Herbs Cultivation, Medicinal, Aromatic Plants cultivation ...
Upload
khangminh22Category
view
2download
0
MA
RC
H 2
022
Afghanistan Opium Survey 2021Cultivation and Production
Research
Afghanistan Opium Survey 2021 – Cultivation and Production
1
Acknowledgements
This report was prepared by the Research and Trend Analysis Branch, United Nations Office on Drugs and Crime (UNODC). The implementation of the survey would not have been possible without the dedicated work of the staff in the field, who often faced difficult security conditions.
UNODC is grateful for the financial contribution of the United States of America to the Afghanistan Opium Survey.
Disclaimer This report has not been formally edited. The contents of this publication can in no way reflect the views or policies of UNODC or contributory organizations, nor do they imply any endorsement. The designations employed and the presentation of material in this publication do not imply the expression of any opinion on the part of UNODC concerning the legal status of any country, territory or city or its authorities, or concerning the delimitation of its frontiers or boundaries. This publication may be reproduced in whole or in part and in any form for educational or non-profit purposes without special permission from the copyright holder, provided acknowledgement of the source is made. UNODC would appreciate a copy of any publication that uses this publication as a source.
Contact and copyright
UNODC, PDMU: [email protected]
© 2022, United Nations Office on Drugs and Crime
Afghanistan Opium Survey 2021 – Cultivation and Production
2
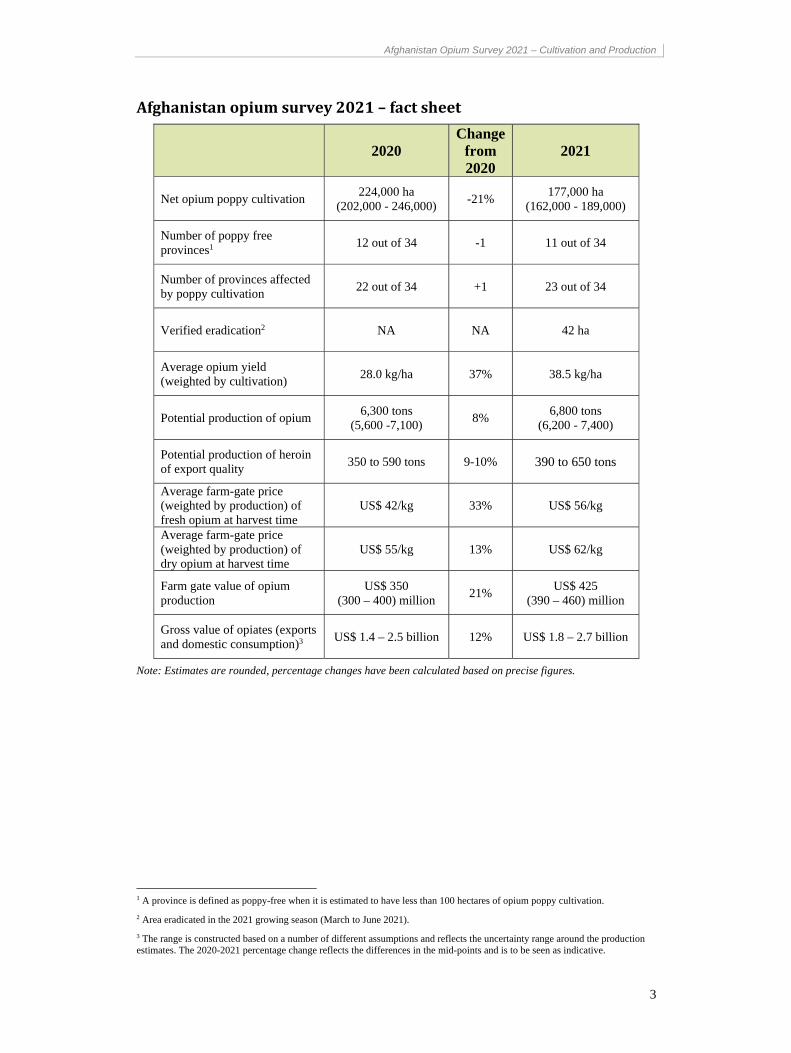
AFGHANISTAN OPIUM SURVEY 2021 – FACT SHEET ....................................................... 3
KEY FINDINGS ............................................................................................................................. 4
1 INTRODUCTION ........................................................................................................ 13
2 OPIUM POPPY CULTIVATION .............................................................................. 13
2.1 NATIONAL AND REGIONAL OPIUM POPPY CULTIVATION TRENDS ................... 13
2.2 PROVINCIAL BREAKDOWN ........................................................................................... 19
3 POTENTIAL OPIUM YIELD AND PRODUCTION .............................................. 29
3.1 POTENTIAL OPIUM PRODUCTION WAS ESTIMATED AT 6,800 TONS IN 2021 ..... 29
3.2 POTENTIAL HEROIN PRODUCTION FROM THE 2021 OPIUM HARVEST ............... 31
4 FARM-GATE VALUE OF OPIUM AND VALUE OF OPIATE PRODUCTION AND EXPORTS ............................................................................................................................ 32
4.1 OPIUM PRICES ................................................................................................................... 32
4.2 FARM-GATE VALUE OF OPIUM PRODUCTION .......................................................... 35
4.3 THE VALUE OF OPIATES IN AFGHANISTAN .............................................................. 35
5 METHODOLOGY ...................................................................................................... 36
5.1 ESTIMATION OF AREA UNDER OPIUM POPPY CULTIVATION .............................. 36
5.2 SATELLITE IMAGE INTERPRETATION ........................................................................ 43
5.3 OPIUM YIELD AND PRODUCTION ................................................................................ 45
5.4 AVERAGE FARM-GATE PRICE AND FARM-GATE VALUE OF OPIUM PRODUCTION .................................................................................................................... 48
ANNEX I INDICATIVE DISTRICT LEVEL ESTIMATES OF OPIUM POPPY CULTIVATION, 2010-2021 (HECTARES) ............................................................................... 49
Afghanistan Opium Survey 2021 – Cultivation and Production
3
Afghanistanopiumsurvey2021–factsheet
2020 Change
from 2020
2021
Net opium poppy cultivation 224,000 ha
(202,000 - 246,000) -21%
177,000 ha (162,000 - 189,000)
Number of poppy free provinces1
12 out of 34 -1 11 out of 34
Number of provinces affected by poppy cultivation
22 out of 34 +1 23 out of 34
Verified eradication2 NA NA 42 ha
Average opium yield (weighted by cultivation)
28.0 kg/ha 37% 38.5 kg/ha
Potential production of opium 6,300 tons
(5,600 -7,100) 8%
6,800 tons (6,200 - 7,400)
Potential production of heroin of export quality
350 to 590 tons 9-10% 390 to 650 tons
Average farm-gate price (weighted by production) of fresh opium at harvest time
US$ 42/kg 33% US$ 56/kg
Average farm-gate price (weighted by production) of dry opium at harvest time
US$ 55/kg 13% US$ 62/kg
Farm gate value of opium production
US$ 350 (300 – 400) million
21% US$ 425
(390 – 460) million
Gross value of opiates (exports and domestic consumption)3
US$ 1.4 – 2.5 billion 12% US$ 1.8 – 2.7 billion
Note: Estimates are rounded, percentage changes have been calculated based on precise figures.
1 A province is defined as poppy-free when it is estimated to have less than 100 hectares of opium poppy cultivation.
2 Area eradicated in the 2021 growing season (March to June 2021).
3 The range is constructed based on a number of different assumptions and reflects the uncertainty range around the production estimates. The 2020-2021 percentage change reflects the differences in the mid-points and is to be seen as indicative.
Afghanistan Opium Survey 2021 – Cultivation and Production
4
KeyFindingsThe production of opiates (opium, morphine, and heroin) is arguably Afghanistan’s largest illegal economic activity. The gross output of the Afghan illicit opiate economy was estimated to be $1.8-$2.7 billion in 2021. The total value of opiates, including domestic consumption and exports, stood at between 9 to 14 per cent of Afghanistan’s GDP, exceeding the value of its officially recorded licit exports of goods and services (estimated at 9 per cent of GDP in 2020).
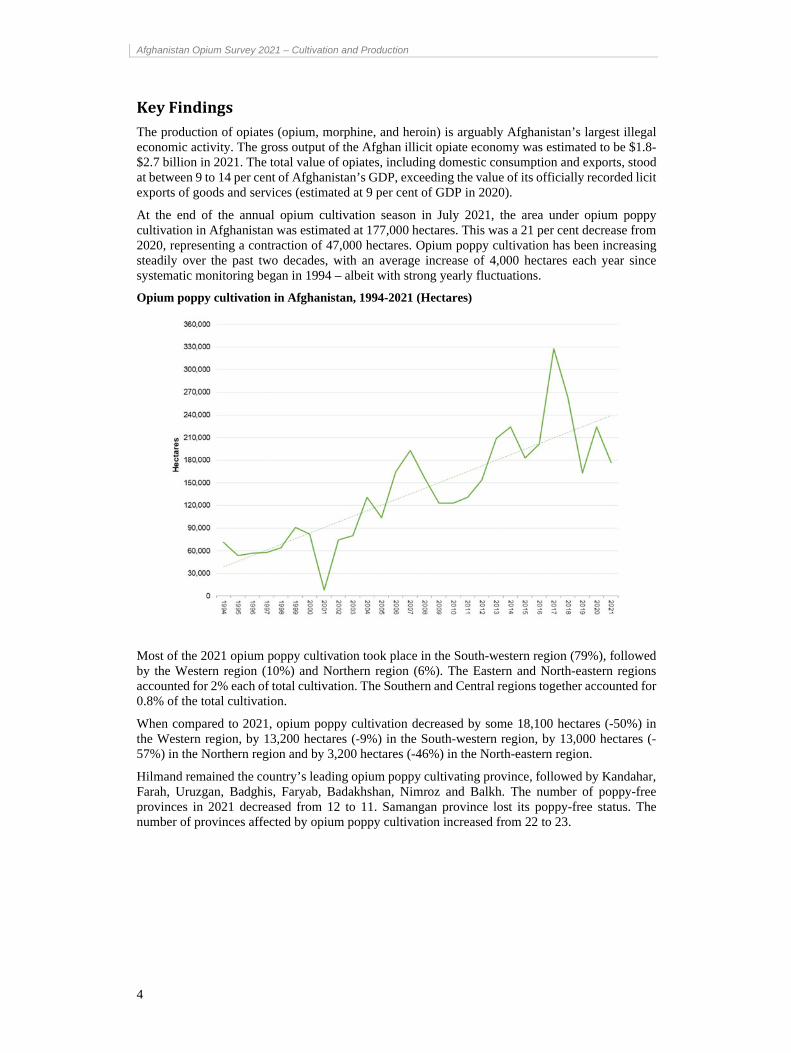
At the end of the annual opium cultivation season in July 2021, the area under opium poppy cultivation in Afghanistan was estimated at 177,000 hectares. This was a 21 per cent decrease from 2020, representing a contraction of 47,000 hectares. Opium poppy cultivation has been increasing steadily over the past two decades, with an average increase of 4,000 hectares each year since systematic monitoring began in 1994 – albeit with strong yearly fluctuations.
Opium poppy cultivation in Afghanistan, 1994-2021 (Hectares)
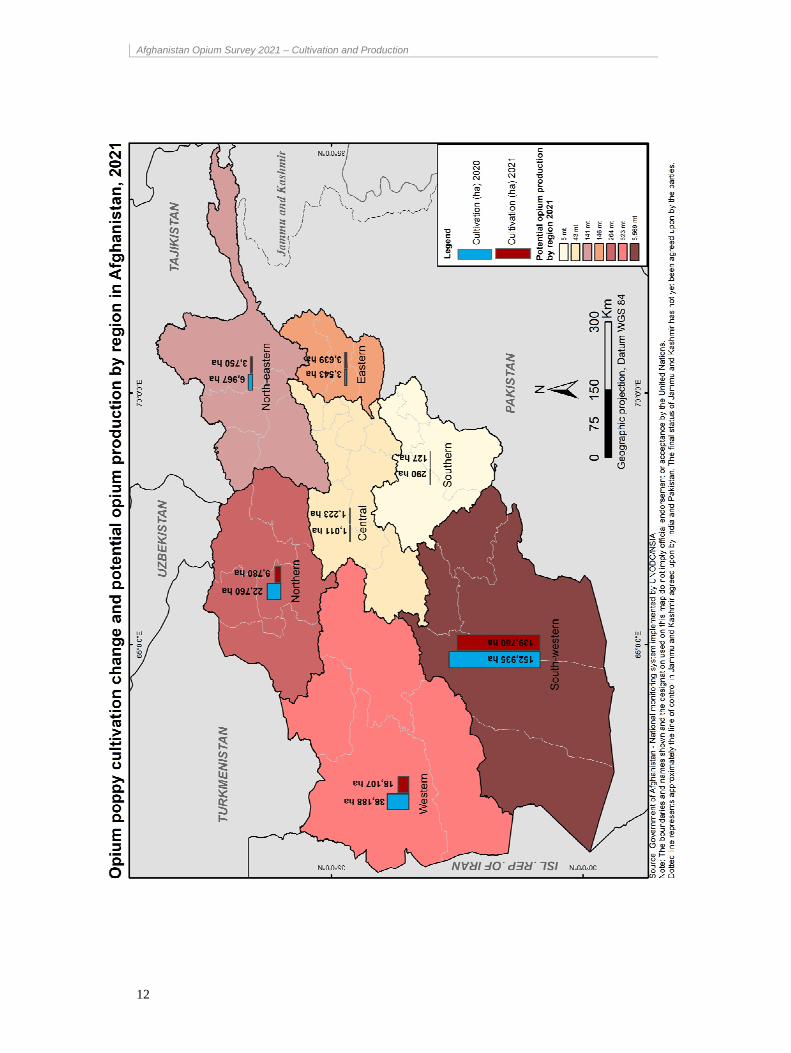
Most of the 2021 opium poppy cultivation took place in the South-western region (79%), followed by the Western region (10%) and Northern region (6%). The Eastern and North-eastern regions accounted for 2% each of total cultivation. The Southern and Central regions together accounted for 0.8% of the total cultivation.
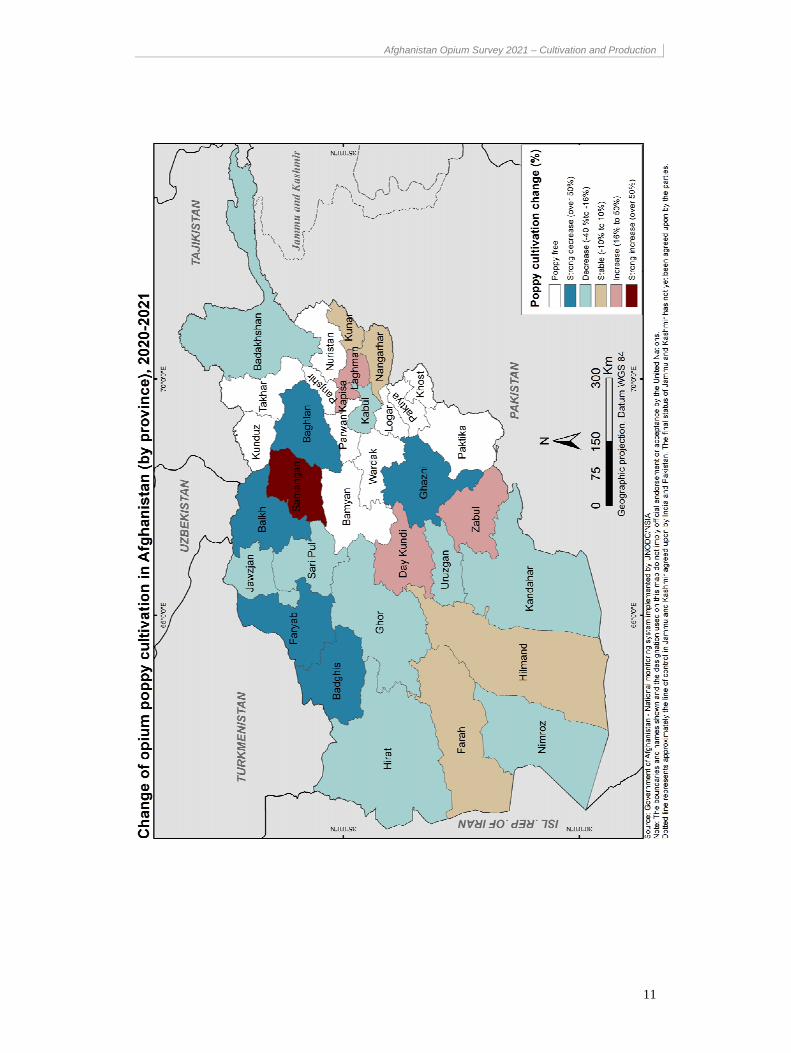
When compared to 2021, opium poppy cultivation decreased by some 18,100 hectares (-50%) in the Western region, by 13,200 hectares (-9%) in the South-western region, by 13,000 hectares (-57%) in the Northern region and by 3,200 hectares (-46%) in the North-eastern region.
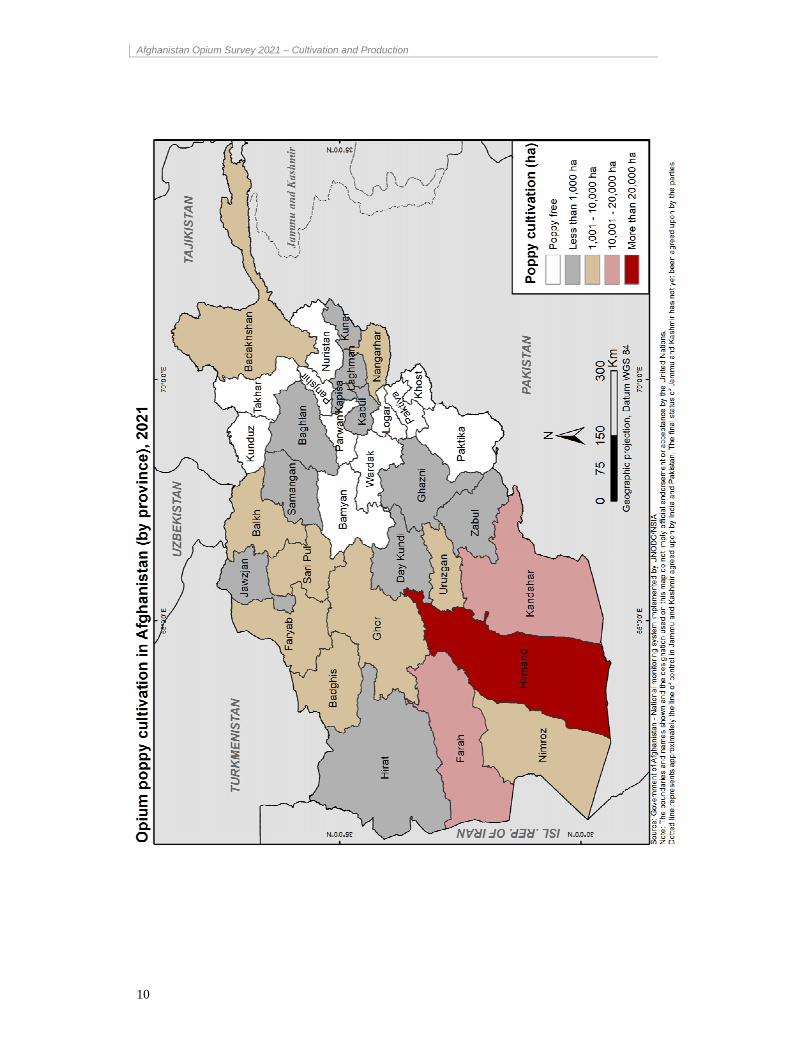
Hilmand remained the country’s leading opium poppy cultivating province, followed by Kandahar, Farah, Uruzgan, Badghis, Faryab, Badakhshan, Nimroz and Balkh. The number of poppy-free provinces in 2021 decreased from 12 to 11. Samangan province lost its poppy-free status. The number of provinces affected by opium poppy cultivation increased from 22 to 23.
Afghanistan Opium Survey 2021 – Cultivation and Production
5
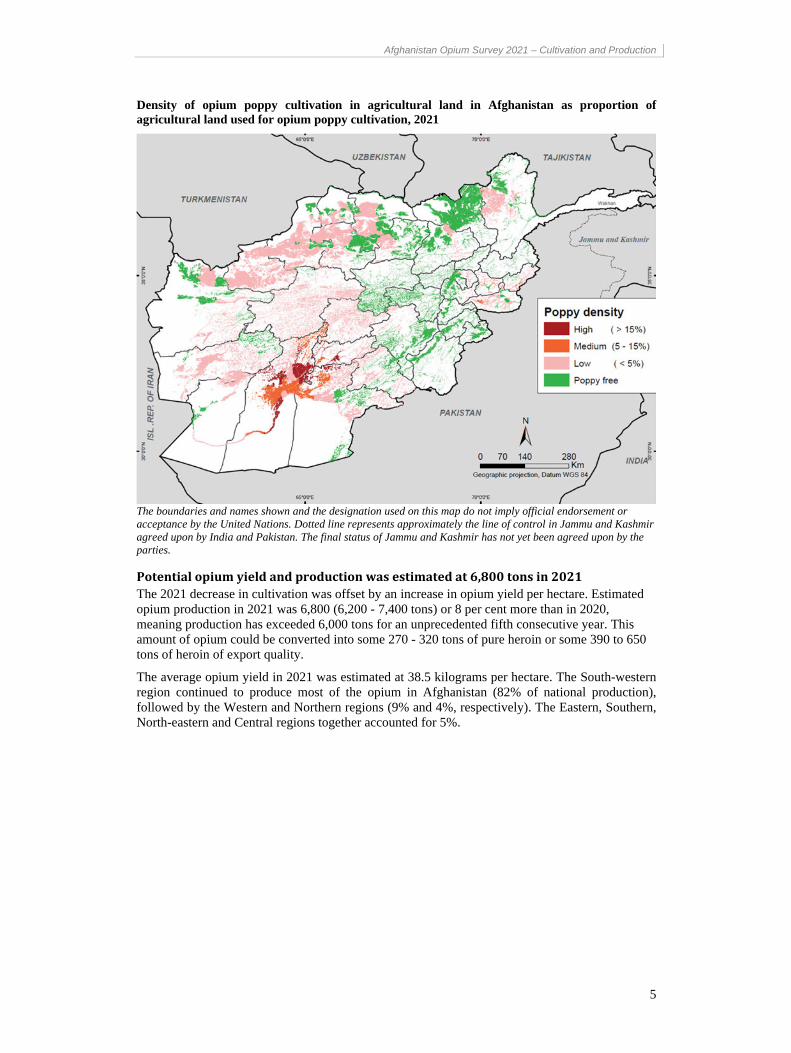
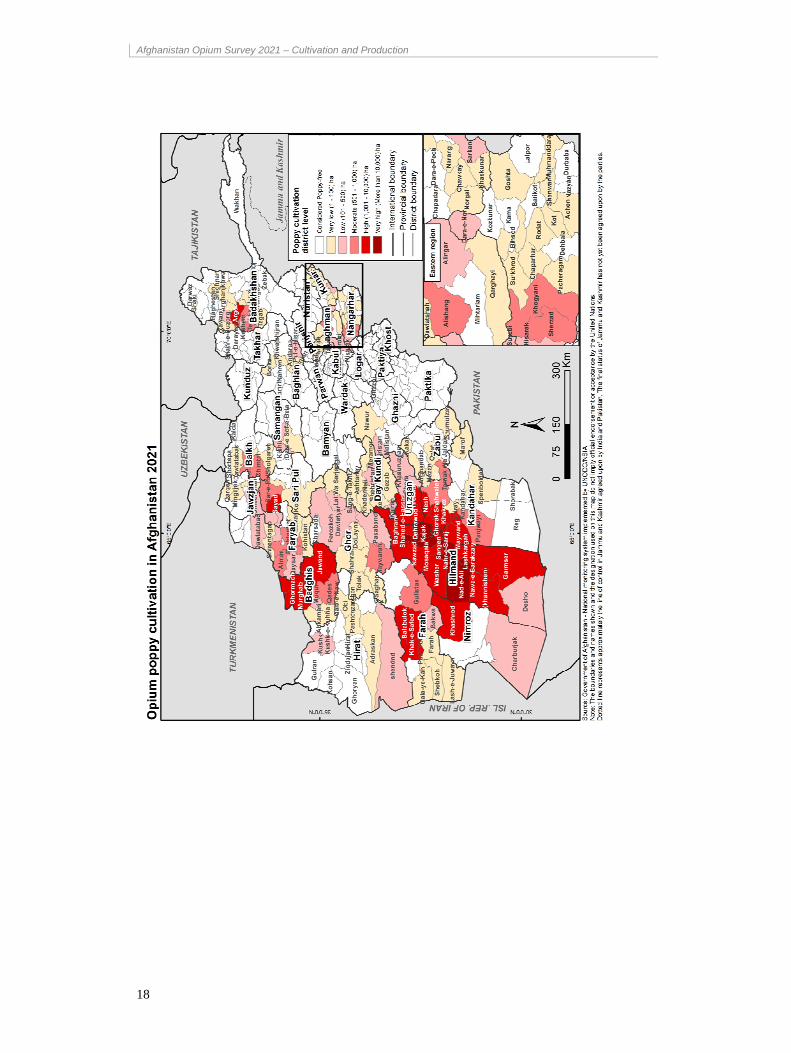
Density of opium poppy cultivation in agricultural land in Afghanistan as proportion of agricultural land used for opium poppy cultivation, 2021
The boundaries and names shown and the designation used on this map do not imply official endorsement or acceptance by the United Nations. Dotted line represents approximately the line of control in Jammu and Kashmir agreed upon by India and Pakistan. The final status of Jammu and Kashmir has not yet been agreed upon by the parties.
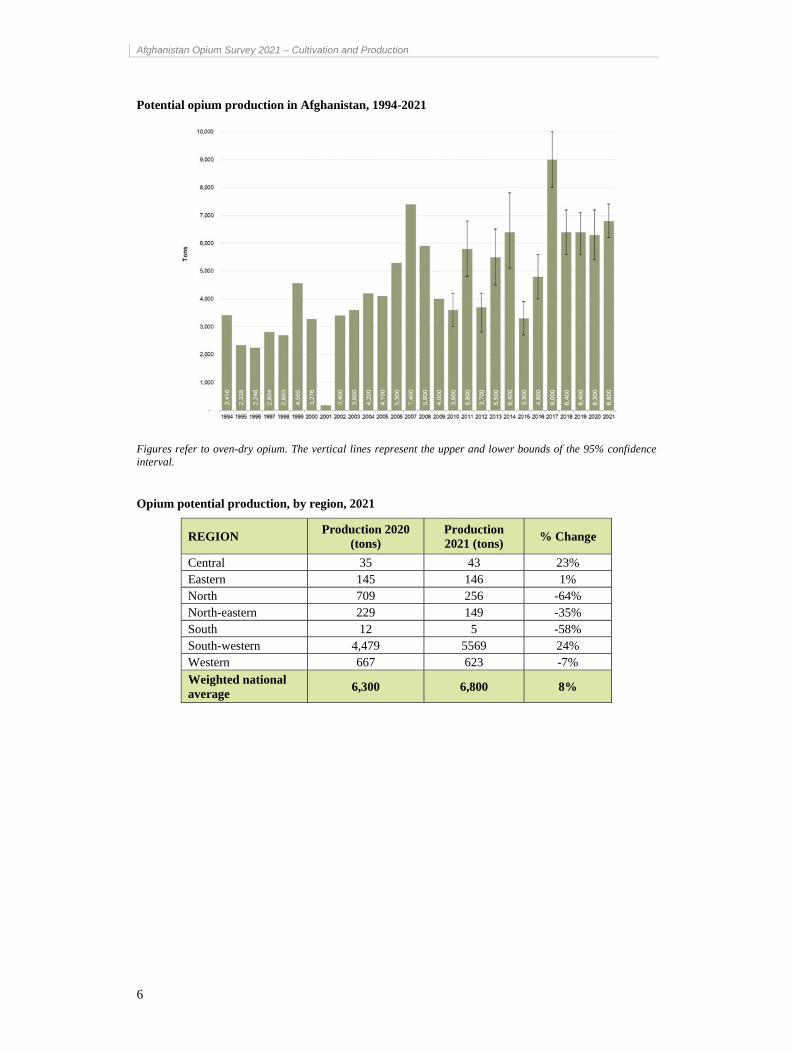
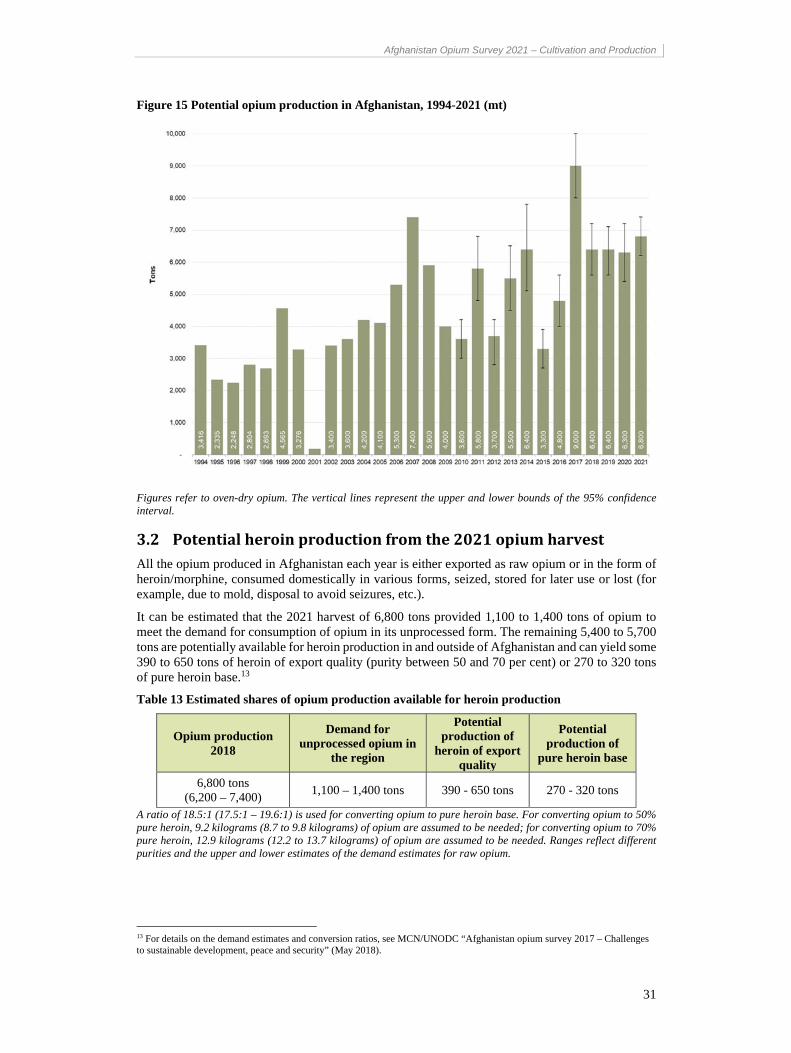
Potentialopiumyieldandproductionwasestimatedat6,800tonsin2021The 2021 decrease in cultivation was offset by an increase in opium yield per hectare. Estimated opium production in 2021 was 6,800 (6,200 - 7,400 tons) or 8 per cent more than in 2020, meaning production has exceeded 6,000 tons for an unprecedented fifth consecutive year. This amount of opium could be converted into some 270 - 320 tons of pure heroin or some 390 to 650 tons of heroin of export quality.
The average opium yield in 2021 was estimated at 38.5 kilograms per hectare. The South-western region continued to produce most of the opium in Afghanistan (82% of national production), followed by the Western and Northern regions (9% and 4%, respectively). The Eastern, Southern, North-eastern and Central regions together accounted for 5%.
Afghanistan Opium Survey 2021 – Cultivation and Production
6
Potential opium production in Afghanistan, 1994-2021
Figures refer to oven-dry opium. The vertical lines represent the upper and lower bounds of the 95% confidence interval.
Opium potential production, by region, 2021
REGION Production 2020
(tons) Production 2021 (tons)
% Change
Central 35 43 23% Eastern 145 146 1% North 709 256 -64% North-eastern 229 149 -35% South 12 5 -58% South-western 4,479 5569 24% Western 667 623 -7%
Weighted national average
6,300 6,800 8%
Afghanistan Opium Survey 2021 – Cultivation and Production
7
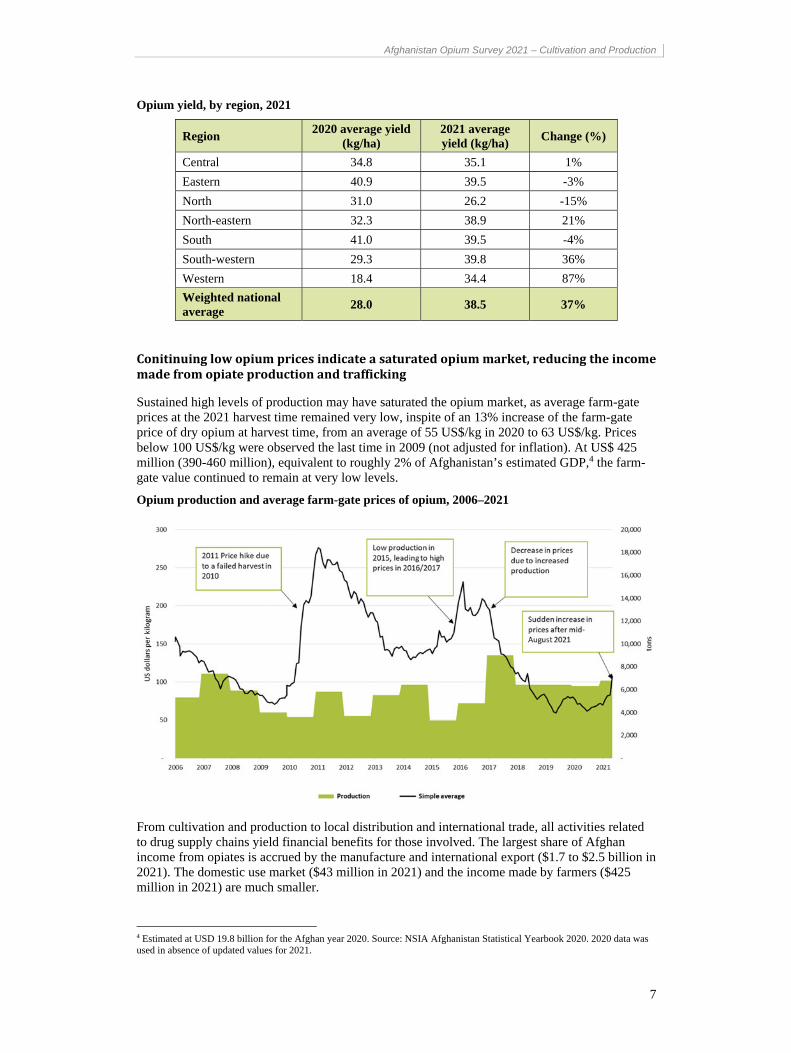
Opium yield, by region, 2021
Region 2020 average yield
(kg/ha) 2021 average yield (kg/ha)
Change (%)
Central 34.8 35.1 1%
Eastern 40.9 39.5 -3%
North 31.0 26.2 -15%
North-eastern 32.3 38.9 21%
South 41.0 39.5 -4%
South-western 29.3 39.8 36%
Western 18.4 34.4 87%
Weighted national average
28.0 38.5 37%
Conitinuinglowopiumpricesindicateasaturatedopiummarket,reducingtheincomemadefromopiateproductionandtrafficking
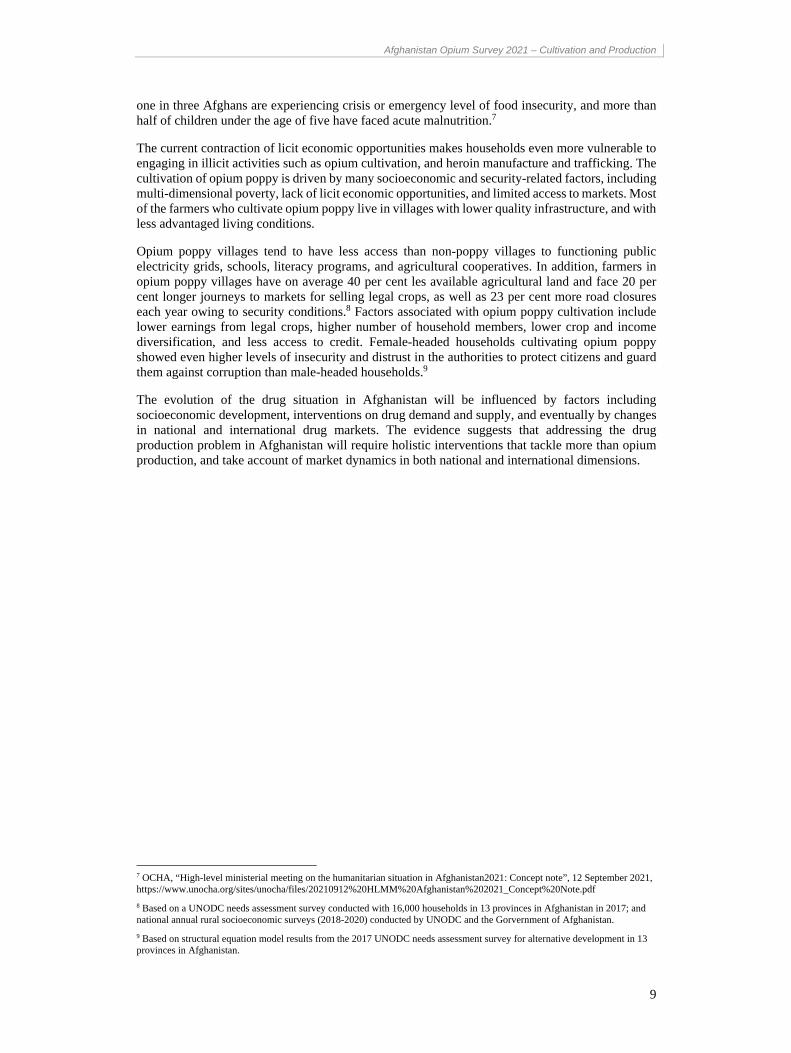
Sustained high levels of production may have saturated the opium market, as average farm-gate prices at the 2021 harvest time remained very low, inspite of an 13% increase of the farm-gate price of dry opium at harvest time, from an average of 55 US$/kg in 2020 to 63 US$/kg. Prices below 100 US$/kg were observed the last time in 2009 (not adjusted for inflation). At US$ 425 million (390-460 million), equivalent to roughly 2% of Afghanistan’s estimated GDP,4 the farm-gate value continued to remain at very low levels.
Opium production and average farm-gate prices of opium, 2006–2021
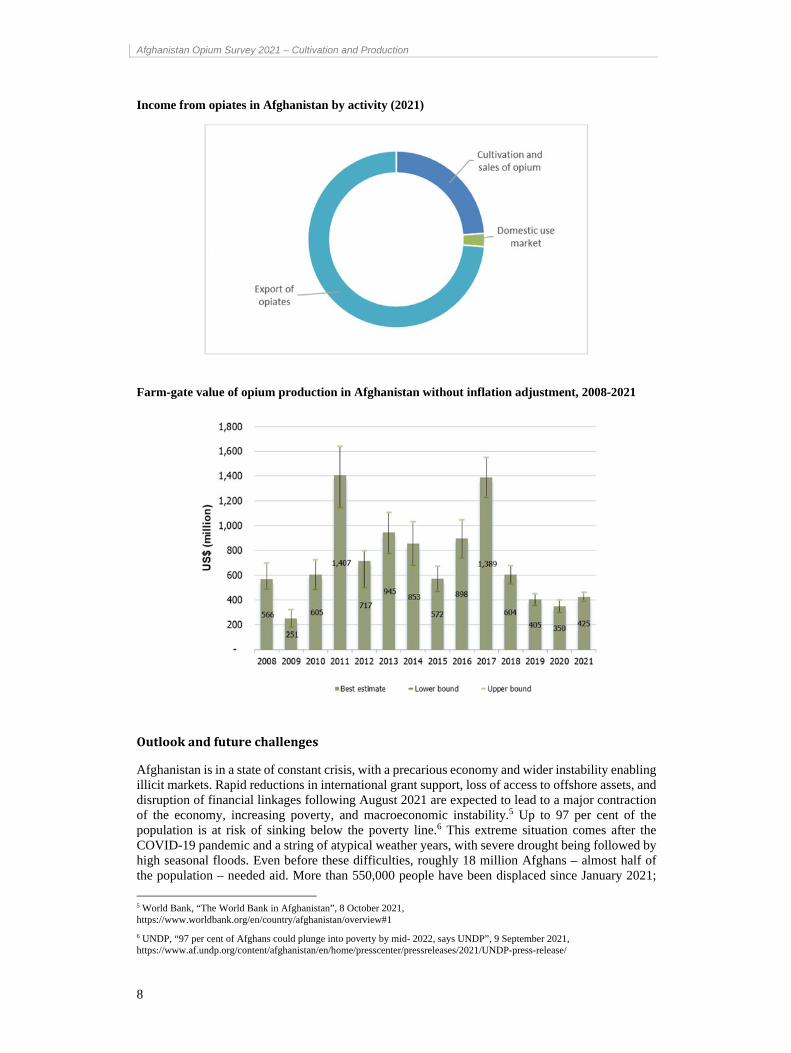
From cultivation and production to local distribution and international trade, all activities related to drug supply chains yield financial benefits for those involved. The largest share of Afghan income from opiates is accrued by the manufacture and international export ($1.7 to $2.5 billion in 2021). The domestic use market ($43 million in 2021) and the income made by farmers ($425 million in 2021) are much smaller.
4 Estimated at USD 19.8 billion for the Afghan year 2020. Source: NSIA Afghanistan Statistical Yearbook 2020. 2020 data was used in absence of updated values for 2021.
Afghanistan Opium Survey 2021 – Cultivation and Production
8
Income from opiates in Afghanistan by activity (2021)
Farm-gate value of opium production in Afghanistan without inflation adjustment, 2008-2021
Outlookandfuturechallenges
Afghanistan is in a state of constant crisis, with a precarious economy and wider instability enabling illicit markets. Rapid reductions in international grant support, loss of access to offshore assets, and disruption of financial linkages following August 2021 are expected to lead to a major contraction of the economy, increasing poverty, and macroeconomic instability.5 Up to 97 per cent of the population is at risk of sinking below the poverty line.6 This extreme situation comes after the COVID-19 pandemic and a string of atypical weather years, with severe drought being followed by high seasonal floods. Even before these difficulties, roughly 18 million Afghans – almost half of the population – needed aid. More than 550,000 people have been displaced since January 2021;
5 World Bank, “The World Bank in Afghanistan”, 8 October 2021, https://www.worldbank.org/en/country/afghanistan/overview#1
6 UNDP, “97 per cent of Afghans could plunge into poverty by mid- 2022, says UNDP”, 9 September 2021, https://www.af.undp.org/content/afghanistan/en/home/presscenter/pressreleases/2021/UNDP-press-release/
Afghanistan Opium Survey 2021 – Cultivation and Production
9
one in three Afghans are experiencing crisis or emergency level of food insecurity, and more than half of children under the age of five have faced acute malnutrition.7
The current contraction of licit economic opportunities makes households even more vulnerable to engaging in illicit activities such as opium cultivation, and heroin manufacture and trafficking. The cultivation of opium poppy is driven by many socioeconomic and security-related factors, including multi-dimensional poverty, lack of licit economic opportunities, and limited access to markets. Most of the farmers who cultivate opium poppy live in villages with lower quality infrastructure, and with less advantaged living conditions.
Opium poppy villages tend to have less access than non-poppy villages to functioning public electricity grids, schools, literacy programs, and agricultural cooperatives. In addition, farmers in opium poppy villages have on average 40 per cent les available agricultural land and face 20 per cent longer journeys to markets for selling legal crops, as well as 23 per cent more road closures each year owing to security conditions.8 Factors associated with opium poppy cultivation include lower earnings from legal crops, higher number of household members, lower crop and income diversification, and less access to credit. Female-headed households cultivating opium poppy showed even higher levels of insecurity and distrust in the authorities to protect citizens and guard them against corruption than male-headed households.9
The evolution of the drug situation in Afghanistan will be influenced by factors including socioeconomic development, interventions on drug demand and supply, and eventually by changes in national and international drug markets. The evidence suggests that addressing the drug production problem in Afghanistan will require holistic interventions that tackle more than opium production, and take account of market dynamics in both national and international dimensions.
7 OCHA, “High-level ministerial meeting on the humanitarian situation in Afghanistan2021: Concept note”, 12 September 2021, https://www.unocha.org/sites/unocha/files/20210912%20HLMM%20Afghanistan%202021_Concept%20Note.pdf
8 Based on a UNODC needs assessment survey conducted with 16,000 households in 13 provinces in Afghanistan in 2017; and national annual rural socioeconomic surveys (2018-2020) conducted by UNODC and the Gorvernment of Afghanistan.
9 Based on structural equation model results from the 2017 UNODC needs assessment survey for alternative development in 13 provinces in Afghanistan.
Afghanistan Opium Survey 2021 – Cultivation and Production
10
Afghanistan Opium Survey 2021 – Cultivation and Production
11
Afghanistan Opium Survey 2021 – Cultivation and Production
12
Afghanistan Opium Survey 2021 – Cultivation and Production
13
1 IntroductionThe Afghanistan Opium Survey 2021 was implemented under the project “Monitoring of Opium Production in Afghanistan” (AFG/F98), with financial contributions from the Government of United States of America. Information and data contained in this report, unless otherwise stated, are based on data collected by UNODC through surveys and other tools in Afghanistan and through global data collections on drugs.10 Data on opium cultivation and production are based on the Afghanistan Opium Surveys 1994-2020 published by UNODC and the Government of Afghanistan, as well as the latest findings of the Afghanistan Opium Survey conducted in 2021.
The results provide a detailed assessment of the outcome of the current year’s opium season and together with data from previous years, enable the identification of medium- and long-term trends in the evolution of the illicit drug problem. This information is essential for planning, implementing and monitoring the impact of measures required for tackling a problem that has far-reaching implications for Afghanistan and the international community.
The opium survey is implemented within the technical framework of the UNODC Illicit Crop Monitoring Programme (ICMP), established in 1999 upon request of the Commission on Narcotic Drugs in its resolution 42/3, Monitoring and verification of illicit cultivation. The objective of ICMP is to assist the international community in monitoring the extent and evolution of illicit crops and to compile reliable and internationally comparable data. Currently, UNODC carries out and supports monitoring activities in six countries affected by illicit crop cultivation: coca surveys in Bolivia, Colombia, and Peru; and opium poppy surveys in Afghanistan, Mexico and Myanmar.
2 OpiumPoppyCultivation
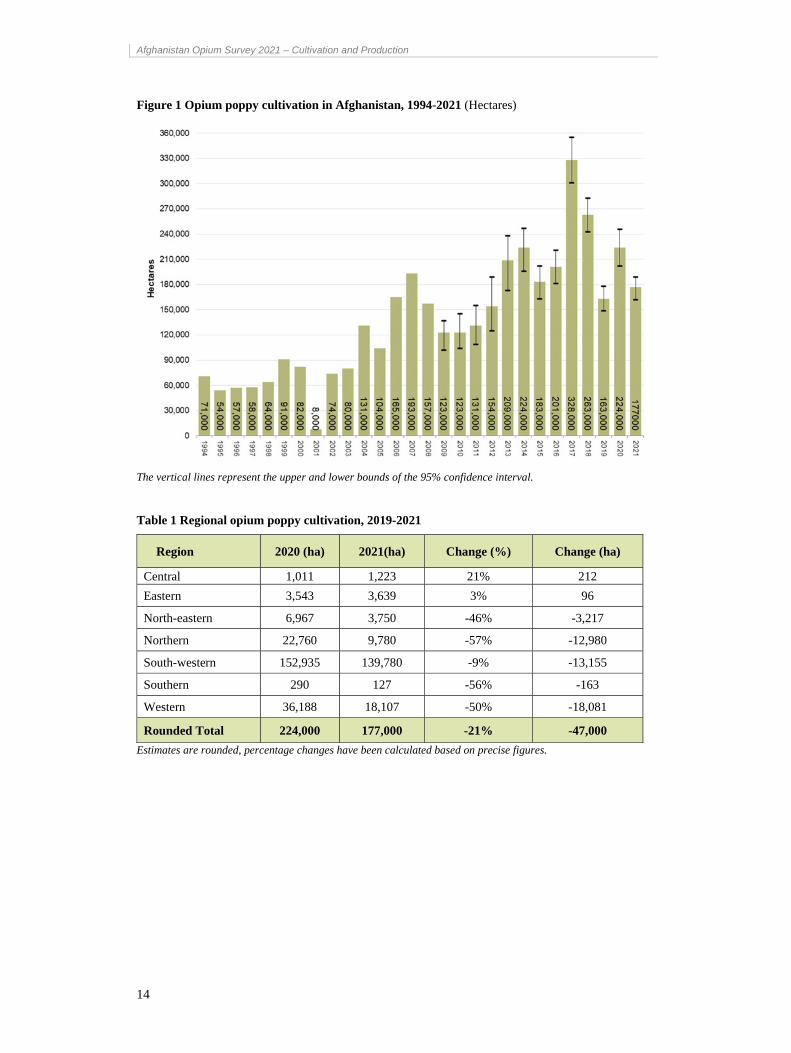
2.1 NationalandregionalopiumpoppycultivationtrendsThe total area under opium poppy cultivation in Afghanistan was estimated at 177,000 hectares in 2021, a decrease by 21% or 47,000 hectares compared to the previous year. This level of opium poppy cultivation is the eighth highest since the of beginning of systematic opium poppy monitoring and recording in 1994.
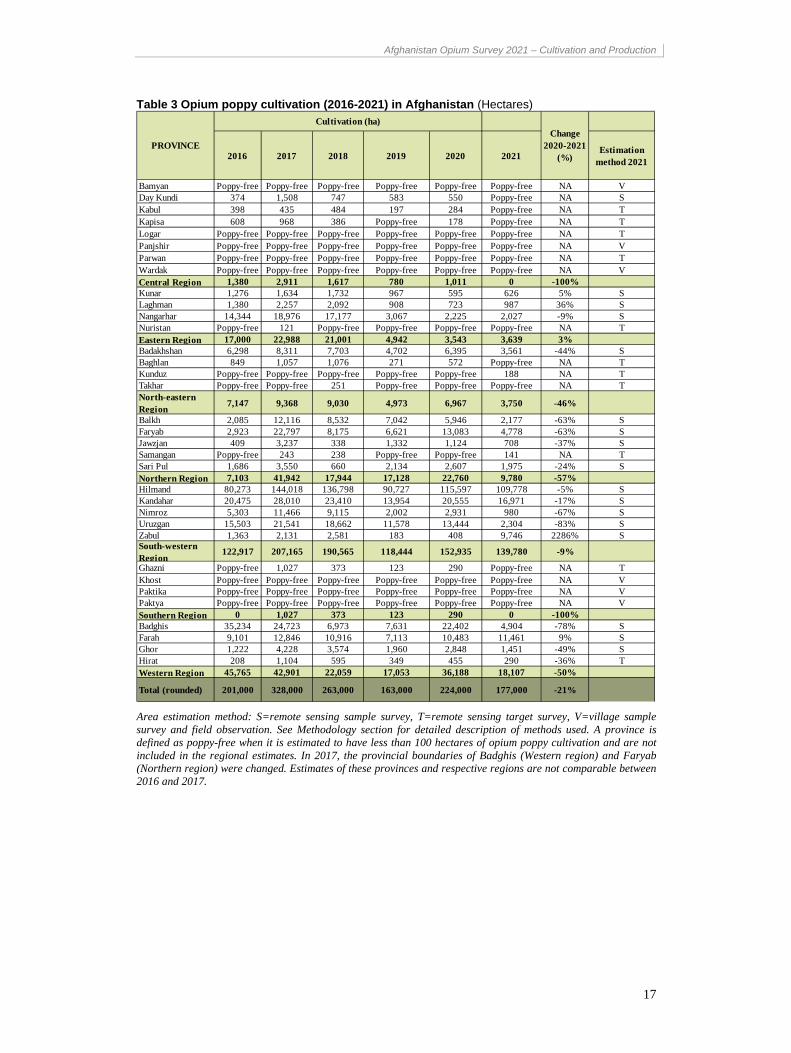
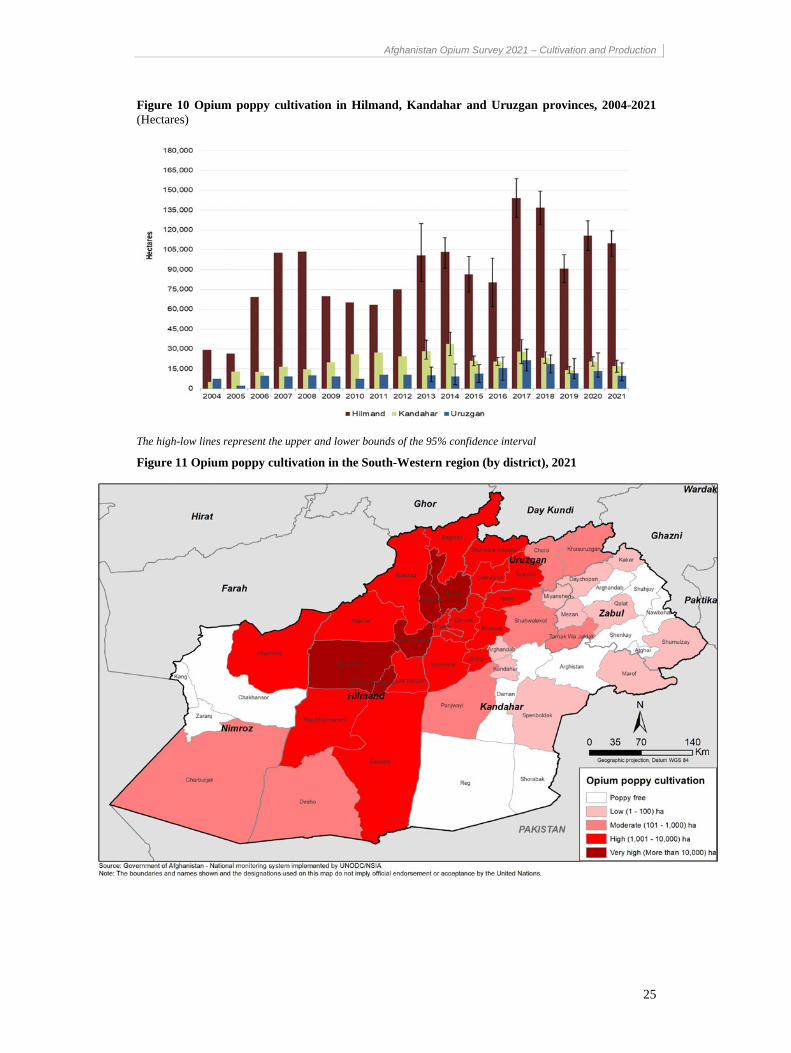
The decreases were observed in almost all major opium poppy cultivating provinces. Badghis and Faryab provinces recorded the most significant reduction by 78% and 63%, respectively, in total reducing the area under opium cultivation by 25,800 hectares. Balkh, Badakhshan, Nangarhar and Nimroz also showed a decrease in cultivation by 63%, 44%, 9% and 21%. Hilmand and Kandahar provinces, which had the largest areas under opium-culitivation (more than 70% of national total), witnessed a reduction of 5% and 17% respectively in 2021, amounting to a net reduction by over 9,400 hectares.
The regional distribution of opium poppy cultivation shows that the majority (79%) of cultivation continued to be in the South-western region of the country. The Western region accounted for 10% of total cultivation, and the other regions contributed the remaining 11%.
Hilmand remained the country’s major opium poppy cultivating province at 109,778 hectares, followed by Kandahar (16,971 hectares) and Farah (11,461 hectares),
The number of poppy-free provinces in Afghanistan decreased from 12 to 11 in 2021. Samangan lost its poppy-free status with an estimated 141 hectares of opium poppy cultivation.
10 UNODC, annual report questionnaires.
Afghanistan Opium Survey 2021 – Cultivation and Production
14
Figure 1 Opium poppy cultivation in Afghanistan, 1994-2021 (Hectares)
The vertical lines represent the upper and lower bounds of the 95% confidence interval.
Table 1 Regional opium poppy cultivation, 2019-2021
Region 2020 (ha) 2021(ha) Change (%) Change (ha)
Central 1,011 1,223 21% 212
Eastern 3,543 3,639 3% 96
North-eastern 6,967 3,750 -46% -3,217
Northern 22,760 9,780 -57% -12,980
South-western 152,935 139,780 -9% -13,155
Southern 290 127 -56% -163
Western 36,188 18,107 -50% -18,081
Rounded Total 224,000 177,000 -21% -47,000
Estimates are rounded, percentage changes have been calculated based on precise figures.
Afghanistan Opium Survey 2021 – Cultivation and Production
15
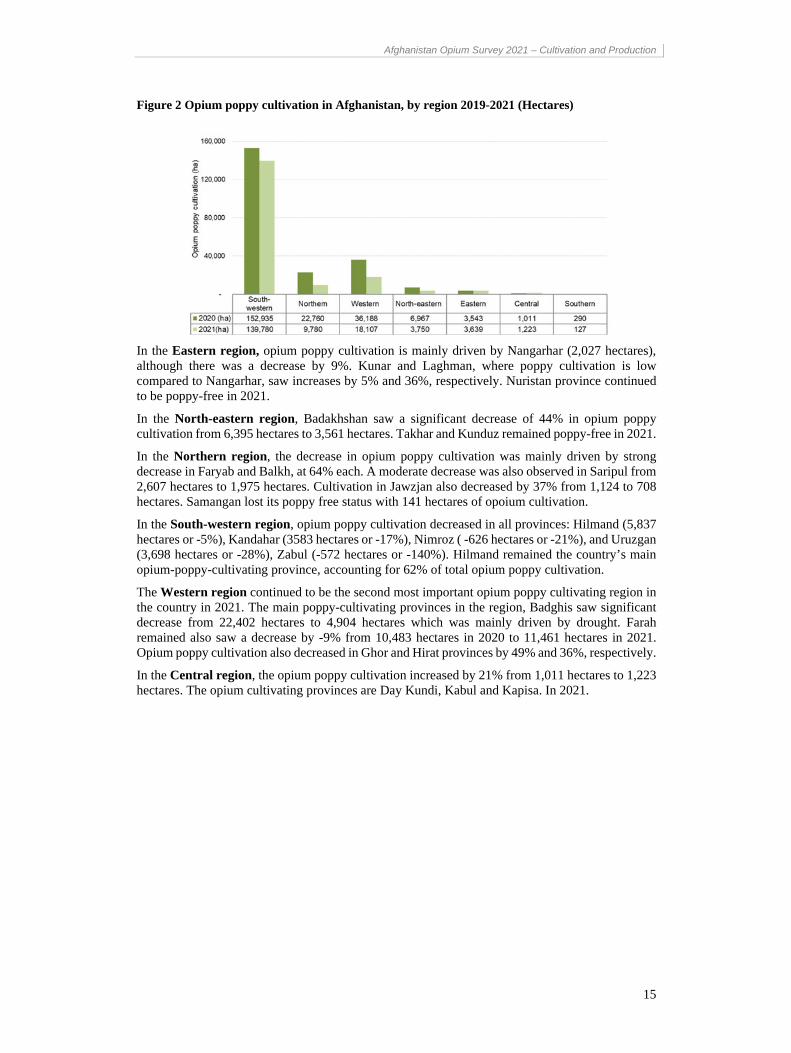
Figure 2 Opium poppy cultivation in Afghanistan, by region 2019-2021 (Hectares)
In the Eastern region, opium poppy cultivation is mainly driven by Nangarhar (2,027 hectares), although there was a decrease by 9%. Kunar and Laghman, where poppy cultivation is low compared to Nangarhar, saw increases by 5% and 36%, respectively. Nuristan province continued to be poppy-free in 2021.
In the North-eastern region, Badakhshan saw a significant decrease of 44% in opium poppy cultivation from 6,395 hectares to 3,561 hectares. Takhar and Kunduz remained poppy-free in 2021.
In the Northern region, the decrease in opium poppy cultivation was mainly driven by strong decrease in Faryab and Balkh, at 64% each. A moderate decrease was also observed in Saripul from 2,607 hectares to 1,975 hectares. Cultivation in Jawzjan also decreased by 37% from 1,124 to 708 hectares. Samangan lost its poppy free status with 141 hectares of opoium cultivation.
In the South-western region, opium poppy cultivation decreased in all provinces: Hilmand (5,837 hectares or -5%), Kandahar (3583 hectares or -17%), Nimroz ( -626 hectares or -21%), and Uruzgan (3,698 hectares or -28%), Zabul (-572 hectares or -140%). Hilmand remained the country’s main opium-poppy-cultivating province, accounting for 62% of total opium poppy cultivation.
The Western region continued to be the second most important opium poppy cultivating region in the country in 2021. The main poppy-cultivating provinces in the region, Badghis saw significant decrease from 22,402 hectares to 4,904 hectares which was mainly driven by drought. Farah remained also saw a decrease by -9% from 10,483 hectares in 2020 to 11,461 hectares in 2021. Opium poppy cultivation also decreased in Ghor and Hirat provinces by 49% and 36%, respectively.
In the Central region, the opium poppy cultivation increased by 21% from 1,011 hectares to 1,223 hectares. The opium cultivating provinces are Day Kundi, Kabul and Kapisa. In 2021.
Afghanistan Opium Survey 2021 – Cultivation and Production
16
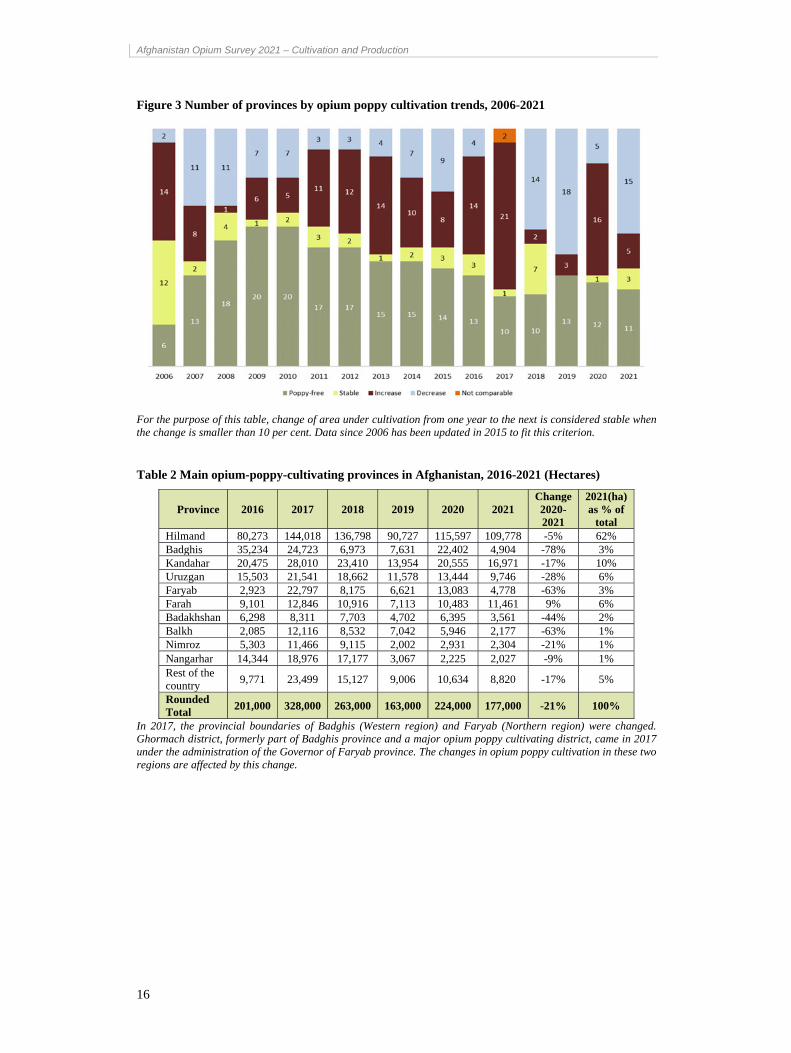
Figure 3 Number of provinces by opium poppy cultivation trends, 2006-2021
For the purpose of this table, change of area under cultivation from one year to the next is considered stable when the change is smaller than 10 per cent. Data since 2006 has been updated in 2015 to fit this criterion.
Table 2 Main opium-poppy-cultivating provinces in Afghanistan, 2016-2021 (Hectares)
Province 2016 2017 2018 2019 2020 2021 Change 2020-2021
2021(ha) as % of
total Hilmand 80,273 144,018 136,798 90,727 115,597 109,778 -5% 62% Badghis 35,234 24,723 6,973 7,631 22,402 4,904 -78% 3% Kandahar 20,475 28,010 23,410 13,954 20,555 16,971 -17% 10% Uruzgan 15,503 21,541 18,662 11,578 13,444 9,746 -28% 6% Faryab 2,923 22,797 8,175 6,621 13,083 4,778 -63% 3% Farah 9,101 12,846 10,916 7,113 10,483 11,461 9% 6% Badakhshan 6,298 8,311 7,703 4,702 6,395 3,561 -44% 2% Balkh 2,085 12,116 8,532 7,042 5,946 2,177 -63% 1% Nimroz 5,303 11,466 9,115 2,002 2,931 2,304 -21% 1% Nangarhar 14,344 18,976 17,177 3,067 2,225 2,027 -9% 1% Rest of the country
9,771 23,499 15,127 9,006 10,634 8,820 -17% 5%
Rounded Total
201,000 328,000 263,000 163,000 224,000 177,000 -21% 100%
In 2017, the provincial boundaries of Badghis (Western region) and Faryab (Northern region) were changed. Ghormach district, formerly part of Badghis province and a major opium poppy cultivating district, came in 2017 under the administration of the Governor of Faryab province. The changes in opium poppy cultivation in these two regions are affected by this change.
Afghanistan Opium Survey 2021 – Cultivation and Production
17
Table 3 Opium poppy cultivation (2016-2021) in Afghanistan (Hectares)
Area estimation method: S=remote sensing sample survey, T=remote sensing target survey, V=village sample survey and field observation. See Methodology section for detailed description of methods used. A province is defined as poppy-free when it is estimated to have less than 100 hectares of opium poppy cultivation and are not included in the regional estimates. In 2017, the provincial boundaries of Badghis (Western region) and Faryab (Northern region) were changed. Estimates of these provinces and respective regions are not comparable between 2016 and 2017.
2016 2017 2018 2019 2020 2021Estimation
method 2021
Bamyan Poppy-free Poppy-free Poppy-free Poppy-free Poppy-free Poppy-free NA VDay Kundi 374 1,508 747 583 550 Poppy-free NA SKabul 398 435 484 197 284 Poppy-free NA TKapisa 608 968 386 Poppy-free 178 Poppy-free NA TLogar Poppy-free Poppy-free Poppy-free Poppy-free Poppy-free Poppy-free NA TPanjshir Poppy-free Poppy-free Poppy-free Poppy-free Poppy-free Poppy-free NA VParwan Poppy-free Poppy-free Poppy-free Poppy-free Poppy-free Poppy-free NA TWardak Poppy-free Poppy-free Poppy-free Poppy-free Poppy-free Poppy-free NA VCentral Region 1,380 2,911 1,617 780 1,011 0 -100%Kunar 1,276 1,634 1,732 967 595 626 5% SLaghman 1,380 2,257 2,092 908 723 987 36% SNangarhar 14,344 18,976 17,177 3,067 2,225 2,027 -9% SNuristan Poppy-free 121 Poppy-free Poppy-free Poppy-free Poppy-free NA TEastern Region 17,000 22,988 21,001 4,942 3,543 3,639 3%Badakhshan 6,298 8,311 7,703 4,702 6,395 3,561 -44% SBaghlan 849 1,057 1,076 271 572 Poppy-free NA TKunduz Poppy-free Poppy-free Poppy-free Poppy-free Poppy-free 188 NA TTakhar Poppy-free Poppy-free 251 Poppy-free Poppy-free Poppy-free NA TNorth-eastern Region
7,147 9,368 9,030 4,973 6,967 3,750 -46%
Balkh 2,085 12,116 8,532 7,042 5,946 2,177 -63% SFaryab 2,923 22,797 8,175 6,621 13,083 4,778 -63% SJawzjan 409 3,237 338 1,332 1,124 708 -37% SSamangan Poppy-free 243 238 Poppy-free Poppy-free 141 NA TSari Pul 1,686 3,550 660 2,134 2,607 1,975 -24% SNorthern Region 7,103 41,942 17,944 17,128 22,760 9,780 -57%Hilmand 80,273 144,018 136,798 90,727 115,597 109,778 -5% SKandahar 20,475 28,010 23,410 13,954 20,555 16,971 -17% SNimroz 5,303 11,466 9,115 2,002 2,931 980 -67% SUruzgan 15,503 21,541 18,662 11,578 13,444 2,304 -83% SZabul 1,363 2,131 2,581 183 408 9,746 2286% SSouth-western Region
122,917 207,165 190,565 118,444 152,935 139,780 -9%
Ghazni Poppy-free 1,027 373 123 290 Poppy-free NA TKhost Poppy-free Poppy-free Poppy-free Poppy-free Poppy-free Poppy-free NA VPaktika Poppy-free Poppy-free Poppy-free Poppy-free Poppy-free Poppy-free NA VPaktya Poppy-free Poppy-free Poppy-free Poppy-free Poppy-free Poppy-free NA VSouthern Region 0 1,027 373 123 290 0 -100%Badghis 35,234 24,723 6,973 7,631 22,402 4,904 -78% SFarah 9,101 12,846 10,916 7,113 10,483 11,461 9% SGhor 1,222 4,228 3,574 1,960 2,848 1,451 -49% SHirat 208 1,104 595 349 455 290 -36% TWestern Region 45,765 42,901 22,059 17,053 36,188 18,107 -50%
Total (rounded) 201,000 328,000 263,000 163,000 224,000 177,000 -21%
PROVINCE
Cultivation (ha)Change
2020-2021 (%)
Afghanistan Opium Survey 2021 – Cultivation and Production
18
Afghanistan Opium Survey 2021 – Cultivation and Production
19
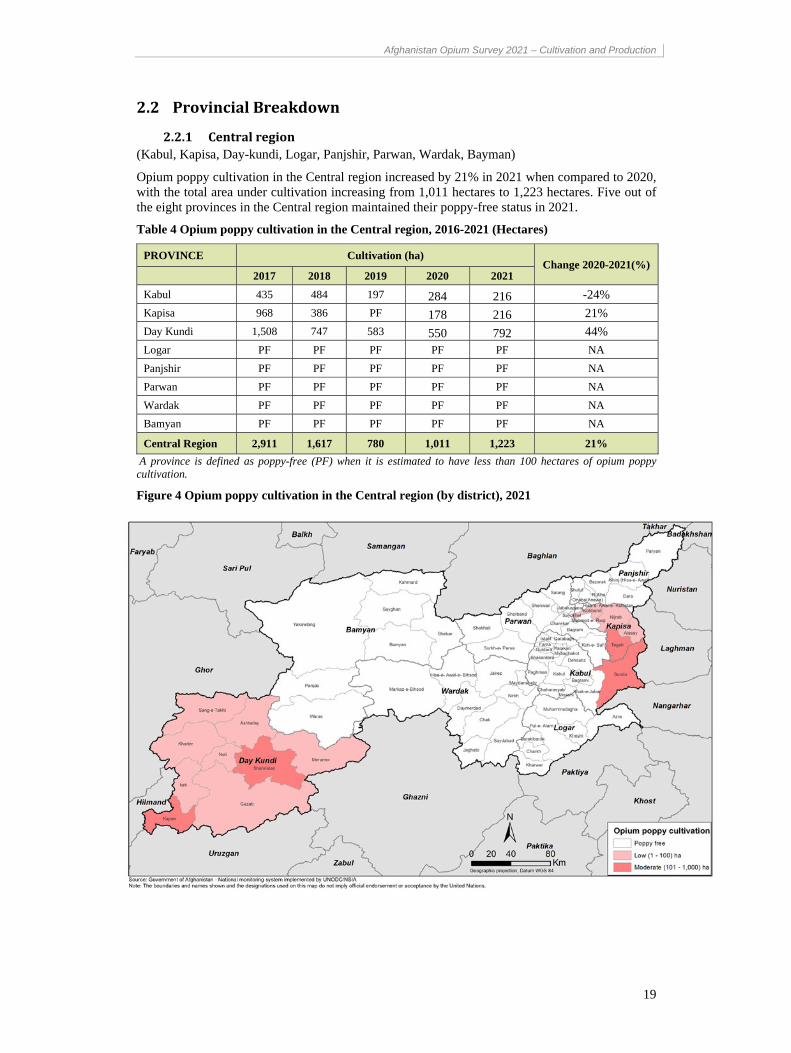
2.2 ProvincialBreakdown
2.2.1 Centralregion(Kabul, Kapisa, Day-kundi, Logar, Panjshir, Parwan, Wardak, Bayman)
Opium poppy cultivation in the Central region increased by 21% in 2021 when compared to 2020, with the total area under cultivation increasing from 1,011 hectares to 1,223 hectares. Five out of the eight provinces in the Central region maintained their poppy-free status in 2021.
Table 4 Opium poppy cultivation in the Central region, 2016-2021 (Hectares)
PROVINCE Cultivation (ha) Change 2020-2021(%)
2017 2018 2019 2020 2021
Kabul 435 484 197 284 216 -24%
Kapisa 968 386 PF 178 216 21%
Day Kundi 1,508 747 583 550 792 44%
Logar PF PF PF PF PF NA
Panjshir PF PF PF PF PF NA
Parwan PF PF PF PF PF NA
Wardak PF PF PF PF PF NA
Bamyan PF PF PF PF PF NA
Central Region 2,911 1,617 780 1,011 1,223 21%
A province is defined as poppy-free (PF) when it is estimated to have less than 100 hectares of opium poppy cultivation.
Figure 4 Opium poppy cultivation in the Central region (by district), 2021
Afghanistan Opium Survey 2021 – Cultivation and Production
20
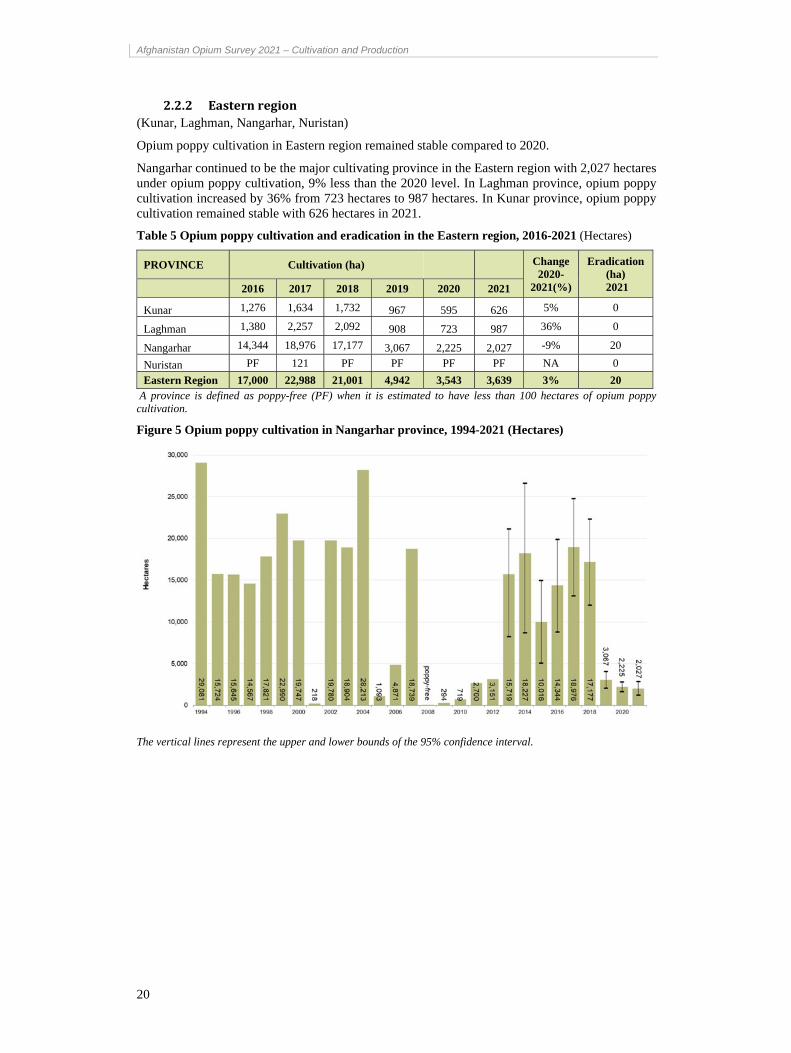
2.2.2 Easternregion(Kunar, Laghman, Nangarhar, Nuristan)
Opium poppy cultivation in Eastern region remained stable compared to 2020.
Nangarhar continued to be the major cultivating province in the Eastern region with 2,027 hectares under opium poppy cultivation, 9% less than the 2020 level. In Laghman province, opium poppy cultivation increased by 36% from 723 hectares to 987 hectares. In Kunar province, opium poppy cultivation remained stable with 626 hectares in 2021.
Table 5 Opium poppy cultivation and eradication in the Eastern region, 2016-2021 (Hectares)
PROVINCE Cultivation (ha) Change 2020-
2021(%)
Eradication (ha)
2021 2016 2017 2018 2019 2020 2021
Kunar 1,276 1,634 1,732 967 595 626 5% 0
Laghman 1,380 2,257 2,092 908 723 987 36% 0
Nangarhar 14,344 18,976 17,177 3,067 2,225 2,027 -9% 20
Nuristan PF 121 PF PF PF PF NA 0
Eastern Region 17,000 22,988 21,001 4,942 3,543 3,639 3% 20 A province is defined as poppy-free (PF) when it is estimated to have less than 100 hectares of opium poppy cultivation.
Figure 5 Opium poppy cultivation in Nangarhar province, 1994-2021 (Hectares)
The vertical lines represent the upper and lower bounds of the 95% confidence interval.
Afghanistan Opium Survey 2021 – Cultivation and Production
21
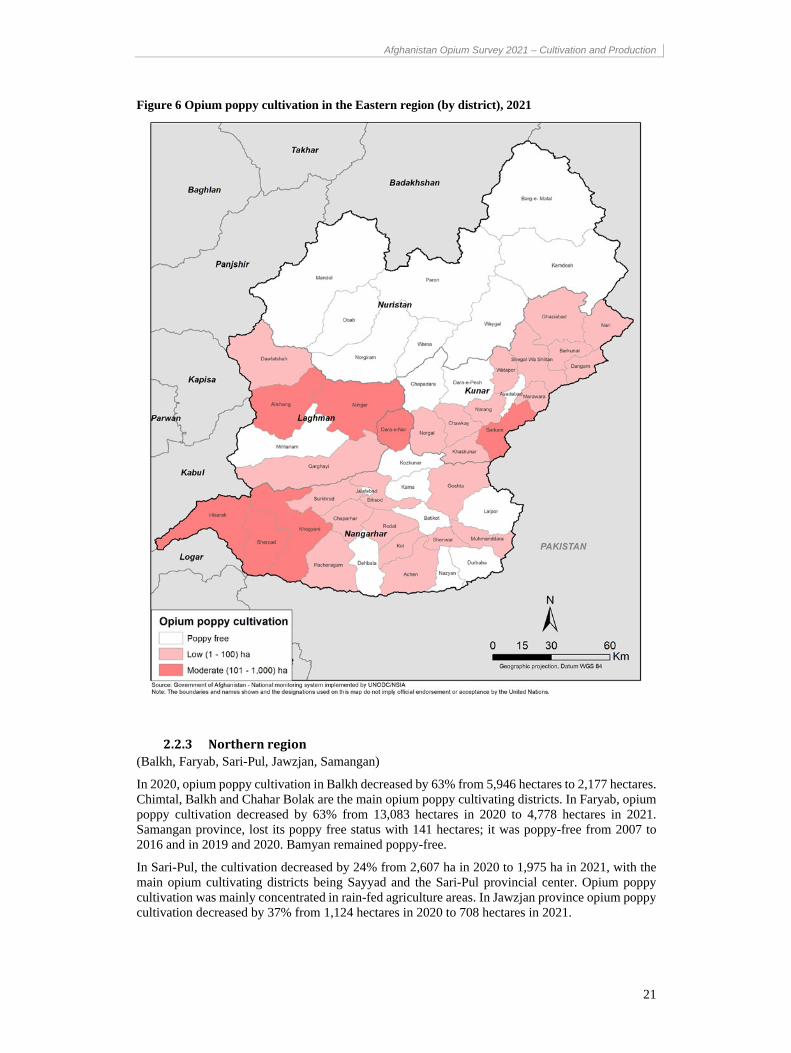
Figure 6 Opium poppy cultivation in the Eastern region (by district), 2021
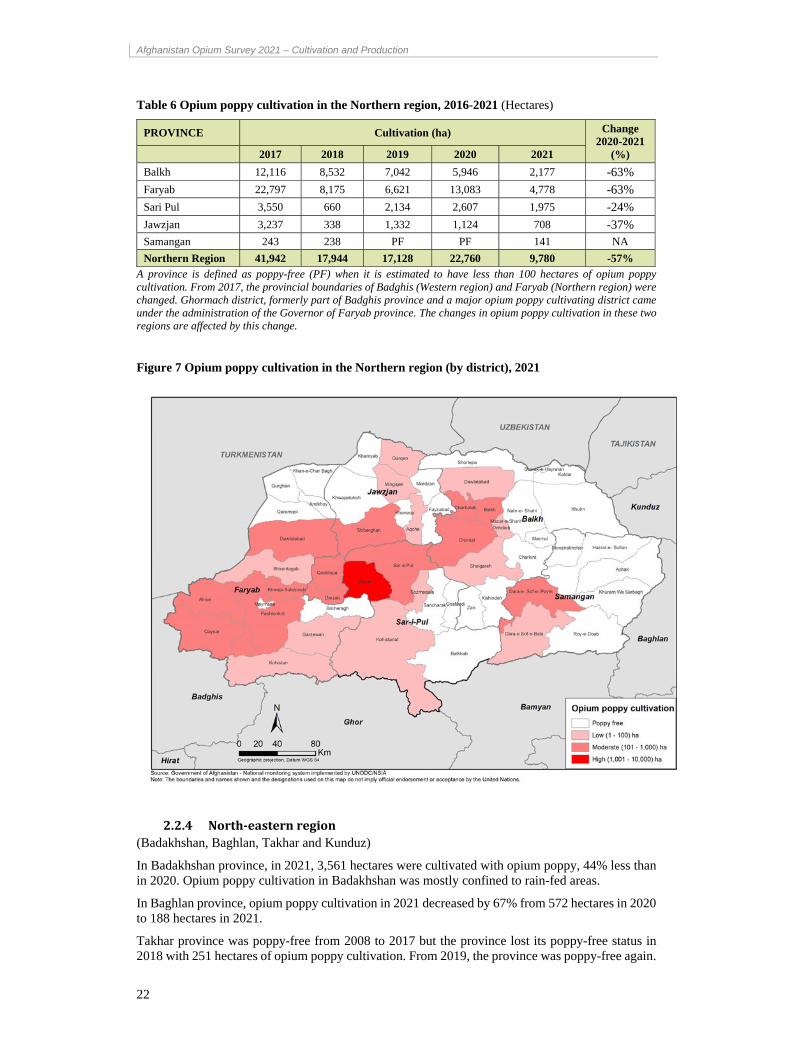
2.2.3 Northernregion(Balkh, Faryab, Sari-Pul, Jawzjan, Samangan)
In 2020, opium poppy cultivation in Balkh decreased by 63% from 5,946 hectares to 2,177 hectares. Chimtal, Balkh and Chahar Bolak are the main opium poppy cultivating districts. In Faryab, opium poppy cultivation decreased by 63% from 13,083 hectares in 2020 to 4,778 hectares in 2021. Samangan province, lost its poppy free status with 141 hectares; it was poppy-free from 2007 to 2016 and in 2019 and 2020. Bamyan remained poppy-free.
In Sari-Pul, the cultivation decreased by 24% from 2,607 ha in 2020 to 1,975 ha in 2021, with the main opium cultivating districts being Sayyad and the Sari-Pul provincial center. Opium poppy cultivation was mainly concentrated in rain-fed agriculture areas. In Jawzjan province opium poppy cultivation decreased by 37% from 1,124 hectares in 2020 to 708 hectares in 2021.
Afghanistan Opium Survey 2021 – Cultivation and Production
22
Table 6 Opium poppy cultivation in the Northern region, 2016-2021 (Hectares)
PROVINCE Cultivation (ha) Change 2020-2021
(%) 2017 2018 2019 2020 2021
Balkh 12,116 8,532 7,042 5,946 2,177 -63% Faryab 22,797 8,175 6,621 13,083 4,778 -63% Sari Pul 3,550 660 2,134 2,607 1,975 -24% Jawzjan 3,237 338 1,332 1,124 708 -37%
Samangan 243 238 PF PF 141 NA
Northern Region 41,942 17,944 17,128 22,760 9,780 -57% A province is defined as poppy-free (PF) when it is estimated to have less than 100 hectares of opium poppy cultivation. From 2017, the provincial boundaries of Badghis (Western region) and Faryab (Northern region) were changed. Ghormach district, formerly part of Badghis province and a major opium poppy cultivating district came under the administration of the Governor of Faryab province. The changes in opium poppy cultivation in these two regions are affected by this change.
Figure 7 Opium poppy cultivation in the Northern region (by district), 2021
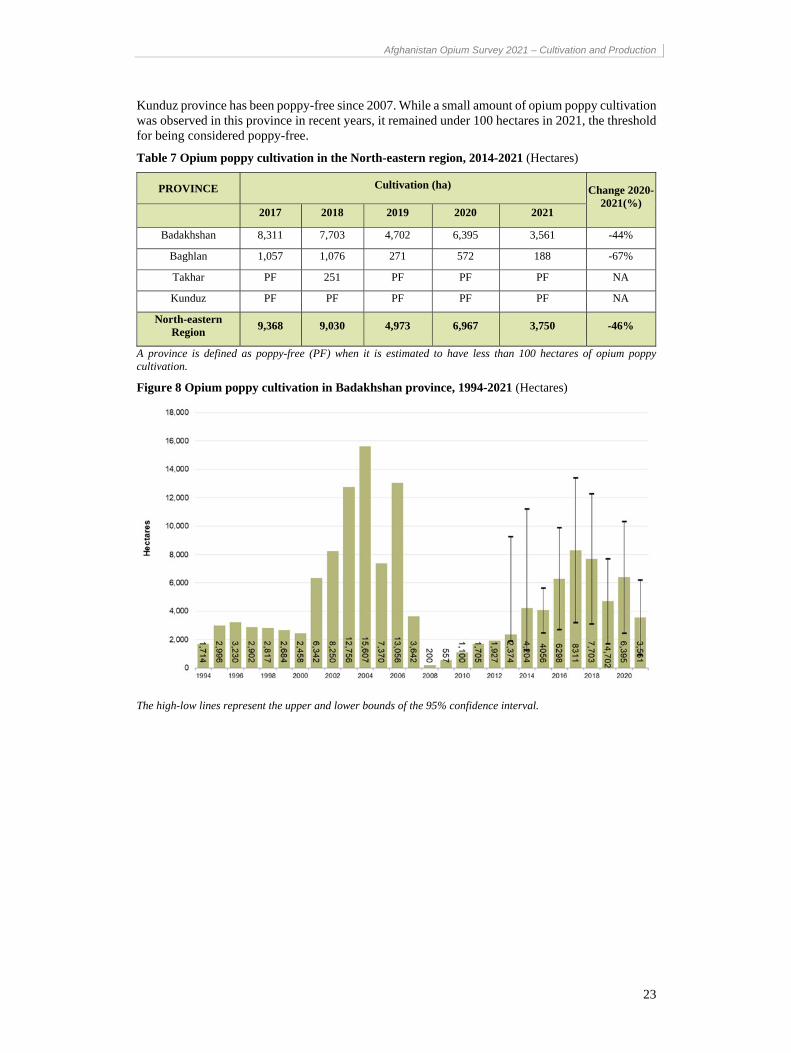
2.2.4 North‐easternregion(Badakhshan, Baghlan, Takhar and Kunduz)
In Badakhshan province, in 2021, 3,561 hectares were cultivated with opium poppy, 44% less than in 2020. Opium poppy cultivation in Badakhshan was mostly confined to rain-fed areas.
In Baghlan province, opium poppy cultivation in 2021 decreased by 67% from 572 hectares in 2020 to 188 hectares in 2021.
Takhar province was poppy-free from 2008 to 2017 but the province lost its poppy-free status in 2018 with 251 hectares of opium poppy cultivation. From 2019, the province was poppy-free again.
Afghanistan Opium Survey 2021 – Cultivation and Production
23
Kunduz province has been poppy-free since 2007. While a small amount of opium poppy cultivation was observed in this province in recent years, it remained under 100 hectares in 2021, the threshold for being considered poppy-free.
Table 7 Opium poppy cultivation in the North-eastern region, 2014-2021 (Hectares)
PROVINCE Cultivation (ha) Change 2020-2021(%)
2017 2018 2019 2020 2021
Badakhshan 8,311 7,703 4,702 6,395 3,561 -44%
Baghlan 1,057 1,076 271 572 188 -67%
Takhar PF 251 PF PF PF NA
Kunduz PF PF PF PF PF NA
North-eastern Region
9,368 9,030 4,973 6,967 3,750 -46%
A province is defined as poppy-free (PF) when it is estimated to have less than 100 hectares of opium poppy cultivation.
Figure 8 Opium poppy cultivation in Badakhshan province, 1994-2021 (Hectares)
The high-low lines represent the upper and lower bounds of the 95% confidence interval.
Afghanistan Opium Survey 2021 – Cultivation and Production
24
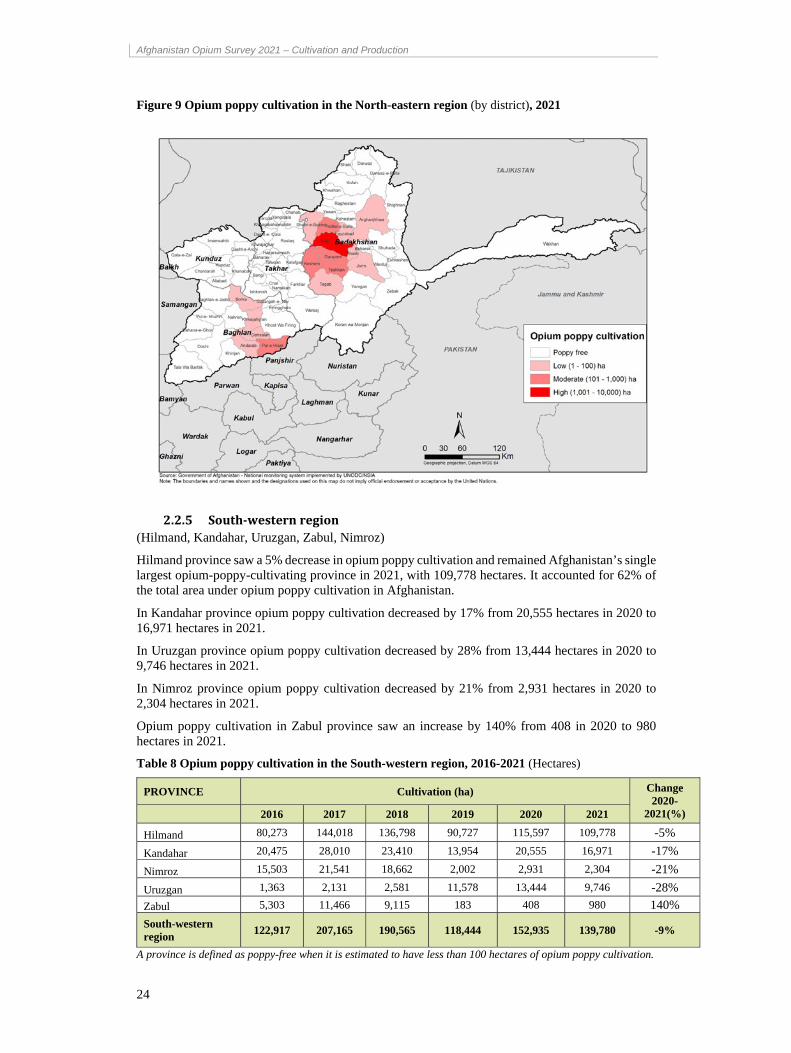
Figure 9 Opium poppy cultivation in the North-eastern region (by district), 2021
2.2.5 South‐westernregion(Hilmand, Kandahar, Uruzgan, Zabul, Nimroz)
Hilmand province saw a 5% decrease in opium poppy cultivation and remained Afghanistan’s single largest opium-poppy-cultivating province in 2021, with 109,778 hectares. It accounted for 62% of the total area under opium poppy cultivation in Afghanistan.
In Kandahar province opium poppy cultivation decreased by 17% from 20,555 hectares in 2020 to 16,971 hectares in 2021.
In Uruzgan province opium poppy cultivation decreased by 28% from 13,444 hectares in 2020 to 9,746 hectares in 2021.
In Nimroz province opium poppy cultivation decreased by 21% from 2,931 hectares in 2020 to 2,304 hectares in 2021.
Opium poppy cultivation in Zabul province saw an increase by 140% from 408 in 2020 to 980 hectares in 2021.
Table 8 Opium poppy cultivation in the South-western region, 2016-2021 (Hectares)
PROVINCE Cultivation (ha) Change 2020-
2021(%) 2016 2017 2018 2019 2020 2021
Hilmand 80,273 144,018 136,798 90,727 115,597 109,778 -5%
Kandahar 20,475 28,010 23,410 13,954 20,555 16,971 -17%
Nimroz 15,503 21,541 18,662 2,002 2,931 2,304 -21%
Uruzgan 1,363 2,131 2,581 11,578 13,444 9,746 -28%
Zabul 5,303 11,466 9,115 183 408 980 140%
South-western region
122,917 207,165 190,565 118,444 152,935 139,780 -9%
A province is defined as poppy-free when it is estimated to have less than 100 hectares of opium poppy cultivation.
Afghanistan Opium Survey 2021 – Cultivation and Production
25
Figure 10 Opium poppy cultivation in Hilmand, Kandahar and Uruzgan provinces, 2004-2021 (Hectares)
The high-low lines represent the upper and lower bounds of the 95% confidence interval
Figure 11 Opium poppy cultivation in the South-Western region (by district), 2021
Afghanistan Opium Survey 2021 – Cultivation and Production
26
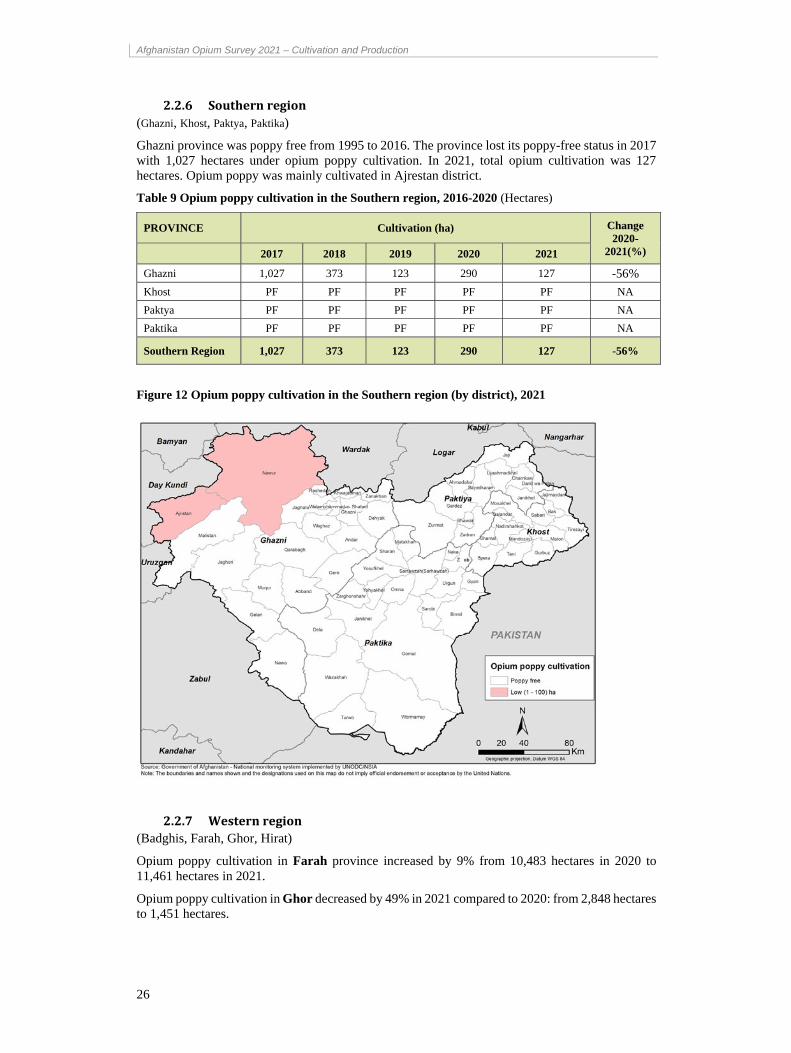
2.2.6 Southernregion(Ghazni, Khost, Paktya, Paktika)
Ghazni province was poppy free from 1995 to 2016. The province lost its poppy-free status in 2017 with 1,027 hectares under opium poppy cultivation. In 2021, total opium cultivation was 127 hectares. Opium poppy was mainly cultivated in Ajrestan district.
Table 9 Opium poppy cultivation in the Southern region, 2016-2020 (Hectares)
PROVINCE Cultivation (ha) Change 2020-
2021(%) 2017 2018 2019 2020 2021
Ghazni 1,027 373 123 290 127 -56%
Khost PF PF PF PF PF NA
Paktya PF PF PF PF PF NA
Paktika PF PF PF PF PF NA
Southern Region 1,027 373 123 290 127 -56%
Figure 12 Opium poppy cultivation in the Southern region (by district), 2021
2.2.7 Westernregion(Badghis, Farah, Ghor, Hirat)
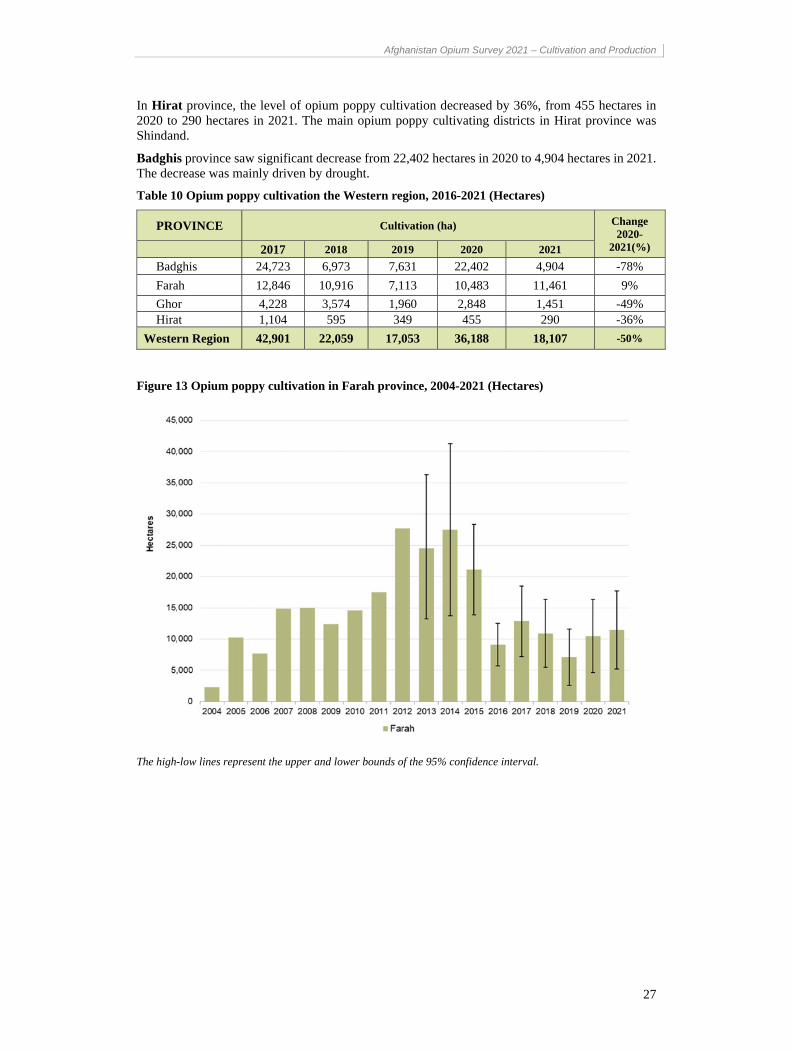
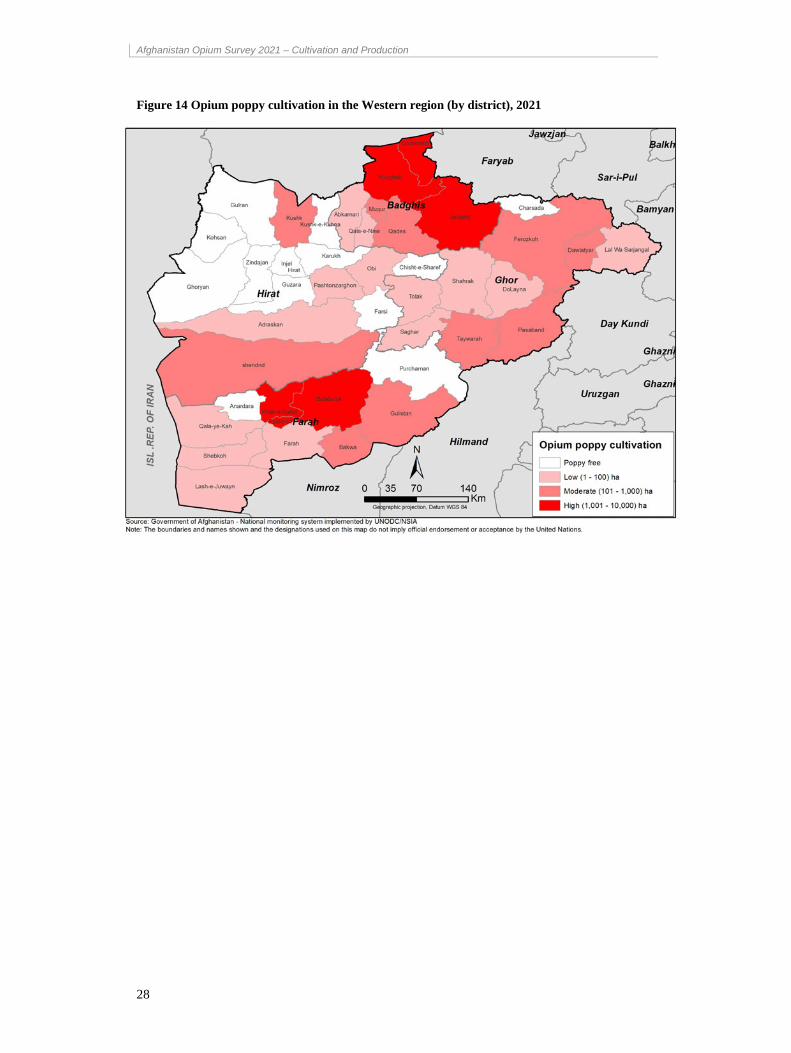
Opium poppy cultivation in Farah province increased by 9% from 10,483 hectares in 2020 to 11,461 hectares in 2021.
Opium poppy cultivation in Ghor decreased by 49% in 2021 compared to 2020: from 2,848 hectares to 1,451 hectares.
Afghanistan Opium Survey 2021 – Cultivation and Production
27
In Hirat province, the level of opium poppy cultivation decreased by 36%, from 455 hectares in 2020 to 290 hectares in 2021. The main opium poppy cultivating districts in Hirat province was Shindand.
Badghis province saw significant decrease from 22,402 hectares in 2020 to 4,904 hectares in 2021. The decrease was mainly driven by drought.
Table 10 Opium poppy cultivation the Western region, 2016-2021 (Hectares)
PROVINCE Cultivation (ha) Change 2020-
2021(%) 2017 2018 2019 2020 2021
Badghis 24,723 6,973 7,631 22,402 4,904 -78%
Farah 12,846 10,916 7,113 10,483 11,461 9%
Ghor 4,228 3,574 1,960 2,848 1,451 -49% Hirat 1,104 595 349 455 290 -36%
Western Region 42,901 22,059 17,053 36,188 18,107 -50%
Figure 13 Opium poppy cultivation in Farah province, 2004-2021 (Hectares)
The high-low lines represent the upper and lower bounds of the 95% confidence interval.
Afghanistan Opium Survey 2021 – Cultivation and Production
28
Figure 14 Opium poppy cultivation in the Western region (by district), 2021
Afghanistan Opium Survey 2021 – Cultivation and Production
29
3 Potentialopiumyieldandproduction
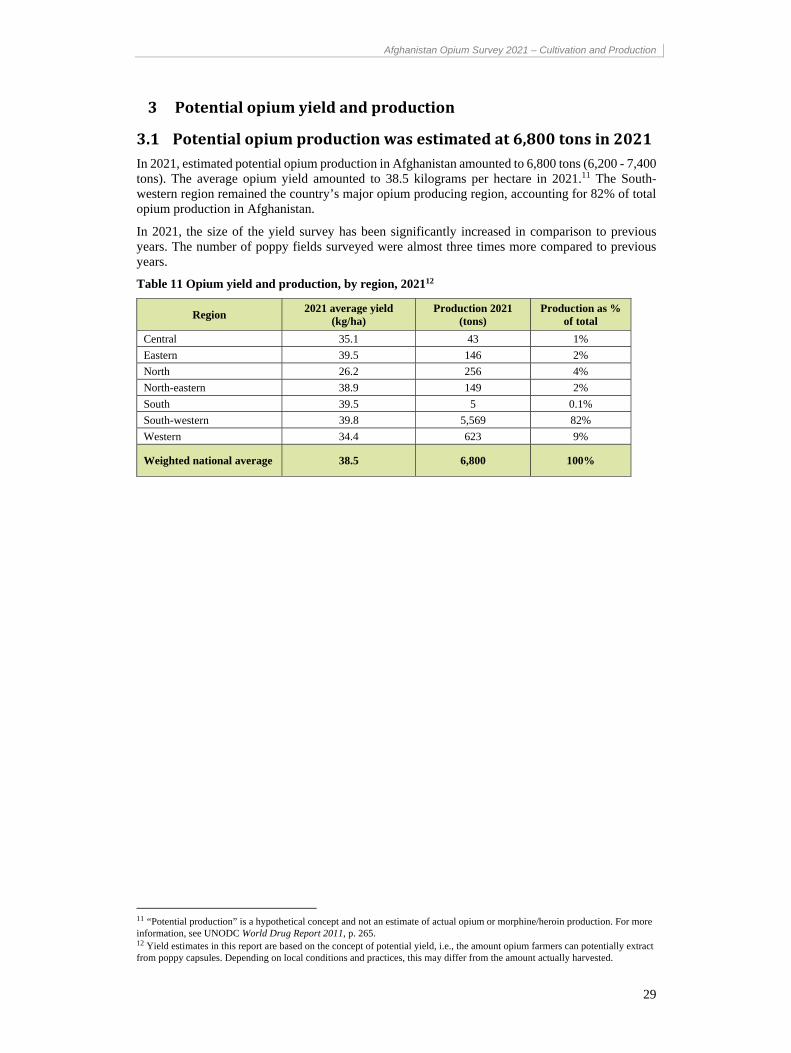
3.1 Potentialopiumproductionwasestimatedat6,800tonsin2021In 2021, estimated potential opium production in Afghanistan amounted to 6,800 tons (6,200 - 7,400 tons). The average opium yield amounted to 38.5 kilograms per hectare in 2021.11 The South-western region remained the country’s major opium producing region, accounting for 82% of total opium production in Afghanistan.
In 2021, the size of the yield survey has been significantly increased in comparison to previous years. The number of poppy fields surveyed were almost three times more compared to previous years.
Table 11 Opium yield and production, by region, 202112
Region 2021 average yield
(kg/ha) Production 2021
(tons) Production as %
of total
Central 35.1 43 1%
Eastern 39.5 146 2%
North 26.2 256 4%
North-eastern 38.9 149 2%
South 39.5 5 0.1%
South-western 39.8 5,569 82%
Western 34.4 623 9%
Weighted national average 38.5 6,800 100%
11 “Potential production” is a hypothetical concept and not an estimate of actual opium or morphine/heroin production. For more information, see UNODC World Drug Report 2011, p. 265. 12 Yield estimates in this report are based on the concept of potential yield, i.e., the amount opium farmers can potentially extract from poppy capsules. Depending on local conditions and practices, this may differ from the amount actually harvested.
Afghanistan Opium Survey 2021 – Cultivation and Production
30
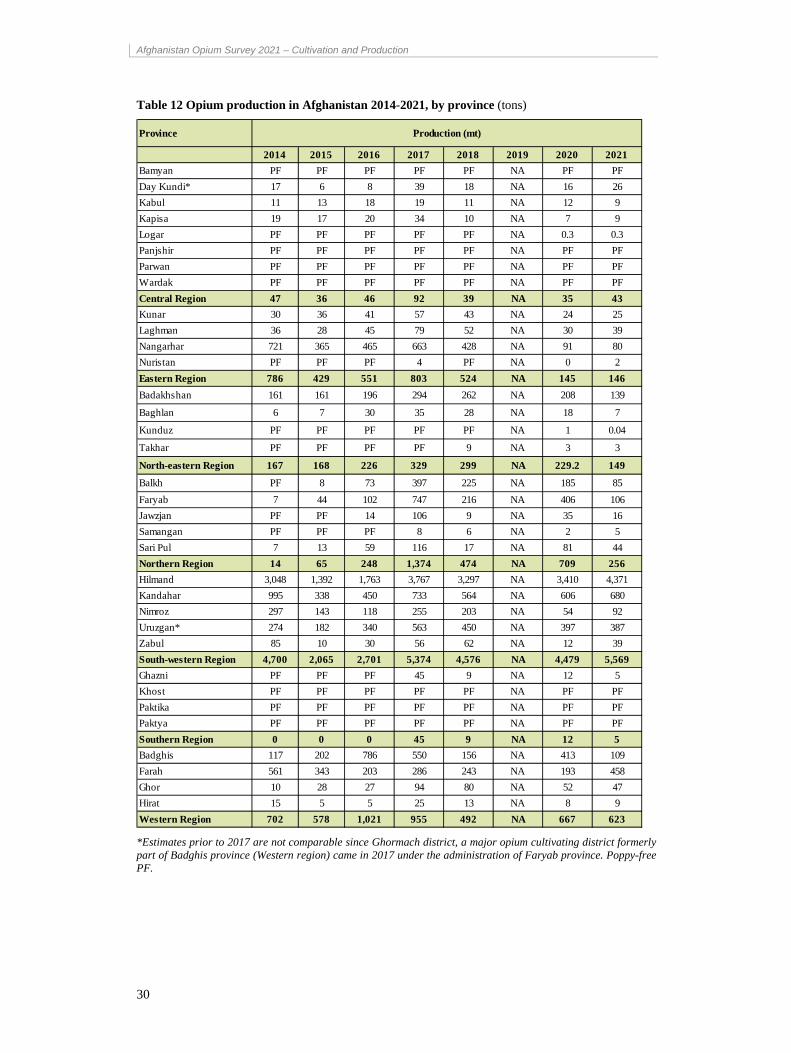
Table 12 Opium production in Afghanistan 2014-2021, by province (tons)
*Estimates prior to 2017 are not comparable since Ghormach district, a major opium cultivating district formerly part of Badghis province (Western region) came in 2017 under the administration of Faryab province. Poppy-free PF.
Province
2014 2015 2016 2017 2018 2019 2020 2021
Bamyan PF PF PF PF PF NA PF PF
Day Kundi* 17 6 8 39 18 NA 16 26
Kabul 11 13 18 19 11 NA 12 9
Kapisa 19 17 20 34 10 NA 7 9
Logar PF PF PF PF PF NA 0.3 0.3
Panjshir PF PF PF PF PF NA PF PF
Parwan PF PF PF PF PF NA PF PF
Wardak PF PF PF PF PF NA PF PF
Central Region 47 36 46 92 39 NA 35 43
Kunar 30 36 41 57 43 NA 24 25
Laghman 36 28 45 79 52 NA 30 39
Nangarhar 721 365 465 663 428 NA 91 80
Nuristan PF PF PF 4 PF NA 0 2
Eastern Region 786 429 551 803 524 NA 145 146
Badakhshan 161 161 196 294 262 NA 208 139
Baghlan 6 7 30 35 28 NA 18 7
Kunduz PF PF PF PF PF NA 1 0.04
Takhar PF PF PF PF 9 NA 3 3
North-eastern Region 167 168 226 329 299 NA 229.2 149
Balkh PF 8 73 397 225 NA 185 85
Faryab 7 44 102 747 216 NA 406 106
Jawzjan PF PF 14 106 9 NA 35 16
Samangan PF PF PF 8 6 NA 2 5
Sari Pul 7 13 59 116 17 NA 81 44
Northern Region 14 65 248 1,374 474 NA 709 256
Hilmand 3,048 1,392 1,763 3,767 3,297 NA 3,410 4,371
Kandahar 995 338 450 733 564 NA 606 680
Nimroz 297 143 118 255 203 NA 54 92
Uruzgan* 274 182 340 563 450 NA 397 387
Zabul 85 10 30 56 62 NA 12 39
South-western Region 4,700 2,065 2,701 5,374 4,576 NA 4,479 5,569
Ghazni PF PF PF 45 9 NA 12 5
Khost PF PF PF PF PF NA PF PF
Paktika PF PF PF PF PF NA PF PF
Paktya PF PF PF PF PF NA PF PF
Southern Region 0 0 0 45 9 NA 12 5
Badghis 117 202 786 550 156 NA 413 109
Farah 561 343 203 286 243 NA 193 458
Ghor 10 28 27 94 80 NA 52 47
Hirat 15 5 5 25 13 NA 8 9
Western Region 702 578 1,021 955 492 NA 667 623
Production (mt)
Afghanistan Opium Survey 2021 – Cultivation and Production
31
Figure 15 Potential opium production in Afghanistan, 1994-2021 (mt)
Figures refer to oven-dry opium. The vertical lines represent the upper and lower bounds of the 95% confidence interval.
3.2 Potentialheroinproductionfromthe2021opiumharvestAll the opium produced in Afghanistan each year is either exported as raw opium or in the form of heroin/morphine, consumed domestically in various forms, seized, stored for later use or lost (for example, due to mold, disposal to avoid seizures, etc.).
It can be estimated that the 2021 harvest of 6,800 tons provided 1,100 to 1,400 tons of opium to meet the demand for consumption of opium in its unprocessed form. The remaining 5,400 to 5,700 tons are potentially available for heroin production in and outside of Afghanistan and can yield some 390 to 650 tons of heroin of export quality (purity between 50 and 70 per cent) or 270 to 320 tons of pure heroin base.13
Table 13 Estimated shares of opium production available for heroin production
Opium production 2018
Demand for unprocessed opium in
the region
Potential production of
heroin of export quality
Potential production of
pure heroin base
6,800 tons (6,200 – 7,400)
1,100 – 1,400 tons 390 - 650 tons 270 - 320 tons
A ratio of 18.5:1 (17.5:1 – 19.6:1) is used for converting opium to pure heroin base. For converting opium to 50% pure heroin, 9.2 kilograms (8.7 to 9.8 kilograms) of opium are assumed to be needed; for converting opium to 70% pure heroin, 12.9 kilograms (12.2 to 13.7 kilograms) of opium are assumed to be needed. Ranges reflect different purities and the upper and lower estimates of the demand estimates for raw opium.
13 For details on the demand estimates and conversion ratios, see MCN/UNODC “Afghanistan opium survey 2017 – Challenges to sustainable development, peace and security” (May 2018).
Afghanistan Opium Survey 2021 – Cultivation and Production
32
These values represent a potential heroin production from the 2021 harvest: A noteworthy share of the opium and heroin production is seized or lost along the supply chain from source to destination countries, and a proportion of the product may not enter the market in the year of interest. The amount of heroin that reaches end-consumer markets is thus lower than this estimate.
There is great uncertainty around these estimates. While confidence in the opium production estimates is high, uncertainties around the conversion ratio from opium to heroin stem mainly from the wide range of possible purities of the product and from scarce data on the efficiency of the conversion from opium to heroin (i.e., how much opium is needed to produce one kilogramme of heroin). Uncertainties around the demand estimate are mainly associated with the assumptions around annual opium consumption per user.
4 Farm‐gate value of opium and value of opiateproduction andexports
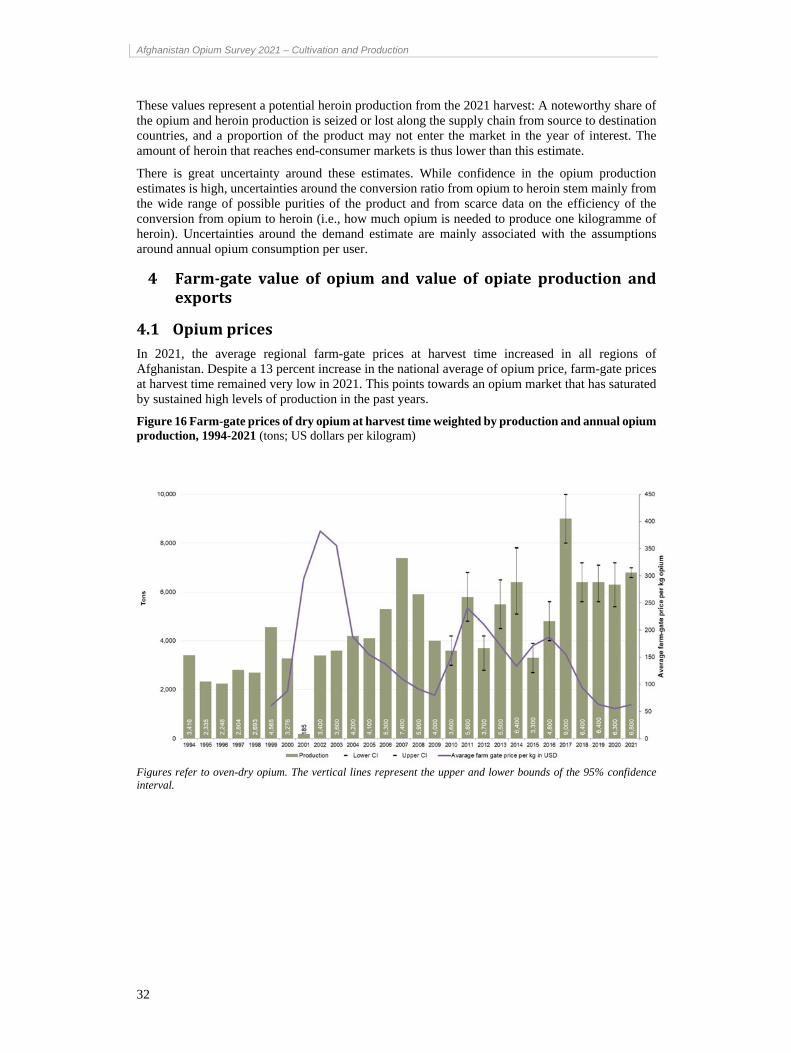
4.1 OpiumpricesIn 2021, the average regional farm-gate prices at harvest time increased in all regions of Afghanistan. Despite a 13 percent increase in the national average of opium price, farm-gate prices at harvest time remained very low in 2021. This points towards an opium market that has saturated by sustained high levels of production in the past years.
Figure 16 Farm-gate prices of dry opium at harvest time weighted by production and annual opium production, 1994-2021 (tons; US dollars per kilogram)
Figures refer to oven-dry opium. The vertical lines represent the upper and lower bounds of the 95% confidence interval.
Afghanistan Opium Survey 2021 – Cultivation and Production
33
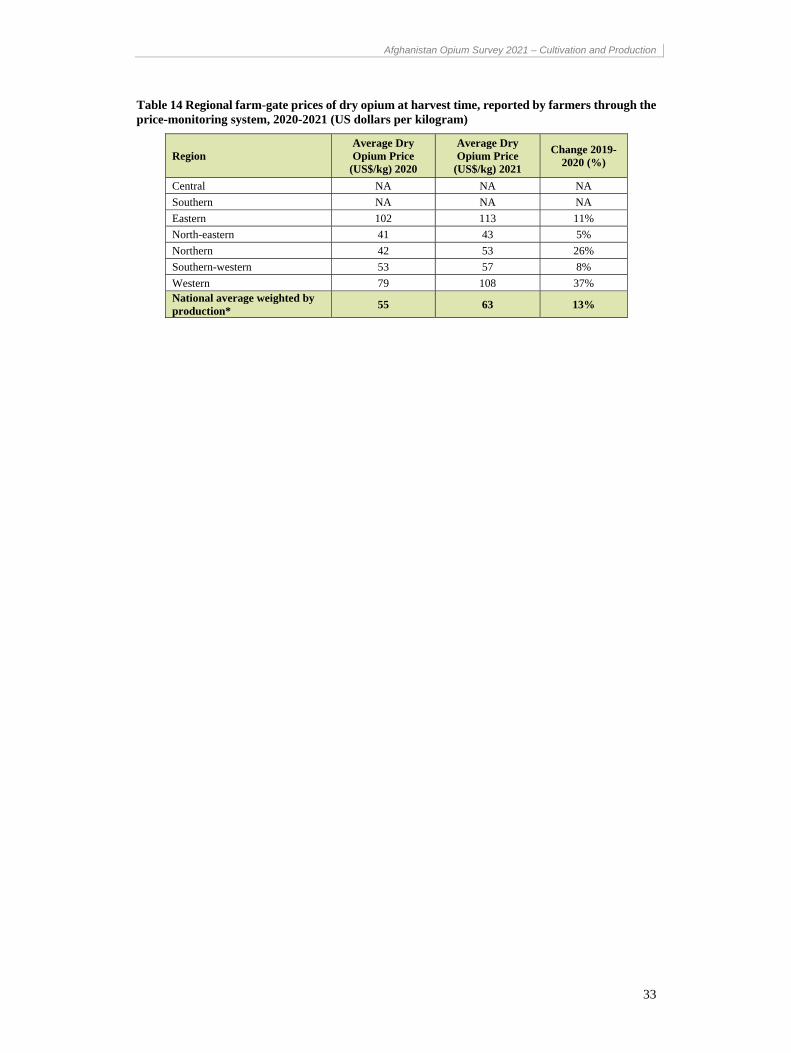
Table 14 Regional farm-gate prices of dry opium at harvest time, reported by farmers through the price-monitoring system, 2020-2021 (US dollars per kilogram)
Region Average Dry Opium Price
(US$/kg) 2020
Average Dry Opium Price
(US$/kg) 2021
Change 2019-2020 (%)
Central NA NA NA
Southern NA NA NA
Eastern 102 113 11%
North-eastern 41 43 5%
Northern 42 53 26%
Southern-western 53 57 8%
Western 79 108 37% National average weighted by production*
55 63 13%
Afghanistan Opium Survey 2021 – Cultivation and Production
34
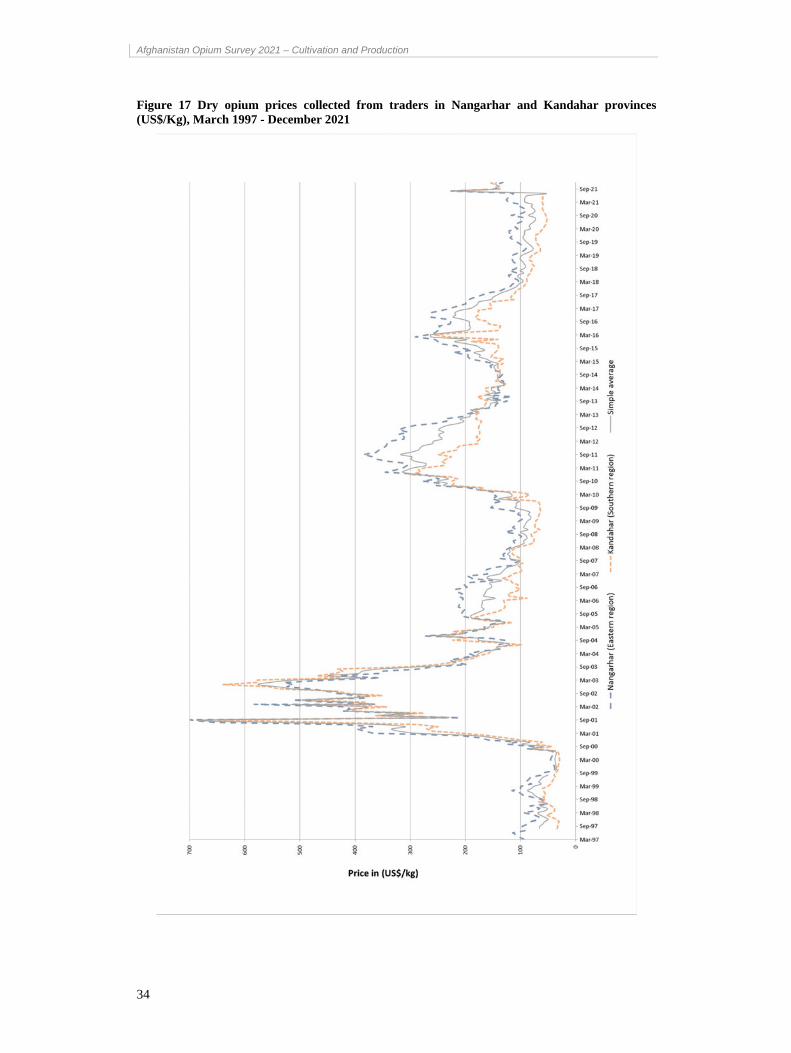
Figure 17 Dry opium prices collected from traders in Nangarhar and Kandahar provinces (US$/Kg), March 1997 - December 2021
Afghanistan Opium Survey 2021 – Cultivation and Production
35
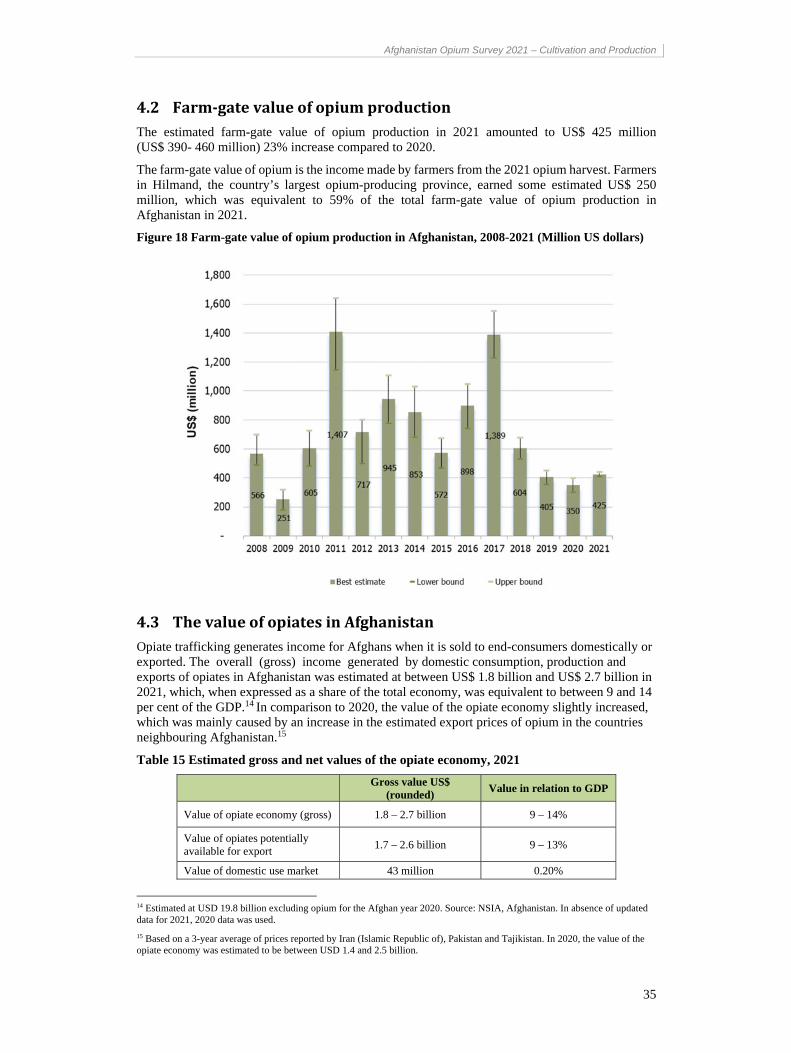
4.2 Farm‐gatevalueofopiumproductionThe estimated farm-gate value of opium production in 2021 amounted to US$ 425 million (US$ 390- 460 million) 23% increase compared to 2020.
The farm-gate value of opium is the income made by farmers from the 2021 opium harvest. Farmers in Hilmand, the country’s largest opium-producing province, earned some estimated US$ 250 million, which was equivalent to 59% of the total farm-gate value of opium production in Afghanistan in 2021.
Figure 18 Farm-gate value of opium production in Afghanistan, 2008-2021 (Million US dollars)
4.3 ThevalueofopiatesinAfghanistanOpiate trafficking generates income for Afghans when it is sold to end-consumers domestically or exported. The overall (gross) income generated by domestic consumption, production and exports of opiates in Afghanistan was estimated at between US$ 1.8 billion and US$ 2.7 billion in 2021, which, when expressed as a share of the total economy, was equivalent to between 9 and 14 per cent of the GDP.14 In comparison to 2020, the value of the opiate economy slightly increased, which was mainly caused by an increase in the estimated export prices of opium in the countries neighbouring Afghanistan.15
Table 15 Estimated gross and net values of the opiate economy, 2021
Gross value US$ (rounded)
Value in relation to GDP
Value of opiate economy (gross) 1.8 – 2.7 billion 9 – 14%
Value of opiates potentially available for export
1.7 – 2.6 billion 9 – 13%
Value of domestic use market 43 million 0.20%
14 Estimated at USD 19.8 billion excluding opium for the Afghan year 2020. Source: NSIA, Afghanistan. In absence of updated data for 2021, 2020 data was used.
15 Based on a 3-year average of prices reported by Iran (Islamic Republic of), Pakistan and Tajikistan. In 2020, the value of the opiate economy was estimated to be between USD 1.4 and 2.5 billion.
Afghanistan Opium Survey 2021 – Cultivation and Production
36
Value of imported precursor substances
85 – 137 million 0.43 – 0.69%
Farm-gate value of opium 430 million
(390 – 460 million) 2%
Value of production and trafficking after farm-gate to the border (net)
1.3 – 2.1 billion 6 – 11%
Note: Ranges are calculated based on different assumptions on the conversion of opium to morphine/heroin within Afghanistan and on the purity of the exported products. “Value of the opiate economy (gross)” is the sum of the value of the domestic market and the value of opiates believed to be exported, including the value of the imported precursor substance acetic anhydride. The net value of the opiate economy excludes the value of imported precursor substances. Details on the calculation and the underlying assumptions are provided in the methodology section. “Value of production and trafficking after farm-gate to the border (net)” is the value added in the opiate economy after the farm-gate value with costs for imported precursor substances subtracted. Figures are rounded; calculations are based on raw values.
5 MethodologyThis chapter covers various methodological aspects regarding survey design and estimation procedure.
5.1 EstimationofareaunderopiumpoppycultivationRemote sensing methodologies have been used by UNODC since 2002 to monitor the extent of opium poppy cultivation in Afghanistan. Changes in the location of opium poppy cultivation and the increased security difficulties involved in accessing the area of interest require continuous improvements of the survey designs.
A sampling approach is used to cover those provinces where most of the poppy is found, whereas a targeted approach is used in provinces with a low level of opium poppy cultivation. “Targeted approach” means that a certain area of a province is fully covered by satellite imagery. Provinces without indication for opium poppy cultivation are covered by the village survey only.
From 2015, new and better satellite technology allowed for a major change in the study design: the size of the grid cells used for acquiring satellite imagery has been reduced from 10 x 10 km images to 5 x 5 km images. This change affected only provinces where a sampling approach was used; all other provinces were not affected by this change.
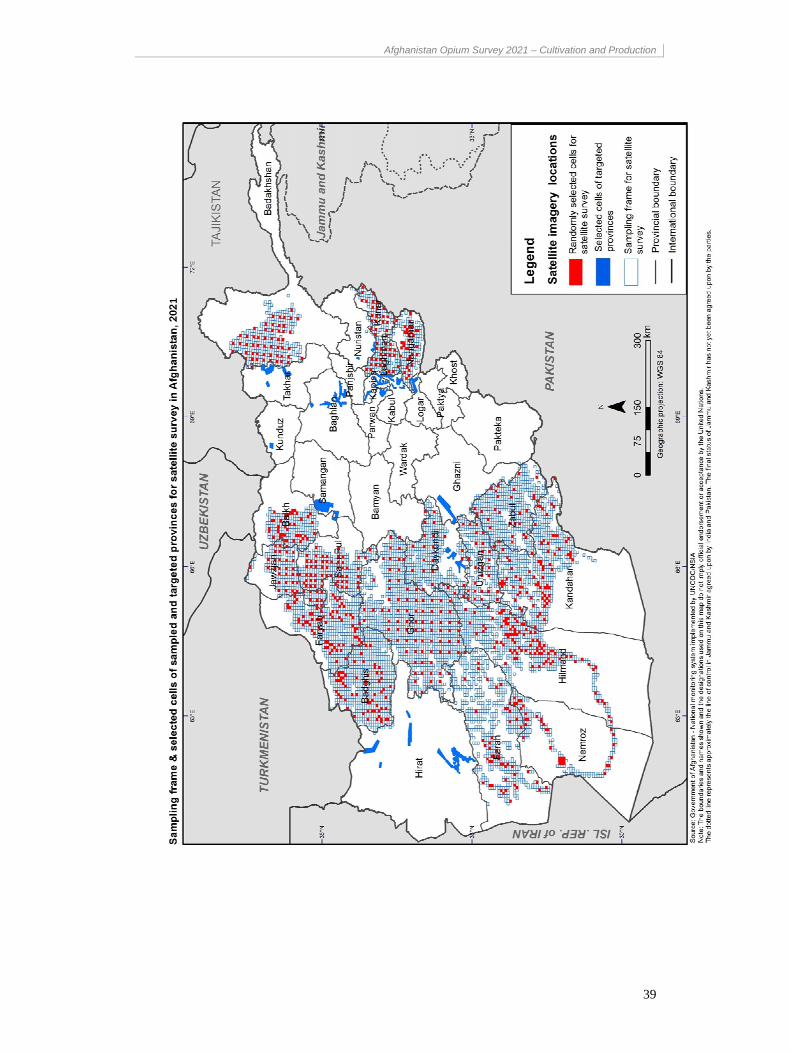
In 2021, out of 34 provinces in Afghanistan, 17 were sampled and 11 were targeted. The remaining 6 provinces were considered to be poppy-free based on information from the field. These provinces were not covered by the remote sensing survey but were covered by the village survey.
The same sampling locations have been used since 2019, which ensured high levels of comparability of the annual estimates.
Table 16 Area estimation method, by province, 2021
Region Targeted approach Sampling approach Village survey only
Central Kabul, Parwan, Logar Day-Kundi Panjshir, Wardak,
Eastern Kapisa, Nuristan Kunar, Nangarhar, Laghman
Northern Samangan Faryab, Jawzjan, Balkh, Sari-Pul,
Bamyan
North-eastern
Baghlan, Takhar, Kunduz
Badakhshan
Southern Ghazni Khost, Paktya, Paktika
Western Hirat Badghis, Farah, Ghor
South-western
Hilmand, Kandahar, Uruzgan, Zabul, Nimroz,

Afghanistan Opium Survey 2021 – Cultivation and Production
37
Afghanistan Opium Survey 2021 – Cultivation and Production
38
5.1.1 Studydesign
5.1.1.1 SamplingframeThe sampling frame was established by extracting the area of land potentially available for opium poppy cultivation in 17 provinces. This area was divided into regular 5 km by 5 km grids, which constituted the sampling frame. The final sampling frame, from which the satellite images were randomly selected, consisted of 7,477 cells. In the case of images that cut across provincial boundaries, only the part falling into a particular province was considered to be in that province.
The area available for agriculture in the sampling frame covers irrigated and rain-fed land. The total area in the 17 provinces was 48,313 km2, which is equivalent to 38% of all potential agricultural land in Afghanistan. Potential land refers to all land available for cultivation and also includes land that is currently fallow.
Cells containing less than 0.25 km2 of potential agricultural land were excluded from the sampling frame in order to reduce the likelihood of choosing cells with very little arable land. In total, the exclusions represented less than 1% of the total potential agricultural land.
5.1.1.2 SamplesizedeterminationThe total number of images to be selected in the sampled provinces was determined in 2015 with the goal to increase accuracy of the estimates and to save cost when compared to previous years.
The accuracy of area estimates depends on the proportion of land covered by satellite imagery and even more so on the number of images than can be acquired. With opium poppy cultivation being concentrated in hot spots and thus unevenly distributed across the agricultural land, information from a large, contiguous piece of land has less value than geographically evenly distributed, smaller pieces information. Costs associated with satellite imagery depends mainly on the total area covered (and not on the number of images). By using 5 x 5 km instead of 10 x 10 km images, at same costs four times the number of images can be acquired. Further details on the sample size determination methodology can be found in Opium Survey, December 2015, page 42.
5.1.1.3 SamplesizeallocationThe available number n of images has been distributed to provinces h according to a so-called power allocation, which uses agricultural area as size measure. For provincial sample size nh,
𝑛 𝑛𝑋 𝐶𝑉
∑ 𝑋 𝐶𝑉
where CVh is the coefficient of variation of area under poppy cultivation in province h and Xh land available for agriculture in province h. This approach ensures that sample size depends on both the variability of poppy and the size of the province measured by agricultural land. After an empirical assessment, the smoothing parameter q, 0≤q≤1, was set to 0.2. In addition, a mininum of 20 samples per provinces was set, which took effect in Day-Kundi and Kunar.
In 2021, high-resolution satellite images were acquired for 830 sampled locations 5 km by 5 km in size covering a total of 17 provinces.
Afghanistan Opium Survey 2021 – Cultivation and Production
39
Afghanistan Opium Survey 2021 – Cultivation and Production
40
Table 17 Sample size and agricultural land and sampling ratio, by province, 2021
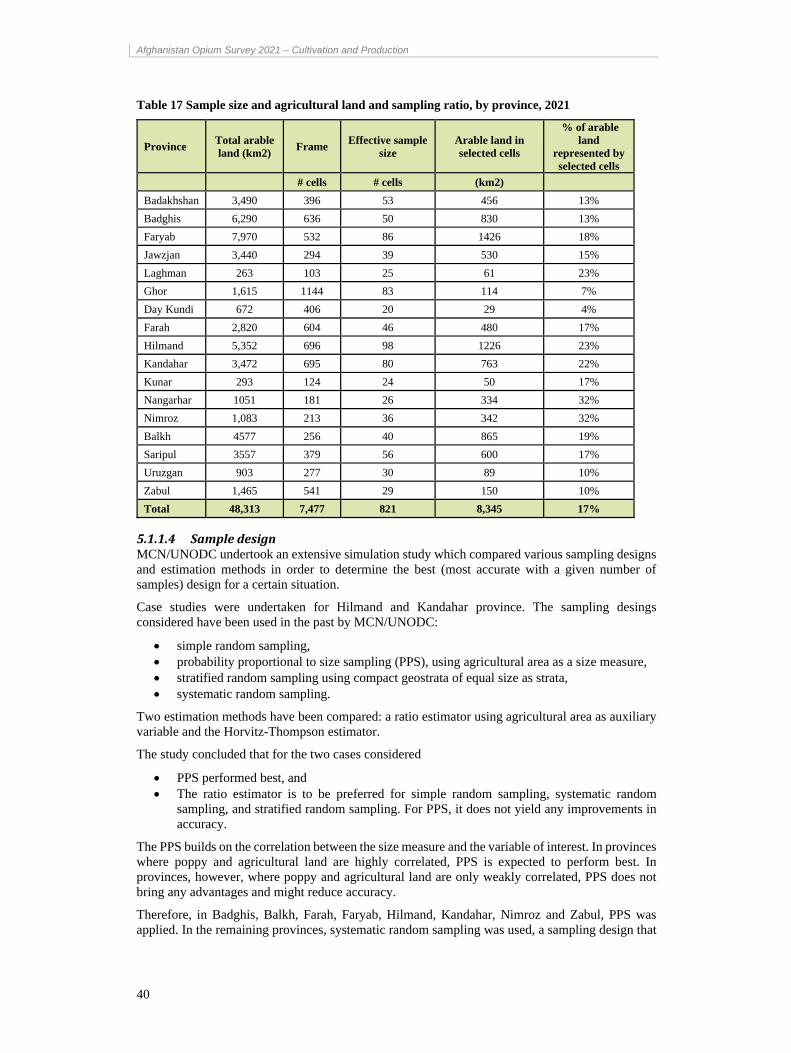
Province Total arable land (km2)
Frame Effective sample
size Arable land in selected cells
% of arable land
represented by selected cells
# cells # cells (km2)
Badakhshan 3,490 396 53 456 13%
Badghis 6,290 636 50 830 13%
Faryab 7,970 532 86 1426 18%
Jawzjan 3,440 294 39 530 15%
Laghman 263 103 25 61 23%
Ghor 1,615 1144 83 114 7%
Day Kundi 672 406 20 29 4%
Farah 2,820 604 46 480 17%
Hilmand 5,352 696 98 1226 23%
Kandahar 3,472 695 80 763 22%
Kunar 293 124 24 50 17%
Nangarhar 1051 181 26 334 32%
Nimroz 1,083 213 36 342 32%
Balkh 4577 256 40 865 19%
Saripul 3557 379 56 600 17%
Uruzgan 903 277 30 89 10%
Zabul 1,465 541 29 150 10%
Total 48,313 7,477 821 8,345 17%
5.1.1.4 SampledesignMCN/UNODC undertook an extensive simulation study which compared various sampling designs and estimation methods in order to determine the best (most accurate with a given number of samples) design for a certain situation.
Case studies were undertaken for Hilmand and Kandahar province. The sampling desings considered have been used in the past by MCN/UNODC:
simple random sampling, probability proportional to size sampling (PPS), using agricultural area as a size measure, stratified random sampling using compact geostrata of equal size as strata, systematic random sampling.
Two estimation methods have been compared: a ratio estimator using agricultural area as auxiliary variable and the Horvitz-Thompson estimator.
The study concluded that for the two cases considered
PPS performed best, and The ratio estimator is to be preferred for simple random sampling, systematic random
sampling, and stratified random sampling. For PPS, it does not yield any improvements in accuracy.
The PPS builds on the correlation between the size measure and the variable of interest. In provinces where poppy and agricultural land are highly correlated, PPS is expected to perform best. In provinces, however, where poppy and agricultural land are only weakly correlated, PPS does not bring any advantages and might reduce accuracy.
Therefore, in Badghis, Balkh, Farah, Faryab, Hilmand, Kandahar, Nimroz and Zabul, PPS was applied. In the remaining provinces, systematic random sampling was used, a sampling design that
Afghanistan Opium Survey 2021 – Cultivation and Production
41
ensures an even geographical distribution of samples (see the “Opium poppy 2015 – Cultivation and production” for more details).
In more detail, in a PPS design without replacement a unit has a probability to be selected in the first draw of
𝑝𝑖𝑥
∑ 𝑥
where x is the size variable (agricultural land) in unit i, and N is the number of units that can be selected. The subsequent units have slightly modified inclusion probabilities. For drawing the samples and for calculating the inclusion probabilities the statistical software R (package sampling) was used.
Since agricultural area tends to be concentrated in one or more clusters in a province, PPS sampling without further stratification would lead to a concentration of samples in a few spots and possibly do not cover every district. Therefore, in all PPS provinces, the sample was stratified by district.
In the remaining provinces, a one-stage systematic random sampling approach was employed in which a sampling rule was applied that ensured good geographic coverage. Starting from a randomly chosen cell, every kth element from then onwards was chosen, where k is determined by the number of cells in the frame and the desired sample size (the actual sample size might differ slightly).
In Nangarhar province, the districts Dara-e-Nur, Kuzkunar, Kama, Behsud, Jalalabad and partially Surkhrod were excluded from the frame.
5.1.2 AreaestimationinsampledprovincesThe estimation of the extent of opium poppy cultivation is a ratio estimate16 for each of the provinces, using potential agricultural land as an auxiliary variable. The national estimate was obtained by adding up the provincial estimates in what is known as a separate ratio estimate.
In provinces where systematic random sampling was applied, the area of opium poppy cultivation, Yk, within province k, is estimated as:
𝑌 𝑋∑ 𝑦
∑ 𝑥
where nk is the number of satellite image locations within the province; yi is the area of poppy cultivation in image i; xi is the area of land potentially available for poppy cultivation in image I, and X is the total potential land available for poppy cultivation in province k.
In PPS provinces, where units are selected with unequal inclusion probability, a slightly different ratio estimate was used that incorporates the inclusion probability (Horvitz-Thompson estimator).
5.1.2.1 UncertaintyIn the PPS provinces the confidence intervals were calculated following statistical practice.17
In all remaining provinces no unbiased estimator for the variance was available; confidence intervals were approximated by assuming simple random sampling. The confidence intervals therefore slightly overestimate the uncertainty of the estimates.
16 The ratio estimator did not outperform the Horvitz Thompson estimator in the PPS provinces. The ratio estimator was applied in all provinces for reasons of consistency and to account for possible updates of the agricultural area in future years.
17 See, e.g. Cochran, W. G., Sampling techniques, John Wiley & Sons (2007).
Afghanistan Opium Survey 2021 – Cultivation and Production
42
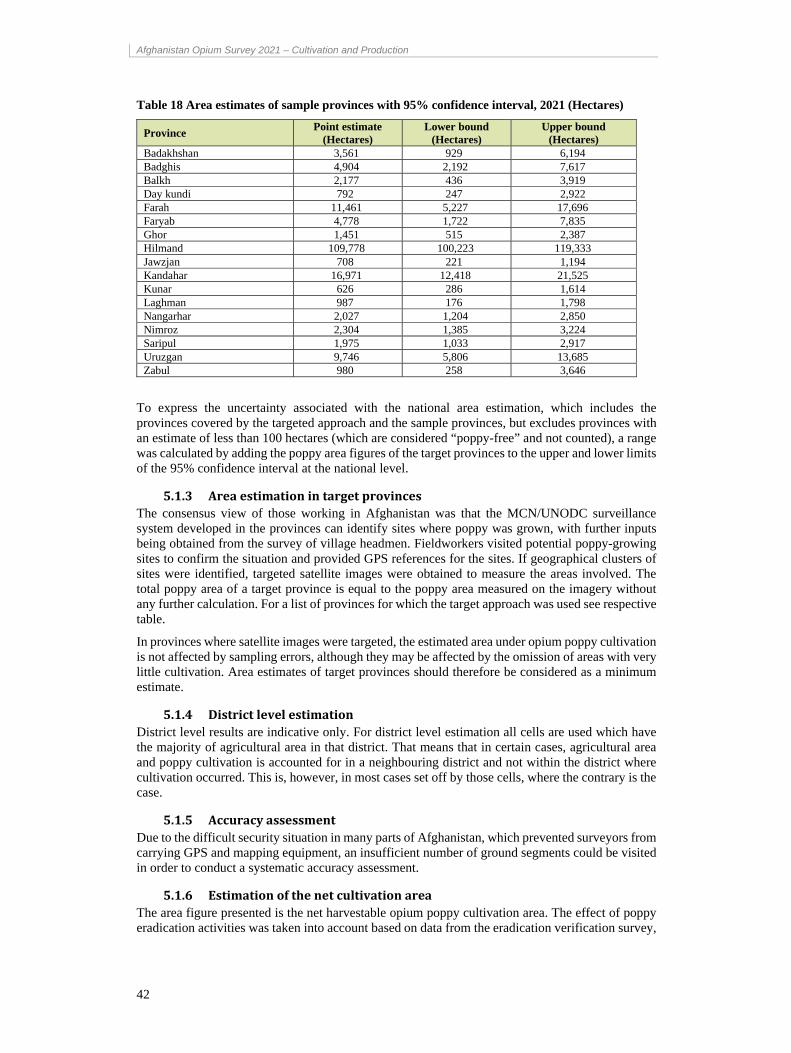
Table 18 Area estimates of sample provinces with 95% confidence interval, 2021 (Hectares)
Province Point estimate
(Hectares) Lower bound
(Hectares) Upper bound
(Hectares) Badakhshan 3,561 929 6,194 Badghis 4,904 2,192 7,617 Balkh 2,177 436 3,919 Day kundi 792 247 2,922 Farah 11,461 5,227 17,696 Faryab 4,778 1,722 7,835 Ghor 1,451 515 2,387 Hilmand 109,778 100,223 119,333 Jawzjan 708 221 1,194 Kandahar 16,971 12,418 21,525 Kunar 626 286 1,614 Laghman 987 176 1,798 Nangarhar 2,027 1,204 2,850 Nimroz 2,304 1,385 3,224 Saripul 1,975 1,033 2,917 Uruzgan 9,746 5,806 13,685 Zabul 980 258 3,646
To express the uncertainty associated with the national area estimation, which includes the provinces covered by the targeted approach and the sample provinces, but excludes provinces with an estimate of less than 100 hectares (which are considered “poppy-free” and not counted), a range was calculated by adding the poppy area figures of the target provinces to the upper and lower limits of the 95% confidence interval at the national level.
5.1.3 AreaestimationintargetprovincesThe consensus view of those working in Afghanistan was that the MCN/UNODC surveillance system developed in the provinces can identify sites where poppy was grown, with further inputs being obtained from the survey of village headmen. Fieldworkers visited potential poppy-growing sites to confirm the situation and provided GPS references for the sites. If geographical clusters of sites were identified, targeted satellite images were obtained to measure the areas involved. The total poppy area of a target province is equal to the poppy area measured on the imagery without any further calculation. For a list of provinces for which the target approach was used see respective table.
In provinces where satellite images were targeted, the estimated area under opium poppy cultivation is not affected by sampling errors, although they may be affected by the omission of areas with very little cultivation. Area estimates of target provinces should therefore be considered as a minimum estimate.
5.1.4 DistrictlevelestimationDistrict level results are indicative only. For district level estimation all cells are used which have the majority of agricultural area in that district. That means that in certain cases, agricultural area and poppy cultivation is accounted for in a neighbouring district and not within the district where cultivation occurred. This is, however, in most cases set off by those cells, where the contrary is the case.
5.1.5 AccuracyassessmentDue to the difficult security situation in many parts of Afghanistan, which prevented surveyors from carrying GPS and mapping equipment, an insufficient number of ground segments could be visited in order to conduct a systematic accuracy assessment.
5.1.6 EstimationofthenetcultivationareaThe area figure presented is the net harvestable opium poppy cultivation area. The effect of poppy eradication activities was taken into account based on data from the eradication verification survey,
Afghanistan Opium Survey 2021 – Cultivation and Production
43
which provides exact GPS coordinates of all eradicated fields supplemented with additional information. The gross cultivation areas would be the net cultivation plus eradication.
In provinces where the poppy area is estimated with a sampling approach, the first step is to calculate the gross poppy cultivation area. The total area eradicated in those provinces is then deducted from the mid-point estimate of the provincial cultivation estimate to obtain the net cultivation area. If eradication activities were carried out after the date of the image acquisition, no adjustment is necessary as the poppy present in the image reflects the gross poppy area. If eradication activities were carried out in a sample block before the date of the image acquisition, the area interpreted as poppy would not reflect the gross area. Therefore, the eradicated fields are added to the interpreted fields. The adjusted poppy area figure for the block is then used for the provincial estimate.
In provinces where the poppy areas is estimated with a targeted approach (census), eradication activities that happened before the date of the image acquisition are already reflected, as these fields no longer appear as poppy in the image. Fields that were eradicated after the date of the images acquisition are simply deleted.
5.2 Satelliteimageinterpretation
5.2.1 AcquisitionofsatelliteimagesThe acquisition of satellite images at the appropriate growth stage of the opium poppy is key to the successful identification of opium poppy fields on satellite images. Satellite data is collected at two stages: the pre-harvest (flowering) stage and the post-harvest (post-lancing) stage. In recent years, detailed information on the crop growth cycle of each district has been collected in the form of a phenological chart, which is useful for deciding on appropriate dates for satellite data acquisition. First-dated images of the Southern, Eastern and Western regions are collected during March and April due to the early cultivation and maturity of crops in those regions. The crop growth cycle begins later as one goes northward. Images of the North and North-eastern region are acquired during May, June and July. Second-dated satellite images are collected approximately two months after the first images are collected.
The normal time window for satellite data acquisition is one month, depending on the scheduled passing of satellite and weather conditions. The time window for first-dated image acquisition begins at the full flowering stage and continues through the capsule stage. Second-dated image acquisition begins towards the end of the lancing stage and continues until the opium poppy fields are ploughed. Images acquired in the middle of the prescribed time window facilitate optimum discrimination between opium poppy and other crops.
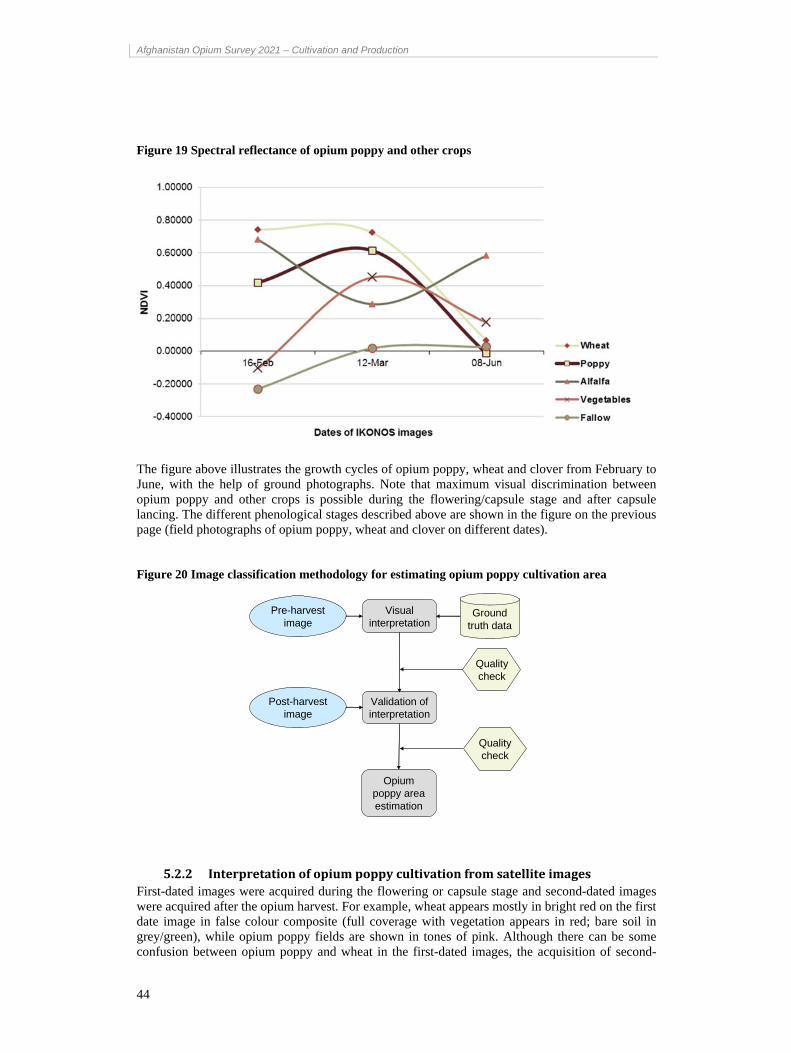
The figure below illustrates the spectral characteristics (expressed in a Normalized Difference Vegetation Index; NDVI) of opium poppy and other crops between February and June. Wheat and opium poppy have the same growth cycle between March and June, as illustrated. The spectral differences between those two crops are more pronounced in February, which marks the beginning of the capsule stage of the crop in this example. Poppy fields are ploughed immediately after the harvest, whereas wheat fields are not. That is why two-dated images (pre-harvest and post-harvest) are collected for the same location.
Afghanistan Opium Survey 2021 – Cultivation and Production
44
Figure 19 Spectral reflectance of opium poppy and other crops
The figure above illustrates the growth cycles of opium poppy, wheat and clover from February to June, with the help of ground photographs. Note that maximum visual discrimination between opium poppy and other crops is possible during the flowering/capsule stage and after capsule lancing. The different phenological stages described above are shown in the figure on the previous page (field photographs of opium poppy, wheat and clover on different dates).
Figure 20 Image classification methodology for estimating opium poppy cultivation area
5.2.2 InterpretationofopiumpoppycultivationfromsatelliteimagesFirst-dated images were acquired during the flowering or capsule stage and second-dated images were acquired after the opium harvest. For example, wheat appears mostly in bright red on the first date image in false colour composite (full coverage with vegetation appears in red; bare soil in grey/green), while opium poppy fields are shown in tones of pink. Although there can be some confusion between opium poppy and wheat in the first-dated images, the acquisition of second-
Pre-harvest image
Ground truth data
Visual interpretation
Post-harvest image
Validation of interpretation
Opium poppy area estimation
Quality check
Quality check
Afghanistan Opium Survey 2021 – Cultivation and Production
45
dated images makes it possible to distinguish opium poppy from other crops, because the opium poppy crop has been harvested and the fields appear in grey/green.
Visual interpretation was used to delineate opium poppy fields by interpreting PLEIADES images covering a 5 km by 5 km area. Ortho-rectified PLEIADES images of 0.5 m resolution (PAN-sharpened) were used for this purpose. Opium poppy was initially identified using first-dated high resolution images. Ground truth information collected in the form of segment maps and GPS points was also useful in identifying opium poppy fields. The interpretation based on first-dated images was improved using patterns of observation in second-dated images. Ground photos of the poppy fields were used in the provinces of in Kabul, Kapisa, Kunar, Laghman, Nangarhar Faryab, Baghlan, Badakhshan, Jawzjan and Sari-Pul provinces. These photographs were tagged by latitude and longitude and facilitated to locate the poppy areas on satellite images, and were very helpful in confirming the poppy areas in the satellite images. Poppy field boundaries were delineated by an on-screen digitization method.
5.2.2.1 BandcombinationforopiumpoppyidentificationTwo kinds of band combination were used to detect opium poppy. True-colour combination (blue, green, red) was used in areas where land use is dominated by opium (for example, Hilmand and Kandahar) and in cases where images were obtained during the flowering and lancing stages of opium poppy. False-colour combination (infra-red, red, green) was used in almost all cases. Analysts used both combinations simultaneously to optimize discrimination between opium poppy and other crops.
Some of the images could not be acquired at the appropriate time due to weather conditions and/or the time at which the satellite passed. The delayed acquisition of images makes it difficult to detect opium poppy, since fields may be at the senescence stage due to the lancing of capsules and can therefore be confused with fallow fields. In such cases, second-dated images are often useful in confirming opium poppy fields, since harvest patterns are different for wheat and opium poppy.
5.2.2.2 Advantageoftwo‐datedimagesIn provinces and areas were interpretation was challenging, second-date imagery was obtained. The second-dated images were useful to distinguish poppy from barley, wheat and grapes in certain provinces. The second-dated (post-harvest) images were useful in confirming whether the opium poppy on the first-dated images had been correctly identified. Image acquisition at two different times (pre- and post-harvest) has been proven to be essential in such cases.
5.2.2.3 QualitycontrolA quality control mechanism was applied to the image interpretation process, with each analyst’s work being checked by two other experts. Both first-dated and second-dated images were cross-checked.
All fields determined as likely to be under opium poppy cultivation (potential opium poppy fields) were delineated on the basis of the interpretation of first-dated satellite imagery. In some cases a second-dated image was acquired for the purpose of confirmation. The corrections involved a few commissions and omissions.
5.3 OpiumyieldandproductionThe representativeness of the yield measurements was increased by increasing the number of observations.
5.3.1 EstimatingopiumyieldThe relationship between poppy capsule volume per square metre and dry opium yield is used to estimate opium production.18 It takes the form of a non-rectangular hyperbola.
18 UNODC Guidelines for yield assessment of opium gum and coca leaf from brief field visits, UN New York, 2001, ST/NAR/33. See also UNODC (2003): Limited opium yield assessment surveys. Technical report: Observations and findings. Guidance for future activities. In: Scientific and Technical Notes, SCITEC/19, December 2003.

Afghanistan Opium Survey 2021 – Cultivation and Production
46
Non-rectangular hyperbola formula for opium yield as function of capsule volume:
Y = [(VC + 1495) – ((VC + 1495)2 – 395.259 VC)0.5] / 1.795
where
Y = Dry opium gum yield (kg/ha), and
VC = Mature capsule volume (cm3/m2).
In the yield survey, data on the number of yield capsules per plot and capsule volume are collected. The survey follows the procedure established in the UNODC Guidelines for Yield Assessment.
An imaginary transect was drawn on each surveyed field, along which three one-metre square plots were selected. In each plot, the number of flower buds, flowers, immature capsules and mature capsules that were expected to yield opium were counted, and the diameter and height of 10 to 15 opium-yielding capsules were measured with a calliper. The capsule volume per square metre was calculated with these data and entered into the formula for the yield calculation. Each plot thus provided one yield observation. The simple average of the three plots in a field is the field yield. The simple average of all fields in a geographical area is the average yield in the respective area. A range was calculated to express the uncertainty of the yield estimate due to sampling with the 95% confidence interval.
5.3.2 SizeoftheyieldsurveyanddataqualityThe surveyors carrying out the yield survey in the field have to spend long periods of time for capsule mesurements because of the stringent protocols that have to be followed. There are challenges of other nature like approachibility of the sample villages due to difficult terrain as well poor security in remote areas. These challenges have restricted the size of representative samples.
In 2021 a mixed approach was adopted to increase the representativeness of the samples collected. It was decided to first attempt the yield measurements in the sampled villages, however in case of failure to collect the samples an opportunity based approach would be adopted and the sampled villages will be replaced by non-randomly chosen villages.
To carry out a representative survey below step were followed:
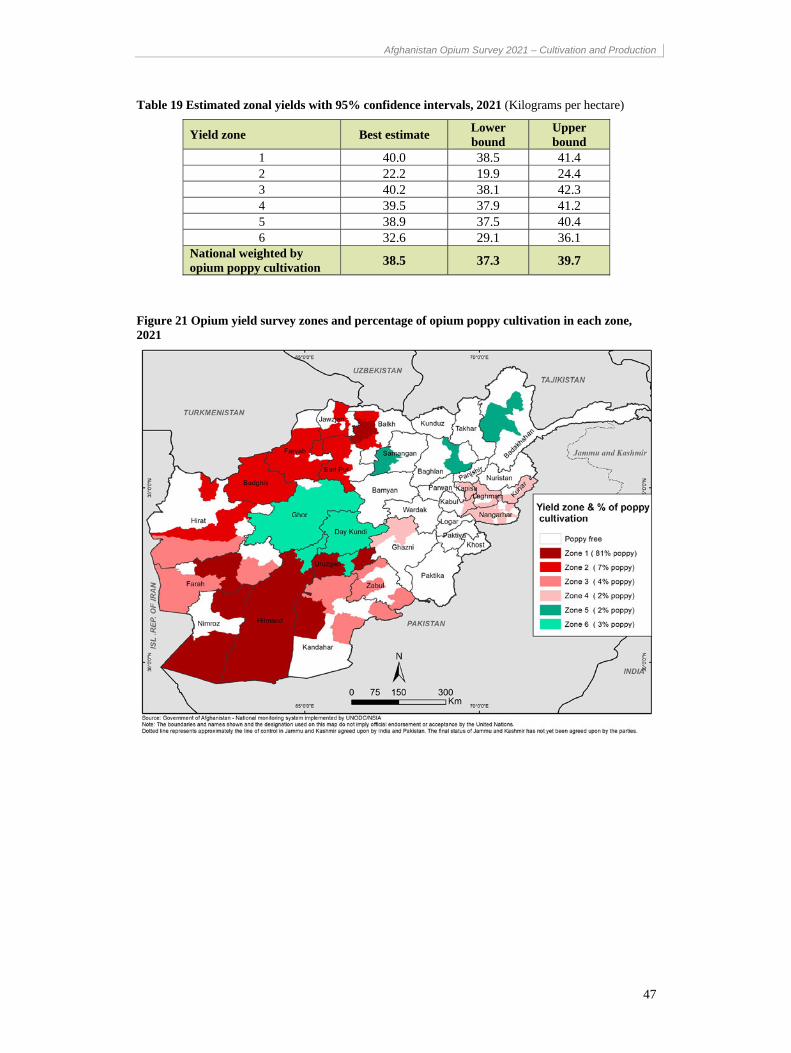
All poppy cultivated districts were categorised into six zones based on altitude, soil type, agriculture type and visual appearance of the crops using previous years high resolution satellite imagery.
The poppy cultivated villages were used as sample frame within the six zones. 192 villages were selected using random sample in six zones with equal distribution.
Due to security challenges only 30% of sampled villages could be surveyed, the remaining 70% of villages had to be replaced with non-representative samples. The comparision of number of samples by year in table 28 indicates substantial increase in number of samples in 2021 as compared to previous years.
Table 28 Yield survey villages and fields surveyed (all data), 2011-2021
Region 2016 2017 2018 2019 2020 2021
Number of Villages 76 79 73 73 NA 162 Number of fields (max 3 Per village) 209 222 191 216 NA 482
Number of plots (3 per field) 620 631 560 634 NA 1442
Number of capsules measured 5,388 5,682 4,706 5,689 NA 13,428
The estimated yield in 2021 is 37% more than in 2020 which was estimated by visually ranking using opium poppy fields according to the quality of crops on the field on satellite imagery.
Afghanistan Opium Survey 2021 – Cultivation and Production
47
Table 19 Estimated zonal yields with 95% confidence intervals, 2021 (Kilograms per hectare)
Yield zone Best estimate Lower bound
Upper bound
1 40.0 38.5 41.4 2 22.2 19.9 24.4 3 40.2 38.1 42.3 4 39.5 37.9 41.2 5 38.9 37.5 40.4 6 32.6 29.1 36.1
National weighted by opium poppy cultivation
38.5 37.3 39.7
Figure 21 Opium yield survey zones and percentage of opium poppy cultivation in each zone, 2021
Afghanistan Opium Survey 2021 – Cultivation and Production
48
5.4 Averagefarm‐gatepriceandfarm‐gatevalueofopiumproductionSince 2009, farm-gate prices at harvest time have been derived from the opium price monitoring system and refer to the month when opium harvesting took place in the different regions of the country, which is thought to reflect opium prices at harvest time better. To calculate the national average price, regional price averages were weighted by regional opium production. The opium price in the Central region was calculated from the annual village survey, as there is no monthly opium price monitoring in that region.
The farm-gate value of opium production is the product of potential opium production at the national level multiplied by the weighted average farm-gate price of dry opium at harvest time. The upper and lower limits of the range of the farm-gate value were determined by using the upper and lower opium production estimate.
Afghanistan Opium Survey 2021 – Cultivation and Production
49
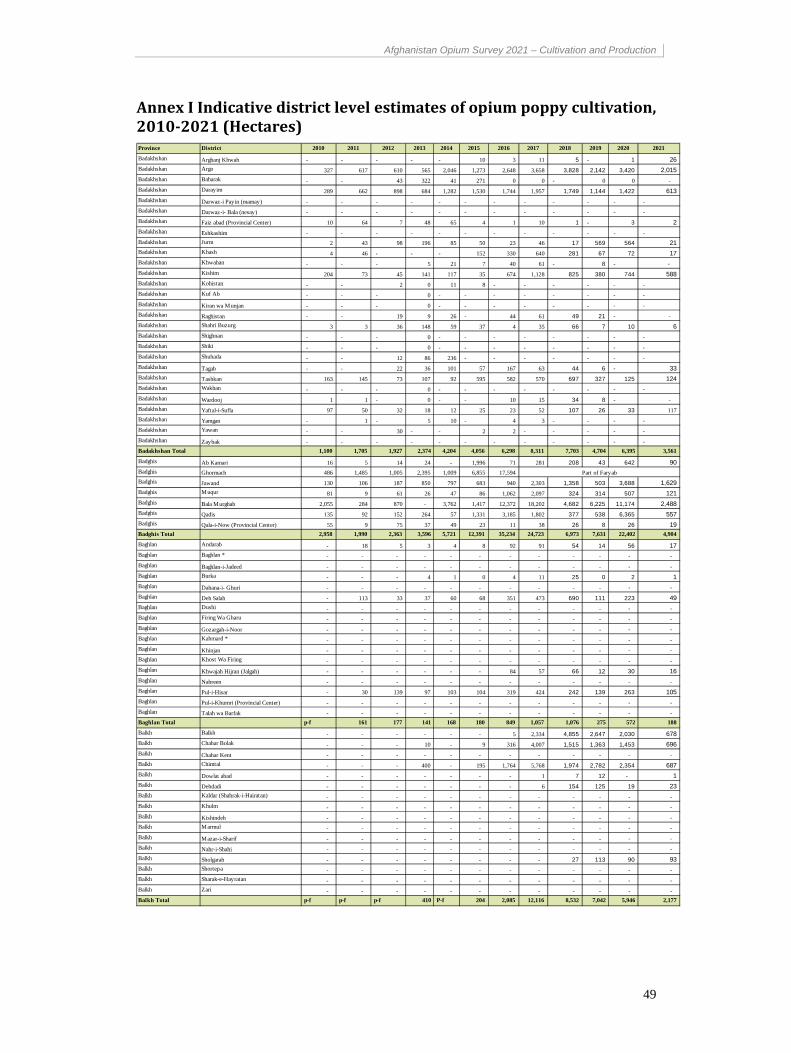
AnnexIIndicativedistrictlevelestimatesofopiumpoppycultivation,2010‐2021(Hectares)
Province District 2010 2011 2012 2013 2014 2015 2016 2017 2018 2019 2020 2021
Badakhshan Arghanj Khwah - - - - - 10 3 11 5 - 1 26 Badakhshan Argo 327 617 610 565 2,046 1,273 2,648 3,658 3,828 2,142 3,420 2,015 Badakhshan Baharak - - 43 322 41 271 0 0 - 0 0 -
Badakhshan Darayim 289 662 898 684 1,282 1,530 1,744 1,957 1,749 1,144 1,422 613 Badakhshan Darwaz-i Payin (mamay) - - - - - - - - - - - -
Badakhshan Darwaz-i- Bala (nesay) - - - - - - - - - - - -
Badakhshan Faiz abad (Provincial Center) 10 64 7 48 65 4 1 10 1 - 3 2 Badakhshan Eshkashim - - - - - - - - - - - -
Badakhshan Jurm 2 43 98 196 85 50 23 46 17 569 564 21 Badakhshan Khash 4 46 - - - 152 330 640 281 67 72 17 Badakhshan Khwahan - - - 5 21 7 40 61 - 8 - - Badakhshan Kishim 204 73 45 141 117 35 674 1,128 825 380 744 588 Badakhshan Kohistan - - 2 0 11 8 - - - - - -
Badakhshan Kuf Ab - - - 0 - - - - - - - -
Badakhshan Kiran wa Munjan - - - 0 - - - - - - - -
Badakhshan Raghistan - - 19 9 26 - 44 61 49 21 - -
Badakhshan Shahri Buzurg 3 3 36 148 59 37 4 35 66 7 10 6 Badakhshan Shighnan - - - 0 - - - - - - - -
Badakhshan Shiki - - - 0 - - - - - - - -
Badakhshan Shuhada - - 12 86 236 - - - - - - -
Badakhshan Tagab - - 22 36 101 57 167 63 44 6 - 33 Badakhshan Tashkan 163 145 73 107 92 595 582 570 697 327 125 124 Badakhshan Wakhan - - - 0 - - - - - - - -
Badakhshan Wardooj 1 1 - 0 - - 10 15 34 8 - -
Badakhshan Yaftal-i-Sufla 97 50 32 18 12 25 23 52 107 26 33 117
Badakhshan Yamgan - 1 - 5 10 - 4 3 - - - -
Badakhshan Yawan - - 30 - - 2 2 - - - - -
Badakhshan Zaybak - - - - - - - - - - - -
Badakhshan Total 1,100 1,705 1,927 2,374 4,204 4,056 6,298 8,311 7,703 4,704 6,395 3,561
Badghis Ab Kamari 16 5 14 24 - 1,996 71 281 208 43 642 90 Badghis Ghormach 486 1,485 1,005 2,395 1,009 6,855 17,594
Badghis Jawand 130 106 187 850 797 683 940 2,303 1,358 503 3,688 1,629 Badghis Muqur 81 9 61 26 47 86 1,062 2,097 324 314 507 121 Badghis Bala Murghab 2,055 284 870 - 3,762 1,417 12,372 18,202 4,682 6,225 11,174 2,488 Badghis Qadis 135 92 152 264 57 1,331 3,185 1,802 377 538 6,365 557 Badghis Qala-i-Now (Provincial Center) 55 9 75 37 49 23 11 38 26 8 26 19
Badghis Total 2,958 1,990 2,363 3,596 5,721 12,391 35,234 24,723 6,973 7,631 22,402 4,904
Baghlan Andarab - 18 5 3 4 8 92 91 54 14 56 17 Baghlan Baghlan * - - - - - - - - - - - -
Baghlan Baghlan-i-Jadeed - - - - - - - - - - - -
Baghlan Burka - - - 4 1 0 4 11 25 0 2 1 Baghlan Dahana-i- Ghuri - - - - - - - - - - - -
Baghlan Deh Salah - 113 33 37 60 68 351 473 690 111 223 49 Baghlan Dushi - - - - - - - - - - - -
Baghlan Firing Wa Gharu - - - - - - - - - - - -
Baghlan Gozargah-i-Noor - - - - - - - - - - - -
Baghlan Kahmard * - - - - - - - - - - - -
Baghlan Khinjan - - - - - - - - - - - -
Baghlan Khost Wa Firing - - - - - - - - - - - -
Baghlan Khwajah Hijran (Jalgah) - - - - - - 84 57 66 12 30 16 Baghlan Nahreen - - - - - - - - - - - -
Baghlan Pul-i-Hisar - 30 139 97 103 104 319 424 242 139 263 105 Baghlan Pul-i-Khumri (Provincial Center) - - - - - - - - - - - -
Baghlan Talah wa Barfak - - - - - - - - - - - -
Baghlan Total p-f 161 177 141 168 180 849 1,057 1,076 275 572 188
Balkh Balkh - - - - - - 5 2,334 4,855 2,647 2,030 678 Balkh Chahar Bolak - - - 10 - 9 316 4,007 1,515 1,363 1,453 696 Balkh Chahar Kent - - - - - - - - - - - -
Balkh Chimtal - - - 400 - 195 1,764 5,768 1,974 2,782 2,354 687 Balkh Dowlat abad - - - - - - - 1 7 12 - 1 Balkh Dehdadi - - - - - - - 6 154 125 19 23 Balkh Kaldar (Shahrak-i-Hairatan) - - - - - - - - - - - -
Balkh Khulm - - - - - - - - - - - -
Balkh Kishindeh - - - - - - - - - - - -
Balkh Marmul - - - - - - - - - - - -
Balkh Mazar-i-Sharif - - - - - - - - - - - -
Balkh Nahr-i-Shahi - - - - - - - - - - - -
Balkh Sholgarah - - - - - - - - 27 113 90 93 Balkh Shortepa - - - - - - - - - - - -
Balkh Sharak-e-Hayratan - - - - - - - - - - - -
Balkh Zari - - - - - - - - - - - -
Balkh Total p-f p-f p-f 410 P-f 204 2,085 12,116 8,532 7,042 5,946 2,177
Part of Faryab
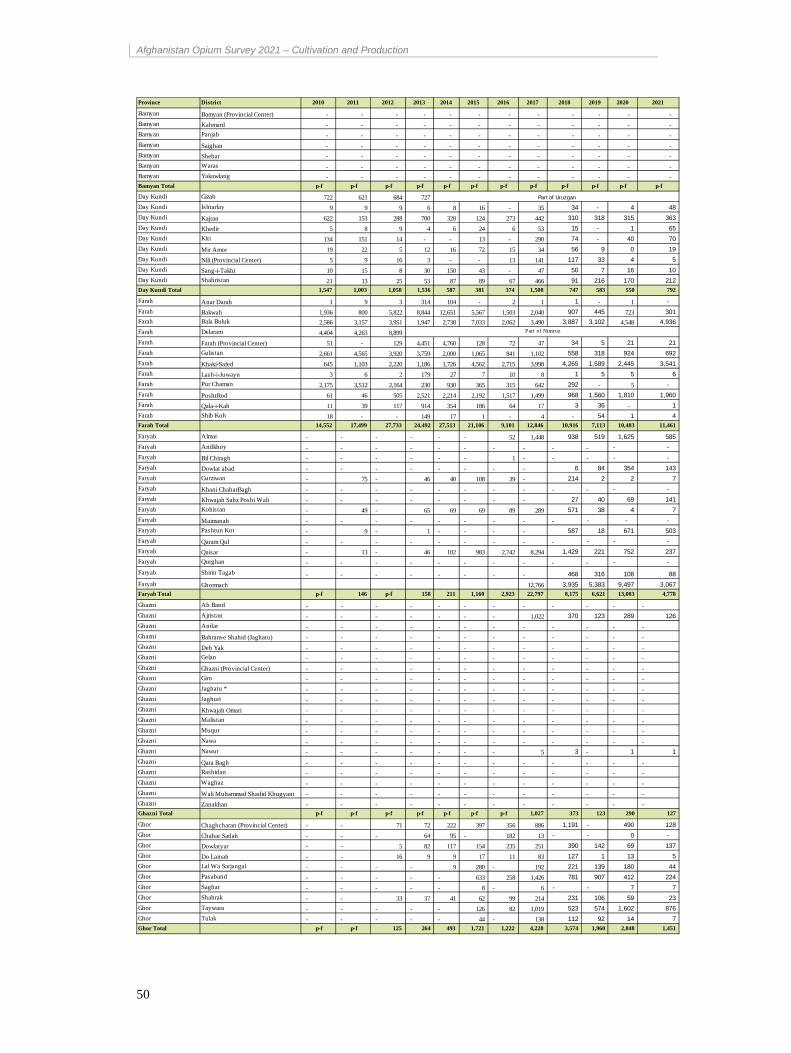
Afghanistan Opium Survey 2021 – Cultivation and Production
50
Province District 2010 2011 2012 2013 2014 2015 2016 2017 2018 2019 2020 2021
Bamyan Bamyan (Provincial Center) - - - - - - - - - - - -
Bamyan Kahmard - - - - - - - - - - - -
Bamyan Panjab - - - - - - - - - - - -
Bamyan Saighan - - - - - - - - - - - -
Bamyan Shebar - - - - - - - - - - - -
Bamyan Waras - - - - - - - - - - - -
Bamyan Yakawlang - - - - - - - - - - - - Bamyan Total p-f p-f p-f p-f p-f p-f p-f p-f p-f p-f p-f p-f
Day Kundi Gizab 722 621 684 727
Day Kundi Ishtarlay 9 9 9 6 8 16 - 35 34 - 4 48
Day Kundi Kajran 622 153 288 700 320 124 273 442 310 318 315 363
Day Kundi Khedir 5 8 9 4 6 24 6 53 15 - 1 65
Day Kundi Kiti 134 151 14 - - 13 - 290 74 - 40 70
Day Kundi Mir Amor 19 22 5 12 16 72 15 34 56 9 0 19
Day Kundi Nili (Provincial Center) 5 9 16 3 - - 13 141 117 33 4 5
Day Kundi Sang-i-Takht 10 15 8 30 150 43 - 47 50 7 16 10
Day Kundi Shahristan 21 13 25 53 87 89 67 466 91 216 170 212
Day Kundi Total 1,547 1,003 1,058 1,536 587 381 374 1,508 747 583 550 792
Farah Anar Darah 1 9 3 314 104 - 2 1 1 - 1 -
Farah Bakwah 1,936 800 5,822 8,844 12,651 5,567 1,503 2,040 907 445 723 301
Farah Bala Buluk 2,586 3,157 3,951 1,947 2,730 7,033 2,062 3,490 3,887 3,102 4,548 4,936
Farah Delaram 4,404 4,263 8,899
Farah Farah (Provincial Center) 51 - 129 4,451 4,760 128 72 47 34 5 21 21
Farah Gulistan 2,661 4,565 3,920 3,759 2,000 1,065 841 1,102 558 318 924 692
Farah Khaki-Safed 645 1,103 2,220 1,186 1,726 4,562 2,715 3,998 4,265 1,589 2,445 3,541
Farah Lash-i-Juwayn 3 6 2 179 27 7 10 8 1 5 5 6
Farah Pur Chaman 2,175 3,512 2,164 230 930 365 315 642 292 - 5 -
Farah PushtRod 61 46 505 2,521 2,214 2,192 1,517 1,499 968 1,560 1,810 1,960
Farah Qala-i-Kah 11 39 117 914 354 186 64 17 3 36 - 1
Farah Shib Koh 18 - - 149 17 1 - 4 - 54 1 4
Farah Total 14,552 17,499 27,733 24,492 27,513 21,106 9,101 12,846 10,916 7,113 10,483 11,461
Faryab Almar - - - - - - 52 1,448 938 519 1,625 585
Faryab Andkhoy - - - - - - - - - - - -
Faryab Bil Chiragh - - - - - - 1 - - - - -
Faryab Dowlat abad - - - - - - - - 6 84 354 143
Faryab Gurziwan - 75 - 46 40 108 39 - 214 2 2 7
Faryab Khani ChaharBagh - - - - - - - - - - - -
Faryab Khwajah Sabz Poshi Wali - - - - - - - - 27 40 69 141
Faryab Kohistan - 49 - 65 69 69 89 289 571 38 4 7
Faryab Maimanah - - - - - - - - - - - -
Faryab Pashtun Kot - 9 - 1 - - - - 587 18 671 503
Faryab Qaram Qul - - - - - - - - - - - -
Faryab Qaisar - 13 - 46 102 983 2,742 8,294 1,429 221 752 237
Faryab Qurghan - - - - - - - - - - - -
Faryab Shirin Tagab - - - - - - - - 468 316 108 88
Faryab Ghormach 12,766 3,935 5,383 9,497 3,067
Faryab Total p-f 146 p-f 158 211 1,160 2,923 22,797 8,175 6,621 13,083 4,778
Ghazni Ab Band - - - - - - - - - - - -
Ghazni Ajristan - - - - - - - 1,022 370 123 289 126
Ghazni Andar - - - - - - - - - - - -
Ghazni Bahram-e Shahid (Jaghatu) - - - - - - - - - - - -
Ghazni Deh Yak - - - - - - - - - - - -
Ghazni Gelan - - - - - - - - - - - -
Ghazni Ghazni (Provincial Center) - - - - - - - - - - - -
Ghazni Giro - - - - - - - - - - - -
Ghazni Jaghatu * - - - - - - - - - - - -
Ghazni Jaghuri - - - - - - - - - - - -
Ghazni Khwajah Omari - - - - - - - - - - - -
Ghazni Malistan - - - - - - - - - - - -
Ghazni Muqur - - - - - - - - - - - -
Ghazni Nawa - - - - - - - - - - - -
Ghazni Nawur - - - - - - - 5 3 - 1 1
Ghazni Qara Bagh - - - - - - - - - - - -
Ghazni Rashidan - - - - - - - - - - - -
Ghazni Waghaz - - - - - - - - - - - -
Ghazni Wali Muhammad Shadid Khugyani - - - - - - - - - - - -
Ghazni Zanakhan - - - - - - - - - - - - Ghazni Total p-f p-f p-f p-f p-f p-f p-f 1,027 373 123 290 127
Ghor Chaghcharan (Provincial Center) - - 71 72 222 397 356 886 1,191 - 490 128
Ghor Chahar Sadah - - - 64 95 - 182 13 - - 0 -
Ghor Dowlatyar - - 5 82 117 154 235 251 390 142 69 137
Ghor Do Lainah - - 16 9 9 17 11 83 127 1 13 5
Ghor Lal Wa Sarjangal - - - - 9 280 - 192 221 139 180 44
Ghor Pasaband - - - - - 633 258 1,426 781 907 412 224
Ghor Saghar - - - - - 8 - 6 - - 7 7
Ghor Shahrak - - 33 37 41 62 99 214 231 106 59 23
Ghor Taywara - - - - - 126 82 1,019 523 574 1,602 876
Ghor Tulak - - - - - 44 - 138 112 92 14 7
Ghor Total p-f p-f 125 264 493 1,721 1,222 4,228 3,574 1,960 2,848 1,451
Part of Uruzgan
Part of Nimroz
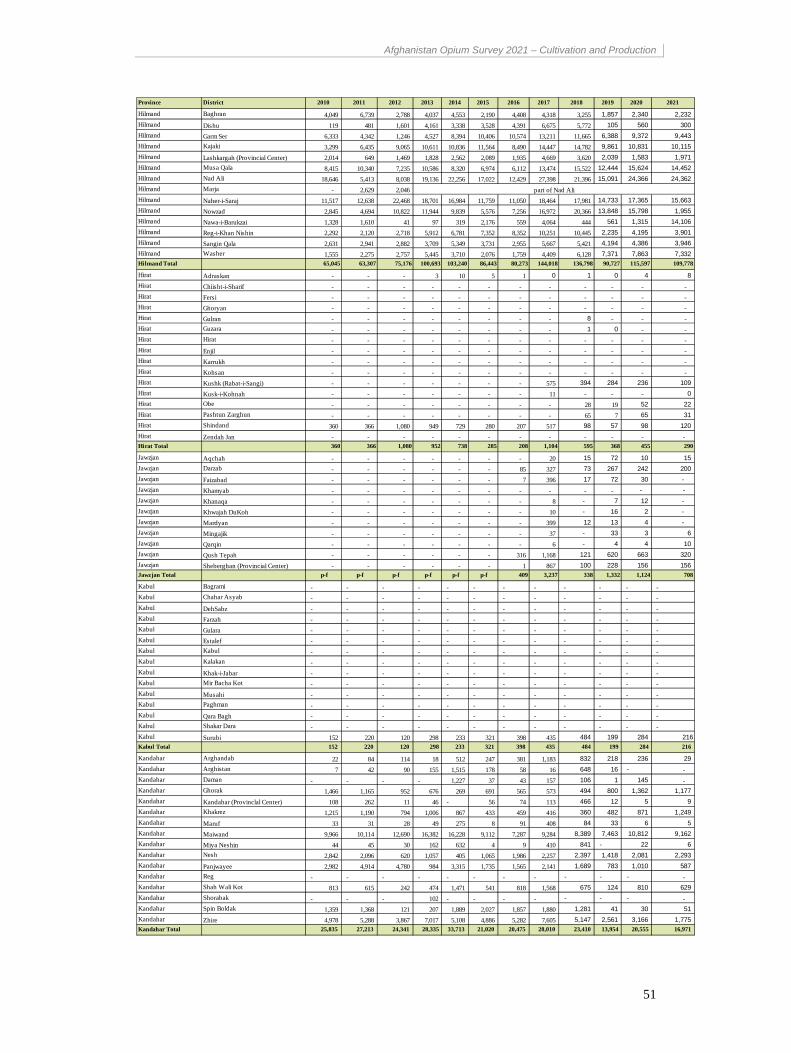
Afghanistan Opium Survey 2021 – Cultivation and Production
51
Province District 2010 2011 2012 2013 2014 2015 2016 2017 2018 2019 2020 2021
Hilmand Baghran 4,049 6,739 2,788 4,037 4,553 2,190 4,408 4,318 3,255 1,857 2,340 2,232
Hilmand Dishu 119 481 1,601 4,161 3,338 3,528 4,391 6,675 5,772 105 560 300
Hilmand Garm Ser 6,333 4,342 1,246 4,527 8,394 10,406 10,574 13,211 11,665 6,388 9,372 9,443
Hilmand Kajaki 3,299 6,435 9,065 10,611 10,836 11,564 8,490 14,447 14,782 9,861 10,831 10,115
Hilmand Lashkargah (Provincial Center) 2,014 649 1,469 1,828 2,562 2,089 1,935 4,669 3,620 2,039 1,583 1,971
Hilmand Musa Qala 8,415 10,340 7,235 10,586 8,320 6,974 6,112 13,474 15,522 12,444 15,624 14,452
Hilmand Nad Ali 18,646 5,413 8,038 19,136 22,256 17,022 12,429 27,398 21,396 15,091 24,366 24,362
Hilmand Marja - 2,629 2,046
Hilmand Naher-i-Saraj 11,517 12,638 22,468 18,701 16,984 11,759 11,050 18,464 17,981 14,733 17,365 15,663
Hilmand Nowzad 2,845 4,694 10,822 11,944 9,839 5,576 7,256 16,972 20,366 13,848 15,798 1,955
Hilmand Nawa-i-Barukzai 1,328 1,610 41 97 319 2,176 559 4,064 444 561 1,315 14,106
Hilmand Reg-i-Khan Nishin 2,292 2,120 2,718 5,912 6,781 7,352 8,352 10,251 10,445 2,235 4,195 3,901
Hilmand Sangin Qala 2,631 2,941 2,882 3,709 5,349 3,731 2,955 5,667 5,421 4,194 4,386 3,946
Hilmand Washer 1,555 2,275 2,757 5,445 3,710 2,076 1,759 4,409 6,128 7,371 7,863 7,332
Hilmand Total 65,045 63,307 75,176 100,693 103,240 86,443 80,273 144,018 136,798 90,727 115,597 109,778
Hirat Adraskan - - - 3 10 5 1 0 1 0 4 8
Hirat Chiisht-i-Sharif - - - - - - - - - - - -
Hirat Fersi - - - - - - - - - - - -
Hirat Ghoryan - - - - - - - - - - - -
Hirat Gulran - - - - - - - - 8 - - -
Hirat Guzara - - - - - - - - 1 0 - -
Hirat Hirat - - - - - - - - - - - -
Hirat Enjil - - - - - - - - - - - -
Hirat Karrukh - - - - - - - - - - - -
Hirat Kohsan - - - - - - - - - - - -
Hirat Kushk (Rabat-i-Sangi) - - - - - - - 575 394 284 236 109
Hirat Kusk-i-Kohnah - - - - - - - 11 - - - 0
Hirat Obe - - - - - - - - 28 19 52 22
Hirat Pashtun Zarghun - - - - - - - - 65 7 65 31
Hirat Shindand 360 366 1,080 949 729 280 207 517 98 57 98 120
Hirat Zendah Jan - - - - - - - - - - - - Hirat Total 360 366 1,080 952 738 285 208 1,104 595 368 455 290
Jawzjan Aqchah - - - - - - - 20 15 72 10 15
Jawzjan Darzab - - - - - - 85 327 73 267 242 200
Jawzjan Faizabad - - - - - - 7 396 17 72 30 -
Jawzjan Khamyab - - - - - - - - - - - -
Jawzjan Khanaqa - - - - - - - 8 - 7 12 -
Jawzjan Khwajah DuKoh - - - - - - - 10 - 16 2 -
Jawzjan Mardyan - - - - - - - 399 12 13 4 -
Jawzjan Mingajik - - - - - - - 37 - 33 3 6
Jawzjan Qarqin - - - - - - - 6 - 4 4 10
Jawzjan Qush Tepah - - - - - - 316 1,168 121 620 663 320
Jawzjan Sheberghan (Provincial Center) - - - - - - 1 867 100 228 156 156
Jawzjan Total p-f p-f p-f p-f p-f p-f 409 3,237 338 1,332 1,124 708
Kabul Bagrami - - - - - - - - - - - -
Kabul Chahar Asyab - - - - - - - - - - - -
Kabul DehSabz - - - - - - - - - - - -
Kabul Farzah - - - - - - - - - - - -
Kabul Gulara - - - - - - - - - - - -
Kabul Estalef - - - - - - - - - - - -
Kabul Kabul - - - - - - - - - - - -
Kabul Kalakan - - - - - - - - - - - -
Kabul Khak-i-Jabar - - - - - - - - - - - -
Kabul Mir Bacha Kot - - - - - - - - - - - -
Kabul Musahi - - - - - - - - - - - -
Kabul Paghman - - - - - - - - - - - -
Kabul Qara Bagh - - - - - - - - - - - -
Kabul Shakar Dara - - - - - - - - - - - -
Kabul Surubi 152 220 120 298 233 321 398 435 484 199 284 216
Kabul Total 152 220 120 298 233 321 398 435 484 199 284 216
Kandahar Arghandab 22 84 114 18 512 247 381 1,183 832 218 236 29
Kandahar Arghistan 7 42 90 155 1,515 178 58 16 648 16 - -
Kandahar Daman - - - - 1,227 37 43 157 106 1 145 -
Kandahar Ghorak 1,466 1,165 952 676 269 691 565 573 494 800 1,362 1,177
Kandahar Kandahar (Provinclal Center) 108 262 11 46 - 56 74 113 466 12 5 9
Kandahar Khakrez 1,215 1,190 794 1,006 867 433 459 416 360 482 871 1,249
Kandahar Maruf 33 31 28 49 275 8 91 408 84 33 6 5
Kandahar Maiwand 9,966 10,114 12,690 16,382 16,228 9,112 7,287 9,284 8,389 7,463 10,812 9,162
Kandahar Miya Neshin 44 45 30 162 632 4 9 410 841 - 22 6
Kandahar Nesh 2,842 2,096 620 1,057 405 1,065 1,986 2,257 2,397 1,418 2,081 2,293
Kandahar Panjwayee 2,982 4,914 4,780 984 3,315 1,735 1,565 2,141 1,689 783 1,010 587
Kandahar Reg - - - - - - - - - - - -
Kandahar Shah Wali Kot 813 615 242 474 1,471 541 818 1,568 675 124 810 629
Kandahar Shorabak - - - 102 - - - - - - - -
Kandahar Spin Boldak 1,359 1,368 121 207 1,889 2,027 1,857 1,880 1,281 41 30 51
Kandahar Zhire 4,978 5,288 3,867 7,017 5,108 4,886 5,282 7,605 5,147 2,561 3,166 1,775
Kandahar Total 25,835 27,213 24,341 28,335 33,713 21,020 20,475 28,010 23,410 13,954 20,555 16,971
part of Nad Ali
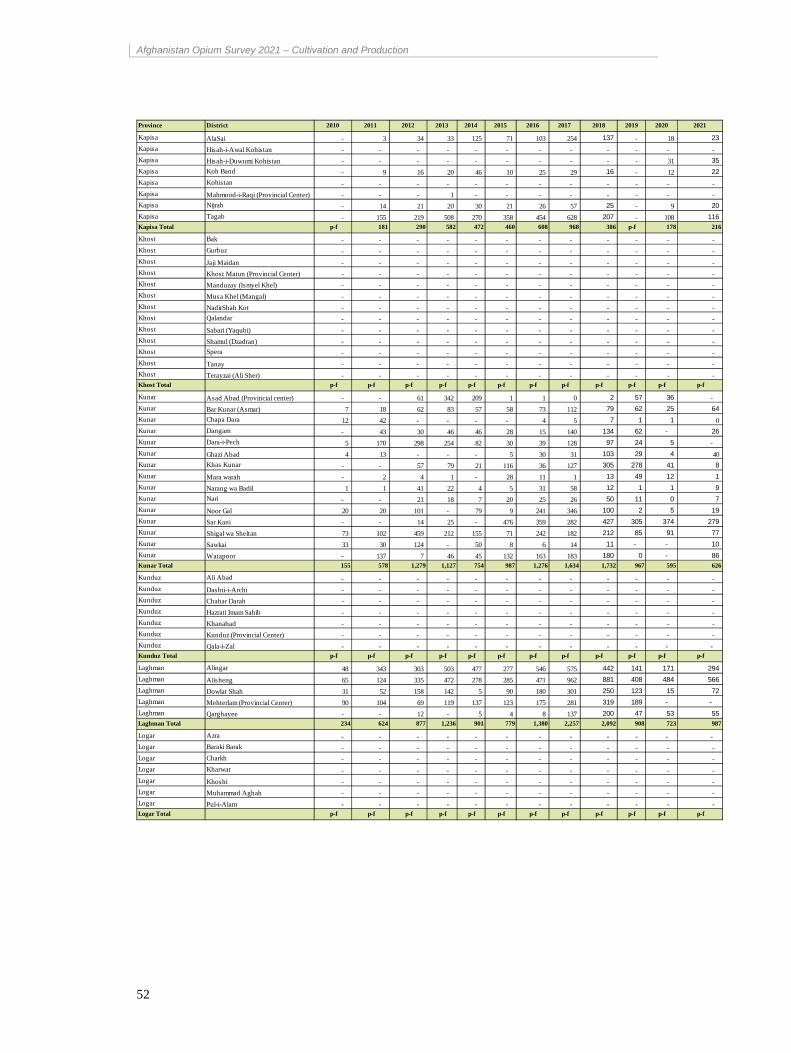
Afghanistan Opium Survey 2021 – Cultivation and Production
52
Province District 2010 2011 2012 2013 2014 2015 2016 2017 2018 2019 2020 2021
Kapisa AlaSai - 3 34 33 125 71 103 254 137 - 18 23
Kapisa Hisah-i-Awal Kohistan - - - - - - - - - - - -
Kapisa Hisah-i-Duwumi Kohistan - - - - - - - - - - 31 35
Kapisa Koh Band - 9 16 20 46 10 25 29 16 - 12 22
Kapisa Kohistan - - - - - - - - - - - -
Kapisa Mahmood-i-Raqi (Provincial Center) - - - 1 - - - - - - - -
Kapisa Nijrab - 14 21 20 30 21 26 57 25 - 9 20
Kapisa Tagab - 155 219 508 270 358 454 628 207 - 108 116
Kapisa Total p-f 181 290 582 472 460 608 968 386 p-f 178 216
Khost Bak - - - - - - - - - - - -
Khost Gurbuz - - - - - - - - - - - -
Khost Jaji Maidan - - - - - - - - - - - -
Khost Khost Matun (Provincial Center) - - - - - - - - - - - -
Khost Manduzay (Ismyel Khel) - - - - - - - - - - - -
Khost Musa Khel (Mangal) - - - - - - - - - - - -
Khost NadirShah Kot - - - - - - - - - - - -
Khost Qalandar - - - - - - - - - - - -
Khost Sabari (Yaqubi) - - - - - - - - - - - -
Khost Shamul (Dzadran) - - - - - - - - - - - -
Khost Spera - - - - - - - - - - - -
Khost Tanay - - - - - - - - - - - -
Khost Terayzai (Ali Sher) - - - - - - - - - - - - Khost Total p-f p-f p-f p-f p-f p-f p-f p-f p-f p-f p-f p-f
Kunar Asad Abad (Provincial center) - - 61 342 209 1 1 0 2 57 36 -
Kunar Bar Kunar (Asmar) 7 18 62 83 57 58 73 112 79 62 25 64
Kunar Chapa Dara 12 42 - - - - 4 5 7 1 1 0
Kunar Dangam - 43 30 46 46 28 15 140 134 62 - 26
Kunar Dara-i-Pech 5 170 298 254 82 30 39 128 97 24 5 -
Kunar Ghazi Abad 4 13 - - - 5 30 31 103 29 4 40
Kunar Khas Kunar - - 57 79 21 116 36 127 305 278 41 8
Kunar Mara warah - 2 4 1 - 28 11 1 13 49 12 1
Kunar Narang wa Badil 1 1 41 22 4 5 31 58 12 1 1 9
Kunar Nari - - 21 18 7 20 25 26 50 11 0 7
Kunar Noor Gal 20 20 101 - 79 9 241 346 100 2 5 19
Kunar Sar Kani - - 14 25 - 476 359 282 427 305 374 279
Kunar Shigal wa Sheltan 73 102 459 212 155 71 242 182 212 85 91 77
Kunar Sawkai 33 30 124 - 50 8 6 14 11 - - 10
Kunar Watapoor - 137 7 46 45 132 163 183 180 0 - 86
Kunar Total 155 578 1,279 1,127 754 987 1,276 1,634 1,732 967 595 626
Kunduz Ali Abad - - - - - - - - - - - -
Kunduz Dashti-i-Archi - - - - - - - - - - - -
Kunduz Chahar Darah - - - - - - - - - - - -
Kunduz Hazrati Imam Sahib - - - - - - - - - - - -
Kunduz Khanabad - - - - - - - - - - - -
Kunduz Kunduz (Provincial Center) - - - - - - - - - - - -
Kunduz Qala-i-Zal - - - - - - - - - - - - Kunduz Total p-f p-f p-f p-f p-f p-f p-f p-f p-f p-f p-f p-f
Laghman Alingar 48 343 303 503 477 277 546 575 442 141 171 294
Laghman Alisheng 65 124 335 472 278 285 471 962 881 408 484 566
Laghman Dowlat Shah 31 52 158 142 5 90 180 301 250 123 15 72
Laghman Mehterlam (Provincial Center) 90 104 69 119 137 123 175 281 319 189 - -
Laghman Qarghayee - - 12 - 5 4 8 137 200 47 53 55
Laghman Total 234 624 877 1,236 901 779 1,380 2,257 2,092 908 723 987
Logar Azra - - - - - - - - - - - -
Logar Baraki Barak - - - - - - - - - - - -
Logar Charkh - - - - - - - - - - - -
Logar Kharwar - - - - - - - - - - - -
Logar Khoshi - - - - - - - - - - - -
Logar Muhammad Aghah - - - - - - - - - - - -
Logar Pul-i-Alam - - - - - - - - - - - - Logar Total p-f p-f p-f p-f p-f p-f p-f p-f p-f p-f p-f p-f
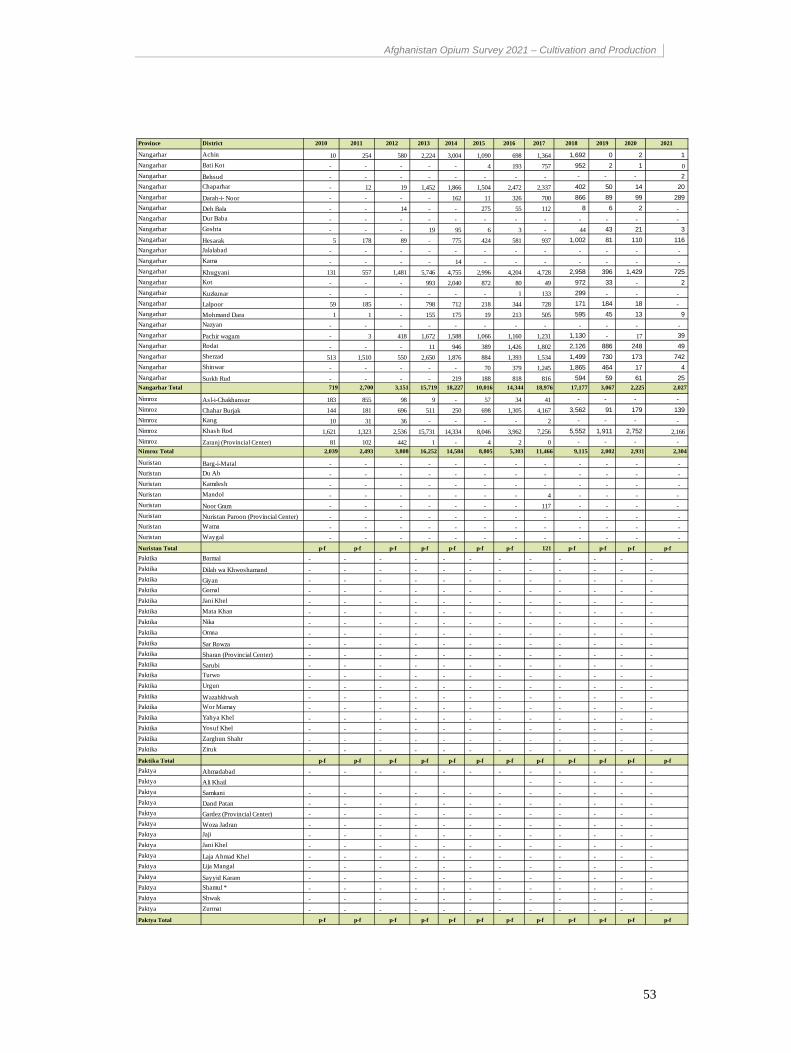
Afghanistan Opium Survey 2021 – Cultivation and Production
53
Province District 2010 2011 2012 2013 2014 2015 2016 2017 2018 2019 2020 2021
Nangarhar Achin 10 254 580 2,224 3,004 1,090 698 1,364 1,692 0 2 1
Nangarhar Bati Kot - - - - - 4 193 757 952 2 1 0
Nangarhar Behsud - - - - - - - - - - - 2
Nangarhar Chaparhar - 12 19 1,452 1,866 1,504 2,472 2,337 402 50 14 20
Nangarhar Darah-i- Noor - - - - 162 11 326 700 866 89 99 289
Nangarhar Deh Bala - - 14 - - 275 55 112 8 6 2 -
Nangarhar Dur Baba - - - - - - - - - - - -
Nangarhar Goshta - - - 19 95 6 3 - 44 43 21 3
Nangarhar Hesarak 5 178 89 - 775 424 581 937 1,002 81 110 116
Nangarhar Jalalabad - - - - - - - - - - - -
Nangarhar Kama - - - - 14 - - - - - - -
Nangarhar Khugyani 131 557 1,481 5,746 4,755 2,996 4,204 4,728 2,958 396 1,429 725
Nangarhar Kot - - - 993 2,040 872 80 49 972 33 - 2
Nangarhar Kuzkunar - - - - - - 1 133 299 - - -
Nangarhar Lalpoor 59 185 - 798 712 218 344 728 171 184 18 -
Nangarhar Mohmand Dara 1 1 - 155 175 19 213 505 595 45 13 9
Nangarhar Nazyan - - - - - - - - - - - -
Nangarhar Pachir wagam - 3 418 1,672 1,588 1,066 1,160 1,231 1,130 - 17 39
Nangarhar Rodat - - - 11 946 389 1,426 1,802 2,126 886 248 49
Nangarhar Sherzad 513 1,510 550 2,650 1,876 884 1,393 1,534 1,499 730 173 742
Nangarhar Shinwar - - - - - 70 379 1,245 1,865 464 17 4
Nangarhar Surkh Rud - - - - 219 188 818 816 594 59 61 25
Nangarhar Total 719 2,700 3,151 15,719 18,227 10,016 14,344 18,976 17,177 3,067 2,225 2,027
Nimroz Asl-i-Chakhansur 183 855 98 9 - 57 34 41 - - - -
Nimroz Chahar Burjak 144 181 696 511 250 698 1,305 4,167 3,562 91 179 139
Nimroz Kang 10 31 36 - - - - 2 - - - -
Nimroz Khash Rod 1,621 1,323 2,536 15,731 14,334 8,046 3,962 7,256 5,552 1,911 2,752 2,166
Nimroz Zaranj (Provincial Center) 81 102 442 1 - 4 2 0 - - - -
Nimroz Total 2,039 2,493 3,808 16,252 14,584 8,805 5,303 11,466 9,115 2,002 2,931 2,304
Nuristan Barg-i-Matal - - - - - - - - - - - -
Nuristan Du Ab - - - - - - - - - - - -
Nuristan Kamdesh - - - - - - - - - - - -
Nuristan Mandol - - - - - - - 4 - - - -
Nuristan Noor Gram - - - - - - - 117 - - - -
Nuristan Nuristan Paroon (Provincial Center) - - - - - - - - - - - -
Nuristan Wama - - - - - - - - - - - -
Nuristan Waygal - - - - - - - - - - - -
Nuristan Total p-f p-f p-f p-f p-f p-f p-f 121 p-f p-f p-f p-f
Paktika Barmal - - - - - - - - - - - -
Paktika Dilah wa Khwoshamand - - - - - - - - - - - -
Paktika Giyan - - - - - - - - - - - -
Paktika Gomal - - - - - - - - - - - -
Paktika Jani Khel - - - - - - - - - - - -
Paktika Mata Khan - - - - - - - - - - - -
Paktika Nika - - - - - - - - - - - -
Paktika Omna - - - - - - - - - - - -
Paktika Sar Rowza - - - - - - - - - - - -
Paktika Sharan (Provincial Center) - - - - - - - - - - - -
Paktika Sarubi - - - - - - - - - - - -
Paktika Turwo - - - - - - - - - - - -
Paktika Urgun - - - - - - - - - - - -
Paktika Wazahkhwah - - - - - - - - - - - -
Paktika Wor Mamay - - - - - - - - - - - -
Paktika Yahya Khel - - - - - - - - - - - -
Paktika Yosuf Khel - - - - - - - - - - - -
Paktika Zarghun Shahr - - - - - - - - - - - -
Paktika Ziruk - - - - - - - - - - - -
Paktika Total p-f p-f p-f p-f p-f p-f p-f p-f p-f p-f p-f p-f
Paktya Ahmadabad - - - - - - - - - - - -
Paktya Ali Khail - - - - -
Paktya Samkani - - - - - - - - - - - -
Paktya Dand Patan - - - - - - - - - - - -
Paktya Gardez (Provincial Center) - - - - - - - - - - - -
Paktya Woza Jadran - - - - - - - - - - - -
Paktya Jaji - - - - - - - - - - - -
Paktya Jani Khel - - - - - - - - - - - -
Paktya Laja Ahmad Khel - - - - - - - - - - - -
Paktya Lija Mangal - - - - - - - - - - - -
Paktya Sayyid Karam - - - - - - - - - - - -
Paktya Shamul * - - - - - - - - - - - -
Paktya Shwak - - - - - - - - - - - -
Paktya Zurmat - - - - - - - - - - - -
Paktya Total p-f p-f p-f p-f p-f p-f p-f p-f p-f p-f p-f p-f
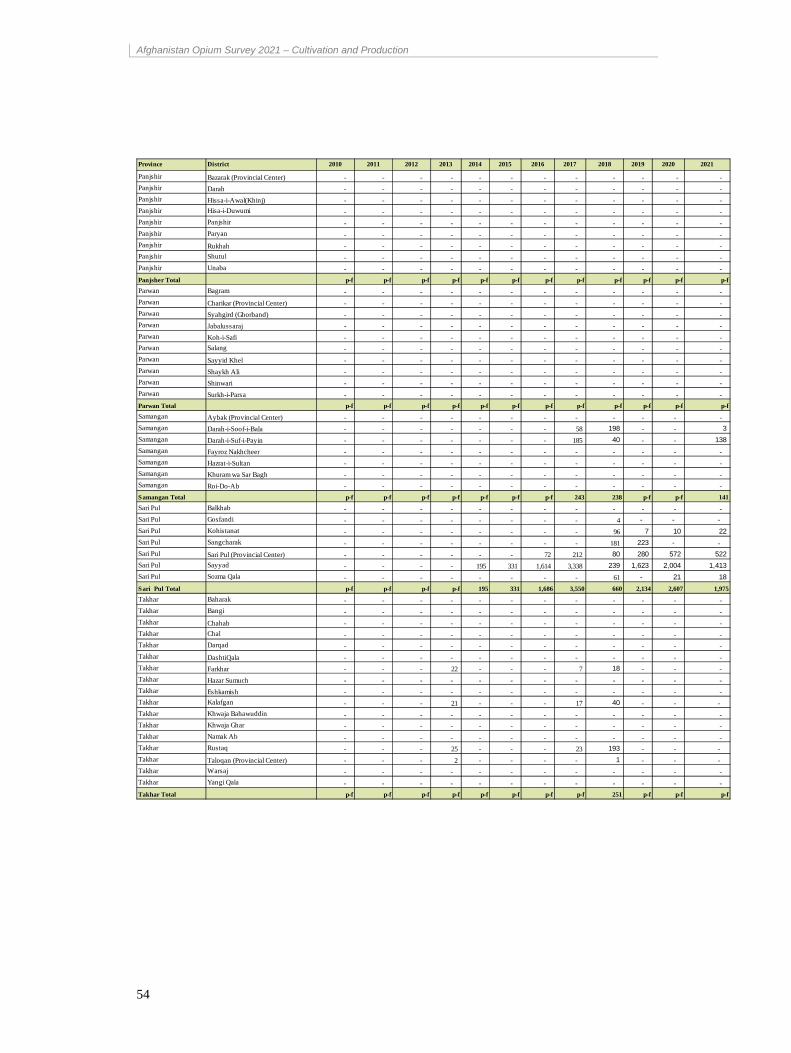
Afghanistan Opium Survey 2021 – Cultivation and Production
54
Province District 2010 2011 2012 2013 2014 2015 2016 2017 2018 2019 2020 2021
Panjshir Bazarak (Provincial Center) - - - - - - - - - - - -
Panjshir Darah - - - - - - - - - - - -
Panjshir Hissa-i-Awal(Khinj) - - - - - - - - - - - -
Panjshir Hisa-i-Duwumi - - - - - - - - - - - -
Panjshir Panjshir - - - - - - - - - - - -
Panjshir Paryan - - - - - - - - - - - -
Panjshir Rukhah - - - - - - - - - - - -
Panjshir Shutul - - - - - - - - - - - -
Panjshir Unaba - - - - - - - - - - - -
Panjsher Total p-f p-f p-f p-f p-f p-f p-f p-f p-f p-f p-f p-f
Parwan Bagram - - - - - - - - - - - -
Parwan Charikar (Provincial Center) - - - - - - - - - - - -
Parwan Syahgird (Ghorband) - - - - - - - - - - - -
Parwan Jabalussaraj - - - - - - - - - - - -
Parwan Koh-i-Safi - - - - - - - - - - - -
Parwan Salang - - - - - - - - - - - -
Parwan Sayyid Khel - - - - - - - - - - - -
Parwan Shaykh Ali - - - - - - - - - - - -
Parwan Shinwari - - - - - - - - - - - -
Parwan Surkh-i-Parsa - - - - - - - - - - - -
Parwan Total p-f p-f p-f p-f p-f p-f p-f p-f p-f p-f p-f p-f
Samangan Aybak (Provincial Center) - - - - - - - - - - - -
Samangan Darah-i-Soof-i-Bala - - - - - - - 58 198 - - 3
Samangan Darah-i-Suf-i-Payin - - - - - - - 185 40 - - 138
Samangan Fayroz Nakhcheer - - - - - - - - - - - -
Samangan Hazrat-i-Sultan - - - - - - - - - - - -
Samangan Khuram wa Sar Bagh - - - - - - - - - - - -
Samangan Roi-Do-Ab - - - - - - - - - - - -
Samangan Total p-f p-f p-f p-f p-f p-f p-f 243 238 p-f p-f 141
Sari Pul Balkhab - - - - - - - - - - - -
Sari Pul Gosfandi - - - - - - - - 4 - - -
Sari Pul Kohistanat - - - - - - - - 96 7 10 22
Sari Pul Sangcharak - - - - - - - - 181 223 - -
Sari Pul Sari Pul (Provincial Center) - - - - - - 72 212 80 280 572 522
Sari Pul Sayyad - - - - 195 331 1,614 3,338 239 1,623 2,004 1,413
Sari Pul Sozma Qala - - - - - - - - 61 - 21 18
Sari Pul Total p-f p-f p-f p-f 195 331 1,686 3,550 660 2,134 2,607 1,975
Takhar Baharak - - - - - - - - - - - -
Takhar Bangi - - - - - - - - - - - -
Takhar Chahab - - - - - - - - - - - -
Takhar Chal - - - - - - - - - - - -
Takhar Darqad - - - - - - - - - - - -
Takhar DashtiQala - - - - - - - - - - - -
Takhar Farkhar - - - 22 - - - 7 18 - - -
Takhar Hazar Sumuch - - - - - - - - - - - -
Takhar Eshkamish - - - - - - - - - - - -
Takhar Kalafgan - - - 21 - - - 17 40 - - -
Takhar Khwaja Bahawuddin - - - - - - - - - - - -
Takhar Khwaja Ghar - - - - - - - - - - - -
Takhar Namak Ab - - - - - - - - - - - -
Takhar Rustaq - - - 25 - - - 23 193 - - -
Takhar Taloqan (Provincial Center) - - - 2 - - - - 1 - - -
Takhar Warsaj - - - - - - - - - - - -
Takhar Yangi Qala - - - - - - - - - - - -
Takhar Total p-f p-f p-f p-f p-f p-f p-f p-f 251 p-f p-f p-f
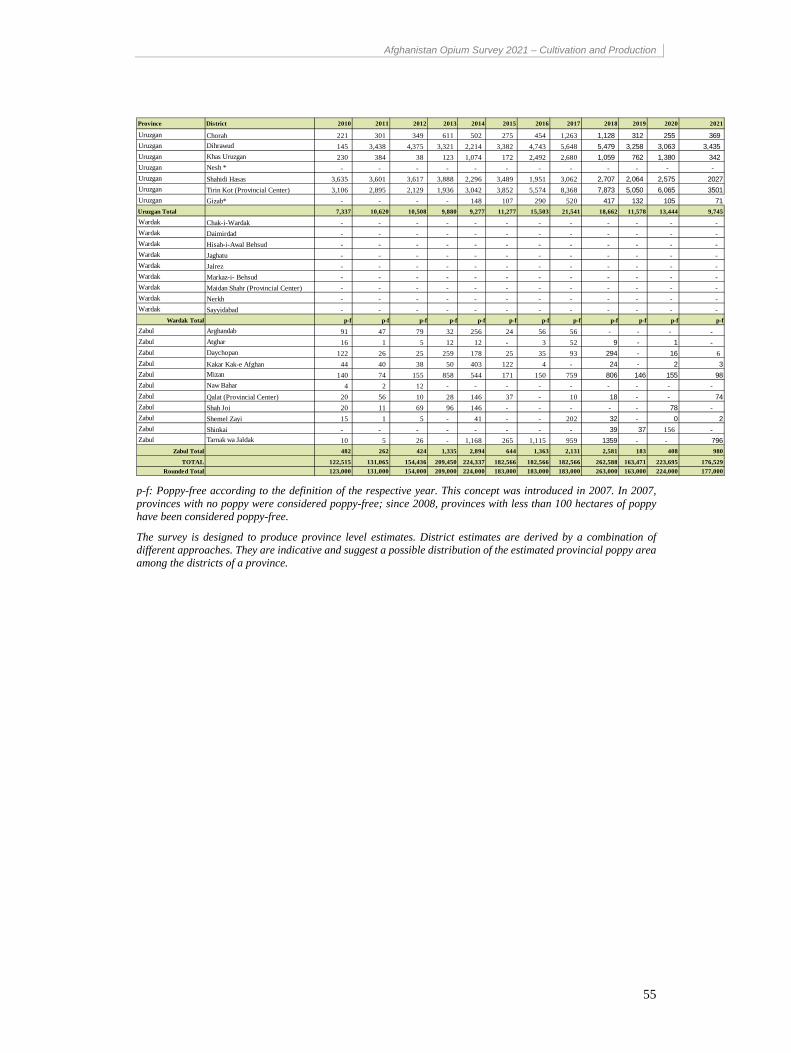
Afghanistan Opium Survey 2021 – Cultivation and Production
55
p-f: Poppy-free according to the definition of the respective year. This concept was introduced in 2007. In 2007, provinces with no poppy were considered poppy-free; since 2008, provinces with less than 100 hectares of poppy have been considered poppy-free.
The survey is designed to produce province level estimates. District estimates are derived by a combination of different approaches. They are indicative and suggest a possible distribution of the estimated provincial poppy area among the districts of a province.
Province District 2010 2011 2012 2013 2014 2015 2016 2017 2018 2019 2020 2021
Uruzgan Chorah 221 301 349 611 502 275 454 1,263 1,128 312 255 369
Uruzgan Dihrawud 145 3,438 4,375 3,321 2,214 3,382 4,743 5,648 5,479 3,258 3,063 3,435
Uruzgan Khas Uruzgan 230 384 38 123 1,074 172 2,492 2,680 1,059 762 1,380 342
Uruzgan Nesh * - - - - - - - - - - - -
Uruzgan Shahidi Hasas 3,635 3,601 3,617 3,888 2,296 3,489 1,951 3,062 2,707 2,064 2,575 2027
Uruzgan Tirin Kot (Provincial Center) 3,106 2,895 2,129 1,936 3,042 3,852 5,574 8,368 7,873 5,050 6,065 3501
Uruzgan Gizab* - - - - 148 107 290 520 417 132 105 71
Uruzgan Total 7,337 10,620 10,508 9,880 9,277 11,277 15,503 21,541 18,662 11,578 13,444 9,745
Wardak Chak-i-Wardak - - - - - - - - - - - -
Wardak Daimirdad - - - - - - - - - - - -
Wardak Hisah-i-Awal Behsud - - - - - - - - - - - -
Wardak Jaghatu - - - - - - - - - - - -
Wardak Jalrez - - - - - - - - - - - -
Wardak Markaz-i- Behsud - - - - - - - - - - - -
Wardak Maidan Shahr (Provincial Center) - - - - - - - - - - - -
Wardak Nerkh - - - - - - - - - - - -
Wardak Sayyidabad - - - - - - - - - - - -
Wardak Total p-f p-f p-f p-f p-f p-f p-f p-f p-f p-f p-f p-f
Zabul Arghandab 91 47 79 32 256 24 56 56 - - - -
Zabul Atghar 16 1 5 12 12 - 3 52 9 - 1 -
Zabul Daychopan 122 26 25 259 178 25 35 93 294 - 16 6
Zabul Kakar Kak-e Afghan 44 40 38 50 403 122 4 - 24 - 2 3
Zabul Mizan 140 74 155 858 544 171 150 759 806 146 155 98
Zabul Naw Bahar 4 2 12 - - - - - - - - -
Zabul Qalat (Provincial Center) 20 56 10 28 146 37 - 10 18 - - 74
Zabul Shah Joi 20 11 69 96 146 - - - - - 78 -
Zabul Shemel Zayi 15 1 5 - 41 - - 202 32 - 0 2
Zabul Shinkai - - - - - - - - 39 37 156 -
Zabul Tarnak wa Jaldak 10 5 26 - 1,168 265 1,115 959 1359 - - 796
Zabul Total 482 262 424 1,335 2,894 644 1,363 2,131 2,581 183 408 980
TOTAL 122,515 131,065 154,436 209,450 224,337 182,566 182,566 182,566 262,588 163,471 223,695 176,529
Rounded Total 123,000 131,000 154,000 209,000 224,000 183,000 183,000 183,000 263,000 163,000 224,000 177,000
Copyright © 2022 FDOKUMEN