Afghanistan Opium Survey 2021 – Cultivation and Production - UNODC

Examining Afghanistan’s Enemy Within: A Look at the Causes of Opium Cultivation across Provinces
By Wesley Oliphant
Abstract: Afghanistan has been the top producer of opium since 1991 and now constitutes over 90% of global production. Afghanistan’s opium fosters many problems including drug use within the country and the deaths of tens of thousands each year. Despite various efforts and about $7.5 billion spent, Afghanistan in 2014 posted a record amount of opium cultivation for a second straight year. Part of the problem is the lack of consensus on the cause with several theories advocated: insufficient security, weak institutions, lack of recognition of wheat as a possible substitute, lack of recognition of cotton as a possible substitute, returning refugees, insufficient eradication of opium crops and poverty. This paper is the first to use cross sectional regressions of provincial data to test all these theories simultaneously. I look at the period of recent increase of 2010 to 2014 and find evidence for the factors of returning refugees and poverty. The findings suggest an alternative economic opportunity can lower opium cultivation.
I. Intro
“When solving problems, dig at the roots instead of just hacking at the leaves.”
- Anthony D’Angelo
Opium and Afghanistan. In media articles, these two words can appear synonymous as Afghanistan is
by far the world’s greatest opium supplier. Since 2006, the country supplies about 90% of the world’s
opium according to the United Nations Office of Drugs and Crime (UNODC 2009) 1. While various efforts
have been made to reduce opium cultivation and approximately $7.6 billion has been spent on its
reduction2, the 2014 cultivation amount is a second consecutive record.3 As of 2014, the amount of
cultivation is about 224,000 hectares (or 550,000 acres) – enough to cover 70% of Rhode Island.
Also according to the UNODC, the opium economy now accounts for about $2.4 billion or roughly
15% of the country’s legal economy. Also according to the UNODC, a significant percent of the
population has been involved in opium production – ranging from year to year with a low of 6% in 2010
to a high of 15% in 2007. Also, Afghan opium farmers earned $850 million in 2014 (UNODC 2014).
But far from being a boon for Afghanistan, opium creates many problems. The first is helping the
insurgency. While the Taliban briefly banned opium production in 2001, much of the opium economy’s
revenues now go to them and other insurgent groups. To get an idea of how much, consider that 98% of
all opium poppies are grown in insurgent-influenced areas and the income stream from this drug
1 The UNODC is a UN office charged with several tasks including solving problems related to trafficking and abuse of drugs.2 This amount is according to the Office of the Inspector General for Afghanistan Reconstruction (SIGAR). This office was created to provide objective oversight of Afghanistan’s reconstruction efforts. 3 The 2013 crop itself was a record increase of 36% on the previous year and shattered the previous record for cultivation of 2007 until it was surpassed a year later.
1

averaged about $125 million per year from 2005 to 2009. Estimates vary with the UNODC asserting
about 15% of Taliban and other insurgent funding comes from opium (UNODC 2009, 113) while an
article in The Atlantic states opium constitutes one-third of their funding. The opium economy also
encourages a stronger economic bond between the population and insurgents.
The second problem is fostering addiction among Afghans. Despite the perception Afghanistan only
produces opium, data increasingly indicate the high supply is creating demand (World Drug Report 2014,
27) with about 5% of the Afghan opium crop consumed within the country (Constable 2015).
Consequently, addiction rates among Afghans aged 15-64 years old now runs at 10% according to the
Ministry of Public Health of Afghanistan and the UNODC.4 The public health costs from opium use are
now estimated at $300 million.5 And with the bulk of the police work going to fighting the insurgency,
there is little manpower to combat drugs.6
In addition, Afghan opium has promoted insurgency abroad. According to the UNODC, Afghan opium
has been contributing money to various insurgencies in Central Asia along the route to Russia. Two
examples are the Islamic Movement of Uzbekistan and the Islamic Party of Turkestan (UNODC 2009).
Furthermore, Afghan opium has also fostered addiction abroad. This opium has been particularly
damaging in Europe, Russia, India and China. For example, India’s Punjab state is on the transit route for
opium out of Afghanistan and as a result is now dealing with a 70% drug abuse rate among its youth
population (Simha 2015). According to Russia’s official statistics, the number of Russians dying of opium
imported from Afghanistan is 30,000 a year – more than twice the number of Soviet soldiers killed in the
entire Soviet Afghan War of the 1980s (UNODC 2009). The number of deaths per year in NATO countries
due to heroin overdoses from Afghan opium is estimated at 10,000 (UNODC 2009) - nearly three times
the number of NATO soldiers killed since the beginning of combat operations in Afghanistan.7 In fact,
more people die annually from Afghan opium than any other drug at around 100,000 (UNODC 2009, 1).
While there is general agreement Afghan opium is harmful and current policy is not working, there is
little consensus on a solution. This ambiguity stems partly from a lack of consensus on opium
cultivation’s cause(s). The theories include but are not limited to insufficient security, weak institutions
in the form of corruption, the decline in the planting of substitutes of wheat or cotton, the lack of
sufficient eradication, poverty and the return of Afghan refugees.
4 Many take the drug to alleviate pain (e.g., for physically repetitive work) without knowledge of its addictive consequences and because there is no alternative.5 This statistic comes from an article on opium in Afghanistan from Business Insider by Alice Speri May 22, 2014 and was originally from Vice News. 6 Only 2,000 policemen are so assigned throughout the country. 7 As of September 5, 2015, this number stands at 3,493 according to icasualties.org.
2

Accordingly, this paper is the first to attempt to test all of the theories stated above using a regression
analysis with provincial data on opium cultivation. The intent is to provide a more effective policy for
combating opium cultivation today.8 In particular, my paper examines the change in opium cultivation
from 2010 to 2014. Why this period?
From figure 1, we can see opium cultivation since 2002.
60,000
80,000
100,000
120,000
140,000
160,000
180,000
200,000
220,000
240,000
02 03 04 05 06 07 08 09 10 11 12 13 14
We can discern three periods. The first is one of general increase from 2002 to 2007 while the second is
one of decrease from 2007 to 2009. While the third period from 2010 to 2014 is also one of increase,
the increase itself is record breaking and produces two consecutive records of opium cultivation in 2013
and 2014.
To find out which theories are more valid, the methods used have varied from looking at what specific
events immediately precede major changes in opium cultivation to survey data – examining only one or
a few theories. For example, Bove 2011 employs a provincial analysis to test one possible factor behind
opium production (conflict) and is restricted to only 15 of the 34 provinces. In contrast, my paper is the
first to test the various causes of opium cultivation asserted in other studies.
While survey data are valuable since farmers determine what crop to grow, other methods should
also be employed for Afghanistan. One major flaw with survey data has been the inability to take a
8Some would argue that trying to remove opium is a waste of resources. If opium was removed from Afghanistan, it would be grown elsewhere. Even if opium cultivation worldwide plunged to negligible levels, people would simply substitute to other drugs. However, few countries in the world can grow opium on a large scale and none rival the yields of Afghanistan – e.g., the average yield in Afghanistan is 40 kilograms per hectare compared with 10 kilograms per hectare in Burma – the previous top producer of opium in the world. Also, while by no means the only plant to produce drugs, the opiates made from opium are the most deadly – partly explaining why 60% of drug treatment demand in Asia and Europe relate to opiates (UNODC 2009, 3).
3

representative sample. For example, in Mansfield’s 2004 paper, the survey could not be conducted for a
second time in Uruzgan and northern Helmand because of security. Security problems in the Pasaband
district of Ghor province in Afghanistan’s west prevented interviews in the provinces’ most productive
opium producing district. The author even states “Given the current paucity of data regarding Afghan
rural livelihood strategies it is not possible to determine whether this sample is truly representative”
(Mansfield 2004).
But even if representative, survey data still have other flaws for opium farming because opium
farming in Afghanistan is a complicated issue. As stated in Mansfield 2013,
…simply asking households why they do or do not cultivate opium is insufficient, since the complex and interconnected factors that inform household decision-making cannot be distilled into a single answer. Interviewers also avoided asking direct questions about opium. This was to reduce the risk of households exaggerating the returns on opium as a way to ‘negotiate’ for greater development assistance in return for giving up the crop.
He goes on to state the recent policy of eradication and other methods “has made illicit drug a more
sensitive topic for discussion with farmers and other stakeholders than was the case in the 1990s or
early 2000s” (Mansfield 2013).
Lind et al. 2012 undertakes a regression analysis at the district level and using a dummy variable for
Western casualties in a given district as a proxy for conflict. They find evidence conflict leads to opium
production – particularly where the rule of law is weak (Lind et al. 2012). While this study allows for
more micro level analysis than my paper, their paper only focuses on conflict and is unable to test other
hypotheses due to sparse district level data.
Like district level data, provincial data is insightful for Afghanistan. These data are more micro than
apparent since the provinces are more similar to US counties than states in size and population. This
similarity with US counties is because the number of provinces has increased from 1964 when there
were only 14 to 34 by 2004 and since Afghanistan itself is over 15,000 square miles smaller than Texas.9
Consequently, while the US states on average are 70,000 square miles, the average Afghan province is
only 7,400 square miles. This size is similar to the average county size of three US states: Alaska, Arizona
9 There are several reasons: first, to increase local involvement with the central government’s provincial representatives (Dupree 1980); second, to increase development (Dupree 1980); third, to provide patronage to various groups – providing them their own province and so the positions of governor and so forth. For example, for their contribution in fighting the Taliban in
the late 1990s, the people of the Panjshir valley were given their own province in 2004.
4

and Nevada. There is also a fair amount of variability between the provinces – e.g., the opium
percentage of arable land in a province has a standard deviation of about 7%.
I find the variables for poverty and of returning refugees are significant. This result remains even when
several robustness checks are run. Such a result implies the need for alternative economic
opportunities.
The paper proceeds as follows. Section II discusses the data and their sources. Section III describes the
research method, and section IV presents the results. Finally, section V mentions the studies’ limitations
while section VI concludes.
II. Data
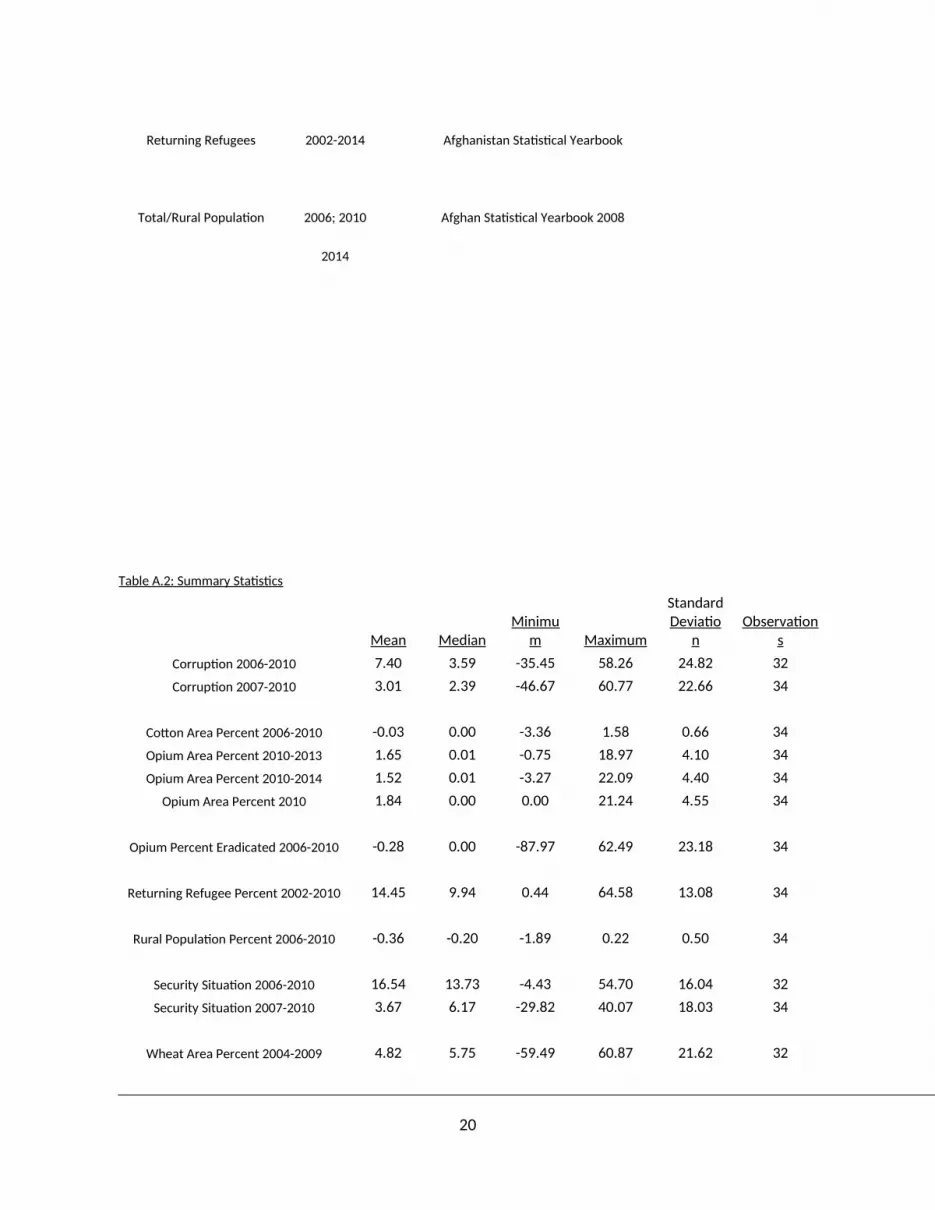
The sources of the data appear in table A.1 along with a discussion of the variables. Summary statistics
appear in table A.2.
The first variable is the dependent variable which is the percent of arable land that is planted with
opium. I use the percent of land to control for the possibility that greater opium cultivation is simply
where there is more arable land. The data for opium cultivation comes from the UNODC. The data for
arable land comes from several sources: the UNODC’s Afghanistan Opium Surveys, Afghanistan’s
Department of Geodesy and Cartography, USAID, the Afghanistan Information Management Systems,
the National Area Based Development Program, and Wiley (2003). Please see the appendix.
The explanatory variables not only reflect what is mentioned in different studies but also reflect the
possible influences on a farmer’s crop choice. According to the Afghanistan Farmers’ Intention Survey of
2003 to 2004, around 90% of farmers decide what they plant (87% of poppy farmers and 81% of non-
poppy farmers) (FIS 2003/2004, 33). It goes on to state that “The interviews with the farmers also
revealed that the large majority of land under cultivation in the poppy growing regions of Afghanistan is
owned by the farmers themselves (close to 80% among poppy farmers).” For non-opium farmers the
land under cultivation that is owned by farmers is 76% (FIS 2003/2004, 33).
1. Lack of Security
The first possible reason is a lack of sufficient security due to inadequate government control of an
area. This variable is measured by the Asia Foundation data in terms of the percentage of those
surveyed in each province stating they always or often fear for their personal safety.
The Asia Foundation was founded over 60 years ago and is a non-profit organization to promote Asian
development. Unlike other surveys which are done only once or once every five years and interview only
a few hundred, its surveys have been conducted annually from 2006 to 2014 and are more
5

comprehensive - covering thousands of Afghans over all 34 provinces. For this variable, data are
available annually from 2006 to 2012.
This cause is asserted by the UNODC and several other sources such as Mansfield 2004. The argument
is that if the central government were stronger, they would be better able to enforce drug laws. In
Mansfield 2004 (9), the province with the highest opium production also had the highest percentage of
respondents who stated the central government did not have sufficient control to enforce the opium
ban declared after Taliban rule (Mansfield 2004, 16). Furthermore, according to the UNODC, 98% of
opium production in 2009 was concentrated in those areas that were the “most insecure Taliban-
influenced areas” (UNODC 2009). By 2013, almost 90% of the country’s opium was still concentrated in
these regions.
In addition, “The February 2008 MCN/UNODC Rapid Assessment Survey showed that, in a sample of
469 villages, more than two-thirds of the villages located in areas with poor security conditions reported
growing opium poppy in 2008, as compared to less than one-third in areas that enjoyed better security.
(UNODC 2008, 10). Furthermore, it is noted that in the western province of Badghis “increases in opium
poppy cultivation ran parallel with decreases in security in Badghis province after 2003” (UNODC 2009,
85).
It should be noted that while most other possible reasons have sources arguing against it, this factor
does not. While other studies may not find evidence of this factor, none of the sources argue against
this factor as a cause of cultivation.
2. Weak Institutions
The second possible reason for opium cultivation is the quality of institutions. The proxy variable for
weak institutions is the percentage of people stating corruption is a major or minor problem in their
daily life which also comes from the Asia Foundation survey. The argument is that with greater
corruption, the weaker the enforcement of opium laws and so the more likely is opium cultivation.
This cause is asserted by several sources. One example is Glaze 2007 (6) which states how farmers are
able to grow opium: “Farmers routinely bribe police and counter narcotics eradication personnel to turn
a blind eye.” It is also mentioned as a reason for other countries growing opium such as Myanmar – the
second highest opium producer. This factor is similar to the previous factor in terms of the absence of
counterarguments in the literature.
3. Insufficient Wheat Cultivation
The third and fourth reasons for opium cultivation involve the lack of cultivation of substitute crops.
For example, in Myanmar opium production started in many communities in the central eastern part of
6

the country due to a lack of alternatives (Brown 1999, 244). As another example, UNODC 2009 (95)
asserts that “In 2005 and 2006, most Nangarhar farmers abstained from cultivating opium poppy but
were unable to compensate for the loss in income through other crops. As a result, opium poppy
cultivation bounced back…”
The two substitute crops considered are wheat and cotton. The data for wheat come from the
Afghanistan Central Statistics Organization (CSO) in their annual statistical yearbooks. This possible
cause is measured by the percentage of arable land in a province that is wheat.
Lind et al. treats wheat as the substitute for opium and with good reason as wheat can also be a
source of income. For example, “In north-eastern Afghanistan, non-poppy growing farmers also earn
higher levels of income than poppy growers. This is due to the spike in wheat prices and a decrease in
opium prices and opium poppy cultivation” (UNODC 2009, 96). Wheat is also a crop everyone knows
how to grow as it is the most widely grown crop in Afghanistan as it is the main staple of the Afghans’
diet.10
On the other hand, one argument against wheat’s importance in opium farming comes from Robert
Ford’s description. Looking at the country and not just one region, he asserts wheat farming in general is
undertaken not for the market but is grown only for subsistence. The farmers will then use the rest of
their land for other cash crops such as cotton or opium (Ford, 178).
4. Insufficient Cotton Cultivation
The other crop asserted as an alternative is the crop just mentioned as another cash crop: cotton. Its
cultivation data also come from Afghan CSO’s annual statistical yearbooks. This possible cause is also
measured by the percent of arable land that is planted with cotton.
Cotton’s importance is highlighted by the following quote: “Cotton is one of the most important
industrial and commercial crops in Afghanistan after fresh and dried fruits. Since it is a very important
crop in Afghanistan, therefore it is called White Gold” (Chemonics 2004, 2).11 In Robert Ford’s
description of the Afghan economy in 1986 he refers to cotton as “the most important cash crop”. Its
importance as a major crop is shown by its cultivation area in 2001 and 2002 – e.g., in Kunduz province
cultivation of cotton stood at 4,400 hectares (Chemonics 2004, 6) and 20,000 hectares for Helmand
province (Chemonics 2004, 9).
This cause is also supported by Dick Scott – a renowned expert on Helmand province which is the
province most responsible for opium production at about 50% for the past two decades12. He argues
10 Wheat is so central to Afghanistan that the country’s flag from 1974 to 1978 included it.11 Chemonics is a company that promotes international development.12It is more specifically for the period 1994 to 2000 and 2006 to 2014.
7

that cotton is a strong substitute for opium. In a recent analysis of the US counter-narcotics program in
Afghanistan, he states the following:
Cotton, for example, is a labor intensive cash crop the farmers understand, prefer and continue to cultivate. Cotton has a traditional central marketing point at the government cotton gin in Lashkar Gah [Helmand province’s capital city] that can set a reasonable (for the farmers) fixed price for raw cotton, provide free cotton seed to insure top quality cotton for the international market, process the cotton into bales and find the best price on the international market…with some needed technical assistance. The gin was built by the British in about 1965 and performed all these functions until the Soviet invasion.13
Back in 2002, cotton was a profitable crop. For example, in Kunduz province “Interviews were
conducted with farmers to determine the costs per jerib involved in growing cotton. While the costs
differed slightly at each farm, the costs were approximately $40 per acre” (Chemonics 2004, 7). The
farmer could sell his raw cotton to the gin at the set price of $147 per acre and so, farmers could obtain
an average profit of $67 per jerib (Chemonics 2004, 7)14. In Helmand province, “Farmers who sold their
cotton to the government gin had an estimated net income of about $35 per acre” (Chemonics 2004, 9).
On the other hand, some have reservations about cotton or any other cash crop as a substitute. As
stated in Mansfield 2004 (20), “The production of cash crops is constrained by low yields, insufficient
water, poor infrastructure, limited markets, price fluctuations and potential border restrictions making it
a relatively risky endeavor relative to opium production.” In their study of cotton cultivation in
Afghanistan in the early 2000s and despite saying cotton cultivation is profitable, Chemonics 2004 (9)
states that for Helmand province “certain sub-sectors are having marketing problems. The marketing
problems are exacerbated by the poor roads that make accessing distant markets difficult and
expensive.” In addition, the source continues that due to decades of war, most of the irrigation systems
in cotton growing areas have been destroyed or damaged and that due to a lack of maintenance most of
the canals and streams are filled with sand or soil or have simply fallen apart (Chemonics 2004, 11).
5. Number of Returning Refugees
The fifth possible reason is the number of returning refugees with data coming from the UN Refugee
Agency (UNHCR). This cause is asserted by Thomas Barfield – an anthropologist and author of several
books on Afghanistan. He argues returning refugees who returned after the Taliban defeat at the end of
2001 had few economic opportunities. As a result, many turned to opium production (Barfield 2010).
This reason is also mentioned by Pierre Chouvy – a geography and expert in the geopolitics of illegal
13 It should be noted that there were once four cotton gins in Afghanistan capable of processing the raw cotton purchased by the government (Chemonics 2004, 4).14 A jerib corresponds to about one half of an acre or one fifth of a hectare.
8

drugs – who attributes the increase in opium cultivation in Nangarhar province in the 1990s to the
returning refugees (Chouvy 2009).
On the other hand, there is evidence against this explanation in Lind et al. 2012 (27). They examine
whether the positive relationship found between conflict and opium production is due to an increase in
farming which includes wheat. They argue the increase in farming activities and so wheat production
could have been caused by the many Afghans returning which causes land scarcity which then fostered
opium production (which is less land intensive than wheat) as well as conflict. To test for this possibility,
the authors run a two way fixed effects model with data at the provincial level but found no evidence.
6. Lack of Opium Eradication
The sixth possible reason is insufficient opium eradication with data on the number of hectares of
opium eradicated coming from the UNODC. One argument is the success of eradication in Mexico via
aerial spraying (see above). This cause is also asserted by the UNODC. In 2014, they emphasize how the
increase in opium cultivation to a new record was accompanied by a 63% fall in opium eradication.
The argument is that the greater the eradication, the less land under opium cultivation and also the
fewer the farmers who choose cultivating opium because of the greater risks of losing one’s crop. This
argument is supported by Farrell and Thorne (2005) which as mentioned argued the decline in opium
production in 2001 was due to the Taliban ban - with one of the main tactics being eradication. In
particular, Nangarhar province’s reduction in opium cultivation to opium free from 2007 to 2008 is
considered the prime example of eradication’s effectiveness.
In contrast, many argue eradication is ineffective and even counterproductive – particularly in
subsequent years. Among farmers interviewed in the Mansfield 2004 survey (19), about 78% stated they
would continue farming opium regardless of eradication. They were confident they could prevent
eradication by placing their crops in a walled compound where they would also locate their family’s
women as it would mean breaking the rules of purdah (women not being seen by men unrelated to the
family or female strangers) and risk angering the local population.
The main argument against eradication stems from how it proceeded in practice. The local law
enforcement can be bribed not to destroy opium crops and will often avoid those who may take
revenge. So, the opium eradication fell on poorer farmers.15
15 In fact and also as stated in Mansfield 2004 (18), “respondents and key informants reported that the eradication campaign in the 2002/3 growing season had generally been targeted against the more vulnerable and that the crops of the wealthy and influential were not destroyed.” Over 60% of those whose land was destroyed in the 2002/3 season were landless in that they did not own land themselves (Mansfield 2004, 21).
9

Given poorer farmers bore the brunt, eradication increases opium production later as eradication
increases the debt of opium farmers. In Mansfield’s 2004 survey, the debts of those interviewed whose
crops had been eradicated was $1,300 compared with $900 for those who had not (Mansfield 2004, 18).
In the Mansfield 2004 survey (25), many respondents further stated their opium debts would double for
every year they could not repay them. Given farmers could be imprisoned for their debts (Mansfield
2004, ii) and given the highly undesirable alternatives of mortgaging their land or selling their children,
the only way to repay those debts is to reserve more of the farm for opium. As stated in Mansfield 2004
(v),
Reports from the field suggest that by destroying the crops of the more vulnerable (who were least likely to have alternative sources of livelihood) and subsequently driving up their debts (payable in opium) many households believe they have little choice but to cultivate opium in subsequent years. It is particularly notable that all those interviewed who were targeted by the eradication campaign in the 2002/3 growing season are cultivating opium poppy in the 2003/4 growing season and they have on average increased the amount of land dedicated to opium by more than those whose crops were left undamaged.
Among those respondents whose crop was destroyed in the 2002/2003 season, only 3% said they had
lowered their opium area in 2003/2004 while 79% said they had increased it (Mansfield 2004, 18).
According to the Institute of War, even the supposed success of eradication in Nangarhar province was
actually due to substitution to wheat – a point highlighted by opium returning to higher levels as wheat
declined.
7. Poverty
The seventh possible cause is poverty. This cause is asserted by multiple sources including the reason
for opium growth in other countries. For example, when talking about the opium industry in Myanmar,
Brown (1999, 240) asserts “Cultivators of drugs do so to survive, not to profit as their continued and
worsening impoverishment demonstrates.” Another example is the following: “Opium production
clearly proceeds from poverty and food insecurity, from Afghanistan to Burma to Laos, where it is a
coping mechanism and a livelihood strategy (Chouvy 2008, 6).
The argument is farmers undertake opium farming due to poverty and its many accompanying
deprivations. When people are poor in Afghanistan, they can resort to opium to increase their income.
Furthermore, the poor do not have access to medicines, fuel and transportation and other amenities.
Opium is far more useful in these circumstances as it can be used as medicine and fuel and can be sold
at the farm gate and so does not require transport. Opium can also help people out of debt.
10

Some authors on Afghan opium find evidence of this relationship. In the survey conducted by
Mansfield 2004 (24), we find the highest accumulated debt for a province happens to be in the one with
the highest opium cultivation in 2004: Helmand province at $2,373. In early 2003, poppy farmers had
about $740 in outstanding loans compared with only $456 for non-poppy farmers (FIS 2003, 7).
On the other hand, this argument is disputed by a UNODC publication. The paper concludes that
opium cultivation “increased most in areas notable for their exposure to the insurgency, not the depth
of their poverty” (UNODC 2008, 2). There is also no evidence that it is the choice of the poorest of the
poor farmers.
For example, the paper examines Afghanistan’s opium and poverty on a regional basis: “especially in
central Afghanistan, farmers are much poorer than in other regions with a comparable level of debt.
They do not, however, cultivate opium poppy on the same level as farmers in eastern, north-eastern and
northern Afghanistan” (UNODC 2009, 97).
While there is a poverty rate calculated from the National Risk and Vulnerability Assessment (NRVA),
it is only for 2008. While widely cited, it is not highly correlated with other possible measurements of
poverty for that same year from different sources – e.g., illiteracy among men, illiteracy among women,
lack of access to safe drinking water, unemployment rate, etc.
Instead, to measure poverty I use the measurement of percentage of population that lives in rural
areas which comes from annual statistical yearbook of Afghanistan’s CSO. I do so because poverty is
generally higher in rural areas so that provinces with higher percentages of the population in rural areas
are poorer than those provinces with lower such percentages.
Although there are several significant exceptions to this association such as in Latin America,
Afghanistan is not one of them. Just as it has had one of the world’s lowest GDP per capita levels for
many decades, Afghanistan also has one of the world’s highest percentages of people in the rural areas -
about 76.5% for 2011 according to the CIA World Factbook. Among Afghan provinces, the rural
percentage of population is closely correlated with illiteracy among women (0.70), lack of access to
health facilities (0.44) and lack of access to safe drinking water (0.55). Furthermore, other potential
measurements of development are highly, negatively correlated with rural percentage – e.g., doctors
per capita at -0.71.16
III. Method
16 These data come from the National Risk and Vulnerability Assessment 2007/2008 and are compared with the rural percentage for each province in the same year.
11

Looking at the years of the most recent (and record breaking) increase in cultivation, I look at the
period 2010 to 2014. Each explanatory variable corresponds to a particular theory and is the change
over time because the dependent variable is the change over time. To avoid endogeneity, I choose the
four year change up to 2010 unless I believe it is helpful to provide another time period or due to lack of
data availability. So, for example to test the theory of poverty, I use the measurement of the change in
percentage of the population living in rural areas from 2006 to 2010.
The only exception is returning refugees where I use the sum (weighted by province population) not
the change since this sum is more consistent with the theory. I use the sum because as stated according
to Barfield 2010, it is the lack of opportunities for returning refugees (after the Taliban defeat) that
caused opium cultivation to increase. I weight the number by provincial population since a given
number of refugees would not have as much of an impact in a more populous province.
Also to be consistent with the theory, I do not use the years 2006 to 2010. I select 2002 since this was
the first year after the Taliban’s defeat when a large scale and consistent pattern of migration back to
Afghanistan began.17
Given the theories advanced, the regressions run should be the following:
Opium cultivation percentage point change 2010 to 2014 = α + β1*Opium cultivation percentage 2010 + β2*Change in Security Situation 2010 to 2014 + β3*Change in Institutional Quality 2010 to 2014 + β4*Change in Wheat cultivation percentage 2010 to 2014 + β5*Change in Cotton cultivation percentage 2010 to 2014 + β6*Returning Refugees as Percent of Population 2002 to 2014 + β7*Change in Percent of Opium Eradicated 2010 to 2014 + β8*Change in Rural Percent of Population 2010 to 2014 (1)
But since each explanatory variable would be measured for the same time period as the dependent
variable, there is a strong possibility of endogeneity. So, I have an instrument for each of the
explanatory variables in the regression. Since the dependent variable is for a four year period, I look at
the change in the previous four year period. Since they are before the change in opium cultivation, they
avoid the endogeneity issue.
For example, one variable is the change in the security situation from 2010 to 2014. But endogeneity
may be a problem since an increase in opium cultivation may mean more funds for insurgent groups
which can decrease the security situation. Accordingly, I use security situation change from 2006 to
17 Significant numbers of refugees from the Soviet Afghan war returned before 2002 – e.g., 1.3 million for the year 1992 but soon after fighting between Mujahidin groups particularly for the capital led to 700,000 refugees returning to Pakistan in 1994. In 2000, many fled the country after the Taliban banned opium that year.
12

2010. Besides returning refugees, the only exception of using the previous four year period is for wheat.
Because it is more correlated with the change from 2010 to 2014, I use the change for the period 2004
to 2009. For returning refugees, I use the weighted sum from 2002 to 2010.
So, the actual regression run is the following:
Opium cultivation percentage point change 2010 to 2014 = α + β1*Opium cultivation percentage 2010 + β2*Change in Security Situation 2006 to 2010 + β3*Change in Corruption 2006 to 2010 + β4*Change in Wheat cultivation percentage 2004 to 2009 + β5*Change in Cotton cultivation percentage 2006 to 2010 + β6*Returning Refugees as Percent of Population 2002 to 2010 + β7*Change in Percent of Opium Eradicated 2006 to 2010 + β8*Change in Rural Percent of Population 2006 to 2010 (2)
Each of the instruments is highly correlated with the variable it is meant to replace. These correlations
appear in table A.3. Only the change in wheat percent does not have a correlation above 0.5 in
magnitude.18 The correlation for change in security situation is also not above 0.5, but I must examine its
correlation with the change from 2010 to 2012 rather than 2010 to 2014 due to data availability (see
above).
I run several robustness checks. To ensure the results are not simply the result of the particular time
period chosen, I undertake a robustness check involving the opium percentage change for period from
2010 to 2013 as the dependent variable. Because the regression above suffers from some sample
attrition of 30 provinces (observations) rather than 34, I run a separate regression for both periods that
employs the period 2007 to 2010 for the security situation and for corruption which boosts the sample
to 32 observations. These variables are used only as robustness checks as they are not as correlated with
the explanatory variables for 2010 to 2014: only -0.42 for corruption and -0.39 for security situation.
IV. Results
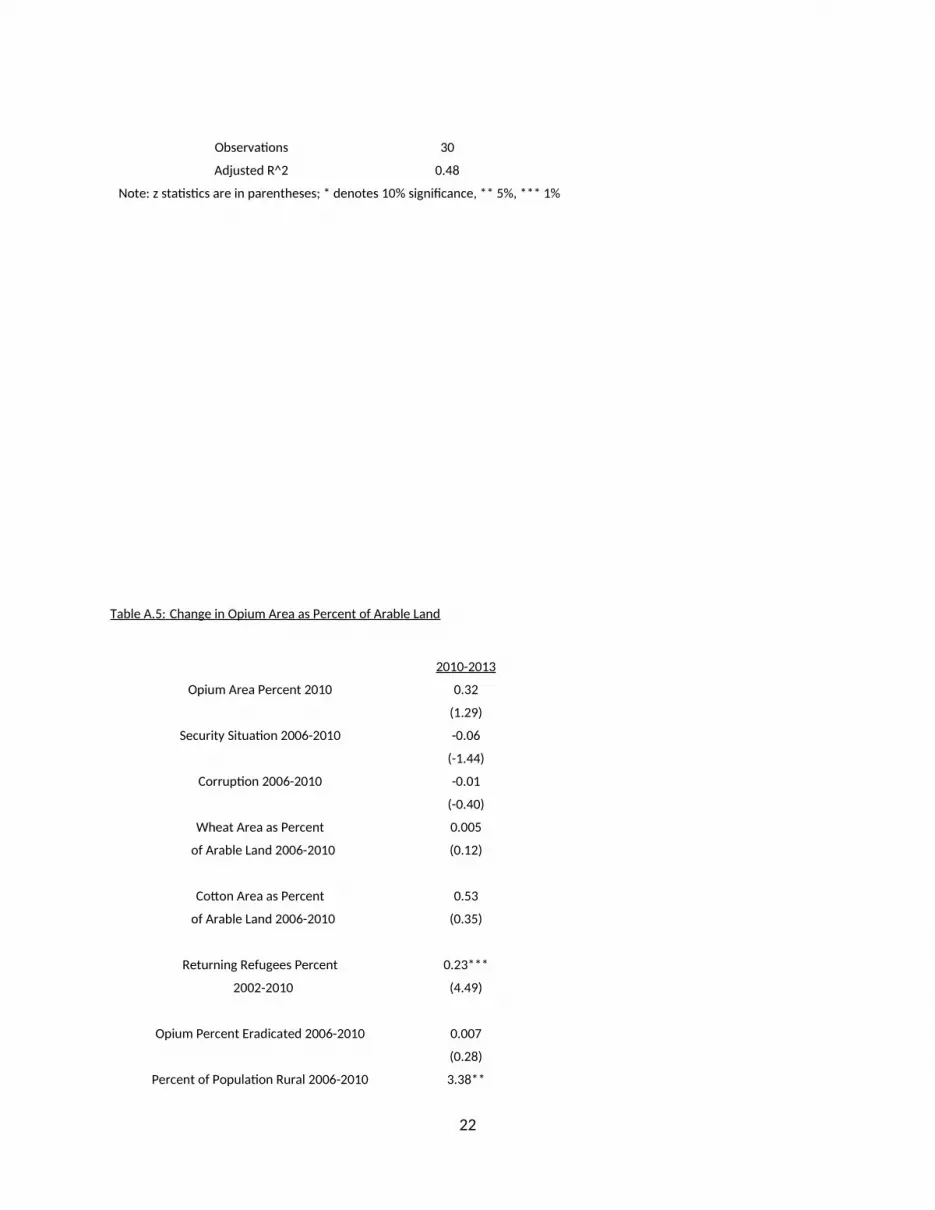
The results for the regressions for the periods 2010 to 2014 and 2010 to 2013 appear in tables A.4 and
A.5. Because of the small sample size, the threshold for significance is at the 10% level. For 2010 to
2014, I find that variables for returning refugees and for percent of population that is rural are
significant. Consistent with each argument, they are both positively significant. The result is exactly the
same when the period 2010 to 2013 is used albeit the percent of population rural variable is now
significant at the 5% level.
18 For security situation change, only the period 2010 to 2012 is the closest. The correlation with the change from 2006 to 2010 is 0.42.
13

The results for the regressions using the corruption variable and security situation variable for 2007 to
2010 appear in tables A.6 and A.7. While the adjusted R2 statistic is slightly lower for both regressions,
the variables for returning refugees and percent of population rural are still the only significant
variables.
As a result, the findings suggest the cause of opium cultivation may be due to a lack of other
opportunities. Accordingly, an alternative means of sufficient income might be useful for curtailing
opium.
One possible way would be to combat opium cultivation via crop substitution. Substitute crops like
saffron and grapes have been attempted before but have been ineffective at supplanting opium. For
example, according to the CSO Statistical Yearbook saffron cultivation for 2014 amounted to only 800
hectares for the whole country – less than .05% of the total land for crops. The reasons include
insufficient knowledge of how to grow such crops and a limited area where they can be grown. Even for
cotton, it is only grown in less than half the provinces and would require a major increase in investment
in multiple types of infrastructure such as roads and water provision in the form of canals.
A more likely candidate would be wheat. Unlike other potential substitutes, wheat is grown
throughout the country. In large part because of its use as the staple food, it accounts for over 50% of
the cropland from at least 1961 onward. As a result, farmers know how to grow the crop.
However, why wheat when the results seem to contradict it being a substitute? To understand,
consider that crops can be grown for two main reasons: for commerce or for subsistence. As stated by
Ford (1986), farmers throughout the country would generally grow wheat to ensure they would have
enough food to eat and then grow other crops for money. So, it is not about getting farmers to switch
from being opium farmers to wheat farmers but for farmers to grow more wheat and less opium by
recognizing how wheat can be grown commercially as well.
Another question is why attempt to make wheat a substitute when a previous effort a few years ago
failed? The main reason for the previous failure to make wheat a substitute stemmed from its price
being so much lower than opium that it was less profitable than opium. In addition, the farmers had to
find their own buyers and deal with wild fluctuations in prices
To counteract this deficiency, a price floor for wheat could be used. A price floor would help farmers
obtain a higher price for wheat but just as importantly provide price security as wheat prices can be very
volatile (Favre 2005). Consequently, farmers with lower risk would be encouraged to grow wheat.
Of course, price floors have disadvantages. In particular, deadweight loss is generated and the cost of
such a floor would be high. But this cost must be weighed against the number of lives saved (e.g., from
14

drug overdoses in the form of the reduction in the number of addicts in Afghanistan) and the reduction
in funding to insurgencies.
But the usefulness of a wheat price floor is seen by the following. If the Afghan government were to
implement a very high wheat price floor of $0.50 per pound and bought half the entire amount of wheat
production from Afghanistan’s highest annual level in the past forty years that was in 2013, the price
would be about $2.8 billion. This amount would be 4 times the average amount spent per year up to
now. But consider an estimate from the UNODC in 2009 that 100,000 people die each year from the
crop. Even though over 10% of deaths are from developed countries where the Value of a Statistical Life
is much higher, using the VSL of about $100,000 for developing countries, a decline in deaths of less
than 30% would be enough to justify such a price floor. This estimate does not include the benefits of
depriving insurgencies in Afghanistan and abroad of funds nor does it include the average amount spent
per year on methods that are not working.
Still, one other caveat of a wheat price floor must also be considered. Whether effective or not, a price
floor will be hard to remove as the lack of larger farms in Afghanistan means an inability to compete in
world markets (economies of scale). So, such a floor may turn into a permanent politically sensitive as
well as costly agricultural program.
V. Limitations of the Study
This study has several limitations. One limitation is that there are several factors asserted that cannot
be measured by statistical analysis. One example is the belief in the immorality of planting opium.
“Within Islam the cultivation, production, trafficking and consumption of intoxicants like opium is
haram, and in many deeply conservative and religious rural areas of the country, this is perceived as a
distinct cost when farmers weigh up the advantages and disadvantages of planting opium poppy.”
(MacDonald, 2007, 64).
Another example is the price of opium. This cause is asserted in several sources: by the Farmer
Intentions Surveys which consistently cites this reason as one of the top two, by the UNODC and by
SIGAR. This cause is also asserted in the study of the Afghan economy by Robert Ford in 1986: “Before
the war the Afghan opium was thought to have been grown in half the country’s provinces, and with
prices ranging up to $100 per kilogram, it paid far better than any other cash crop” (Ford, 1986, 204).
The argument is that since Afghan farmers are profit maximizers like everyone else, they will
substitute from other crops all else equal if the price of opium increases. The implication is that opium
prices can make growing opium more profitable and thus far more likely than other crops like wheat.
15

Furthermore, as stated in the FIS 2003/2004 (37), “no other crop can currently compete with opium
poppy and bring Afghan farmers similar financial benefits.”
On the other hand, some like Mansfield 2004 argue against the importance of opium prices in
cultivation decisions:
The argument for opium prices is much related to the argument of opium’s profitability relative to other crops and farmer opportunities. In fact, a review of the opium cultivation provides evidence that this cultivation is actually price inelastic. (Mansfield 2004, 14).
I cannot test this reason due to sample attrition as only 18 provinces have opium prices collected. The
UNODC only collects data for provinces not considered opium free – even though there must be some
price in these provinces as well that farmers would consider when deciding whether to plant opium. I
also am unable to test the theory of credit availability.
A second limitation is this analysis cannot test causes that are national or international in scale.
Specifically, another possible cause that cannot be considered in a provincial analysis is opium
cultivation is procyclical with the world economy. When the world economy is doing poorly, demand
decreases so less opium is grown. This argument is supported by opium cultivation falling in 2008 and
2009, stabilizing in 2010 but then increasing thereafter – corresponding with the great recession and the
subsequent recovery in the global economy.
However, closer examination of the data does not indicate such a procyclical pattern. For example,
for the countries estimated to account for almost 70% of the global opium demand (UNODC 2009, 7),
the GDP growth rates are considerably higher for 2010 than 2009 but then lower for 2011 than 2010
and lower for 2012 relative to 2011. The opium cultivation trends are inconsistent with these growth
rates since as stated cultivation stabilized in 2010 and increased in 2011 and 2012.
VI. Conclusion
Given opium in Afghanistan is a menace in funding insurgencies and in fostering drug addiction in
Afghanistan and elsewhere and given previous efforts to reduce cultivation have been ineffective partly
due to disagreement on the cause, this paper attempts to examine the reason(s) asserted in the
literature for opium cultivation in Afghanistan. To do so, my paper is the first to test multiple reasons by
using a regression analysis that employs provincial data. Looking at the years when sufficient data are
available, I look at the change in cultivation from 2010 to 2014 – a period of rapid increase in opium
cultivation which leads to a second consecutive record in opium cultivation.
16

I have several findings. The regressions provide evidence for returning refugees and poverty. In
addition, I find no evidence of the importance of other factors such as insufficient cotton cultivation or
corruption or opium eradication.
One possible policy implication follows from the results. Given that it appears to be the lack of
alternative economic opportunities and given that wheat is grown in significant amounts by most
farmers, the government should consider encouraging greater wheat production to crowd out opium.
The disadvantages of these policies are the financial cost and deadweight loss generated and what to
do with excess wheat. The financial cost and deadweight loss must be weighed against the negative
production and consumption externalities of opium on Afghanistan. To mitigate the cost, estimations
can be made about the number of lives saved to each country in terms of addiction or domestic
insurgency and so donations made to Afghanistan based on the value of a statistical life (VSL) for each
country. Given the approximately 100,000 lives lost each year due to Afghanistan opium, the
insurgencies it is helping to fund and the alternative of spending on the current ineffective opium
reduction strategies, such a strategy would seem highly beneficial. Similar to the use of excess crops
from generous agricultural policies going to needy children in the US, wheat could similarly go to those
without enough food in Afghanistan.
This paper attempts to get at the root cause(s) of opium, but another root cause is also relevant.
Besides the elimination of a major source of insurgent financing, one of the main purposes of opium
removal is preventing the use of the most deadly drug which can destroy a person’s livelihood,
relationships and ultimately claim their life. However, supply reduction alone cannot solve the problem
since people often substitute for another controlled substance - albeit far less deadly – and this
cultivation can move outside of Afghanistan. The presence of evidence-based drug treatment programs
that get at the root causes of the need for such substances that are also accessible to the general
populations must also be part of any solution to reducing the addiction problem.
Appendix: Details about Arable Land
For arable land, several inferences were made. There are several sources available. The UNODC
Afghan opium surveys provide data on land but for specific provinces that are growing opium. There are
also arable land data from the Department of Geodesy and Cartography (DGC) for October 2002 for 25
of the 32 provinces. Arable land also can be obtained from provincial descriptions from USAID.
Given the UNODC estimations were done for most provinces while the estimates from the DGC were
qualified as having been done in haste, I try to employ the UNODC data as much as possible. Given total
arable land has been measured as roughly constant with the only significant change in arable land
17

coming from the southwestern provinces over the past decade according to SIGAR, I used the arable
land measurements for UNODC for previous years when possible. For example, for Balkh province the
earliest year for arable land from the UNODC is 2007. Since it is almost the same from 2007 to 2014, I
use the 2007 observation as the measurement for 2002 to 2006 as well.
For each subsequent year, I would see if the UNODC survey updated the amount of arable land. So, if
data were available for 2007, I would use that but then for 2008 I looked at whether there were any
updates in the UNODC opium surveys to the arable land data for any province and did the same for
2009. As a result, I compiled my dataset for arable land for 2009 which I then used to find the percent of
arable land used for opium, wheat and cotton for 2009.
I sometimes would exclude individual observations from the UNODC surveys if I felt they were likely
inaccurate. For example, I excluded the opium survey data for 2006 for Faryab province as it is stated as
about 144,000 hectares when subsequent surveys for 2007 to 2014 show the arable land as 800,000
hectares. Instead, I inferred the subsequent opium survey as more reliable and employed that number
back up to 2002.
For Nuristan province, there was no observation from the DGC for 2002 and only one observation
from the opium surveys which was in 2007. I found this observation suitable given the amount of
cultivation of crops for that year but found it was too small given the cultivation of crops for 2002-2004
and 2009-2014.
Instead, for Nuristan I employed data by district from Afghanistan Information Management Services
(AIMS) for 2002 and National Area Based Development Program (NABDP) for 2012. I use these data for
the years 2002-2004 and 2014. However, since these sources produced estimates too high for the years
2009-2013, I estimated the arable land by summing the crop cultivation for those years.
I only employ the USAID and DGC data when these were the only data sources available. Accordingly, I
used USAID data for Panjshir province from 2004 to 2014 – 2004 as that was the year the province was
formed. I relied on the 2002 DGC data for 2002 to 2014 for 7 of the 32 provinces – specifically, Bamyan,
Kabul, Logar, Paktia, Parwan, Ghazni and Kunduz provinces.
I believe this method is effective. According to SIGAR, the recent changes in arable land occurred in
the country’s southwest (Helmand and Nimroz provinces) and was an increase of 200,000 hectares for
the past decade.19 From my method, I found the exact same change over the same period for this
region. When summed for the whole country, the totals for arable land are also comparable to those
19 This increase is due to obtaining water from deep well technology.
18

stated in the World Bank and FAO – e.g., for both it is 7.8 million hectares for 2007 while I obtain 7.9
million.
Table A.1: Provincial Data Information
Variable Years Source
Opium Area 2010 UNODC Afghanistan Opium Survey
2013-2014
Arable Land 2002-2014 Wiley 2003; USAID;Afghanistan Information Management Systems;
UNODC Afghanistan Opium Survey;Afghanistan Department of Geodesy and
Cartography; National Area Based Development Program
Security Situation 2006-2007; Asia Foundation Survey of Afghan People
2010; 2014
Paid Bribe (Survey) 2006-2007; Asia Foundation Survey of Afghan People
2010; 2014
Opium Eradication 2006; 2010 UNODC Afghanistan Opium Survey
2014
Wheat Area 2006; 2010 Afghan Statistical Yearbook
2014
Cotton Area 2006; 2010 Afghan Statistical Yearbook
2014
19
Returning Refugees 2002-2014 Afghanistan Statistical Yearbook
Total/Rural Population 2006; 2010 Afghan Statistical Yearbook 2008
2014
Table A.2: Summary Statistics
Standard
Mean MedianMinimu
m MaximumDeviatio
nObservation
sCorruption 2006-2010 7.40 3.59 -35.45 58.26 24.82 32Corruption 2007-2010 3.01 2.39 -46.67 60.77 22.66 34
Cotton Area Percent 2006-2010 -0.03 0.00 -3.36 1.58 0.66 34Opium Area Percent 2010-2013 1.65 0.01 -0.75 18.97 4.10 34Opium Area Percent 2010-2014 1.52 0.01 -3.27 22.09 4.40 34
Opium Area Percent 2010 1.84 0.00 0.00 21.24 4.55 34
Opium Percent Eradicated 2006-2010 -0.28 0.00 -87.97 62.49 23.18 34
Returning Refugee Percent 2002-2010 14.45 9.94 0.44 64.58 13.08 34
Rural Population Percent 2006-2010 -0.36 -0.20 -1.89 0.22 0.50 34
Security Situation 2006-2010 16.54 13.73 -4.43 54.70 16.04 32Security Situation 2007-2010 3.67 6.17 -29.82 40.07 18.03 34
Wheat Area Percent 2004-2009 4.82 5.75 -59.49 60.87 21.62 32
20

Table A.3: Correlations
Opium Eradication Percent Rural PercentCorruption2010-2014
Security Situation2010-2012
Wheat Percentage2010-2014
Cotton Percentage2010-2014
Returning Refugees2002-2014 2010-2014 2010-2014
Corruption 2006-2010 -0.62
Security Situation 2006-2010 -0.42
Wheat Percentage 2006-2010 0.40
Cotton Percentage 2006-2010 0.77
Returning Refugees 2002-2010 0.99
Opium Eradication 2006-2010 -0.72
Rural Percent 2006-2010 0.78
Table A.4: Change in Opium Area as Percent of Arable Land
2010-2014
Opium Area Percent 2010 0.40
(1.55)
Security Situation 2006-2010 -0.05
(-1.19)
Corruption 2006-2010 -0.02
(-0.54)
Wheat Area as Percent 0.02
of Arable Land 2006-2010 (0.51)
Cotton Area as Percent 0.91
of Arable Land 2006-2010 (0.58)
Returning Refugees Percent 0.24***
2002-2010 (4.45)
Opium Percent Eradicated 2006-2010 0.004
(0.16)
Percent of Population Rural 2006-2010 2.91*
(2.07)
21
Observations 30
Adjusted R^2 0.48
Note: z statistics are in parentheses; * denotes 10% significance, ** 5%, *** 1%
Table A.5: Change in Opium Area as Percent of Arable Land
2010-2013
Opium Area Percent 2010 0.32
(1.29)
Security Situation 2006-2010 -0.06
(-1.44)
Corruption 2006-2010 -0.01
(-0.40)
Wheat Area as Percent 0.005
of Arable Land 2006-2010 (0.12)
Cotton Area as Percent 0.53
of Arable Land 2006-2010 (0.35)
Returning Refugees Percent 0.23***
2002-2010 (4.49)
Opium Percent Eradicated 2006-2010 0.007
(0.28)
Percent of Population Rural 2006-2010 3.38**
22

(2.51)
Observations 30
Adjusted R^2 0.47
Table A.6: Change in Opium Area as Percent of Arable Land (Variables for Asia Foundation 2007-2010)
2010-2014
Opium Area Percent 2010 0.24
(1.19)
Security Situation 2007-2010 -0.06
(-1.51)
Corruption 2007-2010 0.01
(0.32)
Wheat Area as Percent 0.003
of Arable Land 2006-2010 (0.09)
Cotton Area as Percent 0.18
of Arable Land 2006-2010 (0.13)
Returning Refugees Percent 0.26***
2002-2010 (5.07)
Opium Percent Eradicated 2006-2010 -0.01
(-0.42)
23

Percent of Population Rural 2006-2010 2.67*
(1.92)
Observations 32
Adjusted R^2 0.46
Note: z statistics are in parentheses; * denotes 10% significance, ** 5%, *** 1%
Table A.7: Change in Opium Area as Percent of Arable Land (Variables for Asia Foundation 2007-2010)
2010-2013
Opium Area Percent 2010 0.39
(1.96)
Security Situation 2007-2010 -0.04
(-1.25)
Corruption 2007-2010 0.005
(0.16)
Wheat Area as Percent 0.01
of Arable Land 2006-2010 (0.44)
Cotton Area as Percent 0.85
of Arable Land 2006-2010 (0.64)
Returning Refugees Percent 0.23***
2002-2010 (4.69)
Opium Percent Eradicated 2006-2010 -0.002
24

(-0.08)
Percent of Population Rural 2006-2010 2.78**
(2.09)
Observations 32
Adjusted R^2 0.43
Sources
Barfield, Thomas. Afghanistan: A Political and Cultural History. Princeton: Princeton University Press, 2010.
Brown, Catherine. 1999. Burma: The Political Economy of Violence. Disasters, 23(3), 234-256.
Brown, David. “The Looming Narco-State In Afghanistan,” The Atlantic, January 2014.
Bove, Vincenzo. 2011. Opium Market Revenue Opportunities and Insurgency in Afghanistan’s Provinces.
Central Statistics Organization, Afghanistan Statistical Yearbook 2009, 2013 and 2014. (Kabul: Central Statistics Organization, 2004).
Chemonics International Inc. 2004. Afghanistan RAMP Rebuilding Agricultural Markets in Afghanistan. (Washington DC: Chemonics International Inc.)
Chouvy, Pierre-Arnaud. 2006. Afghanistan’s Opium Production in Perspective. China and Eurasia Forum Quarterly, 4(1), 21-24.
Chouvy, Pierre-Arnaud. 2008. Licensing Afghanistan’s Opium: Solution or Fallacy? Caucasian Review of International Affairs, 2(2), 1-6.
Chouvy, Pierre-Arnaud. 2009. Uncovering the Politics of the Poppy. (London: The I.B. Taurus and Company Limited).
Constable, Pamela. “Heroin Addiction Spreads with Alarming Speed Across Afghanistan,” The Washington Post, January 11, 2015.
Farrell, Graham and John Thorne. 2005. Where Have all the Flowers Gone? Evaluation of the Taliban Crackdown against Opium Poppy Cultivation in Afghanistan. International Journal of Drug Policy, 16, 81-91.
Ford, R.S. The Economy, in: Richard F. Nyrop and Donald M. Seekins, (Eds.), Afghanistan Country Study. The American University, 1986.
Goodhand, Jonathan. 2005. Frontiers and Wars: A Study of the Opium Economy in Afghanistan. Journal of Agrarian Change, 5(2), 191-216.
25

Jelsma, Martin. 2005. Learning Lessons from the Taliban Opium Ban. International Journal of Drug Policy, 16, 98-103.
Integrity Watch Afghanistan. National Corruption Survey 2010 and 2014. (Afghanistan: Integrity Watch Afghanistan, 2010 and 2014).
Lind, Jo Thori, Karl Ove Moene and Frederik Willumsen. 2013. Opium for the Masses? Conflict-Induced Narcotics Production in Afghanistan. The Review of Economics and Statistics, 96(5), 949-966.
MacDonald, David. Drugs in Afghanistan. London: Pluto Press, 2007.
Mansfield, David. 2001. The Economic Superiority of Illicit Drug Production: Myth and Reality. (International Conference on Alternative Development in Drug Policy and Cooperation).
Mansfield, David. 2004. What is Driving Opium Poppy Cultivation? Decision Making Amongst Opium Poppy Cultivators in Afghanistan in the 2003/4 Growing Season (Kabul: Afghanistan Research and Evaluation Unit).
Mansfield, David. 2013. All Bets are Off! (Kabul: Afghanistan Research and Evaluation Unit).
Scott, Richard. 2014. Poopy Harvest is Here Again: What’s Next with our Failed Counter Narcotics Projects?
Simha, Vijay. “The Afghan Opium News is Bad for India,” Sify.com, January 6, 2015.
United Nations Office on Drugs and Crime. Afghanistan Opium Survey 2007-2014. (Kabul: Ministry of Counternarcotics, 2007-2014).
United Nations Office on Drugs and Crime. 2004. Afghanistan Farmers’ Intentions Survey 2003/2004. (Kabul: Afghan Transition Government, Counter Narcotics Directorate).
United Nations Office on Drugs and Crime. 2008. Is Poverty Driving the Afghan Opium Boom? (Vienna: UNODC).
United Nations Office on Drugs and Crime. 2009. Addiction, Crime and Insurgency: The Transitional Threat of Afghan Opium. (Vienna: UNODC Studies and Threat Analysis Section)
United Nations Office on Drugs and Crime. 2013. Afghanistan Opium Risk Assessment 2013. (Vienna: UNODC).
Wiley, Liz. 2003. Land Rights in Crisis: Restoring Tenure Security in Afghanistan. (Kabul: Afghanistan Research and Evaluation Unit).
United Nations Office on Drugs and Crime. 2014. World Drug Report 2014. (United Nations publication, Sales No. E.14.XI.7).
26

27
Copyright © 2022 FDOKUMEN