Survey of the Afghan People 2014
229
AFGHANISTAN IN 2014 A Survey of the Afghan People House No. 861, Street No. 1, Sub-Street of Shirpour Project, Kabul, Afghanistan www.asiafoundation.org A Survey of the Afghan People AFGHANISTAN IN 2014
-
Upload
georgetown -
Category
Documents
-
view
2 -
download
0
Transcript of Survey of the Afghan People 2014
AFG
HA
NIS
TAN
IN 2014
A Survey of the Afghan People
House No. 861, Street No. 1, Sub-Street of Shirpour Project, Kabul, Afghanistan
www.asiafoundation.org
A Survey of the Afghan PeopleA F G H A N I S TA N I N 2 0 14

AFGHANISTAN IN 2014A Survey of the Afghan People
AFGHANISTAN IN 2014A Survey of the Afghan People
Project Design and DirectionThe Asia Foundation
EditorNancy Hopkins
Report AuthorZach Warren
Assistant AuthorsShahim Ahmad Kabuli, Shamim Sarabi, Sayed Masood Sadat,
Christina Satkowski, Aaron Steppe
FieldworkAfghan Center for Socio-economic and Opinion Research (ACSOR), Kabul
Report Design and PrintingThe Asia Foundation
AINA Afghan Media and Culture Center, Kabul
© 2014, !e Asia Foundation
About !e Asia Foundation!e Asia Foundation is a nonpro"t international development organization committed to improving lives across a dynamic and developing Asia. Informed by six decades of experience and deep local expertise, our programs address critical issues a#ecting Asia in the 21st century – governance and law, economic development, women’s empowerment, environment, and regional cooperation. In addition, our Books for Asia and professional exchange programs are among the ways we encourage Asia’s continued development as a peaceful, just, and thriving region of the world.
Headquartered in San Francisco, !e Asia Foundation works through a network of o$ces in 18 Asian countries and in Washington, DC. Working with public and private partners, the Foundation receives funding from a diverse group of bilateral and multilateral development agencies, foundations, corporations, and individuals.
For more information, visit asiafoundation.org
Afghanistan in 2014
Table of Contents Executive Summary . . . . . . . . . . . . . . . . . . . . . . . . . . . . . . . . . . . . . . . . . . . . . . 5
1 National Mood . . . . . . . . . . . . . . . . . . . . . . . . . . . . . . . . . . . . . . . . . . . . . . 15
1.1 Direction of the Country . . . . . . . . . . . . . . . . . . . . . . . . . . . . . . . . . . . . . . . . . . . . . . . . . . 151.2 Afghanistan’s Biggest Problems: National Level . . . . . . . . . . . . . . . . . . . . . . . . . . . . . . . . . . . . . . . 231.3 Afghanistan's Biggest Problems: Local Level . . . . . . . . . . . . . . . . . . . . . . . . . . . . . . . . . . . . . . . . . 251.4 Biggest Problems Facing Women . . . . . . . . . . . . . . . . . . . . . . . . . . . . . . . . . . . . . . . . . . . . . . 261.5 Self-Reported Happiness . . . . . . . . . . . . . . . . . . . . . . . . . . . . . . . . . . . . . . . . . . . . . . . . . . 28
2 Security . . . . . . . . . . . . . . . . . . . . . . . . . . . . . . . . . . . . . . . . . . . . . . . . . . 31
2.1 Fear for Safety . . . . . . . . . . . . . . . . . . . . . . . . . . . . . . . . . . . . . . . . . . . . . . . . . . . . . . . . 322.2 Crime and Violence . . . . . . . . . . . . . . . . . . . . . . . . . . . . . . . . . . . . . . . . . . . . . . . . . . . . . 362.3 Perceptions of the Afghan National Security Forces . . . . . . . . . . . . . . . . . . . . . . . . . . . . . . . . . . . . . 402.4 Peace and Reconciliation . . . . . . . . . . . . . . . . . . . . . . . . . . . . . . . . . . . . . . . . . . . . . . . . . . 44
3 Economic Growth and Employment . . . . . . . . . . . . . . . . . . . . . . . . . . . . . . . . . . 51
3.1 Perceptions of the Economy . . . . . . . . . . . . . . . . . . . . . . . . . . . . . . . . . . . . . . . . . . . . . . . . . 513.2 Personal Financial Situation . . . . . . . . . . . . . . . . . . . . . . . . . . . . . . . . . . . . . . . . . . . . . . . . . 533.3 !e Economy and Migration . . . . . . . . . . . . . . . . . . . . . . . . . . . . . . . . . . . . . . . . . . . . . . . . 543.4 Employment . . . . . . . . . . . . . . . . . . . . . . . . . . . . . . . . . . . . . . . . . . . . . . . . . . . . . . . . 563.5 Women and the Economy . . . . . . . . . . . . . . . . . . . . . . . . . . . . . . . . . . . . . . . . . . . . . . . . . . 603.6 Household Assets and Wealth . . . . . . . . . . . . . . . . . . . . . . . . . . . . . . . . . . . . . . . . . . . . . . . 613.7 Wealth and Happiness . . . . . . . . . . . . . . . . . . . . . . . . . . . . . . . . . . . . . . . . . . . . . . . . . . . 64
4 Development and Services Delivery . . . . . . . . . . . . . . . . . . . . . . . . . . . . . . . . . . 67
4.1 Development and Migration . . . . . . . . . . . . . . . . . . . . . . . . . . . . . . . . . . . . . . . . . . . . . . . . 674.2 Access to and Satisfaction with Public Goods and Services . . . . . . . . . . . . . . . . . . . . . . . . . . . . . . . . . 684.3 Awareness of Development Programs and Funders . . . . . . . . . . . . . . . . . . . . . . . . . . . . . . . . . . . . . 714.4 Educational Attainment and Opportunities . . . . . . . . . . . . . . . . . . . . . . . . . . . . . . . . . . . . . . . . . 754.5 Access to Health Services . . . . . . . . . . . . . . . . . . . . . . . . . . . . . . . . . . . . . . . . . . . . . . . . . . 784.6 Natural Disasters and Government Response . . . . . . . . . . . . . . . . . . . . . . . . . . . . . . . . . . . . . . . . 80
5 Governance . . . . . . . . . . . . . . . . . . . . . . . . . . . . . . . . . . . . . . . . . . . . . . . 85
5.1 Satisfaction with Government Performance . . . . . . . . . . . . . . . . . . . . . . . . . . . . . . . . . . . . . . . . 855.2 Con"dence in Public Institutions . . . . . . . . . . . . . . . . . . . . . . . . . . . . . . . . . . . . . . . . . . . . . 885.3 Satisfaction with Democracy . . . . . . . . . . . . . . . . . . . . . . . . . . . . . . . . . . . . . . . . . . . . . . . . 905.4 Corruption . . . . . . . . . . . . . . . . . . . . . . . . . . . . . . . . . . . . . . . . . . . . . . . . . . . . . . . . . 915.5 Dispute Resolution and Justice Systems . . . . . . . . . . . . . . . . . . . . . . . . . . . . . . . . . . . . . . . . . . . 96

Afghanistan in 2014
6 Political Participation . . . . . . . . . . . . . . . . . . . . . . . . . . . . . . . . . . . . . . . . . 101
6.1 Exercising Basic Political Freedoms . . . . . . . . . . . . . . . . . . . . . . . . . . . . . . . . . . . . . . . . . . . . . 1016.2 Ability to In#uence Local Government Decisions . . . . . . . . . . . . . . . . . . . . . . . . . . . . . . . . . . . . . 1036.3 Politics and Religion . . . . . . . . . . . . . . . . . . . . . . . . . . . . . . . . . . . . . . . . . . . . . . . . . . . . 1056.4 Electoral Decision-Making . . . . . . . . . . . . . . . . . . . . . . . . . . . . . . . . . . . . . . . . . . . . . . . . . 1076.5 !e 2014 Elections . . . . . . . . . . . . . . . . . . . . . . . . . . . . . . . . . . . . . . . . . . . . . . . . . . . . . 109
7 Access to Information . . . . . . . . . . . . . . . . . . . . . . . . . . . . . . . . . . . . . . . . . 117
7.1 Physical Sources of News and Information . . . . . . . . . . . . . . . . . . . . . . . . . . . . . . . . . . . . . . . . . 1177.2 Television’s Role in Public Opinion and Behavior . . . . . . . . . . . . . . . . . . . . . . . . . . . . . . . . . . . . . . 119
8 Women in Society . . . . . . . . . . . . . . . . . . . . . . . . . . . . . . . . . . . . . . . . . . . 125
8.1 Rights and Justice . . . . . . . . . . . . . . . . . . . . . . . . . . . . . . . . . . . . . . . . . . . . . . . . . . . . . 1268.2 Political Participation . . . . . . . . . . . . . . . . . . . . . . . . . . . . . . . . . . . . . . . . . . . . . . . . . . . . 1298.3 Education . . . . . . . . . . . . . . . . . . . . . . . . . . . . . . . . . . . . . . . . . . . . . . . . . . . . . . . . . 1338.4 Economic Opportunities . . . . . . . . . . . . . . . . . . . . . . . . . . . . . . . . . . . . . . . . . . . . . . . . . . 1368.5 Customs and Cultural Practices . . . . . . . . . . . . . . . . . . . . . . . . . . . . . . . . . . . . . . . . . . . . . . 139
9 Appendix 1: Methodology . . . . . . . . . . . . . . . . . . . . . . . . . . . . . . . . . . . . . . . 147
10 Appendix 2: . . . . . . . . . . . . . . . . . . . . . . . . . . . . . . . . . . . . . . . . . . . . . . 171
10.1 Interview Questionnaire . . . . . . . . . . . . . . . . . . . . . . . . . . . . . . . . . . . . . . . . . . . . . . . . . . 17110.2 Sample Demographics . . . . . . . . . . . . . . . . . . . . . . . . . . . . . . . . . . . . . . . . . . . . . . . . . . . 208
Afghanistan in 2014
Table of Figures1.1 NATIONAL MOOD: DIRECTION OF COUNTRY . . . . . . . . . . . . . . . . . . . . . . . . . . . . . . . . . . . . . . 16
1.2 RIGHT DIRECTION: LONGITUDINAL TRENDS . . . . . . . . . . . . . . . . . . . . . . . . . . . . . . . . . . . . . . 17
1.3 REASONS: RIGHT DIRECTION . . . . . . . . . . . . . . . . . . . . . . . . . . . . . . . . . . . . . . . . . . . . . . . . 18
1.4 REASONS FOR RIGHT DIRECTION: BY REGION . . . . . . . . . . . . . . . . . . . . . . . . . . . . . . . . . . . . . . 19
1.5 RESPONSE PATTERNS: DIRECTION OF THE COUNTRY . . . . . . . . . . . . . . . . . . . . . . . . . . . . . . . . . . 20
1.6 REASONS: RIGHT DIRECTION BY YEAR . . . . . . . . . . . . . . . . . . . . . . . . . . . . . . . . . . . . . . . . . . . 21
1.7 REASONS: WRONG DIRECTION . . . . . . . . . . . . . . . . . . . . . . . . . . . . . . . . . . . . . . . . . . . . . . . 21
1.8 REASONS: WRONG DIRECTION BY YEAR . . . . . . . . . . . . . . . . . . . . . . . . . . . . . . . . . . . . . . . . . . 22
1.9 REASONS: WRONG DIRECTION BY REGION . . . . . . . . . . . . . . . . . . . . . . . . . . . . . . . . . . . . . . . . 23
1.10 BIGGEST PROBLEM: NATIONAL LEVEL. . . . . . . . . . . . . . . . . . . . . . . . . . . . . . . . . . . . . . . . . . . . 24
1.11 BIGGEST PROBLEM: NATIONAL LEVEL BY YEAR . . . . . . . . . . . . . . . . . . . . . . . . . . . . . . . . . . . . . . 24
1.12 BIGGEST PROBLEM: LOCAL LEVEL . . . . . . . . . . . . . . . . . . . . . . . . . . . . . . . . . . . . . . . . . . . . . . 25
1.13 BIGGEST PROBLEM: LOCAL LEVEL BY YEAR . . . . . . . . . . . . . . . . . . . . . . . . . . . . . . . . . . . . . . . . . 26
1.14 BIGGEST PROBLEM FACING WOMEN . . . . . . . . . . . . . . . . . . . . . . . . . . . . . . . . . . . . . . . . . . . . 27
1.15 BIGGEST PROBLEMS FACING WOMEN BY YEAR . . . . . . . . . . . . . . . . . . . . . . . . . . . . . . . . . . . . . . 28
1.16 HAPPINESS: BY SELF - REPORT . . . . . . . . . . . . . . . . . . . . . . . . . . . . . . . . . . . . . . . . . . . . . . . . . 29
2.1 FEAR FOR PERSONAL SAFETY . . . . . . . . . . . . . . . . . . . . . . . . . . . . . . . . . . . . . . . . . . . . . . . . . 32
2.2 FEAR FOR PERSONAL SAFETY BY REGION . . . . . . . . . . . . . . . . . . . . . . . . . . . . . . . . . . . . . . . . . . 33
2.3 LEVEL OF FEAR BY ACTIVITY . . . . . . . . . . . . . . . . . . . . . . . . . . . . . . . . . . . . . . . . . . . . . . . . . 34
2.4 FEAR WHEN ENCOUNTERING ANSF . . . . . . . . . . . . . . . . . . . . . . . . . . . . . . . . . . . . . . . . . . . . . 35
2.5 EXPERIENCE OF CRIME OR VIOLENCE . . . . . . . . . . . . . . . . . . . . . . . . . . . . . . . . . . . . . . . . . . . 37
2.6 CATEGORIES OF VIOLENCE AND CRIME . . . . . . . . . . . . . . . . . . . . . . . . . . . . . . . . . . . . . . . . . . 38
2.7 INSTITUTIONS: REPORTING CRIME . . . . . . . . . . . . . . . . . . . . . . . . . . . . . . . . . . . . . . . . . . . . . 39
2.8 BIGGEST CAUSE OF CRIME. . . . . . . . . . . . . . . . . . . . . . . . . . . . . . . . . . . . . . . . . . . . . . . . . . . 40
2.9 SECURITY FORCES IN AFGHANISTAN . . . . . . . . . . . . . . . . . . . . . . . . . . . . . . . . . . . . . . . . . . . . 41
2.10 PERCEPTIONS OF THE ANP . . . . . . . . . . . . . . . . . . . . . . . . . . . . . . . . . . . . . . . . . . . . . . . . . . 42
2.11 PERCEPTIONS OF THE ANA . . . . . . . . . . . . . . . . . . . . . . . . . . . . . . . . . . . . . . . . . . . . . . . . . . 42
2.12 PERCEPTIONS OF ANSF BY PROVINCE . . . . . . . . . . . . . . . . . . . . . . . . . . . . . . . . . . . . . . . . . . . . 43
2.13 CAN RECONCILIATION EFFORTS HELP STABILIZE THE COUNTRY? . . . . . . . . . . . . . . . . . . . . . . . . . . 45
2.14 SYMPATHY FOR ARMED OPPOSITION GROUPS . . . . . . . . . . . . . . . . . . . . . . . . . . . . . . . . . . . . . . 46
2.15 SYMPATHY FOR ARMED OPPOSITION GROUPS . . . . . . . . . . . . . . . . . . . . . . . . . . . . . . . . . . . . . . 46
2.16 MAIN REASON THAT ARMED OPPOSITION GROUPS ARE FIGHTING . . . . . . . . . . . . . . . . . . . . . . . . . 47
Afghanistan in 2014
3.1 NATIONAL MOOD: ECONOMIC REASONS . . . . . . . . . . . . . . . . . . . . . . . . . . . . . . . . . . . . . . . . . 52
3.2 OVERALL, FOR YOU AND YOUR FAMILY, WHICH PERIOD WAS BETTER FOR YOU ECONOMICALLY? . . . . . . 54
3.3 REASONS FOR LEAVING AFGHANISTAN OR HOME PROVINCE SINCE 1992 . . . . . . . . . . . . . . . . . . . . . . 55
3.4 SELF-REPORTED UNEMPLOYMENT . . . . . . . . . . . . . . . . . . . . . . . . . . . . . . . . . . . . . . . . . . . . . . 57
3.5 LAND OWNERSHIP AMONG FARMERS . . . . . . . . . . . . . . . . . . . . . . . . . . . . . . . . . . . . . . . . . . . . 58
3.6 EMPLOYMENT BY AGE GROUP: MEN . . . . . . . . . . . . . . . . . . . . . . . . . . . . . . . . . . . . . . . . . . . . . 59
3.7 EMPLOYMENT BY AGE GROUP: WOMEN . . . . . . . . . . . . . . . . . . . . . . . . . . . . . . . . . . . . . . . . . . . 59
3.8 HOUSEHOLDS WHERE WOMEN CONTRIBUTE TO INCOME . . . . . . . . . . . . . . . . . . . . . . . . . . . . . . . 61
3.9 ASSET OWNERSHIP . . . . . . . . . . . . . . . . . . . . . . . . . . . . . . . . . . . . . . . . . . . . . . . . . . . . . . . . 62
3.10 AVERAGE INCOME BY HIGHEST EDUCATION LEVEL ACHIEVED . . . . . . . . . . . . . . . . . . . . . . . . . . . . 63
3.11 AVERAGE MONTHLY INCOME . . . . . . . . . . . . . . . . . . . . . . . . . . . . . . . . . . . . . . . . . . . . . . . . 64
3.12 RELATIONSHIP BETWEEN INCOME AND HAPPINESS . . . . . . . . . . . . . . . . . . . . . . . . . . . . . . . . . . . 65
4.1 FREQUENCY OF ACCESS TO PUBLIC GOODS AND SERVICES . . . . . . . . . . . . . . . . . . . . . . . . . . . . . . 69
4.2 SATISFACTION WITH ELECTRICITY SUPPLY . . . . . . . . . . . . . . . . . . . . . . . . . . . . . . . . . . . . . . . . 70
4.3 SATISFACTION WITH BASIC SERVICES . . . . . . . . . . . . . . . . . . . . . . . . . . . . . . . . . . . . . . . . . . . . 71
4.4 AWARENESS OF RECENT DEVELOPMENT PROJECTS BY REGION . . . . . . . . . . . . . . . . . . . . . . . . . . . . 72
4.5 AWARENESS OF RECENT DEVELOPMENT PROJECTS . . . . . . . . . . . . . . . . . . . . . . . . . . . . . . . . . . . 73
4.6 RECOGNITION OF DEVELOPMENT PROJECT FUNDERS . . . . . . . . . . . . . . . . . . . . . . . . . . . . . . . . . 74
4.7 RECOGNITION OF DEVELOPMENT FUNDERS: 2013 VS. 2014 . . . . . . . . . . . . . . . . . . . . . . . . . . . . . . 75
4.8 HIGHEST EDUCATION LEVEL . . . . . . . . . . . . . . . . . . . . . . . . . . . . . . . . . . . . . . . . . . . . . . . . . 76
4.9 TYPE OF EDUCATION RECEIVED . . . . . . . . . . . . . . . . . . . . . . . . . . . . . . . . . . . . . . . . . . . . . . . 77
4.10 AFGHANS WITH FORMAL EDUCATION (OF ANY LEVEL) . . . . . . . . . . . . . . . . . . . . . . . . . . . . . . . . . 78
4.11 SATISFACTION WITH CLINICS AND HOSPITALS BY PROXIMITY. . . . . . . . . . . . . . . . . . . . . . . . . . . . . 79
4.12 TIME NEEDED TO REACH HOSPITAL VIA DIFFERENT MODES OF TRANSPORT . . . . . . . . . . . . . . . . . . . 79
4.13 HAS YOUR VILLAGE EXPERIENCED FLOODING IN THE PAST 12 MONTHS? . . . . . . . . . . . . . . . . . . . . . 81
4.14 SATISFACTION WITH GOVERNMENT RESPONSE TO DISASTER . . . . . . . . . . . . . . . . . . . . . . . . . . . . . 81
4.15 SATISFACTION WITH GOVERNMENT RESPONSE: SOMEWHAT OR VERY SATISFIED . . . . . . . . . . . . . . . . 82
5.1 SATISFACTION WITH GOVERNMENT . . . . . . . . . . . . . . . . . . . . . . . . . . . . . . . . . . . . . . . . . . . . 86
5.2 PERCEPTION OF PROVINCIAL GOVERNMENT PERFORMANCE . . . . . . . . . . . . . . . . . . . . . . . . . . . . . 88
5.3 CONFIDENCE IN OFFICIALS, INSTITUTIONS, AND ORGANIZATIONS . . . . . . . . . . . . . . . . . . . . . . . . . 89
5.4 SATISFACTION WITH DEMOCRACY . . . . . . . . . . . . . . . . . . . . . . . . . . . . . . . . . . . . . . . . . . . . . . 90
5.5 CORRUPTION IN DAILY LIFE: MAJOR PROBLEM . . . . . . . . . . . . . . . . . . . . . . . . . . . . . . . . . . . . . . 92
5.6 PERCEPTION OF CORRUPTION . . . . . . . . . . . . . . . . . . . . . . . . . . . . . . . . . . . . . . . . . . . . . . . . 92

Afghanistan in 2014
5.7 IS CORRUPTION A PROBLEM IN YOUR DAILY LIFE? . . . . . . . . . . . . . . . . . . . . . . . . . . . . . . . . . . . . 93
5.8 CORRUPTION IN DAILY LIFE: MAJOR PROBLEM BY REGION . . . . . . . . . . . . . . . . . . . . . . . . . . . . . . . 94
5.9 EXPOSURE TO CORRUPTION . . . . . . . . . . . . . . . . . . . . . . . . . . . . . . . . . . . . . . . . . . . . . . . . . . 95
5.10 TYPE OF DISPUTES . . . . . . . . . . . . . . . . . . . . . . . . . . . . . . . . . . . . . . . . . . . . . . . . . . . . . . . 97
5.11 PERCEPTIONS OF DISPUTE RESOLUTION INSTITUTIONS . . . . . . . . . . . . . . . . . . . . . . . . . . . . . . . . 98
6.1 FEAR WHILE VOTING . . . . . . . . . . . . . . . . . . . . . . . . . . . . . . . . . . . . . . . . . . . . . . . . . . . . . 102
6.2 FEAR WHILE PARTICIPATING IN POLITICAL ACTIVITIES . . . . . . . . . . . . . . . . . . . . . . . . . . . . . . . . 103
6.3 ABILITY TO INFLUENCE LOCAL GOVERNMENT DECISIONS . . . . . . . . . . . . . . . . . . . . . . . . . . . . . . 104
6.4 ABILITY TO INFLUENCE GOVERNMENT DECISIONS . . . . . . . . . . . . . . . . . . . . . . . . . . . . . . . . . . 104
6.5 AFGHANS’ PERCEPTIONS OF ABILITY TO INFLUENCE GOVERNMENT DECISIONS . . . . . . . . . . . . . . . . 105
6.6 SHOULD POLITICS AND RELIGION MIX? . . . . . . . . . . . . . . . . . . . . . . . . . . . . . . . . . . . . . . . . . . 106
6.7 OPINION ON MIXING POLITICS AND RELIGION . . . . . . . . . . . . . . . . . . . . . . . . . . . . . . . . . . . . . 106
6.8 WOMEN’S INDEPENDENCE IN VOTING . . . . . . . . . . . . . . . . . . . . . . . . . . . . . . . . . . . . . . . . . . 108
6.9 SOURCE OF INFORMATION ON ELECTIONS . . . . . . . . . . . . . . . . . . . . . . . . . . . . . . . . . . . . . . . 109
6.10 PROFILE OF SUPPORTERS FOR EACH CANDIDATE IN SECOND ROUND . . . . . . . . . . . . . . . . . . . . . . 110
6.11 WAS THE RECENT ELECTION FREE AND FAIR? . . . . . . . . . . . . . . . . . . . . . . . . . . . . . . . . . . . . . . 112
6.12 REASON THE ELECTION WAS NOT FREE AND FAIR . . . . . . . . . . . . . . . . . . . . . . . . . . . . . . . . . . . 113
6.13 CONFIDENCE IN THE INDEPENDENT ELECTIONS COMMISSION . . . . . . . . . . . . . . . . . . . . . . . . . . 114
7.1 TV OWNERSHIP IN AFGHANISTAN . . . . . . . . . . . . . . . . . . . . . . . . . . . . . . . . . . . . . . . . . . . . . 118
7.2 SOURCE FOR NEWS/INFORMATION . . . . . . . . . . . . . . . . . . . . . . . . . . . . . . . . . . . . . . . . . . . . 119
7.3 RELATIONSHIP BETWEEN PARTICIPATION IN SPORTS AND TV USE . . . . . . . . . . . . . . . . . . . . . . . . . 120
7.4 SHOULD WOMEN HAVE EQUAL ACCESS TO UNIVERSITY EDUCATION AS MEN? (STRONGLY AGREE) . . . . . 121
7.5 VIEWS ON HOW WOMEN SHOULD DRESS IN PUBLIC BY TV OWNERSHIP . . . . . . . . . . . . . . . . . . . . . 122
8.1 COURTS TREAT MEN AND WOMEN EQUALLY: AGREE . . . . . . . . . . . . . . . . . . . . . . . . . . . . . . . . . . 128
8.2 SHOULD THERE BE LOCAL WOMEN’S JIRGAS AND SHURAS? . . . . . . . . . . . . . . . . . . . . . . . . . . . . . 129
8.3 WOMEN’S INDEPENDENCE IN VOTING . . . . . . . . . . . . . . . . . . . . . . . . . . . . . . . . . . . . . . . . . . 130
8.4 REASONS FOR NOT VOTING IN THE FIRST ROUND OF PRESIDENTIAL ELECTIONS 2014 . . . . . . . . . . . . . 131
8.5 POLITICAL PARTICIPATION . . . . . . . . . . . . . . . . . . . . . . . . . . . . . . . . . . . . . . . . . . . . . . . . . 131
8.6 INFLUENCE OVER LOCAL (DISTRICT/PROVINCIAL) GOVERNMENT DECISIONS . . . . . . . . . . . . . . . . . 132
8.7 WILL THE 2014 PRESIDENTIAL ELECTIONS MAKE LIFE BETTER? . . . . . . . . . . . . . . . . . . . . . . . . . . . 132
8.8 SUPPORT FOR GENDER EQUALITY IN EDUCATION . . . . . . . . . . . . . . . . . . . . . . . . . . . . . . . . . . . 133
8.9 SUPPORT FOR WOMEN’S ACCESS TO UNIVERSITY EDUCATION IN HOME PROVINCE . . . . . . . . . . . . . . 134

Afghanistan in 2014
8.10 EDUCATIONAL ATTAINMENT . . . . . . . . . . . . . . . . . . . . . . . . . . . . . . . . . . . . . . . . . . . . . . . . 135
8.11 FORMAL SCHOOLING (AGE 18-25) . . . . . . . . . . . . . . . . . . . . . . . . . . . . . . . . . . . . . . . . . . . . . 135
8.12 HOUSEHOLDS WHERE WOMEN CONTRIBUTE TO INCOME . . . . . . . . . . . . . . . . . . . . . . . . . . . . . 136
8.13 VIEWS ON WOMEN WORKING OUTSIDE THE HOME . . . . . . . . . . . . . . . . . . . . . . . . . . . . . . . . . . 137
8.14 IS IT ACCEPTABLE FOR WOMEN TO WORK IN THE FOLLOWING PLACES? . . . . . . . . . . . . . . . . . . . . . 138
8.15 SUPPORT FOR WOMEN’S EMPLOYMENT IN THE ARMY/POLICE . . . . . . . . . . . . . . . . . . . . . . . . . . . 139
8.16 OPINIONS ON THE PRACTICE OF BADDAL . . . . . . . . . . . . . . . . . . . . . . . . . . . . . . . . . . . . . . . . 140
8.17 VIEWS OF APPROPRIATE DRESS FOR WOMEN IN PUBLIC . . . . . . . . . . . . . . . . . . . . . . . . . . . . . . . 141
8.18 VIEWS OF APPROPRIATE DRESS FOR WOMEN IN PUBLIC . . . . . . . . . . . . . . . . . . . . . . . . . . . . . . . 142
8.19 BEST AGE FOR A WOMAN TO GET MARRIED . . . . . . . . . . . . . . . . . . . . . . . . . . . . . . . . . . . . . . . 143
Afghanistan in 2014 1
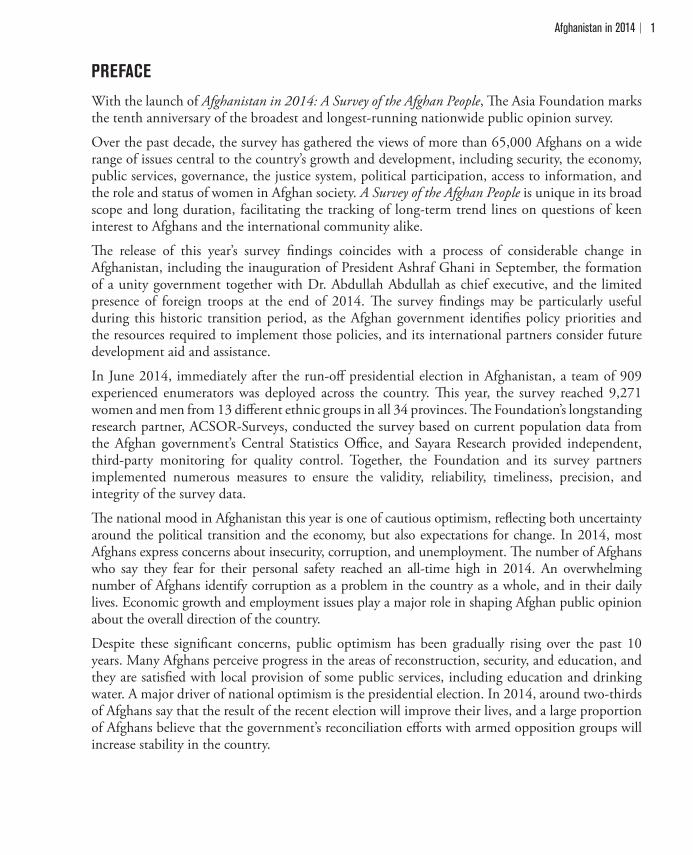
PREFACEWith the launch of Afghanistan in 2014: A Survey of the Afghan People, !e Asia Foundation marks the tenth anniversary of the broadest and longest-running nationwide public opinion survey. Over the past decade, the survey has gathered the views of more than 65,000 Afghans on a wide range of issues central to the country’s growth and development, including security, the economy, public services, governance, the justice system, political participation, access to information, and the role and status of women in Afghan society. A Survey of the Afghan People is unique in its broad scope and long duration, facilitating the tracking of long-term trend lines on questions of keen interest to Afghans and the international community alike. !e release of this year’s survey "ndings coincides with a process of considerable change in Afghanistan, including the inauguration of President Ashraf Ghani in September, the formation of a unity government together with Dr. Abdullah Abdullah as chief executive, and the limited presence of foreign troops at the end of 2014. !e survey "ndings may be particularly useful during this historic transition period, as the Afghan government identi"es policy priorities and the resources required to implement those policies, and its international partners consider future development aid and assistance.In June 2014, immediately after the run-o# presidential election in Afghanistan, a team of 909 experienced enumerators was deployed across the country. !is year, the survey reached 9,271 women and men from 13 di#erent ethnic groups in all 34 provinces. !e Foundation’s longstanding research partner, ACSOR-Surveys, conducted the survey based on current population data from the Afghan government’s Central Statistics O$ce, and Sayara Research provided independent, third-party monitoring for quality control. Together, the Foundation and its survey partners implemented numerous measures to ensure the validity, reliability, timeliness, precision, and integrity of the survey data. !e national mood in Afghanistan this year is one of cautious optimism, re%ecting both uncertainty around the political transition and the economy, but also expectations for change. In 2014, most Afghans express concerns about insecurity, corruption, and unemployment. !e number of Afghans who say they fear for their personal safety reached an all-time high in 2014. An overwhelming number of Afghans identify corruption as a problem in the country as a whole, and in their daily lives. Economic growth and employment issues play a major role in shaping Afghan public opinion about the overall direction of the country. Despite these signi"cant concerns, public optimism has been gradually rising over the past 10 years. Many Afghans perceive progress in the areas of reconstruction, security, and education, and they are satis"ed with local provision of some public services, including education and drinking water. A major driver of national optimism is the presidential election. In 2014, around two-thirds of Afghans say that the result of the recent election will improve their lives, and a large proportion of Afghans believe that the government’s reconciliation e#orts with armed opposition groups will increase stability in the country.
Afghanistan in 20142
Across the Asia-Paci"c region, and in nearly all of the 18 countries in which we program, !e Asia Foundation conducts research and perception surveys to help contribute to an active public discourse. Many of these surveys have been conducted in fragile, con%ict-a#ected states and regions where reliable o$cial statistics are often missing. A Survey of the Afghan People is a core component of the Foundation’s work in Afghanistan, providing timely data and analysis to support Afghan government and citizens’ e#orts in building a stable, prosperous society. It is the Foundation’s hope that this year’s survey "ndings will continue to be useful to a wide range of stakeholders working toward that shared vision.
David D. Arnold President, !e Asia Foundation October 2014

Afghanistan in 2014 3
ACKNOWLEDGEMENTS!e Survey of the Afghan People is a major project of the Foundation each year, requiring coordination of multiple inputs and of numerous Asia Foundation sta# and Foundation partners. !e survey report was produced under the overall guidance of Afghanistan Acting Country Representative Abdullah Ahmadzai and Deputy Country Representative Judge Najla Ayubi, and led by Zach Warren, the Director of Surveys and Research, working with the survey team, Shahim Ahmad Kabuli, Shamim Sarabi, Sayed Masood Sadat, and Maryam Sherzai.
ACSOR-Surveys worked closely with the Foundation in planning, conducting, or monitoring all survey "eldwork, and the Foundation is grateful for their cooperation in ensuring that best practices were followed in a challenging "eldwork environment. Sayara Research, Inc., provided excellent monitoring support for all "eldwork and enumerator trainings in real time. Additional thanks is due to Eureka for providing qualitative research support for key questions.
!e Asia Foundation thanks the Australian Government Department of Foreign A#airs and Trade (DFAT), the United Kingdom Foreign and Commonwealth O$ce/Department for International Development (FCO/DFID), and the United States Agency for International Development (USAID) for their support to this survey and also for supporting Afghan capacity development in research methods and data analysis.

Afghanistan in 20144

Executive Summary 5
EXECUTIVE SUMMARYAfghanistan in 2014: A Survey of the Afghan People is !e Asia Foundation’s tenth annual public opinion survey in Afghanistan. The longest-running and broadest nationwide survey of Afghan at-titudes and opinions, the survey has gathered the views of 65,558 Afghans on a wide range of issues central to the country’s growth and development since 2004. !e survey series is unique in its broad scope and long duration, tracking long-term trend lines on questions of keen interest to Afghans and the international com-munity alike.
!e national mood in Afghanistan this year is one of cautious optimism, re%ecting citizens’ hopes and fears across the country. In 2014, a large proportion of the Afghan public remains most concerned about insecu-rity, corruption, and unemployment. !is year’s survey polled 9,271 Afghan citizens, including 50.1% male and 49.9% female respondents, from 14 ethnic groups across all 34 provinces in the country.
In-person surveys were conducted between June 22 and July 8, 2014, following the June presidential run-o# election in Afghanistan. !ese surveys were conducted by a team of 909 experienced Afghan interviewers (474 male and 435 female),who were deployed across the country. Survey results are weighted to be nation-ally representative using the 2013-2014 Afghan Central Statistics O$ce’s (CSO) population estimates for provincial, as well as urban and rural, population distributions. !is year, the margin of error is +/-1.5% at the 95% con"dence level with a p=.05 and a design e#ect of 2.17 for the probability sample.
!e Foundation’s longstanding research partner, ACSOR-Surveys, conducted the survey based on current population data from the Afghan government’s Central Statistics O$ce, and Sayara Research provided inde-pendent, third-party monitoring for quality control. Eureka Research provided a qualitative research com-ponent (a new feature this year) based on using 125 in-depth interviews in "ve provinces. Together, the Foundation and its survey partners implement quality control processes for the survey guided by principles of validity, reliability, timeliness, and integrity.
!is year’s Survey of the Afghan People includes some new questions about such issues as the 2014 election, migration, women’s rights, access to health services, and disaster response. !e Foundation has built on its e#orts to report statistical analysis alongside the survey "ndings, highlighting for the reader the ways in which factors like gender, geography, ethnicity, and education may shape Afghan perspectives and opinions on certain issues. An in-depth discussion of the survey methodology is provided in Appendix 1 of this report.
National mood
x� Direction of the country. In 2014 54.7% of Afghans say their country is moving in the right direction, down from 57.2% in 2013, while 40.4% say it is moving in the wrong direction, up from 37.9% in 2013. Despite yearly %uctuations, the long-term trend since 2006 shows an increase in the perception that the country is moving in the right direction. Overall optimism in 2014 is highest in the East, South East and South West regions. Since 2013, the percentage of Afghans in the East and West regions who say the country is going in the right direction has increased. !e largest decreases over the past year in the percentage of people who say the country is going in the right direction are found in the Central/Hazarajat and South West regions.
Afghanistan in 20146
x� Reasons for optimism. When asked why the country might be moving in the right direction, Afghans point to reconstruction (36.4%), good security (32.8%), an improved education system (15.1%), the active presence of the Afghan National Army (ANA) and Afghan National Police (ANP) (10.2%), economic revival (8.7%), and democracy/elections (8.7%). Since 2006, good security and reconstruction have been consistently identi"ed as the main reasons for optimism, concentrated in safer regions. Democracy/elections has been increasingly cited as a reason for optimism, exceeding levels reported in 2010 in the wake of the 2009 presidential elections.
x� Reasons for pessimism. !e main reasons why Afghans say the country is moving in the wrong direction include insecurity (38.3%), corruption (in general, and administrative corruption in particular) (24.2%), unemployment (22.6%), a bad economy (10.2%), and election fraud (9.4%). Since 2007 insecurity has been the most frequently cited reason for pessimism, and the proportion of people citing insecurity rose sharply from 2013 to 2014. !e proportion of Afghans citing unemployment is at its highest point since 2006.
x� Afghanistan’s biggest problems: national level. Unemployment (33.1%) is the most frequently cited local problem, followed by the electricity supply (22.5%), roads (17.5%), the availability of drinking water (16.4%), insecurity (14.1%), education (11.8%), and healthcare (11.2%). While this list of issues has remained fairly constant over the years, the biggest increase this year is in the number of people who say insecurity is the biggest problem (34.0% in 2014 compared to 29.8% in 2013). Insecurity is cited most often in the West region (42.0%) and least often in the North East region (24.5%).
x� Afghanistan’s biggest problems: local level. Unemployment (33.1%) is the most frequently cited local problem, “insecurity (14.1%)” after drinking water (16.4%) in the list electricity supply (22.5%), roads (17.5%), the availability of drinking water (16.4%), healthcare (11.2%), and education (11.8%). While this list and its order has not changed signi"cantly over the last eight years, the percentage of Afghans citing unemployment has risen from 26.0% in 2009 to 33.1% in 2014. Unemployment is the most common local problem in all regions except the East, where lack of electricity (34.3%) is reported as the most common local problem.
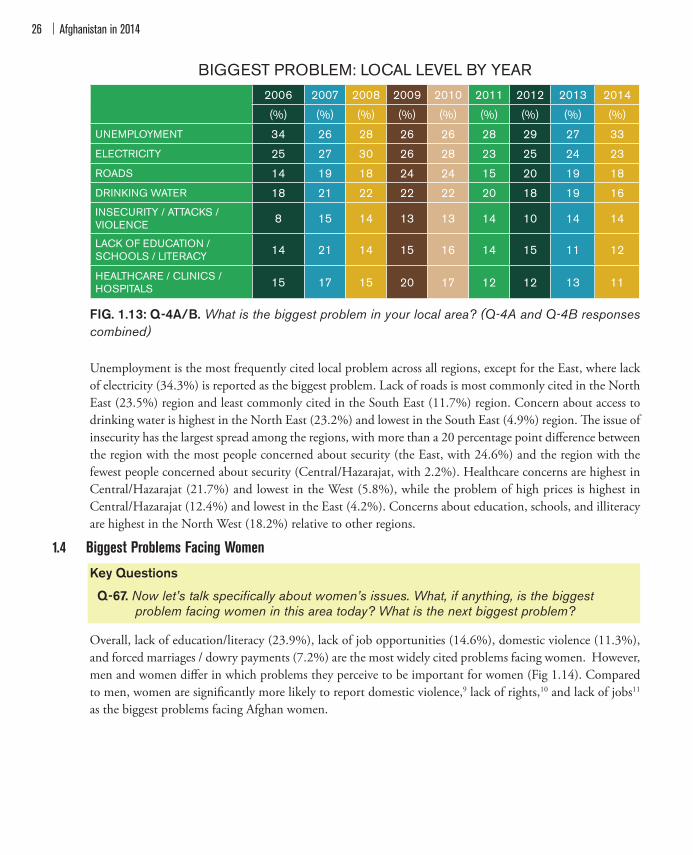
x� Biggest problems facing women. Afghans identify education and illiteracy (23.9%), a lack of job opportunities (14.6 %), domestic violence (11.3 %), forced marriages and dowry payments (7.2%), and lack of rights (6.2%) as the biggest problems facing Afghan women today. Compared to men, women are signi"cantly more likely to report domestic violence, lack of rights, and lack of jobs as the biggest problems facing Afghan women.
x� Self-reported happiness. Overall, 78.6% of Afghans say they are somewhat or very happy, including 81.2% of men and 75.6% of women.
Executive Summary 7
Security
x� In 2014 a majority of Afghans (65.4%) report always, often, or sometimes fearing for their safety or security or that of their family. Fear for safety has increased since 2013 (59.0%), and since 2006 fear for safety has been on an overall upward trend. !e provinces reporting the highest levels of fear for personal safety are Faryab (92.1%), Wardak (89.2%), Farah (87.5%), and Kunduz (87.5%). !e provinces most likely to report never or rarely experiencing fear are Panjshir (98.5%), Badakhshan (81.7), and Bamyan (74.9%). Around three quarters of Afghans say they would be afraid when traveling within Afghanistan (76.4%). A clear majority would be afraid to participate in a peaceful demonstration (69.4%), run for public o$ce (70.8%), and encounter international forces (76.6%).
x� Afghans who say they have experienced violence or crime this year (15.6% of all respondents) are signi"cantly more likely to report feeling fear for their personal safety than those who have not. !e percentage of Afghans who report su#ering violence or crime is highest in Logar (39.0%), Ghor (37.5%), and Helmand (37.0%) provinces. Provinces with the fewest reports of experience with violence or crime are Panjshir (1.5%), Badakhshan (2.3%), and Bamyan (1.0%).
x� A majority of people who experienced violence or crime say they reported it (69.0%), and overall, a majority of Afghans (58.9%) say that if they were to experience a crime and reported it, they have some or a lot of con"dence that the guilty party would be punished. !is is a higher level of con"dence than was reported in 2013 (45.8%) but the level of con"dence has varied widely over the past "ve years. !e percentage of Afghans who agree that the ANP are e$cient at arresting those who have committed crimes has increased in recent years, from 70% in 2010 to 82.1% in 2014.
x� When asked which forces are most responsible for providing security in their area, 50.4% of Afghans cite the ANP, 24.2% cite the ANA, and 21.7% cite the Afghan Local Police (ALP). Afghans in urban areas are more likely to say the ANP, and Afghans in rural areas are more likely to credit the ANA and ALP.
x� Using a composite measure of overall con"dence, 86.5% of Afghans are con"dent in the ANA, and 73.2% are con"dent in the ANP. Overall perceptions of the ANA and ANP have improved over time, and more so for the ANA than the ANP. However, 55.7% of Afghans still say they think that the Afghan National Security Forces (of which the ANA and ANP are a part) need foreign support to do their job properly.
x� Nearly three-quarters of Afghans (72.6%) say that the reconciliation e#orts between the Afghan government and armed opposition groups (AOGs) can help stabilize the country. Con"dence in reconciliation e#orts is lowest in Panjshir (22.3%), Daikundi (48.0%), Balkh (56.4%), and Wardak (58.3%) provinces. Con"dence is highest in Jawjzan (92.8%), Badghis (89.1%), and Nangarhar (87.4%). A higher percentage of men (76.8%) than women (68.7%) believe reconciliation e#orts can be e#ective in stabilizing the country.
Afghanistan in 20148
x� Approximately one in three (32.0%) Afghans say they have a lot (6.6%) or a little (25.4%) sympathy with AOGs. Afghans in the East, South East, and South West regions have the highest concentration of sympathy for AOGs. A higher percentage of men (34.8%) express some level of sympathy with AOGs than women (29.5%). Residents of rural areas sympathize with AOGs at a higher rate (35.0%) than residents of urban areas (22.4%). Men from highly insecure areas who were polled using targeted intercept interviews report signi"cantly higher levels of sympathy: 14.7% say they have a lot of sympathy, and 35.4% say they have some sympathy for AOGs.
Economic growth and employment
x� More than one-third (39.6%) of Afghans say that their economic situation was better last year than this year, while 36.9% say it has not changed since last year. !e percentage of Afghans who say their economic situation has improved over the past year is 21.5%.
x� For the "rst time, this year the survey looked at the issue of migration. Nearly one quarter (22.3%) of Afghans say that they left Afghanistan at some point over the past 23 years (i.e., since the fall of the Najibullah government), while 14.5% say they moved from one province to another. While war and insecurity were the most commonly cited reasons for leaving the country or province, economic reasons are also salient. Among those who left the country, 27.0% say they did so due to the economy or lack of jobs, and among those who moved from one province to another, an even higher proportion (38.8%) moved for economic or employment reasons.
x� With regard to the self-reported unemployment rate, the percentage of Afghans who say they are unemployed and currently looking for work increased signi"cantly from 6.6% in 2013 to 10.7% in 2014. Men’s self-reported unemployment has dropped from a high of 25.5% in 2009 to 10.0% in in 2014, while women’s self-reported unemployment has increased from a low of 0.1% in 2009 to a high of 11.3% in 2014. Because the percentage of women who say they are working remains steady, this increase in self-reported unemployment likely does not represent an increase in women’s joblessness, but rather an increase in interest among women to join the workforce.
x� Over time, the percentage of Afghans who say that female members of their family contribute to household income has increased from 13.9% in 2009 to 22.4% in 2014. !e percentage of households with women contributing to household income varies widely between provinces, from a low of 1.1% in Khost to a high of 63.7% in Nooristan.
x� Average monthly reported income is $190 USD (10,839 Afghanis) with Afghans in rural areas reporting a signi"cantly lower household income of $170 USD per month (9,701 Afghanis) than Afghans in urban households ($261 USD per month, or 14,903 Afghanis).
x� Income shows a signi"cant positive correlation with self-reported happiness; Afghans with higher incomes report higher levels of happiness. However, beyond a threshold of $700 USD (40,000 Afghanis) per month, the relationship is no longer signi"cant.
Executive Summary 9
Development and service delivery
x� !e survey asked respondents to evaluate their level of access to various public goods and services in their area. Over half of Afghans report having good access (often or always) to education for children (70.8%), clean drinking water (69.4%), and roads (50.7%). Fewer than half report having good access to clinics and hospitals (44.4%), medicine (43.4%), water for irrigation (40.1%), and electricity (36.8%).
x� When asked about their level of satisfaction with the quality of various goods and services in their area, satisfaction with the availability of education for children and clean drinking water are highest (74.3% and 72.9%, respectively), and electricity supply is lowest (37.9%). Satisfaction with the electricity supply declined from 2013 (40.5%) to 2014 (37.9%). Over time, satisfaction with the availability of clean drinking water has shown the greatest gains, compared to satisfaction with other services.
x� !is year, 64.1% of Afghans say they are aware of some kind of development project in their area, and the two most frequently cited projects are reconstruction or building of roads and bridges (36.1%) and drinking water projects (25.6%). Afghans in the Central/Hazarajat region are least likely to know of any recent development projects in their area (43.8%), while those in the South West region are most likely to know of such projects (70.5%).
x� In 2014, the top "ve most recognized development project funders were the United States, the Afghan government/ministries, Japan, India, and Germany. Recognition of the Afghan government as a funder of local development projects rose 12 percentage points from 2013 to 2014, perhaps due to overall decreasing international aid for Afghanistan and an increase in on-budget funding (development assistance channeled through the host country’s core budget) to the Afghan government by the international community. However, overall the highest percentage of respondents (40.7%) say they do not know who has funded development projects in their area.
x� Over half (59.1%) of respondents say they have never attended school. !e rate is higher among rural Afghans (65.1%) than urban Afghans (40.5%), and higher among women (74.2%) than men (42.1%). Among all regions, Central/Hazarajat has the highest rate of respondents with no formal education (74.9%), while Central/Kabul has the fewest respondents with no formal education (42.2%). Overall, 42.0% of Afghans report having received some Islamic madrasa education.
x� Regarding proximity to essential health services, more than half of Afghans (57.3%) say they live within 30 minutes of a clinic or hospital, while 6.8% say they either do not have a clinic or hospital in their area or live more than three hours traveling distance from it. Respondents were also asked about their method of transportation to the nearest clinic or hospital. Around half (48.7%) say they walk, while 26.4% say they would travel by car or truck, and 13.5% by motorcycle. Provinces with the longest average commute times are Daikundi (119 minutes), Nooristan (102 minutes), and Ghor (87 minutes).
Afghanistan in 201410
x� Afghans were asked if they had experienced %ooding, landslides, earthquakes, or avalanches in the last year in their village, then asked to evaluate the government’s response to those events. !e most frequently reported type of natural disaster was %ooding (26.7%), followed by earthquakes (7.2%), landslides or soil erosion (3.9%), and avalanches (3.7%). !e percentage of those who are either somewhat or very satis"ed with the government’s response ranged from 41-46%, but encouragingly, was higher in the provinces most a#ected by these types of events.
Governance
x� Each year, the survey explores Afghan perceptions of how well the various levels of government are carrying out their responsibilities. !is year, 75.3% of Afghans say the national government does a somewhat good or very good job. Around two-thirds say provincial government is doing a good job (67.6%), followed by municipal authorities (58.5%) and district government (56.7%). Views in 2014 are quite similar to 2013.
x� Around one-quarter of Afghans say they asked their provincial governor (25.8%) or member of parliament (MP) (25.0%) for help in resolving a problem a#ecting them over the past in the past two years.
x� Among the 22.0% of Afghans who contacted their provincial council member for assistance within the past two years, 72.3% were satis"ed (either somewhat or very) with the result. Importantly, men and women’s satisfaction with the outcome is not signi"cantly di#erent. Ratings of provincial government performance in the North West, South West, and North East regions have declined since 2013, ratings in the East and Central/Kabul regions have improved, and ratings in the South East, West, and Central/Hazarajat regions are not signi"cantly di#erent compared to 2013.
x� When asked about the degree of con"dence they have in a wide range of institutions, for the second consecutive year, the highest percentage of Afghans express con"dence in the media (72.7%). Prior to 2013, the highest percentage of Afghans expressed con"dence in religious leaders (70.0% in 2014). Afghans are least con"dent (47.3%) in government ministries.
x� When asked if they are satis"ed with the way democracy works in Afghanistan, 73.1% say they feel somewhat satis"ed or very satis"ed in 2014, while 25.9% say they are somewhat or very dissatis"ed, and 1.0% say they don’t know. Over time, reported satisfaction with democracy follows a U-shaped curve, with a low point in 2008 followed by a gradual rise.
x� Most Afghans report corruption as a major problem in numerous arenas, ranging from 53.3% in their neighborhood to 75.7% in Afghanistan as a whole. Importantly, all long-term measures for both perception and exposure to corruption have risen since the survey began. !e perception of corruption as a major problem in daily life rose sharply from 2013 (55.7%) to 2014 (62.4%). Afghans in the South East and East regions are most likely to say that corruption is a problem (either major or minor) in their daily life.
Executive Summary 11
x� When asked how often they had paid a bribe, given a gift, or performed a favor for a list of di#erent authorities and situations, 57.6% of Afghans in 2014 say they encountered corruption in their interaction in at least one authority or in a least one situation in the past year. Over half (54.7%) of Afghans who had contact with the judiciary or courts in the past year say they had to pay a bribe, exchange a gift, or perform a favor. A similar percentage (55.1%) experienced corruption in their interaction with municipal or district authorities. Afghans’ experiences with corruption adversely a#ect their perception of and con"dence in various governing institutions.
x� Nearly one in "ve (19.1%) respondents say they took a dispute to a dispute resolution body, and the vast majority (80.7%) say they were satis"ed with the result. Nearly half (42.3%) of these disputes were land disputes.
x� People in rural areas were much more likely to take their disputes to jirgas/shuras (consultative councils) than those in urban areas (44.8% versus 25.8%) and much less likely to use state courts (38.2% versus 61.9%).
x� Afghans were asked whether they think Huquqs (government mediation o$ces), state courts, and jirgas/shuras are fair and trusted, follow local norms and values, are e#ective at delivering justice, and resolve cases promptly. In every case, more Afghans think jirgas/shuras have these qualities; Huquqs came in second, followed by state courts.
Political participation
x� In 2014, 67.4% of Afghans surveyed said they feel very safe or somewhat safe expressing their opinions about the government in public. Residents of Parwan (94.3%), Panjshir (91.9%), and Samangan (86.0%) provinces are most likely to say they feel safe criticizing the government. !e provinces where people feel the least safe doing so are Uruzghan (43.9%), Ghor (49.2%), Herat (51.3%), and Zabul (51.9%). Afghans living in urban areas (76.2%) are more likely to feel safe speaking out about the government in public than those in rural areas (64.5%).
x� !e percentage of Afghans who say they feel fear while participating in an election (45.8%) in 2014 is signi"cantly lower than 2013 (57.2%). People are more afraid to engage in other political activities, such as participating in a peaceful demonstration (69.4%) and running for o$ce (70.8%). Among the three activities, fear of voting in an election showed the greatest variation among geographic regions, ranging from 61.0% of residents of the South West to 31.6% in Central/Kabul. People are most afraid to participate in a peaceful demonstration in the West (78.4%) and least afraid in the Central/Hazarajat region (50.4%).
x� When asked whether they feel they can in%uence local government decisions, 55.9% of Afghans say they have a lot or some in%uence, up from 47.9% in 2013. People in Nangarhar (81.1%), Kunduz (77.4%), Samangan (76.0%), and Kandahar (73.6%) provinces are most likely to say they have in%uence over local government decisions.
x� Around two-thirds (64.9%) of Afghans say that religious leaders should be involved in politics, an overall increase from 58.1% in 2013. !e biggest regional increases are shown in in the East and South West, while the proportion of Afghans in the Central/Kabul region who say religious leaders should be
Afghanistan in 201412
involved has decreased.
x� Most respondents (85.9%) say people should vote for themselves, regardless of what community elders think, with no signi"cant variation in responses by age, gender, or ethnicity.
x� When asked how women should make their voting decisions, 56.0% of Afghans say women should decide for themselves and 25.6% say women should decide for themselves but consult with men. More urban Afghans (68.2%) than rural Afghans (52.1%) say that women should decide on their own. Pashtuns (20.8%) were most likely to say men should decide for women, compared to 14.7% of Tajiks, 13.8% of Uzbeks, and 13.2% of Hazaras.
x� For the 2014 presidential elections, one in three Afghans (33.5%) say they relied primarily on the media (including TV, radio, and the internet) to learn about the candidates and decide who they would vote for. Another third (39.3%) say they relied on family and friends, followed by 11.8% who turned to community shuras and 10.0% who relied on information from mosques.
x� !e survey found that ethnicity tended to in%uence voter choices more than other factors. When asked directly, Afghans say they would consider voting for a candidate of a di#erent ethnic background than their own. However, in 2014 most Afghans also say that they voted for candidates from their own ethnic group.
x� Well over half (61.6%) of Afghans surveyed say that they were somewhat or very concerned about security threats during the election, with people in the South West region (67.9%) being most concerned and people in the Central/Hazarajat (44.5%) region least concerned. Signi"cantly more women (24.2%) than men (18.6%) say they were very concerned.
x� Among Afghans who say they didn’t vote in the "rst election, 32.2% say it was because they didn’t have a voting card, 18.0% said their family did not permit them to vote, and 11.6% say they did not vote due to insecurity. Afghans gave similar explanations for not voting in the run-o# election.
x� When asked immediately after the run-o# election whether the election was free and fair, 63.3% of Afghans said yes. !ose who think it was not free and fair cite lack of open polling stations in their area (47.8%), not enough ballots (47.8%), and a belief that the ballots were counted dishonestly (45.5%).
x� When asked about the level of con"dence they have in the Independent Election Commission (IEC) to do its job (a question that also applied to a wide range of other institutions, see Governance above), 66.4% reported they have a great deal or a fair amount of con"dence in the IEC.
x� Around two-thirds of Afghans (64.0%) say they believe the result of the presidential election will make their lives better, a signi"cant increase from 56.4% in 2013. Men (68.5%) are slightly more likely to say the election result will make their life better than women (60.1%).
Access to information
x� As in previous years, in 2014 the most widely used source for obtaining news and information in Afghanistan is radio (77.4%), followed by television (58.4%), mobile phones (48.1%), mosques (46.9%), community shuras (36.4%), and the internet (5.6%). Compared to 2013, reliance on radio and mobile phones as a main source of news and information dropped considerably for both urban and rural areas, largely due to the expansion of other available options, such as television and the internet. In rural areas, reliance on television and mobile phones is less common compared to urban areas, while

Executive Summary 13
INSECURITY
the mosque and community shuras are more common compared to urban areas.
x� Television ownership has risen from 36.9% in 2007 to 58.3% in 2014, while the use of television as a source of news and information increased from 54.8% in 2013 to 58.4% in 2014. Internet use also increased from 3.2% in 2013 to 5.6% in 2014, and has nearly doubled in urban areas over the past year.
x� While media use may not directly drive voter participation, Afghans who report using television and radio for obtaining news and information are signi"cantly more likely to report having voted in the "rst round of presidential elections than those who do not use television and radio.
x� Afghans who use television and community shuras for information are signi"cantly less likely to report sympathy for AOGs. By contrast, those who report use of radio, mobile phones, and the mosque as primary sources for news and information are more likely to report sympathy for AOGs. !is "nding holds even after controlling for region and other demographic factors.
x� Respondents who use television as a source of news and information are signi"cantly more likely to say that women should have the same right to education as men (even when controlling for factors like gender, education, and region).
Women in society
x� Only 19.2% of all Afghans say they are aware of an organization, institution, or authority where women can go for assistance with their problems. Among those who know of such a place, 44.4% cite the Directorate of Women’s A#airs, 13.7% cite the Human Rights Council, and 12.3% cite the District Governor’s O$ce.
x� When asked whom they would turn to for help to resolve a family problem, 29.5% of Afghan women say they would seek help from family and friends, followed by elders of the local jirga (15.0%) and the local malik/khan (a village head or local tribal leader) (10.9%).
x� Just over half (52.5%) of Afghans say state courts treat men and women equally. Among people who took a dispute to a shura/jirga, there is sizeable support (64.5%) for the idea of special women’s shuras/jirgas, with women more likely to support the idea than men.
x� Over two-thirds (69.7%) of women surveyed say they voted in the presidential run-o# election of 2014, compared to the 43.4% of women who say they voted in the presidential election of 2009. Among Afghans who say they did not vote in the "rst round of the election, resistance from family members was a much more commonly cited reason by women for not voting than by men.
x� !is year, for the "rst time ever, the number of Afghans who say that political positions in government should be mostly for men (46.1%) has overtaken the number who say that political positions should be shared equally between men and women (42.1%). Regionally, Afghans in the South West region are most likely (59.9%) to say that political positions should be mostly for men, while Afghans in the Central/Hazarajat region (59.3%) are most likely to say that political positions should be shared equally between men and women.
x� Despite these barriers to women’s political participation, the percentage of women who say they feel able to in%uence local government decisions increased from 41.2% in 2013 to 52.2% in 2014. !e same
Afghanistan in 201414
pattern appears for the 2014 presidential elections, where 60.5% of women say it will make their lives better, signi"cantly more than women surveyed in 2013 (54.0%).
x� !is year the survey asked respondents whether women should have the same educational opportunities as men at various levels and in various arenas. !ere is strong support for women’s education in Islamic madrasas (92.3%), primary schools (83.9%), high schools (82.0%), and universities in their home province (71.9%), but less support for women to study in another province (45.2%) or to go abroad on a scholarship (33.4%).
x� Around two-thirds (67.8%) of Afghans say that women should be able to work outside the home. !is year, respondents were asked whether they agree or disagree that women should be able to work in a range of speci"c employment environments. Schools are seen as most acceptable (with 83.6% of Afghans in agreement), followed by hospitals or clinics (80.8%) and government o$ces (70.0%). !ere was much lower support for women’s employment in the police or the army (41.9%) and nongovernmental organizations (NGOs) (40.9%).
x� Overall, 79.1% of Afghans say they disagree with the practice of baad (where a daughter is given to another party as a penalty or payment for some o#ense), with a minimal di#erence between men’s and women’s responses. !e highest percentage of Afghans who say they agree with the practice of baad live in the South West region.
x� When asked if baddal (the exchange of daughters between families for marriage) is acceptable, 62.8% of Afghans say they disagree with the practice, with women more likely to disagree than men (64.7% to 60.6%). Afghans in the South East and South West regions, which are predominantly rural, are signi"cantly more likely to agree with the practice than all other regions.
x� Nationally, 87.3% of Afghans somewhat or strongly agree that a daughter should receive her miras (an inheritance as a portion of her father’s estate upon his death).
National Mood 15
1 NATIONAL MOODEach year, the survey asks respondents to re%ect on whether, and why, the country is moving in the right direction or the wrong direction, as well as on Afghanistan’s biggest problems, including the most pressing problems facing Afghan women. At the time the survey was conducted in June 2014, there were clearly numerous potential reasons for fear and uncertainty among the Afghan public. Ballots from the presidential runo# election between Dr. Ashraf Ghani and Dr. Abdullah Abdullah were still being counted by the Independent Elections Commission, and no winner had been announced. In the months leading up to the election, civilian casualties from con%ict-related violence had reached record highs. !e United Nations Assistance Mission to Afghanistan (UNAMA) attributed the rise to an increase in ground combat between Afghan National Security Forces (ANSF) and Armed Opposition Groups (AOGs) within civilian-populated areas.
At the time of the survey polling, the Bilateral Security Agreement (BSA) with the United States, which provides for a residual number of foreign forces in the country after 2014, had not yet been signed. National news broadcasts described the BSA as a lynchpin for continued international aid and support, which directly a#ects future economic growth and development. (!e BSA was later rati"ed on September 30, 2014, three months after the survey). In spite of this, survey respondents’ fears around security and the political transition were tempered with cautious optimism. Many Afghans expressed hope for change with a new president, particularly in the areas of security and reconciliation, employment, and continued international assistance.
In the survey this year, like last year, the biggest national concern is security. !is is true for both urban and rural areas, and across most regions. Afghans who see progress in the security sector tend to have a more positive view of the overall direction of the country, the ANSF, and the Afghan government, while those who see evidence of deteriorating security are more likely to have a more pessimistic view across multiple survey topics. At the local level, however, unemployment is the biggest concern. Illiteracy and access to education are considered the biggest problems facing women. !is chapter reviews regional and provincial variations in national mood, the reasons that some Afghans are optimistic and others pessimistic, and the problems and challenges that Afghans identify as important in 2014.
1.1 Direction of the Country Key QuestionsQ-1. Overall, based on your own experience, do you think things in Afghanistan today are going in the right direction, or do you think they are going in the wrong direction?Q-2. (If answered “Right Direction” to Q-1) What are two reasons you think that Afghanistan is going in the right direction?Q-3. (If answered “Wrong Direction” to Q-1) What are two reasons you think that Afghanistan is going in the wrong direction?
Afghanistan in 201416
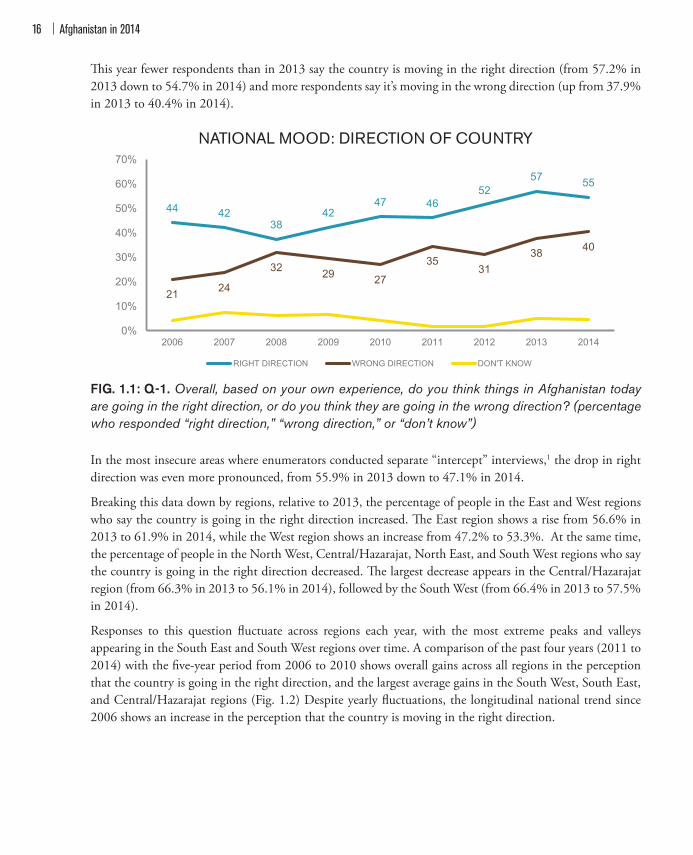
!is year fewer respondents than in 2013 say the country is moving in the right direction (from 57.2% in 2013 down to 54.7% in 2014) and more respondents say it’s moving in the wrong direction (up from 37.9% in 2013 to 40.4% in 2014).
NATIONAL MOOD: DIRECTION OF COUNTRY
FIG. 1.1: Q-1. Overall, based on your own experience, do you think things in Afghanistan today are going in the right direction, or do you think they are going in the wrong direction? (percentage who responded “right direction,” “wrong direction,” or “don’t know”)
In the most insecure areas where enumerators conducted separate “intercept” interviews,1 the drop in right direction was even more pronounced, from 55.9% in 2013 down to 47.1% in 2014.
Breaking this data down by regions, relative to 2013, the percentage of people in the East and West regions who say the country is going in the right direction increased. !e East region shows a rise from 56.6% in 2013 to 61.9% in 2014, while the West region shows an increase from 47.2% to 53.3%. At the same time, the percentage of people in the North West, Central/Hazarajat, North East, and South West regions who say the country is going in the right direction decreased. !e largest decrease appears in the Central/Hazarajat region (from 66.3% in 2013 to 56.1% in 2014), followed by the South West (from 66.4% in 2013 to 57.5% in 2014).
Responses to this question %uctuate across regions each year, with the most extreme peaks and valleys appearing in the South East and South West regions over time. A comparison of the past four years (2011 to 2014) with the "ve-year period from 2006 to 2010 shows overall gains across all regions in the perception that the country is going in the right direction, and the largest average gains in the South West, South East, and Central/Hazarajat regions (Fig. 1.2) Despite yearly %uctuations, the longitudinal national trend since 2006 shows an increase in the perception that the country is moving in the right direction.
�
44 4238
4247 46
5257 55
21 24
32 29 27
3531
38 40
0%
10%
20%
30%
40%
50%
60%
70%
2006 2007 2008 2009 2010 2011 2012 2013 2014
RIGHT DIRECTION WRONG DIRECTION DON'T KNOW

National Mood 17
40
52
36 31
37
53
42 49
45 54
50 53 47
56 61
55
0%
10%
20%
30%
40%
50%
60%
70%
CENTRAL /KABUL
EAST SOUTH EAST SOUTH WEST WEST NORTH EAST CENTRAL /HAZARAJAT
NORTH WEST
2006-2010 AVERAGE 2011-2014 AVERAGE

Afghanistan in 201418
REASONS: RIGHT DIRECTION
FIG. 1.3: Q-2A/B. (Ask if answered “1 - Right direction” to Q-1) What are two reasons you think that Afghanistan is going in the right direction? (Q-2A and Q-2B responses combined)
Broken down geographically, urban respondents cite reconstruction as a reason for optimism more often (39.6%) than rural respondents (35.4%), a trend consistent with previous years. Urban respondents are also more likely (12.1%) than rural respondents (8.4%) to cite elections or democracy as a reason for saying that the country is moving in the right direction. Rural respondents, meanwhile, were more likely to cite having an active ANA and ANP (11.6%) than urban respondents (5.5%). Across all regions, reconstruction/rebuilding and good security are the two most commonly cited reasons for optimism about the overall direction of the country (Fig 1.4).
�
�
36 33
15
10 9 9
0%
5%
10%
15%
20%
25%
30%
35%
40%
RECONSTRUCTION/ REBUILDING
GOOD SECURITY IMPROVEMENT INEDUCATION
SYSTEM
HAVING ACTIVEANA AND ANP
ECONOMICREVIVAL
DEMOCRACY /ELECTIONS
National Mood 19
REASONS FOR RIGHT DIRECTION: BY REGION
CENTRAL / KABUL EAST SOUTH
EAST SOUTH WEST WEST NORTH
EAST CENTRAL /HAZARAJAT
NORTH WEST
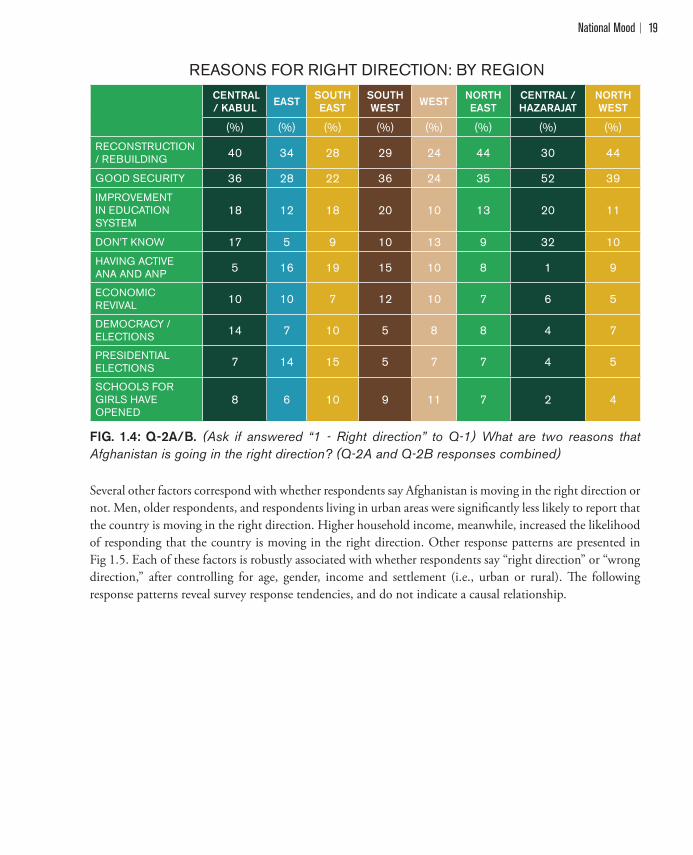
(%) (%) (%) (%) (%) (%) (%) (%)RECONSTRUCTION / REBUILDING 40 34 28 29 24 44 30 44
GOOD SECURITY 36 28 22 36 24 35 52 39IMPROVEMENT IN EDUCATION SYSTEM
18 12 18 20 10 13 20 11
DON’T KNOW 17 5 9 10 13 9 32 10HAVING ACTIVE ANA AND ANP 5 16 19 15 10 8 1 9
ECONOMIC REVIVAL 10 10 7 12 10 7 6 5
DEMOCRACY / ELECTIONS 14 7 10 5 8 8 4 7
PRESIDENTIAL ELECTIONS 7 14 15 5 7 7 4 5
SCHOOLS FOR GIRLS HAVE OPENED
8 6 10 9 11 7 2 4
FIG. 1.4: Q-2A/B. (Ask if answered “1 - Right direction” to Q-1) What are two reasons that Afghanistan is going in the right direction? (Q-2A and Q-2B responses combined)
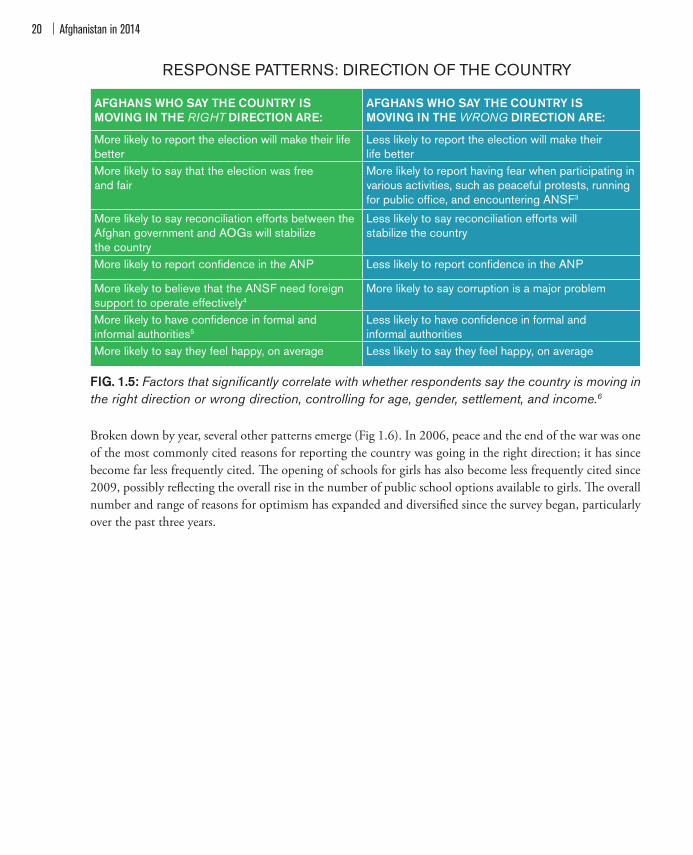
Several other factors correspond with whether respondents say Afghanistan is moving in the right direction or not. Men, older respondents, and respondents living in urban areas were signi"cantly less likely to report that the country is moving in the right direction. Higher household income, meanwhile, increased the likelihood of responding that the country is moving in the right direction. Other response patterns are presented in Fig 1.5. Each of these factors is robustly associated with whether respondents say “right direction” or “wrong direction,” after controlling for age, gender, income and settlement (i.e., urban or rural). !e following response patterns reveal survey response tendencies, and do not indicate a causal relationship.
Afghanistan in 201420
RESPONSE PATTERNS: DIRECTION OF THE COUNTRY
AFGHANS WHO SAY THE COUNTRY IS MOVING IN THE RIGHT DIRECTION ARE:
AFGHANS WHO SAY THE COUNTRY IS MOVING IN THE WRONG DIRECTION ARE:
More likely to report the election will make their life better
Less likely to report the election will make their life better
More likely to say that the election was free and fair
More likely to report having fear when participating in various activities, such as peaceful protests, running for public office, and encountering ANSF3
More likely to say reconciliation efforts between the Afghan government and AOGs will stabilize the country
Less likely to say reconciliation efforts will stabilize the country
More likely to report confidence in the ANP Less likely to report confidence in the ANP
More likely to believe that the ANSF need foreign support to operate effectively4
More likely to say corruption is a major problem
More likely to have confidence in formal and informal authorities5
Less likely to have confidence in formal and informal authorities
More likely to say they feel happy, on average Less likely to say they feel happy, on average
FIG. 1.5: Factors that significantly correlate with whether respondents say the country is moving in the right direction or wrong direction, controlling for age, gender, settlement, and income.6
Broken down by year, several other patterns emerge (Fig 1.6). In 2006, peace and the end of the war was one of the most commonly cited reasons for reporting the country was going in the right direction; it has since become far less frequently cited. !e opening of schools for girls has also become less frequently cited since 2009, possibly re%ecting the overall rise in the number of public school options available to girls. !e overall number and range of reasons for optimism has expanded and diversi"ed since the survey began, particularly over the past three years.
National Mood 21
REASONS: RIGHT DIRECTION BY YEAR
2006 2007 2008 2009 2010 2011 2012 2013 2014
(%) (%) (%) (%) (%) (%) (%) (%) (%)RECONSTRUCTION / REBUILDING 21 39 32 36 35 40 35 32 36
GOOD SECURITY 31 34 39 44 38 39 41 24 33IMPROVEMENT IN EDUCATION SYSTEM - - - - 10 16 13 13 15
HAVING ACTIVE ANA AND ANP - - - - - - - 13 10
ECONOMIC REVIVAL 7 9 5 6 10 8 8 6 9
DEMOCRACY / ELECTIONS 10 9 7 1 7 3 4 6 9SCHOOLS FOR GIRLS HAVE OPENED 16 19 19 21 15 10 14 13 8
PEACE / END OF WAR 29 16 21 9 12 7 7 7 6
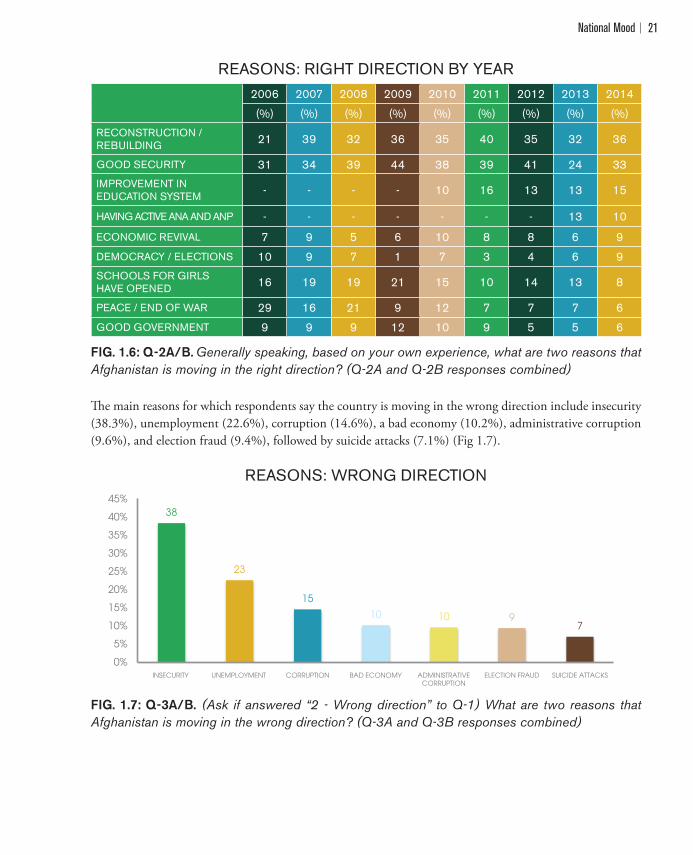
GOOD GOVERNMENT 9 9 9 12 10 9 5 5 6
FIG. 1.6: Q-2A/B. Generally speaking, based on your own experience, what are two reasons that Afghanistan is moving in the right direction? (Q-2A and Q-2B responses combined)
!e main reasons for which respondents say the country is moving in the wrong direction include insecurity (38.3%), unemployment (22.6%), corruption (14.6%), a bad economy (10.2%), administrative corruption (9.6%), and election fraud (9.4%), followed by suicide attacks (7.1%) (Fig 1.7).
REASONS: WRONG DIRECTION
FIG. 1.7: Q-3A/B. (Ask if answered “2 - Wrong direction” to Q-1) What are two reasons that Afghanistan is moving in the wrong direction? (Q-3A and Q-3B responses combined)
38
23
15
10 10 97
0%
5%
10%
15%
20%
25%
30%
35%
40%
45%
INSECURITY UNEMPLOYMENT CORRUPTION BAD ECONOMY ADMINISTRATIVE CORRUPTION
ELECTION FRAUD SUICIDE ATTACKS

Afghanistan in 201422
Longitudinal analysis shows an increase in the perception of unemployment as a reason for pessimism about the direction of the country, from 15.5% in 2010 to 22.6% in 2014 (Fig 1.8). Many factors have contributed to reduced employment opportunities in several regions, including changing security conditions, the withdrawal of foreign forces, and reductions in donor budgets.7 While the percentage of respondents citing corruption as a reason for pessimism decreased from 2013 (22.8%) to 2014 (14.6%), at the same time it is important to note that election fraud (a form of corruption) was a common and new response in 2014. Combining responses from those who cite election fraud with those who cite the more general problem of corruption would suggest that there may have been no substantial change in perceptions of corruption as a reason for pessimism between 2013 and 2014.
REASONS: WRONG DIRECTION BY YEAR
2006 2007 2008 2009 2010 2011 2012 2013 2014
(%) (%) (%) (%) (%) (%) (%) (%) (%)
INSECURITY 6 48 50 42 44 45 39 24 38
UNEMPLOYMENT 21 15 15 15 16 13 18 20 23
CORRUPTION - 13 19 17 27 16 14 23 15ADMINISTRATIVE CORRUPTION 2 15 9 10 - 4 10 6 10
BAD ECONOMY 27 12 17 11 8 10 10 8 10
ELECTION FRAUD - - - - - - - - 9
SUICIDE ATTACKS - - - - - - - 11 7
PRESENCE OF TALIBAN - - - - - - - 9 6
BAD GOVERNMENT 22 15 12 25 18 15 11 6 5
NO RECONSTRUCTION 22 8 7 6 4 4 6 4 4
FIG. 1.8: Q-3A/B. Generally speaking, based on your own experience, what are two reasons that Afghanistan is moving in the wrong direction? (Q-3A and Q-3B responses combined)8
Broken down by region, all eight regions cite insecurity and unemployment as the two primary reasons for why the country is moving in the wrong direction (Fig 1.9). Insecurity ranges from a high of 48.7% of responses in the South West, to a low of 31.5% of responses in the West, while unemployment is most commonly cited in the North East (29.4%), and cited with the lowest frequency in the West (17.6%).

National Mood 23
REASONS: WRONG DIRECTION BY REGION CENTRAL
/ KABUL EAST SOUTH EAST
SOUTH WEST WEST NORTH
EAST CENTRAL / HAZARAJAT
NORTH WEST
(%) (%) (%) (%) (%) (%) (%) (%)
36 44 41 49 32 33 36 42
UNEMPLOYMENT 23 20 20 26 18 29 24 19
CORRUPTION 12 19 13 10 18 20 13 13ADMINISTRATIVE CORRUPTION 10 5 16 9 11 7 14 8
BAD ECONOMY 11 11 6 10 13 10 14 9ELECTION FRAUD 16 4 9 1 7 11 8 9
SUICIDE ATTACKS 7 11 7 4 5 5 4 13
PRESENCE OF TALIBAN 3 8 14 6 6 6 4 7
FIG. 1.9: Q-3A/B. Generally speaking, based on your own experience, what are two reasons to think that Afghanistan is going in the wrong direction? (Q-3A and Q-3B responses combined)
1.2 Afghanistan’s Biggest Problems: National LevelKey Questions
Q-5A/B. In your view, what are the biggest problems facing Afghanistan as a whole?
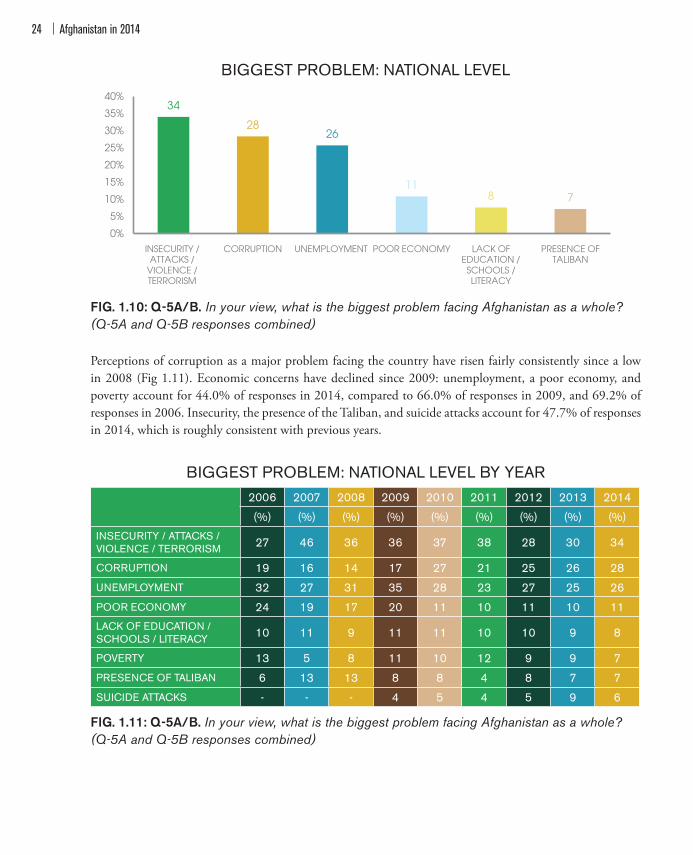
When asked about the biggest problems facing the nation as a whole, insecurity tops the list (34.0%), followed by corruption (28.4%) (Fig. 1.10). !e next two most frequently cited problems are both economic issues (unemployment and a poor economy), together totaling 36.7%, which is higher than the percentage of people who cited insecurity. !e "fth most commonly cited problem is poor access to education/schools, and illiteracy (7.6%). !is response also carries economic consequences, because respondent education level signi"cantly predicts household income.
INSECURITY
Afghanistan in 201424
BIGGEST PROBLEM: NATIONAL LEVEL
FIG. 1.10: Q-5A/B. In your view, what is the biggest problem facing Afghanistan as a whole?(Q-5A and Q-5B responses combined)
Perceptions of corruption as a major problem facing the country have risen fairly consistently since a low in 2008 (Fig 1.11). Economic concerns have declined since 2009: unemployment, a poor economy, and poverty account for 44.0% of responses in 2014, compared to 66.0% of responses in 2009, and 69.2% of responses in 2006. Insecurity, the presence of the Taliban, and suicide attacks account for 47.7% of responses in 2014, which is roughly consistent with previous years.
BIGGEST PROBLEM: NATIONAL LEVEL BY YEAR
2006 2007 2008 2009 2010 2011 2012 2013 2014
(%) (%) (%) (%) (%) (%) (%) (%) (%)INSECURITY / ATTACKS / VIOLENCE / TERRORISM 27 46 36 36 37 38 28 30 34
CORRUPTION 19 16 14 17 27 21 25 26 28
UNEMPLOYMENT 32 27 31 35 28 23 27 25 26
POOR ECONOMY 24 19 17 20 11 10 11 10 11LACK OF EDUCATION / SCHOOLS / LITERACY 10 11 9 11 11 10 10 9 8
POVERTY 13 5 8 11 10 12 9 9 7
PRESENCE OF TALIBAN 6 13 13 8 8 4 8 7 7
SUICIDE ATTACKS - - - 4 5 4 5 9 6
FIG. 1.11: Q-5A/B. In your view, what is the biggest problem facing Afghanistan as a whole? (Q-5A and Q-5B responses combined)
34
2826
118 7
0%
5%
10%
15%
20%
25%
30%
35%
40%
INSECURITY / ATTACKS /
VIOLENCE / TERRORISM
CORRUPTION UNEMPLOYMENT POOR ECONOMY LACK OF EDUCATION / SCHOOLS / LITERACY
PRESENCE OF TALIBAN

National Mood 25
Respondents from all regions rank insecurity, corruption, and unemployment interchangeably as the three biggest problems facing Afghanistan. Insecurity is cited most often in the West (42.0%) and least often in the North East (24.5%). !e presence of the Taliban is cited most frequently in the West (13.8%) and least frequently in the South West (4.9%). People in the East region are most likely to say corruption is the biggest problem facing Afghanistan (34.1%) and people in the Central/Hazarajat region are the least likely (22.4%). Meanwhile, unemployment is cited most often in the Central/Kabul (35.9%) region and least often in the South East (19.7%) region.
1.3 Afghanistan's Biggest Problems: Local Level
Key Questions Q-4A/B. In your view, what are the biggest problems in your local area?
When respondents were asked about the biggest problems in their local area, jobs (33.1%) and services (22.5% say electricity, 17.5% say roads, and 16.4% say drinking water) top the list, followed by security issues (14.1%) (Fig 1.12).
BIGGEST PROBLEM: LOCAL LEVEL
FIG. 1.12: Q-4A/B. What is the biggest problem in your local area? (Q-4A and Q-4B responses combined)
!e hierarchy of local-level problems cited by respondents has not changed notably since 2006 (Fig 1.13). Roads have always been less of a concern than employment and electricity, and for most years, unemployment has been a more common concern than lack of electricity. Compared to 2013, this year’s unemployment concerns have increased, while drinking water concerns have decreased. Longitudinally, the lack of education/schools and illiteracy concerns have decreased from a peak of 21.0% in 2007 to 11.8% of responses in 2014, and healthcare concerns have dropped from a peak of 20.2% of responses in 2009 to 11.0% of responses in 2014.
33
23
18 1614
12 11
0%
5%
10%
15%
20%
25%
30%
35%
UNEMPLOYMENT ELECTRICITY ROADS DRINKING WATER INSECURITY / ATTACKS / VIOLENCE
LACK OF EDUCATION / SCHOOLS / LITERACY
HEALTHCARE / CLINICS / HOSPITALS
Afghanistan in 201426
BIGGEST PROBLEM: LOCAL LEVEL BY YEAR
2006 2007 2008 2009 2010 2011 2012 2013 2014
(%) (%) (%) (%) (%) (%) (%) (%) (%)
UNEMPLOYMENT 34 26 28 26 26 28 29 27 33
ELECTRICITY 25 27 30 26 28 23 25 24 23
ROADS 14 19 18 24 24 15 20 19 18
DRINKING WATER 18 21 22 22 22 20 18 19 16INSECURITY / ATTACKS / VIOLENCE 8 15 14 13 13 14 10 14 14
LACK OF EDUCATION / SCHOOLS / LITERACY 14 21 14 15 16 14 15 11 12
HEALTHCARE / CLINICS / HOSPITALS 15 17 15 20 17 12 12 13 11
FIG. 1.13: Q-4A/B. What is the biggest problem in your local area? (Q-4A and Q-4B responses combined)
Unemployment is the most frequently cited local problem across all regions, except for the East, where lack of electricity (34.3%) is reported as the biggest problem. Lack of roads is most commonly cited in the North East (23.5%) region and least commonly cited in the South East (11.7%) region. Concern about access to drinking water is highest in the North East (23.2%) and lowest in the South East (4.9%) region. !e issue of insecurity has the largest spread among the regions, with more than a 20 percentage point di#erence between the region with the most people concerned about security (the East, with 24.6%) and the region with the fewest people concerned about security (Central/Hazarajat, with 2.2%). Healthcare concerns are highest in Central/Hazarajat (21.7%) and lowest in the West (5.8%), while the problem of high prices is highest in Central/Hazarajat (12.4%) and lowest in the East (4.2%). Concerns about education, schools, and illiteracy are highest in the North West (18.2%) relative to other regions.
1.4 Biggest Problems Facing Women
Key Questions
Q-67. Now let’s talk specifically about women’s issues. What, if anything, is the biggest problem facing women in this area today? What is the next biggest problem?
Overall, lack of education/literacy (23.9%), lack of job opportunities (14.6%), domestic violence (11.3%), and forced marriages / dowry payments (7.2%) are the most widely cited problems facing women. However, men and women di#er in which problems they perceive to be important for women (Fig 1.14). Compared to men, women are signi"cantly more likely to report domestic violence,9 lack of rights,10 and lack of jobs11 as the biggest problems facing Afghan women.

National Mood 27
BIGGEST PROBLEM FACING WOMEN
FIG. 1.14: Q-67A. What, if anything, is the biggest problem facing women in this area today? (percentage of men and women who cite each response)
Lack of education/literacy is the most frequently cited problem for women across all regions except in the North East, where lack of jobs (26.1%) is higher. Domestic violence is cited with the highest frequency in the West (20.3%), South West (14.1%), and South East (12.4%), and with the lowest frequency in the North East (7.8%) and Central/Hazarajat (4.1%) region. Recognition of forced marriage as a problem for women followed a similar geographic pattern, being highest in the South East (16.8%) and lowest in the Central/Hazarajat (0.5%) region.
!e mention of baad (the traditional practice of giving away a daughter to another party as penalty or payment for some o#ense) was infrequent overall (3.4%), but shows more variation between regions than any other issue. In the East, 12.4% of all respondents, and 14.9% of female respondents, cite baad as the biggest problem facing women. In the South East, the "gure is 9.4% overall, and 10.0% among female respondents. By contrast, it was rarely cited as a problem in the North East (0.6%), West (1.6%), North West (0.3%), Central/Kabul (0.6%), and Central/Hazarajat (0.0%) regions.
Longitudinal trends (Fig. 1.15) suggest an increase in the recognition of domestic violence as a pressing problem facing Afghan women. !ese trends also re%ect an increasing concern about job opportunities for women that seem to coincide with declining concern about women’s freedom to leave the home. !ese "ndings paint a mixed picture of women’s rights and advancement, to be reviewed in greater detail later (see Chapter 8, Women and Society).
23
1513
8 8
4
25
14
9
47
5
0%
5%
10%
15%
20%
25%
30%
LACK OF EDUCATION /
LITERACY
LACK OF JOBS DOMESTIC VIOLENCE
LACK OF RIGHTS FORCED MARRIAGES
DON'T KNOW
WOMEN MEN
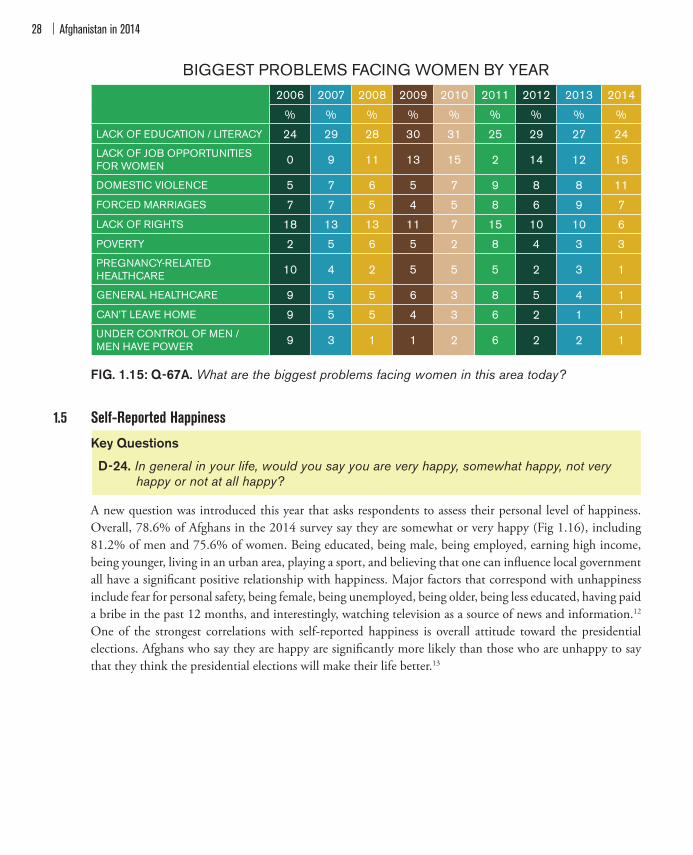
Afghanistan in 201428
BIGGEST PROBLEMS FACING WOMEN BY YEAR
2006 2007 2008 2009 2010 2011 2012 2013 2014
% % % % % % % % %
LACK OF EDUCATION / LITERACY 24 29 28 30 31 25 29 27 24LACK OF JOB OPPORTUNITIES FOR WOMEN 0 9 11 13 15 2 14 12 15
DOMESTIC VIOLENCE 5 7 6 5 7 9 8 8 11
FORCED MARRIAGES 7 7 5 4 5 8 6 9 7
LACK OF RIGHTS 18 13 13 11 7 15 10 10 6
POVERTY 2 5 6 5 2 8 4 3 3PREGNANCY-RELATED HEALTHCARE 10 4 2 5 5 5 2 3 1
GENERAL HEALTHCARE 9 5 5 6 3 8 5 4 1
CAN’T LEAVE HOME 9 5 5 4 3 6 2 1 1UNDER CONTROL OF MEN / MEN HAVE POWER 9 3 1 1 2 6 2 2 1
FIG. 1.15: Q-67A. What are the biggest problems facing women in this area today?
1.5 Self-Reported Happiness
Key Questions
D-24. In general in your life, would you say you are very happy, somewhat happy, not very happy or not at all happy?
A new question was introduced this year that asks respondents to assess their personal level of happiness. Overall, 78.6% of Afghans in the 2014 survey say they are somewhat or very happy (Fig 1.16), including 81.2% of men and 75.6% of women. Being educated, being male, being employed, earning high income, being younger, living in an urban area, playing a sport, and believing that one can in%uence local government all have a signi"cant positive relationship with happiness. Major factors that correspond with unhappiness include fear for personal safety, being female, being unemployed, being older, being less educated, having paid a bribe in the past 12 months, and interestingly, watching television as a source of news and information.12 One of the strongest correlations with self-reported happiness is overall attitude toward the presidential elections. Afghans who say they are happy are signi"cantly more likely than those who are unhappy to say that they think the presidential elections will make their life better.13
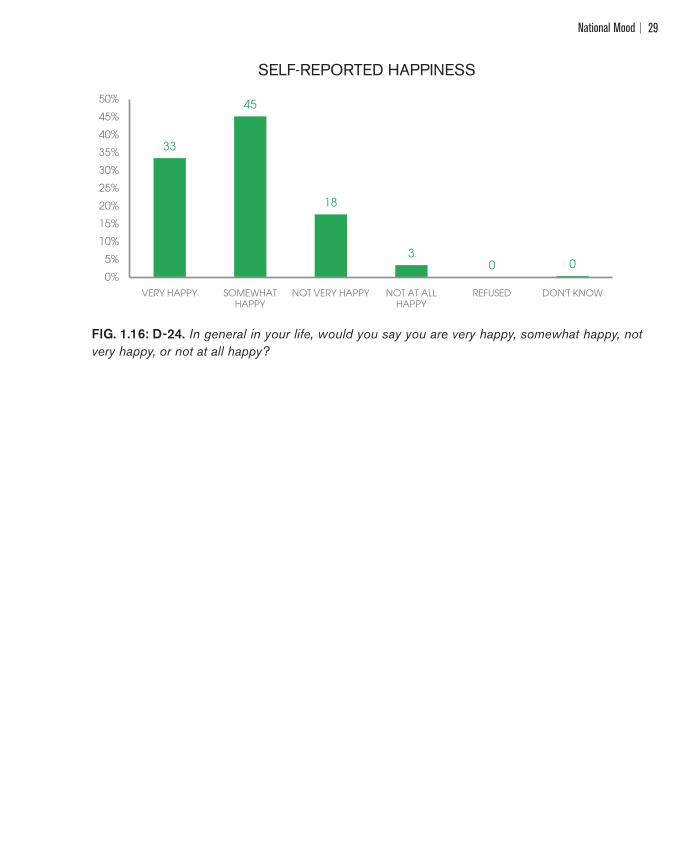
National Mood 29
SELF-REPORTED HAPPINESS
FIG. 1.16: D-24. In general in your life, would you say you are very happy, somewhat happy, not very happy, or not at all happy?
33
45
18
30 0
0%
5%
10%
15%
20%
25%
30%
35%
40%
45%
50%
VERY HAPPY SOMEWHAT HAPPY
NOT VERY HAPPY NOT AT ALL HAPPY
REFUSED DON'T KNOW
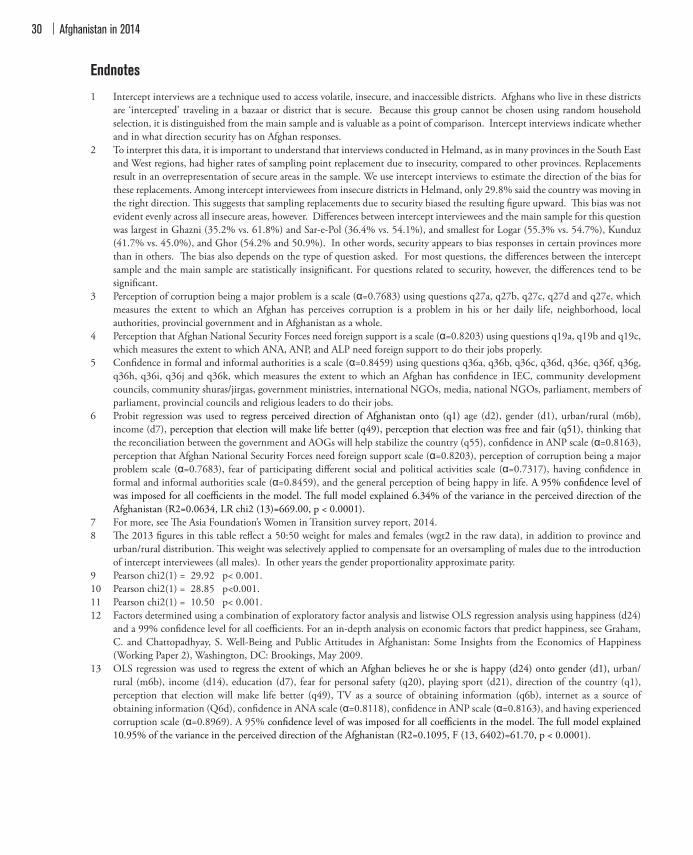
Afghanistan in 201430
Endnotes
1 Intercept interviews are a technique used to access volatile, insecure, and inaccessible districts. Afghans who live in these districts are ‘intercepted’ traveling in a bazaar or district that is secure. Because this group cannot be chosen using random household selection, it is distinguished from the main sample and is valuable as a point of comparison. Intercept interviews indicate whether and in what direction security has on Afghan responses.
2 To interpret this data, it is important to understand that interviews conducted in Helmand, as in many provinces in the South East and West regions, had higher rates of sampling point replacement due to insecurity, compared to other provinces. Replacements result in an overrepresentation of secure areas in the sample. We use intercept interviews to estimate the direction of the bias for these replacements. Among intercept interviewees from insecure districts in Helmand, only 29.8% said the country was moving in the right direction. !is suggests that sampling replacements due to security biased the resulting "gure upward. !is bias was not evident evenly across all insecure areas, however. Di#erences between intercept interviewees and the main sample for this question was largest in Ghazni (35.2% vs. 61.8%) and Sar-e-Pol (36.4% vs. 54.1%), and smallest for Logar (55.3% vs. 54.7%), Kunduz (41.7% vs. 45.0%), and Ghor (54.2% and 50.9%). In other words, security appears to bias responses in certain provinces more than in others. !e bias also depends on the type of question asked. For most questions, the di#erences between the intercept sample and the main sample are statistically insigni"cant. For questions related to security, however, the di#erences tend to be signi"cant.
3 Perception of corruption being a major problem is a scale (Į=0.7683) using questions q27a, q27b, q27c, q27d and q27e, which measures the extent to which an Afghan has perceives corruption is a problem in his or her daily life, neighborhood, local authorities, provincial government and in Afghanistan as a whole.
4 Perception that Afghan National Security Forces need foreign support is a scale (Į=0.8203) using questions q19a, q19b and q19c, which measures the extent to which ANA, ANP, and ALP need foreign support to do their jobs properly.
5 Con"dence in formal and informal authorities is a scale (Į=0.8459) using questions q36a, q36b, q36c, q36d, q36e, q36f, q36g, q36h, q36i, q36j and q36k, which measures the extent to which an Afghan has con"dence in IEC, community development councils, community shuras/jirgas, government ministries, international NGOs, media, national NGOs, parliament, members of parliament, provincial councils and religious leaders to do their jobs.
6 Probit regression was used to regress perceived direction of Afghanistan onto (q1) age (d2), gender (d1), urban/rural (m6b), income (d7), perception that election will make life better (q49), perception that election was free and fair (q51), thinking that the reconciliation between the government and AOGs will help stabilize the country (q55), con"dence in ANP scale (Į=0.8163), perception that Afghan National Security Forces need foreign support scale (Į=0.8203), perception of corruption being a major problem scale (Į=0.7683), fear of participating di#erent social and political activities scale (Į=0.7317), having con"dence in formal and informal authorities scale (Į=0.8459), and the general perception of being happy in life. A 95% con"dence level of was imposed for all coe$cients in the model. !e full model explained 6.34% of the variance in the perceived direction of the Afghanistan (R2=0.0634, LR chi2 (13)=669.00, p < 0.0001).
7 For more, see !e Asia Foundation’s Women in Transition survey report, 2014. 8 !e 2013 "gures in this table re%ect a 50:50 weight for males and females (wgt2 in the raw data), in addition to province and
urban/rural distribution. !is weight was selectively applied to compensate for an oversampling of males due to the introduction of intercept interviewees (all males). In other years the gender proportionality approximate parity.
9 Pearson chi2(1) = 29.92 p< 0.001.10 Pearson chi2(1) = 28.85 p<0.001.11 Pearson chi2(1) = 10.50 p< 0.001.12 Factors determined using a combination of exploratory factor analysis and listwise OLS regression analysis using happiness (d24)
and a 99% con"dence level for all coe$cients. For an in-depth analysis on economic factors that predict happiness, see Graham, C. and Chattopadhyay, S. Well-Being and Public Attitudes in Afghanistan: Some Insights from the Economics of Happiness (Working Paper 2), Washington, DC: Brookings, May 2009.
13 OLS regression was used to regress the extent of which an Afghan believes he or she is happy (d24) onto gender (d1), urban/rural (m6b), income (d14), education (d7), fear for personal safety (q20), playing sport (d21), direction of the country (q1), perception that election will make life better (q49), TV as a source of obtaining information (q6b), internet as a source of obtaining information (Q6d), con"dence in ANA scale (Į=0.8118), con"dence in ANP scale (Į=0.8163), and having experienced corruption scale (Į=0.8969). A 95% con"dence level of was imposed for all coe$cients in the model. !e full model explained 10.95% of the variance in the perceived direction of the Afghanistan (R2=0.1095, F (13, 6402)=61.70, p < 0.0001).

Security 31
2 SECURITY!e International Security Assistance Force (ISAF), which has operated in Afghanistan since 2001, will complete its mission at the end of 2014. As of October 2014, just under 40,000 ISAF troops remain in Afghanistan, down from a peak of more than 100,000 in 2010.1 !e delayed Bilateral Security Agreement (BSA), which sets the conditions for a continued, limited presence of U.S. troops in Afghanistan to undertake training and counterterrorism missions, was signed by the new unity government on September 29, 2014.
Since June 2013, Afghan National Security Forces (ANSF) have been responsible for security operations throughout the country. Today, the ANSF lead more than 90% of security operations in Afghanistan and show signs of improving capacity. !e ANSF include the Afghan National Army (ANA), with 189,000 personnel nationwide, the Afghan National Police (ANP), with 153,000 personnel nationwide, and the Afghan Local Police (ALP), with 27,000 personnel in 137 districts.2 However, the ability of the ANSF to maintain security throughout the country, especially in rural areas, remains weak. Armed Opposition Groups (AOGs) have stepped up their attacks as foreign forces withdraw, often targeting the ANSF.3 In 2014, AOGs gained control of territory outside of their traditional stronghold in the south, including strategic districts near the capital.4
Reports of con%ict-related violence have risen throughout Afghanistan over the past year, while civilian casualty rates now approach those of AOGs.5 !e United Nations reports that the number of civilian casualties in Afghanistan during the "rst half of 2014 increased 24% compared to the same period in 2013. !e recorded number of child casualties is double the number recorded one year ago.6
A key challenge for the new Afghan government will be to build security at the local level. !e ALP, which was established in 2010 to help smaller communities protect themselves from AOGs, has had uneven success. Among the ANA and the ANP, unit readiness varies region to region. Many units su#er from shortfalls of fuel, equipment, and spare parts. Despite large literacy training programs sponsored by the United States military, illiteracy rates within the ANSF remain very high (roughly two-thirds of ANSF are illiterate). Reports suggest that the annual attrition rate within the ANA is 33%, and 16% within the ANP.7
Meanwhile, the Afghan Peace and Reintegration Program (APRP) reintegrated 1,600 combatants back into their communities in 2013, out of a total 7,800 since the High Peace Council established the program in 2010.8 While an increasing number of the reintegrated combatants come from Afghanistan’s more insecure southern and eastern provinces, most combatants in the program are from the less troubled northern and western provinces.9
!e reconciliation and reintegration process is expected to slow down during Afghanistan’s political transition.However, 72.6% of Afghans remain optimistic that reconciliation e#orts can help stabilize their country. Among intercept interviewees living in insecure areas, 76.7% in 2014 think the government’s reconciliation e#orts and negotiations will be successful, up from 68.4% in 2013.

Afghanistan in 201432
2.1 Fear for Safety
Key QuestionsQ-20. How often do you fear for your own personal safety or security or for that of your family
these days? Would you say you always, often, sometimes, rarely, or never fear for you and your family’s safety?
Q-31. Now I will read you a list of different activities that you could participate in. Please tell me whether you would participate in the following activities with no fear, some fear, or a lot of fear? a) Voting in a national/provincial election, b) Participating in a peaceful demonstration, c) Running for public office, d) Encountering the ANP, e) Encountering the ANA, f) Traveling from one part of Afghanistan to another part of the country, g) Encountering international forces.
!e number of Afghans who say they fear for their personal safety has risen signi"cantly since the survey began in 2006. !is year 65.4% of respondents report that they always, often, or sometimes fear for their personal safety (Fig. 2.1).
FEAR FOR PERSONAL SAFETY
FIG. 2.1: Q-20. How often do you fear for your own personal safety or security or for that of your family these days? (percentage of respondents who answered “always,” “often,” or “sometimes”)
!e percentage of residents who report some level of fear for personal safety is highest in the South East (76.9%) and West (79.2%) regions, where clashes with AOGs have been most frequent (Fig. 2.2). !e provinces most likely to report some level of fear for personal safety are Faryab (92.1%), Wardak (89.2%), Farah (87.5%), and Kunduz (87.5%). !e provinces least likely to report some level of fear are Panjshir (1.5%), Badakhshan (18.3%), and Bamyan (24.7%). Among those living in insecure and AOG-controlled areas, the percentage who report feeling some level of fear is 74.2%.10
40
49 4851
54 56
48
5965
0%
10%
20%
30%
40%
50%
60%
70%
2006 2007 2008 2009 2010 2011 2012 2013 2014
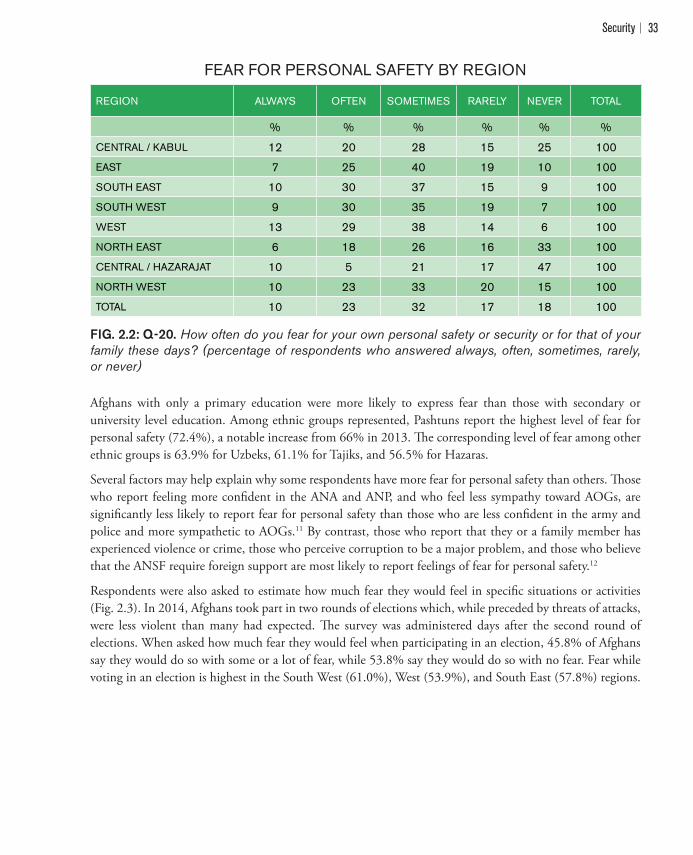
Security 33
FEAR FOR PERSONAL SAFETY BY REGION
REGION ALWAYS OFTEN SOMETIMES RARELY NEVER TOTAL
% % % % % %
CENTRAL / KABUL 12 20 28 15 25 100
EAST 7 25 40 19 10 100
SOUTH EAST 10 30 37 15 9 100
SOUTH WEST 9 30 35 19 7 100
WEST 13 29 38 14 6 100
NORTH EAST 6 18 26 16 33 100
CENTRAL / HAZARAJAT 10 5 21 17 47 100
NORTH WEST 10 23 33 20 15 100
TOTAL 10 23 32 17 18 100
FIG. 2.2: Q-20. How often do you fear for your own personal safety or security or for that of your family these days? (percentage of respondents who answered always, often, sometimes, rarely, or never)
Afghans with only a primary education were more likely to express fear than those with secondary or university level education. Among ethnic groups represented, Pashtuns report the highest level of fear for personal safety (72.4%), a notable increase from 66% in 2013. !e corresponding level of fear among other ethnic groups is 63.9% for Uzbeks, 61.1% for Tajiks, and 56.5% for Hazaras.
Several factors may help explain why some respondents have more fear for personal safety than others. !ose who report feeling more con"dent in the ANA and ANP, and who feel less sympathy toward AOGs, are signi"cantly less likely to report fear for personal safety than those who are less con"dent in the army and police and more sympathetic to AOGs.11 By contrast, those who report that they or a family member has experienced violence or crime, those who perceive corruption to be a major problem, and those who believe that the ANSF require foreign support are most likely to report feelings of fear for personal safety.12
Respondents were also asked to estimate how much fear they would feel in speci"c situations or activities (Fig. 2.3). In 2014, Afghans took part in two rounds of elections which, while preceded by threats of attacks, were less violent than many had expected. !e survey was administered days after the second round of elections. When asked how much fear they would feel when participating in an election, 45.8% of Afghans say they would do so with some or a lot of fear, while 53.8% say they would do so with no fear. Fear while voting in an election is highest in the South West (61.0%), West (53.9%), and South East (57.8%) regions.
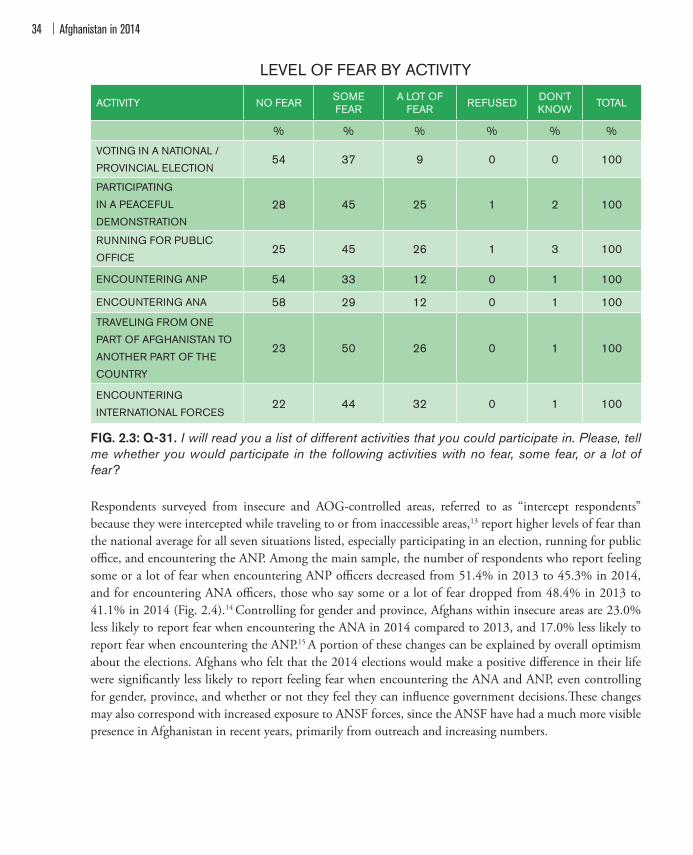
Afghanistan in 201434
LEVEL OF FEAR BY ACTIVITY
ACTIVITY NO FEAR SOME FEAR
A LOT OF FEAR REFUSED DON’T
KNOW TOTAL
% % % % % %
VOTING IN A NATIONAL /
PROVINCIAL ELECTION54 37 9 0 0 100
PARTICIPATING
IN A PEACEFUL
DEMONSTRATION
28 45 25 1 2 100
RUNNING FOR PUBLIC
OFFICE25 45 26 1 3 100
ENCOUNTERING ANP 54 33 12 0 1 100
ENCOUNTERING ANA 58 29 12 0 1 100
TRAVELING FROM ONE
PART OF AFGHANISTAN TO
ANOTHER PART OF THE
COUNTRY
23 50 26 0 1 100
ENCOUNTERING
INTERNATIONAL FORCES22 44 32 0 1 100
FIG. 2.3: Q-31. I will read you a list of different activities that you could participate in. Please, tell me whether you would participate in the following activities with no fear, some fear, or a lot of fear?
Respondents surveyed from insecure and AOG-controlled areas, referred to as “intercept respondents” because they were intercepted while traveling to or from inaccessible areas,13 report higher levels of fear than the national average for all seven situations listed, especially participating in an election, running for public o$ce, and encountering the ANP. Among the main sample, the number of respondents who report feeling some or a lot of fear when encountering ANP o$cers decreased from 51.4% in 2013 to 45.3% in 2014, and for encountering ANA o$cers, those who say some or a lot of fear dropped from 48.4% in 2013 to 41.1% in 2014 (Fig. 2.4).14 Controlling for gender and province, Afghans within insecure areas are 23.0% less likely to report fear when encountering the ANA in 2014 compared to 2013, and 17.0% less likely to report fear when encountering the ANP.15 A portion of these changes can be explained by overall optimism about the elections. Afghans who felt that the 2014 elections would make a positive di#erence in their life were signi"cantly less likely to report feeling fear when encountering the ANA and ANP, even controlling for gender, province, and whether or not they feel they can in%uence government decisions.!ese changes may also correspond with increased exposure to ANSF forces, since the ANSF have had a much more visible presence in Afghanistan in recent years, primarily from outreach and increasing numbers.

Security 35
FEAR WHEN ENCOUNTERING ANSF
51
61
48
57
45
55
4144
0%
10%
20%
30%
40%
50%
60%
70%
FEAR OF ANP (MAIN SAMPLE)
FEAR OF ANP (INTERCEPT INTERVIEWS)
FEAR OF ANA (MAIN SAMPLE)
FEAR OF ANA (INTERCEPT INTERVIEWS)
2013 2014
FIG. 2.4: Q-31. Now I will read you a list of different activities that you could participate in. Please tell me whether you would participate in the following activities with no fear, some fear, or a lot of fear? e) Encountering the ANP, f) Encountering the ANA. (percentage of respondents who answered no, some or a lot of fear)
On a regional level, fear of encountering the ANP or ANA is highest in the South West and Central/Hazarajat regions and lowest in the Central/Kabul region. Compared to fear of encountering the ANSF, Afghans report signi"cantly higher levels of fear when encountering international forces. !is may be because compared to the ANSF, foreign forces tend to travel with heavier artillery and larger convoys than national security forces, and can lack Afghan cultural and linguistic skills. In total, 76.6% of Afghans report some or a lot of fear when meeting international military forces, a percentage virtually unchanged since 2013.
Exposure to corruption may explain some feelings of fear when encountering the ANSF. Afghans who report that they had to pay bribes to the ANA and/or ANP in the past year are signi"cantly more likely to say they fear encountering these forces. Six out of every 10 Afghans who report that they paid a bribe to the ANP also say that they fear encountering ANP o$cers, compared to three out of every 10 who did not pay a bribe to the ANP. Similarly, six out of 10 Afghans who paid bribes to the ANA say they fear encountering ANA o$cers, compared to four out of 10 who did not pay a bribe to an ANA o$cer.
Afghanistan in 201436
2.2 Crime and Violence
Key QuestionsQ-21. Have you or has anyone in your family suffered from violence or from some criminal
act in the past year?
Q-22. What kinds of violence or crimes did you or someone in your family experience in the past year?
Q-23. Were the crimes or violent acts reported to anybody outside your family or not?
Q-24. Who did you report the crime to?
Q-25. If you were a victim of violence or any criminal act in the future, how much confidence would you have that the guilty party would be punished?
Q-26. In your view, what is the biggest cause of crime in Afghanistan?
While a majority of Afghans express fear for their personal safety on some level, only 15.6% report that they or a member of their family have su#ered from violence or crime in the past year. !ose who have experienced violence or crime are signi"cantly more likely to report feeling fear for their personal safety (75.0%) than those who have not (63.5%). !e percentage of Afghans who report su#ering violence or crime is highest in Logar (39.0%), Ghor (37.5%), and Helmand (37.0%) provinces. Provinces with the lowest level of fear for personal safety are also the provinces with the fewest reports of experience with violence or crime: 1.5% in Panjshir, 2.3% in Badakhshan, and 1.0% in Bamyan.
Crime and violence appear to follow geographic patterns, similar to crime patterns in other countries. For example, Afghans are more likely to say they experienced violence or crime if they live in a rural area (17.2%) than an urban area (10.5%), and respondents who live in provinces that border Pakistan or Iran are more likely to have su#ered violence and crime than provinces that do not share a border with any other neighboring country (Fig 2.5). Geographic patterns re%ect varying proportions of crime and violence among ethnic groups as well, where Pashtuns (20.0%) and Tajiks (13.5%) are more likely to say they experienced violence or crime than Uzbeks (11.8%) or Hazaras (10.0%).
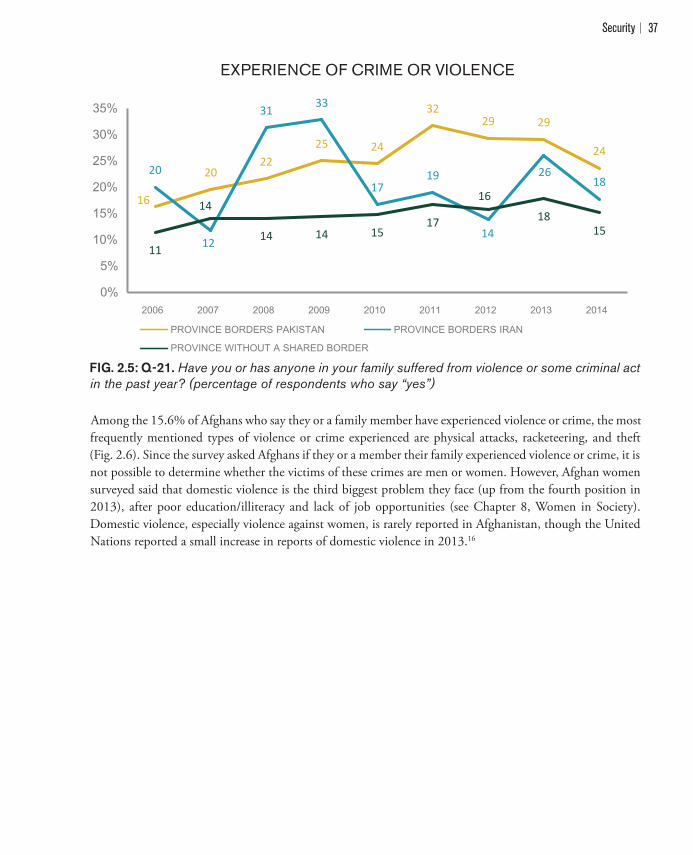
Security 37
16
2022
25 24
3229 29
2420
12
31 33
1719
14
2618
11
14
14 14 1517
16
1815
0%
5%
10%
15%
20%
25%
30%
35%
2006 2007 2008 2009 2010 2011 2012 2013 2014
PROVINCE BORDERS PAKISTAN PROVINCE BORDERS IRAN
PROVINCE WITHOUT A SHARED BORDER

Afghanistan in 201438
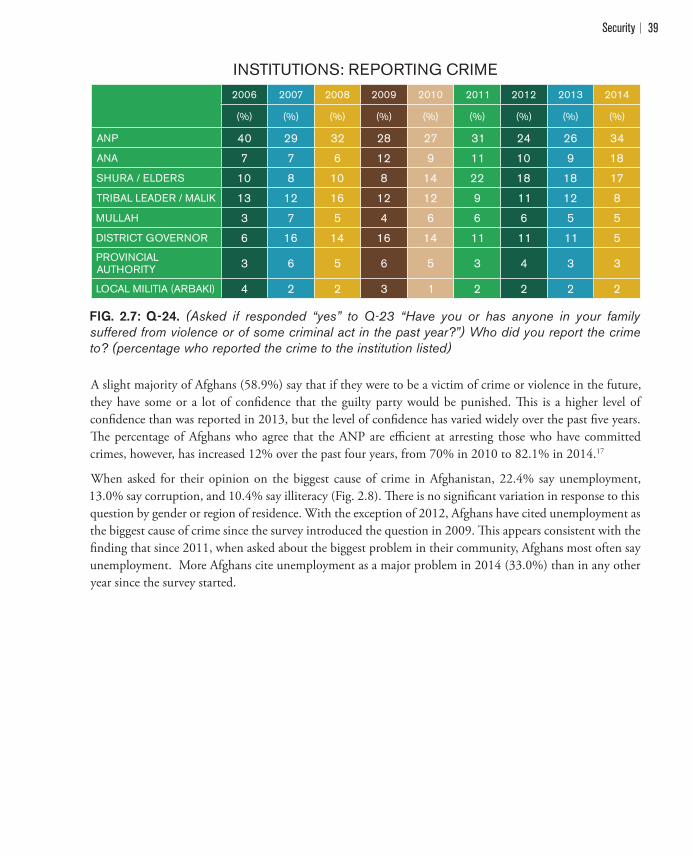
Security 39

Afghanistan in 201440
BIGGEST CAUSE OF CRIME
�
21 20 19
16
23 22
13 19
10 11
13 13
7 6 8
6
9 10
11 6 8
5 8 8
4 3
4
17
4 3 0%
5%
10%
15%
20%
25%
2009 2010 2011 2012 2013 2014
UNEMPLOYMENT CORRUPTION ILLITERACY POVERTY TALIBAN
FIG. 2.8: Q-26. In your view, what is the biggest cause of crime in Afghanistan? (percentage of respondents citing each cause)
2.3 Perceptions of the Afghan National Security Forces
Key QuestionsQ-17. I’m going to read some statements to you about the Afghan National Army (ANA).
ANA soldiers are the ones who wear dark green and brown camouflage uniforms. Please tell me if you agree or disagree with each statement. a) The ANA is honest and fair with the Afghan people, b) The ANA helps improve security in Afghanistan, c) The ANA protects civilians.
Q-18. I’m going to read some statements to you about the Afghan National Police (ANP). ANP officers are the ones who wear solid blue-grey colored uniforms. Please tell me if you agree or disagree with each statement. a) The ANP is honest and fair with the Afghan people, b) The ANP helps improve security in Afghanistan, c) The ANP is efficient at arresting those who have committed crimes.
Q-19. Now, please tell me if you think that the following need foreign support to do their job properly at the moment? Do you strongly agree, somewhat agree, somewhat disagree, or strongly disagree? a) Afghan National Army, b) Afghan National Police, c) Afghan Local Police.
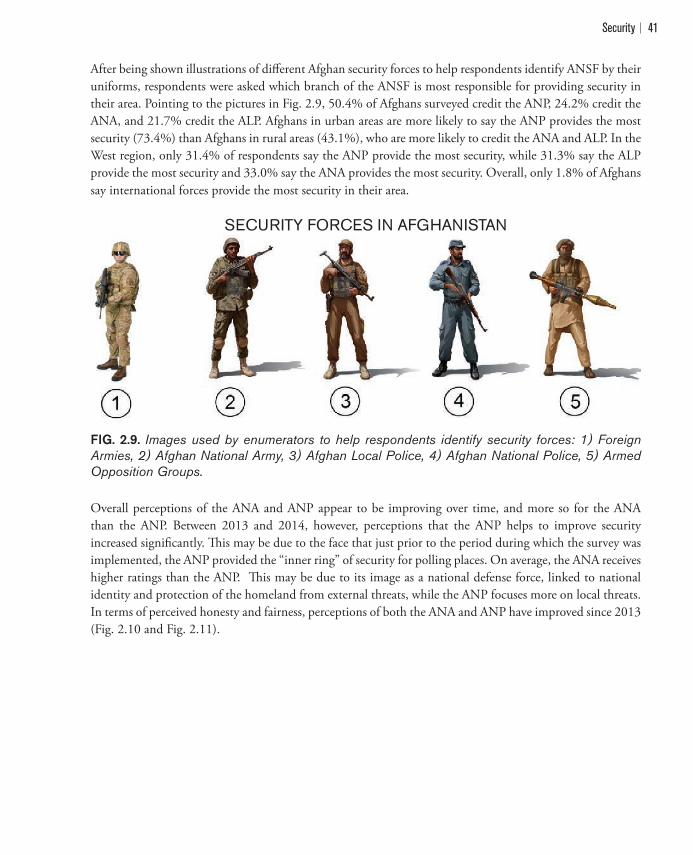
Security 41
After being shown illustrations of di#erent Afghan security forces to help respondents identify ANSF by their uniforms, respondents were asked which branch of the ANSF is most responsible for providing security in their area. Pointing to the pictures in Fig. 2.9, 50.4% of Afghans surveyed credit the ANP, 24.2% credit the ANA, and 21.7% credit the ALP. Afghans in urban areas are more likely to say the ANP provides the most security (73.4%) than Afghans in rural areas (43.1%), who are more likely to credit the ANA and ALP. In the West region, only 31.4% of respondents say the ANP provide the most security, while 31.3% say the ALP provide the most security and 33.0% say the ANA provides the most security. Overall, only 1.8% of Afghans say international forces provide the most security in their area.
SECURITY FORCES IN AFGHANISTAN
FIG. 2.9. Images used by enumerators to help respondents identify security forces: 1) Foreign Armies, 2) Afghan National Army, 3) Afghan Local Police, 4) Afghan National Police, 5) Armed Opposition Groups.
Overall perceptions of the ANA and ANP appear to be improving over time, and more so for the ANA than the ANP. Between 2013 and 2014, however, perceptions that the ANP helps to improve security increased signi"cantly. !is may be due to the face that just prior to the period during which the survey was implemented, the ANP provided the “inner ring” of security for polling places. On average, the ANA receives higher ratings than the ANP. !is may be due to its image as a national defense force, linked to national identity and protection of the homeland from external threats, while the ANP focuses more on local threats. In terms of perceived honesty and fairness, perceptions of both the ANA and ANP have improved since 2013 (Fig. 2.10 and Fig. 2.11).
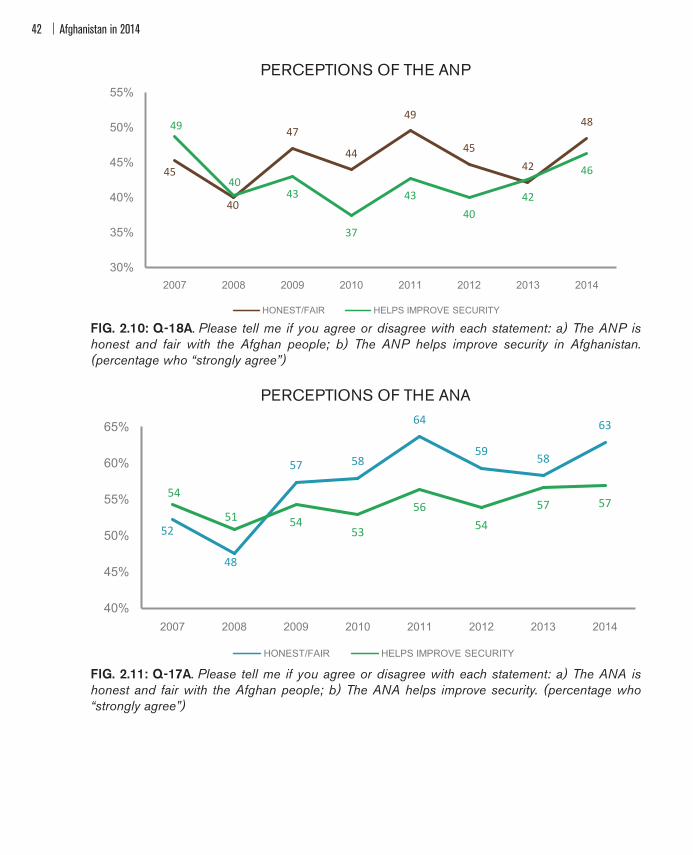
Afghanistan in 201442
PERCEPTIONS OF THE ANP
45
40
47
44
49
4542
4849
4043
37
4340
42
46
30%
35%
40%
45%
50%
55%
2007 2008 2009 2010 2011 2012 2013 2014
HONEST/FAIR HELPS IMPROVE SECURITY
FIG. 2.10: Q-18A. Please tell me if you agree or disagree with each statement: a) The ANP is honest and fair with the Afghan people; b) The ANP helps improve security in Afghanistan. (percentage who “strongly agree”)
PERCEPTIONS OF THE ANA
52
48
57 58
64
59 58
63
54
51 5453
5654
57 57
40%
45%
50%
55%
60%
65%
2007 2008 2009 2010 2011 2012 2013 2014
HONEST/FAIR HELPS IMPROVE SECURITY
FIG. 2.11: Q-17A. Please tell me if you agree or disagree with each statement: a) The ANA is honest and fair with the Afghan people; b) The ANA helps improve security. (percentage who “strongly agree”)

Security 43
Using a composite measure of overall con"dence,18 86.5% of Afghans expressed con"dence in the ANA in 2014, while 73.2% expressed con"dence in the ANP. At the national level, there are no signi"cant di#erences between 2013 and 2014 con"dence levels. However, the year-to-year regional variations for the ANP are greater than for the ANA. Con"dence in the ANP decreased 19% in the South West region, followed by 7% decreases in the East and West regions. Con"dence in the ANP increased by 9% in the Central/Kabul region and 13% in the South East region. !e regions with the highest con"dence in the ANP are the North East (84.2%) and North West (82.6%), and those with the lowest are the West (55.1%) and South West (56.7%) regions.
Con"dence in the ANA, by comparison, decreased 11% in the Central/Hazarajat and South West regions since 2013, but remains steady across all other regions. !e regions with the highest con"dence in the ANA are Central/Kabul (91.2%), the East (90.3%), the South East (91.5%), and the North East (91.4%). !e West (75.8%), South West (75.8%), and Central/Hazarajat (77.6%) regions report lower levels of con"dence in the ANA.
While con"dence in the ANA and ANP is very high in many provinces, 55.7% of Afghans say they think that the ANSF still need foreign support to do their job properly. Urban residents (67.9%) are more likely than rural residents (51.8%) to say the ANSF still need foreign support. Con"dence that the ANSF can operate without foreign support is highly localized, even within a single geographic region. For example, the four provinces that comprise the South East region: 91.5% of Afghans in Paktiya say the ANSF need foreign support, compared to 56.8% in Paktika, 13.8% in Khost, and 51.5% in Ghazni.
Since 2007, the perception that the ANSF needs foreign support to operate has increased. However, there are provincial variations. Figure 2.12 shows which provinces have grown more and less likely to agree that the ANSF needs foreign support.
PERCEPTIONS OF ANSF BY PROVINCEMORE LIKELY, OVER TIME, TO SAY ANSF NEEDS
FOREIGN SUPPORT TO DO THEIR JOB PROPERLY:
LESS LIKELY, OVER TIME, TO SAY ANSF NEEDS
FOREIGN SUPPORT TO DO THEIR JOB PROPERLY:
Nangarhar Jawzjan
Uruzghan Sar-i-Pul
Kandahar Badakshan
Helmand Zabul
Nooristan Khost
FIG. 2.12: Q-19. Now, please tell me if you think that the following need foreign support to do their job properly at the moment? Do you strongly agree, somewhat agree, somewhat disagree, or strongly disagree?

Afghanistan in 201444
Men from insecure areas who were polled during intercept interviews were less likely than those from more secure areas (who were polled using random sampling) to express con"dence in the ANSF. Two in three (66.7%) intercept interviewees from insecure areas reported con"dence in the ANA, and 51.9% reported con"dence in ANP. Men from insecure areas were just as likely as their counterparts from more secure areas to believe that the ANSF still need foreign support, though they were slightly more con"dent in the ability of the ALP to operate without foreign support.
2.4 Peace and Reconciliation
Key QuestionsQ-55. Do you think reconciliation efforts between the Afghan government and armed
opposition groups can help to stabilize the country, or not?
Q-56. In your opinion, what is the main reason that the armed opposition groups are fighting against the Afghan government?
Q-57. Thinking about the reasons why armed opposition groups have been fighting during the past year, in general, would you say that you have a lot of sympathy, a little sympathy, or no sympathy at all for these groups?
E#orts by the Afghan government to reconcile with members of AOGs have proceeded on multiple levels for several years. !e survey asked Afghans if they know of a reconciliation project that has taken place in their area. Afghans in the East, North East, and South West regions were more likely to respond “yes,” especially in Nangarhar (30.8%), Wardak (26.0%), Helmand (25.3%), Zabul (23.9%), and Kunar (22.7%) provinces. Afghans in rural areas report knowing of reconciliation e#orts at a higher rate (14.0%) than urban respondents (7.2%).
Regardless of their knowledge of the presence or absence of reconciliation e#orts in their communities, nearly three-quarters of Afghans (72.6%) say such e#orts can help stabilize the country. !e percentage of Afghans who believe reconciliation can help stabilize the country has remained steady over the last "ve years, with the exception of a dip to 63.4% in 2013.19 Among intercept interviewees living in insecure areas, 76.7% in 2014 think the government’s reconciliation e#orts and negotiations will be successful, up from 68.4% in 2013 Con"dence in reconciliation e#orts is lowest in Panjshir (22.3%), Daikundi (48.0%), Balkh (56.4%), and Wardak (58.3%) provinces (Fig. 2.13). Con"dence is highest in the East, South East, West, and South West regions, which have seen the greatest share of con%ict with AOGs. A higher percentage of men (76.8%) than women (68.7%) believe reconciliation e#orts can be e#ective in stabilizing the country.
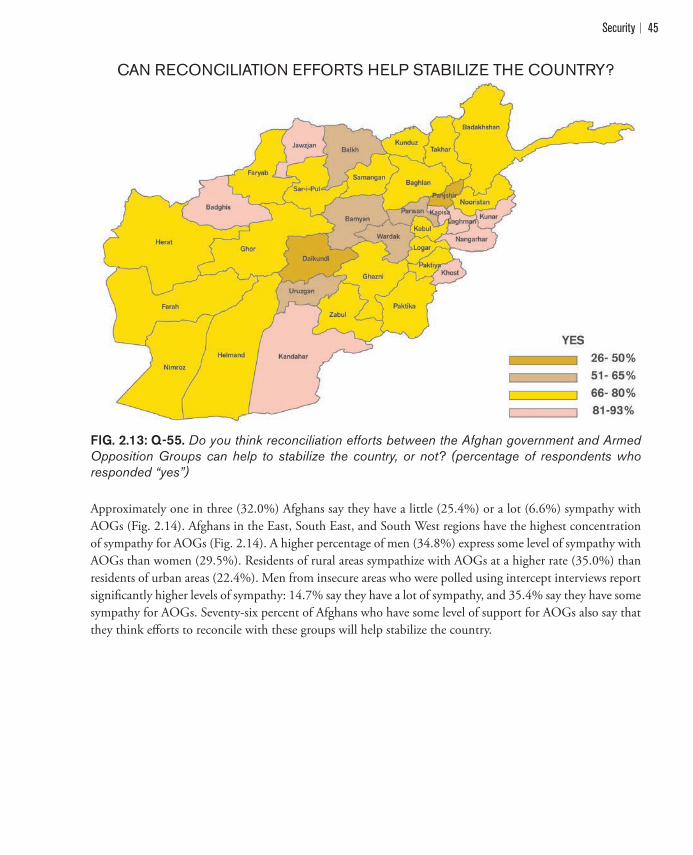
Security 45
CAN RECONCILIATION EFFORTS HELP STABILIZE THE COUNTRY?
FIG. 2.13: Q-55. Do you think reconciliation efforts between the Afghan government and Armed Opposition Groups can help to stabilize the country, or not? (percentage of respondents who responded “yes”)
Approximately one in three (32.0%) Afghans say they have a little (25.4%) or a lot (6.6%) sympathy with AOGs (Fig. 2.14). Afghans in the East, South East, and South West regions have the highest concentration of sympathy for AOGs (Fig. 2.14). A higher percentage of men (34.8%) express some level of sympathy with AOGs than women (29.5%). Residents of rural areas sympathize with AOGs at a higher rate (35.0%) than residents of urban areas (22.4%). Men from insecure areas who were polled using intercept interviews report signi!cantly higher levels of sympathy: 14.7% say they have a lot of sympathy, and 35.4% say they have some sympathy for AOGs. Seventy-six percent of Afghans who have some level of support for AOGs also say that they think e"orts to reconcile with these groups will help stabilize the country.
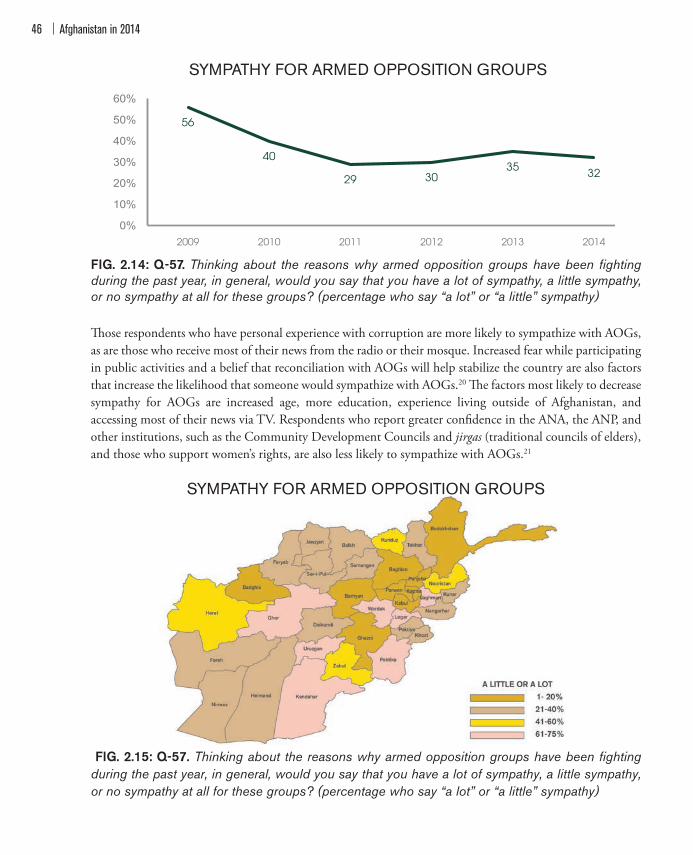
Afghanistan in 201446
SYMPATHY FOR ARMED OPPOSITION GROUPS
56
40
29 3035 32
0%
10%
20%
30%
40%
50%
60%
2009 2010 2011 2012 2013 2014
FIG. 2.14: Q-57. Thinking about the reasons why armed opposition groups have been fighting during the past year, in general, would you say that you have a lot of sympathy, a little sympathy, or no sympathy at all for these groups? (percentage who say “a lot” or “a little” sympathy)
!ose respondents who have personal experience with corruption are more likely to sympathize with AOGs, as are those who receive most of their news from the radio or their mosque. Increased fear while participating in public activities and a belief that reconciliation with AOGs will help stabilize the country are also factors that increase the likelihood that someone would sympathize with AOGs.20 !e factors most likely to decrease sympathy for AOGs are increased age, more education, experience living outside of Afghanistan, and accessing most of their news via TV. Respondents who report greater con"dence in the ANA, the ANP, and other institutions, such as the Community Development Councils and jirgas (traditional councils of elders), and those who support women’s rights, are also less likely to sympathize with AOGs.21
SYMPATHY FOR ARMED OPPOSITION GROUPS
FIG. 2.15: Q-57. Thinking about the reasons why armed opposition groups have been fighting during the past year, in general, would you say that you have a lot of sympathy, a little sympathy, or no sympathy at all for these groups? (percentage who say “a lot” or “a little” sympathy)
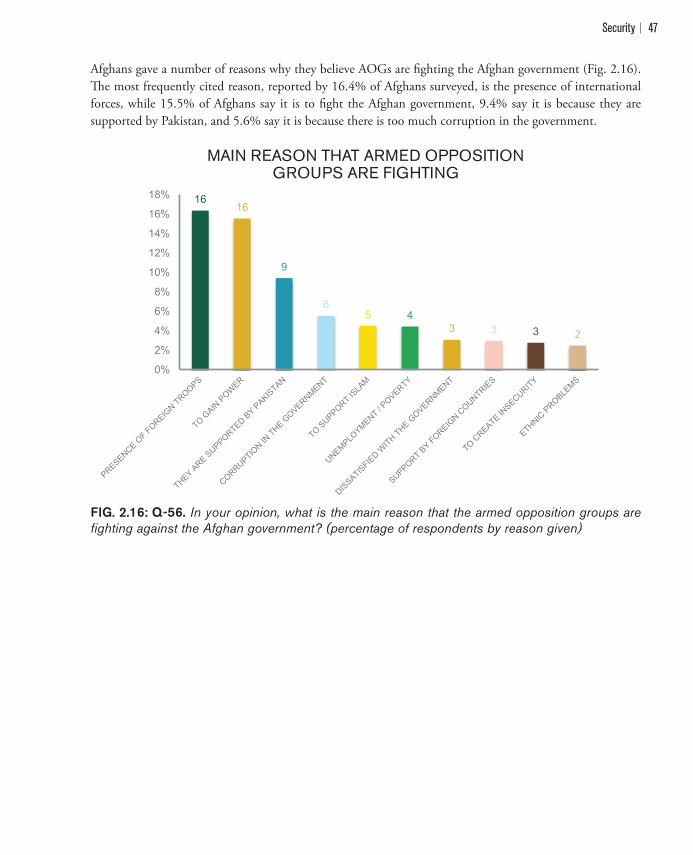
Security 47
Afghans gave a number of reasons why they believe AOGs are "ghting the Afghan government (Fig. 2.16). !e most frequently cited reason, reported by 16.4% of Afghans surveyed, is the presence of international forces, while 15.5% of Afghans say it is to "ght the Afghan government, 9.4% say it is because they are supported by Pakistan, and 5.6% say it is because there is too much corruption in the government.
MAIN REASON THAT ARMED OPPOSITION GROUPS ARE FIGHTING�
�
16 16
9
6 5 4
3 3 3 2
0%
2%
4%
6%
8%
10%
12%
14%
16%
18%
FIG. 2.16: Q-56. In your opinion, what is the main reason that the armed opposition groups are fighting against the Afghan government? (percentage of respondents by reason given)
Afghanistan in 201448
Endnotes1 International Security Assistance Force, “International Security Assistance Force: Key Facts and Figures,” June 2014,
http://www. nato.int/nato_static/assets/pdf/pdf_2014_06/20140603_140603-ISAF-Placemat-"nal.pdf.2 North Atlantic Treaty Organization, “Developing Afghan Security Forces” (April 10, 2014).3 Katzman, Kenneth, “Afghanistan: Post-Taliban Governance, Security and U.S. Policy,” Congressional Research Service, May 29,
2014, 27.4 Ahmed, Azam. “Taliban Making Military Gains in Afghanistan.” !e New York Times. July 26, 2014.5 International Crisis Group, “Afghanistan’s Insurgency After the Transition,” 12 May 2014, http://www.crisisgroup.org/en/regions/
asia/south-asia/afghanistan/256-afghanistan-s-insurgency-after-the-transition.aspx.6 United Nations Assistance Mission in Afghanistan, “Protection of Civilians in Armed Con%ict: Midyear Report 2014” (Kabul:
July 2014), http://unama.unmissions.org/LinkClick.aspx?"leticket=m_XyrUQDKZg%3D&; UNAMA, “Protection of Civilians in Armed Con%ict: Annual Report 2013” (Kabul: February 2014).
7 Pugliese, David. “Holding the line: Will Afghan security forces be able to stand up to the enemy after foreign soldeirs leave for good?.” Ottawa Citizen. February 19, 2014. http://www.ottawacitizen.com/story_print.html?id=9526478&sponsor.
8 United Nations Development Programme. “Afghanistan: Annual Report 2013.” 9 Katzman, 37.10 Respondents from insecure and inaccessible areas were surveyed using “intercept interviews,” a convenience sampling technique.
!ese respondents are treated as separate from the main sample, which is based on random sampling techniques. Intercept interviews are used as a reference point to estimate how security impacts perceptions.
11 Con"dence in ANA is a scale (Į=0.8118) using questions q17a, q17b and q17c, which measures the extent to which someone believes ANA is honest and fair with people, improves security, and protects civilians. Con"dence in ANP is a scale (Į=0.8163) using questions q18a, q18b and q18c, which measures the extent to which someone believes ANP is honest and fair with people, improves security, and e$cient in arresting criminals.
12 Perception of corruption being a major problem is a scale (Į=0.7683) using questions q27a, q27b, q27c, q27d and q27e, which measures the extent to which someone believes corruption is a problem in his or her daily life, neighborhood, local authorities, provincial government and the whole country. Perception that the ANSF require foreign support is a scale (Į=0.8203) using questions q19a, q19b and q19c questions, which measures the extent to which someone believes ANA, ANP and ALP require foreign support to do their job properly. Using OLS regression, fear for personal safety (q20) was regressed on a variety of attitudinal and demographic measures, including geographic region (m6b), income (LnIncome), con"dence in ANP, con"dence in ANA, perception of Afghan National Security Forces in need of foreign support, a corruption scale, sympathy for Armed Opposition Groups (q57), having a family member being a victim of a crime (q33) and in%uence on local government institutions. !e model was weighted by urban/rural and excluding intercepts. A 95% con"dence level was imposed for all coe$cients. !e full model explained 8.67% of the variance in fear for personal safety (R2=.867, F(9,8116)=85.66, p<.0001).
13 Intercept interviews were "rst introduced as a survey technique in 2013 as a means to access insecure areas where travel is too insecure for enumerators. It reduces the rate at which districts much be replaced for safer ones, because respondents are intercepted in safer areas, such as a bazaar, while traveling to their home district. !ese are all male respondents, both because it is more culturally acceptable for enumerators to approach men in public places than to approach women, and because men from insecure districts are more able to travel compared to women. As a convenience sample, rather than a simple random sample, these interviews are treated as a separate cohort from the main sample and are not re%ected in the summary statistics except as a point of reference or comparison.
14 !e "gure cited in the 2013 Survey Report for somewhat or a lot of fear when encountering the ANP was 52%. !is "gure included intercept interviewees in its calculations, which in 2014 are treated as separate from the main sample in all calculations. For the record, a correction is necessary for the 2013 Survey Report’s citation of fear when encountering ANA (p 41). !e "gure was listed as 39% when the actual "gure was 49%, again re%ecting the combination of main sample interviews with intercept interviewees. In 2014, all "gures re%ect the separation of these groups for consistency in sampling technique, since intercept interviews use convenience sampling, while the main sample uses random sampling.
15 Nonlinear probit regression analysis was used to regress fear when encountering ANA on year (2013 vs. 2014), province, and gender. !e coe$cients for all factors were signi"cant, particularly intercept year (beta=-.23, z= 12.14, p<.0001). !e model, while limited, explains 1.3% of the variance in fear when encountering ANA. A second probit analysis shows that respondents in 2014 compared to 2013 are 17.0% less likely to report fear when encountering ANP (beta=-.17, z=8.98, p<.001), again controlling for gender and province. However, this model explains less of the overall variance in fear (R2=.01, p<.0001).
16 United Nations Assistance Mission in Afghanistan, “A Way to Go: An Update on the Implementation of the Law on Elimination of Violence Against Women in Afghanistan,” (Kabul: December 2013). Fewer than 2% of respondents in the Survey of the Afghan People listed sexual violence as the type of violence or crime they experienced.

Security 49
17 Note that the wording of this question changed in 2014. Prior to this year, the question asked for the respondent’s con"dence that the “ANP will arrest the guilty party.” In 2014, the question (Q-18a) asked for their con"dence that the “ANP is e$cient at arresting those who have committed crimes.”
18 Percentage of respondents who “agree” or “strongly agree” with all three statements in Q-17 (ANA), and for both statements in Q-18 (ANP).
19 Similarly, a separate set of surveys also conducted by D3 Systems/ACSOR found that Afghan public support for negotiations has remained steady around 70% since 2010, while the percentage of Afghans who believe the Taliban should continue "ghting rather than negotiating has remained been between 20-30% during that same period. See, John Richardson, D3 Systems, “Prospects for Taliban Reconciliation in Afghanistan,” PowerPoint Presentation, May 2014. http://www.d3systems.com/wp-content/uploads/2014/06/D3-AAPOR-2014_Afghan-Perspectives-on-Taliban-Reconciliation.pdf. !e surveys, conducted as part of the Afghan Futures survey, found that public support for negotiations with the Taliban was similar among men and women.
20 Fear of participating in di#erent public activities is a scale (Į=0.7317) using questions q31a, q31b, q31c, q31d, q31e, q31f and q31g, which measures the extent to which an Afghan fears while voting, demonstrating, running for public o$ce, encountering ANA, encountering ANP, encountering international forces, and traveling to other parts of Afghanistan.
21 Con"dence in formal and informal authorities is a scale (Į=0.8459) using questions q36a, q36b, q36c, q36d, q36e, q36f, q36g, q36h, q36i and q36k, which measures the extent to which an Afghan has con"dence in formal and informal institutions such as Independent Election Commission, Community Development Council, community shuras/jirgas, government ministries, international NGOs, media, national NGOs, parliament, provincial councils, religious leaders and members of parliament. Support for women’s rights is a scale (Į=0.876) using questions q71c, q71d, q71e, q71f, q72, q73a, q73b, q73c, q73d, q73e and q75, which measures the perception and the extent to which an Afghan would support women’s Islamic education, primary school, high school, higher education, education in a di#erent province, and education in another country; support for women to work outside home; support for women to work in government o$ces, work in NGOs, work in schools, work in hospitals, and work with army/police; and support for equal participation of men and women in political leadership as opposed to mostly for men. Using OLS regression, sympathy for AOGs (q57) was regressed on a variety of attitudinal and demographic measures, including income (LnIncome), age (d2), education (d7), source of news (q6), experience of migration outside of Afghanistan (d16), and belief that reconciliation with AOGs can help stabilize the country (q55). !e regression also included scales measuring experience with corruption, fear while participating in public activities, con"dence in formal institutions, con"dence in ANA, con"dence in ANP, views of corruption as a problem, and support for women’s rights. !e model predicts 14.93% of the change in support for AOGs (R2=0.1493, F(16, 6704)=73.53, p<.0001).

Afghanistan in 201450

Economic Growth and Employment 51
3 ECONOMIC GROWTH AND EMPLOYMENTWhen asked about the biggest problem facing Afghanistan today, 25.7% of Afghans cite unemployment, 10.8% an overall poor economy, 6.7% poverty, and 5.3% high prices. Clearly, these economic issues loom large for Afghans across the country. An estimated 36% of Afghans live below the poverty line of $30 USD per month (1,713 Afghanis), and the projected per capita Gross Domestic Product (GDP) for 2014 is $695 USD per year (39,685 Afghanis).1 !is year, around three quarters of Afghans say that in 2014 their economic situation is worse or the same as it was in 2013, and only one-"fth say 2014 has been better.
Afghanistan continues to depend on international aid to fund its development priorities. In recent years, domestic revenue has funded just over half of the country’s total core budget, and only 15% of the development budget.2 Afghanistan’s real GDP growth slowed in 2013, to a rate of only 3.6% after experiencing 14.4% growth in 2012.3 !e economic growth forecast for 2014 is lower than 2013, at 3.5%.4 Meanwhile, despite signi"cant investments in the eradication of the opium industry, poppy cultivation grew 36% from 2012 to 2013,5 and poppy cultivation remains a major contributor to GDP (roughly 15% in 2013, up from 11% in 2012).6
!e value chains that support foreign troops have downsized with the troop drawdown, introducing economic shocks across Afghanistan’s economy. Recent strong performance in the agricultural sector has not compensated for sharp reductions in investment and manufacturing, while growth in services and construction slowed with lack of con"dence in the market.7 Security concerns continue to create economic uncertainty. !e drawdown of international troops and delays over the signing of the Bilateral Security Agreement (BSA) contributed to delays in investment, declining demand for goods and services, declining real estate prices, and an increase in opium production.8
However, this year saw two substantive improvements in Afghanistan’s regulatory and legal framework for private sector development. !e passage of the Minerals Law by the Wolesi Jirga provides a framework for exploratory and extraction licenses for Afghanistan’s minerals. Meanwhile, the Value Added Tax Law is expected to help the government "nance its expenditures through improved mechanisms for taxation. Both laws are expected to improve Afghanistan’s capacity to attract foreign investment.
!is chapter describes Afghans’ perceptions on a range of economic issues, from employment to women’s contribution to household income, to new questions related to migration and household assets.
3.1 Perceptions of the Economy
Key QuestionsQ-2. What are two reasons you think that Afghanistan is going in the right direction?
Q-3. What are two reasons you think that Afghanistan is going in the wrong direction?
Q-4. In your view what are the biggest problems in your local area?
Q-5. In your view, what are the two biggest problems facing Afghanistan as a whole?

Afghanistan in 201452
Economic growth and employment issues play a major role in shaping Afghan public opinion about the overall direction of the country (see Chapter 1, National Mood). Opinion on overall economic growth is mixed, but opinions on employment tend to be more negative. Among the 54.7% of those who say Afghanistan is moving in the right direction, 8.7% say economic revival is a main reason for optimism, and 3.7% cite more job opportunities. Among the 40.5% who say Afghanistan is moving in the wrong direction, 10.1% cite a bad economy as a reason for pessimism, and 22.5% cite unemployment. Unemployment is most often cited by Afghans in the North East (29.4%) region as a reason for the country going in the wrong direction, and least often cited in the West (17.6%). An overall bad economy is cited most often in the Central/Hazarajat region (13.9%) and least often in the South East (5.8%) region (Fig. 3.1).
Other economic reasons given for why Afghanistan is moving in the wrong direction include high prices (3.9%), lack of manufacturing factories, and lack of investment (each less than 1%). Among people who report that Afghanistan is moving in the right direction, other economic reasons include increased salaries for government employees, prospects for mining of natural resources, and access to new products, each representing less than 1% of responses.
NATIONAL MOOD: ECONOMIC REASONS AFGHANISTAN IS GOING IN THE
RIGHT DIRECTION DUE TO:AFGHANISTAN IS GOING IN THE
WRONG DIRECTION DUE TO:
ECONOMIC REVIVALMORE JOB
OPPORTUNITIES AVAILABLE
BAD ECONOMY UNEMPLOYMENT
(%) (%) (%) (%)
CENTRAL / KABUL 10 4 11 23
EAST 10 7 11 20
SOUTH EAST 7 2 6 20
SOUTH WEST 12 5 10 26
WEST 10 4 13 18
NORTH EAST 7 5 10 29CENTRAL / HAZARAJAT 6 <0.5 14 23
NORTH WEST 4 1 9 19
OVERALL 9 4 10 23
FIG. 3.1: Q-2A/B. (Ask if answered “1 – Right direction” to Q-1) What are two reasons you think that Afghanistan is going in the right direction; Q-3A/B (Ask if answered “2 – Wrong direction” to Q-1) What are two reasons you think that Afghanistan is going in the wrong direction? (percentage of respondents who cited economic and employment reasons for pessimism or optimism)
When respondents are asked about the two biggest problems facing Afghanistan as a whole, economic factors are again cited: 25.7% of Afghans say unemployment and 10.8% say a poor economy in general. Unemployment is more often cited in urban areas (37.1%) than rural areas (22.2%), and the same pattern holds for those who say a poor economy (13.0% in urban areas, and 10.2% in rural areas).9 10
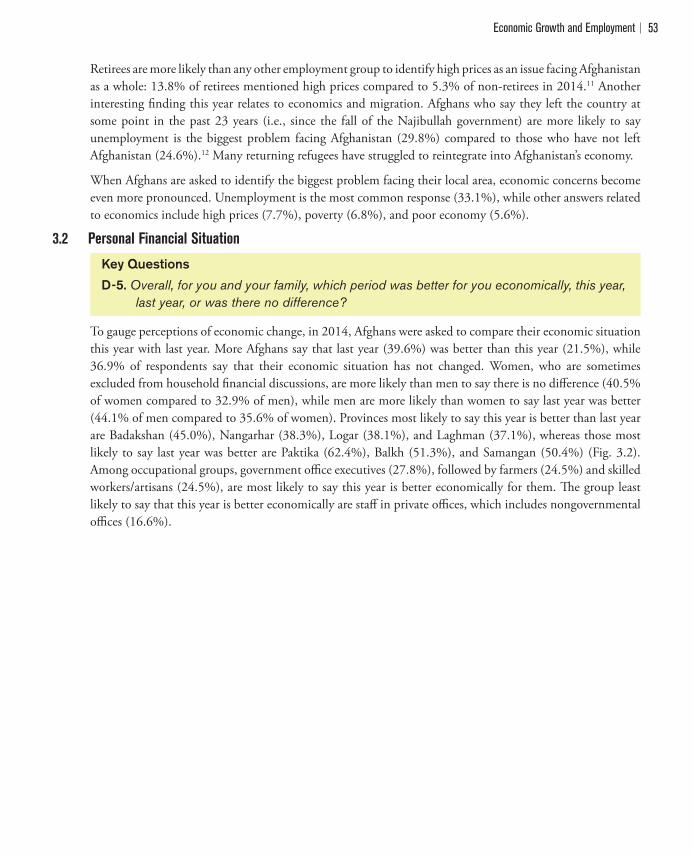
Economic Growth and Employment 53
Retirees are more likely than any other employment group to identify high prices as an issue facing Afghanistan as a whole: 13.8% of retirees mentioned high prices compared to 5.3% of non-retirees in 2014.11 Another interesting "nding this year relates to economics and migration. Afghans who say they left the country at some point in the past 23 years (i.e., since the fall of the Najibullah government) are more likely to say unemployment is the biggest problem facing Afghanistan (29.8%) compared to those who have not left Afghanistan (24.6%).12 Many returning refugees have struggled to reintegrate into Afghanistan’s economy.
When Afghans are asked to identify the biggest problem facing their local area, economic concerns become even more pronounced. Unemployment is the most common response (33.1%), while other answers related to economics include high prices (7.7%), poverty (6.8%), and poor economy (5.6%).
3.2 Personal Financial Situation
Key QuestionsD-5. Overall, for you and your family, which period was better for you economically, this year,
last year, or was there no difference?
To gauge perceptions of economic change, in 2014, Afghans were asked to compare their economic situation this year with last year. More Afghans say that last year (39.6%) was better than this year (21.5%), while 36.9% of respondents say that their economic situation has not changed. Women, who are sometimes excluded from household "nancial discussions, are more likely than men to say there is no di#erence (40.5% of women compared to 32.9% of men), while men are more likely than women to say last year was better (44.1% of men compared to 35.6% of women). Provinces most likely to say this year is better than last year are Badakshan (45.0%), Nangarhar (38.3%), Logar (38.1%), and Laghman (37.1%), whereas those most likely to say last year was better are Paktika (62.4%), Balkh (51.3%), and Samangan (50.4%) (Fig. 3.2). Among occupational groups, government o$ce executives (27.8%), followed by farmers (24.5%) and skilled workers/artisans (24.5%), are most likely to say this year is better economically for them. !e group least likely to say that this year is better economically are sta# in private o$ces, which includes nongovernmental o$ces (16.6%).

Afghanistan in 201454
OVERALL, FOR YOU AND YOUR FAMILY, WHICH PERIOD WAS BETTER FOR YOU ECONOMICALLY?
FIG. 3.2: D-5. Overall, for you and your family, which period was better for you economically, this year, last year, or was there no difference? (most common response by province)
3.3 The Economy and Migration
Key QuestionsD-16. Have you lived outside of Afghanistan in another country at any time in the past 23 years? For reference, 23 years ago was the fall of Dr. Najibullah’s government and
the start of mujahedin government.
D-17A. In what country or countries have you lived?
D-17B. How long in years did you live in this country?
D-17C. What is the main reason you left?
D-18. Inside Afghanistan, have you ever moved from one province to another province in the past 23 years? For reference, 23 years ago was the fall of Dr. Najibullah’s government and the start of mujahedin government?
D-19A. In what provinces have you lived?
D-19C. What is the main reason you left?
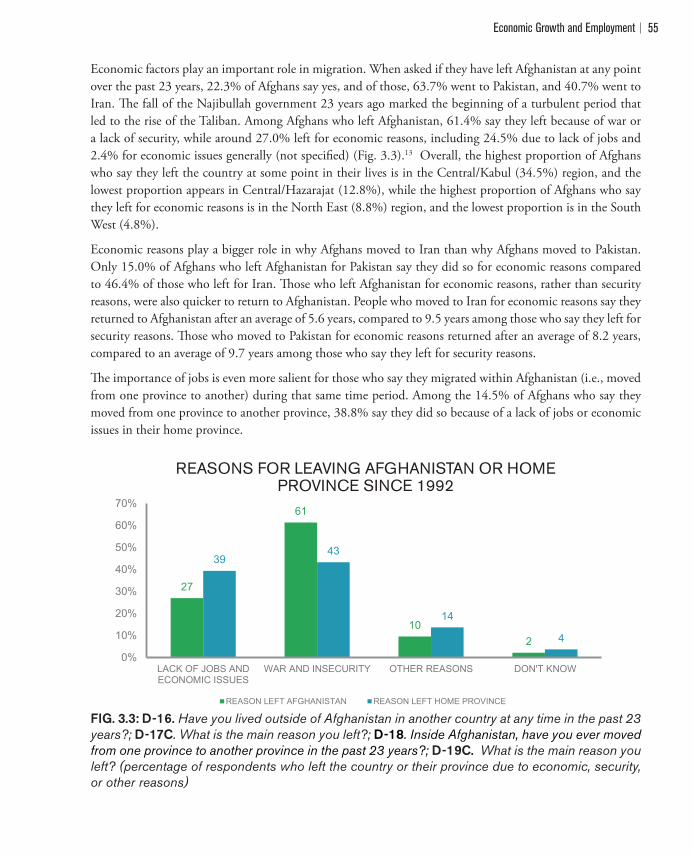
Economic Growth and Employment 55
Economic factors play an important role in migration. When asked if they have left Afghanistan at any point over the past 23 years, 22.3% of Afghans say yes, and of those, 63.7% went to Pakistan, and 40.7% went to Iran. !e fall of the Najibullah government 23 years ago marked the beginning of a turbulent period that led to the rise of the Taliban. Among Afghans who left Afghanistan, 61.4% say they left because of war or a lack of security, while around 27.0% left for economic reasons, including 24.5% due to lack of jobs and 2.4% for economic issues generally (not speci"ed) (Fig. 3.3).13 Overall, the highest proportion of Afghans who say they left the country at some point in their lives is in the Central/Kabul (34.5%) region, and the lowest proportion appears in Central/Hazarajat (12.8%), while the highest proportion of Afghans who say they left for economic reasons is in the North East (8.8%) region, and the lowest proportion is in the South West (4.8%).
Economic reasons play a bigger role in why Afghans moved to Iran than why Afghans moved to Pakistan. Only 15.0% of Afghans who left Afghanistan for Pakistan say they did so for economic reasons compared to 46.4% of those who left for Iran. !ose who left Afghanistan for economic reasons, rather than security reasons, were also quicker to return to Afghanistan. People who moved to Iran for economic reasons say they returned to Afghanistan after an average of 5.6 years, compared to 9.5 years among those who say they left for security reasons. !ose who moved to Pakistan for economic reasons returned after an average of 8.2 years, compared to an average of 9.7 years among those who say they left for security reasons.
!e importance of jobs is even more salient for those who say they migrated within Afghanistan (i.e., moved from one province to another) during that same time period. Among the 14.5% of Afghans who say they moved from one province to another province, 38.8% say they did so because of a lack of jobs or economic issues in their home province.
REASONS FOR LEAVING AFGHANISTAN OR HOME PROVINCE SINCE 1992
27
61
102
3943
14
4
0%
10%
20%
30%
40%
50%
60%
70%
LACK OF JOBS ANDECONOMIC ISSUES
WAR AND INSECURITY OTHER REASONS DON'T KNOW
REASON LEFT AFGHANISTAN REASON LEFT HOME PROVINCE
FIG. 3.3: D-16. Have you lived outside of Afghanistan in another country at any time in the past 23 years?; D-17C. What is the main reason you left?; D-18. Inside Afghanistan, have you ever moved from one province to another province in the past 23 years?; D-19C. What is the main reason you left? (percentage of respondents who left the country or their province due to economic, security, or other reasons)
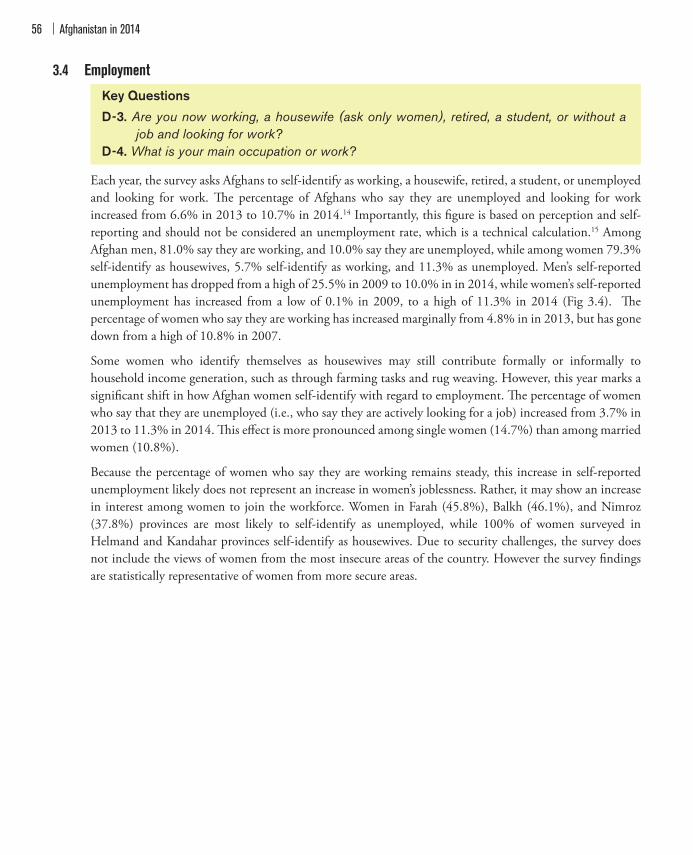
Afghanistan in 201456
3.4 Employment
Key QuestionsD-3. Are you now working, a housewife (ask only women), retired, a student, or without a
job and looking for work?D-4. What is your main occupation or work?
Each year, the survey asks Afghans to self-identify as working, a housewife, retired, a student, or unemployed and looking for work. !e percentage of Afghans who say they are unemployed and looking for work increased from 6.6% in 2013 to 10.7% in 2014.14 Importantly, this "gure is based on perception and self-reporting and should not be considered an unemployment rate, which is a technical calculation.15 Among Afghan men, 81.0% say they are working, and 10.0% say they are unemployed, while among women 79.3% self-identify as housewives, 5.7% self-identify as working, and 11.3% as unemployed. Men’s self-reported unemployment has dropped from a high of 25.5% in 2009 to 10.0% in in 2014, while women’s self-reported unemployment has increased from a low of 0.1% in 2009, to a high of 11.3% in 2014 (Fig 3.4). !e percentage of women who say they are working has increased marginally from 4.8% in in 2013, but has gone down from a high of 10.8% in 2007.
Some women who identify themselves as housewives may still contribute formally or informally to household income generation, such as through farming tasks and rug weaving. However, this year marks a signi"cant shift in how Afghan women self-identify with regard to employment. !e percentage of women who say that they are unemployed (i.e., who say they are actively looking for a job) increased from 3.7% in 2013 to 11.3% in 2014. !is e#ect is more pronounced among single women (14.7%) than among married women (10.8%).
Because the percentage of women who say they are working remains steady, this increase in self-reported unemployment likely does not represent an increase in women’s joblessness. Rather, it may show an increase in interest among women to join the workforce. Women in Farah (45.8%), Balkh (46.1%), and Nimroz (37.8%) provinces are most likely to self-identify as unemployed, while 100% of women surveyed in Helmand and Kandahar provinces self-identify as housewives. Due to security challenges, the survey does not include the views of women from the most insecure areas of the country. However the survey "ndings are statistically representative of women from more secure areas.
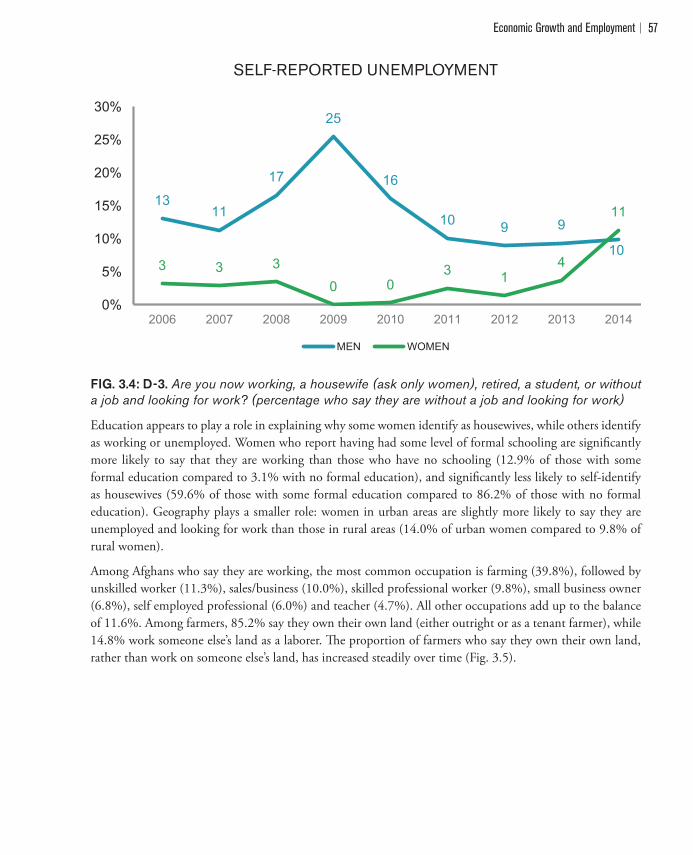
Economic Growth and Employment 57
SELF-REPORTED UNEMPLOYMENT
13 11
17
25
16
10 9 9
10 3 3 3
0 0 3 1
4
11
0%
5%
10%
15%
20%
25%
30%
2006 2007 2008 2009 2010 2011 2012 2013 2014
MEN WOMEN
FIG. 3.4: D-3. Are you now working, a housewife (ask only women), retired, a student, or without a job and looking for work? (percentage who say they are without a job and looking for work)
Education appears to play a role in explaining why some women identify as housewives, while others identify as working or unemployed. Women who report having had some level of formal schooling are signi"cantly more likely to say that they are working than those who have no schooling (12.9% of those with some formal education compared to 3.1% with no formal education), and signi"cantly less likely to self-identify as housewives (59.6% of those with some formal education compared to 86.2% of those with no formal education). Geography plays a smaller role: women in urban areas are slightly more likely to say they are unemployed and looking for work than those in rural areas (14.0% of urban women compared to 9.8% of rural women).
Among Afghans who say they are working, the most common occupation is farming (39.8%), followed by unskilled worker (11.3%), sales/business (10.0%), skilled professional worker (9.8%), small business owner (6.8%), self employed professional (6.0%) and teacher (4.7%). All other occupations add up to the balance of 11.6%. Among farmers, 85.2% say they own their own land (either outright or as a tenant farmer), while 14.8% work someone else’s land as a laborer. !e proportion of farmers who say they own their own land, rather than work on someone else’s land, has increased steadily over time (Fig. 3.5).

Afghanistan in 201458
LAND OWNERSHIP AMONG FARMERS
77 7971 69
73 7479 81
85
23 2129 31
27 2621 19
15
0%
10%
20%
30%
40%
50%
60%
70%
80%
90%
2006 2007 2008 2009 2010 2011 2012 2013 2014
WORK THEIR OWN LAND WORK SOMEONE ELSE'S LAND
FIG 3.5: D4. What is your main occupation or work? (percentage of farmers who say they are landowners or tenant farmers and who say they farm someone else’s land)
Rural men are most likely to be farmers (44.8%), while urban men are most likely to be employed in informal sales (19.6%). Rural women, on the other hand, are most likely to be skilled workers/artisans (28.3%), while urban women are most likely to be employed as schoolteachers (44.7%). Since 2006, the percentage of unskilled laborers has increased from 6.2% to 11.3% of working Afghans, and the percentage of military/police has increased modestly from 1.5% to 2.3%. !e percentage of farmers has decreased signi"cantly in the past year, from 44.2% in 2013 to 39.8% in 2014. !e percentage of teachers, as a percentage share of working Afghans, dropped from a high of 9.9% in 2007 to 5.5% in 2010, and has not changed or varied signi"cantly since then.
Among di#erent age groups, Afghan men between the ages 35-44 (93.5%) are most likely to say they are working, while men age 55 and over (22.0%) are most likely to report being unemployed (Fig. 3.6). Despite an increase in the number of women seeking employment, most women self-identify as housewives across all age brackets (Fig. 3.7).

Economic Growth and Employment 59
EMPLOYMENT BY AGE GROUP: MEN
56
88 94
88
68
33
3 0 0 0 0 0 0 2 10 11 9 6 10
22
0%10%20%30%40%50%60%70%80%90%
100%
18-24 25-34 35-44 45-54 55 AND OVER
WORKING STUDENT RETIRED UNEMPLOYED
FIG 3.6: D-3. Are you now working, a housewife (ask only women), retired, a student, or without a job and looking for work? (percentage of men citing each response)
EMPLOYMENT BY AGE GROUP: WOMEN
6 6 6 6 4
68
83 84 80 85
15
1 0 0 0 12 10 10 14 11
0%10%20%30%40%50%60%70%80%90%
18-24 25-34 35-44 45-54 55 AND OVER
WORKING HOUSEWIFE STUDENT UNEMPLOYED
FIG 3.7: D-3. Are you now working, a housewife (ask only women), retired, a student, or without a job and looking for work? (percentage of women citing each response)
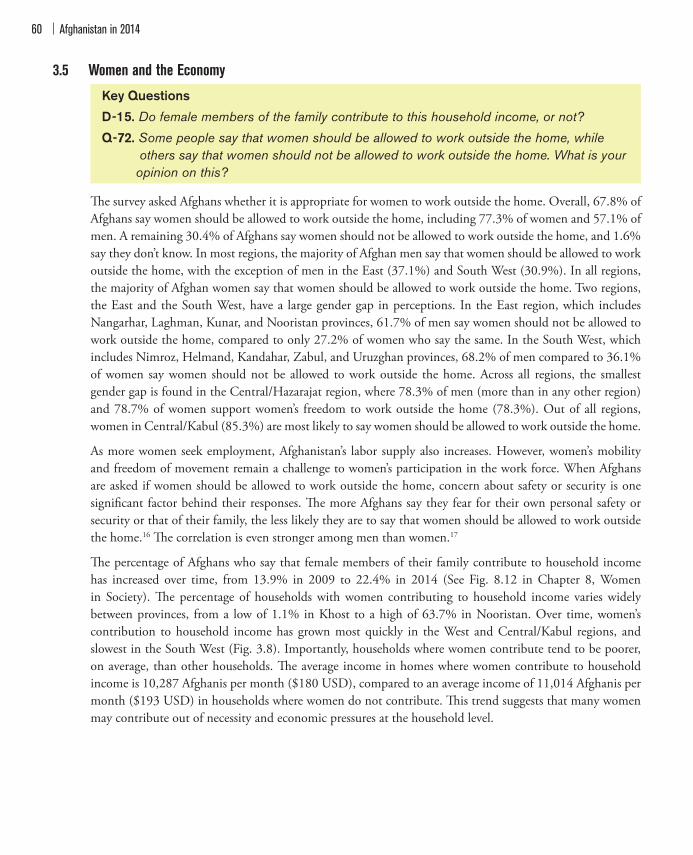
Afghanistan in 201460
3.5 Women and the Economy
Key QuestionsD-15. Do female members of the family contribute to this household income, or not?
Q-72. Some people say that women should be allowed to work outside the home, while others say that women should not be allowed to work outside the home. What is your opinion on this?
!e survey asked Afghans whether it is appropriate for women to work outside the home. Overall, 67.8% of Afghans say women should be allowed to work outside the home, including 77.3% of women and 57.1% of men. A remaining 30.4% of Afghans say women should not be allowed to work outside the home, and 1.6% say they don’t know. In most regions, the majority of Afghan men say that women should be allowed to work outside the home, with the exception of men in the East (37.1%) and South West (30.9%). In all regions, the majority of Afghan women say that women should be allowed to work outside the home. Two regions, the East and the South West, have a large gender gap in perceptions. In the East region, which includes Nangarhar, Laghman, Kunar, and Nooristan provinces, 61.7% of men say women should not be allowed to work outside the home, compared to only 27.2% of women who say the same. In the South West, which includes Nimroz, Helmand, Kandahar, Zabul, and Uruzghan provinces, 68.2% of men compared to 36.1% of women say women should not be allowed to work outside the home. Across all regions, the smallest gender gap is found in the Central/Hazarajat region, where 78.3% of men (more than in any other region) and 78.7% of women support women’s freedom to work outside the home (78.3%). Out of all regions, women in Central/Kabul (85.3%) are most likely to say women should be allowed to work outside the home.
As more women seek employment, Afghanistan’s labor supply also increases. However, women’s mobility and freedom of movement remain a challenge to women’s participation in the work force. When Afghans are asked if women should be allowed to work outside the home, concern about safety or security is one signi"cant factor behind their responses. !e more Afghans say they fear for their own personal safety or security or that of their family, the less likely they are to say that women should be allowed to work outside the home.16 !e correlation is even stronger among men than women.17
!e percentage of Afghans who say that female members of their family contribute to household income has increased over time, from 13.9% in 2009 to 22.4% in 2014 (See Fig. 8.12 in Chapter 8, Women in Society). !e percentage of households with women contributing to household income varies widely between provinces, from a low of 1.1% in Khost to a high of 63.7% in Nooristan. Over time, women’s contribution to household income has grown most quickly in the West and Central/Kabul regions, and slowest in the South West (Fig. 3.8). Importantly, households where women contribute tend to be poorer, on average, than other households. !e average income in homes where women contribute to household income is 10,287 Afghanis per month ($180 USD), compared to an average income of 11,014 Afghanis per month ($193 USD) in households where women do not contribute. !is trend suggests that many women may contribute out of necessity and economic pressures at the household level.
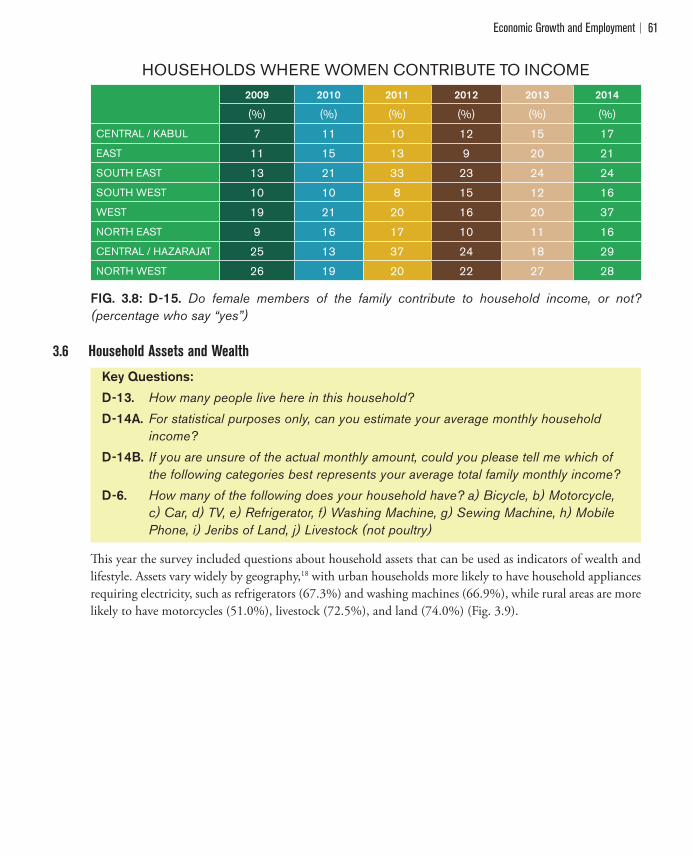
Economic Growth and Employment 61
HOUSEHOLDS WHERE WOMEN CONTRIBUTE TO INCOME2009 2010 2011 2012 2013 2014
(%) (%) (%) (%) (%) (%)
CENTRAL / KABUL 7 11 10 12 15 17
EAST 11 15 13 9 20 21
SOUTH EAST 13 21 33 23 24 24
SOUTH WEST 10 10 8 15 12 16
WEST 19 21 20 16 20 37
NORTH EAST 9 16 17 10 11 16
CENTRAL / HAZARAJAT 25 13 37 24 18 29
NORTH WEST 26 19 20 22 27 28
FIG. 3.8: D-15. Do female members of the family contribute to household income, or not? (percentage who say “yes”)
3.6 Household Assets and Wealth
Key Questions:D-13. How many people live here in this household?
D-14A. For statistical purposes only, can you estimate your average monthly household income?
D-14B. If you are unsure of the actual monthly amount, could you please tell me which of the following categories best represents your average total family monthly income?
D-6. How many of the following does your household have? a) Bicycle, b) Motorcycle, c) Car, d) TV, e) Refrigerator, f) Washing Machine, g) Sewing Machine, h) Mobile Phone, i) Jeribs of Land, j) Livestock (not poultry)
!is year the survey included questions about household assets that can be used as indicators of wealth and lifestyle. Assets vary widely by geography,18 with urban households more likely to have household appliances requiring electricity, such as refrigerators (67.3%) and washing machines (66.9%), while rural areas are more likely to have motorcycles (51.0%), livestock (72.5%), and land (74.0%) (Fig. 3.9).
Afghanistan in 201462
ASSET OWNERSHIP
ITEMSRURAL URBAN OVERALL
(%) (%) (%)
BICYCLES 53 51 53
MOTORCYCLES 51 30 46
CARS 20 35 23
TVS 48 92 58
REFRIGERATORS 9 67 23
WASHING MACHINES 10 67 24
SEWING MACHINES 70 72 70
MOBILE PHONES 75 91 79
JERIBS OF LAND 74 21 61
LIVESTOCK 73 14 58
FIG. 3.9: D-6. How many of the following does your household have? (percentage of respondents who say they own at least one of the items listed)
Average monthly reported income is $190 USD (10,839 Afghanis; 1 USD = 57.1 Afghanis) with Afghans in rural areas reporting a signi"cantly lower household income of $170 USD per month (9,701 Afghanis) than Afghans in urban households ($261 USD per month, or 14,903 Afghanis). Afghans in rural households also report a larger household size (10.3 people per rural household compared to 9.3 people per urban household), which a#ects their relative wealth. Reported income is signi"cantly a#ected by region and education as well. Income increases with education level (Fig. 3.10). !ose who complete high school (grade 12) report 64% more income, in average monthly earnings, compared to those who never went to school. !ose who completed university have the highest average income, at $431 USD per month.19

Economic Growth and Employment 63
AVERAGE INCOME BY HIGHEST EDUCATION LEVEL ACHIEVED
$168 $188 $170 $172 $217 $218 $238
$261 $239 $246
$354
$431
$-
$50
$100
$150
$200
$250
$300
$350
$400
$450
$500
FIG 3.10: D-14A. For statistical purposes only, can you estimate your average monthly household income?; D-7. What is the highest level (grade) of school you have completed? (average monthly income of respondents who completed each grade level)
Regionally, wide disparities exist in reported income. !e lowest average monthly income appears in the Central/Hazarajat ($92/month) region and the highest is in the Central/Kabul ($260/month) region (Fig. 3.11). !e South East and South West regions (the regions with the third and second-highest average incomes, at $191/month and $245/month, respectively) both bene"t from a strong agriculture sector, including strong poppy production in Helmand province, while the Central/Hazarajat region is mountainous and remote, with few roads for transporting goods to urban markets.

Afghanistan in 201464
AVERAGE MONTHLY INCOME
$260
$186 $191
$245
$147 $144
$92
$151
$-
$50
$100
$150
$200
$250
$300
CENTRAL / KABUL
EAST SOUTH EAST SOUTH WEST WEST NORTH EAST CENTRAL / HAZARAJAT
NORTH WEST
FIG 3.11: D-14A. For statistical purposes only, can you estimate your average monthly household income? (respondents’ average monthly income by province)
3.7 Wealth and Happiness
Key Questions:D-14A. For statistical purposes only, can you estimate your average monthly household
income?
D-24. In general in your life, would you say you are very happy, somewhat happy, not very happy, or not happy at all?
Afghans’ income is signi"cantly and positively correlated with their self-reported level of happiness (Fig. 3.12).20 However, as income rises, the power of income to explain happiness grows weaker. Beyond a threshold of $700 USD (40,000 Afghanis) per month, the relationship is no longer signi"cant.
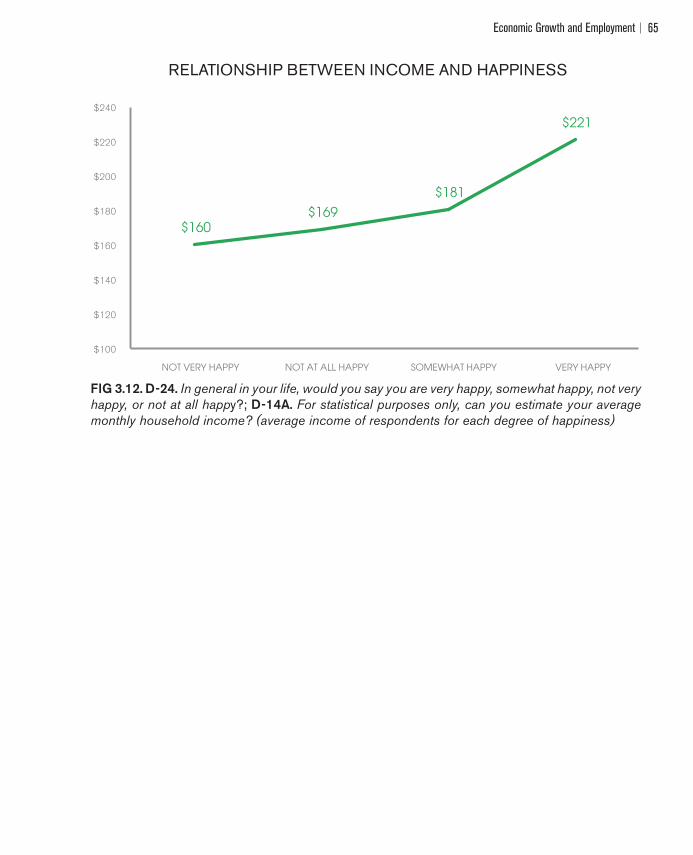
Economic Growth and Employment 65
RELATIONSHIP BETWEEN INCOME AND HAPPINESS
$160 $169
$181
$221
$100
$120
$140
$160
$180
$200
$220
$240
NOT VERY HAPPY NOT AT ALL HAPPY SOMEWHAT HAPPY VERY HAPPY
FIG 3.12. D-24. In general in your life, would you say you are very happy, somewhat happy, not very happy, or not at all happy?; D-14A. For statistical purposes only, can you estimate your average monthly household income? (average income of respondents for each degree of happiness)

Afghanistan in 201466
Endnotes1 Central Statistics Organization and !e World Bank. “Setting the O$cial Poverty Line for Afghanistan.” Central Statistics
Organization and !e World Bank. 2010. p. 24. Accessed August 15, 2014: http://cso.gov.af/Content/Media/Documents/CSO-WB_Tech-Report-Pov_v4(2)1162011121045651553325325.pdf .
2 Gomez Osorio, Camilo. “Managing the Fiscal Challenge.” Afghanistan in Transition: Looking Beyond 2014. !e World Bank. 2013. p. 78. Accessed August 1, 2014: https://openknowledge.worldbank.org/bitstream/handle/10986/13107/758480PUB0EPI0001300PUBDATE02028013.pdf?sequence=1 .
3 !e World Bank. Afghanistan: A Country Snapshot. March 2014, p. 1. Accessed August 1, 2014: http://siteresources.worldbank.org/SOUTHASIAEXT/Resources/223546-1398285132254/Afghanistan-Country-Snapshot-Spring-Meetings-2014.pdf .
4 Gul, Rehman. “Asian Development Outlook 2014.” Asian Development Bank, 2014, p. 156. Accessed August 1, 2014: http://www.adb.org/sites/default/"les/ado2014-afghanistan.pdf .
5 United Nations O$ce on Drugs and Crime. “Afghanistan Opium Survey 2013” UNODC, November 2013. p. 4. Accessed September 7, 2014: http://www.unodc.org/documents/crop-monitoring/Afghanistan/Afghan_report_Summary_Findings_2013.pdf .
6 !e World Bank. “Afghanistan: Country Snapshot” !e World Bank, March 2014. p. 2. Accessed September 1, 2014: http://siteresources.worldbank.org/SOUTHASIAEXT/Resources/223546-1398285132254/Afghanistan-Country-Snapshot-Spring-Meetings-2014.pdf .
7 !e World Bank. Afghanistan Economic Update. April, 2014, p. 4-5. Accessed August 1, 2014: http://www-wds.worldbank.org/external/default/WDSContentServer/WDSP/IB/2014/04/23/000456286_20140423092911/Rendered/PDF/875740WP0Afgha00Box382171B00PUBLIC0.pdf .
8 United States Institute of Peace. “Compounding Uncertainty in Afghanistan, Economic Consequences of Delay in Signing the Bilateral Security Agreement.” USIP: Washington, DC, February 2014. Accessed August 1, 2014: http://www.usip.org/publications/compounding-uncertainty-in-afghanistan .
9 t(9269) = -11.46, p<.0001, with more urban dwellers reporting Unemployment as an issue than rural dwellers.10 t(9269) = -3.10, p<.001, with more of those in urban areas saying the poor economy is one of the biggest issues facing
Afghanistan.11 t(9269) = -2.53, p<.05, with more retirees claiming high prices are an issue facing Afghanistan as a whole than non-retirees.12 t(9269) = -4.08, p<.0001, with more of those who left Afghanistan saying unemployment is a major issue facing the country
than those who have not left.13 Combines the following response categories: Lack of Jobs, Economic Issues, Business.14 !is year, this particular "gure is weighted by gender to meet a 50:50 split for the purpose of longitudinal comparison across
years. Because most Afghan women are housewives, and because a perfect gender balance of 50:50 cannot be met each year due to changing security conditions, this question’s analysis uses a weight for a 50:50 gender balance to correct gender bias. In the raw data available online, this weight is labeled as wgt2. Previous survey reports, including the 2013 report, did not apply this weight because longitudinal comparisons were not made for this particular question.
15 Unemployment rate calculations are traditionally a ratio of the number of people unemployed (and actively seeking work) to the number of people employed. !ese exclude students, retirees, and others not actively seeking work. !ese distinctions are not made in the survey, which seeks to measure perceptions only.
16 Fear for personal safety (x15B) is inversely correlated with support for women working outside the home (z13) (r=-.06, p<.0001). Both variables are found in the merged dataset.
17 Among Afghan men, fear for personal safety (x15B) explains 7.1% of the variance in support for women working outside the home (z13) (r=-.07, p<.0001), while among Afghan women, it explains 5.3% of the variance (r=-.05 p<.0001).
18 See variable m6b (Geographic Code) in Appendix 2 for a weighted distribution of urban and rural respondents, based on the Afghan Central Statistics O$ce estimates for urban/rural population.
19 Education alone explains 4.3% of the variance in reported income. (OLS Regression model with reported income regressed on education; R2=.043, F(33, 8502) = 28.92, p<.0001).
20 r= .06, p<.0001.

Development and Services Delivery 67
4 DEVELOPMENT AND SERVICES DELIVERYAmong Afghans who say the country is moving in the right direction, more than half (54.8%) cite improvements in development as the reason.1 However, progress is slow, and the government remains dependent on foreign aid to operate. A key talking point at the November 2014 London Conference on Afghanistan will be the government’s progress to ful"ll commitments made in the 2012 Tokyo Mutual Accountability Framework (TMAF) and at the 2010 London Conference, including improvements in education, electoral reform, anti-corruption, anti-narcotics reform, and expanded access to education for girls.
!e United Nations ranks Afghanistan 169th out of 187 countries on the Human Development Index (last year it ranked 175th), an aggregate measure of life expectancy, years of schooling, and gross national income per person. 2 In 2014, as in 2013, Afghans are most concerned about access to jobs employment and security (see the National Mood, Economic Growth and Employment, and Security chapters). !e Afghan government’s 2013-2014 development budget increased spending on security services, and to a lesser extent, on education, agriculture, and health programs.3 4 A major test in 2015 will be Afghanistan’s ability to support job creation, particularly for a “youth bulge” rapidly coming of age and seeking employment opportunities. Youth bulges have the potential to threaten political stability when combined with poor economic performance.5
Of the estimated 30.6 million people in Afghanistan in 2013, 4.9 million were under the age of 5, or 16% of the population. !e proportion of the population under age 15 is projected to be 44.9% in 2015. In contrast, only 2.6% of the population will be over age 65 in 2015. Fertility and population growth rates do appear to be declining, however. Between 2000-2005, the average was 7.4 births per woman and an annual population growth of 3.8%, whereas between 2010-2014, the same rates dropped to 5.0 births per woman and 2.4% growth.6
!is year’s survey report therefore pays special attention to issues a#ecting youth, particularly migration, education, and early healthcare. !e 2014 survey also features a number of new questions about the Afghan government’s response to natural disasters. !e May 2, 2014 landslide in Badakhshan province killed several hundred people, while serious %oods a#ected Jawzjan, Sar-i-Pul, Faryab, Balkh, and Baghlan on June 6, 2014. Natural disasters a#ected 4.1 million people in Afghanistan over the period 2005-2012, and killed a total of 2,846 people over the same time period. Such disasters create new security challenges, and government responsiveness will play an important role in the perceived capacity of the Afghan government to deliver emergency relief, reconstruction, and development.7
4.1 Development and MigrationKey QuestionsD-16. Have you lived outside of Afghanistan in another country at any time in the past 23
years? For reference, 23 years ago was the fall of Dr. Najibullah’s government and the start of the mujahedin government.
D-17C. What is the main reason you left?D-18. Inside Afghanistan, have you ever moved from one province to another province in the
past 23 years? For reference, 23 years ago was the fall of Dr. Najibullah’s government and the start of the mujahedin government.
D-19C. What is the main reason you left?

Afghanistan in 201468
!is year, the survey asked Afghans whether they have left their home province or Afghanistan in the past 23 years (i.e., since the fall of the Najibullah government), and their reasons for leaving. Development reasons were a commonly cited reason for leaving. Among the 14.5% of Afghans who say they left their home province, 28.5% say it was because of development issues there, while 32.6% of those who left Afghanistan say they did so because of lack of development in their area. !e types of development cited by survey respondents include: a lack of healthcare, security, shelter, education, and electricity.
Afghans living in the East (40.4%) and South East (40.7%) regions left Afghanistan at a higher rate because of development issues, while those from the North East (27.5%) and North West (24.3%) left the country at a lower rate because of these issues. Afghans in the East (37.9%) and Central/Hazarajat (33.7%) regions were also most likely to say that they left their provinces because of development issues, and those least likely to say so live in the West and North East (17.2%).
4.2 Access to and Satisfaction with Public Goods and Services Key QuestionsQ-4. In your view what are the biggest problems in your local area?Q-10. Please tell me if your family has access to [insert item] in your area? Do you have
access always, often, seldom, or never? a) Clean drinking water, b) Water for irrigation, c) Electricity, d) Clinics or hospitals, e) Medicine, f) Education for children, g) Roads.
Q-11. Next please rate your satisfaction with the quality of goods and services in your area. For each item I list, please tell me if you are very satisfied, somewhat satisfied,
somewhat dissatisfied, or very dissatisfied. a) Clean drinking water, b) Water for irrigation, c) Electricity, d) Clinics or hospitals, e) Medicine, f) Education for children,
g) Roads.Q-28: Thinking back to your interactions in the past 12 months, please tell me how often
you had to give money, a gift or perform a favor for these organizations or in these situations? g) State electricity supply, j) Admissions to schools/university.
!e survey asked respondents to evaluate the availability and satisfaction with various public goods and services in their area. Overall, Afghans report having the most frequent access (often or always) to education for children (70.8%), and least frequent access to electricity (36.8%) (Fig. 4.1). Notably, when Afghans are asked about the biggest problem facing their local community, similar to most previous years, the second most common response is electricity (22.5%), followed by roads (17.5%) and drinking water (16.4%).
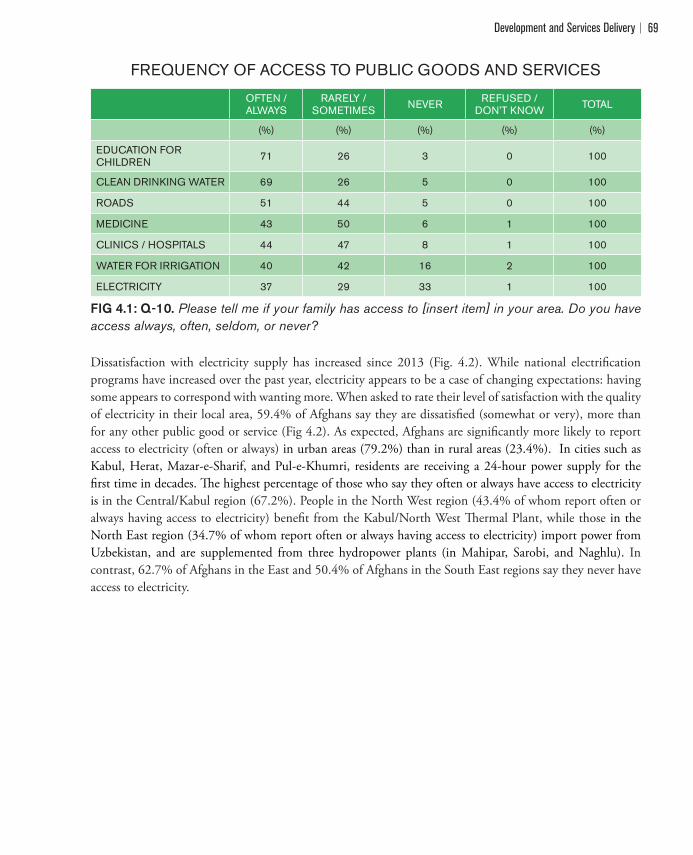
Development and Services Delivery 69
FREQUENCY OF ACCESS TO PUBLIC GOODS AND SERVICES
OFTEN /ALWAYS
RARELY /SOMETIMES NEVER REFUSED /
DON’T KNOW TOTAL
(%) (%) (%) (%) (%)
EDUCATION FORCHILDREN 71 26 3 0 100
CLEAN DRINKING WATER 69 26 5 0 100
ROADS 51 44 5 0 100
MEDICINE 43 50 6 1 100
CLINICS / HOSPITALS 44 47 8 1 100
WATER FOR IRRIGATION 40 42 16 2 100
ELECTRICITY 37 29 33 1 100
FIG 4.1: Q-10. Please tell me if your family has access to [insert item] in your area. Do you have access always, often, seldom, or never?
Dissatisfaction with electricity supply has increased since 2013 (Fig. 4.2). While national electri"cation programs have increased over the past year, electricity appears to be a case of changing expectations: having some appears to correspond with wanting more. When asked to rate their level of satisfaction with the quality of electricity in their local area, 59.4% of Afghans say they are dissatis"ed (somewhat or very), more than for any other public good or service (Fig 4.2). As expected, Afghans are signi"cantly more likely to report access to electricity (often or always) in urban areas (79.2%) than in rural areas (23.4%). In cities such as Kabul, Herat, Mazar-e-Sharif, and Pul-e-Khumri, residents are receiving a 24-hour power supply for the "rst time in decades. !e highest percentage of those who say they often or always have access to electricity is in the Central/Kabul region (67.2%). People in the North West region (43.4% of whom report often or always having access to electricity) bene"t from the Kabul/North West !ermal Plant, while those in the North East region (34.7% of whom report often or always having access to electricity) import power from Uzbekistan, and are supplemented from three hydropower plants (in Mahipar, Sarobi, and Naghlu). In contrast, 62.7% of Afghans in the East and 50.4% of Afghans in the South East regions say they never have access to electricity.

Afghanistan in 201470
SATISFACTION WITH ELECTRICITY SUPPLY
FIG 4.2: Q-11. Next please rate your satisfaction with the quality of goods and services in your area. For each item I list, please tell me if you are very satisfied, somewhat satisfied, somewhat dissatisfied, or very dissatisfied. g) Electricity (percentage who say somewhat satisfied or very satisfied)
Over time, satisfaction with the availability of clean drinking water has shown the greatest gains, compared to satisfaction with other services. Satisfaction with available clinics and hospitals has decreased signi"cantly since 2012. Like electricity, this too may be a case of marginal utility. Marginal utility is the principle that the more of a good or service a person has, the less satisfaction that each additional unit of that good or service can provide. Overall, satisfaction with the availability of education for children and clean drinking water are highest, and electricity supply is lowest (Fig. 4.3).
31
25
34 34 34
36
41
38
20%
25%
30%
35%
40%
45%
2007 2008 2009 2010 2011 2012 2013 2014

Development and Services Delivery 71
SATISFACTION WITH BASIC SERVICES
2007 2008 2009 2010 2011 2012 2013 2014
(%) (%) (%) (%) (%) (%) (%) (%)
AVAILABILITY OF EDUCATION FORCHILDREN
72 70 67 68 73 77 72 74
AVAILABILITY OF CLEAN DRINKING WATER 63 62 63 63 70 76 74 73
AVAILABILITY OF CLINICSAND HOSPITALS 56 51 49 46 57 58 52 52
AVAILABILITY OFMEDICINE - 49 44 43 53 53 50 51
AVAILABILITY OF WATERFOR IRRIGATION 59 47 53 49 45 52 53 48
SUPPLY OF ELECTRICITY 31 25 34 34 34 36 41 38
FIG 4.3: Q-11. Next please rate your satisfaction with the quality of goods and services in your area. For each item I list, please tell me if you are very satisfied, somewhat satisfied, somewhat dissatisfied, or very dissatisfied. (percentage who say “somewhat satisfied” or “very satisfied”)
4.3 Awareness of Development Programs and Funders Key QuestionsQ-12. I am going to read a list of projects that may or may not have been implemented in
your area. Please tell me if there has been this type of project in your area in the last 12 months... a) Reconstruction/building of roads or bridges, b) New government school opening, c) New private school opening, d) New private university, e) Drinking water project (e.g., new wells, hand pumps, tank system, reservoir), f) Irrigation project, g) Government supplied electricity, h) Healthcare (primary health center, regular visits of doctors, etc.), i) Reconciliation, j) Programs in agriculture, k) New factories opened, l) Building new mosques.
Q-13. Which country do you think has provided the most funding for these types of projects in your area? Is there another country that you believe has funded these projects? Another one?
Each year, respondents are asked if they are aware of any development projects that took place in their area within the last 12 months, and what types of projects those are. !is year, 64.1% of Afghans say they are aware of some kind of development project in their area, and the two most frequently cited project types are reconstruction or building of roads and bridges (36.1%) and drinking water projects (25.6%).
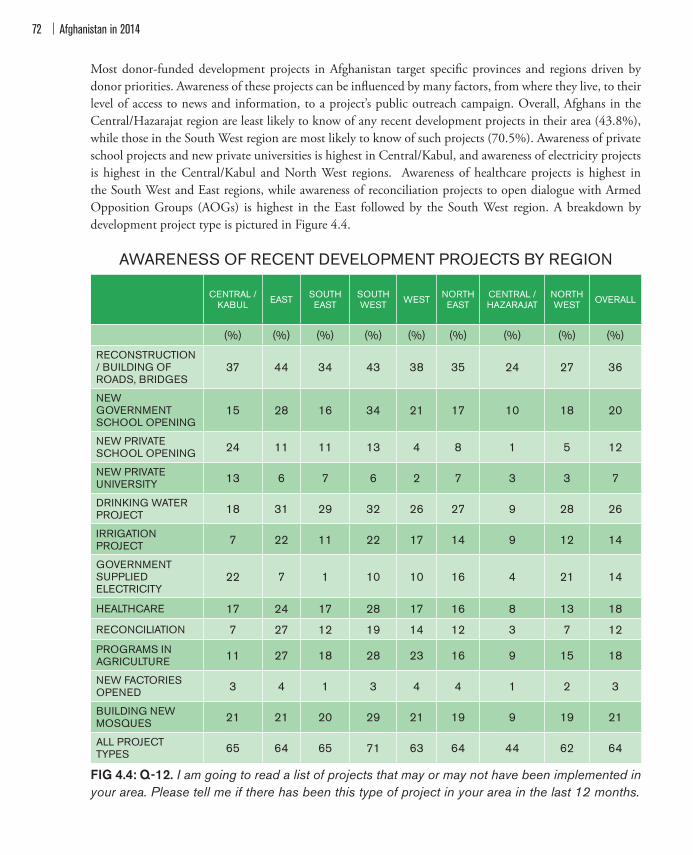
Afghanistan in 201472
Most donor-funded development projects in Afghanistan target speci"c provinces and regions driven by donor priorities. Awareness of these projects can be in%uenced by many factors, from where they live, to their level of access to news and information, to a project’s public outreach campaign. Overall, Afghans in the Central/Hazarajat region are least likely to know of any recent development projects in their area (43.8%), while those in the South West region are most likely to know of such projects (70.5%). Awareness of private school projects and new private universities is highest in Central/Kabul, and awareness of electricity projects is highest in the Central/Kabul and North West regions. Awareness of healthcare projects is highest in the South West and East regions, while awareness of reconciliation projects to open dialogue with Armed Opposition Groups (AOGs) is highest in the East followed by the South West region. A breakdown by development project type is pictured in Figure 4.4.
AWARENESS OF RECENT DEVELOPMENT PROJECTS BY REGION
CENTRAL /KABUL EAST SOUTH
EAST SOUTH
WEST WEST NORTHEAST
CENTRAL /HAZARAJAT
NORTHWEST OVERALL
(%) (%) (%) (%) (%) (%) (%) (%) (%)
RECONSTRUCTION / BUILDING OFROADS, BRIDGES
37 44 34 43 38 35 24 27 36
NEW GOVERNMENTSCHOOL OPENING
15 28 16 34 21 17 10 18 20
NEW PRIVATESCHOOL OPENING 24 11 11 13 4 8 1 5 12
NEW PRIVATEUNIVERSITY 13 6 7 6 2 7 3 3 7
DRINKING WATERPROJECT 18 31 29 32 26 27 9 28 26
IRRIGATIONPROJECT 7 22 11 22 17 14 9 12 14
GOVERNMENT SUPPLIEDELECTRICITY
22 7 1 10 10 16 4 21 14
HEALTHCARE 17 24 17 28 17 16 8 13 18
RECONCILIATION 7 27 12 19 14 12 3 7 12
PROGRAMS INAGRICULTURE 11 27 18 28 23 16 9 15 18
NEW FACTORIESOPENED 3 4 1 3 4 4 1 2 3
BUILDING NEWMOSQUES 21 21 20 29 21 19 9 19 21
ALL PROJECTTYPES 65 64 65 71 63 64 44 62 64
FIG 4.4: Q-12. I am going to read a list of projects that may or may not have been implemented in your area. Please tell me if there has been this type of project in your area in the last 12 months.
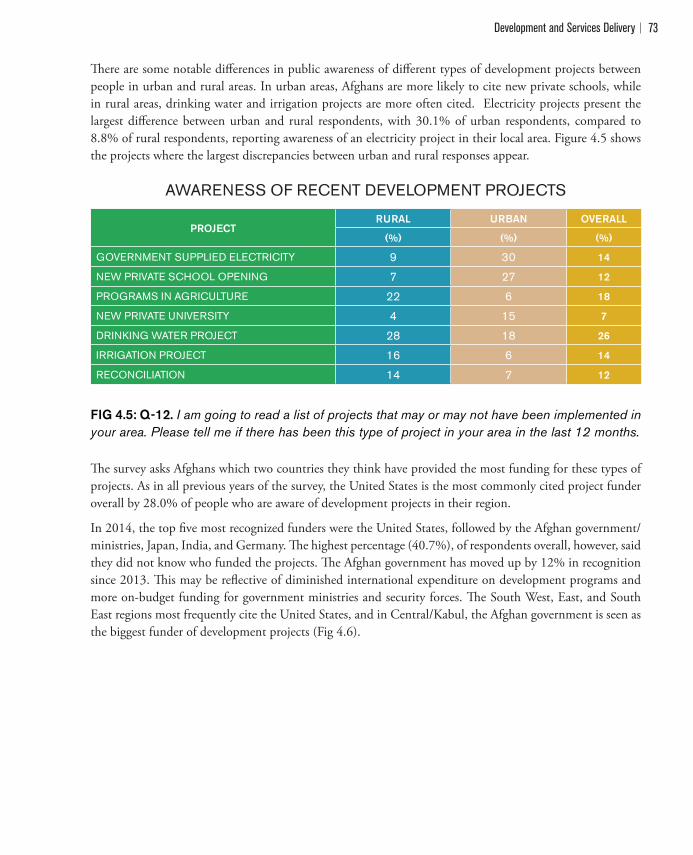
Development and Services Delivery 73
!ere are some notable di#erences in public awareness of di#erent types of development projects between people in urban and rural areas. In urban areas, Afghans are more likely to cite new private schools, while in rural areas, drinking water and irrigation projects are more often cited. Electricity projects present the largest di#erence between urban and rural respondents, with 30.1% of urban respondents, compared to 8.8% of rural respondents, reporting awareness of an electricity project in their local area. Figure 4.5 shows the projects where the largest discrepancies between urban and rural responses appear.
AWARENESS OF RECENT DEVELOPMENT PROJECTS
PROJECTRURAL URBAN OVERALL
(%) (%) (%)
GOVERNMENT SUPPLIED ELECTRICITY 9 30 14
NEW PRIVATE SCHOOL OPENING 7 27 12
PROGRAMS IN AGRICULTURE 22 6 18
NEW PRIVATE UNIVERSITY 4 15 7
DRINKING WATER PROJECT 28 18 26
IRRIGATION PROJECT 16 6 14
RECONCILIATION 14 7 12
FIG 4.5: Q-12. I am going to read a list of projects that may or may not have been implemented in your area. Please tell me if there has been this type of project in your area in the last 12 months.
!e survey asks Afghans which two countries they think have provided the most funding for these types of projects. As in all previous years of the survey, the United States is the most commonly cited project funder overall by 28.0% of people who are aware of development projects in their region.
In 2014, the top "ve most recognized funders were the United States, followed by the Afghan government/ministries, Japan, India, and Germany. !e highest percentage (40.7%), of respondents overall, however, said they did not know who funded the projects. !e Afghan government has moved up by 12% in recognition since 2013. !is may be re%ective of diminished international expenditure on development programs and more on-budget funding for government ministries and security forces. !e South West, East, and South East regions most frequently cite the United States, and in Central/Kabul, the Afghan government is seen as the biggest funder of development projects (Fig 4.6).
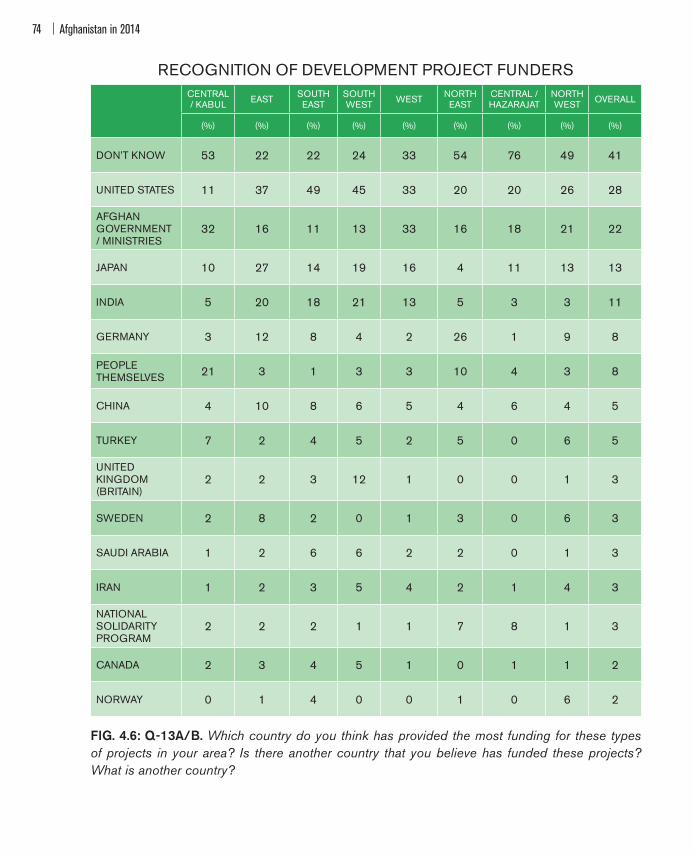
Afghanistan in 201474
RECOGNITION OF DEVELOPMENT PROJECT FUNDERS
CENTRAL/ KABUL EAST SOUTH
EAST SOUTH
WEST WEST NORTHEAST
CENTRAL /HAZARAJAT
NORTHWEST OVERALL
(%) (%) (%) (%) (%) (%) (%) (%) (%)
DON’T KNOW 53 22 22 24 33 54 76 49 41
UNITED STATES 11 37 49 45 33 20 20 26 28
AFGHAN GOVERNMENT/ MINISTRIES
32 16 11 13 33 16 18 21 22
JAPAN 10 27 14 19 16 4 11 13 13
INDIA 5 20 18 21 13 5 3 3 11
GERMANY 3 12 8 4 2 26 1 9 8
PEOPLETHEMSELVES 21 3 1 3 3 10 4 3 8
CHINA 4 10 8 6 5 4 6 4 5
TURKEY 7 2 4 5 2 5 0 6 5
UNITED KINGDOM (BRITAIN)
2 2 3 12 1 0 0 1 3
SWEDEN 2 8 2 0 1 3 0 6 3
SAUDI ARABIA 1 2 6 6 2 2 0 1 3
IRAN 1 2 3 5 4 2 1 4 3
NATIONAL SOLIDARITYPROGRAM
2 2 2 1 1 7 8 1 3
CANADA 2 3 4 5 1 0 1 1 2
NORWAY 0 1 4 0 0 1 0 6 2
FIG. 4.6: Q-13A/B. Which country do you think has provided the most funding for these types of projects in your area? Is there another country that you believe has funded these projects? What is another country?
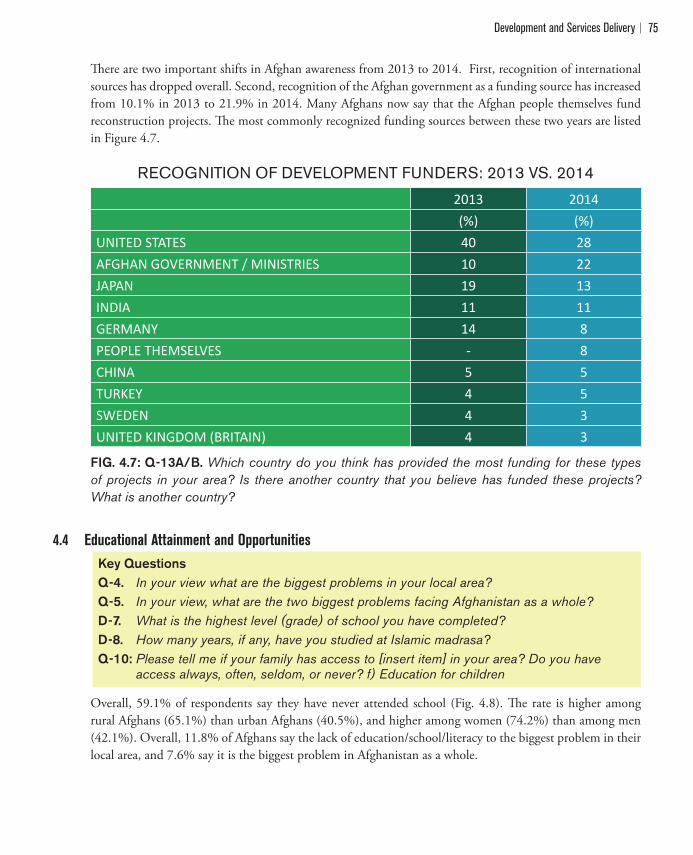
Development and Services Delivery 75
!ere are two important shifts in Afghan awareness from 2013 to 2014. First, recognition of international sources has dropped overall. Second, recognition of the Afghan government as a funding source has increased from 10.1% in 2013 to 21.9% in 2014. Many Afghans now say that the Afghan people themselves fund reconstruction projects. !e most commonly recognized funding sources between these two years are listed in Figure 4.7.
RECOGNITION OF DEVELOPMENT FUNDERS: 2013 VS. 2014
2013 2014 )%( )%(UNITED STATES 40 28AFGHAN GOVERNMENT / MINISTRIES 10 22JAPAN 19 13INDIA 11 11GERMANY 14 8PEOPLE THEMSELVES - 8CHINA 5 5TURKEY 4 5SWEDEN 4 3UNITED KINGDOM )BRITAIN( 4 3
FIG. 4.7: Q-13A/B. Which country do you think has provided the most funding for these types of projects in your area? Is there another country that you believe has funded these projects? What is another country?
4.4 Educational Attainment and OpportunitiesKey QuestionsQ-4. In your view what are the biggest problems in your local area?Q-5. In your view, what are the two biggest problems facing Afghanistan as a whole?D-7. What is the highest level (grade) of school you have completed?D-8. How many years, if any, have you studied at Islamic madrasa?Q-10: Please tell me if your family has access to [insert item] in your area? Do you have
access always, often, seldom, or never? f) Education for children
Overall, 59.1% of respondents say they have never attended school (Fig. 4.8). !e rate is higher among rural Afghans (65.1%) than urban Afghans (40.5%), and higher among women (74.2%) than among men (42.1%). Overall, 11.8% of Afghans say the lack of education/school/literacy to the biggest problem in their local area, and 7.6% say it is the biggest problem in Afghanistan as a whole.
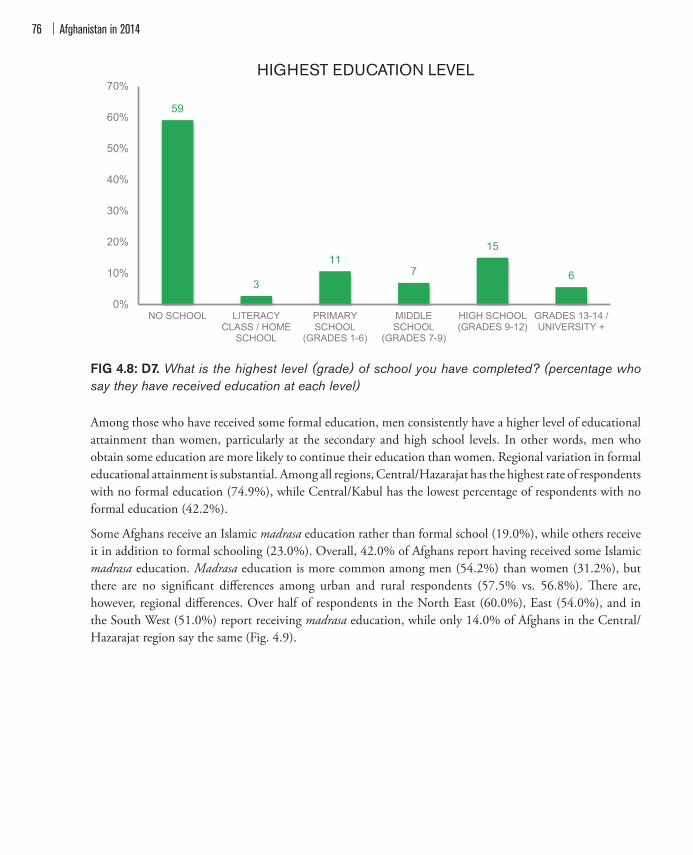
Afghanistan in 201476
HIGHEST EDUCATION LEVEL
FIG 4.8: D7. What is the highest level (grade) of school you have completed? (percentage who say they have received education at each level)
Among those who have received some formal education, men consistently have a higher level of educational attainment than women, particularly at the secondary and high school levels. In other words, men who obtain some education are more likely to continue their education than women. Regional variation in formal educational attainment is substantial. Among all regions, Central/Hazarajat has the highest rate of respondents with no formal education (74.9%), while Central/Kabul has the lowest percentage of respondents with no formal education (42.2%).
Some Afghans receive an Islamic madrasa education rather than formal school (19.0%), while others receive it in addition to formal schooling (23.0%). Overall, 42.0% of Afghans report having received some Islamic madrasa education. Madrasa education is more common among men (54.2%) than women (31.2%), but there are no signi"cant di#erences among urban and rural respondents (57.5% vs. 56.8%). !ere are, however, regional di#erences. Over half of respondents in the North East (60.0%), East (54.0%), and in the South West (51.0%) report receiving madrasa education, while only 14.0% of Afghans in the Central/Hazarajat region say the same (Fig. 4.9).
59
3
117
15
6
0%
10%
20%
30%
40%
50%
60%
70%
NO SCHOOL LITERACYCLASS / HOME
SCHOOL
PRIMARYSCHOOL
(GRADES 1-6)
MIDDLESCHOOL
(GRADES 7-9)
HIGH SCHOOL(GRADES 9-12)
GRADES 13-14 /UNIVERSITY +
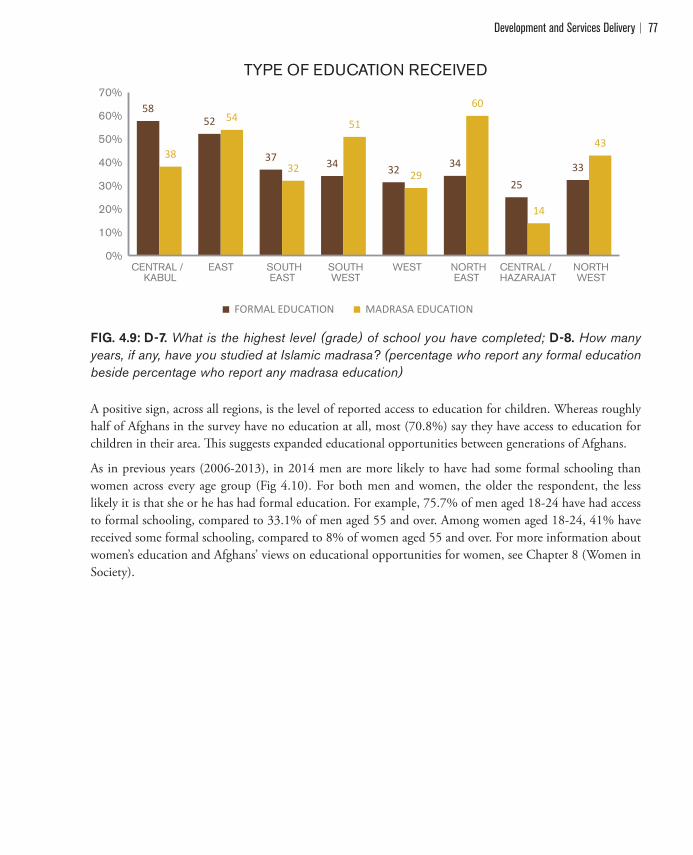
Development and Services Delivery 77
TYPE OF EDUCATION RECEIVED
FIG. 4.9: D-7. What is the highest level (grade) of school you have completed; D-8. How many years, if any, have you studied at Islamic madrasa? (percentage who report any formal education beside percentage who report any madrasa education)
A positive sign, across all regions, is the level of reported access to education for children. Whereas roughly half of Afghans in the survey have no education at all, most (70.8%) say they have access to education for children in their area. !is suggests expanded educational opportunities between generations of Afghans.
As in previous years (2006-2013), in 2014 men are more likely to have had some formal schooling than women across every age group (Fig 4.10). For both men and women, the older the respondent, the less likely it is that she or he has had formal education. For example, 75.7% of men aged 18-24 have had access to formal schooling, compared to 33.1% of men aged 55 and over. Among women aged 18-24, 41% have received some formal schooling, compared to 8% of women aged 55 and over. For more information about women’s education and Afghans’ views on educational opportunities for women, see Chapter 8 (Women in Society).
58
52
37 34
32 34
25
33
38
54
32
51
29
60
14
43
0%
10%
20%
30%
40%
50%
60%
70%
CENTRAL /KABUL
EAST SOUTHEAST
SOUTHWEST
WEST NORTHEAST
CENTRAL /HAZARAJAT
NORTHWEST
FORMAL EDUCATION MADRASA EDUCATION
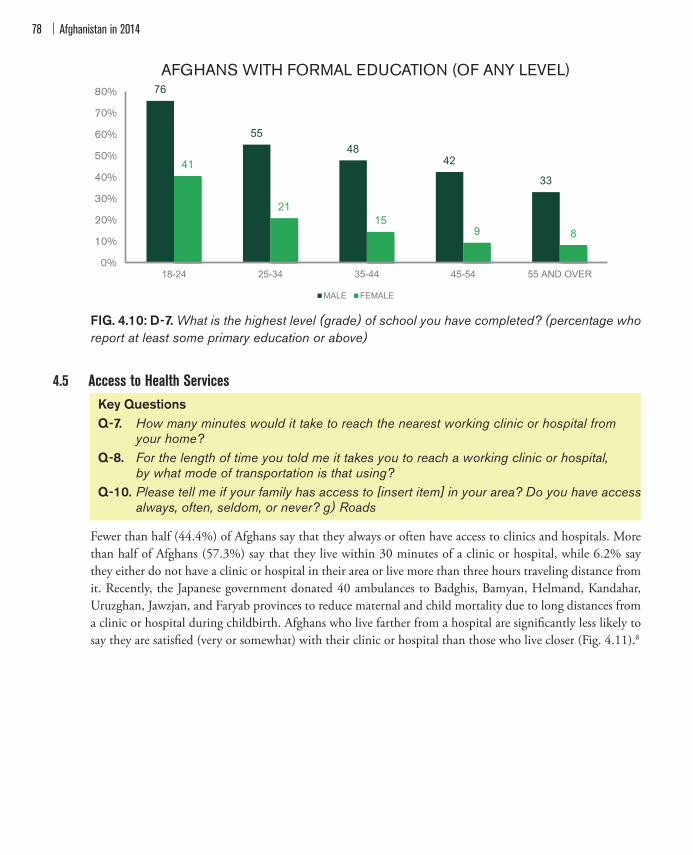
Afghanistan in 201478
AFGHANS WITH FORMAL EDUCATION (OF ANY LEVEL)
FIG. 4.10: D-7. What is the highest level (grade) of school you have completed? (percentage who report at least some primary education or above)
4.5 Access to Health ServicesKey QuestionsQ-7. How many minutes would it take to reach the nearest working clinic or hospital from your home?Q-8. For the length of time you told me it takes you to reach a working clinic or hospital, by what mode of transportation is that using?Q-10. Please tell me if your family has access to [insert item] in your area? Do you have access
always, often, seldom, or never? g) Roads
Fewer than half (44.4%) of Afghans say that they always or often have access to clinics and hospitals. More than half of Afghans (57.3%) say that they live within 30 minutes of a clinic or hospital, while 6.2% say they either do not have a clinic or hospital in their area or live more than three hours traveling distance from it. Recently, the Japanese government donated 40 ambulances to Badghis, Bamyan, Helmand, Kandahar, Uruzghan, Jawzjan, and Faryab provinces to reduce maternal and child mortality due to long distances from a clinic or hospital during childbirth. Afghans who live farther from a hospital are signi"cantly less likely to say they are satis"ed (very or somewhat) with their clinic or hospital than those who live closer (Fig. 4.11).8
76
5548
42
3341
2115
9 8
0%
10%
20%
30%
40%
50%
60%
70%
80%
18-24 25-34 35-44 45-54 55 AND OVER
MALE FEMALE

Development and Services Delivery 79
SATISFACTION WITH CLINICS AND HOSPITALS BY PROXIMITY
TRAVEL TIME TO REACH CLINIC OR HOSPITALSATISFIED NOT SATISFIED
(%) (%)
WITHIN 10 MINUTES 77 22
BETWEEN 10 TO 30 MINUTES 60 39
BETWEEN 30 TO 60 MINUTES 44 56
ONE TO TWO HOURS 33 67
TWO TO THREE HOURS 31 68
THREE TO FOUR HOURS 27 68
FOUR TO FIVE HOURS 40 60
FIVE HOURS OR MORE 49 51
NO HOSPITAL IN AREA 8 91
FIG. 4.11: Q-7. How many minutes would it take to reach the nearest working clinic or hospital from your home? Q-11D. Next please rate your satisfaction with the quality of goods and services in your area. For each item I list, please tell me if you are very satisfied, somewhat satisfied, somewhat dissatisfied, or very dissatisfied. d) Clinics or hospitals (percentage who say somewhat or very satisfied and somewhat or very dissatisfied)
Respondents were also asked their method of transportation to the nearest clinic or hospital (Fig 4.12). Overall, 48.7% say they walk, while 26.4% say they would travel by car or truck, and 13.5% by motorcycle (Fig. 4.12). !e duration of time needed to reach the hospital is dependent upon the distance from the hospital and the transportation means available to the respondent. !ose who say they would travel by horse or donkey estimate the longest average travel times, with just under an hour, and signi"cantly longer than those who say they would walk.9
TIME NEEDED TO REACH HOSPITAL VIA DIFFERENT MODES OF TRANSPORT
MODE OF TRANSPORT OF SAMPLE USING % AVERAGE TRAVEL TIME, INMINUTES
WALKING 49 37
CAR OR TRUCK 26 34
MOTORCYCLE 14 36
ANIMAL (HORSE, DONKEY, ETC) 5 59
BICYCLE 3 32
BUS 2 35
RICKSHAW 1 27
FIG. 4.12. Q-8. For the length of time you told me it takes you to reach a working clinic or hospital, by what mode of transportation is that using?
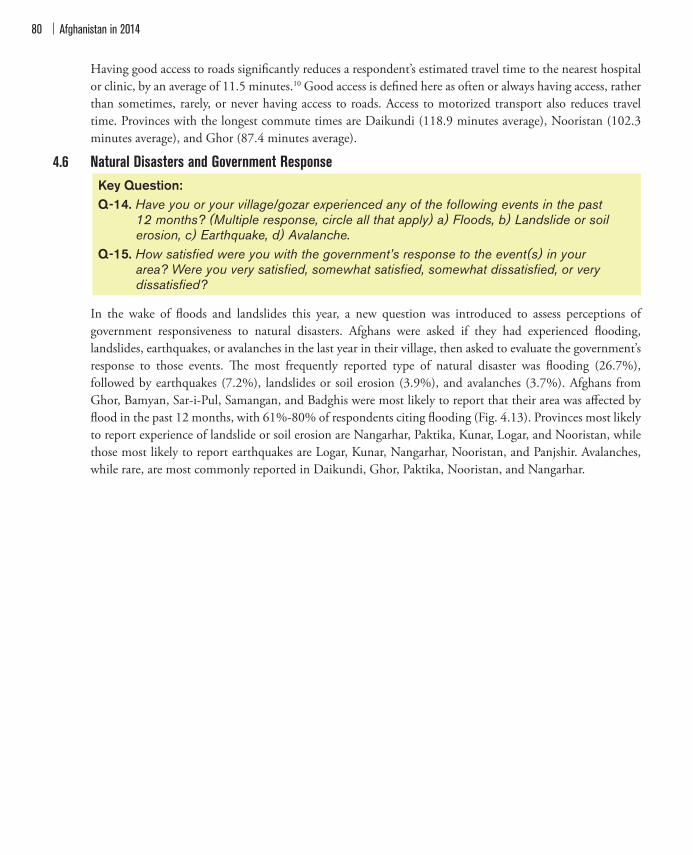
Afghanistan in 201480
Having good access to roads signi"cantly reduces a respondent’s estimated travel time to the nearest hospital or clinic, by an average of 11.5 minutes.10 Good access is de"ned here as often or always having access, rather than sometimes, rarely, or never having access to roads. Access to motorized transport also reduces travel time. Provinces with the longest commute times are Daikundi (118.9 minutes average), Nooristan (102.3 minutes average), and Ghor (87.4 minutes average).
4.6 Natural Disasters and Government Response Key Question:Q-14. Have you or your village/gozar experienced any of the following events in the past
12 months? (Multiple response, circle all that apply) a) Floods, b) Landslide or soil erosion, c) Earthquake, d) Avalanche.
Q-15. How satisfied were you with the government’s response to the event(s) in your area? Were you very satisfied, somewhat satisfied, somewhat dissatisfied, or very dissatisfied?
In the wake of %oods and landslides this year, a new question was introduced to assess perceptions of government responsiveness to natural disasters. Afghans were asked if they had experienced %ooding, landslides, earthquakes, or avalanches in the last year in their village, then asked to evaluate the government’s response to those events. !e most frequently reported type of natural disaster was %ooding (26.7%), followed by earthquakes (7.2%), landslides or soil erosion (3.9%), and avalanches (3.7%). Afghans from Ghor, Bamyan, Sar-i-Pul, Samangan, and Badghis were most likely to report that their area was a#ected by %ood in the past 12 months, with 61%-80% of respondents citing %ooding (Fig. 4.13). Provinces most likely to report experience of landslide or soil erosion are Nangarhar, Paktika, Kunar, Logar, and Nooristan, while those most likely to report earthquakes are Logar, Kunar, Nangarhar, Nooristan, and Panjshir. Avalanches, while rare, are most commonly reported in Daikundi, Ghor, Paktika, Nooristan, and Nangarhar.
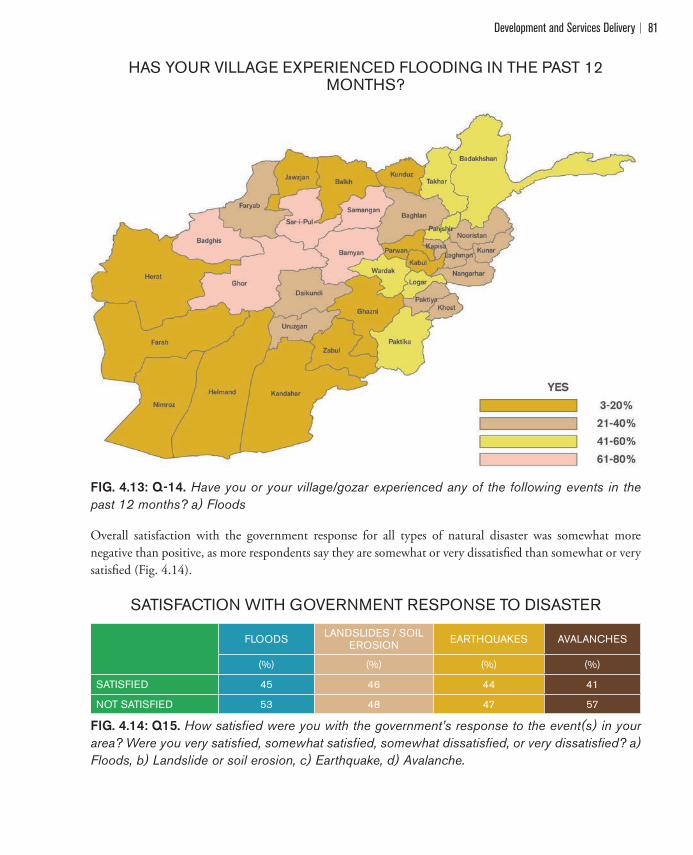
Development and Services Delivery 81
HAS YOUR VILLAGE EXPERIENCED FLOODING IN THE PAST 12 MONTHS?
FIG. 4.13: Q-14. Have you or your village/gozar experienced any of the following events in the past 12 months? a) Floods
Overall satisfaction with the government response for all types of natural disaster was somewhat more negative than positive, as more respondents say they are somewhat or very dissatis"ed than somewhat or very satis"ed (Fig. 4.14).
SATISFACTION WITH GOVERNMENT RESPONSE TO DISASTER
FLOODS LANDSLIDES / SOILEROSION EARTHQUAKES AVALANCHES
(%) (%) (%) (%)
SATISFIED 45 46 44 41
NOT SATISFIED 53 48 47 57
FIG. 4.14: Q15. How satisfied were you with the government’s response to the event(s) in your area? Were you very satisfied, somewhat satisfied, somewhat dissatisfied, or very dissatisfied? a) Floods, b) Landslide or soil erosion, c) Earthquake, d) Avalanche.
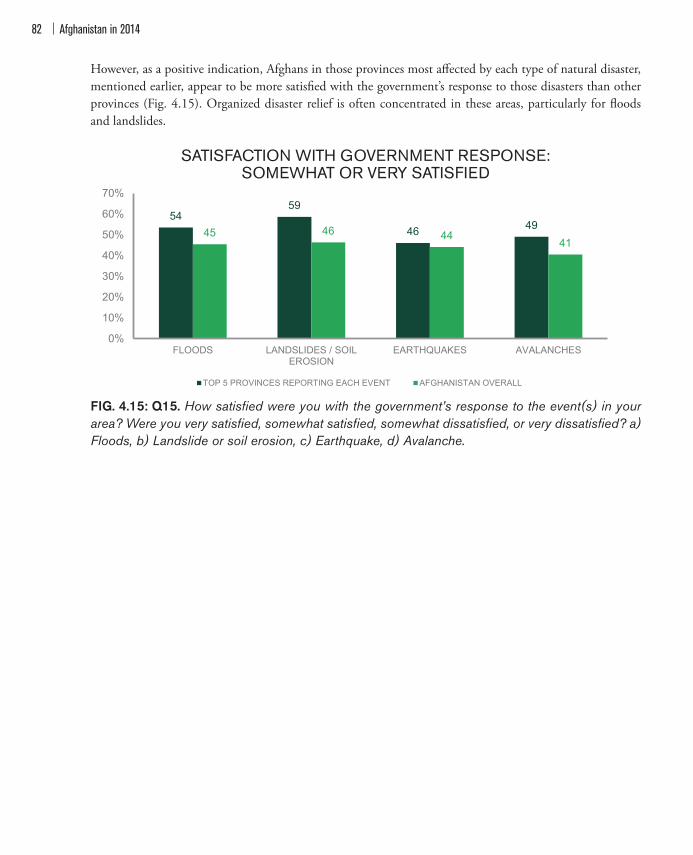
Afghanistan in 201482
However, as a positive indication, Afghans in those provinces most a#ected by each type of natural disaster, mentioned earlier, appear to be more satis"ed with the government’s response to those disasters than other provinces (Fig. 4.15). Organized disaster relief is often concentrated in these areas, particularly for %oods and landslides.
SATISFACTION WITH GOVERNMENT RESPONSE: SOMEWHAT OR VERY SATISFIED
FIG. 4.15: Q15. How satisfied were you with the government’s response to the event(s) in your area? Were you very satisfied, somewhat satisfied, somewhat dissatisfied, or very dissatisfied? a) Floods, b) Landslide or soil erosion, c) Earthquake, d) Avalanche.
5459
46 4945 46 44
41
0%
10%
20%
30%
40%
50%
60%
70%
FLOODS LANDSLIDES / SOILEROSION
EARTHQUAKES AVALANCHES
TOP 5 PROVINCES REPORTING EACH EVENT AFGHANISTAN OVERALL
Development and Services Delivery 83
Endnotes1 !ese include: reconstruction/rebuilding; international assistance; road reconstruction; clinics have been built; development of
agriculture; development in healthcare system in general; more electricity supply than before; improvement in education system; good communication system; clean drinking water; and banking services.
2 United Nations Development Programme. “Human Development Report: Sustaining Human Progress; Reducing Vulnerability and Building Resilence.” New York, NY: United Nations, July 24, 2014.
3 !e Afghan government’s budget has two components—an operating budget and a development budget. !e operating budget is disbursed by the Afghan government and contains all domestic revenue; the development budget is disbursed directly by donors. Comparison with the budget of solar Hijri year 1391 (March 20, 2012-March 20, 2013) is a bit nuanced because the "scal year was altered in that year, but the operating budget has decreased by 4% if the expenditure over the nine-month period for that "scal year is presumed to have held constant for the subsequent three months, while the development budget shows a 10% increase, applying the same standards. Out of the ordinary budget, spending on security and infrastructure/natural resources decreased by 14% and 22%, while education, agriculture/rural development and health sectors have increased by 13%, 11%, and 25%, respectively. On-budget donor assistance overall has increased by 45.3% from 1391 to 1392.
4 Afghan Coalition for Transparency and Accountability. “1392 National Budget Review.” ACTA, Kabul, Afghanistan. p. 5-6.5 For a review of research literature on youth bulges, see Urdal, Henrik, “!e Devil in the Demographics: !e E#ect of Youth Bulges
on Domestic Armed Con%ict 1950-2000,” World Bank Social Development Papers, July, 2004. 6 United Nations Development Programme. “Human Development Report: Sustaining Human Progress; Reducing Vulnerability
and Building Resilence.” New York, NY: United Nations, July 24, 2014. 7 UN Secretary General. “!e situation in Afghanistan and its implications for international peace and security.” UN General Assembly
Security Council. June 18, 2014. Accessed August 31, 2014: http://www.un.org/ga/search/view_doc.asp?symbol=A/68/910. 8 Logistic regression with satisfaction with clinics and hospitals (fully or somewhat satis"ed) regressed solely on distance in minutes
to the nearest hospital. Z=-20.32, p<.0001.9 Ordinary least square regression, R2 = 17.1%, F(16, 7972) = 102.98, with time to hospital regressed on method of transportation,
income, region, rural/urban status, and gender.10 Ordinary least square regression, R2 = 18.2%, F(18, 7970) = 98.72, with time to hospital regressed on method of transportation,
income, region, rural/urban status, more often having access to roads than no access (1-5 scale), and gender.

Afghanistan in 201484

Governance 85
5 GOVERNANCEOn September 29, President Ashraf Ghani installed Dr. Abdullah Abdullah as chief executive to share power in what is now referred to as the National Unity Government. !e position of chief executive was created by presidential decree, and is expected to be formalized in the Afghan Constitution pending approval from both chambers in Afghanistan’s bicameral national legislature, also called the National Assembly. !e new government has to date established a special commission on electoral reforms, and reopened the investigation into the Kabul Bank fraud case, while President Ghani has promised reforms for the judiciary and anti-corruption e#orts. !e December 2014 London Conference is expected to make corruption an important part of the agenda for continued international support for Afghanistan.
Two important laws were passed in 2013 that a#ected the 2014 election process. !e "rst reduced executive in%uence over the Independent Elections Commission and the Independent Elections Complaint Commission. !e law still allows the president to directly select the leadership of both commissions, but from a pre-approved list of 27 candidates chosen by a committee that includes justice and parliamentary o$cials. !e second law established a framework for the 2014 elections as well as the upcoming 2015 parliamentary elections, which are anticipated to be delayed. !e laws also reduced the number of women who are directly appointed by the president to the Meshrano Jirga (Lower House), which may diminish women’s participation in governance.1 Separately, the Lower House approved a reduction in the quota for women’s seats in district and provincial councils, from 25% to 20%, a#ecting 21 seats.
Overall satisfaction with governance is a key factor underlying responses to questions in Chapter 1 (National Mood): 35.3% Afghans cite governance-related issues as a reason why the country is moving in the wrong direction,2 compared to 11.2% who cite it as a reason that the country is moving in the right direction.3 !e most frequently cited issue out of all governance issues is corruption, and a high proportion of Afghans continue to say that corruption is a major problem in Afghanistan as a whole, at various levels of government, and in their daily life. President Ashraf Ghani made "ghting corruption a key platform issue of his presidential election campaign.
!is chapter reviews longitudinal data on satisfaction with and con"dence in various levels of government, from national to local, with particular attention to measures of corruption. It also examines Afghans’ perceptions of access to justice and dispute resolution, including con"dence in o$cial and informal dispute resolution bodies.
5.1 Satisfaction with Government Performance Key QuestionsQ-34. Members of parliament have various responsibilities. How would you rate their
performance on each of the following duties? Would you say they are very effective, somewhat effective, somewhat ineffective, or very ineffective? a) Listening to constituents and representing their needs, b) Making laws for the good of the country, c) Monitoring the president and his staff.
Q-37. Thinking of the different levels of government in Afghanistan,do you think that overall the [insert item], is doing a very good job, somewhat good job, somewhat bad job or a very bad job? a) national government, b) provincial government, c) municipal authorities (asked to urban residents only),d) district government (asked to rural residents only).
85
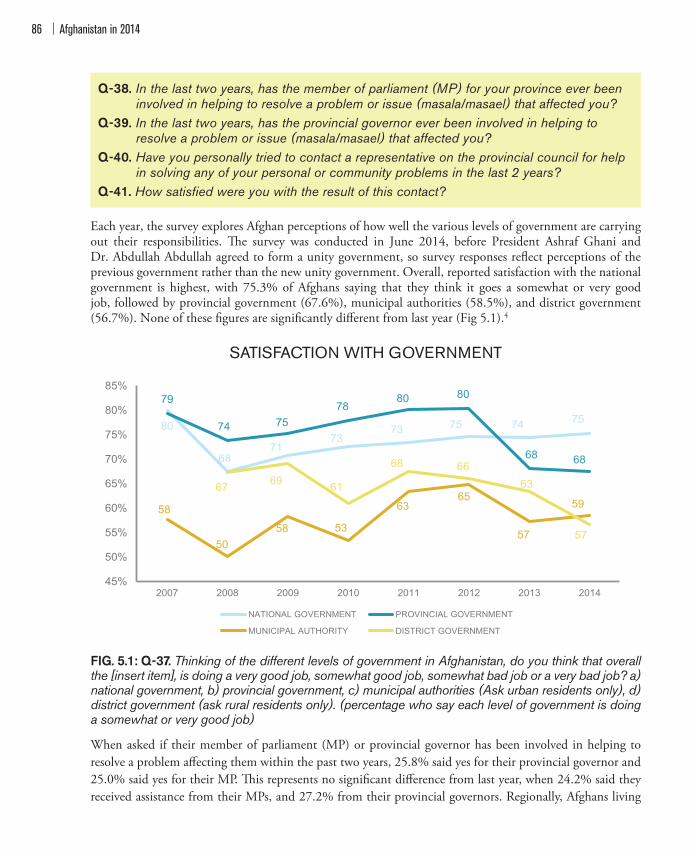
Afghanistan in 201486
Q-38. In the last two years, has the member of parliament (MP) for your province ever been involved in helping to resolve a problem or issue (masala/masael) that affected you?
Q-39. In the last two years, has the provincial governor ever been involved in helping to resolve a problem or issue (masala/masael) that affected you?
Q-40. Have you personally tried to contact a representative on the provincial council for help in solving any of your personal or community problems in the last 2 years?
Q-41. How satisfied were you with the result of this contact?
Each year, the survey explores Afghan perceptions of how well the various levels of government are carrying out their responsibilities. !e survey was conducted in June 2014, before President Ashraf Ghani and Dr. Abdullah Abdullah agreed to form a unity government, so survey responses re%ect perceptions of the previous government rather than the new unity government. Overall, reported satisfaction with the national government is highest, with 75.3% of Afghans saying that they think it goes a somewhat or very good job, followed by provincial government (67.6%), municipal authorities (58.5%), and district government (56.7%). None of these "gures are signi"cantly di#erent from last year (Fig 5.1).4
SATISFACTION WITH GOVERNMENT
FIG. 5.1: Q-37. Thinking of the different levels of government in Afghanistan, do you think that overall the [insert item], is doing a very good job, somewhat good job, somewhat bad job or a very bad job? a) national government, b) provincial government, c) municipal authorities (Ask urban residents only), d) district government (ask rural residents only). (percentage who say each level of government is doing a somewhat or very good job)
When asked if their member of parliament (MP) or provincial governor has been involved in helping to resolve a problem a#ecting them within the past two years, 25.8% said yes for their provincial governor and 25.0% said yes for their MP. !is represents no signi"cant di#erence from last year, when 24.2% said they received assistance from their MPs, and 27.2% from their provincial governors. Regionally, Afghans living
80
68 71
73 73 75 74 75
79
74 75 78
80 80
68 68
58
50 58 53
63 65
57
59 67 69 61
68 66 63
57
45%
50%
55%
60%
65%
70%
75%
80%
85%
2007 2008 2009 2010 2011 2012 2013 2014
NATIONAL GOVERNMENT PROVINCIAL GOVERNMENT
MUNICIPAL AUTHORITY DISTRICT GOVERNMENT
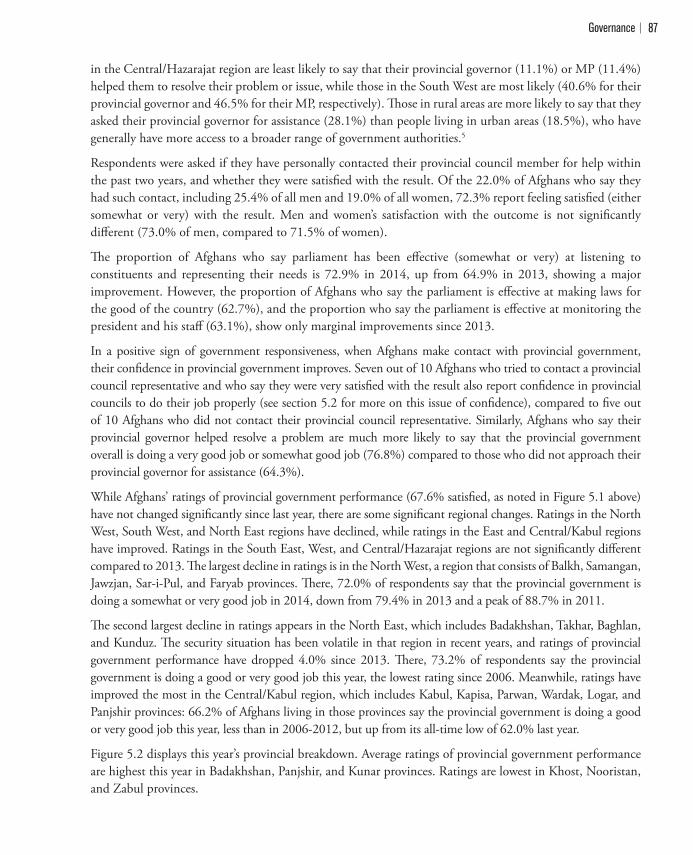
Governance 87
in the Central/Hazarajat region are least likely to say that their provincial governor (11.1%) or MP (11.4%) helped them to resolve their problem or issue, while those in the South West are most likely (40.6% for their provincial governor and 46.5% for their MP, respectively). !ose in rural areas are more likely to say that they asked their provincial governor for assistance (28.1%) than people living in urban areas (18.5%), who have generally have more access to a broader range of government authorities.5
Respondents were asked if they have personally contacted their provincial council member for help within the past two years, and whether they were satis"ed with the result. Of the 22.0% of Afghans who say they had such contact, including 25.4% of all men and 19.0% of all women, 72.3% report feeling satis"ed (either somewhat or very) with the result. Men and women’s satisfaction with the outcome is not signi"cantly di#erent (73.0% of men, compared to 71.5% of women).
!e proportion of Afghans who say parliament has been e#ective (somewhat or very) at listening to constituents and representing their needs is 72.9% in 2014, up from 64.9% in 2013, showing a major improvement. However, the proportion of Afghans who say the parliament is e#ective at making laws for the good of the country (62.7%), and the proportion who say the parliament is e#ective at monitoring the president and his sta# (63.1%), show only marginal improvements since 2013.
In a positive sign of government responsiveness, when Afghans make contact with provincial government, their con"dence in provincial government improves. Seven out of 10 Afghans who tried to contact a provincial council representative and who say they were very satis"ed with the result also report con"dence in provincial councils to do their job properly (see section 5.2 for more on this issue of con"dence), compared to "ve out of 10 Afghans who did not contact their provincial council representative. Similarly, Afghans who say their provincial governor helped resolve a problem are much more likely to say that the provincial government overall is doing a very good job or somewhat good job (76.8%) compared to those who did not approach their provincial governor for assistance (64.3%).
While Afghans’ ratings of provincial government performance (67.6% satis"ed, as noted in Figure 5.1 above) have not changed signi"cantly since last year, there are some signi"cant regional changes. Ratings in the North West, South West, and North East regions have declined, while ratings in the East and Central/Kabul regions have improved. Ratings in the South East, West, and Central/Hazarajat regions are not signi"cantly di#erent compared to 2013. !e largest decline in ratings is in the North West, a region that consists of Balkh, Samangan, Jawzjan, Sar-i-Pul, and Faryab provinces. !ere, 72.0% of respondents say that the provincial government is doing a somewhat or very good job in 2014, down from 79.4% in 2013 and a peak of 88.7% in 2011.
!e second largest decline in ratings appears in the North East, which includes Badakhshan, Takhar, Baghlan, and Kunduz. !e security situation has been volatile in that region in recent years, and ratings of provincial government performance have dropped 4.0% since 2013. !ere, 73.2% of respondents say the provincial government is doing a good or very good job this year, the lowest rating since 2006. Meanwhile, ratings have improved the most in the Central/Kabul region, which includes Kabul, Kapisa, Parwan, Wardak, Logar, and Panjshir provinces: 66.2% of Afghans living in those provinces say the provincial government is doing a good or very good job this year, less than in 2006-2012, but up from its all-time low of 62.0% last year.
Figure 5.2 displays this year’s provincial breakdown. Average ratings of provincial government performance are highest this year in Badakhshan, Panjshir, and Kunar provinces. Ratings are lowest in Khost, Nooristan, and Zabul provinces.
Afghanistan in 201488
PERCEPTION OF PROVINCIAL GOVERNMENT PERFORMANCE
FIG. 5.2: Q-37B. Thinking of the different levels of government in Afghanistan, do you think that overall the [insert item], is doing a very good job, somewhat good job, somewhat bad job or a very bad job? b) provincial government. (percentage who say “good job” or “very good job”)
5.2 Confidence in Public Institutions Key Questions
Q-36. I would like to ask you about some officials, institutions, and organizations. As I read out each, please tell me how much confidence you have in them to do their jobs.Do you have a lot, some, not much, no confidence, or no opinion? a) Independent Election Commission, b) Community Development Councils, c) Community shuras/ jirgas, d) Government ministers, e) International NGOs, f) Media such as newspapers, radio,TV, g) National NGOs, h) Parliament as a whole, i) Provincial Councils,
j) Religious leaders, k) Your member of parliament.
Each year, respondents are asked about the degree of con"dence they have in various public o$cials, institutions, and organizations to do their jobs. Response options include a lot, some, not much, and no con"dence at all, and like all questions in the survey, are read out loud to respondents. For the second consecutive year, the highest percentage of Afghans express some or a lot of con"dence in the media (72.7%). Prior to 2013, the highest percentage of Afghans expressed con"dence in religious leaders (70.0% in 2014). Notably, fewer Afghans express con"dence in government ministers (47.3%) than in any other body in 2014, similar to 2013 responses (Fig. 5.3).
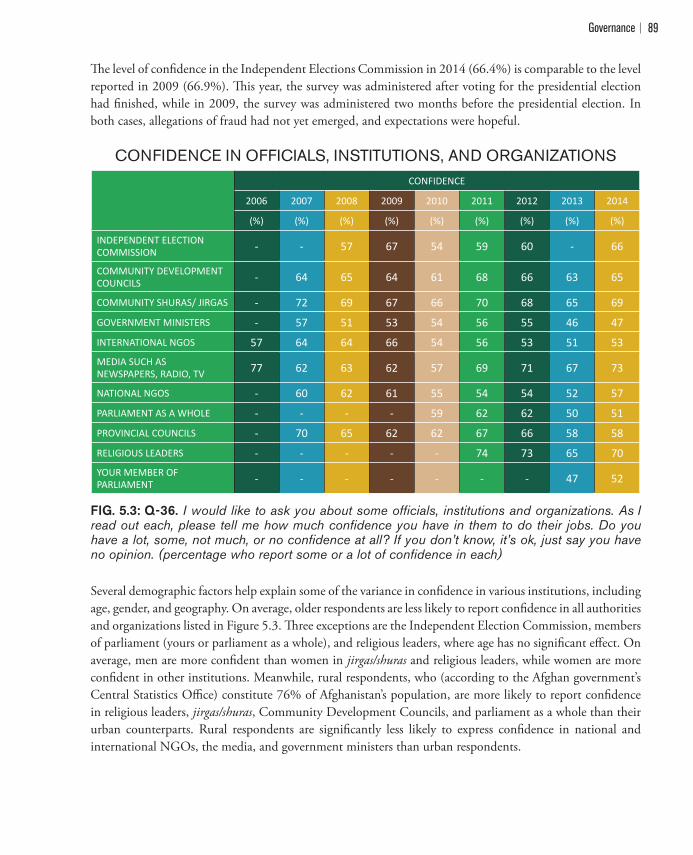
Governance 89
!e level of con"dence in the Independent Elections Commission in 2014 (66.4%) is comparable to the level reported in 2009 (66.9%). !is year, the survey was administered after voting for the presidential election had "nished, while in 2009, the survey was administered two months before the presidential election. In both cases, allegations of fraud had not yet emerged, and expectations were hopeful.
CONFIDENCE IN OFFICIALS, INSTITUTIONS, AND ORGANIZATIONS
CONFIDENCE
2006 2007 2008 2009 2010 2011 2012 2013 2014
)%( )%( )%( )%( )%( )%( )%( )%( )%(
INDEPENDENT ELECTIONCOMMISSION - - 57 67 54 59 60 - 66
COMMUNITY DEVELOPMENTCOUNCILS - 64 65 64 61 68 66 63 65
COMMUNITY SHURAS/ JIRGAS - 72 69 67 66 70 68 65 69
GOVERNMENT MINISTERS - 57 51 53 54 56 55 46 47
INTERNATIONAL NGOS 57 64 64 66 54 56 53 51 53 MEDIA SUCH ASNEWSPAPERS, RADIO, TV 77 62 63 62 57 69 71 67 73
NATIONAL NGOS - 60 62 61 55 54 54 52 57
PARLIAMENT AS A WHOLE - - - - 59 62 62 50 51
PROVINCIAL COUNCILS - 70 65 62 62 67 66 58 58
RELIGIOUS LEADERS - - - - - 74 73 65 70 YOUR MEMBER OFPARLIAMENT - - - - - - - 47 52
FIG. 5.3: Q-36. I would like to ask you about some officials, institutions and organizations. As I read out each, please tell me how much confidence you have in them to do their jobs. Do you have a lot, some, not much, or no confidence at all? If you don’t know, it’s ok, just say you have no opinion. (percentage who report some or a lot of confidence in each)
Several demographic factors help explain some of the variance in con"dence in various institutions, including age, gender, and geography. On average, older respondents are less likely to report con"dence in all authorities and organizations listed in Figure 5.3. !ree exceptions are the Independent Election Commission, members of parliament (yours or parliament as a whole), and religious leaders, where age has no signi"cant e#ect. On average, men are more con"dent than women in jirgas/shuras and religious leaders, while women are more con"dent in other institutions. Meanwhile, rural respondents, who (according to the Afghan government’s Central Statistics O$ce) constitute 76% of Afghanistan’s population, are more likely to report con"dence in religious leaders, jirgas/shuras, Community Development Councils, and parliament as a whole than their urban counterparts. Rural respondents are signi"cantly less likely to express con"dence in national and international NGOs, the media, and government ministers than urban respondents.
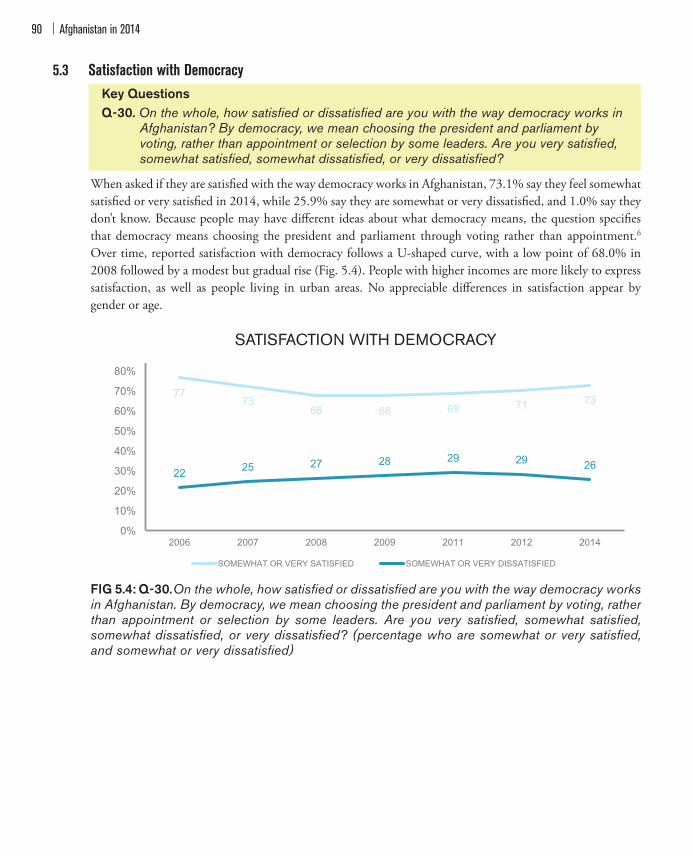
Afghanistan in 201490
5.3 Satisfaction with Democracy Key Questions Q-30. On the whole, how satisfied or dissatisfied are you with the way democracy works in
Afghanistan? By democracy, we mean choosing the president and parliament by voting, rather than appointment or selection by some leaders. Are you very satisfied, somewhat satisfied, somewhat dissatisfied, or very dissatisfied?
When asked if they are satis"ed with the way democracy works in Afghanistan, 73.1% say they feel somewhat satis"ed or very satis"ed in 2014, while 25.9% say they are somewhat or very dissatis"ed, and 1.0% say they don’t know. Because people may have di#erent ideas about what democracy means, the question speci"es that democracy means choosing the president and parliament through voting rather than appointment.6 Over time, reported satisfaction with democracy follows a U-shaped curve, with a low point of 68.0% in 2008 followed by a modest but gradual rise (Fig. 5.4). People with higher incomes are more likely to express satisfaction, as well as people living in urban areas. No appreciable di#erences in satisfaction appear by gender or age.
SATISFACTION WITH DEMOCRACY
FIG 5.4: Q-30. On the whole, how satisfied or dissatisfied are you with the way democracy works in Afghanistan. By democracy, we mean choosing the president and parliament by voting, rather than appointment or selection by some leaders. Are you very satisfied, somewhat satisfied, somewhat dissatisfied, or very dissatisfied? (percentage who are somewhat or very satisfied, and somewhat or very dissatisfied)
�
77 73
68 68 69 71 73
22 25 27 28 29 29 26
0%
10%
20%
30%
40%
50%
60%
70%
80%
90%
2006 2007 2008 2009 2011 2012 2014
SATISFACTION WITH DEMOCRACY
SOMEWHAT OR VERY SATISFIED SOMEWHAT OR VERY DISSATISFIED
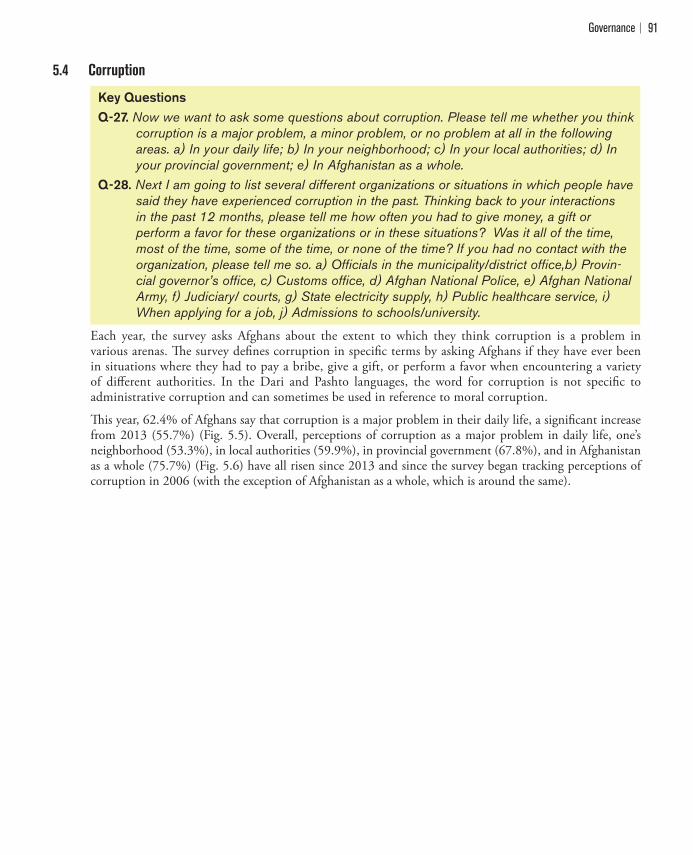
Governance 91
5.4 Corruption
Key QuestionsQ-27. Now we want to ask some questions about corruption. Please tell me whether you think
corruption is a major problem, a minor problem, or no problem at all in the following areas. a) In your daily life; b) In your neighborhood; c) In your local authorities; d) In your provincial government; e) In Afghanistan as a whole.
Q-28. Next I am going to list several different organizations or situations in which people have said they have experienced corruption in the past. Thinking back to your interactions in the past 12 months, please tell me how often you had to give money, a gift or perform a favor for these organizations or in these situations? Was it all of the time, most of the time, some of the time, or none of the time? If you had no contact with the organization, please tell me so. a) Officials in the municipality/district office,b) Provin-cial governor’s office, c) Customs office, d) Afghan National Police, e) Afghan National Army, f) Judiciary/ courts, g) State electricity supply, h) Public healthcare service, i) When applying for a job, j) Admissions to schools/university.
Each year, the survey asks Afghans about the extent to which they think corruption is a problem in various arenas. !e survey de"nes corruption in speci"c terms by asking Afghans if they have ever been in situations where they had to pay a bribe, give a gift, or perform a favor when encountering a variety of di#erent authorities. In the Dari and Pashto languages, the word for corruption is not speci"c to administrative corruption and can sometimes be used in reference to moral corruption.
!is year, 62.4% of Afghans say that corruption is a major problem in their daily life, a signi"cant increase from 2013 (55.7%) (Fig. 5.5). Overall, perceptions of corruption as a major problem in daily life, one’s neighborhood (53.3%), in local authorities (59.9%), in provincial government (67.8%), and in Afghanistan as a whole (75.7%) (Fig. 5.6) have all risen since 2013 and since the survey began tracking perceptions of corruption in 2006 (with the exception of Afghanistan as a whole, which is around the same).
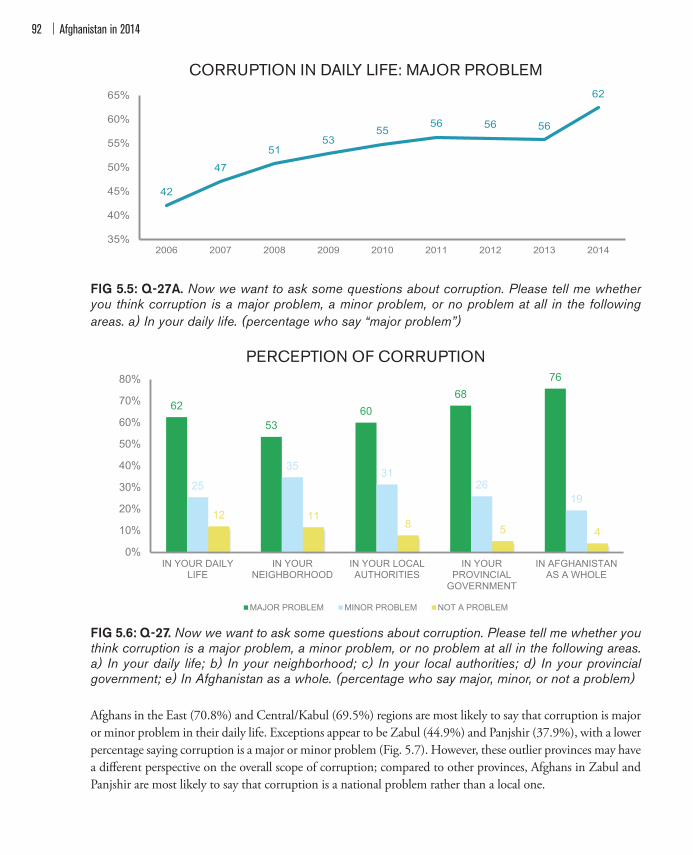
Afghanistan in 201492
CORRUPTION IN DAILY LIFE: MAJOR PROBLEM
FIG 5.5: Q-27A. Now we want to ask some questions about corruption. Please tell me whether you think corruption is a major problem, a minor problem, or no problem at all in the following areas. a) In your daily life. (percentage who say “major problem”)
PERCEPTION OF CORRUPTION
FIG 5.6: Q-27. Now we want to ask some questions about corruption. Please tell me whether you think corruption is a major problem, a minor problem, or no problem at all in the following areas. a) In your daily life; b) In your neighborhood; c) In your local authorities; d) In your provincial government; e) In Afghanistan as a whole. (percentage who say major, minor, or not a problem)
Afghans in the East (70.8%) and Central/Kabul (69.5%) regions are most likely to say that corruption is major or minor problem in their daily life. Exceptions appear to be Zabul (44.9%) and Panjshir (37.9%), with a lower percentage saying corruption is a major or minor problem (Fig. 5.7). However, these outlier provinces may have a di#erent perspective on the overall scope of corruption; compared to other provinces, Afghans in Zabul and Panjshir are most likely to say that corruption is a national problem rather than a local one.
62
53 60
68 76
25
35 31 26
19 12 11
8 5 4
0%
10%
20%
30%
40%
50%
60%
70%
80%
IN YOUR DAILYLIFE
IN YOURNEIGHBORHOOD
IN YOUR LOCALAUTHORITIES
IN YOURPROVINCIAL
GOVERNMENT
IN AFGHANISTANAS A WHOLE
PERCEPTION OF CORRUPTION
MAJOR PROBLEM MINOR PROBLEM NOT A PROBLEM
��ͷǤͷǤ�
�
42
47
5153
5556 56 56
62
35%
40%
45%
50%
55%
60%
65%
2006 2007 2008 2009 2010 2011 2012 2013 2014
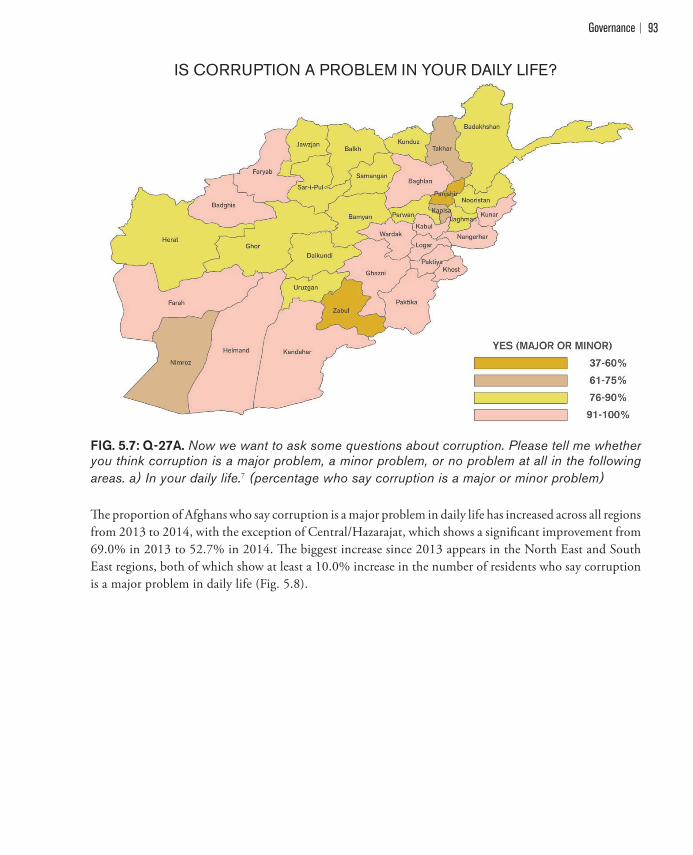
Governance 93
IS CORRUPTION A PROBLEM IN YOUR DAILY LIFE?
FIG. 5.7: Q-27A. Now we want to ask some questions about corruption. Please tell me whether you think corruption is a major problem, a minor problem, or no problem at all in the following areas. a) In your daily life.7 (percentage who say corruption is a major or minor problem)
!e proportion of Afghans who say corruption is a major problem in daily life has increased across all regions from 2013 to 2014, with the exception of Central/Hazarajat, which shows a signi"cant improvement from 69.0% in 2013 to 52.7% in 2014. !e biggest increase since 2013 appears in the North East and South East regions, both of which show at least a 10.0% increase in the number of residents who say corruption is a major problem in daily life (Fig. 5.8).
�
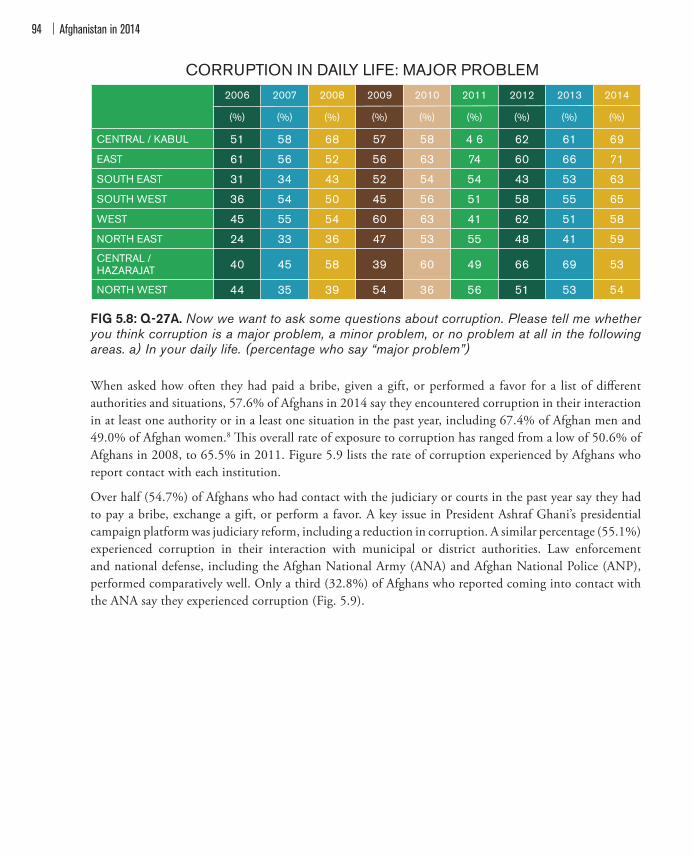
Afghanistan in 201494
CORRUPTION IN DAILY LIFE: MAJOR PROBLEM
2006 2007 2008 2009 2010 2011 2012 2013 2014
(%) (%) (%) (%) (%) (%) (%) (%) (%)
CENTRAL / KABUL 51 58 68 57 58 4 6 62 61 69
EAST 61 56 52 56 63 74 60 66 71
SOUTH EAST 31 34 43 52 54 54 43 53 63
SOUTH WEST 36 54 50 45 56 51 58 55 65
WEST 45 55 54 60 63 41 62 51 58
NORTH EAST 24 33 36 47 53 55 48 41 59 CENTRAL /HAZARAJAT 40 45 58 39 60 49 66 69 53
NORTH WEST 44 35 39 54 36 56 51 53 54
FIG 5.8: Q-27A. Now we want to ask some questions about corruption. Please tell me whether you think corruption is a major problem, a minor problem, or no problem at all in the following areas. a) In your daily life. (percentage who say “major problem”)
When asked how often they had paid a bribe, given a gift, or performed a favor for a list of di!erent authorities and situations, 57.6% of Afghans in 2014 say they encountered corruption in their interaction in at least one authority or in a least one situation in the past year, including 67.4% of Afghan men and 49.0% of Afghan women.8 "is overall rate of exposure to corruption has ranged from a low of 50.6% of Afghans in 2008, to 65.5% in 2011. Figure 5.9 lists the rate of corruption experienced by Afghans who report contact with each institution.
Over half (54.7%) of Afghans who had contact with the judiciary or courts in the past year say they had to pay a bribe, exchange a gift, or perform a favor. A key issue in President Ashraf Ghani’s presidential campaign platform was judiciary reform, including a reduction in corruption. A similar percentage (55.1%) experienced corruption in their interaction with municipal or district authorities. Law enforcement and national defense, including the Afghan National Army (ANA) and Afghan National Police (ANP), performed comparatively well. Only a third (32.8%) of Afghans who reported coming into contact with the ANA say they experienced corruption (Fig. 5.9).
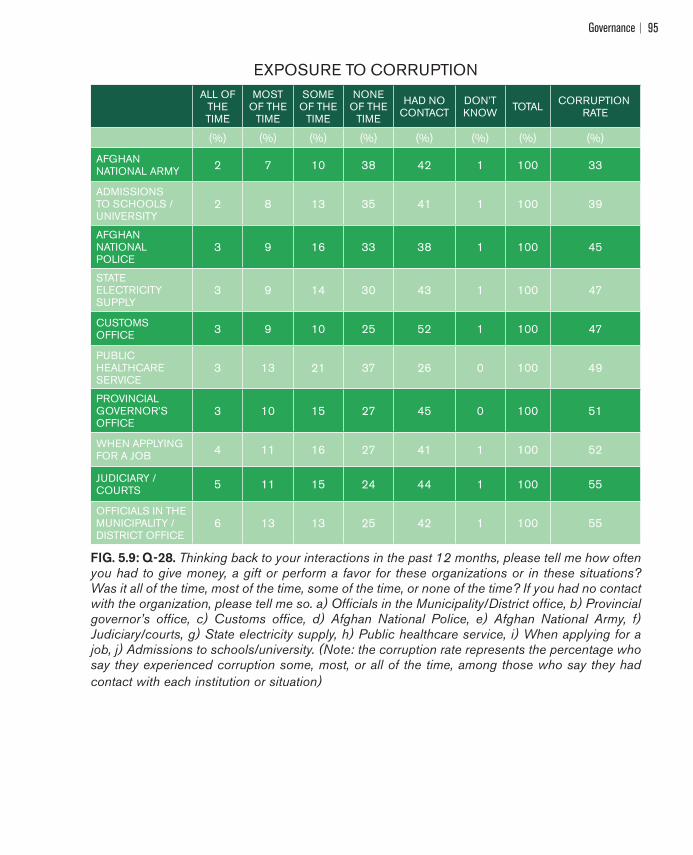
Governance 95
EXPOSURE TO CORRUPTION
ALL OF
THETIME
MOST OF THE
TIME
SOME OF THE
TIME
NONE OF THE
TIME
HAD NOCONTACT
DON’TKNOW TOTAL CORRUPTION
RATE
(%) (%) (%) (%) (%) (%) (%) (%)
AFGHANNATIONAL ARMY 2 7 10 38 42 1 100 33
ADMISSIONS TO SCHOOLS /UNIVERSITY
2 8 13 35 41 1 100 39
AFGHAN NATIONAL POLICE
3 9 16 33 38 1 100 45
STATE ELECTRICITY SUPPLY
3 9 14 30 43 1 100 47
CUSTOMS OFFICE 3 9 10 25 52 1 100 47
PUBLIC HEALTHCARESERVICE
3 13 21 37 26 0 100 49
PROVINCIAL GOVERNOR’SOFFICE
3 10 15 27 45 0 100 51
WHEN APPLYINGFOR A JOB 4 11 16 27 41 1 100 52
JUDICIARY /COURTS 5 11 15 24 44 1 100 55
OFFICIALS IN THE MUNICIPALITY /DISTRICT OFFICE
6 13 13 25 42 1 100 55
FIG. 5.9: Q-28. Thinking back to your interactions in the past 12 months, please tell me how often you had to give money, a gift or perform a favor for these organizations or in these situations? Was it all of the time, most of the time, some of the time, or none of the time? If you had no contact with the organization, please tell me so. a) Officials in the Municipality/District office, b) Provincial governor’s office, c) Customs office, d) Afghan National Police, e) Afghan National Army, f) Judiciary/courts, g) State electricity supply, h) Public healthcare service, i) When applying for a job, j) Admissions to schools/university. (Note: the corruption rate represents the percentage who say they experienced corruption some, most, or all of the time, among those who say they had contact with each institution or situation)
Afghanistan in 201496
5.5 Dispute Resolution and Justice SystemsKey QuestionsQ-59. In the past two years have you had a dispute or a formal case that you couldn’t settle
with the other party and had to go to the Huquq department or village/neighborhood-based shura/jirga to resolve it, or not?
Q-60. What kind of a case or dispute was it?Q-61. Were you fully satisfied, somewhat satisfied, or not satisfied with the outcome of the
proceedings?Q-62. Where have you taken this case or dispute?Q-63. (Ask if “Huquq department” was selected in Q-62) And now let’s turn to the
department. Tell me do you strongly agree, somewhat agree, somewhat disagree, or strongly disagree with the following statements about the Huquq department. a) Local Huquq are fair and trusted, b) Local Huquq follow the norms and values of our people, c) Local Huquq are effective at delivering justice, d) Local Huquq resolve cases quickly and efficiently.
Q-64. (Ask if “state courts” was selected in Q-62) Tell me, do you strongly agree, somewhat agree, somewhat disagree, or strongly disagree with the following statements about State courts? a) State courts are fair and trusted, b) State courts follow the local norms and values of our people, c) State courts are effective at delivering justice, d) State courts resolve cases promptly, e) State courts treat men and women equally.
Q-65. (Ask if “jirga/shura” was selected in Q-62) And now let’s turn to village/neighborhood based jirgas/shuras. Tell me do you strongly agree, somewhat agree, somewhat disagree, or strongly disagree with the following statements about the village/neighborhood based jirgas/ shuras? a) Local jirgas, shuras are fair and trusted,
b) Local jirgas, shuras follow the local norms and values of our people, c) Local jirgas, shuras are effective at delivering justice, d) Local jirgas, shuras resolve cases timely and promptly, e) There should be local women’s jirgas and shuras.
!is year, 19.1% of Afghans say that they had a dispute or formal case within the past two years that they could not resolve internally and had to go to a Huquq department or a local shura/jirga for resolution. Among those who took a case forward, most (80.7%) say they are satis"ed (either somewhat or very) with the outcome of the proceedings.
Huquqs are part of the formal justice system, along with state courts, while shuras and jirgas are part of the informal justice system. !e Huquq department is responsible for civil cases, such as disputes over divorce or land rights (the term Huquq means “rights” in the Dari language), and are located in every province and in most districts. State courts are responsible for criminal and other types of cases and are often limited to provincial centers. Shuras, on the other hand, are local consultative councils or assemblies of tribal elders who gather to discuss and make collective decisions about social issues, such as the location of a well or a schoolhouse, and jirgas are dispute resolution mechanisms where village elders hear speci"c individual disputes or con%icts between families or within families. In some cases, Afghans consult more than one of these bodies. For example, if a dispute over land were to involve violence between two parties, the local Huquq and a state court might both be involved. If the land were to contain a public access road or community well, a local shura might also be involved in the dispute resolution process.
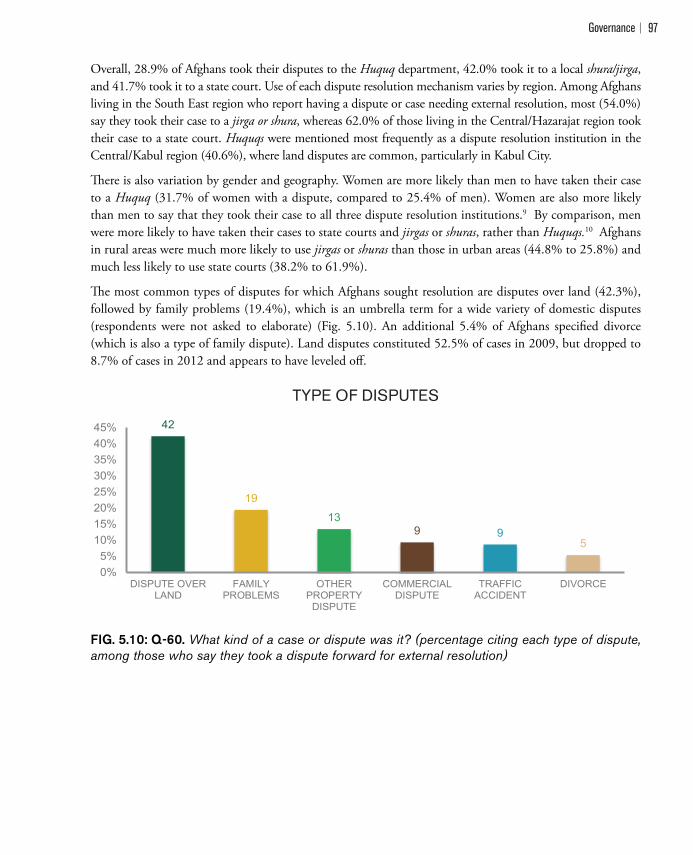
Governance 97
Overall, 28.9% of Afghans took their disputes to the Huquq department, 42.0% took it to a local shura/jirga, and 41.7% took it to a state court. Use of each dispute resolution mechanism varies by region. Among Afghans living in the South East region who report having a dispute or case needing external resolution, most (54.0%) say they took their case to a jirga or shura, whereas 62.0% of those living in the Central/Hazarajat region took their case to a state court. Huquqs were mentioned most frequently as a dispute resolution institution in the Central/Kabul region (40.6%), where land disputes are common, particularly in Kabul City.
!ere is also variation by gender and geography. Women are more likely than men to have taken their case to a Huquq (31.7% of women with a dispute, compared to 25.4% of men). Women are also more likely than men to say that they took their case to all three dispute resolution institutions.9 By comparison, men were more likely to have taken their cases to state courts and jirgas or shuras, rather than Huquqs.10 Afghans in rural areas were much more likely to use jirgas or shuras than those in urban areas (44.8% to 25.8%) and much less likely to use state courts (38.2% to 61.9%).
!e most common types of disputes for which Afghans sought resolution are disputes over land (42.3%), followed by family problems (19.4%), which is an umbrella term for a wide variety of domestic disputes (respondents were not asked to elaborate) (Fig. 5.10). An additional 5.4% of Afghans speci"ed divorce (which is also a type of family dispute). Land disputes constituted 52.5% of cases in 2009, but dropped to 8.7% of cases in 2012 and appears to have leveled o#.
TYPE OF DISPUTES
FIG. 5.10: Q-60. What kind of a case or dispute was it? (percentage citing each type of dispute, among those who say they took a dispute forward for external resolution)
��ͷǤͳͲ��
�
42
19
139 9
5
0%5%
10%15%20%25%30%35%40%45%
DISPUTE OVERLAND
FAMILYPROBLEMS
OTHERPROPERTY
DISPUTE
COMMERCIALDISPUTE
TRAFFICACCIDENT
DIVORCE
DISPUTE OVER LAND FAMILY PROBLEMS OTHER PROPERTY DISPUTE
COMMERCIAL DISPUTE TRAFFIC ACCIDENT DIVORCE
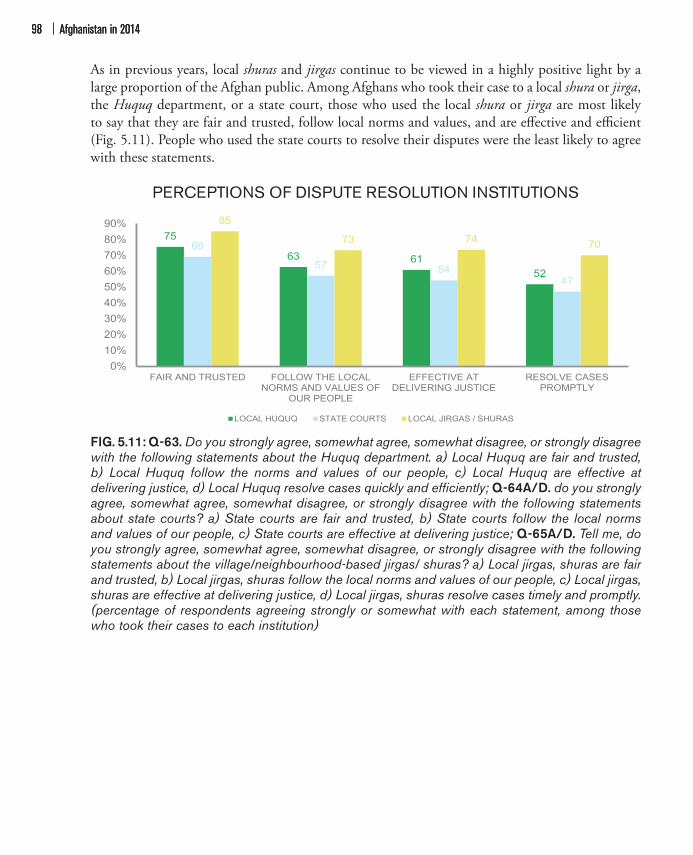
Afghanistan in 201498
�
75
63 61 52
69
57 54 47
85
73 74 70
0%10%20%30%40%50%60%70%80%90%
FAIR AND TRUSTED FOLLOW THE LOCALNORMS AND VALUES OF
OUR PEOPLE
EFFECTIVE ATDELIVERING JUSTICE
RESOLVE CASESPROMPTLY
PERCEPTIONS OF DISPUTE RESOLUTION INSTITUTIONS
LOCAL HUQUQ STATE COURTS LOCAL JIRGAS / SHURAS
Afghanistan in 201498
As in previous years, local shuras and jirgas continue to be viewed in a highly positive light by a large proportion of the Afghan public. Among Afghans who took their case to a local shura or jirga, the Huquq department, or a state court, those who used the local shura or jirga are most likely to say that they are fair and trusted, follow local norms and values, and are e#ective and e$cient (Fig. 5.11). People who used the state courts to resolve their disputes were the least likely to agree with these statements.
PERCEPTIONS OF DISPUTE RESOLUTION INSTITUTIONS
FIG. 5.11: Q-63. Do you strongly agree, somewhat agree, somewhat disagree, or strongly disagree with the following statements about the Huquq department. a) Local Huquq are fair and trusted, b) Local Huquq follow the norms and values of our people, c) Local Huquq are effective at delivering justice, d) Local Huquq resolve cases quickly and efficiently; Q-64A/D. do you strongly agree, somewhat agree, somewhat disagree, or strongly disagree with the following statements about state courts? a) State courts are fair and trusted, b) State courts follow the local norms and values of our people, c) State courts are effective at delivering justice; Q-65A/D. Tell me, do you strongly agree, somewhat agree, somewhat disagree, or strongly disagree with the following statements about the village/neighbourhood-based jirgas/ shuras? a) Local jirgas, shuras are fair and trusted, b) Local jirgas, shuras follow the local norms and values of our people, c) Local jirgas, shuras are effective at delivering justice, d) Local jirgas, shuras resolve cases timely and promptly. (percentage of respondents agreeing strongly or somewhat with each statement, among those who took their cases to each institution)

Governance 99
Endnotes1 Felbab Brown, Vanda. “Afghanistan in 2013: On the Cusp… or on the Brink?” in Asian Survey, 54(1) (Berkeley: University of California Press), January/February 2014), pp.165-176. University of California Press. p. 173. Accessed Oct. 15, 2014: http://www.jstor.org/stable/10.1525/as.2014.54.1.165.2 Bad government, corruption, poor leadership, administrative corruption, injustice in the country, lack of implementation of the law, weak parliament. 3 Good government, reduction in level of administrative corruption, having a legal constitution, prevention/elimination of crimes, establishing high peace with the jirga/shura, improved justice. 4 !e term “signi"cance,” here and throughout the survey report, is based on statistical tests of group di#erences.5 Based on logistic regression: seeing the provincial governor or not was regressed on natural logarithm of income, gender, region, and rural/urban designation.6 For in-depth interviews on how Afghans de"ne democracy and other key terms used in the survey, a qualitative supplement is available online at asiafoundation.org/ag2014poll.7 Corruption is a scale (Į=0.72) using questions q27a, q27b, q27c, q27d and q27e, which measures the extent to which an Afghan perceive corruption is a major problem in his or her daily life, neighborhood, local authorities, provincial government and Afghanistan as a whole.8 Based on whether respondents answered some of the time, most of the time, or all of the time to any items in the battery of q28.9 t(1883) = -4.04, p<.0001, with women more likely than men to have gone to all three institutions.10 t(1883) = 3.86, p<.0001, with men more likely to go to state courts and jirgas/shuras for their issue.

Afghanistan in 2014100

Political Participation 101
6 POLITICAL PARTICIPATIONOn April 5, 2014, Afghans went to the polls to elect a new president and provincial councils. !ere were eight presidential candidates on the April 2014 ballot.1 !ree women were on the national ballot as candidates for vice president, and the number of women provincial council candidates was higher than in previous elections. No candidate in the "rst election received a majority of votes, and a run-o# election was held on June 14 between the two top candidates, Dr. Abdullah Abdullah and Dr. Ashraf Ghani. On September 21, a unity government between the president (Dr. Ghani) and a newly created position of chief executive (Dr. Abdullah) was announced.
While the presidential campaign was lively—ranging from local rallies, to YouTube videos distributed across social media, to televised debates on a range of domestic and international topics—the pre-election period was marked by violence. !e Taliban mounted a deadly campaign targeting international organizations, election organizers, and journalists, prompting many foreign observers to leave the country. On election day, 23 people were killed in attacks, most of them government workers and soldiers.2 !is year’s survey indicates that 45.8% Afghans report that they feel some level of fear while participating in an election. However, despite threats and security risks, voter participation in the 2014 elections exceeded that of the 2009 presidential election. !e Independent Electoral Commission (IEC) reported that more than 6.8 million Afghans voted in the "rst round of the election (36% of whom were women) at more than 5,000 polling stations across the country, and 8.1 million ballots were reportedly cast in the run-o# election.3
!is year’s survey took place immediately after the run-o# vote, in late June. Allegations of fraud surfaced immediately following the vote and circulated rapidly in the media, which may have impacted citizens’ views on a range of issues, including political participation. !is year’s data provides insight into how Afghans view the political process, how they make electoral decisions, and what shapes their voting preferences during times of political uncertainty.
6.1 Exercising Basic Political FreedomsKey QuestionsQ-32. In some countries, people do not feel able to publicly criticize their government, while in other countries they feel quite free to do so in public. Thinking back to a year ago, how safe did you feel expressing your opinions about the government in public? 1) Very safe, 2) Somewhat safe, 3) Somewhat unsafe, 4) Very unsafe.Q-33. How much influence do you think someone like you can have over local (district/provincial) government decisions – a lot, some, very little, or none at all?
In 2014, 67.4% of Afghans surveyed said they feel very safe or somewhat safe expressing their opinions about the government in public.4 Residents of Parwan (94.3%), Panjshir (91.9%), and Samangan (86.0%) provinces are most likely to say they feel safe criticizing the government. !e percentage of residents who felt safe doing so is lowest in Uruzghan (43.9%), Ghor (49.2%), Herat (51.3%), and Zabul (51.9%) provinces. Afghans living in urban areas (76.2%) are more likely to feel safe speaking out in public than those in rural areas (64.5%). No signi"cant gender di#erences emerge for this question.
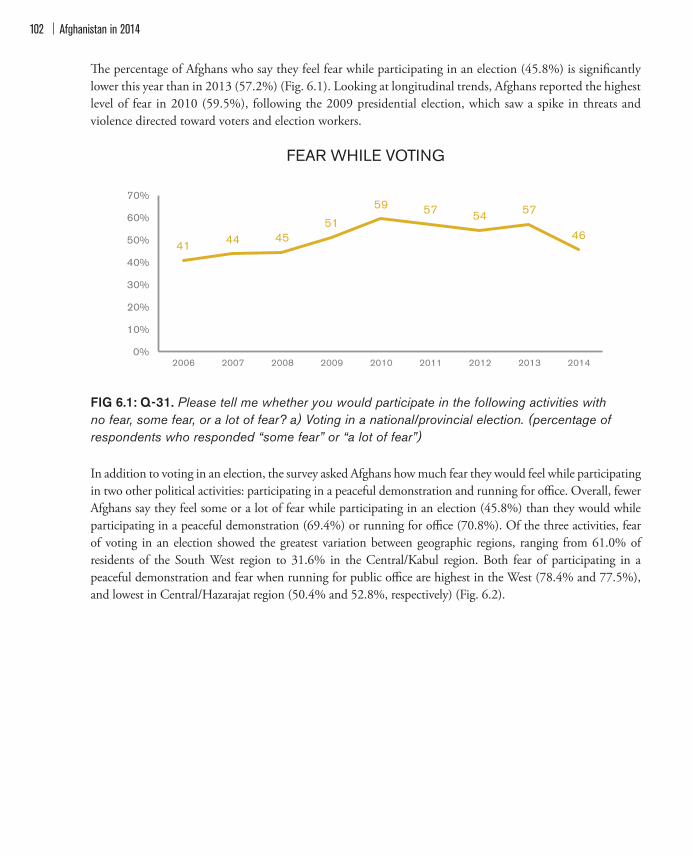
Afghanistan in 2014102
!e percentage of Afghans who say they feel fear while participating in an election (45.8%) is signi"cantly lower this year than in 2013 (57.2%) (Fig. 6.1). Looking at longitudinal trends, Afghans reported the highest level of fear in 2010 (59.5%), following the 2009 presidential election, which saw a spike in threats and violence directed toward voters and election workers.
FEAR WHILE VOTING
FIG 6.1: Q-31. Please tell me whether you would participate in the following activities with no fear, some fear, or a lot of fear? a) Voting in a national/provincial election. (percentage of respondents who responded “some fear” or “a lot of fear”)
In addition to voting in an election, the survey asked Afghans how much fear they would feel while participating in two other political activities: participating in a peaceful demonstration and running for o$ce. Overall, fewer Afghans say they feel some or a lot of fear while participating in an election (45.8%) than they would while participating in a peaceful demonstration (69.4%) or running for o$ce (70.8%). Of the three activities, fear of voting in an election showed the greatest variation between geographic regions, ranging from 61.0% of residents of the South West region to 31.6% in the Central/Kabul region. Both fear of participating in a peaceful demonstration and fear when running for public o$ce are highest in the West (78.4% and 77.5%), and lowest in Central/Hazarajat region (50.4% and 52.8%, respectively) (Fig. 6.2).
41 44 45 51
59 57 54 57
46
0%
10%
20%
30%
40%
50%
60%
70%
2006 2007 2008 2009 2010 2011 2012 2013 2014

Political Participation 103
FEAR WHILE PARTICIPATING IN POLITICAL ACTIVITIES
FIG. 6.2: Q-31. Would you participate in the following activities with no fear, some fear, or a lot of fear? a) Voting in a national/provincial election, b) Participating in a peaceful demonstration, c) Running for public office. (percentage of respondents who responded “some fear” or “a lot of fear”)
6.2 Ability to Influence Local Government DecisionsKey QuestionQ-33. How much influence do you think someone like you can have over local (district/provincial) government decisions – a lot, some, very little, or none at all?
When asked whether they feel they can in%uence local government decisions, 55.9% of Afghans say they have a lot or some in%uence over decisions made at the district and provincial level. Answers to this question vary greatly by province (Fig. 6.3). Afghans who live in Nangarhar (81.1%), Kunduz (77.4%), Samangan (76.0%), and Kandahar (73.6%) are most likely to say they have some or a lot of in%uence over local government decisions. Residents of Parwan (21.8%), Panjshir (28.8%), and Zabul (34.4%) were least likely to say the same.
32
53 5661 58
34 32
50
6167
77 7478
68
50
74
60
75 75 76 7770
53
76
0%
10%
20%
CENTRAL / KABUL EAST
SOUTH EAST
SOUTH WEST WEST
NORTH EAST
CENTRAL / HAZARAJAT
NORTH WEST
30%
40%
50%
60%
70%
80%
90%
PARTICIPATING IN AN ELECTION PARTICIPATING IN A PEACEFUL DEMONSTRATIONRUNNING FOR PUBLIC OFFICE
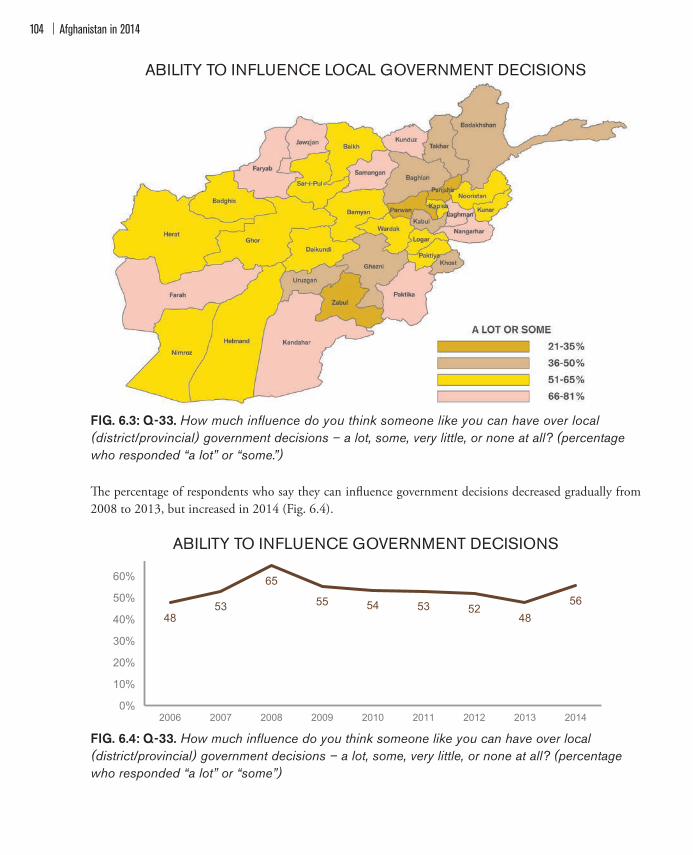
Afghanistan in 2014104
ABILITY TO INFLUENCE LOCAL GOVERNMENT DECISIONS
FIG. 6.3: Q-33. How much influence do you think someone like you can have over local (district/provincial) government decisions – a lot, some, very little, or none at all? (percentage who responded “a lot” or “some.”)
!e percentage of respondents who say they can in%uence government decisions decreased gradually from 2008 to 2013, but increased in 2014 (Fig. 6.4).
ABILITY TO INFLUENCE GOVERNMENT DECISIONS
FIG. 6.4: Q-33. How much influence do you think someone like you can have over local (district/provincial) government decisions – a lot, some, very little, or none at all? (percentage who responded “a lot” or “some”)
4853
65
55 54 53 5248
56
0%
10%
20%
30%
40%
50%
60%
70%
2006 2007 2008 2009 2010 2011 2012 2013 2014

Political Participation 105
Neither income nor age has a signi"cant relationship with whether or not Afghans say they can in%uence government decisions. Education level has a small but signi"cant positive relationship with the perception of having in%uence over government decisions. However, several factors do appear to correspond with whether Afghans say they can in%uence government decisions. One of the most signi"cant of these is con"dence that if one were a victim of violence or crime, that the guilty party would be punished (Fig 6.5). !ese patterns emerge after controlling for age, income, region, ethnicity, and all other factors listed.5 !e following response patterns reveal survey response tendencies, and do not indicate a causal relationship.
AFGHANS’ PERCEPTIONS OF ABILITY TO INFLUENCE GOVERNMENT DECISIONS
AFGHANS WHO REPORT MORE ABILITY TO INFLUENCE LOCAL GOVERNMENT DECISIONS, ON AVERAGE, ARE:
AFGHANS WHO REPORT LESS ABILITY TO INFLUENCE LOCAL GOVERNMENT DECISIONS, ON AVERAGE, ARE:
More likely to be men More likely to be women
More likely to have voted in the recent elections Less likely to have voted in the recent elections
More likely to be ethnically Pashtun or Uzbek More likely to be ethnically Tajik or Hazara
More confident that the guilty party would be punished,if they were a victim of violence or a criminal act
Less confident that the guilty party would be punished, if they were a victim of violence or a criminal act
More satisfied with available local dispute resolution mechanisms Less satisfied with available local dispute resolution mechanisms
More likely to report having paid a bribe to a government officer Less likely to report having paid a bribe to a government officer
More likely to report feeling fear for their personal safety Less likely to report feeling fear for their personal safety
More likely to have remained within Afghanistan over the past 23 years More likely to have left the country in the past 23 years
FIG. 6.5: Q-33. How much influence do you think someone like you can have over local (district /provincial) government decisions – a lot, some, very little, or none at all? (average tendencies based on regression analysis)
6.3 Politics and Religion Key QuestionQ-29. Some people say that that politics and religion should be mixed. Other people say politics and religion should not mix. For example, some say religious scholars should only manage religion, and should not take part in politics. Which is closer to your view?
!e survey asked respondents which they agree with more: the idea that politics and religion should be mixed, or that religious scholars should not take part in politics. Most Afghans (64.9%) say politics and religion should be mixed, while 33.2% say that religious leaders should not take part in politics, and 1.8% say they don’t know. !is represents a signi"cant increase since last year, but with prominent regional di#erences. Afghans in the South West (78.8%) and East (74.9%) regions are most likely to support the role of religious leaders in politics. !ese two regions show the largest increases in the number of Afghans who hold that view since last year (a 16.1 percentage point increase in the South West, and a 23.7 percentage point increase in the East). Afghans in the Central/Kabul region, by contrast, show a decrease in the number who say that politics and religion should be mixed, from 71.5% in 2013 to 63.4% in 2014. Overall, Afghans in the Central/Hazarajat (52.2%) region are least likely to say the same (Fig. 6.6).
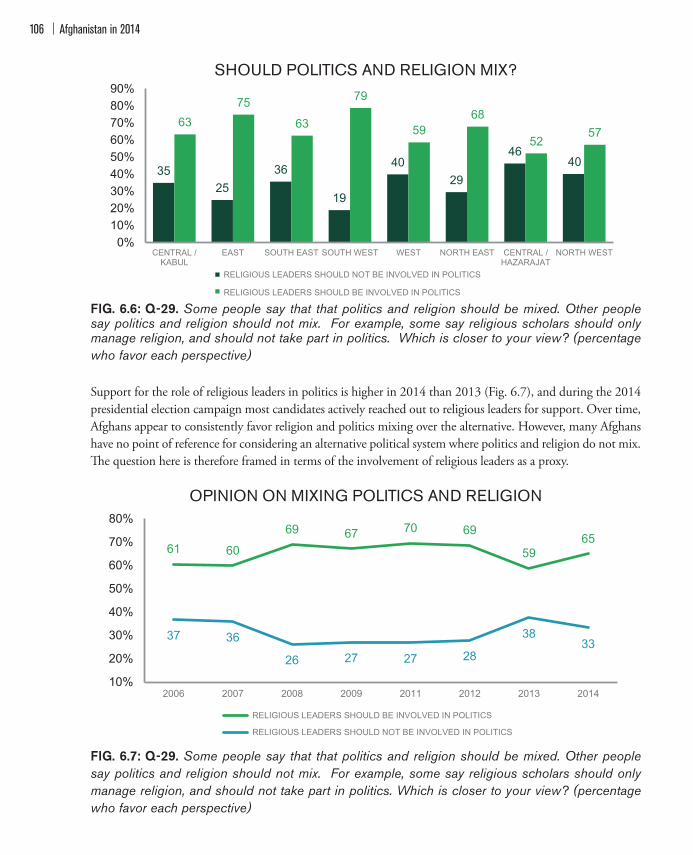
Afghanistan in 2014106
�
61 60
69 67 70 69
59 65
37 36
26 27 27 28
38 33
10%
20%
30%
40%
50%
60%
70%
80%
2006 2007 2008 2009 2011 2012 2013 2014
RELIGIOUS LEADERS SHOULD BE INVOLVED IN POLITICS
RELIGIOUS LEADERS SHOULD NOT BE INVOLVED IN POLITICS
SHOULD POLITICS AND RELIGION MIX?
FIG. 6.6: Q-29. Some people say that that politics and religion should be mixed. Other people say politics and religion should not mix. For example, some say religious scholars should only manage religion, and should not take part in politics. Which is closer to your view? (percentage who favor each perspective)
Support for the role of religious leaders in politics is higher in 2014 than 2013 (Fig. 6.7), and during the 2014 presidential election campaign most candidates actively reached out to religious leaders for support. Over time, Afghans appear to consistently favor religion and politics mixing over the alternative. However, many Afghans have no point of reference for considering an alternative political system where politics and religion do not mix. !e question here is therefore framed in terms of the involvement of religious leaders as a proxy.
OPINION ON MIXING POLITICS AND RELIGION
FIG. 6.7: Q-29. Some people say that that politics and religion should be mixed. Other people say politics and religion should not mix. For example, some say religious scholars should only manage religion, and should not take part in politics. Which is closer to your view? (percentage who favor each perspective)
35 25
36
19
40 29
46 40
63 75
63
79
59 68
52 57
0%10%20%30%40%50%60%70%80%90%
CENTRAL /KABUL
EAST SOUTH EAST SOUTH WEST WEST NORTH EAST CENTRAL /HAZARAJAT
NORTH WEST
RELIGIOUS LEADERS SHOULD NOT BE INVOLVED IN POLITICS
RELIGIOUS LEADERS SHOULD BE INVOLVED IN POLITICS
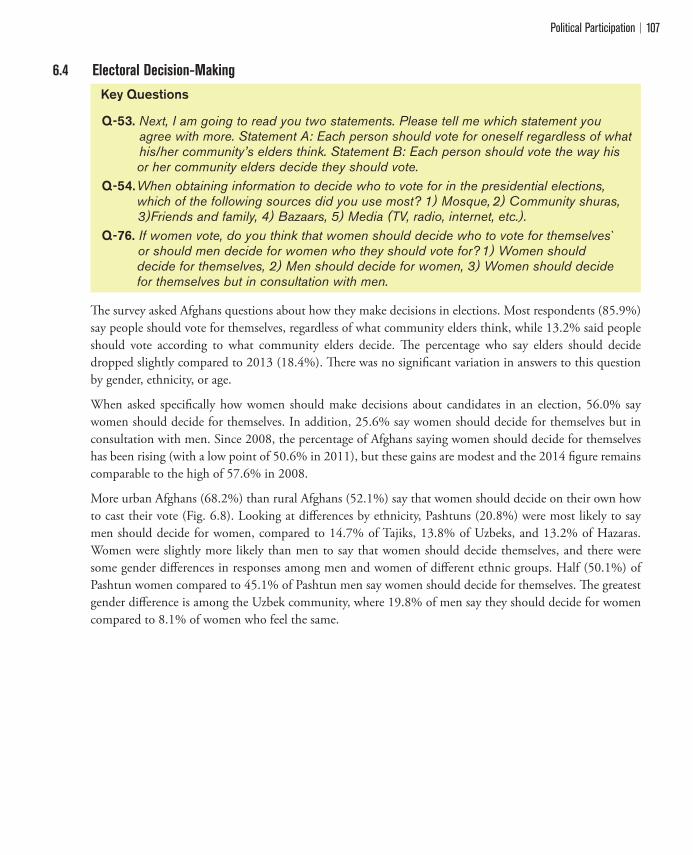
Political Participation 107
6.4 Electoral Decision-Making Key Questions
Q-53. Next, I am going to read you two statements. Please tell me which statement you agree with more. Statement A: Each person should vote for oneself regardless of what his/her community’s elders think. Statement B: Each person should vote the way his or her community elders decide they should vote. Q-54. When obtaining information to decide who to vote for in the presidential elections, which of the following sources did you use most? 1) Mosque, 2) Community shuras, 3)Friends and family, 4) Bazaars, 5) Media (TV, radio, internet, etc.).Q-76. If women vote, do you think that women should decide who to vote for themselves ̀ or should men decide for women who they should vote for? 1) Women should decide for themselves, 2) Men should decide for women, 3) Women should decide for themselves but in consultation with men.
!e survey asked Afghans questions about how they make decisions in elections. Most respondents (85.9%) say people should vote for themselves, regardless of what community elders think, while 13.2% said people should vote according to what community elders decide. !e percentage who say elders should decide dropped slightly compared to 2013 (18.4%). !ere was no signi"cant variation in answers to this question by gender, ethnicity, or age.
When asked speci"cally how women should make decisions about candidates in an election, 56.0% say women should decide for themselves. In addition, 25.6% say women should decide for themselves but in consultation with men. Since 2008, the percentage of Afghans saying women should decide for themselves has been rising (with a low point of 50.6% in 2011), but these gains are modest and the 2014 "gure remains comparable to the high of 57.6% in 2008.
More urban Afghans (68.2%) than rural Afghans (52.1%) say that women should decide on their own how to cast their vote (Fig. 6.8). Looking at di#erences by ethnicity, Pashtuns (20.8%) were most likely to say men should decide for women, compared to 14.7% of Tajiks, 13.8% of Uzbeks, and 13.2% of Hazaras. Women were slightly more likely than men to say that women should decide themselves, and there were some gender di#erences in responses among men and women of di#erent ethnic groups. Half (50.1%) of Pashtun women compared to 45.1% of Pashtun men say women should decide for themselves. !e greatest gender di#erence is among the Uzbek community, where 19.8% of men say they should decide for women compared to 8.1% of women who feel the same.

Afghanistan in 2014108
WOMEN’S INDEPENDENCE IN VOTING
FIG. 6.8: Q-76. If women vote, do you think that women should decide who to vote for themselves or should men decide for women who they should vote for? 1) Women should decide for themselves, 2) Men should decide for women, 3) Women should decide for themselves but in consultation with men. (percentage who chose each response)
For the 2014 presidential elections, one in three Afghans (33.5%) say they relied primarily on the media (including TV, radio, and the internet) to learn about the candidates and decide who they would vote for (Fig. 6.9). Another third (39.3%) say they relied on family and friends, followed by 11.8% who turned to community shuras (consultative councils), and 10.0% who relied on information from mosques.7
As might be expected, respondents who live in rural areas were signi"cantly less likely to rely on media (24.8%) than residents of urban areas (60.8%). !ose who live in the East (48.9%) and South East (51.0%) regions were more likely to rely on family and friends than residents of the Central/Kabul region (26.5%) and West region (32.5%), and more women (48.0%) than men (29.3%) say they relied on family and friends.
54 58
68
52 56
25 26 20
28 25 20
15 10
19 17
0%
10%
20%
30%
40%
50%
60%
70%
80%
MEN WOMEN URBAN RURAL OVERALL WOMEN SHOULD DECIDE FOR THEMSELVES WOMEN SHOULD DECIDE FOR THEMSELVES, BUT IN CONSULTATION WITH MEN MEN SHOULD DECIDE FOR WOMEN
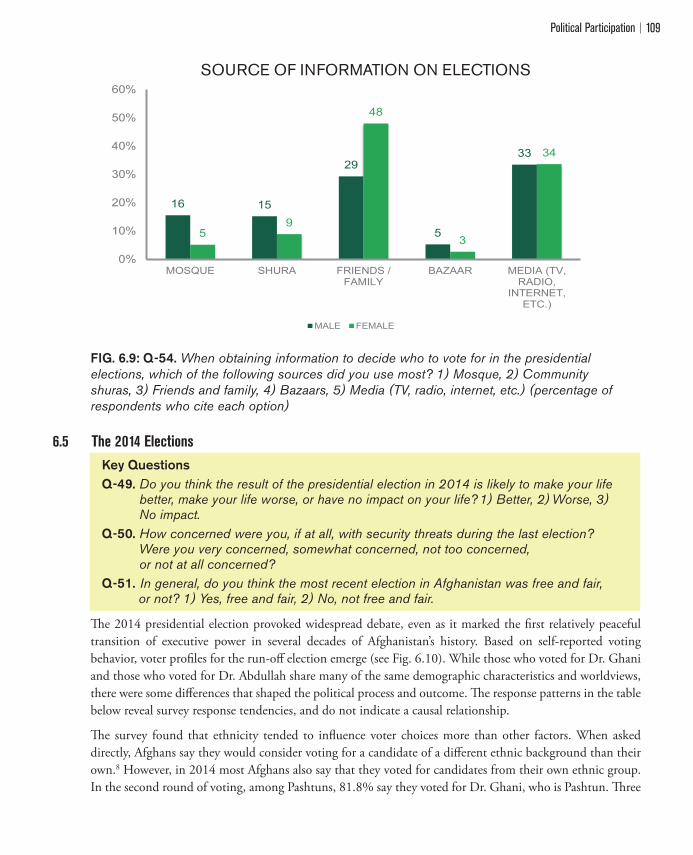
Political Participation 109
SOURCE OF INFORMATION ON ELECTIONS
FIG. 6.9: Q-54. When obtaining information to decide who to vote for in the presidential elections, which of the following sources did you use most? 1) Mosque, 2) Community shuras, 3) Friends and family, 4) Bazaars, 5) Media (TV, radio, internet, etc.) (percentage of respondents who cite each option)
6.5 The 2014 ElectionsKey QuestionsQ-49. Do you think the result of the presidential election in 2014 is likely to make your life better, make your life worse, or have no impact on your life? 1) Better, 2) Worse, 3) No impact.Q-50. How concerned were you, if at all, with security threats during the last election? Were you very concerned, somewhat concerned, not too concerned, or not at all concerned? Q-51. In general, do you think the most recent election in Afghanistan was free and fair, or not? 1) Yes, free and fair, 2) No, not free and fair.
!e 2014 presidential election provoked widespread debate, even as it marked the "rst relatively peaceful transition of executive power in several decades of Afghanistan’s history. Based on self-reported voting behavior, voter pro"les for the run-o# election emerge (see Fig. 6.10). While those who voted for Dr. Ghani and those who voted for Dr. Abdullah share many of the same demographic characteristics and worldviews, there were some di#erences that shaped the political process and outcome. !e response patterns in the table below reveal survey response tendencies, and do not indicate a causal relationship.
!e survey found that ethnicity tended to in%uence voter choices more than other factors. When asked directly, Afghans say they would consider voting for a candidate of a di#erent ethnic background than their own.8 However, in 2014 most Afghans also say that they voted for candidates from their own ethnic group. In the second round of voting, among Pashtuns, 81.8% say they voted for Dr. Ghani, who is Pashtun. !ree
�
16 15
29
5
33
5 9
48
3
34
0%
10%
20%
30%
40%
50%
60%
MOSQUE SHURA FRIENDS /FAMILY
BAZAAR MEDIA (TV,RADIO,
INTERNET,ETC.)
MALE FEMALE
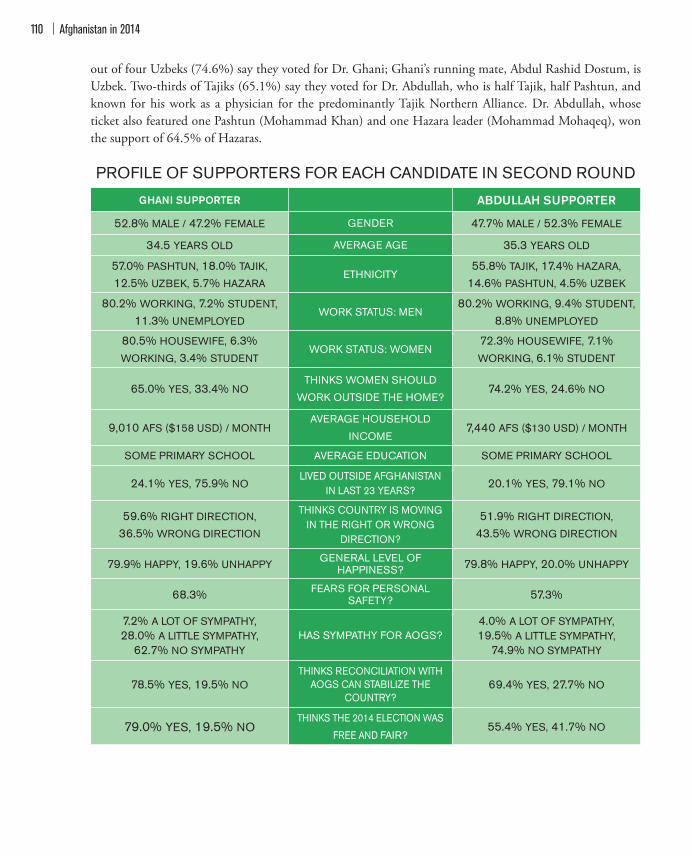
Afghanistan in 2014110
out of four Uzbeks (74.6%) say they voted for Dr. Ghani; Ghani’s running mate, Abdul Rashid Dostum, is Uzbek. Two-thirds of Tajiks (65.1%) say they voted for Dr. Abdullah, who is half Tajik, half Pashtun, and known for his work as a physician for the predominantly Tajik Northern Alliance. Dr. Abdullah, whose ticket also featured one Pashtun (Mohammad Khan) and one Hazara leader (Mohammad Mohaqeq), won the support of 64.5% of Hazaras.
PROFILE OF SUPPORTERS FOR EACH CANDIDATE IN SECOND ROUND
GHANI SUPPORTER ABDULLAH SUPPORTER
52.8% MALE / 47.2% FEMALE GENDER 47.7% MALE / 52.3% FEMALE
34.5 YEARS OLD AVERAGE AGE 35.3 YEARS OLD
57.0% PASHTUN, 18.0% TAJIK, 12.5% UZBEK, 5.7% HAZARA
ETHNICITY55.8% TAJIK, 17.4% HAZARA,
14.6% PASHTUN, 4.5% UZBEK
80.2% WORKING, 7.2% STUDENT, 11.3% UNEMPLOYED
WORK STATUS: MEN80.2% WORKING, 9.4% STUDENT,
8.8% UNEMPLOYED
80.5% HOUSEWIFE, 6.3% WORKING, 3.4% STUDENT
WORK STATUS: WOMEN72.3% HOUSEWIFE, 7.1% WORKING, 6.1% STUDENT
65.0% YES, 33.4% NOTHINKS WOMEN SHOULD
WORK OUTSIDE THE HOME?74.2% YES, 24.6% NO
9,010 AFS ($158 USD) / MONTHAVERAGE HOUSEHOLD
INCOME7,440 AFS ($130 USD) / MONTH
SOME PRIMARY SCHOOL AVERAGE EDUCATION SOME PRIMARY SCHOOL
24.1% YES, 75.9% NOLIVED OUTSIDE AFGHANISTAN
IN LAST 23 YEARS?20.1% YES, 79.1% NO
59.6% RIGHT DIRECTION, 36.5% WRONG DIRECTION
THINKS COUNTRY IS MOVING IN THE RIGHT OR WRONG
DIRECTION?
51.9% RIGHT DIRECTION, 43.5% WRONG DIRECTION
79.9% HAPPY, 19.6% UNHAPPY GENERAL LEVEL OF HAPPINESS? 79.8% HAPPY, 20.0% UNHAPPY
68.3% FEARS FOR PERSONAL SAFETY? 57.3%
7.2% A LOT OF SYMPATHY, 28.0% A LITTLE SYMPATHY,
62.7% NO SYMPATHYHAS SYMPATHY FOR AOGS?
4.0% A LOT OF SYMPATHY, 19.5% A LITTLE SYMPATHY,
74.9% NO SYMPATHY
78.5% YES, 19.5% NOTHINKS RECONCILIATION WITH
AOGS CAN STABILIZE THE COUNTRY?
69.4% YES, 27.7% NO
79.0% YES, 19.5% NOTHINKS THE 2014 ELECTION WAS
FREE AND FAIR?55.4% YES, 41.7% NO
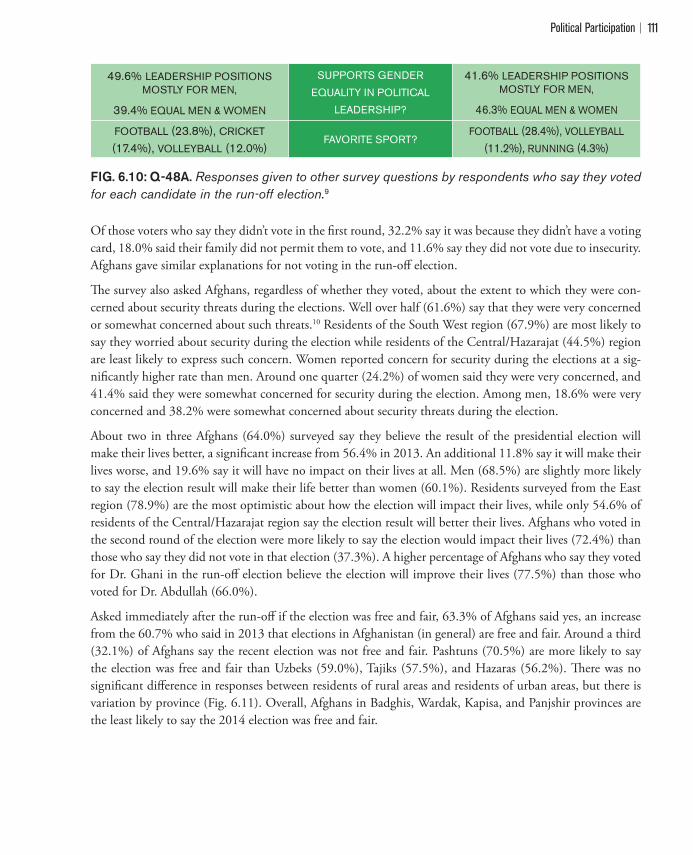
Political Participation 111
49.6% LEADERSHIP POSITIONS MOSTLY FOR MEN,
39.4% EQUAL MEN & WOMEN
SUPPORTS GENDER
EQUALITY IN POLITICAL
LEADERSHIP?
41.6% LEADERSHIP POSITIONS MOSTLY FOR MEN,
46.3% EQUAL MEN & WOMEN
FOOTBALL (23.8%), CRICKET (17.4%), VOLLEYBALL (12.0%)
FAVORITE SPORT?FOOTBALL (28.4%), VOLLEYBALL
(11.2%), RUNNING (4.3%)
FIG. 6.10: Q-48A. Responses given to other survey questions by respondents who say they voted for each candidate in the run-off election.9
Of those voters who say they didn’t vote in the "rst round, 32.2% say it was because they didn’t have a voting card, 18.0% said their family did not permit them to vote, and 11.6% say they did not vote due to insecurity. Afghans gave similar explanations for not voting in the run-o# election.
!e survey also asked Afghans, regardless of whether they voted, about the extent to which they were con-cerned about security threats during the elections. Well over half (61.6%) say that they were very concerned or somewhat concerned about such threats.10 Residents of the South West region (67.9%) are most likely to say they worried about security during the election while residents of the Central/Hazarajat (44.5%) region are least likely to express such concern. Women reported concern for security during the elections at a sig-ni"cantly higher rate than men. Around one quarter (24.2%) of women said they were very concerned, and 41.4% said they were somewhat concerned for security during the election. Among men, 18.6% were very concerned and 38.2% were somewhat concerned about security threats during the election.
About two in three Afghans (64.0%) surveyed say they believe the result of the presidential election will make their lives better, a signi"cant increase from 56.4% in 2013. An additional 11.8% say it will make their lives worse, and 19.6% say it will have no impact on their lives at all. Men (68.5%) are slightly more likely to say the election result will make their life better than women (60.1%). Residents surveyed from the East region (78.9%) are the most optimistic about how the election will impact their lives, while only 54.6% of residents of the Central/Hazarajat region say the election result will better their lives. Afghans who voted in the second round of the election were more likely to say the election would impact their lives (72.4%) than those who say they did not vote in that election (37.3%). A higher percentage of Afghans who say they voted for Dr. Ghani in the run-o# election believe the election will improve their lives (77.5%) than those who voted for Dr. Abdullah (66.0%).
Asked immediately after the run-o# if the election was free and fair, 63.3% of Afghans said yes, an increase from the 60.7% who said in 2013 that elections in Afghanistan (in general) are free and fair. Around a third (32.1%) of Afghans say the recent election was not free and fair. Pashtuns (70.5%) are more likely to say the election was free and fair than Uzbeks (59.0%), Tajiks (57.5%), and Hazaras (56.2%). !ere was no signi"cant di#erence in responses between residents of rural areas and residents of urban areas, but there is variation by province (Fig. 6.11). Overall, Afghans in Badghis, Wardak, Kapisa, and Panjshir provinces are the least likely to say the 2014 election was free and fair.
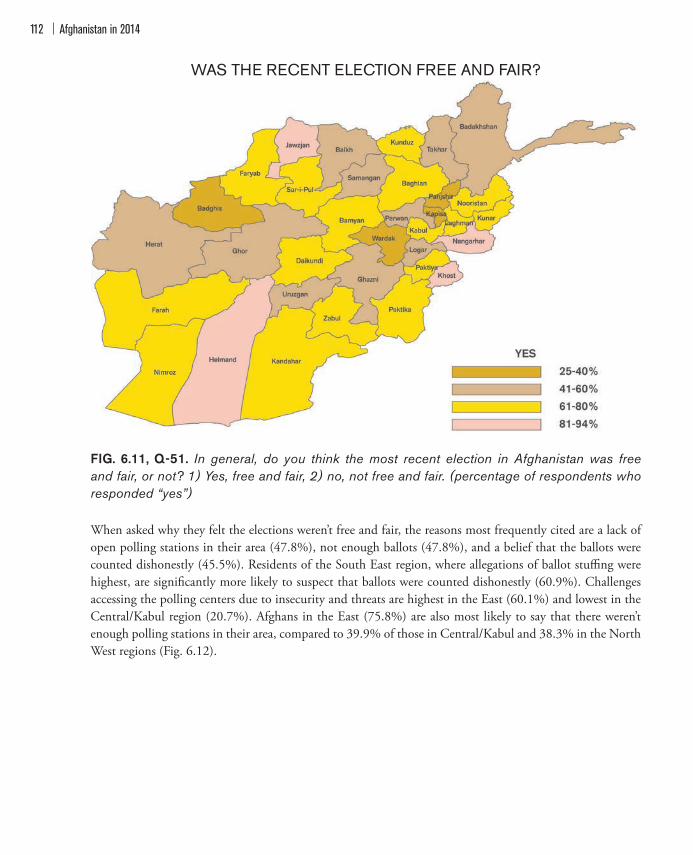
Afghanistan in 2014112
WAS THE RECENT ELECTION FREE AND FAIR?
FIG. 6.11, Q-51. In general, do you think the most recent election in Afghanistan was free and fair, or not? 1) Yes, free and fair, 2) no, not free and fair. (percentage of respondents who responded “yes”)
When asked why they felt the elections weren’t free and fair, the reasons most frequently cited are a lack of open polling stations in their area (47.8%), not enough ballots (47.8%), and a belief that the ballots were counted dishonestly (45.5%). Residents of the South East region, where allegations of ballot stu$ng were highest, are signi"cantly more likely to suspect that ballots were counted dishonestly (60.9%). Challenges accessing the polling centers due to insecurity and threats are highest in the East (60.1%) and lowest in the Central/Kabul region (20.7%). Afghans in the East (75.8%) are also most likely to say that there weren’t enough polling stations in their area, compared to 39.9% of those in Central/Kabul and 38.3% in the North West regions (Fig. 6.12).
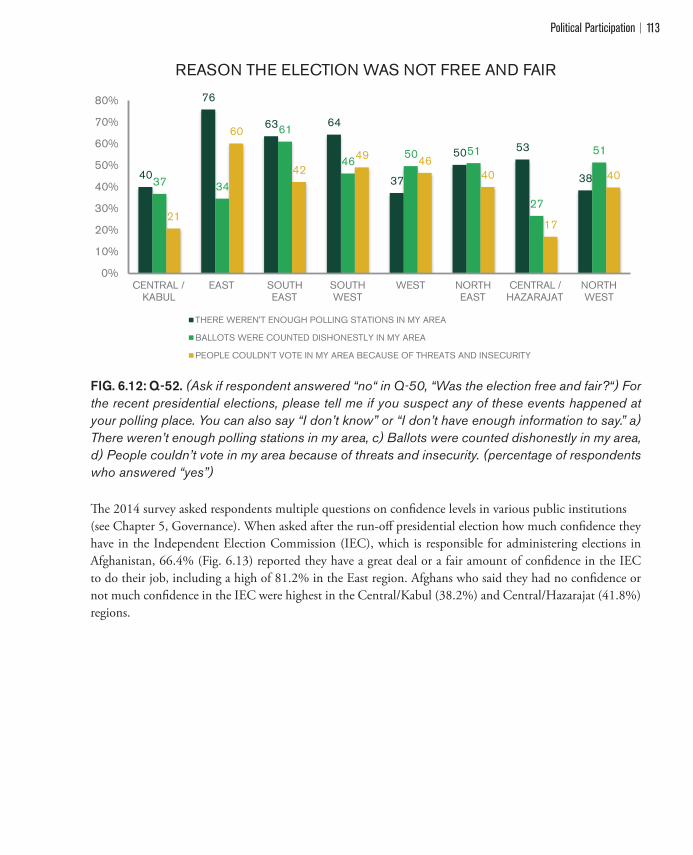
Political Participation 113
REASON THE ELECTION WAS NOT FREE AND FAIR
FIG. 6.12: Q-52. (Ask if respondent answered “no“ in Q-50, “Was the election free and fair?“) For the recent presidential elections, please tell me if you suspect any of these events happened at your polling place. You can also say “I don’t know” or “I don’t have enough information to say.” a) There weren’t enough polling stations in my area, c) Ballots were counted dishonestly in my area, d) People couldn’t vote in my area because of threats and insecurity. (percentage of respondents who answered “yes”)
!e 2014 survey asked respondents multiple questions on con"dence levels in various public institutions (see Chapter 5, Governance). When asked after the run-o# presidential election how much con"dence they have in the Independent Election Commission (IEC), which is responsible for administering elections in Afghanistan, 66.4% (Fig. 6.13) reported they have a great deal or a fair amount of con"dence in the IEC to do their job, including a high of 81.2% in the East region. Afghans who said they had no con"dence or not much con"dence in the IEC were highest in the Central/Kabul (38.2%) and Central/Hazarajat (41.8%) regions.
40
76
63 64
37
50 53
38 37 34
61
46 50 51
27
51
21
60
42 49 46
40
17
40
0%
10%
20%
30%
40%
50%
60%
70%
80%
CENTRAL /KABUL
EAST SOUTHEAST
SOUTHWEST
WEST NORTHEAST
CENTRAL /HAZARAJAT
NORTHWEST
THERE WEREN'T ENOUGH POLLING STATIONS IN MY AREA
BALLOTS WERE COUNTED DISHONESTLY IN MY AREA
PEOPLE COULDN'T VOTE IN MY AREA BECAUSE OF THREATS AND INSECURITY

Afghanistan in 2014114 Afghanistan in 2014114
CONFIDENCE IN THE INDEPENDENT ELECTIONS COMMISSION
FIG. 6.13: Q-36A. Please tell me how much confidence you have in the Independent Elections Commission to do their job.
57
67
54
59
60
66
34
27
44
40
39
32
8 5
2 1 1 2
0%
10%
20%30%40%50%
60%70%80%
2008 2009 2010 2011 2012 2014
A GREAT DEAL / A FAIR AMOUNT NOT VERY MUCH / NO CONFIDENCE DON'T KNOW
Political Participation 115
Endnotes1 !e names of three other candidates who withdrew shortly before the April election (Qayum Karzai, Sader Mohammad Nadir
Naeem, and Abdul Rahim Wardak) also appeared on the ballot.2 According to data reported by the U.S. army, compiled from Afghan authorities, there were 286 insurgent attacks in Afghanistan
on April 5: 226 in eastern Afghanistan, 21 in the Kandahar region, 17 in the western provinces, 14 in the north, seven in Helmand, and one in Kabul. See Partlow, Joshua, “Violence Data Show Spike During Afghan Presidential Election,” !e Washington Post, April 14, 2014.
3 Independent Election Commission of Afghanistan. “Preliminary Results of the 2014 Presidential Election.” April 26, 2014. http://www.iec.org.af/media-section/press-releases/357-preliminary.
4 Among those residents of insecure areas who were surveyed using intercept interviews, the percentage who feel very or somewhat safe criticizing their government in public was 57.9%.
5 Using OLS regression, perception of how much respondents think they have in%uence on local government’s decisions was regressed on a variety of demographic and attitudinal measures, including educational level, gender, age, income, whether having migrated to another country, fear for personal safety, con"dence that the guilty party would be punished, having experienced corruption scale (Į=0.8969), fear of participating in social activities scale (Į=0.7317), perception about member of parliament scale (Į=0.8163), sympathy for AOGs, and satisfaction about dispute resolution services in the area. A 95% con"dence level was imposed for all coe$cients. !e full model explained 14.89% of the variance in whether a respondent voted in the "rst round of presidential election or not (R2=0.1489, F(12,6646)=96.91, P > .0001).
6 Note that the wording of this question changed in 2014. In 2013, Afghans were asked, “Some people say that politics and religion should be mixed (i.e. local religious leaders should be regularly consulted on the problems facing an area), while others think that politics and religion should not mix. Which is closer to your view?” In 2014, the question was, “Some people say that politics and religion should be mixed. Other people say that politics and religion should not mix. For example, some say religious leaders should only manage religion, and should not take part in politics. Which is closer to your view?” By comparison, the Pew survey of Muslims around the world found that 53% of Afghans believe religious leaders should have large in%uence in politics, and 29% believe they should have some in%uence. !is "gure was the highest among the 20 countries Pew surveyed. Pew Research Center. “!e World’s Muslims: Politics, Religion, and Society”. (Washington, DC: April 2013), 64. !e Pew survey, conducted in November/December 2011, asked 1,509 Muslims in Afghanistan, “In your opinion, how much in%uence should religious leaders have in political matters? A large in%uence, some in%uence, not too much in%uence or no in%uence at all?”
7 A separate poll of Afghans conducted in late 2013 found that of all forms of media, Afghans were mostly likely to turn to radio for election information, especially those Afghans who live in the southern provinces. See Glevum Associates. “Afghanistan Presidential Election 2014 Poll Results (Wave 1).” December 2013, 25-26.
8 In a survey by Glevum Associates, 84% of respondents said they would vote for a candidate from a tribe or ethnic group other than their own, or that ethnicity did not matter. Glevum Associates. “Afghanistan Presidential Election 2014 Poll Results (Wave 1),” 34.
9 Table shows responses to the following questions if the respondent said they voted for Dr. Abdullah or Dr. Ghani in the runo# election (Q-48a): gender (d1), age (d2), ethnicity (d11), work status (d3), should women work outside the home?, average household income (d14), average education (d7), lived outside Afghanistan in last 23 years? (d16), country moving in right direction? (q1), happiness, fear for personal safety (q20), sympathy with AOGs (q57), believe reconciliation with AOGs can stabilize the country? (q55), was 2014 election free and fair? (q51), women in political leadership?, and favorite sport (d20).
10 !is is an increase from 53% who said in late 2013 they were “very” or “a little” concerned about threats, as reported in a survey by Glevum Associates. Glevum Associates. “Afghanistan Presidential Election 2014 Poll Results (Wave 1),” 21.

Afghanistan in 2014116

Access to Information 117
7 ACCESS TO INFORMATIONTechnology-driven developments over the past 13 years have revolutionized the speed at which citizens share information on elections, security, and Afghanistan’s place in the broader international community. !e recent growth in mobile phone and television ownership in Afghanistan re%ects a country catching up with the times. However, long before the Taliban banned television, cinema, and music, Afghanistan’s media sector was modernizing parallel to neighboring Iran and Pakistan. In Afghanistan today, the legacy of civil war and Taliban rule makes “access to information” a broad concept: access to the outside world through any means possible, and well beyond access to news and public information.
Television broadcasts stopped in 1992 during the civil war, and under Taliban rule, television, "lms, satellite dishes, and music were banned. !e primary sources of information to the outside world were print and AM news radio. Today, as well as before 2001, radio continues to be the primary source of news and information for most Afghans. Before 2001, a handful of satellite phones and Public Call O$ces (PCOs) were available in cities and towns. T he Afghan Ministry of Communication and Information Technology reports 21.6 million mobile phone users and 700,000 internet subscriptions nationwide, with coverage in most but not all rural areas.1 Economic factors are facilitating consumer growth, as mobile phones and internet bandwidth become more a#ordable.2 Television now includes 68 private TV stations, 22 state-owned provincial channels, and a national state TV called Radio Television of Afghanistan (RTA).3
Access to information is considered a fundamental right in Article 50 of the Afghan Constitution.4 Despite this, Freedom House classi"es media in Afghanistan as “not free” relative to other countries.5 Reasons cited include the Afghan Ministry of Culture and Information’s recently issued a letter to local media outlets ordering “self-censorship” of anything that is against the Islamic Shari’ah laws.6 Journalists have been threatened, physically abused, or killed while carrying out their duties.7 Protections for press and activists may improve with the Access to Information Law, which was rati"ed this year by the Lower House of Parliament (Wolesi Jirga).8 !is law consists of 32 articles, and aims to protect journalists, civil society, and human rights activists from censorship when performing duties to disseminate public information. As of October 2014, the Upper House and president have not yet approved this law.
!is year’s data re%ects di#erences among rural and urban Afghans in obtaining news and information. Access to information, in particular television, continues to play a major role in shaping public opinion.
7.1 Physical Sources of News and InformationKey QuestionsQ-6. Do you or do you not use any of the following for obtaining news and information? (radio, TV set, mobile phone, the internet, community shuras)D-6D. How many of the following does your household have? (TV)

Afghanistan in 2014118
As in previous years, in 2014 the most widely used source for obtaining news and information in Afghanistan is radio (77.4% of all Afghans), followed by television (58.4%), mobile phones (48.1%), mosques (46.9%), community shuras (consultative councils) (36.4%), and the internet (5.6%). Compared to last year, reliance on radio and mobile phones as a main source of news and information dropped considerably for both urban and rural areas, largely due to the expansion of other available options, such as television and the internet. For example, television ownership has risen from 36.9% in 2007 to 58.3% in 2014 (Fig. 7.1), while the use of television as a source of news and information increased from 54.8% in 2013 to 58.4% in 2014. Internet use also increased from 3.2% in 2013 to 5.6% in 2014.9
TV OWNERSHIP IN AFGHANISTAN
FIG. 7.1: X-1B. Do you own any of the following here in your household in functioning order? (TV) (used from 2007 to 2012); D-6D. How many of the following does your household have? (TV) (only used in 2014, recoded for comparison with X-1B) (percentage who own TVs)
Sources for obtaining news and information di#er among rural and urban Afghans. In urban areas, television is reported to be the most widely used source (91.1%), while in rural areas it is radio (82.5%). Reliance on mobile phones as a source of news and information dropped signi"cantly in urban areas, from 83% in 2013 to 54.6% in 2014. Mosques (43.2%), community shuras (25.8%), and the internet (17.5%) are other important sources of obtaining news and information among urban respondents. Consistent with the growing trend reported by the Ministry of Communication and Information Technology,10 use of the internet for obtaining information nearly doubled in urban areas over the past year, from 9% in 2013 to 17.5% in 2014, but still remains negligible in rural areas. In rural areas, reliance on television (48.0%) and mobile phones (46.0%) is less common compared to urban areas, while the mosque (48.1%) and community shuras (39.8%) are more common compared to urban areas (Fig 7.2).
37 38 41 41 42
52 58
0%
10%
20%
30%
40%
50%
60%
70%
2007 2008 2009 2010 2011 2012 2014

Access to Information 119
SOURCE FOR NEWS/INFORMATION
FIG. 7.2: Q-6B. Do you or do you not use any of the following for obtaining news and information? (percentage who use each)
7.2 Television’s Role in Public Opinion and BehaviorKey QuestionsQ-6B. Do you or do you not use any of the following for obtaining news and information? (TV)D-6D. How many of the following does your household have? (TV)
Media can play a major role in shaping public opinion. Television is considered a particularly in%uential source for obtaining information because it provides visual content that radio cannot and is a primary source of exposure to new ideas and foreign cultures.11 In developing countries, television often plays a critical role in social change, including in such arenas as public health.12 Evidence suggests it plays a major role in shaping mood and social attitudes.13 While the survey cannot isolate the impact of watching speci"c television content on public opinion and behavior, there are patterns in attitudes and opinions that emerge from comparing respondents who do and do not use television as a source of information on measures of voting behavior, sports participation, sympathy with Armed Opposition Groups (AOGs), and attitudes toward women.
While media use may not directly relate to voter participation, Afghans who report using television and radio for obtaining news and information are signi"cantly more likely to report having voted in the "rst round of presidential elections than those who do not use television and radio. Meanwhile, use of a mobile phone, the internet, and the local mosque for news and information had no signi"cant e#ect on whether or not respondents voted in the presidential election.14 !is year, presidential candidates and the Independent Election Commission (IEC) used television and radio to disseminate election campaign information and generate public interest in the election. Television and radio programs also discussed topics such as the relationship between Islam and the election, and the importance of women’s voting.
61
91
55
18
43
26
83
48 46
2
4840
0%
20%
40%
60%
80%
100%
RADIO TV MOBILE PHONE INTERNET MOSQUE COMMUNITYSHURAS
URBAN RURAL
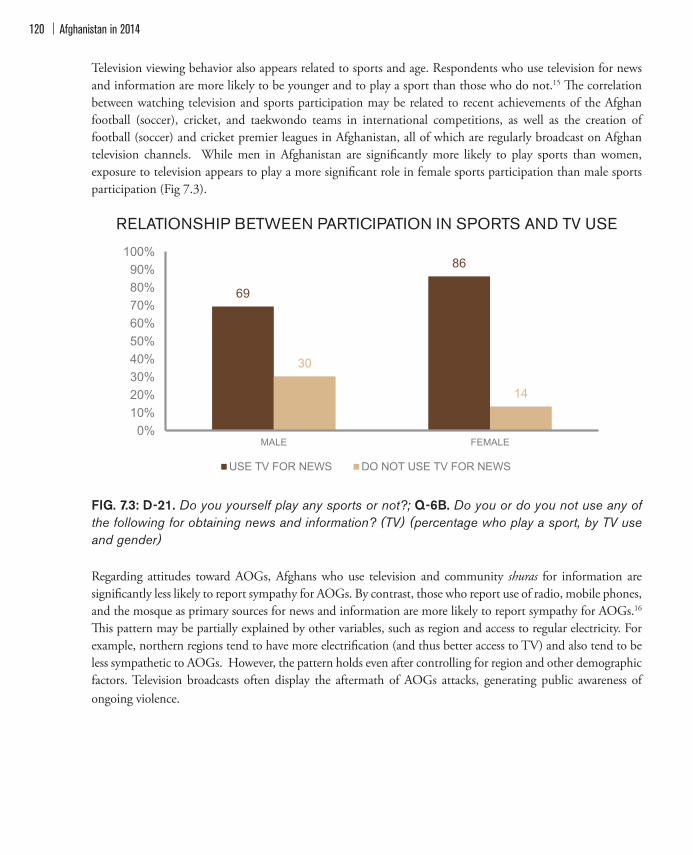
Afghanistan in 2014120
Television viewing behavior also appears related to sports and age. Respondents who use television for news and information are more likely to be younger and to play a sport than those who do not.15 !e correlation between watching television and sports participation may be related to recent achievements of the Afghan football (soccer), cricket, and taekwondo teams in international competitions, as well as the creation of football (soccer) and cricket premier leagues in Afghanistan, all of which are regularly broadcast on Afghan television channels. While men in Afghanistan are signi"cantly more likely to play sports than women, exposure to television appears to play a more signi"cant role in female sports participation than male sports participation (Fig 7.3).
RELATIONSHIP BETWEEN PARTICIPATION IN SPORTS AND TV USE
FIG. 7.3: D-21. Do you yourself play any sports or not?; Q-6B. Do you or do you not use any of the following for obtaining news and information? (TV) (percentage who play a sport, by TV use and gender)
Regarding attitudes toward AOGs, Afghans who use television and community shuras for information are signi"cantly less likely to report sympathy for AOGs. By contrast, those who report use of radio, mobile phones, and the mosque as primary sources for news and information are more likely to report sympathy for AOGs.16 !is pattern may be partially explained by other variables, such as region and access to regular electricity. For example, northern regions tend to have more electri"cation (and thus better access to TV) and also tend to be less sympathetic to AOGs. However, the pattern holds even after controlling for region and other demographic factors. Television broadcasts often display the aftermath of AOGs attacks, generating public awareness of ongoing violence.
69
86
30
14
0%10%20%30%40%50%60%70%80%90%
100%
MALE FEMALE
USE TV FOR NEWS DO NOT USE TV FOR NEWS
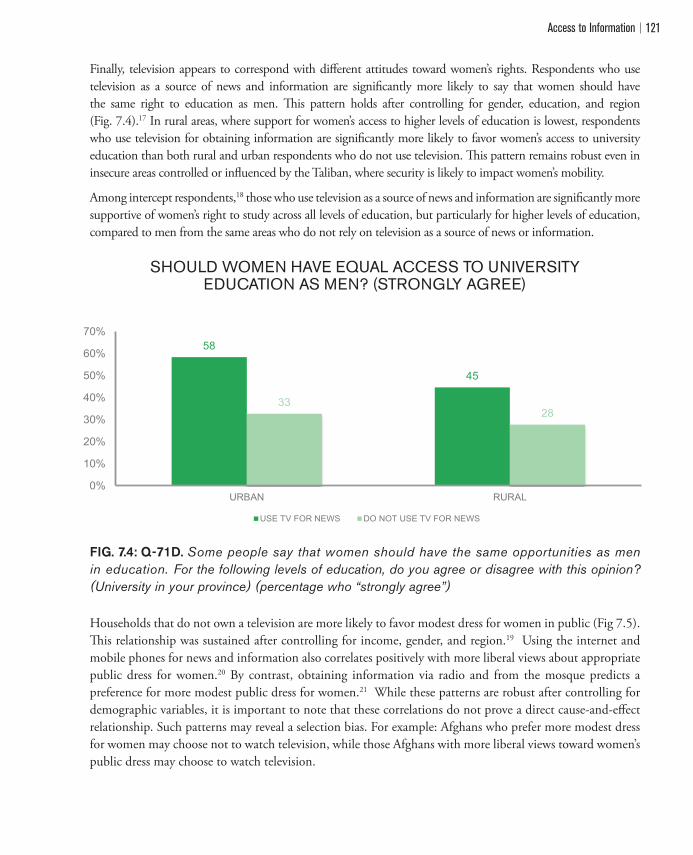
Access to Information 121
Finally, television appears to correspond with di#erent attitudes toward women’s rights. Respondents who use television as a source of news and information are signi"cantly more likely to say that women should have the same right to education as men. !is pattern holds after controlling for gender, education, and region (Fig. 7.4).17 In rural areas, where support for women’s access to higher levels of education is lowest, respondents who use television for obtaining information are signi"cantly more likely to favor women’s access to university education than both rural and urban respondents who do not use television. !is pattern remains robust even in insecure areas controlled or in%uenced by the Taliban, where security is likely to impact women’s mobility.
Among intercept respondents,18 those who use television as a source of news and information are signi"cantly more supportive of women’s right to study across all levels of education, but particularly for higher levels of education, compared to men from the same areas who do not rely on television as a source of news or information.
SHOULD WOMEN HAVE EQUAL ACCESS TO UNIVERSITY EDUCATION AS MEN? (STRONGLY AGREE)
FIG. 7.4: Q-71D. Some people say that women should have the same opportunities as men in education. For the following levels of education, do you agree or disagree with this opinion? (University in your province) (percentage who “strongly agree”)
Households that do not own a television are more likely to favor modest dress for women in public (Fig 7.5). !is relationship was sustained after controlling for income, gender, and region.19 Using the internet and mobile phones for news and information also correlates positively with more liberal views about appropriate public dress for women.20 By contrast, obtaining information via radio and from the mosque predicts a preference for more modest public dress for women.21 While these patterns are robust after controlling for demographic variables, it is important to note that these correlations do not prove a direct cause-and-e#ect relationship. Such patterns may reveal a selection bias. For example: Afghans who prefer more modest dress for women may choose not to watch television, while those Afghans with more liberal views toward women’s public dress may choose to watch television.
58
45
3328
0%
10%
20%
30%
40%
50%
60%
70%
URBAN RURAL
USE TV FOR NEWS DO NOT USE TV FOR NEWS
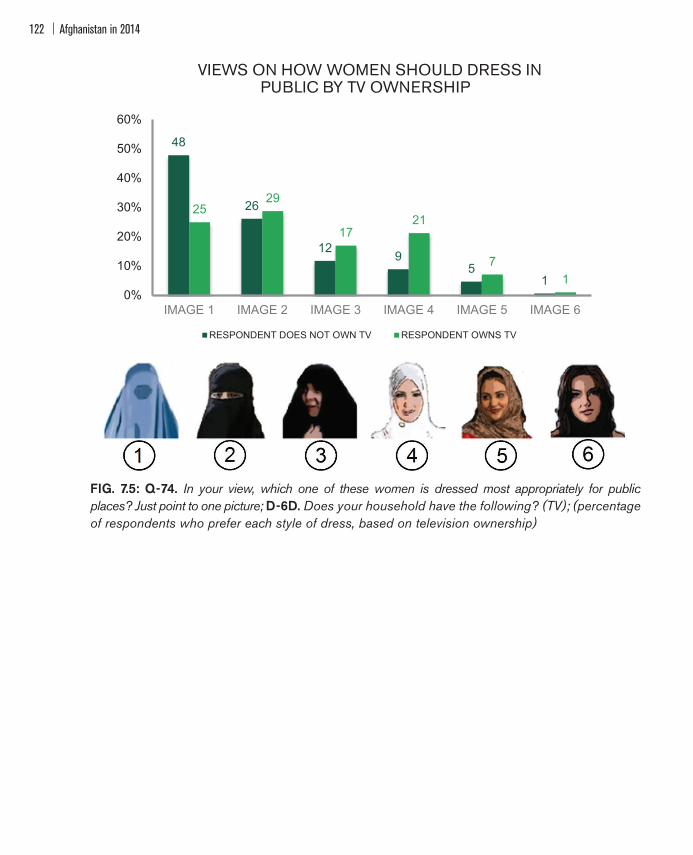
Afghanistan in 2014122
48
26
129
51
2529
1721
71
0%
10%
20%
30%
40%
50%
60%
IMAGE 1 IMAGE 2 IMAGE 3 IMAGE 4 IMAGE 5 IMAGE 6
RESPONDENT DOES NOT OWN TV RESPONDENT OWNS TV
VIEWS ON HOW WOMEN SHOULD DRESS IN PUBLIC BY TV OWNERSHIP
FIG. 7.5: Q-74. In your view, which one of these women is dressed most appropriately for public places? Just point to one picture; D-6D. Does your household have the following? (TV); (percentage of respondents who prefer each style of dress, based on television ownership)
�
Access to Information 123
Endnotes1 Ministry of Communication and Information Technology. Statistics. Accessed September 8, 2014. http://mcit.gov.af/en. 2 Ministry of Communication and Information Technology. Internet Price of 1MB/Month (US Dollars). Accessed September 8,
2014. http://mcit.gov.af/Content/images/Eng-%20Internet%20Prices_png.png. 3 BBC. Afghanistan Pro"le. March 21, 2014. http://www.bbc.com/news/world-south-asia-12013942.4 !e Constitution of Afghanistan. Article 50. Accessed September 16, 2014. http://moj.gov.af/en/page/1684.5 Freedom House. “Afghanistan.” Accessed September 25, 2014. http://www.freedomhouse.org/report/freedom-press/2013/
afghanistan#.VCPf4yuSyyd.6 Hamed, Samay. “Afghanistan: New media restrictions according to Sharia law.” Freemuse. Accessed September 27, 2014. http://
freemuse.org/archives/1193.7 Stancati, Margherita and Ehsanullah Amiri. “Violent Censorship on Rise in Afghanistan.” !e Wall Street Journal. September 17,
2013. http://online.wsj.com/news/articles/SB10001424127887324139404579012783313887184.8 Ghanizada. “Afghan parliament approves Access to Information Law.” Khaama Press. June 30, 2014. 9 Use of "xed line phones is no longer asked on the survey questionnaire due to negligible "gures (1.3% of respondents in 2013).10 Ministry of Communication and Information Technology. Internet Users. Accessed September 8, 2014. http://mcit.gov.af/Content/images/Eng%20-%20Internet%20Users.png. 11 For more discussion of the impact of television and mass media on public opinion, see agenda-setting theory, cultivation theory, and framing theory. Resources include: McCombs, Maxwell E., and Donald L. Shaw, “!e agenda-setting function of mass
media.” Public Opinion Quarterly 36, no. 2 (1972): 176-187; Gerbner, George, and Larry Gross. “Living with television: !e violence pro"le.” Journal of Communication 26, no. 2 (1976): 172-194; and Go#man, Erving, Frame analysis: An essay on the Organization of experience, Harvard University Press, 1974.
12 Okorie, Nelson. “Mass Media Strategies for Creating Awareness of Breast Cancer.” Public Knowledge Journal. Volume 3, Issue 1 (2013).
13 Johnston, Wendy M., and Graham CL Davey. “!e psychological impact of negative TV news bulletins: !e catastrophizing of personal worries.” British Journal of Psychology 88, no. 1 (1997): 85-91.
14 Probit regression was used to regress whether respondent has voted in the "rst round of presidential election this year (q45) on sources of obtaining information: radio (q6a), TV (q6b) and community shuras (q6f ); controlling for urban/rural (m6b), gender (d1), age (d2), natural logarithm of income, education (d7), perception about country’s direction (q1), fear for personal safety (q20), whether respondent or a family member have su#ered from a crime in the past year (q21), con"dence in ANA scale (Į= 0.8118), con"dence in ANP scale (Į= 0.8163), whether Afghan National Security Forces require foreign support scale (Į=0.8203), perception of corruption being a problem scale (Į= 0.7683), fear of participating in di#erent activities scale (Į=0.7317), perception about MPs’ scale (Į=8163), con"dence in formal and informal authorities scale (Į=0.8459), and support for women’s rights scale (Į=0.8760). A 95% con"dence level was imposed for all coe$cients. !e full model explained 12.89% of the variance in whether a respondent voted in the "rst round of presidential election or not (R2=.1289, LR Chi2(19)=1079.56, P < .0001).
15 r= -0.06, p< 0.0001.16 Using OLS regression, sympathy for armed opposition groups (q57) was regressed on sources of obtaining information (q6a-f )
controlling for fear for personal safety (q20) and demographic measures, including gender (d1), age (d2), and education (d7). T he model was weighted by urban/rural and excluding intercepts interviews. A 95% con"dence level was imposed for all coef f icients. The full model explained 6.97% of the variance in the sympathy for armed opposition groups (R2=.0697, F(10,8331)=62.42, p<.0001).
17 Using multiple OLS regressions, support for women’s right to Islamic madrasa education (q71a), primary education (q71b), high school (q71c), university in home province (q71d), education in another province (q71e), and studying abroad on scholarship (q71f ) were regressed on TV as the source of obtaining information (q6b), controlling for gender (d1) and education (d7). !e full models were weighted by urban/rural and excluding intercept interviews. A 95% con"dence level was imposed for all the coe$cients. !e "rst model explained 2.15% changes in support for women’s right to Islamic madrasa education (R2=.0215, F(3,8645)=63.44, p<.0001). !e second model explained 1.54% of variance in women’s right to primary education (R2=.0154, F(3,8628)=44.94, p<.0001). !e third model explained 7.02% variance in women’s right to high school education (R2=.0702, F(3,8607)=216.50, p<.0001). !e fourth model explained 10.01% changes in women’s right to university education in the home province (R2=.1001, F(3,8614)=319.38, p<.0001). !e "fth model explained 5.64% changes in the support for women’s right to education in another province (R2=.0564, F(3,8602)=171.54, p<.0001). !e sixth model could explain 6.03% variance in the support for women’s right to education in another country on scholarship (R2=.0603, F(3,8560)=183.22, p<.0001).
18 “Intercept interviews” represent men who were interviewed while traveling to or from inaccessible and insecure areas, using a non-random convenience sampling technique. !ese men are treated as separate from the main sample.
Afghanistan in 2014124
19 Views toward women’s public dress (q74) was regressed on region (m4), gender (d1), income (a composite of d14a and d14b), and ownership of a television (a transformation of d6d into a binary variable). In a simple regression using only ownership of a television, owning a TV explained 5.7% of the variance in views on women’s public dress, signi"cantly more than any other variable. In the full model, owning a TV predicts a half-level increase in the scale of women’s public dress (1-6), compared to those without a TV (beta=.56, t=22.39, p<.0001). !e full model explained 6.9% of the variance in attitudes toward women’s dress (R2=.069, F(4,9016)=168.15, p<.0001).
20 Correlation between obtaining information via internet (q6d) and view on women’s dress in public (r=0.0709, p<0.0001) and between obtaining information via mobile (q6c) phone and women’s dress in public (r=0.0438, p<0.0001).
21 Correlation between obtaining information via radio (q6a) and view on women’s dress in public (r=0.1669, p<0.0001) and between obtaining information via mosque, (q6e) phone, and women’s dress in public (r=0.0864, p<0.0001).
Women in Society 125
8 WOMEN IN SOCIETYAccording to this year’s survey, the biggest problems facing women are a lack of education/literacy, lack of job opportunities, domestic violence, and forced marriage/dowry payments. Longitudinal trends suggest an increasing concern about domestic violence and job opportunities, and a declining concern about women’s freedom to leave the home. More detail is provided in the National Mood chapter.
Women in Afghanistan have achieved progress since 2001, when the Bonn Agreement established the Ministry of Women’s A#airs, and women’s rights, access to justice, education, and political processes became formal goals of the Afghan government. Major international donor commitments were made at the 2002 Tokyo and 2010 London Donor Conferences with these goals in mind. Uncertainties remain, however, because while Afghan women have made signi"cant gains since the fall of the Taliban, these gains are not embraced equally by all groups in Afghan society.
Recent goals and reforms related to women’s rights and opportunities are not new to Afghanistan. Women were "rst eligible to vote in 1919, and this was formalized as a right in the Afghanistan Constitution of 1964. !e 2004 Afghanistan Constitution reintroduced women’s right to vote after it was abolished by the Taliban regime.1 In 2008, the Afghanistan Education Law again guaranteed women equal access to public education after it was banned by the Taliban for girls over age eight. !e Elimination of Violence Against Women (EVAW) law, enacted by presidential decree in 2009, criminalized the o#ense of rape, although in the 1976 Penal Code violations of chastity through violence, threat, or deceit is an o#ense. !e EVAW law also criminalized underage and forced marriage, although under the Civil Code, underage marriages are illegal. Shari’ah law already states that women cannot be married without their consent. !e EVAW law further de"nes, for the "rst time in a stand-alone law, 20 additional o#enses of violence against women, and places penalties on acts such as the practice of baad, the traditional practice of giving away a daughter to another party as penalty or payment for some o#ense or to resolve a dispute.
!ere is also evidence of gains in women’s participation in several sectors, including education and employment. By 2012, an estimated 2.7 million Afghan girls were enrolled in schools, compared to 5,000 in 2001. Afghanistan’s "rst female governor was appointed in 2005 and its "rst female mayor in 2008, both in the Central/Hazarajat region. Estimates for women’s employment in the judiciary range from 9-10%.2 In May 2014, a caucus of 22 members of parliament called on the next president to allocate one seat for a woman on the Supreme Judicial Council, which is currently comprised of all men.3
However, challenges remain. Many fear that possible negotiations with the Taliban will reopen debates about women’s rights that could lead to reversal of the gains that have been made. !e rati"cation of the EVAW law is currently stalled in committees in the Lower House. !e customs of bride prices and honor killings continue to be practiced in many regions; legal rights to divorce, selection of a marriage partner, and control of one’s own income are often unenforced.4

Afghanistan in 2014126
In politics, an early draft of the 2013 Electoral Law proposed the elimination of the quota for women in provincial and district councils. While members within the Lower House attempted to lobby against the change, the law ultimately passed, reducing the quota for women from 25% to 20% of total seats. Several high-pro"le women have been kidnapped or assassinated over the past year, including a parliamentarian in Ghazni province and the highest-ranking female police o$cer in Helmand province.
!e survey’s longitudinal data re%ects these complexities. Support for the idea that men should decide how women should vote has decreased in recent years. Over time, fewer Afghans say that the biggest problem facing women is that they are not able to leave their homes, and that women are under the control of men. At the same time, as reported in the National Mood chapter, the perception of domestic violence as a major problem facing women is rising, women report overall lower levels of educational attainment, and there is uneven support for women’s access to education at various levels and employment in di#erent sectors.
!is chapter reviews changes in perceptions on a variety of issues, from access to justice, employment, and education. !is year, new questions were introduced on social attitudes toward women’s dress, on the practice of baad and baddal (the exchange of daughters between families in marriage), and on women’s inheritance.
8.1 Rights and Justice
Key QuestionsQ-68. In your area is there an organization, institution, or authority where women can go
to have their problem(s) resolved?
Q-69. What organization, institution or authority is that?
Q-58C. If your household were to have family problems, from whom would you ask for help to resolve it?
Q-59. In the past two years have you had a dispute or a formal case that you couldn’t settle with the other party and had to go to the Department of Huquq (Ministry of Justice) or village/neighborhood-based shura/jirga to resolve it, or not?
Q-60. What kind of a case or dispute was it? (Single Response. If more than one case or dispute, ask for the most recent one).
Q-65. And now let’s turn to village/neighborhood-based jirgas/shuras. Tell me do you strongly agree, somewhat agree, somewhat disagree, or stronglydisagree with the following statements (There should be local women’s jirgas and shuras).
Q-64E. Tell me, do you strongly agree, somewhat agree, somewhat disagree, or strongly disagree with the following statement: state courts treat men and women equally.
Women in Society 127
Access to justice is a key component of women’s empowerment in Afghan society. !e survey asked respondents whether they are aware of a place where women can go to obtain resolution for their problems. Only 19.2% of all Afghans say they are aware of such an organization, institution, or authority. When asked to name the organization or authority, 44.4% cite the Directorate of Women’s A#airs, 13.7% cite the Human Rights Council, and 12.3% cite the District Governor’s O$ce. Rural respondents are much more likely to cite the District O$ce than urban respondents, since District Governor’s O$ces are primarily active in rural areas.
!is year, as noted in Chapter 5 (Governance), 19.1% of Afghans say that they had a dispute or case within the past two years that they could not resolve internally and had to go to a Huquq department or to a local shura/jirga for resolution. Huquqs are part of the formal justice system, while shuras and jirgas are part of the informal justice system. !e Huquq department is responsible for civil cases, such as disputes over divorce or land rights (the term Huquq means “rights” in Dari). Shuras, on the other hand, are consultative councils or assemblies of tribal elders gather to discuss and make collective decisions aboutsocial issues, such as the location of a well or a schoolhouse, while jirgas are dispute resolution mechanisms where village elders hear individual disputes or con%icts between families, or within families, related to speci"c cases.
!is "gure is comparable to the 2013 "nding (18.9%), but in 2013 there was a gender gap: women (16.4%) were signi"cantly less likely than men (20.7%) to take a dispute to one of these bodies.5 In 2014, there is no such gap; women are no more or less likely than men to take their cases to Huquqs or local shuras/jirgas.6 Among Afghans who say they "led disputes in 2014, land disputes are the most common type among both men and women (42.3% for each, respectively). However, women (29.4%) were more likely than men (19.2%) to say they "led a case about a family problem or divorce, while men (26.3%) were more likely than women (19.9%) to say they "led a case about a commercial or other property dispute.
When asked whom they would turn to for help to resolve a family problem, 29.5% of Afghan women say they would seek help from family and friends, followed by elders of the local jirga (15.0%) and the local malik/khan (a village head or local tribal leader) (10.9%). Rural women are signi"cantly more likely to consult local elders (15.1%) compared to urban women (10.1%), and are twice as likely to consult the malik/khan than urban women (12.3% vs. 6.3%). Urban women, on the other hand, are signi"cantly more likely to say they seek help from friends and family (46.21%) compared to rural women (25.8%), and twice as likely to say the Human Rights Council (11.1%) compared to rural women (5.4%).
When asked whether or not they agree with the statement that state courts treat men and women equally, 52.5% of Afghans agree, 42.3% disagree, and 5.2% say they don’t know. However, opinions at the regional level have changed over time. Comparing the past two years (2013-2014) with the previous two years (2011-2012), Afghans in the South West region are currently more likely to agree that state courts treat men and women equally, while in most other regions, the level of agreement has decreased (Fig 8.1).

Afghanistan in 2014128
COURTS TREAT MEN AND WOMEN EQUALLY: AGREE
45
67
53 56 53
7075
67
49 49 46
64
54
63 6557
0%
10%
20%
30%
40%
50%
60%
70%
80%
CENTRAL / KABUL
EAST SOUTH EAST
SOUTH WEST
WEST NORTH EAST
CENTRAL / HAZARAJAT
NORTH WEST
2011-2012 2013-2014
FIG. 8.1: Q-64E. (Ask if 2 “state courts” in Q-62) Tell me, do you strongly agree, somewhat agree, somewhat disagree, or strongly disagree with the following statement: State courts treat men and women equally. (percentage of respondents who somewhat or strongly agree, among respondents who took a dispute case to a Huquq and/or state court)
Afghans who say they took their dispute for resolution by a jirga or shura were asked if there should be local women’s shuras and jirgas, and 64.5% say they agree somewhat or strongly. !ose with no education or schooling agree with lower frequency (59.8%) than those with at least some schooling (73.4%), and women (67.7%) are signi"cantly more likely to agree than men (60.8%).7 Between 2013 and 2014, a small increase in the number of women who disagree attracts attention but appears statistically insigni"cant. !ere is no di#erence in agreement between urban (64.2%) and rural (64.6%) respondents, but regionally, 88.3% of Afghans in the Central/Hazarajat region agree somewhat or strongly, compared to a low of 49.9% of Afghans in the South East region. Consistent with last year’s "ndings, in 2014 more women (67.7%) compared to men (60.6%) support the idea of having local shuras and jirgas (Fig 8.2).
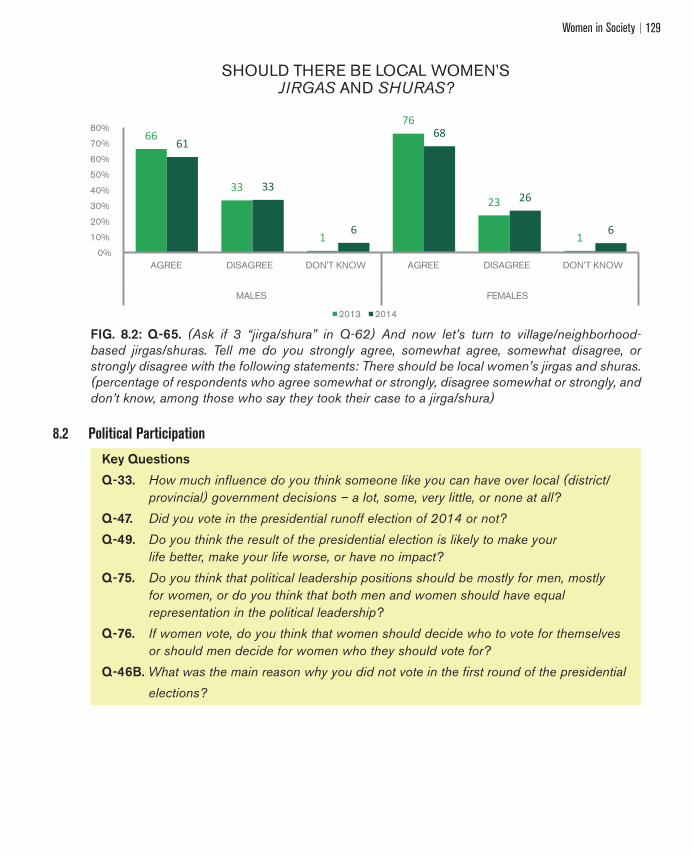
Women in Society 129
SHOULD THERE BE LOCAL WOMEN’S JIRGAS AND SHURAS?
66
33
1
76
23
1
61
33
6
68
26
6
0%
10%
20%
30%
40%
50%
60%
70%
80%
AGREE DISAGREE DON'T KNOW AGREE DISAGREE DON'T KNOW
MALES FEMALES
2013 2014
FIG. 8.2: Q-65. (Ask if 3 “jirga/shura” in Q-62) And now let’s turn to village/neighborhood-based jirgas/shuras. Tell me do you strongly agree, somewhat agree, somewhat disagree, or strongly disagree with the following statements: There should be local women’s jirgas and shuras. (percentage of respondents who agree somewhat or strongly, disagree somewhat or strongly, and don’t know, among those who say they took their case to a jirga/shura)
8.2 Political Participation
Key QuestionsQ-33. How much influence do you think someone like you can have over local (district/
provincial) government decisions – a lot, some, very little, or none at all?
Q-47. Did you vote in the presidential runoff election of 2014 or not?
Q-49. Do you think the result of the presidential election is likely to make your life better, make your life worse, or have no impact?
Q-75. Do you think that political leadership positions should be mostly for men, mostly for women, or do you think that both men and women should have equal representation in the political leadership?
Q-76. If women vote, do you think that women should decide who to vote for themselves or should men decide for women who they should vote for?
Q-46B. What was the main reason why you did not vote in the first round of the presidential
elections?
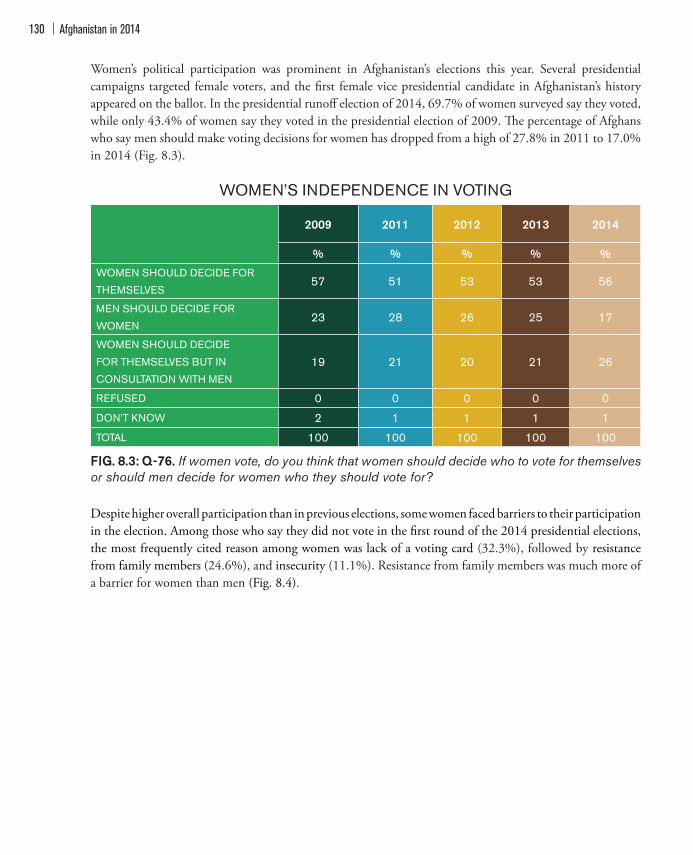
Afghanistan in 2014130
Women’s political participation was prominent in Afghanistan’s elections this year. Several presidential campaigns targeted female voters, and the "rst female vice presidential candidate in Afghanistan’s history appeared on the ballot. In the presidential runo# election of 2014, 69.7% of women surveyed say they voted, while only 43.4% of women say they voted in the presidential election of 2009. !e percentage of Afghans who say men should make voting decisions for women has dropped from a high of 27.8% in 2011 to 17.0% in 2014 (Fig. 8.3).
WOMEN’S INDEPENDENCE IN VOTING
2009 2011 2012 2013 2014
% % % % %WOMEN SHOULD DECIDE FOR
THEMSELVES57 51 53 53 56
MEN SHOULD DECIDE FOR
WOMEN23 28 26 25 17
WOMEN SHOULD DECIDE
FOR THEMSELVES BUT IN
CONSULTATION WITH MEN
19 21 20 21 26
REFUSED 0 0 0 0 0
DON’T KNOW 2 1 1 1 1
TOTAL 100 100 100 100 100
FIG. 8.3: Q-76. If women vote, do you think that women should decide who to vote for themselves or should men decide for women who they should vote for?
Despite higher overall participation than in previous elections, some women faced barriers to their participation in the election. Among those who say they did not vote in the "rst round of the 2014 presidential elections, the most frequently cited reason among women was lack of a voting card (32.3%), followed by resistance from family members (24.6%), and insecurity (11.1%). Resistance from family members was much more of a barrier for women than men (Fig. 8.4).
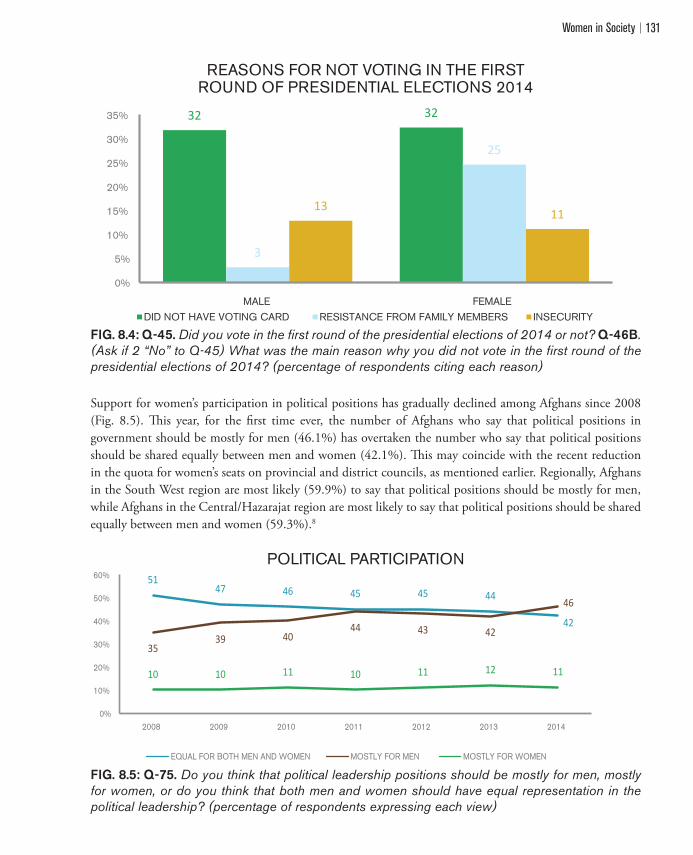
Women in Society 131
REASONS FOR NOT VOTING IN THE FIRST ROUND OF PRESIDENTIAL ELECTIONS 2014
32 32
3
25
13 11
0%
5%
10%
15%
20%
25%
30%
35%
MALE FEMALEDID NOT HAVE VOTING CARD RESISTANCE FROM FAMILY MEMBERS INSECURITY
FIG. 8.4: Q-45. Did you vote in the first round of the presidential elections of 2014 or not? Q-46B. (Ask if 2 “No” to Q-45) What was the main reason why you did not vote in the first round of the presidential elections of 2014? (percentage of respondents citing each reason)
Support for women’s participation in political positions has gradually declined among Afghans since 2008 (Fig. 8.5). !is year, for the "rst time ever, the number of Afghans who say that political positions in government should be mostly for men (46.1%) has overtaken the number who say that political positions should be shared equally between men and women (42.1%). !is may coincide with the recent reduction in the quota for women’s seats on provincial and district councils, as mentioned earlier. Regionally, Afghans in the South West region are most likely (59.9%) to say that political positions should be mostly for men, while Afghans in the Central/Hazarajat region are most likely to say that political positions should be shared equally between men and women (59.3%).8
POLITICAL PARTICIPATION
5147 46 45 45 44
42
3539 40
44 43 42
46
10 10 11 10 11 12 11
0%
10%
20%
30%
40%
50%
60%
2008 2009 2010 2011 2012 2013 2014
EQUAL FOR BOTH MEN AND WOMEN MOSTLY FOR MEN MOSTLY FOR WOMEN
FIG. 8.5: Q-75. Do you think that political leadership positions should be mostly for men, mostly for women, or do you think that both men and women should have equal representation in the political leadership? (percentage of respondents expressing each view)

Afghanistan in 2014132
Despite these barriers to women’s political participation, the percentage of women who say they feel able to in%uence local government decisions has increased from 41.2% in 2013 to 52.2% in 2014 (Fig. 8.6). !e same pattern appears for the presidential elections, where 60.1% of women say it will make their lives better, signi"cantly more than women surveyed in 2013 (54.0%) (Fig. 8.7).
INFLUENCE OVER LOCAL (DISTRICT/PROVINCIAL) GOVERNMENT DECISIONS
53
41
6052
47
57
3946
0%
10%
20%
30%
40%
50%
60%
70%
MALE FEMALE MALE FEMALE
2013 2014
A LOT AND SOME VERY LITTLE AND NONE AT ALL
FIG. 8.6: Q-33. How much influence do you think someone like you can have over local (district/provincial) government decisions – a lot, some, very little, or none at all?
WILL THE 2014 PRESIDENTIAL ELECTIONS MAKE LIFE BETTER?
58
16
68
12
54
14
60
12
0%
10%
20%
30%
40%
50%
60%
70%
80%
BETTER WORSE BETTER WORSE
2013 2014
MALE FEMALE
FIG. 8.7: Q-49. Do you think the result of the presidential election in 2014 is likely to make your life better, make your life worse, or have no impact on your life?
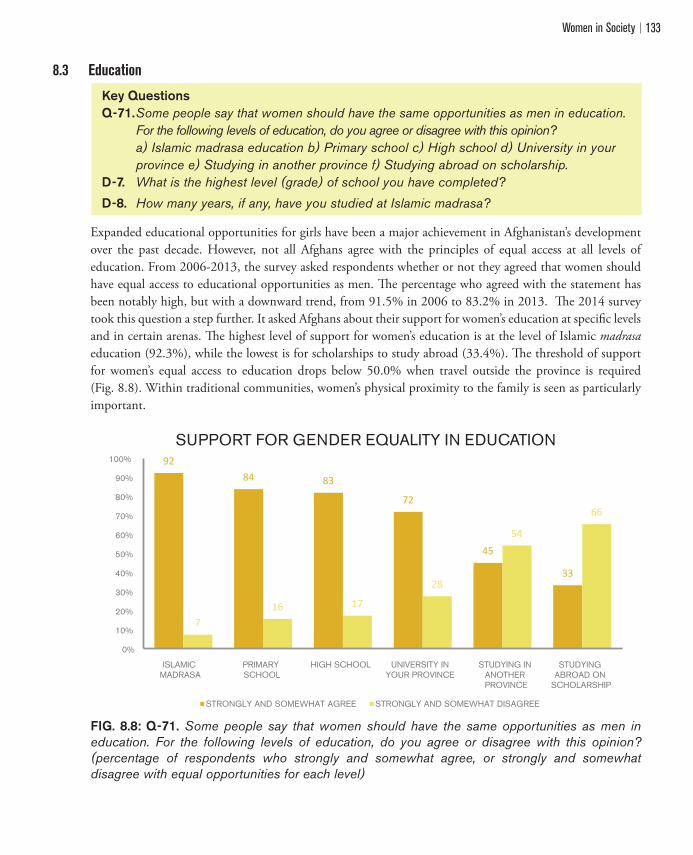
Women in Society 133
8.3 Education
Key QuestionsQ-71. Some people say that women should have the same opportunities as men in education. For the following levels of education, do you agree or disagree with this opinion?
a) Islamic madrasa education b) Primary school c) High school d) University in your province e) Studying in another province f) Studying abroad on scholarship. D-7. What is the highest level (grade) of school you have completed?
D-8. How many years, if any, have you studied at Islamic madrasa?
Expanded educational opportunities for girls have been a major achievement in Afghanistan’s development over the past decade. However, not all Afghans agree with the principles of equal access at all levels of education. From 2006-2013, the survey asked respondents whether or not they agreed that women should have equal access to educational opportunities as men. !e percentage who agreed with the statement has been notably high, but with a downward trend, from 91.5% in 2006 to 83.2% in 2013. !e 2014 survey took this question a step further. It asked Afghans about their support for women’s education at speci"c levels and in certain arenas. !e highest level of support for women’s education is at the level of Islamic madrasa education (92.3%), while the lowest is for scholarships to study abroad (33.4%). !e threshold of support for women’s equal access to education drops below 50.0% when travel outside the province is required (Fig. 8.8). Within traditional communities, women’s physical proximity to the family is seen as particularly important.
SUPPORT FOR GENDER EQUALITY IN EDUCATION
9284 83
72
45
33
716 17
28
54
66
0%
10%
20%
30%
40%
50%
60%
70%
80%
90%
100%
ISLAMIC MADRASA
PRIMARY SCHOOL
HIGH SCHOOL UNIVERSITY IN YOUR PROVINCE
STUDYING IN ANOTHER PROVINCE
STUDYING ABROAD ON
SCHOLARSHIP
STRONGLY AND SOMEWHAT AGREE STRONGLY AND SOMEWHAT DISAGREE
FIG. 8.8: Q-71. Some people say that women should have the same opportunities as men in education. For the following levels of education, do you agree or disagree with this opinion? (percentage of respondents who strongly and somewhat agree, or strongly and somewhat disagree with equal opportunities for each level)

Afghanistan in 2014134
Ethnicity explains some but not all di#erences in whether Afghans support women’s equal access to education (Fig. 8.9). For example, compared to all ethnic groups, Hazaras (85.1%) are most likely to agree that women should have the same opportunities as men to attend university in their home province,9 and Pashtuns (61.1%) are least likely.10 !e survey cannot conclude that ethnicity causes these intergroup di#erences. Rather, regional traditions and cultural values, such as attitudes toward women and security, attitudes toward education, and other perceptions not measured in the survey may explain such patterns.
SUPPORT FOR WOMEN’S ACCESS TO UNIVERSITY EDUCATION IN HOME PROVINCE
61
79 7985
73
39
21 2115
27
0%
10%
20%
30%
40%
50%
60%
70%
80%
90%
PASHTUN TAJIK UZBEK HAZARA OTHER
STRONGLY AND SOMEWHAT AGREE STRONGLY AND SOMEWHAT DISAGREE
FIG. 8.9: Q-71. Some people say that women should have the same opportunities as men in education. For the following levels of education, do you agree or disagree with this opinion d) University in your province (percentage of respondents who strongly and somewhat agree, and who strongly and somewhat disagree)
Looking at the issue of educational attainment, similar to previous survey years, the majority of Afghans report having had no formal schooling (59.1%). !ere is, however, a signi"cant gender gap: 74.2% of Afghan women report having no formal education, compared to 42.1% of men (Fig 8.10). !ese "gures exclude 3.2% of women and 2.2% of men who say they received informal schooling at home. Not surprisingly, women in urban areas report higher levels of educational attainment than women in rural areas. Among urban women, 28.2% say they have at least a seventh grade education (i.e., some secondary education in the Afghan system), compared to only 11.9% of women living in rural areas.
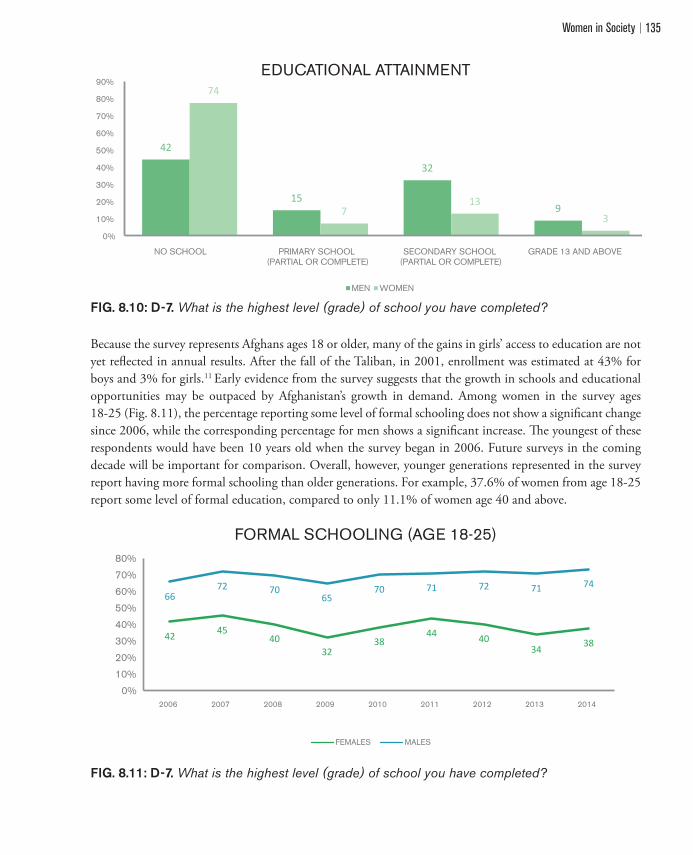
Women in Society 135
EDUCATIONAL ATTAINMENT
42
15
32
9
74
713
30%
10%
20%
30%
40%
50%
60%
70%
80%
90%
NO SCHOOL PRIMARY SCHOOL (PARTIAL OR COMPLETE)
SECONDARY SCHOOL (PARTIAL OR COMPLETE)
GRADE 13 AND ABOVE
MEN WOMEN
FIG. 8.10: D-7. What is the highest level (grade) of school you have completed?
Because the survey represents Afghans ages 18 or older, many of the gains in girls’ access to education are not yet re%ected in annual results. After the fall of the Taliban, in 2001, enrollment was estimated at 43% for boys and 3% for girls.11 Early evidence from the survey suggests that the growth in schools and educational opportunities may be outpaced by Afghanistan’s growth in demand. Among women in the survey ages 18-25 (Fig. 8.11), the percentage reporting some level of formal schooling does not show a signi"cant change since 2006, while the corresponding percentage for men shows a signi"cant increase. !e youngest of these respondents would have been 10 years old when the survey began in 2006. Future surveys in the coming decade will be important for comparison. Overall, however, younger generations represented in the survey report having more formal schooling than older generations. For example, 37.6% of women from age 18-25 report some level of formal education, compared to only 11.1% of women age 40 and above.
FORMAL SCHOOLING (AGE 18-25)
42 4540
3238
44 4034 38
6672 70
6570 71 72 71 74
0%
10%
20%
30%
40%
50%
60%
70%
80%
2006 2007 2008 2009 2010 2011 2012 2013 2014
FEMALES MALES
FIG. 8.11: D-7. What is the highest level (grade) of school you have completed?
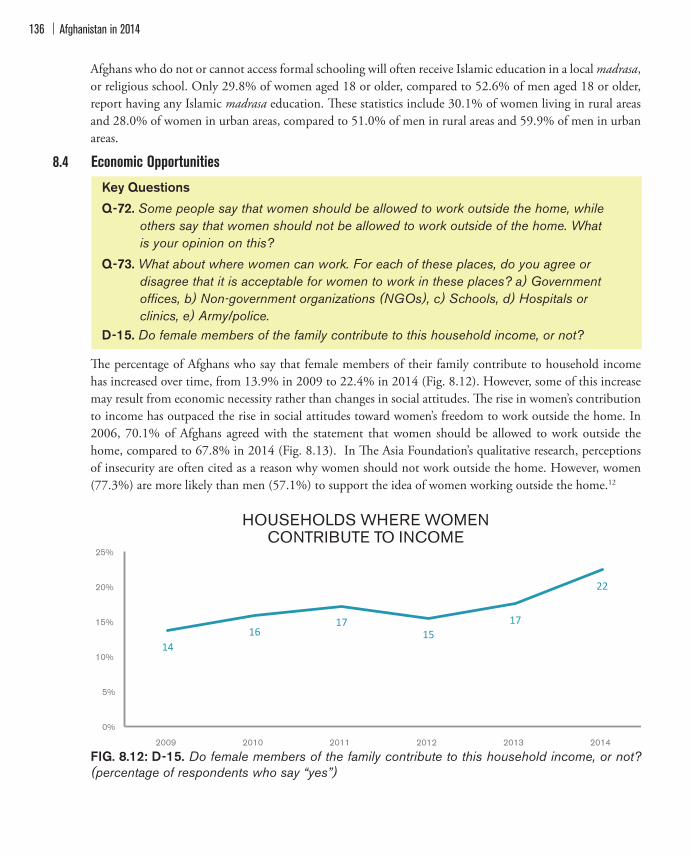
Afghanistan in 2014136
Afghans who do not or cannot access formal schooling will often receive Islamic education in a local madrasa, or religious school. Only 29.8% of women aged 18 or older, compared to 52.6% of men aged 18 or older, report having any Islamic madrasa education. !ese statistics include 30.1% of women living in rural areas and 28.0% of women in urban areas, compared to 51.0% of men in rural areas and 59.9% of men in urban areas.
8.4 Economic Opportunities
Key QuestionsQ-72. Some people say that women should be allowed to work outside the home, while
others say that women should not be allowed to work outside of the home. What is your opinion on this?
Q-73. What about where women can work. For each of these places, do you agree or disagree that it is acceptable for women to work in these places? a) Government offices, b) Non-government organizations (NGOs), c) Schools, d) Hospitals or clinics, e) Army/police.
D-15. Do female members of the family contribute to this household income, or not?
!e percentage of Afghans who say that female members of their family contribute to household income has increased over time, from 13.9% in 2009 to 22.4% in 2014 (Fig. 8.12). However, some of this increase may result from economic necessity rather than changes in social attitudes. !e rise in women’s contribution to income has outpaced the rise in social attitudes toward women’s freedom to work outside the home. In 2006, 70.1% of Afghans agreed with the statement that women should be allowed to work outside the home, compared to 67.8% in 2014 (Fig. 8.13). In !e Asia Foundation’s qualitative research, perceptions of insecurity are often cited as a reason why women should not work outside the home. However, women (77.3%) are more likely than men (57.1%) to support the idea of women working outside the home.12
HOUSEHOLDS WHERE WOMEN CONTRIBUTE TO INCOME
1416
1715
17
22
0%
5%
10%
15%
20%
25%
2009 2010 2011 2012 2013 2014
FIG. 8.12: D-15. Do female members of the family contribute to this household income, or not? (percentage of respondents who say “yes”)

Women in Society 137
VIEWS ON WOMEN WORKING OUTSIDE THE HOME
2006 2007 2008 2009 2010 2011 2012 2013 2014
% % % % % % % % %
WOMEN SHOULD BE
ALLOWED TO WORK
OUTSIDE THE HOME
70 70 69 67 64 62 66 63 68
WOMEN SHOULD NOT
BE ALLOWED TO WORK
OUTSIDE THE HOME
27 28 27 29 33 35 33 36 30
REFUSED 1 1 0 1 0 0 0 0 0
DON’T KNOW 2 2 4 3 3 2 2 1 2
TOTAL 100 100 100 100 100 100 100 100 100
FIG. 8.13: Q-72. Some people say that women should be allowed to work outside the home, while others say that women should not be allowed to work outside of the home. What is your opinion on this?
While some Afghans say that women should be allowed to work outside the home, not all employment opportunities are seen as equally acceptable. !is year, respondents were asked to evaluate the acceptability of di#erent types of employment venues for women. Of these, schools are seen as most acceptable, with 83.6% in agreement (Fig. 8.14). Among Afghans who said that women should not be allowed to work outside the home, 64.7% nonetheless still agreed that schools are acceptable. !is may be because in the case of community-based schools, schools are usually located inside the home. A close second are hospitals or clinics, with 80.8% of Afghans in agreement that these are acceptable places for women to work, followed by government o$ces (70.0%). For employment in the police or the army, 41.9% agree that women’s participation is acceptable. Among those who agree that women should be allowed to work outside the home, 48.7% disagree (somewhat or strongly) with women’s employment in the police or army. Even less acceptable, according to Afghans surveyed, is for women to work for a non-governmental organizations (NGO). A total of 40.9% of Afghans agree that working for an NGO is acceptable, while 58.1% disagree.
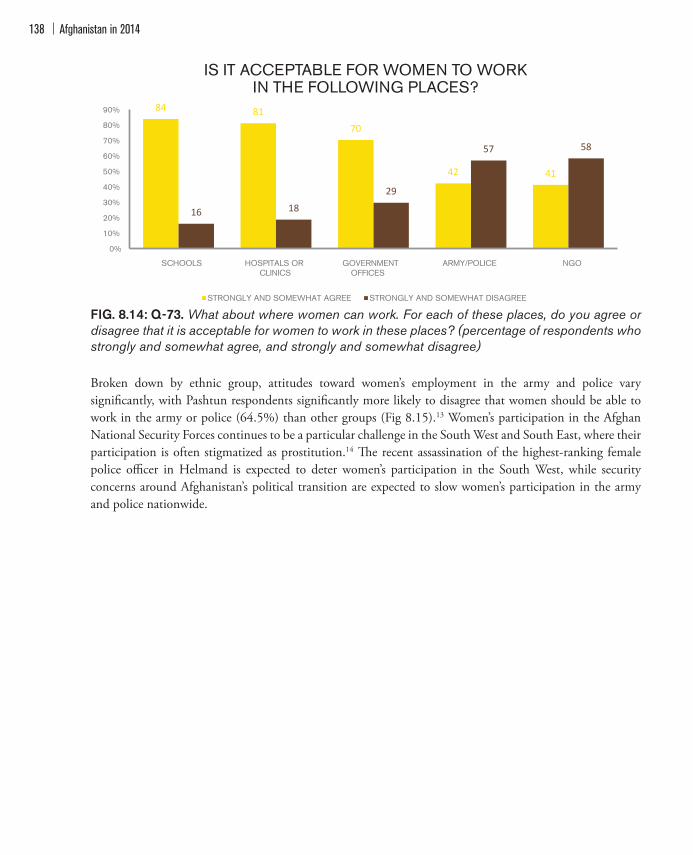
Afghanistan in 2014138
IS IT ACCEPTABLE FOR WOMEN TO WORK IN THE FOLLOWING PLACES?
84 8170
42 41
16 18
29
57 58
0%
10%
20%
30%
40%
50%
60%
70%
80%
90%
SCHOOLS HOSPITALS OR CLINICS
GOVERNMENT OFFICES
ARMY/POLICE NGO
STRONGLY AND SOMEWHAT AGREE STRONGLY AND SOMEWHAT DISAGREE
FIG. 8.14: Q-73. What about where women can work. For each of these places, do you agree or disagree that it is acceptable for women to work in these places? (percentage of respondents who strongly and somewhat agree, and strongly and somewhat disagree)
Broken down by ethnic group, attitudes toward women’s employment in the army and police vary signi"cantly, with Pashtun respondents signi"cantly more likely to disagree that women should be able to work in the army or police (64.5%) than other groups (Fig 8.15).13 Women’s participation in the Afghan National Security Forces continues to be a particular challenge in the South West and South East, where their participation is often stigmatized as prostitution.14 !e recent assassination of the highest-ranking female police o$cer in Helmand is expected to deter women’s participation in the South West, while security concerns around Afghanistan’s political transition are expected to slow women’s participation in the army and police nationwide.
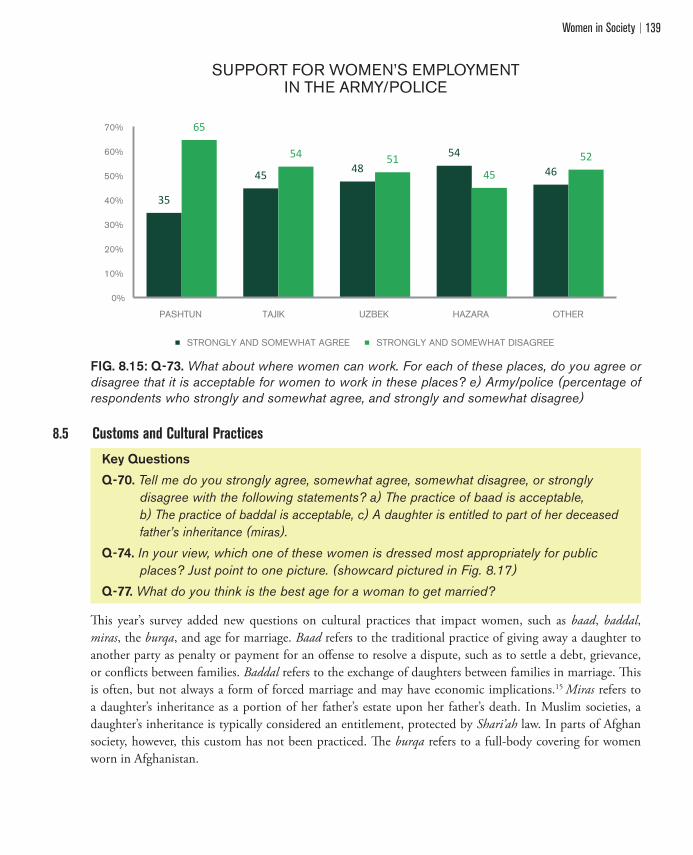
Women in Society 139
SUPPORT FOR WOMEN’S EMPLOYMENT IN THE ARMY/POLICE
35
45 4854
46
65
54 5145
52
0%
10%
20%
30%
40%
50%
60%
70%
PASHTUN TAJIK UZBEK HAZARA OTHER
STRONGLY AND SOMEWHAT AGREE STRONGLY AND SOMEWHAT DISAGREE
FIG. 8.15: Q-73. What about where women can work. For each of these places, do you agree or disagree that it is acceptable for women to work in these places? e) Army/police (percentage of respondents who strongly and somewhat agree, and strongly and somewhat disagree)
8.5 Customs and Cultural Practices
Key QuestionsQ-70. Tell me do you strongly agree, somewhat agree, somewhat disagree, or strongly
disagree with the following statements? a) The practice of baad is acceptable, b) The practice of baddal is acceptable, c) A daughter is entitled to part of her deceased father’s inheritance (miras).
Q-74. In your view, which one of these women is dressed most appropriately for public places? Just point to one picture. (showcard pictured in Fig. 8.17)
Q-77. What do you think is the best age for a woman to get married?
!is year’s survey added new questions on cultural practices that impact women, such as baad, baddal, miras, the burqa, and age for marriage. Baad refers to the traditional practice of giving away a daughter to another party as penalty or payment for an o#ense to resolve a dispute, such as to settle a debt, grievance, or con%icts between families. Baddal refers to the exchange of daughters between families in marriage. !is is often, but not always a form of forced marriage and may have economic implications.15 Miras refers to a daughter’s inheritance as a portion of her father’s estate upon her father’s death. In Muslim societies, a daughter’s inheritance is typically considered an entitlement, protected by Shari’ah law. In parts of Afghan society, however, this custom has not been practiced. !e burqa refers to a full-body covering for women worn in Afghanistan.
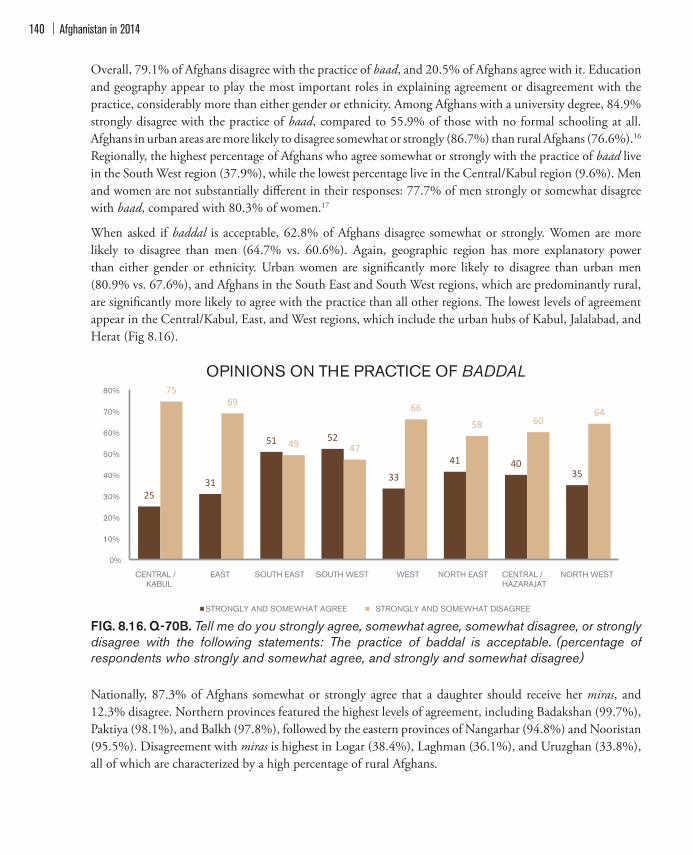
Afghanistan in 2014140
Overall, 79.1% of Afghans disagree with the practice of baad, and 20.5% of Afghans agree with it. Education and geography appear to play the most important roles in explaining agreement or disagreement with the practice, considerably more than either gender or ethnicity. Among Afghans with a university degree, 84.9% strongly disagree with the practice of baad, compared to 55.9% of those with no formal schooling at all. Afghans in urban areas are more likely to disagree somewhat or strongly (86.7%) than rural Afghans (76.6%).16
Regionally, the highest percentage of Afghans who agree somewhat or strongly with the practice of baad live in the South West region (37.9%), while the lowest percentage live in the Central/Kabul region (9.6%). Men and women are not substantially di#erent in their responses: 77.7% of men strongly or somewhat disagree with baad, compared with 80.3% of women.17
When asked if baddal is acceptable, 62.8% of Afghans disagree somewhat or strongly. Women are more likely to disagree than men (64.7% vs. 60.6%). Again, geographic region has more explanatory power than either gender or ethnicity. Urban women are signi"cantly more likely to disagree than urban men (80.9% vs. 67.6%), and Afghans in the South East and South West regions, which are predominantly rural, are signi"cantly more likely to agree with the practice than all other regions. !e lowest levels of agreement appear in the Central/Kabul, East, and West regions, which include the urban hubs of Kabul, Jalalabad, and Herat (Fig 8.16).
OPINIONS ON THE PRACTICE OF BADDAL
2531
51 52
33
41 4035
7569
49 47
66
58 6064
0%
10%
20%
30%
40%
50%
60%
70%
80%
CENTRAL / KABUL
EAST SOUTH EAST SOUTH WEST WEST NORTH EAST CENTRAL / HAZARAJAT
NORTH WEST
STRONGLY AND SOMEWHAT AGREE STRONGLY AND SOMEWHAT DISAGREE
FIG. 8.16. Q-70B. Tell me do you strongly agree, somewhat agree, somewhat disagree, or strongly disagree with the following statements: The practice of baddal is acceptable. (percentage of respondents who strongly and somewhat agree, and strongly and somewhat disagree)
Nationally, 87.3% of Afghans somewhat or strongly agree that a daughter should receive her miras, and 12.3% disagree. Northern provinces featured the highest levels of agreement, including Badakshan (99.7%), Paktiya (98.1%), and Balkh (97.8%), followed by the eastern provinces of Nangarhar (94.8%) and Nooristan (95.5%). Disagreement with miras is highest in Logar (38.4%), Laghman (36.1%), and Uruzghan (33.8%), all of which are characterized by a high percentage of rural Afghans.

Women in Society 141
Having received education in an Islamic madrasa signi"cantly increases the likelihood that Afghans agree with the miras entitlement for daughters. Miras is required by Shari’ah law in all schools of Islamic jurisprudence. Other factors that increase agreement include living in an urban area, being a woman, and having more formal education. One surprising "nding is the strength of the relationship between disagreement with miras and sympathy with Armed Opposition Groups (AOGs). Compared with Afghans with no sympathy for AOGs, Afghans who express a little or a lot of sympathy with AOGs are on average 48.8% more likely to disagree with a daughter’s entitlement to miras, after controlling for province, years of Islamic education, formal education, ethnicity, and other factors.18 !e reason for this is unclear, but it appears consistent with other attitudinal measures toward women and women’s rights among Afghans who report sympathy for AOGs. One of the de"ning characteristics of the Taliban regime between 1996-2001 were severe limitations on women’s rights, including access to education and political participation.
!is year, Afghans were also asked to say which type of dress they think is most appropriate for women in public places. During the Taliban era, the burqa, a full-body covering (Fig. 8.17, image 1), was mandated for all adult women. Afghans are most likely to favor the burqa (34.5%) than the niqab (a veil that covers the full face, with the exception of the eyes, see image 2) (27.6%). A negligible number of Afghans are in favor of woman appearing in public with no head covering at all (image 6) (0.8%).
VIEWS OF APPROPRIATE DRESS FOR WOMEN IN PUBLIC
41
27
13 13
5 1
28 28
17 19
7
1 0%
5%
10%
15%
20%
25%
30%
35%
40%
45%
IMAGE 1 IMAGE 2 IMAGE 3 IMAGE 4 IMAGE 5 IMAGE 6
MALE FEMALE
FIG. 8.17: Q-74. In your view, which one of these women is dressed most appropriately for public places? Just point to one picture (showcard presented) (percentage of respondents who selected each image)
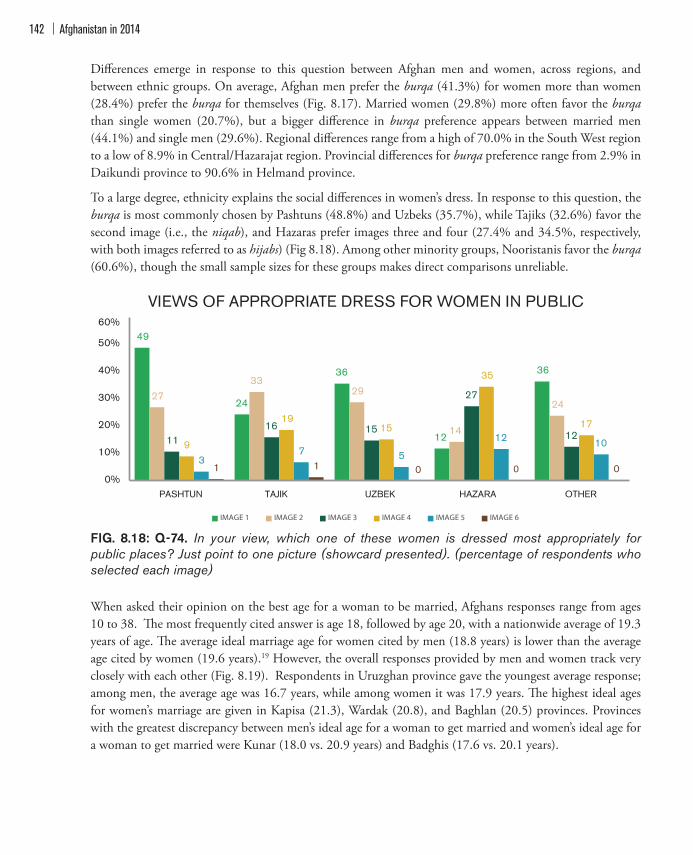
Afghanistan in 2014142
Di#erences emerge in response to this question between Afghan men and women, across regions, and between ethnic groups. On average, Afghan men prefer the burqa (41.3%) for women more than women (28.4%) prefer the burqa for themselves (Fig. 8.17). Married women (29.8%) more often favor the burqa than single women (20.7%), but a bigger di#erence in burqa preference appears between married men (44.1%) and single men (29.6%). Regional di#erences range from a high of 70.0% in the South West region to a low of 8.9% in Central/Hazarajat region. Provincial di#erences for burqa preference range from 2.9% in Daikundi province to 90.6% in Helmand province.
To a large degree, ethnicity explains the social di#erences in women’s dress. In response to this question, the burqa is most commonly chosen by Pashtuns (48.8%) and Uzbeks (35.7%), while Tajiks (32.6%) favor the second image (i.e., the niqab), and Hazaras prefer images three and four (27.4% and 34.5%, respectively, with both images referred to as hijabs) (Fig 8.18). Among other minority groups, Nooristanis favor the burqa (60.6%), though the small sample sizes for these groups makes direct comparisons unreliable.
VIEWS OF APPROPRIATE DRESS FOR WOMEN IN PUBLIC
49
24
36
12
36
27 33
29
14
24
11 16 15
27
12 9
19 15
35
17
3 7 5
12 10
1 1 0 0 0 0%
10%
20%
30%
40%
50%
60%
PASHTUN TAJIK UZBEK HAZARA OTHER
IMAGE 1 IMAGE 2 IMAGE 3 IMAGE 4 IMAGE 5 IMAGE 6
FIG. 8.18: Q-74. In your view, which one of these women is dressed most appropriately for public places? Just point to one picture (showcard presented). (percentage of respondents who selected each image)
When asked their opinion on the best age for a woman to be married, Afghans responses range from ages 10 to 38. !e most frequently cited answer is age 18, followed by age 20, with a nationwide average of 19.3 years of age. !e average ideal marriage age for women cited by men (18.8 years) is lower than the average age cited by women (19.6 years).19 However, the overall responses provided by men and women track very closely with each other (Fig. 8.19). Respondents in Uruzghan province gave the youngest average response; among men, the average age was 16.7 years, while among women it was 17.9 years. !e highest ideal ages for women’s marriage are given in Kapisa (21.3), Wardak (20.8), and Baghlan (20.5) provinces. Provinces with the greatest discrepancy between men’s ideal age for a woman to get married and women’s ideal age for a woman to get married were Kunar (18.0 vs. 20.9 years) and Badghis (17.6 vs. 20.1 years).

Women in Society 143
BEST AGE FOR A WOMAN TO GET MARRIED
2 3
8 5
35
6
25
36
2 2 31 2 5 2
27
8
32
47
2 25
1
0%
5%
10%
15%
20%
25%
30%
35%
40%
10 11 12 13 14 15 16 17 18 19 20 21 22 23 24 25 26 27 28 29 30 31 33 35 37 38
MALE OPINION FEMALE OPINION
FIG. 8.19: Q-77. What do you think is the best age for a woman to get married? (percent of respondents citing each ideal age)
Afghanistan in 2014144
Endnotes
1 See Article 33: “!e citizens of Afghanistan shall have the right to elect and be elected.”2 See Women’s professional participation in Afghanistan’s justice sector: challenges and opportunities, Rome, Italy: International
Development Law Organization (IDLO), 2014.3 Mohseni, Geeti. “Female MPs Want Equal Political Power.” Tolo News. May 25, 2014. Accessed October 6, 2014. http://www.
tolonews.com/en/afghanistan/14994-female-mps-want-equal-political-power.4 Ibid, p. 8.5 Pearson chi2(1) = 17.50 p<.001.6 Pearson chi2(1) = 0.57 p = 0.45.7 Pairwise correlation r = 0.10, p<.004.8 Pairwise correlation, r = 0.09 p<001, Central/Hazarajat.9 Pairwise correlation, r = 0.13, p<001 (Hazara).10 Pairwise correlation, r = -0.24, p<001 (Pashtun).11 World Bank. “Afghanistan Report.” Updated April 8, 2014. Accessed October 16, 2014: http://www.worldbank.org/en/country/
afghanistan/overview. 12 Pairwise correlation r = 0.22, p<.0001. 13 Pairwise correlation r = -0.15, p<.0001 (Pashtuns).14 !is perception is also a#ected by women’s absence from the home during late night hours, a requirement for some police rank
and "le and correctional o$cers.15 In the practice of baddal, there is generally no bride price involved.16 Pairwise correlation, r = 0.12, p<.0001.17 Pearson’s chi2(1) = 5.67, p=.02.18 Agreement with miras (q70c) was regressed onto variables for age, gender, formal education, Islamic education, urban/rural,
province, ethnicity, and sympathy for Armed Opposition Groups (AOGs) using probit likelihood analysis. A one-level increase in sympathy for AOGs (1 = no sympathy, 2 = some sympathy, 3 = a lot of sympathy) predicts a 33.3% decrease in the probability that a respondent agrees with the statement that a daughter is entitled to her miras, ceterus paribus (z = -13.28, p<.0001), with a 95% con"dence interval of -.38 to -.28. While this variable was extremely signi"cant relative to others, the overall model explains a modest 5.2% of the variance in agreement with miras (R2 = .052, chi(2)9, p<.0001, using a sample of 8,835 observations). Further analysis is recommended for interested researchers.
19 A t-test shows a signi"cant di#erence between the ages estimated by men (M = 18.81, SD = 2.47) and by women (M = 19.60, SD = 2.62), t(9233) = 14.72, p<.0001.

Women in Society 145

Afghanistan in 2014146

Appendix 1: Methodology 147
APPENDIX 1: METHODOLOGY
1 Summary
!e Asia Foundation’s annual Survey of the Afghan People is Afghanistan’s longest-running and broadest nationwide survey of adult Afghan attitudes and opinions. Since 2004 we have conducted 65,558 interviews nationwide, consisting of both male and female respondents age 18 or older. !is year’s survey reached 9,271 Afghan citizens, including 50.1% male and 49.9% female respondents from all 34 provinces in the country (Fig. 1). In-person surveys were conducted between June 22 and July 8, 2014. Survey results are weighted to be nationally representative using the 2013-2014 Afghan Central Statistics O$ce’s (CSO) population estimates for provincial, as well as urban and rural, population distributions. !is year, using a design e#ect of 2.17,1 the margin of error at the 95% con"dence interval with a p=.05 is +/-1.5% for the probability sample.2
Quality control processes for the 2014 survey have been guided by principles of validity, reliability, timeliness, and integrity. !is year, these principles have been made operational through 24 steps in the survey process designed to ensure data quality and transparency (Fig. 2). Some of these steps are new, while others have been used since 2006. !e survey methodology was designed using international best practices and customized for Afghanistan’s unique challenges. As in previous years, survey "eldwork was conducted by ACSOR-Surveys for !e Asia Foundation in Afghanistan, while third-party monitoring was conducted by Sayara Research. Question validity and qualitative research was provided by Eureka Research, using 125 in-depth interviews in "ve provinces representing four regions. Qualitative research results are available online at http://asiafoundation.org/ag2014poll.
Afghan respondents were surveyed by 909 enumerators (474 men and 435 women). All respondents were interviewed by a member of their own sex (i.e., all women were interviewed by a female enumerator). !ese enumerators represent 11 ethnic groups, out of a total 13 ethnic groups represented among respondents this year. In addition to random household selection for the main survey sample, the Kish grid technique was used for random selection of respondents within each household. Enumerators collected GPS coordinates for 1,376 sampling points in all 34 provinces in order to verify that "eldwork had been conducted at the correct locations speci"ed in the sampling plan. !e cooperation rate (number of questions answered) was 94.9% while the response rate, an overall measure used to estimate success in obtaining a response, was 83.1% (see Fig. 7). !e average interview length was 41 minutes, with a range of 20-70 minutes, and the questionnaire included 98 substantive questions.
Since 2006, 32.1% of all individual surveys with respondents have been monitored, including through direct supervision during the interview by the provincial supervisor (5.5%), back-checks by the provincial supervisor (20.9%), back-checks by the ACSOR-Surveys Kabul o$ce (2.8%), and third-party monitoring (3.0%). !is year, 38.8% of surveys were subject to some form of quality control, including 14.9% by a third-party monitor.

Afghanistan in 2014148
!e survey has always included Afghans from insecure areas, where only male enumerators from those areas can safely travel. However, for a signi"cant number of sampling points, access is prohibitive. For these, sampling points are replaced using a randomly generated list of alternative assignments, referred to as “replacements.” !is represents an increase over previous years due to election-related violence in summer 2014 and an overall increase in armed combat between Armed Opposition Groups (AOGs) and the Afghan National Security Forces (ANSF) (see Chapter 2, Security). !e overall percentage of sampling points that have had to be replaced annually dropped from 25.9% in 2010 to 17.0% in 2013, and increased to 28.3% this year. Fieldwork started on June 22, one week after the June 14 presidential runo# election, and was completed on July 8.
To estimate the e#ect of these replacements, 565 survey interviews (6.1% of the 9,271 interviews total) were conducted with Afghans living in highly insecure areas using “intercept interviews,” a technique that was introduced in the 2013 survey. !ese are interviews with Afghan men from highly insecure, inaccessible areas who are “intercepted” by enumerators while traveling in a secure area, such as a bazaar or provincial center. Because it is culturally inappropriate for strangers to approach women in public areas, these interviews are limited to male respondents. Responses from these interviewees are used to determine the direction of e#ect that replacements have on the main survey sample due to insecurity and remoteness. In 2013, intercept interviews (n=840) were included as part of the main sample (n=8,420). However, to approximate a 50:50 gender proportionality, and to segregate convenience sampling techniques from random sampling techniques in the 2014 sample, intercept interviews (n=565) are treated as separate from the main sample (n=8,706).
Importantly, whether the respondent is male or female tends to explain more variance in public opinions more than sampling point accessibility. Controlling for gender and province, opinions between intercept interviews and main sample interviews on most measures, ranging from sympathy with Armed Opposition Groups to attitudes toward the Afghan government, are statistically insigni"cant. Without controlling for gender, however, these di#erences appear signi"cant. !e main sample includes women’s voices, while intercept interviews do not. Men tend to have more uniform opinions, whether or not they live in secure, semi-secure, or insecure areas, whereas women’s opinions tend to di#er from men’s regardless of where the men live. Where the intercept interviewees’ responses are signi"cantly di#erent from those of respondents from semi-secure areas, we have noted intercept interview responses separately in each chapter.
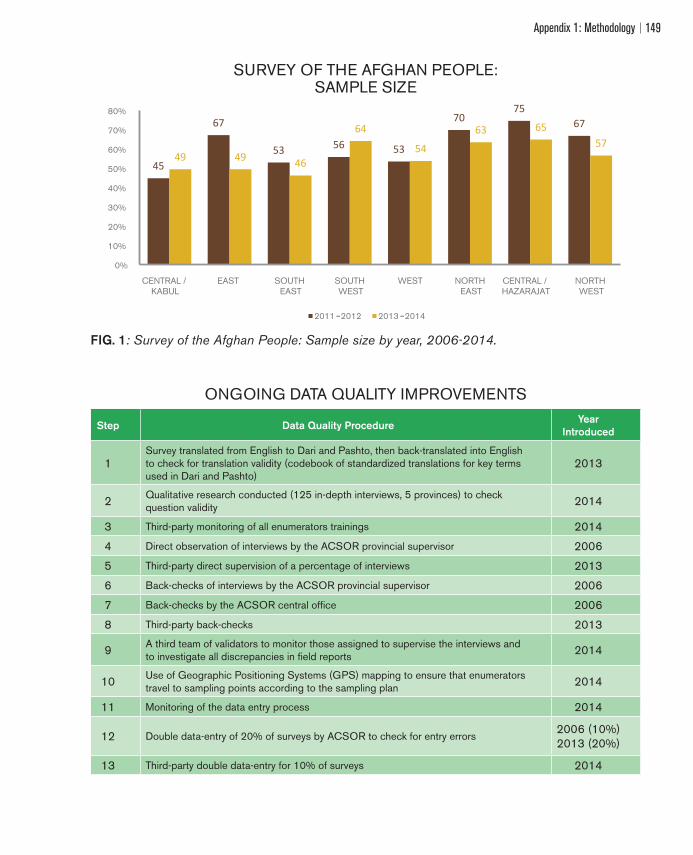
Appendix 1: Methodology 149
SURVEY OF THE AFGHAN PEOPLE: SAMPLE SIZE
45
67
53 56 53
7075
67
49 49 46
64
54
63 6557
0%
10%
20%
30%
40%
50%
60%
70%
80%
CENTRAL / KABUL
EAST SOUTH EAST
SOUTH WEST
WEST NORTH EAST
CENTRAL / HAZARAJAT
NORTH WEST
2011-2012 2013-2014
FIG. 1: Survey of the Afghan People: Sample size by year, 2006-2014.
ONGOING DATA QUALITY IMPROVEMENTS
Step Data Quality Procedure Year Introduced
1Survey translated from English to Dari and Pashto, then back-translated into English to check for translation validity (codebook of standardized translations for key terms used in Dari and Pashto)
2013
2 Qualitative research conducted (125 in-depth interviews, 5 provinces) to check question validity 2014
3 Third-party monitoring of all enumerators trainings 2014
4 Direct observation of interviews by the ACSOR provincial supervisor 2006
5 Third-party direct supervision of a percentage of interviews 2013
6 Back-checks of interviews by the ACSOR provincial supervisor 2006
7 Back-checks by the ACSOR central office 2006
8 Third-party back-checks 2013
9 A third team of validators to monitor those assigned to supervise the interviews and to investigate all discrepancies in field reports 2014
10 Use of Geographic Positioning Systems (GPS) mapping to ensure that enumerators travel to sampling points according to the sampling plan 2014
11 Monitoring of the data entry process 2014
12 Double data-entry of 20% of surveys by ACSOR to check for entry errors 2006 (10%) 2013 (20%)
13 Third-party double data-entry for 10% of surveys 2014

Afghanistan in 2014150
14 Hard copy survey checks 2006
15 Monitoring of coding for open-ended question responses 2014
16 Inter-rater reliability check for coding consistency from Dari and Pashto to English 2014
17 Logic tests for duplicates and straights by ACSOR (141 surveys flagged and removed in 2014)
2006
18 Asia Foundation logic tests (41 in 2014, resulting in 161 surveys flagged and removed) 2014
19 Problem sampling points and problem enumerators and back-checking staff are flagged and investigated (220 surveys removed in 2014)
2014
20 Data analyzed for social desirability bias 2013
21 Nonresponse analysis 2013
22 Third-party analysis of household refusal rates 2014
23 Tabulations released publicly for independent verification 2006
24 Raw data released publicly for independent verification 2013
FIG. 2: Ongoing data quality procedures by year introduced.
2 Survey Timeline
Project Phase Start Date End Date Comments
Questionnaire review and
translation
May 5, 2014 June 9, 2014 Questions shaped in
onsultation with line ministries
Enumerators trainings June 18, 2014 June 19, 2014 Presidential runoff election
June 14
Qualitative research June 20, 2014 July 20, 2014 Uruzgan, Helmand, Ghor,
Wardak, and Kunduz only
Fieldwork (main sample +
intercept interviews)
June 22, 2014 July 08, 2014 Ramadan started June 28
Quality control June 22, 2014 July 08, 2014 See Fig. 2
Data processing July 16, 2014 August 5, 2014 Numbering, coding, and
keypunching
Application of logic tests August 5, 2014 August 18, 2014 Client logic tests and third-
party validation results
FIG. 3: Project phases.
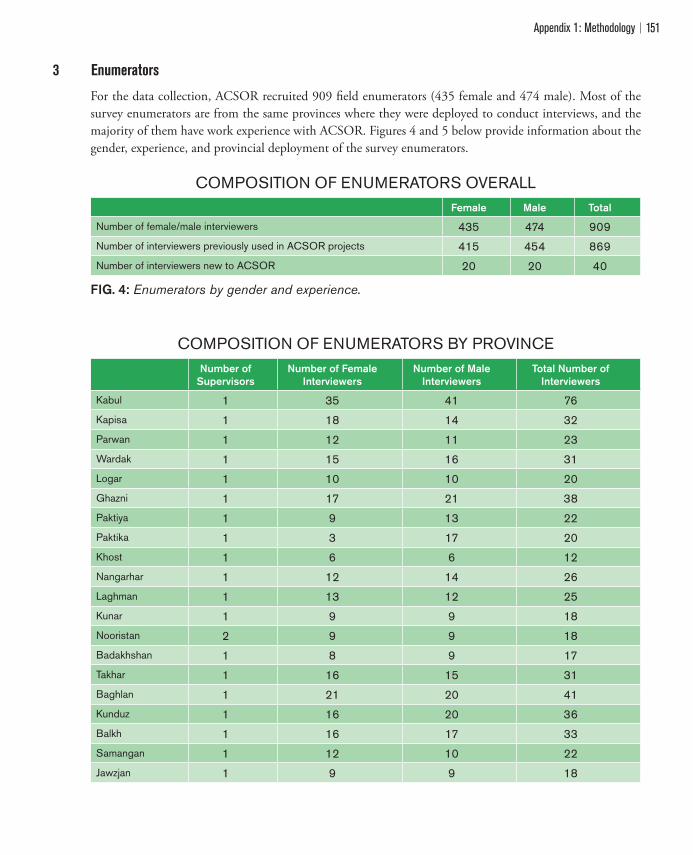
Appendix 1: Methodology 151
3 Enumerators
For the data collection, ACSOR recruited 909 "eld enumerators (435 female and 474 male). Most of the survey enumerators are from the same provinces where they were deployed to conduct interviews, and the majority of them have work experience with ACSOR. Figures 4 and 5 below provide information about the gender, experience, and provincial deployment of the survey enumerators.
COMPOSITION OF ENUMERATORS OVERALLFemale Male Total
Number of female/male interviewers 435 474 909Number of interviewers previously used in ACSOR projects 415 454 869Number of interviewers new to ACSOR 20 20 40
FIG. 4: Enumerators by gender and experience.
COMPOSITION OF ENUMERATORS BY PROVINCE Number of
SupervisorsNumber of Female
InterviewersNumber of Male
InterviewersTotal Number of
Interviewers
Kabul 1 35 41 76Kapisa 1 18 14 32Parwan 1 12 11 23Wardak 1 15 16 31Logar 1 10 10 20Ghazni 1 17 21 38Paktiya 1 9 13 22Paktika 1 3 17 20Khost 1 6 6 12Nangarhar 1 12 14 26Laghman 1 13 12 25Kunar 1 9 9 18Nooristan 2 9 9 18Badakhshan 1 8 9 17Takhar 1 16 15 31Baghlan 1 21 20 41Kunduz 1 16 20 36Balkh 1 16 17 33Samangan 1 12 10 22Jawzjan 1 9 9 18
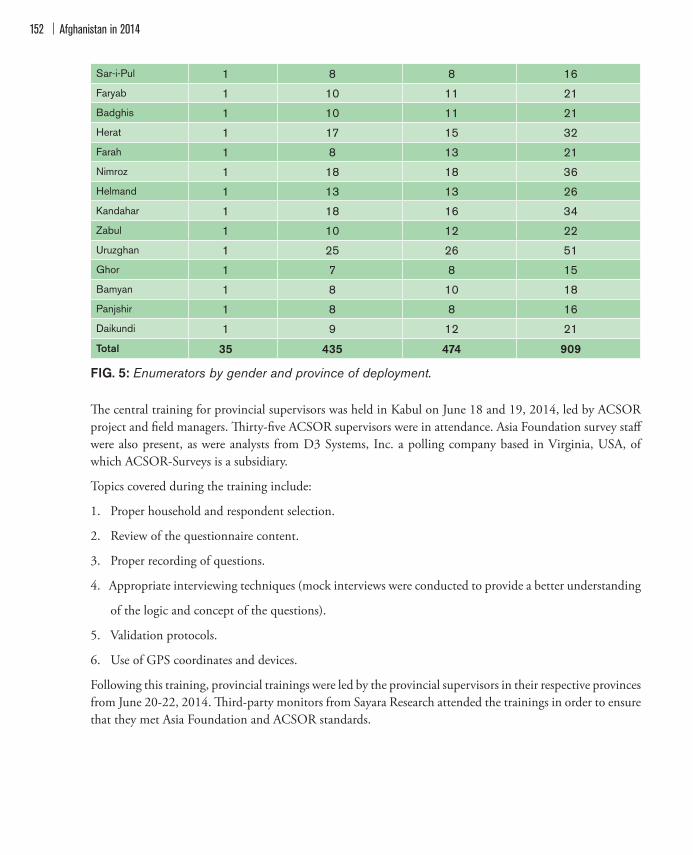
Afghanistan in 2014152
Sar-i-Pul 1 8 8 16Faryab 1 10 11 21Badghis 1 10 11 21Herat 1 17 15 32Farah 1 8 13 21Nimroz 1 18 18 36Helmand 1 13 13 26Kandahar 1 18 16 34Zabul 1 10 12 22Uruzghan 1 25 26 51Ghor 1 7 8 15Bamyan 1 8 10 18Panjshir 1 8 8 16Daikundi 1 9 12 21
Total 35 435 474 909
FIG. 5: Enumerators by gender and province of deployment.
!e central training for provincial supervisors was held in Kabul on June 18 and 19, 2014, led by ACSOR project and "eld managers. !irty-"ve ACSOR supervisors were in attendance. Asia Foundation survey sta# were also present, as were analysts from D3 Systems, Inc. a polling company based in Virginia, USA, of which ACSOR-Surveys is a subsidiary.
Topics covered during the training include:
1. Proper household and respondent selection.
2. Review of the questionnaire content.
3. Proper recording of questions.
4. Appropriate interviewing techniques (mock interviews were conducted to provide a better understanding
of the logic and concept of the questions).
5. Validation protocols.
6. Use of GPS coordinates and devices.
Following this training, provincial trainings were led by the provincial supervisors in their respective provinces from June 20-22, 2014. !ird-party monitors from Sayara Research attended the trainings in order to ensure that they met Asia Foundation and ACSOR standards.

Appendix 1: Methodology 153
4 Survey Preparation
As an opinion trends survey, the Survey of the Afghan People maintains a core set of questions for longitudinal comparison. !ese questions are kept to ensure ongoing reliability of results, and are crosschecked against other questions. Each year, a team of Asia Foundation experts, both Afghan and international, reviews all questions in the previous year’s survey to determine whether the questions were valid, reliable, and useful. !is year, qualitative interviews were conducted with a sample of 125 Afghans (roughly half male, half female) in "ve provinces by Eureka Research to inform questionnaire improvements for future studies. Questions were modi"ed or added in consultation with line ministries, donors, journalists, and other stakeholders.
5 Sample Design
ACSOR used the 2013-2014 updated "gures for provincial population distribution provided by the Central Statistics O$ce (CSO) of the Afghan government. ACSOR chooses to use this data set because (similar to the 2006 update) much of the 2013-2014 update is based on data drawn from the National Reconstruction Vulnerability Assessment (NRVA) by the Ministry of Rehabilitation and Rural Development (MRRD), which provide a detailed cataloging of households and are used by other local and national surveys for comparison.
Target Population: Afghan adults in 34 provinces
Target Sample: 9,500 Afghan adults in 34 provinces
Achieved Sample: 9,271 Afghan adults in 34 provinces
Step 1: A base sample was "rst strati"ed proportional to estimated province population. A minimum of 200 interviews were carried out in each province. Within each province, the sample was then strati"ed by and urban rural population "gures from the 2013-2014 CSO estimates. Each of the 65 strata was allocated at least one primary sampling unit (PSU) to ensure that the entire target population had a probability of selection. After the urban and rural strata of each province receive a cluster, the remainder of the province’s sample was allocated proportionally.
Step 2: Districts were selected via probability proportional to size (PPS) systematic sampling. Districts serve as the primary sampling unit (PSU). Each PSU contained two sampling points, one of male respondents and one of female respondents. !is was done to allow for gender-matched interviewing, which is a cultural requirement of working in Afghanistan. Each PSU was chosen via PPS sampling within its stratum.
In order to obtain some information on the perceptions of Afghans living in highly insecure areas that are not accessible to the enumerators, additional “intercept interviews” were held with people coming out of these highly insecure areas to towns or bazaars in more secure areas. For the 2014 survey, approximately 6.1% of the 9,271 interviews (n=565) were intercept interviews. Intercept interviews were conducted in 57 districts across 23 provinces. !ese intercept interviews are identi"ed by the variables “Method” and “Methods” in the data set.
Step 3: !e settlements within districts were selected by simple random sampling. !ese serve as the secondary sampling unit (SSU). Within urban strata, we used neighborhoods (called nahias) from cities, towns, and metropolitan areas while in rural strata we used villages. Because population data for settlement sizes does
Afghanistan in 2014154
not exist, a simple random selection among all known settlements was used to select locations. In this survey, six interviews were conducted per sampling point.
!e instability and frequent "ghting in some provinces can cause a sampling point to be adjusted or replaced to keep interviewers out of areas with active violence. A complete listing of replaced sampling points can can be found at asiafoundation.org/ag2014poll. A total of three replicate draws were provided to the "eld team prior to the launch of "eldwork. In the case that the replicates were exhausted, settlement/nahia level replacements were done in the "eld by supervisors, and neighboring accessible settlements were chosen as replacements whenever possible.
Some districts with signi"cant insurgent activity or military operations had male-only samples depending on conditions. In the case that a sampling point designated for interviews with Afghan women was only accessible to male enumerators, it was replaced with a sampling point containing women respondents/enumerators from within the same strata (i.e., from the same province with the same urban or rural status). !is di#ers from the replacement protocol followed in the 2013 survey, in which sampling points containing women respondents in districts that were inaccessible for female interviewers were replaced with male sampling points from the same district. As a result, in 2014 the raw number of women respondents from insecure provinces tend to overrepresent provincial and district centers. !e e#ect of this bias has been reduced through urban/rural weighting.
Step 4: Field managers used maps generated from several sources to select starting points within each SSU. In rural areas, we used a system that required interviewers to start in one of "ve randomly selected locations (northern, southern, eastern, or western edges of the rural settlement, or the center). In urban areas, because it is more di$cult to di#erentiate neighborhood borders, a random location (northern, southern, eastern, western, or center) was provided to the interviewer, and they started from an identi"able landmark in the vicinity (e.g., a school or mosque).
Step 5: To bolster the randomization process, each sampling point was randomly assigned a di#erent house for "rst contact: either the "rst, second, or third house the enumerator arrived at following the start of the random walk. After approaching the "rst contacted house, the enumerator followed a set interval to select all other households for inclusion in the sample (for example, selecting every third house on the right in rural areas and every "fth house on the right in urban areas).
Step 6: After selecting a household, enumerators used a Kish grid for randomizing the target respondent within the household. Members of the household were listed with their names and their age in descending order and the enumerator must choose a pre-assigned position within the household (e.g. head of household, son, daughter, and so on) (see Kish, 1965).
Under no circumstances were enumerators allowed to substitute an alternate member of a household for the selected respondent. If the respondent refused to participate or was not available after three call-backs, the interviewer then moved on to the next household according to the random walk. Typically, enumerators were required to make two call-backs before replacing the household. !ese call-backs were made at di#erent times of the same day or on di#erent days of the "eld period, in order to provide a broader schedule in which to engage the respondent. Due to time and security-related concerns, enumerators had di$culty meeting the requirement of two call-backs prior to substitution in many rural areas. However, due to the high rate
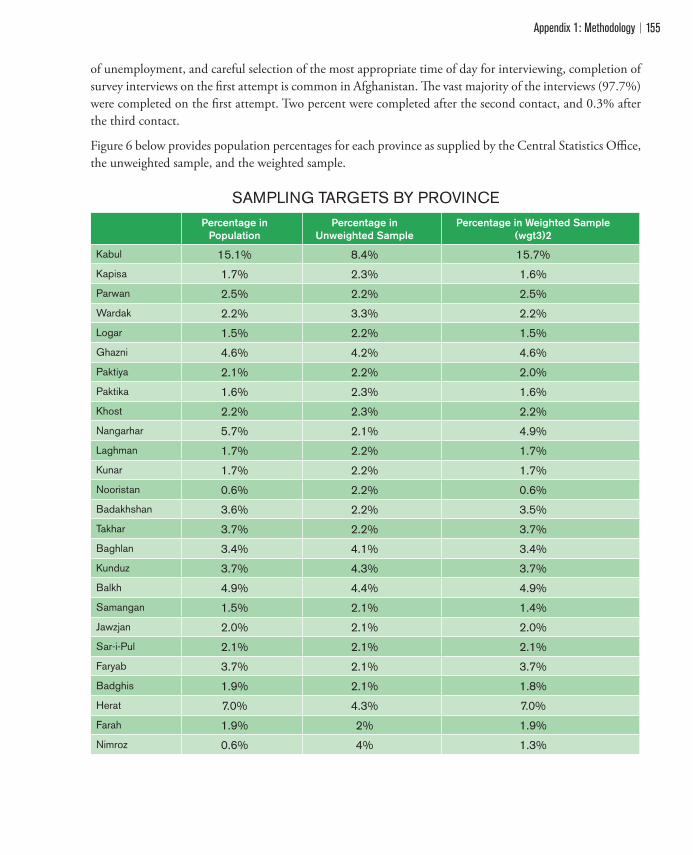
Appendix 1: Methodology 155
of unemployment, and careful selection of the most appropriate time of day for interviewing, completion of survey interviews on the "rst attempt is common in Afghanistan. !e vast majority of the interviews (97.7%) were completed on the "rst attempt. Two percent were completed after the second contact, and 0.3% after the third contact.
Figure 6 below provides population percentages for each province as supplied by the Central Statistics O$ce, the unweighted sample, and the weighted sample.
SAMPLING TARGETS BY PROVINCEPercentage in
PopulationPercentage in
Unweighted SamplePercentage in Weighted Sample
(wgt3)2
Kabul 15.1% 8.4% 15.7%Kapisa 1.7% 2.3% 1.6%Parwan 2.5% 2.2% 2.5%Wardak 2.2% 3.3% 2.2%Logar 1.5% 2.2% 1.5%Ghazni 4.6% 4.2% 4.6%Paktiya 2.1% 2.2% 2.0%Paktika 1.6% 2.3% 1.6%Khost 2.2% 2.3% 2.2%Nangarhar 5.7% 2.1% 4.9%Laghman 1.7% 2.2% 1.7%Kunar 1.7% 2.2% 1.7%Nooristan 0.6% 2.2% 0.6%Badakhshan 3.6% 2.2% 3.5%Takhar 3.7% 2.2% 3.7%Baghlan 3.4% 4.1% 3.4%Kunduz 3.7% 4.3% 3.7%Balkh 4.9% 4.4% 4.9%Samangan 1.5% 2.1% 1.4%Jawzjan 2.0% 2.1% 2.0%Sar-i-Pul 2.1% 2.1% 2.1%Faryab 3.7% 2.1% 3.7%Badghis 1.9% 2.1% 1.8%Herat 7.0% 4.3% 7.0%Farah 1.9% 2% 1.9%Nimroz 0.6% 4% 1.3%

Afghanistan in 2014156
Helmand 3.5% 4.3% 3.4%Kandahar 4.5% 3.7% 4.5%Zabul 1.1% 2% 1.1%Uruzghan 1.3% 5.2% 1.4%Ghor 2.6% 2.3% 2.6%Bamyan 1.7% 2.2% 1.7%Panjshir 0.6% 2.1% 0.6%Daikundi 1.7% 2.3% 1.6%
Total 100% 100% 100%
FIG. 6: Sampling targets by province.
6 Weighting
Four weights were created for the survey: “wgt1,” “wgt2,” “wgt3,” and “wgt4.” Each is weighted by strata.!e “wgt1” variable is a weight by province and urban/rural status to account for the disproportionate strati"cation and quality control by simple inverse cell weighting. It includes intercept interviews. !e “wgt2” variable is a weight by province, urban/rural status, and gender by post strati"cation. It includes intercept interviews. !e “wgt3” variable is a weight by province and urban/rural status to account for the disproportionate strati"cation and quality control by simple inverse cell weighting. It does not include intercept interviews. !e “wgt4” variable is a weight by province, urban/rural status, and gender by post strati"cation. It does not include intercept interviews. All analysis in the 2014 survey report uses “wgt3.” Because intercept interviews rely on convenience sampling rather than random sampling, they are treated separately from the main sample and are not included in summary statistics unless speci"cally stated.
7 Sample Disposition
!e American Association of Public Opinion Researchers (AAPOR) publishes four di#erent types of rate calculations used in AAPOR reporting (response rates, contact rates, cooperation rates, and refusal rates). ACSOR Surveys use AAPOR’s Response Rate 3, Cooperation Rate 3, Refusal Rate 2, and Contact Rate 2 as their standards. !e formulas used for the various rates are provided below.
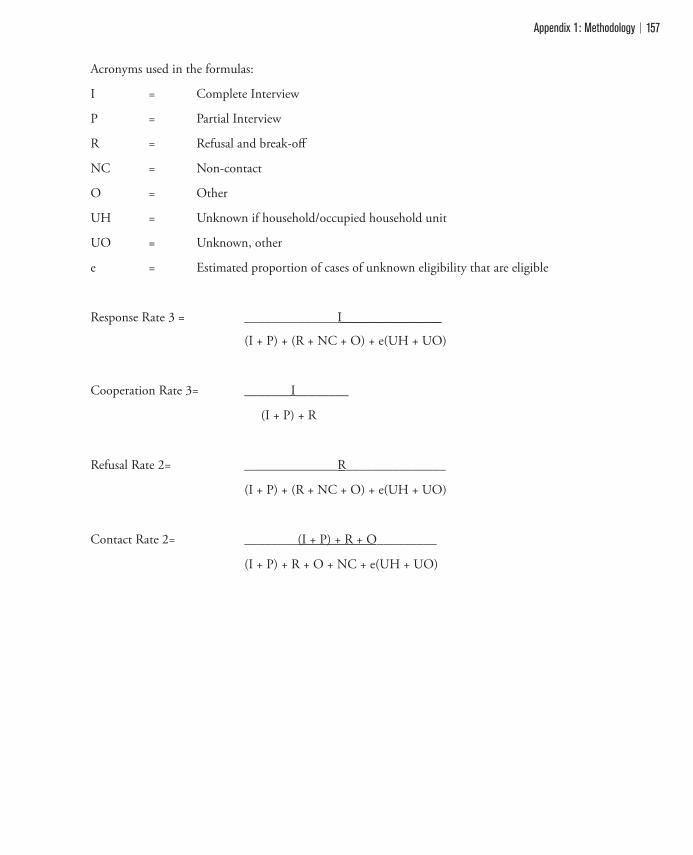
Appendix 1: Methodology 157
Acronyms used in the formulas:
I = Complete Interview
P = Partial Interview
R = Refusal and break-o#
NC = Non-contact
O = Other
UH = Unknown if household/occupied household unit
UO = Unknown, other
e = Estimated proportion of cases of unknown eligibility that are eligible
Response Rate 3 = ______________I_______________
(I + P) + (R + NC + O) + e(UH + UO)
Cooperation Rate 3= _______I________
(I + P) + R
Refusal Rate 2= ______________R_______________
(I + P) + (R + NC + O) + e(UH + UO)
Contact Rate 2= ________(I + P) + R + O_________
(I + P) + R + O + NC + e(UH + UO)

Afghanistan in 2014158
SURVEY MANAGEMENT DETAILACSOR
Code
AAPOR
Code
Description Number
Completed Interviews
1 1.0/1.10 Interview was successfully completed 9775
Partial Interviews
10 1.2 During interview, selected respondent refused (General) 21
11 1.2 During interview, selected respondent was not feeling informed
enough to answer the questions17
12 1.2 During interview, selected respondent got angry because of a
question5
13 1.2 During interview, selected respondent preferred head of
household be interviewed20
14 1.2 During interview, selected respondent was in a hurry/had no time 19
Total Partials 82
Unknown Eligibility
20 3.13 No answer at door 289
21 3.2 No adults (18+) after three visits 309
22 3.17 Unable to access building or house 68
23 3.21 Outright refusal at the door 347
Total Unknown Household 1013
Non-contacts
24 2.21 Selected respondent never available for interview 161
25 2.25 Selected respondent had long-term absence for the fieldwork
period232
Total Non-contacts 393
Other
26 2.3 Selected respondent not allowed to participate in the survey 41
35 2.31 Selected respondent deceased 9
36 2.32 Selected respondent physically or mentally unable to complete
the interview5
37 2.332 Selected respondent unable to complete interview in languages
available2
90 2.36 Other 4
Total Others 61
Refusals
30 2.11 Selected respondent refused (general) 146
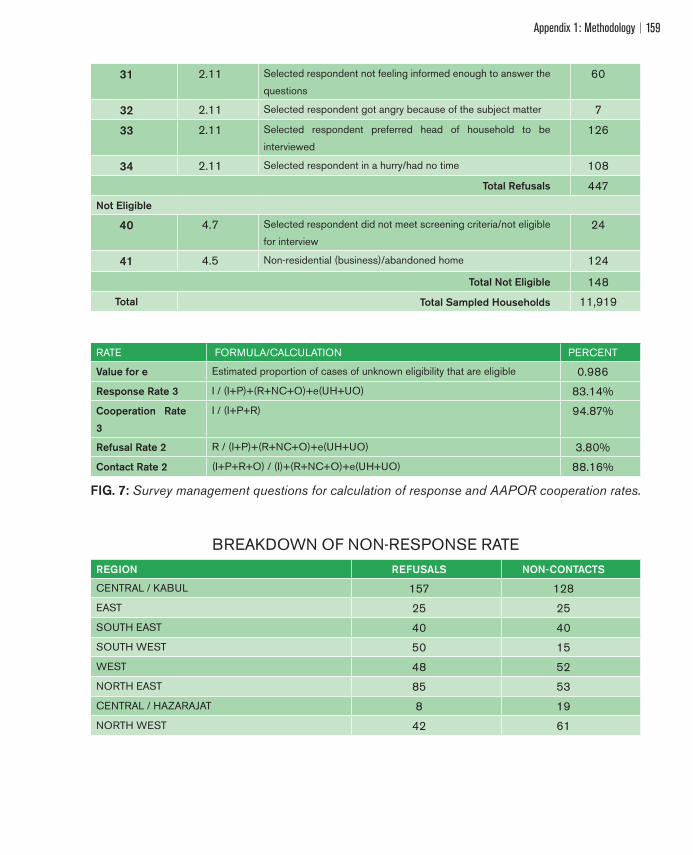
Appendix 1: Methodology 159
31 2.11 Selected respondent not feeling informed enough to answer the
questions60
32 2.11 Selected respondent got angry because of the subject matter 7
33 2.11 Selected respondent preferred head of household to be
interviewed126
34 2.11 Selected respondent in a hurry/had no time 108
Total Refusals 447
Not Eligible
40 4.7 Selected respondent did not meet screening criteria/not eligible
for interview24
41 4.5 Non-residential (business)/abandoned home 124
Total Not Eligible 148
Total Total Sampled Households 11,919
RATE FORMULA/CALCULATION PERCENT
Value for e Estimated proportion of cases of unknown eligibility that are eligible 0.986
Response Rate 3 I / (I+P)+(R+NC+O)+e(UH+UO) 83.14%
Cooperation Rate
3
I / (I+P+R) 94.87%
Refusal Rate 2 R / (I+P)+(R+NC+O)+e(UH+UO) 3.80%
Contact Rate 2 (I+P+R+O) / (I)+(R+NC+O)+e(UH+UO) 88.16%
FIG. 7: Survey management questions for calculation of response and AAPOR cooperation rates.
BREAKDOWN OF NON-RESPONSE RATE REGION REFUSALS NON-CONTACTS
CENTRAL / KABUL 157 128EAST 25 25SOUTH EAST 40 40SOUTH WEST 50 15WEST 48 52NORTH EAST 85 53CENTRAL / HAZARAJAT 8 19NORTH WEST 42 61

Afghanistan in 2014160
8 Village Replacements
In previous years, if a sampling point (village) was inaccessible, the replacement of this sampling point was left to the discretion of "eld supervisors and managers. Recognizing the need to limit any systematic bias involved with "eld supervisors selecting replacement sampling points this year, ACSOR modi"ed its system for assigning replacements to inaccessible sampling points in 2013. For the 2014 survey, ACSOR implemented a new replacement protocol: a total of two replicate sample draws were provided to the "eld team prior to the launch of "eldwork. !e "rst draw served as the initial list of sampling points where "eldwork was to be conducted. If the sampling point was inaccessible, ACSOR "eld supervisors informed the central o$ce of the reason for inaccessibility. !e "eld supervisor then used the "rst pre-assigned replacement, which was always a di#erent village within the same district. If this village was also inaccessible, the process was repeated and a second pre-assigned replicate was attempted. If the second replicate was also inaccessible, the next selected village was left to the discretion of the "eld managers and supervisors. In cases where settlement/nahia-level replacements were done in the "eld by supervisors, neighboring accessible settlements were chosen as replacements whenever possible.
Because this survey was implemented shortly after the second round of the presidential election, there was heightened Taliban activity throughout the survey "eldwork period. More restrictions were placed on local travel, leading to a higher than average replacement rate of the selected sampling points. Of the 1,628 sampling points selected, a total of 460 villages from the main draw had to be replaced. !is represents a total replacement rate of 28.3% for original sampling points. !is percentage of replacements is higher than in previous surveys, but similar to the 2010 replacement rate (Fig. 8).
VILLAGE REPLACEMENT RATE BY YEARYear Number of Sampling Points
(Total)
Number of Replaced Sampling
Points
Replacement
Rate
2008 762 52 6.8%
2009 961 208 21.6%
2010 825 214 25.9%
2011 825 166 20.1%
2012 1,436 341 23.7%
2013 1,568 267 17.0%
2014 1,628 460 28.3%
FIG 8: Replacements disaggregated by year as a proportion of the total number of sampling points.
Reasons for replacements have been consistent across the years of the survey, with security being the primary reason for replacements since 2009. Figure 9 outlines the reasons for replacements since 2008, the "rst year that reasons for replacement were recorded.
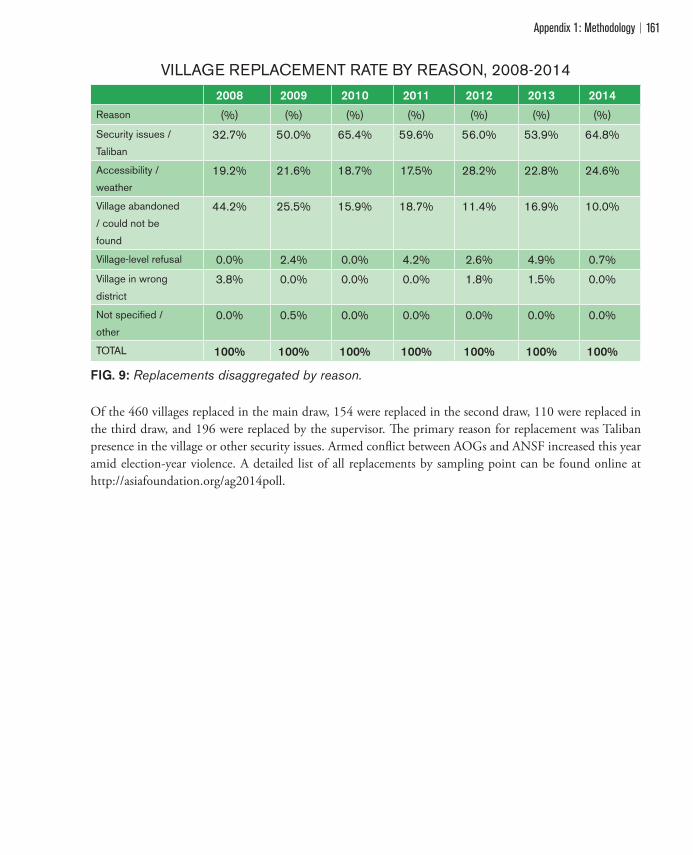
Appendix 1: Methodology 161
VILLAGE REPLACEMENT RATE BY REASON, 2008-2014 2008 2009 2010 2011 2012 2013 2014
Reason (%) (%) (%) (%) (%) (%) (%)Security issues /
Taliban32.7% 50.0% 65.4% 59.6% 56.0% 53.9% 64.8%
Accessibility /
weather19.2% 21.6% 18.7% 17.5% 28.2% 22.8% 24.6%
Village abandoned
/ could not be
found
44.2% 25.5% 15.9% 18.7% 11.4% 16.9% 10.0%
Village-level refusal 0.0% 2.4% 0.0% 4.2% 2.6% 4.9% 0.7%Village in wrong
district3.8% 0.0% 0.0% 0.0% 1.8% 1.5% 0.0%
Not specified /
other0.0% 0.5% 0.0% 0.0% 0.0% 0.0% 0.0%
TOTAL 100% 100% 100% 100% 100% 100% 100%
FIG. 9: Replacements disaggregated by reason.
Of the 460 villages replaced in the main draw, 154 were replaced in the second draw, 110 were replaced in the third draw, and 196 were replaced by the supervisor. !e primary reason for replacement was Taliban presence in the village or other security issues. Armed con%ict between AOGs and ANSF increased this year amid election-year violence. A detailed list of all replacements by sampling point can be found online at http://asiafoundation.org/ag2014poll.
Afghanistan in 2014162
9 Quality Control
Field Level
Approximately 40% of the interviews were subject to some form of quality control. ACSOR’s quality control methods consisted of:
x� Direct observation during the interview (474 interviews, 5%);
x� A return visit to the residence where an interview took place by the supervisor (1,596 interviews, 17%);
x� Back-checking from the central o$ce (119 interviews, 1%); or
x� Quality control by an external validator (1,548 interviews, 17%).
!ird-party quality control by Sayara Research included:
x� Monitoring of 17 provinces (14 back-checked);
x� Monitoring of 62 districts;
x� Monitoring of 55 enumerator trainings;
x� Monitoring of 161 total survey sampling points (100 back checked);
x� Monitoring of 94 rural sampling points;
x� Monitoring of 57 urban sampling points;
x� Monitoring of 904 household interviews by 102 individual ACSOR interviewers (14 female and 88 male); and
x� Interviews with 17 survey supervisors.
Sayara Research’s monitors directly observed the work of ACSOR’s interviewers at a total of 161 (9.9%) of the total number of survey sampling points. Monitors traveled to each location separately from the ACSOR interviewers and observed the process of survey data collection in the "eld.
GPS Coordinates
In order to improve accuracy and verify "eldwork, ACSOR interviewers collected GPS data using watches or phones in 1,376 out of 1,628 (85%) of sampling points (Fig. 12). While ACSOR was able to collect GPS coordinates in all 34 provinces, due to concerns about "eld sta# security, they were not able to collect GPS coordinates in all surveyed districts. In insecure areas, GPS devices are sometimes associated with clandestine work for military or government sources, which can make enumerators who carry them a target. !is year, ACSOR collected GPS coordinates from 255 of the 358 selected districts (71%). As an extra level of veri"cation, GPS coordinates were then compared against the GPS coordinates of villages provided by the CSO. For this survey, the median distance from the selected villages was 2.05 km.

Appendix 1: Methodology 163
FIG. 10: Sampling points by GPS coordinates (captures most, but not all sampling points).
Coding, Data Entry, and Data Cleaning
When the questionnaires were returned to the ACSOR central o$ce in Kabul, they were sorted and open-ended questions were coded by a team of coders familiar with international standards for creating typologies for codes.
!e questionnaires were then sent for data entry. ACSOR keypunched all questionnaires on-site to protect the data and closely control the quality of the data entry process. During this process, the keypunching team utilized logic checks and veri"ed any errors inadvertently committed by interviewers. During this initial review, eight interviews were removed due to missing or misprinted pages.
Following the data cleaning process and logic checks of the dataset, ACSOR used a program called Hunter that searches for additional patterns and duplicates that may indicate that an interview was not properly conducted by an interviewer.
!e Hunter program includes three tests:

Afghanistan in 2014164
x�Equality test – compares interviews for similarities, grouped by interviewer, within sampling point, province, or any other variable. Typically, interviews with an interviewer average of 90% or higher are %agged for further investigation.
x�“Don’t Know” (i.e., non-response) test – determines the percentage of Don’t Knows (DK) for each interviewer’s cases. Typically, interviews with 40% or higher DK responses are %agged for further investigation.
x�Duplicates test – compares cases across all interviewers and respondents to check for similarity rates. !is test will %ag any pair of interviews that are similar to each other. Typically, any cases that have a similarity of 95% or higher are %agged for further investigation.
Any interview that did not pass any Hunter tests was pulled out for additional screening. If the interview did not pass screening, it was removed from the "nal database before delivery.
For the 2014 survey, 151 cases were deleted for being over 95% similar in substantive responses to another interview (i.e., failing the duplicates test), and one case was deleted for consisting of over 40% “don’t know” responses (i.e., failing the “Don’t Know” test). No cases failed the equality test.
Double Entry
During the data entry process, as entry of questionnaires was completed, 20% of questionnaires (1,956 out of 9,775) were randomly pulled by ACSOR’s data entry managers and given to a di#erent team for re-entry. Data results from this independent entry were then compared to the primary data set. Discrepancies and errors were identi"ed by data coders. Keypunchers with high error rates were disciplined and provided with additional training. For all errors, questionnaires were then reviewed and the correct data was included in the "nal data set. !e error rate for data entry in this year’s survey was 0.11%, which is comparably low and acceptable for quality control standards.
In addition to ACSOR’s 20% double-entry of the data, !e Asia Foundation’s third-party project monitoring provider, Sayara Research, conducted double-entry on an additional 901 cases. !ese results were then compared against the data entry conducted by ACSOR keypunchers. From these 901 cases, 65 cases (7%) had one or more errors. Of the 279 questions tested in the double punching, keypunchers made an average error on 0.31 questions per survey. However, during data cleaning, it was found that two questionnaires had shifted column positions in the data, skewing the results of the double-entry. Removing these cases shows that the average keypuncher had an average is 0.126 incorrect keystrokes per questionnaire, consistent with the rate of ACSOR’s internal review.
Inter-Rater Reliability (IRR)/Coding Comparison
!is year, the survey included an additional quality control component: coder comparison and inter-rater reliability. In order to assess the reliability of ACSOR coders who match responses to open-ended questions to a pre-existing code list, three hundred questionnaires (150 Dari questionnaires and 150 Pashto questionnaires) were selected for comparison.
Appendix 1: Methodology 165
In order to check for rates of discrepancy, coding for open-ended questions was compared between four independent coders, including two unique coders for Dari questionnaires, and two unique coders for Pashto questionnaires,. Coders were assigned to work on the same open-ended questions independently, without any reference or indication of the others’ codes, for an independent estimation of coding error. !e coders for Dari questionnaires evaluated 1,878 responses, with 290 discrepancies (15.4%), while the coders for Pashto questionnaires evaluated 1,773 responses in Pashto, with 275 discrepancies (15.6%). !is yielded a Cohen’s Kappa of .84 for both Dari and Pashto, considered “very good agreement” and “almost perfect” using guidelines for Kappa reliability as per the guidelines published by Landis and Koch in 1977.
ACSOR Review and Cleaning
Prior to the delivery of data to !e Asia Foundation, ACSOR conducted a full review of the data set. !is included analyzing the data for irregularities and data processing errors. To achieve this, ACSOR wrote SPSS syntax code to:
x�Identify incorrect coding;
x�Verify "ltering instructions were followed correctly;
x�Address any logical inconsistencies;
x�Identify outliers in the data; and
x�List questionnaires and interviewers for further review.
In total, ACSOR wrote nearly 1,600 lines of code to create a total of 99 tests for the questionnaire. Questionnaires identi"ed by these tests were then reviewed by ACSOR sta# and the data was updated as necessary.
The Asia Foundation Logic Tests
Following ACSOR’s review, !e Asia Foundation’s analysts ran a series of logic checks to test data for interviewer error, logical consistency, and detect any possible patterns of falsi"cation or poor performance. !ese checks were developed and run by !e Asia Foundation with input from ACSOR.
!e Asia Foundation used a total of 44 logic tests for their analysis. Based on the results of these tests, a total of 131 cases were removed from the data set for failing two or more logic tests in areas where "eld validation noted suspected problems with "eldwork. If an interviewer had at least two interviews deleted, all interviews conducted by this interviewer were then removed from the data. Based on these "ndings, a total of 32 sampling points were deleted from the "nal data set. Finally, an additional 30 cases, were removed based solely on the validation reports. !is resulted in a total of 344 interviews being removed from the data as a result of client quality control measures. In total, 5.1% of all successful interviews were removed at some stage of the quality control process (Fig. 13).

Afghanistan in 2014166
DATA REMOVED BY QUALITY CONTROL (QC)n-Size at Each Stage
of QCTotal
RemovedPercentage Removed at
Each Stage
Total Successful Interviews 9,775 -- NAn-size post-ACSOR QC 9,615 160 1.6%n-size post-Asia Foundation QC
9,301 314 3.2%
Final Data Set (post-validation reports)
9,271 30 0.3%
FIG. 11: Summary of removed cases.
10 Margin of Error
!e margin of error is a statistical estimation for how well the sample re%ects the true population of Afghanistan, taking into account a strati"ed sample design (i.e., urban/rural and provincial population distributions) with district as the cluster unit. Every year, the survey estimates the margin of error based on speci"c point means for Q-1. Margin of error is primarily a#ected by overall sample size (as the sample size goes up, the margin of error goes down, in most cases) and by standard error (as the standard deviation of the sampling distribution increases, for any point mean, the con"dence interval widens). Importantly, the margin of error does not capture systematic error, which must be evaluated separately based on quality control methods.
In 2014, as in 2013, bootstrapping is used to estimate the margin of error. Bootstrapping is a technique to estimate true population variance by resampling directly from the observed data. It relies on assumptions of random sampling with replacement, and it is particularly useful when the true population variance and con"dence intervals are unknown.
Figure 12 represents the empirical con"dence intervals for Q-1 based on 2,000 bootstrap replications weighted by strata (i.e., urban/rural and provincial population distribution) without intercept interviews. Using a weighted average design e#ect across responses for this question, the margin of error at the 95% con"dence interval with a p=.05 is +/-1.5% for the probability sample.
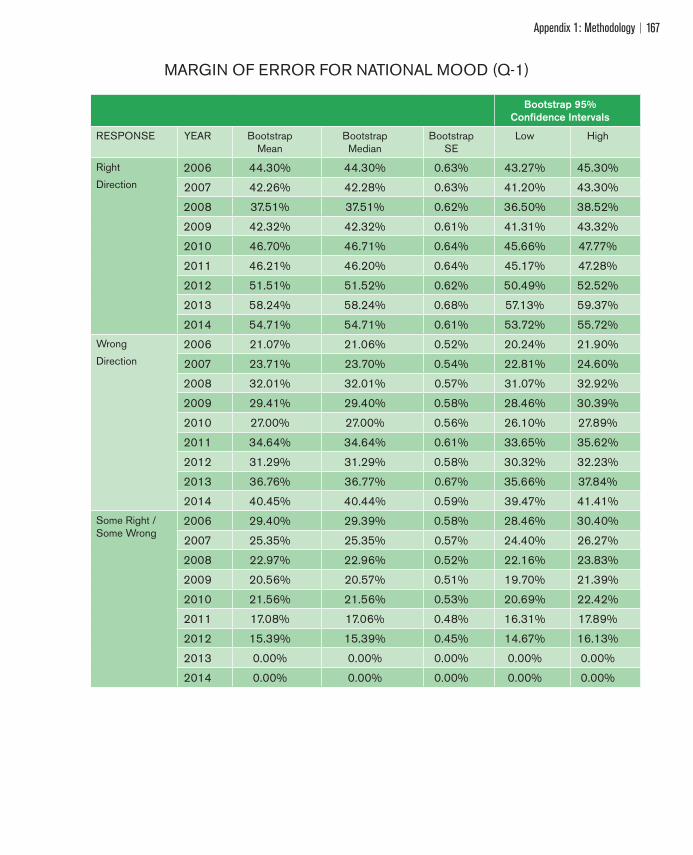
Appendix 1: Methodology 167
MARGIN OF ERROR FOR NATIONAL MOOD (Q-1)
Bootstrap 95% Confidence Intervals
RESPONSE YEAR Bootstrap Mean
Bootstrap Median
Bootstrap SE
Low High
Right
Direction2006 44.30% 44.30% 0.63% 43.27% 45.30%
2007 42.26% 42.28% 0.63% 41.20% 43.30%
2008 37.51% 37.51% 0.62% 36.50% 38.52%
2009 42.32% 42.32% 0.61% 41.31% 43.32%
2010 46.70% 46.71% 0.64% 45.66% 47.77%
2011 46.21% 46.20% 0.64% 45.17% 47.28%
2012 51.51% 51.52% 0.62% 50.49% 52.52%
2013 58.24% 58.24% 0.68% 57.13% 59.37%
2014 54.71% 54.71% 0.61% 53.72% 55.72%Wrong
Direction2006 21.07% 21.06% 0.52% 20.24% 21.90%
2007 23.71% 23.70% 0.54% 22.81% 24.60%
2008 32.01% 32.01% 0.57% 31.07% 32.92%
2009 29.41% 29.40% 0.58% 28.46% 30.39%
2010 27.00% 27.00% 0.56% 26.10% 27.89%
2011 34.64% 34.64% 0.61% 33.65% 35.62%
2012 31.29% 31.29% 0.58% 30.32% 32.23%
2013 36.76% 36.77% 0.67% 35.66% 37.84%
2014 40.45% 40.44% 0.59% 39.47% 41.41%Some Right /Some Wrong
2006 29.40% 29.39% 0.58% 28.46% 30.40%
2007 25.35% 25.35% 0.57% 24.40% 26.27%
2008 22.97% 22.96% 0.52% 22.16% 23.83%
2009 20.56% 20.57% 0.51% 19.70% 21.39%
2010 21.56% 21.56% 0.53% 20.69% 22.42%
2011 17.08% 17.06% 0.48% 16.31% 17.89%
2012 15.39% 15.39% 0.45% 14.67% 16.13%
2013 0.00% 0.00% 0.00% 0.00% 0.00%
2014 0.00% 0.00% 0.00% 0.00% 0.00%
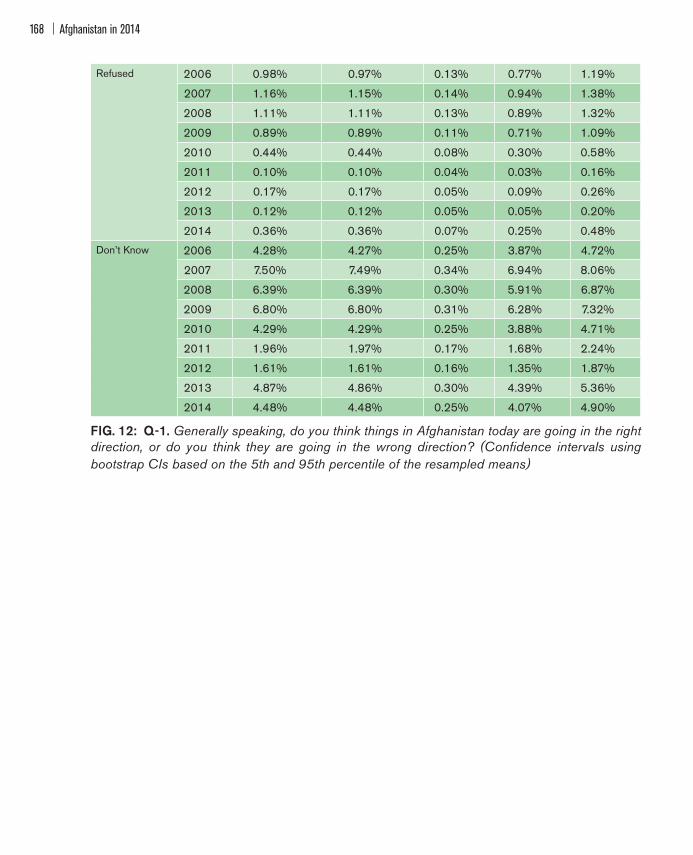
Afghanistan in 2014168
Refused 2006 0.98% 0.97% 0.13% 0.77% 1.19%
2007 1.16% 1.15% 0.14% 0.94% 1.38%
2008 1.11% 1.11% 0.13% 0.89% 1.32%
2009 0.89% 0.89% 0.11% 0.71% 1.09%
2010 0.44% 0.44% 0.08% 0.30% 0.58%
2011 0.10% 0.10% 0.04% 0.03% 0.16%
2012 0.17% 0.17% 0.05% 0.09% 0.26%
2013 0.12% 0.12% 0.05% 0.05% 0.20%
2014 0.36% 0.36% 0.07% 0.25% 0.48%Don’t Know 2006 4.28% 4.27% 0.25% 3.87% 4.72%
2007 7.50% 7.49% 0.34% 6.94% 8.06%
2008 6.39% 6.39% 0.30% 5.91% 6.87%
2009 6.80% 6.80% 0.31% 6.28% 7.32%
2010 4.29% 4.29% 0.25% 3.88% 4.71%
2011 1.96% 1.97% 0.17% 1.68% 2.24%
2012 1.61% 1.61% 0.16% 1.35% 1.87%
2013 4.87% 4.86% 0.30% 4.39% 5.36%
2014 4.48% 4.48% 0.25% 4.07% 4.90%
FIG. 12: Q-1. Generally speaking, do you think things in Afghanistan today are going in the right direction, or do you think they are going in the wrong direction? (Confidence intervals using bootstrap CIs based on the 5th and 95th percentile of the resampled means)
Appendix 1: Methodology 169
Endnotes1 !e design e#ect estimate is a weighted average across individual response option design e#ects for this key question of interest.2 !e probability sample excludes intercept interviews from variance estimation, and the Margin of Error is based on responses to
Q-1 in the survey.3 !e target n-size for this survey was 9,500. !e initial data set delivered by ACSOR had an n-size of 9,615. A total of 344
interviews were removed as a result of quality control by ACSOR and client logic checks, which reduced the total n-size in the "nal data set to 9,271.
4 ‘Wgt3’ variable in the data set. Post Strati"ed Weight by Strata without Intercepts. Distribution of the weighted sample by province is approximately the same for all four weights.

Afghanistan in 2014170

Appendix 2: Interview Questionnaire 171
APPENDIX 2: INTERVIEW QUESTIONNAIRE
Region
Base: All Respondents 8706
Central / Kabul 24%East 9%
South East 10%
South West 12%West 13%North East 14%
Central / Hazarajat 3%
North West 14%
Geographic Code
Base: All Respondents 8706
Villages 76%Towns 5%City 6%Metro (Kabul) 13%
Province
Base: All Respondents 8706
Kabul 16%Kapisa 2%Parwan 2%Wardak 2%Logar 1%Ghazni 5%Paktiya 2%Paktika 2%Khost 2%Nangarhar 5%Laghman 2%Kunar 2%Nooristan 1%Badakhshan 4%

Afghanistan in 2014172
Takhar 4%Baghlan 3%Kunduz 4%Balkh 5%Samangan 1%Jawzjan 2%Sar-i-Pul 2%Faryab 4%Badghis 2%Herat 7%Farah 2%Nimroz 1%Helmand 3%Kandhar 5%Zabul 1%Uruzghan 1%Ghor 3%Bamyan 2%Panjshir 1%Daikundi 2%
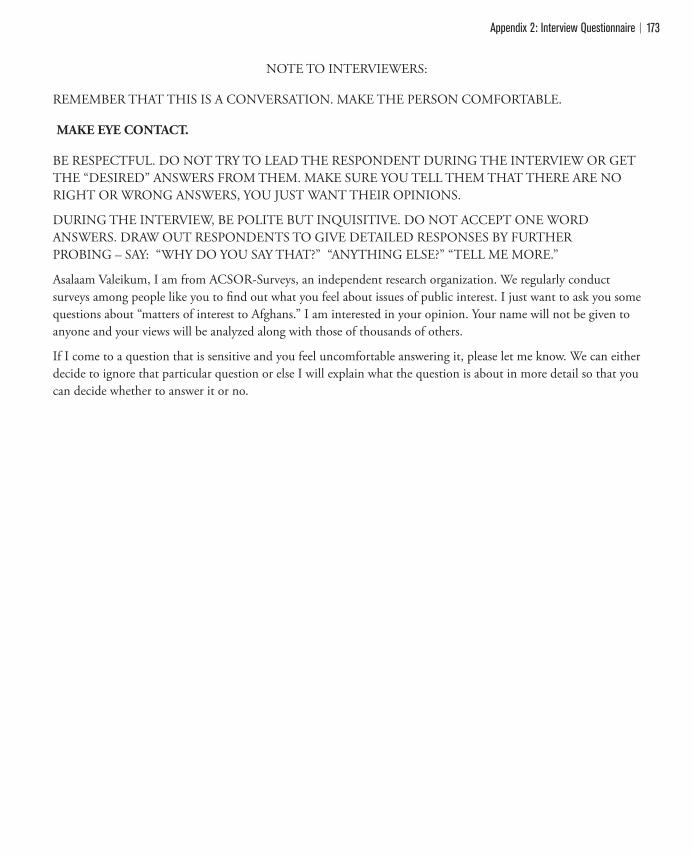
Appendix 2: Interview Questionnaire 173
NOTE TO INTERVIEWERS:
REMEMBER THAT THIS IS A CONVERSATION. MAKE THE PERSON COMFORTABLE.
MAKE EYE CONTACT.
BE RESPECTFUL. DO NOT TRY TO LEAD THE RESPONDENT DURING THE INTERVIEW OR GET THE “DESIRED” ANSWERS FROM THEM. MAKE SURE YOU TELL THEM THAT THERE ARE NO RIGHT OR WRONG ANSWERS, YOU JUST WANT THEIR OPINIONS.
DURING THE INTERVIEW, BE POLITE BUT INQUISITIVE. DO NOT ACCEPT ONE WORD ANSWERS. DRAW OUT RESPONDENTS TO GIVE DETAILED RESPONSES BY FURTHER PROBING – SAY: “WHY DO YOU SAY THAT?” “ANYTHING ELSE?” “TELL ME MORE.”
Asalaam Valeikum, I am from ACSOR-Surveys, an independent research organization. We regularly conduct surveys among people like you to "nd out what you feel about issues of public interest. I just want to ask you some questions about “matters of interest to Afghans.” I am interested in your opinion. Your name will not be given to anyone and your views will be analyzed along with those of thousands of others.
If I come to a question that is sensitive and you feel uncomfortable answering it, please let me know. We can either decide to ignore that particular question or else I will explain what the question is about in more detail so that you can decide whether to answer it or no.
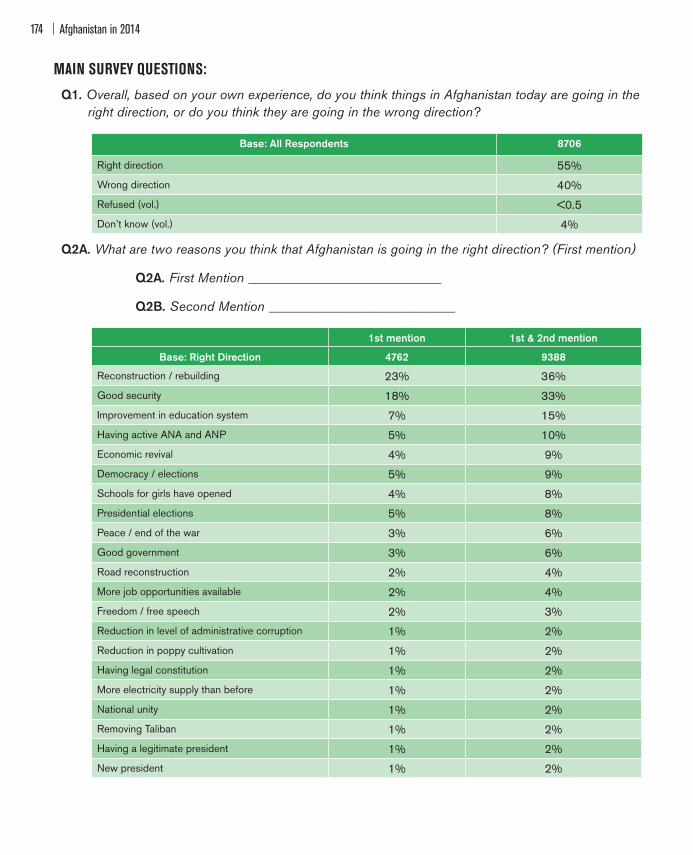
Afghanistan in 2014174
MAIN SURVEY QUESTIONS:
Q1. Overall, based on your own experience, do you think things in Afghanistan today are going in the right direction, or do you think they are going in the wrong direction?
Base: All Respondents 8706
Right direction 55%Wrong direction 40%Refused (vol.) <0.5Don’t know (vol.) 4%
Q2A. What are two reasons you think that Afghanistan is going in the right direction? (First mention)
Q2A. First Mention _____________________________
Q2B. Second Mention ____________________________
1st mention 1st & 2nd mention
Base: Right Direction 4762 9388
Reconstruction / rebuilding 23% 36%Good security 18% 33%Improvement in education system 7% 15%Having active ANA and ANP 5% 10%Economic revival 4% 9%Democracy / elections 5% 9%Schools for girls have opened 4% 8%Presidential elections 5% 8%Peace / end of the war 3% 6%Good government 3% 6%Road reconstruction 2% 4%More job opportunities available 2% 4%Freedom / free speech 2% 3%Reduction in level of administrative corruption 1% 2%Reduction in poppy cultivation 1% 2%Having legal constitution 1% 2%More electricity supply than before 1% 2%National unity 1% 2%Removing Taliban 1% 2%Having a legitimate president 1% 2%New president 1% 2%
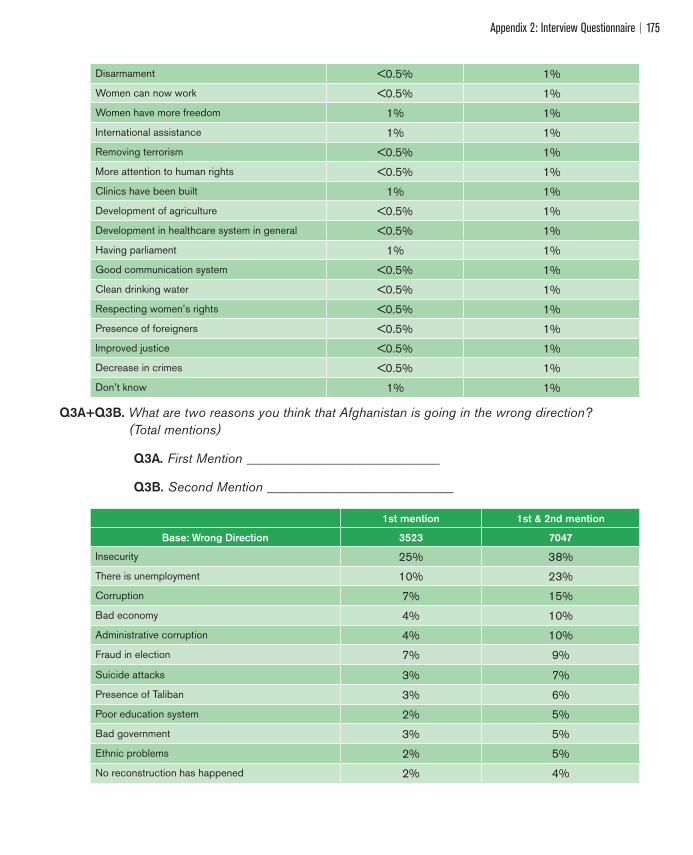
Appendix 2: Interview Questionnaire 175
Disarmament <0.5% 1%Women can now work <0.5% 1%Women have more freedom 1% 1%International assistance 1% 1%Removing terrorism <0.5% 1%More attention to human rights <0.5% 1%Clinics have been built 1% 1%Development of agriculture <0.5% 1%Development in healthcare system in general <0.5% 1%Having parliament 1% 1%Good communication system <0.5% 1%Clean drinking water <0.5% 1%Respecting women’s rights <0.5% 1%Presence of foreigners <0.5% 1%Improved justice <0.5% 1%Decrease in crimes <0.5% 1%Don’t know 1% 1%
Q3A+Q3B. What are two reasons you think that Afghanistan is going in the wrong direction? (Total mentions)
Q3A. First Mention _____________________________
Q3B. Second Mention ____________________________
1st mention 1st & 2nd mention
Base: Wrong Direction 3523 7047
Insecurity 25% 38%There is unemployment 10% 23%Corruption 7% 15%Bad economy 4% 10%Administrative corruption 4% 10%Fraud in election 7% 9%
Suicide attacks 3% 7%Presence of Taliban 3% 6%Poor education system 2% 5%Bad government 3% 5%Ethnic problems 2% 5%No reconstruction has happened 2% 4%
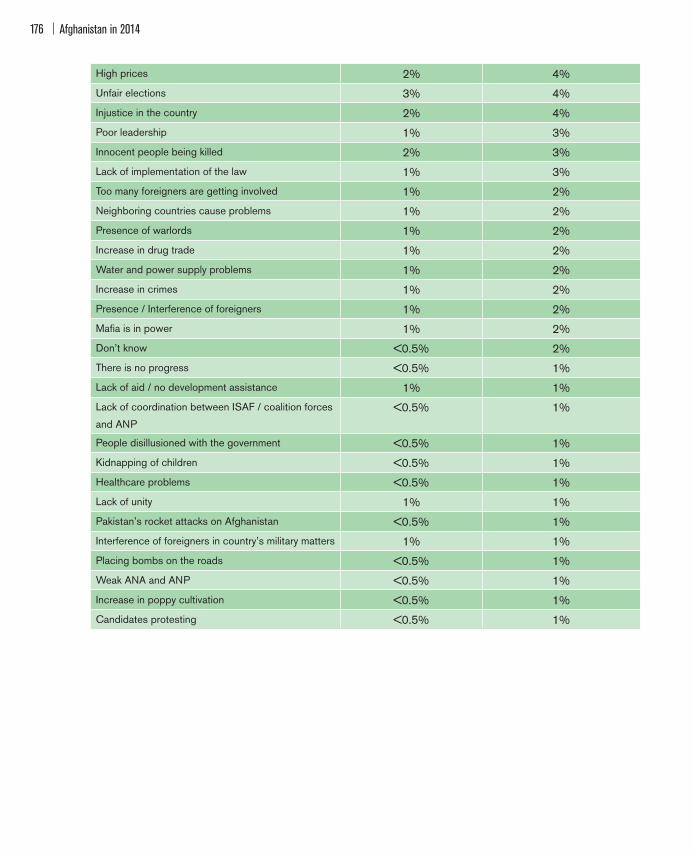
Afghanistan in 2014176
High prices 2% 4%Unfair elections 3% 4%Injustice in the country 2% 4%Poor leadership 1% 3%Innocent people being killed 2% 3%Lack of implementation of the law 1% 3%Too many foreigners are getting involved 1% 2%Neighboring countries cause problems 1% 2%Presence of warlords 1% 2%Increase in drug trade 1% 2%Water and power supply problems 1% 2%Increase in crimes 1% 2%Presence / Interference of foreigners 1% 2%Mafia is in power 1% 2%Don’t know <0.5% 2%There is no progress <0.5% 1%Lack of aid / no development assistance 1% 1%Lack of coordination between ISAF / coalition forces
and ANP <0.5% 1%
People disillusioned with the government <0.5% 1%Kidnapping of children <0.5% 1%Healthcare problems <0.5% 1%Lack of unity 1% 1%Pakistan’s rocket attacks on Afghanistan <0.5% 1%Interference of foreigners in country’s military matters 1% 1%Placing bombs on the roads <0.5% 1%Weak ANA and ANP <0.5% 1%Increase in poppy cultivation <0.5% 1%Candidates protesting <0.5% 1%
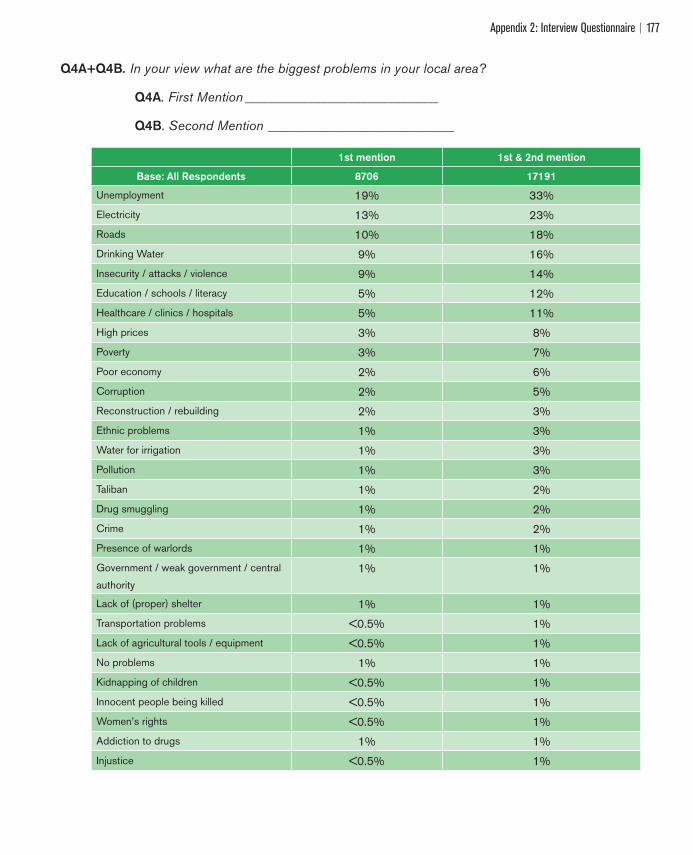
Appendix 2: Interview Questionnaire 177
Q4A+Q4B. In your view what are the biggest problems in your local area?
Q4A. First Mention _____________________________
Q4B. Second Mention ____________________________
1st mention 1st & 2nd mention
Base: All Respondents 8706 17191
Unemployment 19% 33%Electricity 13% 23%Roads 10% 18%Drinking Water 9% 16%Insecurity / attacks / violence 9% 14%Education / schools / literacy 5% 12%Healthcare / clinics / hospitals 5% 11%High prices 3% 8%Poverty 3% 7%Poor economy 2% 6%Corruption 2% 5%Reconstruction / rebuilding 2% 3%Ethnic problems 1% 3%Water for irrigation 1% 3%Pollution 1% 3%Taliban 1% 2%Drug smuggling 1% 2%Crime 1% 2%Presence of warlords 1% 1% Government / weak government / central
authority1% 1%
Lack of (proper) shelter 1% 1%Transportation problems <0.5% 1%Lack of agricultural tools / equipment <0.5% 1%No problems 1% 1%Kidnapping of children <0.5% 1%Innocent people being killed <0.5% 1%Women’s rights <0.5% 1%Addiction to drugs 1% 1%Injustice <0.5% 1%

Afghanistan in 2014178
Lack of unity <0.5% 1%Roadside bombs <0.5% 1%Dikes and drains against flood <0.5% 1%Theft 1% 1%Lack of professional doctors <0.5% 1%Don’t know 1% 1%
Q5A+Q5B. In your view, what are the two biggest problems facing Afghanistan as a whole?
Q5A. First Mention _____________________________
Q5B. Second Mention ____________________________
1st mention 1st & 2nd mention
Base: All Respondents 8706 17263
Insecurity / attacks / violence / terrorism 22% 34%Corruption 17% 28%Unemployment 13% 26%Poor economy 5% 11%Education / schools / literacy 3% 8%Presence of Taliban 4% 7%Poverty 3% 7%Suicide attacks 3% 6%High prices 2% 5%Injustice 2% 5%Interference of Pakistan 3% 5%Government / weak government / central authority 2% 4%Interference of foreign countries 2% 4%Tribal issues / partisanship 2% 4%Scarcity of electricity 2% 3%Drug smuggling 1% 3%Fraud in elections 1% 3%Presence of warlords 1% 2%Crime 1% 2%Innocent people being killed 1% 2%Presence of foreign troops 1% 2%Don’t know 2% 2%Reconstruction / rebuilding <0.5% 1%Roads 1% 1%
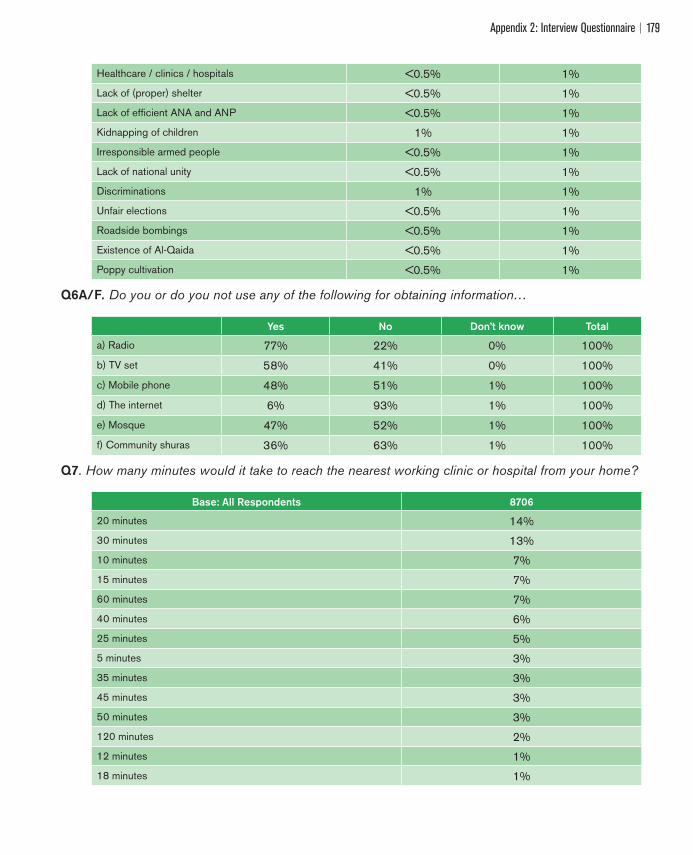
Appendix 2: Interview Questionnaire 179
Healthcare / clinics / hospitals <0.5% 1%Lack of (proper) shelter <0.5% 1%Lack of efficient ANA and ANP <0.5% 1%Kidnapping of children 1% 1%Irresponsible armed people <0.5% 1%Lack of national unity <0.5% 1%Discriminations 1% 1%Unfair elections <0.5% 1%Roadside bombings <0.5% 1%Existence of Al-Qaida <0.5% 1%Poppy cultivation <0.5% 1%
Q6A/F. Do you or do you not use any of the following for obtaining information…
Yes No Don’t know Total
a) Radio 77% 22% 0% 100%
b) TV set 58% 41% 0% 100%
c) Mobile phone 48% 51% 1% 100%
d) The internet 6% 93% 1% 100%
e) Mosque 47% 52% 1% 100%
f) Community shuras 36% 63% 1% 100%
Q7. How many minutes would it take to reach the nearest working clinic or hospital from your home?
Base: All Respondents 8706
20 minutes 14%30 minutes 13%10 minutes 7%15 minutes 7%60 minutes 7%40 minutes 6%25 minutes 5%5 minutes 3%35 minutes 3%45 minutes 3%50 minutes 3%120 minutes 2%12 minutes 1%18 minutes 1%
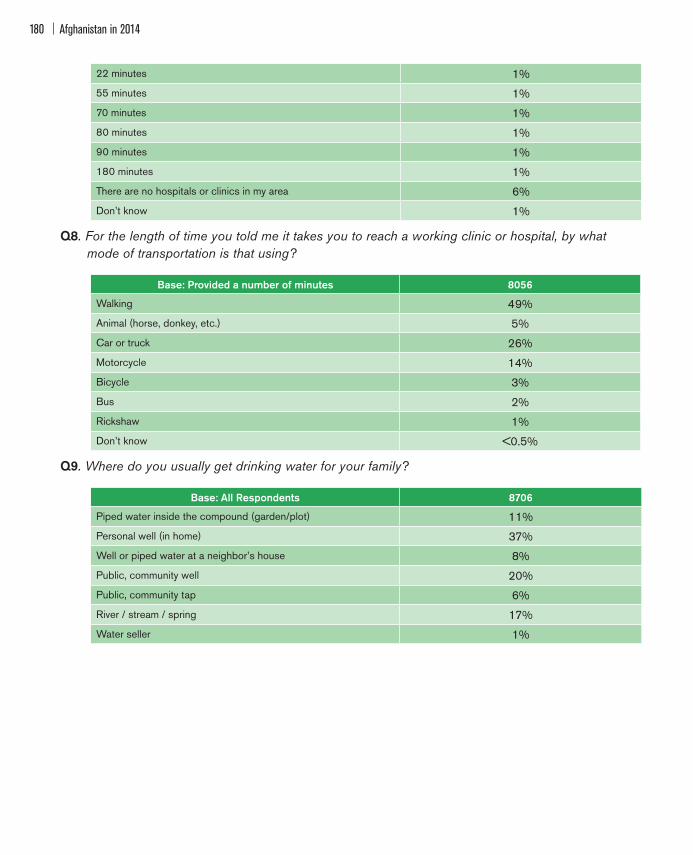
Afghanistan in 2014180
22 minutes 1%55 minutes 1%70 minutes 1%80 minutes 1%90 minutes 1%180 minutes 1%There are no hospitals or clinics in my area 6%Don’t know 1%
Q8. For the length of time you told me it takes you to reach a working clinic or hospital, by what mode of transportation is that using?
Base: Provided a number of minutes 8056
Walking 49%Animal (horse, donkey, etc.) 5%Car or truck 26%Motorcycle 14%Bicycle 3%Bus 2%Rickshaw 1%Don’t know <0.5%
Q9. Where do you usually get drinking water for your family?
Base: All Respondents 8706
Piped water inside the compound (garden/plot) 11%Personal well (in home) 37%Well or piped water at a neighbor’s house 8%Public, community well 20%Public, community tap 6%River / stream / spring 17%Water seller 1%

Appendix 2: Interview Questionnaire 181
Q10A/G. Please tell me if your family has access to [insert item] in your area? Do you have access always, often, seldom, or never?...
Column percents Always Often Sometimes Rarely Never Don’tknow
a) Clean drinking water 39% 31% 18% 7% 5% <0.5%
b) Water for irrigation 14% 26% 28% 14% 16% 1%
c) Electricity 19% 17% 15% 13% 33% 1%
d) Clinics or hospitals 15% 29% 32% 15% 8% 1%
e) Medicine 13% 30% 33% 16% 6% 1%
f) Education for children 34% 36% 19% 7% 3% <0.5%
g) Roads 20% 31% 29% 15% 5% <0.5%
Q11A/G. Next please rate your satisfaction with the quality of goods and services in your area. For each item I list, please tell me if you are very satisfied, somewhat satisfied, somewhat dissatisfied or very dissatisfied...
Column percents Very satisfied
Somewhat satisfied
Somewhat dissatisfied
Somewhat dissatisfied Refused Don’t
know
a) Clean drinking water 34% 39% 16% 11% <0.5% <0.5%
b) Water for irrigation 14% 34% 28% 17% 1% 6%
c) Electricity 17% 21% 19% 40% 1% 2%
d) Clinics or hospitals 14% 39% 31% 16% <0.5% 1%
e) Medicine 12% 39% 34% 14% <0.5% 1%
f) Education for children 32% 42% 19% 6% <0.5% 1%
g) Roads 16% 37% 30% 17% <0.5% <0.5%
Q12A/I. I am going to read a list of projects that may or may not have been implemented in your area. Please tell me if there has been this type of project in your area in the last 12 months...
Column percents Yes No Refused Don’tknow
a) Reconstruction / building of roads or bridges 36% 63% 0% 1%
b) New government school opening 20% 80% <0.5% 1%c) New private school opening 12% 87% <0.5% 1%d) New private university 7% 92% <0.5% 1%e) Drinking water project (e.g. new wells, hand pumps, tank system,
reservoir)26% 73% <0.5% 1%
f) Irrigation project 14% 85% <0.5% 1%g) Government supplied electricity 14% 80% <0.5% 6%

Afghanistan in 2014182
h) Healthcare (primary health center, regular visits of doctors, etc) 18% 81% <0.5% 1%i) Reconciliation 12% 86% <0.5% 1%j) Programs in agriculture 18% 81% <0.5% 1%k) New factories opened 3% 96% <0.5% 1%l) Building new mosques 21% 78% <0.5% 1%
Q13A+Q13B. Which country do you think has provided the most funding for these types of projects in your area? Is there another country that you believe has funded these projects? Another one?
Q13A. First Mention _____________________________
Q13B. Second Mention ____________________________
1st mention 1st & 2nd mention
Base: Aware of projects 5582 10361
USA 18% 28%Afghan government / ministries 16% 22%Japan 7% 13%India 5% 11%Germany 5% 8%People themselves 8% 8%China 2% 5%Turkey 2% 5%United Kingdom (Britain) 1% 3%Iran 1% 3%Saudi Arabia 1% 3%Sweden 1% 3%National Solidarity Program 2% 3%Canada 1% 2%Norway 1% 2%Pakistan 1% 1%Italy 1% 1%Korea 1% 1%France 1% 1%Spain 1% 1%Australia 1% 1%Denmark 1% 1%Uzbekistan 1% 1%Tajikistan 1% 1%

Appendix 2: Interview Questionnaire 183
Russia 1% 1%Foreign countries 1% 1%UN agencies 1% 1%Foreign NGOs 1% 1%Poland 1% 1%European countries in general 1% 1%No country 1% 1%Provincial Reconstruction Team (PRT) 5% 1%National Development Council 1% 1%Ministry of Rural Rehabilitation and Development (MRRD) 1% 1%Don’t know 15% 41%
Q14A. Have you or your village/gozar experienced any of the following events in the past 12 months?...
Column percents Yes No Refused Don’t know
a) Floods 27% 73% <0.5% <0.5%b) Landslide or soil erosion 4% 96% <0.5% <0.5%c) Earthquake 7% 92% <0.5% <0.5%d) Avalanche 4% 96% <0.5% 1%
Q15A. How satisfied were you with the government’s response to the event(s) in your area? Were you very satisfied, somewhat satisfied, somewhat dissatisfied, or very dissatisfied?
Column percents Very satisfied
Somewhat satisfied
Somewhatdissatisfied
Very dissatisfied
Don’tknow
a) Floods 11% 34% 26% 27% 2%b) Landslide or soil erosion 9% 38% 33% 15% 6%c) Earthquake 11% 33% 29% 17% 9%d) Avalanche 9% 32% 34% 21% 4%

Afghanistan in 2014184
Q16. There are many security forces in the country. Which of these groups would you say is most responsible for providing security in your village/gozar?
Base: All Respondents 8706
Foreign armies 2%National army 24%Local police 22%National police 50%Armed opposition groups 1%Refused <0.5%Don’t know 1%
Q17A/C. I’m going to read some statements to you about the Afghan National Army (ANA). Please tell me if you agree or disagree with each statement: Would you say strongly or somewhat?...
Column percents Stronglyagree
Agree somewhat
Disagreesomewhat
Strongly disagree Refused Don’t
know
a) The ANA is honest
and fair with the Afghan
people
63% 31% 5% 1% <0.5% 1%
b) The ANA helps improve
security in Afghanistan57% 32% 8% 2% <0.5% <0.5%
c) The ANA protects
civilians58% 31% 8% 2% <0.5% 1%
Q18A/C. Please tell me if you agree or disagree...
Column percents Strongly agree
Agree somewhat
Disagree somewhat
Stronglydisagree Refused Don’t
know
a) ANP is honest and fair
with the Afghan people48% 40% 9% 2% <0.5% <0.5%
b) ANP helps improve
security in Afghanistan46% 40% 11% 3% <0.5% <0.5%
c) ANP is efficient at
arresting those who have
committed crimes
43% 39% 14% 3% <0.5% 1%
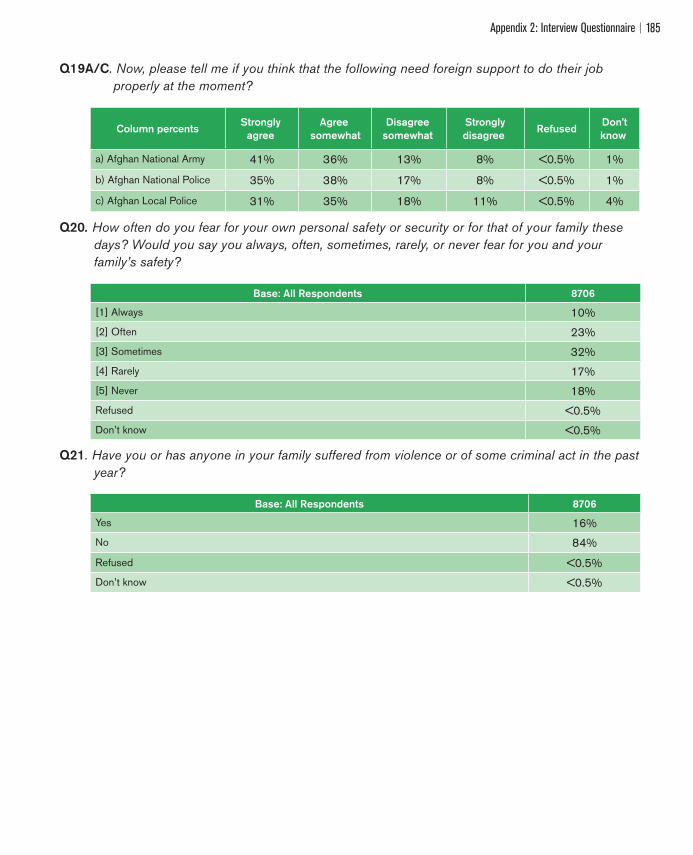
Appendix 2: Interview Questionnaire 185
Q19A/C. Now, please tell me if you think that the following need foreign support to do their job properly at the moment?
Column percents Strongly agree
Agree somewhat
Disagree somewhat
Stronglydisagree Refused Don’t
know
a) Afghan National Army 41% 36% 13% 8% <0.5% 1%
b) Afghan National Police 35% 38% 17% 8% <0.5% 1%
c) Afghan Local Police 31% 35% 18% 11% <0.5% 4%
Q20. How often do you fear for your own personal safety or security or for that of your family these days? Would you say you always, often, sometimes, rarely, or never fear for you and your family’s safety?
Base: All Respondents 8706
[1] Always 10%[2] Often 23%[3] Sometimes 32%[4] Rarely 17%[5] Never 18%Refused <0.5%Don’t know <0.5%
Q21. Have you or has anyone in your family suffered from violence or of some criminal act in the past year?
Base: All Respondents 8706
Yes 16%No 84%
Refused <0.5%Don’t know <0.5%
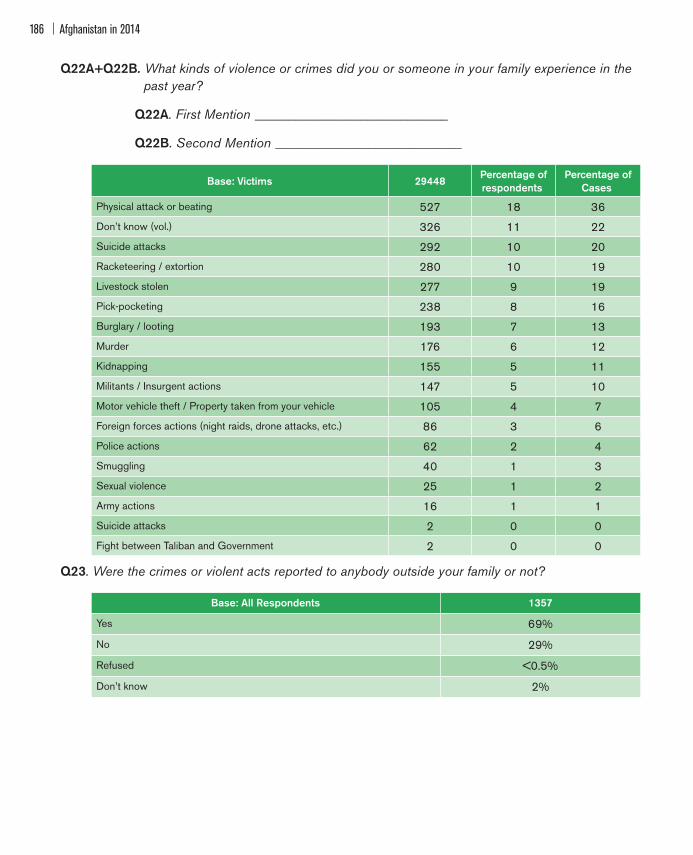
Afghanistan in 2014186
Q22A+Q22B. What kinds of violence or crimes did you or someone in your family experience in the past year?
Q22A. First Mention _____________________________
Q22B. Second Mention ____________________________
Base: Victims 29448 Percentage ofrespondents
Percentage ofCases
Physical attack or beating 527 18 36
Don’t know (vol.) 326 11 22
Suicide attacks 292 10 20
Racketeering / extortion 280 10 19
Livestock stolen 277 9 19
Pick-pocketing 238 8 16
Burglary / looting 193 7 13
Murder 176 6 12
Kidnapping 155 5 11
Militants / Insurgent actions 147 5 10
Motor vehicle theft / Property taken from your vehicle 105 4 7
Foreign forces actions (night raids, drone attacks, etc.) 86 3 6
Police actions 62 2 4
Smuggling 40 1 3
Sexual violence 25 1 2
Army actions 16 1 1
Suicide attacks 2 0 0
Fight between Taliban and Government 2 0 0
Q23. Were the crimes or violent acts reported to anybody outside your family or not?
Base: All Respondents 1357
Yes 69%
No 29%
Refused <0.5%
Don’t know 2%

Appendix 2: Interview Questionnaire 187
Q24A+Q24B. Who did you report the crime to?
Q24A. First Mention _____________________________
Q24B. Second Mention ____________________________
Base: Reported 2010 Percentage ofrespondent
Percentage ofcases
Afghan National Police 466 23 46
Shura / elders 361 18 36
Tribal leader / Malik 206 10 21
Afghan National Army 200 10 20
District Governor / woleswal 185 9 18
Mullah Saheb 114 6 11
Don’t know (vol.) 109 5 11
Provincial authority 94 5 9
Courts 44 2 4
Local militia (Arbakai) 44 2 4
Public prosecutor 43 2 4
Just my family 38 2 4
Local commander or warlord 31 2 3
Central Government 23 1 2
Afghanistan Independent Human Rights Commission 21 1 2
Office of UN organization(s) 10 0 1
Taliban 9 0 1
Local PRT 9 0 1
Press or other media 2 0 0
Q25. If you were a victim of violence or any criminal act in the future, how much confidence would you have that the guilty party would be punished? Would you have:
Base: All Respondents 8706
[1] A great deal of confidence 16%[2] A fair amount 42%[3] Not very much 27%[4] No confidence at all 13%Refused <0.5%Don’t know 2%

Afghanistan in 2014188
Q26. In your view, what is the biggest cause of crime in Afghanistan?
Base: All Respondents 8706
Unemployment 22%Corruption 13%Illiteracy 10%Poverty / weak economy 8%Insecurity 6%Don’t know 5% Lack of government attention / Weak government 4%Taliban 3%Drugs 3%Lack of law implementation 3%Discrimination 3%Existence of irresponsible armed groups 2%Pakistan’s interference 2%Presence of international forces 2%Injustice 2%Murders 1%Robberies 1%Criminals released without punishment 1%Suicide attacks 1%Violence 1%Crime in general 1%Drug addicts 1%
Q27A/E. Now we want to ask some questions about corruption. Please tell me whether you think corruption is a major problem, a minor problem, or no problem at all in the following areas...
Column percents Majorproblem
Minorproblem
Not aproblem Refused Don’t
know
a) In your daily life 62% 25% 12% <0.5% <0.5%b) In your neighborhood 53% 35% 11% <0.5% 1% c) In your local authorities 60% 31% 8% <0.5% 1%d) In your provincial government 68% 26% 5% <0.5% 1%e) In Afghanistan as a whole 76% 19% 4% <0.5% 1%
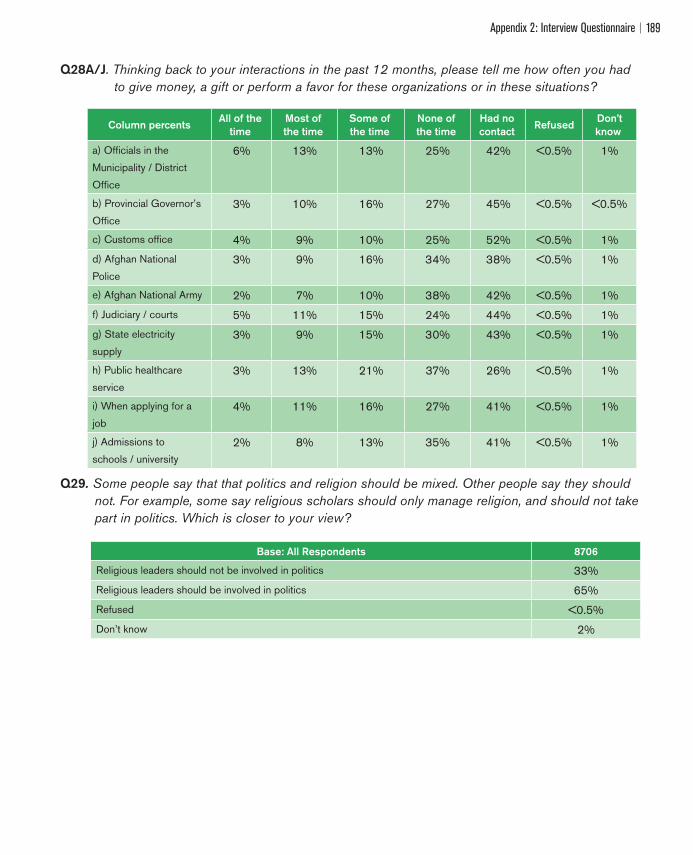
Appendix 2: Interview Questionnaire 189
Q28A/J. Thinking back to your interactions in the past 12 months, please tell me how often you had to give money, a gift or perform a favor for these organizations or in these situations?
Column percents All of the time
Most of the time
Some of the time
None of the time
Had no contact Refused Don’t
know
a) Officials in the
Municipality / District
Office
6% 13% 13% 25% 42% <0.5% 1%
b) Provincial Governor’s
Office3% 10% 16% 27% 45% <0.5% <0.5%
c) Customs office 4% 9% 10% 25% 52% <0.5% 1% d) Afghan National
Police3% 9% 16% 34% 38% <0.5% 1%
e) Afghan National Army 2% 7% 10% 38% 42% <0.5% 1%f) Judiciary / courts 5% 11% 15% 24% 44% <0.5% 1% g) State electricity
supply3% 9% 15% 30% 43% <0.5% 1%
h) Public healthcare
service3% 13% 21% 37% 26% <0.5% 1%
i) When applying for a
job4% 11% 16% 27% 41% <0.5% 1%
j) Admissions to
schools / university2% 8% 13% 35% 41% <0.5% 1%
Q29. Some people say that that politics and religion should be mixed. Other people say they should not. For example, some say religious scholars should only manage religion, and should not take part in politics. Which is closer to your view?
Base: All Respondents 8706
Religious leaders should not be involved in politics 33%Religious leaders should be involved in politics 65%Refused <0.5%Don’t know 2%
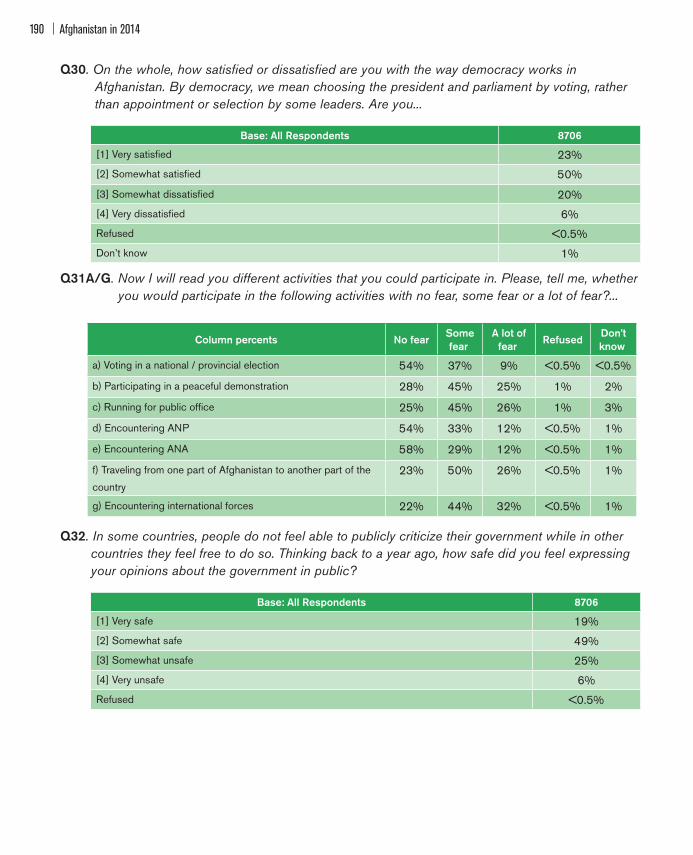
Afghanistan in 2014190
Q30. On the whole, how satisfied or dissatisfied are you with the way democracy works in Afghanistan. By democracy, we mean choosing the president and parliament by voting, rather than appointment or selection by some leaders. Are you...
Base: All Respondents 8706
[1] Very satisfied 23%[2] Somewhat satisfied 50%
[3] Somewhat dissatisfied 20%[4] Very dissatisfied 6%Refused <0.5%Don’t know 1%
Q31A/G. Now I will read you different activities that you could participate in. Please, tell me, whether you would participate in the following activities with no fear, some fear or a lot of fear?...
Column percents No fear Somefear
A lot offear Refused Don’t
know
a) Voting in a national / provincial election 54% 37% 9% <0.5% <0.5%
b) Participating in a peaceful demonstration 28% 45% 25% 1% 2%
c) Running for public office 25% 45% 26% 1% 3%
d) Encountering ANP 54% 33% 12% <0.5% 1%
e) Encountering ANA 58% 29% 12% <0.5% 1%
f) Traveling from one part of Afghanistan to another part of the
country23% 50% 26% <0.5% 1%
g) Encountering international forces 22% 44% 32% <0.5% 1%
Q32. In some countries, people do not feel able to publicly criticize their government while in other countries they feel free to do so. Thinking back to a year ago, how safe did you feel expressing your opinions about the government in public?
Base: All Respondents 8706
[1] Very safe 19%[2] Somewhat safe 49%[3] Somewhat unsafe 25%[4] Very unsafe 6%Refused <0.5%
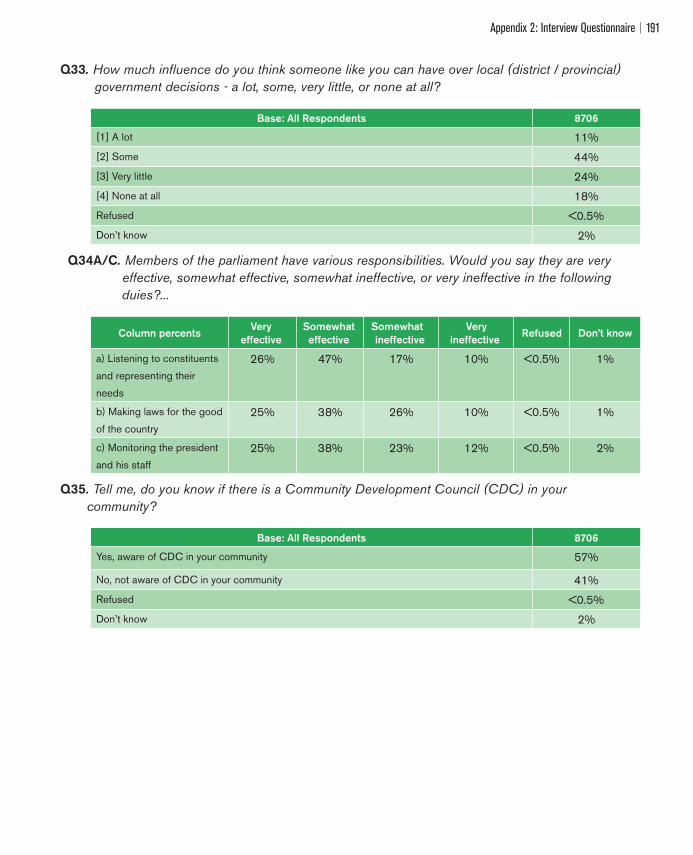
Appendix 2: Interview Questionnaire 191
Q33. How much influence do you think someone like you can have over local (district / provincial) government decisions - a lot, some, very little, or none at all?
Base: All Respondents 8706
[1] A lot 11%[2] Some 44%[3] Very little 24%[4] None at all 18%Refused <0.5%Don’t know 2%
Q34A/C. Members of the parliament have various responsibilities. Would you say they are very effective, somewhat effective, somewhat ineffective, or very ineffective in the following
duies?...
Column percents Very effective
Somewhat effective
Somewhat ineffective
Veryineffective Refused Don’t know
a) Listening to constituents
and representing their
needs
26% 47% 17% 10% <0.5% 1%
b) Making laws for the good
of the country25% 38% 26% 10% <0.5% 1%
c) Monitoring the president
and his staff25% 38% 23% 12% <0.5% 2%
Q35. Tell me, do you know if there is a Community Development Council (CDC) in your community?
Base: All Respondents 8706
Yes, aware of CDC in your community 57%
No, not aware of CDC in your community 41%Refused <0.5%Don’t know 2%
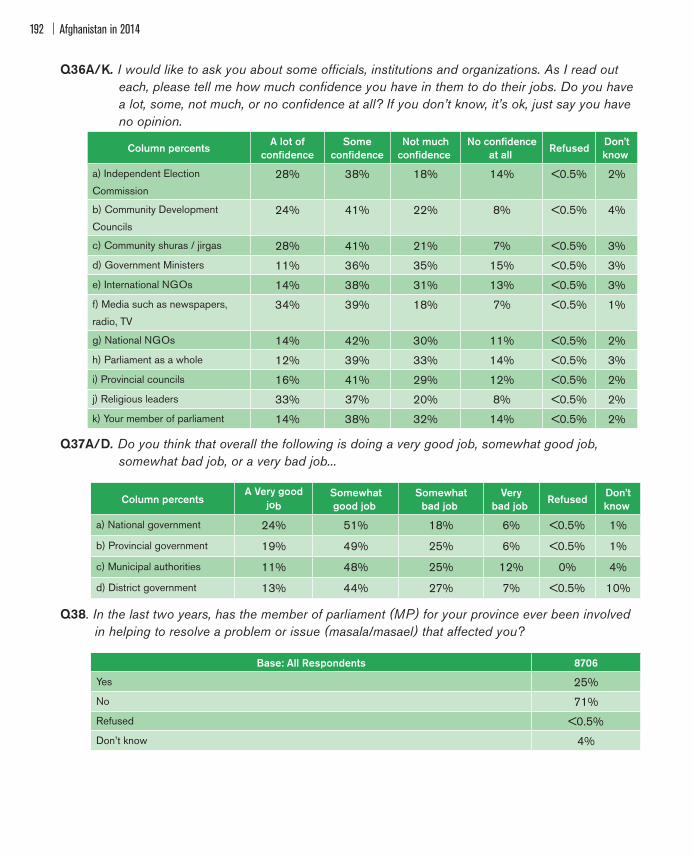
Afghanistan in 2014192
Q36A/K. I would like to ask you about some officials, institutions and organizations. As I read out each, please tell me how much confidence you have in them to do their jobs. Do you have a lot, some, not much, or no confidence at all? If you don’t know, it’s ok, just say you have no opinion.
Column percents A lot ofconfidence
Someconfidence
Not muchconfidence
No confidenceat all Refused Don’t
know
a) Independent Election
Commission28% 38% 18% 14% <0.5% 2%
b) Community Development
Councils24% 41% 22% 8% <0.5% 4%
c) Community shuras / jirgas 28% 41% 21% 7% <0.5% 3%d) Government Ministers 11% 36% 35% 15% <0.5% 3%e) International NGOs 14% 38% 31% 13% <0.5% 3% f) Media such as newspapers,
radio, TV34% 39% 18% 7% <0.5% 1%
g) National NGOs 14% 42% 30% 11% <0.5% 2%h) Parliament as a whole 12% 39% 33% 14% <0.5% 3%i) Provincial councils 16% 41% 29% 12% <0.5% 2%j) Religious leaders 33% 37% 20% 8% <0.5% 2%k) Your member of parliament 14% 38% 32% 14% <0.5% 2%
Q37A/D. Do you think that overall the following is doing a very good job, somewhat good job, somewhat bad job, or a very bad job...
Column percents A Very good
jobSomewhatgood job
Somewhatbad job
Verybad job Refused Don’t
know
a) National government 24% 51% 18% 6% <0.5% 1%
b) Provincial government 19% 49% 25% 6% <0.5% 1%
c) Municipal authorities 11% 48% 25% 12% 0% 4%
d) District government 13% 44% 27% 7% <0.5% 10%
Q38. In the last two years, has the member of parliament (MP) for your province ever been involved in helping to resolve a problem or issue (masala/masael) that affected you?
Base: All Respondents 8706
Yes 25%No 71%Refused <0.5%Don’t know 4%

Appendix 2: Interview Questionnaire 193
Q39. In the last two years, has the provincial governor ever been involved in helping to resolve a problem or issue (masala/masael) that affected you?
Base: All Respondents 8706
Yes 26%No 73%Refused <0.5%Don’t know 1%
Q40. Have you ever personally tried to contact a representative on the provincial council for help in solving any of your personal or community problems in the last 2 years?
Base: All Respondents 8706
Yes 22%
No 78%
Refused <0.5%
Don’t know <0.5%
Q41. How satisfied were you with the result of this contact?
Base: Contacted a representative on the provincial council 1912
[1] Very satisfied 22%[2] Somewhat satisfied 50%[3] Somewhat dissatisfied 19%[4] Very dissatisfied 8%Don’t know <0.5%
Q42. Please tell me if you happened to have voted in the presidential election of 2009 (the previous election) or not?
Base: All Respondents 8706
Yes 52%No 48%
Q43. Did you vote in the parliamentary election of 2010 or not?
Base: All Respondents 8706
Yes 51%No 49%
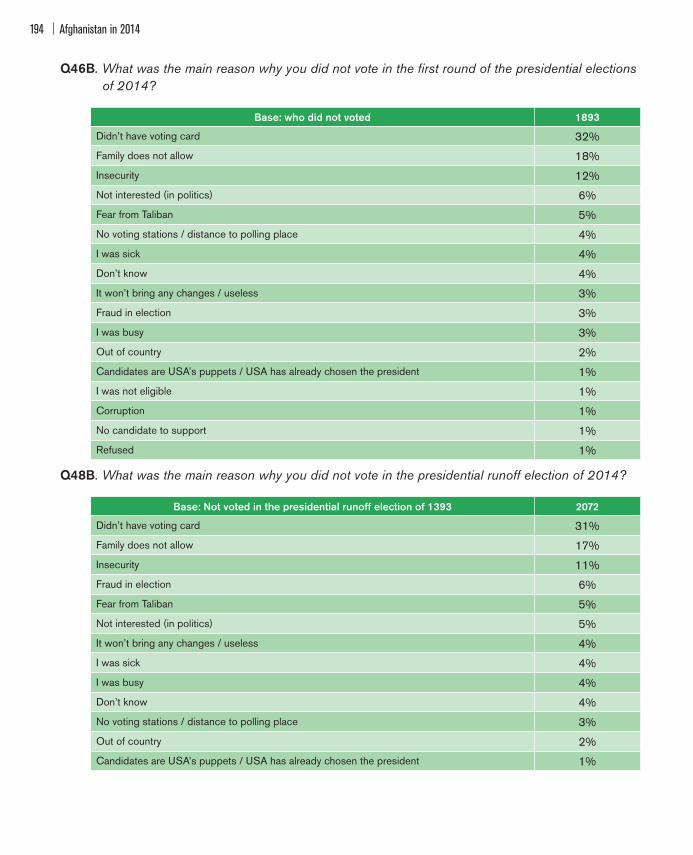
Afghanistan in 2014194
Q46B. What was the main reason why you did not vote in the first round of the presidential elections of 2014?
Base: who did not voted 1893
Didn’t have voting card 32%Family does not allow 18%Insecurity 12%Not interested (in politics) 6%Fear from Taliban 5%No voting stations / distance to polling place 4%I was sick 4%Don’t know 4%It won’t bring any changes / useless 3%Fraud in election 3%I was busy 3%Out of country 2%Candidates are USA’s puppets / USA has already chosen the president 1%I was not eligible 1%Corruption 1%No candidate to support 1%Refused 1%
Q48B. What was the main reason why you did not vote in the presidential runoff election of 2014?
Base: Not voted in the presidential runoff election of 1393 2072
Didn’t have voting card 31%Family does not allow 17%Insecurity 11%Fraud in election 6%Fear from Taliban 5%Not interested (in politics) 5%It won’t bring any changes / useless 4%I was sick 4%I was busy 4%Don’t know 4%No voting stations / distance to polling place 3%Out of country 2%Candidates are USA’s puppets / USA has already chosen the president 1%
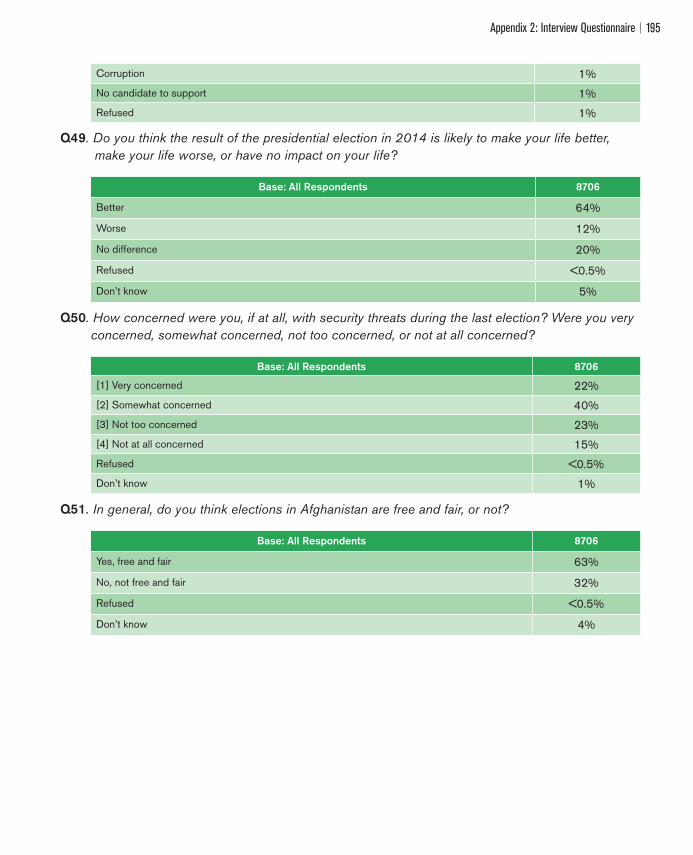
Appendix 2: Interview Questionnaire 195
Corruption 1%No candidate to support 1%Refused 1%
Q49. Do you think the result of the presidential election in 2014 is likely to make your life better, make your life worse, or have no impact on your life?
Base: All Respondents 8706
Better 64%
Worse 12%
No difference 20%
Refused <0.5%
Don’t know 5%
Q50. How concerned were you, if at all, with security threats during the last election? Were you very concerned, somewhat concerned, not too concerned, or not at all concerned?
Base: All Respondents 8706
[1] Very concerned 22%[2] Somewhat concerned 40%[3] Not too concerned 23%[4] Not at all concerned 15%Refused <0.5%Don’t know 1%
Q51. In general, do you think elections in Afghanistan are free and fair, or not?
Base: All Respondents 8706
Yes, free and fair 63%
No, not free and fair 32%
Refused <0.5%
Don’t know 4%
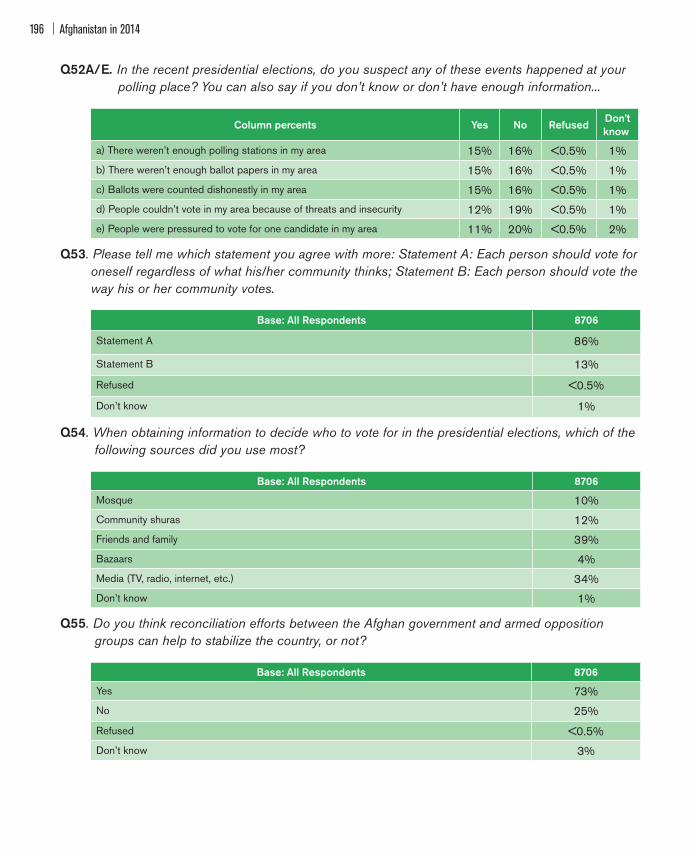
Afghanistan in 2014196
Q52A/E. In the recent presidential elections, do you suspect any of these events happened at your polling place? You can also say if you don’t know or don’t have enough information...
Column percents Yes No Refused Don’tknow
a) There weren’t enough polling stations in my area 15% 16% <0.5% 1%b) There weren’t enough ballot papers in my area 15% 16% <0.5% 1%c) Ballots were counted dishonestly in my area 15% 16% <0.5% 1%d) People couldn’t vote in my area because of threats and insecurity 12% 19% <0.5% 1%e) People were pressured to vote for one candidate in my area 11% 20% <0.5% 2%
Q53. Please tell me which statement you agree with more: Statement A: Each person should vote for oneself regardless of what his/her community thinks; Statement B: Each person should vote the way his or her community votes.
Base: All Respondents 8706
Statement A 86%
Statement B 13%
Refused <0.5%
Don’t know 1%
Q54. When obtaining information to decide who to vote for in the presidential elections, which of the following sources did you use most?
Base: All Respondents 8706
Mosque 10%Community shuras 12%Friends and family 39%Bazaars 4%Media (TV, radio, internet, etc.) 34%Don’t know 1%
Q55. Do you think reconciliation efforts between the Afghan government and armed opposition groups can help to stabilize the country, or not?
Base: All Respondents 8706
Yes 73%No 25%
Refused <0.5%Don’t know 3%

Appendix 2: Interview Questionnaire 197
Q56. In your opinion, what is the main reason that the armed opposition groups are fighting against the Afghan government?
Base: All Respondents 8706
To gain power 16%Presence of foreign troops / international community 16%Don’t know 10%They are supported by Pakistan 9%Too much corruption in the government 6%To support Islam 5%Unemployment / poverty 4%They are dissatisfied from the government 3%To create insecurity 3%They are supported / motivated by foreign countries 3%Lack of attention to their desires 2%Ethnic problems 2%For money 2%Illiteracy 2%They are against democracy 1%Injustice 1%To support drug traffic 1%Moral corruption 1%To destroy our country 1%To establish security 1%
Creating fear / terror 1%They implement law 1%They are brutal / cruel 1%Want to occupy Afghanistan 1%To force foreign forces to withdraw 1%Government / ANSF are too weak to fight them 1%They are against Islam 1%
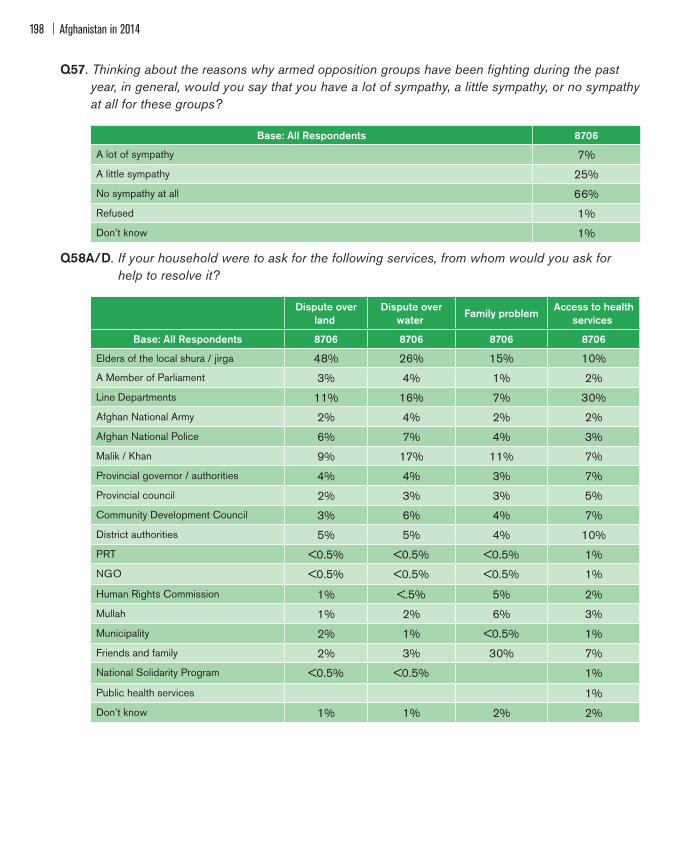
Afghanistan in 2014198
Q57. Thinking about the reasons why armed opposition groups have been fighting during the past year, in general, would you say that you have a lot of sympathy, a little sympathy, or no sympathy at all for these groups?
Base: All Respondents 8706
A lot of sympathy 7%A little sympathy 25%No sympathy at all 66%Refused 1%Don’t know 1%
Q58A/D. If your household were to ask for the following services, from whom would you ask for help to resolve it?
Dispute overland
Dispute overwater Family problem Access to health
services
Base: All Respondents 8706 8706 8706 8706
Elders of the local shura / jirga 48% 26% 15% 10%A Member of Parliament 3% 4% 1% 2%Line Departments 11% 16% 7% 30%Afghan National Army 2% 4% 2% 2%Afghan National Police 6% 7% 4% 3%Malik / Khan 9% 17% 11% 7%Provincial governor / authorities 4% 4% 3% 7%Provincial council 2% 3% 3% 5%Community Development Council 3% 6% 4% 7%District authorities 5% 5% 4% 10%PRT <0.5% <0.5% <0.5% 1%NGO <0.5% <0.5% <0.5% 1%
Human Rights Commission 1% <.5% 5% 2%Mullah 1% 2% 6% 3%Municipality 2% 1% <0.5% 1%Friends and family 2% 3% 30% 7%National Solidarity Program <0.5% <0.5% 1%
Public health services 1%Don’t know 1% 1% 2% 2%

Appendix 2: Interview Questionnaire 199
Q59. In the past two years have you had a dispute or a formal case that you couldn’t settle with the other party and had to go to the Huquq department or village/neighborhood-based shura/jirga to resolve it, or not?
Base: All Respondents 8706
Yes 19%
No 81%
Refused <0.5%
Don’t know <0.5%
Q60. What kind of a case or dispute was it?
Base: Contacted Huquq department or shura / jirga 1660
Dispute over land 42%Family problems 19%Other property dispute, not land 13%Commercial dispute 9%Traffic accident 9%Divorce 5%Robbery 1%
Q61. Were you fully satisfied, somewhat satisfied, or not satisfied with the outcome of the proceedings?
Base: Contacted Huquq department or shura / jirga 1660
Fully 24%Somewhat 50%Not satisfied 17%Not finished yet / still in proceedings 9%Don’t know 1%
Q62. Where have you taken this case or dispute?
Base: Contacted Huquq department or shura / jirga 1660
Huquq department 29%State court 42%
Village, neighborhood based shura / jirga 42%Don’t know 2%

Afghanistan in 2014200
Q63A/D. Tell me do you strongly agree, somewhat agree, somewhat disagree, or strongly disagree with the following statements about the Huquq department...
Column percents Strongly agree
Agreesomewhat
Disagreesomewhat
Strongly disagree Refused Don’t know
a) Local Huquq are fair and
trusted29% 46% 17% 6% <0.5% 2%
b) Local Huquq follow the
local norms and values of
our people
18% 45% 30% 6% <0.5% 2%
c) Local Huquq are
effective at delivering
justice
21% 40% 29% 8% <0.5% 2%
d) Local Huquq resolve
cases quickly and efficiently15% 36% 31% 15% 0% 2%
Q64A/E. Tell me do you strongly agree, somewhat agree, somewhat disagree, or strongly disagree with the following statements about state courts...
Column percents Stronglyagree
Agreesomewhat
Disagree somewhat
Strongly disagree Don’t know
a) State courts are fair and
trusted21% 48% 18% 9% 4%
b) State courts follow the local
norms and values of our people14% 44% 27% 12% 4%
c) State courts are effective at
delivering justice16% 38% 29% 12% 5%
d) State courts resolve cases
timely and promptly12% 35% 31% 17% 5%
e) State courts treat men and
women equally17% 36% 29% 14% 5%
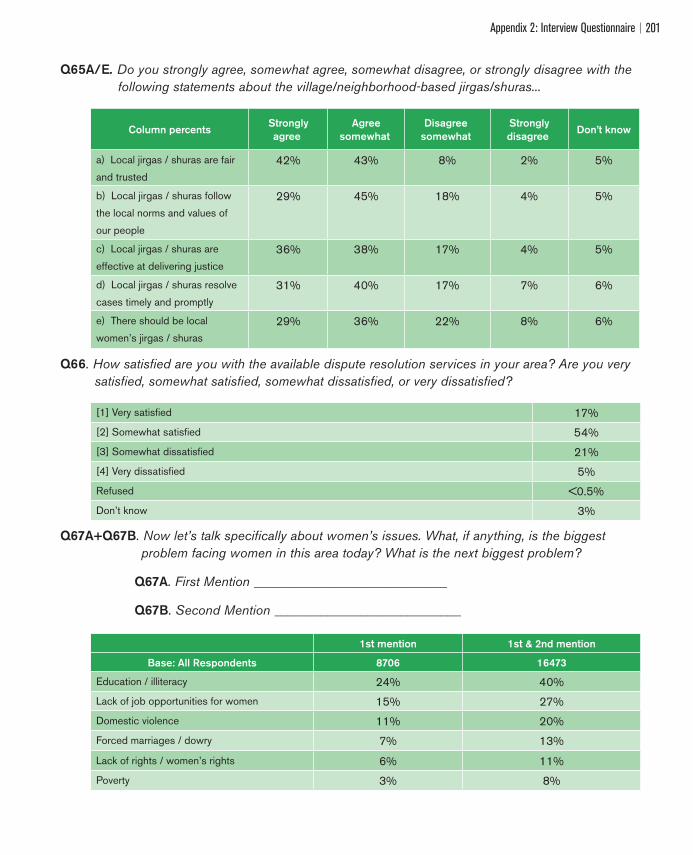
Appendix 2: Interview Questionnaire 201
Q65A/E. Do you strongly agree, somewhat agree, somewhat disagree, or strongly disagree with the following statements about the village/neighborhood-based jirgas/shuras...
Column percents Stronglyagree
Agreesomewhat
Disagree somewhat
Stronglydisagree Don’t know
a) Local jirgas / shuras are fair
and trusted42% 43% 8% 2% 5%
b) Local jirgas / shuras follow
the local norms and values of
our people
29% 45% 18% 4% 5%
c) Local jirgas / shuras are
effective at delivering justice36% 38% 17% 4% 5%
d) Local jirgas / shuras resolve
cases timely and promptly31% 40% 17% 7% 6%
e) There should be local
women’s jirgas / shuras29% 36% 22% 8% 6%
Q66. How satisfied are you with the available dispute resolution services in your area? Are you very satisfied, somewhat satisfied, somewhat dissatisfied, or very dissatisfied?
[1] Very satisfied 17%[2] Somewhat satisfied 54%[3] Somewhat dissatisfied 21%[4] Very dissatisfied 5%Refused <0.5%Don’t know 3%
Q67A+Q67B. Now let’s talk specifically about women’s issues. What, if anything, is the biggest problem facing women in this area today? What is the next biggest problem?
Q67A. First Mention _____________________________
Q67B. Second Mention ____________________________
1st mention 1st & 2nd mention
Base: All Respondents 8706 16473
Education / illiteracy 24% 40%Lack of job opportunities for women 15% 27%Domestic violence 11% 20%Forced marriages / dowry 7% 13%
Lack of rights / women’s rights 6% 11%Poverty 3% 8%
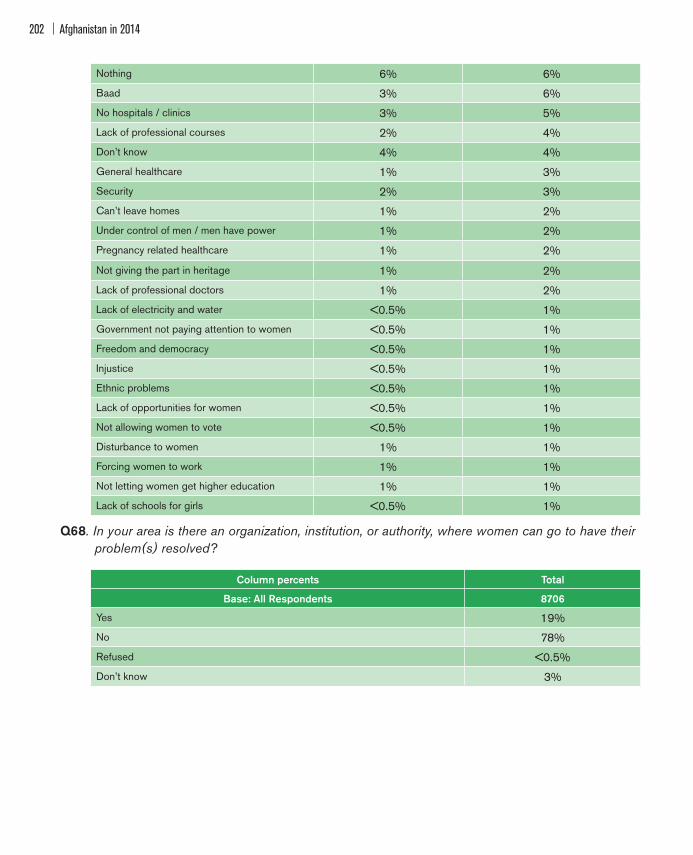
Afghanistan in 2014202
Nothing 6% 6%Baad 3% 6%No hospitals / clinics 3% 5%Lack of professional courses 2% 4%Don’t know 4% 4%General healthcare 1% 3%Security 2% 3%Can’t leave homes 1% 2%Under control of men / men have power 1% 2%Pregnancy related healthcare 1% 2%
Not giving the part in heritage 1% 2%Lack of professional doctors 1% 2%Lack of electricity and water <0.5% 1%Government not paying attention to women <0.5% 1%Freedom and democracy <0.5% 1%Injustice <0.5% 1%Ethnic problems <0.5% 1%Lack of opportunities for women <0.5% 1%Not allowing women to vote <0.5% 1%Disturbance to women 1% 1%Forcing women to work 1% 1%Not letting women get higher education 1% 1%Lack of schools for girls <0.5% 1%
Q68. In your area is there an organization, institution, or authority, where women can go to have their problem(s) resolved?
Column percents Total
Base: All Respondents 8706
Yes 19%No 78%Refused <0.5%Don’t know 3%
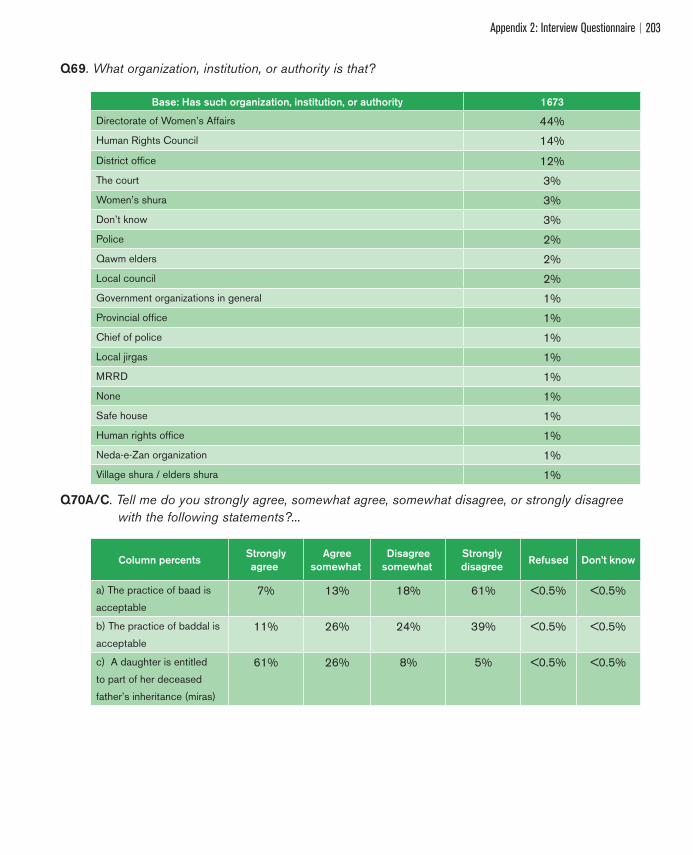
Appendix 2: Interview Questionnaire 203
Q69. What organization, institution, or authority is that?
Base: Has such organization, institution, or authority 1673
Directorate of Women’s Affairs 44%Human Rights Council 14%
District office 12%The court 3%Women’s shura 3%Don’t know 3%Police 2%Qawm elders 2%Local council 2%Government organizations in general 1%Provincial office 1%Chief of police 1%Local jirgas 1%MRRD 1%None 1%Safe house 1%Human rights office 1%Neda-e-Zan organization 1%Village shura / elders shura 1%
Q70A/C. Tell me do you strongly agree, somewhat agree, somewhat disagree, or strongly disagree with the following statements?...
Column percents Stronglyagree
Agreesomewhat
Disagreesomewhat
Strongly disagree Refused Don’t know
a) The practice of baad is
acceptable7% 13% 18% 61% <0.5% <0.5%
b) The practice of baddal is
acceptable11% 26% 24% 39% <0.5% <0.5%
c) A daughter is entitled
to part of her deceased
father’s inheritance (miras)
61% 26% 8% 5% <0.5% <0.5%

Afghanistan in 2014204
Q71A/F. Some people say that women should have the same opportunities as men in education. For the following levels of education, do you agree or disagree with this opinion? Is that strongly or somewhat?...
Column percents Stronglyagree
Agreesomewhat
Disagree somewhat
Stronglydisagreed Refused Don’t know
a) Islamic madrasa
education69% 23% 6% 2% <0.5% <0.5%
b) Primary school 57% 27% 11% 5% <0.5% <0.5%c) High school 55% 27% 11% 7% <0.5% 1% d) University in your
province45% 27% 15% 12% <0.5% <0.5%
e) Studying in another
province20% 25% 27% 28% <0.5% 1%
f) Studying abroad on
scholarship15% 18% 23% 43% <0.5% 1%
Q72. Some people say that women should be allowed to work outside the home, while others say that women should not be allowed to work outside of the home. What is your opinion on this?
Base: All Respondents 8706
Women should be allowed to work outside the home 68%Women should not be allowed to work outside the home 30%Refused <0.5%Don’t know 2%
Q73A/E. What about where women can work. For each of these places, do you agree or disagree that it is acceptable for women to work in these places? Strongly or somewhat?...
Column percents Strongly agree
Agree somewhat
Disagree somewhat
Strongly disagreed
Refused Don’tknow
a) Government offices 41% 29% 14% 15% <0.5% 1%b) Non-government
organizations (NGO)17% 24% 29% 30% <0.5% 1%
c) Schools 61% 22% 9% 7% <0.5% 1%d) Hospitals or clinics 55% 25% 10% 8% <0.5% 1%e) Army / police 16% 26% 25% 31% <0.5% 1%
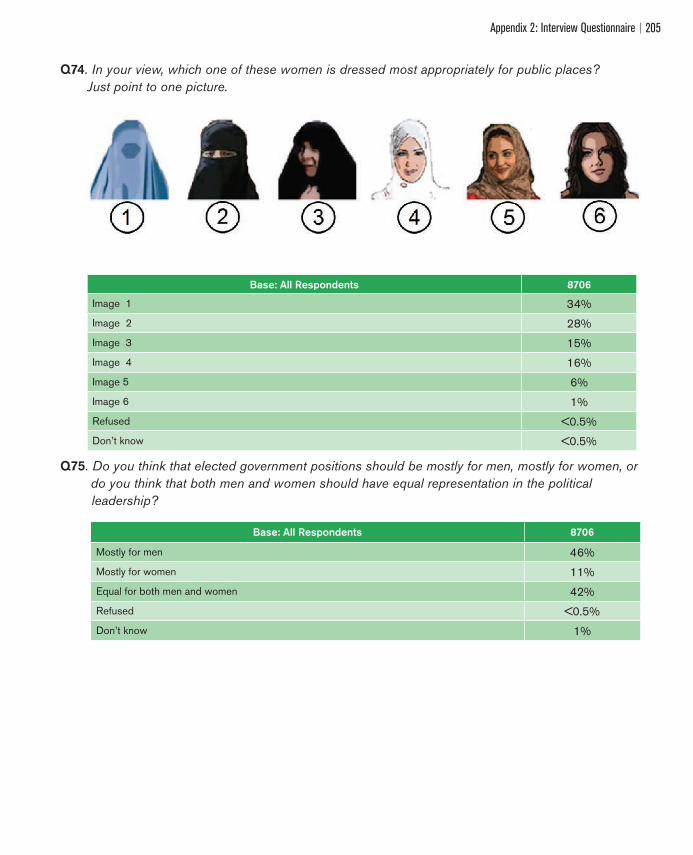
Appendix 2: Interview Questionnaire 205
Q74. In your view, which one of these women is dressed most appropriately for public places? Just point to one picture.
Base: All Respondents 8706
Image 1 34%Image 2 28%Image 3 15%Image 4 16%Image 5 6%Image 6 1%Refused <0.5%Don’t know <0.5%
Q75. Do you think that elected government positions should be mostly for men, mostly for women, or do you think that both men and women should have equal representation in the political
leadership?
Base: All Respondents 8706
Mostly for men 46%Mostly for women 11%Equal for both men and women 42%Refused <0.5%Don’t know 1%
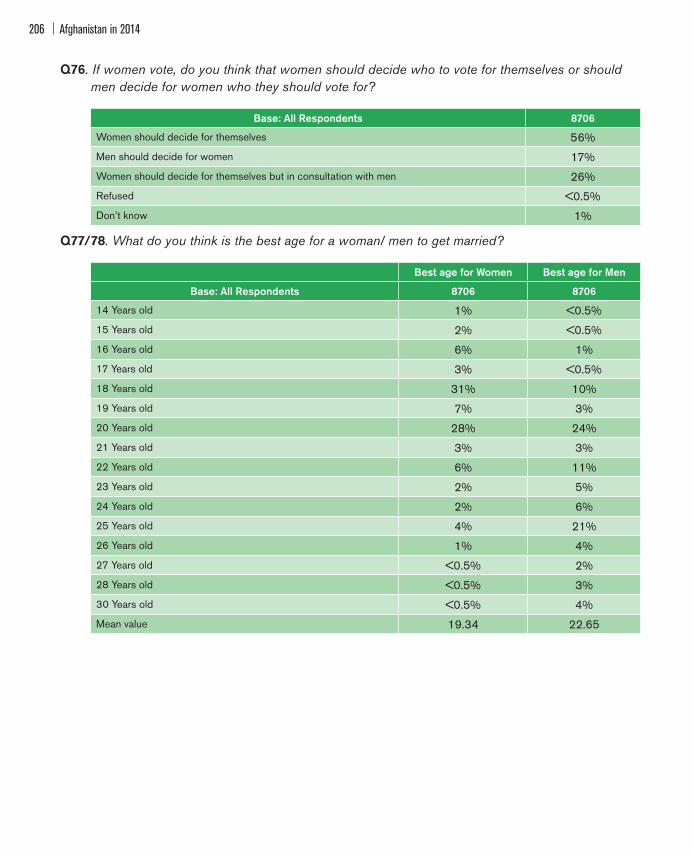
Afghanistan in 2014206
Q76. If women vote, do you think that women should decide who to vote for themselves or should men decide for women who they should vote for?
Base: All Respondents 8706
Women should decide for themselves 56%Men should decide for women 17%Women should decide for themselves but in consultation with men 26%Refused <0.5%Don’t know 1%
Q77/78. What do you think is the best age for a woman/ men to get married?
Best age for Women Best age for Men
Base: All Respondents 8706 8706
14 Years old 1% <0.5%15 Years old 2% <0.5%16 Years old 6% 1%17 Years old 3% <0.5%18 Years old 31% 10%19 Years old 7% 3%20 Years old 28% 24%21 Years old 3% 3%22 Years old 6% 11%23 Years old 2% 5%24 Years old 2% 6%25 Years old 4% 21%26 Years old 1% 4%27 Years old <0.5% 2%28 Years old <0.5% 3%30 Years old <0.5% 4%Mean value 19.34 22.65

Appendix 2: Interview Questionnaire 207
Q79. Which of these two qualities do you think is more important for a child to learn at home obedience or creativity? By creativity, we mean use of imagination to create new ideas and
things.
Base: All Respondents 8706
Obedience, following traditional rules 47%Creativity, creating new ideas 34%Refused <0.5%Don’t know 1%
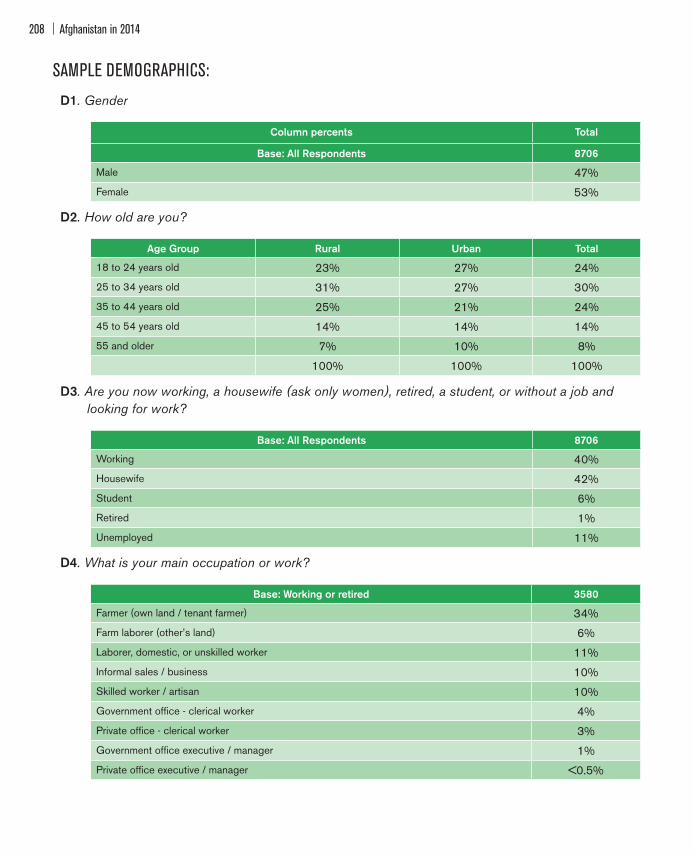
Afghanistan in 2014208
SAMPLE DEMOGRAPHICS:
D1. Gender
Column percents Total
Base: All Respondents 8706
Male 47%Female 53%
D2. How old are you?
Age Group Rural Urban Total
18 to 24 years old 23% 27% 24%25 to 34 years old 31% 27% 30%35 to 44 years old 25% 21% 24%45 to 54 years old 14% 14% 14%55 and older 7% 10% 8%
100% 100% 100%
D3. Are you now working, a housewife (ask only women), retired, a student, or without a job and looking for work?
Base: All Respondents 8706
Working 40%Housewife 42%Student 6%Retired 1%Unemployed 11%
D4. What is your main occupation or work?
Base: Working or retired 3580
Farmer (own land / tenant farmer) 34%Farm laborer (other’s land) 6%Laborer, domestic, or unskilled worker 11%Informal sales / business 10%Skilled worker / artisan 10%Government office - clerical worker 4%Private office - clerical worker 3%Government office executive / manager 1%Private office executive / manager <0.5%
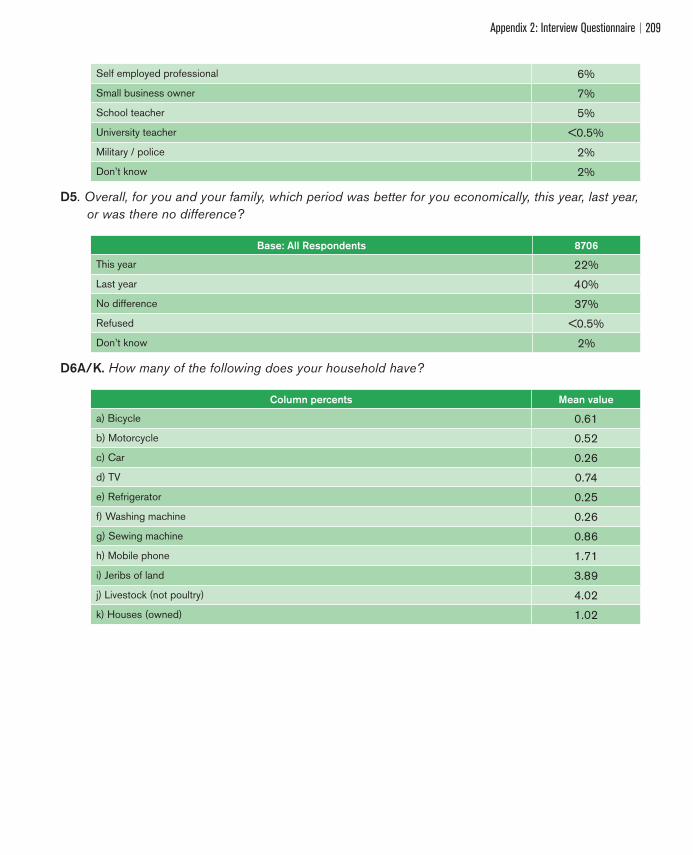
Appendix 2: Interview Questionnaire 209
Self employed professional 6%Small business owner 7%School teacher 5%University teacher <0.5%Military / police 2%Don’t know 2%
D5. Overall, for you and your family, which period was better for you economically, this year, last year, or was there no difference?
Base: All Respondents 8706
This year 22%Last year 40%No difference 37%Refused <0.5%Don’t know 2%
D6A/K. How many of the following does your household have?
Column percents Mean value
a) Bicycle 0.61b) Motorcycle 0.52c) Car 0.26d) TV 0.74e) Refrigerator 0.25f) Washing machine 0.26g) Sewing machine 0.86h) Mobile phone 1.71i) Jeribs of land 3.89j) Livestock (not poultry) 4.02k) Houses (owned) 1.02
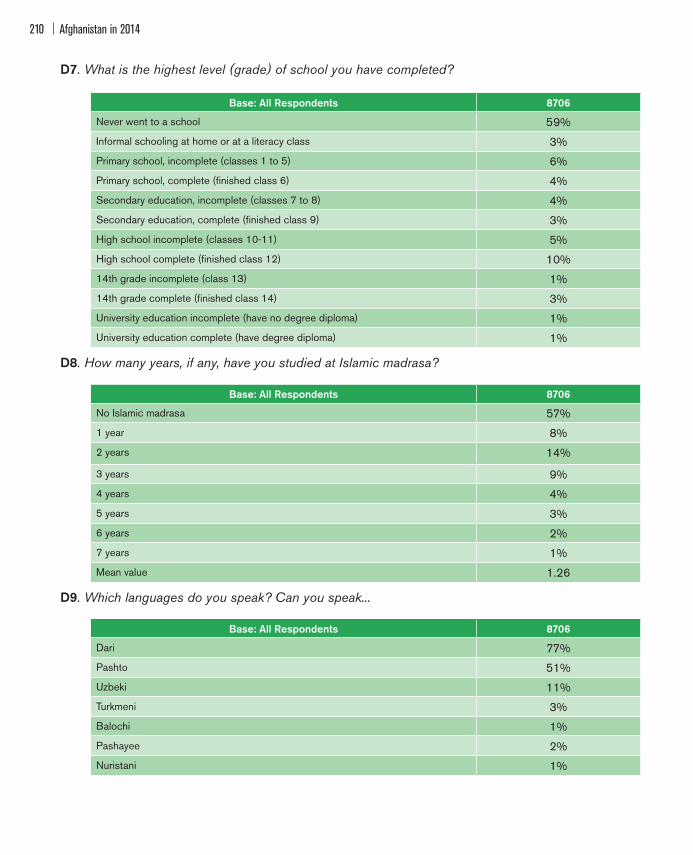
Afghanistan in 2014210
D7. What is the highest level (grade) of school you have completed?
Base: All Respondents 8706
Never went to a school 59%Informal schooling at home or at a literacy class 3%Primary school, incomplete (classes 1 to 5) 6%Primary school, complete (finished class 6) 4%Secondary education, incomplete (classes 7 to 8) 4%Secondary education, complete (finished class 9) 3%High school incomplete (classes 10-11) 5%High school complete (finished class 12) 10%14th grade incomplete (class 13) 1%14th grade complete (finished class 14) 3%University education incomplete (have no degree diploma) 1%University education complete (have degree diploma) 1%
D8. How many years, if any, have you studied at Islamic madrasa?
Base: All Respondents 8706
No Islamic madrasa 57%1 year 8%2 years 14%
3 years 9%4 years 4%5 years 3%6 years 2%7 years 1%Mean value 1.26
D9. Which languages do you speak? Can you speak...
Base: All Respondents 8706
Dari 77%Pashto 51%Uzbeki 11%Turkmeni 3%Balochi 1%Pashayee 2%Nuristani 1%
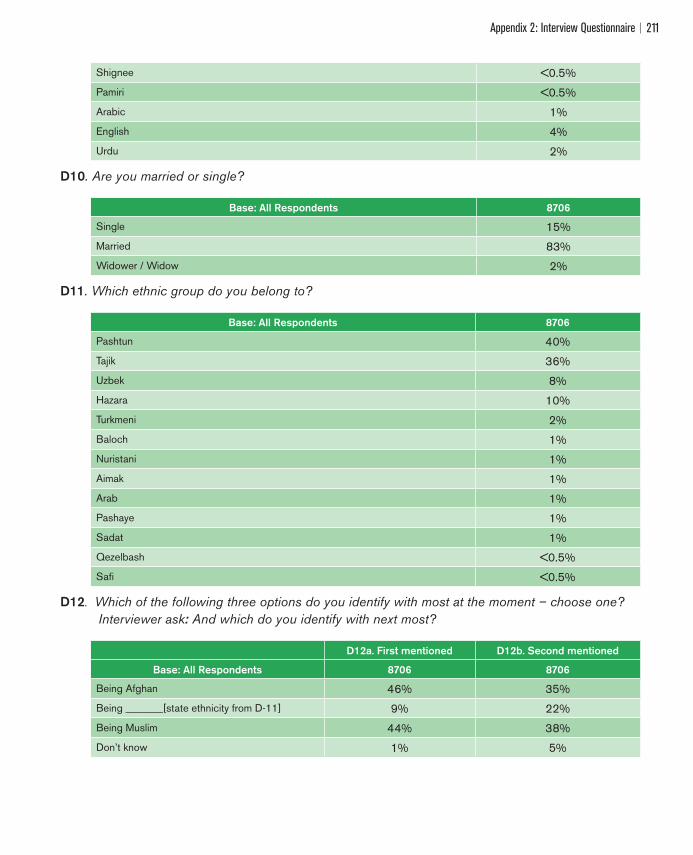
Appendix 2: Interview Questionnaire 211
Shignee <0.5%Pamiri <0.5%Arabic 1%English 4%Urdu 2%
D10. Are you married or single?
Base: All Respondents 8706
Single 15%Married 83%Widower / Widow 2%
D11. Which ethnic group do you belong to?
Base: All Respondents 8706
Pashtun 40%Tajik 36%Uzbek 8%Hazara 10%Turkmeni 2%Baloch 1%Nuristani 1%Aimak 1%Arab 1%Pashaye 1%Sadat 1% Qezelbash <0.5%Safi <0.5%
D12. Which of the following three options do you identify with most at the moment – choose one? Interviewer ask: And which do you identify with next most?
D12a. First mentioned D12b. Second mentioned
Base: All Respondents 8706 8706
Being Afghan 46% 35%Being _______[state ethnicity from D-11] 9% 22%Being Muslim 44% 38%Don’t know 1% 5%
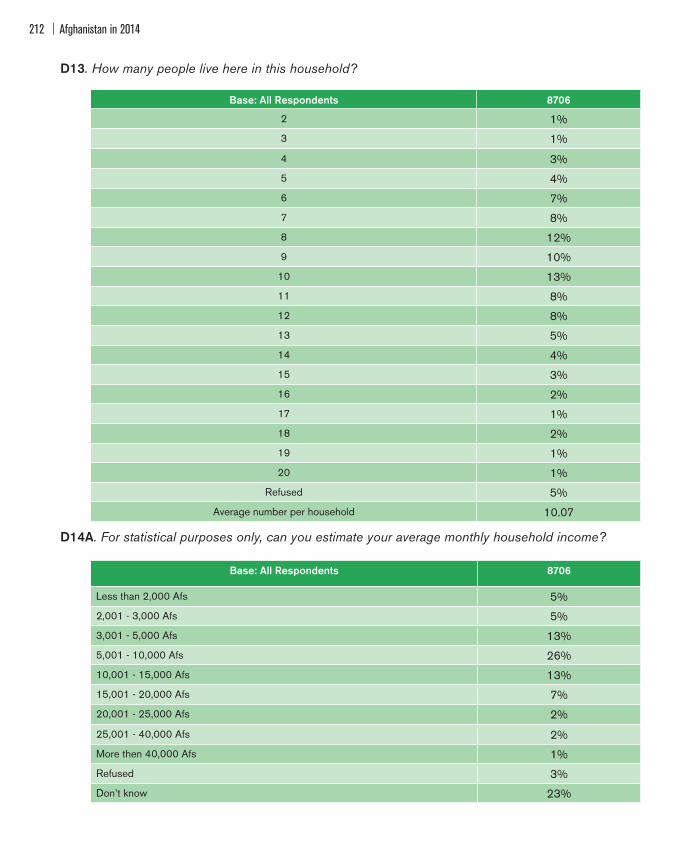
Afghanistan in 2014212
D13. How many people live here in this household?
Base: All Respondents 8706
2 1%3 1%
4 3%5 4%6 7%7 8%8 12%9 10%
10 13%11 8%12 8%13 5%14 4%15 3%16 2%17 1%18 2%19 1%20 1%
Refused 5%Average number per household 10.07
D14A. For statistical purposes only, can you estimate your average monthly household income?
Base: All Respondents 8706
Less than 2,000 Afs 5%2,001 - 3,000 Afs 5%3,001 - 5,000 Afs 13%5,001 - 10,000 Afs 26%10,001 - 15,000 Afs 13%15,001 - 20,000 Afs 7%20,001 - 25,000 Afs 2%
25,001 - 40,000 Afs 2%More then 40,000 Afs 1%Refused 3%Don’t know 23%
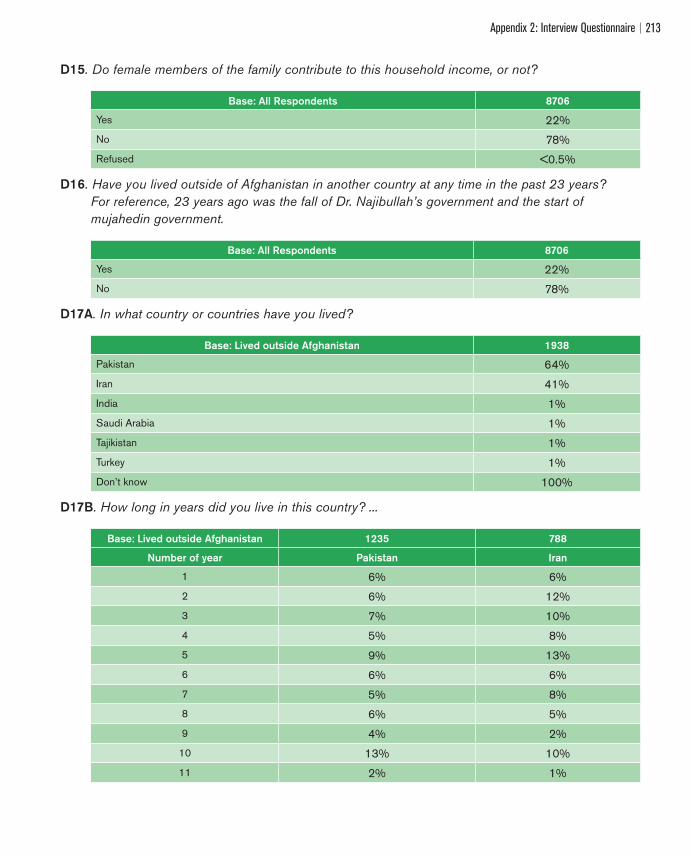
Appendix 2: Interview Questionnaire 213
D15. Do female members of the family contribute to this household income, or not?
Base: All Respondents 8706
Yes 22%No 78%Refused <0.5%
D16. Have you lived outside of Afghanistan in another country at any time in the past 23 years? For reference, 23 years ago was the fall of Dr. Najibullah’s government and the start of mujahedin government.
Base: All Respondents 8706
Yes 22%No 78%
D17A. In what country or countries have you lived?
Base: Lived outside Afghanistan 1938
Pakistan 64%Iran 41%India 1%Saudi Arabia 1%Tajikistan 1%Turkey 1%Don’t know 100%
D17B. How long in years did you live in this country? ...
Base: Lived outside Afghanistan 1235 788
Number of year Pakistan Iran
1 6% 6%2 6% 12%3 7% 10%4 5% 8%5 9% 13%6 6% 6%7 5% 8%8 6% 5%9 4% 2%
10 13% 10%11 2% 1%

Afghanistan in 2014214
12 6% 4%13 3% 2%14 3% 1%15 4% 2%16 2% 1%17 1% 1%18 2% 2%
20 4% 3%25 1% 1%
D17C. What is the main reason you left?
Base: Lived outside Afghanistan 1235 788
Pakistan Iran
Lack of jobs 15% 44%Lack of healthcare 2% 1%War 38% 22%Lack of security 33% 20%Economic issues 2% 4%To meet family 1% 1%Political instability 2% 1%Education 1% Existence of Taliban 1% 1%Personal enmity 1% Refugee / took shelter 1% 1%Don’t know 2% 3%
D18. Inside Afghanistan, have you ever moved from one province to another province in the past 23 years? For reference, 23 years ago was the fall of Dr. Najibullah’s government and the start of Mujahedin government?
Base: All Respondents 8706
Yes 14%
No 85%

Appendix 2: Interview Questionnaire 215
D19A. In what provinces have you lived?
Base: Moved from one province to another province 1262
Kabul 30%Balkh 12%Nangarhar 10%Kandahar 9%Herat 9%Kunduz 5%Panjshir 5%Ghazni 4%Badakhshan 3%Logar 3%Parwan 3%Laghman 3%Helmand 3%Faryab 2%Takhar 2%Baghlan 2%Khost 2%Wardak 2%Kunar 2%Nimroz 2%Farah 2%Jawzjan 1%Kapisa 1%Uruzghan 1%Badghis 1%Bamyan 1%Samangan 1%
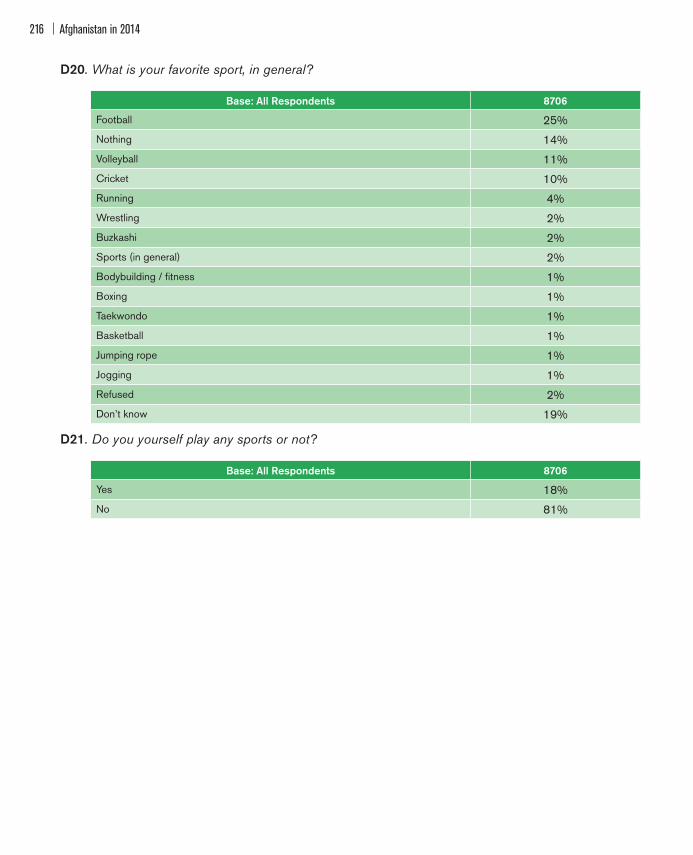
Afghanistan in 2014216
D20. What is your favorite sport, in general?
Base: All Respondents 8706
Football 25%Nothing 14%Volleyball 11%Cricket 10%Running 4%Wrestling 2%Buzkashi 2%Sports (in general) 2%Bodybuilding / fitness 1%Boxing 1%Taekwondo 1%Basketball 1%Jumping rope 1%Jogging 1%Refused 2%Don’t know 19%
D21. Do you yourself play any sports or not?
Base: All Respondents 8706
Yes 18%No 81%
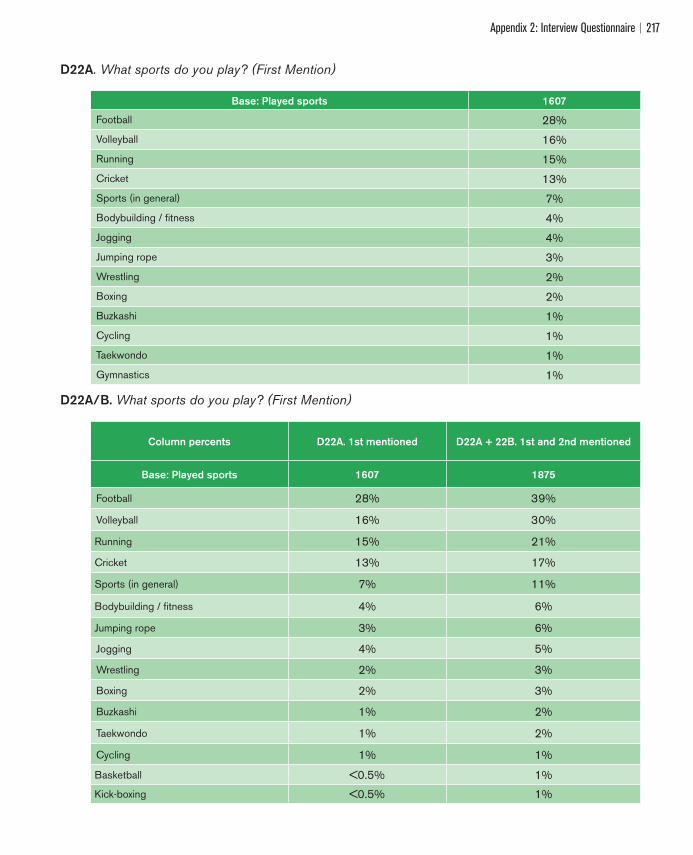
Appendix 2: Interview Questionnaire 217
D22A. What sports do you play? (First Mention)
Base: Played sports 1607
Football 28%Volleyball 16%Running 15%Cricket 13%Sports (in general) 7%Bodybuilding / fitness 4%Jogging 4%Jumping rope 3%Wrestling 2%Boxing 2%Buzkashi 1%Cycling 1%Taekwondo 1%Gymnastics 1%
D22A/B. What sports do you play? (First Mention)
Column percents D22A. 1st mentioned D22A + 22B. 1st and 2nd mentioned
Base: Played sports 1607 1875
Football 28% 39%
Volleyball 16% 30%
Running 15% 21%
Cricket 13% 17%
Sports (in general) 7% 11%
Bodybuilding / fitness 4% 6%
Jumping rope 3% 6%
Jogging 4% 5%
Wrestling 2% 3%
Boxing 2% 3%
Buzkashi 1% 2%
Taekwondo 1% 2%
Cycling 1% 1%
Basketball <0.5% 1%Kick-boxing <0.5% 1%

Afghanistan in 2014218
D23. In the past month, how often did you play a sport of any kind?
Column percents Total:
Base: Played sports 1607
Every day 36%
Several days a week 47%
Once, or just a few times 15%
Never 1%
Don’t know 1%
D24. In general in your life, would you say you are very happy, somewhat happy, not very happy or not at all happy?
Column percents Total:
Base: All Respondents 8706
[1] Very happy 33%
[2] Somewhat happy 45%
[3] Not very happy 18%
[4] Not at all happy 3%
Refused <0.5%
Don’t know <0.5%

Appendix 2: Interview Questionnaire 219
RECORD THE TIME (USING 24 HOUR CLOCK) INTERVIEW WAS COMPLETED AND THE LENGTH OF THE INTERVIEW (M-16 AND M-17)Read Closing Statement to the Respondent:
“Thank you for participating in our survey. Do you have any questions? In the next few days my supervisor may contact you to evaluate the quality of my work and answer any other questions you may have. To help him do that, could I have your name and address?”
Respondent Information: Name: ____________________
Address: ____________________
Interviewer Certi"cation: “I certify that I have completed this interview according to the instructions provided me by the Afghan Center for Socio-economic and Opinion Research.”
___________________ _______________
Signed Date
To be completed by supervisor:
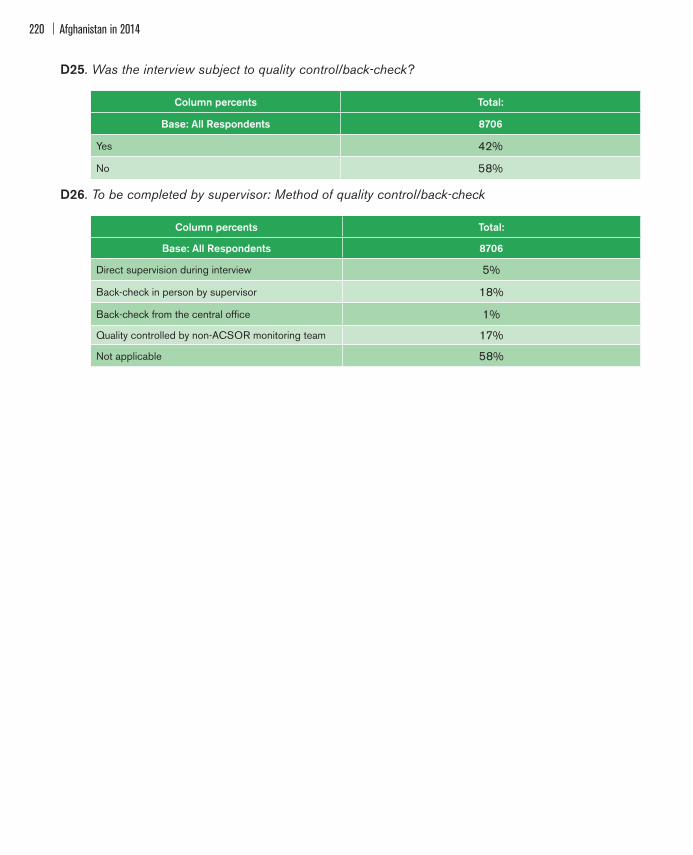
Afghanistan in 2014220
D25. Was the interview subject to quality control/back-check?
Column percents Total:
Base: All Respondents 8706
Yes 42%
No 58%
D26. To be completed by supervisor: Method of quality control/back-check
Column percents Total:
Base: All Respondents 8706
Direct supervision during interview 5%
Back-check in person by supervisor 18%
Back-check from the central office 1%
Quality controlled by non-ACSOR monitoring team 17%
Not applicable 58%