
Genomic Profiling Reveals Alternative Genetic Pathways of Prostate Tumorigenesis
8
2007;67:8504-8510. Cancer Res Jacques Lapointe, Chunde Li, Craig P. Giacomini, et al. Prostate Tumorigenesis Genomic Profiling Reveals Alternative Genetic Pathways of Updated version http://cancerres.aacrjournals.org/content/67/18/8504 Access the most recent version of this article at: Material Supplementary http://cancerres.aacrjournals.org/content/suppl/2007/09/17/67.18.8504.DC1.html Access the most recent supplemental material at: Cited Articles http://cancerres.aacrjournals.org/content/67/18/8504.full.html#ref-list-1 This article cites by 36 articles, 21 of which you can access for free at: Citing articles http://cancerres.aacrjournals.org/content/67/18/8504.full.html#related-urls This article has been cited by 18 HighWire-hosted articles. Access the articles at: E-mail alerts related to this article or journal. Sign up to receive free email-alerts Subscriptions Reprints and . [email protected] Department at To order reprints of this article or to subscribe to the journal, contact the AACR Publications Permissions . [email protected] Department at To request permission to re-use all or part of this article, contact the AACR Publications Research. on February 4, 2014. © 2007 American Association for Cancer cancerres.aacrjournals.org Downloaded from Research. on February 4, 2014. © 2007 American Association for Cancer cancerres.aacrjournals.org Downloaded from
Transcript of Genomic Profiling Reveals Alternative Genetic Pathways of Prostate Tumorigenesis

2007;67:8504-8510. Cancer Res Jacques Lapointe, Chunde Li, Craig P. Giacomini, et al. Prostate TumorigenesisGenomic Profiling Reveals Alternative Genetic Pathways of
Updated version
http://cancerres.aacrjournals.org/content/67/18/8504
Access the most recent version of this article at:
Material
Supplementary
http://cancerres.aacrjournals.org/content/suppl/2007/09/17/67.18.8504.DC1.html
Access the most recent supplemental material at:
Cited Articles
http://cancerres.aacrjournals.org/content/67/18/8504.full.html#ref-list-1
This article cites by 36 articles, 21 of which you can access for free at:
Citing articles
http://cancerres.aacrjournals.org/content/67/18/8504.full.html#related-urls
This article has been cited by 18 HighWire-hosted articles. Access the articles at:
E-mail alerts related to this article or journal.Sign up to receive free email-alerts
Subscriptions
Reprints and
To order reprints of this article or to subscribe to the journal, contact the AACR Publications
Permissions
To request permission to re-use all or part of this article, contact the AACR Publications
Research. on February 4, 2014. © 2007 American Association for Cancercancerres.aacrjournals.org Downloaded from
Research. on February 4, 2014. © 2007 American Association for Cancercancerres.aacrjournals.org Downloaded from

Genomic Profiling Reveals Alternative Genetic Pathways of
Prostate Tumorigenesis
Jacques Lapointe,1,2Chunde Li,
6Craig P. Giacomini,
1Keyan Salari,
1,3Stephanie Huang,
1Pei Wang,
5
Michelle Ferrari,2Tina Hernandez-Boussard,
4James D. Brooks,
2and Jonathan R. Pollack
1
Departments of 1Pathology, 2Urology, 3Genetics, and 4Biochemistry, Stanford University, Stanford, California; 5Division of Public HealthSciences, Fred Hutchinson Cancer Research Center, Seattle, Washington; and 6Department of Oncology-Pathology, KarolinskaInstitutet, and Department of Oncology, Karolinska University Hospital, Stockholm, Sweden
Abstract
Prostate cancer is clinically heterogeneous, ranging fromindolent to lethal disease. Expression profiling previouslydefined three subtypes of prostate cancer, one (subtype-1)linked to clinically favorable behavior, and the others(subtypes-2 and -3) linked with a more aggressive form ofthe disease. To explore disease heterogeneity at the genomiclevel, we carried out array-based comparative genomichybridization (array CGH) on 64 prostate tumor specimens,including 55 primary tumors and 9 pelvic lymph nodemetastases. Unsupervised cluster analysis of DNA copynumber alterations (CNA) identified recurrent aberrations,including a 6q15-deletion group associated with subtype-1gene expression patterns and decreased tumor recurrence.Supervised analysis further disclosed distinct patterns ofCNA among gene-expression subtypes, where subtype-1tumors exhibited characteristic deletions at 5q21 and 6q15,and subtype-2 cases harbored deletions at 8p21 (NKX3-1) and21q22 (resulting in TMPRSS2-ERG fusion). Lymph node meta-stases, predominantly subtype-3, displayed overall higherfrequencies of CNA, and in particular gains at 8q24 (MYC)and 16p13, and loss at 10q23 (PTEN) and 16q23. Our findingsreveal that prostate cancers develop via a limited number ofalternative preferred genetic pathways. The resultant molec-ular genetic subtypes provide a new framework for investi-gating prostate cancer biology and explain in part the clinicalheterogeneity of the disease. [Cancer Res 2007;67(18):8504–10]
Introduction
Prostate cancer is the most frequently diagnosed cancer amongmen in the United States, with one in six men being diagnosed intheir lifetime (1). Prostate cancers display a range of clinicalbehavior, from slow-growing tumors of no clinical significance toaggressively metastatic and lethal disease. Although therapies havebeen well documented to improve prostate cancer survival, thereis a growing consensus that a large subset of patients do notrequire aggressive treatment (2). A critical question facing patientsand their treating physicians is which localized prostate cancers
require aggressive therapy, with the attendant risks of urinary andsexual dysfunction, and which can be followed safely. The observedclinical heterogeneity of prostate cancer is likely attributable inlarge part to underlying molecular heterogeneity, and an improvedunderstanding of molecular variation might, in the future, informdecisions of whether and how aggressively to treat.
Numerous molecular alterations have been implicated inprostate cancer initiation or progression, and some correlate withclinical outcome and have been proposed as surrogate markers ofdisease risk or prognosis. Germ-line mutations of several geneshave been found in a relatively small subset of hereditary prostatecancers, although most do not seem to be commonly involved insporadic tumors (3). Loss of expression of pi-class glutathionetransferase, due to extensive promoter hypermethylation, is foundin most prostate cancers and is also seen in many prostate cancerprecursor lesions [prostatic intraepithelial neoplasia (PIN); ref. 4].Likewise, allelic loss of chromosome 8p has been observed fre-quently in localized prostate cancers and has also been reported inPIN. Recently, fusion of the androgen-regulated gene TMPRSS2 toETS family oncogenic transcription factors (most frequently ERG)has been identified as a common rearrangement in prostate cancer(5) and may be associated with aggressive tumor features (6).
DNA copy number alterations (CNA) have been extensivelycharacterized in prostate cancers and include recurrent regions ofloss, indicating the locations of either known or candidate prostatecancer tumor suppressor genes (TSG), such as 13q (RB1), 10q(PTEN), 16q (CDH1 ; E-cadherin), 6q, 5q (APC), 2q, and 18q(SMAD4), as well as regions of recurrent gains at 8q (MYC) and 7,among others (3, 7). Overexpression of the androgen receptor (AR)and AR gene amplification have also been observed in late,hormone-refractory cancer (8). Most of these molecular andcytogenetic alterations have been found to occur with increasedfrequency in tumors of high histologic grade, advanced stage, andwith clinical disease progression. Based on these observations,prostate carcinogenesis has been proposed to occur as a result of astepwise accumulation of genetic alterations that correlate withdisease progression (7).
In previous studies, we explored molecular variation in prostatetumors by gene-expression profiling (9). Unsupervised hierarchicalcluster analysis identified three subtypes of prostate cancer notpreviously recognized or distinguishable histologically, based ondifferent gene expression patterns. One of the subtypes, subtype-1,was notable for its clinically favorable behavior, where scoring twoimmunohistochemical (IHC)-based surrogate markers for thissubtype (i.e., AZGP1+/MUC1�) predicted favorable tumor-freesurvival in a separate cohort of patients, independent of pathologicstage, Gleason grade, and preoperative serum prostate-specificantigen (PSA) levels. Whether these subtypes represent stagesalong a linear model of prostate carcinogenesis and progression or
Note: Supplementary data for this article are available at Cancer Research Online(http://cancerres.aacrjournals.org/).
J.D. Brooks and J.R. Pollack share senior authorship.Current address for J. Lapointe: Urology Division, Department of Surgery, McGill
University, Montreal, Quebec, Canada.Requests for reprints: Jonathan R. Pollack, Department of Pathology, Stanford
University School of Medicine, CCSR-3245A, 269 Campus Drive, Stanford, CA 94305-5176. Phone: 650-736-1987; Fax: 650-736-0073; E-mail: [email protected].
I2007 American Association for Cancer Research.doi:10.1158/0008-5472.CAN-07-0673
Cancer Res 2007; 67: (18). September 15, 2007 8504 www.aacrjournals.org
Research Article
Research. on February 4, 2014. © 2007 American Association for Cancercancerres.aacrjournals.org Downloaded from
distinct molecular genetic entities that arise independently iscurrently unknown. To further investigate the biological under-pinnings of disease heterogeneity, and in particular of the threegene-expression subtypes, we did array-based comparative genomichybridization (array CGH) profiling of genomic DNA CNAs atsubmegabase resolution.
Materials and Methods
Specimens. Freshly frozen prostate surgical specimens, scalpel-dissectedto enrich for tumor cells, were described in Lapointe et al. (9), where
detailed pathologic and clinical data are also available. Specimens were
collected with Institutional Review Board approval. Genomic DNA was
isolated from 64 samples, including 55 primary tumors and 9 unmatchedpelvic lymph node metastases ( from aborted surgeries), by back-extraction
from the TRIzol (Invitrogen) organic phase according to the manufacturer’s
protocol.Array CGH. cDNA microarrays for CGH were obtained from the Stanford
Functional Genomics Facility and included 39,632 human cDNAs,
representing 22,279 mapped human genes [18,049 UniGene clusters (10),
together with 4,230 additional mapped expressed sequence tags notassigned UniGene IDs]. Array CGH was done according to our published
protocols (11, 12). Briefly, 4 Ag of genomic DNA from each tumor specimen
was random primer labeled with Cy5 and cohybridized to the microarray
along with 4 Ag of Cy3-labeled normal male leukocyte reference DNA from asingle donor. Following overnight hybridization and washing, arrays were
imaged using a GenePix 4000B scanner (Molecular Devices). Fluorescence
ratios were extracted using GenePix Pro software, and the data wereuploaded into the Stanford Microarray Database (13) for storage, retrieval,
and analysis. The complete microarray data set is accessible at the Stanford
Microarray Database7 and at GEO8 (accession GSE6469).
Microarray data analysis. For array CGH analysis, background-subtracted fluorescence ratios were normalized by mean centering genes
for each array. We included for subsequent analysis only well-measured
genes with Cy3 reference-channel fluorescence signal intensity at least
1.4-fold above background in at least 50% of samples. Map positions forarrayed cDNA clones were assigned using the National Center for
Biotechnology Information (NCBI) genome assembly, accessed through
the University of California at Santa Cruz (UCSC) genome browser database
(NCBI Build 35). For genes represented by multiple arrayed cDNAs, theaverage fluorescence ratio was used. DNA gains and losses were identified
using the CLuster Along Chromosomes method (CLAC; ref. 14). Briefly, the
CLAC algorithm builds a hierarchical cluster-style tree along eachchromosome, such that neighboring genes with positive and negative
ratios are separated into different clusters. DNA gains and losses are then
called significant based on the height and width of clusters, and a false
discovery rate (FDR) is estimated by comparison to normal-normalhybridization data. Hierarchical cluster analysis (15) of CNAs was done
with Pearson correlation and average linkage clustering using Gene Cluster
software.9 Significant associations between CNAs and gene-expression
subtypes were identified using the Significance Analysis of Microarrays(SAM) two-class method (16), which is based on a modified t statistic and
uses random permutations of class labels to estimate a FDR. For the
hierarchical cluster and SAM analyses, the f22,000 mapped human geneswere first collapsed into the 803 cytoband loci (boundaries defined by NCBI
Build 35) represented by those genes. By integrating information across
neighboring genes, binning provides a useful balance between minimizing
noise and maximizing mapping resolution (17). For each specimen,cytobands displaying gain or loss were defined as those harboring at least
two genes with gain or loss (respectively) called by CLAC. Frequency plots
of CNAs were drawn using CGH Explorer (18). Kaplan-Meier survival
analysis was done using WinSTAT (R. Finch software).
Gene set enrichment analysis. Gene set enrichment analysis (GSEA;ref. 19), done as described (20), was applied to a set of 4,741 variably
expressed named genes from our expression-profiling data set (9). Analyzed
gene sets (see Supplementary Table S1) included MYC up-regulated targets
(Myc Target Gene Database; ref. 21) and cell-cycle–regulated genes (22).Genes with putative ETS binding sites within the first 1-kb upstream
promoter sequence (ref. 23; obtained from the UCSC Genome Browser10)
were defined using MATCH software (ref. 24; default setting to minimize
false positives), applied to a TRANSFAC (25) binding site matrix(V$ELK1_02) for the ETS-family gene ELK1 . Although an ERG binding site
has not yet been empirically defined, all ETS factors share a common core
binding site, GGAA/T (26). To assess enrichment of ETS binding sites, the
absolute value of the GSEA metric (Pearson correlation) was used toconsider both up-regulated and down-regulated targets.
Fluorescence in situ hybridization. Fluorescence in situ hybridization
(FISH) was carried out on paraffin sections of paired tumor-normal tissuefrom selected cases, arrayed in TMA format as described previously (27).
Probe labeling and FISH was done using Vysis reagents according to the
manufacturer’s protocols. Locus-specific BACs mapping to 6q16.1 (CTC-
387L6; BACPAC Resources Centre) and 8p22 (RP11-105D13; Invitrogen),residing within subtype-characteristic deletions, were labeled with Spec-
trumOrange, and cohybridized with SpectrumGreen-labeled centromere
control probes (Vysis) CEP6 and CEP8, respectively. Chromosomal locations
of BACs were validated using normal metaphase slides (data not shown).Slides were counterstained with 4¶,6-diamidino-2-phenylindole (DAPI) and
imaged using an Olympus BX51 fluorescence microscope with Applied
Imaging Cytovision 3.0 software. For each tumor-normal pair, the averageratio of locus specific to centromere FISH signals was tabulated for 50
tumor and 50 normal interphase nuclei, and deletion was defined by a
statistically significant difference (Student’s t test).
Results
To investigate prostate cancer heterogeneity at the genomiclevel, we profiled DNA CNAs by CGH on cDNA microarraysrepresenting f22,000 mapped genes. Genomic DNA was availablefor 64 prostate tumors, including 55 primary tumors and 9unmatched therapy-naı̈ve pelvic lymph node metastases, from a setof 71 tumor specimens previously profiled for gene expression (9).Overall, we observed numerous recurrent CNAs (summarized inSupplementary Fig. S1), the spectrum of which was consistent withpublished chromosome-based CGH studies (7), with deletionsoutnumbering gains (average fractional genome loss and gain of6.4% and 2.6%, respectively; P < 0.001, Student’s t test). The mostfrequent aberrations included gains at 8q (27% of cases) and lossesat 13q (52%), 8p (47%), 6q (38%), 10q (28%), and 12p (27%).
To probe the organization of CNAs across the specimen set, wedid unsupervised hierarchical clustering of prostate samples in thespace of CNAs (Fig. 1A). Cluster analysis accentuated commonrecurrent aberrations, including gain at 8q22-q24 (MYC) and lossesat 8p11-p23 (NKX3-1), 10q23 (PTEN), 12p13 (CDKN1B), and 13q14(RB1). Notably, cluster analysis also highlighted a sample groupwith deletion on 6q (smallest shared deletion at 6q15), which wassignificantly associated with subtype-1 gene expression patterns(P < 0.001, m2 test), as well as a decreased tumor recurrence rate(Fig. 1B ; P = 0.028, log-rank test).
To more directly assess the relation between CNAs and gene-expression subtypes, we applied supervised analysis using the two-class (i.e., one subtype versus all others) SAM method (16).Supervised analysis affirmed that expression subtypes exhibiteddistinct patterns of CNAs (Fig. 2A and Table 1). In particular,
7 http://genome-www.stanford.edu/microarray8 http://www.ncbi.nlm.nih.gov/geo9 http://rana.lbl.gov/EisenSoftware.htm 10 http://genome.ucsc.edu
Genomic Profiles of Prostate Cancer
www.aacrjournals.org 8505 Cancer Res 2007; 67: (18). September 15, 2007
Research. on February 4, 2014. © 2007 American Association for Cancercancerres.aacrjournals.org Downloaded from
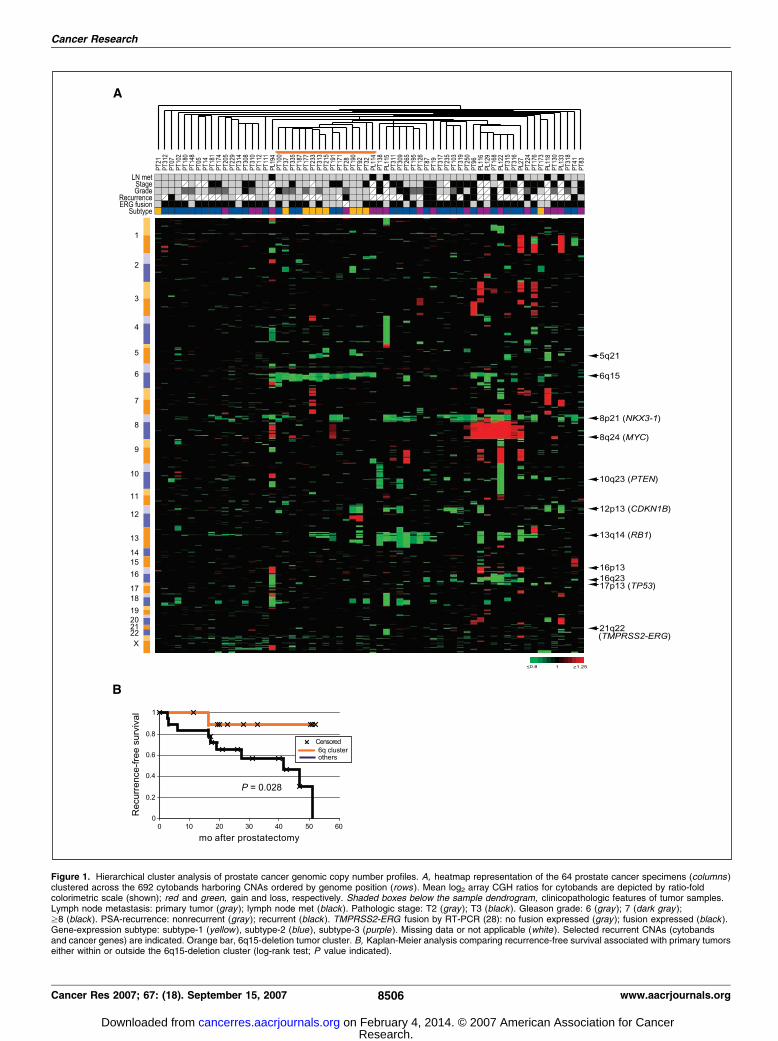
Figure 1. Hierarchical cluster analysis of prostate cancer genomic copy number profiles. A, heatmap representation of the 64 prostate cancer specimens (columns )clustered across the 692 cytobands harboring CNAs ordered by genome position (rows ). Mean log2 array CGH ratios for cytobands are depicted by ratio-foldcolorimetric scale (shown); red and green, gain and loss, respectively. Shaded boxes below the sample dendrogram, clinicopathologic features of tumor samples.Lymph node metastasis: primary tumor (gray ); lymph node met (black ). Pathologic stage: T2 (gray ); T3 (black ). Gleason grade: 6 (gray ); 7 (dark gray );z8 (black ). PSA-recurrence: nonrecurrent (gray ); recurrent (black ). TMPRSS2-ERG fusion by RT-PCR (28): no fusion expressed (gray ); fusion expressed (black ).Gene-expression subtype: subtype-1 (yellow ), subtype-2 (blue ), subtype-3 (purple ). Missing data or not applicable (white ). Selected recurrent CNAs (cytobandsand cancer genes) are indicated. Orange bar, 6q15-deletion tumor cluster. B, Kaplan-Meier analysis comparing recurrence-free survival associated with primary tumorseither within or outside the 6q15-deletion cluster (log-rank test; P value indicated).
Cancer Research
Cancer Res 2007; 67: (18). September 15, 2007 8506 www.aacrjournals.org
Research. on February 4, 2014. © 2007 American Association for Cancercancerres.aacrjournals.org Downloaded from

Figure 2. Expression subtypes exhibit distinct patterns of CNA. A, frequency plotssummarizing the distribution of CNAs in subtype-1, subtype-2, subtype-3 (primaries only),and therapy-naı̈ve pelvic lymph node metastases. Red and green , gain and loss,respectively. Selected CNAs harboring known or novel cancer genes are identified.Number (n) of specimens represented in each group is indicated. B, FISH analysisverifying subtype-selective deletions at 6q16 (subtype-1) and 8p22 (subtype-2).Representative FISH images are shown; red, locus-specific FISH probes (arrow, tumornuclei with single signal); green, control centromere probes. Counting FISH signals from50 cells per specimen from three tumor-normal pairs confirms significantly decreasedlocus/centromere ratios (P values indicated; Student’s t test) in tumor cases exhibitingdeletion by array CGH. C, fraction of genome (cytobands) harboring CNA for each of thesubgroups. Box-and-whisker plots, median, lower and upper quartiles, and the smallestand largest values.
Genomic Profiles of Prostate Cancer
www.aacrjournals.org 8507 Cancer Res 2007; 67: (18). September 15, 2007
Research. on February 4, 2014. © 2007 American Association for Cancercancerres.aacrjournals.org Downloaded from
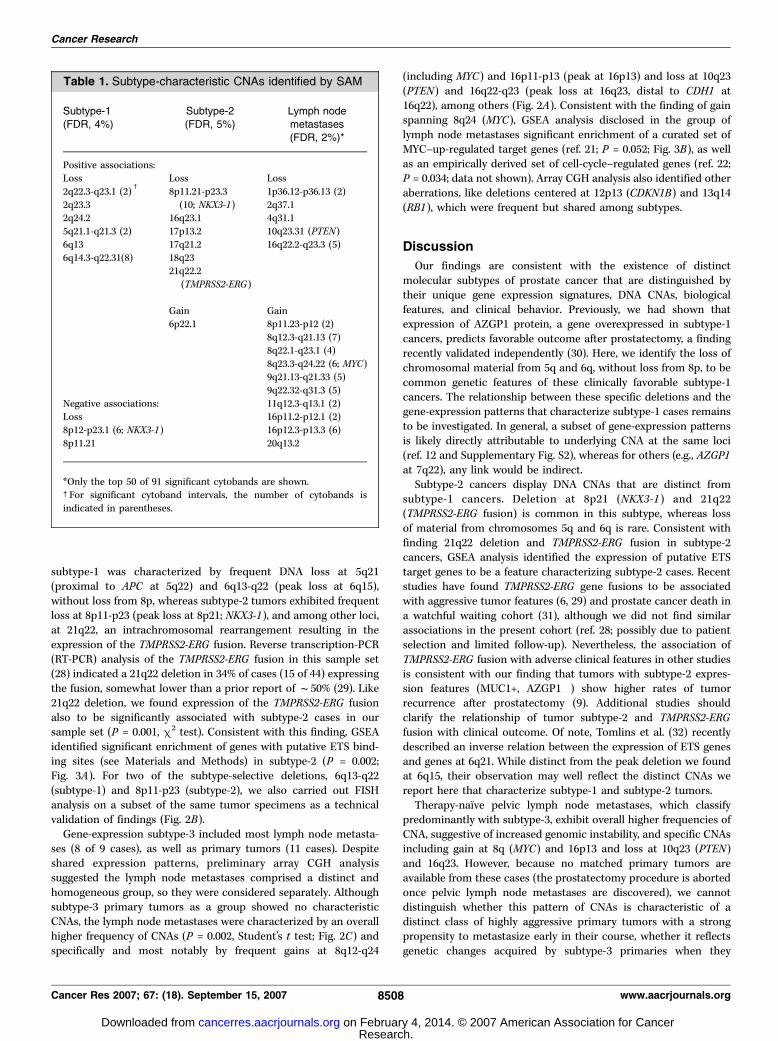
subtype-1 was characterized by frequent DNA loss at 5q21(proximal to APC at 5q22) and 6q13-q22 (peak loss at 6q15),without loss from 8p, whereas subtype-2 tumors exhibited frequentloss at 8p11-p23 (peak loss at 8p21; NKX3-1), and among other loci,at 21q22, an intrachromosomal rearrangement resulting in theexpression of the TMPRSS2-ERG fusion. Reverse transcription-PCR(RT-PCR) analysis of the TMPRSS2-ERG fusion in this sample set(28) indicated a 21q22 deletion in 34% of cases (15 of 44) expressingthe fusion, somewhat lower than a prior report of f50% (29). Like21q22 deletion, we found expression of the TMPRSS2-ERG fusionalso to be significantly associated with subtype-2 cases in oursample set (P = 0.001, m2 test). Consistent with this finding, GSEAidentified significant enrichment of genes with putative ETS bind-ing sites (see Materials and Methods) in subtype-2 (P = 0.002;Fig. 3A). For two of the subtype-selective deletions, 6q13-q22(subtype-1) and 8p11-p23 (subtype-2), we also carried out FISHanalysis on a subset of the same tumor specimens as a technicalvalidation of findings (Fig. 2B).
Gene-expression subtype-3 included most lymph node metasta-ses (8 of 9 cases), as well as primary tumors (11 cases). Despiteshared expression patterns, preliminary array CGH analysissuggested the lymph node metastases comprised a distinct andhomogeneous group, so they were considered separately. Althoughsubtype-3 primary tumors as a group showed no characteristicCNAs, the lymph node metastases were characterized by an overallhigher frequency of CNAs (P = 0.002, Student’s t test; Fig. 2C) andspecifically and most notably by frequent gains at 8q12-q24
(including MYC) and 16p11-p13 (peak at 16p13) and loss at 10q23(PTEN) and 16q22-q23 (peak loss at 16q23, distal to CDH1 at16q22), among others (Fig. 2A). Consistent with the finding of gainspanning 8q24 (MYC), GSEA analysis disclosed in the group oflymph node metastases significant enrichment of a curated set ofMYC–up-regulated target genes (ref. 21; P = 0.052; Fig. 3B), as wellas an empirically derived set of cell-cycle–regulated genes (ref. 22;P = 0.034; data not shown). Array CGH analysis also identified otheraberrations, like deletions centered at 12p13 (CDKN1B) and 13q14(RB1), which were frequent but shared among subtypes.
Discussion
Our findings are consistent with the existence of distinctmolecular subtypes of prostate cancer that are distinguished bytheir unique gene expression signatures, DNA CNAs, biologicalfeatures, and clinical behavior. Previously, we had shown thatexpression of AZGP1 protein, a gene overexpressed in subtype-1cancers, predicts favorable outcome after prostatectomy, a findingrecently validated independently (30). Here, we identify the loss ofchromosomal material from 5q and 6q, without loss from 8p, to becommon genetic features of these clinically favorable subtype-1cancers. The relationship between these specific deletions and thegene-expression patterns that characterize subtype-1 cases remainsto be investigated. In general, a subset of gene-expression patternsis likely directly attributable to underlying CNA at the same loci(ref. 12 and Supplementary Fig. S2), whereas for others (e.g., AZGP1at 7q22), any link would be indirect.
Subtype-2 cancers display DNA CNAs that are distinct fromsubtype-1 cancers. Deletion at 8p21 (NKX3-1 ) and 21q22(TMPRSS2-ERG fusion) is common in this subtype, whereas lossof material from chromosomes 5q and 6q is rare. Consistent withfinding 21q22 deletion and TMPRSS2-ERG fusion in subtype-2cancers, GSEA analysis identified the expression of putative ETStarget genes to be a feature characterizing subtype-2 cases. Recentstudies have found TMPRSS2-ERG gene fusions to be associatedwith aggressive tumor features (6, 29) and prostate cancer death ina watchful waiting cohort (31), although we did not find similarassociations in the present cohort (ref. 28; possibly due to patientselection and limited follow-up). Nevertheless, the association ofTMPRSS2-ERG fusion with adverse clinical features in other studiesis consistent with our finding that tumors with subtype-2 expres-sion features (MUC1+, AZGP1�) show higher rates of tumorrecurrence after prostatectomy (9). Additional studies shouldclarify the relationship of tumor subtype-2 and TMPRSS2-ERGfusion with clinical outcome. Of note, Tomlins et al. (32) recentlydescribed an inverse relation between the expression of ETS genesand genes at 6q21. While distinct from the peak deletion we foundat 6q15, their observation may well reflect the distinct CNAs wereport here that characterize subtype-1 and subtype-2 tumors.
Therapy-naı̈ve pelvic lymph node metastases, which classifypredominantly with subtype-3, exhibit overall higher frequencies ofCNA, suggestive of increased genomic instability, and specific CNAsincluding gain at 8q (MYC) and 16p13 and loss at 10q23 (PTEN)and 16q23. However, because no matched primary tumors areavailable from these cases (the prostatectomy procedure is abortedonce pelvic lymph node metastases are discovered), we cannotdistinguish whether this pattern of CNAs is characteristic of adistinct class of highly aggressive primary tumors with a strongpropensity to metastasize early in their course, whether it reflectsgenetic changes acquired by subtype-3 primaries when they
Table 1. Subtype-characteristic CNAs identified by SAM
Subtype-1
(FDR, 4%)
Subtype-2
(FDR, 5%)
Lymph node
metastases(FDR, 2%)*
Positive associations:Loss Loss Loss
2q22.3-q23.1 (2)c
8p11.21-p23.3 1p36.12-p36.13 (2)
2q23.3 (10; NKX3-1)16q23.1
2q37.12q24.2
17p13.2
4q31.1
5q21.1-q21.3 (2)
17q21.2
10q23.31 (PTEN)
6q13
18q23
16q22.2-q23.3 (5)
6q14.3-q22.31(8)21q22.2
(TMPRSS2-ERG)
Gain Gain6p22.1 8p11.23-p12 (2)
8q12.3-q21.13 (7)
8q22.1-q23.1 (4)
8q23.3-q24.22 (6; MYC)9q21.13-q21.33 (5)
9q22.32-q31.3 (5)
Negative associations: 11q12.3-q13.1 (2)Loss 16p11.2-p12.1 (2)
8p12-p23.1 (6; NKX3-1) 16p12.3-p13.3 (6)
8p11.21 20q13.2
*Only the top 50 of 91 significant cytobands are shown.cFor significant cytoband intervals, the number of cytobands is
indicated in parentheses.
Cancer Research
Cancer Res 2007; 67: (18). September 15, 2007 8508 www.aacrjournals.org
Research. on February 4, 2014. © 2007 American Association for Cancercancerres.aacrjournals.org Downloaded from

become metastatic, or whether it encompasses one or morecurrently undefined subclasses. Regardless, frequent 8q24 (MYC)amplification with enrichment of MYC–up-regulated target tran-scripts in the pelvic lymph node metastases underscores the likelypathogenic relevance of deregulated MYC expression in thissubgroup. Deregulated MYC expression drives cell-cycle progres-
sion and has been linked to genomic instability (33), bothprominent features of the tumors in the pelvic lymph nodemetastasis subset.
Our finding that the more aggressive subtypes-2 and -3 exhibitsignificantly lower frequencies of 5q21 and 6q15 deletionchallenges the prevailing view of a linear pathway of prostatecancer progression. Rather, our data support the existence ofalternative parallel pathways of tumorigenesis (Fig. 4), where loss ofTSGs at 5q21 and 6q15 generally leads to the development of whatseem to be more clinically favorable prostate cancers, whereasdeletion at 8p21 (NKX3-1) and 21q22 (TMPRSS2-ERG fusion),among others, result in more aggressive cancers. Because somelymph node metastases do show loss on chromosomes 5q and 6q,it is quite possible that some subtype-1 cancers can progress tometastasis; however, given the relatively better prognosis ofsubtype-1 cancers, such progression would be expected to occurless frequently.
We found DNA deletions to be overall more frequent than DNAgains, consistent with most prior chromosome-based CGH studies(7) and indicating a central role of TSGs in prostate cancerinitiation. Our data also suggest possible synergies between specificprostate cancer genes or loci. For example, subtype-2 tumors arecharacterized by concomitant deletion at 8p21 and 21q22,suggesting that the NKX3-1 tumor suppressor (or another TSG at8p21) and TMPRSS2-ERG fusion might cooperate to affect prostatetumorigenesis. Likewise, subtype-1 tumors exhibit frequent co-deletion of the 5q21 and 6q15 loci, implying cooperating TSGs atthese loci. Although no known TSGs map to these latter loci,candidates with known functions relevant to tumor suppressoractivity include, at 5q21, RGMB (cell adhesion), CHD1 (chromatinremodeling), and EFNA5 (cell-cell signaling); and at 6q15, PNRC1(nuclear receptor coactivation), ANKRD6 (WNT signaling and cellpolarity), CASP8AP2 (apoptosis), and MAP3K7 (transforminggrowth factor h signal transduction). Genomic profiling ofadditional subtype-1 specimens should enable further refinementof deletion boundaries to facilitate the identification of the TSGs.
Our discovery of prostate cancer subtypes associated withdistinct patterns of both gene-expression profiles and genomic
Figure 3. GSEA links CNAs to subtype gene-expression patterns. GSEAidentifies enrichment of genes (A) with putative ETS binding sites in subtype-2versus others, and (B) of MYC–up-regulated targets in lymph node metastasesversus others. Enrichment is evidenced by the early positive deflection of theKolmogorov-Smirnov running sum. The significance of the maximum runningsum (S) is evaluated by comparison with 500 trials with randomly permutedsubtype class labels; the P value is the frequency that S in the actual data isequaled or exceeded in the permuted data.
Figure 4. Alternative genetic pathways of prostatetumorigenesis. Schematic model synthesizingmajor findings from the current study. See text fordetails; aberrations shared among subtypes, likedeletions at 12p13 (CDKN1B ) and 13q14 (RB1 ),are not shown.
Genomic Profiles of Prostate Cancer
www.aacrjournals.org 8509 Cancer Res 2007; 67: (18). September 15, 2007
Research. on February 4, 2014. © 2007 American Association for Cancercancerres.aacrjournals.org Downloaded from

CNAs is reminiscent of recent findings in other tumor types. Inparticular, breast cancer has been subdivided into five differentgene-expression subtypes (Luminal-A, Luminal-B, Basal-like,ERBB2-associated, and normal-like), associated with distinctprognoses (34) and, more recently, different underlying patternsof genomic CNA (17, 35). Our findings indicate that prostatecancer can similarly be usefully considered as comprising distinctgene expression and genetic subtypes, with implications fordiagnostic classification and potentially for patient management.
The CNAs we have identified also represent novel candidatebiomarkers of prognosis that could be tested clinically. Inparticular, studies of biopsy material from patients followed butnot treated (i.e., watchful waiting cohorts), or from patients whohave been treated when their tumors were localized, are needed todetermine if subtype markers might effectively predict whichtumors progress. Discriminatory subtype markers might includegene-expression signatures, selected IHC stains, genetic markers(e.g., 5q21/6q15 deletion), or combinations of these. Of particularimportance is the identification of markers (AZGP1 expression,5q21/6q15 deletion) that define what seem to be less aggressivecancers. These markers offer promise to better identify tumors of
low risk that can be watched when used in combination withmarkers of poor prognosis (e.g., MUC1 or EZH2 protein expression,TMPRSS2-ERG fusion, and chromosome 8p loss; refs. 9, 31, 36, 37).Although additional investigations are needed, the current studyestablishes the existence of clinically relevant molecular geneticsubtypes of prostate cancer arising via alternative genetic path-ways. These subtypes provide a new framework for understandingprostate cancer biology and may explain in part the observedheterogeneity of the disease with regard to both tumor progressionand response to therapies.
Acknowledgments
Received 2/19/2007; revised 6/23/2007; accepted 7/5/2007.Grant support: NIH grants CA97139 (J.R. Pollack), CA111782 (J.D. Brooks), CA85129
(J.R. Pollack and J.D. Brooks), and GM07365 (K. Salari); Swedish Cancer Society,Radiumhemmet’s Research Foundations and Cancer and Allergy Foundation (C. Li).
The costs of publication of this article were defrayed in part by the payment of pagecharges. This article must therefore be hereby marked advertisement in accordancewith 18 U.S.C. Section 1734 solely to indicate this fact.
We thank the Stanford Functional Genomic Facility for microarray manufacture,the Stanford Microarray Database for database support, and Ilana Galperin (StanfordCytogenetics Laboratory) for assistance with FISH analysis. We also thank themembers of the Pollack lab for helpful discussion.
References1. Jemal A, Tiwari RC, Murray T, et al. Cancer statistics,2004. CA Cancer J Clin 2004;54:8–29.
2. Klotz L. Active surveillance versus radical treatmentfor favorable-risk localized prostate cancer. Curr TreatOptions Oncol 2006;7:355–62.
3. DeMarzo AM, Nelson WG, Isaacs WB, Epstein JI.Pathological and molecular aspects of prostate cancer.Lancet 2003;361:955–64.
4. Lee WH, Morton RA, Epstein JI, et al. Cytidinemethylation of regulatory sequences near the pi-classglutathione S -transferase gene accompanies humanprostatic carcinogenesis. Proc Natl Acad Sci U S A1994;91:11733–7.
5. Tomlins SA, Rhodes DR, Perner S, et al. Recurrentfusion of TMPRSS2 and ETS transcription factor genesin prostate cancer. Science 2005;310:644–8.
6. Wang J, Cai Y, Ren C, Ittmann M. Expression of variantTMPRSS2/ERG fusion messenger RNAs is associatedwith aggressive prostate cancer. Cancer Res 2006;66:8347–51.
7. Karan D, Lin MF, Johansson SL, Batra SK. Currentstatus of the molecular genetics of human prostaticadenocarcinomas. Int J Cancer 2003;103:285–93.
8. Grossmann ME, Huang H, Tindall DJ. Androgenreceptor signaling in androgen-refractory prostatecancer. J Natl Cancer Inst 2001;93:1687–97.
9. Lapointe J, Li C, Higgins JP, et al. Gene expressionprofiling identifies clinically relevant subtypes of pros-tate cancer. Proc Natl Acad Sci U S A 2004;101:811–6.
10. Schuler GD. Pieces of the puzzle: expressed sequencetags and the catalog of human genes. J Mol Med 1997;75:694–8.
11. Pollack JR, Perou CM, Alizadeh AA, et al. Genome-wide analysis of DNA copy-number changes using cDNAmicroarrays. Nat Genet 1999;23:41–6.
12. Pollack JR, Sorlie T, Perou CM, et al. Microarrayanalysis reveals a major direct role of DNA copy numberalteration in the transcriptional program of humanbreast tumors. Proc Natl Acad Sci U S A 2002;99:12963–8.
13. Gollub J, Ball CA, Binkley G, et al. The StanfordMicroarray Database: data access and quality assess-ment tools. Nucleic Acids Res 2003;31:94–6.
14. Wang P, Kim Y, Pollack J, Narasimhan B, Tibshirani R.A method for calling gains and losses in array CGH data.Biostatistics 2005;6:45–58.
15. Eisen MB, Spellman PT, Brown PO, Botstein D.Cluster analysis and display of genome-wide expres-sion patterns. Proc Natl Acad Sci U S A 1998;95:14863–8.
16. Tusher VG, Tibshirani R, Chu G. Significance analysisof microarrays applied to the ionizing radiationresponse. Proc Natl Acad Sci U S A 2001;98:5116–21.
17. Bergamaschi A, Kim YH, Wang P, et al. Distinctpatterns of DNA copy number alteration are associatedwith different clinicopathological features and gene-expression subtypes of breast cancer. Genes Chromo-somes Cancer 2006;45:1033–40.
18. Lingjaerde OC, Baumbusch LO, Liestol K, Glad IK,Borresen-Dale AL. CGH-Explorer: a program for analysisof array-CGH data. Bioinformatics 2005;21:821–2.
19. Subramanian A, Tamayo P, Mootha VK, et al. Geneset enrichment analysis: a knowledge-based approachfor interpreting genome-wide expression profiles. ProcNatl Acad Sci U S A 2005;102:15545–50.
20. Kim YH, Girard L, Giacomini CP, et al. Combinedmicroarray analysis of small cell lung cancer revealsaltered apoptotic balance and distinct expressionsignatures of MYC family gene amplification. Oncogene2006;25:130–8.
21. Zeller KI, Jegga AG, Aronow BJ, O’Donnell KA, DangCV. An integrated database of genes responsive to theMyc oncogenic transcription factor: identification ofdirect genomic targets. Genome Biol 2003;4:R69.
22. Whitfield ML, Sherlock G, Saldanha AJ, et al.Identification of genes periodically expressed in thehuman cell cycle and their expression in tumors. MolBiol Cell 2002;13:1977–2000.
23. Rhodes DR, Kalyana-Sundaram S, Mahavisno V,Barrette TR, Ghosh D, Chinnaiyan AM. Mining forregulatory programs in the cancer transcriptome. NatGenet 2005;37:579–83.
24. Kel AE, Gossling E, Reuter I, Cheremushkin E, Kel-Margoulis OV, Wingender E. MATCH: A tool forsearching transcription factor binding sites in DNAsequences. Nucleic Acids Res 2003;31:3576–9.
25. Matys V, Fricke E, Geffers R, et al. TRANSFAC:
transcriptional regulation, from patterns to profiles.Nucleic Acids Res 2003;31:374–8.
26. Graves BJ, Petersen JM. Specificity within the etsfamily of transcription factors. Adv Cancer Res 1998;75:1–55.
27. Kim H, Lapointe J, Kaygusuz G, et al. The retinoicacid synthesis gene ALDH1a2 is a candidate tumorsuppressor in prostate cancer. Cancer Res 2005;65:8118–24.
28. Lapointe J, Kim YH, Miller MA, et al. A variantTMPRSS2 isoform and ERG fusion product in prostatecancer with implications for molecular diagnosis. ModPathol 2007;20:467–73.
29. Perner S, Demichelis F, Beroukhim R, et al.TMPRSS2:ERG fusion-associated deletions provide in-sight into the heterogeneity of prostate cancer. CancerRes 2006;66:8337–41.
30. Henshall SM, Horvath LG, Quinn DI, et al. Zinc-a2-glycoprotein expression as a predictor of metastaticprostate cancer following radical prostatectomy. J NatlCancer Inst 2006;98:1420–4.
31. Demichelis F, Fall K, Perner S, et al. TMPRSS2:ERGgene fusion associated with lethal prostate cancer in awatchful waiting cohort. Oncogene 2007;26:4596–9.
32. Tomlins SA, Mehra R, Rhodes DR, et al. Integrativemolecular concept modeling of prostate cancer pro-gression. Nat Genet 2007;39:41–51.
33. Felsher DW, Bishop JM. Transient excess of MYCactivity can elicit genomic instability and tumorigenesis.Proc Natl Acad Sci U S A 1999;96:3940–4.
34. Sorlie T, Perou CM, Tibshirani R, et al. Geneexpression patterns of breast carcinomas distinguishtumor subclasses with clinical implications. Proc NatlAcad Sci U S A 2001;98:10869–74.
35. Chin K, DeVries S, Fridlyand J, et al. Genomic andtranscriptional aberrations linked to breast cancerpathophysiologies. Cancer Cell 2006;10:529–41.
36. Varambally S, Dhanasekaran SM, Zhou M, et al. Thepolycomb group protein EZH2 is involved in progres-sion of prostate cancer. Nature 2002;419:624–9.
37. Paris PL, Andaya A, Fridlyand J, et al. Whole genomescanning identifies genotypes associated with recur-rence and metastasis in prostate tumors. Hum MolGenet 2004;13:1303–13.
Cancer Research
Cancer Res 2007; 67: (18). September 15, 2007 8510 www.aacrjournals.org
Research. on February 4, 2014. © 2007 American Association for Cancercancerres.aacrjournals.org Downloaded from