
Current Technique of Open Intrafascial Nerve-Sparing Retropubic Prostatectomy

Discovery and Validation of a Prostate Cancer GenomicClassifier that Predicts Early Metastasis Following RadicalProstatectomyNicholas Erho1., Anamaria Crisan1., Ismael A. Vergara1, Anirban P. Mitra2, Mercedeh Ghadessi1,
Christine Buerki1, Eric J. Bergstralh3, Thomas Kollmeyer4, Stephanie Fink4, Zaid Haddad1,
Benedikt Zimmermann1, Thomas Sierocinski1, Karla V. Ballman3, Timothy J. Triche1,2, Peter C. Black5, R.
Jeffrey Karnes6, George Klee4, Elai Davicioni1", Robert B. Jenkins4"*
1 Research and Development, GenomeDx Biosciences, Vancouver, British Columbia, Canada, 2 Department of Pathology and Laboratory Medicine, University of Southern
California, Los Angeles, California, United States of America, 3 Department of Health Sciences Research, Mayo Clinic, Rochester, Minnesota, United States of America,
4 Department of Pathology and Laboratory Medicine, Mayo Clinic, Rochester, Minnesota, United States of America, 5 Department of Urology, University of British
Columbia, Vancouver, British Columbia, Canada, 6 Department of Urology, Mayo Clinic, Rochester, Minnesota, United States of America
Abstract
Purpose: Clinicopathologic features and biochemical recurrence are sensitive, but not specific, predictors of metastaticdisease and lethal prostate cancer. We hypothesize that a genomic expression signature detected in the primary tumorrepresents true biological potential of aggressive disease and provides improved prediction of early prostate cancermetastasis.
Methods: A nested case-control design was used to select 639 patients from the Mayo Clinic tumor registry who underwentradical prostatectomy between 1987 and 2001. A genomic classifier (GC) was developed by modeling differential RNAexpression using 1.4 million feature high-density expression arrays of men enriched for rising PSA after prostatectomy,including 213 who experienced early clinical metastasis after biochemical recurrence. A training set was used to develop arandom forest classifier of 22 markers to predict for cases - men with early clinical metastasis after rising PSA. Performance ofGC was compared to prognostic factors such as Gleason score and previous gene expression signatures in a withheldvalidation set.
Results: Expression profiles were generated from 545 unique patient samples, with median follow-up of 16.9 years. GCachieved an area under the receiver operating characteristic curve of 0.75 (0.67–0.83) in validation, outperforming clinicalvariables and gene signatures. GC was the only significant prognostic factor in multivariable analyses. Within Gleason scoregroups, cases with high GC scores experienced earlier death from prostate cancer and reduced overall survival. The markersin the classifier were found to be associated with a number of key biological processes in prostate cancer metastatic diseaseprogression.
Conclusion: A genomic classifier was developed and validated in a large patient cohort enriched with prostate cancermetastasis patients and a rising PSA that went on to experience metastatic disease. This early metastasis prediction modelbased on genomic expression in the primary tumor may be useful for identification of aggressive prostate cancer.
Citation: Erho N, Crisan A, Vergara IA, Mitra AP, Ghadessi M, et al. (2013) Discovery and Validation of a Prostate Cancer Genomic Classifier that Predicts EarlyMetastasis Following Radical Prostatectomy. PLoS ONE 8(6): e66855. doi:10.1371/journal.pone.0066855
Editor: Chad Creighton, Baylor College of Medicine, United States of America
Received February 4, 2013; Accepted May 10, 2013; Published June 24, 2013
Copyright: � 2013 Erho et al. This is an open-access article distributed under the terms of the Creative Commons Attribution License, which permitsunrestricted use, distribution, and reproduction in any medium, provided the original author and source are credited.
Funding: This study was supported in part by the National Research Council of Canada, Industrial Research Assistance Program (http://www.nrc-cnrc.gc.ca/eng/irap/index.html), and the Mayo Clinic Prostate Cancer SPORE P50 CA91956 (PI: Donald Tindall Ph.D.) The funders had no role in study design, data collection andanalysis, decision to publish, or preparation of the manuscript.
Competing Interests: The authors have read the journal’s policy and have the following conflicts: NE, AC, IV, MG, CB, ZH, BZ, TS, TT, and ED are employees ofGenomeDx Biosciences Inc. ED and TT own stock in GenomeDx Biosciences Inc. ED has received research funding from GenomeDx Biosciences Inc. and theNational Research Council - Industrial Research Assistance Program. PB has received research funding from GenomeDx Biosciences Inc. GK has received researchfunding from Beckman Coulter. KB, EB, RC, SF, RK, RJ, and TK have declared that no competing interests exist. This does not alter the authors adherence to all thePLOS ONE policies on sharing data and materials.
* E-mail: [email protected]
. These authors contributed equally to this work.
" These authors also contributed equally to this work.
PLOS ONE | www.plosone.org 1 June 2013 | Volume 8 | Issue 6 | e66855

Introduction
Over 240,000 men are diagnosed with prostate cancer in the
U.S. annually, and a majority of them harbor local or regional
disease where the long-term prognosis is excellent [1]. About half
of these men undergo radical prostatectomy (RP) and nearly 40%
will present with one or more clinicopathologic features such as
high Gleason score (GS), extra-capsular extension (ECE), positive
surgical margins (SM+), seminal vesicle invasion (SVI) or lymph
node involvement (N+) that are associated with increased risk of
clinical metastasis [2–4]. Although only a minority of these men
are truly at risk of dying of their cancer [5], many of these
"clinically high risk" patients will receive additional postoperative
interventions (e.g., adjuvant radiation) and often suffer treatment
morbidity. Conversely, many men present without adverse clinical
features and yet die of prostate cancer. Current tools have limited
capacity to identify, at time of RP, men that are most at risk of
metastasis and prostate cancer death - such patients are currently
treated aggressively only after the observation of rising PSA
(Prostate Specific Antigen) or biochemical recurrence (BCR).
Recent clinical trials suggest that these patients would likely have
more favorable outcomes if treated earlier post-RP [6–10]. Thus,
the limited performance of clinical factors for predicting men at
highest risk for metastasis leads to suboptimal patient manage-
ment.
Over the last decade, many studies have tried to address the
unmet clinical need for predicting aggressive prostate cancer using
individual biomarkers or gene expression signatures [11–30].
However, these prior efforts have not seen widespread implemen-
tation in clinical practice because none have convincingly
demonstrated improved prediction over established clinical factors
such as the GS. This is mainly due to limitations in sample size and
power, the lengthy clinical follow up required to observe
metastatic or lethal prostate cancer events and the use of BCR
as a surrogate endpoint; a sensitive, but non-specific, predictor of
disease progression [31]. Thus, most biomarker studies poorly
sample clinically-proven aggressive prostate cancer cases. In
addition, most gene expression signatures were developed with
assays that required fresh or frozen tissue, which is not routinely
available in clinical practice, and were limited to profiling protein-
coding genes - examining only a minority of the active genome
(i.e., transcriptome). In a previous report we obtained archived
formalin-fixed paraffin embedded (FFPE) primary prostate cancer
specimens from the Mayo Clinic tumor registry that included a
large number of patients that developed metastatic disease. With
long-term follow up we ascertained a biomarker signature that
could identify men at risk of progression to clinical metastasis and
lethal prostate cancer [20]. However, in validation we did not
demonstrate a significant improvement on performance in
comparison to clinical variables and we hypothesized that this
may be due to the limited focus on a set of about 1,000 protein-
coding genes.
Here we expand upon this work by re-profiling the patients of
the original study utilizing a high-density transcriptome-wide
microarray that assesses the expression of over 1.4 million RNA
features including the ,22,000 known protein-coding genes as
well as many thousands of non-coding RNAs. Such non-coding
RNAs are now recognized for their ability to regulate the activity
of oncogenes and tumor suppressor genes involved in the
development of disease recurrence and metastatic progression
[32,33]. We present the development and validation of a genomic
classifier (GC) for risk prediction of early clinical metastasis that is
enriched in non-coding RNAs. We demonstrate that GC provides
independent and statistically significant prognostic information
beyond clinicopathologic variables and show that GC outperforms
previously reported gene signatures.
Materials and Methods
Patient Population and Clinical OutcomesPatients from this study were selected using a nested case-
control design from the Mayo Clinic Radical Prostatectomy
Tumor Registry, as described previously [20]. In brief, patients
that received radical prostatectomy (RP) for primary prostatic
adenocarcinoma as first line treatment at the Mayo Clinic
Comprehensive Cancer Center between 1987 and 2001 were
retrospectively classified into the following outcome groups:
N No evidence of disease (NED) progression group: Exhibited no
biochemical or other clinical signs of disease progression
following RP, with at least 7 years of follow-up.
N Prostate-specific antigen (PSA)-recurrence group: Experienced bio-
chemical recurrence (BCR), defined as two successive increases
in PSA measurements above 0.02 ng/mL (with the subsequent
measure 0.05 ng/mL above the first measurement) with no
detectable clinical metastasis (see below) within 5 years of
BCR.
N Clinical metastasis group (metastasis): Experienced BCR and
developed regional or distant metastases, confirmed by bone
or CT scan, within 5 years of BCR. This group was referred to
as Systemic Progression (SYS) in our previous study [20].
A total of 213 patients met the definition of metastasis group
and were designated as cases [20]. For each case, one patient each
from PSA and NED groups were selected based on the matching
criteria described previously [20] and were designated as controls.
Ethics statement. This study was approved by the Institu-
tional Review Board of Mayo Clinic and due to the archival
nature of the specimens, patient consent was waived by the board.
RNA Extraction and Microarray HybridizationFrom the original study (n = 639), RNA was available for
microarray from 545 unique patients. As previously described,
after histopathological re-review by an expert genitourinary
pathologist, tumor was macrodissected from surrounding stroma
from 3–4 10 mm tissue sections from the primary Gleason grade of
the index lesion (the highest pathologic GS) for total RNA
extraction [20]. Total RNA was subjected to amplification using
the WT-Ovation FFPE v2 kit together with the Exon Module
(NuGen, San Carlos, CA) according to the manufacturer’s
recommendations with minor modifications. Amplified products
were fragmented and labeled using the Encore Biotin Module
(NuGen, San Carlos, CA) and hybridized to Human Exon 1.0 ST
GeneChips (Affymetrix, Santa Clara, CA) following manufactur-
er’s recommendations. Human Exon GeneChips profile coding
and non-coding regions of the transcriptome using approximately
1.4 million probe selection regions (PSRs), hereinafter referred to
as features.
Microarray ProcessingMicroarray quality control. Of the 545 patients with
available tissue and RNA, a total of 59 samples failed initial QC
(as assessed by Affymetrix Power Tools AUC metric [34]) and
were re-run. Additionally, a PC3 cell line (ATCC, Manassas, VA)
control was run with each batch and used to identify unreliable
features (see below). The Human Exon array data corresponding
to this study are available from the National Center for
Genomic Classifier Predicts Aggressive PCa
PLOS ONE | www.plosone.org 2 June 2013 | Volume 8 | Issue 6 | e66855

Biotechnology Information’s Gene Expression Omnibus database
(GSE46691).
Microarray Normalization, Removal of UnreliableFeatures and Batch Effect Correction
Feature summarization and normalization of expression values
were performed by frozen robust multi-array analysis (fRMA;
[35]), which is available through Bioconductor. A custom set of
frozen vectors were generated by randomly selecting 15 arrays
from each of the 19 batches across the whole study. Features
interrogated with fewer than four probes or any cross-hybridizing
probes (as defined by Affymetrix) were removed (http://www.
affymetrix.com). The variance of the feature expression values on
the PC3 cell lines was used to gauge the technical versus biological
variability. Features with the highest 10% variance in the PC3 cell
lines were removed from the expression matrix. Lastly, in order to
evaluate and remove batch effect, the data was decomposed into
its principal components and an analysis of variance model was
used. As suggested by a previous study [36], the first 10 principal
Table 1. Clinical characteristics of cases and controls among training and validation sets.
Training Validation
Cases Controls Cases Controls
Total Metastasis PSA NED Total Metastasis PSA NED
n n (row %) n (row %) n (row %) n n (row %) n (row %) n (row %)
Study Cohort 359 129 (36) 121 (34) 109(30) 186 63 (34) 63 (34) 60 (32)
Pathological Stage
pT2N0M0 145 36 (25) 46 (32) 63 (43) 74 16 (22) 31 (42) 27 (36)
pT3/4N0M0 168 60 (36) 70 (42) 38 (22) 85 35 (41) 28 (33) 22 (26)
pTanyN+M0 46 33 (72) 5 (11) 8 (17) 27 12 (44) 4 (15) 11 (41)
Pathologic Gleason Score
#6 45 4 (9) 18 (40) 23 (51) 18 2 (11) 9 (50) 7 (39)
7 174 44 (25) 70 (40) 60 (35) 97 26 (27) 29 (30) 42 (43)
8 45 17 (38) 16 (35) 12 (27) 23 10 (43) 9 (40) 4 (17)
9 87 57 (65) 17 (20) 13 (15) 47 25 (53) 15 (32) 7 (15)
10 8 7 (87) 0 1 (13) 1 0 1 (100) 0
Pre-operative Prostate-specific Antigen
,10 ng/mL 191 74 (39) 55 (29) 62 (32) 92 32 (35) 29 (31) 31 (34)
10–20 ng/mL 83 21 (25) 33 (40) 29 (35) 33 10 (31) 12 (36) 11 (33)
.20 ng/mL 81 12 (14) 32 (40) 37 (46) 50 16 (32) 18 (36) 16 (32)
Not available 4 1 (25) 1 (25) 2 (50) 11 5 (46) 4 (36) 2 (18)
Seminal Vesicle Invasion
Present 110 56 (51) 35 (32) 19 (17) 66 31 (47) 19 (28) 16 (25)
Surgical Margin Status
Positive 179 73 (40) 60 (34) 46 (26) 87 30 (34) 34 (40) 23 (26)
Extra-capsular Extension
Present 182 80 (44) 63 (35) 39 (21) 91 38 (41) 26 (29) 27 (30)
Biochemical recurrence
Event 260 129 (50) 121 (46) 10 (4.0) 128 63 (49) 63 (49) 2 (2.0)
Clinical Metastasis
Event 143 129 (90) 14 (10) 0 69 62 (90) 7 (10) 0
Prostate Cancer-specific Mortality
Event 96 86 (90) 10 (10) 0 36 32 (89) 4 (11) 0
Adjuvant Radiation
Administered 36 18 (50) 5 (14) 13 (36) 18 10 (56) 4 (22) 4 (22)
Adjuvant Androgen Deprivation Therapy
Administered 77 44 (57) 13 (17) 20 (26) 47 18 (39) 9 (19) 20 (42)
Salvage Radiation
Administered 57 23 (40) 34 (60) 0 25 10 (40) 15 (60) 0
Salvage Androgen Deprivation Therapy
Administered 119 67 (56) 52 (44) 0 53 23 (43) 30 (57) 0
doi:10.1371/journal.pone.0066855.t001
Genomic Classifier Predicts Aggressive PCa
PLOS ONE | www.plosone.org 3 June 2013 | Volume 8 | Issue 6 | e66855

components were examined for their correlation with batch effect.
From these 10 principal components (capturing 31% of the total
variance), the two components that were most highly correlated
with batch effect were removed.
Definition of Training and Validation Sets, FeatureSelection and Genomic Classifier Development
Training and validation sets. After assessing the molecular
differences among the three patient groups, very limited differen-
tial expression was observed between the NED and PSA-
recurrence groups. Differential expression of individual features
was obtained through pairwise comparisons of the outcome groups
(Crisan et al., manuscript in preparation). At a fold-change
threshold of 1.5 (after correcting for false-discovery), only 2 (out
of ,1.4 million) features were found to be differentially expressed
between NED and PSA groups, compared to 1186 and 887 in
metastasis outcomes compared to NED and BCR-only groups,
respectively [37]. Therefore, and in order to develop a signature
that predicts early clinical metastasis, these two groups were
combined into a single control group. The assignment of patients
into training (n = 359) and validation (n = 186) was as defined in
our previous study [20].
Feature selection. Given the initially large number of
features (,1.4 million), each feature was filtered using a t-test
(p,0.01) for complexity reduction on the training set (Figure S1).
Features were further vetted in subsequent selection steps. To
identify robust features, regularized logistic regression was applied
[38,39] with an elastic net penalty of a= 0.5. This procedure was
bootstrapped 1,000 times and the number of times a feature was
selected by the regularized regression was tallied. Features that
were selected at least 25% of the time were used for classifier
development.
Genomic classifier development. A random forest ma-
chine learning algorithm was used to assemble the selected features
into a classifier [40]. A final selection step was used to optimize the
feature set on the classification algorithm. Using the rfcv function
within the randomForest package [41], the 10-fold cross validation
mean squared error (MSE) of models with decreasing numbers of
features was plotted. In each iteration, features were excluded if
they had the lowest 10% Gini Index. Features that showed little
contribution to the performance of the model were not included in
Figure 1. Consort diagram. Study breakdown into cases andcontrols. Training and validation sets are shown.doi:10.1371/journal.pone.0066855.g001
Figure 2. Multidimensional scaling plot of (A) the training and (B) the validation sets. Controls are indicated in blue and cases in red. Inboth the training and validation sets the controls tend to cluster on the left of the plot and the cases on the right of the plot. In this manner, most ofthe biological differences are expressed in the first dimension of the scaling. Random forest proximity [http://www.stat.berkeley.edu/̃breiman/] wasused to measure the 22 marker distance between samples.doi:10.1371/journal.pone.0066855.g002
Genomic Classifier Predicts Aggressive PCa
PLOS ONE | www.plosone.org 4 June 2013 | Volume 8 | Issue 6 | e66855

the final classifier, keeping those features above the knee of the
MSE curve (Figure S2). With this final feature set, the mtry and
nodesize random forest parameters were tuned with an accuracy-
optimizing grid search. The search of the parameter space was
pursued with the tune.randomForest function in the e1071
package [42]. Specifically, the training set (composed of 359
samples) was further split into 1/3 training and 2/3 testing and
used with 1000 iterations of bootstrapping to improve perfor-
mance estimates and control over-fitting. The final genomic
classifier (GC) outputs a continuous variable score ranging
Table 2. Summary description of the 22 markers in the genomic classifier.
MarkerNearestGene/Locus Type of Marker Cytoband
AndrogenRegulated1 Biological Process(es)
Reference(s)
[PMID]
1 LASP1 CODING 17q12 Cell Proliferation,Differentiation
Grunewald et al,2007 [17211471];Traenka et al, 2010
[20924110]
2 IQGAP3 3’ UTR 1q23.1 Cell Proliferation,Differentiation
Nojima et al, 2008
[18604197]
3 NFIB INTRONIC 9p23 Cell Proliferation,Differentiation
Qian et al, 1995
[7590749]; Dooleyet al, 2011 [21764851]
4 S1PR4 3’ UTR 19p13.3 Cell Proliferation,Differentiation
Yamazaki et al,2000 [10679247]
5 THBS2 3’ UTR 6q27 Cell Structure, Adhesion,Motility
Volpert et al, 1995
[8526929]; Kyriakideset al, 2001 [11583953]
6 ANO7 3’ UTR 2q37.3 Yes Cell Structure, Adhesion,Motility
Das et al, 2008
[18676855]
7 NON-CODING TRANSCRIPT*
8 PCDH7 INTRONIC 4p15.1 Yes Cell Structure, Adhesion,Motility
Yoshida, 2003
[12949613]
9 MYBPC1 CODING 12q23.2 Yes Cell Structure, Adhesion,Motility
Gregg et al, 2010
[20426842]
10 INTRONIC
11 EPPK1 3’ UTR 8q24.3 Yes Cell Structure, Adhesion,Motility
Yoshida et al, 2008
[18498355]
12 TSBP INTRONIC 6p21.32 Immune Response Liang et al, 1994
[7530381]
13 PBX1 CODING 1q23.3 Yes Immune Response Chung et al, 2007
[18093541]; Kikugawaet al, 2006 [16637071];Qiu et al, 2007
[17200190]
14 NUSAP1 3’ UTR 15q15.1 Cell Cycle Progression, MitosisRaemaekers et al,2003 [12963707];Ribbeck et al, 2007
[17276916]
15 ZWILCH 3’ UTR 15q22.31 Cell Cycle Progression, MitosisWilliams et al, 2003
[12686595]
16 UBE2C 39UTR 20q13.12 Yes Cell Cycle Progression, MitosisRape and Kirschner,2004 [15558010]
17 CODING ANTISENSE
18 CAMK2N1 CODING ANTISENSE 1p36.12 Yes Cell Cycle Progression, MitosisWang et al, 2008
[18305109]
19 RABGAP1 EXON/INTRON JUNCTION ANTISENSE 9q33.2 Cell Cycle Progression, MitosisCuif et al, 1999
[10202141]
20 PCAT-32 NON-CODING TRANSCRIPT 5p15.2 Other, Unknown Function Prensner et al, 2011
[21804560]
21 GLYATL1P4/PCAT-80
NON-CODING TRANSCRIPT 11q12.1 Other, Unknown Function Prensner et al, 2011
[21804560]
22 TNFRSF19 INTRONIC 13q12.12 Other, Unknown Function Eby et al, 2000
[10809768]
*Overlaps with an exon of a ’retained intron’ category.1Based on Jiang et al. Mol Endocrinol 23:1927-33, 2009; Massie et al. EMBO Rep 8:871-8, 2007.doi:10.1371/journal.pone.0066855.t002
Genomic Classifier Predicts Aggressive PCa
PLOS ONE | www.plosone.org 5 June 2013 | Volume 8 | Issue 6 | e66855

between 0 and 1, where a higher score indicates a higher
probability of clinical metastasis.
Clinical classifier and integrated genomic clinical
classifier. To benchmark the prognostic ability of GC, we
developed a ‘clinical-only’ classifier (CC), trained on the same
patients used to discover GC. CC combines pathologic GS, pre-
operative PSA (pPSA), SM+, SVI, ECE and N+ using logistic
regression. When scoring patients, CC produces a score between 0
and 1, analogous to GC. Additionally, in order to measure the
joint prognostic ability of the molecular signature and clinico-
pathologic variables, an integrated genomic-clinical classifier
(GCC) was constructed by combining the CC and GC models
using logistic regression.
Comparison Against External Biomarker SignaturesThe performance of GC was compared to that of previously
published gene signatures [11–13,15,16,18–24,28–30] and indi-
vidual genomic markers associated with prostate cancer progres-
sion including CHGA [43], DAB2IP [44], GOLPH2 [45], PAP
[46], ETV1 and ERG [47], KI-67 [48], PSA [49], PSCA [50],
PSMA [51], AMACR [52], GSTP1 [53], PCA3 [54], B7-H3 [55],
TOP2A [14] and CAV1 [56]. Each genomic marker and gene in
the signatures were mapped to its associated Affymetrix core
transcript cluster (http://www.affymetrix.com/analysis/index.
affx) where available, otherwise the extended transcript cluster was
used. Based on the fRMA summarized expression values for the
individual genes, the signatures were modeled in the training set
using a random forest and tuned with the tune.randomForest function
from the e1071 R package. Tuning involved performing a 20 by
20 grid search to find the optimal ‘‘mtry’’ and ‘‘nodesize’’ model
parameters evaluated via 5-fold cross validation in order to
maximize accuracy.
Performance Assessment of Classifiers and ClinicalVariables
Statistical analyses were performed in R v2.14.1, and all tests
were two-sided using a 5% significance level. The prognostic
ability of all classifiers (GC, CC, GCC, and the external biomarker
signatures) were compared using area under ROC curves (AUC),
discrimination boxplots and univariable (UVA) logistic regression.
Importance of the classifiers relative to clinical information and
independent prognostic ability were compared using multivariable
(MVA) logistic regression.
Clinical variables were calculated, categorized or transformed as
follows. GS was dichotomized into groups with the threshold of
$8; although convention is to segregate GS into three groups (#6,
7, $8) the relative lack of patients with GS#6 prompted the
dichotomization of GS. The pPSA, measured immediately prior to
RP, was log2-transformed. The following variables were binary:
ECE, SVI, SM+, and N+. Hormone and radiation therapy were
included as separate binary covariates if administered in an
adjuvant (,90 days post-RP) or salvage (following PSA rise)
setting. Treatments administered subsequent to clinical metastasis
were not included.
Based on a majority rule criterion, the patients with GC, CC
and GCC scores greater than 0.5 were classified as high risk
whereas those with a score lower or equal than 0.5 were classified
as low risk. Kaplan Meier survival curves were generated for the
prostate cancer specific mortality (PCSM) and overall survival
endpoints. Lastly, all follow-up times were reported using the
method described by Korn [57].
Results
Clinical Characteristics of Study PopulationFrom the study population of 639 patients [20], 545 (85%)
corresponding to 192 cases and 353 controls had available RNA
and were successfully hybridized to microarrays for analysis (see
methods). The median age of men in this study is 66 (IQR: 61–70)
years, with a median of 16.9 years follow-up. The clinical
characteristics of these patients are described in Table 1. Overall,
60% of cases (116/192) had GS $8 with only six GS #6, whereas
controls were predominantly GS 7 (57%) and GS #6 (16%). A
similar proportion of both cases and controls, (49% and 45%,
respectively) were pathological stage T3/4. Controls had 47% T2
disease (in contrast to 27% for cases), and 23% of cases were N+,
in contrast to just 8% for controls. A slightly higher rate of SM+was observed in the cases (54%) in comparison to controls (46%).
As expected given the study design, the median time to BCR was
very similar between the cases (2.3 years) and PSA controls (1.7
years). While there were 21 clinical metastasis events among
controls, these occurred with a median of 9.39 (IQR: 7.5–10.95)
years, whereas cases experienced much more rapid events with a
median of 5.47 (IQR: 3.7–8.14) years post-RP. Overall, the
median time to PCSM (n = 132) was 10.5 years. In order to
characterize the true biological potential of tumors from patients
who progress early to clinical metastasis after rising PSA, we
performed transcriptome-wide differential expression analysis to
test the hypothesis that an expression signature in primary tumors
could better predict clinical metastasis than clinical variables
alone.
Figure 3. Performance of classifiers and individual clinicopathologic variables. For each predictor, the AUC obtained in the training andvalidation sets, as well as the 95% Confidence Interval for this metric is shown. CC: clinical-only classifier. GC: genomic classifier. GCC: combinedgenomic-clinical classifier.doi:10.1371/journal.pone.0066855.g003
Genomic Classifier Predicts Aggressive PCa
PLOS ONE | www.plosone.org 6 June 2013 | Volume 8 | Issue 6 | e66855

Development of Models to Predict Early ClinicalMetastasis
Cases and controls were compared and used for the develop-
ment of a genomic (GC), clinical-only (CC) and integrated (GCC)
classifier models for predicting cases (i.e., early clinical metastasis
after rising PSA) as the primary endpoint (see methods). The 545
samples were assigned to training (n = 359, 39% cases) and
validation (n = 186, 37% cases) sets (Figure 1). GC was developed
from analysis of 1.1 million RNA features on the microarray in the
training set after removal of cross-hybridizing and unreliable
features (see methods). An initial feature selection step based on t-
tests for complexity reduction yielded 18,902 differentially
expressed features between cases and controls (Figure S1). Further
selection of these differentially expressed features by regularized
logistic regression reduced the list to a total of 43. As a final step,
these 43 differentially expressed features were further filtered to
only those that demonstrated to improve a random forest-based
performance metric (see methods). This resulted in a final set of 22
markers corresponding to RNAs from coding and non-protein
coding regions of the genome (Table 2). Multidimensional scaling
analysis depicts clustering of cases and controls based on
Figure 4. Score distributions of multivariable classifiers incases and controls in validation set. Distributions of scores areplotted for A) CC B) GC and C) GCC for controls and cases. Medianscores and 95% confidence intervals are represented by a horizontalblack line and notches, respectively. Non-overlapping notches indicatethat differences in the distribution of scores between cases and controlsare statistically significant. Outliers are represented as points beyondthe boxplot whiskers.doi:10.1371/journal.pone.0066855.g004
Table 3. Reclassification by GC of GS risk categories amongcases and controls in the validation set of patients.
GC #0.5 GC .0.5
GleasonCategory n
n METs(%)
n PCSM(%) n
n METs(%)
n PCSM(%)
GS #6 18 2 (11) 0 0 0 0
GS 7 69 12 (17) 4 (5.7) 28 14 (50) 4 (14)
GS 8 12 4 (33) 1 (8.3) 11 6 (54) 5 (45)
GS $9 17 3 (17) 2 (12) 31 22 (70) 16 (51)
Pathologic GS is categorized into four groups: #6,7, 8 and $9. Gleason groupsare re-classified by high (.0.5) and low GC risk scores. Total number of patientsin each category is further subdivided into the number of cases and those thatdied of prostate cancer (PCSM).doi:10.1371/journal.pone.0066855.t003
Figure 5. Distribution of GC scores among pathologic GScategories in validation. GC scores are plotted with a jitter so as tomore easily differentiate the patients among each pathologic GS (x-axis)groups. Case (red) and controls patients (blue) are shown for eachcategory. The dashed black line indicates the GC cutoff of 0.5. Trendsshow the patients with high GC scores tend to have high GS as well.doi:10.1371/journal.pone.0066855.g005
Genomic Classifier Predicts Aggressive PCa
PLOS ONE | www.plosone.org 7 June 2013 | Volume 8 | Issue 6 | e66855

expression of the 22 markers (Figure 2). A random forest machine-
learning algorithm was used to generate GC scores after
assembling the 22 markers with forest parameters to optimize
for highest accuracy in the training set. Logistic regression was
used to assemble the six clinicopathologic risk factors into a CC
and also integrated with GC to build a GCC.
Classifier Performance in Training and Validation SetIn the training set, ROC area-under the curve (AUC) values for
GC, CC and GCC were 0.90, 0.76 and 0.91 respectively, higher
than any individual clinical variable (Figure 3). In the validation
set, GC and GCC had the highest AUC of 0.75, and 0.74,
respectively for predicting cases. The clinical-only CC had an
AUC of 0.69, which was only marginally better than pathological
GS alone (0.65). The shape of the ROC curves for GC and GCC
shows that these models have the highest specificity and sensitivity
compared to clinical models above a threshold of ,50% specificity
(Figure S3). Discrimination box plots further show greater median
differences in GC and GCC scores between cases and controls
than for CC (Figure 4).
GC Reclassification of GS GroupsThe distribution of cases and controls in the validation set by
both GC and GS [58] risk groups is illustrated in Figure 5 and
summarized in Table 3. Among GS #6 tumors (n = 18) none had
high GC scores, while among GS 7 tumors (n = 97), nearly a third
(29%) had high GC scores and half of these were cases that
developed early metastasis after rising PSA. While most patients
with high GS ($8) had high GC scores, among the 29 (40%) with
low GC scores there were only 7 cases with 3 deaths from prostate
cancer. Overall, 116 out of 186 (62%) validation set patients had
low GC scores of which only 21 were cases resulting in 7 deaths
from prostate cancer. Among the 70 (38%) patients with high GC
scores, there were 42 cases and 25 of these men died of prostate
cancer.
GC is an Independent Prognostic VariableIn order to test for the effect size of individual variables as well
as dependencies among these variables we performed univariable
and multivariable analyses using logistic regression on the
validation set (Table 4). In univariable analysis, we found GC,
CC, GCC, GS, SVI and ECE to be statistically significant
predictors of cases (p,0.05). The odds ratio for GC was 1.42 for
every 10% increase in GC score. When dichotomized into low and
high GC risk groups, as described above, the odds ratio was 6.79
(95% CI: 3.46–13.29), more than twice the odds ratio of GS (OR:
3.02 (95% CI: 1.61–5.68)) for predicting cases. In multivariable
analysis, after adjustment for post-RP treatment, GC remained the
only significant prognostic variable (p,0.001) with an OR of
1.36 for every 10% increase in GC score. The independent
significance of GC suggests that a more direct measure of tumor
biology (i.e., 22-marker expression signature) adds significant
prognostic information for prediction of early metastasis after
rising PSA, which is not captured by the clinical variables available
from pathological analysis.
Cases with High GC Scores Die Earlier from ProstateCancer and other Causes
We next compared the survival outcomes of cases and controls
in Kaplan-Meier analysis of low and high GC score groups. Cases
with lower GC scores had a median 6.9 year prostate-cancer
specific survival compared to median 2.9 years for cases with high
GC scores (p = 0.003) (Figure 6). For overall survival, there was a
significant (p = 0.03) difference in outcome, with median overall
survival after metastasis of 2.5 and 4.98 years for cases with high
and low GC scores, respectively. Among all controls, 21 patients
developed clinical metastasis outside of the study case-control
definitions (i.e. .5 years after rising PSA). We evaluated whether
GC was able to segregate patients that had late occurring
metastasis events among the PSA controls (Figure S4). GC was
able to significantly (p,0.05) separate those PSA patients that
would go on to experience later clinical metastasis, from those that
did not. This difference in outcomes further strengthens the notion
that GC measures a component of the biological potential for
metastasis and that those patients with the highest GC scores may
be most at risk for early metastatic progression post-RP.
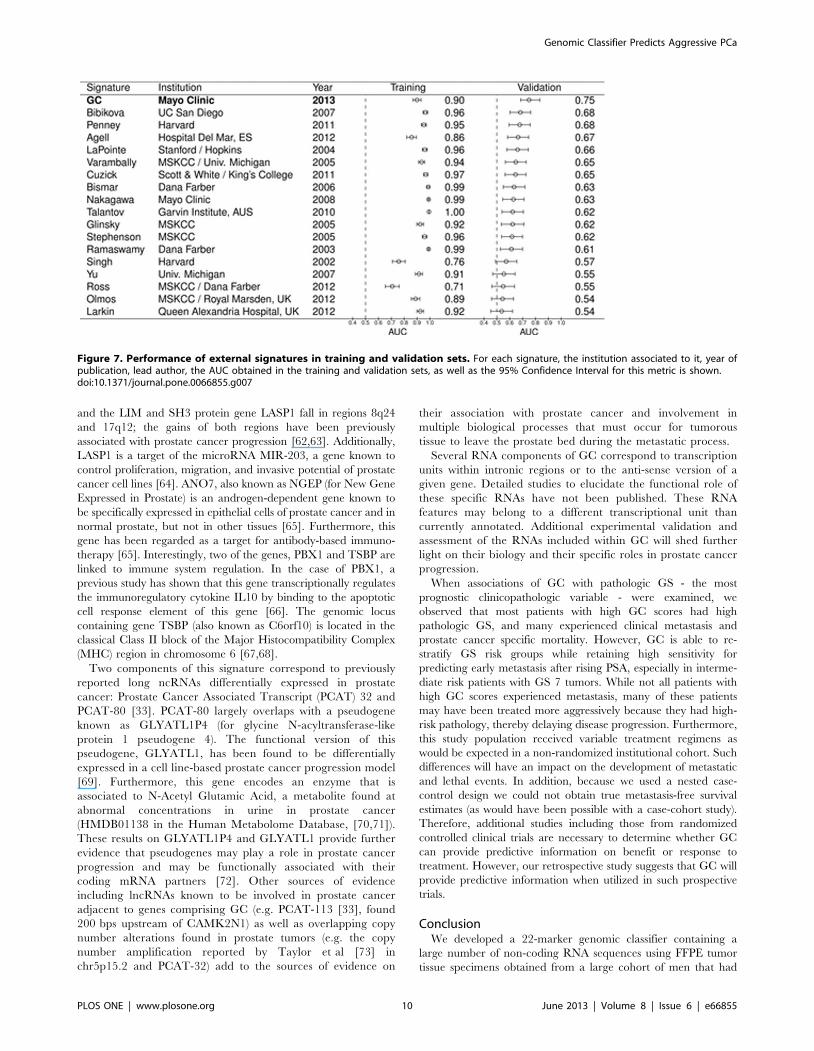
Comparisons to External Biomarker SignaturesIn order to compare the performance of GC to previously
reported gene signatures, we compiled the genes associated to
external signatures and combined them into a Random Forest
classifier (see methods). In addition, we evaluated the expression of
Table 4. Univariable and multivariable odds Ratios for CC, GC and GCC, and clinicopathologic variables.
Univariable Multivariable
Odds Ratio (95% CI) P Odds Ratio (95% CI) P
GC 1.42 (1.28–1.60) p,0.001 1.36 (1.16–1.60) p,0.001
GCC 1.36 (1.21–1.53) p,0.001 n.a n.a
CC 1.35 (1.15–1.59) p,0.001 n.a n.a
Pre-operative PSA 0.99 (0.77–1.26) 0.92 0.75 (0.52–1.07) 0.11
Pathologic Gleason Score $8 3.02 (1.61–5.68) p,0.001 1.91 (0.85–4.33) 0.12
Seminal Vesicle Invasion 2.44 (1.30–4.58) 0.01 1.93 (0.79–4.73) 0.15
Tumor Volume 1.02 (0.97–1.06) 0.44 0.97 (0.92–1.04) 0.42
Lymph Node Involvement 1.69 (0.74–3.88) 0.21 1.42 (0.41–4.96) 0.58
Positive Surgical Margins 1.05 (0.57–1.93) 0.87 0.93 (0.40–2.17) 0.87
Extra-capsular Extension 2.01 (1.18–3.73) 0.03 1.00 (0.45–2.20) 0.99
Odd ratios for multivariable classifiers are adjusted as indicated in the Materials and Methods. CC: clinical-only classifier. GC: genomic classifier. GCC: integratedgenomic-clinical classifier.doi:10.1371/journal.pone.0066855.t004
Genomic Classifier Predicts Aggressive PCa
PLOS ONE | www.plosone.org 8 June 2013 | Volume 8 | Issue 6 | e66855

individual genes previously reported to be associated to prostate
cancer outcomes. The performance of the classifiers and the
individual genes was subsequently assessed in both training and
validation sets (Figures 7 and S5). As expected, we observe high
AUCs in training for nearly all the external signatures, similar to
what was observed with GC. When applied to validation, the
AUC for each model decreased. Among the 17 external signatures
that were modeled, 12 were statistically significant predictors of
metastasis (i.e., their 95% confidence intervals did not drop below
a threshold random chance AUC of 0.5) (Figure 7). The AUC of
GC was 0.08 points higher than the top performing external
signature, the 16-gene signature reported by Bibikova et al [12],
which had an AUC of 0.68 (95% CI : 0.60–0.76,). In contrast to
the expression signature models, the performance of the 16 single
genes tested were expected to be similar in the training and
validation sets. These genomic markers show an overall agreement
in performance, with differences in significance likely explained by
the smaller sample size of the validation set compared to the
training set (Figure S5). Of the 16 genomic markers, only B7-H3
(CD276), GSTP1 and PCA3 were statistically significant in both
the training and validation sets (Figure S5). Again, none of the
individual genomic markers outperform GC or the top performing
clinical predictor, GS (AUCs #0.64).
Discussion
This study was designed to test the hypothesis that biological
assessment of both coding and non-coding expression profiles in
primary tumors could predict the development of early clinical
metastasis following BCR. We discovered a 22-marker genomic
classifier (GC) that, without sacrifice of sensitivity, was more
specific in validation than established prognostic factors such as
GS. Based on the results presented here, GC measures a
component of the biologic potential for early clinical metastasis
better than clinical variables or previously reported biomarker
signatures. This may enable clinicians to better select the best
candidates for intensive multi-modal therapy and spare those not
at risk the morbidity of post-RP interventions.
Here we profile the expression of over 1.4 million RNA features
in FFPE primary tumor specimens from 545 patients, of whom
192 developed early clinical metastasis, representing to our
knowledge the largest high-resolution genomic discovery and
validation effort of aggressive prostate cancer to date. The long
term follow-up (median 16.9 years) allowed us to evaluate GC for
more definitive endpoints such as clinical metastasis and prostate
cancer specific mortality compared to previous biomarker studies
that focused on surrogates such as Gleason grade or biochemical
recurrence (e.g. [11,15]). We benchmarked the improved perfor-
mance of GC against individual clinical factors and multivariable
clinical risk models as well as previously reported single and multi-
marker expression signatures. While GC outperforms the previ-
ously reported signatures and individual markers, we acknowledge
that differences in methodology, study design, and endpoint may
impact performance of these signatures and biomarkers. To avoid
over-fitting bias skewed in favor of GC, we retrained the
previously reported multi-marker expression signatures (e.g.,
Cuzick et al [15], CCP) in the training set. In validation, GC
outperformed all individual variables including GS, clinicopath-
ologic features and single biomarkers (e.g., KI-67, TOP2A) and
the clinical-only multivariable classifier (CC). CC was integrated
with GC into a genomic-clinical classifier (GCC) and we observed
that the genomic features contributed the bulk of prognostic
information upon multivariable analysis, with GCC having the
same prognostic abilities as GC.
The high-density array used in this study permits measurement
of the expression patterns of RNAs associated with multiple
biological processes in prostate cancer progression. The biological
processes represented in the GC signature include cell cycle
progression, cell adhesion, tumor cell motility, migration and
immune system modulation (see Table 2). Furthermore, many of
the genes have evidence of being involved in androgen signaling.
For example, MYBPC1, UBE2C and NUSAP1 have been
previously reported to be differentially expressed throughout
prostate cancer progression [22]. Differential expression analysis
between androgen-dependent and androgen-independent cell lines
[59] found the protocadherin gene PCDH7 to have the largest fold
change, suggesting it may play a role in the development of
castrate-resistant prostate cancer. Thrombospondin-2, a modula-
tor of angiogenesis, has also been reported to be differentially
expressed when comparing non-metastatic and metastatic prostate
cancer samples in two independent studies [60,61]. Also, the
cytoskeleton associated genes EPPK1, a plakin family member,
Figure 6. Kaplan Meier estimates for all Cases with (A) PCSMand (B) OS endpoints. Cases were separated into high (.0.5) or lowrisk according to GC score. Log-rank p-values are shown in the upperright corner. Time to PCSM and OS is measured from BCR in years.doi:10.1371/journal.pone.0066855.g006
Genomic Classifier Predicts Aggressive PCa
PLOS ONE | www.plosone.org 9 June 2013 | Volume 8 | Issue 6 | e66855
and the LIM and SH3 protein gene LASP1 fall in regions 8q24
and 17q12; the gains of both regions have been previously
associated with prostate cancer progression [62,63]. Additionally,
LASP1 is a target of the microRNA MIR-203, a gene known to
control proliferation, migration, and invasive potential of prostate
cancer cell lines [64]. ANO7, also known as NGEP (for New Gene
Expressed in Prostate) is an androgen-dependent gene known to
be specifically expressed in epithelial cells of prostate cancer and in
normal prostate, but not in other tissues [65]. Furthermore, this
gene has been regarded as a target for antibody-based immuno-
therapy [65]. Interestingly, two of the genes, PBX1 and TSBP are
linked to immune system regulation. In the case of PBX1, a
previous study has shown that this gene transcriptionally regulates
the immunoregulatory cytokine IL10 by binding to the apoptotic
cell response element of this gene [66]. The genomic locus
containing gene TSBP (also known as C6orf10) is located in the
classical Class II block of the Major Histocompatibility Complex
(MHC) region in chromosome 6 [67,68].
Two components of this signature correspond to previously
reported long ncRNAs differentially expressed in prostate
cancer: Prostate Cancer Associated Transcript (PCAT) 32 and
PCAT-80 [33]. PCAT-80 largely overlaps with a pseudogene
known as GLYATL1P4 (for glycine N-acyltransferase-like
protein 1 pseudogene 4). The functional version of this
pseudogene, GLYATL1, has been found to be differentially
expressed in a cell line-based prostate cancer progression model
[69]. Furthermore, this gene encodes an enzyme that is
associated to N-Acetyl Glutamic Acid, a metabolite found at
abnormal concentrations in urine in prostate cancer
(HMDB01138 in the Human Metabolome Database, [70,71]).
These results on GLYATL1P4 and GLYATL1 provide further
evidence that pseudogenes may play a role in prostate cancer
progression and may be functionally associated with their
coding mRNA partners [72]. Other sources of evidence
including lncRNAs known to be involved in prostate cancer
adjacent to genes comprising GC (e.g. PCAT-113 [33], found
200 bps upstream of CAMK2N1) as well as overlapping copy
number alterations found in prostate tumors (e.g. the copy
number amplification reported by Taylor et al [73] in
chr5p15.2 and PCAT-32) add to the sources of evidence on
their association with prostate cancer and involvement in
multiple biological processes that must occur for tumorous
tissue to leave the prostate bed during the metastatic process.
Several RNA components of GC correspond to transcription
units within intronic regions or to the anti-sense version of a
given gene. Detailed studies to elucidate the functional role of
these specific RNAs have not been published. These RNA
features may belong to a different transcriptional unit than
currently annotated. Additional experimental validation and
assessment of the RNAs included within GC will shed further
light on their biology and their specific roles in prostate cancer
progression.
When associations of GC with pathologic GS - the most
prognostic clinicopathologic variable - were examined, we
observed that most patients with high GC scores had high
pathologic GS, and many experienced clinical metastasis and
prostate cancer specific mortality. However, GC is able to re-
stratify GS risk groups while retaining high sensitivity for
predicting early metastasis after rising PSA, especially in interme-
diate risk patients with GS 7 tumors. While not all patients with
high GC scores experienced metastasis, many of these patients
may have been treated more aggressively because they had high-
risk pathology, thereby delaying disease progression. Furthermore,
this study population received variable treatment regimens as
would be expected in a non-randomized institutional cohort. Such
differences will have an impact on the development of metastatic
and lethal events. In addition, because we used a nested case-
control design we could not obtain true metastasis-free survival
estimates (as would have been possible with a case-cohort study).
Therefore, additional studies including those from randomized
controlled clinical trials are necessary to determine whether GC
can provide predictive information on benefit or response to
treatment. However, our retrospective study suggests that GC will
provide predictive information when utilized in such prospective
trials.
ConclusionWe developed a 22-marker genomic classifier containing a
large number of non-coding RNA sequences using FFPE tumor
tissue specimens obtained from a large cohort of men that had
Figure 7. Performance of external signatures in training and validation sets. For each signature, the institution associated to it, year ofpublication, lead author, the AUC obtained in the training and validation sets, as well as the 95% Confidence Interval for this metric is shown.doi:10.1371/journal.pone.0066855.g007
Genomic Classifier Predicts Aggressive PCa
PLOS ONE | www.plosone.org 10 June 2013 | Volume 8 | Issue 6 | e66855

radical prostatectomy for localized prostate cancer. The classifier
was validated and showed significantly superior performance in
predicting early clinical metastasis compared to previously
described individual genes, multigene signatures and clinicopath-
ologic variables. To our knowledge this represents the largest
study of prostate cancer patients exploring clinically relevant
endpoints using a high-density, transcriptome-wide approach for
differential expression analysis. GC offers improved risk stratifi-
cation among post-RP patients and may better identify patients
that require intensive multi-modal therapy, while sparing those
who can be closely monitored without initiating aggressive
adjuvant treatment. The reassignment of risk groups for patients
with different pathological GS based on GC scores indicates that
genomic markers presumably measure the biological potential of
the tumor to metastasize and can add an additional layer of detail
not captured by clinicopathologic variables. GC can be used
immediately following RP and, because it can accurately predict
metastasis long before it can be detected radiographically, may
better guide post-surgical treatment decisions.
Supporting Information
Figure S1 Summary of methods of GC development.Methods are separated based on array summarization, normali-
zation and quality controls (pre-processing) followed by steps used
for feature selection and classifier assembly (model building).
(TIFF)
Figure S2 Example of the mean squared error vsfeature set size plot used to reduce the genomicfeature set size from 43 to 22 features. 10 fold cross
validation was used to assess the MSE of each random forest
model constructed from decreasing feature set sizes. Features
were eliminated based on having the lowest variable importance
ranked by the Gini index. The vertical dotted line is drawn at
the 22 feature mark, where the MSE is minimized and the knee
of the plot occurs.
(TIFF)
Figure S3 ROC curve of multivariable models andclinicopathologic variables. A) ROC curves in Training B)
ROC curves in the validation set.
(TIFF)
Figure S4 Kaplan Meier estimates for all PSA Controlswith metastasis endpoint. PSA controls were separated into
two groups based on high (.0.5) or low risk according to GC. The
log-rank p-value is shown in the upper right corner.
(TIFF)
Figure S5 Performance of single genes in training andvalidation sets. For each gene, the AUC obtained in the
training and validation sets, as well as the 95% Confidence
Interval for this metric is shown.
(TIFF)
Acknowledgments
The authors thank Darby J.S. Thompson, PhD (EMMES Canada), John
Hornberger, MD (Cedars Associates, LLC), Andrew Vickers, PhD
(Memorial Sloan-Kettering), Ashley Ross MD, PhD (Johns Hopkins
Medical Institute), Felix Feng MD (University of Michigan) and Hyung
Kim MD (Cedars-Sinai) for useful discussions and comments during
preparation of this manuscript. The efforts of Iris Feng and Betty Schaub at
the USC Genome Core (Los Angeles) are greatly appreciated.
Author Contributions
Conceived and designed the experiments: ED EJB GK KVB RBJ TJT.
Performed the experiments: ED SF TK. Analyzed the data: AC APM BZ
CB EJB IAV KVB MG NE PCB RBJ TS ZH. Contributed reagents/
materials/analysis tools: AC GK NE RBJ RJK TS. Wrote the paper: AC
APM BZ CB ED EJB GK IAV KVB MG NE PCB RBJ RJK SF TJT TK
TS ZH.
References
1. Siegel R, DeSantis C, Virgo K, Stein K, Mariotto A, et al. (2012) Cancer
treatment and survivorship statistics, 2012. CA Cancer J Clin 62: 220–241.
2. Hull GW, Rabbani F, Abbas F, Wheeler TM, Kattan MW, et al. (2002) Cancercontrol with radical prostatectomy alone in 1,000 consecutive patients. J Urol
167: 528–534.
3. Patel AR, Stephenson AJ (2011) Radiation therapy for prostate cancer afterprostatectomy: adjuvant or salvage? Nat Rev Urol 8: 385–392.
4. Mishra MV, Champ CE, Den RB, Scher ED, Shen X, et al. (2011)
Postprostatectomy radiation therapy: an evidence-based review. Future Oncol7: 1429–1440.
5. Swanson GP, Basler JW (2010) Prognostic factors for failure after prostatectomy.
J Cancer 2: 1–19.6. Bolla M, van Poppel H, Tombal B, Vekemans K, Da Pozzo L, et al. (2012)
Postoperative radiotherapy after radical prostatectomy for high-risk prostate
cancer: long-term results of a randomised controlled trial (EORTC trial 22911).Lancet 380: 2018–2027.
7. Bolla M, van Poppel H, Collette L, van Cangh P, Vekemans K, et al. (2005)
Postoperative radiotherapy after radical prostatectomy: a randomised controlledtrial (EORTC trial 22911). Lancet 366: 572–578.
8. Thompson IM Jr., Tangen CM, Paradelo J, Lucia MS, Miller G, et al. (2006)
Adjuvant radiotherapy for pathologically advanced prostate cancer: a random-ized clinical trial. JAMA 296: 2329–2335.
9. Wiegel T, Bottke D, Steiner U, Siegmann A, Golz R, et al. (2009) Phase III
postoperative adjuvant radiotherapy after radical prostatectomy compared withradical prostatectomy alone in pT3 prostate cancer with postoperative
undetectable prostate-specific antigen: ARO 96–02/AUO AP 09/95. J ClinOncol 27: 2924–2930.
10. Thompson IM, Tangen CM, Paradelo J, Lucia MS, Miller G, et al. (2009)
Adjuvant radiotherapy for pathological T3N0M0 prostate cancer significantlyreduces risk of metastases and improves survival: long-term followup of a
randomized clinical trial. J Urol 181: 956–962.
11. Agell L, Hernandez S, Nonell L, Lorenzo M, Puigdecanet E, et al. (2012) A 12-gene expression signature is associated with aggressive histological in prostate
cancer: SEC14L1 and TCEB1 genes are potential markers of progression.Am J Pathol 181: 1585–1594.
12. Bibikova M, Chudin E, Arsanjani A, Zhou L, Garcia EW, et al. (2007)
Expression signatures that correlated with Gleason score and relapse in prostate
cancer. Genomics 89: 666–672.
13. Bismar TA, Demichelis F, Riva A, Kim R, Varambally S, et al. (2006) Defining
aggressive prostate cancer using a 12-gene model. Neoplasia 8: 59–68.
14. Cheville JC, Karnes RJ, Therneau TM, Kosari F, Munz JM, et al. (2008) Gene
panel model predictive of outcome in men at high-risk of systemic progression
and death from prostate cancer after radical retropubic prostatectomy. J Clin
Oncol 26: 3930–3936.
15. Cuzick J, Swanson GP, Fisher G, Brothman AR, Berney DM, et al. (2011)
Prognostic value of an RNA expression signature derived from cell cycle
proliferation genes in patients with prostate cancer: a retrospective study. Lancet
Oncol 12: 245–255.
16. Glinsky GV, Berezovska O, Glinskii AB (2005) Microarray analysis identifies a
death-from-cancer signature predicting therapy failure in patients with multiple
types of cancer. J Clin Invest 115: 1503–1521.
17. Glinsky GV, Glinskii AB, Stephenson AJ, Hoffman RM, Gerald WL (2004)
Gene expression profiling predicts clinical outcome of prostate cancer. J Clin
Invest 113: 913–923.
18. Lapointe J, Li C, Higgins JP, van de Rijn M, Bair E, et al. (2004) Gene
expression profiling identifies clinically relevant subtypes of prostate cancer. Proc
Natl Acad Sci U S A 101: 811–816.
19. Larkin SE, Holmes S, Cree IA, Walker T, Basketter V, et al. (2012)
Identification of markers of prostate cancer progression using candidate gene
expression. Br J Cancer 106: 157–165.
20. Nakagawa T, Kollmeyer TM, Morlan BW, Anderson SK, Bergstralh EJ, et al.
(2008) A tissue biomarker panel predicting systemic progression after PSA
recurrence post-definitive prostate cancer therapy. PLoS One 3: e2318.
21. Olmos D, Brewer D, Clark J, Danila DC, Parker C, et al. (2012) Prognostic
value of blood mRNA expression signatures in castration-resistant prostate
cancer: a prospective, two-stage study. Lancet Oncol 13: 1114–1124.
22. Penney KL, Sinnott JA, Fall K, Pawitan Y, Hoshida Y, et al. (2011) mRNA
expression signature of Gleason grade predicts lethal prostate cancer. J Clin
Oncol 29: 2391–2396.
Genomic Classifier Predicts Aggressive PCa
PLOS ONE | www.plosone.org 11 June 2013 | Volume 8 | Issue 6 | e66855

23. Ramaswamy S, Ross KN, Lander ES, Golub TR (2003) A molecular signature
of metastasis in primary solid tumors. Nat Genet 33: 49–54.24. Ross RW, Galsky MD, Scher HI, Magidson J, Wassmann K, et al. (2012) A
whole-blood RNA transcript-based prognostic model in men with castration-
resistant prostate cancer: a prospective study. Lancet Oncol 13: 1105–1113.25. Saal LH, Johansson P, Holm K, Gruvberger-Saal SK, She QB, et al. (2007)
Poor prognosis in carcinoma is associated with a gene expression signature ofaberrant PTEN tumor suppressor pathway activity. Proc Natl Acad Sci U S A
104: 7564–7569.
26. Singh D, Febbo PG, Ross K, Jackson DG, Manola J, et al. (2002) Geneexpression correlates of clinical prostate cancer behavior. Cancer Cell 1: 203–
209.27. Stephenson AJ, Smith A, Kattan MW, Satagopan J, Reuter VE, et al. (2005)
Integration of gene expression profiling and clinical variables to predict prostatecarcinoma recurrence after radical prostatectomy. Cancer 104: 290–298.
28. Talantov D, Jatkoe TA, Bohm M, Zhang Y, Ferguson AM, et al. (2010) Gene
based prediction of clinically localized prostate cancer progression after radicalprostatectomy. J Urol 184: 1521–1528.
29. Varambally S, Yu J, Laxman B, Rhodes DR, Mehra R, et al. (2005) Integrativegenomic and proteomic analysis of prostate cancer reveals signatures of
metastatic progression. Cancer Cell 8: 393–406.
30. Yu J, Rhodes DR, Tomlins SA, Cao X, Chen G, et al. (2007) A polycombrepression signature in metastatic prostate cancer predicts cancer outcome.
Cancer Res 67: 10657–10663.31. Pound CR, Partin AW, Eisenberger MA, Chan DW, Pearson JD, et al. (1999)
Natural history of progression after PSA elevation following radical prostatec-tomy. JAMA 281: 1591–1597.
32. Vergara IA, Erho N, Triche TJ, Ghadessi M, Crisan A, et al. (2012) Genomic
"Dark Matter" in Prostate Cancer: Exploring the Clinical Utility of ncRNA asBiomarkers. Front Genet 3: 23.
33. Prensner JR, Iyer MK, Balbin OA, Dhanasekaran SM, Cao Q, et al. (2011)Transcriptome sequencing across a prostate cancer cohort identifies PCAT-1, an
unannotated lincRNA implicated in disease progression. Nat Biotechnol 29:
742–749.34. Lockstone HE (2011) Exon array data analysis using Affymetrix power tools and
R statistical software. Brief Bioinform 12: 634–644.35. McCall MN, Bolstad BM, Irizarry RA (2010) Frozen robust multiarray analysis
(fRMA). Biostatistics 11: 242–253.36. Leek JT, Scharpf RB, Bravo HC, Simcha D, Langmead B, et al. (2010) Tackling
the widespread and critical impact of batch effects in high-throughput data. Nat
Rev Genet 11: 733–739.37. Crisan A, Ghadessi M, Buerki C, Vergara IA, Thompson DJS, et al. (2012)
Clinical and genomic analysis of metastatic disease progression in a backgroundof biochemical recurrence. J Clin Oncol. ASCO Meeting.
38. Zou H, Hastie T (2005) Regularization and variable selection via the elastic net.
JR Statist Soc B 67: 301–320.39. Friedman J, Hastie T, Tibshirani R (2010) Regularization Paths for Generalized
Linear Models via Coordinate Descent. J Stat Softw 33: 1–22.40. Breiman L (2001) Random Forests. In: Shapire RE, editor. Machine Learning:
Kluwer Academic Publishers. 5–32.41. Liaw A, Wiener M (2002) Classification and Regression by randomForest..
R news 2: 18–22.
42. Meyer D, Dimitriadou E, Hornik K, Weingessel A, Leisch F (2012) e1071: MiscFunctions of the Department of Statistics (e1071), TU Wien.
43. Deftos LJ (1998) Granin-A, parathyroid hormone-related protein, and calcitoningene products in neuroendocrine prostate cancer. Prostate Suppl 8: 23–31.
44. Chen H, Tu SW, Hsieh JT (2005) Down-regulation of human DAB2IP gene
expression mediated by polycomb Ezh2 complex and histone deacetylase inprostate cancer. J Biol Chem 280: 22437–22444.
45. Kristiansen G, Fritzsche FR, Wassermann K, Jager C, Tolls A, et al. (2008)GOLPH2 protein expression as a novel tissue biomarker for prostate cancer:
implications for tissue-based diagnostics. Br J Cancer 99: 939–948.
46. Veeramani S, Yuan TC, Chen SJ, Lin FF, Petersen JE, et al. (2005) Cellularprostatic acid phosphatase: a protein tyrosine phosphatase involved in androgen-
independent proliferation of prostate cancer. Endocr Relat Cancer 12: 805–822.47. Tomlins SA, Rhodes DR, Perner S, Dhanasekaran SM, Mehra R, et al. (2005)
Recurrent fusion of TMPRSS2 and ETS transcription factor genes in prostatecancer. Science 310: 644–648.
48. Berney DM, Gopalan A, Kudahetti S, Fisher G, Ambroisine L, et al. (2009) Ki-
67 and outcome in clinically localised prostate cancer: analysis of conservativelytreated prostate cancer patients from the Trans-Atlantic Prostate Group study.
Br J Cancer 100: 888–893.49. Stamey TA, Yang N, Hay AR, McNeal JE, Freiha FS, et al. (1987) Prostate-
specific antigen as a serum marker for adenocarcinoma of the prostate.
N Engl J Med 317: 909–916.
50. Reiter RE, Gu Z, Watabe T, Thomas G, Szigeti K, et al. (1998) Prostate stem
cell antigen: a cell surface marker overexpressed in prostate cancer. Proc Natl
Acad Sci U S A 95: 1735–1740.
51. Perner S, Hofer MD, Kim R, Shah RB, Li H, et al. (2007) Prostate-specific
membrane antigen expression as a predictor of prostate cancer progression.
Hum Pathol 38: 696–701.
52. Rubin MA, Zhou M, Dhanasekaran SM, Varambally S, Barrette TR, et al.
(2002) alpha-Methylacyl coenzyme A racemase as a tissue biomarker for prostate
cancer. JAMA 287: 1662–1670.
53. Lee WH, Morton RA, Epstein JI, Brooks JD, Campbell PA, et al. (1994)
Cytidine methylation of regulatory sequences near the pi-class glutathione S-
transferase gene accompanies human prostatic carcinogenesis. Proc Natl Acad
Sci U S A 91: 11733–11737.
54. Bussemakers MJ, van Bokhoven A, Verhaegh GW, Smit FP, Karthaus HF, et al.
(1999) DD3: a new prostate-specific gene, highly overexpressed in prostate
cancer. Cancer Res 59: 5975–5979.
55. Roth TJ, Sheinin Y, Lohse CM, Kuntz SM, Frigola X, et al. (2007) B7-H3
ligand expression by prostate cancer: a novel marker of prognosis and potential
target for therapy. Cancer Res 67: 7893–7900.
56. Yang G, Truong LD, Timme TL, Ren C, Wheeler TM, et al. (1998) Elevated
expression of caveolin is associated with prostate and breast cancer. Clin Cancer
Res 4: 1873–1880.
57. Korn EL (1986) Censoring distributions as a measure of follow-up in survival
analysis. Stat Med 5: 255–260.
58. Brimo F, Montironi R, Egevad L, Erbersdobler A, Lin DW, et al. (2013)
Contemporary grading for prostate cancer: implications for patient care. Eur
Urol 63: 892–901.
59. Singh AP, Bafna S, Chaudhary K, Venkatraman G, Smith L, et al. (2008)
Genome-wide expression profiling reveals transcriptomic variation and per-
turbed gene networks in androgen-dependent and androgen-independent
prostate cancer cells. Cancer Lett 259: 28–38.
60. LaTulippe E, Satagopan J, Smith A, Scher H, Scardino P, et al. (2002)
Comprehensive gene expression analysis of prostate cancer reveals distinct
transcriptional programs associated with metastatic disease. Cancer Res 62:
4499–4506.
61. Gorlov IP, Byun J, Gorlova OY, Aparicio AM, Efstathiou E, et al. (2009)
Candidate pathways and genes for prostate cancer: a meta-analysis of gene
expression data. BMC Med Genomics 2: 48.
62. Van Den Berg C, Guan XY, Von Hoff D, Jenkins R, Bittner, etal. (1995) DNA
sequence amplification in human prostate cancer identified by chromosome
microdissection: potential prognostic implications. Clin Cancer Res 1: 11–18.
63. Levin AM, Machiela MJ, Zuhlke KA, Ray AM, Cooney KA, et al. (2008)
Chromosome 17q12 variants contribute to risk of early-onset prostate cancer.
Cancer Res 68: 6492–6495.
64. Viticchie G, Lena AM, Latina A, Formosa A, Gregersen LH, et al. (2011) MiR-
203 controls proliferation, migration and invasive potential of prostate cancer
cell lines. Cell Cycle 10: 1121–1131.
65. Bera TK, Das S, Maeda H, Beers R, Wolfgang CD, et al. (2004) NGEP, a gene
encoding a membrane protein detected only in prostate cancer and normal
prostate. Proc Natl Acad Sci U S A 101: 3059–3064.
66. Chung EY, Liu J, Homma Y, Zhang Y, Brendolan A, et al. (2007) Interleukin-10
expression in macrophages during phagocytosis of apoptotic cells is mediated by
homeodomain proteins Pbx1 and Prep-1. Immunity 27: 952–964.
67. Horton R, Wilming L, Rand V, Lovering RC, Bruford EA, et al. (2004) Gene
map of the extended human MHC. Nat Rev Genet 5: 889–899.
68. Barcellos LF, May SL, Ramsay PP, Quach HL, Lane JA, et al. (2009) High-
density SNP screening of the major histocompatibility complex in systemic lupus
erythematosus demonstrates strong evidence for independent susceptibility
regions. PLoS Genet 5: e1000696.
69. Chen Q, Watson JT, Marengo SR, Decker KS, Coleman I, et al. (2006) Gene
expression in the LNCaP human prostate cancer progression model: progression
associated expression in vitro corresponds to expression changes associated with
prostate cancer progression in vivo. Cancer Lett 244: 274–288.
70. Sreekumar A, Poisson LM, Rajendiran TM, Khan AP, Cao Q, et al. (2009)
Metabolomic profiles delineate potential role for sarcosine in prostate cancer
progression. Nature 457: 910–914.
71. Wishart DS, Jewison T, Guo AC, Wilson M, Knox C, et al. (2013) HMDB 3.0–
The Human Metabolome Database in 2013. Nucleic Acids Res 41: D801–807.
72. Poliseno L, Salmena L, Zhang J, Carver B, Haveman WJ, et al. (2010) A coding-
independent function of gene and pseudogene mRNAs regulates tumour
biology. Nature 465: 1033–1038.
73. Taylor BS, Schultz N, Hieronymus H, Gopalan A, Xiao Y, et al. (2010)
Integrative genomic profiling of human prostate cancer. Cancer Cell 18: 11–22.
Genomic Classifier Predicts Aggressive PCa
PLOS ONE | www.plosone.org 12 June 2013 | Volume 8 | Issue 6 | e66855
Copyright © 2022 FDOKUMEN