Sensitivity to Debt Type Predicts Financial Hea - UCLA ...
21
Running head: NOT ALL DEBTS ARE CREATED EQUAL 1 Not All Debts Are Created Equal: Sensitivity to Debt Type Predicts Financial Health Adam Eric Greenberg University of California, Los Angeles Abigail B. Sussman University of Chicago Hal E. Hershfield University of California, Los Angeles Author Note Adam Eric Greenberg, Anderson School of Management, University of California, Los Angeles, Abigail B. Sussman, Booth School of Business, University of Chicago, and Hal E. Hershfield, Anderson School of Management, University of California, Los Angeles. Address correspondence to: Adam Eric Greenberg, Anderson School of Management, University of California, Los Angeles, 110 Westwood Plaza, B-526, Los Angeles, California, USA 90095, Email: [email protected].
-
Upload
khangminh22 -
Category
Documents
-
view
3 -
download
0
Transcript of Sensitivity to Debt Type Predicts Financial Hea - UCLA ...
Running head: NOT ALL DEBTS ARE CREATED EQUAL 1
Not All Debts Are Created Equal: Sensitivity to Debt Type Predicts Financial Health
Adam Eric Greenberg
University of California, Los Angeles
Abigail B. Sussman
University of Chicago
Hal E. Hershfield
University of California, Los Angeles
Author Note
Adam Eric Greenberg, Anderson School of Management, University of California, Los
Angeles, Abigail B. Sussman, Booth School of Business, University of Chicago, and Hal E.
Hershfield, Anderson School of Management, University of California, Los Angeles.
Address correspondence to: Adam Eric Greenberg, Anderson School of Management,
University of California, Los Angeles, 110 Westwood Plaza, B-526, Los Angeles, California,
USA 90095, Email: [email protected].
NOT ALL DEBTS ARE CREATED EQUAL
2
Abstract
Financial decisions have important consequences for overall well-being; consequently, recent
research in psychology has aimed to understand how people think about debt. Yet, existing work
has largely failed to examine how attitudes and behaviors systematically vary as a function of
debt type. We demonstrate not only that are there are individual differences in attitudes toward
high-interest (e.g., payday loans) and low-interest (e.g., car loans) forms of debt, but also that the
extent to which an individual finds high-interest debts more aversive than low-interest debts
predicts financial health. This relationship cannot be explained by financial literacy, numeracy,
or intertemporal discounting. This research is the first to identify sensitivity to debt type as an
individual difference important for financial decision making.
Keywords: debt, judgment, well-being, financial health, financial literacy
NOT ALL DEBTS ARE CREATED EQUAL
3
Not All Debts Are Created Equal: Sensitivity to Debt Type Predicts Financial Health
Eighty-percent of Americans are debt holders, collectively owing nearly $13 trillion
(Federal Reserve Bank of New York, 2017; Pew Charitable Trusts, 2014). Yet, not all debtors
are in dire financial straits. Notably, there are many kinds of debt, ranging from mortgages that
are actively subsidized by the government to high-cost payday loans that are banned in 18 states.
Recent research by psychologists has begun to explore how people think about debt (e.g., Brown,
Taylor, & Price, 2005; Hershfield et al., 2015; Stewart, 2009; Sussman & Shafir, 2012).
However, this work has focused on general attitudes toward debt, neglecting potential
differences in attitudes toward various forms of debt. In the present paper, we ask whether these
differences exist, and if so, whether they matter. Given the financial burden that excessive, high-
cost debt places on so many Americans—but also the opportunities that debt can facilitate (e.g.,
education)—it is imperative to understand the relationship between attitudes toward specific debt
types and overall financial well-being. Accordingly, we investigate an unexplored individual
difference—sensitivity to debt type—and how it relates to financial health.
The relationship between debt attitudes and financial health could take several possible
forms. Having a general debt-averse attitude—while failing to discriminate across debt types—
could indicate financial prudence. This blanket caution could help people avoid financial pitfalls
and could signal broader financial health. Alternatively, the relationship could be the opposite: a
general debt-seeking attitude (irrespective of type) may indicate a willingness to take on
financial risks that allow for increased opportunities. However, attending to differences across
debt types allows for a third possibility: greater sensitivity to debt type could be associated with a
tendency to maximize value across opportunities, allowing people to take advantage of risks
while avoiding pitfalls in ways that promote broader financial health.
NOT ALL DEBTS ARE CREATED EQUAL
4
Debt Attitudes and Behaviors
Prior research has found evidence of debt aversion, but also finds high levels of debt
take-up in many circumstances. Researchers have documented debt-averse behavior in
laboratory and field settings (Burdman, 2005; Callender & Jackson, 2005; Meissner, 2016;
Prelec & Loewenstein, 1998). For example, people sometimes prepay their mortgages to avoid
holding debt, even when prepayment is suboptimal (Amromin, Huang, & Sialm, 2007). Holding
debt can significantly reduce perceptions of one’s own wealth (Sussman & Shafir, 2011) and
lead to emotional distress (Brown et al., 2005). Other work has aimed to understand why—
despite the prevalence of debt aversion—debt levels are so high, finding that debt may simply be
necessary to finance essential expenses (Lea, Webley, & Walker, 1995), is difficult to repay
(Hershfield & Roese, 2015; Stewart, 2009), and is at times less psychologically painful to take
on compared to using cash (e.g., Morewedge, Holtzman, & Epley, 2007; Prelec & Simester,
2001; Soman, 2001).
Despite this work directed toward understanding debt attitudes, there is scant literature on
how people differentiate between various forms of debt.1 In the current research, we examine
attitudes toward different types of debt and ask whether an individual’s propensity to distinguish
between debt types corresponds to overall financial health. Across three studies—including a
nationally representative sample—we find that differences in sensitivity to debt type play a
unique role in predicting financial health, even beyond other related factors.
Study 1
Study 1 takes an exploratory approach, examining whether and how attitudes toward debt
1 However, some theoretical work has distinguished between the uses of different types of debts
(e.g., Peñaloza & Barnhart, 2011; Prelec & Loewenstein 1998).
NOT ALL DEBTS ARE CREATED EQUAL
5
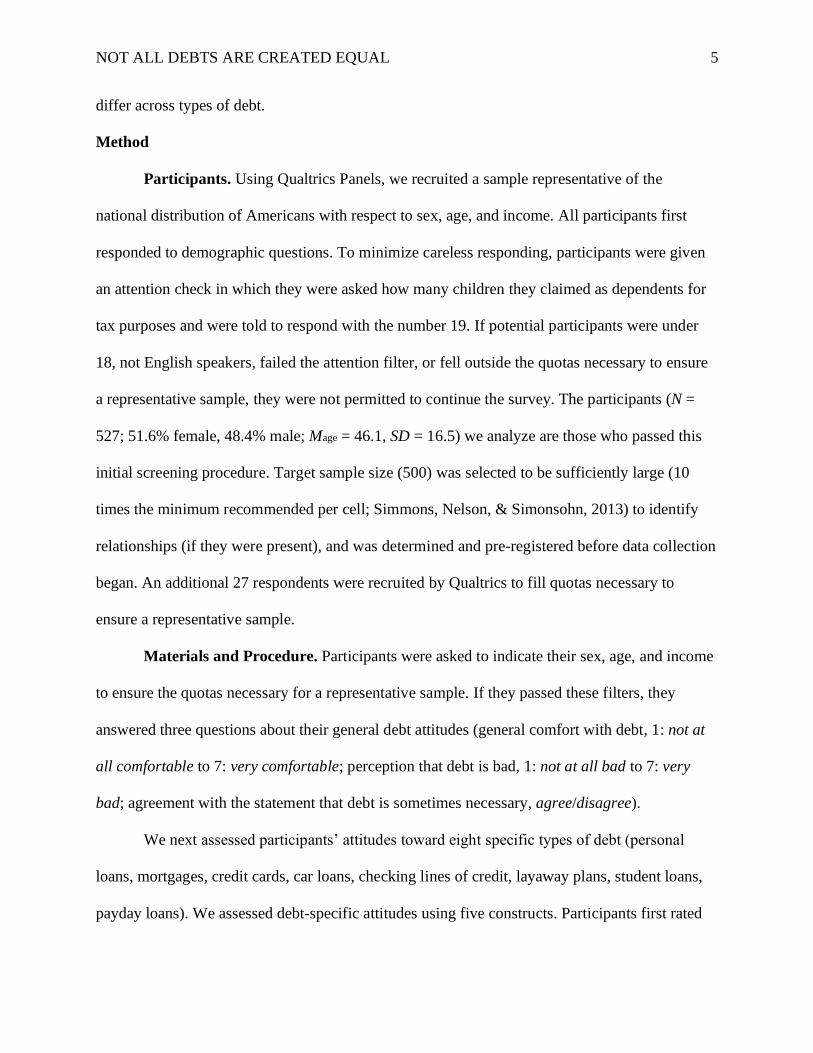
differ across types of debt.
Method
Participants. Using Qualtrics Panels, we recruited a sample representative of the
national distribution of Americans with respect to sex, age, and income. All participants first
responded to demographic questions. To minimize careless responding, participants were given
an attention check in which they were asked how many children they claimed as dependents for
tax purposes and were told to respond with the number 19. If potential participants were under
18, not English speakers, failed the attention filter, or fell outside the quotas necessary to ensure
a representative sample, they were not permitted to continue the survey. The participants (N =
527; 51.6% female, 48.4% male; Mage = 46.1, SD = 16.5) we analyze are those who passed this
initial screening procedure. Target sample size (500) was selected to be sufficiently large (10
times the minimum recommended per cell; Simmons, Nelson, & Simonsohn, 2013) to identify
relationships (if they were present), and was determined and pre-registered before data collection
began. An additional 27 respondents were recruited by Qualtrics to fill quotas necessary to
ensure a representative sample.
Materials and Procedure. Participants were asked to indicate their sex, age, and income
to ensure the quotas necessary for a representative sample. If they passed these filters, they
answered three questions about their general debt attitudes (general comfort with debt, 1: not at
all comfortable to 7: very comfortable; perception that debt is bad, 1: not at all bad to 7: very
bad; agreement with the statement that debt is sometimes necessary, agree/disagree).
We next assessed participants’ attitudes toward eight specific types of debt (personal
loans, mortgages, credit cards, car loans, checking lines of credit, layaway plans, student loans,
payday loans). We assessed debt-specific attitudes using five constructs. Participants first rated
NOT ALL DEBTS ARE CREATED EQUAL
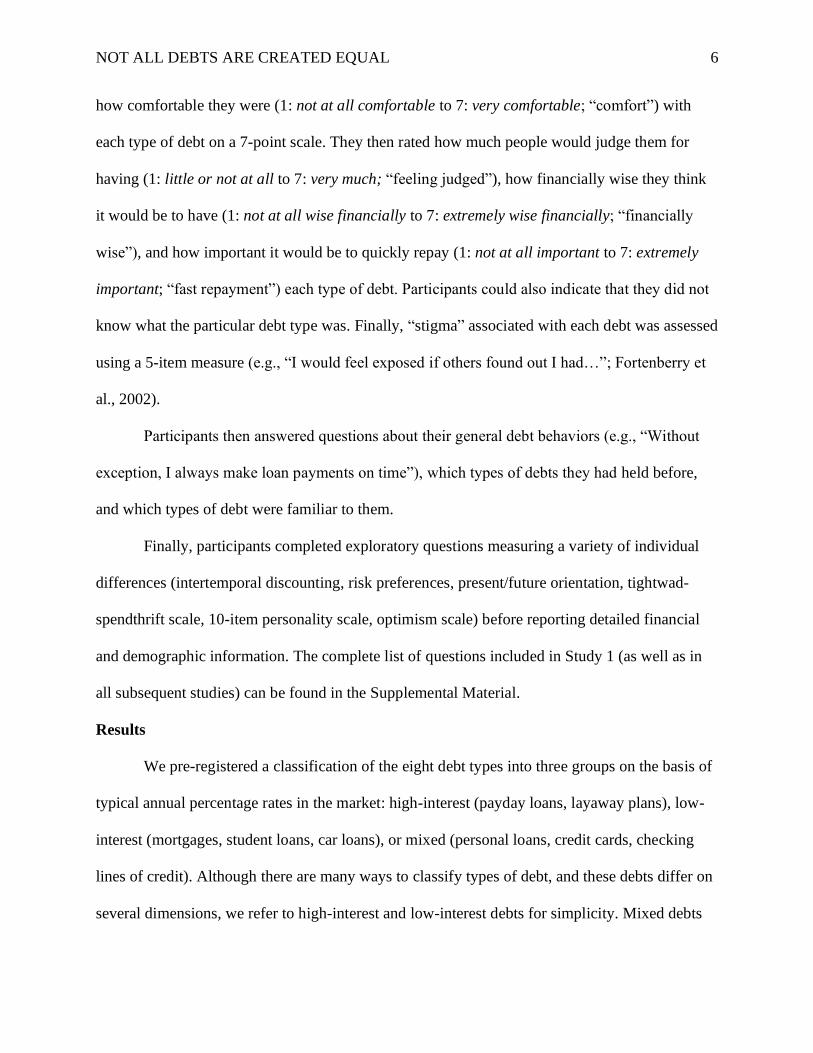
6
how comfortable they were (1: not at all comfortable to 7: very comfortable; “comfort”) with
each type of debt on a 7-point scale. They then rated how much people would judge them for
having (1: little or not at all to 7: very much; “feeling judged”), how financially wise they think
it would be to have (1: not at all wise financially to 7: extremely wise financially; “financially
wise”), and how important it would be to quickly repay (1: not at all important to 7: extremely
important; “fast repayment”) each type of debt. Participants could also indicate that they did not
know what the particular debt type was. Finally, “stigma” associated with each debt was assessed
using a 5-item measure (e.g., “I would feel exposed if others found out I had…”; Fortenberry et
al., 2002).
Participants then answered questions about their general debt behaviors (e.g., “Without
exception, I always make loan payments on time”), which types of debts they had held before,
and which types of debt were familiar to them.
Finally, participants completed exploratory questions measuring a variety of individual
differences (intertemporal discounting, risk preferences, present/future orientation, tightwad-
spendthrift scale, 10-item personality scale, optimism scale) before reporting detailed financial
and demographic information. The complete list of questions included in Study 1 (as well as in
all subsequent studies) can be found in the Supplemental Material.
Results
We pre-registered a classification of the eight debt types into three groups on the basis of
typical annual percentage rates in the market: high-interest (payday loans, layaway plans), low-
interest (mortgages, student loans, car loans), or mixed (personal loans, credit cards, checking
lines of credit). Although there are many ways to classify types of debt, and these debts differ on
several dimensions, we refer to high-interest and low-interest debts for simplicity. Mixed debts
NOT ALL DEBTS ARE CREATED EQUAL
7
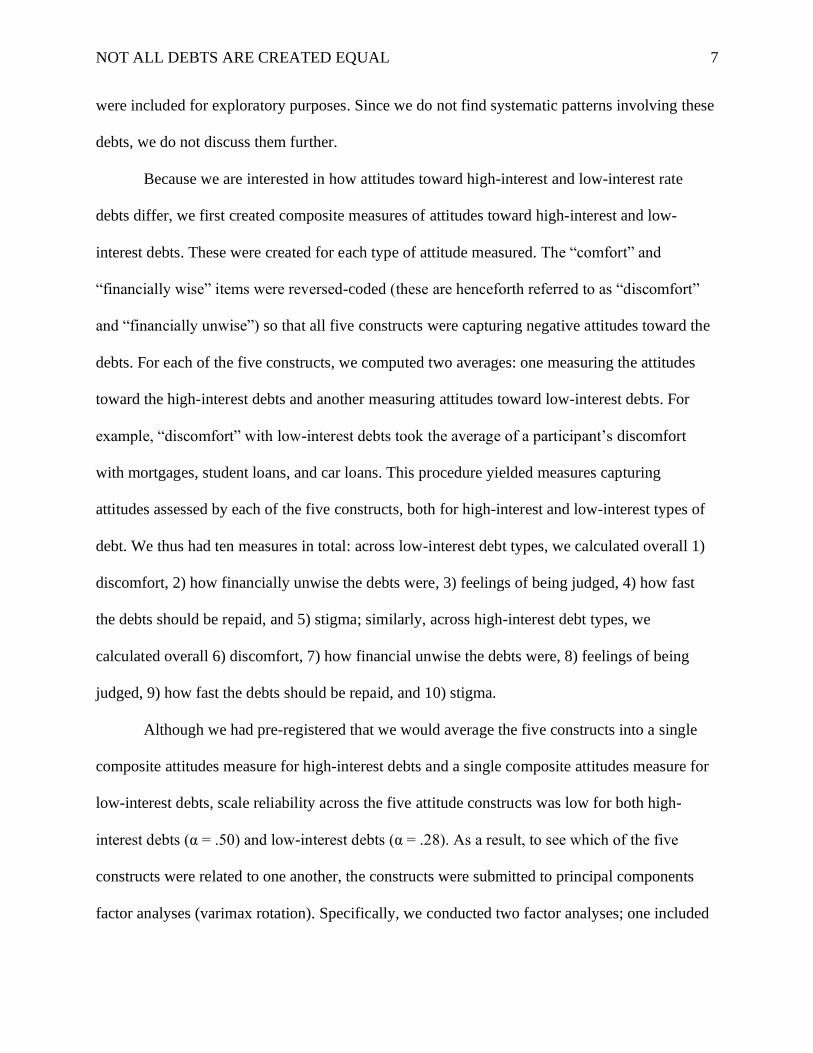
were included for exploratory purposes. Since we do not find systematic patterns involving these
debts, we do not discuss them further.
Because we are interested in how attitudes toward high-interest and low-interest rate
debts differ, we first created composite measures of attitudes toward high-interest and low-
interest debts. These were created for each type of attitude measured. The “comfort” and
“financially wise” items were reversed-coded (these are henceforth referred to as “discomfort”
and “financially unwise”) so that all five constructs were capturing negative attitudes toward the
debts. For each of the five constructs, we computed two averages: one measuring the attitudes
toward the high-interest debts and another measuring attitudes toward low-interest debts. For
example, “discomfort” with low-interest debts took the average of a participant’s discomfort
with mortgages, student loans, and car loans. This procedure yielded measures capturing
attitudes assessed by each of the five constructs, both for high-interest and low-interest types of
debt. We thus had ten measures in total: across low-interest debt types, we calculated overall 1)
discomfort, 2) how financially unwise the debts were, 3) feelings of being judged, 4) how fast
the debts should be repaid, and 5) stigma; similarly, across high-interest debt types, we
calculated overall 6) discomfort, 7) how financial unwise the debts were, 8) feelings of being
judged, 9) how fast the debts should be repaid, and 10) stigma.
Although we had pre-registered that we would average the five constructs into a single
composite attitudes measure for high-interest debts and a single composite attitudes measure for
low-interest debts, scale reliability across the five attitude constructs was low for both high-
interest debts (α = .50) and low-interest debts (α = .28). As a result, to see which of the five
constructs were related to one another, the constructs were submitted to principal components
factor analyses (varimax rotation). Specifically, we conducted two factor analyses; one included
NOT ALL DEBTS ARE CREATED EQUAL
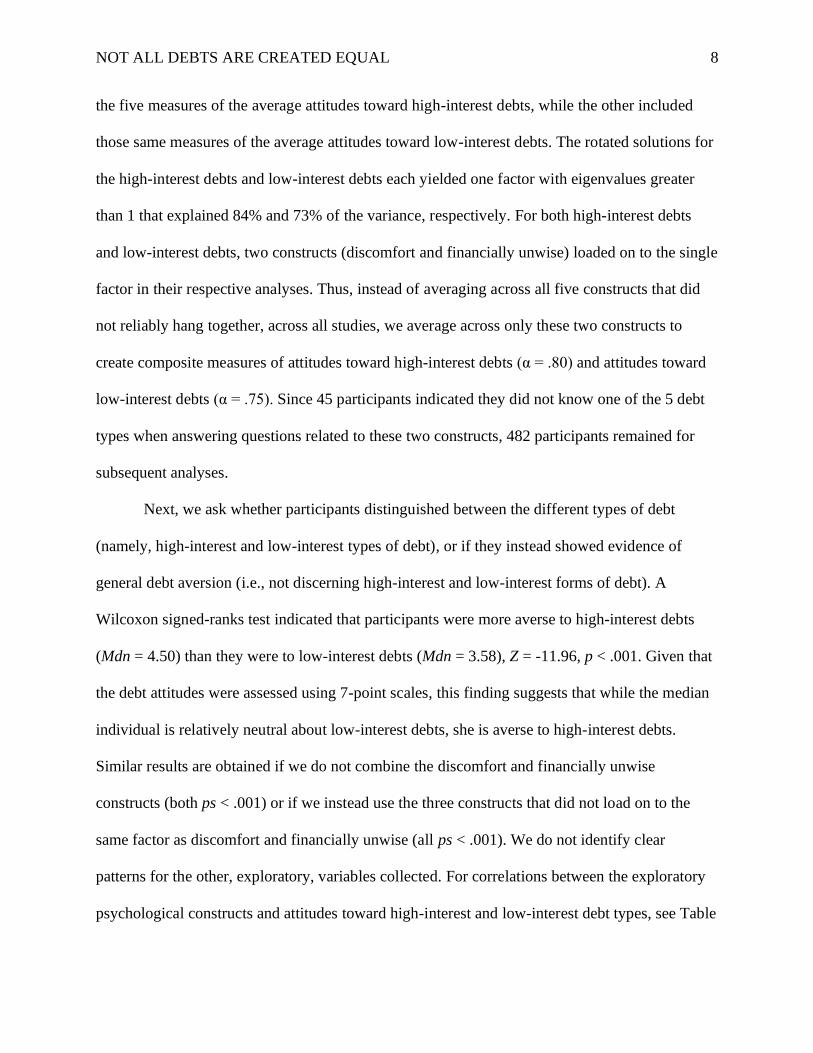
8
the five measures of the average attitudes toward high-interest debts, while the other included
those same measures of the average attitudes toward low-interest debts. The rotated solutions for
the high-interest debts and low-interest debts each yielded one factor with eigenvalues greater
than 1 that explained 84% and 73% of the variance, respectively. For both high-interest debts
and low-interest debts, two constructs (discomfort and financially unwise) loaded on to the single
factor in their respective analyses. Thus, instead of averaging across all five constructs that did
not reliably hang together, across all studies, we average across only these two constructs to
create composite measures of attitudes toward high-interest debts (α = .80) and attitudes toward
low-interest debts (α = .75). Since 45 participants indicated they did not know one of the 5 debt
types when answering questions related to these two constructs, 482 participants remained for
subsequent analyses.
Next, we ask whether participants distinguished between the different types of debt
(namely, high-interest and low-interest types of debt), or if they instead showed evidence of
general debt aversion (i.e., not discerning high-interest and low-interest forms of debt). A
Wilcoxon signed-ranks test indicated that participants were more averse to high-interest debts
(Mdn = 4.50) than they were to low-interest debts (Mdn = 3.58), Z = -11.96, p < .001. Given that
the debt attitudes were assessed using 7-point scales, this finding suggests that while the median
individual is relatively neutral about low-interest debts, she is averse to high-interest debts.
Similar results are obtained if we do not combine the discomfort and financially unwise
constructs (both ps < .001) or if we instead use the three constructs that did not load on to the
same factor as discomfort and financially unwise (all ps < .001). We do not identify clear
patterns for the other, exploratory, variables collected. For correlations between the exploratory
psychological constructs and attitudes toward high-interest and low-interest debt types, see Table
NOT ALL DEBTS ARE CREATED EQUAL
9
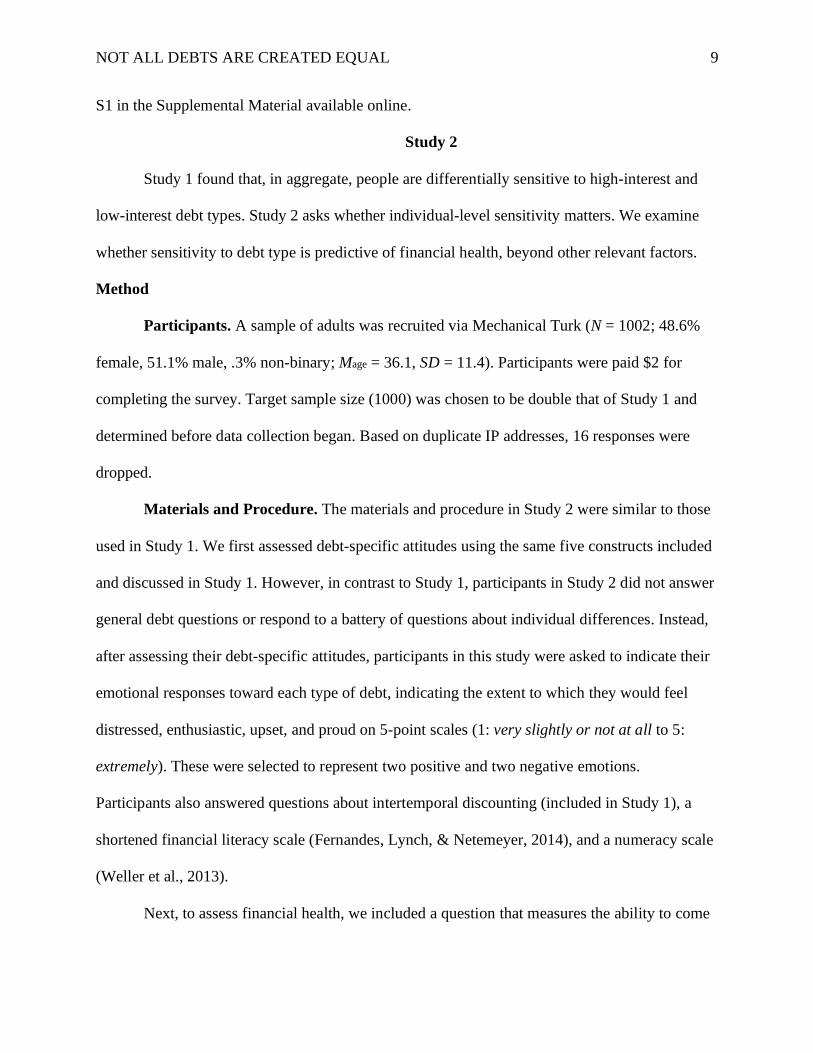
S1 in the Supplemental Material available online.
Study 2
Study 1 found that, in aggregate, people are differentially sensitive to high-interest and
low-interest debt types. Study 2 asks whether individual-level sensitivity matters. We examine
whether sensitivity to debt type is predictive of financial health, beyond other relevant factors.
Method
Participants. A sample of adults was recruited via Mechanical Turk (N = 1002; 48.6%
female, 51.1% male, .3% non-binary; Mage = 36.1, SD = 11.4). Participants were paid $2 for
completing the survey. Target sample size (1000) was chosen to be double that of Study 1 and
determined before data collection began. Based on duplicate IP addresses, 16 responses were
dropped.
Materials and Procedure. The materials and procedure in Study 2 were similar to those
used in Study 1. We first assessed debt-specific attitudes using the same five constructs included
and discussed in Study 1. However, in contrast to Study 1, participants in Study 2 did not answer
general debt questions or respond to a battery of questions about individual differences. Instead,
after assessing their debt-specific attitudes, participants in this study were asked to indicate their
emotional responses toward each type of debt, indicating the extent to which they would feel
distressed, enthusiastic, upset, and proud on 5-point scales (1: very slightly or not at all to 5:
extremely). These were selected to represent two positive and two negative emotions.
Participants also answered questions about intertemporal discounting (included in Study 1), a
shortened financial literacy scale (Fernandes, Lynch, & Netemeyer, 2014), and a numeracy scale
(Weller et al., 2013).
Next, to assess financial health, we included a question that measures the ability to come

NOT ALL DEBTS ARE CREATED EQUAL
10
up with funds quickly: “How confident are you that you could come up with $2,000 if an
unexpected need arose within the next month?” (Lusardi, Schneider, & Tufano, 2011). Possible
responses included “I am certain I could come up with the full $2,000,” “I could probably come
up with $2,000,” “I could probably not come up with $2,000,” or “I am certain I could not come
up with $2,000,” which were coded as 4, 3, 2, and 1, respectively. Participants could also refuse
to answer or indicate that they did not know; these were excluded from analyses involving
financial health. Finally, all participants reported detailed financial and demographic
information.
Results
Because 47 participants indicated they did not know one of the 5 debt types when
answering questions related to these two constructs, 939 participants remained for subsequent
analyses. As in Study 1, the two constructs “discomfort” and “financially unwise” were averaged
to create composite measures of aversion to high-interest debts (α = .69) and aversion to low-
interest debts (α = .65). As in Study 1, participants were more averse to high-interest debts (Mdn
= 5.25) than they were to low-interest debts (Mdn = 3.83), Z = -21.10, p < .001.
To examine whether sensitivity to debt type predicted financial health, we regressed the
financial health measure on the difference between aversion to high-interest and low-interest
debts. As shown in Table 1, greater differences between aversion to high-interest and low-
interest debts predicted higher levels of financial health (B = .195, SE = .025, t(920) = 7.69, p <
.001; model 1, Table 1). This relationship between the difference in aversion to high-interest and
low-interest debts and financial health persisted even when controlling for income, age, and
gender (B = .120, SE = .025, t(900) = 4.84, p < .001).
It is possible that sensitivity to debt type is picking up on differences in the positive
NOT ALL DEBTS ARE CREATED EQUAL
11
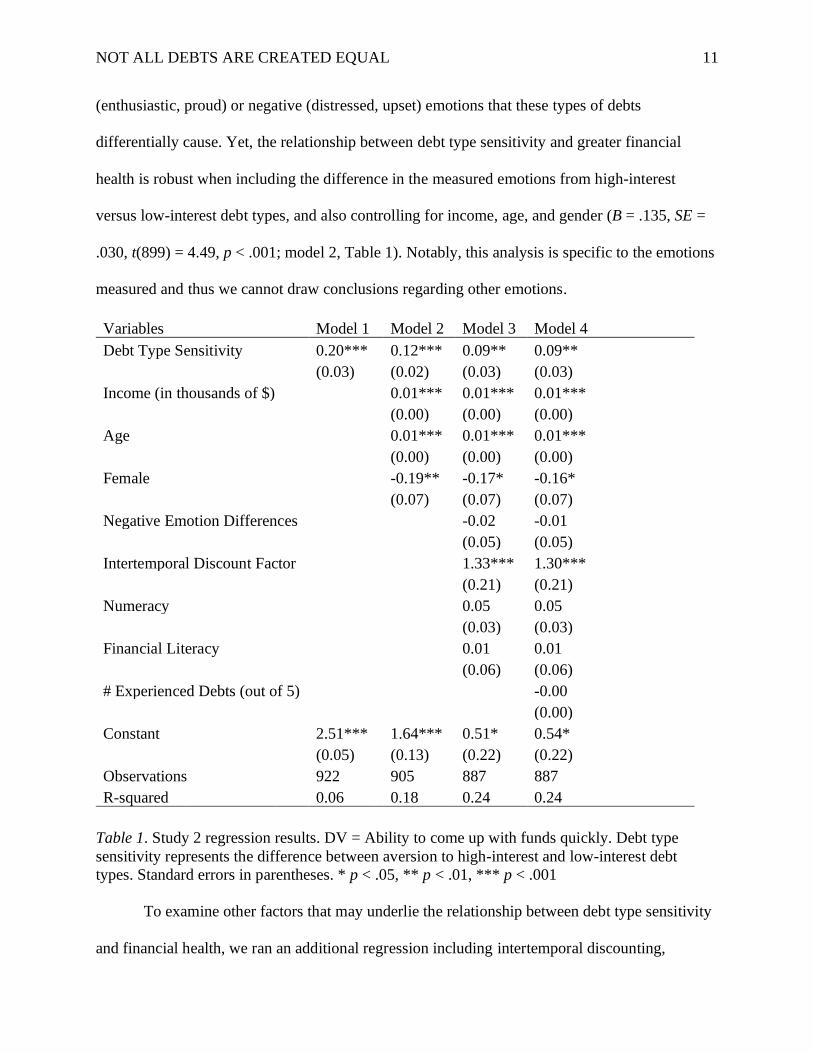
(enthusiastic, proud) or negative (distressed, upset) emotions that these types of debts
differentially cause. Yet, the relationship between debt type sensitivity and greater financial
health is robust when including the difference in the measured emotions from high-interest
versus low-interest debt types, and also controlling for income, age, and gender (B = .135, SE =
.030, t(899) = 4.49, p < .001; model 2, Table 1). Notably, this analysis is specific to the emotions
measured and thus we cannot draw conclusions regarding other emotions.
Variables Model 1 Model 2 Model 3 Model 4
Debt Type Sensitivity 0.20*** 0.12*** 0.09** 0.09**
(0.03) (0.02) (0.03) (0.03) Income (in thousands of $) 0.01*** 0.01*** 0.01***
(0.00) (0.00) (0.00) Age 0.01*** 0.01*** 0.01***
(0.00) (0.00) (0.00) Female -0.19** -0.17* -0.16*
(0.07) (0.07) (0.07) Negative Emotion Differences -0.02 -0.01
(0.05) (0.05) Intertemporal Discount Factor 1.33*** 1.30***
(0.21) (0.21) Numeracy 0.05 0.05
(0.03) (0.03) Financial Literacy 0.01 0.01
(0.06) (0.06) # Experienced Debts (out of 5) -0.00
(0.00) Constant 2.51*** 1.64*** 0.51* 0.54*
(0.05) (0.13) (0.22) (0.22) Observations 922 905 887 887 R-squared 0.06 0.18 0.24 0.24
Table 1. Study 2 regression results. DV = Ability to come up with funds quickly. Debt type
sensitivity represents the difference between aversion to high-interest and low-interest debt
types. Standard errors in parentheses. * p < .05, ** p < .01, *** p < .001
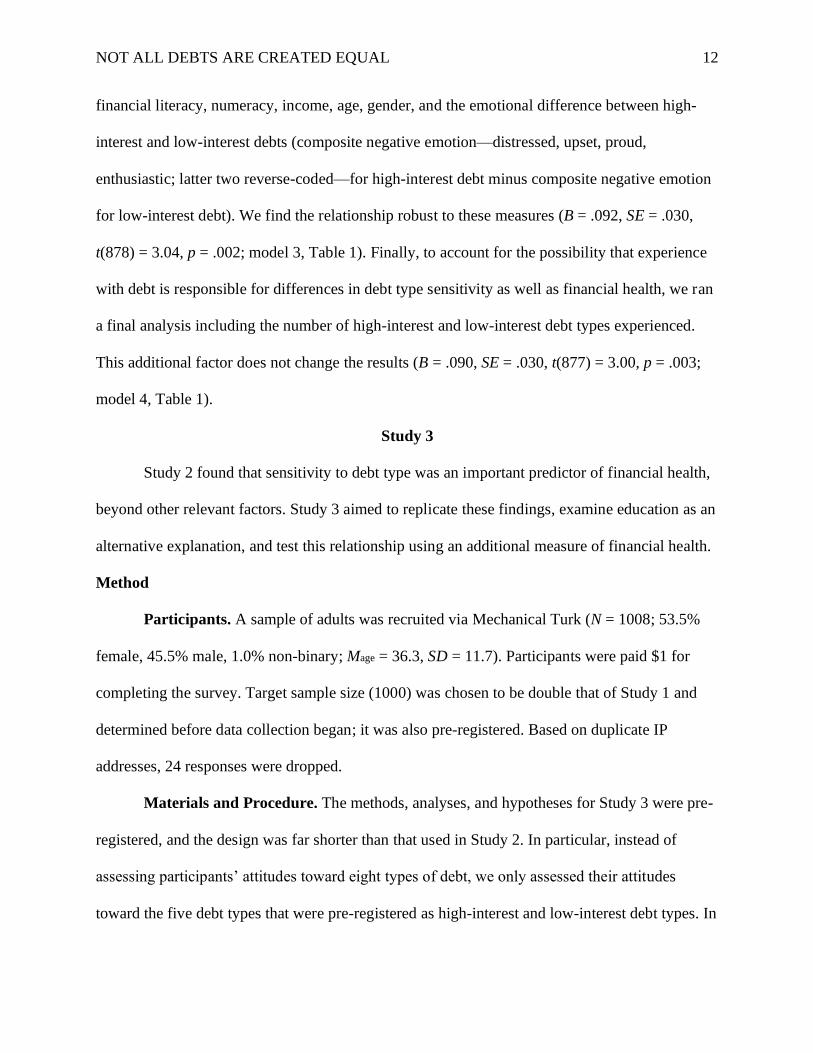
To examine other factors that may underlie the relationship between debt type sensitivity
and financial health, we ran an additional regression including intertemporal discounting,
NOT ALL DEBTS ARE CREATED EQUAL
12
financial literacy, numeracy, income, age, gender, and the emotional difference between high-
interest and low-interest debts (composite negative emotion—distressed, upset, proud,
enthusiastic; latter two reverse-coded—for high-interest debt minus composite negative emotion
for low-interest debt). We find the relationship robust to these measures (B = .092, SE = .030,
t(878) = 3.04, p = .002; model 3, Table 1). Finally, to account for the possibility that experience
with debt is responsible for differences in debt type sensitivity as well as financial health, we ran
a final analysis including the number of high-interest and low-interest debt types experienced.
This additional factor does not change the results (B = .090, SE = .030, t(877) = 3.00, p = .003;
model 4, Table 1).
Study 3
Study 2 found that sensitivity to debt type was an important predictor of financial health,
beyond other relevant factors. Study 3 aimed to replicate these findings, examine education as an
alternative explanation, and test this relationship using an additional measure of financial health.
Method
Participants. A sample of adults was recruited via Mechanical Turk (N = 1008; 53.5%
female, 45.5% male, 1.0% non-binary; Mage = 36.3, SD = 11.7). Participants were paid $1 for
completing the survey. Target sample size (1000) was chosen to be double that of Study 1 and
determined before data collection began; it was also pre-registered. Based on duplicate IP
addresses, 24 responses were dropped.
Materials and Procedure. The methods, analyses, and hypotheses for Study 3 were pre-
registered, and the design was far shorter than that used in Study 2. In particular, instead of
assessing participants’ attitudes toward eight types of debt, we only assessed their attitudes
toward the five debt types that were pre-registered as high-interest and low-interest debt types. In
NOT ALL DEBTS ARE CREATED EQUAL
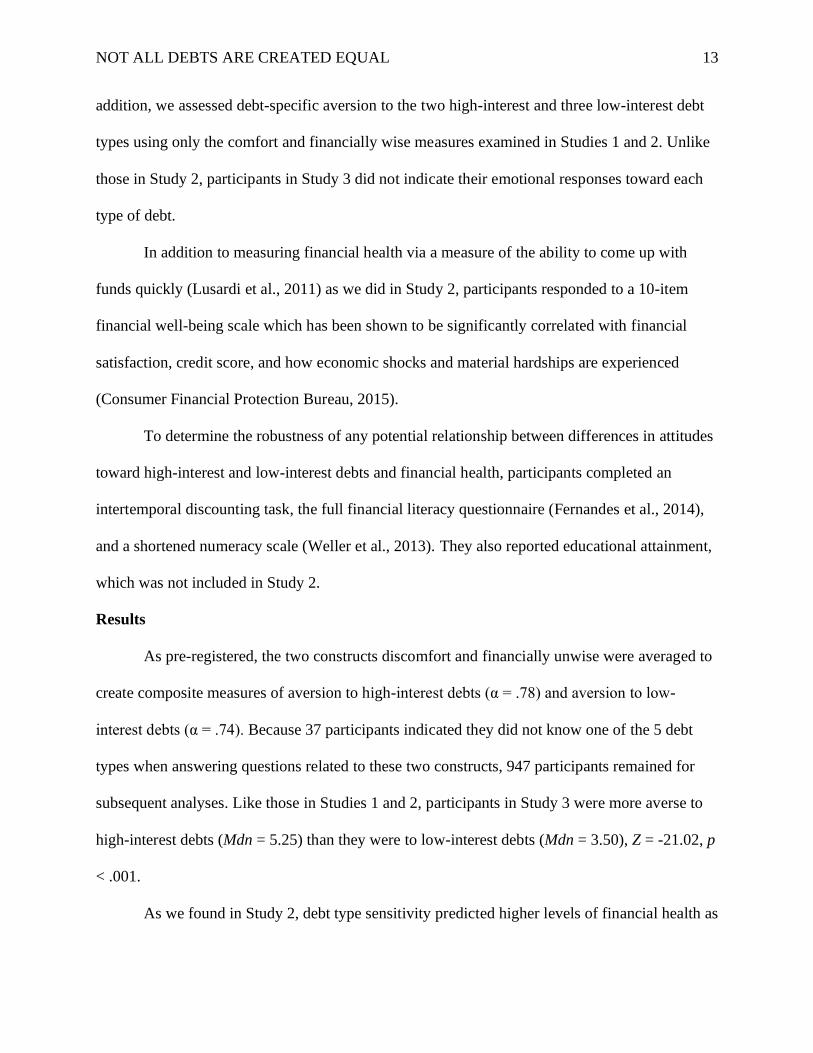
13
addition, we assessed debt-specific aversion to the two high-interest and three low-interest debt
types using only the comfort and financially wise measures examined in Studies 1 and 2. Unlike
those in Study 2, participants in Study 3 did not indicate their emotional responses toward each
type of debt.
In addition to measuring financial health via a measure of the ability to come up with
funds quickly (Lusardi et al., 2011) as we did in Study 2, participants responded to a 10-item
financial well-being scale which has been shown to be significantly correlated with financial
satisfaction, credit score, and how economic shocks and material hardships are experienced
(Consumer Financial Protection Bureau, 2015).
To determine the robustness of any potential relationship between differences in attitudes
toward high-interest and low-interest debts and financial health, participants completed an
intertemporal discounting task, the full financial literacy questionnaire (Fernandes et al., 2014),
and a shortened numeracy scale (Weller et al., 2013). They also reported educational attainment,
which was not included in Study 2.
Results
As pre-registered, the two constructs discomfort and financially unwise were averaged to
create composite measures of aversion to high-interest debts (α = .78) and aversion to low-
interest debts (α = .74). Because 37 participants indicated they did not know one of the 5 debt
types when answering questions related to these two constructs, 947 participants remained for
subsequent analyses. Like those in Studies 1 and 2, participants in Study 3 were more averse to
high-interest debts (Mdn = 5.25) than they were to low-interest debts (Mdn = 3.50), Z = -21.02, p
< .001.
As we found in Study 2, debt type sensitivity predicted higher levels of financial health as
NOT ALL DEBTS ARE CREATED EQUAL
14
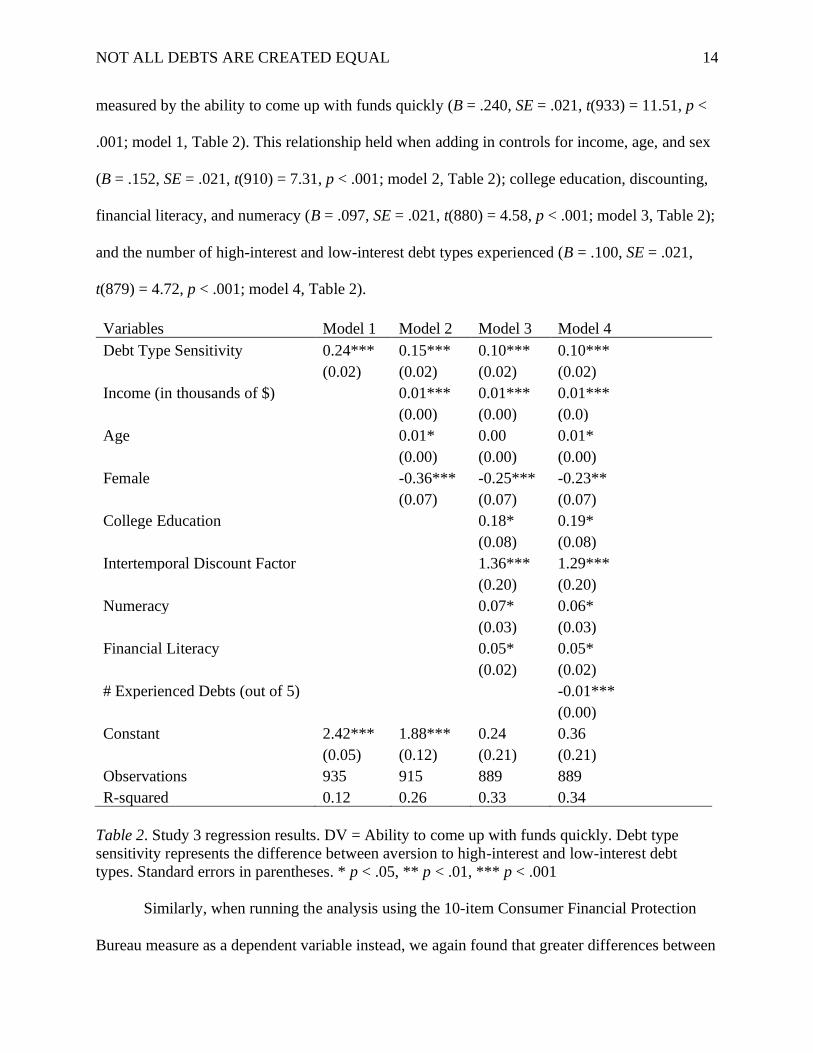
measured by the ability to come up with funds quickly (B = .240, SE = .021, t(933) = 11.51, p <
.001; model 1, Table 2). This relationship held when adding in controls for income, age, and sex
(B = .152, SE = .021, t(910) = 7.31, p < .001; model 2, Table 2); college education, discounting,
financial literacy, and numeracy (B = .097, SE = .021, t(880) = 4.58, p < .001; model 3, Table 2);
and the number of high-interest and low-interest debt types experienced (B = .100, SE = .021,
t(879) = 4.72, p < .001; model 4, Table 2).
Variables Model 1 Model 2 Model 3 Model 4
Debt Type Sensitivity 0.24*** 0.15*** 0.10*** 0.10***
(0.02) (0.02) (0.02) (0.02) Income (in thousands of $) 0.01*** 0.01*** 0.01***
(0.00) (0.00) (0.0) Age 0.01* 0.00 0.01*
(0.00) (0.00) (0.00) Female -0.36*** -0.25*** -0.23**
(0.07) (0.07) (0.07) College Education 0.18* 0.19*
(0.08) (0.08) Intertemporal Discount Factor 1.36*** 1.29***
(0.20) (0.20) Numeracy 0.07* 0.06*
(0.03) (0.03) Financial Literacy 0.05* 0.05*
(0.02) (0.02) # Experienced Debts (out of 5) -0.01***
(0.00) Constant 2.42*** 1.88*** 0.24 0.36
(0.05) (0.12) (0.21) (0.21) Observations 935 915 889 889 R-squared 0.12 0.26 0.33 0.34
Table 2. Study 3 regression results. DV = Ability to come up with funds quickly. Debt type
sensitivity represents the difference between aversion to high-interest and low-interest debt
types. Standard errors in parentheses. * p < .05, ** p < .01, *** p < .001
Similarly, when running the analysis using the 10-item Consumer Financial Protection
Bureau measure as a dependent variable instead, we again found that greater differences between
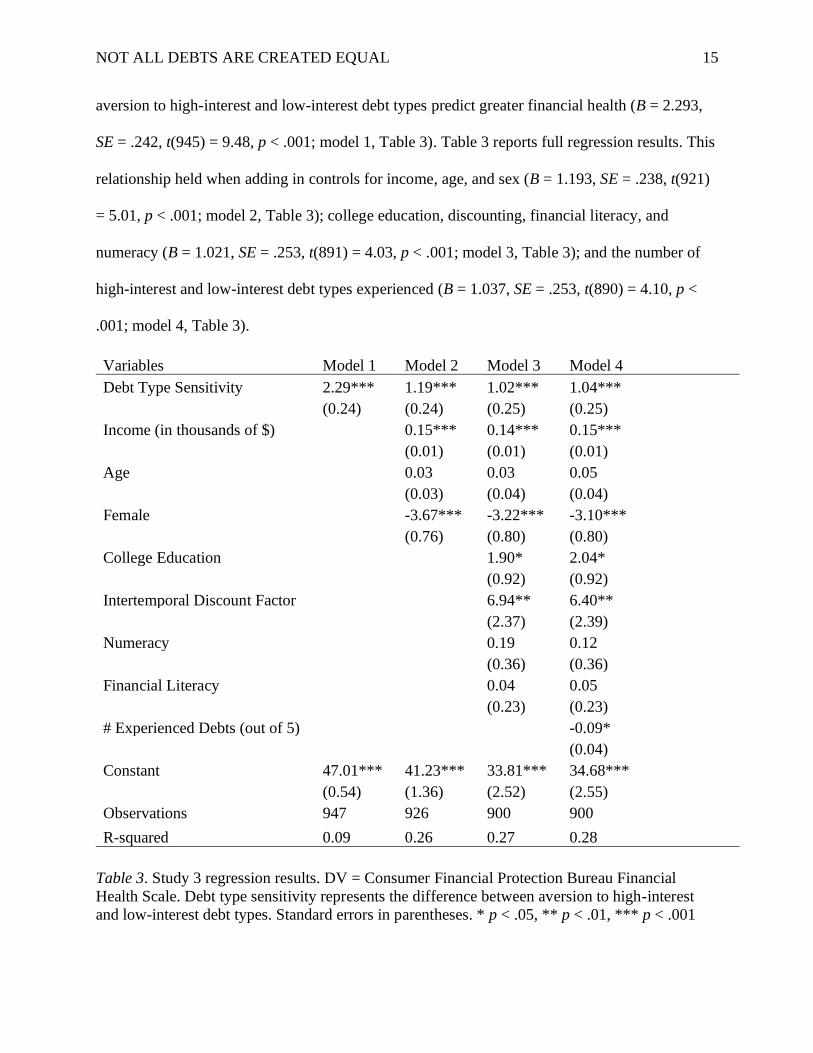
NOT ALL DEBTS ARE CREATED EQUAL
15
aversion to high-interest and low-interest debt types predict greater financial health (B = 2.293,
SE = .242, t(945) = 9.48, p < .001; model 1, Table 3). Table 3 reports full regression results. This
relationship held when adding in controls for income, age, and sex (B = 1.193, SE = .238, t(921)
= 5.01, p < .001; model 2, Table 3); college education, discounting, financial literacy, and
numeracy (B = 1.021, SE = .253, t(891) = 4.03, p < .001; model 3, Table 3); and the number of
high-interest and low-interest debt types experienced (B = 1.037, SE = .253, t(890) = 4.10, p <
.001; model 4, Table 3).
Variables Model 1 Model 2 Model 3 Model 4
Debt Type Sensitivity 2.29*** 1.19*** 1.02*** 1.04***
(0.24) (0.24) (0.25) (0.25)
Income (in thousands of $) 0.15*** 0.14*** 0.15***
(0.01) (0.01) (0.01)
Age 0.03 0.03 0.05
(0.03) (0.04) (0.04)
Female -3.67*** -3.22*** -3.10***
(0.76) (0.80) (0.80)
College Education 1.90* 2.04*
(0.92) (0.92)
Intertemporal Discount Factor 6.94** 6.40**
(2.37) (2.39)
Numeracy 0.19 0.12
(0.36) (0.36)
Financial Literacy 0.04 0.05
(0.23) (0.23)
# Experienced Debts (out of 5) -0.09*
(0.04)
Constant 47.01*** 41.23*** 33.81*** 34.68***
(0.54) (1.36) (2.52) (2.55)
Observations 947 926 900 900
R-squared 0.09 0.26 0.27 0.28
Table 3. Study 3 regression results. DV = Consumer Financial Protection Bureau Financial
Health Scale. Debt type sensitivity represents the difference between aversion to high-interest
and low-interest debt types. Standard errors in parentheses. * p < .05, ** p < .01, *** p < .001
NOT ALL DEBTS ARE CREATED EQUAL
16
Discussion
Given the extent of financial fragility in the United States, understanding the antecedents
of financial health is an important theoretical and practical endeavor. Across three studies, we
demonstrate that people have different attitudes toward high-interest and low-interest debts, and
that greater differences between these attitudes are predictive of financial health. Other relevant
factors (e.g., income, education) do not explain this relationship. To date, attitudes towards debt
have been treated in a general manner. The current research shows that not all debts are
perceived the same way, and that the propensity to distinguish between debt types is an
important and previously unexplored individual difference.
We examined the possibility that sensitivity to debt type is another instantiation of
financial literacy, but we did not find support for this hypothesis. Rather than being a measure of
what people know or have experienced, our measure instead combines feelings of comfort with
holding different types of debt and perceptions of how wise taking on these debts would be.
Similarly, we did not find that a person’s patience (i.e., discount rate) or general numeric ability
explains this relationship.
Future research should thus further explore the mechanisms driving the relationship
between debt type sensitivity and financial health. For example, it is possible that a sense of
cognitive flexibility underlies this link, allowing people to take situational context into account
when making financial decisions. Alternatively, individual differences in mental accounting may
lead some people to create more nuanced categories for financial resources. This could allow
people, for example, to react differently to debt types that have different consequences for
financial health.
Recent work by psychologists has explored how people make financial decisions and

NOT ALL DEBTS ARE CREATED EQUAL
17
think about debt. The present research furthers this growing body of literature by demonstrating
a unique link between debt type sensitivity and financial well-being. It is our hope that
psychologists and policymakers will be able to use these insights to help improve financial
health.

NOT ALL DEBTS ARE CREATED EQUAL
18
Author Contributions
All authors developed the concept and designed the studies for this article. A.E.
Greenberg conducted the data analyses. All authors wrote and approved the final version of the
manuscript for submission.
NOT ALL DEBTS ARE CREATED EQUAL
19
References
Amromin, G., Huang, J., & Sialm, C. (2007). The tradeoff between mortgage prepayments and
tax-deferred retirement savings. Journal of Public Economics, 91(10), 2014-2040.
Brown, S., Taylor, K., & Price, S. W. (2005). Debt and distress: Evaluating the psychological
cost of credit. Journal of Economic Psychology, 26(5), 642-663.
Burdman, P. (2005). The student debt dilemma: Debt aversion as a barrier to college access.
U.C. Berkeley Center for Studies in Higher Education Research & Occasional Paper
Series, CSHE.13.05.
Callender, C., & Jackson, J. (2005). Does the fear of debt deter students from higher education?
Journal of Social Policy, 34(4), 509-540.
Federal Reserve Bank of New York. (2017). Household debt and credit report.
https://www.newyorkfed.org/microeconomics/hhdc.html.
Fortenberry, J. D., McFarlane, M., Bleakley, A., Bull, S., Fishbein, M., Grimley, D. M., … &
Stoner, B. P. (2002). Relationships of stigma and shame to gonorrhea and HIV
screening. American Journal of Public Health, 92(3), 378-381.
Hershfield, H. E., & Roese, N. J. (2015). Dual payoff scenario warnings on credit card
statements elicit suboptimal payoff decisions. Journal of Consumer Psychology, 25(1),
15-27.
Hershfield, H. E., Sussman, A. B., O’Brien, R. L., & Bryan, C. J. (2015). Leveraging
psychological insights to encourage the responsible use of consumer debt. Perspectives
on Psychological Science, 10(6), 749-752.
Lea, S. E., Webley, P., & Walker, C. M. (1995). Psychological factors in consumer debt: Money
management, economic socialization, and credit use. Journal of Economic Psychology,
NOT ALL DEBTS ARE CREATED EQUAL
20
16(4), 681-701.
Lusardi, A., Schneider, D., & Tufano, P. (2011). Financially fragile households: Evidence and
implications. Brookings Papers on Economic Activity, 42(1), 83-150.
Meissner, T. (2016). Intertemporal consumption and debt aversion: An experimental study.
Experimental Economics, 19(2), 281-298.
Morewedge, C. K., Holtzman, L., & Epley, N. (2007). Unfixed resources: Perceived costs,
consumption, and the accessible account effect. Journal of Consumer Research, 34(4),
459-467.
Peñaloza, L., & Barnhart, M. (2011). Living US capitalism: the normalization of credit/
debt. Journal of Consumer Research, 38(4), 743-762.
Pew Charitable Trusts. (2014). The complex story of American debt. Retrieved from
http://www.pewtrusts.org/~/media/assets/2015/07/reach-of-debt-report_artfinal.pdf.
Prelec, D., & Loewenstein, G. (1998). The red and the black: Mental accounting of savings and
debt. Marketing Science, 17(1), 4-28.
Prelec, D., & Simester, D. (2001). Always leave home without it: A further investigation of the
credit-card effect on willingness to pay. Marketing Letters, 12(1), 5-12.
Simmons, J. P., Nelson, L. D., & Simonsohn, U. (2013). Life after p-hacking. Advances in
Consumer Research, 41, 775.
Soman, D. (2001). Effects of payment mechanism on spending behavior: The role of rehearsal
and immediacy of payments. Journal of Consumer Research, 27(4), 460-474.
Stewart, N. (2009). The cost of anchoring on credit-card minimum repayments. Psychological
Science, 20(1), 39-41.
Sussman, A. B., & Shafir, E. (2012). On assets and debt in the psychology of perceived wealth.

NOT ALL DEBTS ARE CREATED EQUAL
21
Psychological Science, 23(1), 101-108.
Weller, J., Dieckmann, N. F., Tusler, M., Mertz, C. K., Burns, W., & Peters, E. (2013).
Development and testing of an abbreviated numeracy scale: A Rasch analysis approach.
Journal of Behavioral Decision Making, 26(2), 198-212.