UCLA Electronic Theses and Dissertations - eScholarship
217
UCLA UCLA Electronic Theses and Dissertations Title Bogota Humana's climate resettlements: Displacement and the limits of the housing market in Colombia Permalink https://escholarship.org/uc/item/6t3827cr Author Sarmiento, Hugo Publication Date 2018 Peer reviewed|Thesis/dissertation eScholarship.org Powered by the California Digital Library University of California
-
Upload
khangminh22 -
Category
Documents
-
view
0 -
download
0
Transcript of UCLA Electronic Theses and Dissertations - eScholarship
UCLAUCLA Electronic Theses and Dissertations
TitleBogota Humana's climate resettlements: Displacement and the limits of the housing market in Colombia
Permalinkhttps://escholarship.org/uc/item/6t3827cr
AuthorSarmiento, Hugo
Publication Date2018 Peer reviewed|Thesis/dissertation
eScholarship.org Powered by the California Digital LibraryUniversity of California
UNIVERSITY OF CALIFORNIA
Los Angeles
Bogota Humana's climate resettlements:
Displacement and the limits of the housing market in Colombia
A dissertation submitted in partial satisfaction of the requirement for the degree of Doctor of Philosophy in Urban Planning
by
Hugo Sarmiento
2018

© Copyright by
Hugo Sarmiento
2018
ii
ABSTRACT OF THE DISSERTATION
Bogota Humana's climate resettlements:
Displacement and the limits of the housing market in Colombia
by
Hugo Sarmiento
Doctor of Philosophy in Urban Planning
University of California, Los Angeles, 2018
Professor Christopher C. Tilly
This dissertation is about climate resettlements, and the challenges to this practice, posed by the
housing market in Bogota, Colombia. Specifically, it focuses on the resettlement strategy
proposed by Petro’s city administration in its Bogota Humana development plan (2012-2016).
Climate resettlements, unlike other types of resettlements, aim to relocate people who live in
areas which climate model projections show are potentially at risk of disasters caused by floods,
landslides and torrential rains. Implicated in Bogota Humana’s resettlement outcome are two
defining features of the city’s housing market, a large and growing housing deficit, and the
informal development of housing in the urban periphery. They raise questions of the particular
iii
housing strategy connected to the resettlements. How did the Petro administration negotiate the
city’s housing deficit? How did it intervene in the city’s informal housing markets?
Borrowing from political ecology and the emerging critiques of social-ecological systems
theory (Adger 2006, Pelling 2011, Hodson &Marvin 2010) this dissertation relies on a political
and economic frame to examine the role played by the housing market in this case of climate
resettlements. It argues that by considering the role of markets we can not only bring into view
how social-ecological contradictions are generated, namely through the existing patterns in the
spatial distribution of housing, but also how they might be resolved. The aim of the dissertation
is to contribute to a deeper understanding of the political economy of climate resettlements by
examining the case represented in Bogota Humana’s resettlement strategy.
iv
The dissertation of Hugo Sarmiento is approved.
Susanna B. Hecht
Paavo Monkonnen
Helga M. Leitner
Christopher C. Tilly, Committee Chair
University of California, Los Angeles
2018
v
Acknowledgements I would like to thank my adviser Chris Tilly for his patience and steadfast support in supervising
this project, and my committee members: Susanna Hecht, Paavo Monkonnen and, Helga Leitner.
Beyond my dissertation committee I had insightful conversations with Leo Estrada and Vinit
Mukhija.
In Colombia, I found invaluable support for my dissertation fieldwork from Andrea
Lampis, at La Universidad Nacional de Colombia, Bogota (UNAL), Jaime Hernandez and Olga
Ceballos at La Pontificia Universidad Javeriana (PUJ). At Vidas Moviles in Ciudad Bolivar,
Alejandra Miranda Menes helped me organize a survey team, without her support and guidance,
my dissertation would just not have been possible. I would also like to acknowledge the staff at
IDIGER, especially Diana Arias Tovar and Jesus Enrique Rojas Ochoa, the staff at Caja de
Vivienda Popular and Sergio Andres Laiton at Secretaria de Planeacion, Alcaldia de Bogota for
his support with navigating the city’s databases.
I would also like to acknowledge my fellow doctoral students and friends in the
department and across UCLA, including Lisa Berglund, Trevor Thomas, C.J. Gabbe, Paloma
Giottonini Badilla, Emily Erickson, Patrick Adler, and so many more.
Most of all, I thank my family, beginning with my mother, Rosa Sarmiento, my father,
Hugo Orlando Sarmiento, my sisters, Alba Sarmiento and Susana Sarmiento, and my brother
Liber Sarmiento. I have made it this far because of them.
vi
Table of Contents List of Acronyms / Glossary .................................................................................................... ix Introduction ……………………………………………………………………………......... 1 Literature Review …………………………………………………………………………… 8 Chapter 1 The Politics of Bogota Humana’s climate resettlements …………………………. 20 Chapter 2 Housing crisis and the geography of climate risk in Bogota ..…………………..... 49 Chapter 3 Risk zones and the spatial determinants of new social housing construction in Bogota
(2008-2016) …………………………........................................................................................ 78
Chapter 4 Household responses to Bogota Humana’s resettlements ………………………..... 108

vii
Conclusion …………………………………………………………………………………… 159 Appendix ................................................................................................................................... 175 References ................................................................................................................................. 199
viii
Acronyms / Glossary API-GR Areas Prioritarias de Intervencion Gestion de Riesgos. Zones identified by
IDIGER which are prioritized for risk mitigation interventions. These are integrated into the POT.
Bogota Humana The Petro administration’s four-year development plan for Bogota. CAMACOL Camara Colombiana de la Construccion. The Colombian chamber of
construction. Represents the interests of the Colombian construction industry.
CVP Caja de Vivienda Popular. Bogota’s social housing agency. Decree 255 of 2013 Defined the financial compensation that could be offered to families
targeted for relocation. Decree 364 of 2013 The special modification proposed by the Gustavo administration for
Bogota’s twelve-year territorial development plan known as the POT. Decree 190 of 2004 The current twelve-year POT for Bogota. DRM Disaster Risk Management. DFDR Development-Forced Displacement and Resettlement. FOPAE Fondo Operativo de Prevencion y Atencion a Emergencias. Bogota’s risk
management agency and predecessor to IDIGER. IDEAM Instituto de Hidrologia, Meteroligia y Estudios Ambientales. Colombia’s
national meterology institute. Responsible for producing technical and scientific knowledge such as climate model projections.
IDIGER Insituto Distrital de Gestion de Riesgo y para los Cambios Climaticos. The
successor agency to FOPAE created by the Petro administration and approved by Bogota’s district council.
POT Plan de Ordenamiento Territorial. Bogota’s twelve-year territorial
developmement plan which determines the city’s risk zoning code. SDVE Subsidio de Vivienda en Especie. A financial instrument created by the
Petro administration to finance housing developments for families participating in the climate resettlement program.
ix
VIS Vivienda de Interes Social. Social housing with a maximum value of 135 times the monthly minimum wage.
VIP Vivienda de Interes Prioritario. Social housing with a maximum value of
70 times the monthly minimum wage. New social housing built for families in the resettlement program is found in this category.
VUR Valor Unico de Reconocimiento. The main financial instrument used to
compensate families relocated by FOPAE / IDIGER. Only families from strata 1 and 2 qualify for this form of compensation.
x
Biography
Hugo Sarmiento studied history as an undergrad and urban planning as a master’s student at
UCLA. He is interested in applying a critical perspective to the study of housing and economic
development especially as it relates to environmental policy such as climate change and risk
management. His work is guided by a political and economic frame, and the central notion
people and their cultural practices are the basis for building more socially and environmentally
just cities. Hugo has a special interest in Latin American urban geographies having completed
projects in Guatemala, El Salvador, Colombia and Brazil.
1
Introduction In the fall of 2016 I visited Caracoli, located in Bogota’s southern locality of Ciudad Bolivar, to
meet two local leaders who were negotiating the city’s climate resettlements in their
neighborhood. One of the pressing issues on their agenda was the new land “invasion” which had
reoccupied the space cleared by the city, a space now legally identified as a high risk zone.
In a previous visit to Bogota I had learned of the Petro administration’s experiment with
climate resettlements in the informal settlements, like Caracoli, found across the city’s southern
periphery. I had participated in a two-day conference organized by the city’s risk management
agency, the District Institute for Risk Management and Climate Change (IDIGER) where
hundreds of residents impacted by the city’s resettlements were assembled for a series of
workshops and panels on the effects of climate change in Bogota. City officials were frequently
interrupted by residents with complaints about the resettlement process. Given this experience I
arrived in Caracoli with the intuition a large part of the conflict between the city and residents
had to do with a lack of understanding of the magnitude climate change-related risks posed to
their communities. I also understood the relationship between the city and residents was
complicated by a historical distrust, a lack of confidence in the state and its institutions, shaped
by decades of civil conflict. In fact, many of the residents of Caracoli had come to the city as part
of the wave of desplazados, or as Colombia’s internally displaced population is known locally,
which contributed to the growth of informal settlements in Bogota in the 1990s.
The interview began with one of the leaders explaining she had come to the
neighborhood because she wanted to own a home. She described her experience renting in a
different part of the city as “throwing money into a bottomless sack.” So, she, along with the
others in this neighborhood, fought the city in the late 1990s, literally fighting the police with
2
sticks and rocks, to win their right to stay and enter the neighborhood legalization process. I
asked her: What do you think of the city’s claim climate change is a problem and that they need
to relocate families from this neighborhood to protect their lives?
She replied, “For me these should not be habitable zones. People should not come to
these sites. Because we have lost lives due to the high risk. Here when it rains hard if people are
not alert their whole house comes down. The last avalanche killed a soldier in this neighborhood.
But one does not think about those things because you know we have necessities. You are
concerned about not being able to pay rent, about your children, so you go wherever you need to
go.”
The other leader explained the city had attempted the resettlement of a large section of
the hill and had declared it a protected forest reserve. But many still lived in the neighborhood
because the city suspended the resettlement when it ran out of new social housing units for the
residents of Caracoli. Meanwhile a new invasion, led by families who had been evicted from the
nearby neighborhood of Juan Jose Rondon, also as part of the city’s effort to resettle from high
risk zones, reoccupied the section of the hill that had been cleared.
He added, “Climate change and global warming is man’s fault. Because the institutions
do not mitigate the problems. It’s like if I tell you this home will fall, if I don’t reinforce it it
falls, because the threat is latent, then it is my fault. Because, those people in the invasion, don’t
have a sewage system, so they take their trash and waste and throw it into the canals blocking the
flow of water causing flooding. They build new artisanal filtration systems that further
destabilize the hill. So we humans are responsible because we are building in parts of the city
where the environment does not support development. So, that area that was relocated if they had
3
planted trees it would have been a lung for the city, because forestation helps a lot, it helps with
absorbing particles from the air.”
1. Colombia and climate resettlements This dissertation is about climate resettlements, and the challenges to this practice, posed by the
housing market in Bogota, Colombia. Specifically, it focuses on the resettlement strategy
proposed by Petro’s city administration in its Bogota Humana development plan (2012-2016).
Climate resettlements, unlike other types of resettlements, aim to relocate people who live in
areas which climate model projections show are potentially at risk of disasters caused by floods,
landslides and torrential rains. Moreover, the focus here is on urban climate resettlements which
take place in very densely built and populated environments, with a complex mix of land-uses,
and regulated by highly developed legal and institutional systems.
The Intergovernmental Panel on Climate Change (IPCC) has recognized resettlements as
an appropriate adaptation measure for communities which lack the time, resources and
infrastructure to protect themselves from the growing risks posed by climate change. According
to the IPCC this approach is most applicable in the global south where large informal settlements
account for a large, in some cases, a majority of urban development. (IPCC, 2014) Bogota
Humana’s climate resettlements can then be understood as an example of one of several
emerging strategies cities are developing to adapt to the effects of climate change. Moreover,
Bogota’s experience offers a valuable case study because the city has invested in resettlements,
as a risk management strategy, since the late 1990s. Therefore, it has established a record which
can be studied and used to inform other cities where the practice may eventually become
necessary.
4
2. Bogota Humana’s climate resettlements
The 2010-2011 winter storms, and the widespread and unprecedented scale of the damage it
caused to infrastructure across the country, are often cited as a turning point in Colombia’s
development agenda. In Bogota this turn was expressed in the Petro administration’s, Bogota
Humana, which identified climate change adaptation as a central component of the development
plan. During this period the city attempted to implement an ambitious plan to resettle 15,000
households found in areas at risk of torrential rains, flooding and landslides. According to the
city resettlements would be necessary to organize the city’s urban territory around water. The
focus on water was rationalized by pointing to climate models which project a significant
increase in precipitation rates for Bogota in the coming decades. This implies the main climate-
related threat to residents is flooding near bodies of water, including rivers, streams and
wetlands, and landslides triggered by heavy and sustained rains.(Secretaria Distritial de
Ambiente - Instituto Distrital de Gestion de Riesgos y Cambio Climatico, 2015)
The plan’s stated goal then was to create “resilient territories” by recuperating the city’s
principal ecological structure – the legal term used to describe the city’s water and forest
ecosystems. Recognizing social-spatial segregation to be an underlying cause in the social
construction of risk, residents would be resettled to housing of a superior construction quality,
located more centrally in the city, and which enabled the accumulation of equity in legally
recognized properties. In this manner, the plan would reduce the population’s social-ecological
exposure to what are considered the “future vulnerabilities associated with climate change”.
(Alcaldia Mayor de Bogota, D.C., 2012). Ultimately, even though Bogota Humana represented a
dramatically increased investment in the climate resettlement strategy, the city was unsuccessful
in meeting its resettlement goals. In fact, only 30% of the 3,200 households originally marked for
5
resettlement during Bogota Humana were actually resettled, a low success rate even when
compared to the resettlement projects of previous administrations.(Rodriguez, 2016) 1
Implicated in Bogota Humana’s resettlement outcome are two defining features of the
city’s housing market, a large and growing housing deficit, and the informal development of
housing in the urban periphery. They raise questions of the particular housing strategy connected
to the resettlements. How did the Petro administration negotiate the city’s housing deficit? How
did it intervene in the city’s informal housing markets?
At stake here is the compatibility of the resettlement strategy and the spatial and
economic logic of capitalist housing dynamics in Bogota. That is because this strategy
constitutes a disruption of housing markets, namely through the state’s acquisition and exchange
of residential properties. The strategy brings into conflict the use values implied by housing and
social-ecology, and the exchange values implied by the market and financial risk. Can the
strategy overcome this basic contradiction to reduce climate-related risks for residents, especially
for those found in the city’s lower social economic strata? What lessons can be learned from
Bogota’s investment in climate resettlements?
Borrowing from political ecology and the emerging critiques of social-ecological systems
theory (Adger 2006, Pelling 2011, Hodson &Marvin 2010) this dissertation relies on a political
and economic frame to examine the role played by the housing market in this case of climate
resettlements. It argues that by considering the role of markets we can not only bring into view
how social-ecological contradictions are generated, namely through the existing patterns in the
spatial distribution of housing, but also how they might be resolved. The aim of the dissertation
1 The target for resettling households, when the Petro administration took office, was set at 3,200. Once in office the Petro administration raised the target to 15,000.
6
is to contribute to a deeper understanding of the political economy of climate resettlements by
examining the case represented in Bogota Humana’s resettlement strategy.
The dissertation finds:
• A uniform prospective policy increased climate risks for residents given the city’s limited
resources, the heterogeneity of informal settlements, and the nature of housing markets.
• Relying on social housing resulted in displacing families further into the periphery often
into risk areas.
• Bogota Humana’s climate resettlements, a project of the political left in Bogota, were
met with political resistance from the local business and political elite.
3. Theoretical contributions This dissertation contributes to the emerging literature on climate resettlements by relying on a
political and economic frame to study the Bogota Humana case. It argues the dominant
theoretical frame in the study of climate change adaptation, social-ecological systems theory
(SES) with value-neutral systems epistemology, does not conceptualize the political and
economic relationships which produce geographies of risk. Left out of this frame are the
economics of housing markets, namely how the market pressures developers and informal
settlers to invest in areas of the city with the lowest land values which also coincide with risk
areas. Conversely, this economic dynamic is accompanied by political resistance to climate
resettlements which promote an alternative spatial logic that is one seeking to recover ecological
corridors without concern for how this land might be capitalized. SES theory then falls short of
being able to explain the contradictory outcomes observed in Bogota Humana’s climate
7
resettlements with its cycles of land invasions and the construction of new social housing in risk
areas. For this we have to study the role of housing markets in the resettlement process.
4. Organization of the dissertation
The dissertation is organized in a series of independent but related chapters in the following
manner: Chapter 1) A brief review of the emerging literature on climate resettlements. Chapter
2) The Bogota Humana development plan, and its emphasis on climate change adaptation, as a
political project. Chapter 3) A discussion of the financial reforms to Colombia’s housing subsidy
system in the late 1990s, the subsequent housing crisis, and the spatial distribution of risk in
Bogota. Chapter 4) A spatial analysis of Bogota’s risk zoning relative to social housing. Chapter
5) An analysis of the results from a household survey of neighborhoods targeted by Bogota’s
resettlement program. Chapter 6) An analysis of in-depth interviews conducted in neighborhoods
targeted by the resettlement program, and in the social housing projects built for the resettlement
program. Finally, I conclude with a summary of the main findings and their implications for the
climate resettlement strategy.
8
A review of the emerging literature on climate resettlements
In search of an analytical frame to deal with the questions posed by Bogota Humana’s
resettlement strategy I found the study of resettlements, as a climate change adaptation strategy,
is an emerging area of study which still lacks conceptual clarity and empirical depth. Therefore,
in this brief review of the literature on resettlements I consider not only the empirical literature
on the topic but also the broader conceptual framework of social-ecological systems (SES)
theory which now dominates the study of climate change adaptation – and provides the
epistemological basis for the discourse of resilience. In fact, this is the discourse used to
formulate Bogota Humana’s policy and objectives. In the first part of the review I place the
nascent literature on climate resettlements in conversation with SES theory aiming to evaluate
the analytical utility of the latter for the study of this emerging practice. Here I argue the existing
literature on resettlements tends to depoliticize and decontextualize the strategy. In the second
part of the review I discuss the study of resettlements with respect to the housing market in the
Colombian context as a research strategy situated in political economy.
1. The resettlement literature
Scholars have only recently begun to engage in the study of planned resettlements as an urban
strategy for climate change adaptation. (Ferris 2015, Kothari 2014, Barnett and Webber 2010,
Warner 2010) Thus, conceptual frames are often borrowed from related fields of study such as
disaster risk management (DRM) and development forced displacement and resettlements
(DFDR).(Wilmsen and Webber 2014, McDowell 2013, de Sherbenin et al. 2011, Warner 2010,
Barnett and Weber 2010) Generally, DFDR refers to forced resettlements connected to
development projects including resource extraction, hydroelectric power and transportation
9
infrastructure. (Oliver-Smith 2010, Downing 2002, Cernea 1997) The influence of these two
traditions can also be found in the Colombian scholarship on resettlements. (Partridge 2010,
Correa 2011) However, I argue the dominant approaches to the study of resettlements found in
both DRM and DFDR are limited in their tendency to depoliticize and decontextualize the
practice.
DRM with its more extensive history offers important lessons for cities experimenting
with resettlements as an adaptive strategy. (Satterthwaithe 2008) Lavell (2009) explains the
objectives of DRM strategies may be corrective or prospective, that is they can be used to correct
existing risk conditions or as planned interventions with the prospect of future risks which have
not yet presented themselves. Correa (et al. 2011) builds on this concept of DRM to define
resettlements as “changing the location of the exposed elements, in this case, the population, so
that there is no time-space coincidence with a specific socio-natural phenomenon that may
develop or intensify in the future.” Moreover, resettlements are more than just the physical
relocation of a population and the provision of an alternative housing solution, they also imply a
post-relocation effort to reconstruct livelihoods and the social infrastructure of affected
communities. This basically defines risk reduction resettlements though it should be noted that
DRM refers to a range of natural disasters including earthquakes while climate resettlements
narrow the scope of planned resettlements to current and anticipated climate-related events. (de
Sherbenin et al. 2011, Barnett and Webber 2010) The defining feature of climate resettlements
then is the anticipation of increasingly severe and frequent climate-related events forecasted by
model projections.
The literature on development forced displacement and resettlement (DFDR) offers
valuable insight on the social and economic costs of the resettlement process. Michael Cernea’s
10
(2009, 1997) work on the economic costs of DFDR has been especially influential as it provides
the basis for the World Bank’s formulation of resettlement policy frameworks. Therefore, this
influence has carried over to cities such as Bogota where the World Bank sponsored the city’s
pioneering experiments with the resettlement strategy in the 1990s.
Cernea (1997) argues the biggest risk families face in the resettlement process is the risk
of economic impoverishment. He points out that, specifically in the global south where
household and economic practices are often informally mixed, resettlements cause a
disarticulation between the home, livelihoods, and sources of income. This is caused not only by
the physical relocation of households but also their transition from informality to a new formal
and heavily regulated environment. That is households might embed themselves in social and
economic networks, and engage in social and cultural practices, which enable them to generate
sources of income and establish livelihoods in the context of informal settlements. For example,
a household may incrementally add rooms to their home to make space for growing families and
small commercial enterprises. These networks and practices are not only disrupted by the
resettlement process but also difficult to reproduce in the context of social housing projects. In
these cases, economic compensation cannot be attained through a simple cost-benefit analysis
tied to the projected benefits of development, but instead through the careful planning of the
reconstruction of livelihoods in the resettlement. This holds important implications for the
practice of climate-related resettlements as it makes clear a simple exchange of property via
financial instruments like housing subsidies may be insufficient for resettled households.
Still this approach to the study of resettlements tends to depoliticize and decontextualize
the process of resettlements. Its emphasis on economic compensation, for example, betrays the
developmental imperatives which underlie the analysis. However, there is little problematizing
11
of the role of regional banks and development agencies in these processes. The politically
contentious nature of who determines when and if resettlements are necessary is largely left out
of this view. Additionally, its reliance on technical expertise, sets of indicators and metrics to
measure social and economic costs, speaks to the technocracy of the World Bank, and other
developmental institutions, concerned with predictable outcomes and the minimizing of financial
risk. While acknowledging the social and economic implications of the resettlement process,
these are narrowly defined with the safe and institutional language of “capacity-building,”
“social inclusion” and “diverse sets of multiple stakeholders” in the “decision-making process.”
The Colombian scholarship on resettlements largely reproduces this technocratic
approach though it also offers important case studies of the country’s pioneering role in the
innovation of DRM resettlement strategies. Here we find examples which provide important
lessons for the integration of DRM systems with social housing systems and neighborhood
upgrading programs. (Burgos 2015, Correa et al 2011, Serje and Anzellini 2011, Partridge 2000,
Joya 2009). Bogota’s experimentation and development of these strategies has been particularly
influential helping shape risk management and resettlement policy at the national level.
For example, the work of Partridge (2000) and Correa et al. (2011) offer important case
studies documenting some of Bogota’s earliest attempts at creating the housing strategies and
financial instruments for resettling households. These case studies describe exceptional, large-
scale resettlements such as the Nueva Esperanza resettlement (2008-2011), one of the earliest
examples of large collective resettlements, and Los Altos de la Estancia resettlement (2010-
2016), to date the largest collective resettlement in Colombian history, in which approximately
3,000 families were resettled. These cases make it possible to discern the defining features of
Bogota’s resettlement practice. First, the vast majority of resettlements have consisted of the
12
relocation of households from informally, self-built homes to state-subsidized social housing.
Second, although Bogota has framed resettlements as a preventative, risk reduction measure, and
despite the relative size of the special cases present here, in absolute terms, Bogota’s
resettlements have been few compared to the total number of households located in conditions of
risk. That is, most households in risk areas are not resettled.
The Colombian scholarship on resettlements, and the literature on DRM and DFDR it
reflects, then offers important lessons for the technical and economic dimension of the practice.
However, by adopting a technocratic approach, with prescriptive and limited responses to the
problems created by resettlements, it largely depoliticizes the process. In this manner, there is
little debate about the need for adopting the strategy, and whether alternative solutions may exist.
Relatedly this literature also provides only a superficial engagement with the social construction
of “natural” hazards such as flooding and landslides. Resettlements are for the most part
decontextualized from the social-spatial relationships, residential segregation for instance, which
create unequal exposure to risk. Little attention is given to the asymmetries in political and
economic power which produce these types of relationships in urban settings.
Given these limits in the literature on DRM and DFDR the emerging the study of climate
resettlements requires a conversation with the broader conceptual frameworks which underpin
the study of climate change adaptation, namely SES theory. The goal here is to ascertain the
conceptual tools and the analytical utility SES theory provides for the study of climate
resettlements. This is especially relevant in the Bogota Humana case as the development plan
invoked the discourse of resilience and social-ecological systems to justify its aims.
Social-ecological systems (SES) theory posits social-ecological systems are linked and
complex adaptive systems. Through self-organizing and adaptive capacities they can withstand
13
external shocks and maintain functional persistence, thus their resilient nature. (Berkes et al.
2003, Holling 1973) Applied to the field of environmental planning and governance SES theory
implies the goal should be to attain resilience in the various forms of urban development.
Climate resettlements can be understood as a strategy for attaining resilient social-ecological
systems in urban development. That is, the objective of these resettlements, as exemplified in
Bogota Humana, is to restore a balance in social-ecological systems by correcting the
environmental degradation caused by uncontrolled development. (IDIGER, 2015)
SES theory, however, advances a value-neutral systems-thinking epistemology.
For example, resilience might be accomplished by relocating homes built in close proximity to
waterways using a technical study of the waterway’s hydrological behavior and history to
determine safe distances for future development. In this sense, SES theory conceptualizes
climate-related threats as natural phenomenon produced externally independent of the social
relationships which determine why homes are built in close proximity to waterways. From the
SES perspective the goal of climate resettlements is to reconfigure the relationship between
development and the natural environment. Left out of this frame are the political and economic
relationships which explain why homes are built in close proximity to waterways, and the
environmental degradation and risk this generates.
Used to interrogate the rationale behind climate resettlements, SES allows for attention to
be given to the social and cultural practices which might be suitable for adaptation to certain
natural environments. This explains the focus on explorations of “community-based” forms of
adaptation and cultural practices which might support certain land-use and risk management
strategies. For example, two important lines of inquiry that stem from this framework include the
study of how communities perceive risk and the architecture of indigenous communities who
14
have co-existed in demanding physical environments. (Isunju et al. 2016, Jabeen et al. 2010 &
Ziergovel et al. 2016)
However, SES theory’s epistemological imperatives do little to counter the depoliticizing
and decontextualizing found in the DRM and DFDR study of resettlements. As such it leaves us
without a framework to consider the relationship between climate change and the social-spatial
disparities produced by the urbanization process such as displacement and exclusion from formal
markets. Understood from this perspective, climate resettlements should simply strive to move
people out of harm’s way through a change in their location or an improvement in the quality of
their housing. Beyond this SES shows little concern for addressing the political and economic
relationships which fix communities in certain geographies, and thus produce environmental
degradation and risk. In fact, through its promotion of resilience it may in fact promote the
reproduction of these disempowering political and economic relationships. For example, families
resettled in social housing projects may reduce their exposure to climate risks but not necessarily
improve, and in fact might worsen, their social and economic capacity in the city.
Thus, to ascertain the premise for climate resettlements, as an expression of social power
and political projects, it becomes necessary to consider the political economy of the strategy.
Robbins’ (2012) in his discussion of a political ecological approach to the study of ‘natural’
hazards argues, “the issue can only be addressed fully by examining the political economy of
floodplain investment, the role of capital in agricultural development, and the control of
legislative processes through normative ideologies, vested interests, and campaign finance.
Similarly, the risk of floods is not uniformly distributed through populations. Are poor and
marginalized groups more vulnerable to such events? What is the role of power in the
environmental system and its relationship to people?” He continues, “But to engage these
15
questions would require a fundamentally different view of social and natural process. In hazards
research, humans are purposeful individuals who first perceive a hazard, recognize available
alternatives, and then rationally adjust their behavior. If an individual behaves ‘irrationally’ it is
the result of cognitive biases, willful ignorance, faulty perception, or other personal and social-
psychological ‘problems,’ The contextual forces that create unequal vulnerability and differential
response, therefore, fall outside the concerns of traditional hazards research.”
Following this approach, a growing scholarship on the broader field of climate change
adaptation and mitigation (Hodson and Marvin 2010, Pelling 2011) are raising these questions
and attempting to build a political and economic explanatory framework to answer them.
Considering climate resettlements in particular, Wilmsen and Webber (2014), note the
conceptual ambiguity around this practice and call for empirical research which connects it to
this emerging study of the political economy of climate change adaptation.
Heeding these research imperatives, I argue an important line of inquiry begins with
recognition of the centrality of housing markets for the study of climate resettlements. Given that
in question is the location and quality of homes, an obvious place to start for this research
strategy is housing policy and the role of housing markets in determining the social-spatial
patterns of residential segregation which fix residents in geographies of risk.
2. Resettlements and housing
While housing is a central element of the planned resettlement strategy the scholarship on DRM
resettlements is largely disconnected from the study of housing policy and housing markets. This
is especially problematic in the Colombian context where cities wrestle with severe patterns of
socio-spatial segregation, housing deficits and informal development. Here, resettlements often

16
represent sharp intrusions in densely populated and peripheral settlements which operate
according to their own market logic, beyond the state’s regulatory power. As such, the financial,
housing and spatial strategies of a resettlement effort if not attentive to the particularities of this
development context may produce contradictory results. They may in fact result in a
displacement that produces negative social, economic and environmental consequences for
resettled households and the communities left behind.
Given the extensive literature on housing policy and informal settlements in Colombia
(Parias Duran 2008, Jaramillo 2008, Ceballos 2009) it is somewhat surprising the Colombian
literature on DRM resettlements is also largely disconnected from the study of housing. For
example, the focus of the DRM literature is on large exceptional resettlement projects. But there
is little attention on the resettlements associated with city programs like neighborhood upgrading
and neighborhood legalization even though assessing environmental risks is a part of these
processes. In what follows then, I discuss why housing policy and housing markets matter for
climate resettlements.
First, Colombian housing policy has failed to meet the housing needs of households in lower
social economic strata. Often working in the informal sector, these families have not been able to
access credit to make payments for market-rate homes in the formal sector. At the same time,
cities have not sufficiently invested in building adequate subsidy systems to provide housing
alternatives contributing to a severe housing deficit. Historically Bogota has partnered with the
national government to build housing for targeted populations such as those internally displaced
by civil war (IDPs). However even these efforts which typically have consisted of large social
housing projects in the extreme periphery or increasingly in surrounding municipalities has been
insufficient to meet demand. (Ceballos 2008, Jaramillo and Cuervo 2009) To bridge the gap
17
families have resorted to informal, self-building practices in peripheral illegal settlements. In
Bogota, for example, (Sierra in Ward, Jimenez-Huerta and Di Virgilio 2015) land invasions and
illegal subdivisions beginning in the 1960s and 70s generated 62% of all informally urbanized
land in Bogota. Much of this growth was concentrated in the southern periphery of the city
producing the defining spatial feature of social segregation in the city. More than half (58%) of
Bogota’s current population lives within this settlement ring which was consolidated in the
1980s.
Given the pressure this pattern of development places on vacant land a primary challenge for
any risk reduction resettlement effort in Bogota is controlling new informal development in
recuperated spaces. Known as ‘pirate urbanizers’ or ‘tierreros’ informal developers have become
adept at occupying the spaces left behind following large scale resettlements and convincing
families the city will also provide them with housing solutions. Case studies of previous
resettlement projects (Burgos 2015, Partridge 2010, Correa 2011) document the city’s effort to
create shared governance structures with local community institutions such as the juntas de
accion to control the activity of these informal developers. The Los Altos de la Estancia
resettlement showcased partnerships between IDIGER and local communities which relied on a
range of strategies including urban farming and reforesting initiatives, community-led patrols,
and finally investments in physical barriers such as the construction of fences and a police
station. However, this remains an exceptional case and not the norm in Bogota.
Second, informal settlements in Bogota are by no means homogenous. As the city’s
population has continued to grow new settlements have contributed to an expanding urbanized
area with varying levels of consolidation across Bogota’s southern and western periphery. (Sierra
in Ward, Jimenez-Huerta and Di Virgilio 2015) On average the consolidation process for these
18
settlements lasts between 15 and 20 years. In newer, less consolidated settlements which are
either not yet legalized or only entering the legalization process, residents can only claim
possession of a property, that is the structure built, or the “mejoras” as they are colloquially
known, but not the land on which it sits. Conversely in legalized neighborhood a resident with a
property title, known as the “escritura,” to show proof of ownership, can claim both the land and
structure. Moreover, in Bogota, overtime these peripheral areas have created a growing rental
market. Survey studies found more than 40% of informal settlement residents are renters. (Parias
Duran 2008) Renters typically are uncounted for by resettlement policy. This dynamic
urbanization process produces heterogeneous patterns of land tenure. Resettlement policy then
has to be flexible and sensitive enough, providing a range of financial compensation instruments,
to account for this variation.
Relatedly, while social housing systems might be designed to support uniform housing
and economic practices, settlement residents engage in diverse housing and economic practices
often mixing these through informal arrangements. In addition to shelter, these self-built homes
represent one of the more important economic resources for low-income families confronted
with limited employment options or low-wage and precarious work. Beyond renting out rooms
many obtain additional income by engaging in various commercial activities including small-
scale manufacturing, retail and food services. (Parias Duran 2008) These informal income
generating activities imply significant capital investments in these homes and drive the process
of consolidating physical properties in settlements. The process usually begins with the
construction of a simple, one story structure which serves as a base for future additions of rooms
and spaces to accommodate more residents and commercial activities. Thus the secondary rental
market created in these neighborhoods has two important effects on residential mobility. For
19
homeowners it creates a strong incentive to maintain and consolidate their properties usually
building vertically and leading to increasingly dense settlements. For renters, the secondary
market enables mobility but only within the restricted space of the city’s informal periphery.
For the families involved, resettlement policy in Bogota, however, which has relied on
the city’s social housing system to provide alternative housing solutions implies a traumatic
transition from the informal to formal sector. New social housing projects typically consists of
high-rise apartment buildings designed to provide just enough space for one family per housing
unit. Commercial space is non-existent in these apartments. And, officially resettled families are
prohibited from renting or selling these apartments for a period of 8-10 years.
3. Conclusion
The study of climate resettlements is still in its formative stages. Therefore, much attention is
given to related though more extensive and better established bodies of literature such as DRM
and DFDR. However, the scholarly traditions which dominate these fields of study tend to
depoliticize and decontextualize resettlements through their technocratic approach. In search of
conceptual tools, then, I turned to SES theory which promotes the now omnipresent discourse of
resilience in policy debates over climate change adaptation. I find SES theory offers little to
counter depoliticizing and decontextualizing of resettlements. Thus, urban policy with respect to
climate resettlements, informed by this theory, are likely to reproduce asymmetries in political
and economic power and the social-spatial patterns which produce risk to begin with. A research
strategy, which addresses these social dynamics, is to examine the role of housing policy and
housing markets and how they might shape the political economy of climate resettlements.
20
Chapter One: The Politics of Bogota Humana’s climate resettlements
This chapter considers the politics of Bogota Humana’s climate resettlements. It argues the
spatial and housing strategy of these resettlements constituted a central component of the Petro
administration’s political project for Bogota. In Bogota Humana Gustavo Petro, a leftist
politician and former member of the M-19 guerilla group, proposed a development plan
concerned with reducing social-spatial disparities specifically as they concerned the residential
segregation of the city’s lower social economic strata, and their unequal exposure to climate
risks. But this plan was met with fierce resistance from Bogota’s local political and business
elite. It also created a disconnect in the housing policy promoted by the administration and the
Santos-led national government. Finally, it generated resistance from below as the administration
struggled to meet its promise of better alternative housing solutions for the residents of the
informal settlements. This political conflict, in addition to a severe housing deficit, greatly
influenced the mixed results produced by the city’s attempt to pioneer the practice of climate
resettlements in Colombia.
This analysis relies on interviews and site visits conducted in Bogota beginning in the
summer of 2016 and through the end of the summer of 2017. This was a period of transition
during which the Bogota Humana development plan was brought to a close and the incoming
mayoral administration launched its own plan. Those interviewed included the outgoing and new
directors of the Instituto Distrital de Gestion de Riesgos y Cambio Climatico (IDIGER), the
subdirectors responsible for managing resettlements at both IDIGER and the city’s social
housing agency, Caja de Vivienda Popular (CVP), IDIGER’s subdirectors responsible for
managing the city’s risk zoning, and the director of Bogota’s Secretariat of Planning under the
Petro Administration. Site visits included visits with IDIGER’s technical and social teams to
21
households marked for relocation and the intervention sites in San Cristobal and Ciudad Bolivar,
visits with CVP’s technical and social teams to the social housing projects constructed for
resettled families and the agency’s remote office in Ciudad Bolivar. It also draws on secondary
data compiled by the various city agencies involved in the resettlement strategy including
IDIGER and CVP.
1. Bogota Humana’s resettlement strategy
Bogota Humana’s focus on climate change should be understood as more than just a superficial
change in the policy discourse of resettlements. The plan put forward a fundamental change in
the city’s resettlement strategy both in terms of its scope and goals. By tying the resettlements to
climate change adaptation the strategy shifted from a reactive to a prospective stance. Unlike
previous risk management resettlements which were limited to historical data and land surveys
this change added climate models as a basis for anticipating future emergencies. The strategy
was also informed by a social-ecological perspective which called for the recovery of ecological
corridors to reduce the potential for flood and landslide disasters.
Bogota Humana’s climate resettlements also represented a political project of the left
which tied the climate resettlements to a broader plan that significantly increased public
investment in housing for the lower socio-economic strata and informally built settlements of the
city’s southern periphery. Recognizing that the vast majority of households at high risk are
concentrated in this part of the city, it articulated the resettlement strategy with a reduction in
social-spatial segregation as the territorial vision for the development plan.(IDIGER, 2015)
Resettlements were understood as a strategy for reducing a household’s vulnerability not just to
22
climate-related threats but also, and relatedly, to social-spatial segregation caused by the inability
to access an adequate housing solution in the formal housing market.
For example, the Petro administration promoted La Plaza de la Hoja, or the Leaf Plaza, as
a demonstration of its development vision. La Plaza de la Hoja, is a large social housing project
completed in 2015 by Metrovivienda, the city’s agency responsible for land-banking and
redevelopment projects, completed La Plaza de la Hoja, in parternship with the national
government. Built in the center of Bogota, the project symbolized the administration’s effort to
counter social spatial segregation. La Plaza de la Hoja provided over 400 VIP units for internally
displaced families. At its opening Gustavo Petro described the project as a “revolution” because
in it “the poor are not excluded, the family in need lives where the wealth is located…there is no
need to lose one’s life in a bus spending hours and hours for transportation…because opportunity
is created for people at the same time we live respecting nature in a new city that is not
segregated.”2
This strategy was supported with a technical rationale and expertise provided by
Colombia’s meteorological service, Instituto de Hidrologia, Meterologia y Estudios Ambientales
(IDEAM). IDEAM had partnered with the United Nation’s Development Program (UNDP) in
2010 to formulate a regional climate change plan, Plan Regional Integral de Cambio Climatico
(PRICC). They projected a significant increase in precipitation rates for Bogota and identified
bodies of water as a major source of climate-related risks.(PRICC, 2010) Bogota Humana
integrated PRICC’s recommendations into a district level climate change plan, Plan Distrital de
Gestion de Riesgos y Cambio Climatico para Bogota D.C., 2015-2050. This district level plan
centered on the recovery of the city’s principal ecological structure, which consists of the
2 http://www.bogota.gov.co/content/la-plaza-de-la-hoja-una-revoluci%C3%B3n-contra-la-segregaci%C3%B3n

23
network of hydrological and forest ecosystems that traverse Bogota’s urbanized area.(source)
This placed the resettlement strategy’s focus firmly on the settlements which surround bodies of
water, namely the city’s streams and rivers. It also greatly amplified the scale of the city’s
intervention increasing the extent of risk zones and the number of households marked for
resettlement.3 To implement this strategy, new zoning and financial instruments were created
designed to facilitate the reorganizing of development, the building of social housing and the
acquisition of properties through the resettlement process.(Source)
Accompanying this shift in the resettlement strategy, the Petro Administration
transformed the institutional organization and capacity of its risk management system to reflect a
new focus on climate change. Bogota’s risk management previously named Sistema Distritial de
Prevencion de y Atencion de Emergencias (SDPAE) became Sistema Distrital de Gestion de
Riesgos y Cambio Climatico (SDGR-CC) combining risk management and climate change
adaptation. The rationale behind this combination was based in climate change theory. That is
climate change is understood as consisting of both short-term climate variability and long-term
climate trends. So that climate change is implicated in both present and future disaster events.
Accordingly, Bogota’s risk management and climate change system is designed to respond to
emergencies and prevent those expected in the future. The risk management agency responsible
for managing the system, Fondo de Prevencion y Atencion de Emergencias (FOPAE), formerly
housed in Bogota’s ministry of government, became IDIGER, empowered with its own fund,
FONDIGER, and placed at the head of the ministry of the environment. This move to the
ministry of the environment also represented a shift in the city’s attitude towards disaster risk
management (DRM) from a narrow focus on risk understood as an emergency response issue to
3 The proposed modification of Bogota’s master plan called for approximately 37,000 hectares of urbanized land to be added to ecologically-sensitive, protected land.
24
a broader view which understood risk as an integral part of the social-ecological system
constituted by the city.
Javier Pava Sanchez, the director of IDIGER under the Petro administration explained
this outlook, “Before risk management was understood as a problem of security. This is why the
former risk management agency, FOPAE, was housed in the city government and designed to
respond to emergencies. Risk management can be viewed as a form of control, social control or
as way of transforming the relationship between communities and their environment.”
He continued to explain the emphasis on climate change:
“If you look at the national policies on these issues you find risk management and climate
change are separated. Those responsible for risk management can plan the response to
emergencies and those for climate change can think of what will happen in 20 years. But, no,
climate change is already happening. So, we have to do both, and start transforming the social
reality now. So when we created IDIGER we created it as an institute to lead the environmental
sector and environmental issues in the city including dictating the policies that govern these
areas. The goal was to transform the social and ecological relationships in Bogota, to recover
ecological corridors, and through these territorial interventions reduce and prevent future risks.”
That Bogota would attempt climate resettlements at this scale is not surprising given its
history of experimenting with risk management strategies starting in the late 1990s. (Correa et al.
2011, Serje and Anzellini 2011, Joya 2009, Partridge 2000). Bogota’s prominence as Colombia’s
capital and largest urban center has provided a political platform for city mayors looking to make
a mark through innovations in urban planning. Historically, Bogota’s city mayors have then
moved on to run for political office at the national level (as is currently the case with Gustavo
Petro’s presidential campaign). Much of this experimentation has been enabled by investments
25
from the national government, regional banks and development agencies. So that the Petro
administration’s investment in the resettlement strategy can be understood as following in this
tradition.
2. Bogota’s history with resettlements
Bogota has been a pioneer in risk management practices, including resettlements, and has served
as a model for the region since the late 1990s. Its first resettlements of households as a risk
management strategy took place in 1996. However, at this time the city had not yet created a
resettlement program for households in risk areas, which meant these early resettlements were
included in programs with other developmental objectives such as public transit infrastructure,
utilities and services.
The city’s DRM resettlements were bolstered by foreign investments. For example, one
of the earliest large-scale resettlements in Bogota included the World Bank financed Nueva
Esperanza resettlement (2008-2011), which relocated over a thousand households at risk of
flooding. The World Bank also co-financed, with the Inter-America Development Bank, the
Bogota Urban Services Project (2002-2007) during which Bogota was assisted with developing
its current resettlement policy framework and methodology.(Garcia, 2015) Another notable
investment came in the form of the Disaster Vulnerability Reduction Project which sought to
enhance the city’s DRM capacity including risk mapping and taking preventative risk reduction
measures. 4 Finally, from 2010 to 2016, overlapping with Bogota Humana’s plan, the city
embarked on the largest collective resettlement in Colombian history to date, in the Los Altos de
4 http://documents.worldbank.org/curated/en/140911468186530431/pdf/ICRR14775-P074726-Box393191B-PUBLIC.pdf ; http://documents.worldbank.org/curated/en/191021468197980209/pdf/ICRR14875-P085727-Box394823B-PUBLIC.pdf
26
la Estancia resettlement which resettled approximately 3,000 families threatened by the risk of
landslides.
Bogota’s first city-wide DRM resettlement program was established in 2001 by the
Antanas Mockus administration. Included in the city’s first Plan de Ordenamiento Territorial
(POT), or territorial development plan, (Decree 619 of 2000 and subsequently in its modified and
current version, Decree 190 of 2004), the resettlement strategy was tied to housing policy which
sought to control the proliferation of informal settlements in the urban periphery. This program
established CVP would be responsible for managing the resettlement process including working
with private developers to promote the construction of social housing alternatives for resettled
families. (Acuerdo Distrita 26 de 1996, Articulo 17) (Correa 2011 et al.)
The Mockus administration also created the Valor Unico de Reconocimiento (VUR),
Bogota’s main instrument for financing the resettlements of households in the lower social
economic strata. The value of the VUR was first set at 24 Salarios Minimo Mensual Legal
Vigente (SMMLV) that is 24 times the minimum legal monthly salary in Colombia. After 2006
the value of the VUR was increased to 50 SMMLV. Bogota uses a socioeconomic index to
classify households into six strata.5 The classification system ranges from the first stratum,
identified as the poorest to the sixth stratum, identified as the wealthiest in the following manner.
The system is used to determine which households are eligible to receive social subsidies.6 Only
strata 1 and 2 households are eligible for the VUR. Distinct from typical housing subsidies
created to assist families found to be in a condition of social vulnerability (defined by a range of
characteristics including poverty, single-parent homes or families internally displaced by
5 www.dane.gov.co/index.php/estratificacion-socioeconomica/generalidades 6 Stratum one – three are eligible, strata five – six are not and must contribute into the social subsidy system, and stratum four is not eligible but also does not have to contribute.
27
Colombia’s civil war), the VUR was created specifically for households found in risk zones. It
was designed to bridge the gap between the appraised value of a property and the cost of
acquiring a social housing solution.
Olimpo Rojas, the director of the CVP’s resettlement program under the Petro
administration, and Gladys Bucha, a special consultant to CVP during this period, Gladys
explained the creation of the VUR. Gladys was involved in this process prior to the Petro
administration.
She explained, “Since informal home ownership is technically illegal and at risk, the
property value is legally at zero. So they had to reconsider how the value of the informal
properties is determined, based on legal rights to homeownership. In other words, the
determination of the property value was determined not by the market, but through a legal and
political assessment. This led to the creation of the special appraisal method used to determine
the value of the VUR.”
The specific type of social housing made accessible through the VUR financial
instrument is priority social housing, known as VIP (Vivienda de Interes Prioritaria). VIP is a
special category of social housing in which the value of the unit is fixed (during this period it
was fixed at 70 SMLM). In contrast the more common category of social housing is known as
VIS (Vivienda de Interes Social) in which the value of the unit can vary though it is capped
(during this period the value of a VIS unit could not exceed 135 SMLM). The difference
between VIS and VIP held important implications for the patterns of displacement caused by the
resettlements. Given the market dynamics of social housing, and the subsidy system, in Bogota
(Cuervo and Jaramillo 2008, Parias Duran 2008) VIP housing tended to produce smaller units in
more peripheral areas of the city. (IDIGER, 2015)
28
3. Challenge to Bogota Humana from local political and business elite
Bogota Humana introduced several innovations in the risk zoning strategy tied to the city’s
resettlements. On the one hand these innovations aimed to restrict new development in the city’s
ecological corridors by increasing risk mitigation requirements and expanding protected zones.
On the other they promoted the densification of the “centro ampliado” or urban core by lifting
height restrictions on new construction in this area. From the beginning, these changes were met
with strong opposition from local political and business elites in Bogota’s district council.
According to Javier Pava Sanchez, “…we had a city council who opposed Bogota
Humana, they opposed the Petro administration. The only initiative the city council approved
and supported was the creation of IDIGER. IDIGER united both risk management and climate
change, it made sense to the city council and so it became not just our initiative [the Petro
administration] but the district’s initiative.”7
The Petro administration began by reassigning responsibilities to the various entities
involved in the resettlement process. IDIGER was given the responsibility of determining which
households would be recommended to the resettlement program. It also gave IDIGER the power
to acquire properties through a form of eminent domain called adquisicion predial near bodies of
water for risk management purposes. Previously only the city’s water service company, Empresa
de Acueducto de Bogota, which manages the city’s water canals had the power to acquire
properties next to bodies of water.
Typically, households can enter the resettlement program in two ways, when IDIGER
issues a diagnostico or a concepto tecnico. The diagnostico is issued in response to emergencies
7 IDIGER’s creation is codified in Bogota’s Decree 546.
29
during which IDIGER sends a technical team to determine if a household has to be evacuated
temporarily or permanently. Temporary evacuation means IDIGER has determined the structure
of the home can be repaired or reinforced, or the city can intervene with mitigation works, and
the family will be given temporary support in the form of rent for an apartment or alternative
living arrangement while the home is made safe. Permanent evacuation means IDIGER has
determined the risk cannot be mitigated and the family is recommended for resettlement.
The concepto tecnico is a zoning instrument most commonly tied to the city’s
Legalizacion de Barrios program at the Secretaria de Planeacion and to a lesser degree other
planning instruments such as Planes Parciales and Suelos de Expansion. When the city
determines an informal neighborhood can be legalized IDIGER studies the terrain and
recommends what portion of the neighborhood is at risk, the level of risk, and if permanent
relocations will be necessary.
The Petro administration expanded the city’s use of risk zoning. As part of the focus on
reorganizing development around water, IDIGER now could issue conceptos tecnicos
specifically for the informal settlements around the city’s many streams or quebradas as they are
locally known. In total 16 quebradas were identified in IDIGER’s conceptos tecnicos. IDIGER
also began developing an additional category of risk, the avenida torrencial, or flash flood, to add
to the flooding and landslide classifications.
The administration also created “priority intervention zones” or Areas Prioritarias de
Intervencion Gestion de Riesgos API-GR. API-GR zones demarcated the boundaries of the
polygons identified by IDIGER for a range of risk management and climate change adaptation
interventions. Distributed across 114 priority intervention zones API-GRs followed the spatial
logic outlined in Bogota Humana, organizing development around water. Twelve bodies of water
30
were prioritized in which IDIGER teams performed a census of the risk they posed and
determined the number of resettlements necessary.
Finally, the city proposed changes to the city’s use of risk zones. For example, while
IDIGER followed longstanding norms such as the prohibition of construction within thirty
meters of a body of water, the proposed POT modified zoning laws to prevent construction not
only in zones designated high risk but also those designated medium risk. Accordingly, the risk
zone maps that regulate construction across Bogota would be updated to reflect IDIGER’s
expansion of protected areas where new building is prohibited.
The Petro administration sought to make these zoning changes permanent by proposing
them as a special modification, known as Decree 364 of 2013, of the zoning laws stipulated in
the city’s POT.8 But in 2014 Bogota’s district council suspended the administration’s proposed
modification of the POT.
Gerardo Ardilla, the director of the Secretariat of Planning under Petro, argues Bogota’s
district council opposed the Petro administration’s proposals because the council was heavily
influenced by the city’s construction industry, specifically CAMACOL, the main construction
industry association. He argued, “CAMACOL is extra neoliberal in its development vision. All
they see in construction is the possibility of generating profits. They don’t have a clear
understanding of their social obligations. And they have tremendous power to pressure the city’s
council members and ministries.”
The current Peñalosa administration is reversing Petro’s strategy. Javier Mendoza, who
led the process of creating the PRICC at IDEAM, he pointed to the current debate over
development in the forest reserve known as la Reserva Thomas van der Hammen as emblematic
8 Bogota’s POT’s are revised every 12 years.
31
of the change in priorities with the new city administration under Peñalosa. Under Petro this
reserve was protected and new development prohibited. But Javier explains, “The new mayor
brought with him an entirely different vision. The idea of using a principal ecological structure to
guide development and land-use was forgotten. And now we return to the Bogota of the cement.
Peñalosa is promoting ciclorutas, public space and some parks, which is fine, but that doesn’t
constitute a plan to address climate change.”
He described the politics in the debate over the forest reserve, “But that is very expensive
land and developers financed Peñalosa’s campaign so they are now pressuring him to let them
build in this reserve.”
He concluded, “PNUD wants to resuscitate PRICC in Peñalosa’s work to revise the POT.
But Peñalosa’s attitude has been whatever Petro did does not interest me.”
Referring to Thomas van der Hammen, Gerardo Ardilla argued, “They are also trying to
reverse our effort to create a protected network of urban forest reserves in the city’s north. This
forest reserve was 20 years in the making. It is meant to diminish the urban heat island effect in
that part of the city, to capture carbon and to allow the trapping of water and the management of
subterranean water systems in that part of the city. They have proposed a new development in
this reserve they call Ciudad Norte. This is taking us back to the development of the 1980s.”
The current director of IDIGER, Richard Vargas, responded, “What does Bogota need to
adapt to climate change over the next 50 years? Public spaces. We need more public spaces. The
parks, the ciclovias, ciclorutas, etc. We, Bogotanos, are demanding higher temperatures! So if we
want public space and ciclovias then it has to be financed. Ciudad Norte contemplates that. Mr.
Developer if you want a taller tower then leave wider sidewalks. That is adapting to climate
change. Sidewalks of 12 meters so that people are out in the streets.
32
He criticized Petro’s attempt to promote more vertical and dense development in the
urban core in his proposed modification to the POT, “They had a proposal to lift restrictions on
building heights across the city in exchange for nothing. They would concentrate population in
certain areas of the city with no new requirements for sidewalks, parks, for alamedas, etc. That’s
crazy. There should be a supply of housing, but the city has to grow in an organized fashion,
dense but organized. When we arrived we studied some of those initiatives and determined we
could not rescue them because they did not make sense financially.”
4. Disconnect between local and national housing policy
Bogota Humana’s housing strategy however was also complicated by the Petro administration’s
disconnect with the Colombian national government. While the Petro administration promoted
building new housing in the urban core much of the national government’s investment in social
housing was primarily found in the urban periphery and often times outside of the city entirely in
surrounding municipalities. This became a problem for Bogota as the ambitious size of the
resettlements generated increasing demand for housing.
Under Bogota Humana resettlements changed from being a subprogram of the
Mejoramiento Integral de Barrios program, which invests in neighborhood infrastructure
improvement projects, to a strategy of the Programa de Gestion Integral de Riesgos, the city’s
risk management program. This change held two important implications. It meant resettlements
due to high risk were now legally distinguished from development-induced resettlements tied to
public infrastructure and public services projects. Most importantly, it meant the city was now
taking responsibility for generating the supply of housing necessary to meet the needs of families
in the resettlement program. In other words, the resettlements would not be organized within the
33
limits of housing policy, resettling families only when alternative housing was available, but
instead on the basis of the resettlement strategy and its goals.
Additionally, because Bogota Humana’s resettlements were prospective it expanded the
area covered by risk zones despite limits in the existing supply of housing. Now, some of the
households included in risk zones and identified as eligible for the resettlement program might
have never experienced climate-related events. This also meant that since the climate model
projections which served as a basis for general predictions were probabilitistic, the households
marked for resettlements could be unaffected by future climate-related events. In these cases, the
resettlement program itself was potentially responsible for creating a previously non-existent risk
for households as it asked them to relocate without the certainty of an imminent risk and without
the certainty it could provide an alternative housing solution within a clearly defined timeline.
Bogota Humana then increased its resettlement goal from 3,232 households to 15,000 (7,900 due
to the threat of landslides and 7,100 due to threat of flooding).
With this new arrangement IDIGER recommended families for resettlement while CVP
took responsibility for finding an alternative housing solution. IDIGER would identify
households to be evacuated, oversee the demolishing of the structure and recovery of the green
space. Then IDIGER would recommend families which it determined had to be permanently
evacuated to the resettlement program managed by CVP. CVP then took on the responsibility for
finding a housing solution. Finally, if new social housing units were not available CVP relied on
a temporary arrangement, called relocalización transitoria, in which a household was offered a
subsidy for renting an apartment while the city completed the construction of new social housing
units.
34
Javier Pava Sanchez explained, “Before the goal was how many homes do we create for
those at high risk. Not how many families do we take out of risk. Now with the national
government the same thing happens. Under the Petro administration we took the position not
how many homes but how many families are exposed to risk. The main responsibility of the state
is to protect human life. The main goal of resettlements is to protect human life. With the
compensation we provided the family would choose what made the most sense for them, which
could be something other than investing in another home.”
To accommodate this increase in resettlements the Petro Administration had to also
increase the available supply of housing. Since the VUR was fixed at 50 SMMLV (instead of
varying with the value determined by the special appraisal as it had before) falling below the
increasing cost of VIP housing, which at the beginning of Bogota Humana was 70 SMMLV, the
administration created the Subsidio Distritial de Vivienda en Especie (SDVE), a housing subsidy
designed to bridge the gap.9 Families with escrituras, or legal proof of property ownership,
qualified for the SDVE but not “poseedores,” that is, families who cannot claim legal ownership
of the land they live on. The SDVE could now be combined with the VUR, along with national
housing subsidies, to fully finance a new home for resettled families.
Instead of subsidizing the supply of housing this strategy subsidized demand. This meant,
technically, a family could rely on this financing scheme to chose from a range of housing
modalities made possible by the resettlement program. First, a family could acquire a used home
provided it met the building safety codes set by IDIGER. For example, codes requiring the
structure was resistant to seismic activity. Secondly, and the most common solution, a family
could acquire a home in the new social housing projects built by CVP. Part of the agency’s
9 Decree 539 de 2012.
35
responsibility for providing permanent homes included working with private developers to build
new social housing projects.
Chart 1. Evolution of Bogota’s financial strategy for resettlements (values in SMLM)
Data source: IDIGER, 2015
Chart 1 illustrates how the Petro administration, via Decree 255, increased the size of the
financial compensation offered to families relocated through CVP’s resettlement program.
Specifically, the administration increased the total compensation offered for VIP to 70 SMLM by
introducing the district subsidy (SDVE). In Chart 1 the SDVE can found as the orange column
with a value of 26 SMLM.
Still, despite the new financial instruments the administration struggled to build new
social housing, especially near the center of the city as the supply of existing social housing was
quickly exhausted. This housing deficit was exacerbated by the Petro administration’s reluctance
5 8 10 10 12
50
16 14
40 38
0
24 24
50 50 50
21 21 2126 2624
5
50 50 50 50
70 70 70
0
10
20
30
40
50
60
70
80
1996 2003 2005 2006 2009 2012 2013
Appraisalaverage Vulnerabilitycompensation VUR
Nationalsubsidy Districtsubsidy Creditandsavings
VIS VIP
36
to rely on the national government’s free housing program to support its housing strategy. Part of
the reason for this approach had to do with where national housing subsidies could be used to
develop social housing. Citing the cost of land and the size of the subsidy, developers which
work with the national social housing program tend to build in the urban periphery or in some
cases in neighboring municipalities. Resettling families to these housing projects would have
undermined Bogota Humana’s goal of reducing social-spatial segregation and relatedly the
climate risk exposure to the city’s lower social economic strata.
Emblematic of these conflicting agendas has been the Campo Verde housing project
developed in partnership with the national government through its free housing program. Campo
Verde was a social housing project with over 6000 units built near the confluence of the Bogota
and Tunjuelo rivers. In 2013 its construction was suspended by the Petro administration because
IDIGER determined it was in a high risk zone vulnerable to flooding. In fact, this area which
constitutes a floodplain has a history of flooding. But in 2016 the Peñalosa administration based
on a new risk assessment by IDIGER resumed construction arguing the risk had been sufficiently
mitigated.
Referring to the Campo Verde project, Gerardo Ardilla argues, “Peñalosa is promoting an
extreme neoliberal vision for the city. One in which real estate development equals urban
development for Bogota. They are promoting Ciudad Rio which consists of developing housing
in the flood plains near the Bogota River with the blind faith that in case of an emergency the
levees will protect residents. This is dangerous and criminal.”
Richard Vargas offered an alternative perspective. Referring to the challenge posed by
the city’s housing deficit he argued, “The Petro administration did not take advantage of the
national government’s housing program. It was a lost opportunity.” Moreover, “Ciudad Rio is a
37
positive example. Building next to Bogota river allows us to pay for the pump station which will
protect the rest of the city from flooding.”
Consequently, during this period over 80% of those resettled found housing in new social
housing projects built by the city. Less than 6% found homes in social housing projects built
through Colombia’s national free housing program. And, the remaining families found used
housing alternatives on their own accord. However, as the administration quickly exhausted the
available stock of social housing in preferred locations closer to the center of the city it had to
increasingly rely on the temporary relocation program, or relocalización transitoria, managed by
CVP.
5. Response from the communities targeted for climate resettlements
Although the Petro administration enjoyed popular support from the city’s lower social economic
strata this relationship was strained in the communities targeted for climate resettlements. This
became increasingly the case as the administration struggled to bridge the housing deficit even as
IDIGER continued to recommend families for resettlement. So that the resettlement process took
longer and new social housing projects were built further into the urban periphery. Meanwhile
neighborhoods experienced uneven resettlement interventions with sections entering the
resettlement program while others stayed behind as the city slowly demolished properties.
Eventually targeted communities began to engage in collective and individual acts of resistance.
These usually took the form of social actions, lawsuits and less visible actions such as disputes
over their compensation and simply refusing to participate in the resettlement program.
Critically, not all households located in high risk zones are marked for resettlement. A
distinction is made between high risk which can be mitigated through improvements in the
38
structure of the house or through investments in localized mitigation works such as retaining
walls and flood control channels, and high risk which cannot be mitigated through these
measures. Known as “alto riesgo no mitigable,” high risk which cannot be mitigated is legally
defined as a type of risk in which the city cannot find “a technically, economically, socially or
environmentally viable solution.” The political nature of this decision, that is, in determining the
“viability” of a solution to risk however becomes clear as it very much depends on the city’s
budgetary decisions, namely how much the city is willing to invest in these projects. (IDIGER
2015) Private developers must also decide whether it is financially viable to invest in risk
mitigation. Here the primary factors in determining financial viability include the location of the
project, the cost of land, and how much of the cost can be passed on to residents.
Additionally, once a concepto tecnico has been issued the properties outside of the
legalized boundaries, included in areas to be resettled, are essentially taken out of the housing
market. These areas are rezoned as suelos de proteccion, or protected land, where housing
construction is no longer permitted. Homes still found in these zones can no longer accrue equity
and can no longer be legally sold in the market. The city begins to gradually lower the impuesto
predial, or property tax, set annually, as the property begins to lose value on the market.

39
Picture 2. Civil Defense team inspecting a home demolished by IDIGER in Ciudad Bolivar
Photograph taken by the author, 2017
Given the housing deficit, under Bogota Humana neighborhoods targeted for resettlement
experienced this process as uneven interventions in which some families were resettled more
quickly than others, and in some cases not at all despite being identified as high risk.
IDIGER also performs a special appraisal to determine the value of the property. If the
special appraisal values the property below that of the VUR then IDIGER recommends the
household enter the resettlement program managed by CVP.10 If the property is valued above
this threshold IDIGER will make an offer to buy the property from the owner. This is a critical
juncture in the process as a family can negotiate the value of the property. For example, they
may ask for a commercial appraisal of the property. Once the property has been turned over to
IDIGER by the resettled family, or by CVP, the agency is responsible for demolishing the
10 When I visited Bogota IDIGER and Caja de Vivienda’s agents explained the threshold at the time was set at 48 million COP.
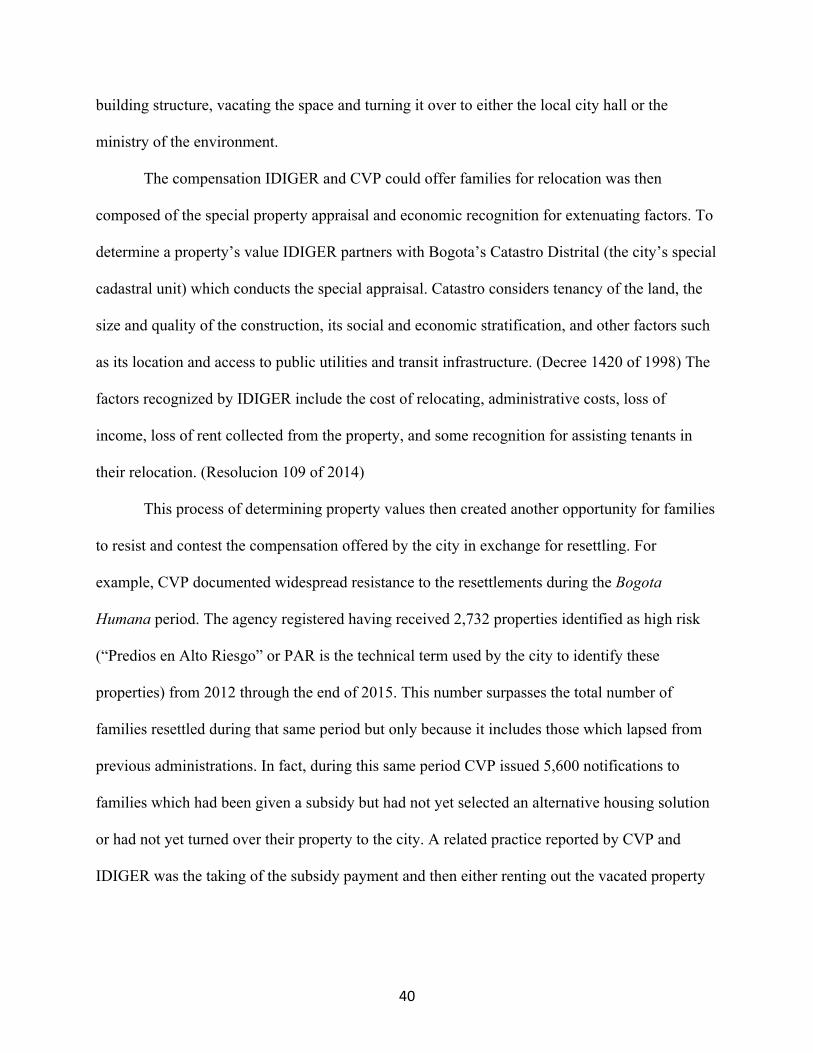
40
building structure, vacating the space and turning it over to either the local city hall or the
ministry of the environment.
The compensation IDIGER and CVP could offer families for relocation was then
composed of the special property appraisal and economic recognition for extenuating factors. To
determine a property’s value IDIGER partners with Bogota’s Catastro Distrital (the city’s special
cadastral unit) which conducts the special appraisal. Catastro considers tenancy of the land, the
size and quality of the construction, its social and economic stratification, and other factors such
as its location and access to public utilities and transit infrastructure. (Decree 1420 of 1998) The
factors recognized by IDIGER include the cost of relocating, administrative costs, loss of
income, loss of rent collected from the property, and some recognition for assisting tenants in
their relocation. (Resolucion 109 of 2014)
This process of determining property values then created another opportunity for families
to resist and contest the compensation offered by the city in exchange for resettling. For
example, CVP documented widespread resistance to the resettlements during the Bogota
Humana period. The agency registered having received 2,732 properties identified as high risk
(“Predios en Alto Riesgo” or PAR is the technical term used by the city to identify these
properties) from 2012 through the end of 2015. This number surpasses the total number of
families resettled during that same period but only because it includes those which lapsed from
previous administrations. In fact, during this same period CVP issued 5,600 notifications to
families which had been given a subsidy but had not yet selected an alternative housing solution
or had not yet turned over their property to the city. A related practice reported by CVP and
IDIGER was the taking of the subsidy payment and then either renting out the vacated property
41
or turning it over to extended family. IDIGER’s social teams also reported increasingly resorting
to the expropriation of properties as the administration neared the end of its term.
The Petro administration attempted social mobilization strategies to build support for the
resettlement housing strategy. For example, Decree 255 made it possible for households to pool
together their subsidies and form Organizaciones Populares de Vivienda (OPVs), or popular
housing organizations. OPVs can enter into partnership with developers to design and build
homes in land acquired by CVP. However, this effort produced limited results. Only two OPVs
successfully initiated and followed through with projects in Usme (336 units) and Bosa (27
units). CVP, responsible for helping families create OPVs and guide them through the process of
identifying land and partnering with developers found it difficult to bring families together. Most
families preferred individual housing solutions. Additionally, OPVs had difficult negotiating
with developers. In Usme the OPV was initially promised the construction of single family
homes before being offered the more typical apartment towers. Ironically, they also had to
absorb the cost of a risk mitigation project since the building was constructed on the banks of a
river. In Bosa the OPV initiated a project which had to be suspended midway because it was
being constructed near the Bogota River, an area prone to widespread flooding.
Olimpo Rojas and Gladys Buchas argue the OPV strategy was important because, “It
showed that people have the capacity, with the resources, to manage the development of these
projects. This is a phenomenon that should be studied more.” However, they also suspect, “… it
is possible the OPV’s were threatened, paramilitaries in the informal settlements threatened
people to keep them away from participating in OPV’s.”
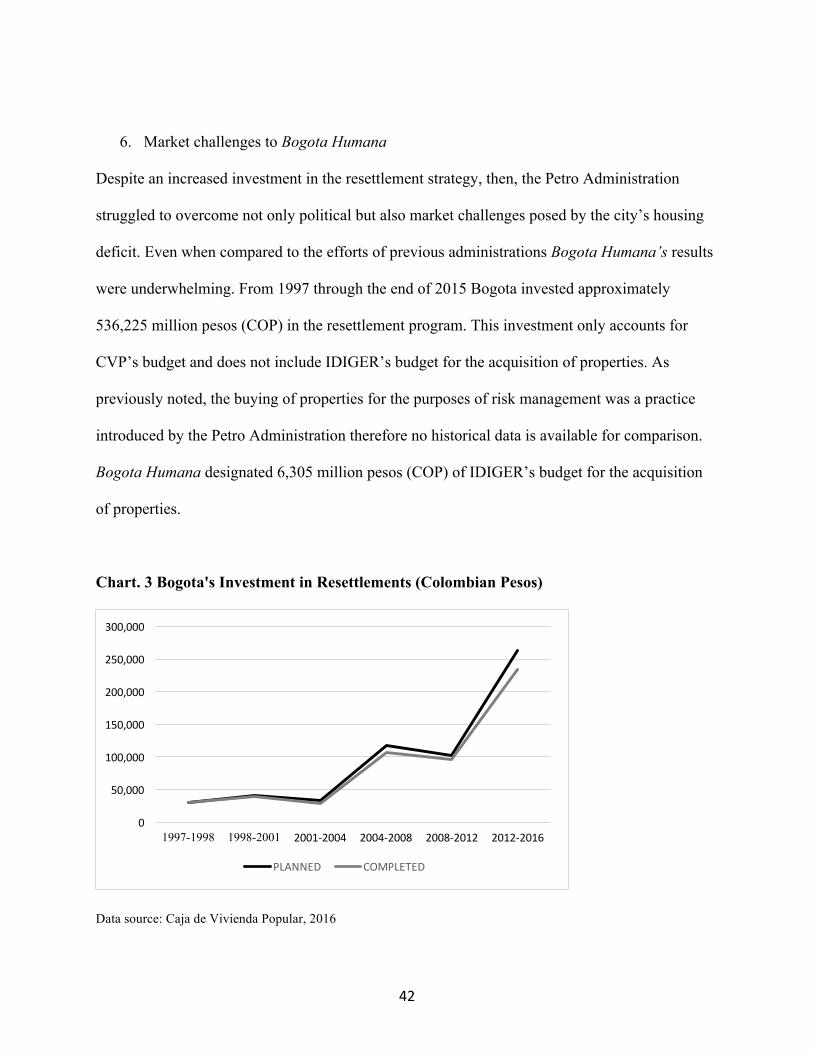
42
6. Market challenges to Bogota Humana
Despite an increased investment in the resettlement strategy, then, the Petro Administration
struggled to overcome not only political but also market challenges posed by the city’s housing
deficit. Even when compared to the efforts of previous administrations Bogota Humana’s results
were underwhelming. From 1997 through the end of 2015 Bogota invested approximately
536,225 million pesos (COP) in the resettlement program. This investment only accounts for
CVP’s budget and does not include IDIGER’s budget for the acquisition of properties. As
previously noted, the buying of properties for the purposes of risk management was a practice
introduced by the Petro Administration therefore no historical data is available for comparison.
Bogota Humana designated 6,305 million pesos (COP) of IDIGER’s budget for the acquisition
of properties.
Chart. 3 Bogota's Investment in Resettlements (Colombian Pesos)
Data source: Caja de Vivienda Popular, 2016
0
50,000
100,000
150,000
200,000
250,000
300,000
1997-1998 1998-2001 2001-2004 2004-2008 2008-2012 2012-2016
PLANNED COMPLETED

43
From 1998, the earliest available data, through the end of 2015 Bogota planned to resettle a
cumulative total of 13, 767 households, actually completing only 8,513 resettlements for a
completion rate of 61.84%. During the Bogota Humana period (2012-2016) the completion rate
for resettlements dropped further to approximately one third (30.9%) through the end of 2015.11
Again no historical data is available for comparing the properties bought by the city but through
the end of 2015 IDIGER reported 147 completed acquisitions out of a planned 600 acquisitions
via this method.
Early in the Bogota Humana period, the Petro administration experienced success in its
climate resettlement strategy. For example, the completion of the Los Altos de la Estancia
resettlement project offered a high-profile example in which important features of the new
strategy were showcased. Here, IDIGER and CVP finished relocating families to new social
housing projects in nearby Madelena (Conjunto Residencial El Paraiso), a neighborhood in the
same locality of Ciudad Bolivar but more centrally located in the city. The Petro administration
was able to negotiate with private developers to build VIP housing alongside higher strata (strata
2 and 3) housing (192 units out of 2408 constructed were set aside for VIP housing for families
resettled by CVP). At the same time IDIGER was able to partner with communities to
collectively manage the large area recovered through the resettlement intervention. IDIGER
invested in community initiatives such as urban agriculture and youth programs to train
community residents how to protect the green space, mitigation works and water channels which
11 The new administration officially takes office in the middle of year, June, which means in these figures which report results through the end of 2015 we would have to account for the last 6 months of the Bogota Humana period. The data I was able to acquire from Caja de Vivienda Popular for 2016 reports approximately 700 resettlements were completed. However, the format in which this data is reported does not allow one to discern how many of these resettlements were completed in the first half of 2016.
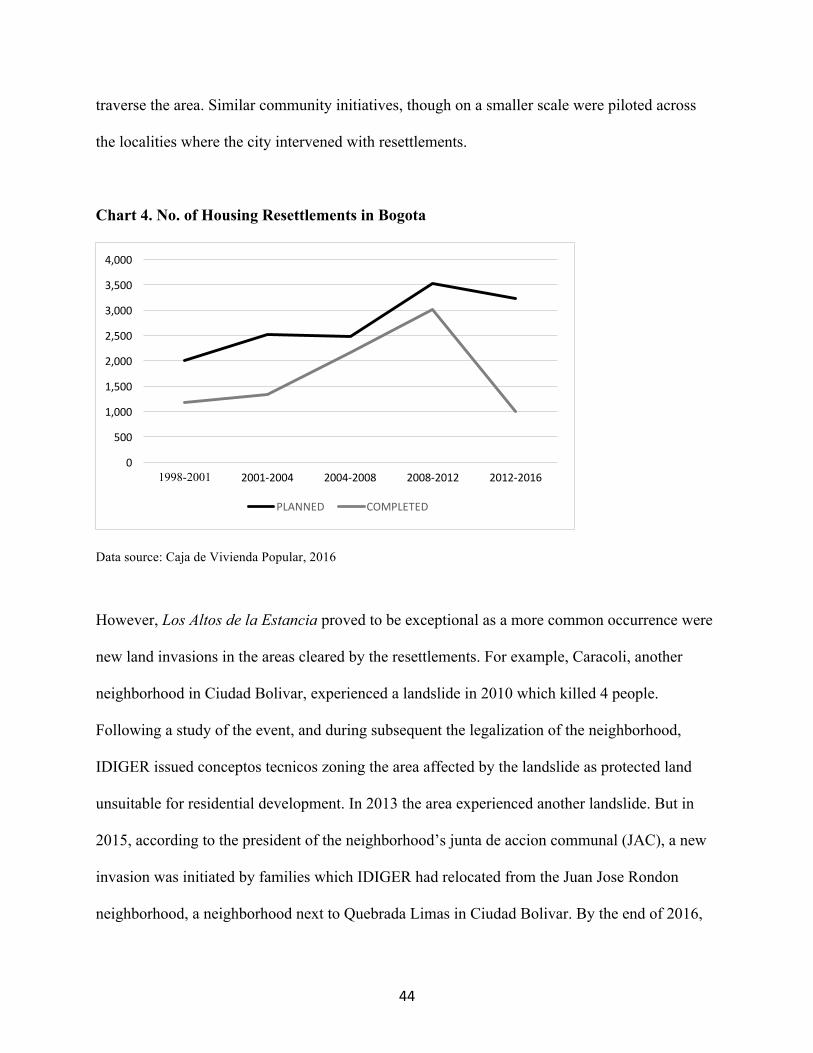
44
traverse the area. Similar community initiatives, though on a smaller scale were piloted across
the localities where the city intervened with resettlements.
Chart 4. No. of Housing Resettlements in Bogota
Data source: Caja de Vivienda Popular, 2016
However, Los Altos de la Estancia proved to be exceptional as a more common occurrence were
new land invasions in the areas cleared by the resettlements. For example, Caracoli, another
neighborhood in Ciudad Bolivar, experienced a landslide in 2010 which killed 4 people.
Following a study of the event, and during subsequent the legalization of the neighborhood,
IDIGER issued conceptos tecnicos zoning the area affected by the landslide as protected land
unsuitable for residential development. In 2013 the area experienced another landslide. But in
2015, according to the president of the neighborhood’s junta de accion communal (JAC), a new
invasion was initiated by families which IDIGER had relocated from the Juan Jose Rondon
neighborhood, a neighborhood next to Quebrada Limas in Ciudad Bolivar. By the end of 2016,
0
500
1,000
1,500
2,000
2,500
3,000
3,500
4,000
1998-2001 2001-2004 2004-2008 2008-2012 2012-2016
PLANNED COMPLETED
45
hundreds of new families had reoccupied this part of Caracoli. Upon a final visit in the late
spring of 2017, now with the Peñalosa administration governing the city, and with its new risk
management strategy in place, these families had settled in and reported being told by city
officials they could stay but would not be compensated with alternative housing in case of a
disaster.
The general housing strategy of Bogota Humana’s resettlements, which consisted of
subsidizing demand via financial instruments like the SDVE, unintentionally incentivized these
cycles of relocation of families at risk, recovery of green spaces and reoccupation by new land
invasions. The strategy encouraged speculation in the informal land and housing markets. First,
informal land developers, or tierreros as they are known locally, anticipated resettlements and
sold lots to families with the resettlement subsidy priced into the cost. When the city could not
initiate new uses for the recovered spaces quick enough the results were new land invasions.
Second, property owners in neighborhoods near resettlements anticipated an influx of new
buyers and renters as relocated families searched for new homes. Property owners then increased
housing prices and might even build new units to rent or sell to families in the resettlement
program.
Olimpo Rojas explained, “Of course it [the SDVE] had an effect on the housing market.
Housing prices skyrocketed, the housing supply became scarce. Another problem, terceros, or
third parties, would claim the property and sell it, or use an intermediary to sell it, at a higher
cost with the added cost of the resettlement. Someone would say I own this property but you
should sell it and you will get a commission for the sale.”
He added, “There were also people who followed IDIGER and la Caja to claim properties
left behind after resettlement. They took advantage of the delay in property acquisition caused by
46
certain ambiguities such as the right to possession and whether or not the state had the legal right
to acquire property or intervene. This created a market for those who were essentially illegally
acquiring the VUR subsidy and reselling it.”
7. Conclusion
Bogota Humana’s climate resettlement strategy while pioneering and ambitious resulted in
limited and sometimes contradictory results. The Petro administration lasted one term and the
one that followed, Peñalosa’s return to city government, brought with it a dramatically different
vision for development. Peñalosa’s new vision does not include the same emphasis on climate
change adaptation nor climate resettlements as a primary strategy. New directors and staff at
IDIGER and Caja de Vivienda argue Petro’s administration offered a nice vision but failed to
demonstrate how it could be feasibly implemented.
Richard Vargas explains this position, “The city is already organized around water. The
2000 POT accounted for this in its development imperatives. In practical terms we never
understood that vision of organizing around water. Physically we never saw it. That as a
philosophy might have been important but in practice we never saw how that would work.”
He continued to explain the current approach to climate change adaptation. Referring to
Bogota Humana he argued, “The scenario of climate change for Bogota is not one to sell a city
that is in danger. The change in temperature we expect in the next 50, 60 years for the city is less
than 1 percent. What we expect in terms of rain is an increase of less than 10 percent. In terms of
climate change adaptation, in those four years of development around water, we never saw that
in concrete terms. How do we protect and insure the water infrastructure of the future? How do
we finance it? By consuming it today! That is how we manage water for the future. So to come
47
out with these messages is not practical, they will not be effective and they are not necessary.
They did not consider the problems in a profound way.”
So far the Peñalosa administration has modified policies and in some cases eliminated
instruments introduced by Bogota Humana. Decree 255 in particular is in the process of being
transformed. The SDVE, one of the main financial instruments which enabled the resettlements,
has been eliminated. IDIGER and Caja de Vivienda’s budget for resettlements has been greatly
reduced. Instead the new administration is investing more in the legalization of new
neighborhoods and in its Ciudad Rio plan which calls for the densification of urban areas near
the Bogota River modeled in projects like Campo Verde. To do this it has modified the risk
zoning created by Bogota Humana.
Javier Mendoza explained he is concerned, “…the new administration does not treat risk
management as necessary to manage an ecological system and instead to respond to individual
emergencies. In this system what happens in the foothills of the eastern Andes eventually affects
what happens in the savannah. I hope they are not returning to the logic of emergency response.”
But his main concern is, “…the technical analysis on the city’s vulnerability to climate change
we created and provided to Bogota is not the basis for the decisions Peñalosa is making in their
development plan and POT revisions.
Bogota Humana’s emphasis on climate resettlements raise important lines of inquiry for
cities considering this strategy as climate change adaptation. Namely, what lessons can be drawn
from this case regarding the use of risk zoning and its relationship to land and housing markets,
and how does the informal housing market set constraints on the relocation of households.
Gerardo Ardilla concluded, “the first challenge one has to confront when trying to
address the effects of climate change on a city like this through public policy are the economic
48
interests...one has to approach the relationship between capitalism and public investment with a
cold head because addressing climate change implies large state investments…and state
investments for the common good imply public entities managed by private interests have to live
at the margins of their profitability. This creates a contradiction between private economic
interests, which are created to maximize profit, and public ones which are created for the
common good.”
49
Chapter 2. Housing crisis and the geography of climate risk in Bogota This chapter considers the neoliberal reform of social housing in Colombia in the late 1990s and
its consequences for the spatial distribution of climate risks in Bogota. I review the literature on
housing policy in Bogota with a focus on the housing crisis precipitated by the introduction of a
demand-side subsidy system in the late 1990s and through the early 2000s. Through an analysis
of secondary housing data, it is argued this financial reform, and the consequent crisis, reinforced
the city’s existing social spatial configuration which fixes the lowest social economic strata to
the riskiest topography in Bogota. In this sense, this neoliberal reform shaped Bogota’s existing
geography of risk. Specifically, this reform resulted in increasingly larger numbers of residents
moving to the informal settlements of Bogota’s southern periphery where they reside in unequal
exposure to the climate risks of flooding and landslides. Moreover, the city’s more recent efforts
to address this housing crisis through the creation of new financial instruments, such as the
Subsidio de Vivienda en Especie (SDVE), have had limited success in improving this social
spatial disparity.
1. Neoliberal reform and the spatial distribution of climate risks in Bogota
In the 1990s, following the pattern of neoliberal reform in the region, inspired by Chile’s social
housing policy model, Colombia transitioned away from the state’s role of directly building and
financing social housing. With the adoption of new housing policy in 1991 (Ley 3 de 1991) the
building of social housing was turned over to private developers. (Cuervo and Jaramillo 2010,
Parias Duran 2010, Ceballos 2008) One of the main challenges to this new strategy was the
inability of low-income residents to generate enough demand which would incentivize
developers to enter the social housing market. To address this challenge, the country shifted to
50
directly subsidizing demand. It created the Instituto Nacional de Vivienda Social y la Reforma
Urbana (INURBE), the national entity responsible for administering the distribution of housing
subsidies. Responsibilities such as the acquisition of land, urbanization and the assignation of
credit were decentralized to municipal governments. The new Plan de Ordenamiento Territorial
(POT) law, requiring cities to develop master plans, Ley 388 de 1997, enabled the creation of
city planning and land-use instruments to support this transition. In Bogota, for example,
Metrovivienda was created in 1998 for land-banking through the acquisition and development of
suelos de expansion (greenfield land) and (renovacion urbana) redevelopment projects. The city
could also rely on its social housing agency, Caja de Vivienda Popular (CVP), created in the
1970s. Although chronically under resourced, CVP was now also engaged in neighborhood
upgrading programs, the administering of district subsidies and housing resettlement projects.
However, the new demand-side subsidy system not only failed to improve the housing
deficit in Bogota but in fact generated a crisis in the housing market. Many families from the
lower social economic strata could not meet the requirements of the new housing subsidy
system. For these families, most of whom were employed in the informal sector, generating the
savings required (worth 10% of the value of the housing unit) and obtaining credit from a bank
was out of reach. (Cuervo and Jaramillo 2010, Parias Duran 2010) With the drop in demand
private developers also struggled to adjust. Small to medium-sized developers, in particular,
unable to compete in the new environment suffered and went out of business. Moreover,
Metrovivienda had limited success in obtaining land at the low costs necessary to incentivize
developers to build social housing. According to Cuervo and Jaramillo (2010) much of the land
Metrovivienda was able to obtain early on was through the open market exposing the entity to
land speculation. Initially it was meant to develop a land value capture program to finance itself
51
but to date it has not been able to do this. Developers have responded by turning to economies of
scale building increasingly smaller housing units often in large apartment towers in peripheral
areas of the city where the cost land is the lowest. These market dynamics have led to many
families simply turning away from the subsidy system and resorting to housing solutions in the
informal housing market.
A consequence of the crisis generated by the new demand-side subsidy system has been a
growing deficit and the growing “auto-construction” or “self-build” of homes by Bogota’s lower
social economic strata. Cuervo and Jaramillo (2010) calculated the proportion of housing
produced in the city through this informal process trended down between 1964 and 1973 (49%),
1973 and 1985 (34%), 1985 and 1993 (12%) only to explode again between 1993 and 2005
(44.2%). This final period encompasses the transition to the new housing subsidy system. Parias
Duran (2010) adds that this auto-construction corresponds to the process of densification and
consolidation of neighborhoods with informal origins during this period. In fact, she finds many
households added a second or third floor to their homes not only to create space for growing
families but also to generate an additional source of income. In a 2004 survey of Bogota’s
informal settlements, Parias Duran (2010) found close to 40% of residents had acquired housing
through the rental market substantiating the growth of the secondary housing market. Moreover,
according to the survey, 61% of transactions in the informal housing market consisted of activity
in this secondary market. This suggests the creation of a dynamic and lucrative secondary market
found especially in the inner rings that are the most consolidated neighborhoods of Bogota’s
informal settlements.
In her tracing of the evolution of Bogota’s urban configuration in the second half of the
20th century, Parias Duran (2012) points to the changes in housing policy, and the financial
52
reform and crisis in housing of the 1990s in particular, as a primary driver in the consolidation of
the city’s geography of social spatial segregation during this period (1980-2000). She describes
the proliferation of the “barrios populares,” or informal settlements, in the southern and western
periphery of the city. During this time, localities such as Usme, San Cristobal, Ciudad Bolivar
and Bosa continued to expand limited only by surrounding municipalities such as Soacha, and
thus through a conurbation process forming the metropolitan area of Bogota. Excluded by the
formal market the city’s lower social economic strata increasingly turned to informal developers,
or the “tierreros” and “pirate” developers, who acquired land through land invasions and the
parceling of lots to be sold in the informal housing market. Importantly, these market changes
also coincided with broader political changes in Colombia such as a sharpening of the civil
conflict and the increase of internally displaced migrants who moved to the city. Many
neighborhoods founded during this time, especially in the locality of Ciudad Bolivar, consisted
of land invasions by former guerillas and paramilitary members who competed over land in these
areas of the city.
The consolidation of these social spatial patterns then fixed Bogota’s lower social
economic strata to the riskiest topography in the city. For example, San Cristobal largely situated
on the slopes of the eastern Andes and Ciudad Bolivar situated among hills, in particular, hold
the largest share of residents vulnerable to the threat of landslides. The city’s risk agency,
IDIGER, uses the term “remocion en masa” to refer to the threat of landslides. Importantly,
remocion en masa technically refers to the anthropogenic nature of this threat. That is, the term
recognizes it is informal development through its inadequate building techniques which
destabilizes slopes where landslides are triggered, or “detonated,” by seismic activity and heavy
precipitation. In localities traversed by the Bogota River and the Tunjuelo River, such as Bosa
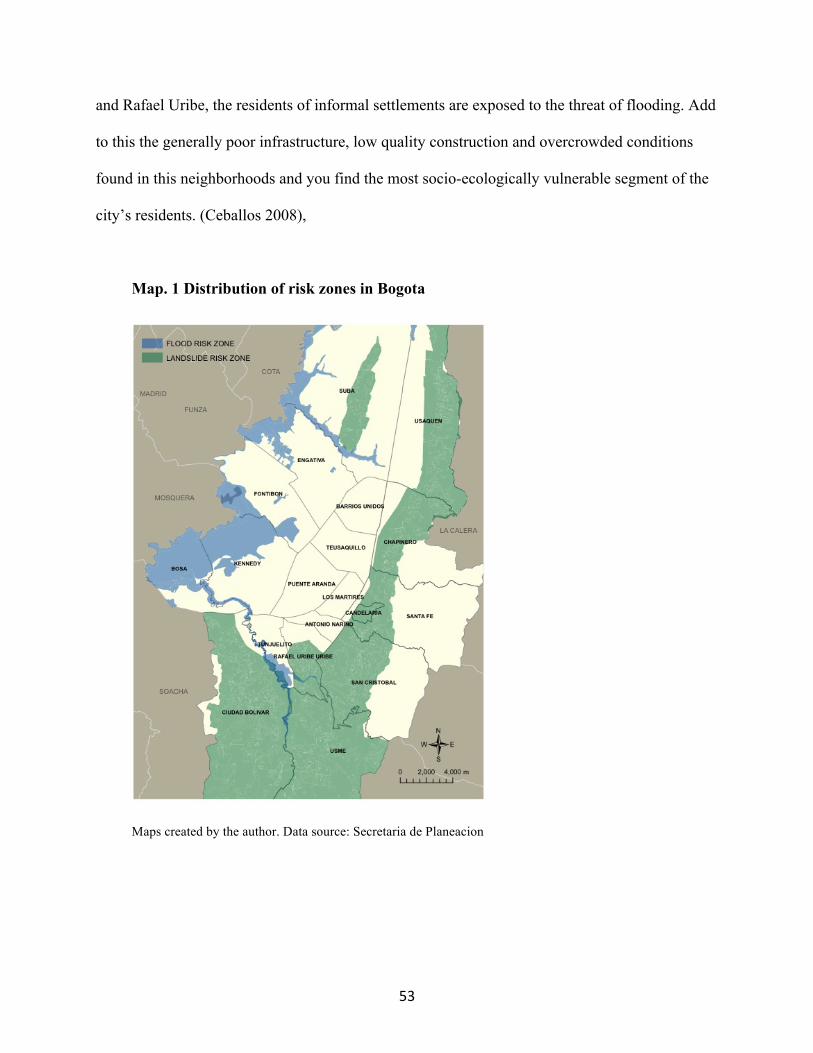
53
and Rafael Uribe, the residents of informal settlements are exposed to the threat of flooding. Add
to this the generally poor infrastructure, low quality construction and overcrowded conditions
found in this neighborhoods and you find the most socio-ecologically vulnerable segment of the
city’s residents. (Ceballos 2008),
Map. 1 Distribution of risk zones in Bogota
Maps created by the author. Data source: Secretaria de Planeacion
54
2. The evolution of the housing deficit
In this section I take a closer look at how the spatial distribution of the housing deficit in Bogota
evolved from the period of crisis in the 1990s and early 2000s to the Bogota Humana period
(2012-2016). Bogota’s housing deficit is measured by the Departamento Administrativo
Nacional de Estadistica (DANE) in three surveys: the national census, the Census Nacional de
Poblacion y Vivienda; the Encuesta Nacional de Calidad de Vida and the Encuesta
Multiproposito. The most recent national census dates from the mid-2000s, thus Cuervo and
Jaramillo’s (2010) discussion of the neoliberal transition leverages data from the period between
the last two censuses 1993 and 2005.12 The other two surveys which are conducted with more
frequency provide more recent data on the housing deficit.13
To define what constitutes a housing deficit, Bogota relies on a methodology developed
by UN-Habitat. (Alcaldia Mayor de Bogota, D.C., Secretaria Distrital del Habitat, 2014) It
identifies two types of deficit, a quantitative and a qualitative deficit. A quantitative deficit
describes the number of homes which need to be built in order to ensure there exists a one to one
relationship between homes and households who need them. This type of deficit is determined
by the following criteria: 1) structures: homes built with unstable materials or without walls 2)
cohabitation: secondary households with more than two members who live in the same home as
other households 3) overcrowding which cannot be mitigated: households have 4 or more
persons per room. A qualitative deficit describes the number of homes in a precarious situation
or in conditions not apt for habitability and which then require improvement, expansion or the
provision of public services. This type of deficit is determined by the following criteria: 1)
12 DANE is currently (2018) conducting the first national census to follow the 2005 national census. 13 The 2017 Encuesta Multiproposito is not publicly available yet.
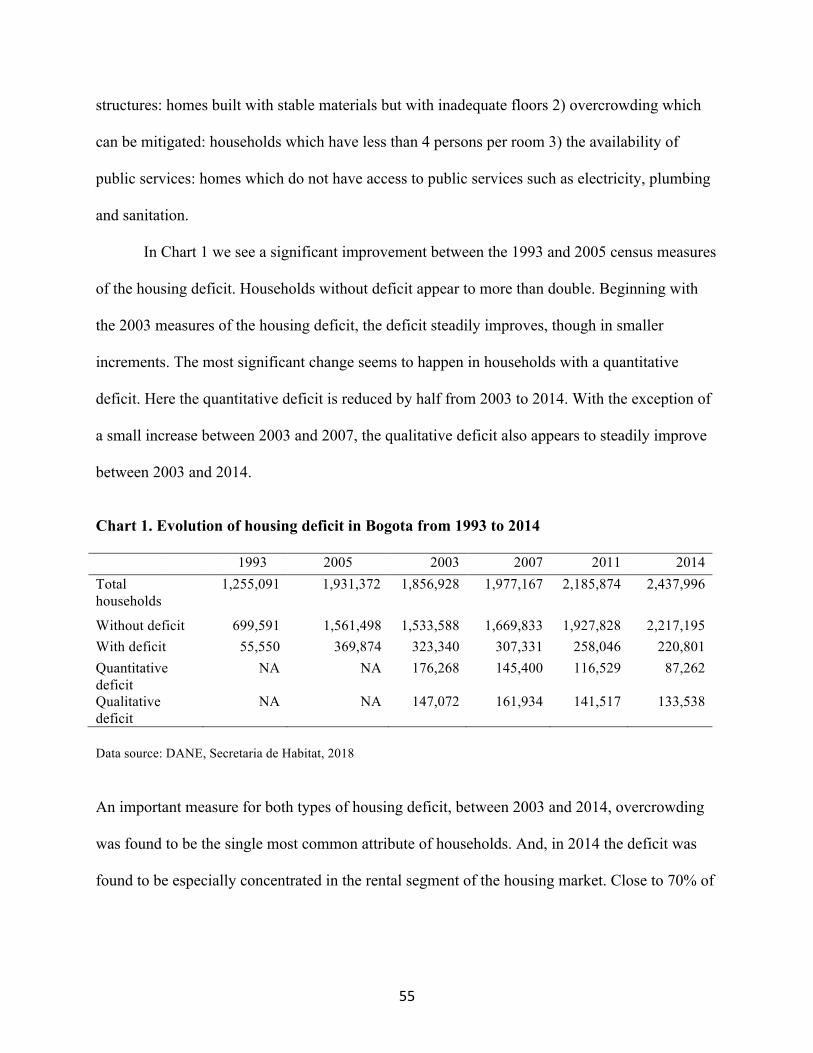
55
structures: homes built with stable materials but with inadequate floors 2) overcrowding which
can be mitigated: households which have less than 4 persons per room 3) the availability of
public services: homes which do not have access to public services such as electricity, plumbing
and sanitation.
In Chart 1 we see a significant improvement between the 1993 and 2005 census measures
of the housing deficit. Households without deficit appear to more than double. Beginning with
the 2003 measures of the housing deficit, the deficit steadily improves, though in smaller
increments. The most significant change seems to happen in households with a quantitative
deficit. Here the quantitative deficit is reduced by half from 2003 to 2014. With the exception of
a small increase between 2003 and 2007, the qualitative deficit also appears to steadily improve
between 2003 and 2014.
Chart 1. Evolution of housing deficit in Bogota from 1993 to 2014 1993 2005 2003 2007 2011 2014 Total households
1,255,091 1,931,372 1,856,928 1,977,167 2,185,874 2,437,996
Without deficit 699,591 1,561,498 1,533,588 1,669,833 1,927,828 2,217,195 With deficit 55,550 369,874 323,340 307,331 258,046 220,801 Quantitative deficit
NA NA 176,268 145,400 116,529 87,262
Qualitative deficit
NA NA 147,072 161,934 141,517 133,538
Data source: DANE, Secretaria de Habitat, 2018 An important measure for both types of housing deficit, between 2003 and 2014, overcrowding
was found to be the single most common attribute of households. And, in 2014 the deficit was
found to be especially concentrated in the rental segment of the housing market. Close to 70% of
56
households renting were found to be experiencing some form of housing deficit. (Alcaldia Mayor
de Bogota, D.C., Secretaria Distrital del Habitat, 2014)
However, while these figures illustrate a generally positive trend in the reduction of the
housing deficit in Bogota, Cuervo and Jaramillo (2010), caution the methods used by the city to
measure changes in the deficit might produce misleading results. As they show in their study of
the financial crisis, the production of housing fell dramatically in the late 1990s and early 2000s
as households and private developers struggled to adjust to the new subsidy system. However,
according to the census, during this same period the number of households without a deficit more
than doubled. Similarly, the more recent deficit figures do not reflect any changes in the 2008-
2009 a period, in which, according to DANE’s housing subsidy data, the city experienced a sharp
downturn in housing production, most likely a reflection of the 2008 global financial crisis.
These divergences between housing production, continued population growth, and the housing
deficit suggest the census and survey data maybe underestimating the true magnitude of the
housing deficit in Bogota.
Now turning to the spatial distribution of the deficit, the 2014 deficit figures reported by
the city show the largest percentages of households in deficit to be concentrated in the southern
and western localities. The locality of Santa Fe is an exception to this trend. However, Santa Fe
is atypical as it represents the heart of Bogota’s old downtown and commercial district. It is site
of the largest concentration of major universities, museums, and commercial buildings in the
city. In general, the spatial distribution of the housing deficit, then, is consistent with Parias
Duran’s (2008) description of the expansion and consolidation of informal settlements in the
south (Ciudad Bolivar and Usme) and west (Bosa and Kennedy) during the housing crisis period.
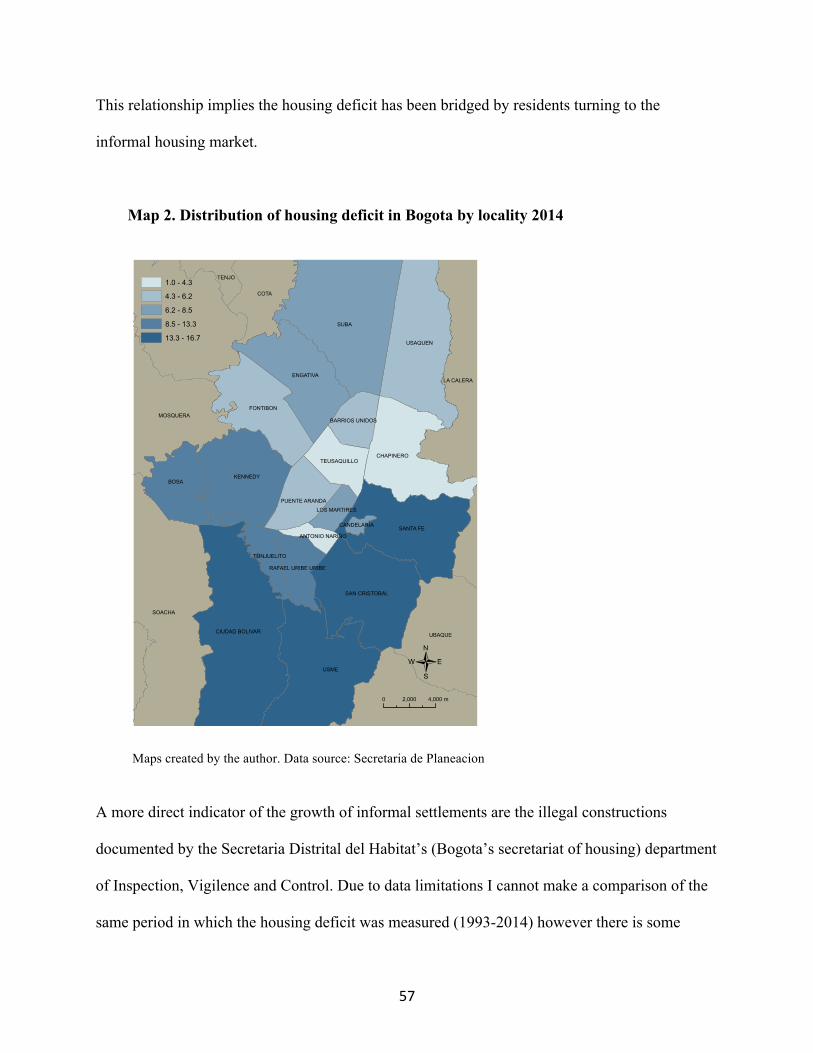
57
This relationship implies the housing deficit has been bridged by residents turning to the
informal housing market.
Map 2. Distribution of housing deficit in Bogota by locality 2014
Maps created by the author. Data source: Secretaria de Planeacion
A more direct indicator of the growth of informal settlements are the illegal constructions
documented by the Secretaria Distrital del Habitat’s (Bogota’s secretariat of housing) department
of Inspection, Vigilence and Control. Due to data limitations I cannot make a comparison of the
same period in which the housing deficit was measured (1993-2014) however there is some
SOACHA
UBAQUE
COTA
LA CALERA
MOSQUERA
TENJO
SUBA
USME
USAQUEN
SANTA FE
CIUDAD BOLIVAR
BOSAKENNEDY
ENGATIVA
FONTIBON
CHAPINERO
SAN CRISTOBAL
PUENTE ARANDA
TEUSAQUILLO
TUNJUELITO
BARRIOS UNIDOS
RAFAEL URIBE URIBE
LOS MARTIRES
ANTONIO NARIÑO
CANDELARIA
0 2,000 4,000 m
1.0 - 4.3
4.3 - 6.2
6.2 - 8.5
8.5 - 13.3
13.3 - 16.7
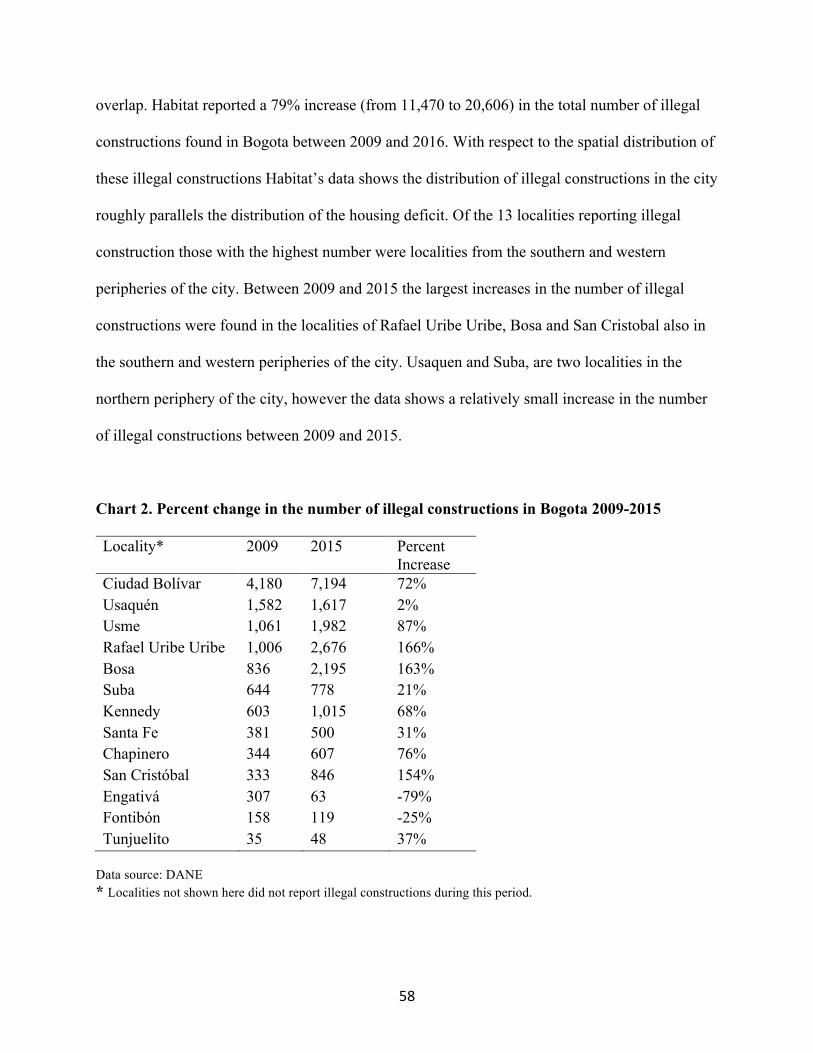
58
overlap. Habitat reported a 79% increase (from 11,470 to 20,606) in the total number of illegal
constructions found in Bogota between 2009 and 2016. With respect to the spatial distribution of
these illegal constructions Habitat’s data shows the distribution of illegal constructions in the city
roughly parallels the distribution of the housing deficit. Of the 13 localities reporting illegal
construction those with the highest number were localities from the southern and western
peripheries of the city. Between 2009 and 2015 the largest increases in the number of illegal
constructions were found in the localities of Rafael Uribe Uribe, Bosa and San Cristobal also in
the southern and western peripheries of the city. Usaquen and Suba, are two localities in the
northern periphery of the city, however the data shows a relatively small increase in the number
of illegal constructions between 2009 and 2015.
Chart 2. Percent change in the number of illegal constructions in Bogota 2009-2015 Locality* 2009 2015 Percent
Increase Ciudad Bolívar 4,180 7,194 72% Usaquén 1,582 1,617 2% Usme 1,061 1,982 87% Rafael Uribe Uribe 1,006 2,676 166% Bosa 836 2,195 163% Suba 644 778 21% Kennedy 603 1,015 68% Santa Fe 381 500 31% Chapinero 344 607 76% San Cristóbal 333 846 154% Engativá 307 63 -79% Fontibón 158 119 -25% Tunjuelito 35 48 37%
Data source: DANE * Localities not shown here did not report illegal constructions during this period.
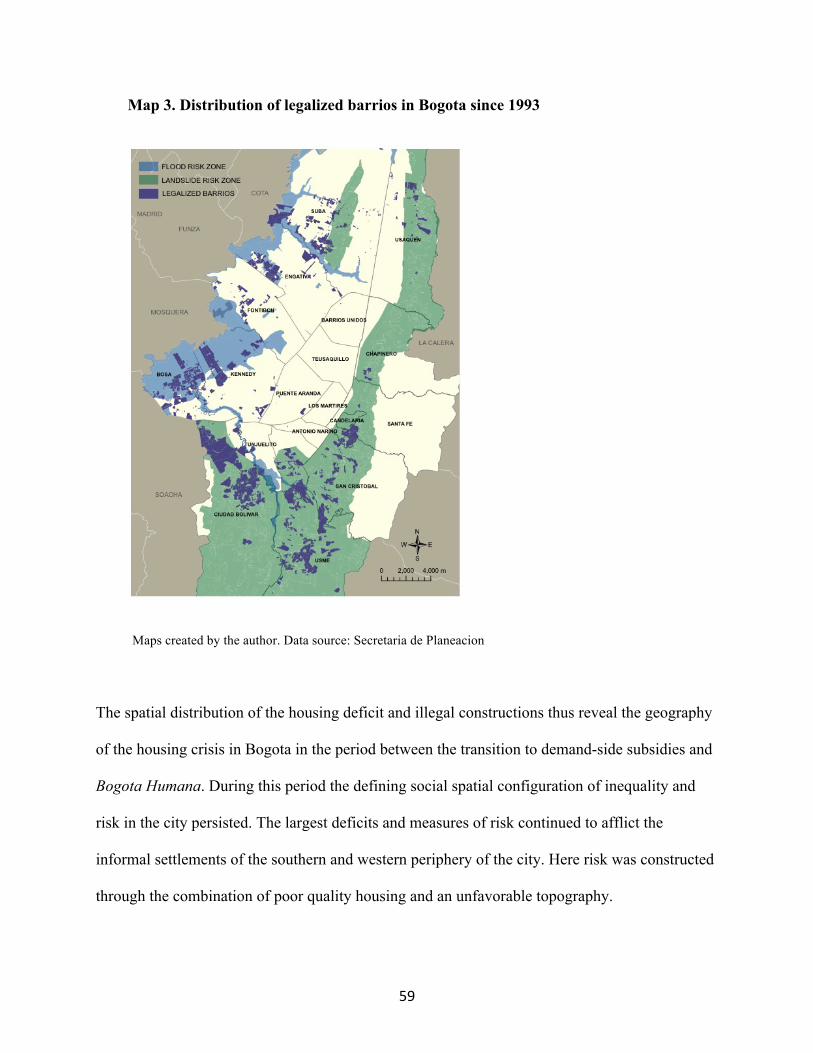
59
Map 3. Distribution of legalized barrios in Bogota since 1993
Maps created by the author. Data source: Secretaria de Planeacion The spatial distribution of the housing deficit and illegal constructions thus reveal the geography
of the housing crisis in Bogota in the period between the transition to demand-side subsidies and
Bogota Humana. During this period the defining social spatial configuration of inequality and
risk in the city persisted. The largest deficits and measures of risk continued to afflict the
informal settlements of the southern and western periphery of the city. Here risk was constructed
through the combination of poor quality housing and an unfavorable topography.

60
There were also important changes in national housing policy with important
implications for the housing deficit in Bogota. The Santos administration, which took office in
2010, for example, invested in housing programs such as Mi Casa Ya – Fondo Nacional de
Ahorro (2014) and the 100 Mil Viviendas Gratis initiative (2012-2015, and only in the
neighboring municipality of Soacha).14 In the next section we will return to the relationship
between these national programs and Bogota’s efforts to address the local housing deficit. Also
noteworthy during this period were institutional changes such as the creation of Secretaria
Distrital del Habitat in 2008 and the consolidation of Metrovivienda which completed its first
projects in 2008-2010. Finally, it was during this period Bogota’s risk management system was
constructed. The creation of this systems with the introduction of new financial instruments like
the VUR, and Bogota Humana’s Subsidio de Vivienda en Especie (SDVE), held important
implications for housing as the city increasingly combined its efforts around the housing deficit
and risk reduction.
14 http://www.minvivienda.gov.co/viceministerios/viceministerio-de-vivienda/programas ; http://www.minvivienda.gov.co/viceministerios/viceministerio-de-vivienda/programas/100-mil-viviendas-gratis/mapa-100-mil-viviendas-gratis
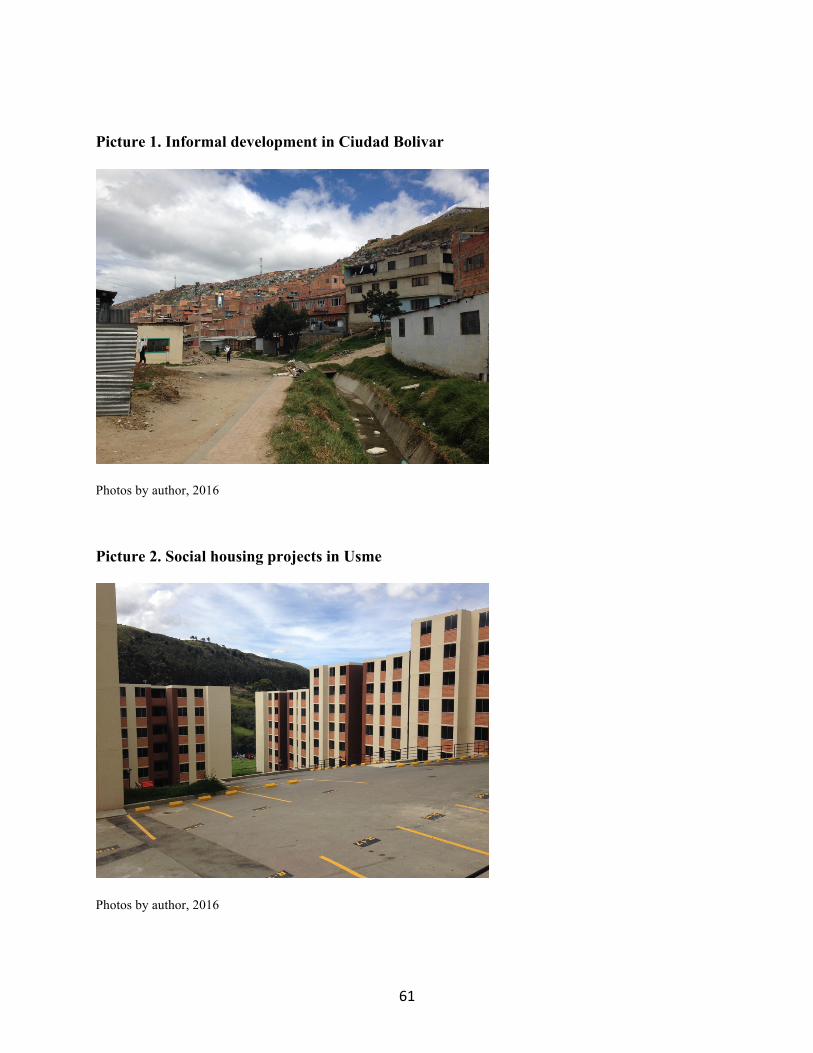
61
Picture 1. Informal development in Ciudad Bolivar
Photos by author, 2016 Picture 2. Social housing projects in Usme
Photos by author, 2016
62
3. Bogota Humana’s housing strategy
During the Bogota Humana period (2012-2016) the Petro administration addressed the city’s
housing deficit and social spatial inequality by emphasizing its relationship to climate risk. One
of its primary strategies for addressing these problems was the use of housing resettlements. The
resettlement program which had been tied to the neighborhood legalization process was
repositioned under the city’s risk management system. Now the number of resettlements were
expanded and included recommendations on the basis of climate change models. The goal was to
relocate vulnerable households from the urban periphery to housing projects closer to the urban
center and as short a distance possible from the neighborhoods they were leaving behind. To
facilitate this, the city introduced a new housing subsidy, the SDVE, made available only to
families in the lowest social economic strata (Strata 1 and 2). The SDVE could be combined with
the Valor Unico de Reconocimiento (VUR) to cover the full cost of an alternative housing
solution for resettled families. It also empowered the city’s risk management agency, IDIGER,
with the ability to buy homes and pay families to relocate on their own. Finally, it proposed a
modification of the city’s master plan (Plan de Ordenamiento Territorial – POT) in which zoning
changes would restrict building in the periphery but encourage densification in more central
areas.
However, the Petro administration’s development plan quickly reached limits imposed on
it by the city’s land and housing market. At the same time Caja de Vivienda Popular (CVP), the
city agency responsible for managing the resettlement program, exhausted the existing social
housing stock, the city experienced a downturn in the overall production of social housing.
Chart 5. illustrates the decline in the production of VIS and VIP housing at the beginning of the
Bogota Humana period and then the sharp increase in production (albeit brief) as the Petro
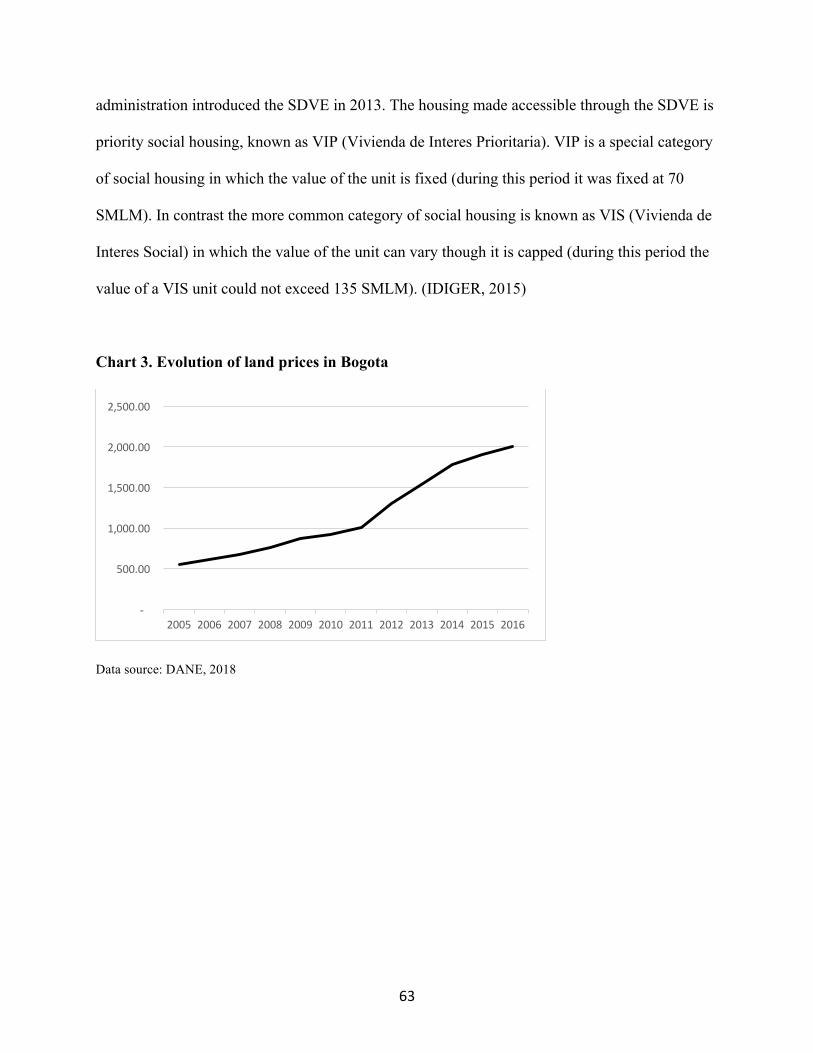
63
administration introduced the SDVE in 2013. The housing made accessible through the SDVE is
priority social housing, known as VIP (Vivienda de Interes Prioritaria). VIP is a special category
of social housing in which the value of the unit is fixed (during this period it was fixed at 70
SMLM). In contrast the more common category of social housing is known as VIS (Vivienda de
Interes Social) in which the value of the unit can vary though it is capped (during this period the
value of a VIS unit could not exceed 135 SMLM). (IDIGER, 2015)
Chart 3. Evolution of land prices in Bogota
Data source: DANE, 2018
-
500.00
1,000.00
1,500.00
2,000.00
2,500.00
2005 2006 2007 2008 2009 2010 2011 2012 2013 2014 2015 2016
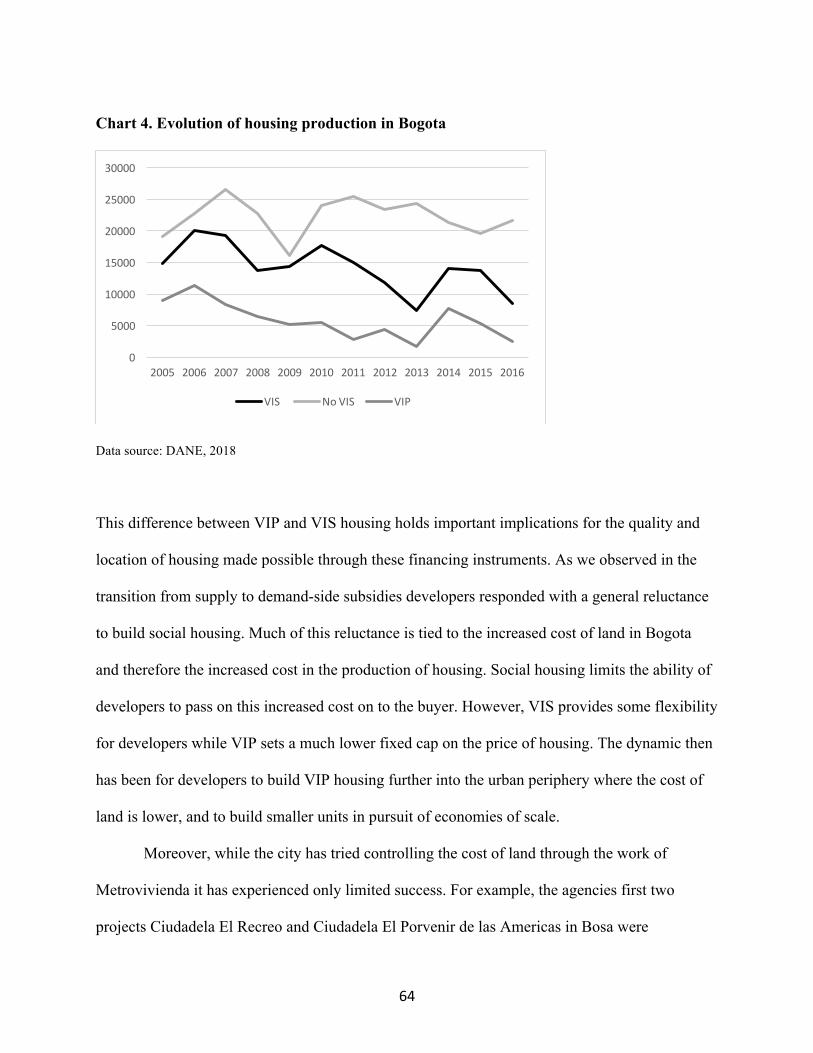
64
Chart 4. Evolution of housing production in Bogota
Data source: DANE, 2018 This difference between VIP and VIS housing holds important implications for the quality and
location of housing made possible through these financing instruments. As we observed in the
transition from supply to demand-side subsidies developers responded with a general reluctance
to build social housing. Much of this reluctance is tied to the increased cost of land in Bogota
and therefore the increased cost in the production of housing. Social housing limits the ability of
developers to pass on this increased cost on to the buyer. However, VIS provides some flexibility
for developers while VIP sets a much lower fixed cap on the price of housing. The dynamic then
has been for developers to build VIP housing further into the urban periphery where the cost of
land is lower, and to build smaller units in pursuit of economies of scale.
Moreover, while the city has tried controlling the cost of land through the work of
Metrovivienda it has experienced only limited success. For example, the agencies first two
projects Ciudadela El Recreo and Ciudadela El Porvenir de las Americas in Bosa were
0
5000
10000
15000
20000
25000
30000
2005 2006 2007 2008 2009 2010 2011 2012 2013 2014 2015 2016
VIS NoVIS VIP
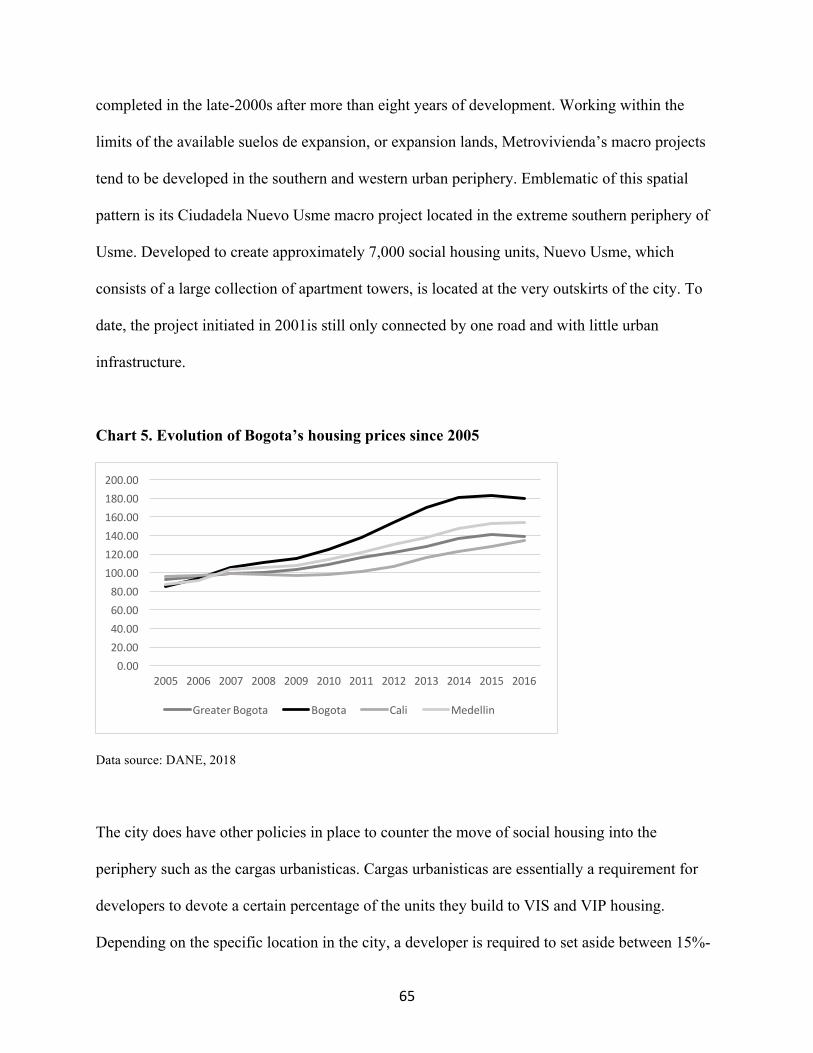
65
completed in the late-2000s after more than eight years of development. Working within the
limits of the available suelos de expansion, or expansion lands, Metrovivienda’s macro projects
tend to be developed in the southern and western urban periphery. Emblematic of this spatial
pattern is its Ciudadela Nuevo Usme macro project located in the extreme southern periphery of
Usme. Developed to create approximately 7,000 social housing units, Nuevo Usme, which
consists of a large collection of apartment towers, is located at the very outskirts of the city. To
date, the project initiated in 2001is still only connected by one road and with little urban
infrastructure.
Chart 5. Evolution of Bogota’s housing prices since 2005
Data source: DANE, 2018 The city does have other policies in place to counter the move of social housing into the
periphery such as the cargas urbanisticas. Cargas urbanisticas are essentially a requirement for
developers to devote a certain percentage of the units they build to VIS and VIP housing.
Depending on the specific location in the city, a developer is required to set aside between 15%-
0.0020.0040.0060.0080.00100.00120.00140.00160.00180.00200.00
2005 2006 2007 2008 2009 2010 2011 2012 2013 2014 2015 2016
GreaterBogota Bogota Cali Medellin
66
30% of their units for VIP housing.15 However, the city also allows developers to pay a
transference fee in lieu of building the VIS / VIP units. (Cargas urbanisticas? (I have data
showing how much they have paid; maybe too much though; leave for later?) One of the few
positive examples in which Caja de Vivienda Popular was able to negotiate with developers to
build VIP for resettled families is found in El Paraiso project in Madalena, Ciudad Bolivar. At
this project, completed in 2016, the developer agreed to build 192 units for families resettled
through the Los Altos de La Estancia resettlement project. Consisting of two small apartment
towers, this project is surrounded by apartment towers the developer built for strata 3 units sold
in a different segment of the housing market.
Finally, the Petro administration had only a limited partnership with the national
government and its housing programs. Since President Manuel Santos took office, the
administration has invested heavily in housing programs such as the 100 Mil Viviendas Gratis,
or the 100 thousand free homes, initiative. Much of the investment in this program, which was
designed to produce VIP social housing, was directed at fast-growing, neighboring
municipalities which increasingly houses Bogota’s workforce. Soacha, in particular, which
borders Ciudad Bolivar and Bosa to the south and west, has been a main site of investment for
the national government’s housing programs. Ciudad Verde, the program’s flagship project, is a
massive 20,000-unit project located in Soacha. During its inauguration Santos allocated 768 units
to those who lost their homes during the 2010-2011 wave of winter storms. Other important sites
of national investments in housing include the peripheral areas of Bosa, namely along the Bogota
River, and the extreme south in Usme. The Ciudadela Usme, located nearly a two hour
Transmilenio ride from downtown Bogota, for example, consists of a large collection of social
15 Article 350 Decree 190 of 2004 determines the percentages that a developer must set aside for social housing.
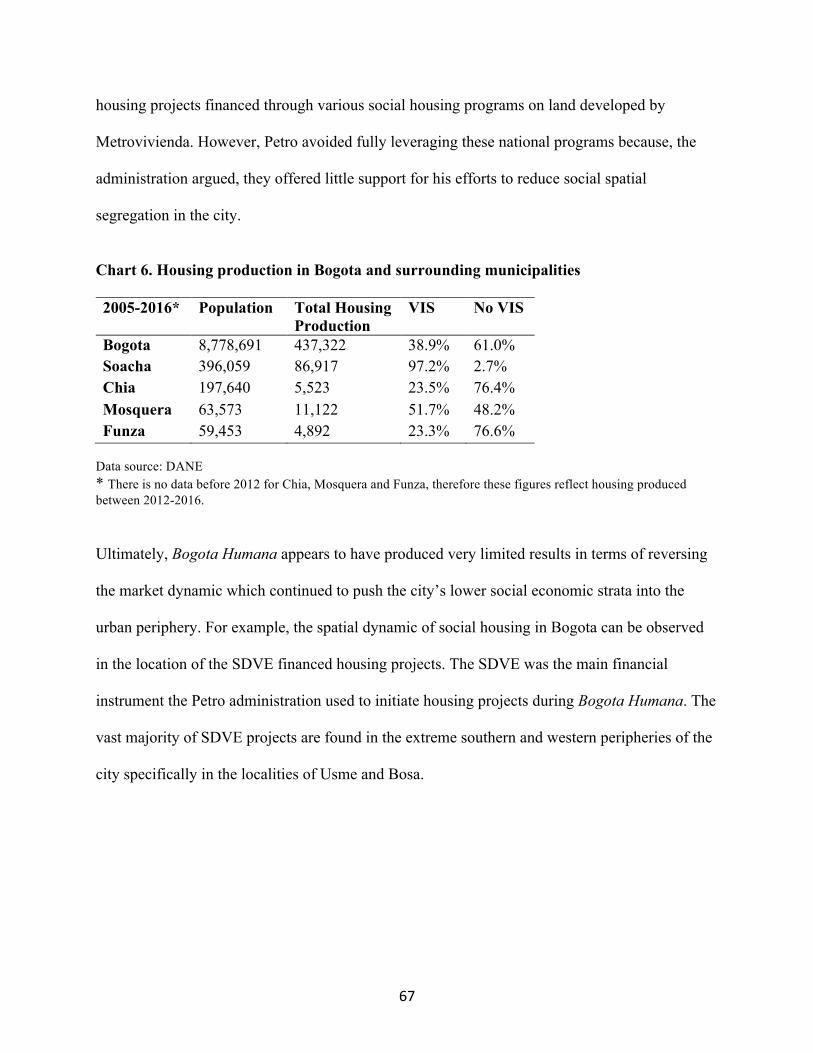
67
housing projects financed through various social housing programs on land developed by
Metrovivienda. However, Petro avoided fully leveraging these national programs because, the
administration argued, they offered little support for his efforts to reduce social spatial
segregation in the city.
Chart 6. Housing production in Bogota and surrounding municipalities 2005-2016* Population Total Housing
Production VIS No VIS
Bogota 8,778,691 437,322 38.9% 61.0% Soacha 396,059 86,917 97.2% 2.7% Chia 197,640 5,523 23.5% 76.4% Mosquera 63,573 11,122 51.7% 48.2% Funza 59,453 4,892 23.3% 76.6%
Data source: DANE * There is no data before 2012 for Chia, Mosquera and Funza, therefore these figures reflect housing produced between 2012-2016. Ultimately, Bogota Humana appears to have produced very limited results in terms of reversing
the market dynamic which continued to push the city’s lower social economic strata into the
urban periphery. For example, the spatial dynamic of social housing in Bogota can be observed
in the location of the SDVE financed housing projects. The SDVE was the main financial
instrument the Petro administration used to initiate housing projects during Bogota Humana. The
vast majority of SDVE projects are found in the extreme southern and western peripheries of the
city specifically in the localities of Usme and Bosa.
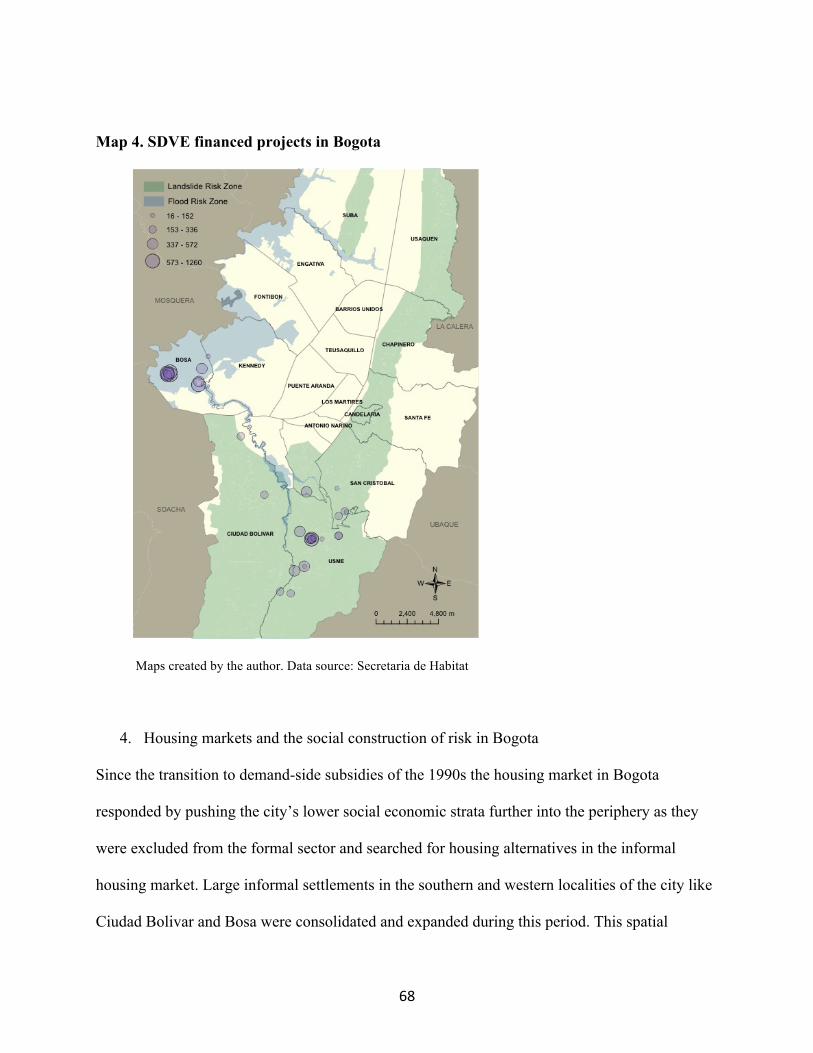
68
Map 4. SDVE financed projects in Bogota
Maps created by the author. Data source: Secretaria de Habitat
4. Housing markets and the social construction of risk in Bogota
Since the transition to demand-side subsidies of the 1990s the housing market in Bogota
responded by pushing the city’s lower social economic strata further into the periphery as they
were excluded from the formal sector and searched for housing alternatives in the informal
housing market. Large informal settlements in the southern and western localities of the city like
Ciudad Bolivar and Bosa were consolidated and expanded during this period. This spatial
69
dynamic, combined with the self-building practices, fixed residents in some of the city’s most
risk-laden topographies prone to landslides and flooding. And while the Petro Administration set
out to reverse these trends, the development vision laid in Bogota Humana was undermined by
the market and political opposition. The result was the reproduction, and in some cases, the
worsening of the risk generating spatial dynamic of the city’s housing market.
Many of the social housing projects constructed with the SDVE were built in risk zones.
The low-quality construction of this projects meant residents were newly exposed to the threat of
landslides and flooding. For example, the Rincones de Bolonia housing project completed in
2015 was built on steep slopes in the locality of Usme. According to Bogota’s own personeria
office (ombudsman or public advocate office), the project built in partnership with the national
government and which produced over 1,000 units, was turned over to families before retention
walls were completed leaving residents exposed to the threat of landslides.16 (Personeria de
Bogota, D.C., 2015) In another example, Bogota had to temporarily stop the development of
over 12,000 VIP housing units in Campo Verde, Bosa, due to complaints of the risk of flooding.
Campo Verde, an area next to the Bogota River is known for having suffered from severe
flooding in 2011. The director of IDIGER under Bogota Humana publicly cautioned against
building social housing in this area, and in other risk zones.17
Moreover, often private developers passed on the cost of mitigating risks at social
housing projects to resettled families. This was most evident in OPV private developer
16 http://www.personeriabogota.gov.co/archivo-2015/item/435-urbanizacion-rincon-de-bolonia-una-montana-de-irregularidades; http://www.noticiasrcn.com/videos/personeria-denuncia-casas-nuevas-usme-estan-riesgo 17 http://www.wradio.com.co/noticias/bogota/advierten-que-proyecto-campo-verde-en-bosa-esta-en-riesgo-de-inundacion/20160707/nota/3182547.aspx; http://www.personeriabogota.gov.co/informacion-general/noticias/item/587-proyecto-de-vivienda-campo-verde-invade-parte-de-humedal; http://www.noticiasrcn.com/videos/ciudadanos-campo-verde-temen-se-vuelva-presentar-una-inundacion
70
partnerships in which families pooled their housing subsidies to fund the project. For example,
the Ventanias de Usminia project built in Usme on a slope next to the Tunjuelo River required
mitigation works to prevent the building from sliding towards the river. This meant that a project
which originally proposed single family homes was redesigned to a set of apartment towers in
order to meet budget constraints. Similarly, another OPV project in Bosa was delayed close to 10
years because the original site selected for 25 single family homes was in a risk zone prone to
flooding from the Bogota River.
5. The perspective from resettled households Between 2016-2017 I made several visits to the social housing projects financed through the
SDVE. In the fall of 2016 I visited projects in Usme and Ciudad Bolivar with representatives
from Caja de Vivienda Popular (CVP). At this time some of these projects were still in
construction and families were only beginning to move in. I was, however, able to meet leaders
from the OPVs and community organizations helping facilitate the resettlement process to these
projects. In the Spring of 2017, at which time most families had already moved into the projects,
I visited to interview families about their experience during the resettlement process. I was
especially interested in their housing strategies during the transition from their neighborhoods of
origin to the social housing projects. Did they look to buy other homes? Did they rent? And,
where did they look for their alternative housing solutions? Given the opportunity I decided to
survey and interview families from three projects, or conjuntos as they are called in Colombia.
These included the Ventania de Usminia conjuntos and Xie conjuntos located in Usme, and El
Paraiso located in Ciudad Bolivar.
71
In the Summer of 2017, with the support of a team of two surveyors from the Vidas
Mobiles program of the Pontificia La Javeriana University, I surveyed families which had been
resettled by CVP through their resettlement program for families in high risk zones. We
completed 103 valid surveys in three housing projects, El Paraiso (N=27), Ventanas de Usminia
(N=36), Xie (N=30). We followed the survey with in-depth household interviews. El Paraiso was
the smallest project with 192 units completed in the Summer of 2016. Ventanas de Usminia
followed with 336 units completed in the Fall of 2016. The last and largest project was Xie with
336 units completed in the Summer of 2016.
These housing projects reflect the various development modalities pursued by CVP. Both
Xie and Ventanas de Usminia are located in Ciudadela Nuevo Usme. Ciudadela Nuevo Usme is
a macro urbanization project developed by Metrovivienda for the expressed purpose of building
social housing through various housing programs. So that Nuevo Usme comprises an
agglomeration of social housing apartment towers built for IDP families (commonly referred to
as desplazados in Colombia), families in the national government’s free housing program,
projects developed by cajas de compensacion, and the CVP’s resettlement program. Ciudadela
Nuevo Usme was previously greenfield land in the extreme southern periphery of Usme, located
nearly two hours away, by transmilenio, from downtown Bogota. CVP acquired the land from
Metrovivienda to develop Ventanas de Usminia in partnership with an OPV called La
Independencia. La Independencia was composed primarily by families from Ciudad Bolivar
though it included others from San Cristobal and Usme. This OPV was responsible for selecting
the private developer and managing the project from the design, implementation of the plan, and
the turnover of units to individual families. In contrast, Xie, which located a 10-minute walk
from Ventanas was built by the national government which allotted some of the units for
72
Colombia’s free housing program and sold the rest to CVP. Both projects are situated on the
banks of the Tunjuelo River in an area zoned at risk of landslides and flooding.
In contrast, to the projects of Ciudadela Nuevo Usme, El Paraiso is located in the
relatively central Madalena neighborhood in Ciudad Bolivar. CVP negotiated the project with a
private developer which built the VIP housing in exchange for the right to build strata 3 housing
in this part of the city. Strata levels are assigned to properties on the basis of variables such as the
quality of construction materials, and neighborhood amenities such as access to transportation,
schools and clinics. Strata levels can also vary over time in accordance with changes in these
variables. Developers prefer building higher strata units because this increases their ability to
pass on the costs of development to buyers. In El Paraiso’s case the developer agreed to keep
CVP’s units at strata level 1 for 10 years.
The survey found 82.8% of all households came from Ciudad Bolivar, while the rest
came from San Cristobal, Bosa, Usme, Rafael Uribe Uribe, and Tunjuelito. This is consistent
with Caja’s resettlement data which reports the main sources of families entering the program are
the localities of Ciudad Bolivar, San Cristobal, Usme and Bosa, in order of frequency. (Informe
de Gestion Enero 2016 Caja de Vivienda). Therefore, the families who were able to resettle in El
Paraiso did not have to travel far from their original neighborhoods. Most families here came
from nearby Los Altos de la Estancia. Here residents also benefit from access to major
Transmilenio lines and commercial centers. The leader of the conjunto’s association argued,
“They [the residents] are lucky because this is a good sector. Here their properties will appraise
value very quickly.” He also explained that the conjunto’s residents were families who had
resisted entering the resettlement program until they were given the option of El Paraiso. A
young woman from the Santa Viviana neighborhood in Ciudad Bolivar who moved to the project
73
with her husband and children added, “The quality of life is better here. Because of the
environment and because one thinks of your children. We are more central here. We are closer to
principal avenues. In Usme the social risks are higher.”
In Nuevo Usme, basic infrastructure and neighborhood amenities are still being
developed. The area is so remote it is even disconnected from Usme’s own central business
district. The leader of the OPV which managed the development of Ventanas de Usminia
explained she was in agreement with the cause of the resettlement because the risk in her
neighborhood was real. However, she is not happy about the scarcity of commerce and
transportation options. She also explained because there is so much new social housing
concentrated in this area there is more pressure on the existing infrastructure. Additionally, a
family from Rafael Uribe Uribe, who left behind a large house, explained, “At first we were
offered apartments in Bosa but we did not want that, when we heard about houses here we liked
that. They talked about two story houses with a plancha [a rooftop built to support the
construction of additional floors]. But then they changed this to apartments.” CVP explains the
project’s design changed to apartments when the developer had to adjust for the costs of
mitigating the risk as required by the zoning code for this parcel.
Before entering the resettlement program, 41.7% of all households had tried buying their
own home. Of these households 81.4% looked for a home in Ciudad Bolivar while the rest
searched for homes in San Cristobal, Usme, Bosa, Engativa, and Rafael Uribe Uribe. A young
woman who had moved to El Paraiso, with her mother and two sisters, explained her family had
first looked to buy a house in 2013 when they were told to vacate their property. But they could
not find a home that met CVP’s strict requirements:
74
“We were given options but they were not very real. Because when it came to select one,
they placed many obstacles. They had very strict requirements and there were very few homes
that met those requirements. They would bother a lot over seismic requirements. And when it
was time to select an option, they place more obstacles, and it seems it always ended up being
new housing, it was easiest for them since they were already build the projects.”
Another woman argued, “We did not look for a used home because of the budget, where
can you find a home with 29 million COP? They also send inspectors to determine if the
structure meets seismic requirements, if the property titles are all in order, etc. All that for 29
million? For 29 million you can’t find something not even in the loma. One cannot borrow from
the bank because they will not lend you because of the sector we lived in, that sector had not
completed the legalization process, it did not have escritura, only promesa de venta”18
The survey also found, because the housing projects took a long time to complete, most
families (72.8%) rented while they waited for their unit. Through the relocalizacion transitoria
program, CVP paid their rent on a monthly basis until they were able to move into their housing
units. Of these families 40% rented for more than 4 years, 15.7% rented for 4-3 years, 17.1%
rented for 2-1 year, and 25.7% rented for less than a year. Not surprisingly, where these families
found homes to rent closely paralleled where they had looked to buy homes. Most (72%) rented
in Ciudad Bolivar, the next largest group (17.3%) rented in Usme, and the rest were distributed
across San Cristobal, Bosa, Rafael Uribe Uribe, Fontibon, and Tunjuelito. These findings are
consistent with Parias Duran’s 2010 survey on secondary housing markets in these localities.
However, many families were not able to stay together through the resettlement process.
Inconsistencies in the CVP’s management of the resettlement process was among the most
18 Loma literally translates to hill though in this context it also holds a negative connotation as it is associated with informal settlements and poor infrastructure.
75
common reason, provided by respondents, for the separation of families. For example, CVP
might treat a large family as several separate households offering them disparate housing
solutions. Another commonly reported reason was the frustration landlords expressed in dealing
with CVP’s bureaucracy. Sometimes this frustration led to families being asked to leave their
new homes complicating their ability to stay together. Overall, then, 58% of the families
surveyed had been able to stay together through the process, while the rest (41.9%) separated. A
woman originally from El Perdomo neighborhood in Ciudad Bolivar who moved to El Paraiso
explained she had been able to stay together with one of her sisters but not her third sister,
“When FOPAE [the predecessor to IDIGER] censused the neighborhood they missed her. So,
she had to leave the house and go look to rent. She had three kids, and still lives in Perdomo.”
Another family in Usme described their experience looking to rent,” It was difficult to
find a place to rent because people do not believe in the government; that the government will
fulfill its promise to pay them. There were periods of 4 to 5 months when CVP did not pay for
rent. We had to pay out of our pocket during that time because every little while they threatened
to kick us out. The last person who rented to us charged us more than they should have because
they knew we did have a choice but to take it.”
Many families had generally favorable opinions about the quality of their new homes in
the social housing projects. Importantly, 79.5% of these families were poseedores, that is, they
did not have legally recognized ownership of the homes they left behind. Many, for example,
came from informal settlements yet to be legalized by the city. Now, even with a small
apartment, they gained the ability to claim a property title and begin accumulating financial
equity in their new home. A family in Usme added, “We are not complaining about this
apartment. It’s not ugly, it’s nice and it’s somewhat big. We do wish we had some space for a
76
business. But, we preferred something small, as long as it was ours, and we did not end up under
a bridge with three kids.”
Still, some (26.2%) reported the desire to move after their 10 years. Most of these
families (81.5%) would look for a new home in Ciudad Bolivar while the rest were considering
other neighborhoods in Usme, or Bosa, Kennedy and Fontibon. In some cases, according to the
OPV leader in Ventanas families might “drop the towel, they get tire of living here.” She
explained some of them simply leave or rent out their apartments before the 5 years required by
CVP. “Sometimes I can’t tell who is the owner of the apartment and who is the renter.”
6. Conclusion
The neoliberal reform of Colombia’s housing subsidy system in the 1990s helped shape Bogota’s
existing geography of risk. It contributed to the expansion and consolidation of the informal
settlements found in the city’s urban periphery. It also appears the city’s investments in social
housing, to bridge the housing deficit, has followed a spatial pattern of building in peripheral
areas of the city, if not outside of Bogota altogether. In some cases, in the city’s risk zones. The
Petro administration attempted to counter this pattern of development through the creation of
new financial instruments like the SDVE, and an unprecedented investment in the resettlement
strategy. The survey of the social housing projects found resettled families generally had a
positive opinion of the resettlement process. Though, confirming the contradictory and
unintended consequences of the resettlement policy, many also reported having searched for
alternative housing in Bogota’s risk areas.
77
Chapter Three: Risk zones and the spatial determinants of new social housing construction
in Bogota (2008-2016)
Bogota’s risk zoning provided the Petro administration with an important policy instrument to
implement its development vision for the city. Emphasizing climate change adaptation in its
development plan Bogota Humana and its proposed modification of the city’s territorial
development plan (POT), the Petro administration sought to control new development in
Bogota’s risk zones. For example, the Petro administration proposed preventing new
construction not just in the city’s high risk zones but also in medium risk zones. This
development vision was met with fierce resistance from the city’s local political and business
elite who favored less restrictions on development. Emblematic of this debate was the Campo
Verde social housing project in Bosa, a locality in the city’s western periphery. Under the Petro
administration the Campo Verde project was suspended because it was being built in the
floodplain next to the Bogota river. But, the Peñalosa administration which replaced the Petro
administration lifted the suspension on Campo Verde as one of its first acts in office.
The debate over risk zoning in Bogota raises questions about its enforcement since its
adoption in 2004. How strongly has it been enforced? Taking into account the city’s resettlement
strategy relies on social housing, how strongly has it been enforced with respect to new social
housing in particular? Do political or market factors weigh more heavily in determining where
this housing is built?
This chapter evaluates the relationship between the new construction of social housing and
risk zoning in Bogota between 2008-2016. Risk zoning, to be more precise, the enforcement of
risk zoning, is very much a state instrument which reflects the political priorities of any given
city administration. But this chapter also conceptualizes the construction of new social housing
78
as an expression of the supply and demand dynamic of the market. While social housing reflects
state investments in the form of subsidies, following housing reforms and the turn to private
developers in the mid-2000s, this type of housing is increasingly subjected to these market
dynamics. (Jaramillo 2008, Parias Duran 2008)
This evaluation relies on the mapping of building permits and the modeling of the effect of
risk zoning on new construction in the city. It relies on a data set of 120,000 building permits
issued between 2008-2016. (Risk zoning was adopted in 2004 but the city’s Secretaría de
Planeación only has building permits digitized from 2008 to the present.) I first map and
produce summary location statistics on Bogotá’s social and market rate housing construction
over this period, demonstrating that despite the city’s control over the siting of social housing,
newly constructed social housing is far more concentrated in risk zones than market rate housing.
This could result from the government being more willing to disregard risk zoning policies in the
case of social housing—a policy double standard—or from market pressures driving social
housing construction into risk zones. A first statistical model shows strong market effects on the
relative location of social vs. market rate housing. A second adds controls for risk zones,
showing first that all else equal, social housing is less likely (or at least no more likely) than its
market rate counterparts to be located in risk zones, and that after controlling for risk zone
location, market factors remain strong determinants of the relative location of the two types of
housing. Thus, the problem does not seem to be driven by a policy double standard, but rather
by market incentives.
79
1. Risk zoning in Bogota
Bogota first began using zoning as a risk management instrument in the late 1990s when the city
incorporated geotechnical maps, created by Colombia’s geology and mining institute (Instituto
Colombiano de Geologia y Mineria - INGEOMINAS) to identify the spatial distribution of
seismic faults, in its neighborhood legalization process This risk zoning aimed to regulate the
type of construction, if any, was permitted in areas of the city with the potential for seismic
activity. Additionally, during this time, Bogota’s risk management agency, IDIGER, began
issuing conceptos tecnicos to prevent new construction in high risk zones. (Osorio 2008) As
Lampis (2012) notes these new policies constituted part of the city’s response to the large influx
of migrants who contributed to the widespread proliferation of informal settlements in Bogota
during this period. The passage of Ley 388 of 1997, which required Colombia’s largest cities
(cities with a population greater than 100,000) to create a Plan de Ordenamiento Territorial
(POT), or territorial master plan, led to the establishment of Bogota’s current risk maps and risk
zoning strategies.
Osorio (2008) explains Bogota’s first, and current POT, finalized in 2004 established a
multi-level system of zoning instruments. First level zoning instruments are designed for long-
term planning (more or less for the duration of the POT which should be updated approximately
every 10 years) and function at the city scale. These include Bogota’s district level risk maps
which identify two major types of risk zones: 1) landslide zones associated with the city’s hills
and mountainous areas 2) flooding zones associated with the development near the major cities
and bodies of water which traverse the city. Additionally, this POT first identified what is called
the city’s Principal Ecological Structure, or the system of water and forest ecosystems, which
traverse the city’s urban territory. Second level zoning instruments are designed for medium-
80
term planning such as the development of new subdivisions or large-scale redevelopment
projects. These include the use of unidades de planeamiento zonal (UPZ) and planes parciales.
Finally, third level zoning instruments are designed for planning interventions at the smallest
scales such as neighborhood level infrastructure projects. These include the conceptos tecnicos
issued by IDIGER which determines the limits for informal settlement legalization projects on
the basis of a territorial risk assessment. Second and third level instruments can be used to adjust
and update first level risk maps.
Lampis (2016) argues Bogota’s pioneering risk management strategies combined with
these land-use instruments can potentially serve as building blocks for an effective district-level
climate change adaptation plan. However, Lampis also emphasizes whether or not climate
change adaptation is realized is partly contingent on the political nature of these planning
projects. For example, while climate change adaptation was central to Petro’s Bogota Humana
development plan calling for the organization of the city’s development around water, and the
city’s principal ecological structure more broadly, these priorities were quickly abandoned by the
new Penalosa-led city administration. In fact, Penalosa’s development plan, Mejor Para Todos,
anchored in projects like Ciudad Rio, which promotes heavy development in close proximity to
the Bogota River, began reversing the zoning modifications made under Bogota Humana.
Similarly, the Penalosa administration supports the expansion of development into the Van der
Hammen forest reserve in the city’s northern periphery.
The shift in Bogota’s development strategy noted by Landis (2016), from one city
administration to another, raises questions of how effective risk zoning has been in preventing
new development in areas marked at risk of landslides and flooding. That is, how much, the
enforcement of risk zoning, figures into the priorities of any given city administration. As Osorio
81
points out (2008), historically, controlling informal development in risk areas has been a
challenge for the city especially since the 1990s with the sharp increase in migration to the city.
First, risk zoning does not necessarily prevent all construction in risk zones. Risk zoning
is classified into three levels: 1) low risk 2) medium risk 3) high risk. As long as the builder can
demonstrate they have taken the measures necessary to mitigate the risk, in their building design
and construction engineering, they are allowed to build in low and medium level risk zones.
High risk zones are further divided into two subcategories, risk which can be mitigated and risk
which cannot be mitigated. Construction is not permitted in high risk zones where IDIGER
determines the risk cannot be mitigated. That is, IDIGER’s conceptos tecnicos can modify the
risk level zoning through a risk assessment. Moreover, if IDIGER determines an area to be at
high risk which cannot be mitigated, they make a recommendation to Bogota’s Secretaria de
Planeacion that they should be reclassified as a suelo de proteccion, or protected land, zone to be
integrated into the city’s Principal Ecological Structure. (Osorio 2008)
Second, private developers operating in the open market enjoy the flexibility of
transferring the costs of mitigation works and land values onto buyers while those operating in
the social housing market do not. This difference holds important implications for where
developers choose to build market rate and social housing. For example, private developers
prefer to build in areas of the city where they can attract Bogota’s higher social economic strata
whom they know can absorb the cost of land and the cost of mitigation if it is necessary. So that
private developers often build on the hillsides of Bogota’s wealthy northern neighborhoods,
found in risk zones, where buyers can afford higher rents and higher housing prices. Conversely,
while developers tend to avoid social housing altogether, if they do build they are more sensitive
to the cost of land since they are less able to pass the cost of mitigation on to buyers.

82
Consequently, they can then build social housing in areas where risk is low so that they do not
have to incure the costs of mitigation or in the southern and western peripheries of the city in
closer proximity to the informal settlements, where land is less expensive but tends to be
correlated with higher risks. Finally, while regular social housing (VIS) provides some flexibility
in that it allows developers to set a range of values for units, priority social housing (VIP) only
allows fixed values. So that developers building VIP housing are the most sensitive to land
values and most likely to deal with any costs associated with mitigation by building in ever
larger economies of scale and further into the periphery.
2. Data collection
Data was collected with support from the Departamento de Sociologia, Facultad de Ciencas
Humanas at la Universidad Nacional de Colombia, Bogota (UNAL). UNAL has an official data
provision agreement with Bogota’s various city departments and agencies for research purposes
through a formal request process. Spatial data including shapefiles for risk zones, protected
natural features, and geographic coordinates for the building permits was acquired from the
Secretaria de Planeacion. The risk zone shapefiles correspond to the landslide and flood risk
maps found in Bogota’s 2004 POT. The protected natural features refer to shapefiles for the
city’s areas de manejo especial, or special management areas, and sistema de areas protegidas, or
protected areas system, which include the water and forest ecosystems encompassed by the city’s
principal ecological structure. Reference maps with shapefiles for sector cadastral, or cadastral
neighborhood, locality and municipal boundaries were acquired from the Infraestructura de
Datos Especiales para el Distrito Capital’s (IDECA) website.19
19 IDECA’s reference maps are publicly available at: https://www.ideca.gov.co/es/servicios/mapa-de-referencia/tabla-mapa-referencia
83
Building permits were acquired from the Registro Local de Obras de Caracter Publico y
Privado en Bogota D.C., a database maintained and updated by the Secretaria de Planeacion.20
This database currently registers approximately 300,000 permits starting in 2008 with the
building permit type, the size of the project measured in square meters, number of units and
number of floors. However, the only geographic identifiers available in this database is the
locality and UPZ for the permit. The exact geographic coordinates (X, Y; latitude and
longitudes) for each building permit was obtained through a formal request also from Secretaria
de Planeacion. Additionally, Secretaria de Planeacion provided the VIS / No VIS or social
housing / market rate housing designation for each building permit which is not found in the
Registro Local de Obras. Finally, Bogota’s cadastral office provided the land values for sectores
cadastrales, or cadastral neighborhoods, for each year from 2004-2016.
3. Dependent variable
The dependent variable consists of the housing permits issued for new construction projects
between 2008-2016 in Bogota. The permits were coded 1 for social housing projects and 0 for
market-rate housing projects to create a dichotomous measure; this dependent variable thus
allows us to identify the factors that make social housing, rather than market rate housing, more
likely to be built in a given location. The city issues several types of building permits for housing
projects including: unifamiliar (single family homes), bifamiliar (two family homes), trifamiliar
(three family homes), and multifamiliar (multi family homes) permits. Therefore, this variable
represents the aggregate of all types of social housing and market-rate housing permits. Lost in
20 The Registro Local de Obras is publicly available at: http://www.sdp.gov.co/portal/page/portal/PortalSDP/InformacionTomaDecisiones/Estadisticas/InformacionPrimaria
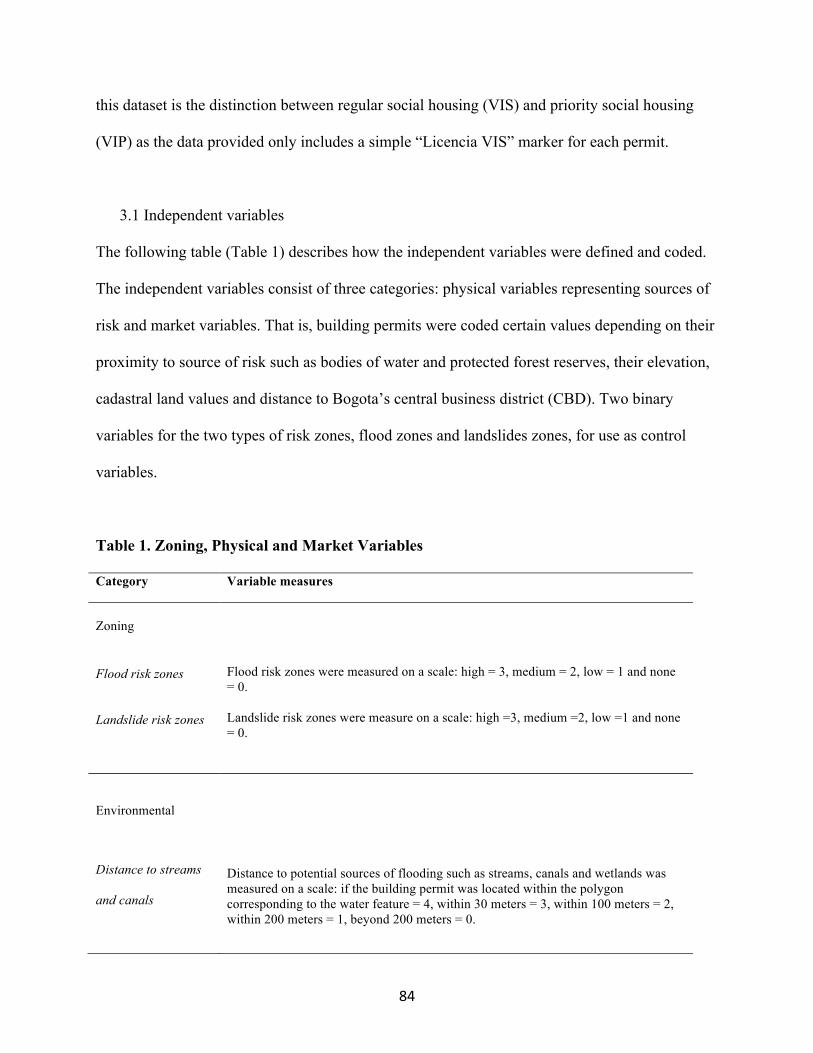
84
this dataset is the distinction between regular social housing (VIS) and priority social housing
(VIP) as the data provided only includes a simple “Licencia VIS” marker for each permit.
3.1 Independent variables
The following table (Table 1) describes how the independent variables were defined and coded.
The independent variables consist of three categories: physical variables representing sources of
risk and market variables. That is, building permits were coded certain values depending on their
proximity to source of risk such as bodies of water and protected forest reserves, their elevation,
cadastral land values and distance to Bogota’s central business district (CBD). Two binary
variables for the two types of risk zones, flood zones and landslides zones, for use as control
variables.
Table 1. Zoning, Physical and Market Variables
Category Variable measures
Zoning Flood risk zones
Landslide risk zones
Flood risk zones were measured on a scale: high = 3, medium = 2, low = 1 and none = 0. Landslide risk zones were measure on a scale: high =3, medium =2, low =1 and none = 0.
Environmental
Distance to streams
and canals
Distance to potential sources of flooding such as streams, canals and wetlands was measured on a scale: if the building permit was located within the polygon corresponding to the water feature = 4, within 30 meters = 3, within 100 meters = 2, within 200 meters = 1, beyond 200 meters = 0.
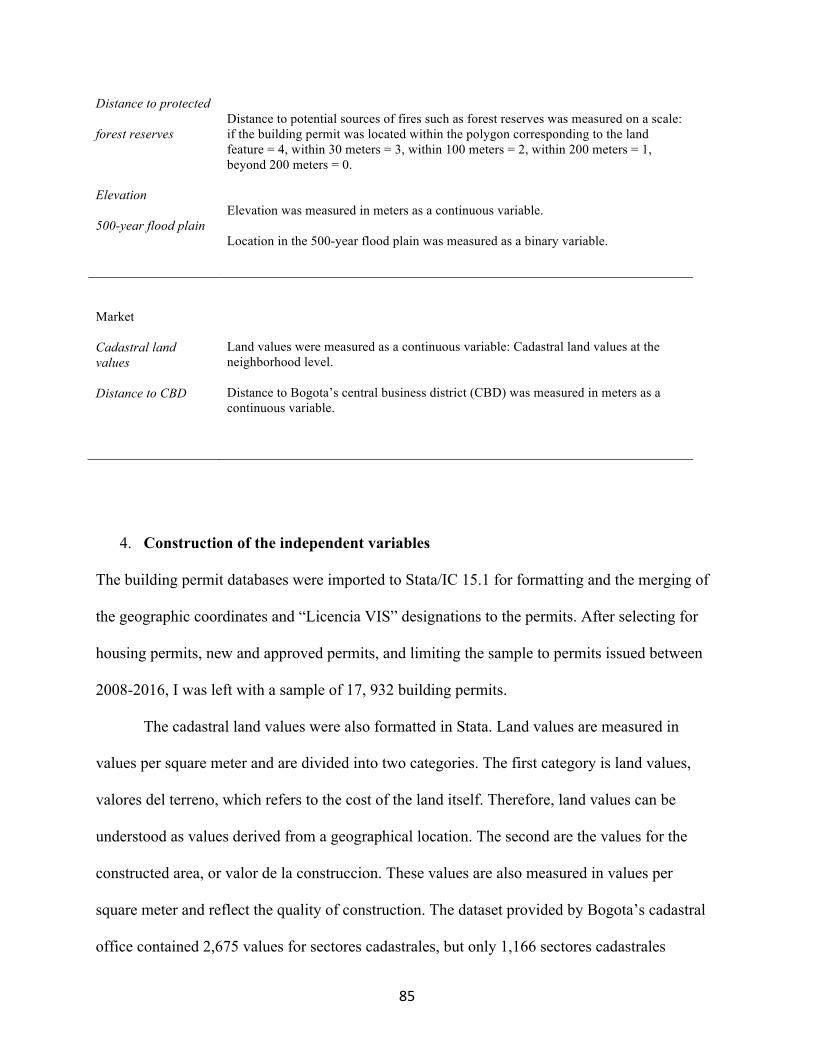
85
Distance to protected
forest reserves
Elevation
500-year flood plain
Distance to potential sources of fires such as forest reserves was measured on a scale: if the building permit was located within the polygon corresponding to the land feature = 4, within 30 meters = 3, within 100 meters = 2, within 200 meters = 1, beyond 200 meters = 0. Elevation was measured in meters as a continuous variable. Location in the 500-year flood plain was measured as a binary variable.
Market
Cadastral land values Distance to CBD
Land values were measured as a continuous variable: Cadastral land values at the neighborhood level. Distance to Bogota’s central business district (CBD) was measured in meters as a continuous variable.
4. Construction of the independent variables
The building permit databases were imported to Stata/IC 15.1 for formatting and the merging of
the geographic coordinates and “Licencia VIS” designations to the permits. After selecting for
housing permits, new and approved permits, and limiting the sample to permits issued between
2008-2016, I was left with a sample of 17, 932 building permits.
The cadastral land values were also formatted in Stata. Land values are measured in
values per square meter and are divided into two categories. The first category is land values,
valores del terreno, which refers to the cost of the land itself. Therefore, land values can be
understood as values derived from a geographical location. The second are the values for the
constructed area, or valor de la construccion. These values are also measured in values per
square meter and reflect the quality of construction. The dataset provided by Bogota’s cadastral
office contained 2,675 values for sectores cadastrales, but only 1,166 sectores cadastrales
86
actually exist. The discrepancy can be explained by the division of values between horizontal
and non-horizontal properties. Horizontally-owned property refers to cooperative or
condominium ownership regimes. I collapsed these categories into average values for each sector
cadastral. I also calculated the average for the values between 2008-2016.
This sample of building permits and the cadastral land values were imported to ArcGIS
10.3.1 to construct the independent variables. First, I projected the building permits to create a
feature class representing the location of each permit as a distribution of points. Then I
performed a spatial join of the permits and the risk zone polygons to obtain risk levels.
Next I used the Generate Near Table tool in ArcMap to calculate the distance between
each permit and the nearest source of risk in meters. This metric was designed to measure
distance to streams and canals not found in flood plains, in addition to protected forest reserves.
Since the elevation map for Bogota embeds values in curvilinear features I had to first
convert the map into a raster, then into a grid coded with elevation values, before performing a
spatial join to obtain elevation values for each building permit.
To obtain the cadastral values for the building permits I first performed a spatial join of
the cadastral values table and the sector cadastral shapefile. Then I joined the sector cadastral
shapefile to the building permits.
The distance to central business district was calculated by first identifying Bogota’s
CBD, located in Chapinero, then using the near distance tool in ArcMap to calculate the distance
between the centroids for each sector cadastral and the centroid of the sector cadastral which
contains the CBD. The distance to CBD for each building permit was then obtained through a
spatial join of the permits and the sector cadastral shapefiles.
87
5. Descriptive maps
The following maps illustrate the spatial distribution of new construction in Bogota during the
2008-2016 period. The spatial relationship between new social housing construction and the two
major types of risk zoning, flood and landslide risk zones, can be found in Map 1.
Map 1. Distribution of social housing in Bogota
Maps created by the author. Data source: Secretaria de Planeacion

88
The second map compares the spatial distribution of new social housing to new market-rate
housing. This map, Map 2., suggests social housing is concentrated in peripheral urban areas
largely absent from the locality which contains Bogota’s CBD, Chapinero.
Map 2. Distribution of social and market rate housing in Bogota
Maps created by the author. Data source: Secretaria de Planeacion
89
Map 3. SDVE financed projects in Bogota
Maps created by the author. Data source: Secretaria de Habitat
Apparent from the two maps is the fact that newly built social housing has considerably higher
concentrations in landslide and especially flood risk zones than private housing.
1. Descriptive Statistics
The amount of new housing construction found in areas of Bogota zoned at risk is significant
with 45% of all new construction during this period was found in either flood or landslide risk
zones (see appendix). Slightly more of the new housing constructed, 24% compared to 21%, was
90
found in landslide risk zones, however the single largest concentration, 18% was found in
medium risk level flood zones. (see appendix) These percentages of construction in risk zones
indicates the conflict brought by the expansionary pressure of the housing market in the risk
laden topography of Bogota. However, finding new housing construction in risk zones in itself
does not discount the effect this type of zoning might have in controlling development in the
riskiest areas of the city. Risk zoning was not created to prevent construction but to control the
quality of new construction. Provided the new building design includes risk mitigation features it
is permitted across the different levels of risk zoning unless the area has been marked a suelo de
proteccion, or a protected land by Bogota’s risk management agency, IDIGER.
When stratifying the sample by housing type, as can be seen in Table 1., social housing
was found to be disproportionately represented in risk zones with 29% of new social housing
found in risk zones compared to 19% found outside of risk zones.
Table 1. Distribution of market-rate and social housing across risk zones (2008-2016)
Outside Risk Inside Risk Inside Risk
Building Permits Frequency Percent Frequency Percent Percent of total
Market rate housing 8,034 81.00 5,740 71.00 42.00
Social housing 1,847 19.00 2,311 29.00 56.00
Total 9,881 100.00 8,051 100.00
Reflecting the broader trend in new housing, Table 2. shows the largest concentration of new
social housing, 1,068 permits, found in risk zones was built in medium level flood risk zones.
For both flood and landslide risks, though moreso for flood risks, the main disparity between
91
market rate and social housing locations is that social housing is less often sited in no-risk zones,
and considerably more often sited in medium-risk zones.
Table 2. Distribution of market-rate and social housing permits across risk levels (2008-2016)
Flood Zone
Landslide Zone
Risk level
Frequency
Market
Percent
Social
Percent
Frequency
Market
Percent
Social
Percent
None 11,281 81.90 2,918 70.17 10,527 76.59 3,087 74.24
Low 289 2.09 152 3.66 1,527 11.11 440 10.58
Medium 2,131 15.47 1,068 25.68 1,616 11.75 599 14.40
High 73 0.53 20 0.05 104 0.75 32 0.76
Total 13,774 100.00 4,158 100.00 13,744 100.00 4,158 100.00
Thus, descriptive statistics confirm what the maps showed: new social housing was more likely
to be located in a risk zone than new market rate housing. But these descriptive profiles do not
tell us whether this fact reflects a policy double standard, or instead results from market
pressures. To distinguish between these possibilities, I undertake multivariate modeling—first
providing basic descriptive statistics for the independent variables and testing for autocorrelation
issues.
The following table, Table 3., provides the descriptive statistics for the independent
variables. It should be noted that for the logistic model, variables measured in square meters
were rescaled to hundreds of square meters. The rescaling is not reflected in this table.
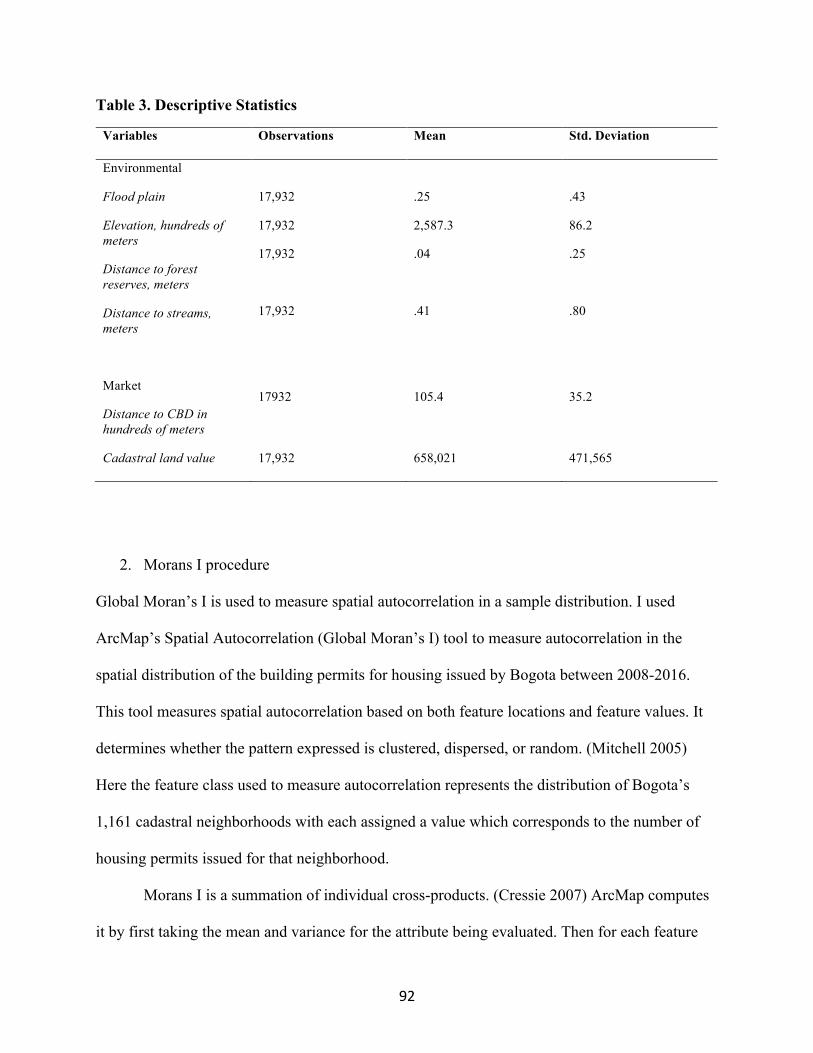
92
Table 3. Descriptive Statistics
Variables Observations Mean Std. Deviation
Environmental
Flood plain
Elevation, hundreds of meters
Distance to forest reserves, meters
Distance to streams, meters
Market
Distance to CBD in hundreds of meters
17,932
17,932
17,932
17,932
17932
.25
2,587.3
.04
.41
105.4
.43
86.2
.25
.80
35.2
Cadastral land value 17,932 658,021 471,565
2. Morans I procedure
Global Moran’s I is used to measure spatial autocorrelation in a sample distribution. I used
ArcMap’s Spatial Autocorrelation (Global Moran’s I) tool to measure autocorrelation in the
spatial distribution of the building permits for housing issued by Bogota between 2008-2016.
This tool measures spatial autocorrelation based on both feature locations and feature values. It
determines whether the pattern expressed is clustered, dispersed, or random. (Mitchell 2005)
Here the feature class used to measure autocorrelation represents the distribution of Bogota’s
1,161 cadastral neighborhoods with each assigned a value which corresponds to the number of
housing permits issued for that neighborhood.
Morans I is a summation of individual cross-products. (Cressie 2007) ArcMap computes
it by first taking the mean and variance for the attribute being evaluated. Then for each feature

93
value it subtracts the mean, creating a deviation from the mean. Deviation values for all
neighboring features are multiplied together to create a cross-product. When values for
neighboring features are either both larger than the mean or both smaller than the mean, the
cross-product will be positive. When one value is smaller than the mean and the other is larger
than the mean, the cross-product will be negative. If the values in the data tend to cluster
spatially, the Moran’s I will be positive. When high values repel other high values, and tend to be
near low values, the Moran’s I will be negative. The numerator is normalized by the variance so
that the Moran’s I values fall between 1.0 and +1.0. (Mitchell 2005)
Since I was interested in the distribution of social housing compared to the distribution of
market-rate housing I used ArcMap to calculate a Moran’s I for two separate samples, the social
housing permits, and the market-rate housing permits. The spatial unit of analysis was the
cadastral neighborhood (n = 1,161). I performed a spatial join between the neighborhood
shapefiles and the building permits to create a count of permits per neighborhood. This count
was the basis for the Moran’s I calculation.
Then to locate clusters in the building permits I calculated the Anselin Local Moran’s I
for the cadastral barrios in each subset of the sample. Because Moran’s I is a summation of
individual cross-products, local indicators of spatial association (LISA) can be used to evaluate
clustering in individual units by calculating Local Moran’s I for each spatial unit. (Anselin 1995)
I used ArcMap’s Cluster and Outlier Analysis tool to perform the Local Moran’s I calculations.
In the feature output generated by this tool a positive value for I indicates that a feature has
neighboring features with similarly high or low attribute values, this feature is part of a cluster. A
negative value for I indicates that a feature has neighboring features with dissimilar values, this
feature is an outlier. The cluster / outlier type field distinguishes between statistically significant
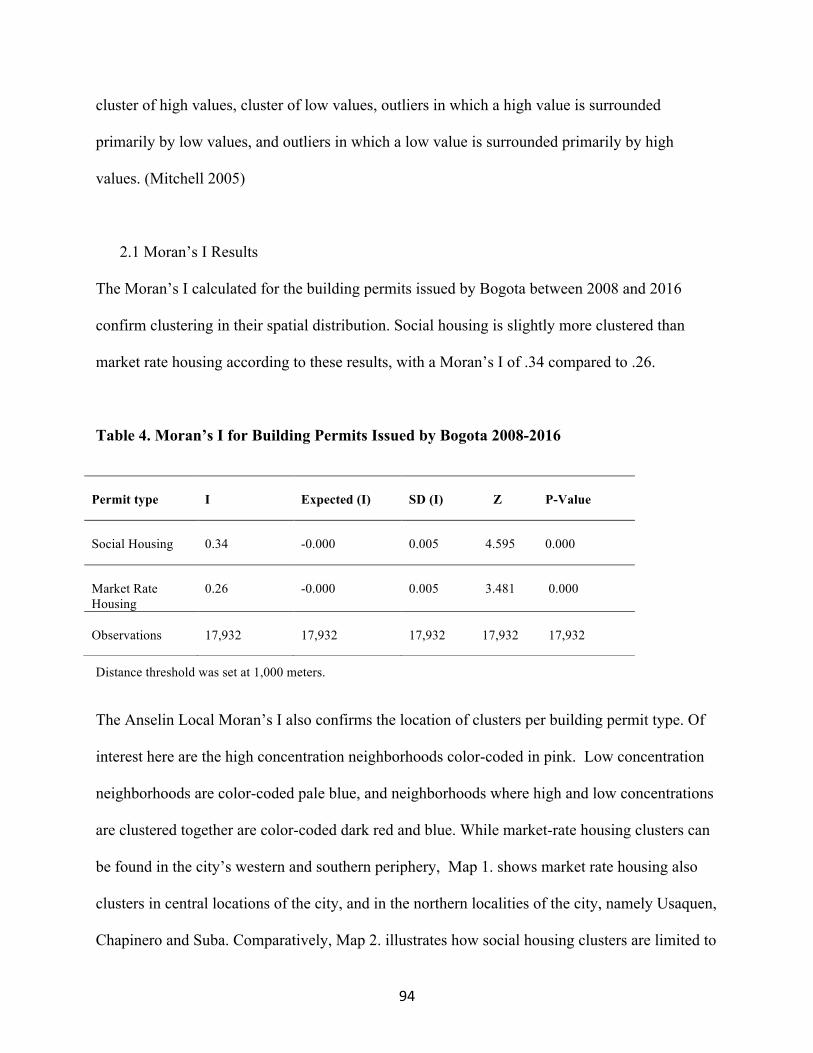
94
cluster of high values, cluster of low values, outliers in which a high value is surrounded
primarily by low values, and outliers in which a low value is surrounded primarily by high
values. (Mitchell 2005)
2.1 Moran’s I Results
The Moran’s I calculated for the building permits issued by Bogota between 2008 and 2016
confirm clustering in their spatial distribution. Social housing is slightly more clustered than
market rate housing according to these results, with a Moran’s I of .34 compared to .26.
Table 4. Moran’s I for Building Permits Issued by Bogota 2008-2016
Distance threshold was set at 1,000 meters.
The Anselin Local Moran’s I also confirms the location of clusters per building permit type. Of
interest here are the high concentration neighborhoods color-coded in pink. Low concentration
neighborhoods are color-coded pale blue, and neighborhoods where high and low concentrations
are clustered together are color-coded dark red and blue. While market-rate housing clusters can
be found in the city’s western and southern periphery, Map 1. shows market rate housing also
clusters in central locations of the city, and in the northern localities of the city, namely Usaquen,
Chapinero and Suba. Comparatively, Map 2. illustrates how social housing clusters are limited to
Permit type
I
Expected (I)
SD (I) Z P-Value
Social Housing
0.34
-0.000
0.005 4.595 0.000
Market Rate Housing
0.26
-0.000
0.005 3.481 0.000
Observations
17,932
17,932
17,932 17,932 17,932
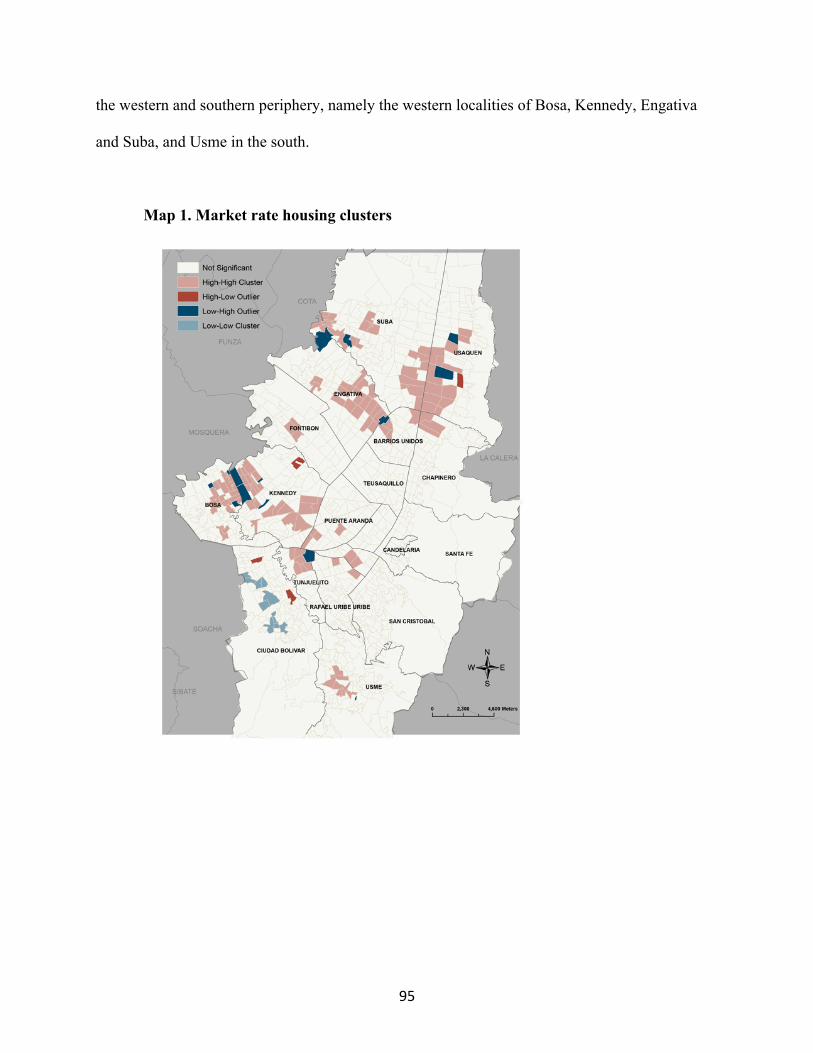
95
the western and southern periphery, namely the western localities of Bosa, Kennedy, Engativa
and Suba, and Usme in the south.
Map 1. Market rate housing clusters
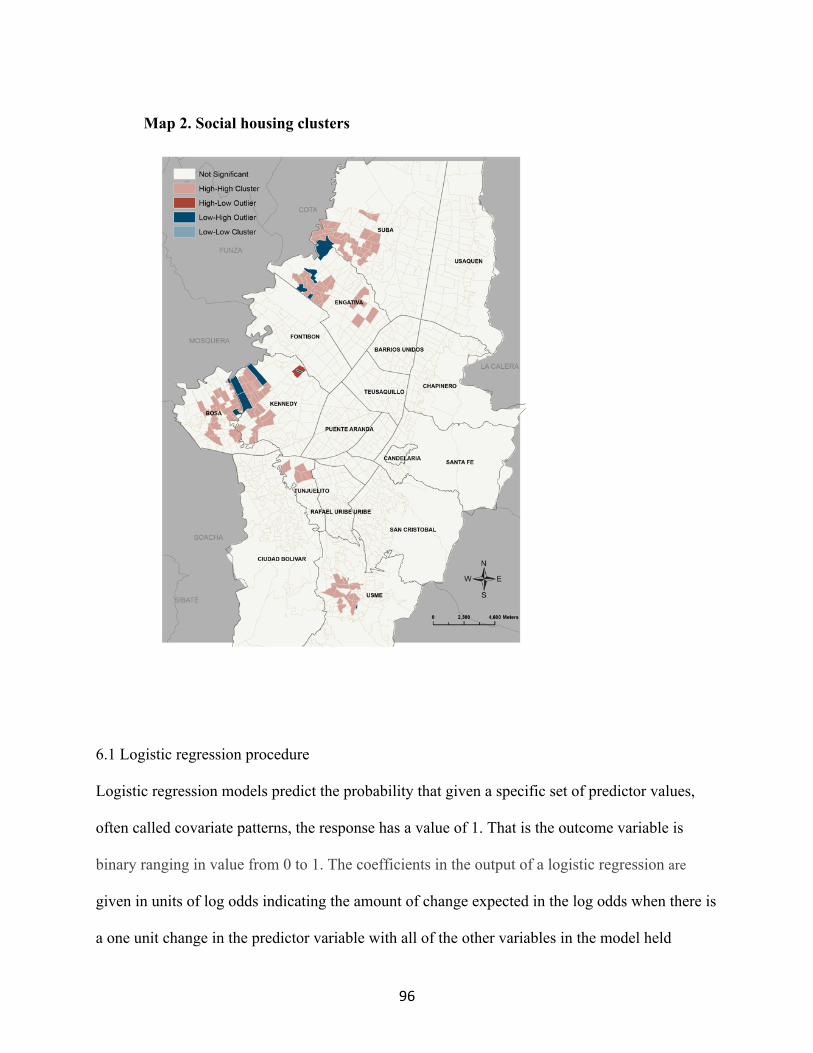
96
Map 2. Social housing clusters
6.1 Logistic regression procedure
Logistic regression models predict the probability that given a specific set of predictor values,
often called covariate patterns, the response has a value of 1. That is the outcome variable is
binary ranging in value from 0 to 1. The coefficients in the output of a logistic regression are
given in units of log odds indicating the amount of change expected in the log odds when there is
a one unit change in the predictor variable with all of the other variables in the model held
97
constant. By taking the exponential of the coefficient it can be transformed into an odds ratio.
(Hosmer and Lemeshow 2000)
𝐿𝑛𝑝
1 − 𝑝= 𝛽) + 𝛽+𝑋++𝛽-𝑋-. . . +𝛽/𝑋/
In this logistic model the effect of risk zoning on the construction of social housing in Bogota is
measured with a binary variable which represents the odds a permit issued between 2008-2016 is
for social housing or market-rate housing. The independent variables correspond to a set of
environmental variables associated with the risk of floods and landslides, such as location in a
flood plain, elevation, and the distance to water and protected forest reserves. I also include a set
of variables which represent market factors such as land values, the size of the project and its
proximity to Bogota’s central business district. That is, the objective here is to measure, in the
cases where housing was permitted by the city, the effect of a set of environmental and market
predictor variables, and how this effect changes when accounting for risk zoning.
𝐿𝑜𝑔𝑖𝑡𝑃𝑟𝑜𝑏𝑎𝑏𝑖𝑙𝑖𝑡𝑦𝑜𝑓𝑆𝑜𝑐𝑖𝑎𝑙𝐻𝑜𝑢𝑠𝑖𝑛𝑔
𝑃𝑟𝑜𝑏𝑎𝑏𝑖𝑙𝑖𝑡𝑦𝑜𝑓𝑀𝑎𝑟𝑘𝑒𝑡𝑅𝑎𝑡𝑒𝐻𝑜𝑢𝑠𝑖𝑛𝑔
= 𝛽) + 𝛽+𝐸𝑛𝑣𝑖𝑟𝑜𝑛𝑚𝑒𝑛𝑡𝑎𝑙𝑓𝑒𝑎𝑡𝑢𝑟𝑒𝑠+𝛽-𝑀𝑎𝑟𝑘𝑒𝑡𝑓𝑎𝑐𝑡𝑜𝑟𝑠
To measure the effect of risk zoning I created a set of binary variables to control for the two
major types of risk zoning: flooding and landslides. Since the risk zones are coded
low/medium/high I recoded them by merging medium and high to represent risk zones and
merging the low and zero to represent areas outside of the risk zones. I made these changes on
the basis of Bogota’s risk management policy which requires more stringent mitigation measures
for buildings constructed in medium and high risk zones compared to those in low risk zones.
98
Conceptually, in this model, this difference means construction in high and medium risk zones is
significantly more expensive than building in low risk zones.
Logistic regression makes several assumptions which include the following: given the
sample size the presence of small cells; the independent variables are not linear combinations of
each other and the observations are independent, that is, no multicollinearity is detected; the
absence of outliers, and model specification. (Hosmer and Lemeshow 2000)
To test these assumptions, I did pre- and post-estimation diagnostics.21 I set the
significance level at 0.05. Before running the regression, I created a pairwise correlation (also
called Pearson’s) matrix to assess the direction and strength of relationships among the
continuous predictor variables. The matrix showed all variables to be statistically significant at
the p > 0.05 level, except for the variable measuring building permit distance from protected
forest reserves. After the pairwise correlation, I used Stata’s collin program to measure the
variance inflation factor (VIF), an indicator of how much of the inflation of the standard error
could be caused by multicollinearity, among the independent variables. No multicollinearity was
detected. Because the observations are not independent I clustered standard errors by cadastral
neighborhoods using the VCE cluster option with the logit command in Stata.
6.1. Logistic Regression Results
The first model evaluates the relationship between the environmental and market variables, and
the construction of social housing in Bogota, without taking risk zones into account. The logistic
results, found in Table 11., show during this period, while housing constructed in flood plains
21 See Appendix A for the results of all diagnostic tests.
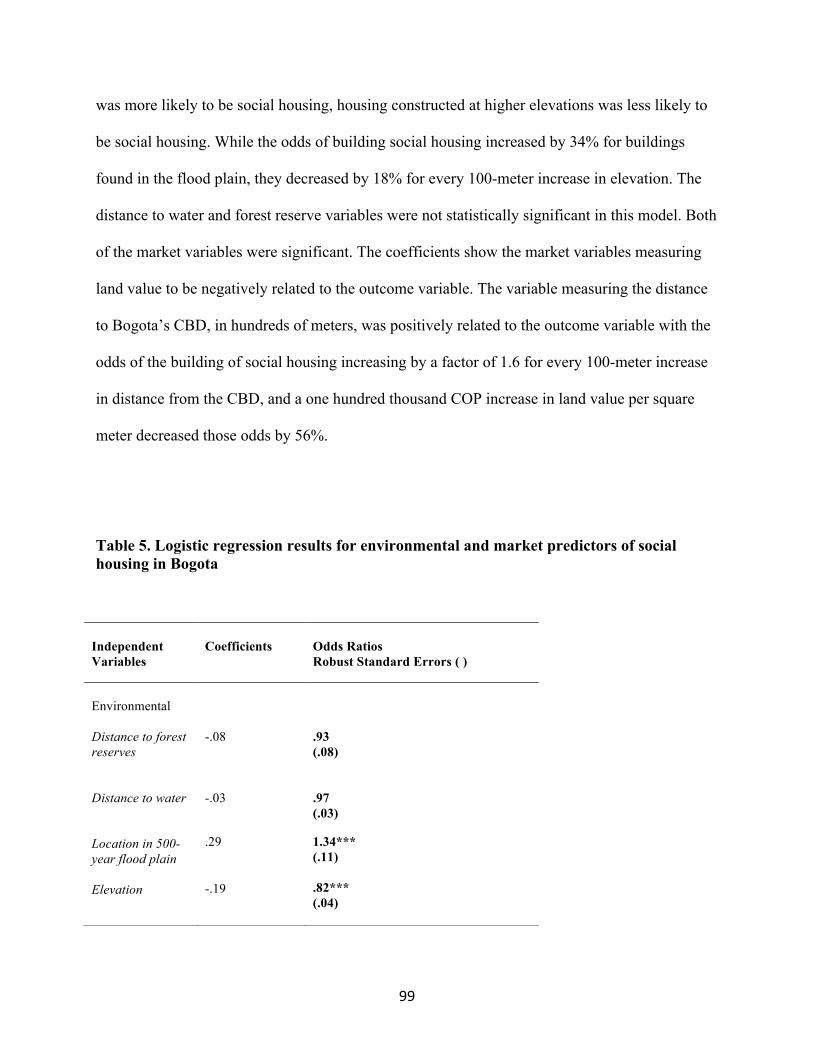
99
was more likely to be social housing, housing constructed at higher elevations was less likely to
be social housing. While the odds of building social housing increased by 34% for buildings
found in the flood plain, they decreased by 18% for every 100-meter increase in elevation. The
distance to water and forest reserve variables were not statistically significant in this model. Both
of the market variables were significant. The coefficients show the market variables measuring
land value to be negatively related to the outcome variable. The variable measuring the distance
to Bogota’s CBD, in hundreds of meters, was positively related to the outcome variable with the
odds of the building of social housing increasing by a factor of 1.6 for every 100-meter increase
in distance from the CBD, and a one hundred thousand COP increase in land value per square
meter decreased those odds by 56%.
Table 5. Logistic regression results for environmental and market predictors of social housing in Bogota
Independent Variables
Coefficients
Odds Ratios Robust Standard Errors ( )
Environmental Distance to forest reserves Distance to water Location in 500-year flood plain Elevation
-.08 -.03
.29 -.19
.93 (.08) .97 (.03)
1.34*** (.11) .82*** (.04)
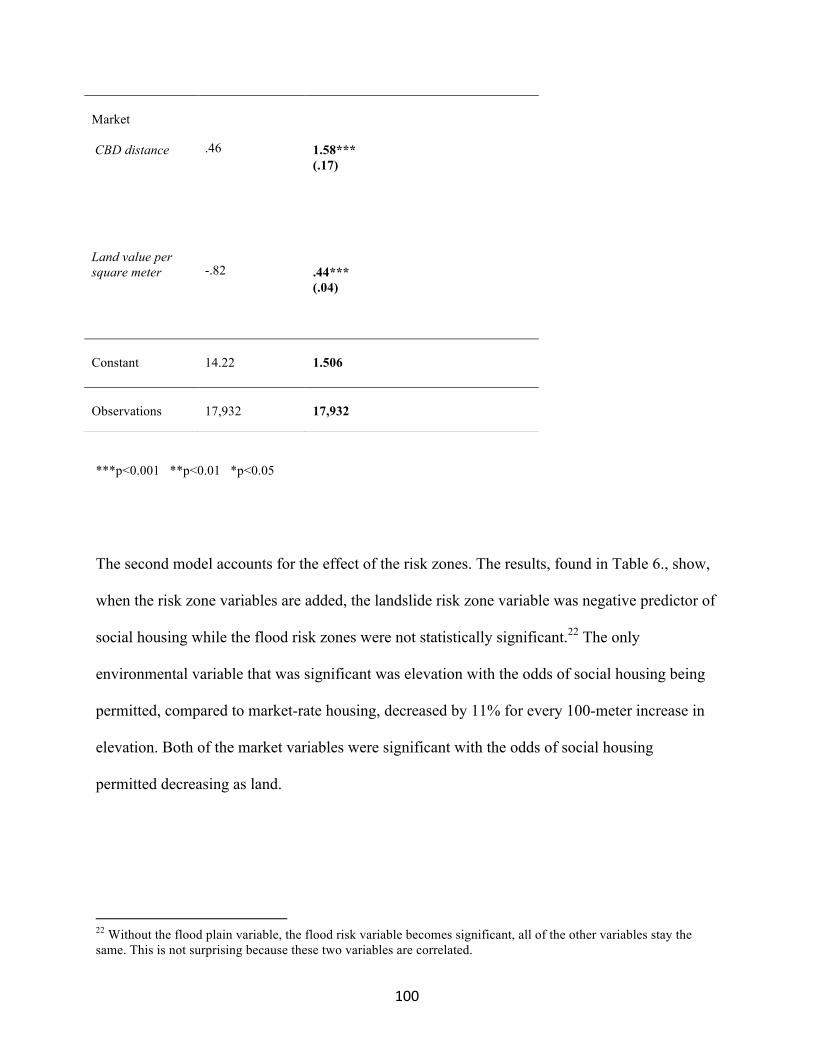
100
***p<0.001 **p<0.01 *p<0.05
The second model accounts for the effect of the risk zones. The results, found in Table 6., show,
when the risk zone variables are added, the landslide risk zone variable was negative predictor of
social housing while the flood risk zones were not statistically significant.22 The only
environmental variable that was significant was elevation with the odds of social housing being
permitted, compared to market-rate housing, decreased by 11% for every 100-meter increase in
elevation. Both of the market variables were significant with the odds of social housing
permitted decreasing as land.
22 Without the flood plain variable, the flood risk variable becomes significant, all of the other variables stay the same. This is not surprising because these two variables are correlated.
Market CBD distance Land value per square meter
.46 -.82
1.58*** (.17) .44*** (.04)
Constant
14.22
1.506
Observations
17,932
17,932
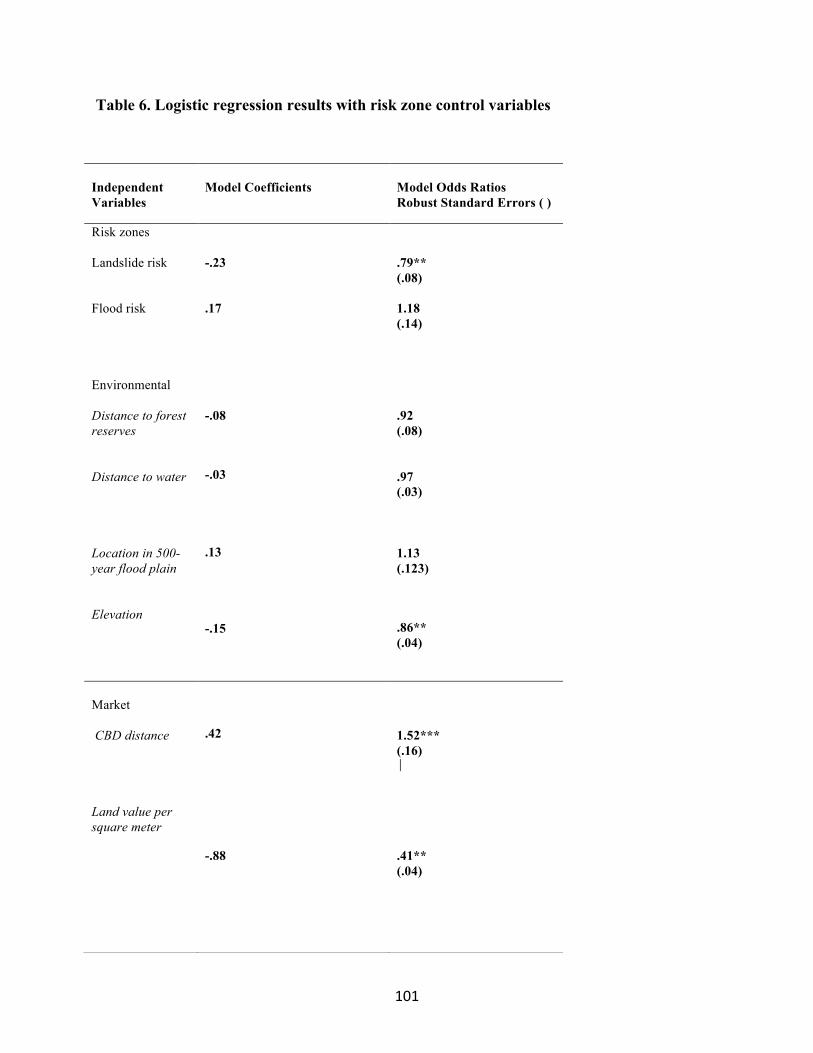
101
Table 6. Logistic regression results with risk zone control variables
Independent Variables
Model Coefficients
Model Odds Ratios Robust Standard Errors ( )
Risk zones Landslide risk Flood risk Environmental Distance to forest reserves Distance to water Location in 500-year flood plain Elevation
-.23 .17 -.08
-.03 .13 -.15
.79** (.08) 1.18 (.14) .92 (.08) .97 (.03) 1.13 (.123)
.86** (.04)
Market CBD distance Land value per square meter
.42 -.88
1.52*** (.16) | .41** (.04)
102
***p<0.001 **p<0.01 *p<0.05
Given these results several spatial patterns emerge in the statistical relationship between this set
of variables, and the building of social housing in Bogota. Without accounting for risk zones, the
effect of the market variables provides statistical confirmation of the spatial patterns described in
the literature on the production of social housing in Bogota. (Parias Duran 2008, Jaramillo 2008)
The inverse relationship between land values and the odds of building social housing is
consistent with the positive relationship between social housing and an increasing distance from
the CBD since the highest land values in Bogota are found near the CBD. Moreover, when
accounting for the growth of the city during this period this effect can be understood to reflect
land values pushing social housing away from the city center into the periphery.
The effect of the environmental variables on social housing is also consistent with market
dynamics in Bogota. Building at higher elevations, given the city’s topography, implies higher
gradients and higher construction costs. Therefore, building at higher elevations decreases the
odds of social housing. On the other hand, the flood plain has the opposite effect as the odds of
social housing construction increases in these areas.
With the introduction of the risk zoning control variables the statistical relationship
between the market and environmental variables and the building of social housing generally
stays the same with the exception of the flood plain variable losing significance as a positive
predictor of social housing. Controlling for all these variables, social housing is less likely to be
Constant
18.64
1.24
Observations
17,932
17,932

103
built in a landslide risk zone than private housing, and there is no statistically significant
difference in the odds of being built in a flood risk zone. However, if the flood plain variable is
dropped, the flood risk variable becomes significant, while all of the other variables stay the
same. (See Appendix A)
7. Analysis
Maps and descriptive statistics showed a higher concentration of social housing than market rate
housing in risk zones. The spatial autocorrelation tests confirmed that new social housing
constructed in this period was both more clustered than market-rate housing, and clustered in the
risk zones of the urban periphery. The first logistic model’s results confirm the powerful effect of
market factors such as increasing land values. The only major environmental barrier to this
pattern of development was increased elevation which is most likely related to the cost of
building at increasingly higher gradients imposes on new construction. While it appears that, as a
result of lower land values, the largest clusters of social housing in Bogota are found in the flood
plains of the city’s western and southern periphery. Especially large clusters are found in the
localities of Bosa, Kennedy and further north in Suba.
The logistic model which controlled for the city’s landslide and flood risk zoning
reaffirm the first model’s results. With a full set of controls, market variables still significantly
shape the location of social housing relative to private housing. On the other hand, landslide risk
is negatively correlated with social housing location; flood risk does have a positive correlation
(which achieves significance if the flood plain variable is omitted), but that increment is small.
In short, market imperatives, and not a policy double standard, drive the concentration of social
housing in risk zones.
104
The model is clearly limited by the available data. A stronger comparison evaluating the
effect of risk zoning could have been made with permits issued before the zoning was adopted in
Bogota’s 2004 POT. Moreover, it is possible the metrics used to measure risk can be more
precise. The two variables measuring distance to sources of risk, which I constructed on the basis
of existing land-use regulations, in particular might be better calibrated with closer look at the
relationship between risk, environmental features like streams and forest reserves, and new
construction.
Despite these limitations, the maps, the descriptives, and the models do provide evidence
of the market pressure on building new social housing in Bogota. Given land values and the costs
of building in proximity to the CBD new social housing is increasingly built in the periphery in
risk zones. Specifically, a significant amount of new social housing has been built in medium
risk areas, especially in areas at risk of flooding.
8. Conclusion
Given these results and analysis, at best we can conclude it is not clear Bogota has been effective
at enforcing risk zoning in the city’s risk areas. Certainly, the spatial distribution of new
construction between 2008-2016 provides evidence of new construction, and especially social
housing, is built and clustered in peripheral areas of the city with medium to high levels of risk
exposure to flooding. The disproportionate presence of social housing in these areas is especially
concerning since the city’s underinvestment in this type of housing is expressed in both its
limited supply and deficient quality. The deficiency in quality of social housing is itself a
reflection of the cost saving measures adopted by developers as they contend with increasing
land values in Bogota.
105
That is, the residents of social housing projects in these risk zones are more exposed to
risk given the low quality of social housing. Some of the more high-profile examples of the
consequences of this underinvestment in social housing include the Colores de Bolonia projects
in San Cristobal, which had to be temporarily evacuated because of the risk of landslides, and the
Campo Verde projects in Bosa, where residents face the threat of large-scale flooding when the
Bogota river breaches its levees. What is more, to the extent developers invest in risk mitigation
features, the cost is passed on to the residents. For example, the residents of the Ventanias de
Usminia in Usme were initially promised single-family homes, following their resettlement from
high risk zones. When the developer took full account of the cost of mitigation features required
by the city for this project built on a medium-level risk site, the project design changed from
single-family homes to small apartments.
Enforcement of risk zoning then reflects the political priorities of any given city
administration. As has been discussed in previous chapters, the Petro administration’s focus on
climate change adaptation and the reduction of social-spatial segregation was articulated in its
attempt to more strictly enforce risk zoning via the city’s development plan and POT. The
administration also created new financial instruments such as the SDVE to promote the building
of social housing closer to the city center. However, the administration had to contend with
strong political resistance from the local political and business elite which is invested in less
restrictive development. Ultimately, this evaluation of risk zoning in Bogota illustrates the
market was the most consistent force in explaining the spatial pattern of new development
between 2008-2016. Even, the Petro administration’s SDVE projects, which aimed to counter
this spatial pattern, conformed with the general spatial patterns set by the market with the
majority of them found in peripheral risk zones.
106
Chapter 4. Household responses to Bogota Humana’s resettlements Examining household responses to Bogota Humana’s resettlements provides an understanding of
the challenges the informal housing market poses for the resettlement strategy. In this chapter I
consider how Bogota Humana’s strategy in particular, with its emphasis on preemptive climate
resettlements and the buying of properties was met by residents in the two most heavily
intervened localities in Bogota. This chapter is guided by the following questions: How did
residents respond to the financial and housing strategies of Bogota Humana’s resettlements? Did
they actively resist or participate in the program? What factors associated with the informal
housing market contributed to this decision?
To evaluate household responses, I constructed a logistic regression model designed to
predict the odds of a household’s decision to resist, or not, the resettlement program given a set
of capital assets. The model is based on Moser’s (1998) asset vulnerability framework which
identifies a set of capital assets to explain household responses to external threats. In this study,
the resettlement intervention is conceptualized as the external threat to the household. Moser
conceptualizes a household’s response as its ability to convert the capital they posses into a range
of survival strategies. So that a household’s level of vulnerability or conversely resilience is
understood to be a function of the capital assets they posses. (Moser and Dani, et al. 2008) I
borrowed from this model to create a set of predictor variables which represent the capital assets
possessed by households recommended to the resettlement program in Bogota.
Data for the logistic regression model was collected from a subset of the population
targeted for resettlement. A household survey was required for data not collected by official
census surveys at the neighborhood level. I used the data collected to model the relative
importance of selected variables which condition the choices made by settlements residents
107
responding to Bogota Humana’s resettlements. The survey was conducted in the two main sites
of Bogota Humana’s resettlement intervention in the localities of San Cristobal and Ciudad
Bolivar. The household survey was supplemented with in-depth interviews of the families in the
program and the city agencies responsible for the resettlement process.
Preparation for the survey began in the summer of 2016. At this time, I was able to
establish a relationship with Instituto Distritial de Gestion de Riesgo y Cambios Climaticos
(IDIGER), the city agency responsible for identifying risk zones and for recommending families
to the resettlement program, and Caja de Vivienda Popular (CVP), the city’s social housing
agency responsible for managing the resettlement program. These relationships facilitated
preliminary interviews and site visits, as well as secondary data sources, necessary to construct
the survey instrument. I also established a relationship with the school of architecture and design
at La Pontificia Universidad Javeriana (PUJ) which has a community service program, Vidas
Moviles, based in Ciudad Bolivar. Vidas Moviles assisted me in organizing a survey team and
creating a strategy to field the survey in San Cristobal and Ciudad Bolivar. I fielded a pilot of the
survey in the fall of 2016 and the survey in the winter of 2017. Follow-up interviews were
conducted in the spring of 2017. The timing of my arrival in Bogota was important as it
coincided with the end of Bogota Humana’s four-year period and the beginning of the new
development plan. This meant I had the opportunity to obtain a range of perspectives from
families who were still negotiating their participation in the resettlement program to families
who had already been resettled.
This section is organized in the following manner: first, a review of the capital-asset
framework literature, second, the method for constructing the logistic model, third the data
108
collection methods, fourth, results and analysis from the model and follow-up interviews, and
last, a conclusion on the implications of the findings for the resettlement strategy.
1. A review of the capital assets framework literature Because I was interested in learning of how the informal housing market constrains the
resettlement strategy, from the perspective of the residents, I needed a framework that allows the
conceptualizing of a household as an economic agent within the housing market of Bogota’s
informal settlements. With this in mind I evaluated two models of household behavior which
address both the political and economic dimensions of household responses to development. In
recent years they have gained currency with international development and social policy
scholars. Albert Hirschman’s Exit Voice Loyalty model (1970) and Caroline Moser’s asset
vulnerability model (1998). I argue Moser’s model provides a more useful framework because it
is situated in political economy providing a theory for how households can convert existing
forms of capital assets into strategies of resistance to development projects.
Hirschman’s model is based in neoclassical economic theory. The model is predicated on
the quality elasticity of demand for certain goods, services or commodities. As such it assumes
individuals are rational economic actors operating in a market context. For example, if a
consumer is faced with declining quality of a service they may choose to ‘exit’ their relationship
with the service provider in exchange for another. However, if the cost of exiting the relationship
is too high a consumer may also choose to ‘voice’ discontent aiming for an improvement in the
quality of the service. Last, if a consumer does not respond to a decline in quality, presumably
because the change in quality does not adversely affect them or because they cannot see how
voicing discontent will improve quality they may choose ‘loyalty,’ that is to continue in the
relationship.
109
Over the years this model has been applied to various social contexts including attempts
to explain migration dynamics and responses to municipal service provision.23 This model,
however, is limited by the assumptions it makes about individual behavior and the market. In this
framework individuals are relatively static, self-contained units and markets are largely
depoliticized. It does not fully account for structural imbalances in political power between
consumers and producers. While it considers political action as one form ‘voice’ might take, it
provides no theory for how individuals might compensate for the asymmetry in power through
the mobilizing of social resources such as networks and cultural practices. All this leaves is the
possibility of ‘exit.’ So that the model leaves out an entire social space in which less powerful
actors who cannot afford to ‘exit’ but may not be able effectively articulate ‘voice’ might resort
to a range of less visible strategies and actions which subvert the rules of the market. That is, this
model cannot explain the social and economic practices associated with the creation of informal
markets.
Alternatively, Moser’s asset vulnerability model considers the relationship between
vulnerability and asset ownership. It involves identifying not only risks or threats but also
resilience in resisting or recovering from the negative effects of a changing environment. The
means of resistance are the assets and entitlements that individuals, households, and communities
mobilize in facing hardship. Vulnerability is therefore closely linked to asset ownership. The
more assets people have, the less vulnerable they are, and the greater the erosion of people’s
assets, the greater their vulnerability and associated insecurity (Moser 1998: 3). Here a
23 Hoffman (2010) attempts to reconceptualize Hisrchman’s model in the context of migration from Latin America and Acey (2009) applies model to the provision of water in Lagos, Nigeria.
110
household’s capacity to sustain and recover from the impact of external shocks is a function of
their capital assets. (Moser and Dani, et al. 2008)
This model was created to explain asset-based behavior in the development context
where unequal power relations is an important determinant of who benefits from economic
growth. According to Moser (2008) the extent to which people participate in, and benefit from,
development processes invariably depends not only on their initial asset endowment but also on
the extent to which they are able to exercise agency within their available opportunity structure.
Moser’s model is one in the broader asset-based behavior approach to the study of household
behavior with respect to economic development. In particular, the model is influenced by Sen’s
study of poverty and household entitlements. According to Sen (1989) entitlements are the total
set of rights and opportunities with which a household can command, or to which it is entitled, to
obtain different bundles of commodities. In this framework vulnerability is the risk a household’s
bundle of commodities and assets, will not protect it against hunger, dislocation or other losses.
Thus, analysis which begins by considering potential causes of crisis at the household level
accounts for a range of causal factors in the production of risk. The model also builds on
Bebbington (1999) and Blaikie et al.’s (1994) shifting of the focus of entitlement analysis from
the household to livelihood strategies. Here, the degree of vulnerability is tied to a person, family
or social group’s ability to command a certain level of income or bundles of resources that can
be exchanged to meet their needs. These resources for example may involve information,
cultural knowledge, social networks, legal rights, tools and land.
This asset-based behavior approach then defines assets as “the resource endowments and
capabilities that people have to sustain their livelihoods and to enhance their welfare.” (Moser
and Dani et al. 2008) Thus, as Bebbington (1999) maintains, assets are not simply resources that
111
people use to build livelihoods: they give them the capability to act. As such, assets are identified
as the basis of an agent’s power to take actions which reproduce, challenge, or change the rules
that govern the control, use, and transformation of resources (Sen 1997). Assets thus create
agency. The main capital assets identified by these scholars include human, social, physical,
natural, and financial capital. (Bebbington 1999, Moser 1998, Sen 1997) Moser and Dani et al.
(2008) define the main capital assets in the following manner:
A. Physical capital comprises of the stock of plant, equipment, infrastructure, and other
productive resources owned by individuals, the business sector, or the country itself.
B. Financial capital consists of the financial resources available to people, such as savings
and supplies of credit.
C. Human capital includes investments in education, health, and the nutrition of individuals.
Labor is a critical asset linked to investments in human capital, health status determines
people’s capacity to work, and skill and education determine the returns from their labor.
D. Social capital is an intangible asset defined as the rules, norms, obligations, reciprocity,
and trust embedded in social relations, social structures, and societies’ institutional
arrangements, which enable its members to achieve their individual and community
objectives. Social capital is embedded in social institutions at the micro-institutional
level—communities and households—as well as referring to the rules and regulations
governing formalized institutions in the marketplace, the political system, and civil
society.
E. Natural capital includes the stocks of environmentally provided assets such as soil,
atmosphere, forests, minerals, water, and wetlands. In rural communities, land is a critical
112
productive asset for the poor; in urban areas, land for shelter is also a critical productive
asset.
According to Moser and Dani et al. the actual strategies by which people accumulate these assets
are conditioned by the institutions (laws, norms, and regulatory frameworks) and opportunities
arising from the political and economic context.
The asset-based model has also been applied in the emerging climate change adaptation
literature to measure the adaptive capacities of households and communities within the
development context. (Hardoy and Pandiella 2009, Lampis 2012, Romero- Lankao et al. 2014,
Quin et al. 2015) How these scholars define vulnerability sets the basis for building a conceptual
framework to explain the adaptive strategies deployed by both settlement residents and the state.
The two major approaches which have dominated the study of urban vulnerability to natural
hazards either rely on a risk-hazard framework or a social constructivist framework. On one
hand, the risk-hazard approach, mainly associated with engineering, is concerned with predicting
the impact of a climate event and estimating the increment of damage caused by intensification
from normal climatic conditions. This approach locates risk in the natural hazard and situates
people in a static social landscape. On the other, the social constructivist approach, based in
political ecology, views climate events and trends as external phenomena but emphasizes the risk
of disaster and suffering is social. Risk is located within society and tied to the political economy
of resource use. Pelling (2011) for example argues the relationship between vulnerability and
adaptive capacity varies according to size and type of hazard risk and the position of the social
unit under analysis within wider socio-ecological systems. Risk is defined by a lack of social
protection arrangements including the right to certain entitlements and livelihoods. (Adger 2006,
Ribot in Mearns and Norton, ed. 2010)
113
For example, Romero-Lankao et al. (2014) study of urban risk and adaptive capacity in
Bogota, Buenos Aires, Mexico City and Santiago applies a multi-scalar framework to climate
change vulnerability. This approach allowed them to determine causal pathways for the
production of vulnerability, but also for the realization of adaptive capacity by households and
communities. They found informality both in terms of land tenure and employment denied low-
income communities the benefits of state investment in physical infrastructure and social
protections, which might buffer them against natural hazards. Socio-economic status also led to
divergent outcomes as higher income households are more likely to rely on individual means to
access state-supplied hazard information while households with lower incomes more often relied
on neighborhood networks and personal knowledge to respond to hazards.
2. Modeling household responses to Bogota Humana’s Resettlements
To model household responses to Bogota Humana’s resettlement intervention I borrowed from
the capital asset framework formulated by Moser and Dani et al. (2008) to create my own set of
variables with some modifications. I modified their definition of capital assets on the basis of a
review of the literature on disaster risk reduction resettlements and informal housing markets in
Bogota. I was also able to draw on my observations from house visits I made able with
IDIGER’s social and technical teams in the summer of 2016. These visits provided a window
into the negotiation that takes place between the city agencies and the households in the
resettlement program. In addition to these visits, with support from Vidas Moviles, I also made
follow-up house visits to conduct preliminary interviews independently from the city agencies.
Free from the presence of city agencies, households were less apprehensive and willing to share
more about their experience in the resettlement process. In particular, households were more
114
open to discussing the strategies they used to resist and negotiate the terms of the resettlements.
This allowed me to construct the outcome variable, resistance to the resettlements, for the model.
So that primarily on the basis of these interviews, and to a lesser degree the city’s reports on the
resettlement program (see Olimpo Rojas Rodriguez, Informe de Gestion: Direccion de Reasentamientos
Humanos, Enero de 2016, Caja de Vivienda Popular) I defined resistance to resettlements as:
1. Arguing with neighbors, friends and family they should not participate in the resettlement
program.
2. Participating in organized meetings with others to discuss actions against the resettlement
program. These for example could be meetings organized by a neighborhood committee
or a Junta de Accion Comunal (a neighborhood council).
3. Communicating disapproval of the resettlement program to city officials through formal
institutional channels such as filing Derechos de Peticion or Tutelas (formal requests to
the city for disclosure of information).
4. Taking legal action against the city for matters related to the resettlement.
Last, I added a variable measuring perception of natural hazard because I was interested in
learning what effect this might have on a household’s disposition towards resettlements. For this
variable I borrowed from a subset of the literature on the adaptive capacity of households to
climate change in Latin America which is concerned with the perception of natural hazards.
(Hardoy and Pandiella 2009, Lampis 2012, Romero- Lankao et al. 2014, Quin et al. 2015)
I define perception of natural hazards:
1. Awareness of landslide and flood events which have affected them directly or others in
the neighborhood.
115
3. Data collection
Establishing a relationship with IDIGER and Vidas Moviles facilitated access to the data I
needed to generate a sample for the household survey. I began with an interview of the director
of the resettlement team at IDIGER. The director authorized me to join IDIGER’s social teams
responsible for negotiating the terms of resettlement with households. I joined two social teams
on their household visits. By participating in visits with these teams I learned of their negotiating
strategies and the spatial distribution of their work in Ciudad Bolivar and San Cristobal. With
these observations I had the data I need to partner with Vidas Moviles to develop a field strategy
for the survey. Generally, the survey field strategy was to begin at the highest point of the
quebrada we could safely reach and work our way down until we had reached the limit of the
area covered by the concepto tecnico. The safety concerns primarily had to do with social
insecurity due to the crime and violence present in these communities. For example, in Ciudad
Bolivar a police patrol prevented us from walking any further up Quebrada Limas warning us it
was too dangerous for the survey team to continue along that path. The police patrol offered to
escort us at a later time. However, I decided to turn down the offer because the presence of the
police would undermine any confidence we could build with households. In fact, this concern
was present throughout this project. It required the team to take precautions such as being
strategic about the hours of the day we chose to conduct the survey, and being careful to limit the
exposure of our smartphones when taking pictures.
IDIGER also surveys households and collects social, economic and physical data but
their focus is on addressing the level of vulnerability to natural hazards primarily as a function of
structural and biophysical engineering metrics. I attempted to access this survey data but could
not as it is not made publicly available. I was however able to access the conceptos tecnicos
116
issued under Bogota Humana for Ciudad Bolivar and San Cristobal.24 The conceptos tecnicos
summarizes some of the social, economic and physical data collected by IDIGER for these
neighborhoods. Most importantly, it identifies the total population recommended for
resettlement, the spatial boundaries of the intervention and the climate-related threats motivating
the resettlements.
In addition to IDIGER’s surveys other important sources of micro-data for households
include the Encuesta Multi-Proposito and the Encuesta Nacional de Calidad de Vida.25 Encuesta
Multi-Proposito is a household survey conducted by Colombia’s Departamento Administrativo
Nacional de Estadística (DANE) and Bogota’s Secretary of Planning. The Encuesta Multi-
Proposito collects household data including education and income levels, social networks and
participation in community organizations, access to technology and transportation. Until this
years’ Encuesta Multi-Proposito, which collected data for UPZs, the previous two surveys
(2014, 2011) of this type were conducted at the locality and municipal levels (the municipalities
surrounding Bogota). The Encuesta Nacional de Calidad de Vida is a national survey also
conducted by DANE. This survey has been collecting household data on an annual basis since
2007 on the physical quality of living conditions including construction materials, the number of
rooms and floors for homes in addition to social-economic characteristics. The survey collects
data at the municipal and regional level. Both surveys provide useful references for comparative
purposes (between the targeted neighborhoods and localities) for the construction of the variables
I used in my survey. The national census is also an important reference however data from the
latest census (2017) is not available yet. The last national census was conducted in 2005.
24 Concepto Tecnico 7528, Concepto Tecnico 7663, Diagnostico Tecnico 7027, Diagnostico Tecnico 8441. 25 Reference with links for DANE’s micro-data on Colombian households: https://sitios.dane.gov.co/visor-anda/
117
4.1 Survey team
With support from La Javeriana University (PUJ)’s community service program, Vidas Moviles,
I organized and trained a team of researchers. This team assisted me in fielding the household
survey. Initially I hoped to recruit a group of students for the survey team. But due to security
concerns PUJ would not allow this. Instead I relied on community members of Vidas Moviles in
Ciudad Bolivar to organize the team. These members live in Ciudad Bolivar and were
tremendously helpful in helping me navigate Ciudad Bolivar and San Cristobal’s neighborhoods.
They also helped me translate the survey into the language more commonly used among
neighborhood residents. This facilitated communication and engendered a certain level of trust
and confidence with survey participants. Importantly, the team legitimized my presence in the
neighborhood without me having to rely on city agencies.
4.2 Sample selection Generating a sample of households participating in Bogota Humana’s resettlements required
identifying active interventions by IDIGER and CVP. This was not as straightforward as it
sounds. Since I began my fieldwork in 2016, I arrived in Bogota during a period of transition, at
the end of the Petro Administration and the beginning of Penalosa Administration. Turnover in
staff and personnel complicated attempts at acquiring data from IDIGER. It also meant that
IDIGER’s resettlement activities consisted of completing Bogota Humana projects while
preparing for the new four-year development plan.
I requested data on the universe of resettlements recommended by Bogota Humana. With
this data I was able to confirm the localities and bodies of water with the largest concentrations
of recommended resettlements – Quebrada Limas in Ciudad Bolivar and La Chiguaza in San
118
Cristobal. IDIGER also provided me with the conceptos tecnicos issued during Bogota Humana
for these bodies of water. The conceptos tecnicos provides the technical assessment of the risk
associated with these bodies of water and specifies which properties fall within the boundary of
the risk polygon submitted to the planning department for zoning changes. Of these properties
the concepto tecnico also marks those which must be evacuated permanently. The families who
own these properties are recommended for resettlement. Families who rent in these properties are
not eligible for the resettlement program.
Since the total number of resettlements recommended for these bodies of water are large
and the agencies operate within the constraints of municipal budgets a smaller subset of the
resettlements are prioritized for active resettlement within the four-year period of the
development plan. And of this smaller subset IDIGER’s social teams set weekly targets for
house visits depending on the personnel available. I was able to identify the neighborhoods with
active collective resettlements through follow-up interviews with IDIGER’s social teams,
meetings with the gestora local for IDIGER in Ciudad Bolivar, and site visits to Ciudad Bolivar
and San Cristobal with members from Vidas Moviles.26
In the fall of 2016 I conducted a small pilot survey to test the household survey and my
sampling strategy. The geography I chose to sample was delimited by the boundaries for the
resettlement intervention set by conceptos tecnicos issued during Bogota Humana in Ciudad
Bolivar and San Cristobal. Per Bogota Humana’s strategy of reorganizing development around
bodies of water these conceptos tecnicos correspond to bodies of water in the localities. Table 1.
identifies these conceptos tecnicos and corresponding bodies of water along with the
26 The gestor local is the IDIGER agent responsible for organizing local risk management teams consisting of first first responders and representatives from the local city halls in each ofBogota’s localities. Vidas Moviles is a community center in Ciudad Bolivar operated by La Javeriana University.
119
recommended and prioritized resettlements. In San Cristobal I visited two bodies of water though
only one had, Quebrada Chiguaza, had a concepto tecnico issued while the second, Rio Fucha,
had a diagnostic tecnico. The diagnostic tecnico can be understood as a precursor to the concepto
tecnico. The diagnostic tecnico is issued in response to emergencies and before IDIGER can
study the physical terrain to recommend zoning changes, namely the risk zoning for the area,
found in the concepto tecnnico. IDIGER was in the process of conducting land surveys around
the Rio Fucha when I visited this part of San Cristobal in 2016-2017. The goal for my survey
was to generate a sample of the concepto tecnico not the locality or the neighborhood
necessarily. However, through the pilot survey I found the resettlements while covering sections
of several neighborhoods found along the bodies of water they tended to concentrate in one or
two neighborhoods. In Ciudad Bolivar for example the majority of resettlements for Concepto
Tecnico 7528 were concentrated in the San Francisco neighborhood. And in San Cristobal
Concepto Tecnico 7663’s resettlements were concentrated in two adjoining neighborhoods, La
Gloria and Altamira.
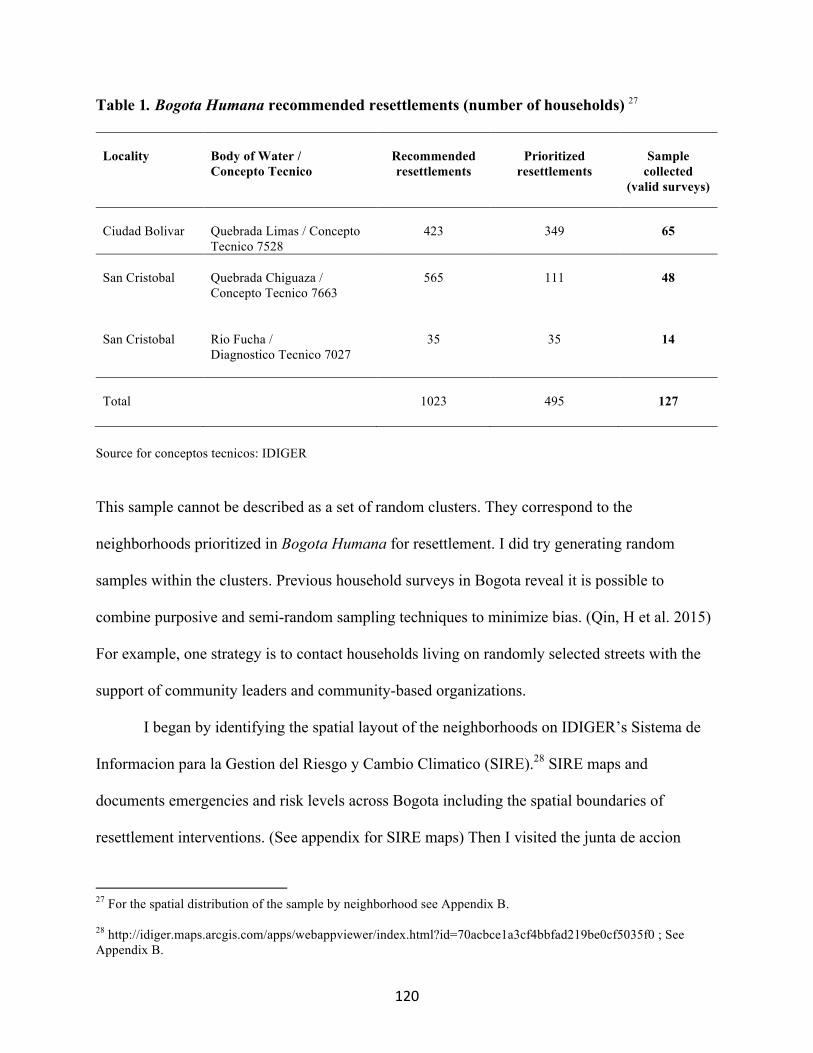
120
Table 1. Bogota Humana recommended resettlements (number of households) 27
Locality
Body of Water / Concepto Tecnico
Recommended resettlements
Prioritized
resettlements
Sample
collected (valid surveys)
Ciudad Bolivar
Quebrada Limas / Concepto Tecnico 7528
423
349
65
San Cristobal
Quebrada Chiguaza / Concepto Tecnico 7663
565
111
48
San Cristobal
Rio Fucha / Diagnostico Tecnico 7027
35
35
14
Total
1023
495
127
Source for conceptos tecnicos: IDIGER
This sample cannot be described as a set of random clusters. They correspond to the
neighborhoods prioritized in Bogota Humana for resettlement. I did try generating random
samples within the clusters. Previous household surveys in Bogota reveal it is possible to
combine purposive and semi-random sampling techniques to minimize bias. (Qin, H et al. 2015)
For example, one strategy is to contact households living on randomly selected streets with the
support of community leaders and community-based organizations.
I began by identifying the spatial layout of the neighborhoods on IDIGER’s Sistema de
Informacion para la Gestion del Riesgo y Cambio Climatico (SIRE).28 SIRE maps and
documents emergencies and risk levels across Bogota including the spatial boundaries of
resettlement interventions. (See appendix for SIRE maps) Then I visited the junta de accion
27 For the spatial distribution of the sample by neighborhood see Appendix B. 28 http://idiger.maps.arcgis.com/apps/webappviewer/index.html?id=70acbce1a3cf4bbfad219be0cf5035f0 ; See Appendix B.
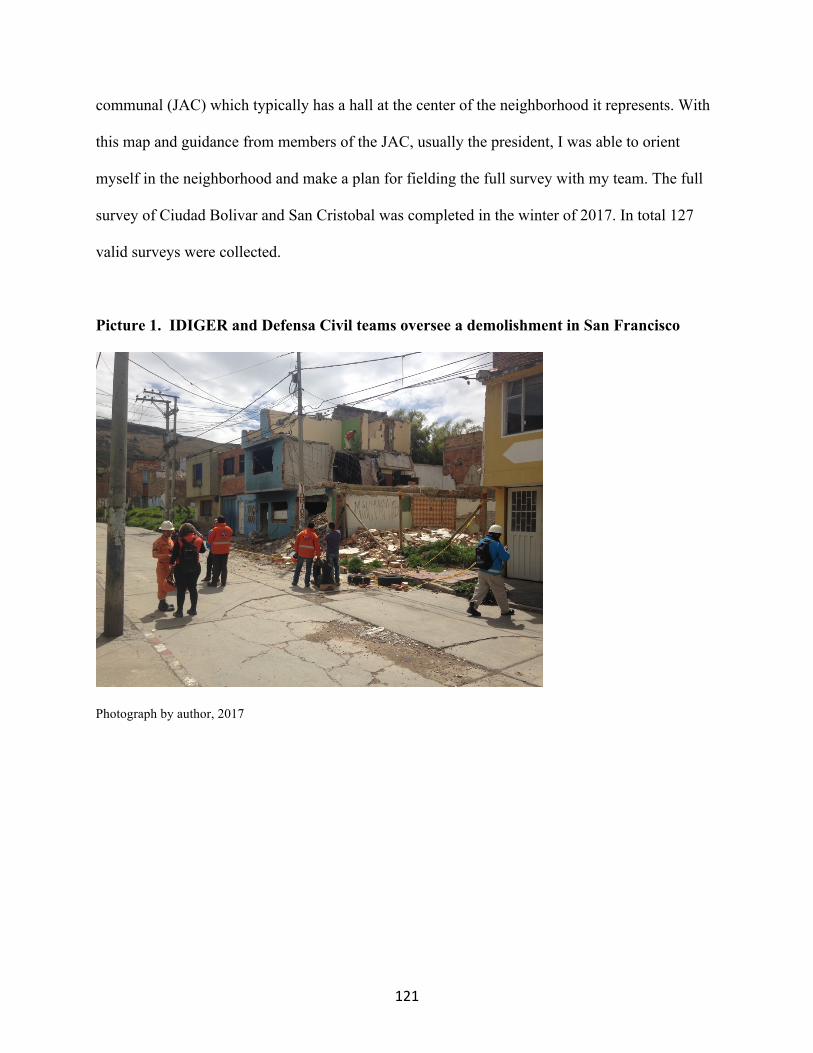
121
communal (JAC) which typically has a hall at the center of the neighborhood it represents. With
this map and guidance from members of the JAC, usually the president, I was able to orient
myself in the neighborhood and make a plan for fielding the full survey with my team. The full
survey of Ciudad Bolivar and San Cristobal was completed in the winter of 2017. In total 127
valid surveys were collected.
Picture 1. IDIGER and Defensa Civil teams oversee a demolishment in San Francisco
Photograph by author, 2017
122
5. Measurement of the variables
5.1 Dependent variable
The resistance variable was constructed on the basis of a composite score. Households were
asked a set of four questions designed to measure their resistance to the resettlement program.
The questions corresponded to the four resistance actions I identified for the model. The binary
responses to these questions were summed to produce a score which could range in value from 0
to 4. A threshold was set at 2 so that households with a score of 2-4 were coded as resisting and
those with a score of 0-1 were coded as not resisting. The resulting variable was a dichotomous
measure with resisting households coded 1 and non-resisting households coded 0.
5.2 Independent variables
The following table (Table 2.) describes how the independent variables based on the asset
vulnerability framework were defined and coded.
Table 2. Capital Asset Variables
Category Variable measures
Human Capital
The level of educational attainment of the household head was measured on a scale ranging from primary school = 1 to university degree or above = 4. 29 Employment status of household members was measured as the total number of adults who work informally or formally in 5 intervals: 1 = 1-2, 2 = 2-5, 3 = 5-10, 4 = 10-15, 5 = 15+.
Household size was measured as the total number of people who live in the house not including other households which might be renting a room also in 5 intervals: 1 = 1-2, 2 = 2-5, 3 = 5-10, 4 = 10-15, 5 = 15+.
29 Four educational levels listed in the survey include the Colombian equivalents of: 1. Primary 2. Secondary 3. Technical Degree 4. University Degree.
123
Physical Capital
The total number of rooms on the property was measured as a continuous variable ranging from 1-5.
The total number of floors on the property was also measured as a continuous variable from 1-5. Access to formal connections for utilities was measured as a binary variable, access = 1, no access = 0. 30
Financial Capital
Use of the property for commercial activity and rent was measured as a binary variable, yes = 1, no = 0.
Ownership of the property was measured as a binary variable, yes = 1, no = 0. Ownership duration of the property was measured in 5 intervals: 1 = 0-5 years, 2 = 5-15 years, 3 = 15-25, 4 = 25-50, 5 = 50+. Access to lines of credit and savings accounts was measured as a binary variable, yes = 1, no = 0.
Social – Cultural Capital
Participation in community groups and other civic organizations was measured as a binary variable, participation = 1 no participation = 0.31 Total number of information sources available to the household was measured on a scale with a possible range: 0-4).32
The household’s perception of risk was measured as a binary variable, if the respondent
indicated awareness of landslide and flood events in the neighborhood the response was coded 1,
if not it was coded 0.
Based on observations from the pilot survey and site visits with city agencies I found
certain variables had to be modified or omitted from statistical analysis. For example, I found an
important feature of the neighborhoods I surveyed was there legal status. With the exception of
neighborhoods along the Fucha River in San Cristobal Alto, the neighborhoods I surveyed had
30 These include connections to water, gas and electricity. 31 Organizations may include the following: social clubs, sports clubs, religious churches and political parties. 32 Sources of information include: access to the internet, television, radio, and newspapers and magazines.
124
all been legalized by the city, often decades ago.33 In these neighborhoods it became clear
questions regarding legal access to public utilities and the legal ownership of properties would
not be a significant factor in a statistical analysis of household resistance to resettlements given
my sample. The omission of these specific variables meant I had to modify the variable
constructs measuring physical and financial capital. I did however keep other variables which
explore related dimensions such as how long a family has owned a property, the number of
rooms in the home, and whether or not the property is used for commercial use in addition to
residential use. These features of a household are important as they are constituent of financial
and physical capital assets.
In the preliminary interviews I conducted, and in the observations I made during house
visits with the city agencies, it also became apparent the reliability of financial data would
become difficult to verify. Namely, questions regarding access to lines of credit and savings were
often met with apprehension. Members of my survey team explained to me these questions might
be received as intrusive and even threatening. With this feedback I decided to drop this variable
from the model and instead construct the financial capital variable with a composite score from
two variables, ownership duration of the property and use of the property for commercial
activity.
6. Results
The household survey data were analyzed in several steps. First, descriptive statistics were used
to identify the general dimensions of the capital assets possessed by households sampled in the
survey. Second, bivariate correlations were used to assess the direction and strength of the
33 The neighborhoods I surveyed next to the Fucha River included Laureles, La Gran Colombia, and San Cristobal Alto.

125
relationships among variables. Third, multivariate analysis using logistic regression was used to
evaluate the relative effect of the different capital assets in a household’s response. All statistical
analysis was conducted with Stata/ IC 15.1 software.
6.1 Descriptive statistics
The descriptive statistics reveal important features of the individual households marked for
resettlement by Bogota Humana. Table 3. presents descriptive statistics for the capital asset
variables of the surveyed households. For ease of interpretation, the table is followed by a set of
charts illustrating the sample distribution of the variables measured in intervals. The Social
Capital variable includes the individual variables used to construct the composite score for the
index.
Table 3. Descriptive Stats of Capital Asset Variables
Variables Observations Mean/
proportion
Std. Deviation Range
Physical Capital
Rooms 127 3.56 1.17 1-5
Social Capital
Community participation
Sources of Information
127
127
127
1.37
.188
1.18
.65
.39
.46
1-5
0-1
0-4
Financial Capital
Duration owned
127
127
3.63
3.41
1.09
.97
1-6
1-5
126
Commercial Use 127 .29 .45 0-1
Human Capital
Household Members Working
127 2.70 1.17 1-5
Education Level 127 1.67 .78 1-4
Physical capital assets
A look at the survey results across both localities, Ciudad Bolivar and San Cristobal, reveals the
homes targeted for these resettlement interventions were often multi-story buildings with several
rooms. These structures had been consolidated over several decades. As noted earlier the pilot
survey found the resettlements in Ciudad Bolivar were concentrated in the San Francisco
neighborhood, and La Gloria and Altamira neighborhoods in San Cristobal. All of these
neighborhoods, and the adjoining neighborhoods included in these conceptos tecnicos, are
neighborhoods which were legalized decades ago (find exact dates; I have this in gis database).
So that at this stage most homes in these neighborhoods enjoyed formal access to utilities, basic
road infrastructure and public transit lines. The exception were the neighborhoods found along
the Fucha River in San Cristobal. Here, neighborhoods such as Laureles and La Gran Colombia
have only recently entered the process of legalization.34 At the time of the survey IDIGER had
not issued a concepto tecnico for these neighborhoods with recommendations for definitive
34 These neighborhoods entered the legalization process in 2015. At the time of the household survey IDIGER was surveying the terrain to make land use and zoning recommendations. The neighborhoods were also undergoing a “desenglobalizacion” were the legally recognized boundaries between individual properties is determined by the city.
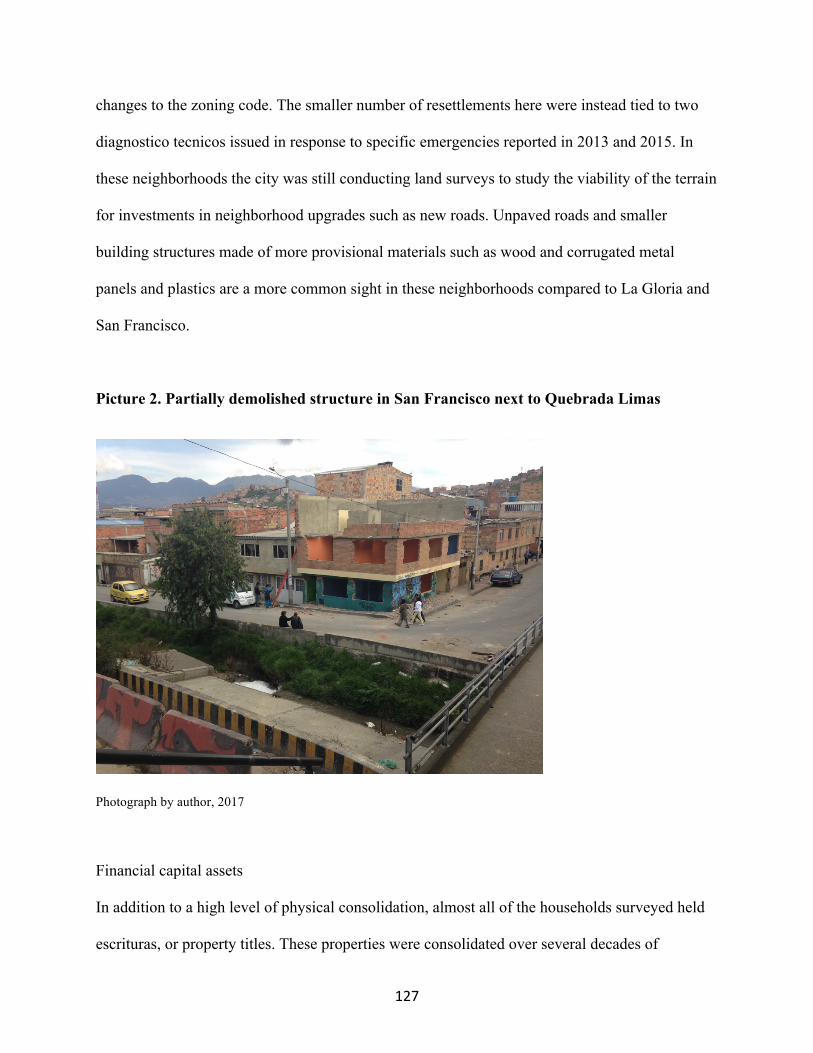
127
changes to the zoning code. The smaller number of resettlements here were instead tied to two
diagnostico tecnicos issued in response to specific emergencies reported in 2013 and 2015. In
these neighborhoods the city was still conducting land surveys to study the viability of the terrain
for investments in neighborhood upgrades such as new roads. Unpaved roads and smaller
building structures made of more provisional materials such as wood and corrugated metal
panels and plastics are a more common sight in these neighborhoods compared to La Gloria and
San Francisco.
Picture 2. Partially demolished structure in San Francisco next to Quebrada Limas
Photograph by author, 2017
Financial capital assets
In addition to a high level of physical consolidation, almost all of the households surveyed held
escrituras, or property titles. These properties were consolidated over several decades of
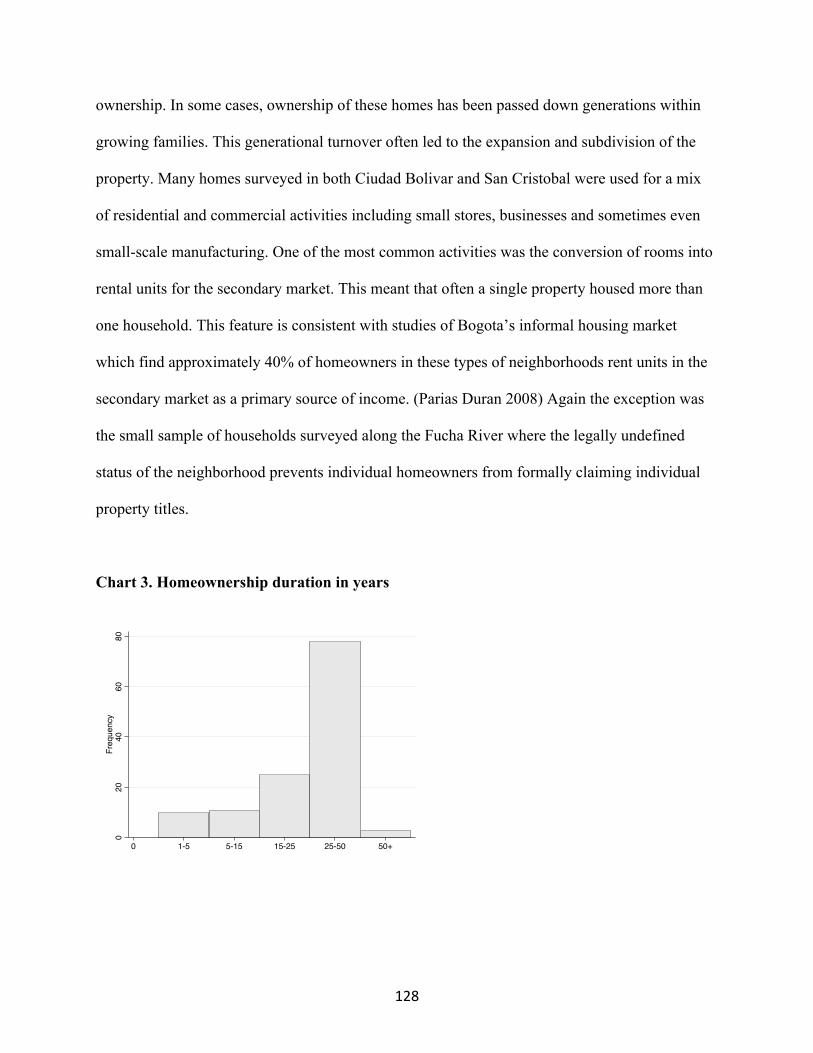
128
ownership. In some cases, ownership of these homes has been passed down generations within
growing families. This generational turnover often led to the expansion and subdivision of the
property. Many homes surveyed in both Ciudad Bolivar and San Cristobal were used for a mix
of residential and commercial activities including small stores, businesses and sometimes even
small-scale manufacturing. One of the most common activities was the conversion of rooms into
rental units for the secondary market. This meant that often a single property housed more than
one household. This feature is consistent with studies of Bogota’s informal housing market
which find approximately 40% of homeowners in these types of neighborhoods rent units in the
secondary market as a primary source of income. (Parias Duran 2008) Again the exception was
the small sample of households surveyed along the Fucha River where the legally undefined
status of the neighborhood prevents individual homeowners from formally claiming individual
property titles.
Chart 3. Homeownership duration in years
020
4060
80Frequency
0 50+25-5015-255-151-5
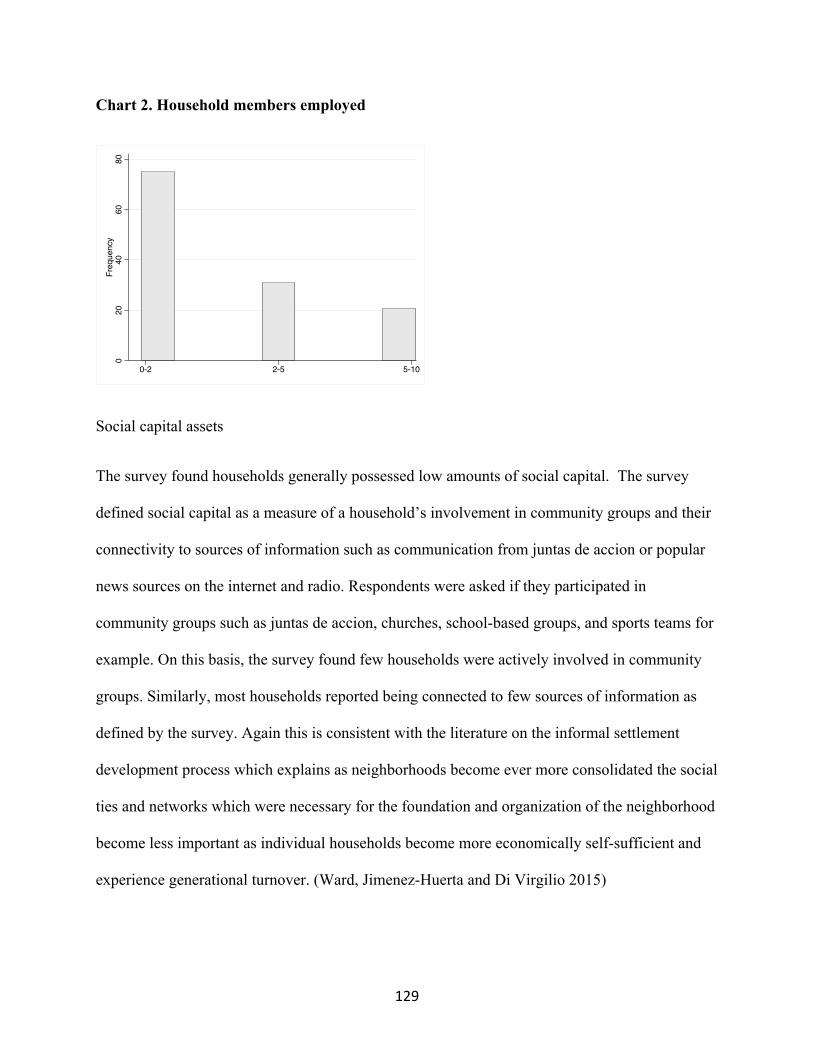
129
Chart 2. Household members employed
Social capital assets
The survey found households generally possessed low amounts of social capital. The survey
defined social capital as a measure of a household’s involvement in community groups and their
connectivity to sources of information such as communication from juntas de accion or popular
news sources on the internet and radio. Respondents were asked if they participated in
community groups such as juntas de accion, churches, school-based groups, and sports teams for
example. On this basis, the survey found few households were actively involved in community
groups. Similarly, most households reported being connected to few sources of information as
defined by the survey. Again this is consistent with the literature on the informal settlement
development process which explains as neighborhoods become ever more consolidated the social
ties and networks which were necessary for the foundation and organization of the neighborhood
become less important as individual households become more economically self-sufficient and
experience generational turnover. (Ward, Jimenez-Huerta and Di Virgilio 2015)
020
4060
80Frequency
0-2 5-102-5
130
Human capital assets
The survey found few household heads had attained education beyond the secondary level, the
equivalent of high school in the U.S. The survey asked for the age of each household member,
their work status, but not their level of education. With respect to employment, determining the
number of individuals employed and the specific types of employment they held was difficult.
Part of the difficulty had to do with the nature of the informal and irregular employment
arrangements often held by individuals in these households. In some cases, it was difficult for
respondents to describe stable and consistent employment relations. Or conversely it was
difficult for surveyors to translate responses into survey codes. As a result, the quality and
reliability of the data collected regarding the number of household members employed and the
types of employment they held was somewhat low. However, one clearly defined feature of work
for these households was that it was often tied to commercial activity in the neighborhood, and
surrounding neighborhoods, and in many cases to the homes themselves.
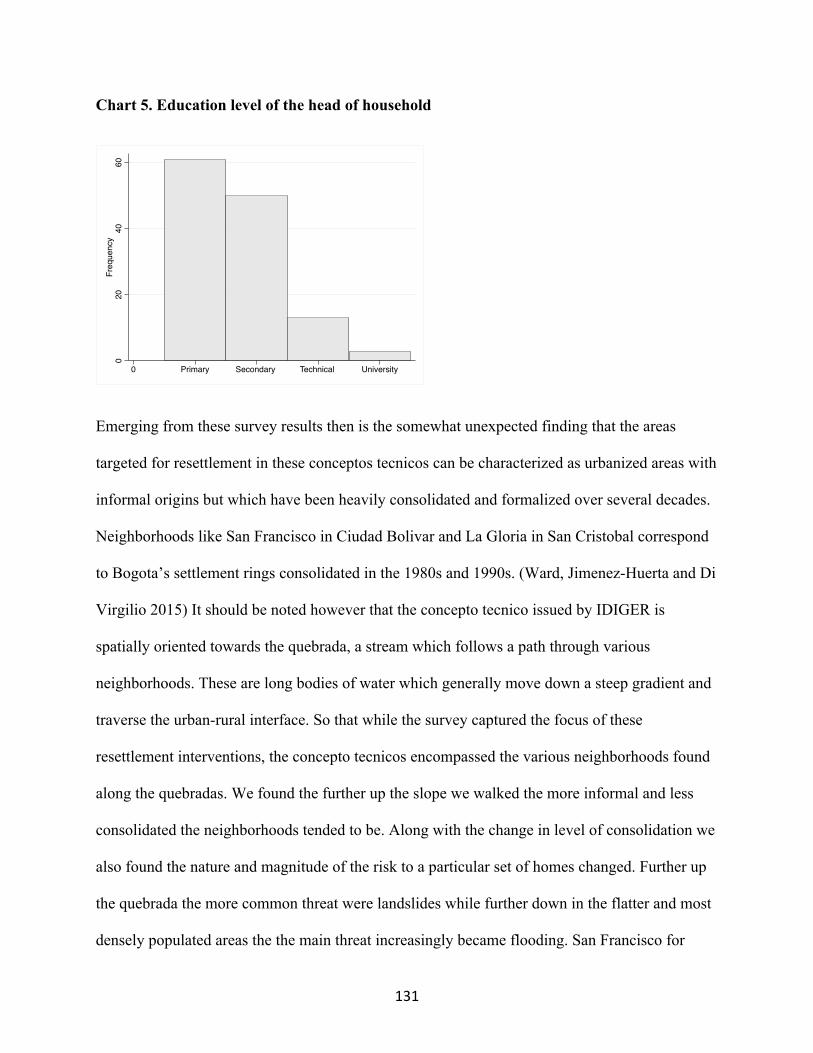
131
Chart 5. Education level of the head of household
Emerging from these survey results then is the somewhat unexpected finding that the areas
targeted for resettlement in these conceptos tecnicos can be characterized as urbanized areas with
informal origins but which have been heavily consolidated and formalized over several decades.
Neighborhoods like San Francisco in Ciudad Bolivar and La Gloria in San Cristobal correspond
to Bogota’s settlement rings consolidated in the 1980s and 1990s. (Ward, Jimenez-Huerta and Di
Virgilio 2015) It should be noted however that the concepto tecnico issued by IDIGER is
spatially oriented towards the quebrada, a stream which follows a path through various
neighborhoods. These are long bodies of water which generally move down a steep gradient and
traverse the urban-rural interface. So that while the survey captured the focus of these
resettlement interventions, the concepto tecnicos encompassed the various neighborhoods found
along the quebradas. We found the further up the slope we walked the more informal and less
consolidated the neighborhoods tended to be. Along with the change in level of consolidation we
also found the nature and magnitude of the risk to a particular set of homes changed. Further up
the quebrada the more common threat were landslides while further down in the flatter and most
densely populated areas the the main threat increasingly became flooding. San Francisco for
020
4060
Freq
uenc
y
0 Primary Secondary Technical University
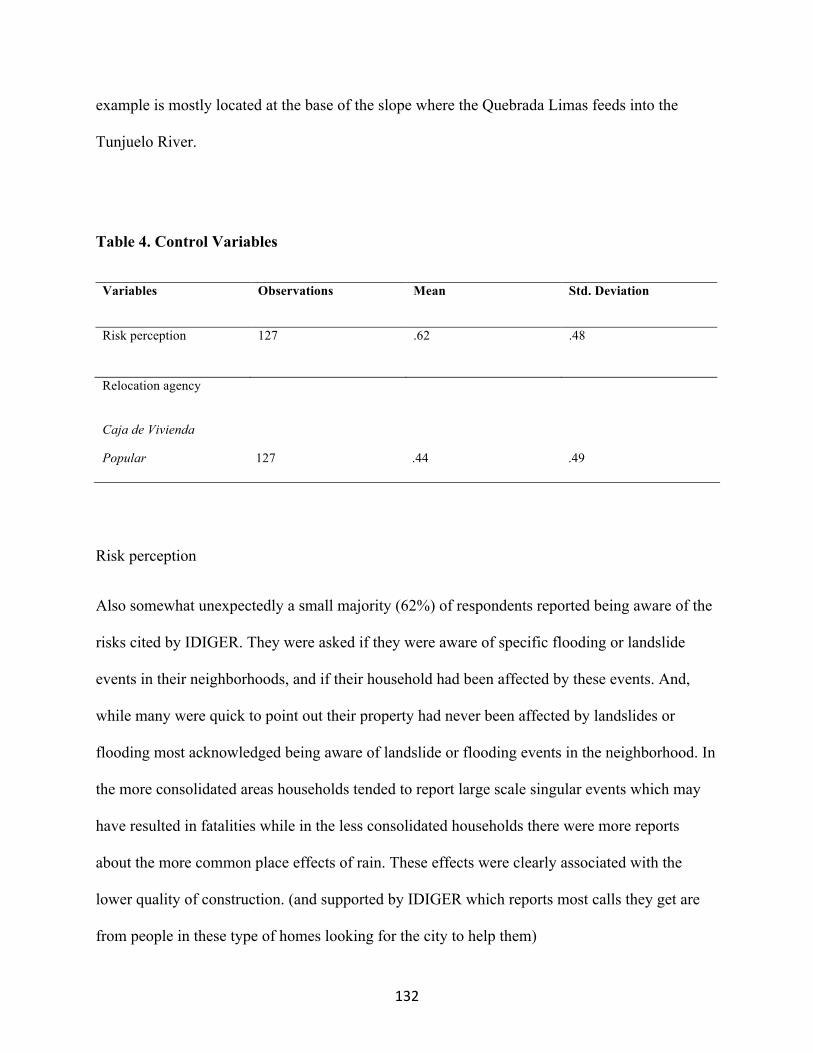
132
example is mostly located at the base of the slope where the Quebrada Limas feeds into the
Tunjuelo River.
Table 4. Control Variables
Variables Observations Mean Std. Deviation
Risk perception 127 .62 .48
Relocation agency
Caja de Vivienda
Popular 127 .44 .49
Risk perception
Also somewhat unexpectedly a small majority (62%) of respondents reported being aware of the
risks cited by IDIGER. They were asked if they were aware of specific flooding or landslide
events in their neighborhoods, and if their household had been affected by these events. And,
while many were quick to point out their property had never been affected by landslides or
flooding most acknowledged being aware of landslide or flooding events in the neighborhood. In
the more consolidated areas households tended to report large scale singular events which may
have resulted in fatalities while in the less consolidated households there were more reports
about the more common place effects of rain. These effects were clearly associated with the
lower quality of construction. (and supported by IDIGER which reports most calls they get are
from people in these type of homes looking for the city to help them)
133
Relocation agency
The survey found most households in these areas were in the process of relocation with IDIGER
not CVP. This finding is significant because it runs contrary to the general trend of resettlements
across Bogota in which the vast majority of households resettle with Caja de Vivienda Popular.
The overrepresentation of relocations through the acquisition of properties by IDIGER in these
neighborhoods reflects Bogota Humana’s policy strategy of recuperating urbanized areas
developed around bodies of water. That is, given the topography of the city, the major quebradas
prioritized by Bogota Humana traverse some of the oldest and most heavily consolidated parts of
Ciudad Bolivar and San Cristobal.
Additionally, these households have been in the resettlement process for a long time.
Even before Bogota Humana some of the households dealt with IDIGER’s predecessor, FOPAE,
or Acqueducto de Bogota. So that some households reported having started their negotiation with
Acueducto but then changing to negotiations with IDIGER as a new resettlement strategy was
introduced by the Petro administration. Households expressed confusion by these institutional
changes and generally inconsistent communication by the city.
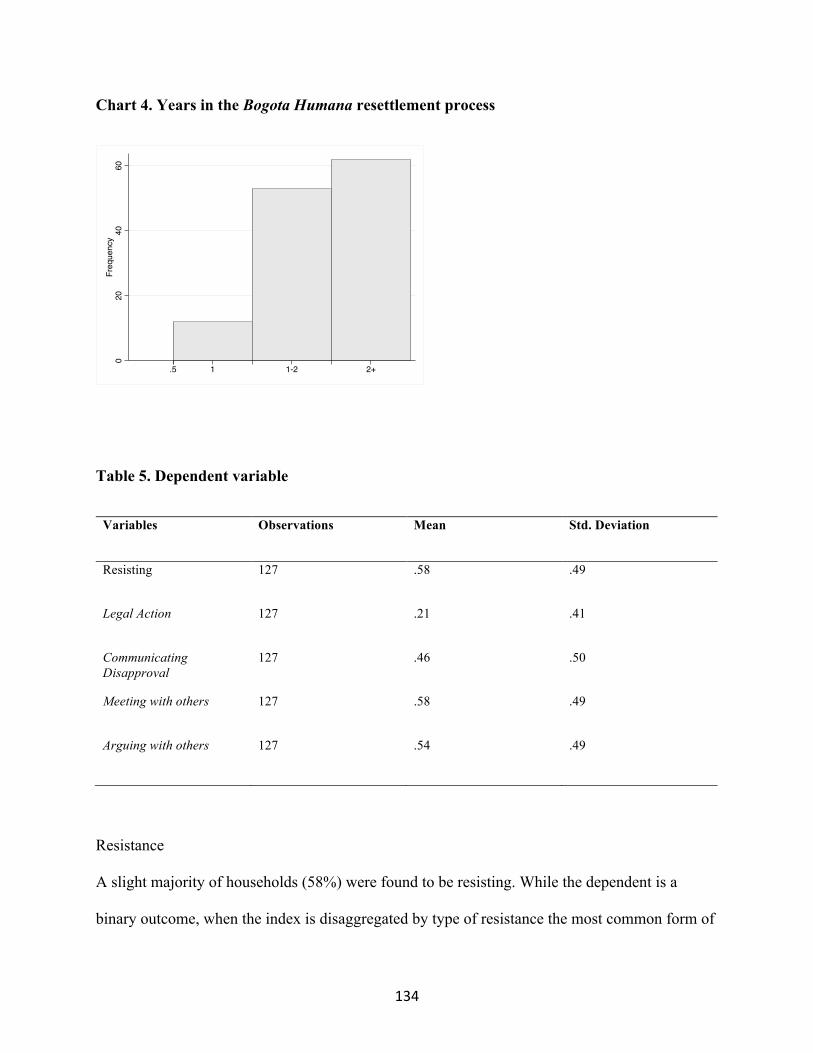
134
Chart 4. Years in the Bogota Humana resettlement process
Table 5. Dependent variable
Variables Observations Mean Std. Deviation
Resisting 127 .58 .49
Legal Action 127 .21 .41
Communicating Disapproval
127 .46 .50
Meeting with others 127 .58 .49
Arguing with others 127 .54 .49
Resistance A slight majority of households (58%) were found to be resisting. While the dependent is a
binary outcome, when the index is disaggregated by type of resistance the most common form of
020
4060
Frequency
1 2+.5 1-2
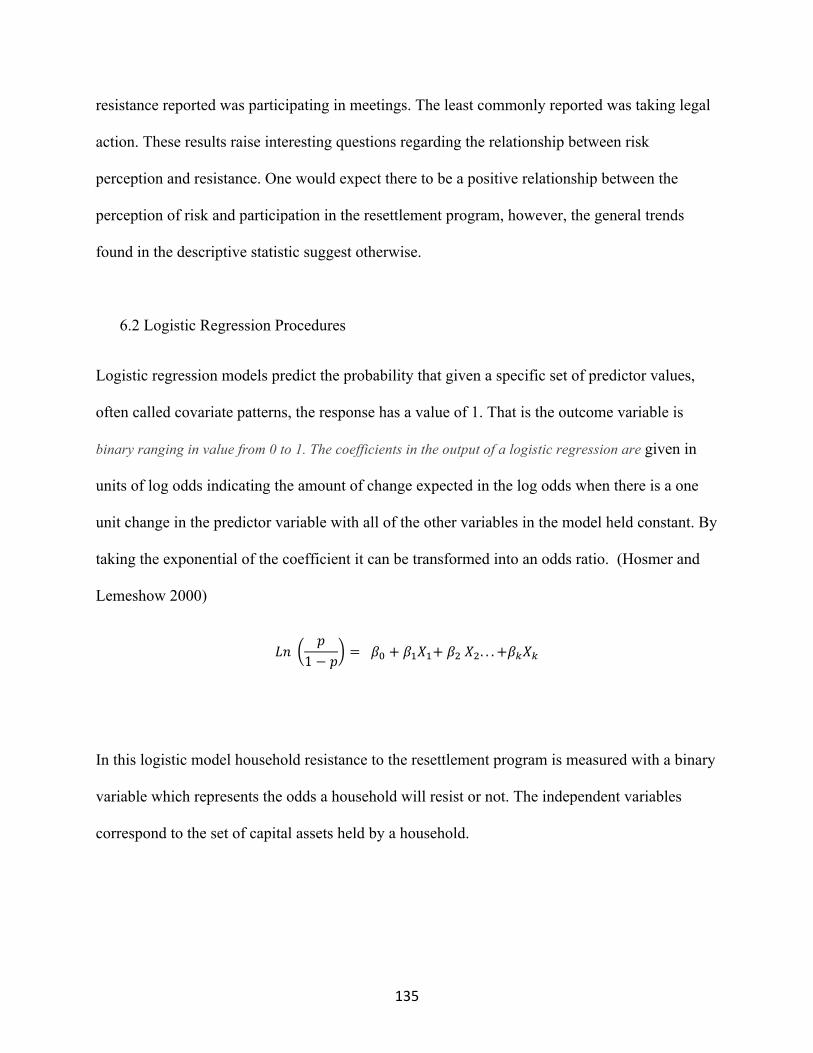
135
resistance reported was participating in meetings. The least commonly reported was taking legal
action. These results raise interesting questions regarding the relationship between risk
perception and resistance. One would expect there to be a positive relationship between the
perception of risk and participation in the resettlement program, however, the general trends
found in the descriptive statistic suggest otherwise.
6.2 Logistic Regression Procedures
Logistic regression models predict the probability that given a specific set of predictor values,
often called covariate patterns, the response has a value of 1. That is the outcome variable is
binary ranging in value from 0 to 1. The coefficients in the output of a logistic regression are given in
units of log odds indicating the amount of change expected in the log odds when there is a one
unit change in the predictor variable with all of the other variables in the model held constant. By
taking the exponential of the coefficient it can be transformed into an odds ratio. (Hosmer and
Lemeshow 2000)
𝐿𝑛𝑝
1 − 𝑝= 𝛽) + 𝛽+𝑋++𝛽-𝑋-. . . +𝛽/𝑋/
In this logistic model household resistance to the resettlement program is measured with a binary
variable which represents the odds a household will resist or not. The independent variables
correspond to the set of capital assets held by a household.
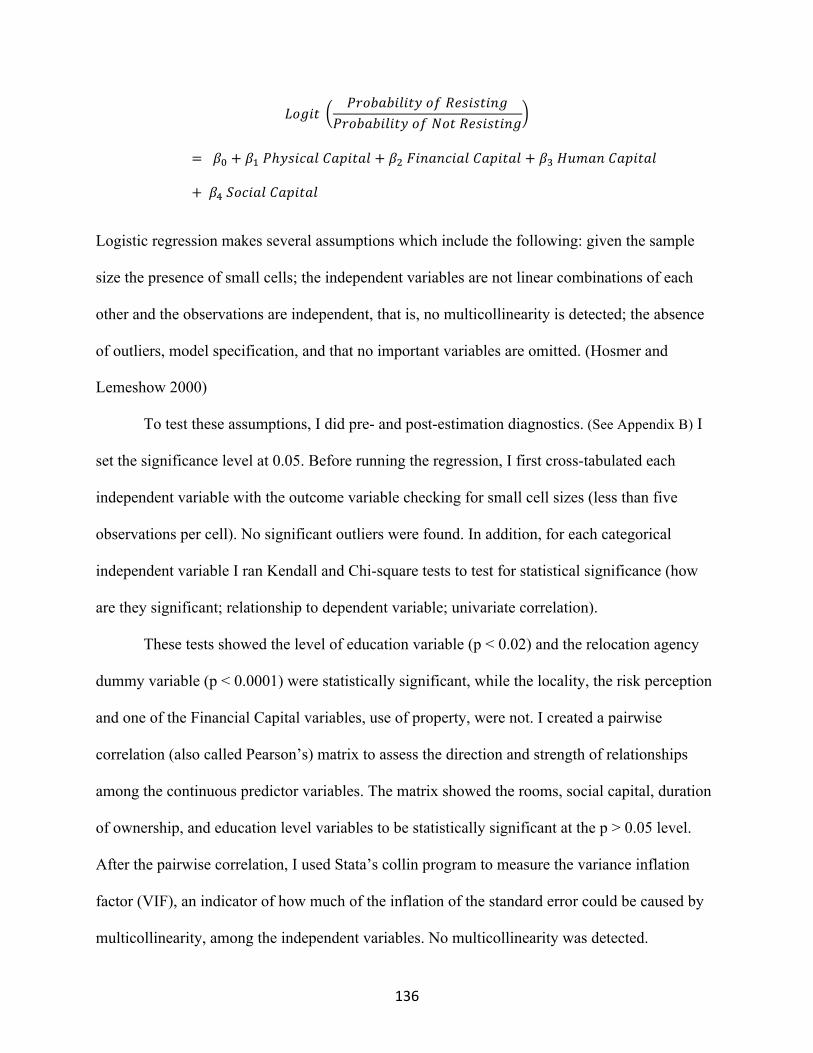
136
𝐿𝑜𝑔𝑖𝑡𝑃𝑟𝑜𝑏𝑎𝑏𝑖𝑙𝑖𝑡𝑦𝑜𝑓𝑅𝑒𝑠𝑖𝑠𝑡𝑖𝑛𝑔
𝑃𝑟𝑜𝑏𝑎𝑏𝑖𝑙𝑖𝑡𝑦𝑜𝑓𝑁𝑜𝑡𝑅𝑒𝑠𝑖𝑠𝑡𝑖𝑛𝑔
= 𝛽) + 𝛽+𝑃ℎ𝑦𝑠𝑖𝑐𝑎𝑙𝐶𝑎𝑝𝑖𝑡𝑎𝑙+𝛽-𝐹𝑖𝑛𝑎𝑛𝑐𝑖𝑎𝑙𝐶𝑎𝑝𝑖𝑡𝑎𝑙 + 𝛽K𝐻𝑢𝑚𝑎𝑛𝐶𝑎𝑝𝑖𝑡𝑎𝑙
+ 𝛽L𝑆𝑜𝑐𝑖𝑎𝑙𝐶𝑎𝑝𝑖𝑡𝑎𝑙
Logistic regression makes several assumptions which include the following: given the sample
size the presence of small cells; the independent variables are not linear combinations of each
other and the observations are independent, that is, no multicollinearity is detected; the absence
of outliers, model specification, and that no important variables are omitted. (Hosmer and
Lemeshow 2000)
To test these assumptions, I did pre- and post-estimation diagnostics. (See Appendix B) I
set the significance level at 0.05. Before running the regression, I first cross-tabulated each
independent variable with the outcome variable checking for small cell sizes (less than five
observations per cell). No significant outliers were found. In addition, for each categorical
independent variable I ran Kendall and Chi-square tests to test for statistical significance (how
are they significant; relationship to dependent variable; univariate correlation).
These tests showed the level of education variable (p < 0.02) and the relocation agency
dummy variable (p < 0.0001) were statistically significant, while the locality, the risk perception
and one of the Financial Capital variables, use of property, were not. I created a pairwise
correlation (also called Pearson’s) matrix to assess the direction and strength of relationships
among the continuous predictor variables. The matrix showed the rooms, social capital, duration
of ownership, and education level variables to be statistically significant at the p > 0.05 level.
After the pairwise correlation, I used Stata’s collin program to measure the variance inflation
factor (VIF), an indicator of how much of the inflation of the standard error could be caused by
multicollinearity, among the independent variables. No multicollinearity was detected.
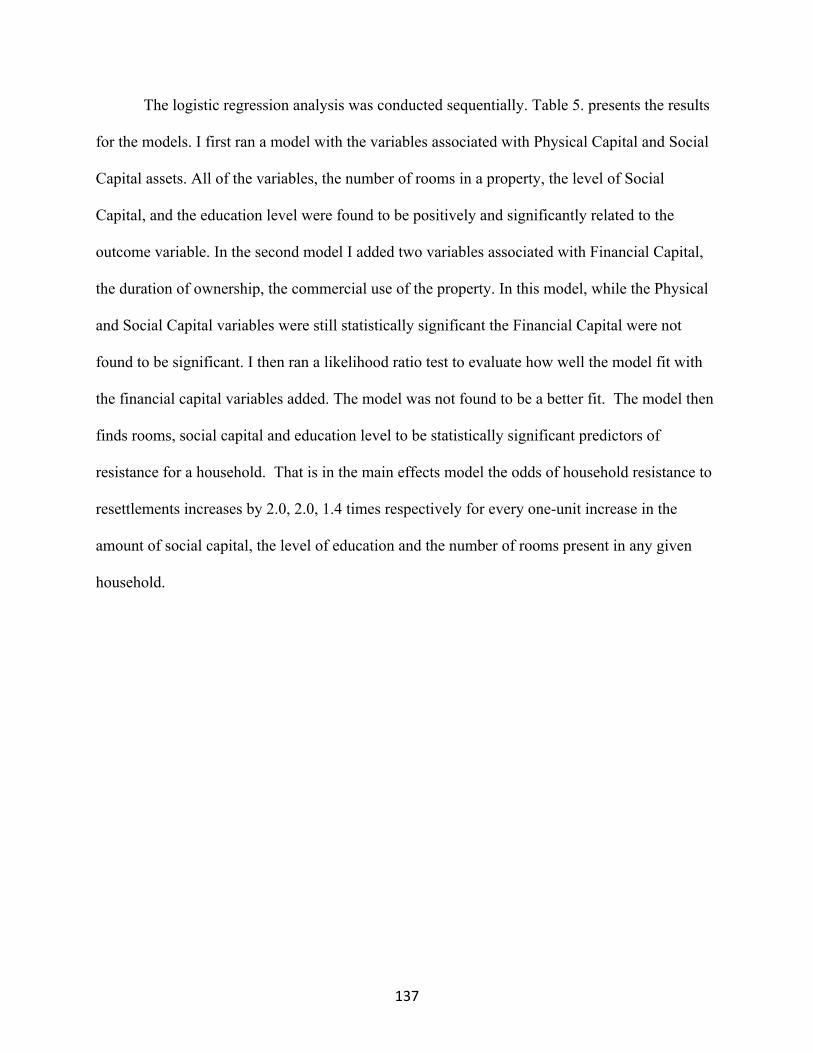
137
The logistic regression analysis was conducted sequentially. Table 5. presents the results
for the models. I first ran a model with the variables associated with Physical Capital and Social
Capital assets. All of the variables, the number of rooms in a property, the level of Social
Capital, and the education level were found to be positively and significantly related to the
outcome variable. In the second model I added two variables associated with Financial Capital,
the duration of ownership, the commercial use of the property. In this model, while the Physical
and Social Capital variables were still statistically significant the Financial Capital were not
found to be significant. I then ran a likelihood ratio test to evaluate how well the model fit with
the financial capital variables added. The model was not found to be a better fit. The model then
finds rooms, social capital and education level to be statistically significant predictors of
resistance for a household. That is in the main effects model the odds of household resistance to
resettlements increases by 2.0, 2.0, 1.4 times respectively for every one-unit increase in the
amount of social capital, the level of education and the number of rooms present in any given
household.
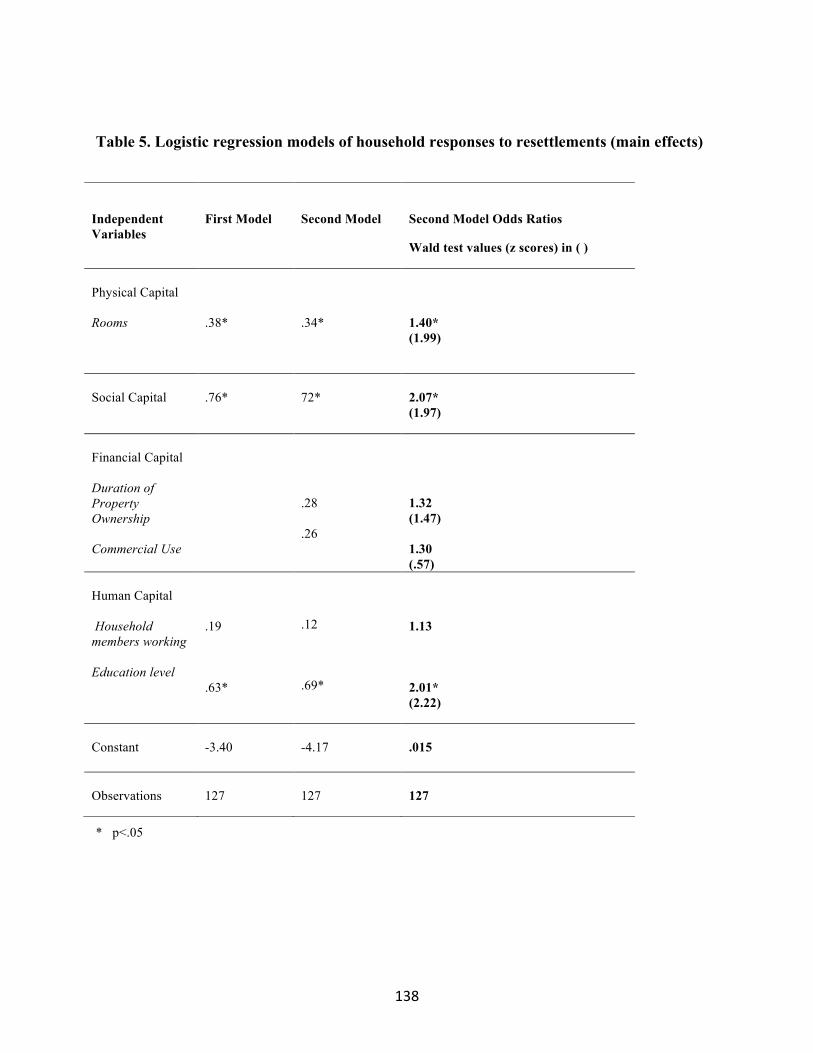
138
Table 5. Logistic regression models of household responses to resettlements (main effects)
* p<.05
Independent Variables
First Model
Second Model
Second Model Odds Ratios
Wald test values (z scores) in ( )
Physical Capital Rooms
.38*
.34*
1.40* (1.99)
Social Capital
.76*
72*
2.07* (1.97)
Financial Capital Duration of Property Ownership Commercial Use
.28 .26
1.32 (1.47) 1.30 (.57)
Human Capital Household members working Education level
.19 .63*
.12 .69*
1.13 2.01* (2.22)
Constant
-3.40
-4.17
.015
Observations
127
127
127
139
As expected households with higher amounts of social capital were found to be more likely to
resist. This is not surprising considering social capital was defined as participation in community
organizations and access to various sources of information. So that those with high amounts of
social capital would be in communication with others regarding the resettlement process in the
neighborhood. They would then be more likely to participate in both individual and collective
actions to resist. Also not surprising is that they had higher levels of education. This implies they
might have higher technological and institutional forms of literacy necessary to mount a defense
of their properties.
That they had more rooms makes sense if you consider the significance of the size of the
property. They were being offered small social housing units, it stands to reason someone with a
larger home would view this is as a downgrade. Additionally, physical property is a source of
income. Properties are commonly used for both residential and commercial purposes, one of the
most important of which is renting rooms in the secondary market. These households might
balance risk versus downgrade in the quality of their housing. More importantly then the cost
benefit analysis here though is that it provides a basis for the household to negotiate more
compensation for their property. That is, this physical capital can be a basis for resistance.
It was surprising financial capital was not statistically significant. Especially since it was
defined as how long a property has been owned and whether or not it was used for commercial
activity. However, this was the result for the main effects model. What follows are the results of
the model with the interaction term. That is to test the effect of a household negotiating with a
particular agency.
I ran a regression with an interaction term representing the effect of the dummy variable
for the relocation agency on each of the predictor variables. Note in the results for the model
140
with the interaction term the lower order term denotes households with IDIGER. The results
presented in Table 6. show the lower order terms for the duration of property ownership and
social capital variables to be statistically significant. So that the odds of household resistance to
resettlements for households being relocated by IDIGER increases by 1.9 times for every one-
unit increase in the duration of property ownership and 5.6 times for every one-unit increase in
the amount of social capital held by a household.

141
Table 6. Logistic regression model with Caja interaction term
Independent Variables
Model
Model Odds Ratios
Wald test values in ( )
Caja 1.70 5.47
(.61)
Physical Capital Rooms x Caja
-.03 .68
.96 (-.12) 1.99 (1.73)
Social Capital x Caja
1.74* -1.17
5.69* (1.97) .32 (-1.11)
Financial Capital Duration of Ownership x Caja Commercial Use x Caja
-.66*
-.76 .14 .00
1.93* (2.11)
.46 (-1.68) 1.15 (.20) 1.00 (.01)
Human Capital Household members employed x Caja Education level x Caja
.63 -.62 .75 -.31
1.88 (1.27) .53 (-0.98) 2.13 (1.62) .73
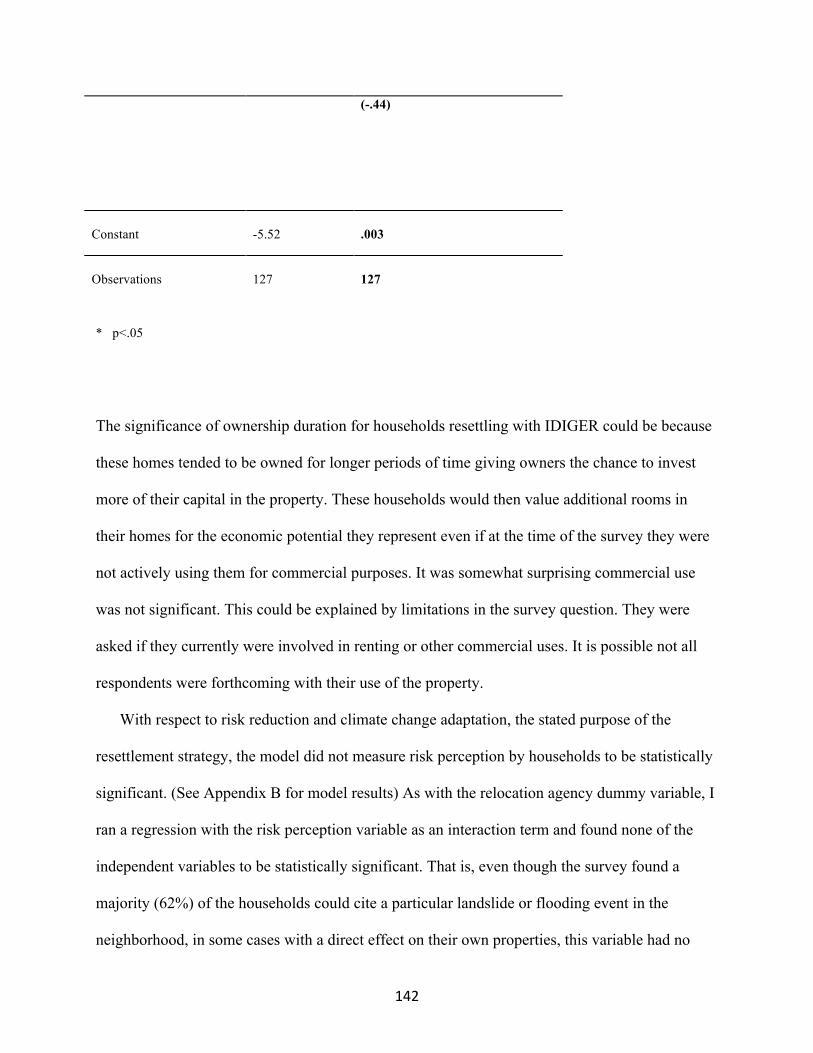
142
* p<.05
The significance of ownership duration for households resettling with IDIGER could be because
these homes tended to be owned for longer periods of time giving owners the chance to invest
more of their capital in the property. These households would then value additional rooms in
their homes for the economic potential they represent even if at the time of the survey they were
not actively using them for commercial purposes. It was somewhat surprising commercial use
was not significant. This could be explained by limitations in the survey question. They were
asked if they currently were involved in renting or other commercial uses. It is possible not all
respondents were forthcoming with their use of the property.
With respect to risk reduction and climate change adaptation, the stated purpose of the
resettlement strategy, the model did not measure risk perception by households to be statistically
significant. (See Appendix B for model results) As with the relocation agency dummy variable, I
ran a regression with the risk perception variable as an interaction term and found none of the
independent variables to be statistically significant. That is, even though the survey found a
majority (62%) of the households could cite a particular landslide or flooding event in the
neighborhood, in some cases with a direct effect on their own properties, this variable had no
(-.44)
Constant
-5.52
.003
Observations
127
127
143
statistical effect on whether or not a household chose to resist the resettlement. Importantly this
implies households, while cognizant of the risks identified by IDIGER’s technical analysis of the
natural hazards present in these areas of the city, prioritized other factors in their response to the
resettlement strategy.
7. Household interviews
After the household survey fifteen follow-up interviews ranging from twenty to twenty-five
minutes were conducted in Ciudad Bolivar and San Cristobal. The purpose of the interviews was
to gain an understanding of the reasoning behind household responses to the resettlement. The
selection criteria for households to interview aimed for a sample which included a mix of
households negotiating with IDIGER, Caja, those which used their properties for commercial
purposes and those which only used their property as a residence. The interviews were semi-
structured though a standard set of questions was used to guide the conversation. (See Appendix
for set of questions) These household interviews were supplemented with interviews of
community leaders including the presidents of the JAC in the neighborhoods most heavily
affected by the resettlements.35
The household interviews revealed residents were not only aware of the risks but could in
many cases explain their anthropogenic causes. First, a common response was to rely on
historical accounts of the quebrada to explain the risks as the consequence of disinvestment by
the city in this part of Bogota. That is, a respondent reported being aware of a flood or landslide,
or having experienced such an event, but pointed to explanations which emphasized the role of
35 In this section quotes are attributed to individuals through the use of pseudonyms. All quotes were translated to English by the author.
144
poor infrastructure rather than climate change itself. Second, respondents pointed to the
environmental degradation caused by informal development. Third, respondents often argued
these risks could be mitigated with investments in upgrading this infrastructure instead of
resettlements.
For example, one respondent, a long-time, elder resident of the San Francisco - Los
Sauces neighborhood who lives next to the Quebrada Limas, explained:
“One time when the water levels increased and the quebrada flooded this area, it was
because they [IDIGER] had planted trees very close to the water. When the water level
increased, the heavy flow of water uprooted the trees and the resulting debris clogged a narrow
tube which channels the quebrada underneath the bridge. You know we are all dirty and throw
garbage into the quebrada. So what happened? The tube was blocked, and it flooded over there,
but not here.” She added, “In any case, it is cheaper to canalize the quebrada” suggesting the city
should invest in upgrading the infrastructure around the quebrada instead of relocating
households.
Further up Quebrada Limas in the neighborhood of Juan Jose Rondon the president of the
JAC argued the problem with flooding of the quebrada could be primarily attributed to mining
operations found at the origins of Quebrada Limas. He argued sediment from the mine flows
down the quebrada causing an increase in water levels which threaten the neighborhoods at the
base of the slope but not Juan Jose Rondon. Instead Juan Jose Rondon has to deal with
landslides. Here he suggested the mining operation was also causing the destabilization of the
slope:
“The threat of landslides mean we are below hills where there might be an avalanche like
it happened in Nevada del Ruiz and Armero. But the problem we have is the result of the mines
145
that are being exploited over there.” He added: “They should build retaining walls on the side of
the quebrada like they did in the Quebrada Chiguaza at the Tunjuelo River.”
Similarly, in San Cristobal residents could point to events they attributed primarily to
poor infrastructure and environmental degradation. For example, an elder man who lives next to
the Quebrada Chiguaza explained: “There once was a flood but that was because up there
[pointing to a higher section of the quebrada] they had built a dam for mining gravel, and when it
rained the dam failed.” This resident very clearly understood the flooding to be climate-related
but chose to emphasize the dam’s inability to contain the quebrada. By doing so he suggested the
relocations could be avoided if the city instead invested more in reinforcing the dam.
In the Laureles neighborhood of San Cristobal, next to the Fucha River, the former
president of the neighborhood’s JAC explained how the risk of landslides affecting Laureles was
created. Having explained her family were founders of the Laureles in the early 1990s she
continued: “When we got here the terrain was flat, but then more started coming, little by little,
and the homes they built destabilized the terrain. The weight of the homes, and the water
filtration pipes families built to channel waste to the river, caused cracks in the terrain and
homes.” At this point, her daughter, a college-graduate, added: “This hillside used to be covered
with trees but obviously they cut them down to build homes.” Here she suggested the clearing of
the trees further destabilized the slope the neighborhood was built on. This explanation of how
the risk of landslides was created through informal development could have been provided by
IDIGER’s own engineers. In fact, resident explanations of specific flooding and landslide risks
in relation to a quebrada often coincided with the technical evaluations found in IDIGER’s
conceptos tecnicos.
146
Residents were also aware of the effect of heavy rain on their environment, in some
cases, directly tying certain events to climate change. For example, a middle-aged man in the
neighborhood of Monte Carlo next to the Fucha River, discussed a flood which took place 5
years ago: “The old-timers say, that had not happened in 40 years. It was a unique phenomenon.”
He then noted: “They [the state] are prioritizing people who have had catastrophes in other
cities.” He was referring to the 2017 Mocoa landslide in Putumayo, which caused hundreds of
deaths, and had just taken place at the time of the interview. This event was attributed to
unusually heavy rains in this part of Colombia.
IDIGER’s inability to fully implement Bogota Humana’s development vision however
appeared to cause confusion among residents who noted the contradictions generated by the
resettlement strategy in these neighborhoods. The elder resident in Los Sauces San Francisco,
Ciudad Bolivar argued: “If they said the relocations are to recover the quebrada on this side I
think the necessary space already exists. If it is for that then they should buy the lots which are
almost on top of the quebrada.” IDIGER identified areas to be recovered not only on the basis of
the quebrada’s history of generating emergencies but also on the basis of its potential to generate
future emergencies given climate models. That is, the probability that areas which had never
experienced emergencies, or did not appear to be at risk according to residents, might experience
emergencies in the future. Following this logic IDIGER’s tactic was to attempt collective
resettlements of entire blocks of homes irrespective of the varying levels of imminent risk faced
by individual households. However, active resistance by households, or complications with
determining property ownership and sorting through titles, prevented IDIGER from completing
these collective resettlements. Instead one or two properties at a time might be demolished and
147
left vacant. Often this meant homes closest to the quebrada and most exposed to the risk of
flooding where left standing while properties further away were demolished.
In fact, some of the most common complaints by residents about the resettlement process
were about the social and environmental degradation caused by vacant properties often left only
partially demolished and unused. The president of San Francisco’s JAC for example explained:
“One of the biggest problems we have are the vacancies left behind. People start to fill them with
trash and rubbish. Some of these attract delinquency. They become places were people go to
smoke… We [the JAC] have considered organizing community patrols to clear these spaces but
the problem is you might get violently attacked. Someone could get killed. We could go armed
but for that we need city permits. And if we don’t go armed then we might get attacked.”
A related problem for those living near vacant and partially demolished areas were the
negative financial consequences for those renting on their property. An older woman in Los
Sauces San Francisco explained vacant properties attracted recyclers who sort through the
partially demolished structures. She lived on a block where many structures had already been
completely or partially demolished, and added: “I used to rent apartments for 1,200 [COP], I was
renting 4 apartments, but not anymore. People started to leave when they saw homes being
demolished…security around here has become a problem…Because they demolished homes and
people come to take material. They fight each other for it.”
Moreover, underlying these problems was the challenge posed by the change in zoning
for the areas marked for resettlement. The new zoning outlawed all commercial activity, new
construction, and gradually lowered property values. Across Ciudad Bolivar and San Cristobal
the households interviewed noted this problem. A young woman in San Cristobal negotiating
with IDIGER shared her story: “When I went to city hall to turn in our paperwork to begin the
148
process we found they had lowered our property tax by 10 million [COP]. So that the
commercial appraisal of our property was also lowered.” So that the more prolonged the
resettlement process the less negotiating power was held by property owners. Similarly, in
Ciudad Bolivar a property owner explained: “every year the city appraises the property, it is
called the ‘avaluo catastral.’ But in these zones instead of increasing the value of the property it
is decreasing annually. For example, based on the appraisal my property tax was 53 million
[COP] but they lowered it by 12 million [COP]. They are devaluing our properties. It’s robbery.”
These inconsistencies in IDIGER’s resettlement strategy contributed to residents’ lack of
confidence and trust in the process. A family in Juan Jose Rondon, San Cristobal who were told
they had to resettle because their home was threatened by landslides argued: “Why if we live in a
green zone did they [they city] allow public utilities to provide us with services? Why are we
paying property taxes?” Residents often placed Bogota Humana’s resettlements within the
context of a history city interventions in these neighborhoods. This was especially true in the
households near Quebrada Limas.
A woman was being resettled by IDIGER explained: “20 years ago one heard the rumor
they were going to demolish over there to build a road. And then later because of the quebrada.
A neighbor tried to sell his house but ‘catastro’ [the district entity responsible for regulating real
estate transactions] did not let him. They informed him his property was located in a protected
land [the technical term used for a land use classification where residential properties cannot be
built]. And he could not modify his property anymore because they had already take photos.
They paid him for what he had when the photos were taken. But we were not sure why they
demolished his home.”
149
Thus most of the surveyed households were aware of the risk of flooding and landslides.
The main argument advanced by households in opposition of the resettlements was not the
absence of risk. They did however suggest alternative explanations for the nature of the risk, and
often disagreed with the specific strategies chosen by the city to mitigate the risk. Respondents
argued these specific strategies were in fact exacerbating the already existing risk they faced in
their neighborhoods.
Turning to a closer look at the capital assets then we begin identifying the main lines of
reasoning behind the resistance to the resettlement intervention. The logistic model found the
physical capital, measured by the number of rooms on the property, possessed by a household to
be a significant factor in whether or not they resisted the resettlement. However, the interviews
revealed these households were not absolute in their resistance, in fact, they used the physical
capital they possessed as a basis for negotiating more compensation from IDIGER. For example,
a family who lived in Los Sauces San Francisco, Ciudad Bolivar and had been notified they had
to relocate due to the risk of landslides, explained:
“We are not saying don’t relocate us, its very simple, we are in agreement with the
relocation if they want, what we are not in agreement with is the price they offer for this
house…This house is well situated. It is a house of three floors with a terrace…They offer 82
million [COP]. Where are we going to find a house like this for 82 million [COP]?
When adding the interaction term for relocation agency the model also found those
negotiating with IDIGER were more likely to resist the longer they had owned the property. Here
it is worth noting, again, there were two main modalities through which a household was offered
an alternative housing solution. IDIGER made an offer to buy a property while CVP simply
exchanged one property for another, that is, a social housing unit to replace the one left behind.
150
IDIGER made their offer on the basis of a special property appraisal which accounted for land
values and the quality of the building’s construction, and which recognized factors such as
ownership duration, commercial activity tied to the property including rentals, the size of the
family including the number of minors, single parent-led households, and the administrative cost
of the relocation.36 One of the consequences of these appraisals was that households could
challenge them and argue for a commercial property appraisal in the hopes of increasing the
amount of their compensation. That is by providing a detailed account of how a property was
valued IDIGER opened the possibility of contention.
For example, an owner of a home repair business in La Gloria, San Cristobal explained
his property consisted of a workshop for his business and his own living space. He also argued:
“I am a young person. Here in my house I have 45 square meters to build. In 6 years if I build an
apartment, let’s say 300 thousand [COP] for an apartment. Let’s add that for 6 years. How much
money is that?
Another resident from Los Sauces San Francisco, Ciudad Bolivar argued: “They don’t
recognize how long you have lived here, not even one thing about your income. One example, I
will tell you about my mom, she is a person of the third age [older than 60 years of age]. What
she gets from rent is an income for her. Even if they give her 80, 100 million [COP] where does
one buy with that, and with the income she is currently receiving?”
While these households possessed high levels of physical and financial capital the survey
also found most of them had low levels of social capital. That is, across the sample of households
surveyed most reported having access to only a few sources of information and only a minority
reported participating in community groups. This is consistent with the literature on informal
36 See Resolucion 109 de 2014 and Decreto 1420 de 1998 for appraisal and recognition of factors methods used by IDIGER.
151
settlements which explains social capital begins to diminish over time as a settlement is
increasingly consolidated and individual households find it unnecessary to rely on social
networks for meeting basic necessities such as access to water, gas and electricity.
Still, a slight majority (58%) of the households surveyed were found to be resisting. They
engaged in activities such as taking legal action against the city, filing formal appeals through
institutional channels, or simply meeting and arguing with others to not cooperate with IDIGER
and CVP.
Follow up interviews, however, help explain the apparent inconsistency between lower
amounts of social capital and a slight majority of households resisting. The interviews provided
evidence that the types of resistance these households engaged in changed over time. Initially,
when households were first notified they would have to vacate their properties in some
neighborhoods households participated in collective acts of resistance. For example, according
to the JAC presidents and community leaders of San Francisco and Juan Jose Rondon in Ciudad
Bolivar community meetings were organized by the JACs, neighborhood committees specifically
organized to mobilize residents were created, and a collection of schools slated for relocation led
a large student strike. In La Gloria, San Cristobal resistance was more fragmented and was more
commonly expressed in groups of families coming together to hire lawyers to challenge the city
through legal and institutional channels. Yet this initial unity seems to have been tenuous and as
time passed quickly dissipated.
For example, an older woman who lives with her son and his family in Los Sauces San
Francisco, Ciudad Bolivar, explained: “When they first notified families they had to relocate the
JAC’s organized many community meetings across 3, 4 [adjoining] neighborhoods, there were
152
also some families who made signs which read ‘this property is not for sale, it is my household
and here I will stay.’ Now the signs are all discolored, nothing else was done besides the signs.”
Another family who participated in community meetings argued they were not effective
because people are self-interested: “We did not go [to the last community meeting] because that
is misinformation.” The head of the household, a middle-aged woman continued with a story
about a meeting she had attended: “An old man showed up late to the meeting, interrupted the
meeting, claiming his house is worth 350 million [COP]. He would not allow the meeting,
attended by representatives from IDIGER and CVP, to continue because he kept arguing and
fighting. So everyone else was left without information because this man kept interrupting.”
The president of San Francisco’s JAC added: “The people try to defend their rights but
without organizing themselves. Because at first I suggested to them we should create an
organization for those casualties of the quebrada’s banks [a reference to households being
resettled due to their proximity to the quebrada]. We can call out the ‘personeria juridica’ [a
district office which exists to review the work of public agencies in Bogota] and fight for the
well-being of everyone. But this is not possible, because there are people who want to sell their
property and there are others who do not. There is no basis for unity.”
This final observation was particularly insightful as it pointed to the lack of economic
basis for uniting communities against the resettlement intervention. Namely, it is a recognition
that due to the varying levels of consolidation of properties, tenure patterns and land uses,
individual households might experience the resettlements differently. In fact, while a slight
majority resisted, mostly those negotiating with IDIGER, those who owned large properties
consolidated over many years, the rest, a significant number of households surveyed, did not.
Among these there were households who clearly viewed the resettlement as an opportunity to
153
improve their housing conditions. For example, an older man in San Cristobal who lived in a
small home located very close to the Quebrada Chiguaza, and who lived alone and was
negotiating with CVP, explained he went to see the model apartments and argued: “Others
complained the apartments would be too small, but when they went to see them they stopped
complaining. The location of the new apartments is beautiful.” Another man, a recycler by
profession who lived in a small home on a steep slope prone to landslides, next to the Fucha
River, stated he was in favor of the resettlements. He was also being resettled by CVP and
argued: “Well logically I am in favor. Because what else are you going to do? What if you say
no? Your house falls, you are [expletive] brother because you refused to accept [the
resettlement].”
Also in San Cristobal, in La Gloria neighborhood were resistance appears to have been
more fragmented to begin with, an older man negotiating with IDIGER, explained the
neighborhood met but at the end of the day they had to negotiate individually. He described the
experience: “5 or 6 of us would go to the IDIGER office but the doctor would sit down and tell
us you have to figure this out on your own with your lawyer and if you are going to contest the
appraisal you will have to pay for your own counter-appraisal.” At this point he explained
everyone went their own way.
Importantly, the survey was conducted several years into the resettlement process for
these households. So that it appears, based on the observations made at this point in time, the
resistance to resettlements had become increasingly more individualized. A common response to
questions about meeting with others to contest the resettlement was “around here people are very
divided.” In this social environment it appears households increasingly relied less on community
groups and more on smaller groups of households united by shared economic interests, that is
154
they were all more or less being offered similar types of compensation. In some cases, they
might be working with a lawyer to explore legal avenues for negotiating offers. It then follows,
as the model results confirmed, households with more human capital, namely higher education
levels, would be more likely to resist at this time. Individual resistance tactics required more
individual physical and financial capital but also the ability to navigate the city’s bureaucracies
and legal system. As noted earlier, a common individual tactic was to dispute IDIGER special
appraisal methodology. This meant a household could hire a third party to conduct their own
commercial appraisal to counter IDIGER’s appraisal (IDIGER convened with Bogota’s Catastro
to conduct appraisals). Few households could counter this way, but those with more physical,
financial, and human capital were the most likely to do so.
A small business owner in San Francisco, who had actively participated in organizing
resistance to the resettlements explained families had to be prepared with their own legal support
because: “IDIGER’s strategy is to organize meetings with individuals, call them to their offices
and confront them with three lawyers. They are told ‘you will not get one more penny than the
special appraisal.’ If you don’t accept we will expropriate.”
8. Conclusion
This study of household responses to Bogota Humana’s climate resettlement strategy produced
several important and unexpected findings with respect to the nature of resistance. First, how
households perceived risk associated with climate change, the primary external threat as defined
by the city, was not a factor in how households responded. Most households had some
knowledge of the threat of flooding and landslides, that is, they did not deny these are significant
problems. Yet, this knowledge did not appear to influence how they negotiated the resettlements.
155
Second, relying on the asset vulnerability frame (Moser and Dani et al. 2008) provided insight on
how social and economic factors associated with the informal housing market in these areas of
Bogota contributed to resistance and limitations for the resettlement policy.
One of the most important findings of the survey was that a majority of the homes
targeted by Bogota Humana’s resettlement strategy in these neighborhoods were large, well-
consolidated properties exposed to varying levels of risk. Most of the households surveyed were
negotiating their relocation with IDIGER. That is most were negotiating an offer made by
IDIGER for their property as opposed to negotiating the exchange of their property with CVP for
a social housing unit. Bogota Humana’s reliance on the “adquisicion predial” modality in these
neighborhoods was exceptional as the vast majority of resettlements across Bogota have been
completed via CVP’s social housing alternative. Approximately 1,700 households were resettled
by CVP compared to approximately 150 households bought by IDIGER through adquisicion
predial during the 2012-2014 period. These resettlement figures do not include the close to 8,500
households resettled by CVP since Bogota began disaster risk reduction resettlements in the late
1990s. (Olimpo Rojas Rodriguez, Informe de Gestion: Direccion de Reasentamientos Humanos,
Enero de 2016)
The overrepresentation of large, consolidated homes in this sample of resettlements was
related to Bogota Humana’s emphasis of recovering areas around bodies of water, such as
Quebrada Limas in Ciudad Bolivar and Quebrada Chiguaza in San Cristobal, on the basis of
probabilistic climate model projections. As codified in Decree 255 of 2013 under Bogota
Humana the operating logic of the resettlements would be to function primarily as a risk
reduction and climate change adaptation strategy, and not a housing provision strategy, designed
to protect human life. This meant a family found to be at risk would be relocated whether or not
156
the city’s social housing supply could provide a unit. Adquisicion predial enabled this shift in
strategy. In fact, before 2014 Bogota’s risk management agency did not have the power to buy
properties for risk reduction measures. The Petro Administration introduced the practice as part
of its transformation of the city’s risk management and housing strategy. Though this change
also meant engaging in the complexity of determining property titles, the valuation of property
and informal commercial activity. Most importantly, this engagement created the opportunity for
families to negotiate and resist through a range of strategies such as requesting alternative
property appraisals, legal challenges, and generally more demand for larger compensation offers.
Many of these households responded by drawing on their capital assets to resist. They
cited the size, construction quality and commercial uses of their properties to demand larger
compensation offers. Importantly, as explained by Moser and Dani et al. (2008) how a
household’s physical capital assets can be converted into social strategies is partly dependent on
the political context and history they inhabit. These families built their homes, informally in
these peripheral areas of the city, because they have historically been socially excluded from
formal labor and housing markets. There homes then do not represent just a financial, capital
investment but also a social investment in these physical properties. As such, their physical
property cannot be evaluated through a simple cost-benefit analysis.
These families also noted the inconsistencies produced by Bogota Humana’s uniform
approach to resettlements. Namely households which appeared to be at manageable levels of risk
where relocated while many which appeared to be facing imminent risk were allowed to stay.
But they also found it difficult to unite in their resistance as the varying levels of consolidation,
physical and financial capital meant some actually found it beneficial to enter the resettlement
program or accept IDIGER’s offer. Resistance at the time at the time of the survey was then
157
characterized by individual lines of action. Lines of action which required the ability to navigate
the city’s bureaucracy and legal system. For example, households could demand new appraisals
of their properties to argue for higher compensation if they could identify the right institutional
channels and when necessary acquire legal support.
A household might also simply refuse to cooperate and prolong the process hoping the
city would not relocate them. This holdout tactic was successful in many cases as IDIGER
eventually exhausted its budget for these projects. In fact, at the time of this survey many
households were being told the resettlement process was on hold while IDIGER transitioned to
new personal and a new budget under the incoming Penalosa Administration. This meant those
who might willingly participate in the resettlement process lost confidence in the city’s
commitment to following through.
Ultimately the Petro administration failed to reach its resettlement targets around
Quebrada Limas and Chiguaza and the Fucha River. Large-scale climate resettlements proved to
be too costly in these highly consolidated neighborhoods. Bogota Humana, then, instead of
reducing the populations’ exposure to risk exacerbated existing social and environmental
problems, and created new ones, for those who did not relocate and chose to stay behind.
Moreover, the resettlement policy did not account for the large number of families renting in
these neighborhoods. Since they were not eligible for the compensation offered by the city
(though technically property owners could ask for additional compensation on their behalf) for
them the resettlement intervention represented a straightforward case of displacement.
158
Conclusion
This dissertation examined Bogota’s climate resettlement strategy as it was formulated in the
Bogota Humana development plan and implemented during the Gustavo Petro administration in
2012-2016. This strategy represented a pioneering effort to merge the practice of resettlements
with climate change adaptation. Combining disaster risk management and climate change
adaptation in its development plan, this innovative strategy was the first of its kind for a city of
this size and prominence in Latin America. The study’s concern lied in how the city’s housing
market, given two of its defining features include a severe housing deficit and informal self-build
housing, complicates this strategy. I chose a research strategy based in political economy
because I was interested in understanding the political and economic relationships which
contribute to the social-spatial construction of climate risk in Bogota. I counter-pose political
economy to social-ecological systems theory (SES) arguing it is necessary to move beyond
narrow and technocratic approaches to the study of climate resettlements. Specifically, I pursued
two broad lines of inquiry focused on the financial and zoning instruments the city used to
address climate risks, on the one hand, and the political debate and resistance from households to
the resettlement strategy, on the other. In what follows I present a summary of the main findings
and discuss their implication for the study of climate resettlements. I conclude with a brief
discussion of the limitations to this study of climate resettlements in Bogota.
159
1. Summary of findings
A uniform prospective policy increased climate risks for residents given the city’s limited
resources, the heterogeneity of informal settlements, and the nature of housing markets.
Based on the projected effects of climate change, Bogota Humana sought to recover the city’s
ecological corridors with the potential for generating floods and landslides. Chapter one
describes how Bogota did this by creating new risk zoning instruments and expanding the urban
areas included in risk zones. These zoning changes greatly increased the number of households
which had to vacate their homes and find alternative housing solutions. Bogota took
responsibility for the financial cost of the relocation and resettlement process creating new
financial instruments to support the increase.
However, chapter four explains while the areas targeted by this strategy were almost
exclusively informally developed settlements these areas are also characterized by a range of
housing typologies which represent varying levels of consolidation. Residents invested in self-
building these homes because they were excluded from the formal market by their inability to
access loans or even qualify for social housing subsidies. Therefore, the city now had to finance
the relocation of households who might be living in small wood and aluminum laminate
structures and those who might be living in large three story cement structures with small
businesses and extra rooms for rent. Moreover, while the city attempted to implement large-scale
collective resettlements the compensation offered to residents had to be negotiated for each
individual property. Relying on a capital asset framework the household survey conducted in
Ciudad Bolivar and San Cristobal, in Quebrada Limas and Quebrada Chiguaza was conducted to
160
asses how households responded to the resettlement intervention. Typically, this framework is
used in the study of poverty to analyze how households capitalize on their assets to form survival
strategies. In this case, the survey took a step beyond and used the framework to analyze how
households participating in the resettlement program capitalized on their assets to resist the city’s
intervention. The survey found a majority of the residents resisted the city’s climate
resettlements. Many understood the climate risks involved but resisted because they did not
believe they were being adequately compensated. Most of these residents also owned large, well-
consolidated homes they had owned for decades. The survey of three social housing projects in
Usme and Ciudad Bolivar, described in chapter two, however found these families, most who
came from less consolidated neighborhoods than the ones surveyed in Quebrada Limas and
Quebrada Chiguaza, were generally satisfied with their new homes viewing them as an upgrade.
Ultimately, Bogota Humana’s climate resettlements, as explained in chapter one, despite
a large investment in the strategy, resulted in less than half of the target met. Towards the end of
the Bogota Humana period the city exhausted its financial resources and housing supply.
Consequently, the household survey found, many residents in neighborhoods like San Francisco
in Ciudad Bolivar found themselves surrounded by vacant lots some with only partially
demolished structures. In some cases, new land invasions took place in areas left vacant by the
city. Caracoli, for example, was partially reinvaded by residents being resettled from Quebrada
Limas.
The survey of the social housing projects also found many who had been relocated, while
waiting for their new social housing unit, had attempted to buy or rent homes in neighborhoods
near their own. As discussed in chapter one the city’s use of financial instruments such as the
SDVE which subsidized demand caused speculation in the housing markets of the informal
161
settlements. Land and property owners looking to sell or rent anticipated the city’s intervention
and raised prices for those looking for alternative housing solutions. So that families in search of
lower prices were displaced into neighborhoods with riskier geographies. Moreover, the city’s
compensation did not account for renters who account for close to 40% of all residents in
Bogota’s informal settlements. (Parias Duran 2008) That is, these residents were also displaced
potentially into riskier geographies. Residents thus experienced the city’s intervention as an
uneven and sometimes contradictory process.
Relying on social housing resulted in displacing families further into the periphery often
into risk areas.
The primary housing modality selected for those entering the resettlement program was new
social housing. Moving beyond the SES framework brought into view the political nature of the
Petro administration’s resettlement intervention. Beyond a risk management strategy designed to
prevent construction in ecologically sensitive areas of the city, the Petro administration
conceptualized climate change adaptation as requiring a more profound intervention which
aimed to counter the basis for social-spatial segregation in the city. To this end, Chapter one
explains how the Petro administration increased the amount the city invested in the buying of
properties in risk areas. However, the vast majority of households marked for resettlement with
Caja de Vivienda Popular (CVP) were offered a new social housing unit in exchange for their
homes. It even created a new financial instrument, the SDVE, to finance new housing for those
in the resettlement program. Ultimately the city could not overcome market pressure which
pushed new social housing projects further into the periphery.
162
Chapter two describes how the financial reform of housing subsidies resulted in the
expansion and consolidation of Bogota’s informal settlements in the southern and western
periphery in the late 1990s and early 2000s. Chapter three shows new social housing built in
Bogota since 2008 was also built in peripheral areas concentrating in localities like Bosa and
Usme. Compared to market rate housing, they were disproportionately built in risk zones,
namely in the city’s flood risk zones. Moreover, the most consistent predictors of where new
social housing, rather than market housing, was built included market variables such as land
values and distance from the central business district. Chapter two also explains social housing in
Bogota is financed via two modalities, social housing (VIS) and priority social housing (VIP).
The CVP’s resettlement program relied on VIP housing exclusively which fixes unit values at a
lower rate than VIS. This decision likely only strengthened the effect of the market on the
location of social housing built for resettled families. That is because developers in Bogota
compensate for the fixed cost by building in increasingly larger economies of scale and
increasingly further into peripheral areas in search of decreasing land values.
Chapter one also explained how the Petro administration largely divested from the
national government’s free housing program. The administration argued this program tends to
build in peripheral risk zones undermining their effort to reduce social-spatial segregation and
resident’s exposure to climate risks. However, without this supply of housing the administration,
even with the creation of the subsidio de vivienda en especie (SDVE) program, could not change
the spatial pattern of new social housing. In fact, the majority of SDVE projects were built in
peripheral risk zones like Nuevo Usme. The administration also experimented with alternative
strategies such as the organizacion popular de vivienda (OPV) program which allowed residents
to pool their subsidies to partner with developers to design and build new housing. But, this
163
program only saw two projects completed. Moreover, these projects located in the peripheral
Bosa and Usme neighborhoods respectively exemplified not only the tradeoff in location but also
in quality. That is because the residents who organized OPV’s had to absorb the cost of
mitigating the risk identified in their project’s location. In Bosa the OPV, committed to building
single family homes, had to relocate from their original site due to the threat of flooding from the
Bogota river. In Usme the OPV had to forego single family homes in order to pay for the risk of
landslides at their site.
Thus ultimately the social housing strategy resulted in families being resettled from risk
areas to other risk areas. While presumably the city was better equipped to mitigate the risk in
new social housing projects, in fact, many projects were of such quality that new residents found
themselves exposed to climate risks such as flooding.
Bogota Humana’s climate resettlements, a project of political left in Bogota, were met with
political resistance
Bogota Humana’s climate resettlements were very much a component of the Petro
administration’s political project for Bogota. They were tied to a broader effort to address social-
spatial disparity in the city by desegregating residents of the lower social economic strata. In
order to this, as explained in chapter one, the Petro administration attempted to intervene in the
city’s housing market with a range of zoning instruments encapsulated in its proposed
modification of the Bogota’s territorial plan (POT). These efforts were met with strong resistance
from the local business and political elite represented by the district council. Ultimately, the
district council’s opposition denied the Petro administration’s modification of the POT. Without
164
this modification, and unable to surmount the housing deficit, the climate resettlements had the
unintended consequence of creating risks in partially demolished neighborhoods and displacing
residents to social housing projects in peripheral risk areas.
Chapter three found the spatial distribution of new construction between 2008-2016
provides evidence new construction, especially social housing, is built and clustered in peripheral
areas of the city. Additionally, after attempting to model the effect of risk zoning on the
development of new social housing, I did not find evidence the city’s risk zoning has been
consistently and effectively enforced to prevent new construction in the city’s risk areas. This
finding is consistent with the understanding the risk zoning instrument is a political instrument
with enforcement varying depending on who holds power, and what plan they propose for
climate change adaptation. This is confirmed in chapter one with examples like the Campo
Verde social housing project. This large project built on the Bogota river’s flood plain was
suspended by the Petro administration following a technical assessment by IDIGER. When the
Penalosa administration took office, based on a new technical assessment by IDIGER, the
Campo Verde project resumed construction. New development in the forest reserve Thomas van
der Hammen is another example of this dynamic. So that far from a value-neutral, technical
process climate resettlements, climate change adaptation more broadly, are a heavily politicized
and contentious.
Finally, if Bogota Humana is to be understood as a political project of the left, the
neoliberal reform of Colombia’s housing subsidy system in the late 1990s can be understood as a
political project of the right. And, as chapter two explains the housing crisis caused by this
reform greatly contributed to the fixing of Bogota’s current social geography of climate risk. It
follows then that while Bogota’s district council opposed the Petro administration’s agenda, the
165
survey of the social housing projects built for resettled families found they were generally
supportive of the resettlements. For example, in social housing projects across Ciudad Bolivar
and Usme new residents expressed their gratitude to the Petro administration.
2. Policy implications A political and economic frame demands thinking beyond a narrow, technocratic evaluation of
the climate resettlement policy. Specifically, this approach requires more attention be given to
policies which might address the social and economic relationships which contribute to spatial
segregation in geographies of risk. An obvious place to start is housing policy and more
specifically credit and subsidy systems which might increase access to housing in the formal
market. A related policy area to consider is economic development which might enable
economic and spatial mobility for the city’s lower social economic strata. Here I very briefly
review both the more focused technical implications and then the broader economic development
and housing policy implications.
The unintended consequences produced by Bogota Humana’s uniform climate
resettlement policy imply future interventions will have to be more sensitive to the diverse
ownership and land tenure patterns found in informal settlements. That is the instruments used to
finance climate resettlements will have to be more flexible and accommodating of the various
arrangements residents have established in these urban areas which largely operate beyond the
reach of state law. Perhaps the single most important example of this is the need to account for
the large secondary market in these settlements. If not included in the resettlement plan residents
participating in this secondary market, both owners and renters, will not be adequately
compensated and therefore less likely to willingly participate in the plan.
166
A related implication is the need to formulate a relocation strategy which plans for the
consequences of an uneven process. To prevent new invasions or other unwanted activity in
areas left vacant by resettlements the city will have to decide whether the risk level and the
resources available merit large-scale, collective resettlements. In Bogota the Los Altos de la
Estancia resettlement, in which the city funds youth and community programs to manage gardens
in the recovered area, built a wall and a police station for security and invested in various
mitigation works such as canals and retention walls, is a positive yet exceptional example.
With respect to the housing supply, relying on social housing systems to provide the
housing solution for families being relocated requires more careful consideration of how these
systems relate to geographies of risk. That is, this approach should be accompanied with policies
designed to promote social housing in more centrally located areas with lower environmental
risk. In Bogota for instance this might include the evaluation of Metrovivienda’s work to
generate and control the price of land for the construction of new social housing. Alternatively,
the city might review the restrictiveness of its policy towards relying on used housing and the
secondary market for families who chose not to participate in the resettlement program. The
social housing project survey found many families had searched for used homes to buy but often
these did not pass IDIGER’s risk evaluations.
For the long-term, if cities like Bogota seek to reframe their approach to climate change
as primarily a social and economic problem more investment will be necessary in credit and
subsidy systems to address housing deficits. The financial reform of the subsidy system in the
late 1990s led to the expansion of informal settlements in risk areas. What new policies might
help reverse this effect? Very closely related are economic development policies which might
increase the number of residents who qualify for credit and housing subsidies.
167
3. Theoretical contributions
This dissertation contributes to the emerging literature on climate resettlements by relying on a
political and economic frame to study the Bogota Humana case. It argues the dominant
theoretical frame in the study of climate change adaptation, social-ecological systems theory
(SES) with value-neutral systems epistemology, does not conceptualize the political and
economic relationships which produce geographies of risk. Left out of this frame are the
economics of housing markets, namely how the market pressures developers and informal
settlers to invest in areas of the city with the lowest land values which also coincide with risk
areas. Conversely, this economic dynamic is accompanied by political resistance to climate
resettlements which promote an alternative spatial logic that is one seeking to recover ecological
corridors without concern for how this land might be capitalized. SES theory then falls short of
being able to explain the contradictory outcomes observed in Bogota Humana’s climate
resettlements with its cycles of land invasions and the construction of new social housing in risk
areas. For this we have to study the role of housing markets in the resettlement process. It is the
housing market, and housing policy, which provides the social and economic terrain on which
the political debate is waged over the costs of climate resettlements.
Beginning with a look at the debate over Bogota Humana’s climate resettlement strategy
brings into view the political nature of what otherwise is apparently just a technical process. This
view reveals this strategy was a central component in the Petro administration’s political project.
Implied in the Petro administration’s development plan was the city should assume
responsibility, and the costs, for climate resettlements. The city would finance the relocation and
increase the housing supply to accommodate those entering the resettlement program. It would
also rewrite zoning code to encourage developers to build in more central areas of the city. Here,
168
developers would have to assume some share of the costs of this project as they would now have
to build more social housing in areas of the city with more expensive land values. Ultimately
political resistance to Petro’s project prevailed as the modification to the city’s POT was
suspended and the administration failed to be re-elected for a second term.
This political and economic frame then reveals what is at stake in the climate resettlement
strategy is the contradiction between the use values of housing the city’s lower social economic
strata, and reducing its exposure to climate risks, and the exchange values of the housing market.
4. Limitations
There are important limitations to this study of Bogota Humana’s climate resettlements. The
main limitations took two forms, limited sample sizes for statistical analyses and the inability to
interview certain political and economic actors who played an important role in the
implementation of the climate resettlement strategy. These limitations were related to the
challenge of accessing certain databases, the challenge of securing sufficient resources to field
the surveys and more generally the challenge of navigating an unfamiliar cultural and
institutional environment.
For example, conducting a household survey in Bogota’s informal settlements with
limited resources forced important compromises in my general research design. Instead of
surveying all of the neighborhoods which had been intervened with resettlements, I selected only
three areas which were actively being resettled. In addition to the limits in the geographic scope
of the survey I decided to leave out renters and survey only property owners. Given these
limitations I adjusted my research design to include a sample of families being resettled and
those who had already been resettled in social housing projects. In this manner I tried capturing a
perspective that provided insight on how families navigated the resettlement process including
169
negotiating the rental market during the transition. Still surveying families in social housing
projects meant leaving out those families who took the city’s compensation offer and found a
permanent solution in the open market. I tried compensating for this by interviewing a smaller
sample of families who had bought used homes with the city’s compensation offer and
interviewing key actors like the leaders of the juntas de accion communal (JAC) and home
sellers in the informal housing market.
Another challenge with the household survey was the cultural and institutional learning
curve. It took several iterations of the survey instrument, with much support from local leaders
and organizers, to format and translate the questions into a vernacular legible to the survey
respondents. In some cases, for example, when it came to questions regarding household
finances I had to learn families are not comfortable discussing these matters especially given the
insecurity found in these neighborhoods. Relatedly, these families regularly interact with a host
of institutional actors in this case not only the city agencies leading the resettlement process but
also law enforcement and social service agencies. These are often strained relationships with a
low level of trust and confidence. Often I had to make sure to clearly identify myself and my
team as an academic project independent of the city for the sake of accessing interviews which
would have otherwise been withheld.
With respect to the modeling of risk zones in chapter three the main limitation was the
challenge in accessing historical and geographical data. Creating the data set from multiple
sources distributed across various city agencies took over a year to complete. Part of the reason
for this had to do with learning of the institutional landscape and determining who held which
individual data sets. The other reason was each city agency or department has a unique process
for handling data requests which can sometimes take months. Eventually I was able to access
170
Bogota’s existing housing and environmental data. However, I encountered a hard limit in that
some of the data, namely building permits, has only been digitized since 2008. This meant I
could not compare a sample of permits issued before the risk zoning was integrated into the POT
in 2004. I therefore had to adjust the statistical analysis. For example, I used the risk zone
variables as controls to measure their effect on the building of new housing during the 2008-
2016 period.
Additionally, some of the data lacked geographic identifiers such as the latitude and
longitude data for building permits and the social housing designation for each project. For this I
had to search for staff at Bogota’s Secretaria de Planeacion who could provide this data after
having made an official data request. For the social housing data, I could not find a set which
distinguished between VIS and VIP social housing. In the analysis then I had to assume, on the
basis of interviews and the housing literature, VIS and VIP are strongly, spatially correlated.
Last, I was not able to interview developers who invest in the social housing projects
built for the resettlement. To gain an understanding of their role in this process I instead had to
relay on Colombian housing experts and academics, representatives from the city agencies who
interacted with developers, and the housing literature.
5. Future research
As climate resettlements are an emerging field of study there are many lines of research to
pursue. Colombia as a regional node for investment by development agencies and for
experimentation in urban planning offers ample room for future research on the topic. Two
promising approaches are comparative projects which consider cases across different political
geographies, and those more focused on the financialization of the strategy which potentially is
the primary mode for the scaling of investments in climate change adaptation.
171
For example, besides Bogota, Medellin has created a risk management system which also
utilizes resettlements. However, the politics of this approach to resettlements are very distinct
from that of the Petro administration’s. Historically, Medellin has been an important center of
conservative politics in Colombia. A comparison between Bogota and Medellin’s approaches to
risk management and climate change adaptation would provide a useful analytical leverage for a
study based in political economy.
At the national level Colombia created the Fondo Adaptacion, a fund which invests in
climate change adaptation projects across the country. One of their macro projects, Proyecto Plan
Jarillon, is currently the largest resettlement project in Latin America. With over 8,000 families
selected for resettlement a major challenge, as in Bogota, is addressing the housing deficit. Not
surprisingly, Fondo Adaptacion’s investment portfolio is heavily focused on the construction of
housing across Colombia. Fondo Adaptacion has drawn interest from the World Bank and other
regional banks. Thus, this case offers the opportunity to study the financialization of climate
change adaptation and consider an economic logic distinct from the one proposed in Bogota
Humana.
To conclude, applying a political and economic frame to climate resettlements can
provide much needed empirical depth and conceptual clarity to this growing field of study. More
than just policy prescriptions, however, the advantage of this approach is the analytical leverage
it provides for bringing into view the entire range of political actors, and their strategies,
involved in the contention over the costs of climate change adaptation for cities. This approach
begins to unravel the technical obscurity imposed by the discourse of resilience. The unjust
political and economic relationships that contribute to geographies of risk also become apparent.
In this way, we position ourselves to better understand not just what cities are doing about
172
climate change but also the individual and collective actors involved in formulating alternative
discourses for climate justice.
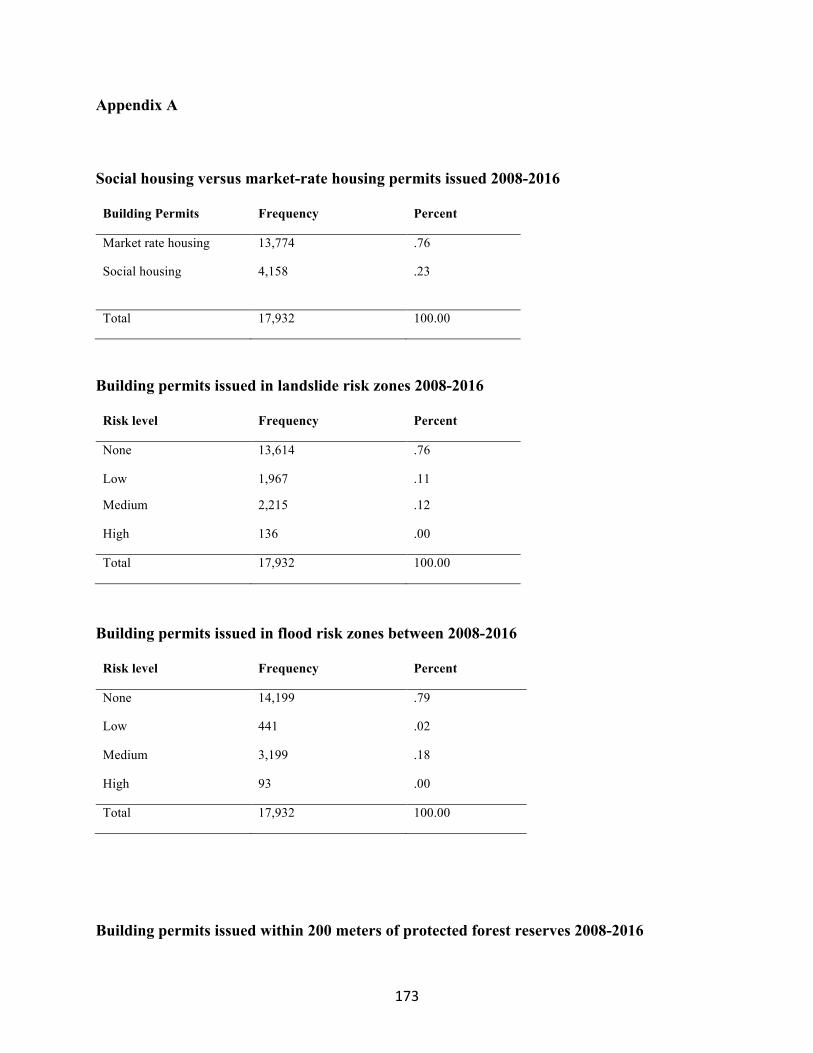
173
Appendix A
Social housing versus market-rate housing permits issued 2008-2016
Building Permits Frequency Percent
Market rate housing 13,774 .76
Social housing 4,158 .23
Total 17,932 100.00
Building permits issued in landslide risk zones 2008-2016
Risk level Frequency Percent
None 13,614 .76
Low 1,967 .11
Medium 2,215 .12
High 136 .00
Total 17,932 100.00
Building permits issued in flood risk zones between 2008-2016
Risk level Frequency Percent
None 14,199 .79
Low 441 .02
Medium 3,199 .18
High 93 .00
Total 17,932 100.00
Building permits issued within 200 meters of protected forest reserves 2008-2016

174
Distance in meters Frequency Percent
200+ 17,491 .98
200 266 .01
100
30
0
143
29
3
.00
.00
.00
Total 17,932 100.00
Building permits issued within 200 meters of rivers, streams and wetlands 2008-2016
Distance Frequency Percent
200+ 13,370 .75
200 2,351 .13
100 1,627 .09
30 568 .03
0 16 .00
Total 17,932 100.00
Pairwise correlation for continuous variables . pwcorr licencia_1 near_dis_1 near_dis_2 cnialtura cbd_dist_1 area_con_1 num_unid_1 averagec_1 averaget_1, sig obs | licenc~1 near_~_1 near_~_2 cnialt~a cbd_di~1 area_c~1 num_un~1 -------------+--------------------------------------------------------------- licencia_1 | 1.0000 | | 17932 | near_dis_1 | 0.0042 1.0000 | 0.5694 | 17932 17932 | near_dis_2 | 0.0385 0.1078 1.0000 | 0.0000 0.0000 | 17932 17932 17932
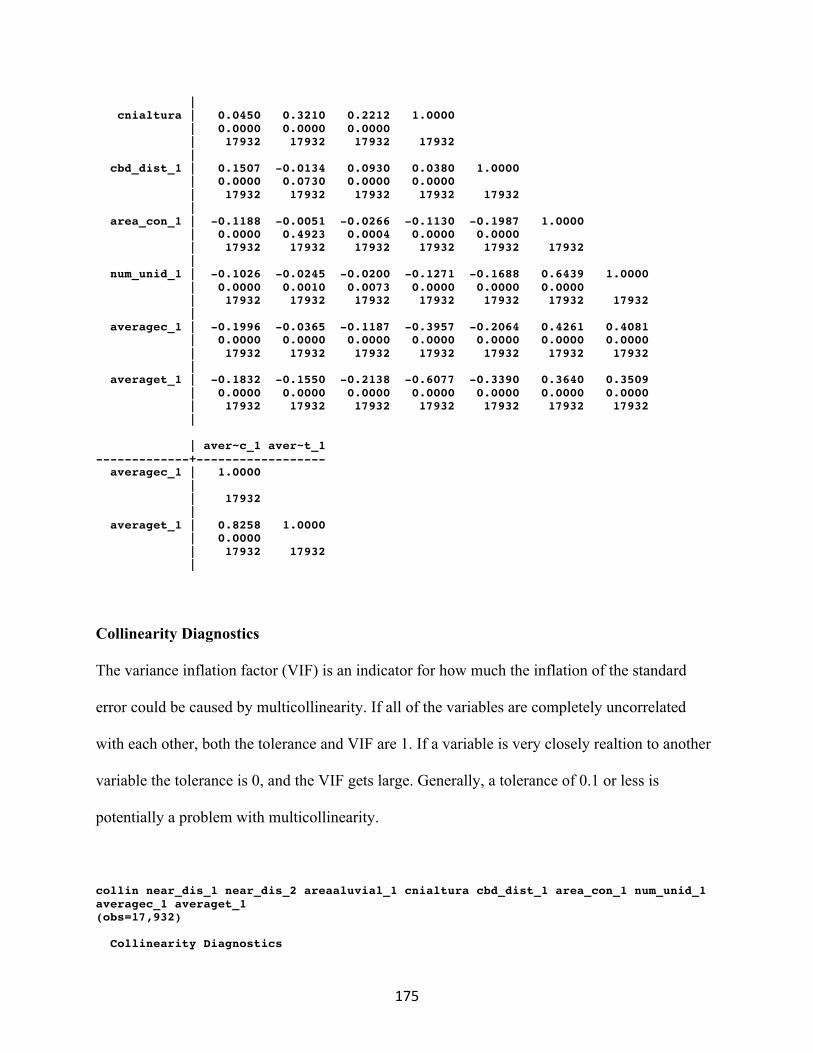
175
| cnialtura | 0.0450 0.3210 0.2212 1.0000 | 0.0000 0.0000 0.0000 | 17932 17932 17932 17932 | cbd_dist_1 | 0.1507 -0.0134 0.0930 0.0380 1.0000 | 0.0000 0.0730 0.0000 0.0000 | 17932 17932 17932 17932 17932 | area_con_1 | -0.1188 -0.0051 -0.0266 -0.1130 -0.1987 1.0000 | 0.0000 0.4923 0.0004 0.0000 0.0000 | 17932 17932 17932 17932 17932 17932 | num_unid_1 | -0.1026 -0.0245 -0.0200 -0.1271 -0.1688 0.6439 1.0000 | 0.0000 0.0010 0.0073 0.0000 0.0000 0.0000 | 17932 17932 17932 17932 17932 17932 17932 | averagec_1 | -0.1996 -0.0365 -0.1187 -0.3957 -0.2064 0.4261 0.4081 | 0.0000 0.0000 0.0000 0.0000 0.0000 0.0000 0.0000 | 17932 17932 17932 17932 17932 17932 17932 | averaget_1 | -0.1832 -0.1550 -0.2138 -0.6077 -0.3390 0.3640 0.3509 | 0.0000 0.0000 0.0000 0.0000 0.0000 0.0000 0.0000 | 17932 17932 17932 17932 17932 17932 17932 | | aver~c_1 aver~t_1 -------------+------------------ averagec_1 | 1.0000 | | 17932 | averaget_1 | 0.8258 1.0000 | 0.0000 | 17932 17932 | Collinearity Diagnostics The variance inflation factor (VIF) is an indicator for how much the inflation of the standard
error could be caused by multicollinearity. If all of the variables are completely uncorrelated
with each other, both the tolerance and VIF are 1. If a variable is very closely realtion to another
variable the tolerance is 0, and the VIF gets large. Generally, a tolerance of 0.1 or less is
potentially a problem with multicollinearity.
collin near_dis_1 near_dis_2 areaaluvial_1 cnialtura cbd_dist_1 area_con_1 num_unid_1 averagec_1 averaget_1 (obs=17,932) Collinearity Diagnostics
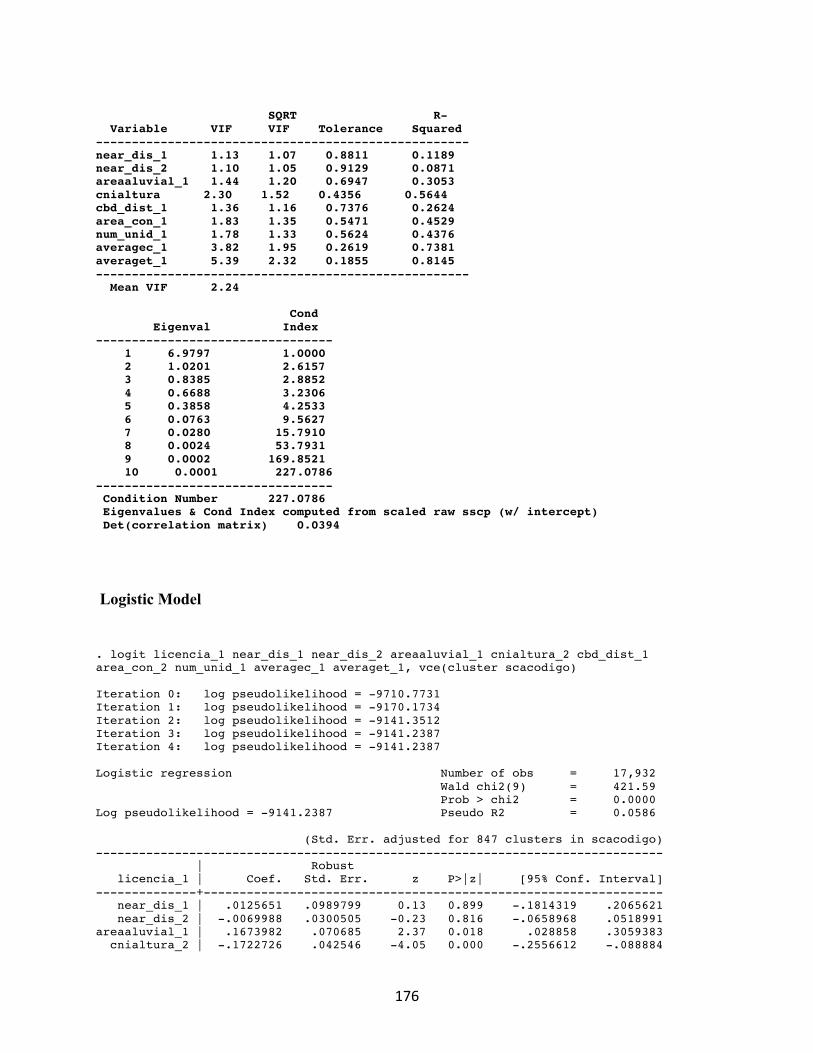
176
SQRT R- Variable VIF VIF Tolerance Squared ---------------------------------------------------- near_dis_1 1.13 1.07 0.8811 0.1189 near_dis_2 1.10 1.05 0.9129 0.0871 areaaluvial_1 1.44 1.20 0.6947 0.3053 cnialtura 2.30 1.52 0.4356 0.5644 cbd_dist_1 1.36 1.16 0.7376 0.2624 area_con_1 1.83 1.35 0.5471 0.4529 num_unid_1 1.78 1.33 0.5624 0.4376 averagec_1 3.82 1.95 0.2619 0.7381 averaget_1 5.39 2.32 0.1855 0.8145 ---------------------------------------------------- Mean VIF 2.24 Cond Eigenval Index --------------------------------- 1 6.9797 1.0000 2 1.0201 2.6157 3 0.8385 2.8852 4 0.6688 3.2306 5 0.3858 4.2533 6 0.0763 9.5627 7 0.0280 15.7910 8 0.0024 53.7931 9 0.0002 169.8521 10 0.0001 227.0786 --------------------------------- Condition Number 227.0786 Eigenvalues & Cond Index computed from scaled raw sscp (w/ intercept) Det(correlation matrix) 0.0394 Logistic Model
. logit licencia_1 near_dis_1 near_dis_2 areaaluvial_1 cnialtura_2 cbd_dist_1 area_con_2 num_unid_1 averagec_1 averaget_1, vce(cluster scacodigo) Iteration 0: log pseudolikelihood = -9710.7731 Iteration 1: log pseudolikelihood = -9170.1734 Iteration 2: log pseudolikelihood = -9141.3512 Iteration 3: log pseudolikelihood = -9141.2387 Iteration 4: log pseudolikelihood = -9141.2387 Logistic regression Number of obs = 17,932 Wald chi2(9) = 421.59 Prob > chi2 = 0.0000 Log pseudolikelihood = -9141.2387 Pseudo R2 = 0.0586 (Std. Err. adjusted for 847 clusters in scacodigo) ------------------------------------------------------------------------------- | Robust licencia_1 | Coef. Std. Err. z P>|z| [95% Conf. Interval] --------------+---------------------------------------------------------------- near_dis_1 | .0125651 .0989799 0.13 0.899 -.1814319 .2065621 near_dis_2 | -.0069988 .0300505 -0.23 0.816 -.0658968 .0518991 areaaluvial_1 | .1673982 .070685 2.37 0.018 .028858 .3059383 cnialtura_2 | -.1722726 .042546 -4.05 0.000 -.2556612 -.088884
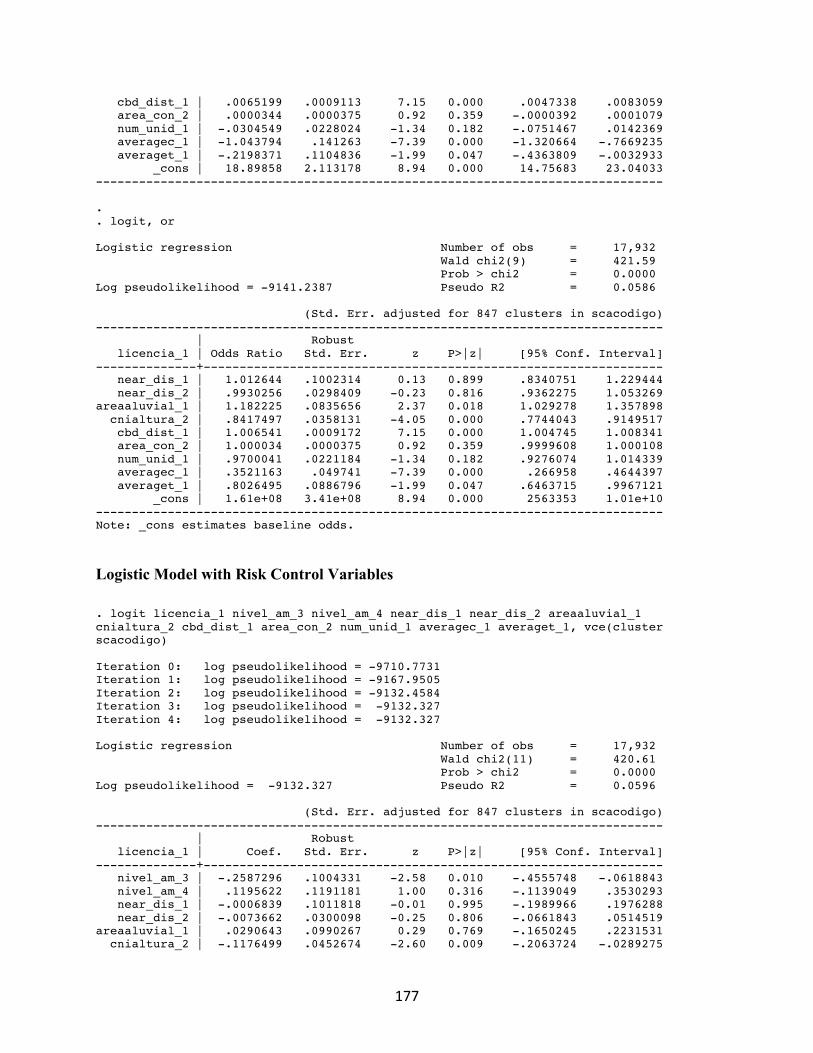
177
cbd_dist_1 | .0065199 .0009113 7.15 0.000 .0047338 .0083059 area_con_2 | .0000344 .0000375 0.92 0.359 -.0000392 .0001079 num_unid_1 | -.0304549 .0228024 -1.34 0.182 -.0751467 .0142369 averagec_1 | -1.043794 .141263 -7.39 0.000 -1.320664 -.7669235 averaget_1 | -.2198371 .1104836 -1.99 0.047 -.4363809 -.0032933 _cons | 18.89858 2.113178 8.94 0.000 14.75683 23.04033 ------------------------------------------------------------------------------- . . logit, or Logistic regression Number of obs = 17,932 Wald chi2(9) = 421.59 Prob > chi2 = 0.0000 Log pseudolikelihood = -9141.2387 Pseudo R2 = 0.0586 (Std. Err. adjusted for 847 clusters in scacodigo) ------------------------------------------------------------------------------- | Robust licencia_1 | Odds Ratio Std. Err. z P>|z| [95% Conf. Interval] --------------+---------------------------------------------------------------- near_dis_1 | 1.012644 .1002314 0.13 0.899 .8340751 1.229444 near_dis_2 | .9930256 .0298409 -0.23 0.816 .9362275 1.053269 areaaluvial_1 | 1.182225 .0835656 2.37 0.018 1.029278 1.357898 cnialtura_2 | .8417497 .0358131 -4.05 0.000 .7744043 .9149517 cbd_dist_1 | 1.006541 .0009172 7.15 0.000 1.004745 1.008341 area_con_2 | 1.000034 .0000375 0.92 0.359 .9999608 1.000108 num_unid_1 | .9700041 .0221184 -1.34 0.182 .9276074 1.014339 averagec_1 | .3521163 .049741 -7.39 0.000 .266958 .4644397 averaget_1 | .8026495 .0886796 -1.99 0.047 .6463715 .9967121 _cons | 1.61e+08 3.41e+08 8.94 0.000 2563353 1.01e+10 ------------------------------------------------------------------------------- Note: _cons estimates baseline odds.
Logistic Model with Risk Control Variables . logit licencia_1 nivel_am_3 nivel_am_4 near_dis_1 near_dis_2 areaaluvial_1 cnialtura_2 cbd_dist_1 area_con_2 num_unid_1 averagec_1 averaget_1, vce(cluster scacodigo) Iteration 0: log pseudolikelihood = -9710.7731 Iteration 1: log pseudolikelihood = -9167.9505 Iteration 2: log pseudolikelihood = -9132.4584 Iteration 3: log pseudolikelihood = -9132.327 Iteration 4: log pseudolikelihood = -9132.327 Logistic regression Number of obs = 17,932 Wald chi2(11) = 420.61 Prob > chi2 = 0.0000 Log pseudolikelihood = -9132.327 Pseudo R2 = 0.0596 (Std. Err. adjusted for 847 clusters in scacodigo) ------------------------------------------------------------------------------- | Robust licencia_1 | Coef. Std. Err. z P>|z| [95% Conf. Interval] --------------+---------------------------------------------------------------- nivel_am_3 | -.2587296 .1004331 -2.58 0.010 -.4555748 -.0618843 nivel_am_4 | .1195622 .1191181 1.00 0.316 -.1139049 .3530293 near_dis_1 | -.0006839 .1011818 -0.01 0.995 -.1989966 .1976288 near_dis_2 | -.0073662 .0300098 -0.25 0.806 -.0661843 .0514519 areaaluvial_1 | .0290643 .0990267 0.29 0.769 -.1650245 .2231531 cnialtura_2 | -.1176499 .0452674 -2.60 0.009 -.2063724 -.0289275
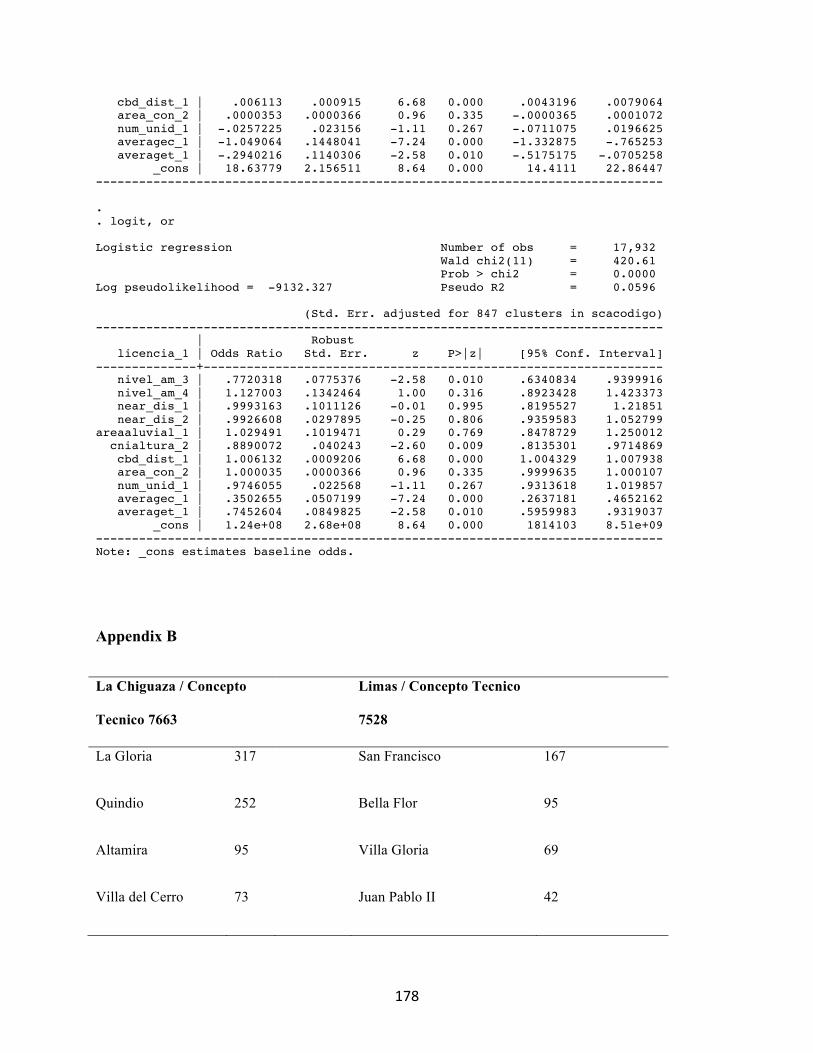
178
cbd_dist_1 | .006113 .000915 6.68 0.000 .0043196 .0079064 area_con_2 | .0000353 .0000366 0.96 0.335 -.0000365 .0001072 num_unid_1 | -.0257225 .023156 -1.11 0.267 -.0711075 .0196625 averagec_1 | -1.049064 .1448041 -7.24 0.000 -1.332875 -.765253 averaget_1 | -.2940216 .1140306 -2.58 0.010 -.5175175 -.0705258 _cons | 18.63779 2.156511 8.64 0.000 14.4111 22.86447 ------------------------------------------------------------------------------- . . logit, or Logistic regression Number of obs = 17,932 Wald chi2(11) = 420.61 Prob > chi2 = 0.0000 Log pseudolikelihood = -9132.327 Pseudo R2 = 0.0596 (Std. Err. adjusted for 847 clusters in scacodigo) ------------------------------------------------------------------------------- | Robust licencia_1 | Odds Ratio Std. Err. z P>|z| [95% Conf. Interval] --------------+---------------------------------------------------------------- nivel_am_3 | .7720318 .0775376 -2.58 0.010 .6340834 .9399916 nivel_am_4 | 1.127003 .1342464 1.00 0.316 .8923428 1.423373 near_dis_1 | .9993163 .1011126 -0.01 0.995 .8195527 1.21851 near_dis_2 | .9926608 .0297895 -0.25 0.806 .9359583 1.052799 areaaluvial_1 | 1.029491 .1019471 0.29 0.769 .8478729 1.250012 cnialtura_2 | .8890072 .040243 -2.60 0.009 .8135301 .9714869 cbd_dist_1 | 1.006132 .0009206 6.68 0.000 1.004329 1.007938 area_con_2 | 1.000035 .0000366 0.96 0.335 .9999635 1.000107 num_unid_1 | .9746055 .022568 -1.11 0.267 .9313618 1.019857 averagec_1 | .3502655 .0507199 -7.24 0.000 .2637181 .4652162 averaget_1 | .7452604 .0849825 -2.58 0.010 .5959983 .9319037 _cons | 1.24e+08 2.68e+08 8.64 0.000 1814103 8.51e+09 ------------------------------------------------------------------------------- Note: _cons estimates baseline odds.
Appendix B
La Chiguaza / Concepto
Tecnico 7663
Limas / Concepto Tecnico
7528
La Gloria 317 San Francisco 167
Quindio 252 Bella Flor 95
Altamira 95 Villa Gloria 69
Villa del Cerro 73 Juan Pablo II 42
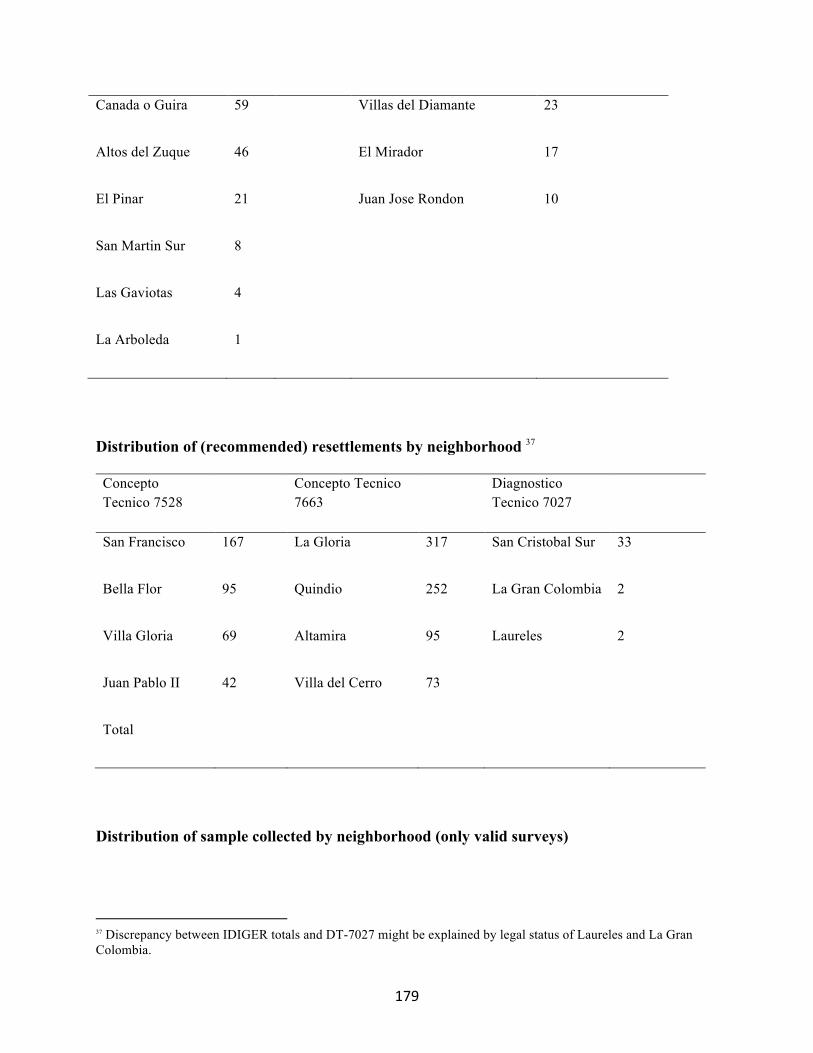
179
Canada o Guira 59 Villas del Diamante 23
Altos del Zuque 46 El Mirador 17
El Pinar 21 Juan Jose Rondon 10
San Martin Sur 8
Las Gaviotas 4
La Arboleda 1
Distribution of (recommended) resettlements by neighborhood 37
Concepto Tecnico 7528
Concepto Tecnico 7663
Diagnostico Tecnico 7027
San Francisco 167 La Gloria 317 San Cristobal Sur 33
Bella Flor 95 Quindio 252 La Gran Colombia 2
Villa Gloria 69 Altamira 95 Laureles 2
Juan Pablo II 42 Villa del Cerro 73
Total
Distribution of sample collected by neighborhood (only valid surveys)
37 Discrepancy between IDIGER totals and DT-7027 might be explained by legal status of Laureles and La Gran Colombia.
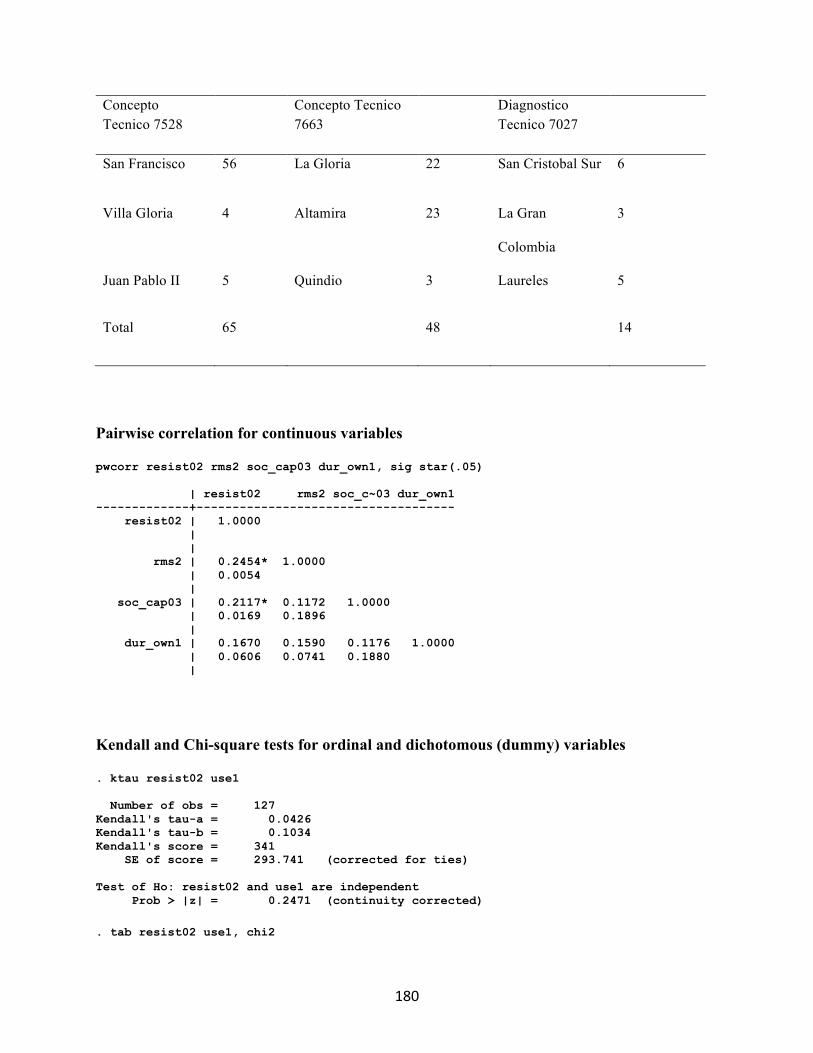
180
Concepto Tecnico 7528
Concepto Tecnico 7663
Diagnostico Tecnico 7027
San Francisco 56 La Gloria 22 San Cristobal Sur 6
Villa Gloria 4 Altamira 23
La Gran
Colombia
3
Juan Pablo II 5 Quindio 3 Laureles 5
Total 65 48 14
Pairwise correlation for continuous variables pwcorr resist02 rms2 soc_cap03 dur_own1, sig star(.05) | resist02 rms2 soc_c~03 dur_own1 -------------+------------------------------------ resist02 | 1.0000 | | rms2 | 0.2454* 1.0000 | 0.0054 | soc_cap03 | 0.2117* 0.1172 1.0000 | 0.0169 0.1896 | dur_own1 | 0.1670 0.1590 0.1176 1.0000 | 0.0606 0.0741 0.1880 |
Kendall and Chi-square tests for ordinal and dichotomous (dummy) variables . ktau resist02 use1 Number of obs = 127 Kendall's tau-a = 0.0426 Kendall's tau-b = 0.1034 Kendall's score = 341 SE of score = 293.741 (corrected for ties) Test of Ho: resist02 and use1 are independent Prob > |z| = 0.2471 (continuity corrected) . tab resist02 use1, chi2
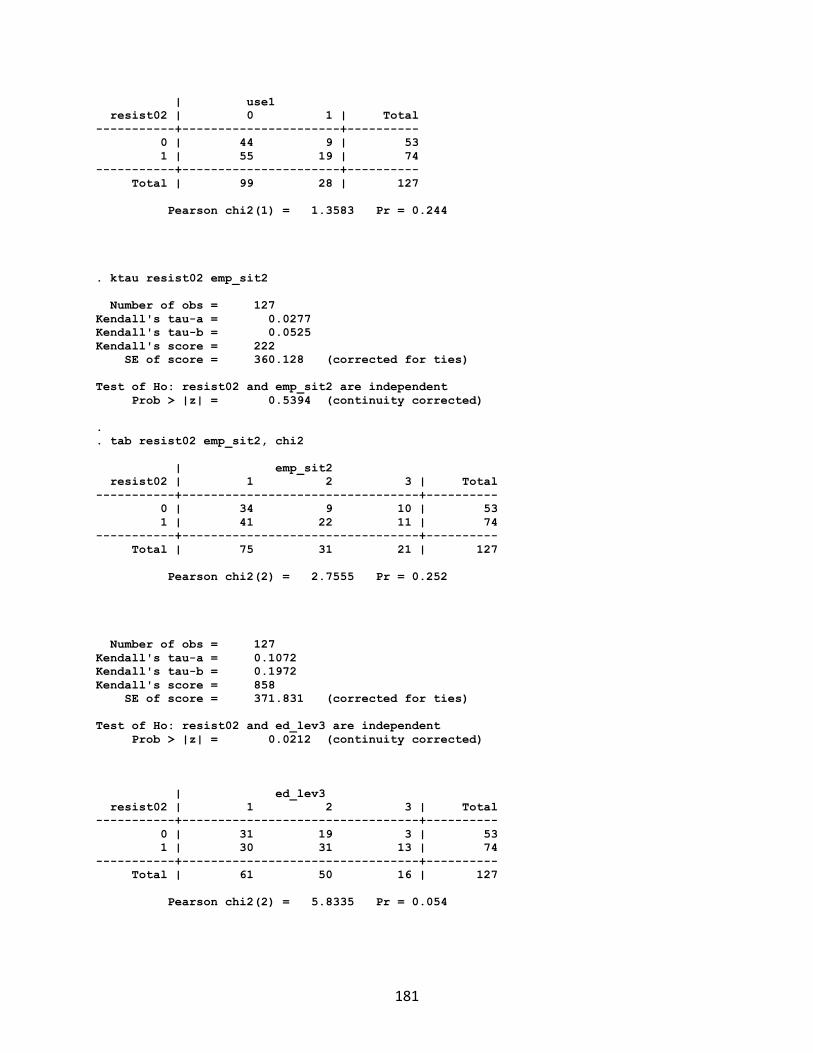
181
| use1 resist02 | 0 1 | Total -----------+----------------------+---------- 0 | 44 9 | 53 1 | 55 19 | 74 -----------+----------------------+---------- Total | 99 28 | 127 Pearson chi2(1) = 1.3583 Pr = 0.244 . ktau resist02 emp_sit2 Number of obs = 127 Kendall's tau-a = 0.0277 Kendall's tau-b = 0.0525 Kendall's score = 222 SE of score = 360.128 (corrected for ties) Test of Ho: resist02 and emp_sit2 are independent Prob > |z| = 0.5394 (continuity corrected) . . tab resist02 emp_sit2, chi2 | emp_sit2 resist02 | 1 2 3 | Total -----------+---------------------------------+---------- 0 | 34 9 10 | 53 1 | 41 22 11 | 74 -----------+---------------------------------+---------- Total | 75 31 21 | 127 Pearson chi2(2) = 2.7555 Pr = 0.252 Number of obs = 127 Kendall's tau-a = 0.1072 Kendall's tau-b = 0.1972 Kendall's score = 858 SE of score = 371.831 (corrected for ties) Test of Ho: resist02 and ed_lev3 are independent Prob > |z| = 0.0212 (continuity corrected) | ed_lev3 resist02 | 1 2 3 | Total -----------+---------------------------------+---------- 0 | 31 19 3 | 53 1 | 30 31 13 | 74 -----------+---------------------------------+---------- Total | 61 50 16 | 127 Pearson chi2(2) = 5.8335 Pr = 0.054
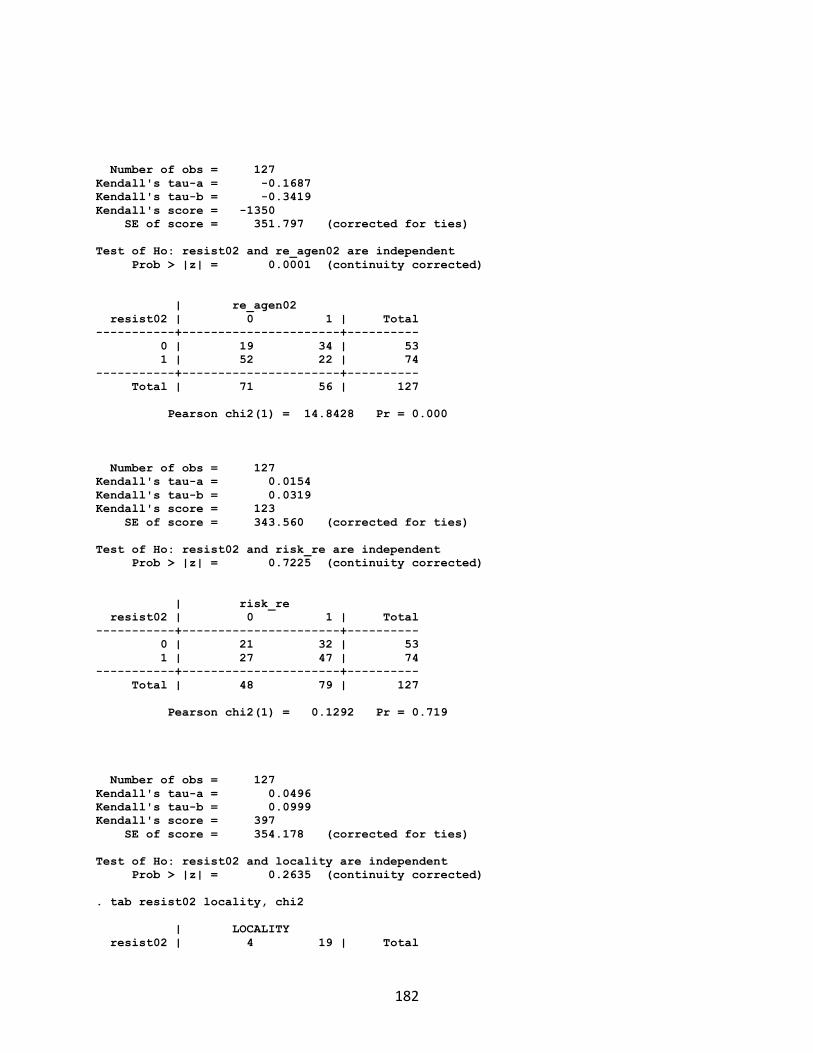
182
Number of obs = 127 Kendall's tau-a = -0.1687 Kendall's tau-b = -0.3419 Kendall's score = -1350 SE of score = 351.797 (corrected for ties) Test of Ho: resist02 and re_agen02 are independent Prob > |z| = 0.0001 (continuity corrected) | re_agen02 resist02 | 0 1 | Total -----------+----------------------+---------- 0 | 19 34 | 53 1 | 52 22 | 74 -----------+----------------------+---------- Total | 71 56 | 127 Pearson chi2(1) = 14.8428 Pr = 0.000 Number of obs = 127 Kendall's tau-a = 0.0154 Kendall's tau-b = 0.0319 Kendall's score = 123 SE of score = 343.560 (corrected for ties) Test of Ho: resist02 and risk_re are independent Prob > |z| = 0.7225 (continuity corrected) | risk_re resist02 | 0 1 | Total -----------+----------------------+---------- 0 | 21 32 | 53 1 | 27 47 | 74 -----------+----------------------+---------- Total | 48 79 | 127 Pearson chi2(1) = 0.1292 Pr = 0.719 Number of obs = 127 Kendall's tau-a = 0.0496 Kendall's tau-b = 0.0999 Kendall's score = 397 SE of score = 354.178 (corrected for ties) Test of Ho: resist02 and locality are independent Prob > |z| = 0.2635 (continuity corrected) . tab resist02 locality, chi2 | LOCALITY resist02 | 4 19 | Total

183
-----------+----------------------+---------- 0 | 29 24 | 53 1 | 33 41 | 74 -----------+----------------------+---------- Total | 62 65 | 127 Pearson chi2(1) = 1.2664 Pr = 0.260 First model . logit resist02 rms2 soc_cap03 emp_sit2 ed_lev3 Iteration 0: log likelihood = -86.285472 Iteration 1: log likelihood = -77.193314 Iteration 2: log likelihood = -77.099994 Iteration 3: log likelihood = -77.09985 Iteration 4: log likelihood = -77.09985 Logistic regression Number of obs = 127 LR chi2(4) = 18.37 Prob > chi2 = 0.0010 Log likelihood = -77.09985 Pseudo R2 = 0.1065 ------------------------------------------------------------------------------ resist02 | Coef. Std. Err. z P>|z| [95% Conf. Interval] -------------+---------------------------------------------------------------- rms2 | .3811251 .168672 2.26 0.024 .050534 .7117162 soc_cap03 | .7612715 .3576163 2.13 0.033 .0603564 1.462187 emp_sit2 | .1986587 .256609 0.77 0.439 -.3042858 .7016032 ed_lev3 | .6658943 .3016586 2.21 0.027 .0746544 1.257134 _cons | -3.404055 1.020324 -3.34 0.001 -5.403854 -1.404257 ------------------------------------------------------------------------------ . . logit, or Logistic regression Number of obs = 127 LR chi2(4) = 18.37 Prob > chi2 = 0.0010 Log likelihood = -77.09985 Pseudo R2 = 0.1065 ------------------------------------------------------------------------------ resist02 | Odds Ratio Std. Err. z P>|z| [95% Conf. Interval] -------------+---------------------------------------------------------------- rms2 | 1.463931 .2469242 2.26 0.024 1.051833 2.037485 soc_cap03 | 2.140997 .7656554 2.13 0.033 1.062215 4.315385 emp_sit2 | 1.219766 .3130029 0.77 0.439 .73765 2.016984 ed_lev3 | 1.94623 .587097 2.21 0.027 1.077512 3.515333 _cons | .0332382 .0339137 -3.34 0.001 .0044992 .2455494 ------------------------------------------------------------------------------ Note: _cons estimates baseline odds.
Second model . . logit resist02 rms2 soc_cap03 dur_own1 use1 emp_sit2 ed_lev3
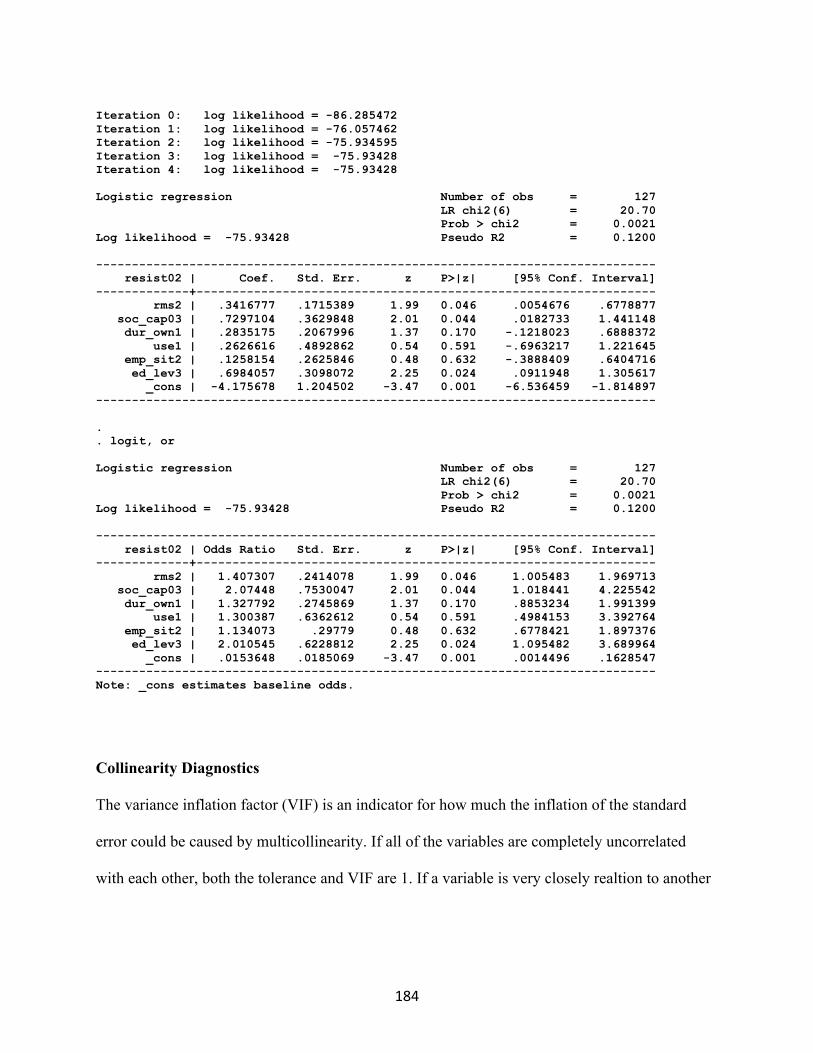
184
Iteration 0: log likelihood = -86.285472 Iteration 1: log likelihood = -76.057462 Iteration 2: log likelihood = -75.934595 Iteration 3: log likelihood = -75.93428 Iteration 4: log likelihood = -75.93428 Logistic regression Number of obs = 127 LR chi2(6) = 20.70 Prob > chi2 = 0.0021 Log likelihood = -75.93428 Pseudo R2 = 0.1200 ------------------------------------------------------------------------------ resist02 | Coef. Std. Err. z P>|z| [95% Conf. Interval] -------------+---------------------------------------------------------------- rms2 | .3416777 .1715389 1.99 0.046 .0054676 .6778877 soc_cap03 | .7297104 .3629848 2.01 0.044 .0182733 1.441148 dur_own1 | .2835175 .2067996 1.37 0.170 -.1218023 .6888372 use1 | .2626616 .4892862 0.54 0.591 -.6963217 1.221645 emp_sit2 | .1258154 .2625846 0.48 0.632 -.3888409 .6404716 ed_lev3 | .6984057 .3098072 2.25 0.024 .0911948 1.305617 _cons | -4.175678 1.204502 -3.47 0.001 -6.536459 -1.814897 ------------------------------------------------------------------------------ . . logit, or Logistic regression Number of obs = 127 LR chi2(6) = 20.70 Prob > chi2 = 0.0021 Log likelihood = -75.93428 Pseudo R2 = 0.1200 ------------------------------------------------------------------------------ resist02 | Odds Ratio Std. Err. z P>|z| [95% Conf. Interval] -------------+---------------------------------------------------------------- rms2 | 1.407307 .2414078 1.99 0.046 1.005483 1.969713 soc_cap03 | 2.07448 .7530047 2.01 0.044 1.018441 4.225542 dur_own1 | 1.327792 .2745869 1.37 0.170 .8853234 1.991399 use1 | 1.300387 .6362612 0.54 0.591 .4984153 3.392764 emp_sit2 | 1.134073 .29779 0.48 0.632 .6778421 1.897376 ed_lev3 | 2.010545 .6228812 2.25 0.024 1.095482 3.689964 _cons | .0153648 .0185069 -3.47 0.001 .0014496 .1628547 ------------------------------------------------------------------------------ Note: _cons estimates baseline odds. Collinearity Diagnostics The variance inflation factor (VIF) is an indicator for how much the inflation of the standard
error could be caused by multicollinearity. If all of the variables are completely uncorrelated
with each other, both the tolerance and VIF are 1. If a variable is very closely realtion to another
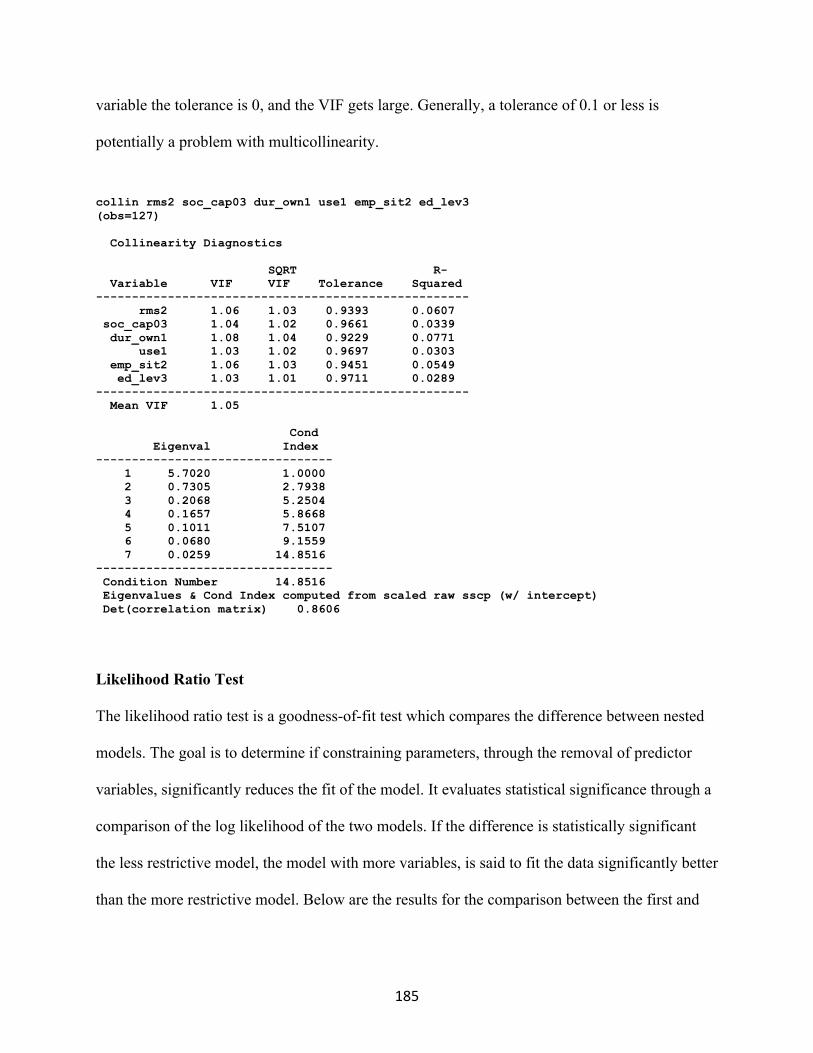
185
variable the tolerance is 0, and the VIF gets large. Generally, a tolerance of 0.1 or less is
potentially a problem with multicollinearity.
collin rms2 soc_cap03 dur_own1 use1 emp_sit2 ed_lev3 (obs=127) Collinearity Diagnostics SQRT R- Variable VIF VIF Tolerance Squared ---------------------------------------------------- rms2 1.06 1.03 0.9393 0.0607 soc_cap03 1.04 1.02 0.9661 0.0339 dur_own1 1.08 1.04 0.9229 0.0771 use1 1.03 1.02 0.9697 0.0303 emp_sit2 1.06 1.03 0.9451 0.0549 ed_lev3 1.03 1.01 0.9711 0.0289 ---------------------------------------------------- Mean VIF 1.05 Cond Eigenval Index --------------------------------- 1 5.7020 1.0000 2 0.7305 2.7938 3 0.2068 5.2504 4 0.1657 5.8668 5 0.1011 7.5107 6 0.0680 9.1559 7 0.0259 14.8516 --------------------------------- Condition Number 14.8516 Eigenvalues & Cond Index computed from scaled raw sscp (w/ intercept) Det(correlation matrix) 0.8606
Likelihood Ratio Test The likelihood ratio test is a goodness-of-fit test which compares the difference between nested
models. The goal is to determine if constraining parameters, through the removal of predictor
variables, significantly reduces the fit of the model. It evaluates statistical significance through a
comparison of the log likelihood of the two models. If the difference is statistically significant
the less restrictive model, the model with more variables, is said to fit the data significantly better
than the more restrictive model. Below are the results for the comparison between the first and
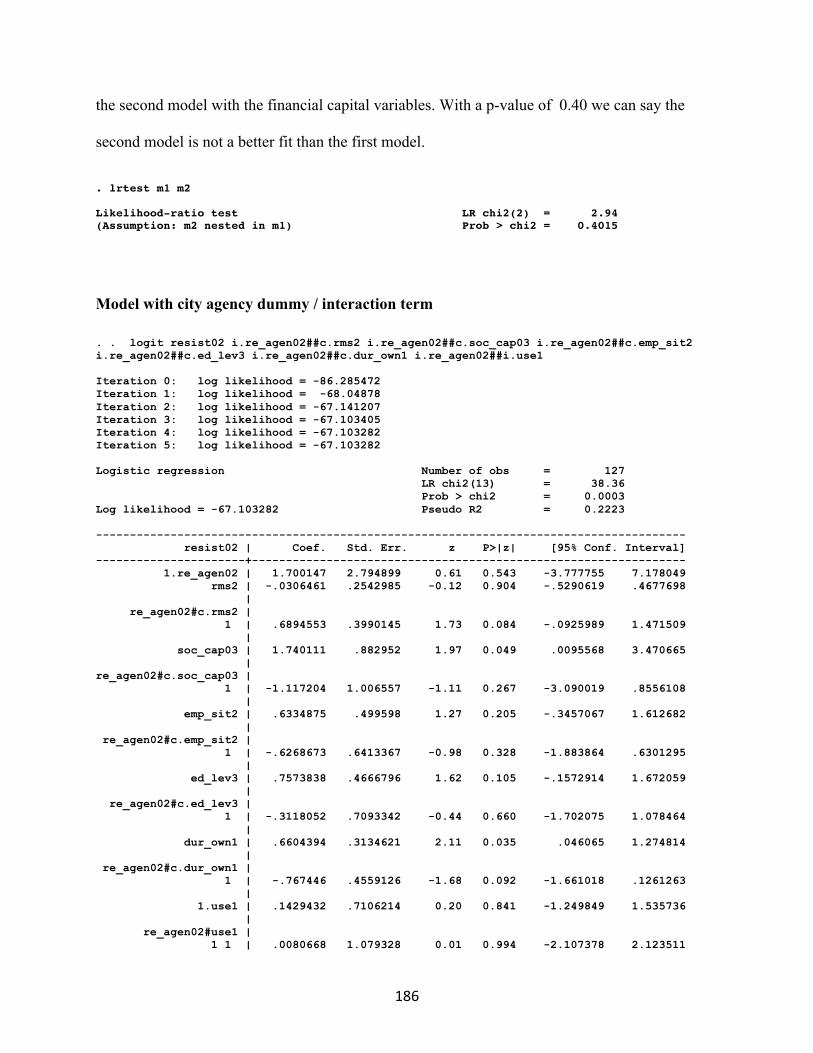
186
the second model with the financial capital variables. With a p-value of 0.40 we can say the
second model is not a better fit than the first model.
. lrtest m1 m2 Likelihood-ratio test LR chi2(2) = 2.94 (Assumption: m2 nested in m1) Prob > chi2 = 0.4015
Model with city agency dummy / interaction term . . logit resist02 i.re_agen02##c.rms2 i.re_agen02##c.soc_cap03 i.re_agen02##c.emp_sit2 i.re_agen02##c.ed_lev3 i.re_agen02##c.dur_own1 i.re_agen02##i.use1 Iteration 0: log likelihood = -86.285472 Iteration 1: log likelihood = -68.04878 Iteration 2: log likelihood = -67.141207 Iteration 3: log likelihood = -67.103405 Iteration 4: log likelihood = -67.103282 Iteration 5: log likelihood = -67.103282 Logistic regression Number of obs = 127 LR chi2(13) = 38.36 Prob > chi2 = 0.0003 Log likelihood = -67.103282 Pseudo R2 = 0.2223 --------------------------------------------------------------------------------------- resist02 | Coef. Std. Err. z P>|z| [95% Conf. Interval] ----------------------+---------------------------------------------------------------- 1.re_agen02 | 1.700147 2.794899 0.61 0.543 -3.777755 7.178049 rms2 | -.0306461 .2542985 -0.12 0.904 -.5290619 .4677698 | re_agen02#c.rms2 | 1 | .6894553 .3990145 1.73 0.084 -.0925989 1.471509 | soc_cap03 | 1.740111 .882952 1.97 0.049 .0095568 3.470665 | re_agen02#c.soc_cap03 | 1 | -1.117204 1.006557 -1.11 0.267 -3.090019 .8556108 | emp_sit2 | .6334875 .499598 1.27 0.205 -.3457067 1.612682 | re_agen02#c.emp_sit2 | 1 | -.6268673 .6413367 -0.98 0.328 -1.883864 .6301295 | ed_lev3 | .7573838 .4666796 1.62 0.105 -.1572914 1.672059 | re_agen02#c.ed_lev3 | 1 | -.3118052 .7093342 -0.44 0.660 -1.702075 1.078464 | dur_own1 | .6604394 .3134621 2.11 0.035 .046065 1.274814 | re_agen02#c.dur_own1 | 1 | -.767446 .4559126 -1.68 0.092 -1.661018 .1261263 | 1.use1 | .1429432 .7106214 0.20 0.841 -1.249849 1.535736 | re_agen02#use1 | 1 1 | .0080668 1.079328 0.01 0.994 -2.107378 2.123511
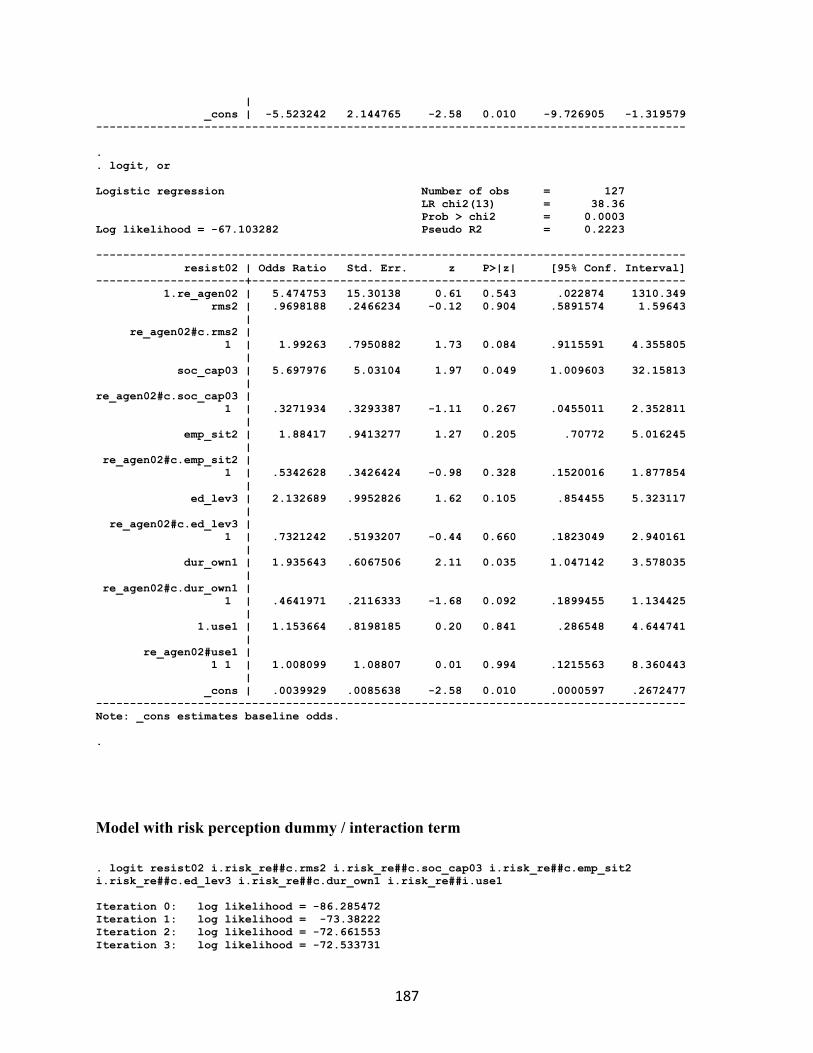
187
| _cons | -5.523242 2.144765 -2.58 0.010 -9.726905 -1.319579 --------------------------------------------------------------------------------------- . . logit, or Logistic regression Number of obs = 127 LR chi2(13) = 38.36 Prob > chi2 = 0.0003 Log likelihood = -67.103282 Pseudo R2 = 0.2223 --------------------------------------------------------------------------------------- resist02 | Odds Ratio Std. Err. z P>|z| [95% Conf. Interval] ----------------------+---------------------------------------------------------------- 1.re_agen02 | 5.474753 15.30138 0.61 0.543 .022874 1310.349 rms2 | .9698188 .2466234 -0.12 0.904 .5891574 1.59643 | re_agen02#c.rms2 | 1 | 1.99263 .7950882 1.73 0.084 .9115591 4.355805 | soc_cap03 | 5.697976 5.03104 1.97 0.049 1.009603 32.15813 | re_agen02#c.soc_cap03 | 1 | .3271934 .3293387 -1.11 0.267 .0455011 2.352811 | emp_sit2 | 1.88417 .9413277 1.27 0.205 .70772 5.016245 | re_agen02#c.emp_sit2 | 1 | .5342628 .3426424 -0.98 0.328 .1520016 1.877854 | ed_lev3 | 2.132689 .9952826 1.62 0.105 .854455 5.323117 | re_agen02#c.ed_lev3 | 1 | .7321242 .5193207 -0.44 0.660 .1823049 2.940161 | dur_own1 | 1.935643 .6067506 2.11 0.035 1.047142 3.578035 | re_agen02#c.dur_own1 | 1 | .4641971 .2116333 -1.68 0.092 .1899455 1.134425 | 1.use1 | 1.153664 .8198185 0.20 0.841 .286548 4.644741 | re_agen02#use1 | 1 1 | 1.008099 1.08807 0.01 0.994 .1215563 8.360443 | _cons | .0039929 .0085638 -2.58 0.010 .0000597 .2672477 --------------------------------------------------------------------------------------- Note: _cons estimates baseline odds. .
Model with risk perception dummy / interaction term . logit resist02 i.risk_re##c.rms2 i.risk_re##c.soc_cap03 i.risk_re##c.emp_sit2 i.risk_re##c.ed_lev3 i.risk_re##c.dur_own1 i.risk_re##i.use1 Iteration 0: log likelihood = -86.285472 Iteration 1: log likelihood = -73.38222 Iteration 2: log likelihood = -72.661553 Iteration 3: log likelihood = -72.533731

188
Iteration 4: log likelihood = -72.509204 Iteration 5: log likelihood = -72.504255 Iteration 6: log likelihood = -72.50313 Iteration 7: log likelihood = -72.502849 Iteration 8: log likelihood = -72.502795 Iteration 9: log likelihood = -72.502786 Iteration 10: log likelihood = -72.502784 Logistic regression Number of obs = 127 LR chi2(13) = 27.57 Prob > chi2 = 0.0104 Log likelihood = -72.502784 Pseudo R2 = 0.1597 ------------------------------------------------------------------------------------- resist02 | Coef. Std. Err. z P>|z| [95% Conf. Interval] --------------------+---------------------------------------------------------------- 1.risk_re | 15.14272 1663.364 0.01 0.993 -3244.991 3275.276 rms2 | .2342963 .2772221 0.85 0.398 -.309049 .7776416 | risk_re#c.rms2 | 1 | .1288634 .3659245 0.35 0.725 -.5883354 .8460623 | soc_cap03 | 17.08999 1663.362 0.01 0.992 -3243.039 3277.219 | risk_re#c.soc_cap03 | 1 | -16.49893 1663.362 -0.01 0.992 -3276.628 3243.63 | emp_sit2 | -.0891792 .4922335 -0.18 0.856 -1.053939 .8755806 | risk_re#c.emp_sit2 | 1 | .3822205 .595102 0.64 0.521 -.784158 1.548599 | ed_lev3 | .6458147 .5095084 1.27 0.205 -.3528034 1.644433 | risk_re#c.ed_lev3 | 1 | .2688859 .6737316 0.40 0.690 -1.051604 1.589376 | dur_own1 | .3135892 .2936732 1.07 0.286 -.2619997 .8891781 | risk_re#c.dur_own1 | 1 | -.0620332 .4480137 -0.14 0.890 -.9401238 .8160575 | 1.use1 | -1.063839 1.017595 -1.05 0.296 -3.058288 .9306103 | risk_re#use1 | 1 1 | 1.743604 1.202095 1.45 0.147 -.6124587 4.099666 | _cons | -19.77214 1663.363 -0.01 0.991 -3279.904 3240.36 ------------------------------------------------------------------------------------- Note: 0 failures and 1 success completely determined. . . . logit, or Logistic regression Number of obs = 127 LR chi2(13) = 27.57 Prob > chi2 = 0.0104 Log likelihood = -72.502784 Pseudo R2 = 0.1597 ------------------------------------------------------------------------------------- resist02 | Odds Ratio Std. Err. z P>|z| [95% Conf. Interval] --------------------+---------------------------------------------------------------- 1.risk_re | 3770490 6.27e+09 0.01 0.993 0 . rms2 | 1.264019 .350414 0.85 0.398 .7341448 2.176334 | risk_re#c.rms2 |
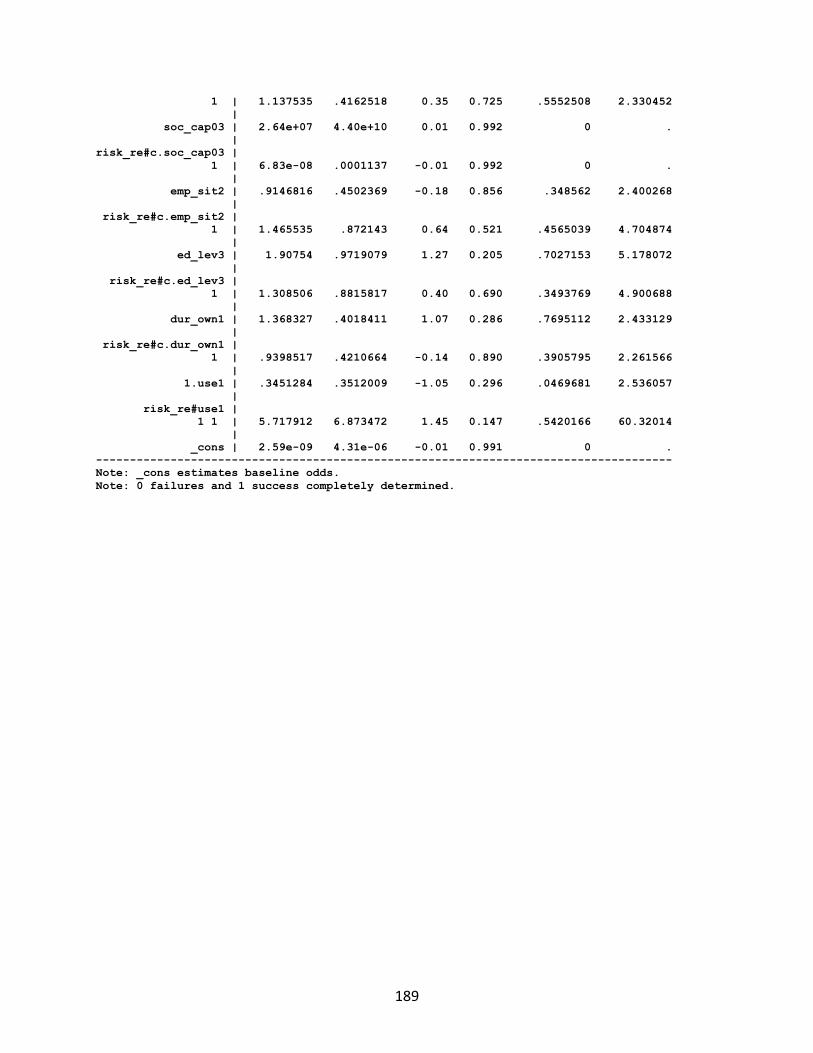
189
1 | 1.137535 .4162518 0.35 0.725 .5552508 2.330452 | soc_cap03 | 2.64e+07 4.40e+10 0.01 0.992 0 . | risk_re#c.soc_cap03 | 1 | 6.83e-08 .0001137 -0.01 0.992 0 . | emp_sit2 | .9146816 .4502369 -0.18 0.856 .348562 2.400268 | risk_re#c.emp_sit2 | 1 | 1.465535 .872143 0.64 0.521 .4565039 4.704874 | ed_lev3 | 1.90754 .9719079 1.27 0.205 .7027153 5.178072 | risk_re#c.ed_lev3 | 1 | 1.308506 .8815817 0.40 0.690 .3493769 4.900688 | dur_own1 | 1.368327 .4018411 1.07 0.286 .7695112 2.433129 | risk_re#c.dur_own1 | 1 | .9398517 .4210664 -0.14 0.890 .3905795 2.261566 | 1.use1 | .3451284 .3512009 -1.05 0.296 .0469681 2.536057 | risk_re#use1 | 1 1 | 5.717912 6.873472 1.45 0.147 .5420166 60.32014 | _cons | 2.59e-09 4.31e-06 -0.01 0.991 0 . ------------------------------------------------------------------------------------- Note: _cons estimates baseline odds. Note: 0 failures and 1 success completely determined.
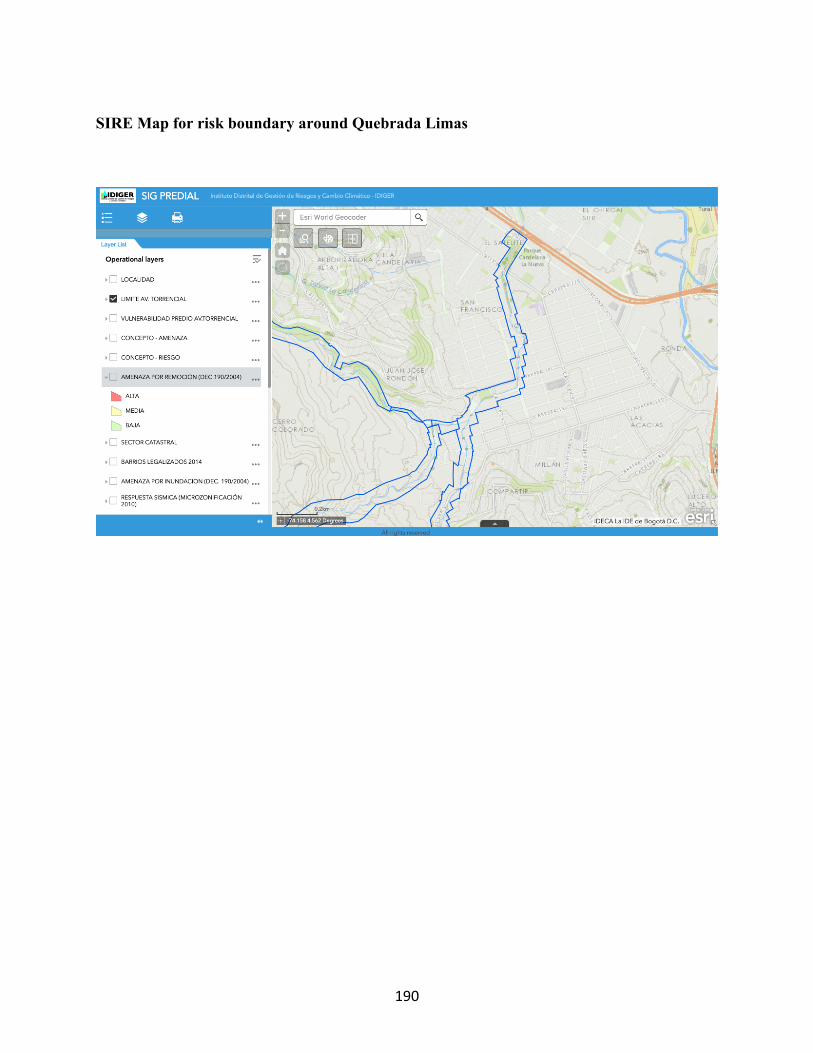
190
SIRE Map for risk boundary around Quebrada Limas
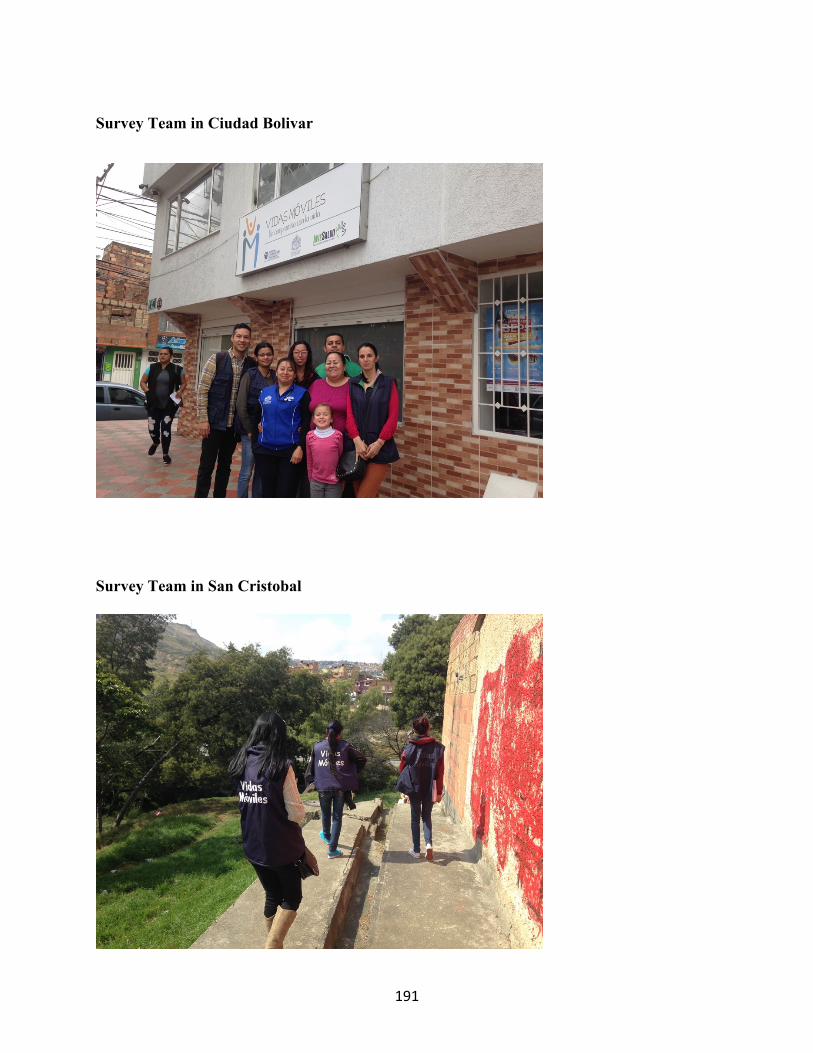
191
Survey Team in Ciudad Bolivar
Survey Team in San Cristobal
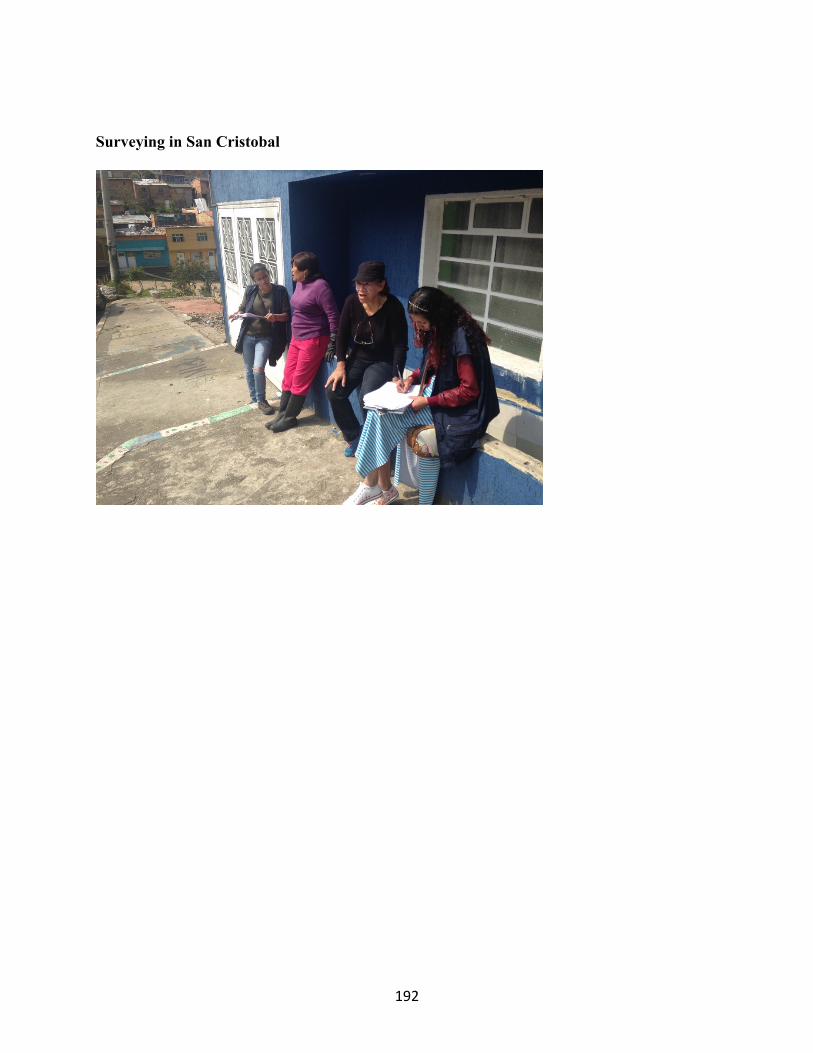
192
Surveying in San Cristobal
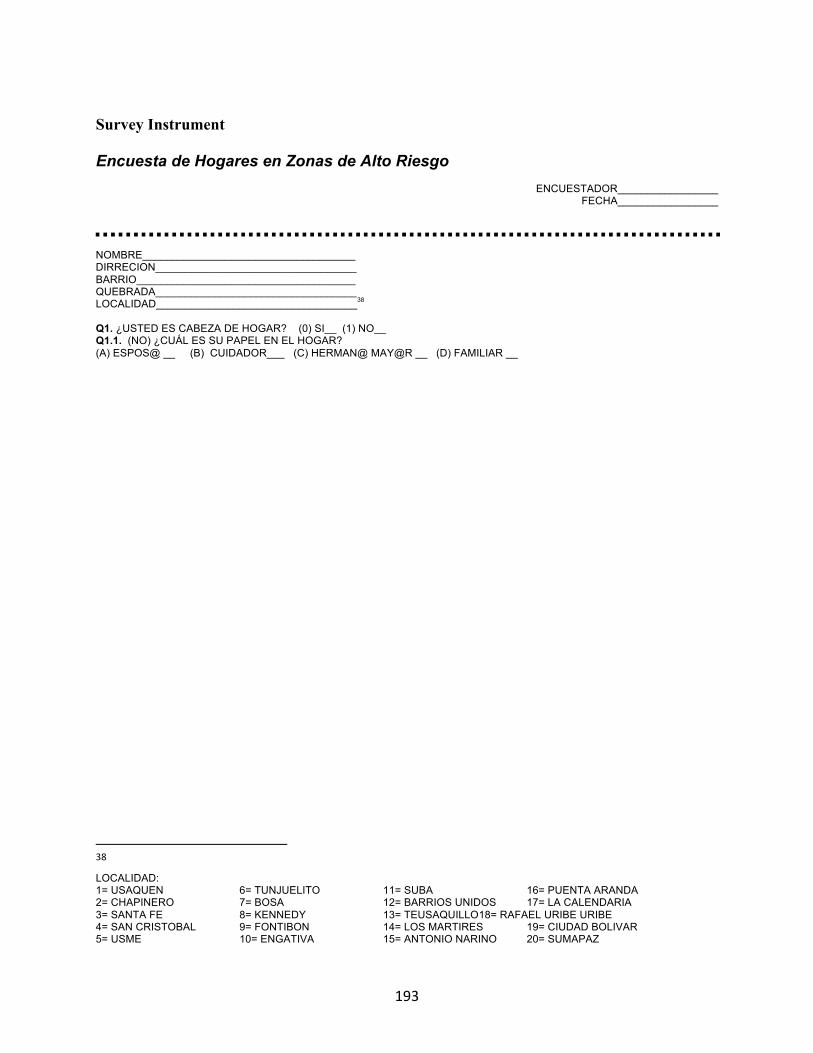
193
Survey Instrument Encuesta de Hogares en Zonas de Alto Riesgo
ENCUESTADOR_________________
FECHA_________________ NOMBRE____________________________________ DIRRECION__________________________________ BARRIO_____________________________________ QUEBRADA__________________________________ LOCALIDAD__________________________________38 Q1. ¿USTED ES CABEZA DE HOGAR? (0) SI__ (1) NO__ Q1.1. (NO) ¿CUÁL ES SU PAPEL EN EL HOGAR? (A) ESPOS@ __ (B) CUIDADOR___ (C) HERMAN@ MAY@R __ (D) FAMILIAR __
38LOCALIDAD: 1= USAQUEN 6= TUNJUELITO 11= SUBA 16= PUENTA ARANDA 2= CHAPINERO 7= BOSA 12= BARRIOS UNIDOS 17= LA CALENDARIA 3= SANTA FE 8= KENNEDY 13= TEUSAQUILLO 18= RAFAEL URIBE URIBE 4= SAN CRISTOBAL 9= FONTIBON 14= LOS MARTIRES 19= CIUDAD BOLIVAR 5= USME 10= ENGATIVA 15= ANTONIO NARINO 20= SUMAPAZ
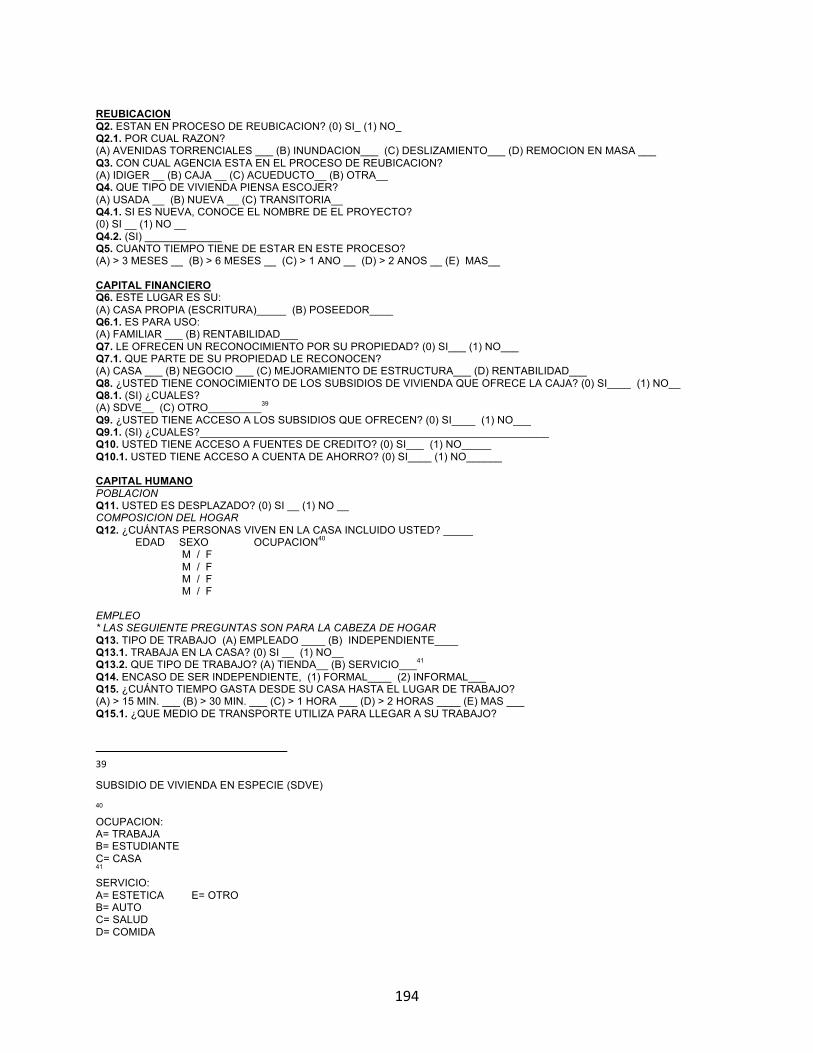
194
REUBICACION Q2. ESTAN EN PROCESO DE REUBICACION? (0) SI_ (1) NO_ Q2.1. POR CUAL RAZON? (A) AVENIDAS TORRENCIALES ___ (B) INUNDACION___ (C) DESLIZAMIENTO___ (D) REMOCION EN MASA ___ Q3. CON CUAL AGENCIA ESTA EN EL PROCESO DE REUBICACION? (A) IDIGER __ (B) CAJA __ (C) ACUEDUCTO__ (B) OTRA__ Q4. QUE TIPO DE VIVIENDA PIENSA ESCOJER? (A) USADA __ (B) NUEVA __ (C) TRANSITORIA__ Q4.1. SI ES NUEVA, CONOCE EL NOMBRE DE EL PROYECTO? (0) SI __ (1) NO __ Q4.2. (SI) _____________ Q5. CUANTO TIEMPO TIENE DE ESTAR EN ESTE PROCESO? (A) > 3 MESES __ (B) > 6 MESES __ (C) > 1 ANO __ (D) > 2 ANOS __ (E) MAS__ CAPITAL FINANCIERO Q6. ESTE LUGAR ES SU: (A) CASA PROPIA (ESCRITURA)_____ (B) POSEEDOR____ Q6.1. ES PARA USO: (A) FAMILIAR ___ (B) RENTABILIDAD___ Q7. LE OFRECEN UN RECONOCIMIENTO POR SU PROPIEDAD? (0) SI___ (1) NO___ Q7.1. QUE PARTE DE SU PROPIEDAD LE RECONOCEN? (A) CASA ___ (B) NEGOCIO ___ (C) MEJORAMIENTO DE ESTRUCTURA___ (D) RENTABILIDAD___ Q8. ¿USTED TIENE CONOCIMIENTO DE LOS SUBSIDIOS DE VIVIENDA QUE OFRECE LA CAJA? (0) SI____ (1) NO__ Q8.1. (SI) ¿CUALES? (A) SDVE__ (C) OTRO_________39 Q9. ¿USTED TIENE ACCESO A LOS SUBSIDIOS QUE OFRECEN? (0) SI____ (1) NO___ Q9.1. (SI) ¿CUALES?___________________________________________________________ Q10. USTED TIENE ACCESO A FUENTES DE CREDITO? (0) SI___ (1) NO_____ Q10.1. USTED TIENE ACCESO A CUENTA DE AHORRO? (0) SI____ (1) NO______ CAPITAL HUMANO POBLACION Q11. USTED ES DESPLAZADO? (0) SI __ (1) NO __ COMPOSICION DEL HOGAR Q12. ¿CUÁNTAS PERSONAS VIVEN EN LA CASA INCLUIDO USTED? _____
EDAD SEXO OCUPACION40 M / F M / F M / F M / F
EMPLEO * LAS SEGUIENTE PREGUNTAS SON PARA LA CABEZA DE HOGAR Q13. TIPO DE TRABAJO (A) EMPLEADO ____ (B) INDEPENDIENTE____ Q13.1. TRABAJA EN LA CASA? (0) SI __ (1) NO__ Q13.2. QUE TIPO DE TRABAJO? (A) TIENDA__ (B) SERVICIO___41 Q14. ENCASO DE SER INDEPENDIENTE, (1) FORMAL____ (2) INFORMAL___ Q15. ¿CUÁNTO TIEMPO GASTA DESDE SU CASA HASTA EL LUGAR DE TRABAJO? (A) > 15 MIN. ___ (B) > 30 MIN. ___ (C) > 1 HORA ___ (D) > 2 HORAS ____ (E) MAS ___ Q15.1. ¿QUE MEDIO DE TRANSPORTE UTILIZA PARA LLEGAR A SU TRABAJO?
39SUBSIDIO DE VIVIENDA EN ESPECIE (SDVE) 40 OCUPACION: A= TRABAJA B= ESTUDIANTE C= CASA 41 SERVICIO: A= ESTETICA E= OTRO B= AUTO C= SALUD D= COMIDA
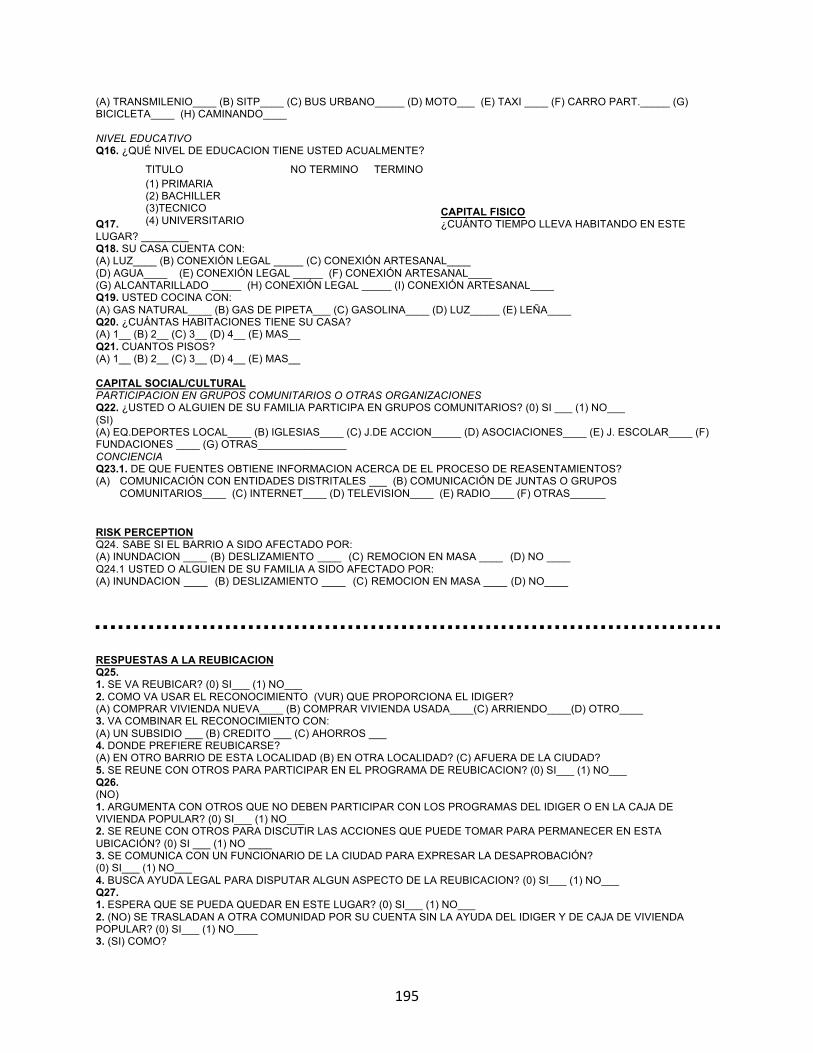
195
(A) TRANSMILENIO____ (B) SITP____ (C) BUS URBANO_____ (D) MOTO___ (E) TAXI ____ (F) CARRO PART._____ (G) BICICLETA____ (H) CAMINANDO____ NIVEL EDUCATIVO Q16. ¿QUÉ NIVEL DE EDUCACION TIENE USTED ACUALMENTE?
CAPITAL FISICO Q17. ¿CUÁNTO TIEMPO LLEVA HABITANDO EN ESTE LUGAR? ________ Q18. SU CASA CUENTA CON: (A) LUZ____ (B) CONEXIÓN LEGAL _____ (C) CONEXIÓN ARTESANAL____ (D) AGUA____ (E) CONEXIÓN LEGAL _____ (F) CONEXIÓN ARTESANAL____ (G) ALCANTARILLADO _____ (H) CONEXIÓN LEGAL _____ (I) CONEXIÓN ARTESANAL____ Q19. USTED COCINA CON: (A) GAS NATURAL____ (B) GAS DE PIPETA___ (C) GASOLINA____ (D) LUZ_____ (E) LEÑA____ Q20. ¿CUÁNTAS HABITACIONES TIENE SU CASA? (A) 1__ (B) 2__ (C) 3__ (D) 4__ (E) MAS__ Q21. CUANTOS PISOS? (A) 1__ (B) 2__ (C) 3__ (D) 4__ (E) MAS__ CAPITAL SOCIAL/CULTURAL PARTICIPACION EN GRUPOS COMUNITARIOS O OTRAS ORGANIZACIONES Q22. ¿USTED O ALGUIEN DE SU FAMILIA PARTICIPA EN GRUPOS COMUNITARIOS? (0) SI ___ (1) NO___ (SI) (A) EQ.DEPORTES LOCAL____ (B) IGLESIAS____ (C) J.DE ACCION_____ (D) ASOCIACIONES____ (E) J. ESCOLAR____ (F) FUNDACIONES ____ (G) OTRAS_______________ CONCIENCIA Q23.1. DE QUE FUENTES OBTIENE INFORMACION ACERCA DE EL PROCESO DE REASENTAMIENTOS? (A) COMUNICACIÓN CON ENTIDADES DISTRITALES ___ (B) COMUNICACIÓN DE JUNTAS O GRUPOS
COMUNITARIOS____ (C) INTERNET____ (D) TELEVISION____ (E) RADIO____ (F) OTRAS______
RISK PERCEPTION Q24.SABE SI EL BARRIO A SIDO AFECTADO POR: (A) INUNDACION ____(B)DESLIZAMIENTO____(C)REMOCION EN MASA ____(D) NO ____ Q24.1USTED O ALGUIEN DE SU FAMILIA A SIDO AFECTADO POR: (A) INUNDACION____(B)DESLIZAMIENTO____(C)REMOCION EN MASA ____(D) NO____ RESPUESTAS A LA REUBICACION Q25. 1. SE VA REUBICAR? (0) SI___ (1) NO___ 2. COMO VA USAR EL RECONOCIMIENTO (VUR) QUE PROPORCIONA EL IDIGER? (A) COMPRAR VIVIENDA NUEVA____ (B) COMPRAR VIVIENDA USADA____(C) ARRIENDO____(D) OTRO____ 3. VA COMBINAR EL RECONOCIMIENTO CON: (A) UN SUBSIDIO ___ (B) CREDITO ___ (C) AHORROS ___ 4. DONDE PREFIERE REUBICARSE? (A) EN OTRO BARRIO DE ESTA LOCALIDAD (B) EN OTRA LOCALIDAD? (C) AFUERA DE LA CIUDAD? 5. SE REUNE CON OTROS PARA PARTICIPAR EN EL PROGRAMA DE REUBICACION? (0) SI___ (1) NO___ Q26. (NO) 1. ARGUMENTA CON OTROS QUE NO DEBEN PARTICIPAR CON LOS PROGRAMAS DEL IDIGER O EN LA CAJA DE VIVIENDA POPULAR? (0) SI___ (1) NO___ 2. SE REUNE CON OTROS PARA DISCUTIR LAS ACCIONES QUE PUEDE TOMAR PARA PERMANECER EN ESTA UBICACIÓN? (0) SI ___ (1) NO ____ 3. SE COMUNICA CON UN FUNCIONARIO DE LA CIUDAD PARA EXPRESAR LA DESAPROBACIÓN? (0) SI___ (1) NO___ 4. BUSCA AYUDA LEGAL PARA DISPUTAR ALGUN ASPECTO DE LA REUBICACION? (0) SI___ (1) NO___ Q27. 1. ESPERA QUE SE PUEDA QUEDAR EN ESTE LUGAR? (0) SI___ (1) NO___ 2. (NO) SE TRASLADAN A OTRA COMUNIDAD POR SU CUENTA SIN LA AYUDA DEL IDIGER Y DE CAJA DE VIVIENDA POPULAR? (0) SI___ (1) NO____ 3. (SI) COMO?
TITULO NO TERMINO TERMINO (1) PRIMARIA (2) BACHILLER (3)TECNICO (4) UNIVERSITARIO

196
(A) CUENTA DE AHORRO ____ (B) CREDITO ____ (C) AYUDA FINANCIERA DE FAMILIA / AMIGOS / VECINOS____ (D) GRUPO COMUNITARIO_____ (E) OTRO ________
FIN DE ENCUESTA
197
References
Acey, Charisma. (2009). Exit, Voice, Loyalty and Structural Silence: Citizen-Consumer Access
and Behavior in Nigeria’s Urban Water Markets. (Doctoral dissertation).
Adger, W. N. (2005). Social-Ecological Resilience to Coastal Disasters. Science, 309(5737),
1036–1039. https://doi.org/10.1126/science.1112122.
Alcaldia Mayor de Bogota, D.C. – Secretaria del Habitat. (2014). El deficit habitacional en
Bogota D.C. 2014: Evolucion y analisis socioeconomico de los hogares. Bogota
Humana.
Alcaldia Mayor de Bogota, D.C. (2012). Por el cual se adopta el plan de desarollo economico,
social, ambiental y de obras publicas para Bogota, D.C. 2012-2016, Bogota Humana.
Acuerdo numero 489 de 12 junio de 2012. El Concejo de Bogota, D.C.
Anselin, Luc. "Local Indicators of Spatial Association—LISA," Geographical Analysis 27(2):
93–115, 1995.
Agresti, A. (2002). Categorical data analysis (2nd ed). New York: Wiley-Interscience.
Ayers, Jessica & Forsyth, Tim. (2009). Community based adaptation to climate change.
Environment: Science and Policy for Sustainable Development, 51 (4).
Barnett, Jon & Webber, Michael. (2010). Accommodating Migration to Promote Adaptation to
Climate Change. Policy Research Working Paper 5270. Background Paper to the 2010
World Development Report 2010: Development in a Changing Climate. The World Bank
Development Economics, Office of the Senior Vice President and Chief Economist.
Bennett, O., & McDowell, C. (2012). Displaced: the human cost of development and
resettlement. New York: Palgrave Macmillan.
Berkes, Colding & Folke. (2003). Navigating Social-Ecological Systems: Building Resilience for
198
Complexity and Change. Cambridge, UK: Cambridge University Press.
Bicknell, J., Dodman, D., & Satterthwaite, D. (2009). Adapting cities to climate change:
understanding and addressing the development challenges. London; Sterling, VA:
Earthscan.
Bouillon, C. P., & Inter-American Development Bank. (2012). Room for development: housing
markets in Latin America and the Caribbean. Houndmills, Basingstoke, Hampshire; New
York: Palgrave Macmillan.
Bredenoord, J., Lindert, P. van, & Smets, P. (2014). Affordable housing in the urban global
south: seeking sustainable solutions. Abingdon, Oxon: Routledge.
Bulkeley, H. (2013). Cities and Climate Change. Routledge.
Bulkeley, H. (2015). An urban politics of climate change: experimentation and the governing of
socio-technical transitions. Abingdon, Oxon; New York, NY: Routledge.
Burgos, Natalia. (2015). An analysis of risk governance systems in urban settlements: a case
study of community participation in Altos de la Estancia, Bogota – Colombia.
Department of Geography of King’s College London for the Degree of ‘Disasters,
Adaptation and Development.’
Caja de la Vivienda Popular. (2015). Estrategia de Postreasentamiento: “Gestion Social del
Cambio para el Buen Vivir.” Equipo de Post Reasentmiento, Direccion de
Reasentamiento Humano
Casa + casa + casa = ¿ciudad? Germán Samper, una investigación en vivienda. (2012).
Bogotá, D.C., Colombia: Universidad de Los Andes, Departamento de Arquitectura :
Ediciones Uniandes : Archivo de Bogotá.
Ceballos, Olga. (2008). Vivienda Social en Colombia. Una Mirada desde su legislacion 1918-
199
2005. Bogota: Pontificia Universidad Javeriana.
Cernea, Michael. (2009). “Introduction: Resettlement- An Enduring Issue in Development.” The
Asia Pacific Journal of Anthropology. Vol. 10, No. 4, 263-265.
Cernea, Michael. (1997). “The Risks and Reconstruction Model for Resettling Displaced
Populations.” World Development. Vol. 25, No. 10, 1569-1587. Washington, D.C.: The
World Bank. Elsevier Science, Ltd. UK.
Correa, Elena. (2011). Reasentamiento preventive de poblaciones en riesgo de desastre:
experencias de America Latina. Banco Mundial y el Global Facility for Disaster
Reduction and Recovery (GFDRR).
Cuervo, Nicolas & Jaramillo, Samuel. (2009) Dos decadas de politica de vivienda en bogota
apostando por el mercado. Universidad de Los Andes, Facultad de Economia. Centro de
Estudios sobre Desarollo Economico.
Decreto 1420 of 1998. Retrieved from:
http://www.alcaldiabogota.gov.co/sisjur/normas/Norma1.jsp?i=1508.
Decreto 190 of 2004. Retrieved from:
http://www.alcaldiabogota.gov.co/sisjur/normas/Norma1.jsp?i=13935. Decreto 255 of 2013. Retrieved from:
http://www.alcaldiabogota.gov.co/sisjur/normas/Norma1.jsp?i=53386. Decreto 364 of 2013. Retrieved from:
http://www.alcaldiabogota.gov.co/sisjur/normas/Norma1.jsp?i=55073.
de Sherbenin et al. (2011). “Preparing for Resettlement Associated with Climate Change.”
Science. Policy Forum. Vol. 334
Downing, Theodore. (2002). Avoiding New Poverty: Mining-Induced Displacement and
200
Resettlement. International Institute for Environment and Development. Mining, Minerals
and Sustainable Development. World Business Council for Sustainable Development.
Ferris, Elizabeth. (2015). “Climate-Induced Resettlement: Environmental Change and the
Planned Relocation of Communities.” SAIS Review of International Affairs, Vol. 35.,
No.1. 109-117. Johns Hopkins University Press.
Escallón Gartner, C. (Ed.). (2010). Arrendamiento y vivienda popular en Colombia como
alternativa habitacional. Bogotá: Universidad de Los Andes, Departamento de
Arquitectura : Alcaldía Mayor de Bogotá, D.C.
Garcia, Luz Marina Ortega et al. (2015). “Estrategia de postreasentamiento: Gestion Social del
Cambio para el Buen Vivir.” Equipo de Post-Reasentamiento Direccion de
Reasentamiento Humano. Caja de La Vivienda Popular: Alcaldía Mayor de Bogotá, D.C.
Gilbert, A., & Ward, P. M. (1985). Housing, the state, and the poor: policy and practice in three
Latin American cities. Cambridge Cambridgeshire; New York: Cambridge University
Press.
Hardoy, Jorgelina & Pandiella, Gustavo. (2009). “Urban poverty and vulnerability to climate
change in Latin America.” Environment & Urbanization. International Institute for
Environment and Development (IIED). Vol. 21(1): 203-224.
Hardoy, Jorgelina & Romero-Lankao, Patricia. (2011). Latin American cities and climate
change: challenges and options to mitigation and adaptation responses. Current Opinion
in Environmental Sustainability, 3:158-163.
Hilbe, J. M. (2016). Practical guide to logistic regression.
Hirschman, Albert. (1970). Exit Voice Loyalty: Responses to Decline in Firms, Organizations,
and States. Cambridge, Massachusetts: Harvard University Press.
201
Hodson, M. & Marvin, S. (2010). World cities and climate change producing urban ecological
security. Berkshire, England: McGraw-Hill: Open University Presss,. Retrieved from
EBRARY. Restricted to UCB IP addresses.
http://site.ebrary.com/lib/berkeley/Doc?id=10441958.
Hoffmann, Elizabeth A. (2006). "Exit and Voice: Organizational Loyalty and Dispute Resolution
Strategies". Social Forces. 84: 2301–2318. doi:10.1353/sof.2006.0093.
Holling, C. S. (1973). “Resilience and stability of ecological systems.” Annual Review of
Ecology and Systematics, Vol. 4. 1-23. Palto Alto, CA: Annual Reviews.
Hosmer, David & Lemeshow, Stanley. (2013). Applied Logistic Regression. Third Edition.
Hoboken, New Jersey: John Wiley & Sons, Inc.
Instituto Distrital de Gestion de Riesgos y Cambio Climaticos y Organizacion Internacional para
las Migraciones. (2015). Reasentamiento de familias por alto riesgo en Bogota: Avances
y desafios. Alcaldia Mayor de Bogota D.C.
Intergovernmental Panel on Climate Change (IPCC). (2014). Climate change 2014 synthesis
report: Summary for policymakers. Retrieved from
http://www.ipcc.ch/pdf/assessmentreport/ar5/syr/SYR_AR5_SPMcorr1.pdf.
Isunju, John et al., (2016). “Community-level adaptation to minimize vulnerability and exploit
opportunities in Kampala’s wetlands.” Environment & Urbanization. International
Institute for Environment and Development (IIED). Vol. 28 (2): 475-494. Sage
Publications.
Jabeen, Huraera et al., (2010). “Built-in resilience: learning from grassroots coping strategies for
climate variability.” Environment & Urbanization. International Institute for
Environment and Development (IIED). Vol. 22 (2): 415-431.
202
Joya, Solanyi Robles. (2009). Impactos del reasentamiento por vulnerabilidad en areas de alto
riesgo. Bogota, 1991-2005. Financiado por la DIB 2007. Universidad Nacional de
Colombia, Facultad de Artes. Maestria en Habitat.
Kothari, U. (2014). Political discourses of climate change and migration: resettlement policies in
the Maldives. The Geographical Journal, 180(2), 130–140.
https://doi.org/10.1111/geoj.12032.
Lampis, Andrea. (2013). “La Adaptacion al Cambio Climatico: El Reto de las Dobles Agendas,”
in Postigo MacDowall, J.C. (Editor), Cambio Climatico, Movimientos Sociales y
Politicas Publicas: Una Vinculacion Necesaria, Santiago de Chile: CLACSO.
Lampis, Andrea. (2013). “Cities and Climate Change Challenges: Institutions, Policy Style and
Adaptation Capacity in Bogota,” International Journal of Urban and Regional Research,
Vol. 37, No. 6: 1079-1901.
Lampis, Andrea and Fraser, Arabella. (2012). The Impact of Climate Change on Urban
Settlements in Colombia. United Nations Human Settlements Programme (UN-
HABITAT) Country Report, Nairobi: UN-HABITAT.
Lavell, Alan. (2009). Local Disaster Reduction: Lessons from the Andes. Andean Community
Disaster Prevention Project – PREDECAN. Comunidad Andina, Secretaria General.
Lima, Peru: Technical Secretariat of the Andean Community.
Li, Hongfei, Calder, Catherine A., Cressie, Noel. (2007). "Beyond Moran's I: Testing for Spatial
Dependence Based on the Spatial Autoregressive Model". Geographical Analysis. 39 (4):
357–375.
Maldonado, J. K., Colombi, B., & Pandya, R. (2014). Climate Change and Indigenous Peoples
in the United States: Impacts, Experiences and Actions. Springer.
203
McDowell, C. (2013). Climate-Change Adaptation and Mitigation: Implications for Land
Acquisition and Population Relocation. Development Policy Review, 31(6), 677–695.
https://doi.org/10.1111/dpr.12030.
Mitchell, Andy. (2005). The ESRI Guide to GIS Analysis, Volume 2. ESRI Press.
Moser, Caroline. (1998). The Asset Vulnerability Framework: Reassessing Urban Poverty
Reduction Strategies. World Development, 26 (1): 1-29
Moser, C. and D. Satterthwaite (2008). “Towards pro-poor adaptation to climate change in the
urban centres of low-and middle-income countries” Human Settlements Discussion Paper
Series, Climate Change and Cities 3, IIED/ GURC Working Paper No 1., University of
Manchester, Global Urban Research Centre.
Moser, Caroline. (2009). “The construction of an asset index: Measuring asset accumulation in
Ecuador,” in A. Addison, D. Hulme and R. Kanbur, Poverty Dynamics: A Cross-
Disciplinary Perspective, Oxford University Press.
Ossa, M. R. S. de la, & Anzellini, S. (2011). Los dilemas del reasentamiento: debates y
experiencias de la Mesa Nacional de Diálogos sobre Reasentamiento de Población.
Universidad de los Andes, Facultad de Ciencias Sociales-CESO, Departamento de
Antropología.
Osorio, Gustavo. (2009). Prevencion y reduccion de riesgos a traves de los instrumentos de
planificacion territorial en Bogota. Serie: Experiencias de desarollo local frente a los
riesgos de desastres. Proyecto Apoyo a la Prevencion de Desastres en la Comundad
Andina- PREDECAN. Comunidad Andina, Secretaria General.
Ostrom, Elinor. (2009). A general framework for analyzing sustainability of social-ecological
systems. Science. Vol. 325, No. 5939 419-422
204
Parias Durán, Adriana. (2010). Hacia una Teoria de La Renta del Suelo Urbano. Por Samuel
Jaramillo. Territorios: Revista de estudios urbano y regionales, (22), 151 - 161.
Parias Durán, Adriana. (2008). El Mercado de Arrendamiento en Los Barrios Informales en
Bogota, un Mercado Estructural. Territorios: Mercados Inmobiliarios populares.
Universidad de los Andes, (No. 18 - 19), 75 - 101.
Partridge, William. (2010). Reasentamiento en Colombia. Banco Mundial. Alto Comisionado de
Naciones. Unidas para Refugiados. Red de Solidaridad Social. Corporacion Antioquia
Presente.
Quin et al. (2015). “Household responses to climate-related hazards in four Latin American
cities: A conceptual framework and exploratory analysis.” Urban Climate. Elsevier B.V.
Peet, R., Robbins, P., & Watts, M. (2011). Global political ecology. Abingdon, Oxon; New
York, NY: Routledge.
Pelling, M. (2010). Adaptation to Climate Change: From Resilience to Transformation.
Routledge.
Resolucion 109 of 2014. Retrieved from:
http://www.alcaldiabogota.gov.co/sisjur/normas/Norma1.jsp?i=60142.
Ribot, Jesse. (2010). “Vulnerability Does Not Fall from the Sky: Toward Multiscale, Pro-Poor
Climate Policy,” in Mearns and Norton, ed. Social Dimensions of Climate Change:
Equity and Vulnerability in a Warming World. New Frontiers of Social Policy. World
Bank.
Robbins, P. (2012). Political ecology: a critical introduction (2nd ed.). Chichester, West Sussex;
Malden, MA: J. Wiley & Sons.
Rodriguez, Olimpo Rojas. (2016). Informe de Gestion: Direccion de Reasentamientos Humanos,
205
Caja de Vivienda Popular.
Romero- Lankao et al. (2014). Scale, urban risk and adaptation capacity in neighborhoods of
Latin American cities. Habitat International 42. 224-235.
Satterthwaite, D., S. Huq, M. Pelling, H. Reid and P. Lankao-Romero (2007). Adapting to
Climate Change in Urban Areas; The possibilities and constraints in low- and middle-
income nations, Climate Change and Cities Series, Discussion Paper No. 1, International
Institute for Environment and Development (IIED), London, 107 pages.
Smith, Oliver. (2011). Defying Displacement: Grassroots Resistance and the Critique of
Development. University of Texas Press.
Secretaria Distritial de Ambiente, Instituto Distrital de Gestion de Riesgos y Cambio Climatico –
IDIGER. (2015). Plan Distrital de Gestion de Riesgos y Cambio Climatico Para Bogota
D.C., 2015-2050, Documento Tecnico de Soporte. Alcaldia Mayor de Bogota D.C.
Shidlo, G. (1990). Housing policy in developing countries. London; New York: Routledge.
Vega Centeno, P. (Ed.). (2009). Lima: diversidad y fragmentación de una metrópoli emergente
(1. ed). Quito: Organización Latinoamericana y del Caribe de Centros Históricos.
Ward, P. M., Jimnez, E. J., & Di Virgilio, M. M. (2014). Housing policy in Latin American
cities: a new generation of strategies and approaches for 2016 UN-Habitat III. New
York, NY: Routledge.
Ziergovel, Gina et al., (2016). “Strengthening the knowledge – policy interface through co-
production of a climate adaptation plan: leveraging opportunities in Bergrivier
Municipality, South Africa.” Environment & Urbanization. International Institute for
Environment and Development (IIED). Vol. 28 (2): 455-474.