Knowledge Transfer in Audit Firms* Xianjie Hea, SP Kotharib ...
57
Knowledge Transfer in Audit Firms * Xianjie He a , S.P. Kothari b , Tusheng Xiao c , Luo Zuo d a School of Accountancy, Shanghai University of Finance and Economics, China b Sloan School of Management, Massachusetts Institute of Technology, United States c School of Accountancy, Central University of Finance and Economics, China d Samuel Curtis Johnson Graduate School of Management, Cornell University, United States November 3, 2018 Abstract We utilize the setting of the rapid audit market consolidation in China over the past twenty years to study knowledge transfer in audit firms. We employ a difference-in-difference approach and examine whether industry-specific knowledge transfer occurs after a merger of two audit firms with different levels of expertise in a particular industry. For clients in an industry audited by both merging audit firms, those audited by the less competent audit firm in that industry belong to the treatment group, while all other clients belong to the control group. Consistent with the existence of knowledge transfer, we find an economically significant improvement in audit quality (as reflected in a reduction in misstatements and an increase in modified audit opinions) for the treatment group relative to the control group in the same merged audit firm. Keywords: Knowledge Transfer, Audit Firm Merger, Industry Expertise, Audit Quality. JEL Classification: M42. * We gratefully acknowledge helpful comments from Sanjeev Bhojraj, Simon Dekeyser, Like Jiang, Andrew Karolyi, Jeong-Bon Kim, Seil Kim, Clive Lennox, Chen Li, Robert Libby, Vic Naiker, Xi Wu, Xing Yang, Eric Yeung, and Liandong Zhang, as well as seminar participants at Baruch College, City University of Hong Kong, Cornell University, the Shanghai University of Finance and Economics, the University of Melbourne, and the Second Dragon-Horse Accounting and Finance International Symposium.
-
Upload
khangminh22 -
Category
Documents
-
view
2 -
download
0
Transcript of Knowledge Transfer in Audit Firms* Xianjie Hea, SP Kotharib ...
Knowledge Transfer in Audit Firms*
Xianjie Hea, S.P. Kotharib, Tusheng Xiaoc, Luo Zuod
a School of Accountancy, Shanghai University of Finance and Economics, China b Sloan School of Management, Massachusetts Institute of Technology, United States
c School of Accountancy, Central University of Finance and Economics, China d Samuel Curtis Johnson Graduate School of Management, Cornell University, United States
November 3, 2018
Abstract
We utilize the setting of the rapid audit market consolidation in China over the past twenty years to study knowledge transfer in audit firms. We employ a difference-in-difference approach and examine whether industry-specific knowledge transfer occurs after a merger of two audit firms with different levels of expertise in a particular industry. For clients in an industry audited by both merging audit firms, those audited by the less competent audit firm in that industry belong to the treatment group, while all other clients belong to the control group. Consistent with the existence of knowledge transfer, we find an economically significant improvement in audit quality (as reflected in a reduction in misstatements and an increase in modified audit opinions) for the treatment group relative to the control group in the same merged audit firm.
Keywords: Knowledge Transfer, Audit Firm Merger, Industry Expertise, Audit Quality. JEL Classification: M42.
* We gratefully acknowledge helpful comments from Sanjeev Bhojraj, Simon Dekeyser, Like Jiang, Andrew Karolyi, Jeong-Bon Kim, Seil Kim, Clive Lennox, Chen Li, Robert Libby, Vic Naiker, Xi Wu, Xing Yang, Eric Yeung, and Liandong Zhang, as well as seminar participants at Baruch College, City University of Hong Kong, Cornell University, the Shanghai University of Finance and Economics, the University of Melbourne, and the Second Dragon-Horse Accounting and Finance International Symposium.
1
1. Introduction
Audit firms are knowledge-intensive organizations (Starbuck 1992), and they can derive
competitive advantage by transferring knowledge internally (Argote 1999; Argote, Ingram, Levine
and Moreland 2000; DeFond and Zhang 2014). Knowledge transfer in organizations is formally
defined as “the process through which one unit (e.g., group, department, or division) is affected by
the experience of another” (Argote and Ingram 2000, p. 151), and it is manifested through changes
in performance (Argote and Ingram 2000). Knowledge transfer can occur through various
mechanisms, such as training, communication, observation, replicating routines, personnel
movement, and technology transfer. In this paper, we extend this literature of organizational
learning and knowledge management to audit firms.
To perform an efficient and effective audit, auditors must possess knowledge along several
dimensions, such as general domain knowledge of accounting and auditing standards, subspecialty
knowledge related to specific industries or clients, and general business knowledge (Libby and
Luft 1993; Nelson and Tan 2005; PCAOB 2015).1 We use the setting of audit firm mergers to
investigate the transfer of industry-specific knowledge between different units within an audit firm.
For illustration, consider a merger between two hypothetical audit firms: firm A specializes in the
mining industry; firm B is a non-specialist, and has clients in both the mining industry and the
entertainment industry. Firms A and B merge to form firm AB. The question is whether, after the
merger, firm A’s specialized knowledge about the mining industry transfers to firm B. Following
1 Auditors’ knowledge can be categorized into either explicit or tacit (Tan and Libby 1997; Vera-Muñoz, Ho and Chow 2006). Explicit or technical knowledge (or “know-what”) can be captured and stored, and is often transferred through formal channels facilitated by information technology. Tacit or procedural knowledge (or “know-how”) manifests itself in terms of intuition, insights, beliefs or values. It cannot be easily articulated or stored, and is typically transferred through personal interactions (Bol, Estep, Moers and Peecher 2018). The crucial role of procedural knowledge has been well established in organizational behavior research and is expressed in the adage that “the effects of what you do depend on how you do it” (Brockner, Chen, Mannix, Leung and Skarlicki 2000, p. 138). Knechel (2000, p. 706) also notes that “this knowledge is rarely documented and often difficult to link to specific assertions or audit risks, it is nevertheless vital for conducting an efficient and effective audit.”
2
prior literature on knowledge transfer (Darr, Argote and Epple 1995; Baum and Ingram 1998;
Ingram and Simons 2002), we use changes in audit performance to measure knowledge transfer.2
In this simple example, an improvement in the audit quality for firm B’s clients in the mining
industry (i.e., the treated clients) after the merger, relative to that for the control clients,3 would
constitute evidence of industry-specific knowledge transfer. The comparison between these two
groups of clients removes the variation common to all clients in the merged audit firm and the
common time-series changes in audit performance.4
The audit firm merger setting has several desirable features. First, a merger of two audit
firms with different levels of expertise in a particular industry results in industry knowledge
heterogeneity in the merged audit firm. This heterogeneity is fertile to identify a set of recipient
units in knowledge transfer (i.e., the treatment group). Because an audit firm often has clients in
multiple industries, those units not in this particular industry can serve as the control group.
Second, a merger removes or at least substantially dismantles the organizational boundaries
between the merging firms, and thus represents an economic shock to the channels through which
knowledge transfer between the merging firms occurs. Post-merger integration often involves the
development of information technology (e.g., knowledge databases, group support systems, or
intranets) that facilitates knowledge sharing and communication. To achieve unified quality
control, the merged firm usually develops audit routines that combine the best practices of the
2 As pointed out in Argote and Ingram (2000), the other approach, assessing knowledge transfer through measuring changes in the knowledge of the recipient unit (with techniques such as questionnaires or verbal protocols), is ill-suited to settings in which a significant amount of knowledge is tacit and cannot be easily articulated. 3 Our results are insensitive to the following choices of control clients: (1) both firm B’s clients in the entertainment industry and firm A’s clients in the mining industry, (2) only firm B’s clients in the entertainment industry, or (3) only firm A’s clients in the mining industry. 4 We do not claim that the improved audit performance for the treated clients is entirely driven by knowledge transfer. As discussed later in this section and Section 5.5, auditor competencies are not independent of their incentives, and audit performance reflects the joint competency and incentive effects. We conduct extensive empirical analysis to ensure that our results are not purely driven by the incentive effect.
3
merging firms.5 Training and gathering organized by the merged firm also provide a platform for
audit personnel originally employed by different firms to establish personal relationships, share
experience, and interact. Moreover, employment affiliation fosters the development of social ties
through homophily (i.e., an affinity for similar others), which, in turn, enhances mutual trust and
facilitates the transfer of tacit knowledge (Rogers and Bhowmik 1970; Granovetter 1985).6
Finally, while merger decisions are endogenously determined at the firm level, audit
quality are measured at the individual client level rather than the audit firm level. Our empirical
tests exploit across-client variation while removing common factors that affect all units in the
merged audit firm (e.g., auditor incentives captured by auditor size) through fixed effects.
The above three features of this setting enable us to test whether industry-specific
knowledge transfers from the more competent to the less competent units after the merger. It is
also worth noting that the knowledge heterogeneity between firm A and firm B does not
automatically translate into knowledge transfer from A to B. Knowledge transfer requires A’s
dissemination and B’s assimilation, both of which depend on one’s ability, willingness, effort and
opportunity. An Ernst & Young survey reports that 87 percent of executives view knowledge as
critical to competitiveness, but 44 percent of them rate the extent of knowledge transfer inside their
organization as poor or very poor (Stimpson 1999, p. 36). Simon (1973, p. 270) has long noted
that “the scarce resource is not information; it is processing capacity to attend to information.”
Empson (2001) discusses various impediments to knowledge transfer (e.g., the fears of
5 The Chinese Institute of Certified Public Accountants (CICPA) required merged audit firms to achieve post-merger uniformity of personnel, finance, services, technology standards and information management. The CICPA was also committed to providing special training and instructions to merged audit firms with respect to unified management and quality control. 6 Existing literature shows that units are more likely to learn best practices from units in the same organization than from units in a different organization (Argote, McEvily and Reagans 2003). Our maintained hypothesis in this paper is that the formal and informal channels for knowledge transfer between the merging audit firms are stronger after the merger than before the merger. We rely on this time-series variation induced by the merger event to avoid the daunting task of developing empirical measures of all the (observable and unobservable) channels for knowledge transfer.
4
exploitation and contamination) in mergers between professional service firms. Thus, it remains
an empirical question as to whether knowledge transfer occurs in a setting where knowledge
heterogeneity exists.7
We utilize a large sample of audit firm mergers in China over the past twenty years to test
the phenomenon of knowledge transfer within audit firms. Unlike the U.S. audit market, which is
dominated by Big N auditors, China’s audit market is quite fragmented among domestic audit
firms and the international Big N audit firms. However, there has been a trend toward consolidation
in the audit market due in part to China’s rapid economic development and regulatory changes.
We have a sample of 46 mergers that took place over the period 1998–2013, in which both merging
audit firms had a license to audit listed companies in China. For each merger, we identify treated
clients based on the relative industry expertise of their auditors before the merger, where industry
expertise is based on an auditor’s industry market share (Balsam, Krishnan, and Yang 2003; Chin
and Chi 2009; DeFond and Zhang 2014).8 In the above simple example, firm B’s clients in the
mining industry belong to the treatment group, while all other clients belong to the control group.9
We employ a difference-in-difference approach and examine whether the audit quality for
the treatment group improves after the merger (three-year post-merger versus three-year pre-
7 The existence of individual heterogeneity within the same audit firm is well documented in prior research (e.g., Libby 1981; Bonner and Lewis 1990; Libby and Tan 1994; Gibbins and Swieringa 1995; Bonner 2008; Nelson 2009; Gul, Wu and Yang 2013; Aobdia, Lin and Petacchi 2015; Ke, Lennox and Xin 2015; Knechel, Vanstraelen, and Zerni 2015; Li, Qi, Tian and Zhang 2017; He, Kothari, Xiao and Zuo 2018; Lennox and Wu 2018). 8 Archival auditing research commonly uses industry market share to measure expertise and generally finds consistent evidence (DeFond and Zhang 2014). We also find lower audit quality for client companies audited by auditors with lower industry market share. To the extent that industry market share does not accurately reflect expertise, our classification of treated clients based on this variable can lead to an underestimation of the true treatment effect and bias against finding evidence of knowledge transfer. Our results are robust with alternative definitions of treated clients that take into account the within-audit firm industry portfolio share or client size (see Section 5.1). 9 Consider a more complicated situation: firm A has clients in two industries: (a) mining, and (b) electronics; firm B has clients in three industries: (a) mining, (b) electronics, and (c) entertainment. Firm A specializes in the mining industry while firm B specializes in the electronics industry. In this case, firm A’s clients in the electronics industry and firm B’s clients in the mining industry belong to the treatment group, while all other clients belong to the control group.
5
merger), relative to that for the control group. Our empirical tests focus on the within-merged-firm
variation by including merger fixed effects. This design allows us to examine across-client
variation while removing all of the effects at the merged audit firm level. We use two audit quality
measures, misstatements and modified audit opinions.10 These two measures have relatively low
measurement error and offer relatively strong evidence of poor audit quality (DeFond and Zhang
2014). In a univariate analysis, the treatment group’s misstatement frequency declines from 9.10
percent before the merger to 4.95 percent after the merger, and the frequency of modified audit
opinions increases from 5.98 percent before the merger to 8.16 percent after the merger. The
corresponding changes for the control group are much smaller. Using a difference-in-difference
research design and a logistic regression model, we again find an economically significant
improvement in audit quality for the treatment group relative to the control group in the same
merged audit firm. We interpret this as evidence of knowledge transfer in audit firms.
We conduct a battery of additional tests to ascertain the robustness of our results. First, we
use alternative definitions of treated clients that consider (1) the industry expertise level of the
more competent auditor in the merger when compared with all other auditors, (2) the gap in
industry knowledge between the two auditors involved in a merger, (3) the within-audit firm
industry portfolio share, and (4) client size. Our results, if anything, become stronger for these
more restricted sets of treated clients.
Second, we examine whether our documented improvement in audit quality for the treated
clients is driven by audit personnel movement after the merger. We do not find that to be the case:
our results continue to hold in a restricted sample in which both the engagement partner and the
10 Following prior literature (e.g., Chin and Chi 2009), the likelihood of an accounting misstatement is based on when the misstatement occurs, not when the misstatement is later disclosed as a restatement.
6
review partner for a client company after the merger belong to the client’s audit firm before the
merger.11
Third, we repeat our analysis with an augmented sample that includes client companies
that switched auditors after the merger, and our inferences remain unchanged. Fourth, our results
also hold in a balanced panel of client companies, and a standard dynamic test shows that treated
and control clients exhibit similar trends in audit quality before the merger. This evidence suggests
that our results are unlikely to be driven by potential differential time trends across the treated and
control clients.
As DeFond and Zhang (2014) note, an important caveat to any archival research on auditor
competencies is that auditor competencies are not independent of their incentives. Greater
competencies in supplying high quality audits can increase an auditor’s reputation capital, which,
in turn, can lead to greater incentives to deliver high quality audits. Similarly, greater incentives
to deliver high quality audits can motivate auditors to develop greater competencies. Thus, the
improved audit performance documented in our paper can be partly explained by enhanced auditor
incentives after the merger. Disentangling the relative magnitude of the competency versus
incentive effect is difficult as these two effects are intertwined. Nevertheless, it is important to
ensure that our documented results are not purely driven by the incentive effect.
Prior research commonly focuses on auditor incentives at the audit firm level. For example,
larger auditors have stronger incentives to maintain independence because of higher reputation and
litigation risk. Because we include merger fixed effects in our analysis, our results cannot be driven
11 We use the term “partner” to describe the signing auditor. The two signing auditors’ signatures appear on the audit report, with the top signature from the review partner, and the bottom signature from the engagement partner. We cannot hold the audit partners constant over the event window because of mandatory partner rotation in China (Lennox, Wu and Zhang 2014). We do not impose constant personnel requirement in the main analysis because personnel movement can be viewed as one channel through which knowledge transfer occurs between the merging audit firms.
7
by enhanced auditor incentives common to the treatment and control groups in the same merged
audit firm. It is possible that the merged audit firm has stronger incentives to improve the audit
performance of the treatment group (versus the control group). If these incentives are due to
anticipated or realized knowledge transfer, then our documented results reflect the joint incentive
and competency effects as noted before.
To ensure that our results are not purely driven by the incentive effect, we conduct three
additional analyses. First, we use alternative control clients that are more similar to the treated
clients in terms of auditor incentives. Specifically, we include merging audit firm fixed effects
(instead of merger fixed effects) in the analysis to examine across-client variation within the same
merging audit firm (i.e., firm A or firm B, instead of firm AB). To further address the concern that
our results are purely driven by auditor incentives to improve the audit quality of relatively weak
units (regardless of their industries) within the same merging audit firm, we restrict the control
group to those clients that belong to an industry whose within-audit firm portfolio share is no larger
than that of the treated clients. Our inferences remain unchanged. Second, we show that the change
in audit performance (as measured by client misstatements) does not occur immediately after the
merger, consistent with a gradual process of knowledge transfer instead of a rapid incentive effect.
Third, we find an increase in audit fees for both the treatment and control groups after the merger
but the difference in fee increases between them is quite small and not statistically significant,
suggesting that the audit performance improvement of the treatment group relative to the control
group is unlikely to be purely driven by auditor incentives induced by differential reputation or
litigation risk.
The rest of the paper is organized as follows. In Section 2, we first contextualize our study
within the auditing literature and discuss its contributions; we then describe the institutional
8
background of China’s audit market. Section 3 explains our sample and research design. Section
4 presents the main results and Section 5 provides supplemental analyses. Finally, we conclude in
Section 6.
2. Related Literature and Institutional Background
2.1.Related Literature and Contribution
Our study is mainly related to four strands of literature. First, it contributes to the literature
on knowledge transfer in audit firms. Prior research provides evidence that some non-audit
services are associated with better audit quality, suggesting that non-audit services create
knowledge spillovers and improve auditor competency and efficiency (e.g., Simunic 1984; Kinney,
Palmrose and Scholz 2004; Knechel and Sharma 2012). Experimental or field research provides
evidence of knowledge transfer from superiors to subordinates within an audit team (Danos,
Eichenseher and Holt 1989; Bol, Estep, Moers and Peecher 2018), among peers across different
teams (Kennedy, Kleinmuntz and Peecher 1997; Kadous, Leiby and Peecher 2013), and from
reviewers to reviewees in the context of work paper reviews (Trotman 1985; Trotman and Yetton
1985; Ramsay 1994; Asare and McDaniel 1996). Using audit firm mergers as a shock to the
channels through which knowledge transfer occurs, we provide large-sample evidence that
industry-specific knowledge transfers from the more competent to the less competent units after
the merger. Our archival approach complements prior studies relying on surveys, interviews or
laboratory experiments (Libby, Bloomfield and Nelson 2002; Bloomfield, Nelson and Soltes
2016).
Second, our study responds to the call of DeFond and Zhang (2014, p. 278) “for more
research on the role of auditors’ competencies in driving audit quality.” There is strong evidence
that auditor industry expertise matters to audit quality, where expertise is measured at the national-
9
level, office-level, or partner-level. Many studies document a positive relation between national-
level industry expertise and audit quality (e.g., Balsam, Krishnan and Yang 2003; Dunn and
Mayhew 2004; Neal and Riley 2004; Knechel, Naiker and Pacheco 2007; Behn, Choi and Kang
2008; Lim and Tan 2008; Payne 2008). Evidence of office-level or partner-level expertise’s effect
on audit quality is more limited (e.g., Chin and Chi 2009; Reichelt and Wang 2010; Dekeyser,
Gaeremynck and Willekens 2018). DeFond and Zhang (2014) note that national-level
specialization leverages broad industry-specific knowledge and creates opportunities for
knowledge sharing, while office-level or partner-level specialization hinges more on local
knowledge or individual ability. Thus, we use industry market share at the national-level to
measure expertise to enhance the power to detect knowledge transfer in merged audit firms.
This literature on auditor industry specialization assumes that expertise developed from
auditing one client benefits audits of other clients in the same industry. We provide evidence
supporting that industry-specific knowledge is transferable across personnel and clients in merged
audit firms. Moreover, the endogenous matching of clients and auditors (e.g., Minutti-Meza 2013)
is less of a concern in our setting (than in prior literature) because we exploit across-client variation
within the same audit firm.
Third, our study contributes to the large body of research that examines the relation
between auditor size and audit quality (DeAngelo 1981; Watts and Zimmerman 1986; DeFond and
Zhang 2014). The majority of the literature supports the notion that larger auditors (typically
captured by Big N membership) provide higher quality audits. The evidence is based on various
audit quality proxies, such as material misstatements (DeFond and Jiambalvo 1991; Archambeault,
Dezoort and Hermanson 2008; Lennox and Pittman 2010; Francis, Michas and Yu 2013; DeFond,
Lim and Zang 2016), auditor communication (Chan and Wu 2011), financial reporting quality
10
(Zang 2012), perceptions of audit quality (Teoh and Wong 1993; Willenborg 1999; Weber and
Willenborg 2003; DeFond and Lennox 2011; Brown, Shu, Soo and Trompeter 2013; Leone, Rice,
Weber and Willenborg 2013), and audit fees (Ireland and Lennox 2002).
A few studies provide evidence that larger auditors do not provide higher quality audits.
Theoretical work by Bar-Yosef and Sarath (2005) and Beyer and Sridhar (2006) demonstrates that
larger auditors can provide lower quality audits. Petroni and Beasley (1996) find no evidence of
audit quality difference between Big N and other auditors. Chaney, Jeter and Shivakumar (2004)
show that Big N audit fee premia disappear after controlling for self-selection through the
Heckman (1979) model. Lawrence, Minutti-Meza and Zhang (2011) use a propensity score
matching technique and show that Big N quality differentiation is caused by differences in client
characteristics.12
Our evidence suggests that industry-specific knowledge sharing in large audit firms
enhances their competencies, which, in turn, improve their audit quality. Moreover, as noted earlier,
our use of across-client variation within the same audit firm mitigates concerns about client self-
selection.
Lastly, our study contributes to a recent literature on the economic determinants and
consequences of audit market consolidation (e.g., Ferguson, Pinnuck and Skinner 2017; Choi, Kim
and Raman 2017). Most related to our study are Chan and Wu (2011) and Gong, Li, Lin and Wu
(2016) who use the same setting of audit firm mergers in China. Chan and Wu (2011) find that a
merger of two audit firms licensed to audit listed clients results in higher audit quality (reflected
as more modified audit opinions), but there is no audit quality improvement after a merger of a
licensed audit firm with a non-licensed audit firm. Gong, Li, Lin and Wu (2016) document a
12 These conclusions are not without controversies. See, for example, Lennox, Francis and Wang (2012), DeFond, Erkens and Zhang (2016), and Shipman, Swanquist and Whited (2017).
11
significant reduction in audit hours of merged audit firms. Unlike our within-audit-firm
comparison, both of these studies compare the audit performance or audit effort across different
audit firms. Another related study, Jiang, Wang and Wang (2018), uses the setting of Big N
auditors’ acquisitions of non-Big N auditors in the United States, and compares the audit quality
of client companies audited by Big-N auditors (due to the acquisition) with that of client companies
audited by non-Big N auditors. In contrast, our comparison is between treated and control clients
in the same audit firm, and our evidence suggests that removing organizational boundaries
facilitates knowledge transfer. In addition, our results are robust after removing mergers involving
the international Big N.
2.2.Institutional Background
In this section, we describe the development of the audit market in China, and the economic
and regulatory forces underlying the audit market consolidation over the past twenty years.
In December 1978, the Communist Party of China led by Deng Xiaoping initiated the
program of economic reforms to introduce market principles to China and build “socialism with
Chinese characteristics.” The opening up of China to foreign investment and the restructuring of
state-owned enterprises as joint stock companies generated demand for auditing. China’s first audit
firm was established in 1980, after which thousands of government-affiliated audit firms
mushroomed (Tang 2000). The launch of the Shanghai Stock Exchange in 1990 and the Shenzhen
Stock Exchange in 1991 created demand for independent audits. To audit listed companies, audit
firms are required to obtain a license from the China Securities Regulatory Commission (CSRC)
and the Ministry of Finance (MOF). Responding to investor demand for independent audits, the
CSRC and the MOF promulgated a series of reforms to separate audit firms from the government
beginning in 1998. These reforms were completed in early 2000. Since then audit firms are
12
independent of the government and operate under competitive market forces (Chen, Chen, Lobo
and Wang 2011).
In the 1990s, most domestic audit firms were small and the audit market was highly
fragmented. In 1999, the average number of listed clients for the 106 licensed audit firms was less
than ten, and the market share of the 20 largest audit firms was only 49.6 percent in terms of the
number of listed clients (CSRC 2001).13 At that time, many domestic auditing professionals
believed that increasing firm size through mergers could strengthen their firms’ ability to compete
with large international audit firms after China’s entrance into the World Trade Organization
(China Securities News 2000).
In the late 1990s, an increasing number of large state-owned enterprises were restructured
to become joint stock companies, and the government started to impose stringent size requirements
for audit firms to obtain an audit license. In 1997, to be eligible to apply for a license to audit listed
companies, an audit firm needed to employ more than eight certified public accountants with a
qualification from the CSRC to sign audit reports for listed companies. In June 2000, the CSRC
and the MOF increased this number to 20 and further required that audit firms must have annual
revenue of more than eight million yuan (the Chinese currency), which exceeded the revenue of
many audit firms in 1999. Merging with another audit firm could enable small audit firms to meet
these requirements.
In the 2000s, the international Big N audit firms aggressively expanded their investment in
China.14 Moreover, international audit firms (mainly the Big N) were selected as auditors for all
13 In the early 1990s, international audit firms were not allowed to directly enter China’s audit market, but they were able to form joint ventures with domestic audit firms. Since 1999, international audit firms can directly invest in and own domestic firms. The market share of the international Big N in China was only 3.6 percent in 1999, and this figure grew to 6.9 percent in 2006. 14 For example, in 2003, Deloitte announced a landmark investment of US$150 million in China as a part of its five-year plan to increase staff and revenue by four to five times (China Securities News 2004). In 2005, Deloitte announced to acquire Beijing Tianjian, a member of the Tianjian Alliance (the biggest domestic audit alliance), and PwC
13
of the overseas listings of Chinese companies. To protect their domestic market share and to
compete for accounting services for large Chinese companies domestically and globally, domestic
audit firms had strong incentives to merge with their peers to increase firm size and competencies.
Mergers among domestic audit firms were also strongly encouraged and supported by the Chinese
government. In May 2007, the Chinese Institute of Certified Public Accountants (CICPA) issued
a policy statement directed at developing larger and more competitive domestic audit firms. In
October 2009, the State Council of China promulgated that the government would support the ten
largest domestic audit firms. In November 2009, the CSRC and the MOF issued guidance for
application of license to audit Chinese companies listed in Hong Kong.15 The first batch of eligible
firms consisted of the international Big 4 and eight domestic audit firms. Other audit firms could
also apply for a license if they had annual revenue of more than 300 million yuan or more than 30
listed clients, and employed more than 400 certified public accountants. Merging with peer audit
firms again became an efficient way to meet these license requirements.
In the early 2010s, the audit market consolidation continued and the government furthered
its effort to support audit firm mergers. In June 2012, the CICPA issued another policy statement
to encourage audit firms to increase their size and competencies (CICPA 2012). In particular, it
promised to offer partial membership fee refunds to those audit firms who first became a top 15
firm and to those existing top 15 firms whose ranking improved by more than three positions. It
explicitly encouraged audit firm mergers and required merged audit firms to achieve post-merger
announced its plan to recruit more than 1,000 workers each year in the following five years (China Financial Times 2005). 15 These companies are referred to as H-share companies which are incorporated in mainland China and listed in Hong Kong. Many H-share companies simultaneously issue A shares traded on the Shanghai Stock Exchange or the Shenzhen Stock Exchange. Prior to 2010, H-share companies were required to prepare financial statements audited by Hong Kong auditors, and the international Big N dominated this audit market. Since 2010, the Hong Kong Exchange and Clearing Limited started to accept financial statements prepared under Chinese accounting standards and audited by mainland audit firms.
14
uniformity of personnel, finance, services, technology standards and information management.
The CICPA was also committed to providing special training and instructions to merged audit
firms with respect to unified management and quality control.
In summary, unlike the U.S. audit market, which is dominated by Big N auditors, China’s
audit market is relatively fragmented among domestic audit firms and the international Big N audit
firms. China’s rapid economic development and regulatory changes over the past twenty years
triggered a wave of audit firm mergers. Domestic audit firms merged with their peers to increase
firm size and to deliver audits demanded by clients in a competitive audit market.16 Merged audit
firms have strong economic incentives to improve their competence to obtain government support
and to compete in the audit market. Using this setting, we study whether removing organizational
boundaries facilitates knowledge transfer between the merging audit firms.
3. Research Methods
3.1.Sample and Data
We collect data on audit firm mergers from the CICPA, audit firms’ official websites, and
leading financial newspapers. We obtain client companies’ financial statement data and audit
opinion data from the China Stock Market and Accounting Research (CSMAR) database. We
collect restatement data from the “Material Accounting Errors” section of financial statement
footnotes and exclude restatements due to changes in accounting standards or tax rules, mergers
and acquisitions, or other issues unrelated to accounting irregularities. We collect the names of the
16 Besides the aforementioned economic and regulatory forces, three factors underlie auditors’ incentives to provide high quality audits in China (Lennox, Wu and Zhang 2016). First, auditors’ legal responsibilities and litigation risk were substantially increased by legal reforms in 2002 and 2005 (Firth, Mo and Wong 2012). Second, audit firms are overseen by the MOF and the CICPA, and regularly inspected by the Inspection Bureau of the MOF. For example, in 2005, the licenses of 18 audit firms were withdrawn by the regulators and a further 60 audit firms were punished with fines and reform orders. Third, audit scandals can result in adverse reputational consequences (He, Pittman and Rui 2016).
15
engagement and review partners from annual reports, and obtain data on their employment history
from the auditor resumes provided by the CSRC.
Our sample consists of 46 mergers over the period 1998–2013, in which both merging audit
firms had a license to audit listed companies in China. 17 Our sample includes listed client
companies over the period 1995–2016 since we use three-year data before and after the merger
when available. The sample consists of client companies that are audited by (1) one of the merging
audit firms before the merger and (2) the merged audit firm after the merger.18
Panel A of Table 1 lists the 46 audit firm mergers by year. Seventeen mergers occurred in
2000, the year in which the CSRC and the MOF issued new regulations that imposed size
requirements (with respect to the number of CPAs and total revenue) for audit firms to obtain or
retain their license to audit listed companies. The number of mergers in other years ranges from
zero to six. Panel B of Table 1 presents the sample breakdown by industry. The whole sample
consists of 9,795 client-year observations (1,899 unique clients), 18% of which (i.e., 1,766
observations of 357 unique clients) belong to the treatment group (defined below). The Machinery,
Equipment, and Instrument industry includes the largest number of client-year observations,
accounting for 15.72% of our sample, followed by the Petroleum, Chemical, Plastics, and Rubber
industry (9.15%), and the Metal and Non-Metal industry (7.86%). The number (percentage) of the
treatment observations in these three industries is 348 (22.6%), 199 (22.2%), and 181 (23.5%)
respectively.
17 Our inferences are unchanged after we drop three mergers involving the international Big N (see the Online Appendix). 18 In the case where firm A merges with firm B to form firm AB, A and B are the merging audit firms, and AB is the merged audit firm. We only require a client company be audited by either A or B in the year before the merger and by AB in the year after the merger, and do not impose this requirement over the whole seven-year window (because doing so severely reduces the number of observations). In a supplemental analysis, we repeat our tests in a constant sample of clients over a five-year window around the merger to ensure that our results hold in a balanced panel.
16
3.2.Research Design
We employ a difference-in-difference approach and examine whether the audit quality for
the treatment group improves after the merger, relative to that for the control group. Specifically,
we estimate the following logistic model of audit quality (AQ):
AQijt = αj + β1×POSTijt + β2×TREATijt + β3×POSTijt×TREATijt + Controls + εijt, (1)
where i indexes client companies, j indexes audit firm mergers, and t indexes event time (the year
of merger is year 0). Our empirical tests focus on the within-merged-firm variation by including
merger fixed effects αj. This design allows us to exploit across-client variation while removing all
effects at the merged audit firm level. We use two audit quality measures as the dependent variable,
misstatements (MISSTATEMENT) and modified audit opinion (MAO). These two measures have
relatively low measurement error and offer relatively strong evidence of poor audit quality
(DeFond and Zhang 2014). MISSTATEMENTijt equals one if client i’s financial statement in year
t is restated in a subsequent year due to accounting irregularities, and zero otherwise. MAOijt equals
one if client i receives a modified audit opinion in year t, and zero otherwise. Following Wang,
Wong and Xia (2008), we classify unqualified opinions with an explanatory paragraph, qualified
opinions, disclaimers, and adverse opinions as modified opinions. Unlike going-concern opinions
only issued to financially distressed clients in the United States, modified opinions in China are
sometimes issued to profitable clients with questionable accounting practices (Chen, Chen and Su
2001). This feature of modified opinions enables us to capture the effect of knowledge transfer on
audit quality for a wide spectrum of client companies.
For each merger, we include three-year client-level data before and after the merger when
available. Data in the merger year is also included since it is the first year in which audit reports
17
are issued in the name of the merged audit firm.19 POSTijt equals one if client i’s year t observation
belongs to the post-merger period (including the merger year), and zero if client i’s year t
observation belongs to the pre-merger period.
We sort all client companies of each merged audit firm into the treatment and control
groups based on the relative industry expertise of their auditors in the year before the merger.
Following prior literature (e.g., Balsam, Krishnan, and Yang 2003; Chin and Chi 2009), an audit
firm’s industry expertise is measured by its industry market share (based on the number of listed
clients in that industry).20 For clients in an industry audited by both merging audit firms, those
audited by the less competent audit firm in that industry belong to the treatment group.21 All other
clients belong to the control group. TREATijt equals one if client i in merger j belongs to the
treatment group, and zero if client i in merger j belongs to the control group.
Our variable of interest is the interaction term POSTijt×TREATijt. Its coefficient β3 captures
the change in audit quality for the treatment group relative to the control group. An improvement
in audit quality for the treatment group will be reflected in a negative β3 when the dependent
variable is MISSTATEMENT, and a positive β3 when the dependent variable is MAO. Because we
include merger fixed effects in the regression, we essentially compare the treatment group and the
control group within the same merged audit firm. This design feature allows us to remove all
common effects at the merged audit firm level, and use the treatment effect to capture industry-
specific knowledge transfer after the merger.
19 Removing observations in the merger event year does not change our inferences (see the Online Appendix). 20 Our results become stronger when we take into account client size in defining an audit firm’s industry expertise (see Section 5.1). 21 As noted earlier, one merging audit firm can be more competent in one industry while less competent in another industry than the other merging audit firm.
18
We include a set of control variables following prior research on misstatements and
auditors’ reporting decisions. Detailed definitions of these variables appear in the Appendix. We
control for client size (SIZE), leverage (LEV), profitability (ROA), the incurrence of loss (LOSS),
and sales growth (GROWTH), which are associated with the incidence of misstatements and audit
risk (Kinney and McDaniel 1989; DeFond and Jiambalvo 1994). A client’s current ratio
(CURRENT) is included as a control since a higher current ratio indicates a lower degree of audit
risk (Chan and Wu 2011). We control for firm age (AGE) as old firms in China, after exhausting
their IPO proceeds, are more likely to suffer financial distress (DeFond, Wong, and Li 2000). Audit
firm tenure (TENURE) is also included as a control as in prior studies (Chan and Wu 2011).
Following Gong, Li, Lin and Wu (2016), we control for audit opinions (MAO) when the dependent
variable is MISSTATEMENT.22 Finally, we include industry fixed effects in all regressions.23
Standard errors are clustered by client.
3.3.Summary Statistics
Table 2 presents the summary statistics of all the variables used in the main analysis. All
continuous variables are winsorized at the top and bottom one percent to mitigate the influence of
extreme values. Misstatements happen for 6.93 percent of all the client-year observations, and 6.66
percent of observations receive a modified audit opinion. The relatively low frequency of these
two outcomes are consistent with prior research (He, Kothari, Xiao and Zuo 2018). 57 percent of
observations belong to the post-merger period, and 18 percent of observations belong to the
treatment group. The variable SIZE is right-skewed, with a mean of 5360.5 million yuan, and a
22 Our inferences are unchanged when we drop MAO as a control. 23 As noted before, the inclusion of merger fixed effects allows us to compare the treatment and control groups within each merged audit firm. We do not further include client or year fixed effects due to the low frequency nature of misstatements or modified audit opinions and the limited time-series and cross-sectional data for each merger. Our inferences are unchanged when we repeat the analysis with a logistic model in which we control for merger×industry fixed effects (see the Online Appendix).
19
median of 2045.6 million yuan. The mean and median of LEV is both around 47 percent, and the
mean and median of ROA is both around 3.6 percent. 10.4 percent of observations report negative
net income. Sales growth exhibits a large variation, with a mean of 19.6 percent, and a standard
deviation of 50 percent. Both the mean and median of the current ratio (2 and 1.4 respectively)
exceed the common benchmark value of one. An average client has been listed for 9 years. The
mean and median tenure for the incumbent audit firm is 6.5 and 5 years respectively.
4. Main Results
The existence of knowledge transfer in audit firms suggests that the audit quality of a less
competent auditor (in terms of industry expertise) improves after merger with a more competent
auditor. We test this prediction using two proxies for audit quality: the likelihood of clients’
earnings misstatements (Table 3) and auditors’ proclivity to issue modified audit opinions (Table
4).
4.1.Results on Misstatements
Panel A of Table 3 reports the descriptive statistics of MISSTATEMENT. For the treatment
group, the misstatement frequency is 9.10 percent before the merger, and 4.95 percent after the
merger, and the reduction of 4.15 percent is statistically significant (p-value<0.001). The
misstatement frequency also decreases for the control group after the merger, though both the
economic and statistical magnitude are much smaller (1 percent with p-value=0.083). The
difference in misstatement reduction between the treatment and control groups is 3.16 percent and
statistically significant (p-value=0.020).
Panel B of Table 3 presents the logistic regression results of using MISSTATEMENT as the
dependent variable in Equation (1). Column 1 reports the results of estimating Equation (1) without
time-varying control variables. The coefficient on the interaction term POST×TREAT is -0.4475
20
and statistically significant at the five percent level (z-stat=-2.05). The magnitude and statistical
significance of this coefficient become slightly larger (-0.4898 with z-stat=-2.25) in column 2 when
the full set of control variables is included in the estimation. The positive, significant coefficient
on TREAT suggests that the audit quality for the treated clients before the merger is on average
lower than that for the control clients.24 The behavior of the control variables is generally as
predicted. Firms with high leverage and low profitability are more likely to restate their current
period earnings. Firms that receive a modified audit opinion are also more likely to exhibit
accounting irregularities.
The economic magnitude of the results is gauged from the incremental effect of
POST×TREAT on the likelihood of an earnings misstatement (Puhani 2012). 25 Based on the
coefficient estimates in column 2, the average marginal effect of POST×TREAT is 2.83 percent,
which is more than one third of the sample mean of MISSTATEMENT (6.93 percent). Hence, we
find an economically significant reduction in misstatements for the treated clients relative to the
control clients after the merger. These results suggest industry-specific knowledge transfer after
the merger, which is manifested through changes in audit performance as measured by the
probability of misstatements.
4.2.Results on Audit Opinion
In the above analysis, we assess audit quality based on whether audited financial statements
contain material misstatements which are later restated. In this section, we use auditors’ reporting
outcomes to assess audit quality.
24 The difference-in-difference approach does not require the level of the dependent variable to be identical between the treatment and control groups as any systematic difference between them will be eliminated in the estimation. 25 Ai and Norton (2003) point out that in non-linear models the coefficient on the interaction term does not capture the marginal effect. However, Puhani (2012) demonstrates that this critique does not apply in a difference-in-differences model. Our inferences are unchanged when we repeat the analysis with a linear probability model (see the Online Appendix).
21
Panel A of Table 4 reports the descriptive statistics of MAO. For the treatment group, the
frequency of modified audit opinions is 5.98 percent before the merger, and 8.16 percent after the
merger, and the increase of 2.18 percent is statistically significant (p-value=0.082). The frequency
of modified audit opinions decreases slightly for the control group after the merger (-0.84 percent
with p-value=0.132). The difference in differences between the treatment and control groups is
3.02 percent and statistically significant (p-value=0.023).
Panel B of Table 4 presents the logistic regression results of using MAO as the dependent
variable in Equation (1). Column 1 reports the results of estimating Equation (1) without time-
varying control variables. The coefficient on the interaction term POST×TREAT is 0.5891 and
statistically significant at the one percent level (z-stat=2.66). The magnitude of this coefficient
becomes slightly larger (0.7126 with z-stat=2.49) in column 2 when the full set of control variables
is included in the estimation. The behavior of the control variables is generally as predicted. Small,
old firms with high leverage, low profitability, frequent losses and low growth are more likely to
receive a modified audit opinion.26
The economic magnitude of the results is gauged from the incremental effect of
POST×TREAT on the likelihood of issuing a modified audit opinion. Based on the coefficient
estimates in column 2, the average marginal effect of POST×TREAT is 2.81 percent, which is more
than one third of the sample mean of MAO (6.66 percent). Hence, we find an economically
significant increase in modified audit opinions for the treated clients relative to the control clients
after the merger. These results suggest industry-specific knowledge transfer after the merger,
which is manifested through changes in audit performance as measured by the likelihood of issuing
a modified audit opinion.
26 The positive coefficient on the current ratio (CURRENT) is somewhat surprising and might be explained by the higher audit risk associated with a larger amount of accounts receivable and inventory.

22
5. Supplementary Analyses
In this section, we conduct a series of additional analyses. First, we use four alternative
definitions of treated clients. Second, we repeat our analysis for a restricted sample in which both
the engagement partner and the review partner for a client company after the merger belong to the
client’s audit firm before the merger. Third, we use an augmented sample including client
companies that switched auditors after the merger. Fourth, we repeat our analysis in a balanced
panel of client companies and perform a standard dynamic test to test for possible pre-trends.
Lastly, we conduct three analyses to further ensure that our results are not purely driven by the
incentive effect.
5.1.Alternative Definitions of Treated Clients
In the baseline specification (reported in Table 3 and Table 4), for each merger, we sort all
client companies into the treatment and control groups based on the relative industry expertise of
their auditors in the year before the merger, where industry expertise is based the auditor’s industry
market share. For client companies in an industry audited by both merging audit firms, those
audited by the less competent audit firm in that industry belong to the treatment group, while all
other client companies belong to the control group.
In this section, we impose more stringent requirements on client companies to be classified
as treatment firms. Specifically, TREAT1 equals one when (1) TREAT equals one, and (2) the more
competent auditor in the merger is an industry expert (i.e., ranked as a top five auditor in terms of
industry market share). TREAT2 equals one when (1) TREAT equals one, and (2) the distance of
the industry market share rank between the two audit firms is at least five. TREAT3 equals one
when (1) TREAT equals one, and (2) the within-audit firm industry portfolio share is larger than
that of the other audit firm, where the industry portfolio share is computed as the number of listed
23
clients in that particular industry divided by the total number of clients. TREAT4 equals one when
(1) TREAT equals one, and (2) the total assets of clients in that particular industry audited by the
audit firm are larger than those of the other audit firm. We expect the effect of knowledge transfer
on audit performance to be stronger for these more restricted sets of client companies.
Table 5 presents the regression results with these alternative definitions of treated clients.
Panel A presents the logistic regression results of using MISSTATEMENT as the dependent
variable. Panel B presents the logistic regression results of using MAO as the dependent variable.
The full set of control variables (as in Table 3 or 4) are included but not reported for brevity. Across
all columns in both panels, the coefficient on the interaction term POST×TREAT remains
statistically significant. In addition, the magnitude of the coefficient on this interaction term in all
specifications is larger than that reported in Table 3 (for MISSTATMENT) or Table 4 (for MAO),
consistent with a stronger effect of knowledge transfer for these more restricted sets of client
companies.
5.2.Restricted Sample without Audit Personnel Movement
In our previous analysis, our sample consists of client companies that are audited by (1)
one of the merging audit firms before the merger and (2) the merged audit firm after the merger.
Our analysis relies on audit team heterogeneity generated by a merger of two audit firms with
different levels of expertise in a particular industry. This heterogeneity allows us to test whether
industry-specific knowledge transfers from the more competent to the less competent audit teams
after the merger, as manifested through changes in audit performance.
Audit personnel movement between the merging audit firms after the merger can partly
contribute to the observed changes in audit performance. To ensure that our results are not entirely
driven by this effect, we repeat our analysis for a restricted sample in which both the engagement
24
partner and the review partner for a client company after the merger belong to the client’s audit
firm before the merger. We manually verify each partner’s employment history from the auditor
resumes provided by the CSRC. Table 6 presents the regression results for this restricted sample.
Consistent with our previous results, the coefficient on the interaction term POST×TREAT is
negative and significant in column 1 when the dependent variable is MISSTATEMENT, and
positive and significant in column 2 when the dependent variable is MAO. These results indicate
that our documented improvement in audit quality for the treated clients (relative to the control
clients) after the merger are unlikely to be entirely driven by audit personnel movement.
5.3.Augmented Sample including Dropped Clients
Our sample only includes client companies of the merging audit firms that remain audited
by the merged audit firm after the merger. Clients that switch to other auditors after the merger are
not included as knowledge transfer between the merging audit firms would have no effect on the
audit quality of those clients. For the 46 mergers included in our sample, the total number of client
companies is 2,211 before the merger, and 1,899 after the merger. Thus, a relatively small number
of client companies (i.e., 14.1 percent) switched auditors after the merger. Based on the industry
market shares of the auditors before the merger, a similar percentage of client companies in the
treatment and control groups are dropped from the sample due to switching auditors (i.e., 15.8
percent and 13.7 percent respectively).27
We repeat our analysis with an augmented sample that includes client companies that
switched audit firms after the merger. We create two dummy variables to indicate dropped client
companies. TREAT_DROP is a dummy variable that equals one for dropped client companies that
27 Had no client companies switched auditors, the treatment group would have included 424 client companies, and the control group would have included 1,787 client companies. In the actual sample, the treatment group consists of 357 client companies, and the control group consists of 1,542 client companies.
25
would have been classified as a treatment firm, and CONTROL_DROP is a dummy variable that
equals one for dropped client companies that would have been classified as a control firm. We
include in the baseline regression these two dummy variables and their interactions with POST
(i.e., POST×TREAT_DROP and POST×CONTROL_DROP). The augmented sample is essentially
divided into four groups: treated clients, control clients, dropped treatment clients, and dropped
control clients. In the regression model, control clients are used as the benchmark group. Table 7
presents the logistic regression results. The results show that dropped treatment and control clients
both exhibit higher misstatement frequencies than the control clients before the merger. After the
merger, the misstatement frequency for the dropped treatment clients does not change, but the
misstatement frequency for the dropped control clients reduces. More importantly, the coefficient
on the interaction term POST×TREAT remains negative and significant in column 1 when the
dependent variable is MISSTATEMENT, and positive and significant in column 2 when the
dependent variable is MAO. Hence, our results continue to hold in this augmented sample that
includes dropped clients.
5.4.Constant Sample and Pre-Trends
Our sample consists of client-year observations in the seven-year window around the audit
firm merger. To be included in our sample, a client company needs to be audited by one of the
merging audit firms in the year before the merger and by the merged audit firm in the year after
the merger. However, we do not require a constant sample of client companies over the seven-year
window because doing so severely reduces the number of observations and weakens the power of
our tests. To ensure the robustness of our results in a balanced panel, we repeat our main analysis
in a constant sample of client companies over a five-year window around the audit firm merger.
Column 1 of Table 8 presents the logistic regression results of using MISSTATEMENT as the
26
dependent variable. Column 2 of Table 8 presents the logistic regression results of using MAO as
the dependent variable. As expected, the coefficient on the interaction term POST×TREAT is
negative and significant in column 1, and positive and significant in column 2.
In addition, to ensure that the coefficient on the interaction term POST×TREAT reflects the
treatment effect instead of a differential time trend between the treatment and control groups, we
perform a standard dynamic test to test for possible pre-trends. Specifically, we create a dummy
variable (BEFORE_1YR) that equals one for observations in the year before the merger (i.e., Year
–1), and include in the baseline regression this dummy variable and its interaction with TREAT.
Columns 3 and 4 of Table 8 present the logistic regression results. The coefficient on the
interaction term BEFORE_1YR×TREAT is statistically insignificant in both columns (z-stat=-0.76
in column 3 and z-stat=0.85 in column 4). These results of similar trends in audit quality across
different client companies before the audit firm merger suggest that our inferences of knowledge
transfer are unlikely driven by potential differential time trends absent the audit firm merger.
5.5.The Incentive Effect
In our main analysis, we classify all client companies in a merged audit firm into the
treatment and control groups based on their auditors’ industry expertise before the merger. Based
on this classification, we interpret the audit quality improvement for the treatment group relative
to the control group after the merger as evidence of knowledge transfer. We acknowledge that the
improved audit performance for the treatment group (relative to the control group) after the merger
can be partly explained by enhanced auditor incentives after the merger. This caveat is not unique
to our study and applies to any archival research on auditor competencies because of the
interrelation between auditor competencies and their incentives (DeFond and Zhang 2014). To
ensure that our results are not purely driven by the incentive effect, we conduct three additional
27
analyses. First, we use alternative control clients that are more similar to the treated clients in terms
of auditor incentives. Second, we investigate the timing of the audit performance improvement.
Third, we look at audit fees.
5.5.1. Alternative Control Clients
In our main analysis, the control group includes all client companies that are not classified
as the treatment group. In our simple example that firm A (a specialist in the mining industry)
merges with firm B (a non-specialist with clients in the mining industry), firm B’s clients in the
mining industry belong to the treatment group, while all other clients of either firm A or firm B
belong to the control group. It could be the case that the audit quality for firm B’s clients is
generally lower than that for firm A’s clients, and the merged audit firm AB has stronger incentives
to improve the audit quality for firm B’s clients regardless of their industries. To address this
concern, we include merging audit firm fixed effects (instead of merger fixed effects) in the
analysis to examine across-client variation within the same merging audit firm (i.e., firm A or firm
B, instead of firm AB). Columns 1 and 2 of Table 9 present the regression results for this alternative
specification. 28 Consistent with our main analysis, the coefficient on the interaction term
POST×TREAT is negative and significant for MISSTATEMENT, and positive and significant for
MAO.
Further, to address the concern that our results are purely driven by auditor incentives to
improve the audit quality of relatively weak units (regardless of their industries) within the same
merging audit firm, we restrict the control group to those clients that belong to an industry whose
within-audit firm portfolio share is no larger than that of the treated clients. For example, in a
situation where audit firm B has three treated clients in the mining industry, two control clients in
28 The number of observations is slightly reduced in this analysis compared with Table 3 or 4 because the value of the dependent variable is all zero for some merging audit firms.
28
the entertainment industry, and six control clients in the electronics industry, we remove from the
control group those clients in the electronics industry. Columns 3 and 4 of Table 9 present the
regression results for the analysis with this more restricted control group. Similar to the results
reported in columns 1 and 2, our inferences on knowledge transfer remain intact.
5.5.2. Alternative Definition of the POST Variable
In the main analysis, the merger year is included as a post-merger year (i.e., POST=1) since
it is the first year in which audit reports are issued in the name of the merged audit firm. If our
results were purely driven by the incentive effect, the improvement in audit performance for the
treatment group (relative to the control group) would occur immediately after the merger (i.e., in
the merger year and the three-year period after the merger). We create two dummy variables and
use their interactions with TREAT to test this prediction: POST_0 equals one if the client
observation belongs to the merger event year, and POST_13 equals one if the client observation
belongs to the three-year period after the merger event year. Table 10 reports the results and shows
that the effect of audit firm mergers on audit performance (as measured by MISSTATEMENT) does
not occur in the merger event year and only happens in the three-year period after the merger. This
evidence suggests again that our results are unlikely to be entirely driven by the incentive effect.
5.5.3. Audit Fees
The change in audit performance of the treatment group relative to the control group
documented in the main analysis reflects a benefit of industry-specific knowledge transfer after
the merger. The net effect of knowledge transfer on audit fees is unclear because knowledge
transfer can entail both additional costs (e.g., integration costs related to information systems or
training) and efficiency gains (e.g., reduction in audit hours). However, if previously documented
results are totally driven by auditors’ stronger incentives to maintain independence because of
29
higher reputation and litigation risk for the treatment group, audit fees should increase more for
the treatment group relative to the control group after the merger. Thus, we test whether the change
in the audit fee differs between the treated clients and the control clients. For this analysis, the
sample is restricted to mergers over the period 2001 to 2013 because client companies started to
disclose audit fees in 2000.
Panel A of Table 11 reports the descriptive statistics of audit fee (FEE). For the treatment
group, the average audit fee is ¥596,100 before the merger, and ¥760,800 after the merger, and the
increase of ¥164,700 is statistically significant (p-value<0.001). The average audit fee also
increases for the control group after the merger (¥184,500 with p-value<0.001). The difference in
audit fee increase between the treatment and control groups is quite small (¥19,730) and not
statistically significant (p-value=0.597).
Panel B of Table 11 presents the OLS regression results of using the natural logarithm of
the audit fee (FEE) as the dependent variable. Column 1 reports the results without time-varying
control variables. The coefficient on the interaction term POST×TREAT is 0.0061 and not
statistically significant (t-stat=0.23). It remains small and statistically insignificant (-0.0131 with
t-stat=-0.62) in column 2 when the full set of control variables is included in the estimation. These
results suggest that the audit performance improvement of the treatment group relative to the
control group is unlikely to be purely driven by auditor incentives induced by differential
reputation or litigation risk.
6. Conclusions
In this paper, we study knowledge transfer in audit firms by utilizing the setting of the rapid
audit market consolidation in China over the past twenty years. For each merger, we sort all client
companies into the treatment and control groups based on the relative industry expertise of their
30
auditors before the merger. We employ a difference-in-difference approach and examine whether
the audit quality for the treatment group improves after the merger (three-year post-merger versus
three-year pre-merger), relative to that for the control group. Our empirical tests exploit across-
client variation while removing all effects at the merged audit firm level by including merger fixed
effects. We find an economically significant improvement in audit quality (as reflected in a
reduction in misstatements and an increase in modified audit opinions) for the treatment group
relative to the control group in the same merged audit firm. The evidence is consistent with the
existence of knowledge transfer in audit firms.
We caution the reader that the audit market in China may be quite different from those in
other countries. The economic and regulatory forces underlying China’s audit market
consolidation may be unique and our documented evidence of knowledge transfer may hinge
critically on these forces. Thus, removing organizational boundaries may not necessarily lead to
knowledge transfer between the merging audit firms in a different economic and regulatory
environment. Assessing the generalizability of our findings with an alternative audit market setting
in other countries is left for future research.
31
References
Ai, C., and E. C. Norton. 2003. Interaction terms in logit and probit models. Economics Letters 80 (1): 123–129.
Aobdia, D., C. Lin, and R. Petacchi. 2015. Capital market consequences of audit partner quality. The Accounting Review 90 (6): 2143–2176.
Archambeault, D. S., F. T. Dezoort, and D. R. Hermanson. 2008. Audit committee incentive compensation and accounting restatements. Contemporary Accounting Research 25 (4): 965–992.
Argote, L. 1999. Organizational Learning: Creating, Retaining, and Transferring Knowledge. Norwell, MA: Kluwer.
Argote, L., and P. Ingram. 2000. Knowledge transfer: A basis for competitive advantage in firms. Organizational Behavior and Human Decision Processes 82 (1): 150–169.
Argote, L., P. Ingram, J. M. Levine, and R. L. Moreland. 2000. Knowledge transfer in organizations: Learning from the experience of others. Organizational Behavior and Human Decision Processes 82 (1): 1–8.
Argote, L., B. McEvily, and R. Reagans. 2003. Managing knowledge in organizations: An integrative framework and review of emerging themes. Management Science 49 (4): 571–582.
Asare, S. K., and L. S. McDaniel. 1996. The effect of familiarity with the preparer and task complexity on the effectiveness of the audit review process. The Accounting Review 71 (2): 139–159.
Balsam, S., J. Krishnan, and J. Yang. 2003. Auditor industry specialization and earnings quality. Auditing: A Journal of Practice & Theory 22 (2): 71–97.
Bar-Yosef, S., and B. Sarath. 2005. Auditor size, market segmentation and litigation patterns: A theoretical analysis. Review of Accounting Studies 10 (1): 59–92.
Baum, J. A. C., and P. Ingram. 1998. Survival-enhancing learning in the Manhattan hotel industry: 1898–1980. Management Science 44 (7): 996–1016.
Behn, B. K., J. Choi, and T. Kang. 2008. Audit quality and properties of analyst earnings forecasts. The Accounting Review 83 (2): 327–349.
Beyer, A., and S. S. Sridhar. 2006. Effects of multiple clients on the reliability of audit reports. Journal of Accounting Research 44 (1): 29–51.
Bloomfield, R., M. W. Nelson, and E. Soltes. 2016. Gathering data for archival, field, survey, and experimental accounting research. Journal of Accounting Research 54 (2): 341–395.
Bol, J. C., C. Estep, F. Moers, and M. E. Peecher. 2018. The role of tacit knowledge in auditor expertise and human capital development. Journal of Accounting Research 56 (4): 1205–1252.
Bonner, S. E. 2008. Judgment and Decision Making in Accounting. Upper Saddle River, NJ: Prentice Hall.
Bonner, S. E., and B. L. Lewis. 1990. Determinants of auditor expertise. Journal of Accounting Research 28 (Supplement): 1–20.
Brockner, J., Y. Chen, E. A. Mannix, K. Leung, and D. P. Skarlicki. 2000. Culture and procedural fairness: When the effects of what you do depend on how you do it. Administrative Science Quarterly 45 (1): 138–159.
Brown D. L., S. Shu, B. S. Soo, and G. M. Trompeter. 2013. The insurance hypothesis: An examination of KPMG’s audit clients around the investigation and settlement of the tax shelter. Auditing: A Journal of Practice & Theory 32 (4): 1–24.
32
Chan, K., and D. Wu. 2011. Aggregate quasi rents and auditor independence: Evidence from audit firm mergers in China. Contemporary Accounting Research 28 (1): 175–213.
Chaney, P. K., D. C. Jeter, and L. Shivakumar. 2004. Self-selection of auditors and audit pricing in private firms. The Accounting Review 79 (1): 51–72.
Chen, H., Z. Chen, G. J. Lobo, and Y. Wang. 2011. Effects of audit quality on earnings management and cost of equity capital: Evidence from China. Contemporary Accounting Research 28 (3): 892–925.
Chen, C., S. Chen, and X. Su. 2001. Profitability regulation, earnings management, and modified audit opinions: Evidence from China. Auditing: A Journal of Practice & Theory 20 (2): 9–30.
Chin, C., and H. Chi. 2009. Reducing restatements with increased industry expertise. Contemporary Accounting Research 26 (3): 729–765.
China Financial Times. 2005. Deloitte acquires Beijing Tianjian: New battle with Big 4. (In Chinese). March 27.
Chinese Institute of Certified Public Accountants (CICPA). 2012. Some policies to support accounting firms to increase size and competence. (In Chinese). June 8.
China Securities News. 2000. The international symposium of “World Trade Organization and the development of capital market in China” is held in Shanghai. (In Chinese). August 9.
China Securities News. 2004. 150 million dollar investment: Deloitte’s new plan in China. (In Chinese). June 2.
China Securities Regulatory Commission (CSRC). 2001. Who Audits China’s Securities Market: An Analysis of Audit Market. (In Chinese). Beijing, China: China Financial and Economic Press.
Choi., J., S. Kim, and K. Raman. 2017. Did the 1998 merger of Price Waterhouse and Coopers & Lybrand increase audit quality? Contemporary Accounting Research 34 (2): 1071–1102.
Danos, P., J. W. Eichenseher, and D. L. Holt. 1989. Specialized knowledge and its communication in auditing. Contemporary Accounting Research 6 (1): 91–109.
Darr, E. D., L. Argote, and D. Epple. 1995. The acquisition, transfer, and depreciation of knowledge in service organizations: Productivity in franchises. Management Science 41 (11): 1750–1762.
DeAngelo, L. E. 1981. Auditor size and audit quality. Journal of Accounting and Economics 3 (3): 183–199.
DeFond, M. L., D. H. Erkens, and J. Zhang. 2016. Do client characteristics really drive the Big N audit quality effect? New evidence from propensity score matching. Management Science 63 (11): 3628–3649.
DeFond, M. L., and J. Jiambalvo. 1991. Incidence and circumstances of accounting errors. The Accounting Review 66 (3): 643–655.
DeFond, M. L., and J. Jiambalvo. 1994. Debt covenant violation and manipulation of accruals. Journal of Accounting and Economics 17 (1-2): 145–176.
DeFond, M. L., and C. S. Lennox. 2011. The effect of SOX on small auditor exits and audit quality. Journal of Accounting and Economics 52 (1): 21–40.
DeFond, M. L., C. Lim, and Y. Zang. 2016. Client conservatism and auditor-client contracting. The Accounting Review 91 (1): 69–98.
DeFond, M. L., T. Wong, and S. Li. 2000. The impact of improved auditor independence on audit market concentration in China. Journal of Accounting and Economics 28 (3): 269–305.
33
DeFond, M. L., and J. Zhang. 2014. A review of archival auditing research. Journal of Accounting and Economics 58 (2-3): 275–326.
Dekeyser, S., A. Gaeremynck, and M. Willekens. 2018. Evidence of industry scale effects on audit hours, billing rates and pricing. Contemporary Accounting Research (forthcoming).
Dunn, K. A., and B. W. Mayhew. 2004. Audit firm industry specialization and client disclosure quality. Review of Accounting Studies 9 (1): 35–58.
Empson, L. 2001. Fear of exploitation and fear of contamination: Impediments to knowledge transfer in mergers between professional service firms. Human relations 54 (7): 839–862.
Ferguson, C., M. Pinnuck, and D. J. Skinner. 2017. Why is the audit market concentrated? The emergence of the Big 4 in Australia. Working paper. University of Melbourne, University of Melbourne and University of Chicago.
Firth, M. A., P. Mo, and R. Wong. 2012. Auditors’ organizational form, legal liability, and reporting conservatism: Evidence from China. Contemporary Accounting Research 29 (1): 57–93.
Francis, J. R., P. N. Michas, and M. Yu. 2013. Office size of Big 4 auditors and client restatements. Contemporary Accounting Research 30 (4), 626–1661.
Gibbins, M., and R. Swieringa. 1995. Twenty years of judgment research in accounting and auditing. In Judgment and Decision-Making Research in Accounting and Auditing, edited by R. Ashton, and A. Ashton. Cambridge, U.K.: Cambridge University Press.
Gong, Q., Z. Li, Y. Lin, and L. Wu. 2016. On the benefits of audit market consolidation: Evidence from merged audit firms. The Accounting Review 91 (2): 463–488.
Granovetter, M. 1985. Economic action and social structure: The problem of embeddedness. American Journal of Sociology 91 (3): 481–510.
Gul, F. A., D. Wu, and Z. Yang. 2013. Do individual auditors affect audit quality? Evidence from archival data. The Accounting Review 88 (6): 1993–2023.
He, X., S. Kothari, T. Xiao, and L. Zuo. 2018. Long-term impact of economic conditions on auditors’ judgment. The Accounting Review (forthcoming).
He, X., J. A. Pittman, and O. Rui. 2016. Reputational implications for partners after a major audit failure: Evidence from China. Journal of Business Ethics 138 (4): 703–722.
Heckman, J. J. 1979. Sample selection bias as a specification error. Econometrica 47 (1): 153–162.
Ingram, P., and T. Simons. 2002. The transfer of experience in groups of organizations: Implications for performance and competition. Management Science 48 (12): 1517–1533.
Ireland, C. J., and C. S. Lennox. 2002. The large audit firm fee premium: A case of selectivity bias? Journal of Accounting, Auditing and Finance 17 (1): 73–91.
Jiang, J., Y. Wang, and K. Wang. 2018. Big N auditors and audit quality: New evidence from quasi-experiments. The Accounting Review (forthcoming).
Kadous, K., J. Leiby, and M. E. Peecher. 2013. How do auditors weight informal advice? The joint influence of affiliation strength and advice quality. The Accounting Review 88 (6): 2061–2087.
Ke, B., C. S. Lennox, and Q. Xin. 2015. The effect of China’s weak institutional environment on the quality of Big 4 audits. The Accounting Review 90 (4): 1591–1619.
Kennedy, J., D. N. Kleinmuntz, and M. E. Peecher. 1997. Determinants of the justifiability of performance in III-structured tasks. Journal of Accounting Research 35 (4): 105–23.
34
Kinney, W. R., and L. S. McDaniel. 1989. Characteristics of firms correcting previously reported quarterly earnings. Journal of Accounting and Economics 11 (1): 71–93.
Kinney, W. R., Z. Palmrose, and S. Scholz. 2004. Auditor independence, non-audit services, and restatements: Was the U.S. government right? Journal of Accounting Research 42 (3): 561–588.
Knechel, W. R. 2000. Behavioral research in auditing and its impact on audit education. Issues in Accounting Education 15 (4): 695–712.
Knechel, W. R., V. Naiker, and G. Pacheco. 2007. Does auditor industry specialization matter? Evidence from market reaction to auditor switches. Auditing: A Journal of Practice & Theory 26 (1): 19–45.
Knechel, W. R., D. S. Sharma. 2012. Auditor-provided nonaudit services and audit effectiveness and efficiency: Evidence from pre- and post-SOX audit report lags. Auditing: A Journal of Practice and Theory 31 (4): 85–114.
Knechel, W. R., A. Vanstraelen, and M. Zerni. 2015. Does the identity of engagement partners matter? An analysis of audit partner reporting decisions. Contemporary Accounting Research 32 (4): 1443–1478.
Lawrence, A., M. Minutti-Meza, and P. Zhang. 2011. Can Big 4 versus non-Big 4 differences in audit-quality proxies be attributed to client characteristics? The Accounting Review 86 (1): 259–286.
Lennox, C. S., J. R. Francis, and Z. Wang. 2012. Selection models in accounting research. The Accounting Review 87 (2): 589–616.
Lennox, C. S., and J. A. Pittman. 2010. Big Five audits and accounting fraud. Contemporary Accounting Research 27 (1): 209–247.
Lennox, C. S., and X. Wu. 2018. A review of the archival literature on audit partners. Accounting Horizons 32 (2): 1–35.
Lennox, C. S., X. Wu, and T. Zhang. 2014. Does mandatory rotation of audit partners improve audit quality? The Accounting Review 89 (5): 1775–1803.
Lennox, C. S., X. Wu, and T. Zhang. 2016. The effect of audit adjustments on earnings quality: Evidence from China. Journal of Accounting and Economics 61(2-3): 545–562.
Leone, A. J., S. Rice, J. P. Weber, and M. Willenborg. 2013. How do auditors behave during periods of market euphoria? The case of internet IPOs. Contemporary Accounting Research 30 (1): 182–214.
Li, L., B. Qi, G. Tian, and G. Zhang. 2017. The contagion effect of low-quality audits along individual auditors. The Accounting Review 92 (1): 137–163.
Libby, R. 1981. Accounting and Human Information Processing: Theory and Applications. Englewood Cliffs, NJ: Prentice-Hall.
Libby, R., R. Bloomfield, and M. W. Nelson. 2002. Experimental research in financial accounting. Accounting, Organizations and Society 27 (8): 775–810.
Libby, R., and J. Luft. 1993. Determinants of judgment performance in accounting settings: Ability, knowledge, motivation, and environment. Accounting, Organizations and Society 18 (5): 425–450.
Libby, R., and H. Tan. 1994. Modeling the determinants of audit expertise. Accounting, Organizations and Society 19 (8): 701–716.
Lim, C., and H. Tan. 2008. Non-audit service fees and audit quality: The impact of auditor specialization. Journal of Accounting Research 46 (1): 199–246.
Minutti-Meza, M. 2013. Does auditor industry specialization improve audit quality? Journal of Accounting Research 51 (4): 779–817.
35
Neal, T. L., and R. R. Riley, Jr. 2004. Auditor industry specialist research design. Auditing: A Journal of Practice and Theory 23 (2): 169–177.
Nelson, M. W. 2009. A model and literature review of professional skepticism in auditing. Auditing: A Journal of Practice and Theory 28 (2): 1–34.
Nelson, M. W., and H. Tan. 2005. Judgment and decision making research in auditing: A task, person, and interpersonal interaction perspective. Auditing: A Journal of Practice & Theory 24 (Supplement): 41–71.
Payne, J. L. 2008. The influence of audit firm specialization on analysts’ forecast errors. Auditing: A Journal of Practice & Theory. 27(2): 109–136.
Petroni, K., and M. Beasley. 1996. Errors in accounting estimates and their relation to audit firm type. Journal of Accounting Research 34 (1): 151–171.
Public Company Accounting Oversight Board (PCAOB). 2015. Concept Release on Audit Quality Indicators. Release No. 2015-005. Washington DC: PCAOB.
Puhani, P. A. 2012. The treatment effect, the cross difference, and the interaction term in nonlinear “difference-in-differences” models. Economics Letters 115 (1): 85–87.
Ramsay, R. J. 1994. Senior/manager differences in audit workpaper review performance. Journal of Accounting Research 32 (1): 127–135.
Reichelt, K. J., and D. Wang. 2010. National and office-specific measures of auditor industry expertise and effects on audit quality. Journal of Accounting Research 48 (3): 647–686.
Rogers, E. M., and D. K. Bhowmik. 1970. Homophily-heterophily: Relational concepts for communication research. Public Opinion Quarterly 34 (4): 523–538.
Shipman J. E., Q. T. Swanquist, and R. L. Whited. 2017. Propensity score matching in accounting research. The Accounting Review 92 (1): 213–244.
Simon, H. A. 1973. Apply information technology to organization design. Public Administration Review 33 (3): 268–278.
Simunic, D., 1984. Auditing, consulting, and auditor independence. Journal of Accounting Research 22 (2): 679–702.
Starbuck, W. H. 1992. Learning by knowledge-intensive firms. Journal of Management Studies 29 (6): 713–740.
Stimpson, J. 1999. In the know. Practical Accountant 7 (6): 34–39.
Tan, H., and R. Libby. 1997. Tacit managerial versus technical knowledge as determinants of audit expertise in the field. Journal of Accounting Research 35 (1): 97–113.
Tang, Y. 2000. Bumpy road leading to internationalization: A review of accounting development in China. Accounting Horizons 14 (1): 93–102.
Teoh, S., and T. Wong. 1993. Perceived auditor quality and the earnings response coefficient. The Accounting Review 68 (2): 346–366.
Trotman, K. T. 1985. The review process and the accuracy of auditor judgments. Journal of Accounting Research 23(2): 740–752.
Trotman, K. T., and P. W. Yetton. 1985. The effect of the review process on auditor judgments. Journal of Accounting Research 23(1): 256–267.
36
Vera-Muñoz, S. C., J. Ho, and C. Chow. 2006. Enhancing knowledge sharing in public accounting firms. Accounting Horizons 20 (2): 133–155
Wang, Q., T. Wong, and L. Xia. 2008. State ownership, the institutional environment, and auditor choice: Evidence from China. Journal of Accounting and Economics 46 (1): 112–134.
Watts, R. L., and J. L. Zimmerman. 1986. Positive Accounting Theory. Englewood Cliffs, NJ: Prentice-Hall.
Weber, J., and M. Willenborg. 2003. Do expert informational intermediaries add value? Evidence from auditors in microcap IPOs. Journal of Accounting Research 41 (4): 681–720.
Willenborg, M. 1999. Empirical analysis of the economic demand for auditing in the initial public offerings market. Journal of Accounting Research 37 (1): 225–238.
Zang, A. 2012. Evidence on the trade-off between real activities manipulation and accrual-based earnings management. The Accounting Review 87 (2): 675–703.
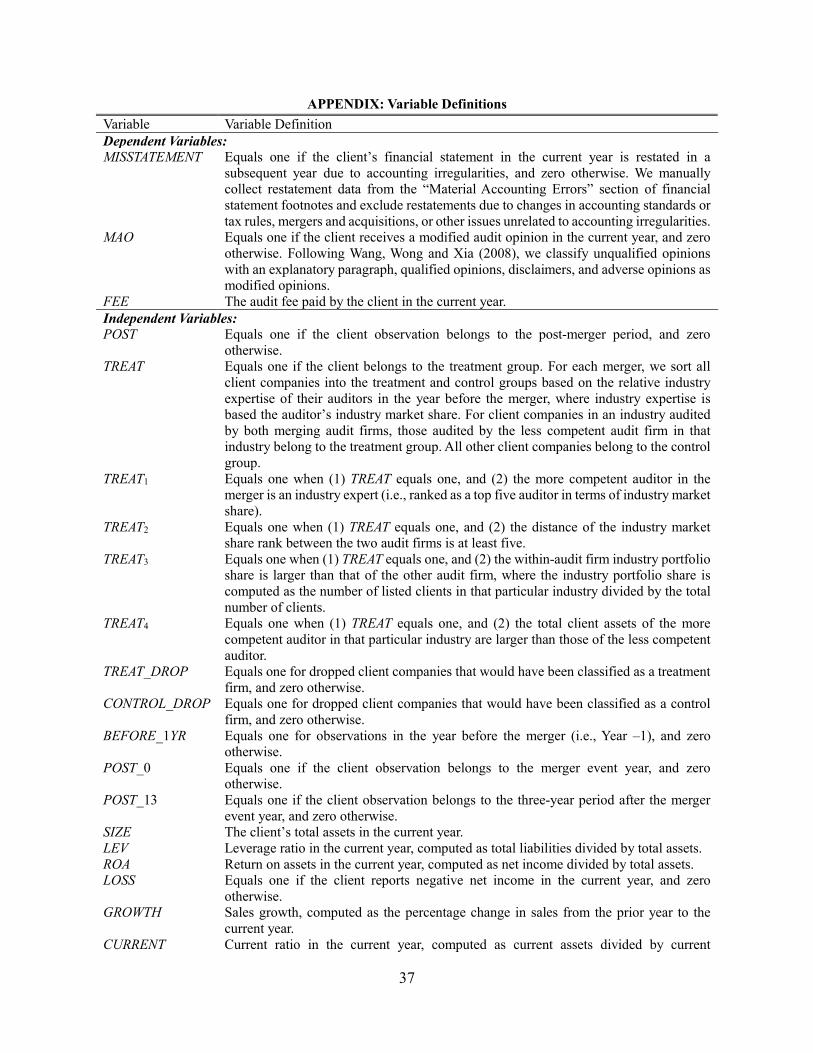
37
APPENDIX: Variable Definitions Variable Variable Definition Dependent Variables: MISSTATEMENT Equals one if the client’s financial statement in the current year is restated in a
subsequent year due to accounting irregularities, and zero otherwise. We manually collect restatement data from the “Material Accounting Errors” section of financial statement footnotes and exclude restatements due to changes in accounting standards or tax rules, mergers and acquisitions, or other issues unrelated to accounting irregularities.
MAO Equals one if the client receives a modified audit opinion in the current year, and zero otherwise. Following Wang, Wong and Xia (2008), we classify unqualified opinions with an explanatory paragraph, qualified opinions, disclaimers, and adverse opinions as modified opinions.
FEE The audit fee paid by the client in the current year. Independent Variables: POST Equals one if the client observation belongs to the post-merger period, and zero
otherwise. TREAT Equals one if the client belongs to the treatment group. For each merger, we sort all
client companies into the treatment and control groups based on the relative industry expertise of their auditors in the year before the merger, where industry expertise is based the auditor’s industry market share. For client companies in an industry audited by both merging audit firms, those audited by the less competent audit firm in that industry belong to the treatment group. All other client companies belong to the control group.
TREAT1 Equals one when (1) TREAT equals one, and (2) the more competent auditor in the merger is an industry expert (i.e., ranked as a top five auditor in terms of industry market share).
TREAT2 Equals one when (1) TREAT equals one, and (2) the distance of the industry market share rank between the two audit firms is at least five.
TREAT3 Equals one when (1) TREAT equals one, and (2) the within-audit firm industry portfolio share is larger than that of the other audit firm, where the industry portfolio share is computed as the number of listed clients in that particular industry divided by the total number of clients.
TREAT4 Equals one when (1) TREAT equals one, and (2) the total client assets of the more competent auditor in that particular industry are larger than those of the less competent auditor.
TREAT_DROP Equals one for dropped client companies that would have been classified as a treatment firm, and zero otherwise.
CONTROL_DROP Equals one for dropped client companies that would have been classified as a control firm, and zero otherwise.
BEFORE_1YR Equals one for observations in the year before the merger (i.e., Year –1), and zero otherwise.
POST_0 Equals one if the client observation belongs to the merger event year, and zero otherwise.
POST_13 Equals one if the client observation belongs to the three-year period after the merger event year, and zero otherwise.
SIZE The client’s total assets in the current year. LEV Leverage ratio in the current year, computed as total liabilities divided by total assets. ROA Return on assets in the current year, computed as net income divided by total assets. LOSS Equals one if the client reports negative net income in the current year, and zero
otherwise. GROWTH Sales growth, computed as the percentage change in sales from the prior year to the
current year. CURRENT Current ratio in the current year, computed as current assets divided by current

38
liabilities. AGE The number of years that the client has been listed. TENURE The number of continuous years that the client has been audited by the audit firm.
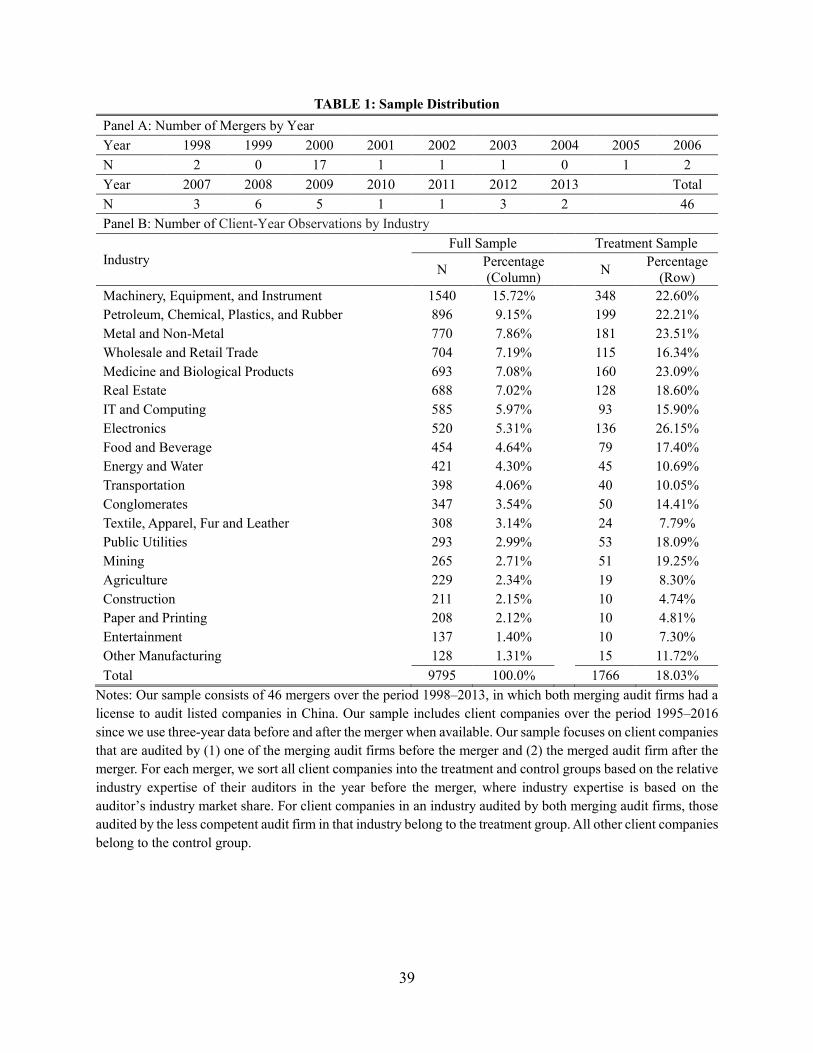
39
TABLE 1: Sample Distribution Panel A: Number of Mergers by Year Year 1998 1999 2000 2001 2002 2003 2004 2005 2006 N 2 0 17 1 1 1 0 1 2 Year 2007 2008 2009 2010 2011 2012 2013 Total N 3 6 5 1 1 3 2 46 Panel B: Number of Client-Year Observations by Industry
Industry Full Sample Treatment Sample
N Percentage (Column) N Percentage
(Row) Machinery, Equipment, and Instrument 1540 15.72% 348 22.60% Petroleum, Chemical, Plastics, and Rubber 896 9.15% 199 22.21% Metal and Non-Metal 770 7.86% 181 23.51% Wholesale and Retail Trade 704 7.19% 115 16.34% Medicine and Biological Products 693 7.08% 160 23.09% Real Estate 688 7.02% 128 18.60% IT and Computing 585 5.97% 93 15.90% Electronics 520 5.31% 136 26.15% Food and Beverage 454 4.64% 79 17.40% Energy and Water 421 4.30% 45 10.69% Transportation 398 4.06% 40 10.05% Conglomerates 347 3.54% 50 14.41% Textile, Apparel, Fur and Leather 308 3.14% 24 7.79% Public Utilities 293 2.99% 53 18.09% Mining 265 2.71% 51 19.25% Agriculture 229 2.34% 19 8.30% Construction 211 2.15% 10 4.74% Paper and Printing 208 2.12% 10 4.81% Entertainment 137 1.40% 10 7.30% Other Manufacturing 128 1.31% 15 11.72% Total 9795 100.0% 1766 18.03%
Notes: Our sample consists of 46 mergers over the period 1998–2013, in which both merging audit firms had a license to audit listed companies in China. Our sample includes client companies over the period 1995–2016 since we use three-year data before and after the merger when available. Our sample focuses on client companies that are audited by (1) one of the merging audit firms before the merger and (2) the merged audit firm after the merger. For each merger, we sort all client companies into the treatment and control groups based on the relative industry expertise of their auditors in the year before the merger, where industry expertise is based on the auditor’s industry market share. For client companies in an industry audited by both merging audit firms, those audited by the less competent audit firm in that industry belong to the treatment group. All other client companies belong to the control group.
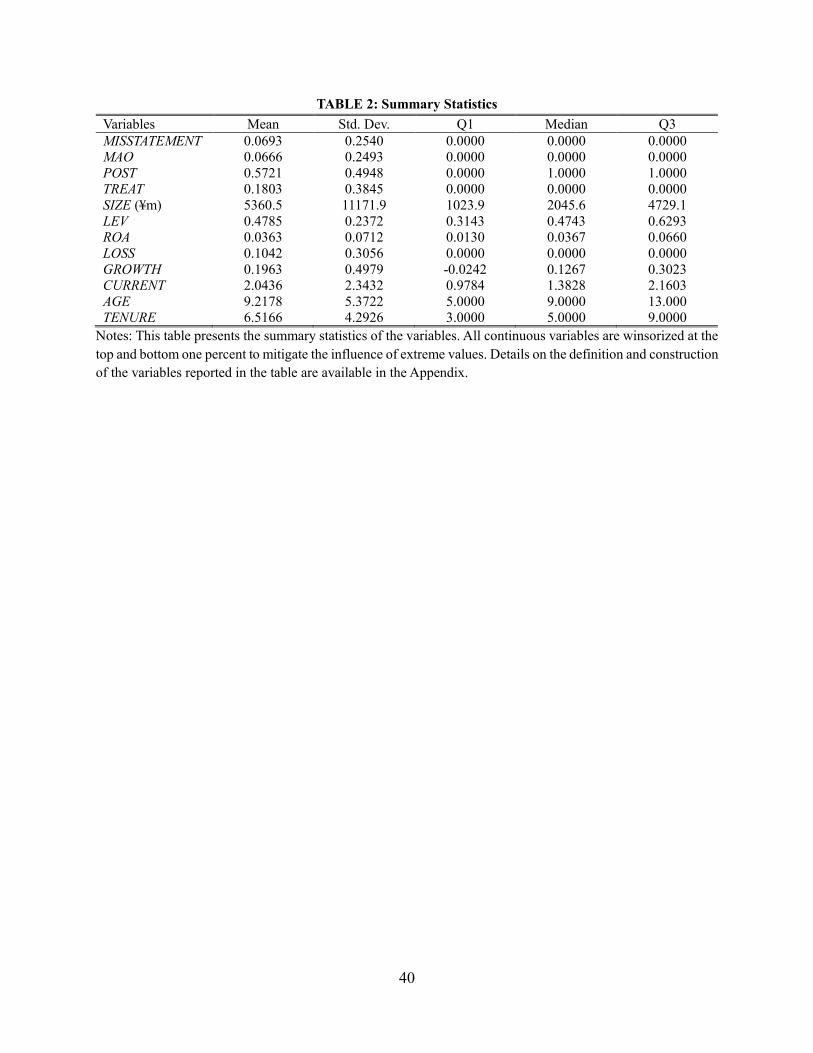
40
TABLE 2: Summary Statistics Variables Mean Std. Dev. Q1 Median Q3 MISSTATEMENT 0.0693 0.2540 0.0000 0.0000 0.0000 MAO 0.0666 0.2493 0.0000 0.0000 0.0000 POST 0.5721 0.4948 0.0000 1.0000 1.0000 TREAT 0.1803 0.3845 0.0000 0.0000 0.0000 SIZE (¥m) 5360.5 11171.9 1023.9 2045.6 4729.1 LEV 0.4785 0.2372 0.3143 0.4743 0.6293 ROA 0.0363 0.0712 0.0130 0.0367 0.0660 LOSS 0.1042 0.3056 0.0000 0.0000 0.0000 GROWTH 0.1963 0.4979 -0.0242 0.1267 0.3023 CURRENT 2.0436 2.3432 0.9784 1.3828 2.1603 AGE 9.2178 5.3722 5.0000 9.0000 13.000 TENURE 6.5166 4.2926 3.0000 5.0000 9.0000
Notes: This table presents the summary statistics of the variables. All continuous variables are winsorized at the top and bottom one percent to mitigate the influence of extreme values. Details on the definition and construction of the variables reported in the table are available in the Appendix.
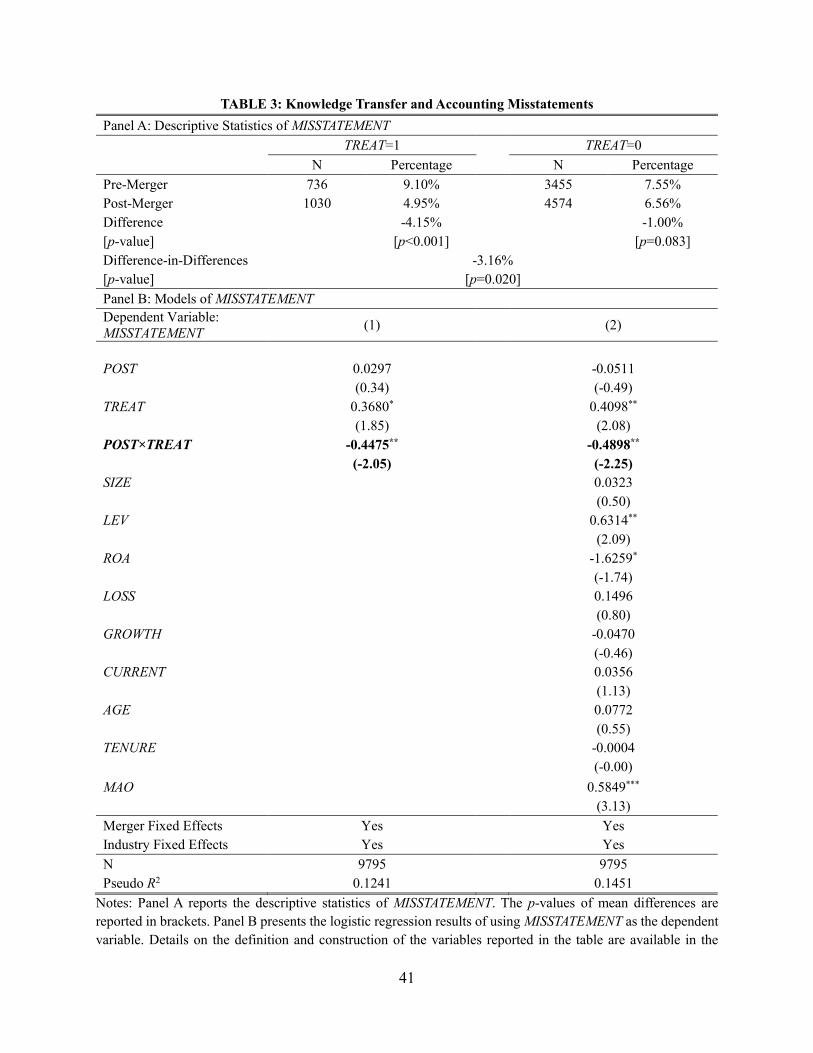
41
TABLE 3: Knowledge Transfer and Accounting Misstatements Panel A: Descriptive Statistics of MISSTATEMENT
TREAT=1 TREAT=0
N Percentage N Percentage Pre-Merger 736 9.10% 3455 7.55% Post-Merger 1030 4.95% 4574 6.56% Difference -4.15% -1.00% [p-value] [p<0.001] [p=0.083] Difference-in-Differences -3.16% [p-value] [p=0.020] Panel B: Models of MISSTATEMENT Dependent Variable: MISSTATEMENT (1) (2)
POST 0.0297 -0.0511 (0.34) (-0.49) TREAT 0.3680* 0.4098** (1.85) (2.08) POST×TREAT -0.4475** -0.4898** (-2.05) (-2.25) SIZE 0.0323 (0.50) LEV 0.6314** (2.09) ROA -1.6259* (-1.74) LOSS 0.1496 (0.80) GROWTH -0.0470 (-0.46) CURRENT 0.0356 (1.13) AGE 0.0772 (0.55) TENURE -0.0004 (-0.00) MAO 0.5849*** (3.13) Merger Fixed Effects Yes Yes Industry Fixed Effects Yes Yes N 9795 9795 Pseudo R2 0.1241 0.1451
Notes: Panel A reports the descriptive statistics of MISSTATEMENT. The p-values of mean differences are reported in brackets. Panel B presents the logistic regression results of using MISSTATEMENT as the dependent variable. Details on the definition and construction of the variables reported in the table are available in the

42
Appendix. For SIZE, AGE and TENURE, log-transformed values are used in the regressions. z-statistics shown in parentheses are adjusted for clustering by client. *, **, *** indicate significance at the 10%, 5%, and 1% levels (two-tailed), respectively.
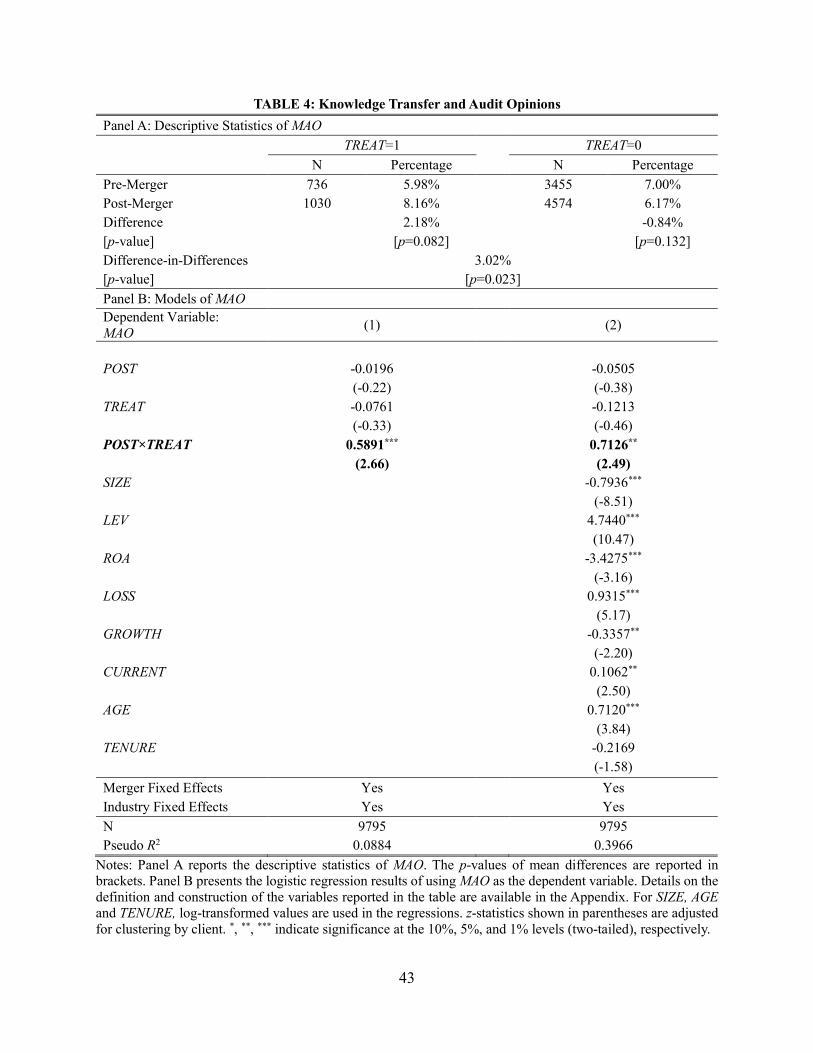
43
TABLE 4: Knowledge Transfer and Audit Opinions Panel A: Descriptive Statistics of MAO
TREAT=1 TREAT=0
N Percentage N Percentage Pre-Merger 736 5.98% 3455 7.00% Post-Merger 1030 8.16% 4574 6.17% Difference 2.18% -0.84% [p-value] [p=0.082] [p=0.132] Difference-in-Differences 3.02% [p-value] [p=0.023] Panel B: Models of MAO Dependent Variable: MAO (1) (2)
POST -0.0196 -0.0505 (-0.22) (-0.38) TREAT -0.0761 -0.1213 (-0.33) (-0.46) POST×TREAT 0.5891*** 0.7126** (2.66) (2.49) SIZE -0.7936*** (-8.51) LEV 4.7440*** (10.47) ROA -3.4275*** (-3.16) LOSS 0.9315*** (5.17) GROWTH -0.3357** (-2.20) CURRENT 0.1062** (2.50) AGE 0.7120*** (3.84) TENURE -0.2169 (-1.58) Merger Fixed Effects Yes Yes Industry Fixed Effects Yes Yes N 9795 9795 Pseudo R2 0.0884 0.3966
Notes: Panel A reports the descriptive statistics of MAO. The p-values of mean differences are reported in brackets. Panel B presents the logistic regression results of using MAO as the dependent variable. Details on the definition and construction of the variables reported in the table are available in the Appendix. For SIZE, AGE and TENURE, log-transformed values are used in the regressions. z-statistics shown in parentheses are adjusted for clustering by client. *, **, *** indicate significance at the 10%, 5%, and 1% levels (two-tailed), respectively.
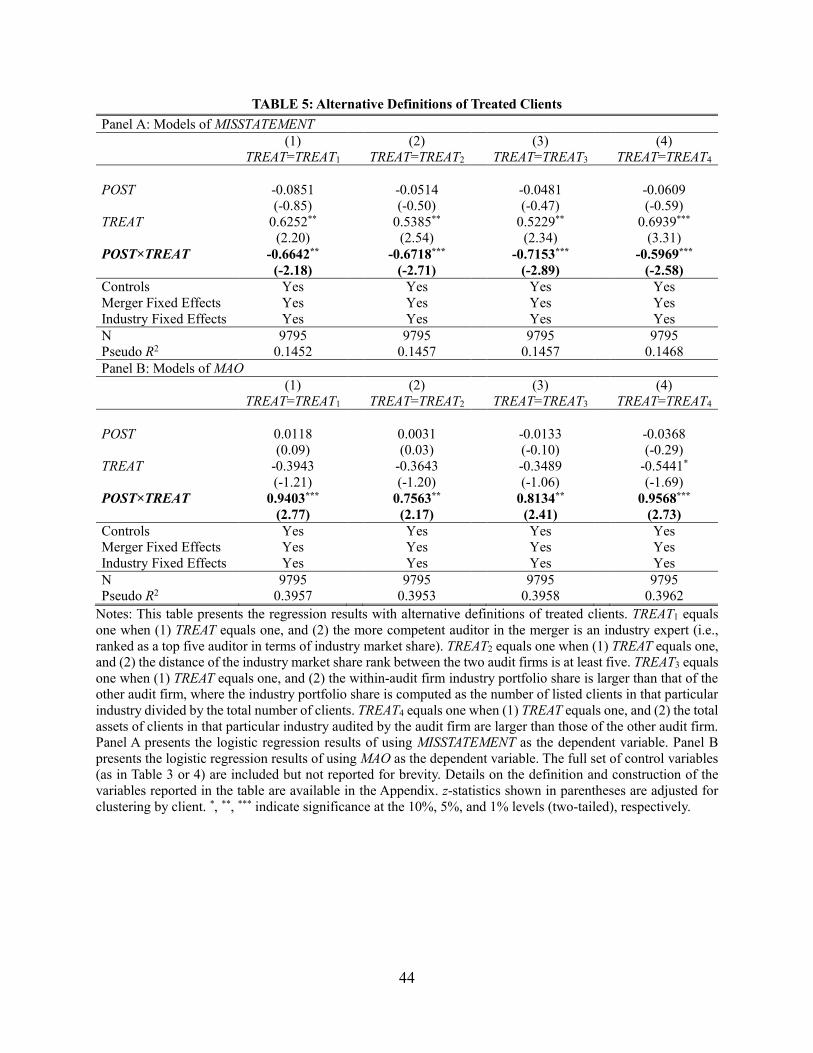
44
TABLE 5: Alternative Definitions of Treated Clients Panel A: Models of MISSTATEMENT
(1) TREAT=TREAT1 (2)
TREAT=TREAT2 (3) TREAT=TREAT3 (4)
TREAT=TREAT4 POST -0.0851 -0.0514 -0.0481 -0.0609 (-0.85) (-0.50) (-0.47) (-0.59) TREAT 0.6252** 0.5385** 0.5229** 0.6939*** (2.20) (2.54) (2.34) (3.31) POST×TREAT -0.6642** -0.6718*** -0.7153*** -0.5969*** (-2.18) (-2.71) (-2.89) (-2.58) Controls Yes Yes Yes Yes Merger Fixed Effects Yes Yes Yes Yes Industry Fixed Effects Yes Yes Yes Yes N 9795 9795 9795 9795 Pseudo R2 0.1452 0.1457 0.1457 0.1468 Panel B: Models of MAO
(1) TREAT=TREAT1 (2)
TREAT=TREAT2 (3) TREAT=TREAT3 (4)
TREAT=TREAT4 POST 0.0118 0.0031 -0.0133 -0.0368 (0.09) (0.03) (-0.10) (-0.29) TREAT -0.3943 -0.3643 -0.3489 -0.5441* (-1.21) (-1.20) (-1.06) (-1.69) POST×TREAT 0.9403*** 0.7563** 0.8134** 0.9568*** (2.77) (2.17) (2.41) (2.73) Controls Yes Yes Yes Yes Merger Fixed Effects Yes Yes Yes Yes Industry Fixed Effects Yes Yes Yes Yes N 9795 9795 9795 9795 Pseudo R2 0.3957 0.3953 0.3958 0.3962
Notes: This table presents the regression results with alternative definitions of treated clients. TREAT1 equals one when (1) TREAT equals one, and (2) the more competent auditor in the merger is an industry expert (i.e., ranked as a top five auditor in terms of industry market share). TREAT2 equals one when (1) TREAT equals one, and (2) the distance of the industry market share rank between the two audit firms is at least five. TREAT3 equals one when (1) TREAT equals one, and (2) the within-audit firm industry portfolio share is larger than that of the other audit firm, where the industry portfolio share is computed as the number of listed clients in that particular industry divided by the total number of clients. TREAT4 equals one when (1) TREAT equals one, and (2) the total assets of clients in that particular industry audited by the audit firm are larger than those of the other audit firm. Panel A presents the logistic regression results of using MISSTATEMENT as the dependent variable. Panel B presents the logistic regression results of using MAO as the dependent variable. The full set of control variables (as in Table 3 or 4) are included but not reported for brevity. Details on the definition and construction of the variables reported in the table are available in the Appendix. z-statistics shown in parentheses are adjusted for clustering by client. *, **, *** indicate significance at the 10%, 5%, and 1% levels (two-tailed), respectively.
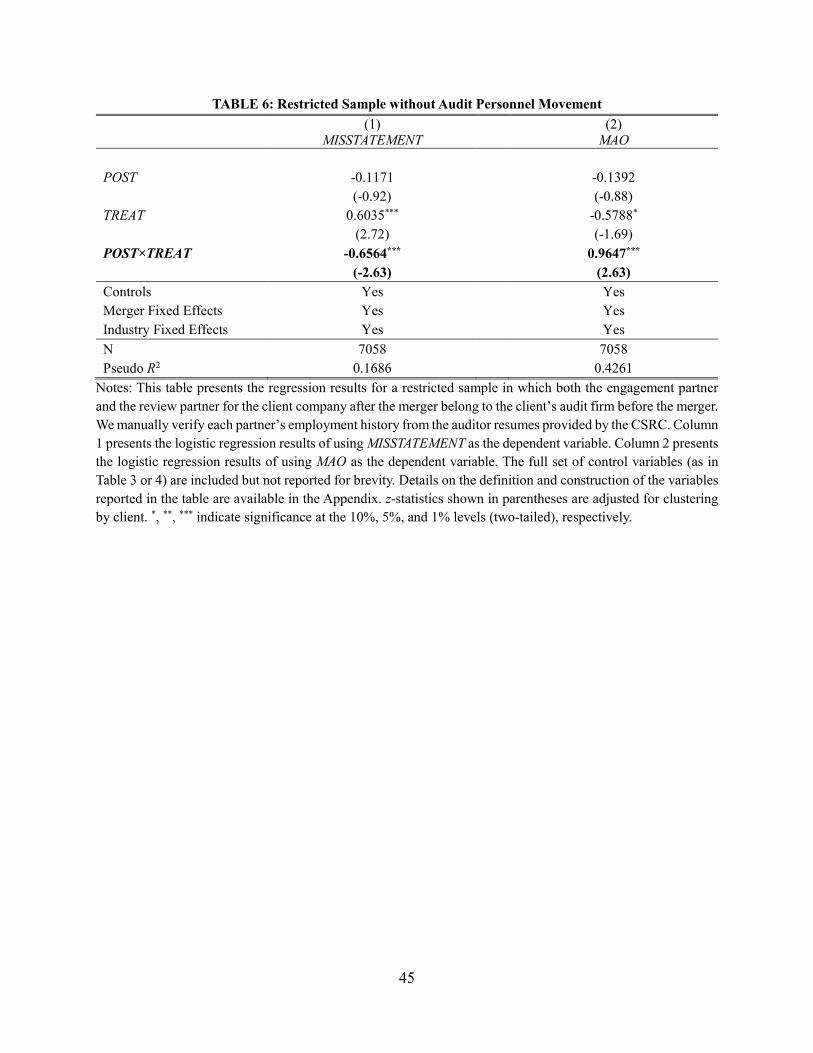
45
TABLE 6: Restricted Sample without Audit Personnel Movement
(1) MISSTATEMENT (2)
MAO POST -0.1171 -0.1392 (-0.92) (-0.88) TREAT 0.6035*** -0.5788* (2.72) (-1.69) POST×TREAT -0.6564*** 0.9647*** (-2.63) (2.63) Controls Yes Yes Merger Fixed Effects Yes Yes Industry Fixed Effects Yes Yes N 7058 7058 Pseudo R2 0.1686 0.4261
Notes: This table presents the regression results for a restricted sample in which both the engagement partner and the review partner for the client company after the merger belong to the client’s audit firm before the merger. We manually verify each partner’s employment history from the auditor resumes provided by the CSRC. Column 1 presents the logistic regression results of using MISSTATEMENT as the dependent variable. Column 2 presents the logistic regression results of using MAO as the dependent variable. The full set of control variables (as in Table 3 or 4) are included but not reported for brevity. Details on the definition and construction of the variables reported in the table are available in the Appendix. z-statistics shown in parentheses are adjusted for clustering by client. *, **, *** indicate significance at the 10%, 5%, and 1% levels (two-tailed), respectively.
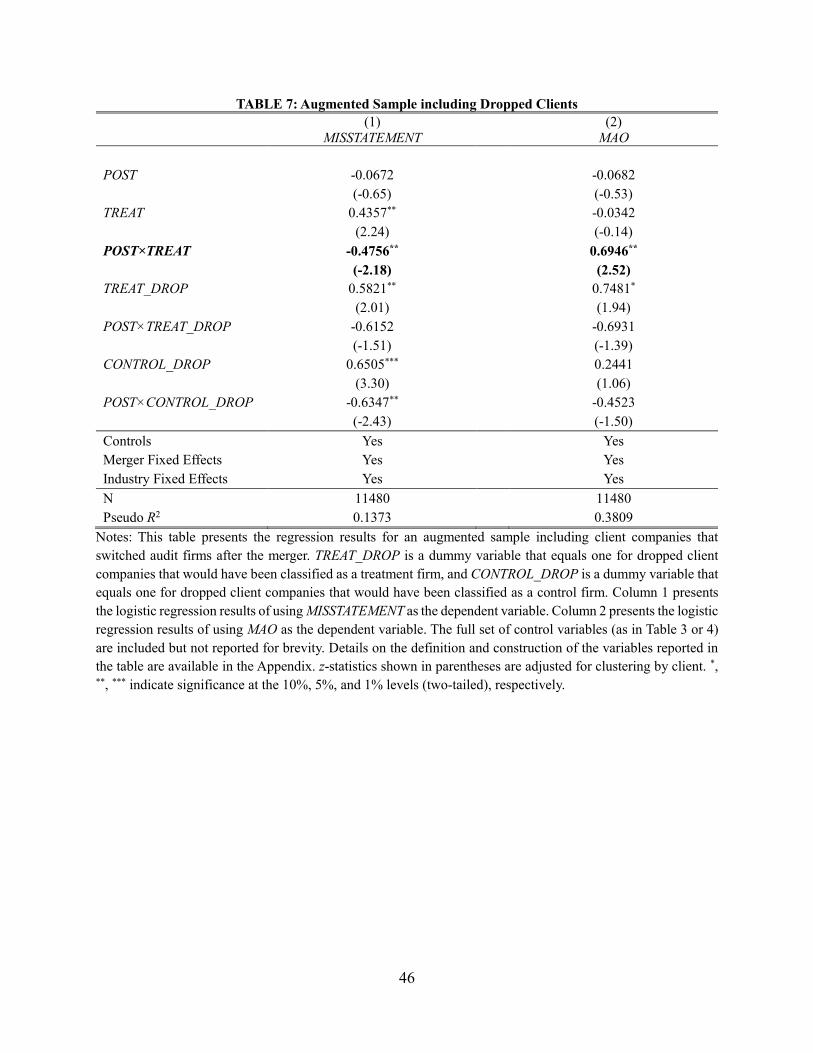
46
TABLE 7: Augmented Sample including Dropped Clients
(1) MISSTATEMENT (2)
MAO POST -0.0672 -0.0682 (-0.65) (-0.53) TREAT 0.4357** -0.0342 (2.24) (-0.14) POST×TREAT -0.4756** 0.6946** (-2.18) (2.52) TREAT_DROP 0.5821** 0.7481* (2.01) (1.94) POST×TREAT_DROP -0.6152 -0.6931 (-1.51) (-1.39) CONTROL_DROP 0.6505*** 0.2441 (3.30) (1.06) POST×CONTROL_DROP -0.6347** -0.4523 (-2.43) (-1.50) Controls Yes Yes Merger Fixed Effects Yes Yes Industry Fixed Effects Yes Yes N 11480 11480 Pseudo R2 0.1373 0.3809
Notes: This table presents the regression results for an augmented sample including client companies that switched audit firms after the merger. TREAT_DROP is a dummy variable that equals one for dropped client companies that would have been classified as a treatment firm, and CONTROL_DROP is a dummy variable that equals one for dropped client companies that would have been classified as a control firm. Column 1 presents the logistic regression results of using MISSTATEMENT as the dependent variable. Column 2 presents the logistic regression results of using MAO as the dependent variable. The full set of control variables (as in Table 3 or 4) are included but not reported for brevity. Details on the definition and construction of the variables reported in the table are available in the Appendix. z-statistics shown in parentheses are adjusted for clustering by client. *, **, *** indicate significance at the 10%, 5%, and 1% levels (two-tailed), respectively.
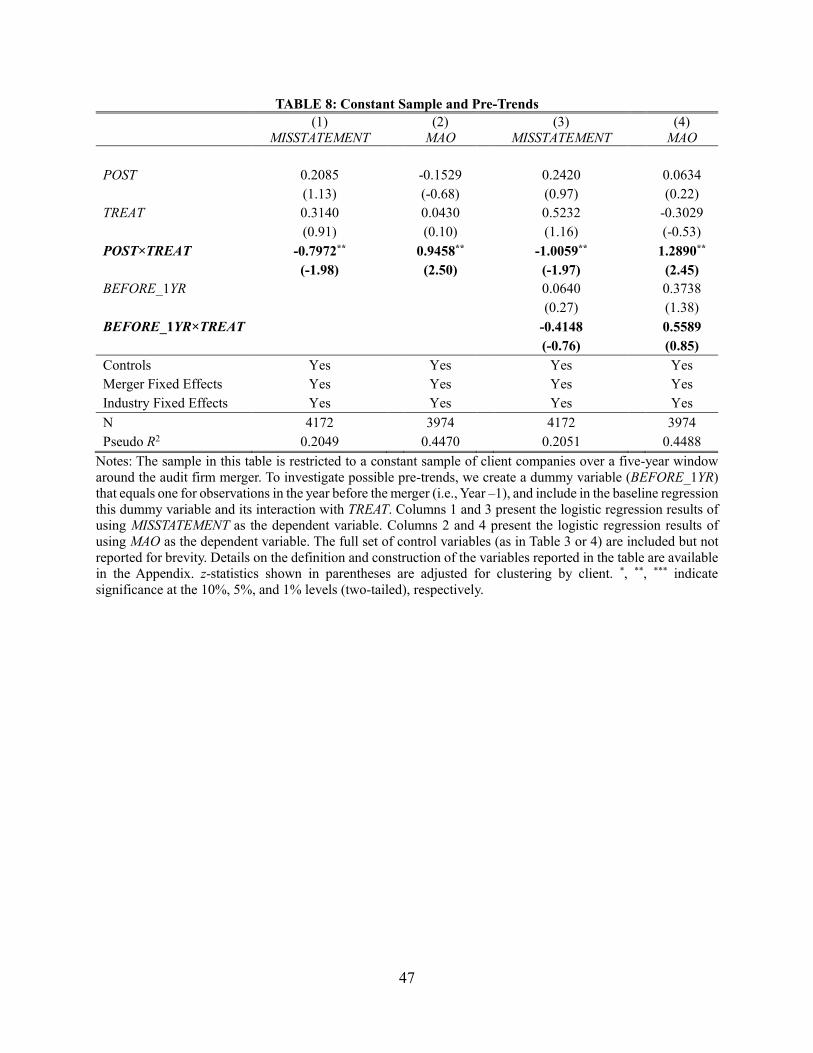
47
TABLE 8: Constant Sample and Pre-Trends
(1) MISSTATEMENT (2)
MAO (3) MISSTATEMENT (4)
MAO POST 0.2085 -0.1529 0.2420 0.0634 (1.13) (-0.68) (0.97) (0.22) TREAT 0.3140 0.0430 0.5232 -0.3029 (0.91) (0.10) (1.16) (-0.53) POST×TREAT -0.7972** 0.9458** -1.0059** 1.2890** (-1.98) (2.50) (-1.97) (2.45) BEFORE_1YR 0.0640 0.3738 (0.27) (1.38) BEFORE_1YR×TREAT -0.4148 0.5589 (-0.76) (0.85) Controls Yes Yes Yes Yes Merger Fixed Effects Yes Yes Yes Yes Industry Fixed Effects Yes Yes Yes Yes N 4172 3974 4172 3974 Pseudo R2 0.2049 0.4470 0.2051 0.4488
Notes: The sample in this table is restricted to a constant sample of client companies over a five-year window around the audit firm merger. To investigate possible pre-trends, we create a dummy variable (BEFORE_1YR) that equals one for observations in the year before the merger (i.e., Year –1), and include in the baseline regression this dummy variable and its interaction with TREAT. Columns 1 and 3 present the logistic regression results of using MISSTATEMENT as the dependent variable. Columns 2 and 4 present the logistic regression results of using MAO as the dependent variable. The full set of control variables (as in Table 3 or 4) are included but not reported for brevity. Details on the definition and construction of the variables reported in the table are available in the Appendix. z-statistics shown in parentheses are adjusted for clustering by client. *, **, *** indicate significance at the 10%, 5%, and 1% levels (two-tailed), respectively.
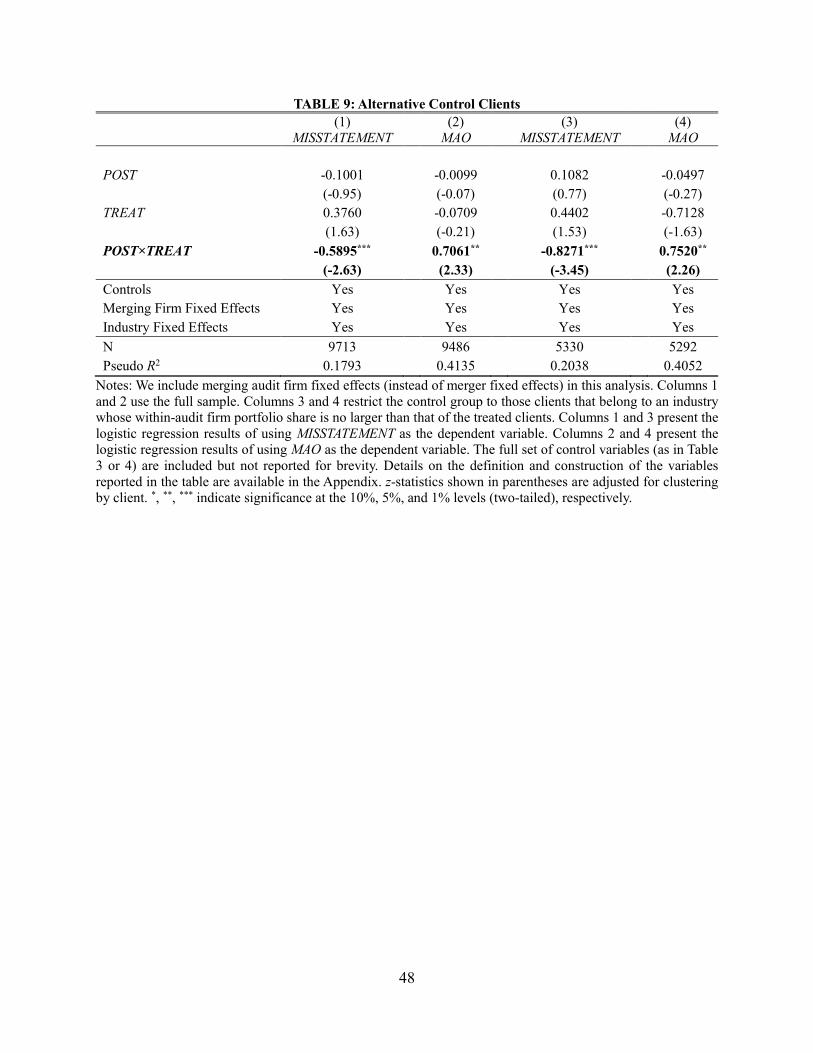
48
TABLE 9: Alternative Control Clients
(1) MISSTATEMENT (2)
MAO (3) MISSTATEMENT (4)
MAO POST -0.1001 -0.0099 0.1082 -0.0497 (-0.95) (-0.07) (0.77) (-0.27) TREAT 0.3760 -0.0709 0.4402 -0.7128 (1.63) (-0.21) (1.53) (-1.63) POST×TREAT -0.5895*** 0.7061** -0.8271*** 0.7520** (-2.63) (2.33) (-3.45) (2.26) Controls Yes Yes Yes Yes Merging Firm Fixed Effects Yes Yes Yes Yes Industry Fixed Effects Yes Yes Yes Yes N 9713 9486 5330 5292 Pseudo R2 0.1793 0.4135 0.2038 0.4052
Notes: We include merging audit firm fixed effects (instead of merger fixed effects) in this analysis. Columns 1 and 2 use the full sample. Columns 3 and 4 restrict the control group to those clients that belong to an industry whose within-audit firm portfolio share is no larger than that of the treated clients. Columns 1 and 3 present the logistic regression results of using MISSTATEMENT as the dependent variable. Columns 2 and 4 present the logistic regression results of using MAO as the dependent variable. The full set of control variables (as in Table 3 or 4) are included but not reported for brevity. Details on the definition and construction of the variables reported in the table are available in the Appendix. z-statistics shown in parentheses are adjusted for clustering by client. *, **, *** indicate significance at the 10%, 5%, and 1% levels (two-tailed), respectively.
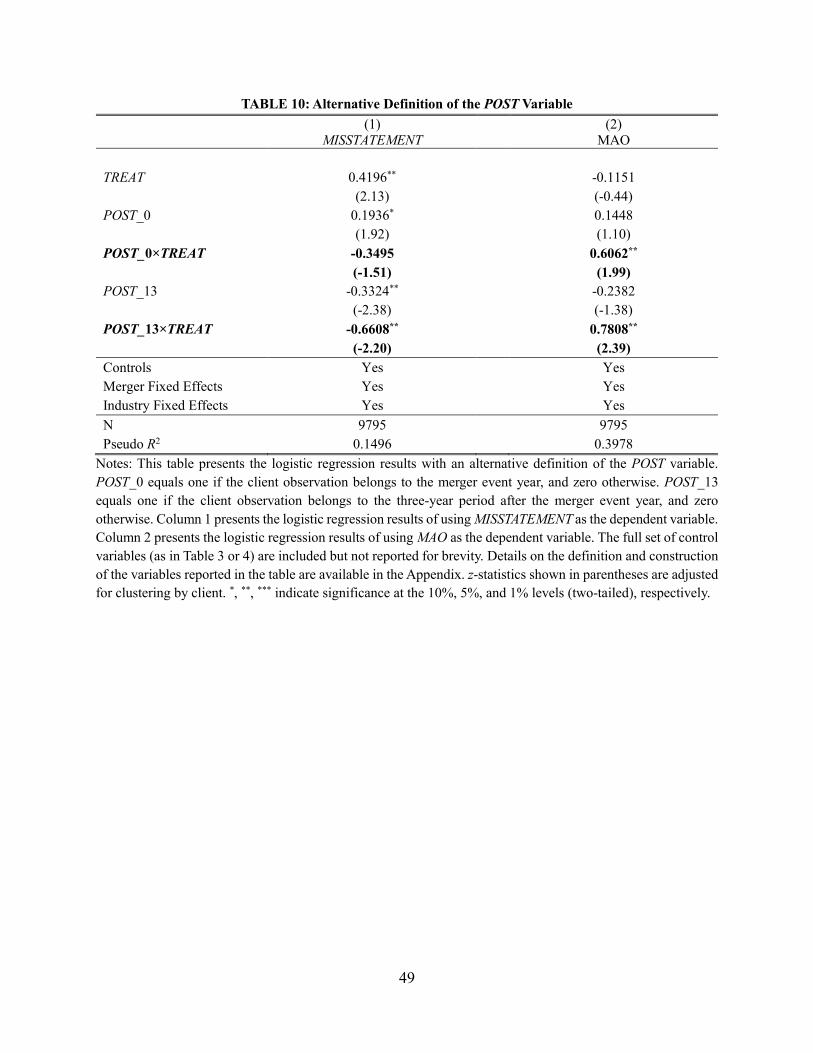
49
TABLE 10: Alternative Definition of the POST Variable
(1) MISSTATEMENT (2)
MAO TREAT 0.4196** -0.1151 (2.13) (-0.44) POST_0 0.1936* 0.1448 (1.92) (1.10) POST_0×TREAT -0.3495 0.6062** (-1.51) (1.99) POST_13 -0.3324** -0.2382 (-2.38) (-1.38) POST_13×TREAT -0.6608** 0.7808** (-2.20) (2.39) Controls Yes Yes Merger Fixed Effects Yes Yes Industry Fixed Effects Yes Yes N 9795 9795 Pseudo R2 0.1496 0.3978
Notes: This table presents the logistic regression results with an alternative definition of the POST variable. POST_0 equals one if the client observation belongs to the merger event year, and zero otherwise. POST_13 equals one if the client observation belongs to the three-year period after the merger event year, and zero otherwise. Column 1 presents the logistic regression results of using MISSTATEMENT as the dependent variable. Column 2 presents the logistic regression results of using MAO as the dependent variable. The full set of control variables (as in Table 3 or 4) are included but not reported for brevity. Details on the definition and construction of the variables reported in the table are available in the Appendix. z-statistics shown in parentheses are adjusted for clustering by client. *, **, *** indicate significance at the 10%, 5%, and 1% levels (two-tailed), respectively.
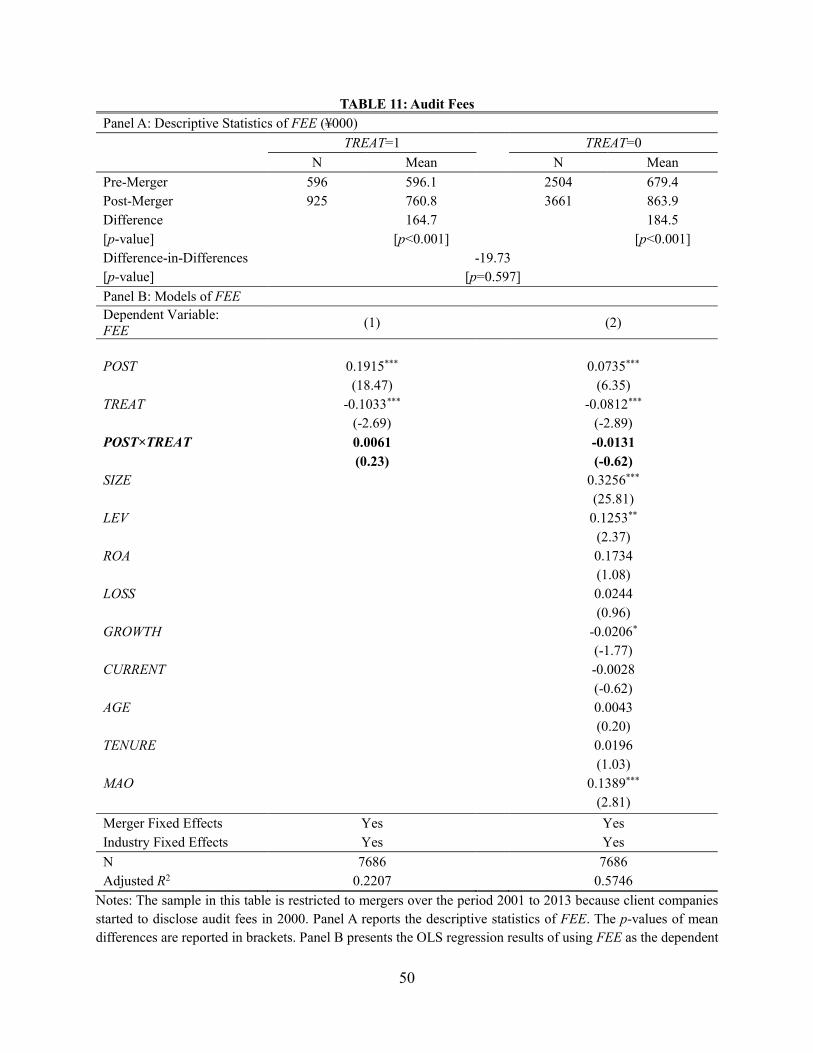
50
TABLE 11: Audit Fees Panel A: Descriptive Statistics of FEE (¥000)
TREAT=1 TREAT=0
N Mean N Mean Pre-Merger 596 596.1 2504 679.4 Post-Merger 925 760.8 3661 863.9 Difference 164.7 184.5 [p-value] [p<0.001] [p<0.001] Difference-in-Differences -19.73 [p-value] [p=0.597] Panel B: Models of FEE Dependent Variable: FEE (1) (2)
POST 0.1915*** 0.0735*** (18.47) (6.35) TREAT -0.1033*** -0.0812*** (-2.69) (-2.89) POST×TREAT 0.0061 -0.0131 (0.23) (-0.62) SIZE 0.3256*** (25.81) LEV 0.1253** (2.37) ROA 0.1734 (1.08) LOSS 0.0244 (0.96) GROWTH -0.0206* (-1.77) CURRENT -0.0028 (-0.62) AGE 0.0043 (0.20) TENURE 0.0196 (1.03) MAO 0.1389*** (2.81) Merger Fixed Effects Yes Yes Industry Fixed Effects Yes Yes N 7686 7686 Adjusted R2 0.2207 0.5746
Notes: The sample in this table is restricted to mergers over the period 2001 to 2013 because client companies started to disclose audit fees in 2000. Panel A reports the descriptive statistics of FEE. The p-values of mean differences are reported in brackets. Panel B presents the OLS regression results of using FEE as the dependent

51
variable. Details on the definition and construction of the variables reported in the table are available in the Appendix. For FEE, SIZE, AGE and TENURE, log-transformed values are used in the regressions. t-statistics shown in parentheses are adjusted for clustering by client. *, **, *** indicate significance at the 10%, 5%, and 1% levels (two-tailed), respectively.

52
ONLINE APPENDIX
(NOT INTENDED FOR PUBLICATION)
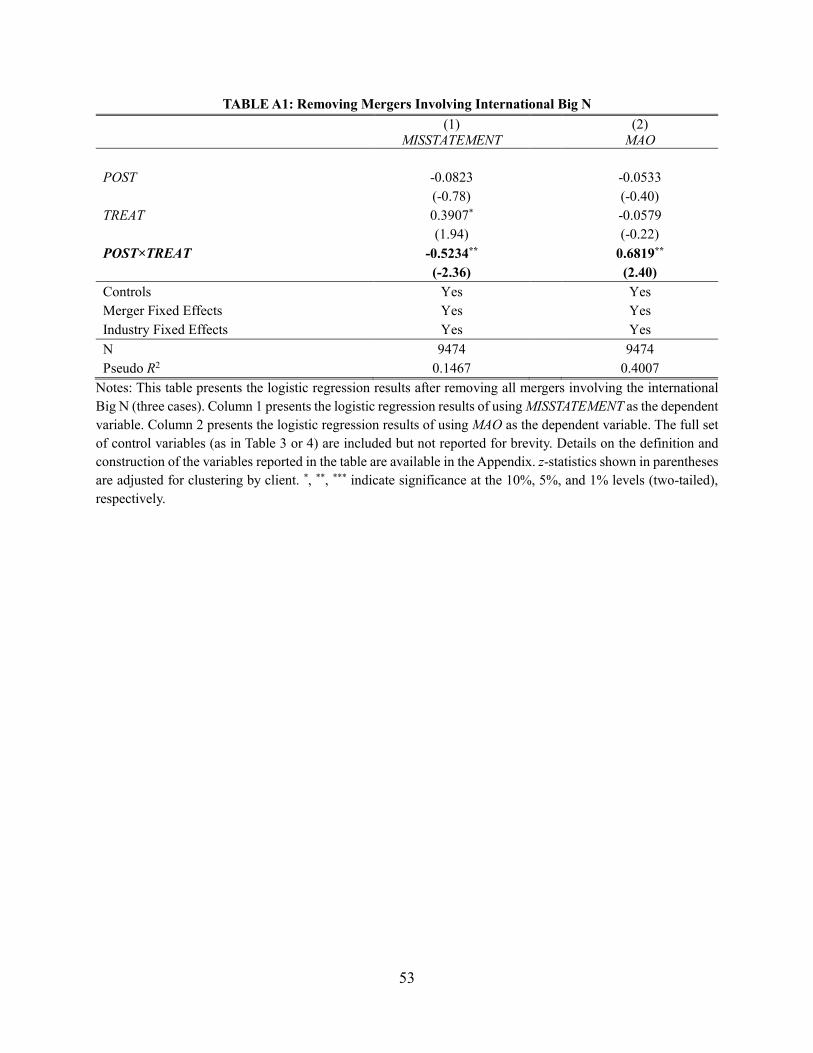
53
TABLE A1: Removing Mergers Involving International Big N
(1) MISSTATEMENT (2)
MAO POST -0.0823 -0.0533 (-0.78) (-0.40) TREAT 0.3907* -0.0579 (1.94) (-0.22) POST×TREAT -0.5234** 0.6819** (-2.36) (2.40) Controls Yes Yes Merger Fixed Effects Yes Yes Industry Fixed Effects Yes Yes N 9474 9474 Pseudo R2 0.1467 0.4007
Notes: This table presents the logistic regression results after removing all mergers involving the international Big N (three cases). Column 1 presents the logistic regression results of using MISSTATEMENT as the dependent variable. Column 2 presents the logistic regression results of using MAO as the dependent variable. The full set of control variables (as in Table 3 or 4) are included but not reported for brevity. Details on the definition and construction of the variables reported in the table are available in the Appendix. z-statistics shown in parentheses are adjusted for clustering by client. *, **, *** indicate significance at the 10%, 5%, and 1% levels (two-tailed), respectively.
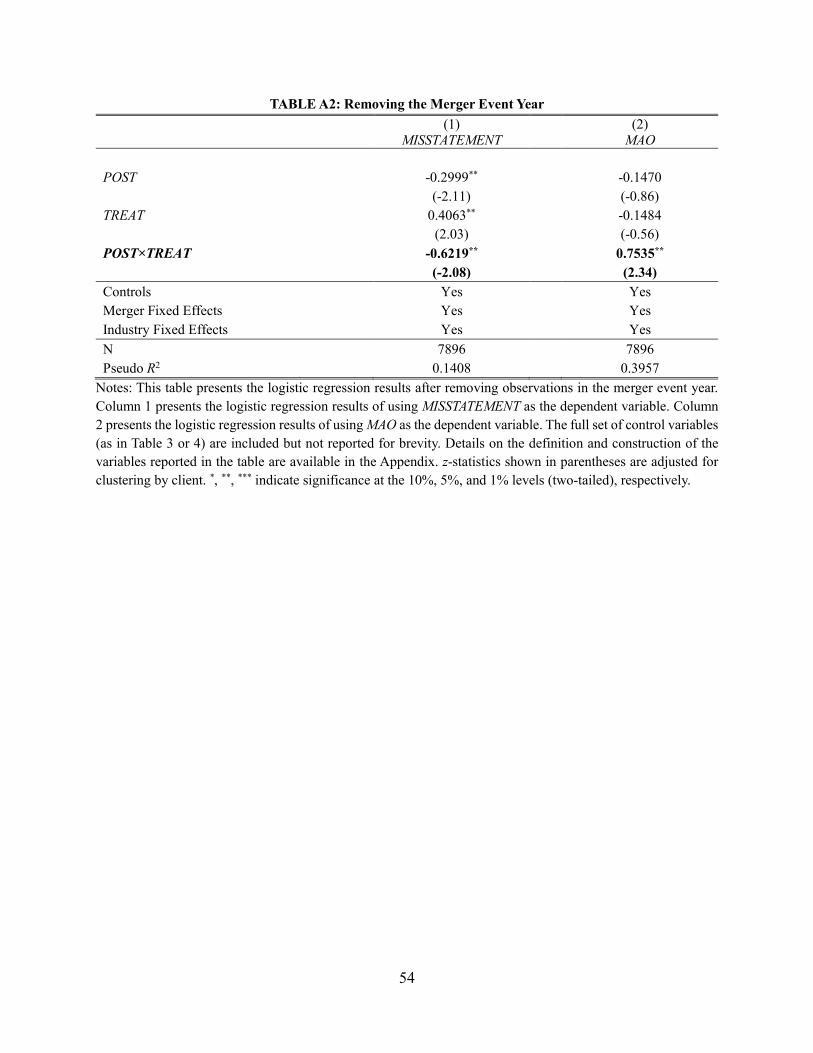
54
TABLE A2: Removing the Merger Event Year
(1) MISSTATEMENT (2)
MAO POST -0.2999** -0.1470 (-2.11) (-0.86) TREAT 0.4063** -0.1484 (2.03) (-0.56) POST×TREAT -0.6219** 0.7535** (-2.08) (2.34) Controls Yes Yes Merger Fixed Effects Yes Yes Industry Fixed Effects Yes Yes N 7896 7896 Pseudo R2 0.1408 0.3957
Notes: This table presents the logistic regression results after removing observations in the merger event year. Column 1 presents the logistic regression results of using MISSTATEMENT as the dependent variable. Column 2 presents the logistic regression results of using MAO as the dependent variable. The full set of control variables (as in Table 3 or 4) are included but not reported for brevity. Details on the definition and construction of the variables reported in the table are available in the Appendix. z-statistics shown in parentheses are adjusted for clustering by client. *, **, *** indicate significance at the 10%, 5%, and 1% levels (two-tailed), respectively.
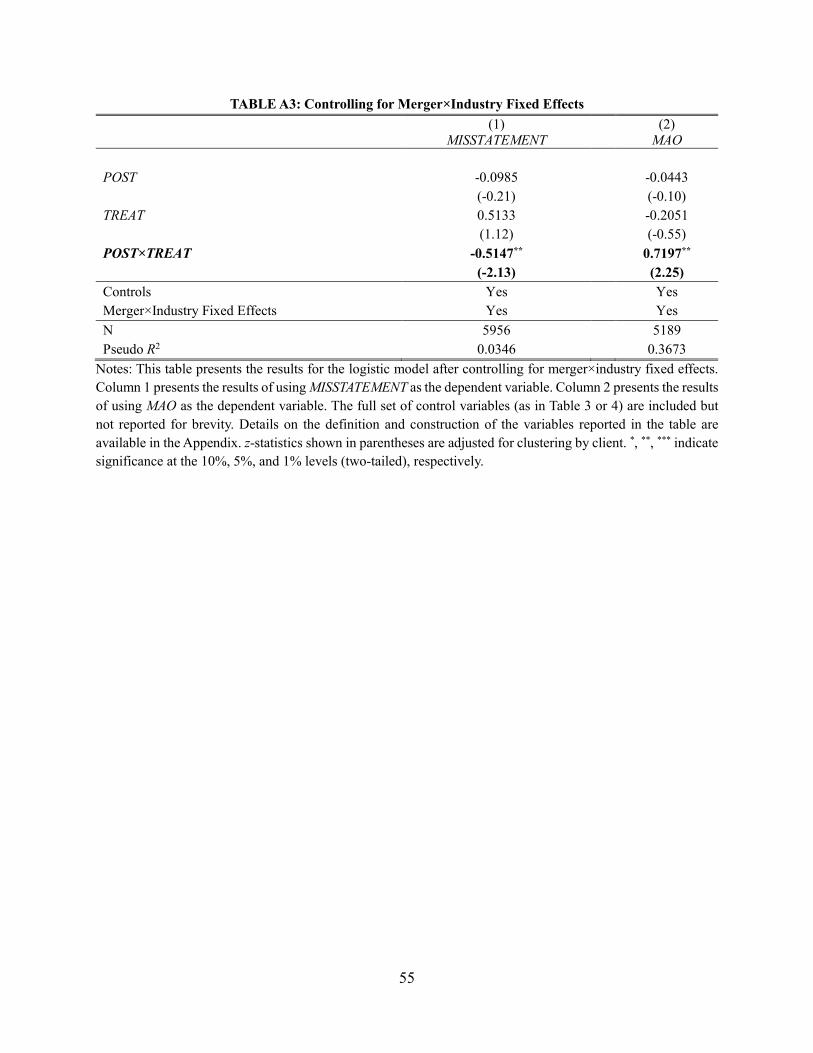
55
TABLE A3: Controlling for Merger×Industry Fixed Effects
(1) MISSTATEMENT (2)
MAO POST -0.0985 -0.0443 (-0.21) (-0.10) TREAT 0.5133 -0.2051 (1.12) (-0.55) POST×TREAT -0.5147** 0.7197** (-2.13) (2.25) Controls Yes Yes Merger×Industry Fixed Effects Yes Yes N 5956 5189 Pseudo R2 0.0346 0.3673
Notes: This table presents the results for the logistic model after controlling for merger×industry fixed effects. Column 1 presents the results of using MISSTATEMENT as the dependent variable. Column 2 presents the results of using MAO as the dependent variable. The full set of control variables (as in Table 3 or 4) are included but not reported for brevity. Details on the definition and construction of the variables reported in the table are available in the Appendix. z-statistics shown in parentheses are adjusted for clustering by client. *, **, *** indicate significance at the 10%, 5%, and 1% levels (two-tailed), respectively.
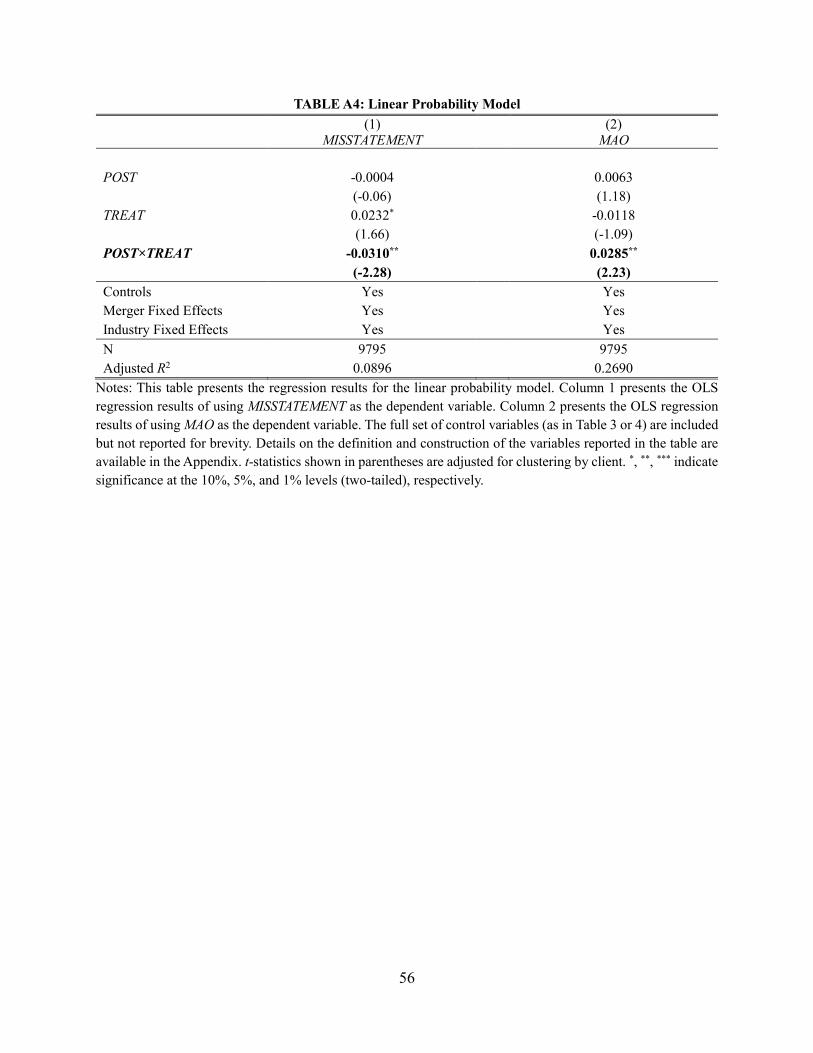
56
TABLE A4: Linear Probability Model
(1) MISSTATEMENT (2)
MAO POST -0.0004 0.0063 (-0.06) (1.18) TREAT 0.0232* -0.0118 (1.66) (-1.09) POST×TREAT -0.0310** 0.0285** (-2.28) (2.23) Controls Yes Yes Merger Fixed Effects Yes Yes Industry Fixed Effects Yes Yes N 9795 9795 Adjusted R2 0.0896 0.2690
Notes: This table presents the regression results for the linear probability model. Column 1 presents the OLS regression results of using MISSTATEMENT as the dependent variable. Column 2 presents the OLS regression results of using MAO as the dependent variable. The full set of control variables (as in Table 3 or 4) are included but not reported for brevity. Details on the definition and construction of the variables reported in the table are available in the Appendix. t-statistics shown in parentheses are adjusted for clustering by client. *, **, *** indicate significance at the 10%, 5%, and 1% levels (two-tailed), respectively.