Genome Wide Association Mapping of Grain Arsenic, Copper, Molybdenum and Zinc in Rice (Oryza sativa...
12
Genome Wide Association Mapping of Grain Arsenic, Copper, Molybdenum and Zinc in Rice (Oryza sativa L.) Grown at Four International Field Sites Gareth J. Norton 1 , Alex Douglas 1 , Brett Lahner 2 , Elena Yakubova 2 , Mary Lou Guerinot 3 , Shannon R. M. Pinson 4 , Lee Tarpley 5 , Georgia C. Eizenga 4 , Steve P. McGrath 6 , Fang-Jie Zhao 6,7 , M. Rafiqul Islam 8 , Shofiqul Islam 8 , Guilan Duan 9 , Yongguan Zhu 9 , David E. Salt 1 , Andrew A. Meharg 10 , Adam H. Price 1 * 1 Institute of Biological and Environmental Sciences, University of Aberdeen, Aberdeen, United Kingdom, 2 Department of Horticulture and Landscape Architecture, Purdue University, West Lafayette, Indiana, United States of America, 3 Department of Biological Sciences, Dartmouth College, Hanover, New Hampshire, United States of America, 4 USDA ARS, Dale Bumpers National Rice Research Center, Stuttgart, Arkansas, United States of America, 5 Texas A&M University System, Texas A&M AgriLife Research, Beaumont, Texas, United States of America, 6 Rothamsted Research, Harpenden, Hertfordshire, United Kingdom, 7 College of Resources and Environmental Sciences, Nanjing Agricultural University, Nanjing, China, 8 Department of Soil Science, Bangladesh Agricultural University, Mymensingh, Bangladesh, 9 Research Center for Eco-environmental Sciences, Chinese Academy of Sciences, Beijing, China, 10 Institute for Global Food Security, Queen’s University Belfast, David Keir Building, Belfast, United Kingdom Abstract The mineral concentrations in cereals are important for human health, especially for individuals who consume a cereal subsistence diet. A number of elements, such as zinc, are required within the diet, while some elements are toxic to humans, for example arsenic. In this study we carry out genome-wide association (GWA) mapping of grain concentrations of arsenic, copper, molybdenum and zinc in brown rice using an established rice diversity panel of ,300 accessions and 36.9 k single nucleotide polymorphisms (SNPs). The study was performed across five environments: one field site in Bangladesh, one in China and two in the US, with one of the US sites repeated over two years. GWA mapping on the whole dataset and on separate subpopulations of rice revealed a large number of loci significantly associated with variation in grain arsenic, copper, molybdenum and zinc. Seventeen of these loci were detected in data obtained from grain cultivated in more than one field location, and six co-localise with previously identified quantitative trait loci. Additionally, a number of candidate genes for the uptake or transport of these elements were located near significantly associated SNPs (within 200 kb, the estimated global linkage disequilibrium previously employed in this rice panel). This analysis highlights a number of genomic regions and candidate genes for further analysis as well as the challenges faced when mapping environmentally- variable traits in a highly genetically structured diversity panel. Citation: Norton GJ, Douglas A, Lahner B, Yakubova E, Guerinot ML, et al. (2014) Genome Wide Association Mapping of Grain Arsenic, Copper, Molybdenum and Zinc in Rice (Oryza sativa L.) Grown at Four International Field Sites. PLoS ONE 9(2): e89685. doi:10.1371/journal.pone.0089685 Editor: Jauhar Ali, International Rice Research Institute, Philippines Received September 9, 2013; Accepted January 22, 2014; Published February 25, 2014 This is an open-access article, free of all copyright, and may be freely reproduced, distributed, transmitted, modified, built upon, or otherwise used by anyone for any lawful purpose. The work is made available under the Creative Commons CC0 public domain dedication. Funding: This work was funded by BBSRC-DFID grant BBF0040871, the U.S. National Science Foundation, Plant Genome Research Program (grant #IOS 0701119). Research conducted in Arkansas was supported in part by the U.S. National Science Foundation, Plant Genome Research Program (grant #PRGP 0606461) and research at Dartmouth College was supported by the U.S. National Institute of Environmental Health Sciences (grant P42ES007373). The plant material was imported into the UK under import licence IMP/SOIL/18/2009 issued by Science and Advice for Scottish Agriculture. Mention of a trademark or proprietary product does not constitute a guarantee or warranty of the product by the U.S. Department of Agriculture or Texas A&M AgriLife Research, and does not imply its approval to the exclusion of other products that also can be suitable. USDA is an equal opportunity provider and employer. The funders had no role in study design, data collection and analysis, decision to publish, or preparation of the manuscript. Competing Interests: The authors have declared that no competing interests exist. * E-mail: [email protected] Introduction Rice (Oryza sativa L.) is perhaps the most important crop plant given that it is estimated to be the staple food of half the world’s human population. As this population rises over the coming decades the demand for staple crops, like rice, will grow further and increasing crop yield while maintaining grain quality is, therefore, essential. For people who are reliant on cereals as a dietary staple, a significant proportion of their minerals come from these grains. Improved concentrations of essential micro nutrients such as zinc, and reductions in the potentially toxic trace elements such as arsenic would therefore hold significant potential for improvements in human health [1,2]. There is significant genetic diversity in rice which can be exploited to perform genome-wide association (GWA) mapping, allowing the unravelling of complex physiological traits [3–6]. Rice landraces and cultivars have undergone many recombination events compared to experimental mapping populations. GWA mapping takes advantage of this increased recombination to potentially localize the genetic determinants of traits to narrower regions in the genome. However, populations used for GWA studies can have a low power to detect rare alleles unless the population is large. This contrasts with biparental experimental PLOS ONE | www.plosone.org 1 February 2014 | Volume 9 | Issue 2 | e89685
Transcript of Genome Wide Association Mapping of Grain Arsenic, Copper, Molybdenum and Zinc in Rice (Oryza sativa...
Genome Wide Association Mapping of Grain Arsenic,Copper, Molybdenum and Zinc in Rice (Oryza sativa L.)Grown at Four International Field SitesGareth J. Norton1, Alex Douglas1, Brett Lahner2, Elena Yakubova2, Mary Lou Guerinot3,
Shannon R. M. Pinson4, Lee Tarpley5, Georgia C. Eizenga4, Steve P. McGrath6, Fang-Jie Zhao6,7, M.
Rafiqul Islam8, Shofiqul Islam8, Guilan Duan9, Yongguan Zhu9, David E. Salt1, Andrew A. Meharg10,
Adam H. Price1*
1 Institute of Biological and Environmental Sciences, University of Aberdeen, Aberdeen, United Kingdom, 2Department of Horticulture and Landscape Architecture,
Purdue University, West Lafayette, Indiana, United States of America, 3Department of Biological Sciences, Dartmouth College, Hanover, New Hampshire, United States of
America, 4USDA ARS, Dale Bumpers National Rice Research Center, Stuttgart, Arkansas, United States of America, 5 Texas A&M University System, Texas A&M AgriLife
Research, Beaumont, Texas, United States of America, 6 Rothamsted Research, Harpenden, Hertfordshire, United Kingdom, 7College of Resources and Environmental
Sciences, Nanjing Agricultural University, Nanjing, China, 8Department of Soil Science, Bangladesh Agricultural University, Mymensingh, Bangladesh, 9 Research Center
for Eco-environmental Sciences, Chinese Academy of Sciences, Beijing, China, 10 Institute for Global Food Security, Queen’s University Belfast, David Keir Building, Belfast,
United Kingdom
Abstract
The mineral concentrations in cereals are important for human health, especially for individuals who consume a cerealsubsistence diet. A number of elements, such as zinc, are required within the diet, while some elements are toxic to humans,for example arsenic. In this study we carry out genome-wide association (GWA) mapping of grain concentrations of arsenic,copper, molybdenum and zinc in brown rice using an established rice diversity panel of ,300 accessions and 36.9 k singlenucleotide polymorphisms (SNPs). The study was performed across five environments: one field site in Bangladesh, one inChina and two in the US, with one of the US sites repeated over two years. GWA mapping on the whole dataset and onseparate subpopulations of rice revealed a large number of loci significantly associated with variation in grain arsenic,copper, molybdenum and zinc. Seventeen of these loci were detected in data obtained from grain cultivated in more thanone field location, and six co-localise with previously identified quantitative trait loci. Additionally, a number of candidategenes for the uptake or transport of these elements were located near significantly associated SNPs (within 200 kb, theestimated global linkage disequilibrium previously employed in this rice panel). This analysis highlights a number ofgenomic regions and candidate genes for further analysis as well as the challenges faced when mapping environmentally-variable traits in a highly genetically structured diversity panel.
Citation: Norton GJ, Douglas A, Lahner B, Yakubova E, Guerinot ML, et al. (2014) Genome Wide Association Mapping of Grain Arsenic, Copper, Molybdenum andZinc in Rice (Oryza sativa L.) Grown at Four International Field Sites. PLoS ONE 9(2): e89685. doi:10.1371/journal.pone.0089685
Editor: Jauhar Ali, International Rice Research Institute, Philippines
Received September 9, 2013; Accepted January 22, 2014; Published February 25, 2014
This is an open-access article, free of all copyright, and may be freely reproduced, distributed, transmitted, modified, built upon, or otherwise used by anyone forany lawful purpose. The work is made available under the Creative Commons CC0 public domain dedication.
Funding: This work was funded by BBSRC-DFID grant BBF0040871, the U.S. National Science Foundation, Plant Genome Research Program (grant#IOS 0701119).Research conducted in Arkansas was supported in part by the U.S. National Science Foundation, Plant Genome Research Program (grant #PRGP 0606461) andresearch at Dartmouth College was supported by the U.S. National Institute of Environmental Health Sciences (grant P42ES007373). The plant material wasimported into the UK under import licence IMP/SOIL/18/2009 issued by Science and Advice for Scottish Agriculture. Mention of a trademark or proprietaryproduct does not constitute a guarantee or warranty of the product by the U.S. Department of Agriculture or Texas A&M AgriLife Research, and does not imply itsapproval to the exclusion of other products that also can be suitable. USDA is an equal opportunity provider and employer. The funders had no role in studydesign, data collection and analysis, decision to publish, or preparation of the manuscript.
Competing Interests: The authors have declared that no competing interests exist.
* E-mail: [email protected]
Introduction
Rice (Oryza sativa L.) is perhaps the most important crop plant
given that it is estimated to be the staple food of half the world’s
human population. As this population rises over the coming
decades the demand for staple crops, like rice, will grow further
and increasing crop yield while maintaining grain quality is,
therefore, essential. For people who are reliant on cereals as a
dietary staple, a significant proportion of their minerals come from
these grains. Improved concentrations of essential micro nutrients
such as zinc, and reductions in the potentially toxic trace elements
such as arsenic would therefore hold significant potential for
improvements in human health [1,2].
There is significant genetic diversity in rice which can be
exploited to perform genome-wide association (GWA) mapping,
allowing the unravelling of complex physiological traits [3–6]. Rice
landraces and cultivars have undergone many recombination
events compared to experimental mapping populations. GWA
mapping takes advantage of this increased recombination to
potentially localize the genetic determinants of traits to narrower
regions in the genome. However, populations used for GWA
studies can have a low power to detect rare alleles unless the
population is large. This contrasts with biparental experimental
PLOS ONE | www.plosone.org 1 February 2014 | Volume 9 | Issue 2 | e89685

mapping populations in which all alleles are generally at
frequencies of 25–50% (depending on the population type and
the heterozygosity of the parents). Populations of rice have been
developed to exploit the power of GWA mapping. The Rice
Diversity Panel 1 (RDP1) of 421 accessions genotyped with 36,901
high quality single nucleotide polymorphisms (SNPs) [7–9] has
been used to identify genomic regions associated with flowering
time, panicles per plant, seed number per panicle, seed
morphology traits, blast resistance, amylose content, protein
content [5] and aluminium tolerance [4]. A different rice panel
has been developed from 517 Chinese landraces [3]. In that study
GWA mapping was performed on 14 agronomic traits across 373
indica accessions using 671,355 common SNPs. Traits studied
included tiller number, grain morphology traits, amylose content,
heading date, and drought tolerance [3]. More recently, the same
group increased their study population to 950 cultivars including
cultivars from both the Indica and Japonica subspecies [6]. Using
this population Huang et al. [6] were able to identify a further 32
loci associated with flowering time, and 10 grain related traits. The
authors concluded from this study that the additional sample size
increased the power of detection for trait-associated DNA variants
using GWA mapping [6].
Improvement in the content of the micro nutrient zinc within
rice grains could have a positive impact on human health [1] since
conservative estimates suggest that greater than 25% of the world’s
population are at risk from zinc deficiency [10–12]. There is
genetic variation amongst rice cultivars for grain zinc concentra-
tion, and a number of quantitative trait loci (QTLs) have also been
identified in rice [13–22].
Unlike zinc, there is not a widespread global issue with copper
deficiency in humans [23]. However, copper is an essential
element for plants and has many functions including having a role
in the electron transport chain of photosystem I, acting as a
component of some metalloproteins and as a co-factor in a
number of enzymes including cytochrome c oxidase, ascobate
oxidase and amino oxidase [24].
Elevated inorganic arsenic concentration in rice grains has been
identified as a risk to human health where rice is a dietary staple
[25–29]. Inorganic arsenic is a non-threshold class 1 human
carcinogen [30]. It has been established that there is genetic
variation for grain arsenic accumulation [2,31–35], and QTLs
have been identified [17,21,22,36]. However, grain arsenic
concentrations are also strongly affected by the environment
[31,34,35].
Molybdenum is an essential element required for plants and
animals as a component of the molybdopterin cofactor in a
number of enzymes including nitrate reductase, sulfite oxidase,
xanthine dehydrogenase, aldehyde oxidase and mitochondrial
amidoxime reductase [37]. Also, grain molybdenum may be
important for seedling vigour in acid soils with low molybdenum
bioavailability. A number of genes have been identified as
potential transporters of molybdenum in plants [37], including
MOT1 in Arabidopsis thaliana where natural variation in this gene is
responsible for variations in the accumulation of molybdenum in
shoots and roots [38–40].
To date GWA mapping has not been used for the exploration of
loci controlling accumulation of essential minerals and potentially
toxic trace elements in rice grain. Here, we report such a study,
using the RDP1 to identify a large number of SNPs associated with
grain accumulation of zinc, copper, molybdenum and arsenic in
rice grains for plants grown in four different field locations. The
stability of these QTLs is explored across years and between
different environmental conditions, as well as their co-localisation
with previously identified QTLs and candidate genes.
Results and Discussion
Variation in Grain Elemental ConcentrationsAt the Faridpur field site, over 50% of the variation for each
element in grain (arsenic, copper, molybdenum, and zinc) is
explained by differences between cultivars (Table 1). For the traits
at the Qiyang field site, grain molybdenum was the only trait
where over 50% of the observed variation could be explained by
cultivar. For grain arsenic and zinc the percentage of variation
explained by cultivar was around 40%, while grain copper was
approximately 20%. For the Arkansas field site (both 2006 and
2007) over 40% of the variation for each element could be
explained by differences between cultivars. At the Texas field site
the cultivars explain greater than 39% of the variation for the four
elements. At all sites, for all four elements measured there were
significant differences between the rice subpopulations (Table 1).
Full details of the differences between subpopulations are given in
Table S1. General trends for the subgroups were that aus tend to
be highest in grain arsenic while either tropical or temperate japonicas
were the lowest, the opposite is true for grain copper, indicas were
the lowest in zinc and no clear pattern across sites exists for grain
molybdenum.
Previously using the grain arsenic data for each of the cultivars it
was possible to identify cultivars that have low grain arsenic across
multiple field sites [35]. Three cultivars were identified, all temperate
japonicas, that have low grain arsenic across four of the five field
sites [35]. These cultivars could be introduced into breeding
programs with the goal of breeding for low grain arsenic rice
cultivars. The breeding of low grain arsenic rice cultivars could
have an impact on the amount of arsenic that is being consumed
from rice in countries like Bangladesh.
An increase in rice grain zinc could have an impact on human
health [1] for the estimated 25% of the world population that are
at risk from zinc deficiency [10–12]. From this study we have
identified five cultivars that have high grain zinc (in the top 20% of
all the cultivars common across all five field trials) at each of the
field trials (Table 2). These are Estrela (admix), Bulgare (temperate
japonica), Jamir (aus), Khao Tot Long 227 (aus) and DZ 193 (aus).
These cultivars have the potential to be exploited in rice breeding
programs to increase rice grain zinc, therefore addressing human
zinc deficiency.
Genome Wide Association Mapping of Grain Arsenic,Copper, Molybdenum and Zinc
Due to the complex population structure within rice, there is no
single design or analysis method which will sufficiently disentangle
the genetics underlying complex polygenic traits [5]. To address
the complexity of population structure in this analysis, GWA
mapping was performed on a worldwide population (denoted ‘‘all’’
below) using a mixed model to account for the population
structure, and was also performed within four separate subpop-
ulations (aus, indica, temperate japonica and tropical japonica) as defined
by Zhao et al. [5]. A naıve approach was not conducted due to the
high potential of false discoveries [5]. Using both GWA mapping
approaches we identified a large number of SNPs significantly
associated with the traits (Figures 1–4; full list of SNPs are detailed
in Tables S3, S4, S5 and S6). Figures 1–4 indicate the location of
SNPs with a P-value below the assigned significance threshold P,
0.0001 associated with the traits. Significant SNPs from the
different experiments are displayed in different coloured symbols
and the analysis of the combined subgroups and separate
subgroups are represented by different symbols. Also presented
in these figures are the positions of previously identified QTLs.
Genome Wide Association for Elements in Rice
PLOS ONE | www.plosone.org 2 February 2014 | Volume 9 | Issue 2 | e89685

Table
1.Mean
andrangeofgrain
elementconcentrations.
Site
Trait
Noofcu
ltivars
Descriptivestatisticsforcu
ltivars
F-valueforcu
ltivar
(allsignificantat
P,0.001)
Pro
portionofth
evariationexplained
bycu
ltivar(%
)
F-valuefor
subpopulation(all
significantatP,0.001)1
Mean
Min.
Median
Max.
Faridpur
Grain
As(m
gkg
21)2
312
0.443
0.192
0.435
0.899
7.77
63.4
12.5
Faridpur
Grain
Cu(m
gkg
21)
312
3.767
1.96
3.66
7.46
5.33
52.5
48.1
Faridpur
GainMo(m
gkg
21)
312
1.030
0.556
0.978
2.088
7.43
62.2
8.27
Faridpur
Grain
Zn(m
gkg
21)
312
17.022
10.32
16.19
32.97
9.26
67.8
41.0
Qiyan
gGrain
As(m
gkg
21)2
295
0.675
0.363
0.662
1.266
3.58
40.1
42.0
Qiyan
gGrain
Cu(m
gkg
21)
295
0.755
0.274
0.662
3.338
2.00
20.5
7.6
Qiyan
gGrain
Mo(m
gkg
21)
295
1.554
0.842
1.521
3.958
7.03
61.0
11.7
Qiyan
gGrain
Zn(m
gkg
21)
295
16.518
7.155
16.394
33.977
3.59
40.2
19.6
Ark2006
Grain
As(m
gkg
21)2
336
0.375
0.100
0.359
0.988
4.18
41.0
15.29
Ark2006
Grain
Cu(m
gkg
21)
336
2.241
0.972
2.139
4.631
6.69
55.5
21.4
Ark2006
Grain
Mo(m
gkg
21)
336
0.708
0.364
0.704
1.412
12.6
71.8
20.17
Ark2006
Grain
Zn(m
gkg
21)
336
25.301
17.918
25.483
35.476
8.03
60.6
51.47
Ark2007
Grain
As(m
gkg
21)2
348
0.256
0.030
0.205
1.400
14.02
70.7
15.83
Ark2007
Grain
Cu(m
gkg
21)
348
3.736
1.989
3.725
6.224
6.7
51.5
30.36
Ark2007
Grain
Mo(m
gkg
21)
348
0.458
0.139
0.420
1.194
16.34
74.0
51.79
Ark2007
Grain
Zn(m
gkg
21)
348
30.017
20.844
29.734
42.410
7.8
55.8
44.10
Tx2009
Grain
As(m
gkg
21)2
370
0.628
0.172
0.618
1.682
5.09
58.2
11.46
Tx2009
Grain
Cu(m
gkg
21)
370
2.972
1.655
2.907
5.497
9.5
74.3
61.34
Tx2009
Grain
Mo(m
gkg
21)
370
0.343
0.116
0.337
0.730
14.1
81.6
23.35
Tx2009
Grain
Zn(m
gkg
21)
370
21.513
11.938
21.538
40.021
2.92
39.5
20.77
1Su
bpopulationgroupan
alysiswas
perform
edusingtheallocationofthecultivarsto
thefoursubpopulationgroups:aus,indica,tem
perate
japonicaan
dtropicaljaponica.M
ean
valuesforthesubpopulationgroupsarepresented
inTab
leS1.
2This(summarised)datahas
previouslybeenreportedin
Nortonetal.(35).
Analysisofcultivar
differencesan
dsubpopulationgroupdifferencesarepresentedas
theFvaluefrom
twoseparateone-w
ayANOVAtests,oneforcultivar
andoneforsubpopulation.
doi:10.1371/journal.pone.0089685.t001
Genome Wide Association for Elements in Rice
PLOS ONE | www.plosone.org 3 February 2014 | Volume 9 | Issue 2 | e89685

Identification of Quantitative Trait Loci Common AcrossMultiple Environments
As the population was grown across multiple sites, the stability
of the QTLs across multiple environments was explored. As
described in the methods section, a SNP was called significant if
the P-value was ,0.0001 and with a minor allele frequency (MAF)
.5%. The significant SNPs had to be within 200 kb of each other
to be considered close enough to be the same genomic region. A
value of 200 kb was selected as this was the estimated global
linkage disequilibrium (LD) previously employed in this rice
population [5]. There were a total of 17 chromosomal regions
where significant SNPs were associated with a trait (e.g., arsenic)
within one or more analyses across two field experiments
(Figures 1–4). For example, with grain copper significant SNPs
at the top of chromosome 5 at approximately 0.95 Mb, were
associated with the analysis of ‘‘all’’ accessions and the tropical
japonica subpopulation at the Qiyang field site, and in the same
region in ‘‘all’’ accessions at the Arkansas field site in 2006 SNPs.
Of these 17 locations, six of them were located with a previously
detected QTL [17,22]. Details of these six locations are presented
in Table 3; one of them is for arsenic, two for copper, one for
molybdenum and two for zinc. Due to the uncertainty of the
mapping position of the previously detected QTLs, the physical
range they cover is quite large. This means that there is a chance
that the co-localisation of SNPs within a previously identified QTL
region may be down to chance rather than co-localisation.
The arsenic association localises with a previously detected
QTL on chromosome 5 originally identified in a ‘Lemont’ 6‘TeQing’ recombinant inbred line (RIL) mapping population
([22]; Lemont is a tropical japonica cultivar from the USA and
TeQing is an indica cultivar from China). In the current study, the
significant arsenic association was detected in the aus subpopula-
tion and ‘‘all’’ accessions in the Arkansas 2007 field site, and the
aus subpopulation at the Qiyang field site. One of the copper
associations is on chromosome 1 where significant SNPs from the
tropical japonica subpopulation GWA mapping from the Arkansas
2006 field site and the indica subpopulation GWA mapping from
the Texas field site co-localise with a QTL detected in the ‘Bala’
(derived from a cross between an indica and aus cultivar) 6‘Azucena’ (tropical japonica) mapping population [17]. The second
copper association which localises with a QTL on chromosome 5,
where significant SNPs were detected in both the ‘‘all’’ accessions
analysis and the tropical japonica subpopulation at the Qiyang field
site and the ‘‘all’’ accessions analysis at the Arkansas 2006 field site.
Table 2. Cultivars which were in either the upper (high grainzinc) or lower (low grain zinc) 20% in all of the five field trials.
Cultivar name SubgroupGrain zincconcentration
Gharib indica Low
JC 117 indica Low
LD 24 indica Low
Bulgare temperate japonica High
DZ 193 aus High
Estrela admix High
Jamir aus High
Khao Tot Long 227 aus High
The value is based on the mean grain zinc value in the cultivars which arecommon across the five trials.doi:10.1371/journal.pone.0089685.t002
Figure 1. GWA mapping of grain arsenic concentration at the five field sites across the 12 rice chromosomes. Data points representSNPs significantly associated (p,0.0001) with the trait and which have a MAF .5%. Significant SNPs from different experiments are displayed withdifferent coloured symbols: 2006 Arkansas are red, 2007 Arkansas are black, 2009 Texas are blue, Faridpur are green, and Qiyang are grey. Analyses ofthe combined subpopulation groups and separate subpopulations are represented by different symbols: combined analysis = X, aus= circle,indica= square, tropical japonica= triangle, temperate japonica= inverted triangle. Yellow highlighted bars indicate regions of mapped QTLs for grainarsenic concentration (21, 22). Dotted lines indicate chromosome ends.doi:10.1371/journal.pone.0089685.g001
Genome Wide Association for Elements in Rice
PLOS ONE | www.plosone.org 4 February 2014 | Volume 9 | Issue 2 | e89685
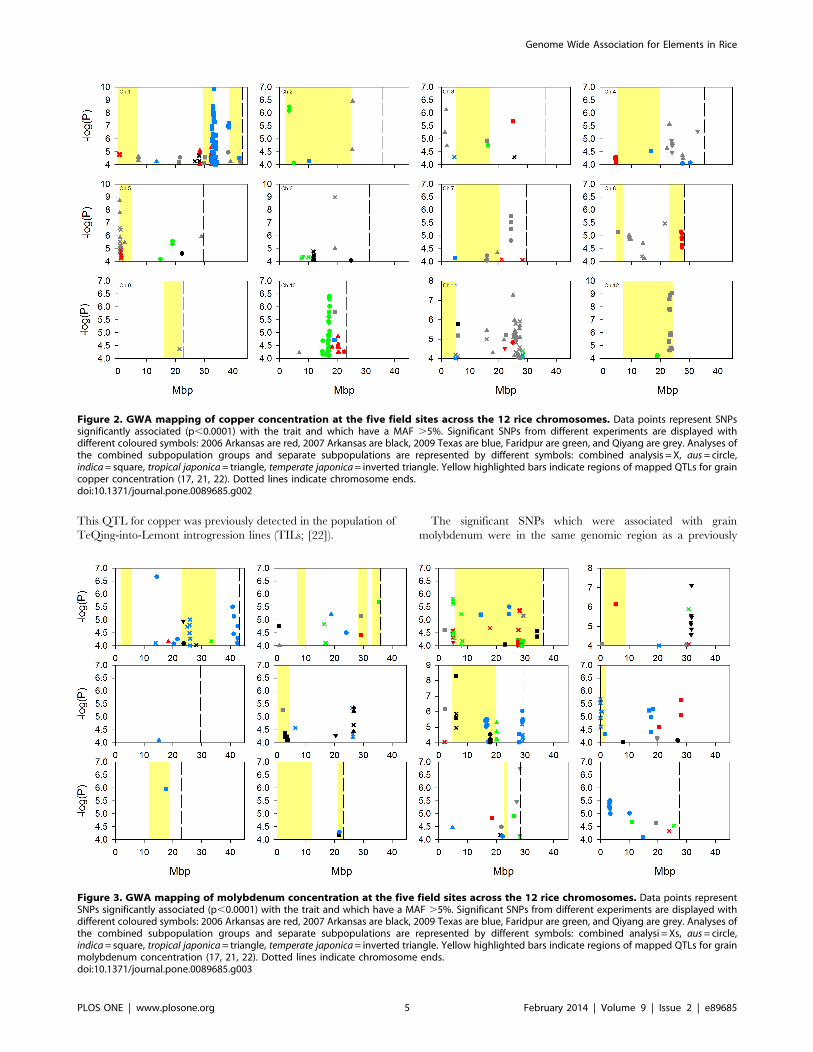
This QTL for copper was previously detected in the population of
TeQing-into-Lemont introgression lines (TILs; [22]).
The significant SNPs which were associated with grain
molybdenum were in the same genomic region as a previously
Figure 2. GWA mapping of copper concentration at the five field sites across the 12 rice chromosomes. Data points represent SNPssignificantly associated (p,0.0001) with the trait and which have a MAF .5%. Significant SNPs from different experiments are displayed withdifferent coloured symbols: 2006 Arkansas are red, 2007 Arkansas are black, 2009 Texas are blue, Faridpur are green, and Qiyang are grey. Analyses ofthe combined subpopulation groups and separate subpopulations are represented by different symbols: combined analysis = X, aus= circle,indica= square, tropical japonica= triangle, temperate japonica= inverted triangle. Yellow highlighted bars indicate regions of mapped QTLs for graincopper concentration (17, 21, 22). Dotted lines indicate chromosome ends.doi:10.1371/journal.pone.0089685.g002
Figure 3. GWA mapping of molybdenum concentration at the five field sites across the 12 rice chromosomes. Data points representSNPs significantly associated (p,0.0001) with the trait and which have a MAF .5%. Significant SNPs from different experiments are displayed withdifferent coloured symbols: 2006 Arkansas are red, 2007 Arkansas are black, 2009 Texas are blue, Faridpur are green, and Qiyang are grey. Analyses ofthe combined subpopulation groups and separate subpopulations are represented by different symbols: combined analysi = Xs, aus= circle,indica= square, tropical japonica= triangle, temperate japonica= inverted triangle. Yellow highlighted bars indicate regions of mapped QTLs for grainmolybdenum concentration (17, 21, 22). Dotted lines indicate chromosome ends.doi:10.1371/journal.pone.0089685.g003
Genome Wide Association for Elements in Rice
PLOS ONE | www.plosone.org 5 February 2014 | Volume 9 | Issue 2 | e89685
identified QTL on chromosome 10. The SNPs were detected in
the aus subpopulation in Texas and the indica subpopulation at the
Arkansas field site in 2007, while the QTL was detected in the
Lemont 6TeQing TIL population [22].
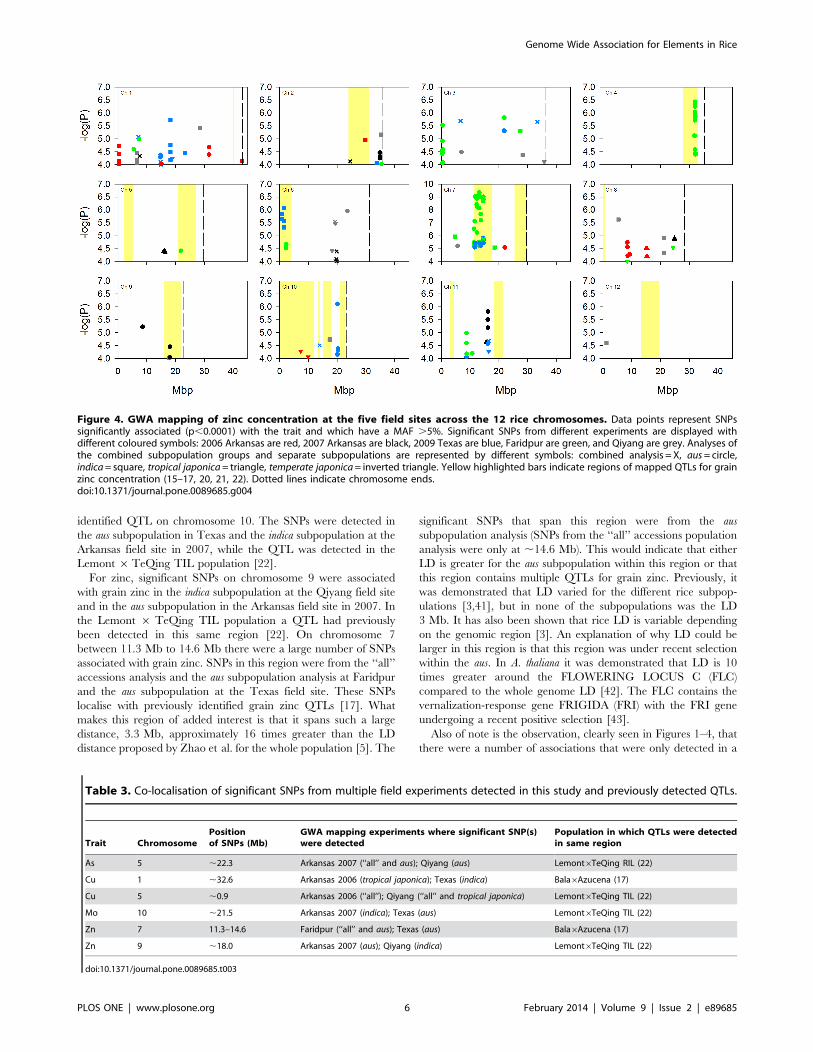
For zinc, significant SNPs on chromosome 9 were associated
with grain zinc in the indica subpopulation at the Qiyang field site
and in the aus subpopulation in the Arkansas field site in 2007. In
the Lemont 6 TeQing TIL population a QTL had previously
been detected in this same region [22]. On chromosome 7
between 11.3 Mb to 14.6 Mb there were a large number of SNPs
associated with grain zinc. SNPs in this region were from the ‘‘all’’
accessions analysis and the aus subpopulation analysis at Faridpur
and the aus subpopulation at the Texas field site. These SNPs
localise with previously identified grain zinc QTLs [17]. What
makes this region of added interest is that it spans such a large
distance, 3.3 Mb, approximately 16 times greater than the LD
distance proposed by Zhao et al. for the whole population [5]. The
significant SNPs that span this region were from the aus
subpopulation analysis (SNPs from the ‘‘all’’ accessions population
analysis were only at ,14.6 Mb). This would indicate that either
LD is greater for the aus subpopulation within this region or that
this region contains multiple QTLs for grain zinc. Previously, it
was demonstrated that LD varied for the different rice subpop-
ulations [3,41], but in none of the subpopulations was the LD
3 Mb. It has also been shown that rice LD is variable depending
on the genomic region [3]. An explanation of why LD could be
larger in this region is that this region was under recent selection
within the aus. In A. thaliana it was demonstrated that LD is 10
times greater around the FLOWERING LOCUS C (FLC)
compared to the whole genome LD [42]. The FLC contains the
vernalization-response gene FRIGIDA (FRI) with the FRI gene
undergoing a recent positive selection [43].
Also of note is the observation, clearly seen in Figures 1–4, that
there were a number of associations that were only detected in a
Figure 4. GWA mapping of zinc concentration at the five field sites across the 12 rice chromosomes. Data points represent SNPssignificantly associated (p,0.0001) with the trait and which have a MAF .5%. Significant SNPs from different experiments are displayed withdifferent coloured symbols: 2006 Arkansas are red, 2007 Arkansas are black, 2009 Texas are blue, Faridpur are green, and Qiyang are grey. Analyses ofthe combined subpopulation groups and separate subpopulations are represented by different symbols: combined analysis = X, aus= circle,indica= square, tropical japonica= triangle, temperate japonica= inverted triangle. Yellow highlighted bars indicate regions of mapped QTLs for grainzinc concentration (15–17, 20, 21, 22). Dotted lines indicate chromosome ends.doi:10.1371/journal.pone.0089685.g004
Table 3. Co-localisation of significant SNPs from multiple field experiments detected in this study and previously detected QTLs.
Trait ChromosomePositionof SNPs (Mb)
GWA mapping experiments where significant SNP(s)were detected
Population in which QTLs were detectedin same region
As 5 ,22.3 Arkansas 2007 (‘‘all’’ and aus); Qiyang (aus) Lemont6TeQing RIL (22)
Cu 1 ,32.6 Arkansas 2006 (tropical japonica); Texas (indica) Bala6Azucena (17)
Cu 5 ,0.9 Arkansas 2006 (‘‘all’’); Qiyang (‘‘all’’ and tropical japonica) Lemont6TeQing TIL (22)
Mo 10 ,21.5 Arkansas 2007 (indica); Texas (aus) Lemont6TeQing TIL (22)
Zn 7 11.3–14.6 Faridpur (‘‘all’’ and aus); Texas (aus) Bala6Azucena (17)
Zn 9 ,18.0 Arkansas 2007 (aus); Qiyang (indica) Lemont6TeQing TIL (22)
doi:10.1371/journal.pone.0089685.t003
Genome Wide Association for Elements in Rice
PLOS ONE | www.plosone.org 6 February 2014 | Volume 9 | Issue 2 | e89685
single location/year analysis that co-localise with previously
detected QTLs (Figures 1–4). For brevity, these are not discussed
individually here.
Identification of Quantitative Trait Loci Common AcrossYears
As well as addressing environmental stability of QTLs, the year-
to-year stability of QTLs was explored. In 2006 and 2007 the
panel was grown at the same site in Arkansas, using a nearby field
area (equivalent soil) and identical field management practices.
The correlations of the traits across both years are presented in
Figure S1 revealing high significance (P.0.001) and r values of
0.407 copper; 0.407 arsenic; 0.555 molybdenum and 0.630 zinc.
There is only one region where SNPs with a P-value below the
threshold of 0.0001 were present for the same trait across both
years. This was on chromosome 1 at 42 Mb where there were
SNPs associated with arsenic within the aus subpopulation. The
lack of year-to-year stability for QTLs is unexpected, as it could be
predicted that the largest driving forces for the accumulation of
different concentrations of elements within grains would be soil
chemistry which should vary relatively little as the plants were
grown in nearby field areas (equivalent soil type) using essentially
identical field management practices in two consecutive years.
However, if other factors like grain yield and flower time have an
effect on the accumulation of the elements in the grain then this
year-year variation in QTLs may not be unexpected. It has been
shown that QTLs for both yield and flowering time can be either
stable or unstable across years [44,45]. QTL stability is discussed
further below.
Identification of Common Significant SNPs usingEnrichment Analysis
A second method of determining if the same genomic regions
have a significant effect on the accumulation of elements across
different field experiments was performed. For this method the 1%
most highly significant SNPs (,369 SNPs) for each trait separately
(e.g., arsenic), based on p-value, were compared across all the
GWA studies analysed per individual location. This analysis was
performed on the GWA studies only across ‘‘all’’ accessions
analysis and the 1% most significant SNPs were selected regardless
of the minor allele frequency (MAF) value. Where a SNP was
detected in four of the five sites it is reported in Table 4. There
were no individual SNPs present in the top 1% for more than
three of the five GWA studies for copper. For arsenic and zinc
GWA studies there was only a single SNP present in the top 1% in
four of the five site analyses at 24.69 Mb on chromosome 3 and
22.26 Mb on chromosome 3, respectively. However, for molyb-
denum GWA mapping there were 13 SNPs that were present in
the top 1% for four site analyses, and one present in all GWA
studies. A number of these molybdenum-associated SNPs were
within 200 kb of each other. For example, on chromosome 3 there
were four significant SNPs between 27.63–27.67 Mb.
Candidate Genes Near Associated SNPsFor the elements measured in the rice grains in this study, there
is varying knowledge on the molecular mechanisms of their
uptake, transport and accumulation in plants. To test if candidate
genes involved in the uptake, transportation or accumulation of
these mineral elements were located near associated SNPs, two
approaches were taken. For arsenic, copper and zinc, a small
subset of candidate genes were tested, with all these genes having a
known function for transporting these elements in rice. The
transporters of molybdenum are unknown in rice, but transporters
of molybdenum have been identified in other plant species [37],
therefore the rice orthologues of these genes were tested to see if
they were associated with significant SNPs detected in this study.
For arsenic transport in rice, Lsi1 (a NIP type aquaporin) and
Lsi2 (a silicon/arsenite efflux carrier) have been identified as inter
and extra cellular transporters of arsenic [46]. The gene encoding
LSI1 is located on chromosome 2 at 31266245–31269960 bp
(LOC Os02g51110) (Rice Genome Annotation Project (RGAP)
(http://rice.plantbiology.msu.edu)), whereas the gene encoding
LSI2 is located on chromosome 3 at 432878-430478 bp (LO-
C_Os03g01700). There were no significant SNPs associated with
grain arsenic within 200 kb of either of these two genes.
For molybdenum there are four known transporter genes in
plants [37], MOT1 and its homologue MOT2 in A. thaliana, plus
SHST1 in Stylosanthes hamata and MOT2 (not a homologue of A.
thaliana MOT1) from Chlamydomonas reinhardtii [39,47–49]. The
closest rice orthologue(s) for these four known transporter genes
were identified using BLASTp analysis against the RGAP as
describe in the methods section. For a number of these orthologues
there are significant SNPs within 200 kb of the candidate genes
(Figure 3) as described in the paragraph below. For the MOT1
orthologue on chromosome 8 (LOC_Os08g01120) there were
significant SNPs for grain molybdenum detected at the Texas field
site within the ‘‘all’’ accessions analysis. Also of note, a QTL in this
region was identified in a Bala 6 Azucena mapping population
[21] as well as within two Lemont6TeQing progeny populations
[22]. For the highest BLASTp hit of the SHST1 gene on rice
chromosome 3 (LOC_Os03g09970), there were significant SNPs
associated with grain molybdenum concentration within 200 kb of
the orthologue. The SNPs that were significant at this location
were detected within the ‘‘all’’ accessions analysis at the Faridpur
field site and within the ‘‘all’’ accessions analysis and temperate
japonicas subpopulation analysis at the Arkansas field site in 2006.
The other two SHST1 orthologues in rice were not near significant
SNPs. For the A. thaliana MOT2 orthologue on rice chromosome 1
(LOC_Os01g45830) there were significant SNPs detected within
200 kb for the Texas ‘‘all’’ accessions analysis, while for MOT2
from C. reinhardtii there were no SNPs significantly associated with
grain molybdenum for either of the two rice orthologues. The
location of significant SNPs associated with grain molybdenum at
three of the four known plant molybdenum transporters suggests
these genes are likely rice molybdenum transporters.
There are a number of genes (and gene families) that have been
identified as being involved in the uptake, transport, and
accumulation of copper and zinc in plants (for review see White
and Broadley; [50]). These include, but are not limited to, the ZIP
(Zinc-regulated transporter (ZRT), Iron-regulated transporter
(IRT)-like protein) family, YSL (yellow stripe-like) proteins, HMA
(heavy metal transporting ATPase) family, MTPs (metal tolerance
proteins), COPT (COPper Transporter)/Ctr (Copper transporter)
family, metallotheioneins, copper chaperone proteins, and
NRAMPs (Natural Resistance Associated Macrophage Proteins).
Some of these gene families have been implicated in the transport
of copper and zinc as well as other elements such as iron,
magnesium and cadmium. As there are such a large number of
genes implicated in the transport of copper and zinc in plants, we
limited our analysis to only those that have been directly identified
as having a role in the uptake, transport, and accumulation of
these elements in rice. For zinc, six ZIP genes (ZIP1, 3, 4, 5, 7a and
8) have all been identified as being directly involved in rice zinc
transport [23,51–55]. However, there were no significant SNPs
associated with zinc accumulation within 200 kb for any of these
genes.
Genome Wide Association for Elements in Rice
PLOS ONE | www.plosone.org 7 February 2014 | Volume 9 | Issue 2 | e89685

For copper, there is evidence that a number of the COPT genes
(COPT1, 2, 3, 4, 5, 6 and 7) transport copper in rice [56,57].
COPT1 (LOC_Os01g56420) and COPT2 (LOC_Os01g56430) are
neighbouring genes on rice chromosome 1 at 32523328–
32524183 bp and 32526290–32526942 bp, respectively. For
COPT1 and COPT2 there were a large number of SNPs
significantly associated with grain copper concentration in the
analysis conducted for the tropical japonica subpopulation at the
Arkansas field site in 2006 (Figure 2). There were no other
significant SNPs associated with grain copper located within
200 kb of the other COPT genes.
Lack of Co-localisation for Quantitative Trait LociOne of the most striking results of this study was the lack of
consistency of the detection of associations across multiple sites.
Some stability of QTLs across years may have been expected as it
has been demonstrated that for the traits measured in this study
there is high genetic broadsense heritability [17,21,22] and in this
study the variation explained by genetic variation is between 20–
74% (Table 1). Using the conventional approach of GWA
mapping (using a P-value and MAF cut off) no associations were
detected in more than two field sites at any one genomic location
(Figures 1–4). This improved slightly when using the SNP
enrichment method, where a number of SNPs were detected in
four or five field experiments (Table 4). However, this general lack
of co-localisation of significant associations across multiple sites
indicates the large effect that the environmental conditions had on
the underlying genetics. Previously Zhao et al. [5] observed the
effect that different environments can have on the flowering time
GWA mapping. It may not be surprising that the environment will
have such a large effect on the grain accumulation of elements
from the soil, like arsenic which is discussed below as an example.
Arsenic is not an essential element for plants so it is unlikely that
a mechanism has evolved specifically for its uptake. Furthermore,
arsenic’s bioavailability in the environment is complex. A
relationship between soil arsenic concentration and accumulation
in grains has been demonstrated but is not particularly strong and
in some cases not linear [58,59]. Also, under anaerobic conditions
arsenic is mainly present as arsenite while under aerobic
conditions it is present as arsenate [60]. This is important in
terms of bioavailability at the time of flowering and grain loading,
as different cultivars will flower at different times, and if the soil
conditions are different (especially in relation to redox state) this
could affect the species of arsenic which is bioavailable and which
uptake mechanism it would be utilising. It was shown in a number
of the field sites, for the cultivars used in this study, that there were
significant differences for grain arsenic when the cultivars were
grouped based on flowering time [35]. Flowering time has also
been shown to have an effect on the mapping of arsenic QTLs. In
the study by Norton et al. [17] large effect arsenic QTLs (which
had previously co-localised with flowering time QTLs) were not
detectable when the data was corrected for variations in flowering
time. It has also been demonstrated that environment greatly
affects the accumulation of arsenic [31,34,35]. Additionally, it has
been demonstrated that there is a genotype by environment
interaction for the accumulation of arsenic [31], so having
different genomic regions being significant in different environ-
ments may be related to differing environmental adaptation of the
cultivars. Research evaluating the importance of flowering time to
the genotype by environment interaction for grain elements is
required.
The most likely environmental factors that might explain QTL
6 environment interactions include climate, day length (as it
impacts flowering) and soil chemistry. Mean monthly maximum
and minimum temperatures for the four field sites during the
experimental period are given in Table S2. The monthly averages
for daily high and low temperatures during the Texas 2009 season
(planted 5/5/2009) were, on average, 5uC warmer than those
experienced in the two Arkansas seasons, while the temperatures
during the Faridpur, Bangladesh winter (dry) growing season, and
Table 4. SNPs identified in GWA studies as being in the top 1% most significant in at least four of the five field sites, with siteidentified with Y.
Field Site
Trait Ch. Mb SNP ARK06 ARK07 TX09 FAR QIY
As 3 24.69 ud3001374 Y – Y Y Y
Mo 2 29.29 id2012831 Y – Y Y Y
Mo 3 27.63 id3012036 Y – Y Y Y
Mo 3 27.67 dd3000580 Y – Y Y Y
Mo 3 27.67 id3012159 Y – Y Y Y
Mo 3 27.67 id3012161 Y Y Y Y Y
Mo 3 28.11 id3013000 Y – Y Y Y
Mo 3 28.12 id3013065 Y – Y Y Y
Mo 4 5.30 id4002236 Y – Y Y Y
Mo 4 29.85 id4010041 Y – Y Y Y
Mo 4 30.69 id4010426 Y Y – Y Y
Mo 5 15.70 id5006313 Y – Y Y Y
Mo 8 0.09 id8000032 Y Y Y – Y
Mo 8 0.17 wd8000030 Y Y Y – Y
Mo 8 0.65 id8000230 Y Y Y Y –
Zn 3 22.26 id3010343 Y – Y Y Y
doi:10.1371/journal.pone.0089685.t004
Genome Wide Association for Elements in Rice
PLOS ONE | www.plosone.org 8 February 2014 | Volume 9 | Issue 2 | e89685
the Qiyang, China 2009 summer season were approximately 3
and 8uC cooler than those of the Arkansas, growing season,
respectively. In the US sites, complete data is available for
temperature allowing a comparison between Arkansas experi-
ments in 2006 and 2007 (data not shown). While the monthly
averages determined from daily high and low temperatures for the
primary rice growing season (May – October) in Arkansas were
nearly identical between 2006 and 2007, there was a cool spell one
week after planting in 2007, while the 2006 planting was followed
by warm temperatures, resulting in slowed growth of the 2007
seedlings ultimately reflected in the fact that heading dates were,
on average, 2 weeks later in 2007 than in 2006 in spite of the 4-
days earlier planting. The observations above might suggest
temperature has a strong role in determining plant growth and
ultimately grain element composition but with so little data (in
terms of sites) validation or quantification are, as yet, impossible.
Another factor that could also affect the detection of QTLs
across multiple years is the different experimental setups that were
used. The field management was performed differently for each
site, generally reflecting the common practises (except the Texas
field site) of rice cultivation in the region. The Texas field site was
kept flooded until harvest, a practise not carried out at the other
field sites. These differences in field management may have
contributed to the lack of consistency of QTLs across field sites.
Considerations for Genome Wide Association Studies inRice
A potential limitation with the analysis conducted here is the
small number of genetic markers at present, a total of 36,901
across the genome, which equates to 1 marker every ,11.7 kb.
This becomes more of an issue when looking at the number of
markers within the subpopulations as not all markers are
informative (polymorphic) in all subpopulations. For example,
the temperate japonica subpopulation analysis only uses 13,295 SNPs
which equates to 1 SNP every ,32.2 kb. Therefore, the addition
of more markers to this population in the near future with a high
density rice array (SR McCouch, personal communication June
26, 2013) should improve the resolution at which mapping could
be done. The population used in this study is an excellent
germplasm collection representing the wide geographical and
ecological diversity of rice [7]. This diversity means that a large
number of haplotypes will be present, but a method has to be
adopted to remove the population structure, in this case a mixed
model approach. The study conducted by Huang et al [3]
overcame part of the problem of population structure by
conducting GWA mapping using only indica cultivars. Using
populations with high levels of genetic diversity and those with less
population structure has advantages and disadvantages. Zhao
et al. [5] highlighted some of these issues when using a diverse
population and a mixed model mapping approach; when alleles
segregate in only one subpopulation (e.g., temperate japonica) the
mixed model approach will miss these associations, however if the
alleles segregate across multiple subpopulations the mixed model
has the best power to identify them. The approach of using a single
subpopulation [3] is limited in that it does not include as much
genetic diversity as a population containing all the subgroups of
rice, however, using a single population does allow a large
population with little or no structure to be analysed. For rice, other
local populations are being developed; this includes an aus
population where the accessions have been collected from
Bangladesh and India [61]. For A. thaliana a regional population
(RegMap) has been developed for GWA mapping [62]. This panel
comprises of 1307 accessions with known geographic locations for
,1200 accessions [63]. Using this population of A. thaliana, GWA
mapping within both global and regional populations can be
performed, which allows for the comparison of the genetic basis of
adaptation of traits within ecologically different subsets [62]. If the
number of accessions within the rice diversity panel were increased
a similar approach could be adopted in rice.
The data presented here have been analysed using the standard
methods for this population [4,5]. Recently Korte et al. [64]
developed a method called multi-trait mixed model (MTMM),
which is a mixed model approach using correlated traits. This
method can be used on the data set produced here in two different
ways: firstly it could be used to look at the same trait across
multiple environments to identify genes that are involved in
differential responses to the environment. Secondly, as a number
of elemental concentrations are correlated within rice grains
[22,65], by using more phenotype data (for example grain iron,
cadmium, selenium, magnesium and manganese concentrations) it
is possible to increase the power of the GWA studies to identify
common associations.
SummaryGWA mapping of grain composition for four elements in rice
plants grown in five experiments has revealed associations with a
complex pattern of QTL 6 environment interaction. Despite this
complexity a number of loci and candidate genes have been
highlighted by the GWA mapping for future research. These
include loci where QTLs have previously been detected for
arsenic, copper, molybdenum and zinc (Figures 1–4), and loci
close to known transporters of copper (COPT1 and COPT2) as
well as orthologues of molybdenum transporters (MOT1, MOT2,
and SHST1).
Materials and Methods
Rice Mapping PopulationThe cultivars used in this study were from an established rice
diversity panel [5,7–9]. The RDP1 panel consists of 421 O. sativa
cultivars collected from 79 countries, and has representatives from
each of the major rice subpopulations (indica, aus, tropical japonica,
temperate japonica and aromatic (Group V)) [5]. The cultivars were
genotyped using 44,000 SNPs leading to the identification of
36,901 high-performing SNPs [5].
Field ExperimentThe experimental design and rice growth conditions have
previously been described in Zhao et al. [5] and Norton et al.
[35]. A total of 312 O. sativa cultivars were grown at the Faridpur
field site (in a farmer’s field where permission had been granted)
and at the Qiyang field site (Red Soil Experimental Station) 295
were grown. At both these sites the plants were transplanted in a
randomised complete block design (RCBD) with four replicates.
Plants were hand transplanted and each replicate consisted of 10
hills (one plant per hill) 20 cm apart. Each row was sown 20 cm
apart from the previous, and every other row was a check variety.
All the grains from all of the panicles from the six central plants
from each row were harvested by hand, and a subsample of the
grain was dehusked for elemental analysis.
For the field site in Arkansas (University of Arkansas Rice
Research and Extension Center), the field layout in both years was
a RCBD with two replications. In 2006 336 cultivars were sown in
to the field and in 2007 348 cultivars were sown. Seeds of each
cultivar were planted with a drill seeder about 2 cm deep in a
single row 5 m long with spacing of 25 cm between each plant and
50 cm between the rows. Three representative plants were
harvested by hand for the grain elemental determination.
Genome Wide Association for Elements in Rice
PLOS ONE | www.plosone.org 9 February 2014 | Volume 9 | Issue 2 | e89685
For the field site in Texas (Texas A&M AgriLife Research
Center), 370 cultivars were grown using a RCBD with three
replications. Plots were planted using the same methods as those
used in Arkansas. Five seeds per cultivar were drill-seeded ,2 cm
deep into 13 cm length lines, hereafter called hills. Five hills were
planted per row with 61 cm between hills within each field-row,
and 25 cm between rows. Genotypes were represented by one hill
per replication. Twenty fully mature seeds per hill were dehusked,
from which three seeds were randomly selected for elemental
analysis. The fields were fertilized in accordance with standard
production systems in each growing area (see Norton et al. [35] for
more details of soil fertility and amendments), and flooded in the
seedling stage. In Texas, the flood was maintained until all plots
were mature and harvested by hand. In all other locations, fields
were drained prior to harvest.
Grain Element Composition AnalysisThe methods for total element analysis were different as the
optimised standard procedures at the institutes where the samples
were analysed differed. The Bangladesh and China samples were
analysed at the University of Aberdeen, UK, whereas the Texas
and Arkansas samples were analysed at Purdue University, USA.
The following method was used for the analysis of the Faridpur
and Qiyang samples. Trace-element grade reagents were used for
all digests, and for quality control replicates of certified reference
material (CRM) (Rice flour (NIST 1568a)) were used; spikes and
blanks were included. Rice grain samples were dehusked, oven
dried (80uC), and 0.2 g weighed into 50 ml polyethylene
centrifuge tubes. Samples were microwave digested with concen-
trated HNO3 and H2O2 as described in Sun et al. [66]. Total
elemental analysis was performed by Inductively Coupled Plasma
Mass Spectrometry (ICP-MS) (Agilent Technologies 7500).
Rhodium (10 mg L21) was run on an external line as the internal
standard. Analysis was performed as described in Sun et al. [66].
The following method was used for the analysis of the grain
from the Texas and Arkansas sites. Three whole grains of fully
mature dehusked rice (,0.05 g) were digested with 1 ml of
concentrated HNO3 in 166100 mm Pyrex tubes, at temperatures
stepped from ambient to 110uC over a period of 12 h. Indium
(EM Science) was added to the acid to a final concentration of
20 mg L21 as an internal standard. Samples were diluted to 10 ml
and analyzed on a PerkinElmer Elan DRCe ICP-MS for total
element analysis. Portions of the samples were combined and used
as a matrix-matched standard for drift correction, measured after
every nine samples. Samples were normalized to the averaged
signals of the best-measured elements and weights of seven samples
per run.
Genome Wide Association Mapping Statistical AnalysisGWA mapping was performed using a mixed model on all the
cultivars (including the admix and aromatic cultivars), and also for
each of the four subpopulations separately according to Zhao et al
[5]. Briefly, a mixed effects model was used to model the
association between SNPs and each phenotype whilst accounting
for population structure using the R package EMMA [67].
Information about population structure [5] was incorporated into
models of all cultivars as both fixed and random effects whereas for
models of each of the four subpopulations random effects only
were used. For the fixed effects, population structure was included
as the first four principal components of a principal components
analysis of all SNPs across cultivars [68]. Random effects were
estimated by using a kinship matrix [5] which measured the
genetic similarity between individuals as the proportion of times a
given pair of cultivars had the same genotype across all SNPs (IBS
values).
Two approaches were used to identify if there were any
genomic regions significantly associated with a trait and present in
more than one GWA mapping analysis. The first method looked
at the regions with significant SNPs (where a SNP was determined
to be significant if the P-value was ,0.0001 and the MAF .5%).
In previous studies [4,69] the level of significance was determined
based on the a priori knowledge of candidate genes for the traits.
This information was used to set a level of significance for which
there was an enrichment of significant genomic regions containing
these candidate genes. However, for most of the traits described
here, there is little previous knowledge of candidate genes,
therefore an arbitrary value of P,0.0001 was set for the significant
threshold in this study. Chromosomal regions from different
analyses (including the within subpopulation analyses) were
determined to be co-localised if the significant SNPs fell within
200 kb of each other. For many traits previously analyzed in the
RDP1, the maximum-effect locus fell within a 200 kb region
containing the previously identified candidate genes [5]. For the
grain arsenic data across all analysis (all the subpopulation GWA
analysis and the ‘‘all’’ GWA analysis, across all five sites) the
association of SNPs with the traits was explored using two other p-
thresholds (using the same MAF cut-off). Initially, 330 SNPs were
identified as significant (i.e. had a p-value lower than 0.0001).
When the data was corrected using a Bonferroni correction of the
330 SNPs, 39 of these were below the threshold. When a
Benjamini Hochberg correction was applied to the data, 236 of the
330 SNPs were significant at the 5% level.
The second method used a SNP enrichment approach. For this
the top 1% most significant SNPs only were analysed (regardless of
MAF) from the GWA mapping that used all the data per element
(i.e., this was not done on the individual subpopulations) for each
field experiment. These SNPs were then analysed to determine if
they were present in multiple experiments.
Identification of Rice Orthologues for Candidate GenesProtein sequences of known transporters of molybdenum from
different species were compared to rice protein sequences using
BLASTp. The default parameters were used for BLASTp with the
species specified as Oryza sativa.
The protein sequence of the four known transporter genes of
molybdenum in plants were obtained from the National Center for
Biotechnology Information (NCBI) database. The closest rice
orthologue(s) for these four known transporter genes were
identified using BLASTp analysis against the RGAP. The closest
rice orthologue to the A. thaliana MOT1 gene (NP_180139) [41] is
located on chromosome 8 at 86335–88510 bp (LO-
C_Os08g01120) (E-value 1.8e2142). There are at least three rice
orthologues for SHST1 from S. hamata (CAA57710) [47]; one is
located on chromosome 3 at 4984577–4992411 bp (LO-
C_Os03g09970) (E-value 2.5e2239), another on chromosome 8
at 19427423–19432708 bp (LOC_Os08g31410) (E-value
2.7e2233), and the third is located on chromosome 3 at
4996773–5002177 bp (LOC_Os03g09980) (E-value 3.1e2218).
For MOT2 from A. thaliana (NP_178147) [48] there is a single
rice orthologue on chromosome 1 at 26034930-26033145 bp
(LOC_Os01g45830) (E-value 7.3e2146). For MOT2 from C.
reinhardtii (AEY68285) [49] there are two possible rice orthologues:
one on chromosome 10 at 20091716–20095059 bp (LO-
C_Os10g37520) (E-value 6.9e2128) and the other on chromosome
3 at 842386–846445 bp (LOC_Os03g02380) (E-value 3.4e2126).
Genome Wide Association for Elements in Rice
PLOS ONE | www.plosone.org 10 February 2014 | Volume 9 | Issue 2 | e89685
Supporting Information
Figure S1 Correlation for elements at the Arkansas fieldsite across both years. (A) copper P,0.001, r = 0.407; (B) zinc
P,0.001, r = 0.630; (C) arsenic P,0.001, r = 0.407; (D) molyb-
denum P,0.001, r = 0.555.
(TIF)
Table S1 Elemental concentrations within each sub-population at the five field experiments.(DOCX)
Table S2 Mean monthly temperatures (uC) and totalrainfall for the regions where field experiments wereconducted (from www.worldweatheronline.com).(DOCX)
Table S3 List of significant SNPs associated with theaccumulation of arsenic within rice grains.(XLSX)
Table S4 List of significant SNPs associated with theaccumulation of copper within rice grains.
(XLSX)
Table S5 List of significant SNPs associated with theaccumulation of molybdenum within rice grains.
(XLSX)
Table S6 List of significant SNPs associated with theaccumulation of zinc within rice grains.
(XLSX)
Acknowledgments
The authors would like to thank the Red Soil Experimental Station,
Chinese Academy of Agricultural Sciences for conducting the field
experiment at Qiyang.
Author Contributions
Conceived and designed the experiments: GJN SRMP MLG LT GCE SM
FJZ MRI YGZ DES AAM AHP. Performed the experiments: GJN BL EY
SRMP LT GCE MRI SI GD. Analyzed the data: GJN AD SRMP LT
GCE DES AAM AHP. Wrote the paper: GJN AD SRMP LT GCE DES
AAM AHP.
References
1. Graham R, Sendhira D, Beebe S, Iglesias C, Monasterio I. (1999) Breeding for
micronutrient density in edible portions of staple food crops: conventional
approaches. Field Crop Res 60: 57–80.
2. Norton GJ, Islam RM, Deacon CM, Zhao FJ, Stroud JL, et al. (2009)
Identification of low inorganic and total grain arsenic rice cultivars from
Bangladesh. Environ Sci Technol 43: 6070–6075.
3. Huang X, Wei X, Sang T, Zhao Q, Feng Q, et al. (2010) Genome-wide
association studies of 14 agronomic traits in rice landraces. Nat Genet 42: 961–
967.
4. Famoso AN, Zhao K, Clark RT, Tung CW, Wright MH, et al. (2011) Genetic
architecture of aluminium tolerance in rice (Oryza sativa) determined through
genome-wide association analysis and QTL mapping. PLoS Genet 7: 8.
5. Zhao K, Tung CW, Eizenga GC, Wright MH, Ali ML, et al. (2011) Genome-
wide association mapping reveals a rich genetic architecture of complex traits in
Oryza sativa. Nat Comm 2: 467.
6. Huang X, Zhao Y, Wei X, Li C, Wang A, et al. (2012) Genome-wide association
study of flowering time and grain yield traits in a worldwide collection of rice
germplasm. Nat Genet 44: 32–40.
7. Eizenga GC, Ali ML, Bryant RJ, Yeater KM, McClung AM, McCouch SR.
(2014) Registration of the ‘Rice Diversity Panel 1’ for genome-wide association
studies. J Plant Registrations 8: 109–116.
8. Tung CW, Zhao K, Wright MH, Ali ML, Jung J, et al. (2010). Development of a
research platform for dissecting phenotype–genotype associations in rice (Oryza
spp.). Rice 3: 205–217.
9. Zhao K, Wright M, Kimball J, Eizenga G, McClung A, et al. (2010) Genomic
diversity and introgression in O. sativa reveal the impact of domestication and
breeding on the rice genome. PLoS One 5: e10780.
10. Maret W and Sandstead HH (2006) Zinc requirements and the risks and benefits
of zinc supplementation. J. Trace Elem. Med. Biol 20: 3–18.
11. World Health Organization (WHO). World health report reducing Risks,
Promoting Healthy Life. WHO: Geneva, Switzerland; 2002.
12. World Health Organization (WHO) (2009) Micronutrient deficiencies. Iron
deficiency anaemia. http://www.who/nutrition of subordinate document.
Accessed 24 July 2009.
13. Stangoulis JCR, Huynh BL, Welch RM, Choi EY, Graham RD (2007)
Quantitative trait loci for phytate in rice grain and their relationship with grain
micronutrient content. Euphytica 154: 289–294.
14. Jiang SL, Wu JG, Thang NB, Feng Y, Yang XE, et al. (2008) Genotypic
variation of mineral elements contents in rice (Oryza sativa L.) Eur Food Res
Technol, 228: 115–122.
15. Lu K, Li L, Zheng X, Zhang Z, Mou T, et al. (2008) Quantitative trait loci
controlling Cu, Ca, Zn, Mn and Fe content in rice grains. J Genet 87: 305–310.
16. Garcia-Oliveira AL, Tan L, Fu Y, Sun C. (2009) Genetic identification of
quantitative trait loci for contents of mineral nutrients in rice grain. J Integr
Plant Biol 51: 84–92.
17. Norton GJ, Deacon CM, Xiong L, Huang S, Meharg AA, et al. (2010) Genetic
mapping of the rice ionome in leaves and grain: Identification of QTLs for 17
elements including arsenic, cadmium, iron and selenium. Plant Soil 329: 139–
153.
18. Zeng Y, Zhang H, Wang L, Pu X, Du J, et al. (2010) Genotypic variation in
element concentrations in brown rice from Yunnan landraces in China. Environ
Geo Health 32: 165–177.
19. Zhang X, Zhang G, Guo L, Wang H, Zeng D, et al. (2011) Identification of
quantitative trait loci for Cd and Zn concentrations of brown rice grown in Cd-
polluted soils. Euphytica 180: 173–179.
20. Anuradha K, Agarwal S, Rao YV, Rao KV, Viraktamath BC, et al. (2012)
Mapping QTLs and candidate genes for iron and zinc concentrations in
unpolished rice of Madhukar6Swarna RILs. Gene 508; 233–240.
21. Norton GJ, Duan G, Lei M, Zhu YG, Meharg AA, et al. (2012) Identification of
quantitative trait loci for rice grain element composition on an arsenic impacted
soil: Influence of flowering time on genetic loci. Ann Appl Biol 161: 46–56.
22. Zhang M, Pinson SRM, Tarpley L, Huang X, Lahner B, et al. (2013) Mapping
and validation of quantitative trait toci associated with concentration of 16
elements in unmilled rice grain. Theor Appl Genet DOI 10.1007/s0012-013-
2207-5.
23. Waters BM, Sankaran RP. (2011). Moving micronutrients from the soil to the
seeds: genes and physiological processes from a biofortification perspective. Plant
Sci 180: 562–574.
24. Marschner H (1995) Mineral Nutrition of Higher Plants. Academic press.
25. Williams PN, Islam MR, Adomako EE, Raab A, Hossain SA, et al. (2006)
Increase in rice grain arsenic for regions of Bangladesh irrigating paddies with
elevated arsenic in groundwaters. Environ Sci Technol 40: 4903–4908.
26. Ohno K, Yanase T, Matsuo Y, Kimura T, Hamidur Rahman M, et al. (2007)
Arsenic intake via water and food by a population living in an arsenic-affected
area of Bangladesh. Sci Total Environ 381: 68–76.
27. Kile ML, Houseman EA, Breton CV, Smith T, Quamruzzaman Q, et al. (2007)
Dietary arsenic exposure in Bangladesh. Environ Health Perspect 115: 889–893.
28. Mondal D, Polya DA. (2008) Rice is a major exposure route for arsenic in
Chakdaha block, Nadia district, West Bengal, India: A probabilistic risk
assessment. Appl Geochem 23: 2986–2997.
29. Agusa T, Kunito T, Minh TB, Kim Trang PT, Iwata H, et al. (2009)
Relationship of urinary arsenic metabolites to intake estimates in residents of the
Red River Delta, Vietnam. Environ Pollut 157: 396–403.
30. National Research Council. Arsenic in drinking water-2001 Update; National
Academy Press: Washington, D.C., 2001.
31. Norton GJ, Duan G, Dasgupta T, Islam RM, Ming L, et al. (2009)
Environmental and genetic control of arsenic accumulation and speciation in
rice grain: comparing a range of common cultivars grown in contaminated sites
across Bangladesh, China and India. Environ Sci Technol 43: 8381–8386.
32. Tuli R, Chakrabarty D, Trivedi PK, Tripathi RD. (2010) Recent advances in
arsenic accumulation and metabolism in rice. Mol Breed 26: 307–323.
33. Pillai TR, Yan W, Agrama HA, James WD, Ibrahim AMH, et al. (2010) Total
grain-arsenic and arsenic-species concentrations in diverse rice cultivars under
flooded conditions. Crop Sci 50: 2065–2075.
34. Ahmed ZU, Panaullah GM, Gauch H, McCouch SR, Tyagi W, et al. (2011)
Genotype and environment effects on rice (Oryza sativa L.) grain arsenic
concentration in Bangladesh. Plant Soil 338: 367–382.
35. Norton GJ, Pinson SRM, Alexander J, Mckay S, Hansen H, et al. (2012)
Variation in grain arsenic assessed in a diverse panel of rice (Oryza sativa) grown
in multiple sites. New Phyt 193: 650–664.
36. Zhang J, Zhu Y, Zeng D, Cheng W, Qian Q, et al. (2008) Mapping quantitative
trait loci associated with arsenic accumulation in rice (Oryza sativa). New Phyt
177: 350–355.
37. Mendel RR. (2011) Cell biology of molybdenum in plants. Plant Cell Rep 30:
1787–1797.
Genome Wide Association for Elements in Rice
PLOS ONE | www.plosone.org 11 February 2014 | Volume 9 | Issue 2 | e89685
38. Tomatsu H, Takano J, Takahashi H, Watanabe-Takahashi A, Shibagaki N, et
al. (2007) An Arabidopsis thaliana high-affinity molybdate transporter requiredfor efficient uptake of molybdate from soil. Proc Natl Acad Sci. 20: 18807–
18812.
39. Baxter I, Muthukumar B, Park HC, Buchner P, Lahner B, et al. (2008) Variationin molybdenum content across broadly distributed populations of Arabidopsis
thaliana is controlled by mitochondrial molybdenum transporter (MOT1). PLosGenet 4: e1000004.
40. Kiani SP, Trontin C, Andreatta M, Simon M, Robert T, et al. (2012) Allelic
heterogeneity and trade-off shape natural variation for response to soilmicronutrient. PLoS Genet 8: e1002814.
41. Mather KA, Caicedo AL, Polato NR, Olsen KM, McCouch S, et al. (2007) Theextent of linkage disequilibrium in rice (Oryza sativa L.). Genet 177: 2223–2232.
42. Atwell S, Huang YS, Vilhjalmsson BJ, Willems G, Horton M, et al. (2010)Genome-wide association study of 107 phenotypes in Arabidopsis thaliana inbred
lines. Nat 465: 627–631.
43. Toomajian C, Hu TT, Aranzan MJ, Lister C, Tang C, et al. (2006) Anonparametric test reveals selection for flowering in the Arabidopsis genome.
PLoS Biol 4: e137.44. Xing YZ, Tan YF, Hua JP, Sun XL, Xu CG, et al. (2002) Characterisation of
the main effects, epistatic effects and their environmental interactions of QTLs
on the genetic basis of yield traits in rice. Theor Appl Genet 105: 248–257.45. Cui K, Peng S, Ying Y, Yu S, Xu C. (2004) Molecular dissection of the
relationships among tiller number, plant height and heading date in rice. PlantProd Sci 7: 309–318.
46. Ma JF, Yamaji N, Mitani N, Xu XY, Su YH, et al. (2008) Transporters ofarsenite in rice and their role in arsenic accumulation in rice grain. PROC
NATL ACAD SCI 105: 9931–9935.
47. Fitzpatrick KL, Tyerman SD, Kaiser BN. (2008) Molybdate transport throughthe plant sulphate transporter SHST1. FEBS Letter 582: 1508–1513.
48. Gasber A, Klaumann S, Trentmann O, Trampczynsk A, Clemens S, et al.(2011) Identification of an Arabidopsis solute carrier critical for intracellular
transport and inter-organ allocation of molybdate. Plant Biol 13: 710–718.
49. Tejada-Jimenez M, Galvan A, Fernandez E. (2011) Algae and humans share amolybdate transporter. Proc Natl Acad Sci 108: 6420–6425.
50. White PJ, Broadley MR. (2009) Biofortification of crops with seven mineralelements often lacking in human diets - iron, zinc, copper, calcium, magnesium,
selenium and iodine. New Phyt 182: 49–84.51. Ishimaru Y, Suzuki M, Kobayashi M, Nakanishi H, Mori S, et al. (2005)
OsZIP4, a novel zinc-regulated transporter in rice. J Exp Bot 56: 3207–3214.
52. Lee S, Jeong HJ, Kim SA, Lee J, Guerinot ML, et al. (2010) OsZIP5 is a plasmamembrane zinc transporter in rice. Plant Mol Biol 73: 507–517.
53. Lee S, Kim SA, Lee J, Guerinot ML, An G. (2010) Zinc deficiency-inducibleOsZIP8 encodes a plasma membrane-localized zinc transporter in rice. Mol Cells
29: 551–558.
54. Ramesh SA, Shin R, Eide DJ, Schachtman DP. (2003) Differential metalselectivity and gene expression of two zinc transporters from rice. Plant Physiol
133: 126–134.
55. Yang X, Huang J, Jiang Y, Zhang HS. (2009) Cloning and functional
identification of two members of the ZIP (Zrt, Irt-like protein) gene family in rice
(Oryza sativa L.) Mol Biol Rep 36: 281–287.
56. Yuan M, Chu Z, Li X, Xu C, Wang S. (2010) The bacterial pathogen
Xanthomonas oryzae overcomes rice defenses by regulating host copper
redistribution. Plant Cell 22: 3164–3176.
57. Yuan M, Li X, Xiao J, Wang S. (2011) Molecular and functional analyses of
COPT/Ctr-type copper transporter-like gene family in rice. BMC Plant Biol 11:
69.
58. Lu Y., Adomako EE, Solaiman ARM, Islam MR, Deacon C, Williams PN,
Rahman GKMM, Meharg AA. (2008) Baseline soil variation is a major factor in
arsenic accumulation in Bengal Delta paddy rice. Environ Sci Technol 43:
1724–1729.
59. Adomako EE, Solaiman ARM, Williams PN, Deacon C, Rahman GKMM,
Meharg AA. (2009) Enhanced transfer of arsenic to grain for Bangladesh grown
rice compared to US and EU. Environ Int 35: 476–479.
60. Xu XY, McGrath SP, Meharg AA, Zhao FJ. (2008) Growing rice aerobically
markedly decreases arsenic accumulation. Environ Sci Technol 42: 5574–5579.
61. Price AH, Norton GJ, Salt DE, Ebenhoeh O, Meharg AA, et al. (2013) Alternate
wetting and drying irrigation for rice in Bangladesh: Is it sustainable and has
plant breeding something to offer? Food Energy Security doi: 10.1002/fes3.29.
62. Horton MW, Hancock AM, Huang YS, Toomajian C, Atwell S, et al. (2012)
Genome-wide patterns of genetic variation in worldwide Arabidopsis thaliana
accessions from the RegMap panel. Nat Genet 44: 212–216.
63. Anastasio AE, Platt A, Horton M, Grotewold E, Scholl R, et al. (2011) Source
verification of misidentified Arabidopsis thaliana accessions. Plant J 67: 554–566.
64. Korte A, Vilhjalmsson BJ, Segura V, Platt A, Long Q, et al. (2012) A mixed-
model approach for genome-wide association studies of correlated traits in
structured populations. Nat Genet 44: 1066–1071.
65. Jiang SL, Wu JG, Feng Y, Yang XE, Shi CH. (2007) Correlation analysis of
mineral element contents and quality traits in milled rice (Oryza sativa L.). J Agr
Food Chem 55: 9608–9613.
66. Sun G, Williams PN, Zhu Y, Deacon C, Carey A, et al. (2009) Survey of arsenic
and its speciation in rice products such as breakfast cereals, rice crackers and
Japanese rice condiments. Environ Inter 35: 473–475.
67. Yu J, Pressoir G, Briggs WH, Vroh Bi I, Yamasaki M, Doebley JF, McMullen
MD, et al. (2006). A unified mixed-model method for association mapping that
accounts for multiple levels of relatedness. Nat Genet 38: 203–208. doi:10.1038/
ng1702.
68. Price AL, Patterson NJ, Plenge RM, Weinblatt ME, Shadick NA, Reich D.
(2006). Principal components analysis corrects for stratification in genome-wide
association studies. Nat Genet 38: 904–909. doi:10.1038/ng1847.
69. Li Y, Huang Y, Bergelson J, Nordborg M, Borevitz JO. (2010) Association
mapping of local climate-sensitive quantitative trait loci in Arabidopsis thaliana.
Proc Natl Acad Sci 107: 21199–21024.
Genome Wide Association for Elements in Rice
PLOS ONE | www.plosone.org 12 February 2014 | Volume 9 | Issue 2 | e89685