
Genome-wide analysis of ets-family DNA-binding in vitro and in vivo
14
EMBO open Genome-wide analysis of ETS-family DNA-binding in vitro and in vivo This is an open-access article distributed under the terms of the Creative Commons Attribution Noncommercial Share Alike 3.0 Unported License, which allows readers to alter, transform, or build upon the article and then distribute the resulting work under the same or similar license to this one. The work must be attributed back to the original author and commercial use is not permitted without specific permission. Gong-Hong Wei 1 , Gwenael Badis 2 , Michael F Berger 3,4,5,6 , Teemu Kivioja 1,7 , Kimmo Palin 7 , Martin Enge 8 , Martin Bonke 1 , Arttu Jolma 1 , Markku Varjosalo 1 , Andrew R Gehrke 3,4,5,6 , Jian Yan 1 , Shaheynoor Talukder 2 , Mikko Turunen 1 , Mikko Taipale 1 , Hendrik G Stunnenberg 9 , Esko Ukkonen 7 , Timothy R Hughes 2 , Martha L Bulyk 3,4,5,6 and Jussi Taipale 1,8, * 1 Public Health Genomics Unit, National Institute for Health and Welfare (THL) and Genome-Scale Biology Program, Institute of Biomedicine and High Throughput Center, University of Helsinki, Biomedicum, Helsinki, Finland, 2 Department of Molecular Genetics and Banting and Best Department of Medical Research, University of Toronto, Toronto, Ontario, Canada, 3 Division of Genetics, Department of Medicine, Brigham and Women’s Hospital and Harvard Medical School, Boston, MA, USA, 4 Department of Pathology, Brigham and Women’s Hospital and Harvard Medical School, Boston, MA, USA, 5 Committee on Higher Degrees in Biophysics, Harvard University, Cambridge, MA, USA, 6 Harvard-MIT Division of Health Sciences and Technology (HST), Harvard Medical School, Boston, MA, USA, 7 Department of Computer Science, University of Helsinki, Helsinki, Finland, 8 Department of Biosciences and Medical Nutrition, Karolinska Institutet, Sweden and 9 Department of Molecular Biology, Radboud University Nijmegen, Nijmegen, The Netherlands Members of the large ETS family of transcription factors (TFs) have highly similar DNA-binding domains (DBDs)— yet they have diverse functions and activities in physiol- ogy and oncogenesis. Some differences in DNA-binding preferences within this family have been described, but they have not been analysed systematically, and their contributions to targeting remain largely uncharacterized. We report here the DNA-binding profiles for all human and mouse ETS factors, which we generated using two differ- ent methods: a high-throughput microwell-based TF DNA- binding specificity assay, and protein-binding microarrays (PBMs). Both approaches reveal that the ETS-binding profiles cluster into four distinct classes, and that all ETS factors linked to cancer, ERG, ETV1, ETV4 and FLI1, fall into just one of these classes. We identify amino-acid residues that are critical for the differences in specificity between all the classes, and confirm the specificities in vivo using chromatin immunoprecipitation followed by sequencing (ChIP-seq) for a member of each class. The results indicate that even relatively small differences in in vitro binding specificity of a TF contribute to site selectivity in vivo. The EMBO Journal (2010) 29, 2147–2160. doi:10.1038/ emboj.2010.106; Published online 1 June 2010 Subject Categories: chromatin & transcription; genomic & computational biology Keywords: cancer; ChIP-seq; DNA-binding specificity; ETS family of transcription factors; transcription factor-DNA binding assay Introduction We currently know very little about the molecular mechan- isms that control tissue-specific gene expression, and about the variations in gene expression that underlie many patho- logical states, including cancer. This is in part due to the lack of information about the ‘second genetic code’—the binding specificities of transcription factors (TFs). Deciphering this regulatory code will allow us to explain observations (i.e. ChIP, expression profiling) based on biochemical principles. The ultimate aim is to read the genetic code of gene expres- sion, that is, understand the expression of genes based on DNA sequence. To begin to address these questions, we have in this work concentrated on the study of the large ETS family of TFs, whose members have diverse functions and activities in physiology and oncogenesis (Bartel et al, 2000; Sharrocks, 2001; Kumar-Sinha et al, 2008). The first ETS factor identified was ETS1, which was discovered as a homolog of the avian leukaemia virus E26 oncogene in 1983 (Leprince et al, 1983; Nunn et al, 1983). Subsequent analyses have identified a total of 27 and 26 ETS-family members in human and mouse genomes, respectively (Bult et al, 2008). ETS factors have both developmental functions (Schober et al, 2005), and functions in differentiated tissues and cells (Bartel et al, 2000). They are critical for vasculogenesis/ angiogenesis, hematopoiesis and neuronal development (Bartel et al, 2000; Vrieseling and Arber, 2006). Cellular responses to activated ETS factors include cell proliferation, differentiation and migration (Sharrocks, 2001; Schober et al, 2005), depending on the type and state of the responding cell. Many ETS proteins, including ETV4 in mammals and Yan in Drosophila are transcriptional targets of signalling path- ways (Schober et al, 2005; Vrieseling and Arber, 2006). Activity of ETS proteins can also be modulated directly by phosphorylation; members of the ETS and ELK subgroups of ETS factors mediate transcriptional responses to Ras/MAPK signalling pathways in species ranging from Caenorhabditis elegans to humans (Brunner et al, 1994; O’Neill et al, 1994; Received: 9 December 2009; accepted: 4 May 2010; published online: 1 June 2010 *Corresponding author. Department of Biosciences and Medical Nutrition, Karolinska Institutet, Sweden. Tel.: þ 46 858 583 833; E-mail: [email protected] The EMBO Journal (2010) 29, 2147–2160 | & 2010 European Molecular Biology Organization | Some Rights Reserved 0261-4189/10 www.embojournal.org & 2010 European Molecular Biology Organization The EMBO Journal VOL 29 | NO 13 | 2010 EMBO THE EMBO JOURNAL THE EMBO JOURNAL 2147
Transcript of Genome-wide analysis of ets-family DNA-binding in vitro and in vivo
EMBOopen
Genome-wide analysis of ETS-family DNA-bindingin vitro and in vivo
This is an open-access article distributed under the terms of the Creative Commons Attribution Noncommercial ShareAlike 3.0 Unported License, which allows readers to alter, transform, or build upon the article and then distribute theresultingworkunder the sameor similar license to this one. Theworkmust be attributed back to the original authorandcommercial use is not permitted without specific permission.
Gong-Hong Wei1, Gwenael Badis2,Michael F Berger3,4,5,6, Teemu Kivioja1,7,Kimmo Palin7, Martin Enge8,Martin Bonke1, Arttu Jolma1,Markku Varjosalo1, Andrew R Gehrke3,4,5,6,Jian Yan1, Shaheynoor Talukder2,Mikko Turunen1, Mikko Taipale1,Hendrik G Stunnenberg9, Esko Ukkonen7,Timothy R Hughes2, Martha L Bulyk3,4,5,6
and Jussi Taipale1,8,*1Public Health Genomics Unit, National Institute for Health and Welfare(THL) and Genome-Scale Biology Program, Institute of Biomedicine andHigh Throughput Center, University of Helsinki, Biomedicum, Helsinki,Finland, 2Department of Molecular Genetics and Banting and BestDepartment of Medical Research, University of Toronto, Toronto, Ontario,Canada, 3Division of Genetics, Department of Medicine, Brigham andWomen’s Hospital and Harvard Medical School, Boston, MA, USA,4Department of Pathology, Brigham and Women’s Hospital and HarvardMedical School, Boston, MA, USA, 5Committee on Higher Degrees inBiophysics, Harvard University, Cambridge, MA, USA, 6Harvard-MITDivision of Health Sciences and Technology (HST), Harvard MedicalSchool, Boston, MA, USA, 7Department of Computer Science, Universityof Helsinki, Helsinki, Finland, 8Department of Biosciences and MedicalNutrition, Karolinska Institutet, Sweden and 9Department of MolecularBiology, Radboud University Nijmegen, Nijmegen, The Netherlands
Members of the large ETS family of transcription factors
(TFs) have highly similar DNA-binding domains (DBDs)—
yet they have diverse functions and activities in physiol-
ogy and oncogenesis. Some differences in DNA-binding
preferences within this family have been described, but
they have not been analysed systematically, and their
contributions to targeting remain largely uncharacterized.
We report here the DNA-binding profiles for all human and
mouse ETS factors, which we generated using two differ-
ent methods: a high-throughput microwell-based TF DNA-
binding specificity assay, and protein-binding microarrays
(PBMs). Both approaches reveal that the ETS-binding
profiles cluster into four distinct classes, and that all ETS
factors linked to cancer, ERG, ETV1, ETV4 and FLI1, fall
into just one of these classes. We identify amino-acid
residues that are critical for the differences in specificity
between all the classes, and confirm the specificities
in vivo using chromatin immunoprecipitation followed
by sequencing (ChIP-seq) for a member of each class.
The results indicate that even relatively small differences
in in vitro binding specificity of a TF contribute to site
selectivity in vivo.
The EMBO Journal (2010) 29, 2147–2160. doi:10.1038/
emboj.2010.106; Published online 1 June 2010
Subject Categories: chromatin & transcription; genomic
& computational biology
Keywords: cancer; ChIP-seq; DNA-binding specificity; ETS
family of transcription factors; transcription factor-DNA
binding assay
Introduction
We currently know very little about the molecular mechan-
isms that control tissue-specific gene expression, and about
the variations in gene expression that underlie many patho-
logical states, including cancer. This is in part due to the lack
of information about the ‘second genetic code’—the binding
specificities of transcription factors (TFs). Deciphering this
regulatory code will allow us to explain observations (i.e.
ChIP, expression profiling) based on biochemical principles.
The ultimate aim is to read the genetic code of gene expres-
sion, that is, understand the expression of genes based on
DNA sequence.
To begin to address these questions, we have in this work
concentrated on the study of the large ETS family of TFs,
whose members have diverse functions and activities in
physiology and oncogenesis (Bartel et al, 2000; Sharrocks,
2001; Kumar-Sinha et al, 2008). The first ETS factor identified
was ETS1, which was discovered as a homolog of the avian
leukaemia virus E26 oncogene in 1983 (Leprince et al, 1983;
Nunn et al, 1983). Subsequent analyses have identified a total
of 27 and 26 ETS-family members in human and mouse
genomes, respectively (Bult et al, 2008).
ETS factors have both developmental functions (Schober
et al, 2005), and functions in differentiated tissues and cells
(Bartel et al, 2000). They are critical for vasculogenesis/
angiogenesis, hematopoiesis and neuronal development
(Bartel et al, 2000; Vrieseling and Arber, 2006). Cellular
responses to activated ETS factors include cell proliferation,
differentiation and migration (Sharrocks, 2001; Schober et al,
2005), depending on the type and state of the responding cell.
Many ETS proteins, including ETV4 in mammals and Yan
in Drosophila are transcriptional targets of signalling path-
ways (Schober et al, 2005; Vrieseling and Arber, 2006).
Activity of ETS proteins can also be modulated directly by
phosphorylation; members of the ETS and ELK subgroups of
ETS factors mediate transcriptional responses to Ras/MAPK
signalling pathways in species ranging from Caenorhabditis
elegans to humans (Brunner et al, 1994; O’Neill et al, 1994;Received: 9 December 2009; accepted: 4 May 2010; published online:1 June 2010
*Corresponding author. Department of Biosciences and MedicalNutrition, Karolinska Institutet, Sweden. Tel.: þ 46 858 583 833;E-mail: [email protected]
The EMBO Journal (2010) 29, 2147–2160 | & 2010 European Molecular Biology Organization |Some Rights Reserved 0261-4189/10
www.embojournal.org
&2010 European Molecular Biology Organization The EMBO Journal VOL 29 | NO 13 | 2010
EMBO
THE
EMBOJOURNAL
THE
EMBOJOURNAL
2147
Beitel et al, 1995; Sharrocks, 2001). The mechanism of
activation of the ELK factors in response to activation
of Ras also appears to be conserved between species
(Wasylyk et al, 1997).
Translocations altering the activity of several members of
the ETS family are associated with multiple types of human
cancer. In translocations observed in some cancer types, the
ETS DNA-binding domain (DBD) is lost, and the ETS partner
contributes a regulatory domain to another class of DBD
(e.g. ETV6-RUNX1; Golub et al, 1995; Mavrothalassitis and
Ghysdael, 2000). More commonly, the cancer-associated
translocations result in fusion of a strong transcriptional
activator domain to the ETS DBD (e.g. EWS fused to FLI1
or ERG in Ewing’s sarcoma; Delattre et al, 1992; Sorensen
et al, 1994) and/or overexpression of an ETS-family member
due to introduction of a strong cis-regulatory element up-
stream of it (Tomlins et al, 2005, 2007). In fact, the most
common known cancer-associated translocation is the
TMPRSS2-ERG fusion, which introduces a strong androgen
receptor (AR)-dependent regulatory element upstream of the
ERG gene (Tomlins et al, 2005). Together with other translo-
cations involving ETV1 and ETV4, over 50% of all prostate
cancer cases display hyperactivity of ETS proteins (Kumar-
Sinha et al, 2008).
All ETS factors share a conserved winged helix-turn-helix
DBD of B85 amino acids, and all analysed members of this
family bind to a consensus DNA sequence containing a core
50-GGA(A/T)-30 motif (Karim et al, 1990; Nye et al, 1992).
On the basis of phylogenetic analysis of the DBDs, the ETS
family has been subdivided into 12 different subgroups (Laudet
et al, 1999; Hollenhorst et al, 2007). Thus, although all ETS
DBDs are relatively highly conserved, different ETS proteins
might exhibit a preference for different flanking sequences to
differentially bind to specific DNA sites, and thus regulate
distinct biological processes. However, there exists no systema-
tic and uniform analysis of ETS-binding specificities, and
whether differences in binding specificity (if any) relate to
targeting in vivo. An earlier analysis showed that there were
differences between published motifs for different ETS-family
members, but these differences did not reflect amino-acid
features, and might be due to differences in the experimental
methods used in different studies (Kielbasa et al, 2005).
In this work, we describe the first comprehensive genome-
wide analysis of binding specificities of the ETS TF family.
We find that the ETS-family DNA-binding specificities fall into
four distinct classes, and confirm this finding by identifying
the key DNA-contact amino acids that contribute to class
specificity. We further perform ChIP-seq analyses for repre-
sentative ETS factors to map the ETS-binding sites in vivo in
Ewing’s sarcoma, leukaemia and prostate cancer cells. These
analyses provide a systematic genome-wide map of ETS DNA-
binding specificities in vitro and in vivo. Remarkably, the
genome-wide data reveal that even small differences in ETS
DNA-binding preferences can contribute to in vivo targeting
specificities.
Results
Systematic determination of ETS-binding specificities
To determine the binding specificities of the ETS factors, we
first cloned all human and mouse ETS DBDs and human ETS
full-length cDNAs (Figure 1; Supplementary Table S1). Two
parallel methods were used to independently determine
relative DNA sequence-specific binding affinities: high-
throughput microwell-based TF DNA-binding specificity
assay (Hallikas and Taipale, 2006; Hallikas et al, 2006) and
protein-binding microarrays (PBMs; Berger et al, 2006). As
these two strategies are based on different principles, they act
to complement and cross-validate each other.
In the microwell-based assay, human and mouse ETS
DBDs were expressed as fusion proteins to a Renilla luciferase
enzyme. The TF-Renilla luciferase fusion proteins were in-
cubated with biotinylated double-stranded oligonucleotide
containing a sequence with high affinity to all known ETS
factors in the presence of an excess of mismatched competitor
oligos. The binding data were then analysed to produce a
position weight matrix (PWM) of the TF-binding site.
Independent analysis of the mouse ETS family was carried
out using PBMs, which allow determination of TF-binding
specificities through sequence-specific binding of individual
TFs directly to double-stranded DNA microarrays containing
all possible 10-mer binding sites (Berger et al, 2006).
Both methods generated similar binding profiles (Figure 1;
Supplementary Table S2), with all of the ETS factors binding
to the previously described core GGA(A/T) motif. Of the 27
factors we studied, 13 had been previously analysed using
different methods to yield a partial binding specificity. Our
results were similar, but not identical, to these earlier studies,
as described in the following sections.
Analysis of the divergence of ETS TF-binding profiles
We next analysed the differences in the obtained profiles to
determine which ETS factors have similar binding specifici-
ties. For this purpose, we developed a computational method
that allows determination of similarity between TF motifs
using the minimum Kullback–Leibler divergence between all
translations and reverse complementations of the multino-
mial distributions defined by the motifs. This analysis re-
vealed that all ETS profiles were relatively similar to each
other, and clearly divergent from publicly available non-ETS
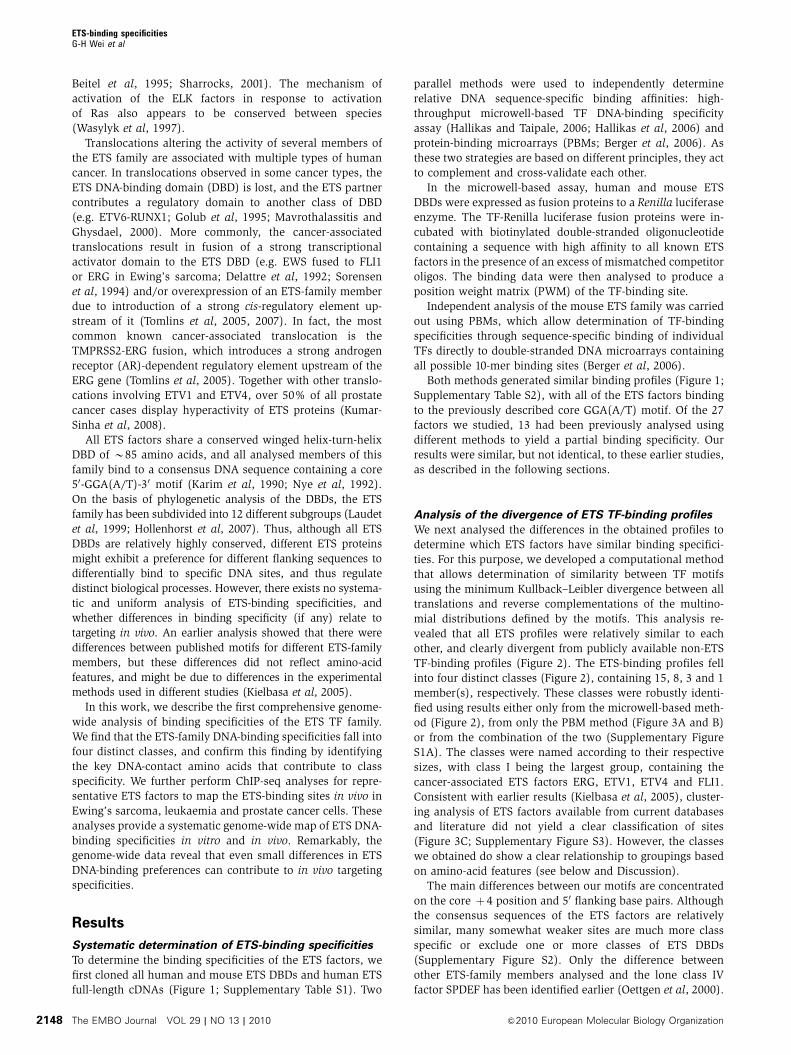
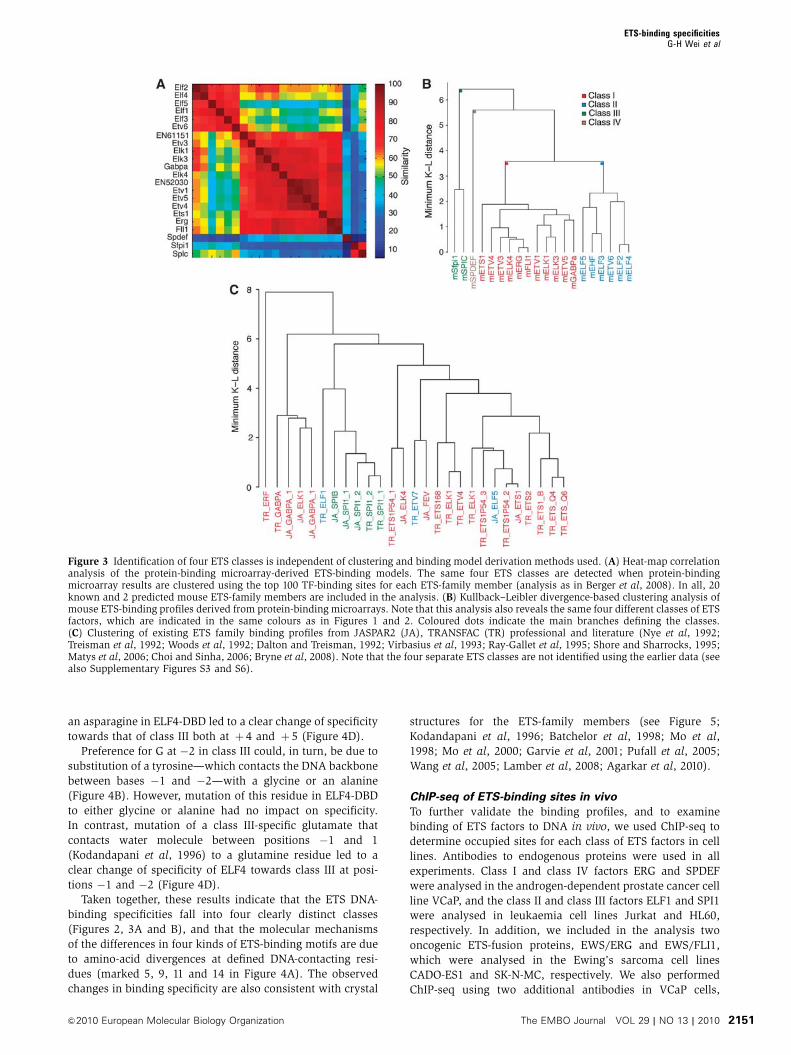
TF-binding profiles (Figure 2). The ETS-binding profiles fell
into four distinct classes (Figure 2), containing 15, 8, 3 and 1
member(s), respectively. These classes were robustly identi-
fied using results either only from the microwell-based meth-
od (Figure 2), from only the PBM method (Figure 3A and B)
or from the combination of the two (Supplementary Figure
S1A). The classes were named according to their respective
sizes, with class I being the largest group, containing the
cancer-associated ETS factors ERG, ETV1, ETV4 and FLI1.
Consistent with earlier results (Kielbasa et al, 2005), cluster-
ing analysis of ETS factors available from current databases
and literature did not yield a clear classification of sites
(Figure 3C; Supplementary Figure S3). However, the classes
we obtained do show a clear relationship to groupings based
on amino-acid features (see below and Discussion).
The main differences between our motifs are concentrated
on the core þ 4 position and 50 flanking base pairs. Although
the consensus sequences of the ETS factors are relatively
similar, many somewhat weaker sites are much more class
specific or exclude one or more classes of ETS DBDs
(Supplementary Figure S2). Only the difference between
other ETS-family members analysed and the lone class IV
factor SPDEF has been identified earlier (Oettgen et al, 2000).
ETS-binding specificitiesG-H Wei et al
The EMBO Journal VOL 29 | NO 13 | 2010 &2010 European Molecular Biology Organization2148
In general, the class definitions derived using hierarchical
clustering seemed to be largely sufficient to explain the
differences between the ETS-family members. However,
ETV6 and ETV7 appeared to have subtly different binding
specificity at þ 4 compared with the other members of class
II (Figure 1), and in this way resembled more the class III
factors. We therefore propose subclassification of class II into
class IIa containing the ELF-family factors, and class IIb
comprising ETV6 and ETV7.
Molecular basis of ETS-class specificity
To analyse the molecular basis of the differences in ETS-
binding specificities, we investigated the amino acid-DNA
contacts in published crystal structures of ETS1, GABPA,
ELK1, ELF3, SPI1 and SPDEF–DNA complexes
(Kodandapani et al, 1996; Batchelor et al, 1998; Mo et al,
1998, 2000; Garvie et al, 2001; Verger and Duterque-
Coquillaud, 2002; Pufall et al, 2005; Wang et al, 2005;
Lamber et al, 2008; Agarkar et al, 2010). The invariant GGA
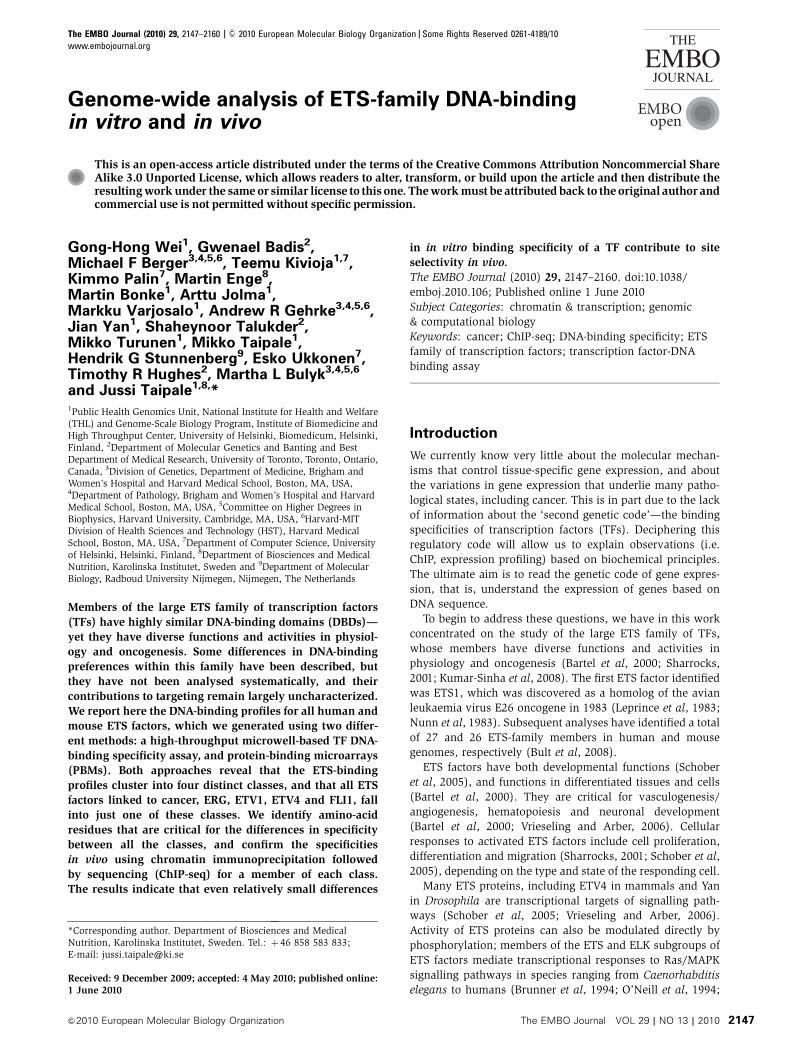
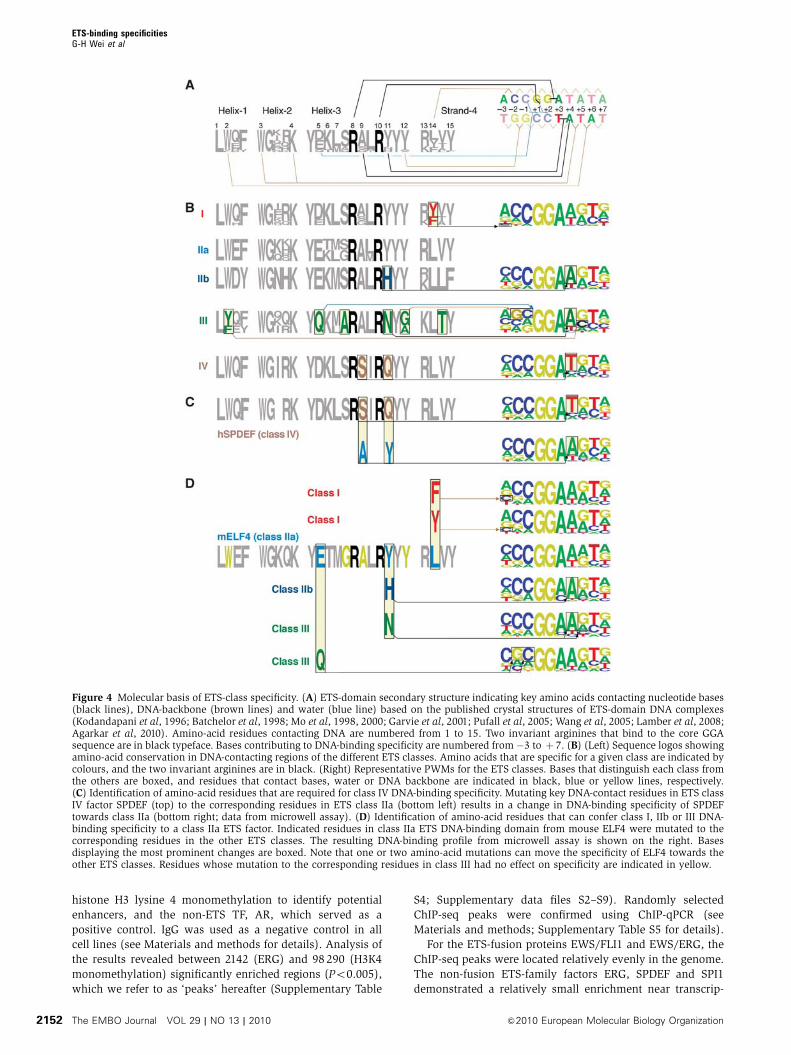
Figure 1 Structural organizations and binding specificities of mammalian ETS transcription factors. (Left) Schematic representation of thedomain structures of the respective full-length proteins. ETS domain is in blue, pointed domain is in green, Proline-rich domain is in grey, andthe Nuc_orp_HMR_rcpt and A/T hook domains are in dark yellow and black, respectively. HUGO gene names are from ENSEMBL and proteindomains are from Pfam. The second and third columns, respectively, show human and mouse ETS-binding profiles determined usingmicrowell-based transcription factor-DNA-binding assays. The right column shows mouse ETS-binding profiles determined using protein-binding microarrays. The logos are drawn using enoLOGOS (Workman et al, 2005), and the height of a letter at a particular position is directlyproportional to the effect of that nucleotide on the binding affinity. Coordinates for the bases are also indicated above each column (see alsoSupplementary Figures S1 and S9; Supplementary Tables S1, S2 and S6; Supplementary data file S1).
ETS-binding specificitiesG-H Wei et al
&2010 European Molecular Biology Organization The EMBO Journal VOL 29 | NO 13 | 2010 2149
core bases of the ETS-family profiles are consistent with the
absolute conservation of two key DNA-contacting arginines
in Helix3 (Figure 4A, black). Most of the differences in DNA-
binding specificity at particular bases, in turn, correlate with
corresponding changes in residues contacting DNA at or near
these bases (Figure 4B). The preference of the lone class IV
factor, SPDEF for T at þ 4 correlates with the presence of
serine and glutamine at DNA-contact residues 9 and 11,
respectively. Recent crystal structure analysis of SPDEF–
DNA complex suggested that combination of these residues
is responsible for the preference of T at þ 4 (Wang et al,
2005). We confirmed the importance of these two residues
by mutagenesis followed by microwell-based DNA-binding
specificity assay (Figure 4C).
Class I factors are characterized by low affinity to C in
the �3 position. This change correlates with a substitution of
a leucine that contacts DNA backbone at �2 and �3 with
a phenylalanine or tyrosine (Figure 4B, red). Mutation of
the leucine residue to either tyrosine or phenylalanine in
the context of the class II factor ELF4-DBD resulted in a
clear shift of specificity towards class I at �3 position,
confirming the importance of this amino acid for the differ-
ences in specificity between class I and the other classes
(Figure 4D).
Whereas Class IIa factors did not have major features that
differentiated them from all other classes, class IIb factors
displayed strong preference for A at þ 4. This change corre-
lated with a substitution of a key tyrosine by a histidine.
Mutation of this residue in ELF4-DBD increased binding to
sequences containing A at þ 4, confirming the importance of
this residue in class IIb specificity (Figure 4D).
Class III factors were characterized by preference of G and
C at �2 and �1, respectively, strong preference for A at þ 4,
and relatively strong binding of sites with a C at þ 5. Many
amino-acid residues within the DBD are specific for class III
(Figure 4B). As the tyrosine that affects specificity at þ 4 is
replaced in class III by an asparagine, we first investigated the
function of this amino-acid change. Mutating the tyrosine to
Figure 2 ETS-binding specificity. Clustering analysis of binding profiles of human (h) and mouse (m) ETS transcription factors (microwellmethod) and publicly available non-ETS-family transcription factor matrices from Jaspar2 (Bryne et al, 2008; http://jaspar.genereg.net). Thefour different classes of ETS factors are indicated by colour: class I, red; class II, blue; class III, green; class IV, brown. Coloured dots indicate themain branches defining the classes. ETS matrices indicated as ‘class’ are the representative matrices for the different ETS classes identifiedusing affinity propagation clustering (see Materials and methods for details). Representative logos, drawn using enoLOGOS (Workman et al,2005), are also shown. Bases displaying the most prominent changes are boxed (see also Supplementary Figures S2 and S6; Supplementarydata file S1).
ETS-binding specificitiesG-H Wei et al
The EMBO Journal VOL 29 | NO 13 | 2010 &2010 European Molecular Biology Organization2150
an asparagine in ELF4-DBD led to a clear change of specificity
towards that of class III both at þ 4 and þ 5 (Figure 4D).
Preference for G at �2 in class III could, in turn, be due to
substitution of a tyrosine—which contacts the DNA backbone
between bases �1 and �2—with a glycine or an alanine
(Figure 4B). However, mutation of this residue in ELF4-DBD
to either glycine or alanine had no impact on specificity.
In contrast, mutation of a class III-specific glutamate that
contacts water molecule between positions �1 and 1
(Kodandapani et al, 1996) to a glutamine residue led to a
clear change of specificity of ELF4 towards class III at posi-
tions �1 and �2 (Figure 4D).
Taken together, these results indicate that the ETS DNA-
binding specificities fall into four clearly distinct classes
(Figures 2, 3A and B), and that the molecular mechanisms
of the differences in four kinds of ETS-binding motifs are due
to amino-acid divergences at defined DNA-contacting resi-
dues (marked 5, 9, 11 and 14 in Figure 4A). The observed
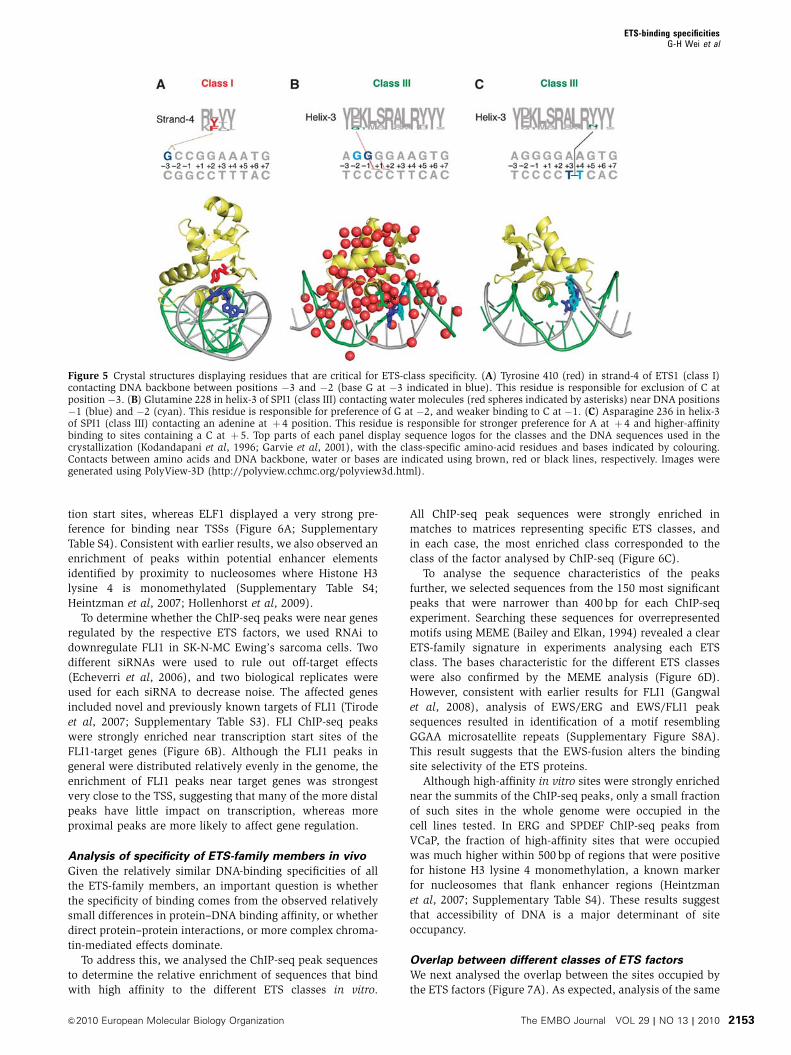
changes in binding specificity are also consistent with crystal
structures for the ETS-family members (see Figure 5;
Kodandapani et al, 1996; Batchelor et al, 1998; Mo et al,
1998; Mo et al, 2000; Garvie et al, 2001; Pufall et al, 2005;
Wang et al, 2005; Lamber et al, 2008; Agarkar et al, 2010).
ChIP-seq of ETS-binding sites in vivo
To further validate the binding profiles, and to examine
binding of ETS factors to DNA in vivo, we used ChIP-seq to
determine occupied sites for each class of ETS factors in cell
lines. Antibodies to endogenous proteins were used in all
experiments. Class I and class IV factors ERG and SPDEF
were analysed in the androgen-dependent prostate cancer cell
line VCaP, and the class II and class III factors ELF1 and SPI1
were analysed in leukaemia cell lines Jurkat and HL60,
respectively. In addition, we included in the analysis two
oncogenic ETS-fusion proteins, EWS/ERG and EWS/FLI1,
which were analysed in the Ewing’s sarcoma cell lines
CADO-ES1 and SK-N-MC, respectively. We also performed
ChIP-seq using two additional antibodies in VCaP cells,
Figure 3 Identification of four ETS classes is independent of clustering and binding model derivation methods used. (A) Heat-map correlationanalysis of the protein-binding microarray-derived ETS-binding models. The same four ETS classes are detected when protein-bindingmicroarray results are clustered using the top 100 TF-binding sites for each ETS-family member (analysis as in Berger et al, 2008). In all, 20known and 2 predicted mouse ETS-family members are included in the analysis. (B) Kullback–Leibler divergence-based clustering analysis ofmouse ETS-binding profiles derived from protein-binding microarrays. Note that this analysis also reveals the same four different classes of ETSfactors, which are indicated in the same colours as in Figures 1 and 2. Coloured dots indicate the main branches defining the classes.(C) Clustering of existing ETS family binding profiles from JASPAR2 (JA), TRANSFAC (TR) professional and literature (Nye et al, 1992;Treisman et al, 1992; Woods et al, 1992; Dalton and Treisman, 1992; Virbasius et al, 1993; Ray-Gallet et al, 1995; Shore and Sharrocks, 1995;Matys et al, 2006; Choi and Sinha, 2006; Bryne et al, 2008). Note that the four separate ETS classes are not identified using the earlier data (seealso Supplementary Figures S3 and S6).
ETS-binding specificitiesG-H Wei et al
&2010 European Molecular Biology Organization The EMBO Journal VOL 29 | NO 13 | 2010 2151
histone H3 lysine 4 monomethylation to identify potential
enhancers, and the non-ETS TF, AR, which served as a
positive control. IgG was used as a negative control in all
cell lines (see Materials and methods for details). Analysis of
the results revealed between 2142 (ERG) and 98 290 (H3K4
monomethylation) significantly enriched regions (Po0.005),
which we refer to as ‘peaks’ hereafter (Supplementary Table
S4; Supplementary data files S2–S9). Randomly selected
ChIP-seq peaks were confirmed using ChIP-qPCR (see
Materials and methods; Supplementary Table S5 for details).
For the ETS-fusion proteins EWS/FLI1 and EWS/ERG, the
ChIP-seq peaks were located relatively evenly in the genome.
The non-fusion ETS-family factors ERG, SPDEF and SPI1
demonstrated a relatively small enrichment near transcrip-
Figure 4 Molecular basis of ETS-class specificity. (A) ETS-domain secondary structure indicating key amino acids contacting nucleotide bases(black lines), DNA-backbone (brown lines) and water (blue line) based on the published crystal structures of ETS-domain DNA complexes(Kodandapani et al, 1996; Batchelor et al, 1998; Mo et al, 1998, 2000; Garvie et al, 2001; Pufall et al, 2005; Wang et al, 2005; Lamber et al, 2008;Agarkar et al, 2010). Amino-acid residues contacting DNA are numbered from 1 to 15. Two invariant arginines that bind to the core GGAsequence are in black typeface. Bases contributing to DNA-binding specificity are numbered from�3 to þ 7. (B) (Left) Sequence logos showingamino-acid conservation in DNA-contacting regions of the different ETS classes. Amino acids that are specific for a given class are indicated bycolours, and the two invariant arginines are in black. (Right) Representative PWMs for the ETS classes. Bases that distinguish each class fromthe others are boxed, and residues that contact bases, water or DNA backbone are indicated in black, blue or yellow lines, respectively.(C) Identification of amino-acid residues that are required for class IV DNA-binding specificity. Mutating key DNA-contact residues in ETS classIV factor SPDEF (top) to the corresponding residues in ETS class IIa (bottom left) results in a change in DNA-binding specificity of SPDEFtowards class IIa (bottom right; data from microwell assay). (D) Identification of amino-acid residues that can confer class I, IIb or III DNA-binding specificity to a class IIa ETS factor. Indicated residues in class IIa ETS DNA-binding domain from mouse ELF4 were mutated to thecorresponding residues in the other ETS classes. The resulting DNA-binding profile from microwell assay is shown on the right. Basesdisplaying the most prominent changes are boxed. Note that one or two amino-acid mutations can move the specificity of ELF4 towards theother ETS classes. Residues whose mutation to the corresponding residues in class III had no effect on specificity are indicated in yellow.
ETS-binding specificitiesG-H Wei et al
The EMBO Journal VOL 29 | NO 13 | 2010 &2010 European Molecular Biology Organization2152
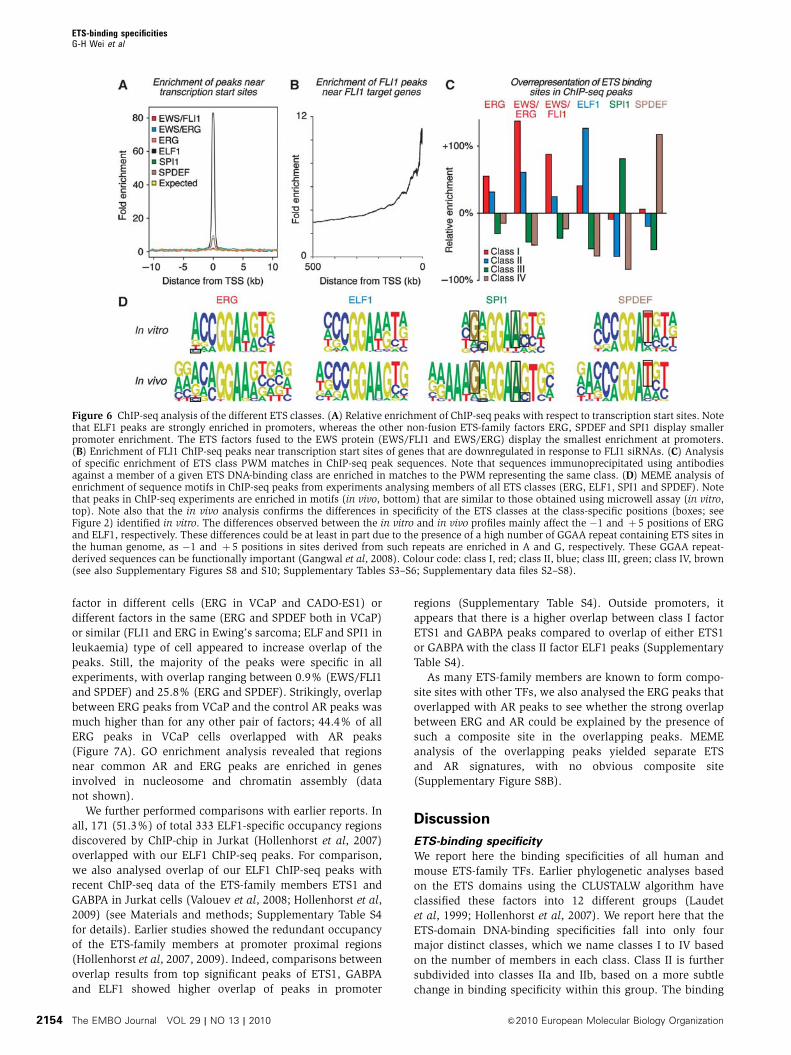
tion start sites, whereas ELF1 displayed a very strong pre-
ference for binding near TSSs (Figure 6A; Supplementary
Table S4). Consistent with earlier results, we also observed an
enrichment of peaks within potential enhancer elements
identified by proximity to nucleosomes where Histone H3
lysine 4 is monomethylated (Supplementary Table S4;
Heintzman et al, 2007; Hollenhorst et al, 2009).
To determine whether the ChIP-seq peaks were near genes
regulated by the respective ETS factors, we used RNAi to
downregulate FLI1 in SK-N-MC Ewing’s sarcoma cells. Two
different siRNAs were used to rule out off-target effects
(Echeverri et al, 2006), and two biological replicates were
used for each siRNA to decrease noise. The affected genes
included novel and previously known targets of FLI1 (Tirode
et al, 2007; Supplementary Table S3). FLI ChIP-seq peaks
were strongly enriched near transcription start sites of the
FLI1-target genes (Figure 6B). Although the FLI1 peaks in
general were distributed relatively evenly in the genome, the
enrichment of FLI1 peaks near target genes was strongest
very close to the TSS, suggesting that many of the more distal
peaks have little impact on transcription, whereas more
proximal peaks are more likely to affect gene regulation.
Analysis of specificity of ETS-family members in vivo
Given the relatively similar DNA-binding specificities of all
the ETS-family members, an important question is whether
the specificity of binding comes from the observed relatively
small differences in protein–DNA binding affinity, or whether
direct protein–protein interactions, or more complex chroma-
tin-mediated effects dominate.
To address this, we analysed the ChIP-seq peak sequences
to determine the relative enrichment of sequences that bind
with high affinity to the different ETS classes in vitro.
All ChIP-seq peak sequences were strongly enriched in
matches to matrices representing specific ETS classes, and
in each case, the most enriched class corresponded to the
class of the factor analysed by ChIP-seq (Figure 6C).
To analyse the sequence characteristics of the peaks
further, we selected sequences from the 150 most significant
peaks that were narrower than 400 bp for each ChIP-seq
experiment. Searching these sequences for overrepresented
motifs using MEME (Bailey and Elkan, 1994) revealed a clear
ETS-family signature in experiments analysing each ETS
class. The bases characteristic for the different ETS classes
were also confirmed by the MEME analysis (Figure 6D).
However, consistent with earlier results for FLI1 (Gangwal
et al, 2008), analysis of EWS/ERG and EWS/FLI1 peak
sequences resulted in identification of a motif resembling
GGAA microsatellite repeats (Supplementary Figure S8A).
This result suggests that the EWS-fusion alters the binding
site selectivity of the ETS proteins.
Although high-affinity in vitro sites were strongly enriched
near the summits of the ChIP-seq peaks, only a small fraction
of such sites in the whole genome were occupied in the
cell lines tested. In ERG and SPDEF ChIP-seq peaks from
VCaP, the fraction of high-affinity sites that were occupied
was much higher within 500 bp of regions that were positive
for histone H3 lysine 4 monomethylation, a known marker
for nucleosomes that flank enhancer regions (Heintzman
et al, 2007; Supplementary Table S4). These results suggest
that accessibility of DNA is a major determinant of site
occupancy.
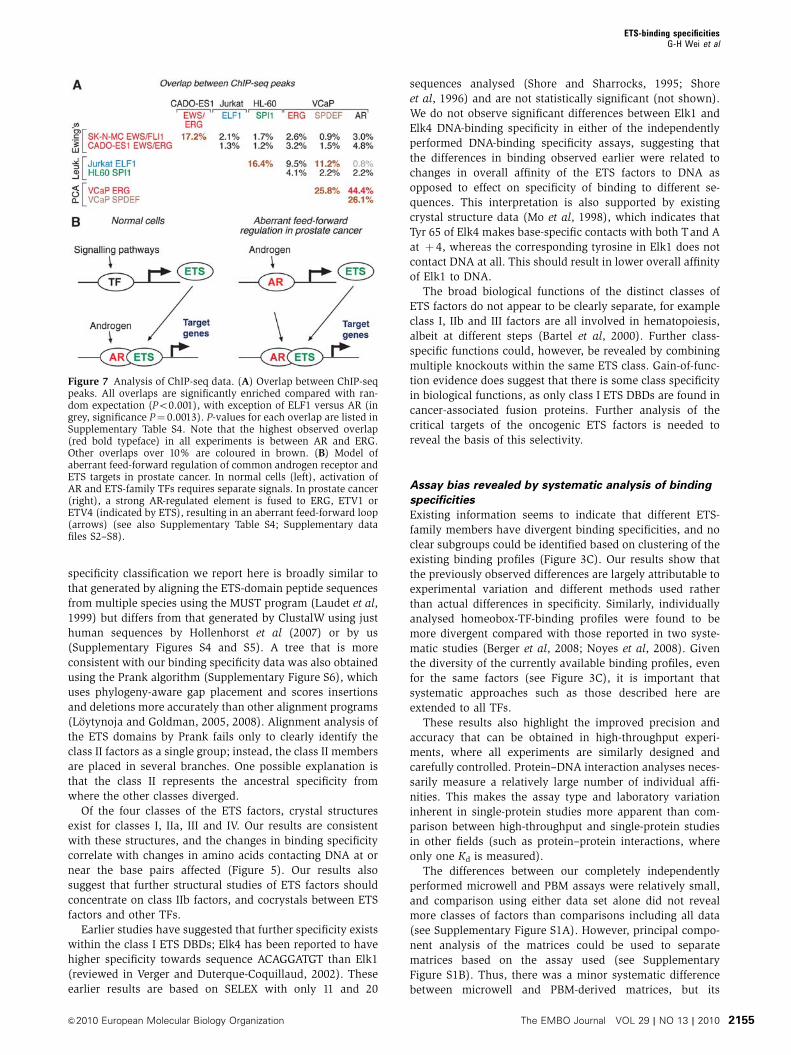
Overlap between different classes of ETS factors
We next analysed the overlap between the sites occupied by
the ETS factors (Figure 7A). As expected, analysis of the same
Figure 5 Crystal structures displaying residues that are critical for ETS-class specificity. (A) Tyrosine 410 (red) in strand-4 of ETS1 (class I)contacting DNA backbone between positions �3 and �2 (base G at �3 indicated in blue). This residue is responsible for exclusion of C atposition �3. (B) Glutamine 228 in helix-3 of SPI1 (class III) contacting water molecules (red spheres indicated by asterisks) near DNA positions�1 (blue) and �2 (cyan). This residue is responsible for preference of G at �2, and weaker binding to C at �1. (C) Asparagine 236 in helix-3of SPI1 (class III) contacting an adenine at þ 4 position. This residue is responsible for stronger preference for A at þ 4 and higher-affinitybinding to sites containing a C at þ 5. Top parts of each panel display sequence logos for the classes and the DNA sequences used in thecrystallization (Kodandapani et al, 1996; Garvie et al, 2001), with the class-specific amino-acid residues and bases indicated by colouring.Contacts between amino acids and DNA backbone, water or bases are indicated using brown, red or black lines, respectively. Images weregenerated using PolyView-3D (http://polyview.cchmc.org/polyview3d.html).
ETS-binding specificitiesG-H Wei et al
&2010 European Molecular Biology Organization The EMBO Journal VOL 29 | NO 13 | 2010 2153
factor in different cells (ERG in VCaP and CADO-ES1) or
different factors in the same (ERG and SPDEF both in VCaP)
or similar (FLI1 and ERG in Ewing’s sarcoma; ELF and SPI1 in
leukaemia) type of cell appeared to increase overlap of the
peaks. Still, the majority of the peaks were specific in all
experiments, with overlap ranging between 0.9% (EWS/FLI1
and SPDEF) and 25.8% (ERG and SPDEF). Strikingly, overlap
between ERG peaks from VCaP and the control AR peaks was
much higher than for any other pair of factors; 44.4% of all
ERG peaks in VCaP cells overlapped with AR peaks
(Figure 7A). GO enrichment analysis revealed that regions
near common AR and ERG peaks are enriched in genes
involved in nucleosome and chromatin assembly (data
not shown).
We further performed comparisons with earlier reports. In
all, 171 (51.3%) of total 333 ELF1-specific occupancy regions
discovered by ChIP-chip in Jurkat (Hollenhorst et al, 2007)
overlapped with our ELF1 ChIP-seq peaks. For comparison,
we also analysed overlap of our ELF1 ChIP-seq peaks with
recent ChIP-seq data of the ETS-family members ETS1 and
GABPA in Jurkat cells (Valouev et al, 2008; Hollenhorst et al,
2009) (see Materials and methods; Supplementary Table S4
for details). Earlier studies showed the redundant occupancy
of the ETS-family members at promoter proximal regions
(Hollenhorst et al, 2007, 2009). Indeed, comparisons between
overlap results from top significant peaks of ETS1, GABPA
and ELF1 showed higher overlap of peaks in promoter
regions (Supplementary Table S4). Outside promoters, it
appears that there is a higher overlap between class I factor
ETS1 and GABPA peaks compared to overlap of either ETS1
or GABPAwith the class II factor ELF1 peaks (Supplementary
Table S4).
As many ETS-family members are known to form compo-
site sites with other TFs, we also analysed the ERG peaks that
overlapped with AR peaks to see whether the strong overlap
between ERG and AR could be explained by the presence of
such a composite site in the overlapping peaks. MEME
analysis of the overlapping peaks yielded separate ETS
and AR signatures, with no obvious composite site
(Supplementary Figure S8B).
Discussion
ETS-binding specificity
We report here the binding specificities of all human and
mouse ETS-family TFs. Earlier phylogenetic analyses based
on the ETS domains using the CLUSTALW algorithm have
classified these factors into 12 different groups (Laudet
et al, 1999; Hollenhorst et al, 2007). We report here that the
ETS-domain DNA-binding specificities fall into only four
major distinct classes, which we name classes I to IV based
on the number of members in each class. Class II is further
subdivided into classes IIa and IIb, based on a more subtle
change in binding specificity within this group. The binding
Figure 6 ChIP-seq analysis of the different ETS classes. (A) Relative enrichment of ChIP-seq peaks with respect to transcription start sites. Notethat ELF1 peaks are strongly enriched in promoters, whereas the other non-fusion ETS-family factors ERG, SPDEF and SPI1 display smallerpromoter enrichment. The ETS factors fused to the EWS protein (EWS/FLI1 and EWS/ERG) display the smallest enrichment at promoters.(B) Enrichment of FLI1 ChIP-seq peaks near transcription start sites of genes that are downregulated in response to FLI1 siRNAs. (C) Analysisof specific enrichment of ETS class PWM matches in ChIP-seq peak sequences. Note that sequences immunoprecipitated using antibodiesagainst a member of a given ETS DNA-binding class are enriched in matches to the PWM representing the same class. (D) MEME analysis ofenrichment of sequence motifs in ChIP-seq peaks from experiments analysing members of all ETS classes (ERG, ELF1, SPI1 and SPDEF). Notethat peaks in ChIP-seq experiments are enriched in motifs (in vivo, bottom) that are similar to those obtained using microwell assay (in vitro,top). Note also that the in vivo analysis confirms the differences in specificity of the ETS classes at the class-specific positions (boxes; seeFigure 2) identified in vitro. The differences observed between the in vitro and in vivo profiles mainly affect the �1 and þ 5 positions of ERGand ELF1, respectively. These differences could be at least in part due to the presence of a high number of GGAA repeat containing ETS sites inthe human genome, as �1 and þ 5 positions in sites derived from such repeats are enriched in A and G, respectively. These GGAA repeat-derived sequences can be functionally important (Gangwal et al, 2008). Colour code: class I, red; class II, blue; class III, green; class IV, brown(see also Supplementary Figures S8 and S10; Supplementary Tables S3–S6; Supplementary data files S2–S8).
ETS-binding specificitiesG-H Wei et al
The EMBO Journal VOL 29 | NO 13 | 2010 &2010 European Molecular Biology Organization2154
specificity classification we report here is broadly similar to
that generated by aligning the ETS-domain peptide sequences
from multiple species using the MUST program (Laudet et al,
1999) but differs from that generated by ClustalW using just
human sequences by Hollenhorst et al (2007) or by us
(Supplementary Figures S4 and S5). A tree that is more
consistent with our binding specificity data was also obtained
using the Prank algorithm (Supplementary Figure S6), which
uses phylogeny-aware gap placement and scores insertions
and deletions more accurately than other alignment programs
(Loytynoja and Goldman, 2005, 2008). Alignment analysis of
the ETS domains by Prank fails only to clearly identify the
class II factors as a single group; instead, the class II members
are placed in several branches. One possible explanation is
that the class II represents the ancestral specificity from
where the other classes diverged.
Of the four classes of the ETS factors, crystal structures
exist for classes I, IIa, III and IV. Our results are consistent
with these structures, and the changes in binding specificity
correlate with changes in amino acids contacting DNA at or
near the base pairs affected (Figure 5). Our results also
suggest that further structural studies of ETS factors should
concentrate on class IIb factors, and cocrystals between ETS
factors and other TFs.
Earlier studies have suggested that further specificity exists
within the class I ETS DBDs; Elk4 has been reported to have
higher specificity towards sequence ACAGGATGT than Elk1
(reviewed in Verger and Duterque-Coquillaud, 2002). These
earlier results are based on SELEX with only 11 and 20
sequences analysed (Shore and Sharrocks, 1995; Shore
et al, 1996) and are not statistically significant (not shown).
We do not observe significant differences between Elk1 and
Elk4 DNA-binding specificity in either of the independently
performed DNA-binding specificity assays, suggesting that
the differences in binding observed earlier were related to
changes in overall affinity of the ETS factors to DNA as
opposed to effect on specificity of binding to different se-
quences. This interpretation is also supported by existing
crystal structure data (Mo et al, 1998), which indicates that
Tyr 65 of Elk4 makes base-specific contacts with both Tand A
at þ 4, whereas the corresponding tyrosine in Elk1 does not
contact DNA at all. This should result in lower overall affinity
of Elk1 to DNA.
The broad biological functions of the distinct classes of
ETS factors do not appear to be clearly separate, for example
class I, IIb and III factors are all involved in hematopoiesis,
albeit at different steps (Bartel et al, 2000). Further class-
specific functions could, however, be revealed by combining
multiple knockouts within the same ETS class. Gain-of-func-
tion evidence does suggest that there is some class specificity
in biological functions, as only class I ETS DBDs are found in
cancer-associated fusion proteins. Further analysis of the
critical targets of the oncogenic ETS factors is needed to
reveal the basis of this selectivity.
Assay bias revealed by systematic analysis of binding
specificities
Existing information seems to indicate that different ETS-
family members have divergent binding specificities, and no
clear subgroups could be identified based on clustering of the
existing binding profiles (Figure 3C). Our results show that
the previously observed differences are largely attributable to
experimental variation and different methods used rather
than actual differences in specificity. Similarly, individually
analysed homeobox-TF-binding profiles were found to be
more divergent compared with those reported in two syste-
matic studies (Berger et al, 2008; Noyes et al, 2008). Given
the diversity of the currently available binding profiles, even
for the same factors (see Figure 3C), it is important that
systematic approaches such as those described here are
extended to all TFs.
These results also highlight the improved precision and
accuracy that can be obtained in high-throughput experi-
ments, where all experiments are similarly designed and
carefully controlled. Protein–DNA interaction analyses neces-
sarily measure a relatively large number of individual affi-
nities. This makes the assay type and laboratory variation
inherent in single-protein studies more apparent than com-
parison between high-throughput and single-protein studies
in other fields (such as protein–protein interactions, where
only one Kd is measured).
The differences between our completely independently
performed microwell and PBM assays were relatively small,
and comparison using either data set alone did not reveal
more classes of factors than comparisons including all data
(see Supplementary Figure S1A). However, principal compo-
nent analysis of the matrices could be used to separate
matrices based on the assay used (see Supplementary
Figure S1B). Thus, there was a minor systematic difference
between microwell and PBM-derived matrices, but its
Figure 7 Analysis of ChIP-seq data. (A) Overlap between ChIP-seqpeaks. All overlaps are significantly enriched compared with ran-dom expectation (Po0.001), with exception of ELF1 versus AR (ingrey, significance P¼ 0.0013). P-values for each overlap are listed inSupplementary Table S4. Note that the highest observed overlap(red bold typeface) in all experiments is between AR and ERG.Other overlaps over 10% are coloured in brown. (B) Model ofaberrant feed-forward regulation of common androgen receptor andETS targets in prostate cancer. In normal cells (left), activation ofAR and ETS-family TFs requires separate signals. In prostate cancer(right), a strong AR-regulated element is fused to ERG, ETV1 orETV4 (indicated by ETS), resulting in an aberrant feed-forward loop(arrows) (see also Supplementary Table S4; Supplementary datafiles S2–S8).
ETS-binding specificitiesG-H Wei et al
&2010 European Molecular Biology Organization The EMBO Journal VOL 29 | NO 13 | 2010 2155
magnitude was so small that it is unlikely to affect
downstream analyses.
ChIP-seq analyses
The ChIP-seq experiments confirmed that the in vitro speci-
ficity analyses were relevant also for TF-binding in vivo
(Figure 6C and D). We found that high-affinity sites were
strongly enriched near the summits of the ChIP-seq peaks,
and that a substantial fraction of high-affinity sites within
accessible genomic regions were occupied (Supplementary
Table S4). In addition, comparison of ChIP-seq data to
expression profiling data revealed that only a small fraction
of FLI1 ChIP-seq peaks are located in close proximity to genes
that are strongly regulated by loss of FLI1. Whereas FLI1
peaks were located randomly with respect to transcription
start sites, enrichment of FLI1 peaks near FLI1-target genes
was clearly higher near the TSS (Figure 6B). It thus appears
that most occupied sites have little if any effect on gene
expression, and that proximity of the occupied site to a TSS is
important in determining whether an ETS binding event
affects transcription. However, it is well established that
long-range enhancers have pivotal functions in mammalian
gene regulation (Heintzman and Ren, 2009), and our results
do not mean that all distal sites are non-functional.
Although overlap was observed between the different ETS
classes, most of the peaks observed were specific for a given
factor, underscoring the specificity of the ETS-family mem-
bers. A notable exception was found in the VCaP prostate
cancer cell line. Activity of two classes of TFs, the AR, and the
class I ETS factors ERG, ETV1 and/or ETV4 are implicated in
prostate cancer. We found here that a very large fraction
(44.4%) of ERG occupied sites are close to sites occupied by
AR, and 30.4% of these sites are also bound by SPDEF (not
shown). These results suggest that the translocation/deletion
that places a strong androgen-responsive element from the
TMPRSS2 gene adjacent to the ERG-coding sequences will
result in aberrant feed-forward regulation of target genes
common to both AR and ERG (Figure 7B).
Basis of specificity of TFs
The human genome contains large number of TFs contribut-
ing to complex gene regulation, accurate developmental
patterning and growth control (Messina et al, 2004). Many
classes of TFs, including members of the ETS and HOX
families have relatively similar binding specificities (Berger
et al, 2008; Noyes et al, 2008). Despite similar specificities
and overlapping expression patterns (Galang et al, 2004;
Hollenhorst et al, 2004; Richardson et al, 2010;
Supplementary Figure S7), loss-of-function studies have re-
vealed that ETS-family TFs have very specific functions
during development (Bartel et al, 2000). An important ques-
tion is how such specificity is achieved despite relatively
similar DNA-binding specificity.
We provide here direct evidence that even the relatively
small differences in ETS-domain DNA-binding specificity
affect in vivo site occupancy. Although the consensus se-
quences of the ETS factors are very similar, many somewhat
weaker sites are much more class specific or exclude one or
more classes of ETS DBDs (Supplementary Figure S2). Such
selectivity is clearly evident also in our ChIP-seq analyses; we
found clear enrichment of class I ETS-binding sites over
binding sites of the other classes in regions immunoprecipi-
tated by the class I ETS-family members ERG and FLI1.
Similar enrichments were observed for all the other classes
as well (Figure 6C). These results indicate that the ETS-class
specificities reported here contribute to site selectivity of the
ETS-family TFs in vivo.
Whereas it is possible that more sensitive methods could,
in the future, be used to further subdivide ETS-domain DNA-
binding specificities, such differences would necessarily be
even smaller than those reported here. Thus, it appears that
DNA-binding specificity differences alone cannot explain the
full diversity of the ETS family, as there are 27 ETS TFs and
four major classes of DNA-binding specificity. One common
mechanism explaining how loss of similar proteins can cause
different phenotypes is that their expression patterns are
different. In mouse embryos, the ETS-family members show
distinct but partially overlapping expression patterns
(Supplementary Figure S7), suggesting that at least part of
the functional specialization within the classes can be ex-
plained by the divergent expression patterns (Richardson
et al, 2010). This hypothesis is also supported by knock-in
experiments that show that the class III ETS factor SPIB can
replace another class III factor SPI1 (SFPI1) in mouse myeloid
development (Dahl et al, 2002; DeKoter et al, 2002).
In contrast, the class I ETS factor ETS1 cannot rescue SFPI1 loss.
Another important mechanism to achieve specificity in-
volves cooperative binding of ETS factors with other TFs. The
protein-binding surfaces of ETS factors are different, and
different ETS factors associate with different other TFs to
bind distinct composite sites (Verger and Duterque-
Coquillaud, 2002). For example, the class I factors ETS1,
ELK1, ELK4 and FLI1 have different binding partners. ELK1
or ELK4 can bind DNA together with SRF (Dalton and
Treisman, 1992; Cooper et al, 2007; Boros et al, 2009), FLI1
associates with SMAD3 (Ravasi et al, 2010) and ETS1 can
bind to composite sites with PAX5 (Garvie et al, 2001) and
RUNX1 (Hollenhorst et al, 2007, 2009). In the cases analysed,
the composite sites are distinct from ETS consensus se-
quences either at the flanking regions, or even at the core
region. ETS1 and PAX5 interact to recognize an element
containing a modified ETS core sequence GGAG instead of
the consensus GGA(A/T) (Fitzsimmons et al, 1996, 2001;
Garvie et al, 2001).
Formation of the composite sites can affect also in vivo
binding specificity, and this has been demonstrated in the
case of ETS1/RUNX1 (Hollenhorst et al, 2009). Although such
cooperative interactions could potentially explain the differ-
ences we observe in in vivo binding for the members of the
different ETS classes, we did not find obvious motifs corres-
ponding to other TFs in our MEME analysis of the ETS
factors ERG, EWS/ERG, EWS/FLI1, ELF1, SPI1 and SPDEF.
This suggests that these factors partner with multiple TFs in
such a way that any given composite site is present in
relatively small numbers—and thus cannot be detected by
the algorithm used. Improvement of methods to systemati-
cally map such interactions between ETS-family members
and other TFs is needed to fully understand in vivo specificity
differences within each ETS class.
Taken together, in this work, we systematically analysed
the ETS family of TF DNA-binding specificities for two species
(human and mouse) with a single high-throughput assay
(microwell based). The DNA-binding specificities of ETS-
family TFs in the mouse genome were determined by two
ETS-binding specificitiesG-H Wei et al
The EMBO Journal VOL 29 | NO 13 | 2010 &2010 European Molecular Biology Organization2156
independent methods (microwell based and PBM). Both sets
of in vitro data are consistent and reveal four clear subclasses
of ETS DNA-binding preferences. We further dissected mole-
cular basis for the specificity in DNA recognition by systema-
tic site-directed mutagenesis of key amino acids in the ETS
DBDs. Through ChIP-seq mapping of ETS-binding sites in
different cell models, we found that the preferences observed
for ETS DNA-binding in vitro can contribute to site selectivity
in vivo on a genome-wide scale.
Materials and methods
Cell cultureSK-N-MC cells were grown in EMEM, Jurkat, HL60, CADO-ES1 inRPMI1640, and COS1, 293T and VCaP in DMEM. All media weresupplemented with penicillin/streptomycin and fetal bovine serum(10%).
CloningSequences coding for the human and mouse ETS domains with10–25 amino acids of flanking sequence (with exception of ETSdomains in N- or C-terminal regions) were cloned into pMAGIC1(Li and Elledge, 2005) or directly to pGEN expression vector (Taipaleet al, 2002) from Megaman cDNA library (Stratagene) and frommouse-pooled cDNAs (mouse 12.5 days embryonic and fetal braincDNA library; a kind gift from Professor Tomi Makela, University ofHelsinki). The inserts in pMAGIC1 were transferred to pMAGIC-DEST vector containing C-terminal Renilla luciferase. All the humanETS full-length cDNAs were cloned into Gateway pDONR221 vector.For expression analyses, the clones were transferred into modifiedpDEST40 (Invitrogen) vectors containing C-terminal triple V5 orRenilla luciferase tags.
Validation of high-throughput dataValidation of high-throughput data was performed as follows:TF-binding assays were performed using two different methods intwo different laboratories. The ChIP analyses were validated usingsingle ChIP-qPCR with different antibodies for 11–42 randomlyselected peaks (Supplementary Table S5). In expression analysis,two different siRNAs for each factor were used to rule out off-targeteffects (Echeverri et al, 2006), and two biological replicates wereused to decrease noise. Thirty-five randomly selected up- ordownregulated genes were validated using qPCR (SupplementaryTable S5).
Analysis of TF-binding specificityMicrowell-based TF DNA-binding assay was performed as described(Hallikas and Taipale, 2006). The method is based on competitionbetween binding sites, and measures relative sequence-specificDNA-binding affinity of a TF. Briefly, TF-Renilla luciferase fusionproteins expressed in COS1 or 293T cells were incubated withcompetitor oligonucleotides indicated in the presence of abiotinylated oligonucleotide containing the ETS consensus-bindingsequence (Forward: ACGCTAACCGGATATAACGCTA; Reverse: TAGCGTTATATCCGGTTAGCGT) (Nye et al, 1992; Woods et al, 1992;Hallikas et al, 2006). A scrambled oligonucleotide (Forward: ACGCTAAACAGTGTCAACGCTA; Reverse: TAGCGTTGACACTGTTTAGCGT)was used to control for non-sequence-specific DNA-binding affinity.Bound TF-Renilla luciferase activity was measured usinga luminometer (BMG Fluostar Optima) and normalized to yieldTF-binding positional weight matrix as described in Hallikas andTaipale (2006). DBDs were used to determine binding profiles, asinitial experiments indicated that significant differences were notobserved between profiles obtained using full-length proteins orDBDs for GABPa or ETS1 (Supplementary Figure S9A). Biotinylatedoligonucleotides with GGAT core sequence were used as thisallowed efficient assay in all classes of ETS factors. Controlexperiments indicated that use of GGAT core instead of GGAA didnot markedly affect results (Supplementary Figure S9B). Microwell-based assay was performed using 3–6 replicate measurements foreach competing DNA sequence (see Supplementary Table S6) for allfactors. Replicate measurements were compared with each otherusing the novel algorithm described below. Results shown represent
averages from all replicates that were within minimum Kullback–Leibler divergence of 0.5 (see below).
Independent analysis of the mouse ETS family was carried outusing PBMs, which analyse binding of TFs to double-stranded DNAmicroarrays synthesized with all possible 10 bp DNA sequences(Berger et al, 2006). The ETS TF proteins were purified fromEscherichia coli or from in vitro translation reactions. Bindingreactions were performed with 39–100nM (see SupplementaryTable S1) of protein using PBM array design #015681 essentially asdescribed in Berger et al (2006).
Divergence of motifsComparison of binding profiles was performed using a novelalgorithm that determines the similarity between TF motifs usingthe minimum Kullback–Leibler divergence between all translationsand reverse complementations of the multinomial distributionsdefined by the motifs. Conceptually, the TF-motif divergencemeasures the information gained about the DNA sequence byknowledge of having binding sites for both of the two factors. TheTF-motif divergence is defined as the minimum Kullback–Leiblerdivergence between all translations and reverse complementationsof the multinomial distributions defined by the two TF motifs. Thelonger motif is inserted to a sequence with background distributionand the shorter motif is slid over the background/longer motifsequence. The KL divergence is computed between the multinomialdistributions defined by (1) the shorter motif and (2) the part of thebackground/longer motif sequence overlapping the shorter motif.The same is repeated with the background/long motif sequencereverse complemented and the minimum of the KL divergences istaken. The TF-motif divergence is symmetric but does not fulfill thetriangle inequality and thus is not a metric in the mathematicalsense. The TF motifs are clustered with hierarchical average linkageclustering (Mahony and Benos, 2007) based on the TF-motifdivergences. The TF-motif divergence bears similarity to earliercomparison strategies (Roepcke et al, 2005; Mahony and Benos,2007) in the use of KL divergence but as far as we know, taking theminimum is a novel feature.
Four matrices representative of the different ETS classes wereselected using affinity propagation clustering (Frey and Dueck,2007). This method does not derive an average, but identifies thematrix that is most representative of each group (these were used asthe class matrices in Figure 2). The exemplar preferences wereuniform on all motifs and the common preference was selected toprovide pre-chosen number of clusters.
Chromatin immunoprecipitation and sequencingChIP analysis of VCaP, Jurkat, HL60, SK-N-MC and CADO-ES1 wasperformed as described earlier (Metivier et al, 2003) with minormodifications described in Robertson et al (2007). For details andantibodies used, please see Supplementary data.
A detailed description of ChIP-seq DNA library preparation andcomplexity estimation (Supplementary Table S4), peak calling(Audic and Claverie, 1997; Li et al, 2008; Nix et al, 2008; Laajalaet al, 2009; Pepke et al, 2009), motif analysis by MEME (Bailey andElkan, 1994) (Figure 6D; Supplementary Figures S8 and S11), motifenrichment in peaks and peak overlap analysis is included in theSupplementary data. Peak positions (NCBI36 coordinates) are inSupplementary data files S2–S9, and sequencing reads are publiclyavailable at NCBI Sequence Read Archive under accession no.SRA014231.
siRNA treatment and expression profilingFor siRNA knockdown of EWS/FLI1 in SK-N-MC, the individual setof four siRNAs (Qiagen) against each gene were tested forknockdown efficiency by qRT–PCR, and two most effective singlesiRNA were used for further experiments (SI00387716 andSI00387730, Qiagen). The selected FLI1 siRNAs, or non-targetingcontrol siRNA (Ctrl-control_1, SI03650325, Qiagen) were trans-fected into cells using HiPerFect Transfection Reagent (Cat. 301704,Qiagen). The final siRNA concentration was 10nM. After 24 h, asecond identical transfection was performed, and cells wereharvested 48h later for RNA isolation.
Before expression profiling, the efficiency of downregulation ofthe target gene and a set of known target genes were validated usingreal-time PCR (Supplementary Figure S10 and not shown).Expression profiling was performed using Affymetrix humangenome U133plus2.0 arrays. A detailed description of array data
ETS-binding specificitiesG-H Wei et al
&2010 European Molecular Biology Organization The EMBO Journal VOL 29 | NO 13 | 2010 2157
analysis (Smyth, 2004; Wu et al, 2004; Falcon and Gentleman, 2007)is provided in the Supplementary data.
Quantitative real-time PCRFor ChIP experiments, enrichments of immunoprecipitated DNAwere analysed by Roche LightCycler and Power SYBR Green MasterMix (Applied Biosystems). Relative enrichment of target DNAfragments was determined by calculating the immunoprecipitationefficiency above fragment-specific background (IgG control) fol-lowed by normalization to the occupancy level observed in controlregions (see Supplementary Table S6 for primers and controlregions used).
For expression analysis of RNAi knockdown efficiency, total RNAwas reverse transcribed to cDNA using the High Capacity cDNA RTKit (ABI), using 500ng total RNA in a 20-ml reaction. The reactionswere diluted 10-fold, and gene expression levels were determinedfrom 1 to 3ml of the reactions using qPCR as described above. Eachgene was analysed at least in triplicate and normalized againstendogenous b-actin control.
Supplementary dataSupplementary data are available at The EMBO Journal Online(http://www.embojournal.org).
Acknowledgements
We thank Ritva Nurmi and Sini Miettinen for technical assistance,and EMBL gene core, Uppsala SNP platform and Dr Outi Monni formassively parallel sequencing. This work was supported by the EUFP6 STREP project REGULATORY GENOMICS, Sigrid JuseliusFoundation, Finnish Cancer Organizations, Biocentrum Helsinki,Academy of Finland Center of Excellence in Translational Genome-Scale Biology, and the NEURO program of the Academy of Finland.MFB and MLB were supported by grant R01 HG003985 from NIH/NHGRI to MLB.
Conflict of interest
The authors declare that they have no conflict of interest.
References
Agarkar VB, Babayeva ND, Wilder PJ, Rizzino A, Tahirov TH (2010)Crystal structure of mouse Elf3 C-terminal DNA-binding domainin complex with type II TGF-beta receptor promoter DNA. J MolBiol 397: 278–289
Audic S, Claverie JM (1997) The significance of digital geneexpression profiles. Genome Res 7: 986–995
Bailey TL, Elkan C (1994) Fitting a mixture model by expectationmaximization to discover motifs in biopolymers. Proc Int ConfIntell Syst Mol Biol 2: 28–36
Bartel FO, Higuchi T, Spyropoulos DD (2000) Mouse models in thestudy of the Ets family of transcription factors. Oncogene 19:6443–6454
Batchelor AH, Piper DE, de la Brousse FC, McKnight SL, Wolberger C(1998) The structure of GABPalpha/beta: an ETS domain-ankyrinrepeat heterodimer bound to DNA. Science 279: 1037–1041
Beitel GJ, Tuck S, Greenwald I, Horvitz HR (1995) TheCaenorhabditis elegans gene lin-1 encodes an ETS-domain pro-tein and defines a branch of the vulval induction pathway. GenesDev 9: 3149–3162
Berger MF, Badis G, Gehrke AR, Talukder S, Philippakis AA, Pena-Castillo L, Alleyne TM, Mnaimneh S, Botvinnik OB, Chan ET,Khalid F, Zhang W, Newburger D, Jaeger SA, Morris QD, BulykML, Hughes TR (2008) Variation in homeodomain DNA bindingrevealed by high-resolution analysis of sequence preferences.Cell 133: 1266–1276
Berger MF, Philippakis AA, Qureshi AM, He FS, Estep III PW, BulykML (2006) Compact, universal DNA microarrays to comprehen-sively determine transcription-factor binding site specificities.Nat Biotechnol 24: 1429–1435
Boros J, Donaldson IJ, O’Donnell A, Odrowaz ZA, Zeef L, Lupien M,Meyer CA, Liu XS, Brown M, Sharrocks AD (2009) Elucidation ofthe ELK1 target gene network reveals a role in the coordinateregulation of core components of the gene regulation machinery.Genome Res 19: 1963–1973
Brunner D, Ducker K, Oellers N, Hafen E, Scholz H, Klambt C(1994) The ETS domain protein pointed-P2 is a target of MAPkinase in the sevenless signal transduction pathway. Nature 370:386–389
Bryne JC, Valen E, Tang MH, Marstrand T, Winther O, da Piedade I,Krogh A, Lenhard B, Sandelin A (2008) JASPAR, the open accessdatabase of transcription factor-binding profiles: new content andtools in the 2008 update. Nucleic Acids Res 36: D102–D106
Bult CJ, Eppig JT, Kadin JA, Richardson JE, Blake JA, MouseGenome Database Group (2008) The Mouse Genome Database(MGD): mouse biology and model systems. Nucleic Acids Res 36:D724–D728
Choi YS, Sinha S (2006) Determination of the consensus DNA-binding sequence and a transcriptional activation domain forESE-2. Biochem J 398: 497–507
Cooper SJ, Trinklein ND, Nguyen L, Myers RM (2007) Serumresponse factor binding sites differ in three human cell types.Genome Res 17: 136–144
Dahl R, Ramirez-Bergeron DL, Rao S, Simon MC (2002) Spi-B canfunctionally replace PU.1 in myeloid but not lymphoid develop-ment. EMBO J 21: 2220–2230
Dalton S, Treisman R (1992) Characterization of SAP-1, a proteinrecruited by serum response factor to the c-fos serum responseelement. Cell 68: 597–612
DeKoter RP, Lee HJ, Singh H (2002) PU.1 regulates expression of theinterleukin-7 receptor in lymphoid progenitors. Immunity 16:297–309
Delattre O, Zucman J, Plougastel B, Desmaze C, Melot T, Peter M,Kovar H, Joubert I, de Jong P, Rouleau G (1992) Gene fusion withan ETS DNA-binding domain caused by chromosome transloca-tion in human tumours. Nature 359: 162–165
Echeverri CJ, Beachy PA, Baum B, Boutros M, Buchholz F, ChandaSK, Downward J, Ellenberg J, Fraser AG, Hacohen N, Hahn WC,Jackson AL, Kiger A, Linsley PS, Lum L, Ma Y, Mathey-Prevot B,Root DE, Sabatini DM, Taipale J et al (2006) Minimizing therisk of reporting false positives in large-scale RNAi screens.Nat Methods 3: 777–779
Falcon S, Gentleman R (2007) Using GOstats to test gene lists for GOterm association. Bioinformatics 23: 257–258
Fitzsimmons D, Hodsdon W, Wheat W, Maira SM, Wasylyk B,Hagman J (1996) Pax-5 (BSAP) recruits Ets proto-oncogenefamily proteins to form functional ternary complexes on a B-cell-specific promoter. Genes Dev 10: 2198–2211
Fitzsimmons D, Lutz R, Wheat W, Chamberlin HM, Hagman J(2001) Highly conserved amino acids in Pax and Ets proteinsare required for DNA binding and ternary complex assembly.Nucleic Acids Res 29: 4154–4165
Frey BJ, Dueck D (2007) Clustering by passing messages betweendata points. Science 315: 972–976
Galang CK, Muller WJ, Foos G, Oshima RG, Hauser CA (2004)Changes in the expression of many Ets family transcriptionfactors and of potential target genes in normal mammary tissueand tumors. J Biol Chem 279: 11281–11292
Gangwal K, Sankar S, Hollenhorst PC, Kinsey M, Haroldsen SC,Shah AA, Boucher KM, Watkins WS, Jorde LB, Graves BJ,Lessnick SL (2008) Microsatellites as EWS/FLI response elementsin Ewing’s sarcoma. Proc Natl Acad Sci USA 105: 10149–10154
Garvie CW, Hagman J, Wolberger C (2001) Structural studies ofEts-1/Pax5 complex formation on DNA. Mol Cell 8: 1267–1276
Golub TR, Barker GF, Bohlander SK, Hiebert SW, Ward DC, Bray-Ward P, Morgan E, Raimondi SC, Rowley JD, Gilliland DG (1995)Fusion of the TEL gene on 12p13 to the AML1 gene on 21q22 in acutelymphoblastic leukemia. Proc Natl Acad Sci USA 92: 4917–4921
Hallikas O, Palin K, Sinjushina N, Rautiainen R, Partanen J,Ukkonen E, Taipale J (2006) Genome-wide prediction of mam-malian enhancers based on analysis of transcription-factor bind-ing affinity. Cell 124: 47–59
Hallikas O, Taipale J (2006) High-throughput assay for determiningspecificity and affinity of protein-DNA binding interactions.Nat Protoc 1: 215–222
ETS-binding specificitiesG-H Wei et al
The EMBO Journal VOL 29 | NO 13 | 2010 &2010 European Molecular Biology Organization2158
Heintzman ND, Ren B (2009) Finding distal regulatory elementsin the human genome. Curr Opin Genet Dev 19: 541–549
Heintzman ND, Stuart RK, Hon G, Fu Y, Ching CW, Hawkins RD,Barrera LO, Van Calcar S, Qu C, Ching KA, Wang W, Weng Z,Green RD, Crawford GE, Ren B (2007) Distinct and predictivechromatin signatures of transcriptional promoters and enhancersin the human genome. Nat Genet 39: 311–318
Hollenhorst PC, Chandler KJ, Poulsen RL, Johnson WE, Speck NA,Graves BJ (2009) DNA specificity determinants associate withdistinct transcription factor functions. PLoS Genet 5: e1000778
Hollenhorst PC, Jones DA, Graves BJ (2004) Expression profilesframe the promoter specificity dilemma of the ETS family oftranscription factors. Nucleic Acids Res 32: 5693–5702
Hollenhorst PC, Shah AA, Hopkins C, Graves BJ (2007) Genome-wide analyses reveal properties of redundant and specific pro-moter occupancy within the ETS gene family. Genes Dev 21:1882–1894
Karim FD, Urness LD, Thummel CS, Klemsz MJ, McKercher SR,Celada A, Van Beveren C, Maki RA, Gunther CV, Nye JA (1990)The ETS-domain: a new DNA-binding motif that recognizesa purine-rich core DNA sequence. Genes Dev 4: 1451–1453
Kielbasa SM, Gonze D, Herzel H (2005) Measuring similaritiesbetween transcription factor binding sites. BMC Bioinformatics6: 237
Kodandapani R, Pio F, Ni CZ, Piccialli G, Klemsz M, McKercher S,Maki RA, Ely KR (1996) A new pattern for helix-turn-helixrecognition revealed by the PU.1 ETS-domain-DNA complex.Nature 380: 456–460
Kumar-Sinha C, Tomlins SA, Chinnaiyan AM (2008) Recurrent genefusions in prostate cancer. Nat Rev Cancer 8: 497–511
Laajala TD, Raghav S, Tuomela S, Lahesmaa R, Aittokallio T, Elo LL(2009) A practical comparison of methods for detecting transcrip-tion factor binding sites in ChIP-seq experiments. BMC Genomics10: 618
Lamber EP, Vanhille L, Textor LC, Kachalova GS, Sieweke MH,Wilmanns M (2008) Regulation of the transcription factor Ets-1by DNA-mediated homo-dimerization. EMBO J 27: 2006–2017
Laudet V, Hanni C, Stehelin D, Duterque-Coquillaud M (1999)Molecular phylogeny of the ETS gene family. Oncogene 18:1351–1359
Leprince D, Gegonne A, Coll J, de Taisne C, Schneeberger A,Lagrou C, Stehelin D (1983) A putative second cell-derivedoncogene of the avian leukaemia retrovirus E26. Nature 306:395–397
Li H, Ruan J, Durbin R (2008) Mapping short DNA sequencing readsand calling variants using mapping quality scores. Genome Res18: 1851–1858
Li MZ, Elledge SJ (2005) MAGIC, an in vivo genetic method for therapid construction of recombinant DNA molecules. Nat Genet 37:311–319
Loytynoja A, Goldman N (2005) An algorithm for progressivemultiple alignment of sequences with insertions. Proc Natl AcadSci USA 102: 10557–10562
Loytynoja A, Goldman N (2008) Phylogeny-aware gap placementprevents errors in sequence alignment and evolutionary analysis.Science 320: 1632–1635
Mahony S, Benos PV (2007) STAMP: a web tool for exploring DNA-binding motif similarities. Nucleic Acids Res 35: W253–W258
Matys V, Kel-Margoulis OV, Fricke E, Liebich I, Land S, Barre-DirrieA, Reuter I, Chekmenev D, Krull M, Hornischer K, Voss N,Stegmaier P, Lewicki-Potapov B, Saxel H, Kel AE, Wingender E(2006) TRANSFAC and its module TRANSCompel: transcriptionalgene regulation in eukaryotes. Nucleic Acids Res 34: D108–D110
Mavrothalassitis G, Ghysdael J (2000) Proteins of the ETS familywith transcriptional repressor activity. Oncogene 19: 6524–6532
Messina DN, Glasscock J, Gish W, Lovett M (2004) An ORFeome-based analysis of human transcription factor genes and theconstruction of a microarray to interrogate their expression.Genome Res 14: 2041–2047
Metivier R, Penot G, Hubner MR, Reid G, Brand H, Kos M, Gannon F(2003) Estrogen receptor-alpha directs ordered, cyclical, andcombinatorial recruitment of cofactors on a natural target pro-moter. Cell 115: 751–763
Mo Y, Vaessen B, Johnston K, Marmorstein R (1998) Structures ofSAP-1 bound to DNA targets from the E74 and c-fos promoters:insights into DNA sequence discrimination by Ets proteins. MolCell 2: 201–212
Mo Y, Vaessen B, Johnston K, Marmorstein R (2000) Structure of theelk-1-DNA complex reveals how DNA-distal residues affect ETSdomain recognition of DNA. Nat Struct Biol 7: 292–297
Nix DA, Courdy SJ, Boucher KM (2008) Empirical methods forcontrolling false positives and estimating confidence in ChIP-Seqpeaks. BMC Bioinformatics 9: 523
Noyes MB, Christensen RG, Wakabayashi A, Stormo GD, BrodskyMH, Wolfe SA (2008) Analysis of homeodomain specificitiesallows the family-wide prediction of preferred recognition sites.Cell 133: 1277–1289
Nunn MF, Seeburg PH, Moscovici C, Duesberg PH (1983) Tripartitestructure of the avian erythroblastosis virus E26 transforminggene. Nature 306: 391–395
Nye JA, Petersen JM, Gunther CV, Jonsen MD, Graves BJ (1992)Interaction of murine ets-1 with GGA-binding sites establishes theETS domain as a new DNA-binding motif. Genes Dev 6: 975–990
Oettgen P, Finger E, Sun Z, Akbarali Y, Thamrongsak U, Boltax J,Grall F, Dube A, Weiss A, Brown L, Quinn G, Kas K, Endress G,Kunsch C, Libermann TA (2000) PDEF, a novel prostate epithe-lium-specific ets transcription factor, interacts with the androgenreceptor and activates prostate-specific antigen gene expression.J Biol Chem 275: 1216–1225
O’Neill EM, Rebay I, Tjian R, Rubin GM (1994) The activities of twoEts-related transcription factors required for Drosophila eye develop-ment are modulated by the Ras/MAPK pathway. Cell 78: 137–147
Pepke S, Wold B, Mortazavi A (2009) Computation for ChIP-seq andRNA-seq studies. Nat Methods 6: S22–S32
Pufall MA, Lee GM, Nelson ML, Kang HS, Velyvis A, Kay LE,McIntosh LP, Graves BJ (2005) Variable control of Ets-1 DNAbinding by multiple phosphates in an unstructured region.Science 309: 142–145
Ravasi T, Suzuki H, Cannistraci CV, Katayama S, Bajic VB, Tan K,Akalin A, Schmeier S, Kanamori-Katayama M, Bertin N, CarninciP, Daub CO, Forrest AR, Gough J, Grimmond S, Han JH,Hashimoto T, Hide W, Hofmann O, Kawaji H et al (2010) Anatlas of combinatorial transcriptional regulation in mouse andman. Cell 140: 744–752
Ray-Gallet D, Mao C, Tavitian A, Moreau-Gachelin F (1995) DNAbinding specificities of Spi-1/PU.1 and Spi-B transcription factorsand identification of a Spi-1/Spi-B binding site in the c-fes/c-fpspromoter. Oncogene 11: 303–313
Richardson L, Venkataraman S, Stevenson P, Yang Y, Burton N, RaoJ, Fisher M, Baldock RA, Davidson DR, Christiansen JH (2010)EMAGE mouse embryo spatial gene expression database: 2010update. Nucleic Acids Res 38: D703–D709
Robertson G, Hirst M, Bainbridge M, Bilenky M, Zhao Y, Zeng T,Euskirchen G, Bernier B, Varhol R, Delaney A, Thiessen N,Griffith OL, He A, Marra M, Snyder M, Jones S (2007) Genome-wide profiles of STAT1 DNA association using chromatin immu-noprecipitation and massively parallel sequencing. Nat Methods4: 651–657
Roepcke S, Grossmann S, Rahmann S, Vingron M (2005) T-RegComparator: an analysis tool for the comparison of positionweight matrices. Nucleic Acids Res 33: W438–W441
Schober M, Rebay I, Perrimon N (2005) Function of the ETS transcrip-tion factor Yan in border cell migration.Development 132: 3493–3504
Sharrocks AD (2001) The ETS-domain transcription factor family.Nat Rev Mol Cell Biol 2: 827–837
Shore P, Sharrocks AD (1995) The ETS-domain transcription factorsElk-1 and SAP-1 exhibit differential DNA binding specificities.Nucleic Acids Res 23: 4698–4706
Shore P, Whitmarsh AJ, Bhaskaran R, Davis RJ, Waltho JP,Sharrocks AD (1996) Determinants of DNA-binding specificityof ETS-domain transcription factors. Mol Cell Biol 16: 3338–3349
Smyth GK (2004) Linear models and empirical bayes methods forassessing differential expression in microarray experiments. StatAppl Genet Mol Biol 3: Article3
Sorensen PH, Lessnick SL, Lopez-Terrada D, Liu XF, Triche TJ,Denny CT (1994) A second Ewing’s sarcoma translocation,t(21;22), fuses the EWS gene to another ETS-family transcriptionfactor, ERG. Nat Genet 6: 146–151
Taipale J, Cooper MK, Maiti T, Beachy PA (2002) Patched actscatalytically to suppress the activity of Smoothened. Nature418: 892–897
Tirode F, Laud-Duval K, Prieur A, Delorme B, Charbord P, Delattre O(2007) Mesenchymal stem cell features of Ewing tumors. CancerCell 11: 421–429
ETS-binding specificitiesG-H Wei et al
&2010 European Molecular Biology Organization The EMBO Journal VOL 29 | NO 13 | 2010 2159
Tomlins SA, Laxman B, Dhanasekaran SM, Helgeson BE, Cao X,Morris DS, Menon A, Jing X, Cao Q, Han B, Yu J, Wang L, MontieJE, Rubin MA, Pienta KJ, Roulston D, Shah RB, Varambally S,Mehra R, Chinnaiyan AM (2007) Distinct classes of chromosomalrearrangements create oncogenic ETS gene fusions in prostatecancer. Nature 448: 595–599
Tomlins SA, Rhodes DR, Perner S, Dhanasekaran SM, Mehra R, SunXW, Varambally S, Cao X, Tchinda J, Kuefer R, Lee C, Montie JE,Shah RB, Pienta KJ, Rubin MA, Chinnaiyan AM (2005) Recurrentfusion of TMPRSS2 and ETS transcription factor genes in prostatecancer. Science 310: 644–648
Treisman R, Marais R, Wynne J (1992) Spatial flexibility in ternarycomplexes between SRF and its accessory proteins. EMBO J 11:4631–4640
Valouev A, Johnson DS, Sundquist A, Medina C, Anton E,Batzoglou S, Myers RM, Sidow A (2008) Genome-wide analysisof transcription factor binding sites based on ChIP-Seq data. NatMethods 5: 829–834
Verger A, Duterque-Coquillaud M (2002) When Ets transcriptionfactors meet their partners. Bioessays 24: 362–370
Virbasius JV, Virbasius CA, Scarpulla RC (1993) Identity of GABPwith NRF-2, a multisubunit avtivator of cytochrome oxidaseexpression, reveals a cellular role for an ETS domain activatorof viral promoters. Genes Dev 7: 380–392
Vrieseling E, Arber S (2006) Target-induced transcriptional controlof dendritic patterning and connectivity in motor neurons by theETS gene Pea3. Cell 127: 1439–1452
Wang Y, Feng L, Said M, Balderman S, Fayazi Z, Liu Y, Ghosh D,Gulick AM (2005) Analysis of the 2.0 A crystal structure of theprotein-DNA complex of the human PDEF Ets domain bound tothe prostate specific antigen regulatory site. Biochemistry 44:7095–7106
Wasylyk C, Bradford AP, Gutierrez-Hartmann A, Wasylyk B (1997)Conserved mechanisms of Ras regulation of evolutionaryrelated transcription factors, Ets1 and Pointed P2. Oncogene 14:899–913
Woods DB, Ghysdael J, Owen MJ (1992) Identification of nucleotidepreferences in DNA sequences recognised specifically by c-Ets-1protein. Nucleic Acids Res 20: 699–704
Workman CT, Yin Y, Corcoran DL, Ideker T, Stormo GD,Benos PV (2005) enoLOGOS: a versatile web tool forenergy normalized sequence logos. Nucleic Acids Res 33:W389–W392
Wu Z, Irizarry RA, Gentleman R, Martinez-Murillo F, Spencer F(2004) A model-based background adjustment for oligonucleo-tide expression arrays. J Am Stat Assoc 99: 909–917
The EMBO Journal is published by NaturePublishing Group on behalf of European
Molecular Biology Organization. This work is licensedunder a Creative Commons Attribution-Noncommercial-ShareAlike 3.0Unported License. [http://creativecommons.org/licenses/by-nc-sa/3.0/]
ETS-binding specificitiesG-H Wei et al
The EMBO Journal VOL 29 | NO 13 | 2010 &2010 European Molecular Biology Organization2160