Enrichment of statistical power for genome-wide association studies
10
METHODOLOGY ARTICLE Open Access Enrichment of statistical power for genome-wide association studies Meng Li 1,2 , Xiaolei Liu 2 , Peter Bradbury 3 , Jianming Yu 4 , Yuan-Ming Zhang 5* , Rory J Todhunter 6 , Edward S Buckler 2,3 and Zhiwu Zhang 2,7,8* Abstract Background: The inheritance of most human diseases and agriculturally important traits is controlled by many genes with small effects. Identifying these genes, while simultaneously controlling false positives, is challenging. Among available statistical methods, the mixed linear model (MLM) has been the most flexible and powerful for controlling population structure and individual unequal relatedness (kinship), the two common causes of spurious associations. The introduction of the compressed MLM (CMLM) method provided additional opportunities for optimization by adding two new model parameters: grouping algorithms and number of groups. Results: This study introduces another model parameter to develop an enriched CMLM (ECMLM). The parameter involves algorithms to define kinship between groups (that is, kinship algorithms). The ECMLM calculates kinship using several different algorithms and then chooses the best combination between kinship algorithms and grouping algorithms. Conclusion: Simulations show that the ECMLM increases statistical power. In some cases, the magnitude of power gained by using ECMLM instead of CMLM is larger than the improvement found by using CMLM instead of MLM. Keywords: Genome wide association study, population structure, kinship, mixed model, cluster analysis Background Genome-wide association studies (GWAS) are widely used in human genetics research to identify genes asso- ciated with complex diseases and in agricultural research to identify genes associated with quantitative traits such as yield and productivity [1,2]. The extremely dense gen- etic markers derived from new genotyping technology, such as genotyping by sequencing, have provided the potential for discovering genes underlying phenotypic diversity through GWAS [3-5]. Several new methods have been proposed for GWAS such as the multi-locus mixed-model approach [6] and the candidate gene ap- proach [7]. However, automatically including cofactors, as proposed by these new methods, is challenging when the number of predictors is large compared to the number of observations. The model space is usually too large to explore exhaustively, and the maximum number of polymorphisms fitted at a time must be less than the number of individuals [6]. These issues are particularly problematic in recent GWAS because the number of polymorphisms can reach millions, but the number of phenotyped and genotyped individuals is rarely more than hundreds of thousands. For candidate gene studies, pre-requisite knowledge is ne- cessary, for example, the location of the candidate genes. In this case, single-locus approaches are a necessary step before further analyses using the multi-locus or candidate gene approaches. Thus, the single-locus approach is still the mainstream method in GWAS. However, advances in genotyping technology have allowed extremely dense genetic marker mapping and the associated computing time has become a major con- cern for genetic researches. Simultaneously, using large numbers of markers has also increased concerns about false positives [8-11] and the potential for misleading re- sults in follow-up re-sequencing studies. * Correspondence: [email protected]; [email protected] 5 State Key Laboratory of Crop Genetics and Germplasm Enhancement/ National Center for Soybean Improvement, College of Agriculture, Nanjing Agricultural University, Nanjing 210095, China 2 Institute for Genomic Diversity, Cornell University, Ithaca, New York 14853, USA Full list of author information is available at the end of the article © 2014 Li et al.; licensee BioMed Central Ltd. This is an Open Access article distributed under the terms of the Creative Commons Attribution License (http://creativecommons.org/licenses/by/4.0), which permits unrestricted use, distribution, and reproduction in any medium, provided the original work is properly cited. The Creative Commons Public Domain Dedication waiver (http://creativecommons.org/publicdomain/zero/1.0/) applies to the data made available in this article, unless otherwise stated. Li et al. BMC Biology 2014, 12:73 http://www.biomedcentral.com/1741-7007/12/73
-
Upload
independent -
Category
Documents
-
view
2 -
download
0
Transcript of Enrichment of statistical power for genome-wide association studies

Li et al. BMC Biology 2014, 12:73http://www.biomedcentral.com/1741-7007/12/73
METHODOLOGY ARTICLE Open Access
Enrichment of statistical power for genome-wideassociation studiesMeng Li1,2, Xiaolei Liu2, Peter Bradbury3, Jianming Yu4, Yuan-Ming Zhang5*, Rory J Todhunter6,Edward S Buckler2,3 and Zhiwu Zhang2,7,8*
Abstract
Background: The inheritance of most human diseases and agriculturally important traits is controlled by manygenes with small effects. Identifying these genes, while simultaneously controlling false positives, is challenging.Among available statistical methods, the mixed linear model (MLM) has been the most flexible and powerful forcontrolling population structure and individual unequal relatedness (kinship), the two common causes of spuriousassociations. The introduction of the compressed MLM (CMLM) method provided additional opportunities foroptimization by adding two new model parameters: grouping algorithms and number of groups.
Results: This study introduces another model parameter to develop an enriched CMLM (ECMLM). The parameterinvolves algorithms to define kinship between groups (that is, kinship algorithms). The ECMLM calculates kinshipusing several different algorithms and then chooses the best combination between kinship algorithms andgrouping algorithms.
Conclusion: Simulations show that the ECMLM increases statistical power. In some cases, the magnitude of powergained by using ECMLM instead of CMLM is larger than the improvement found by using CMLM instead of MLM.
Keywords: Genome wide association study, population structure, kinship, mixed model, cluster analysis
BackgroundGenome-wide association studies (GWAS) are widelyused in human genetics research to identify genes asso-ciated with complex diseases and in agricultural researchto identify genes associated with quantitative traits suchas yield and productivity [1,2]. The extremely dense gen-etic markers derived from new genotyping technology,such as genotyping by sequencing, have provided thepotential for discovering genes underlying phenotypicdiversity through GWAS [3-5]. Several new methodshave been proposed for GWAS such as the multi-locusmixed-model approach [6] and the candidate gene ap-proach [7]. However, automatically including cofactors,as proposed by these new methods, is challenging whenthe number of predictors is large compared to the
* Correspondence: [email protected]; [email protected] Key Laboratory of Crop Genetics and Germplasm Enhancement/National Center for Soybean Improvement, College of Agriculture, NanjingAgricultural University, Nanjing 210095, China2Institute for Genomic Diversity, Cornell University, Ithaca, New York 14853,USAFull list of author information is available at the end of the article
© 2014 Li et al.; licensee BioMed Central Ltd. TCommons Attribution License (http://creativecreproduction in any medium, provided the orwaiver (http://creativecommons.org/publicdomstated.
number of observations. The model space is usually toolarge to explore exhaustively, and the maximum numberof polymorphisms fitted at a time must be less than thenumber of individuals [6].These issues are particularly problematic in recent
GWAS because the number of polymorphisms can reachmillions, but the number of phenotyped and genotypedindividuals is rarely more than hundreds of thousands.For candidate gene studies, pre-requisite knowledge is ne-cessary, for example, the location of the candidate genes.In this case, single-locus approaches are a necessary stepbefore further analyses using the multi-locus or candidategene approaches. Thus, the single-locus approach is stillthe mainstream method in GWAS.However, advances in genotyping technology have
allowed extremely dense genetic marker mapping andthe associated computing time has become a major con-cern for genetic researches. Simultaneously, using largenumbers of markers has also increased concerns aboutfalse positives [8-11] and the potential for misleading re-sults in follow-up re-sequencing studies.
his is an Open Access article distributed under the terms of the Creativeommons.org/licenses/by/4.0), which permits unrestricted use, distribution, andiginal work is properly cited. The Creative Commons Public Domain Dedicationain/zero/1.0/) applies to the data made available in this article, unless otherwise

Li et al. BMC Biology 2014, 12:73 Page 2 of 10http://www.biomedcentral.com/1741-7007/12/73
False positives are easy to control, but only at the ex-pense of true positive discovery or statistical power. Forexample, a stringent association test threshold is an effect-ive way to control the false positive rate, but the numbersof true positives are reduced at the same time. A desirablesolution is to reduce false positives without compromisingstatistical power. This solution is critical because theinheritance of most human diseases and agriculturally im-portant traits is controlled by many genes, which individu-ally have small effects or rare alleles [12,13].A number of statistical methods have been developed to
eliminate spurious association between phenotypes andtesting markers and to increase statistical power in GWAS.One of the causes of spurious association is populationstructure or stratification. In this case, the population canbe partitioned into subpopulations. Then, association testscan be performed within the subpopulations or by usingan estimate of population membership as a covariate in alinear or logistic model [14]. A similar method employs aprincipal components analysis of the genotype matrix. Thefirst few principal components may reflect broad patternsof similarity across individuals [15-17].Spurious association can also be caused by differences in
relatedness between pairs of individuals. This effect can bereduced using a general linear model (GLM) to estimatethe proportion of genes identical by descent between anypair of individuals and excluding closely related individuals[18,19]. Alternatively, population structure and unequalrelatedness can be simultaneously accounted for in amixed linear model (MLM). Subpopulation memberships(Q matrix) or principal components (PC) of the markergenotypes are treated as fixed effects and kinship is usedto define the variance and covariance structure of randomindividual effects [20]. This MLM method outperformsother methods with respect to statistical power. An im-proved approach, called the compressed MLM (CMLM),has been proposed to cluster individuals into groups byusing clustering algorithms such as the un-weighted pairgroup method with arithmetic mean (UPGMA). The kin-ship among groups is calculated simply as the average ofkinship among individuals. By optimizing grouping (thenumber of groups and clustering method used for group-ing), CMLM improves statistical power for GWAS [21].This study introduces another parameter for model
optimization: defining the relationship among groups inthe CMLM. Statistical power is examined through simu-lations. The results showed that statistical power is fur-ther improved through this enriched compressed MLM(ECMLM) method.
ResultsModel setupWith Henderson’s notation [22], a CMLM for GWAScan be written in as follows:
y¼Xβþ Zuþ e ð1Þwhere y is a vector of a phenotype; β represents un-known fixed effects, including population structure andmarker effects; u is a vector of size s (the number ofgroups) for unknown random polygenic effects followinga distribution with mean of zero and covariance matrixof G¼2Kσ2a; and K is the group kinship matrix withelement kij(i, j = 1, 2,.... s) representing the relationshipbetween group i and j, and σ2a is an unknown geneticvariance. X and Z are the incidence matrices for β andu, respectively, and e is a vector of random residual ef-fects that are normally distributed with zero mean andcovariance R¼Iσ2e , where I is the identity matrix and σ2eis the unknown residual variance.The likelihood of equation (1) can be expressed as:
L y β;u; σ2a; σ2e ; g; s;ϕ
�� �� ð2Þ
where g is a clustering algorithm; s is the number ofgroups; and ϕ is the operation used to calculate groupkinship kij from individual kinship ~kht
� �. ϕ is the new
parameter added in this study. The general formula forthe derivation of pair-wise kinship coefficients is asfollows:
kij ¼ ϕh∈ i; t∈ j
~kht� � ð3Þ
where the operation ϕ was defined as the average algo-rithm in the previous study [21]. Here we extended theoperation to a series of algorithms, including average,median, and maximum. This extension created anotherdimension of parameter space in the MLM (Figure 1).We expected the extended parameter space would leadto a better model fit and result in higher statistical powerfor GWAS.
Effect of group kinship algorithms in model fitWe examined model fit using three group kinship algo-rithms (average, median, and maximum) in four species(human, dog, maize, and Arabidopsis) where the UPGMAalgorithm is used to cluster individuals into groups. Themodel fit was reflected by twice negative log likelihood(−2LL). Here, we define the compression level as the aver-age individual number in each group. Different compres-sion levels (up to 16 individuals per group on average)were applied. Variations of model fit due to each groupkinship algorithm were observed for all species and atsome compression levels between 1 and 16 (Figure 2).The average algorithm performed best only for the dogdataset. The maximum algorithm performed best for allother datasets. This finding suggested that optimizationon group kinship algorithms is necessary for choosing thebest algorithm for a specific dataset.

Figure 1 Parameter space for association study. The firstdimension (in black) applies to both a general linear model andmixed linear model (MLM). The other dimensions apply to MLMonly. The population structure (Structure) is fitted as a fixed effectwith effect estimated as the best linear unbiased estimates (BLUE).The second dimension introduces individuals as random effects withvariance defined by a kinship matrix. The best linear unbiasedprediction (BLUP) for random effects can be solved directly withknown variance components. The third dimension estimates unknownvariance components using algorithms such as the residual maximumlikelihood algorithm. The fourth dimension clusters individuals intogroups (compression) by using cluster algorithms. The fifth dimensiondetermines the best number of groups or average number ofindividuals per group (defined as compression level). The current studydeveloped a sixth dimension that determines the best algorithm todefine group kinship, for example, average, median, or maximum. Thetwo dimensions in red belong to the standard MLM based on theindividuals. The remaining dimensions (in blue) belong to thecompressed MLM based on groups.
Li et al. BMC Biology 2014, 12:73 Page 3 of 10http://www.biomedcentral.com/1741-7007/12/73
Optimization on the extended parameter spaceThe joint use of group kinship and individual grouping en-larged the parameter space for the CMLM. We examinedthree group kinship algorithms (average, median, and max-imum) and eight hierarchical clustering algorithms. Theeight clustering algorithms were: UPGMA; un-weightedpair-group centroid (UPGMC); complete linkage (COM);Lance-Williams flexible-beta method (FLE); McQuitty’ssimilarity analysis, which is also called weighted pair-groupmethod using arithmetic averages (WPGMA); weightedpair-group method using centroid (WPGMC); single link-age (SIN), which is also called nearest neighbor; andWard’s method (WAR). Each combination was examinedin the four species (human, dog, maize, and Arabidopsis).Variation of model fit was observed at different com-
pression levels (Figure 3). We found at least one com-bination with better model fit than the combination ofUPGMA and the average group kinship algorithm usedin the standard CMLM.We previously examined 107 traits from Arabidopsis
using the TASSEL software package [23]. We found threeArabidopsis traits for which the CMLM method failed toprovide an advantage, based on model fit by using the
average group kinship and the UPGMA clustering algo-rithm. The details are provided in Additional file 1. Thethree traits were aphid offspring number, visual chlorospresent at 16°C, and vegetative growth rate after vernal-ization. When the parameter space was expanded by thecombinations of clustering methods and group kinship cal-culations, compression improved the fit for all three traits(Additional file 1: Figure S1). Therefore, extension of theparameter space improved the performance of CMLM.
Computing timeECMLM effectively increases the potential to balancestatistical power and computing speed. When the goalwas to have statistical power equivalent to standard MLM,enriched compression resulted in much higher compres-sion levels. Because computing time is a cubic function ofthe compression level, enriched compression greatly re-duced computing time (Additional file 1: Table S1). Forthe human dataset, the number of groups was reducedfrom 166 to 33 (a five-fold reduction). The observed com-puting time was reduced from 8.89 seconds to 0.73 sec-onds (a 12-fold decrease).When conducting GWAS, we first optimized the model
without markers using population parameter previouslydetermined (P3D) to find the best compression level, kin-ship, and cluster algorithms. This process took 80 minutes(InterCore2 Duo CPU E7500, 2.93GHz, Memory 1.99G) toperform ECMLM using Arabidopsis data containing 199lines and 5000 SNPs. The CMLM took 3.5 minutes to fin-ish this step, but used only one combination between kin-ship algorithm and clustering algorithm. Compared to theCMLM, the ECMLM method requires additional time tooptimize population parameters, depending on the numberof algorithm combinations tested. However, ECMLM findsthe optimal combination of compression level, kinship, andcluster algorithms, resulting in higher statistical power anda better model fit. The optimized parameter values canthen be used for SNP association testing, which is the mosttime-consuming step in GWAS.
Statistical power and false positive control of associationstudyThe statistical power of a method corresponds to modelfit. We compared the statistical power of the ECMLMmethod with three other methods: GLM, MLM, andCMLM. The ECMLM was performed using the best of24 combinations between the three group kinship algo-rithms and the eight clustering algorithms that cluster in-dividuals into groups across all compression levels. TheCMLM reported previously used the average group kin-ship and the UPGMA clustering algorithm to cluster indi-viduals into groups across all compression levels. MLMand GLM used the minimum and the maximum compres-sion levels, respectively. Each individual was treated as a

A B
C D
Figure 2 Model fit of three different group kinship algorithms. The model fit (vertical axis) is indicated by twice the negative likelihood (thesmaller, the better). The grouping was performed with the un-weighted pair group method with arithmetic mean clustering algorithm at differentcompression levels (horizontal axis), defined as the average number of individuals per group. The phenotypes are (A) body mass index in human,(B) Orthopedic Foundation for Animals score in dog, and flowering time in both (C) maize and (D) Arabidopsis.
Li et al. BMC Biology 2014, 12:73 Page 4 of 10http://www.biomedcentral.com/1741-7007/12/73
single group in the MLM. All individuals were clusteredas one group (merged into the overall mean) in the GLM.In these two cases, both the clustering algorithm and thegroup kinship algorithm would have no effect.The statistical power was estimated empirically by
adding quantitative trait nucleotides (QTNs) to an ob-served phenotype, then calculating the proportion ofdetected QTNs. The threshold was determined from thedistribution of P-values on the observed phenotype beforethe QTN effect was added. The observed phenotypes arebody mass index in human, Orthopedic Foundation forAnimals (OFA) score in dog, and flowering time in bothmaize and Arabidopsis. Statistical power improvementswith the ECMLM method were observed compared toother methods (Figure 4). Improvements of up to 6.4%,13.3%, 2.9%, and 2.6% were observed when the ECMLMwas compared to the CMLM in human, dog, maize, andArabidopsis, respectively (Additional file 1: Table S2).Based on the human dataset, the improvement in statisticalpower from CMLM to ECMLM was larger than the im-provements from GLM to MLM or from MLM to CMLM.Statistical power under the same false discovery rate
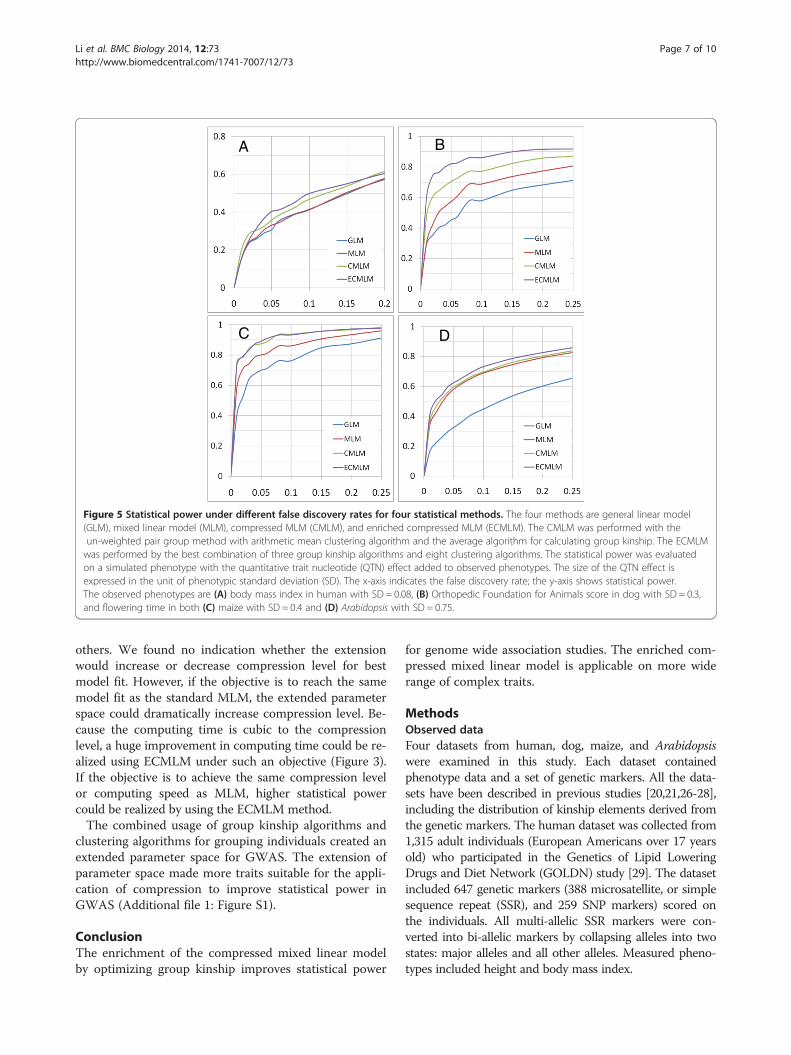
(FDR) was also examined for these four methods. Thesize of the QTN effect is expressed in the unit of
phenotypic standard deviation (SD). The observed phe-notypes are body mass index in human with SD = 0.08,OFA score in dog with SD = 0.3, and flowering time inboth maize with SD = 0.4 and Arabidopsis with SD =0.75 (Figure 5). We examined the power under differentFDR levels. At the same FDR levels, the ECMLMmethod performed better than the other three methodsin all datasets, especially in the dog data. So, theECMLM can control the FDR while improving statis-tical power.Comparison of statistical power for the four models
(GLM, MLM, CMLM, and ECMLM) using differentnumbers of PCs was also investigated (Additional file 1:Figure S2). The comparison used from one to five PCsto control the population structure. The ECMLM wasperformed using the best combination of the three groupkinship algorithms and eight clustering algorithms. Thestatistical power was evaluated on a simulated phenotypewith the QTN effect added to observed phenotypes. Thesize of the QTN effect is expressed in the unit of pheno-typic standard deviation. The observed phenotype is theflowering time of Arabidopsis at 10°C. We found that dif-ferent PCs have little effect on statistical power in MLM,CMLM, and ECMLM.
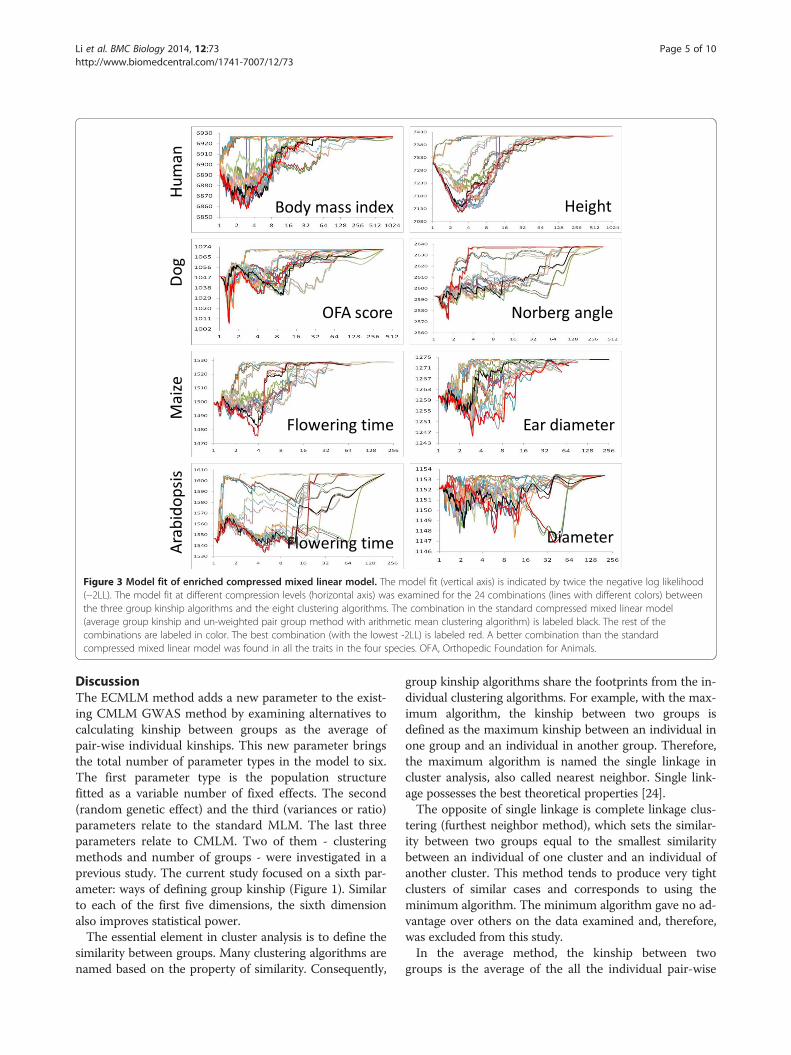
Figure 3 Model fit of enriched compressed mixed linear model. The model fit (vertical axis) is indicated by twice the negative log likelihood(−2LL). The model fit at different compression levels (horizontal axis) was examined for the 24 combinations (lines with different colors) betweenthe three group kinship algorithms and the eight clustering algorithms. The combination in the standard compressed mixed linear model(average group kinship and un-weighted pair group method with arithmetic mean clustering algorithm) is labeled black. The rest of thecombinations are labeled in color. The best combination (with the lowest -2LL) is labeled red. A better combination than the standardcompressed mixed linear model was found in all the traits in the four species. OFA, Orthopedic Foundation for Animals.
Li et al. BMC Biology 2014, 12:73 Page 5 of 10http://www.biomedcentral.com/1741-7007/12/73
DiscussionThe ECMLM method adds a new parameter to the exist-ing CMLM GWAS method by examining alternatives tocalculating kinship between groups as the average ofpair-wise individual kinships. This new parameter bringsthe total number of parameter types in the model to six.The first parameter type is the population structurefitted as a variable number of fixed effects. The second(random genetic effect) and the third (variances or ratio)parameters relate to the standard MLM. The last threeparameters relate to CMLM. Two of them - clusteringmethods and number of groups - were investigated in aprevious study. The current study focused on a sixth par-ameter: ways of defining group kinship (Figure 1). Similarto each of the first five dimensions, the sixth dimensionalso improves statistical power.The essential element in cluster analysis is to define the
similarity between groups. Many clustering algorithms arenamed based on the property of similarity. Consequently,
group kinship algorithms share the footprints from the in-dividual clustering algorithms. For example, with the max-imum algorithm, the kinship between two groups isdefined as the maximum kinship between an individual inone group and an individual in another group. Therefore,the maximum algorithm is named the single linkage incluster analysis, also called nearest neighbor. Single link-age possesses the best theoretical properties [24].The opposite of single linkage is complete linkage clus-
tering (furthest neighbor method), which sets the similar-ity between two groups equal to the smallest similaritybetween an individual of one cluster and an individual ofanother cluster. This method tends to produce very tightclusters of similar cases and corresponds to using theminimum algorithm. The minimum algorithm gave no ad-vantage over others on the data examined and, therefore,was excluded from this study.In the average method, the kinship between two
groups is the average of the all the individual pair-wise

Figure 4 Statistical power of four statistical methods. The four methods are general linear model (GLM), mixed linear model (MLM),compressed MLM (CMLM), and enriched compressed MLM (ECMLM). The CMLM was performed with the un-weighted pair group method witharithmetic mean clustering algorithm and the average algorithm for calculating group kinship. The ECMLM was performed by the best combinationof three group kinship algorithms and eight clustering algorithms. The statistical power was evaluated on a simulated phenotype with the quantitativetrait nucleotide (QTN) effect added to observed phenotypes. The size of the QTN effect is expressed in the unit of phenotypic standard deviation. Thecorresponding proportions of total phenotypic variance explained are displayed in the parentheses. The observed phenotypes are (A) body mass indexin human, (B) Orthopedic Foundation for Animals score in dog, and flowering time in both (C) maize and (D) Arabidopsis.
Li et al. BMC Biology 2014, 12:73 Page 6 of 10http://www.biomedcentral.com/1741-7007/12/73
kinships between the groups. The average method usedin the CMLM corresponds to the average linkage incluster analysis [25]. Average linkage is also known asthe UPGMA.The median method in the CMLM does not corres-
pond to any typical clustering method. Instead of usingthe median, the centroid is commonly used for clusteranalysis. Among the three group kinship algorithms weinvestigated, the median algorithm never performed thebest for any trait from the four species. The other twoalgorithms (average and maximum) switched back andforth, competing for the best in conjunction with clus-tering algorithms to group individuals.Future studies that test other clustering algorithms are
needed. We only examined eight (UPGMA, UPGMC,COM, FLE, WPGMA, WPGMC, SIN, and WAR) of manyalgorithms that cluster individuals into groups. For ex-ample, we did not test any non-hierarchical clustering al-gorithms (for example, K-means); all clustering algorithmsused in this study are hierarchical clustering algorithms.We found a huge variation in model fit among the vari-
ous combinations of the three group kinship algorithms
and the eight clustering algorithms. In general, theoptimum combinations were trait- and species-specific(Figure 3). Optimization is necessary for each specificdataset.The improvement in model fit by introducing a sixth
parameter is accompanied by improvement in statisticalpower for GWAS. Some improvements are large. Theimprovement in statistical power achieved by usingECMLM on the human dataset instead of CMLM isgreater than the power gained by using MLM instead ofGLM or by using CMLM instead of MLM (Figure 4 andAdditional file 1: Table S2).The computing time for optimization on the extended
parameter space increased linearly with the number ofalgorithms in the new dimension. This increase becomesirrelevant in GWAS with many markers by using P3D.The optimization only needs to be performed once forall the parameters in the model except SNP. Those param-eter values can then be used for tests on SNP associations.For the compression level corresponding to the best
model fit, some of the extended parameter space have ahigher compression level for some traits and lower for
A B
C D
Figure 5 Statistical power under different false discovery rates for four statistical methods. The four methods are general linear model(GLM), mixed linear model (MLM), compressed MLM (CMLM), and enriched compressed MLM (ECMLM). The CMLM was performed with theun-weighted pair group method with arithmetic mean clustering algorithm and the average algorithm for calculating group kinship. The ECMLMwas performed by the best combination of three group kinship algorithms and eight clustering algorithms. The statistical power was evaluatedon a simulated phenotype with the quantitative trait nucleotide (QTN) effect added to observed phenotypes. The size of the QTN effect isexpressed in the unit of phenotypic standard deviation (SD). The x-axis indicates the false discovery rate; the y-axis shows statistical power.The observed phenotypes are (A) body mass index in human with SD = 0.08, (B) Orthopedic Foundation for Animals score in dog with SD = 0.3,and flowering time in both (C) maize with SD = 0.4 and (D) Arabidopsis with SD = 0.75.
Li et al. BMC Biology 2014, 12:73 Page 7 of 10http://www.biomedcentral.com/1741-7007/12/73
others. We found no indication whether the extensionwould increase or decrease compression level for bestmodel fit. However, if the objective is to reach the samemodel fit as the standard MLM, the extended parameterspace could dramatically increase compression level. Be-cause the computing time is cubic to the compressionlevel, a huge improvement in computing time could be re-alized using ECMLM under such an objective (Figure 3).If the objective is to achieve the same compression levelor computing speed as MLM, higher statistical powercould be realized by using the ECMLM method.The combined usage of group kinship algorithms and
clustering algorithms for grouping individuals created anextended parameter space for GWAS. The extension ofparameter space made more traits suitable for the appli-cation of compression to improve statistical power inGWAS (Additional file 1: Figure S1).
ConclusionThe enrichment of the compressed mixed linear modelby optimizing group kinship improves statistical power
for genome wide association studies. The enriched com-pressed mixed linear model is applicable on more widerange of complex traits.
MethodsObserved dataFour datasets from human, dog, maize, and Arabidopsiswere examined in this study. Each dataset containedphenotype data and a set of genetic markers. All the data-sets have been described in previous studies [20,21,26-28],including the distribution of kinship elements derived fromthe genetic markers. The human dataset was collected from1,315 adult individuals (European Americans over 17 yearsold) who participated in the Genetics of Lipid LoweringDrugs and Diet Network (GOLDN) study [29]. The datasetincluded 647 genetic markers (388 microsatellite, or simplesequence repeat (SSR), and 259 SNP markers) scored onthe individuals. All multi-allelic SSR markers were con-verted into bi-allelic markers by collapsing alleles into twostates: major alleles and all other alleles. Measured pheno-types included height and body mass index.
Li et al. BMC Biology 2014, 12:73 Page 8 of 10http://www.biomedcentral.com/1741-7007/12/73
The dog dataset was sampled from a dataset used formapping quantitative trait loci underlying canine hip dys-plasia [27,28] and a dataset used to estimate heritability ofcanine hip dysplasia [30]. The dataset contained 292 dogsfrom two breeds (Labrador Retriever and Greyhound) andtheir crosses (F1, F2, and two backcrosses). Hip dysplasiawas measured as the Norberg angle (a measure of hipcongruency) and the OFA hip score. All dogs were geno-typed with 23,500 SNPs at genome-wide coverage and1,000 SNPs were randomly sampled for this study.The maize dataset was composed of phenotypes, geno-
types (553 SNPs), and a population structure (Q matrix)calculated for 277 inbred lines [20]. The phenotypes in-cluded flowering time scored as days to pollination andear diameter.The Arabidopsis dataset included 199 landraces geno-
typed by 216,130 SNPs [26]. We randomly sampled 5,000SNPs for this study. Among the 107 available traits, twotraits (flowering time at 10°C and plant diameter at flower-ing) with the fewest missing observations were chosen tostudy model fit and statistical power.
Statistical power estimationWe added a QTN effect to the observed phenotype. Weassigned the QTN to each marker, one at a time. Theresulting simulated phenotypes retained the original gen-etic architecture, such as population structure relatedness[20]. The proportion of detected QTNs was used as theempirical estimate of statistical power. An SNP was consid-ered a detected QTN if the association test statistics passeda threshold. The genotypic effect of each marker was fit asa fixed effect. The association tests on the markers’ geno-types were performed by F tests. The threshold was deter-mined by the empirical distribution of the F statistics onthe original observed phenotype before the artificial QTNeffect was added. The P-value at the bottom 5% quantilewas used as the empirical threshold [20].The QTN effect was represented in the unit of pheno-
typic standard deviation. The percentage of the totalvariation explained by the QTN (π) is a function of allelesubstitution difference (d) and sample frequency (p) ofthe polymorphism at the QTN: π = 1/(1 + 1/p(1-p)d2) [31].Different effects were added for human (a maximum ofd = 0.2), dog (a maximum of d = 0.5), maize (a maximumof d = 0.5), and Arabidopsis (a maximum of d = 1.5) ac-cording to sample sizes. To facilitate comparison betweendatasets, we listed π at the allele frequency of p = 0.3. Thegenetic effect was assigned to all SNPs, one at a time, toproduce replicates across all SNPs.
Statistical analysisObserved and simulated phenotypes were analyzed usingProc Mixed in SAS [32]. Variance components were esti-mated with the restricted maximum likelihood algorithm.
For human, the fixed effects were sex, age, and the quad-ratic term of age. Similarly, breed (or fraction of LabradorRetriever for the crosses with Greyhound) was the fixedeffect for dog, and population structure was the fixed ef-fect for maize and Arabidopsis. Population structure wasrepresented by the fractions of subpopulation in maizeusing Structure software. The population structure ofArabidopsis was represented by the first two PCs derivedfrom the SNPs. Previous study indicates that models in-corporating both structure and kinship perform betterthan when including them separately [20].Individuals or their corresponding groups were fit as a
random effect. The kinship among individuals was esti-mated from the genetic markers by the approach ofLoiselle et al. [33]. The individuals in each dataset weregrouped based on their kinship using Proc Cluster inSAS [32]. Eight hierarchical clustering algorithms [34] wereexamined: UPGMA, UPMGC, COM, FLE, McQuitty’ssimilarity analysis (WPGMA), WPGMC, SIN, and WAR.At different compression levels, −2LL was used to comparemodel fit.
Data availabilityECMLM has been implemented in GAPIT (R package).Source code and support documents (user manual, demodata, demo script, and demo results) are available atGAPIT [35].
Ethics statementAll the datasets analyzed here were from previously pub-lished datasets. This study did not involve taking actualsamples from humans or animals.
Additional file
Additional file 1: Additional Figure S1-S2 and Table S1-S2.
Abbreviations-2LL: Twice negative log likelihood; CMLM: compressed mixed linear model;COM: complete linkage; ECMLM: enriched compressed mixed linear model;FDR: false discovery rate; FLE: Lance-Williams flexible-beta method;GLM: general linear model; GOLDN: Genetics of Lipid Lowering Drugs andDiet Network; GWAS: genome-wide association study; MLM: mixed linearmodels; OFA: Orthopedic Foundation for Animals; P3D: population parameterpreviously determined; PC: principal component; QTN: quantitative traitnucleotides; SIN: single linkage; SNP: single nucleotide polymorphism;SSR: simple sequence repeat; UPGMA: un-weighted pair-group centroid;UPGMC: un-weighted pair-group centroid; WAR: Ward’s method;WPGMA: weighted pair-group method using arithmetic averages;WPGMC: weighted pair-group method using centroid.
Competing interestsThe authors declare that they have no competing interests.
Authors’ contributionsML and XL carried out the data analyses. PB, JY, YZ, RJT and ESB assisted thesupervision of the experiments. ZZ conceived and supervised the study, andwrote the manuscript. All authors read, revised and approved the finalmanuscript.

Li et al. BMC Biology 2014, 12:73 Page 9 of 10http://www.biomedcentral.com/1741-7007/12/73
AcknowledgementsThis study was supported by NSF-Plant Genome Program (DBI-0321467,0703908 and 0820619), NSF-Plant Genome Comparative SequencingProgram (DBI-06638566), NIH (1R21AR055228-01A1 and 1R24 GM082910-01A),NHLBI (U 01 HL72524, HL54776 and 5U01HL072524-06), US Department of Agri-culture Research Service (53-K06–5-10 and 58–1950-9–001), USDA-CSREES NRI(2006-35300-17155), Morris Animal Foundation (D04CA-135), Masterfoods Inc.,Cornell Enriched Technology in Biotechnology, and the CollaborativeResearch Program in the Cornell Veterinary College. The project was alsosupported by the Fundamental Research Funds for the Central Universities ofChina: Science and Young Scholar Technology Innovation Fund of NanjingAgricultural University (Grant no. KJ2013014), National Natural ScienceFoundation of China (Grant no. 31301748) and China Postdoctoral ScienceFoundation (Grant no. 2014 M551607). The authors thank Sara J Miller andLinda R Klein for copyediting the manuscript.
Author details1College of Horticulture, Nanjing Agricultural University, Nanjing 210095,China. 2Institute for Genomic Diversity, Cornell University, Ithaca, New York14853, USA. 3United States Department of Agriculture (USDA) – AgriculturalResearch Service (ARS), Ithaca, New York 14853, USA. 4Department ofAgronomy, Kansas State University, Manhattan, Kansas 66506, USA. 5State KeyLaboratory of Crop Genetics and Germplasm Enhancement/National Centerfor Soybean Improvement, College of Agriculture, Nanjing AgriculturalUniversity, Nanjing 210095, China. 6Department of Clinical Sciences, Collegeof Veterinary Medicine, Cornell University, Ithaca, New York 14853, USA.7College of Agronomy, Northeast Agricultural University, Harbin, Heilongjiang150030, China. 8Department of Crop and Soil Science, Washington StateUniversity, Pullman, WA 99164, USA.
Received: 30 June 2014 Accepted: 9 September 2014
References1. Huang X, Wei X, Sang T, Zhao Q, Feng Q, Zhao Y, Li C, Zhu C, Lu T, Zhang Z,
Li M, Fan D, Guo Y, Wang A, Wang L, Deng L, Li W, Lu Y, Weng Q, Liu K,Huang T, Zhou T, Jing Y, Lin Z, Buckler ES, Qian Q, Zhang QF, Li J, Han B:Genome-wide association studies of 14 agronomic traits in rice landraces.Nat Genet 2010, 42:961–967.
2. Speliotes EK, Willer CJ, Berndt SI, Monda KL, Thorleifsson G, Jackson AU,Lango Allen H, Lindgren CM, Luan J, Magi R, Randall JC, Vedantam S,Winkler TW, Qi L, Workalemahu T, Heid IM, Steinthorsdottir V, Stringham HM,Weedon MN, Wheeler E, Wood AR, Ferreira T, Weyant RJ, Segre AV, Estrada K,Liang L, Nemesh J, Park JH, Gustafsson S, Kilpelainen TO, et al: Associationanalyses of 249,796 individuals reveal 18 new loci associated with bodymass index. Nat Genet 2010, 42:937–948.
3. Pharoah PD, Tsai YY, Ramus SJ, Phelan CM, Goode EL, Lawrenson K,Buckley M, Fridley BL, Tyrer JP, Shen H, Weber R, Karevan R, Larson MC,Song H, Tessier DC, Bacot F, Vincent D, Cunningham JM, Dennis J, Dicks E,Aben KK, Anton-Culver H, Antonenkova N, Armasu SM, Baglietto L,Bandera EV, Beckmann MW, Birrer MJ, Bloom G, Bogdanova N, et al: GWASmeta-analysis and replication identifies three new susceptibility loci forovarian cancer. Nat Genet 2013, 45:362–370.
4. Rietveld CA, Medland SE, Derringer J, Yang J, Esko T, Martin NW, Westra HJ,Shakhbazov K, Abdellaoui A, Agrawal A, Albrecht E, Alizadeh BZ, Amin N,Barnard J, Baumeister SE, Benke KS, Bielak LF, Boatman JA, Boyle PA,Davies G, de Leeuw C, Eklund N, Evans DS, Ferhmann R, Fischer K, Gieger C,Gjessing HK, Hagg S, Harris JR, Hayward C, et al: GWAS of 126,559individuals identifies genetic variants associated with educationalattainment. Science 2013, 340:1467–1471.
5. Thornton KR, Foran AJ, Long AD: Properties and modeling of GWAS whencomplex disease risk is due to non-complementing, deleteriousmutations in genes of large effect. Plos Genetics 2013, 9:e1003258.
6. Segura V, Vilhjalmsson BJ, Platt A, Korte A, Seren U, Long Q, Nordborg M:An efficient multi-locus mixed-model approach for genome-wide associationstudies in structured populations. Nat Genet 2012, 44:825–830.
7. Thornsberry JM, Goodman MM, Doebley J, Kresovich S, Nielsen D,Buckler ES: Dwarf8 polymorphisms associate with variation in floweringtime. Nat Genet 2001, 28:286–289.
8. Ioannidis JPA: Why most published research findings are false.Plos Medicine 2005, 2:696–701.
9. Moonesinghe R, Khoury MJ, Janssens AC: Most published researchfindings are false-but a little replication goes a long way. PLoS Med2007, 4:e28.
10. Abiola O, Angel JM, Avner P, Bachmanov AA, Belknap JK, Bennett B,Blankenhorn EP, Blizard DA, Bolivar V, Brockmann GA, Buck KJ, Bureau JF,Casley WL, Chesler EJ, Cheverud JM, Churchill GA, Cook M, Crabbe JC,Crusio WE, Darvasi A, de Haan G, Dermant P, Doerge RW, Elliot RW,Farber CR, Flaherty L, Flint J, Gershenfeld H, Gibson JP, Gu J, et al: Thenature and identification of quantitative trait loci: a community's view.Nat Rev Genet 2003, 4:911–916.
11. Zou W, Zeng ZB: Statistical methods for mapping multiple QTL. Int J PlantGenomics 2008, 2008:286561.
12. Yang J, Benyamin B, McEvoy BP, Gordon S, Henders AK, Nyholt DR,Madden PA, Heath AC, Martin NG, Montgomery GW, Goddard ME,Visscher PM: Common SNPs explain a large proportion of the heritabilityfor human height. Nat Genet 2010, 42:565–569.
13. Buckler ES, Holland JB, Bradbury PJ, Acharya CB, Brown PJ, Browne C, Ersoz E,Flint-Garcia S, Garcia A, Glaubitz JC, Goodman MM, Harjes C, Guill K, Kroon DE,Larsson S, Lepak NK, Li H, Mitchell SE, Pressoir G, Peiffer JA, Rosas MO,Rocheford TR, Romay MC, Romero S, Salvo S, Sanchez Villeda H, da Silva HS,Sun Q, Tian F, Upadyayula N, et al: The genetic architecture of maizeflowering time. Science 2009, 325:714–718.
14. Pritchard JK, Stephens M, Rosenberg NA, Donnelly P: Association mappingin structured populations. Am J Hum Genet 2000, 67:170–181.
15. Patterson N, Price AL, Reich D: Population structure and eigenanalysis.PLoS Genet 2006, 2:e190.
16. Price AL, Patterson NJ, Plenge RM, Weinblatt ME, Shadick NA, Reich D:Principal components analysis corrects for stratification in genome-wideassociation studies. Nat Genet 2006, 38:904–909.
17. Zhao K, Aranzana MJ, Kim S, Lister C, Shindo C, Tang C, Toomajian C,Zheng H, Dean C, Marjoram P, Nordborg M: An Arabidopsis example ofassociation mapping in structured samples. PLoS Genet 2007, 3:e4.
18. Voight BF, Pritchard JK: Confounding from cryptic relatedness incase–control association studies. PLoS Genet 2005, 1:e32.
19. Consortium WTCC: Genome-wide association study of 14,000 cases ofseven common diseases and 3,000 shared controls. Nature 2007,447:661–678.
20. Yu J, Pressoir G, Briggs WH, Vroh Bi I, Yamasaki M, Doebley JF, McMullenMD, Gaut BS, Nielsen DM, Holland JB, Kresovich S, Buckler ES: A unifiedmixed-model method for association mapping that accounts formultiple levels of relatedness. Nat Genet 2006, 38:203–208.
21. Zhang Z, Ersoz E, Lai CQ, Todhunter RJ, Tiwari HK, Gore MA, Bradbury PJ, Yu J,Arnett DK, Ordovas JM, Buckler ES: Mixed linear model approach adapted forgenome-wide association studies. Nat Genet 2010, 42:355–360.
22. Henderson CR: Applications of Linear Models in Animal Breeding. Guelph,Ontario: University of Guelph; 1984.
23. Bradbury PJ, Zhang Z, Kroon DE, Casstevens TM, Ramdoss Y, Buckler ES:TASSEL: software for association mapping of complex traits in diversesamples. Bioinformatics 2007, 23:2633–2635.
24. Jardine N, Sibson R: Mathematical Taxonomy. London: Wiley; 1971.25. Soka LRR, Michener CD: A statistical method for evaluating systematic
relationships. Univ Kansas Sci Bull 1958, 38:1409–1438.26. Atwell S, Huang YS, Vilhjalmsson BJ, Willems G, Horton M, Li Y, Meng D,
Platt A, Tarone AM, Hu TT, Jiang R, Muliyati NW, Zhang X, Amer MA,Baxter I, Brachi B, Chory J, Dean C, Debieu M, de Meaux J, Ecker JR, Faure N,Kniskern JM, Jones JD, Michael T, Nemri A, Roux F, Salt DE, Tang C,Todesco M, et al: Genome-wide association study of 107 phenotypes inArabidopsis thaliana inbred lines. Nature 2010, 465:627–631.
27. Zhou Z, Sheng X, Zhang Z, Zhao K, Zhu L, Guo G, Friedenberg SG, Hunter LS,Vandenberg-Foels WS, Hornbuckle WE, Krotscheck U, Corey E, Moise NS,Dykes NL, Li J, Xu S, Du L, Wang Y, Sandler J, Acland GM, Lust G, Todhunter RJ:Differential genetic regulation of canine hip dysplasia and osteoarthritis.PLoS One 2010, 5:e13219.
28. Guo G, Zhou Z, Wang Y, Zhao K, Zhu L, Lust G, Hunter L, Friedenberg S, Li J,Zhang Y, Harris S, Jones P, Sandler J, Krotscheck U, Todhunter R, Zhang Z:Canine hip dysplasia is predictable by genotyping. Osteoarthritis Cartilage2010, 19:420–429.
29. Lai CQ, Arnett DK, Corella D, Straka RJ, Tsai MY, Peacock JM, Adiconis X,Parnell LD, Hixson JE, Province MA, Ordovas JM: Fenofibrate effect ontriglyceride and postprandial response of apolipoprotein A5 variants: theGOLDN study. Arterioscler Thromb Vasc Biol 2007, 27:1417–1425.
Li et al. BMC Biology 2014, 12:73 Page 10 of 10http://www.biomedcentral.com/1741-7007/12/73
30. Zhang Z, Zhu L, Sandler J, Friedenberg SS, Egelhoff J, Williams AJ, Dykes NL,Hornbuckle W, Krotscheck U, Moise NS, Lust G, Todhunter RJ: Estimation ofheritabilities, genetic correlations, and breeding values of four traits thatcollectively define hip dysplasia in dogs. Am J Vet Res 2009, 70:483–492.
31. Long AD, Langley CH: The power of association studies to detect thecontribution of candidate genetic loci to variation in complex traits.Genome Res 1999, 9:720–731.
32. Littell RC, Milliken GA, Stroup WW, Wolfinger RD, Schabenberger O: SAS forMixed Models. 2nd edition. Cary NC: SAS Institute Inc, Cary NC; 2006.
33. Loiselle BA, Sork VL, Nason J, Graham C: Spatial genetic-structure of atropical understory shrub, Psychotria officinalis (Rubiaceae). Am J Bot1995, 82:1420–1425.
34. Romesberg HC: Cluster Analysis for Researchers. North Carolina, USA: LULUPress; 2004.
35. Lipka AE, Tian F, Wang Q, Peiffer J, Li M, Bradbury PJ, Gore MA, Buckler ES,Zhang Z: GAPIT: Genome association and prediction integrated tool.Bioinformatics 2012, 28:2397–2399 (http://www.maizegenetics.net/gapit orhttp://zzlab.net/GAPIT).
doi:10.1186/s12915-014-0073-5Cite this article as: Li et al.: Enrichment of statistical power forgenome-wide association studies. BMC Biology 2014 12:73.
Submit your next manuscript to BioMed Centraland take full advantage of:
• Convenient online submission
• Thorough peer review
• No space constraints or color figure charges
• Immediate publication on acceptance
• Inclusion in PubMed, CAS, Scopus and Google Scholar
• Research which is freely available for redistribution
Submit your manuscript at www.biomedcentral.com/submit