Genome-wide analysis of complex traits in cattle
141
TECHNISCHE UNIVERSITÄT MÜNCHEN Lehrstuhl für Tierzucht Genome-wide analysis of complex traits in cattle Hubert Hans Pausch Vollständiger Abdruck der von der Fakultät Wissenschaftszentrum Weihenstephan für Ernährung, Landnutzung und Umwelt der Technischen Universität München zur Erlangung des akademischen Grades eines Doktors der Naturwissenschaften genehmigten Dissertation. Vorsitzender: Univ.-Prof. Dr. A. Tellier Prüfer der Dissertation: 1. Univ.-Prof. Dr. H.-R. Fries 2. Univ.-Prof. Dr. Ch.-C. Schön 3. Assoc. Prof. Dr. B. Hayes, La Trobe University Melbourne / Australien (nur schriftliche Beurteilung) Univ.-Prof. Dr. Th. A. Meitinger (nur mündliche Prüfung) Die Dissertation wurde am 21.08.2012 bei der Technischen Universität München eingereicht und durch die Fakultät Wissenschaftszentrum für Ernährung, Landnutzung und Umwelt am 28.01.2013 angenommen.
Transcript of Genome-wide analysis of complex traits in cattle

TECHNISCHE UNIVERSITÄT MÜNCHEN
Lehrstuhl für Tierzucht
Genome-wide analysis of complex traits in cattle
Hubert Hans Pausch
Vollständiger Abdruck der von der Fakultät Wissenschaftszentrum Weihenstephan
für Ernährung, Landnutzung und Umwelt der Technischen Universität München zur
Erlangung des akademischen Grades eines
Doktors der Naturwissenschaften
genehmigten Dissertation.
Vorsitzender: Univ.-Prof. Dr. A. Tellier
Prüfer der Dissertation: 1. Univ.-Prof. Dr. H.-R. Fries
2. Univ.-Prof. Dr. Ch.-C. Schön
3. Assoc. Prof. Dr. B. Hayes, La Trobe University
Melbourne / Australien (nur schriftliche Beurteilung)
Univ.-Prof. Dr. Th. A. Meitinger (nur mündliche
Prüfung)
Die Dissertation wurde am 21.08.2012 bei der Technischen Universität München
eingereicht und durch die Fakultät Wissenschaftszentrum für Ernährung,
Landnutzung und Umwelt am 28.01.2013 angenommen.


Publications arising from this thesis
Publications arising from this thesis
Peer reviewed
Pausch H, Flisikowski K, Jung S, Emmerling R, Edel C, Götz K-U, Fries R (2011): Genome-Wide
Association Study Identifies Two Major Loci Affecting Calving Ease and Growth-Related Traits in
Cattle. Genetics, 187:289 –297.
Pausch H, Jung S, Edel C, Emmerling R, Krogmeier D, Götz K-U, Fries R (2012): Genome‐wide
association study uncovers four QTL predisposing to supernumerary teats in cattle.
Animal Genetics. Article first published online: 15 Mar 2012 DOI:10.1111/j.1365-
2052.2012.02340.x
Pausch H, Wang X, Jung S, Krogmeier D, Edel C, Emmerling R, Götz K-U, Fries R (2012):
Identification of QTL for UV-protective Eye Area Pigmentation in Cattle by Progeny Phenotyping
and Genome-wide Association Analysis. PLoS ONE 7: e36346.
Pausch H, Aigner B, Emmerling R, Edel C, Götz KU, Fries R (2012): Imputation of high-density
genotypes in the FV population. Submitted to Genetics Selection Evolution
Fries R, Pausch H (2011): Individual genome sequencing of livestock animals – en route to
genomic selection 2.0. Züchtungskunde 83:371-381
Jansen S, Aigner B, Pausch H, Wysocki M, Eck S, Benet-Pagès A, Wieland T, Strom T, Meitinger
T, Fries R (2012): Assessment of the genomic variation in the Fleckvieh breed by re-sequencing at
low to medium coverage. In preparation
Venhoranta H*, Pausch H*, Wysocki M*, Szczerbal I*, Taponen J, Uimari P, Lohi H, Fries R,
Switonski M, Andersson M (2012): The genetic background of the predominantly left-sided
gonadal hypoplasia in Finnish PSK and Swedish Highland cattle. In preparation (*joint first
authorship)

Publications arising from this thesis
Wang X, Wurmser C, Pausch H, Jung S, Reinhardt F, Tetens J, Thaller G, Fries R (2012):
Identification and dissection of four major QTL affecting milk fat content in the German-Holstein-
Friesian population. PLoS ONE 7: e40711
Conference Proceedings
Pausch H, Flisiskowski K, Jung S, Tetens J, Emmerling R, Edel C, Götz KU, Thaller G, Fries R
(2010): Genomweite Assoziationsstudie identifiziert zwei QTL für den paternalen Kalbeverlauf
beim Fleckvieh. Tagungsband der DGFZ/GfT-Gemeinschaftstagung 2010
Pausch H, Edel C, Emmerling R, Götz KU, Fries R (2011): Imputation von hoch-dichter SNP
Information beim Fleckvieh. Tagungsband der DGFZ/GfT-Gemeinschaftstagung 2011
Pausch H, Wurmser C, Jansen S, Aigner B, Fries R (2012): Imputation of whole-genome sequence
information for QTL fine-mapping in the Fleckvieh population. Book of Abstracts of the 33 rd ISAG
conference, Cairns
Erbe M, Pausch H, Jung S, Fries R (2009): Schätzung von IBD-Wahrscheinlichkeiten aus SNP-
Daten und deren Nutzung für die Qualitätskontrolle. Tagungsband der DGFZ/GfT-
Gemeinschaftstagung 2009
Fries R, Pausch H, Jansen S, Aigner B, Wysocki M (2012): Assessment of the genomic variation in
a cattle population based on low-coverage re-sequencing. Book of Abstracts of the 63 rd EAAP
Annual Meeting, Bratislava
Gollnick NS, Jung S, Langenmayer MC, Majzoub M, Hermanns W, Pausch H, Fries R (2010):
Schwere Hauterkrankungen bei Kälbern der Rasse Deutsches Fleckvieh (DFV): Ist eine neue
Variante der Bovinen Hereditären Zink Defizienz die Ursache? 8. Buiatriktagung der Klinik für
Wiederkäuer der LMU, München, Deutschland.

Publications arising from this thesis
Gollnick NS, Jung S, Langenmayer MC, Majzoub M, Hermanns W, Pausch H, Fries R (2011):
Investigating a genetic variant of the bovine hereditary zinc deficiency syndrome in the German
Fleckvieh population. 6. European Congress of Bovine Health Management, Liège, Belgien
Gollnick NS, Jung S, Langenmayer MC, Majzoub M, Hermanns W, Pausch H, Fries R (2011):
Bovine hereditäre Zinkdefizienz (BHZD) beim deutschen Fleckvieh – Ist eine Mutation auf dem
Chromosom 21 die Ursache? Abstract, 3. Jahrestagung der DVG-Fachgruppe Deutsche buiatrische
Gesellschaft, DVG-Vet-Congress, Berlin
Jansen S, Aigner B, Pausch H, Wysocki M, Eck S, Wieland T, Benet-Pagès A, Strom T, Meitinger
T, Fries R (2011): Sichtung der genomischen Variation der Fleckvieh Population durch Re-
Sequenzierung bei niedriger bis mittlerer Abdeckung. Tagungsband der DGFZ/GfT-
Gemeinschaftstagung 2011
Jansen S, Aigner B, Pausch H, Wysocki M, Fries R (2012): Extensive variant detection in the
Fleckvieh population by low-coverage re-sequencing. Book of Abstracts of the 33rd ISAG
conference, Cairns
Wang X, Pausch H, Jung S, Flisikowski K, Tetens J, Thaller G, Fries R (2010): Polymorphism
analysis of genes in a 3.1-Mb region on bovine chromosome 5 associated with milk fat percentage.
Book of Abstracts of the 32nd ISAG conference, Edinburgh
Wang X, Pausch H, Wysocki M, Fries R (2012): Refinement of a QTL on chromosome 5
associated with milk fat percentage using re-sequencing data. Book of Abstracts of the 33rd ISAG
conference, Cairns
Wurmser C, Eikel I, Buttchereit N, Pausch H, Thaller G, Fries R (2010): Bestimmung des
Fettsäuremusters der Milch im Hinblick auf die Stoffwechselbelastung der frühen Laktation bei
Holstein-Friesian Kühen. Tagungsband der DGFZ/GfT-Gemeinschaftstagung 2010


Table of Contents
Table of Contents
Chapter Page
1 General introduction 8
2 Genome-wide association study identifies two major loci affecting calving ease and growth related traits in cattle
20
3 Genome-wide association study uncovers four QTL predisposing to supernumerary teats in cattle
54
4 Identification of QTL for UV-protective eye area pigmentation in cattle by progeny phenotyping and genome-wide association analysis
70
5 General Discussion 102
6 Outlook 126
Summary 132
Zusammenfassung 134
Appendices 136
Acknowledgements 141

1st Chapter
General Introduction

1 st Chapter General Introduction 9
The genetic architecture of quantitative traits
Most economically important traits in livestock species exhibit a complex genetic architecture with
a small number of loci with major effects and a large number of loci with infinitesimal effects [1],
[2],[3],[4]. Genomic regions affecting quantitative phenotypes are denoted as 'quantitative trait loci'
(QTL) [5]. The proportion of genetic variation explained by a QTL quantifies its effect size and its
importance for the considered trait [6]. Assuming a diallelic locus and pure additivity allows to
assess the trait variation explained by a QTL as 2pq α2 /σ a2 [7], where p and q are the frequencies
of the QTL alleles, α is the allelic substitution effect and σ a2 is the additive genetic variation
of the respective trait. The size of QTL effects is breed specific as allele frequencies differ among
breeds [8],[9]. Furthermore, QTL effects are not persistent over time as genes with favourable
effects underly both natural and artificial selection [10],[11]. The frequency of favourable alleles
(with initial frequency > 0.5) increases considerably under selection resulting in a decrease of the
QTL variation [10].
Mapping genomic regions underlying quantitative traits
The main objective of QTL mapping in livestock populations was the identification of suitable
markers to improve economically relevant traits via marker-assisted selection (MAS) [12]. QTL
mapping experiments in cattle populations were successfully performed using progeny-derived
phenotypes for artificial insemination bulls which were genotyped for a small number of
polymorphic microsatellites (i.e. granddaughter designs (e.g. [13])). This approach allowed for the
identification of numerous QTL for various phenotypes [12]. However, the limited number of
markers applied, resulted in large confidence intervals and imprecise mapping of QTL-regions (e.g.
[14],[15]), rendering the fine-mapping and the identification of the underlying gene(s) (and
polymorphism(s)) a difficult task. Furthermore, the identified markers were of limited suitability for

1 st Chapter General Introduction 10
MAS, as they were (in most cases) in linkage disequilibrium (LD) with the underlying quantitative
trait nucleotide (QTN) only. Addressing the QTN directly rather than using anonymous marker in
LD with the QTN, is more efficient and persistent for MAS [16],[17].
High-throughput genotyping
The first assembly of the bovine genome permitted comprehensive insights into the genomic
variation between as well as within cattle breeds [18]. The availability of the bovine reference
sequence allowed primarily for the systematic assessment of a large number of single nucleotide
polymorphisms (SNPs) by whole genome re-sequencing of individual animals [19],[20],[21],[22].
Thus detected SNPs enable to compile high-throughput genotyping arrays interrogating a large
number of polymorphic sites simultaneously [23],[24]. Currently, the most dense bovine genotyping
array interrogates genotypes for 777,962 SNPs per individual. However, genotyping of cattle
populations is mostly performed with a medium-dense genotyping array interrogating 54,602 SNPs
only. Genotype imputation allows to combine different datasets and to infer missing genotypes in
silico [25]. The haplotype diversity of the entire population can be assessed by genotyping a
substantial number of representative individuals with high-density SNP panels [26]. Missing
genotypes of individuals genotyped at a lower density can be imputed accurately based on high-
density haplotype information.
Implementation of genotype information in breeding programs
The availability of high-density SNP panels resulted in major modifications of cattle breeding
programs. While traditional breeding schemes relied on progeny phenotyping and subsequent sire
evaluation, the genetic value of individuals can now be accurately inferred based on genotype
information only (i.e. genomic selection [27]). The implementation of genotype information not

1 st Chapter General Introduction 11
only increases genetic gain but also dramatically reduces breeding costs of traditional breeding
schemes [28]. However, as the current implementation of genomic selection relies on linkage
disequilibrium between markers and causal variants, the accuracy of genomic breeding values
declines considerably over generations [29]. The most efficient and sustainable genomic breeding
program is supposed to utilize whole-genome sequence information and concomitantly causal
variants directly [30],[6]. So far, the number of validated QTNs is very limited and their
identification still renders a difficult task [31],[32].
Quantitative trait loci mapping with high-density genotypes
Genome-wide association studies (GWAS) based on densely spaced SNPs offer a powerful
approach to the identification of genomic regions underlying phenotypic variation (e.g. [33],[34]).
Fine-mapping and molecular-genetic dissection of significantly associated regions permit insights
into the genetic mechanism(s) causing phenotypic variation and to pinpoint potential causal
variants. However, strong linkage of potentially functional adjacent SNPs often precludes to finally
proof the causality of individual variants [35]. The identification of the underlying QTN is further
complicated by the fact that several adjacent markers with small effects might form a composite
QTL [36].
Genome-wide association studies in humans
Since the first GWAS in 2005 [37], hundreds of variants have been identified to contribute to the
genetic variation of complex traits in humans (e.g. [38],[39]). However, the identified QTNs
account for a minor part of the heritability only [40]. A major part of the 'missing heritability' [41] is
most likely attributable to numerous undetected loci with small effects [42]. Large-scale GWAS and
1 st Chapter General Introduction 12
high-density SNP panels are indispensable to detect small effect loci [43],[3]. However, even
studies with hundreds of thousands of individuals and millions of SNPs have limited power to
identify QTL accounting for a small part of the genetic variation [44].
Genome-wide association studies in cattle populations
In cattle, GWAS have been successfully applied to identify genomic regions underlying both
mendelian (e.g. [45],[46],[47]) and quantitative traits (e.g. [4],[48]). GWAS of quantitative traits in
livestock populations are often performed by using progeny-derived phenotypes such as breeding
values or daughter yield deviations for the genotyped animals. Progeny-derived phenotypes are
high-heritability traits as they are assessed based on a large number of records. The availability of
high-heritability phenotypes facilitates QTL mapping considerably and compensates for the
comparatively small sample sizes in livestock GWAS [3].
Population stratification in genome-wide association studies
An important prerequisite for unbiased QTL mapping is homogeneity of the mapping population.
However, in typical livestock populations a limited number of founder animals explains a large
proportion of the genetic diversity of breeding populations [49]. The resulting small effective
population size causes substantial long-range linkage disequilibrium [3],[50]. Furthermore, the
wide-spread use of genetically superior artificial insemination bulls results in large half-sib families.
Allele frequencies between half-sib families might differ considerably and thereby confound QTL
mapping by causing spurious associations [51]. Comparing the observed with the expected test
statistics under the assumption of no association allows to assess the extent of spurious associations
[52]. Confounding due to population stratification was primarily observed in case-control designs
when allele frequencies differed between groups due to ancestry [53],[54]. Confounding also causes

1 st Chapter General Introduction 13
spurious associations in genome-wide analysis of quantitative traits when subgroups of individuals
share the same ancestry. Family-based designs (e.g. the transmission disequilibrium test, TDT [55])
are robust to population substructure. However, obtaining phenotype information from relatives is
notoriously difficult for large-scale association studies precluding the application of family-based
designs [56]. Furthermore, association studies are more powerful than family-based linkage studies
especially for the identification of small effect variants [57],[58].
Accounting for population stratification
Several approaches are common to account for non-random population structure in GWAS (see [59]
for a review). Initially, Yu et al. proposed a mixed-model based approach to account for the
covariance among related individuals [60]. Therefore, the pairwise relationship is calculated based
on pedigree and marker information, respectively. While the pedigree relationship is an expectation
of the proportion of shared genes only, the genomic relationship reflects the realized proportion of
common genes among individuals [61]. Especially in studies with incomplete pedigree information,
the genomic relationship allows for a better resolution of cryptic relatedness among samples [62],
[63]. While numerous approaches are available to build the genomic relationship based on SNP
genotypes (e.g. [63],[64],[65]), VanRaden's approach [66] and derivatives thereof [67],[68] are most
common for livestock populations. Sophisticatedly implemented algorithms allow for the efficient
computation of large-scale mixed-model based GWAS (e.g. [69],[70],[71],[72]).
Another widely used approach to account for sample structure, albeit rather in human than in
livestock GWAS, is accounting for the top axes of variation as inferred by principal components
analysis (PCA) [73]. To this end, an eigenvector decomposition of a genetic covariance matrix built

1 st Chapter General Introduction 14
based upon SNP genotypes is performed. The GWAS is subsequently carried out by applying the
most informative axes of variation as covariates in a linear regression model [74]. However, the
decision about the appropriate number of employed axes is controversial [75].
Outline of the Thesis
In Chapter 2 of the present thesis a GWAS for calving and growth-related traits was performed in
the German Fleckvieh (FV) population. The GWAS was facilitated by using breeding values as
high-heritability phenotypes. Two major QTL were identified on bovine chromosomes 14 and 21
after careful correction for population stratification applying a principal components analysis (PCA)
based approach. The underlying genomic regions are known to affect growth-related traits in
mammals and most likely affect both fetal and postnatal growth in cattle.
Two different approaches to account for population stratification and the resulting inflation of false
positive association signals were compared using real world data in Chapter 3. In order to identify
genomic regions predisposing to the development of supernumerary teats in cattle, a GWAS was
performed using a PCA based and a mixed model based approach, respectively. The GWAS with the
PCA and mixed model based approach identified three and four QTL, respectively. The mixed
model based approach outperformed the PCA based approach.
The successful mapping of twelve QTL regions underlying a special aspect of skin pigmentation in
cattle is reported in Chapter 4. A high-heritability trait was assessed by phenotyping a large number
of progeny groups of artificial insemination bulls. The successful imputation of high-density
genotype information increased the power of the GWAS and enabled the mapping of QTL that
account for a minor part of the genetic variation only. The results indicate that applying dense SNP
panels clearly reduces the 'missing heritability'.
1 st Chapter General Introduction 15
References
1. Fisher RA (1918) The correlation between relatives on the supposition of Mendelian inheritance. Transactions of the Royal Society of Edinburgh 52: 399–433.
2. Visscher PM, Haley CS (1996) Detection of putative quantitative trait loci in line crosses under infinitesimal genetic models. Theoretical and Applied Genetics 93-93: 691–702.
3. Goddard ME, Hayes BJ (2009) Mapping genes for complex traits in domestic animals and their use in breeding programmes. Nat Rev Genet 10: 381–391.
4. Hayes BJ, Pryce J, Chamberlain AJ, Bowman PJ, Goddard ME (2010) Genetic Architecture of Complex Traits and Accuracy of Genomic Prediction: Coat Colour, Milk-Fat Percentage, and Type in Holstein Cattle as Contrasting Model Traits. PLoS Genet 6: e1001139.
5. Geldermann H (1975) Investigations on inheritance of quantitative characters in animals by gene markers. 1. Methods. Theoretical and Applied Genetics 46: 319–330.
6. Fries R, Pausch H (2011) Individual genome sequencing of livestock animals - En route to genomic selection 2.0. Zuechtungskunde 83: 371–381.
7. Falconer DS, Mackay TFC (1996) Introduction to Quantitative Genetics. 4th ed. Benjamin Cummings; 1996.
8. Thaller G, Krämer W, Winter A, Kaupe B, Erhardt G, Fries R (2003) Effects of DGAT1 variants on milk production traits in German cattle breeds. Journal of Animal Science 81: 1911–1918.
9. Signorelli F, Orrù L, Napolitano F, De Matteis G, Scatà MC, Catillo G, et al. (2009) Exploring polymorphisms and effects on milk traits of the DGAT1, SCD1 and GHR genes in four cattle breeds. Livestock Science 125: 74–79.
10. Goddard ME, Hayes B (2003) The effect of artificial selection on the distribution of QTL effects. http://www.aaabg.org/livestocklibrary/2003/35-38.pdf [Internet] [cited 2012 May 27];Available from: http://livestocklibrary.com.au/handle/1234/5445
11. Flori L, Fritz S, Jaffrézic F, Boussaha M, Gut I, Heath S, et al. (2009) The Genome Response to Artificial Selection: A Case Study in Dairy Cattle. PLoS ONE 4: e6595.
12. Khatkar MS, Thomson PC, Tammen I, Raadsma HW (2004) Quantitative trait loci mapping in dairy cattle: review and meta-analysis. Genetics Selection Evolution 36: 163.
13. Georges M, Nielsen D, Mackinnon M, Mishra A, Okimoto R, Pasquino AT, et al. (1995) Mapping Quantitative Trait Loci Controlling Milk Production in Dairy Cattle by Exploiting Progeny Testing. Genetics 139: 907 –920.
14. Visscher PM, Goddard ME (2004) Prediction of the Confidence Interval of Quantitative Trait Loci Location. Behavior Genetics 34: 477–482.
15. Darvasi A, Soller M (1997) A Simple Method to Calculate Resolving Power and Confidence
1 st Chapter General Introduction 16
Interval of QTL Map Location. Behavior Genetics 27: 125–132.
16. Dekkers JCM (2004) Commercial application of marker- and gene-assisted selection in livestock: Strategies and lessons. Journal of Animal Science 82: E313 –E328.
17. Zhang W, Smith C (1993) Simulation of marker-assisted selection utilizing linkage disequilibrium: the effects of several additional factors. Theoretical and Applied Genetics 86: 492–496.
18. The Bovine HapMap Consortium (2009) Genome-Wide Survey of SNP Variation Uncovers the Genetic Structure of Cattle Breeds. Science 324: 528–532.
19. Eck S, Benet-Pages A, Flisikowski K, Meitinger T, Fries R, Strom T (2009) Whole genome sequencing of a single Bos taurus animal for SNP discovery. Genome Biology 10: R82.
20. Kawahara-Miki R, Tsuda K, Shiwa Y, Arai-Kichise Y, Matsumoto T, Kanesaki Y, et al. (2011) Whole-genome resequencing shows numerous genes with nonsynonymous SNPs in the Japanese native cattle Kuchinoshima-Ushi. BMC Genomics 12: 103.
21. Zhan B, Fadista J, Thomsen B, Hedegaard J, Panitz F, Bendixen C (2011) Global assessment of genomic variation in cattle by genome resequencing and high-throughput genotyping. BMC Genomics 12: 557.
22. Stothard P, Choi J-W, Basu U, Sumner-Thomson JM, Meng Y, Liao X, et al. (2011) Whole genome resequencing of black Angus and Holstein cattle for SNP and CNV discovery. BMC Genomics 12: 559.
23. Matukumalli LK, Lawley CT, Schnabel RD, Taylor JF, Allan MF, Heaton MP, et al. (2009) Development and Characterization of a High Density SNP Genotyping Assay for Cattle. PLoS ONE 4: e5350.
24. Rincon G, Weber KL, Van Eenennaam AL, Golden BL, Medrano JF (2011) Hot topic: Performance of bovine high-density genotyping platforms in Holsteins and Jerseys. Journal of Dairy Science 94: 6116–6121.
25. Li Y, Willer C, Sanna S, Abecasis G (2009) Genotype imputation. Annual Review of Genomics and Human Genetics 10: 387–406.
26. VanRaden PM, O’Connell JR, Wiggans GR, Weigel KA (2011) Genomic evaluations with many more genotypes. Genetics, Selection, Evolution: GSE 43: 10.
27. Meuwissen TH, Hayes BJ, Goddard ME (2001) Prediction of total genetic value using genome-wide dense marker maps. Genetics 157: 1819–1829.
28. Schaeffer LR (2006) Strategy for applying genome‐wide selection in dairy cattle. Journal of Animal Breeding and Genetics 123: 218–223.
29. Habier D, Fernando RL, Dekkers JCM (2007) The Impact of Genetic Relationship Information on Genome-Assisted Breeding Values. Genetics 177: 2389 –2397.

1 st Chapter General Introduction 17
30. Meuwissen T, Goddard M (2010) Accurate Prediction of Genetic Values for Complex Traits by Whole-Genome Resequencing. Genetics 185: 623 –631.
31. Weller JI (2009) Quantitative trait loci analysis in animals. CABI; 2009.
32. Visscher PM, Goddard ME (2011) Cattle gain stature. Nat Genet 43: 397–398.
33. Hirschhorn JN, Daly MJ (2005) Genome-wide association studies for common diseases and complex traits. Nature Reviews Genetics 6: 95–108.
34. McCarthy MI, Abecasis GR, Cardon LR, Goldstein DB, Little J, Ioannidis JPA, et al. (2008) Genome-wide association studies for complex traits: consensus, uncertainty and challenges. Nat Rev Genet 9: 356–369.
35. Georges M (2011) The long and winding road from correlation to causation. Nat Genet 43: 180–181.
36. Bickel RD, Kopp A, Nuzhdin SV (2011) Composite Effects of Polymorphisms near Multiple Regulatory Elements Create a Major-Effect QTL. PLoS Genet 7: e1001275.
37. Klein RJ, Zeiss C, Chew EY, Tsai J-Y, Sackler RS, Haynes C, et al. (2005) Complement Factor H Polymorphism in Age-Related Macular Degeneration. Science (New York, N.Y.) 308: 385–389.
38. Gudbjartsson DF, Walters GB, Thorleifsson G, Stefansson H, Halldorsson BV, Zusmanovich P, et al. (2008) Many sequence variants affecting diversity of adult human height. Nat Genet 40: 609–615.
39. Lango Allen H, Estrada K, Lettre G, Berndt SI, Weedon MN, Rivadeneira F, et al. (2010) Hundreds of variants clustered in genomic loci and biological pathways affect human height. Nature 467: 832–838.
40. Manolio TA, Collins FS, Cox NJ, Goldstein DB, Hindorff LA, Hunter DJ, et al. (2009) Finding the missing heritability of complex diseases. Nature 461: 747–753.
41. Maher B (2008) Personal genomes: The case of the missing heritability. Nature 456: 18–21.
42. Yang J, Benyamin B, McEvoy BP, Gordon S, Henders AK, Nyholt DR, et al. (2010) Common SNPs explain a large proportion of the heritability for human height. Nat Genet 42: 565–569.
43. McRae AF, Byrne EM, Zhao ZZ, Montgomery GW, Visscher PM (2008) Power and SNP tagging in whole mitochondrial genome association studies. Genome Research 18: 911–917.
44. Speliotes EK, Willer CJ, Berndt SI, Monda KL, Thorleifsson G, Jackson AU, et al. (2010) Association analyses of 249,796 individuals reveal 18 new loci associated with body mass index. Nat Genet 42: 937–948.
45. Charlier C, Coppieters W, Rollin F, Desmecht D, Agerholm JS, Cambisano N, et al. (2008) Highly effective SNP-based association mapping and management of recessive defects in livestock. Nat Genet 40: 449–454.

1 st Chapter General Introduction 18
46. Seichter D, Russ I, Förster M, Medugorac I (2011) SNP‐based association mapping of Arachnomelia in Fleckvieh cattle. Animal Genetics 42: 544–547.
47. Drögemüller C, Reichart U, Seuberlich T, Oevermann A, Baumgartner M, Kühni Boghenbor K, et al. (2011) An Unusual Splice Defect in the Mitofusin 2 Gene (MFN2) Is Associated with Degenerative Axonopathy in Tyrolean Grey Cattle. PLoS ONE 6: e18931.
48. Karim L, Takeda H, Lin L, Druet T, Arias JAC, Baurain D, et al. (2011) Variants modulating the expression of a chromosome domain encompassing PLAG1 influence bovine stature. Nat Genet 43: 405–413.
49. Stachowicz K, Sargolzaei M, Miglior F, Schenkel FS (2011) Rates of inbreeding and genetic diversity in Canadian Holstein and Jersey cattle. Journal of Dairy Science 94: 5160–5175.
50. Qanbari S, Pimentel ECG, Tetens J, Thaller G, Lichtner P, Sharifi AR, et al. (2010) The pattern of linkage disequilibrium in German Holstein cattle. Animal Genetics 41: 346–356.
51. Marchini J, Cardon LR, Phillips MS, Donnelly P (2004) The effects of human population structure on large genetic association studies. Nat Genet 36: 512–517.
52. Devlin B, Roeder K (1999) Genomic control for association studies. Biometrics 55: 997–1004.
53. Freedman ML, Reich D, Penney KL, McDonald GJ, Mignault AA, Patterson N, et al. (2004) Assessing the impact of population stratification on genetic association studies. Nature Genetics 36: 388–393.
54. Campbell CD, Ogburn EL, Lunetta KL, Lyon HN, Freedman ML, Groop LC, et al. (2005) Demonstrating stratification in a European American population. Nat Genet 37: 868–872.
55. Spielman RS, McGinnis RE, Ewens WJ (1993) Transmission test for linkage disequilibrium: the insulin gene region and insulin-dependent diabetes mellitus (IDDM). American Journal of Human Genetics 52: 506–516.
56. Laird NM, Lange C (2006) Family-based designs in the age of large-scale gene-association studies. Nat Rev Genet 7: 385–394.
57. Risch N, Merikangas K (1996) The future of genetic studies of complex human diseases. Science (New York, N.Y.) 273: 1516–1517.
58. Sham PC, Cherny SS, Purcell S, Hewitt JK (2000) Power of linkage versus association analysis of quantitative traits, by use of variance-components models, for sibship data. American Journal of Human Genetics 66: 1616–1630.
59. Price AL, Zaitlen NA, Reich D, Patterson N (2010) New approaches to population stratification in genome-wide association studies. Nat Rev Genet 11: 459–463.
60. Yu J, Pressoir G, Briggs WH, Vroh Bi I, Yamasaki M, Doebley JF, et al. (2006) A unified mixed-model method for association mapping that accounts for multiple levels of relatedness. Nat Genet 38: 203–208.

1 st Chapter General Introduction 19
61. Goddard ME, Hayes BJ, Meuwissen TH. (2011) Using the genomic relationship matrix to predict the accuracy of genomic selection. Journal of Animal Breeding and Genetics 128: 409–421.
62. Choi Y, Wijsman EM, Weir BS (2009) Case-control association testing in the presence of unknown relationships. Genetic Epidemiology 33: 668–678.
63. Astle W (2009) Population Structure and Cryptic Relatedness in Genetic Association Studies. Statistical Science 24: 451–471.
64. Wang J (2002) An Estimator for Pairwise Relatedness Using Molecular Markers. Genetics 160: 1203 –1215.
65. Powell JE, Visscher PM, Goddard ME (2010) Reconciling the analysis of IBD and IBS in complex trait studies. Nat Rev Genet 11: 800–805.
66. VanRaden PM (2008) Efficient Methods to Compute Genomic Predictions. Journal of Dairy Science 91: 4414–4423.
67. Forni S, Aguilar I, Misztal I (2011) Different genomic relationship matrices for single-step analysis using phenotypic, pedigree and genomic information. Genetics, Selection, Evolution : GSE 43: 1.
68. Meuwissen TH., Luan T, Woolliams JA (2011) The unified approach to the use of genomic and pedigree information in genomic evaluations revisited. Journal of Animal Breeding and Genetics 128: 429–439.
69. Aulchenko YS, de Koning D-J, Haley C (2007) Genomewide rapid association using mixed model and regression: a fast and simple method for genomewide pedigree-based quantitative trait loci association analysis. Genetics 177: 577–585.
70. Kang HM, Sul JH, Service SK, Zaitlen NA, Kong S, Freimer NB, et al. (2010) Variance component model to account for sample structure in genome-wide association studies. Nat Genet 42: 348–354.
71. Zhang Z, Ersoz E, Lai C-Q, Todhunter RJ, Tiwari HK, Gore MA, et al. (2010) Mixed linear model approach adapted for genome-wide association studies. Nat Genet 42: 355–360.
72. Meyer K, Tier B (2011) “SNP Snappy”: A Strategy for Fast Genome Wide Association Studies Fitting a Full Mixed Model. Genetics [Internet] [cited 2011 Dec 14];Available from: http://www.genetics.org/content/early/2011/10/20/genetics.111.134841.abstract
73. Patterson N, Price AL, Reich D (2006) Population Structure and Eigenanalysis. PLoS Genet 2: e190.
74. Price AL, Patterson NJ, Plenge RM, Weinblatt ME, Shadick NA, Reich D (2006) Principal components analysis corrects for stratification in genome-wide association studies. Nat Genet 38: 904–909.
75. Jolliffe IT (2002) Principal Component Analysis. 0002 ed. Springer, Berlin; 2002.
2nd Chapter
Genome-wide association study identifies two major loci affecting
calving ease and growth related traits in cattle
Hubert Pausch*, Krzysztof Flisikowski*, Simone Jung*, Reiner Emmerling§, Christian
Edel§, Kay-Uwe Götz§, Ruedi Fries*
* Lehrstuhl fuer Tierzucht, Technische Universitaet Muenchen, 85354 Freising, Germany
§ Institut fuer Tierzucht, Bayerische Landesanstalt für Landwirtschaft, 85586 Poing,
Germany
published in Genetics 187(1): 289–297

2 nd Chapter Calving Ease and Growth QTL in Cattle 21
Abstract
Identifying quantitative trait loci (QTL) underlying complex, low heritability traits is notoriously
difficult. Prototypical for such traits, calving ease is an important breeding objective of cattle (Bos
taurus) improving programs. To identify QTL underlying calving ease, we performed a genome-
wide association study using estimated breeding values (EBVs) as highly heritable phenotypes for
paternal calving ease (pCE) and related traits. The massively structured study population consisted
of 1800 bulls of the German Fleckvieh (FV) breed. Two pCE – associated regions on bovine
chromosomes (BTA) 14 and 21 (P = 5.72 x 10⁻¹⁵ and P = 2.27 x 10⁻⁸, respectively) were identified
using principal components analysis to correct for population stratification. The two most
significantly associated SNPs explain 10% of the EBV variation. Since marker alleles with negative
effect on pCE have positive effects on growth-related traits, the QTL may exert their effects on the
birthing process through fetal growth traits. The QTL region on BTA14 corresponds to a human
chromosome (HSA) region that is associated with growth characteristics. The HSA region
corresponding to the BTA21 pCE QTL is maternally imprinted and involved in the Prader-Willi and
Angelman syndromes. Re-sequencing of positional candidate genes on BTA14 revealed a highly
significantly (P = 1.96 x 10⁻¹⁴) associated polymorphism ablating a polyadenylation signal of the
gene encoding ribosomal protein S20 (RPS20). Our study demonstrates the leverage potential of
EBVs in unravelling the genetic architecture of lowly heritable traits.
Introduction
The recent availability of genome-wide SNP panels in cattle and other livestock species enables the
mapping of quantitative trait loci (QTL) as well as the prediction of an animal's genetic merit
without relying on phenotypic information [1]. However, the complex genetic architecture of
agriculturally important traits renders the systematic identification and characterization of

2 nd Chapter Calving Ease and Growth QTL in Cattle 22
individual QTL a difficult task. The proportion of trait variance explained by an average QTL is
very small. First mapping results in cattle seem to validate the classical quantitative genetic model
of a large number of loci of small additive effects ([2],[3],[4]) and agree with findings from
mapping QTL in the human genome [5]. Besides the relative contribution of a QTL to the trait
variation, the heritability of the trait is a major determinant of the mapping power [1]. The
heritability of calving traits, i. e. traits that describe the birthing process (dystocia in the case of
difficulties) and the perinatal viability (stillbirth) of the calf as affected by the birthing process, are
low, ranging from 0.04 to 0.15 ([6],[7],[8]). Calving traits are of considerable economic importance
due to veterinary treatment costs, calf loss and lower production of cows affected by dystocia.
Estimated breeding values (EBVs) for calving traits are used as selection criteria in attempts to
reduce calving problems both in dairy and beef breeds (e.g. [9],[10]). Calving traits are complex
since they are influenced by a sire-effect through the size of the calf as well as dam-effects
consisting mainly of the pelvic dimensions. Routine progeny testing results in highly reliable EBVs
for calving traits and thereby boosts the heritability to levels that make them amenable to QTL
mapping even with medium-sized samples. An important prerequisite for unbiased QTL mapping
based on linkage disequilibrium (LD) is homogeneity of the mapping population [11]. The heavy
use of genetically superior bulls, facilitated by artificial insemination, and introgression lead to
massively stratified populations. We attempted to correct for population stratification by principal
components analysis (PCA) - based approaches that have been successfully in human genome-wide
QTL mapping [12]. Here we report the mapping of two loci affecting very low heritability calving
traits in a heavily structured dual purpose (dairy, beef) cattle population. The mapping approach was
facilitated by the use of EBVs and consequent correction of population stratification.

2 nd Chapter Calving Ease and Growth QTL in Cattle 23
Material and Methods
Animals and phenotypes
Bulls of the dual purpose breed FV (n = 1829) were genotyped using the Illumina BovineSNP 50K
Bead chip® comprising 54,001 single nucleotide polymorphisms (SNPs). Phenotypes in the form of
EBVs for beef (daily gain (DG)) and conformation traits (body size (BS)) as well as functionality
traits such as paternal calving ease (pCE) and paternal stillbirth incidence (pSB) were obtained from
the Bavarian State Research Center for Agriculture (www.lfl.bayern.de/bazi-rind) (November 2009
version, Supporting Table 1). Breeding value estimation was based on best linear unbiased
prediction (BLUP) animal model. The calving process is described by a score ranging from 1
(unassisted delivery) to 4 (surgical delivery, fetotomy). Stillbirth is recorded as categorical trait
(alive or not 48 hours post partum). Paternal and maternal effects on calving ease and stillbirth
incidence are estimated multivariately for the first versus later parities. Parity specific EBVs are
combined to produce paternal and maternal EBVs, respectively.
Genotypes and quality control
Of 1829 genotyped FV animals, six were excluded from further analyses due to genotype call rates
below 90%. The remaining samples exhibited an average genotyping rate of 99.14%. 549 SNPs
were omitted because their chromosome position was not known. 728 SNPs were discarded because
genotyping failed in more than 10% of animals, 8480 SNPs were excluded due to a minor allele
frequency smaller than 1% and 810 SNPs showed a significant (P < 1 x 10 -3) deviation from the
Hardy-Weinberg-equilibrium, indicating genotyping errors, and were thus not considered for further
analyses. Pairwise identity by descent (IBD) was calculated based on identity by state (IBS)
information derived from the remaining 43,863 SNPs using the method-of-moments approach
implemented in PLINK [13]. IBD relationship of each pair of animals was compared with the

2 nd Chapter Calving Ease and Growth QTL in Cattle 24
corresponding pedigree relationship calculated using the PyPedal package [14]. Comparison of the
marker with the pedigree relationship revealed several inconsistencies, most likely resulting from
mislabeling of DNA samples and false relationships. Unresolved inconsistencies led to the
exclusion of 23 animals (Supporting Figure 1). The final set consisted of 1800 animals.
Single marker analysis
Single marker analysis was first carried out without considering population stratification. The
EBVs were regressed on the number of copies of one of the alleles as implemented by the PLINK
--assoc option. Quantile – quantile plots of the expected vs. the observed P values were inspected
for an inflation of small P values indicating false positive association signals due to a structured
population. The genome-wide inflation factor was computed according to Devlin and Roeder [11].
We next applied a PCA - based approach, implemented in the EIGENSOFT 3.0 package [12], for
eliminating false positive association signals due to ancestry differences and resulting population
stratification. One SNP of a pair in LD with r2 > 0.25 was excluded using the PLINK --indep-
pairwise option (500 SNP window, shifted at 50 SNP intervals). A smartpca version of the
EIGENSOFT 3.0 package (compiled from source code with modifications for the bovine
chromosome complement) was ran on the pruned data set consisting of 20,000 autosomal SNPs
with the following option: the value of each marker is replaced with the residuals from a
multivariate regression without intercept on the 5 preceding markers to further reduce redundancies
due to LD. Eigenvalues ( ) and eigenvectors were calculated for all axes of variation. Correlation
of ancestry adjusted EBVs and genotypes was calculated using the previously obtained eigenvectors
with a smarteigenstrat version of EIGENSOFT 3.0 compiled for the bovine chromosome
complement. The resulting test statistic is equal to (N - K - 1) times the squared correlation and χ2 –
distributed, where N is the number of samples and K the number of axes with an eigenvalue that

2 nd Chapter Calving Ease and Growth QTL in Cattle 25
amounts to at least 70% of the mean eigenvalue (Jolliffe's criterion, [15]) used to adjust for ancestry
[12]. Quantile – quantile plots were inspected and the genomic inflation factors were calculated (see
above) to judge the extent of false positive signals. SNPs were considered as significantly
associated for P values below the 5% Bonferroni-corrected type I error threshold for 43,863
independent tests. Allele substitution effects were estimated for each significant marker in a linear
regression model implemented in R (www.r-project.org) with axes of variation with λ ≥ 0.7 as
covariables.
Haplotype analysis
Haplotypes for each chromosome region with significant association signals were reconstructed
using default parameters in fastPHASE [16] and inspected by means of bifurcation plots obtained
with sweep [17] to visualize recombination events and to define the length of haplotypes. The
resulting haplotypes were analyzed for association in a multilinear regression model implemented in
R (see above).
Estimating the power of the genome-wide association study
According to Goddard and Hayes [1] the correlation (r) between marker and trait, r t⋅m , is equal
to rm⋅q⋅r q⋅g⋅r g⋅t , with m representing the marker genotype, q the QTL, g the genotypic value and t
the phenotypic value (EBV) of an animal. rm⋅q2 measures the LD between marker and trait, r q⋅g
2
the variance explained by the QTL and r g⋅t2 the reliability of the EBV. Using this equation and the
formula for the standard error of the correlation coefficient, the number of animals (N) required for
identifying a QTL can be calculated as follows:

2 nd Chapter Calving Ease and Growth QTL in Cattle 26
N = 1−r t⋅m2
r t⋅m1
z 1−
2
where z is the normal score and α the Bonferroni-corrected type I error rate for 43,863 independent
tests. Assuming a reliability of the EBV of 0.9, a LD between marker and QTL of r2 = 0.35 and the
QTL to explain 4% of the genetic variance, the required number of animals amounts to about 1700.
Thus the power of our study with N = 1800 should allow to identify QTL explaining at least 4% of
the genetic variance using EBVs of high reliability.
Annotation and polymorphism analysis of candidate genes
The GENOMETHREADER software tool [18] was used to predict the genomic structure and
localization of the candidate genes based on the University of Maryland UMD3.1 assembly of the
bovine genome sequence [19] and the Dana-Farber Cancer Institute bovine gene index release 12.0
[20] together with the annotated RNA sequences of the UMD3.1 assembly [19]. The
GENOMETHREADER output was viewed and edited using the Apollo sequence annotation editor
[21]. The exons and the promoter regions of the candidate genes were PCR-amplified (the primers
are listed in Supporting Table 2) and re-sequenced in 12 FV bulls with specific genotypes for the
SNP with the most significant signal for the pCE EBV (BTA14 – ARS-BFGL-NGS-104268), i.e. in
one bull with GG and in 11 bulls with AG genotypes.
Genotyping of candidate gene polymorphisms
Genotypes of selected SNPs were determined by TaqMan® genotyping assays (Applied Biosystems
Applera, Darmstadt, Germany). DNA samples were available for 810 FV animals only. Candidate
gene polymorphisms were genotyped in these animals, and the genotypes of the remaining 990
animals of the study population were inferred using the EM algorithm implemented in fastPHASE.
2 nd Chapter Calving Ease and Growth QTL in Cattle 27
Results
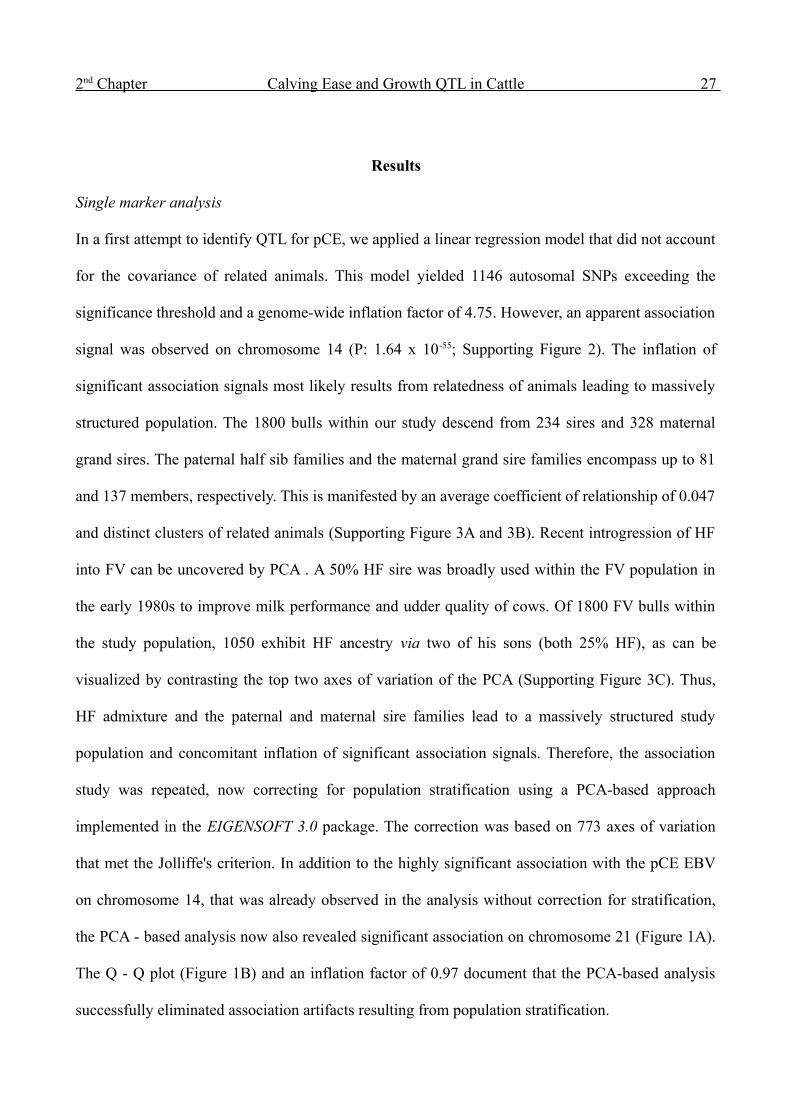
Single marker analysis
In a first attempt to identify QTL for pCE, we applied a linear regression model that did not account
for the covariance of related animals. This model yielded 1146 autosomal SNPs exceeding the
significance threshold and a genome-wide inflation factor of 4.75. However, an apparent association
signal was observed on chromosome 14 (P: 1.64 x 10-55; Supporting Figure 2). The inflation of
significant association signals most likely results from relatedness of animals leading to massively
structured population. The 1800 bulls within our study descend from 234 sires and 328 maternal
grand sires. The paternal half sib families and the maternal grand sire families encompass up to 81
and 137 members, respectively. This is manifested by an average coefficient of relationship of 0.047
and distinct clusters of related animals (Supporting Figure 3A and 3B). Recent introgression of HF
into FV can be uncovered by PCA . A 50% HF sire was broadly used within the FV population in
the early 1980s to improve milk performance and udder quality of cows. Of 1800 FV bulls within
the study population, 1050 exhibit HF ancestry via two of his sons (both 25% HF), as can be
visualized by contrasting the top two axes of variation of the PCA (Supporting Figure 3C). Thus,
HF admixture and the paternal and maternal sire families lead to a massively structured study
population and concomitant inflation of significant association signals. Therefore, the association
study was repeated, now correcting for population stratification using a PCA-based approach
implemented in the EIGENSOFT 3.0 package. The correction was based on 773 axes of variation
that met the Jolliffe's criterion. In addition to the highly significant association with the pCE EBV
on chromosome 14, that was already observed in the analysis without correction for stratification,
the PCA - based analysis now also revealed significant association on chromosome 21 (Figure 1A).
The Q - Q plot (Figure 1B) and an inflation factor of 0.97 document that the PCA-based analysis
successfully eliminated association artifacts resulting from population stratification.

2 nd Chapter Calving Ease and Growth QTL in Cattle 28
Eight SNPs on chromosome 14 and three SNPs on chromosome 21 meet the Bonferroni-corrected
significance threshold (Table 1). Of the eight significant SNPs on chromosome 14, six lie within a
1.4 Mb interval (from 24.06 Mb to 25.4 Mb). Two significant SNPs outside this interval are in LD
(r2 = 0.48 and 0.68) with the most significantly associated SNP on chromosome 14. Three
Figure 1: Association of 43,863 SNPs with the estimated breeding value (EBV) for paternal
calving ease (pCE) in the Fleckvieh breed. (A) Manhattan plot. Red triangles represent SNPs
with P < 1.14 x 10⁻⁶ (Bonferroni corrected significance level). (B) Quantile-quantile plot. The
shaded area represents the 95% concentration band under the null hypothesis of no association. The
open black dots represent the P values of the entire study, open triangles represent SNPs with P < 1
x 10-8. The filled blue dots indicate the P values excluding those from the associated regions on
chromosome 14 and 21.

2 nd Chapter Calving Ease and Growth QTL in Cattle 29
significantly associated SNPs in high LD define a second pCE QTL region on chromosome 21
(2.15 Mb to 2.39 Mb). While the minor allele of the significant SNPs on chromosome 14 has a
negative effect on the pCE EBV, it is the major allele of the significant SNPs on chromosome 21
that lowers the pCE EBV. The most significant SNP on chromosome 14 exhibit an allele
substitution effect of -7.01, corresponding to 58% of the standard deviation of the EBV. The
substitution effect of the major allele of the most significant marker on chromosome 21 is -2.93, i.e.
24% of the standard deviation of the EBV (Figure 2A). pCE is highly correlated with the paternal
stillbirth incidence (pSB) as well as with growth related EBVs such as for DG and BS (Supporting
Table 3). Consequently, association signals can also be observed for these EBVs, particularly on
chromosome 14 (Table 1, Supporting Figure 4). The QTL alleles that lower the pCE and pSB EBVs
have a positive effect on the growth related EBVs. There are several chromosome regions showing
suggestive association (P < 1 x 10⁻³, Supporting Table 4), most prominently a second region on
chromosome 14 with 5 SNPs located between 58.3 and 59.3 Mb.
Haplotype analysis
Haplotype analysis was carried out for the associated regions on chromosome 14 and 21 in an
attempt to delineate the chromosomal segment carrying the pCE QTL. On chromosome 14, the
allele that lowers the pCE EBV could be pinpointed to a specific haplotype that spans 1.58 Mb
(starting at 23.82 Mb) and encompasses 23 SNPs (Table 2). This haplotype version occurs in a
frequency of 10% in the study population. Its negative effect on the pCE EBV (P = 1.56 x 10 -16) is
more prominent than of any of the associated SNPs (-0.66 A vs. -0.62 A , Figure 2B). This is a
strong indication for the causal variant lowering the pCE EBV to exclusively reside on this
haplotype version.

2 nd Chapter Calving Ease and Growth QTL in Cattle 30
On chromosome 21, the associated SNPs are contained within a haplotype spanning 0.6 Mb
(starting at 1.78 Mb). The most frequent haplotype version occurs in a frequency of 66% and has a
negative effect on the pCE EBV (P = 3.15 x 10⁻⁷). However it explains less of the genetic variance
than the most significant SNP does (-0.18 A vs. -0.24 A ).
Figure 2: Effect of the most significantly associated markers on the estimated breeding
value (EBV) for paternal calving ease (pCE) in the Fleckvieh breed. The boxplots show the
effects of the most significantly associated SNPs (A) and haplotypes (B) on chromosome 14 and
21 separately and combined. The solid line represents the population mean, the dotted lines
indicate one standard deviation of the EBV.
2 nd Chapter Calving Ease and Growth QTL in Cattle 31
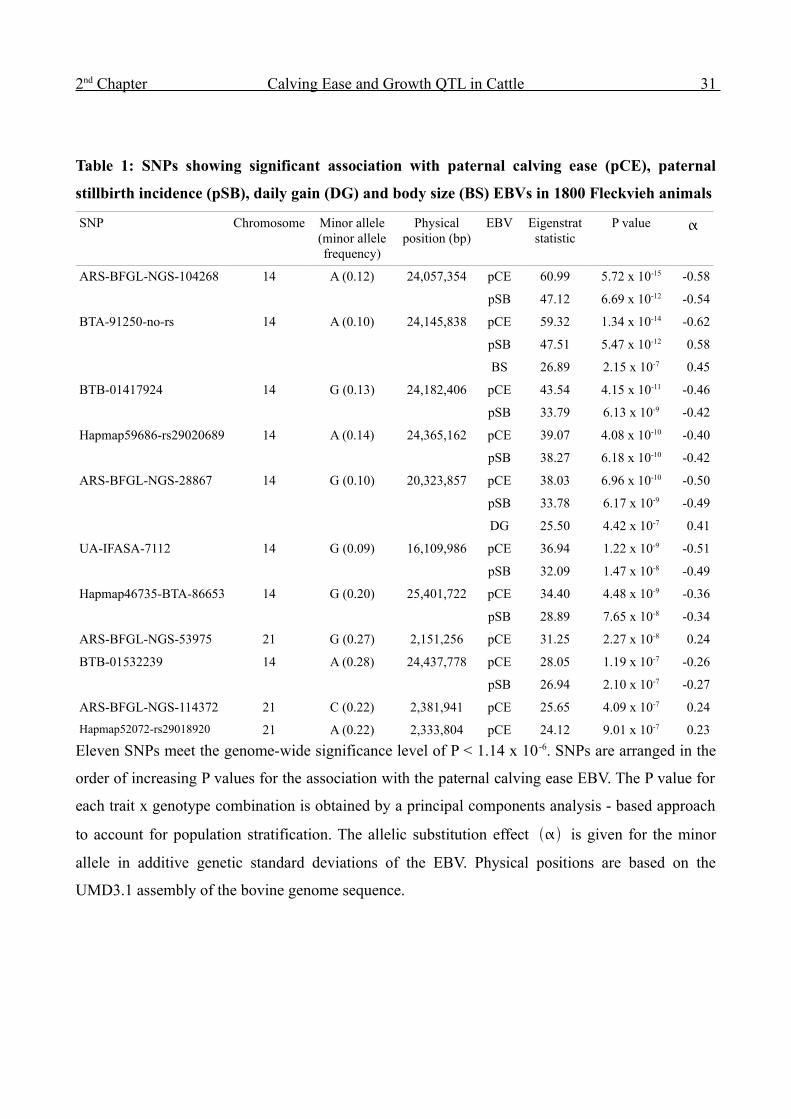
Table 1: SNPs showing significant association with paternal calving ease (pCE), paternal
stillbirth incidence (pSB), daily gain (DG) and body size (BS) EBVs in 1800 Fleckvieh animals
SNP Chromosome Minor allele (minor allele frequency)
Physical position (bp)
EBV Eigenstrat statistic
P value
ARS-BFGL-NGS-104268 14 A (0.12) 24,057,354 pCE 60.99 5.72 x 10⁻¹⁵ -0.58
pSB 47.12 6.69 x 10⁻¹² -0.54
BTA-91250-no-rs 14 A (0.10) 24,145,838 pCE 59.32 1.34 x 10⁻¹⁴ -0.62
pSB 47.51 5.47 x 10⁻¹² 0.58
BS 26.89 2.15 x 10⁻⁷ 0.45
BTB-01417924 14 G (0.13) 24,182,406 pCE 43.54 4.15 x 10⁻¹¹ -0.46
pSB 33.79 6.13 x 10⁻⁹ -0.42
Hapmap59686-rs29020689 14 A (0.14) 24,365,162 pCE 39.07 4.08 x 10⁻¹⁰ -0.40
pSB 38.27 6.18 x 10⁻¹⁰ -0.42
ARS-BFGL-NGS-28867 14 G (0.10) 20,323,857 pCE 38.03 6.96 x 10⁻¹⁰ -0.50
pSB 33.78 6.17 x 10⁻⁹ -0.49
DG 25.50 4.42 x 10⁻⁷ 0.41
UA-IFASA-7112 14 G (0.09) 16,109,986 pCE 36.94 1.22 x 10⁻⁹ -0.51
pSB 32.09 1.47 x 10⁻⁸ -0.49
Hapmap46735-BTA-86653 14 G (0.20) 25,401,722 pCE 34.40 4.48 x 10⁻⁹ -0.36
pSB 28.89 7.65 x 10⁻⁸ -0.34
ARS-BFGL-NGS-53975 21 G (0.27) 2,151,256 pCE 31.25 2.27 x 10⁻⁸ 0.24
BTB-01532239 14 A (0.28) 24,437,778 pCE 28.05 1.19 x 10⁻⁷ -0.26
pSB 26.94 2.10 x 10⁻⁷ -0.27
ARS-BFGL-NGS-114372 21 C (0.22) 2,381,941 pCE 25.65 4.09 x 10⁻⁷ 0.24
Hapmap52072-rs29018920 21 A (0.22) 2,333,804 pCE 24.12 9.01 x 10⁻⁷ 0.23
Eleven SNPs meet the genome-wide significance level of P < 1.14 x 10 -6. SNPs are arranged in the
order of increasing P values for the association with the paternal calving ease EBV. The P value for
each trait x genotype combination is obtained by a principal components analysis - based approach
to account for population stratification. The allelic substitution effect is given for the minor
allele in additive genetic standard deviations of the EBV. Physical positions are based on the
UMD3.1 assembly of the bovine genome sequence.

2 nd Chapter Calving Ease and Growth QTL in Cattle 32
Table 2: SNPs within the haplotype associated with the estimated breeding value (EBV) for
paternal calving ease (pCE) on bovine chromosome 14
SNP Physical position
(bp)
Haplotype allele
Minor allele (allele
frequency)
Eigenstrat statistic
P value
BTB-01953819 23,817,572 A G (0.26) 0.37 0.54 0.03
Hapmap45796-BTA-25271 23,853,811 T A (0.07) 5.39 0.02 -0.18
ss250608741 * 23,884,989 G A (0.09) 1.06 0.3 0.06
ARS-BFGL-BAC-8052 23,893,220 G A (0.01) 6.72 9.55 x 10⁻³ -0.45
ARS-BFGL-NGS-97821 23,946,436 G A (0.1) 0.98 0.32 0.07
ARS-BFGL-NGS-104268 24,057,354 A A (0.12) 61.00 5.71 x 10⁻¹⁵ -0.58
BTA-91250-no-rs 24,145,838 A A (0.1) 59.32 1.34 x 10⁻¹⁴ -0.62
BTB-01417924 24,182,406 G G (0.13) 43.54 4.15 x 10⁻¹¹ -0.46
ARS-BFGL-NGS-110427 24,326,513 A G (0.11) 0.02 0.89 -0.01
Hapmap59686-rs29020689 24,365,162 A A (0.14) 36.94 1.22 x 10⁻⁹ -0.40
ARS-BFGL-NGS-102351 24,407,125 G G (0.25) 18.34 1.85 x 10⁻⁵ -0.21
BTB-01532239 24,437,778 A A (0.28) 28.04 1.19 x 10⁻⁷ -0.26
BTB-01530788 24,524,205 A G (0.34) 8.65 3.27 x 10⁻³ 0.12
BTB-01530836 24,573,257 G A (0.35) 4.30 0.04 0.07
BTB-00557585 24,607,527 A G (0.35) 4.75 0.04 0.08
BTB-00557532 24,643,266 A G (0.35) 4.53 0.03 0.07
ss250608762 * 24,759,177 G T (0.01) 1.00 0.32 -0.14
Hapmap40120-BTA-34288 24,787,245 C A (0.09) 0.28 0.6 -0.05
ss250608721 * 24,954,981 A A (0.16) 58.57 1.96 x 10⁻¹⁴ -0.47
ss250608720 * 24,955,318 T C (0.32) 3.56 0.06 0.06
Hapmap41234-BTA-34285 25,107,556 G A (0.04) 13.89 1.94 x 10⁻⁴ -0.42
BTB-02056709 25,175,950 A G (0.18) 2.55 0.11 -0.08
BTB-00559128 25,215,027 A G (0.21) 0.01 0.92 0.00
BTB-00557354 25,254,540 G A (0.12) 1.63 0.2 0.09
Hapmap46986-BTA-34282 25,307,116 A G (0.46) 9.62 1.93 x 10⁻³ 0.13
BTB-01779799 25,351,733 G A (0.44) 19.00 1.30 x 10⁻⁵ 0.19
Hapmap46735-BTA-86653 25,401,722 G G (0.2) 34.40 4.48 x 10⁻⁹ -0.36
23 SNPs belong to the BovineSNP50 Bead chip collection and 4 additional SNPs designated by *
result from re-sequencing. The P values were obtained by using a principal components analysis -
based approach.. Genotypes for SNPs resulting from re-sequencing were determined in 810 animals
and imputed for the remaining 990 animals of the study population. The allelic substitution effect
is given for the minor allele in additive genetic standard deviations of the pCE EBV. SNPs are
arranged according to their physical position (UMD3.1 assembly of the bovine genome sequence).

2 nd Chapter Calving Ease and Growth QTL in Cattle 33
Identification and analysis of candidate genes
The assessment of the transcriptional content of the pCE EBV associated regions was based on the
UMD3.1 assembly and annotation of the bovine genome [19]. The 23.82 – 25.40 Mb interval on
chromosome 14 encompasses 13 transcripts / genes (Figure 3A). The associated region on bovine
chromosome 14 is conserved in human chromosome 8q21 which has been shown to be associated
with adult height [22]. Since adult stature is positively correlated with fetal size and fetal size is an
important determinant of the birthing process, we considered PLAG1, MOS, CHCHD7, RDHE2
(alias: SDR16C5), RPS20, LYN, TGS1, PENK, as proposed by Gudbjartsson [22] as positional and
functional candidate genes for the pCE QTL in cattle. Of this list, PLAG1, TGS1, RPS20 and LYN
together with SOX17, another gene in the critical region that we considered a functional candidate,
were re-sequenced in a panel of 12 animals of our study population. Totally, we screened 30.3 kb
resulting in the detection of 48 polymorphisms (Supporting Table 5). We decided to genotype four
putatively functional SNPs, located in SOX17 (ss250608762), RPS20 (ss250608720, ss250608721)
and TGS1 (ss250608741), in 810 animals and analyzed the association with the pCE EBV in the
complete study population using genotype imputation (Figure 3B & 3C). Only ss250608721
produced a highly significant signal (P = 1.96 x 10⁻¹⁴). The polymorphism affects a polyadenylation
signal of a cistron encompassing the genes for the ribosomal protein S20 (RPS20, a ribosomal
component) and the small nucleolar RNA U54 (SNORD54, a ribosomal RNA modifying RNA)
(Figure 4).
2 nd Chapter Calving Ease and Growth QTL in Cattle 34
The association signals on chromosome 21 result from the most proximal region on the
chromosome (Supporting Figure 5). The region contains, among other transcripts, those encoding
SNURF-SNRPN and UBE3A. These two transcripts are encoded in the human chromosome interval
15q11-15q13 that is subject to imprinting. The lack of a functional paternal copy of 15q11-15q13
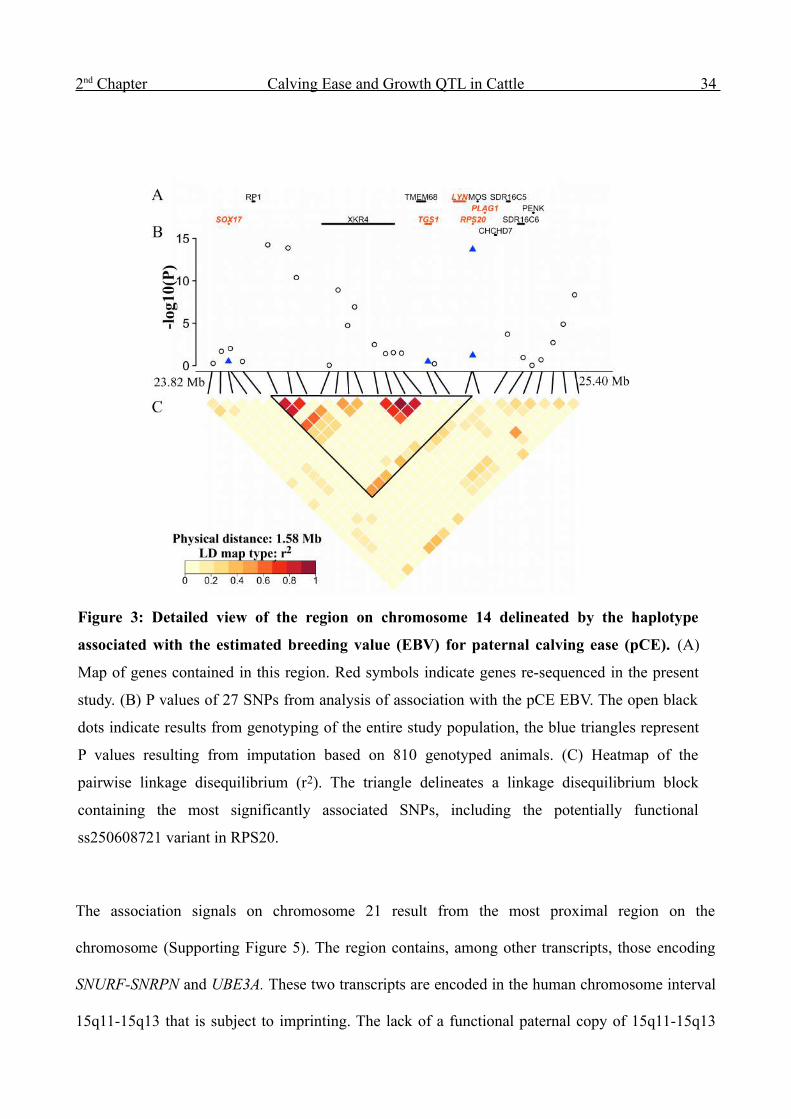
Figure 3: Detailed view of the region on chromosome 14 delineated by the haplotype
associated with the estimated breeding value (EBV) for paternal calving ease (pCE). (A)
Map of genes contained in this region. Red symbols indicate genes re-sequenced in the present
study. (B) P values of 27 SNPs from analysis of association with the pCE EBV. The open black
dots indicate results from genotyping of the entire study population, the blue triangles represent
P values resulting from imputation based on 810 genotyped animals. (C) Heatmap of the
pairwise linkage disequilibrium (r2). The triangle delineates a linkage disequilibrium block
containing the most significantly associated SNPs, including the potentially functional
ss250608721 variant in RPS20.
2 nd Chapter Calving Ease and Growth QTL in Cattle 35
causes the Prader-Willi syndrome, while the lack of a functional maternal copy of UBE3A is
implicated in the Angelman syndrome [23]. The SNURF-SNRPN mRNA is derived from a single
large transcriptional unit of which more than 70 snoRNAs of the C/D box type are processed [24].
Preliminary BLAST-analyses indicate the presence of a snoRNA cluster in the proximal region of
bovine chromosome 21. However, a systematic annotation has not been attempted. The lack of
detailed knowledge of the genomic organization, the imprinting status and transcriptional content of
the associated region on chromosome 21 precluded the analysis of candidate genes, although a
functional implication of the region in fetal growth and thus pCE seems obvious when considering
that fetal growth retardation is symptomatic for the Prader-Willi syndrome.
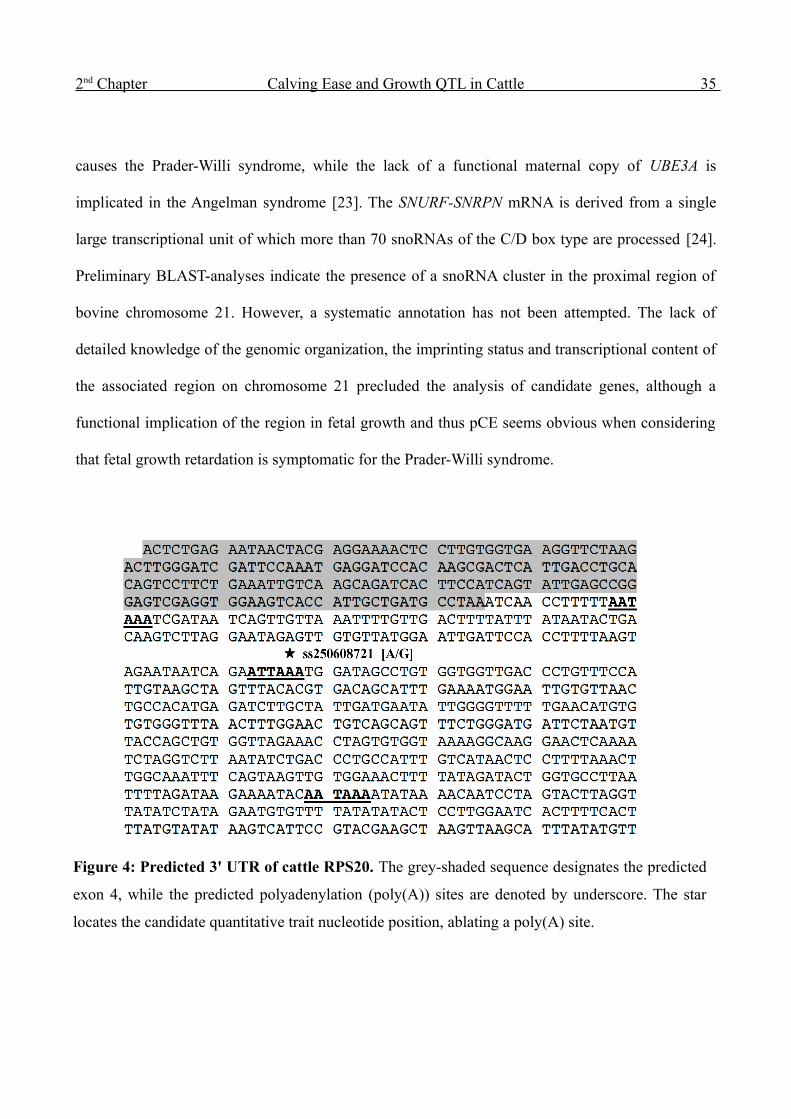
Figure 4: Predicted 3' UTR of cattle RPS20. The grey-shaded sequence designates the predicted
exon 4, while the predicted polyadenylation (poly(A)) sites are denoted by underscore. The star
locates the candidate quantitative trait nucleotide position, ablating a poly(A) site.

2 nd Chapter Calving Ease and Growth QTL in Cattle 36
Discussion
Our genome-wide association study based on a dense SNP marker map provides strong evidence for
two QTL on chromosome 14 and 21, respectively, that together explain at least 10% of the variation
of the pCE EBV in the German FV breed. The two QTL also explain a substantial fraction of the
pSB EBV as well as of EBVs of postnatal growth such as DG and BS. Stillbirth can be considered
as the dichotomic manifestation of the calving ease score, as dystocia is a major cause of perinatal
mortality. The correlation of pCE with growth-related traits and the coincident QTL point to fetal
growth and the resulting birth weight as major determinant for the ease of delivery ([25],[26]).
Thus, the two QTL might primarily affect fetal growth. One could expect that they would explain a
larger fraction of the genetic variation of birth weight, a trait that is not routinely measured in dairy
cattle. Improving postnatal growth along with lactation traits is a major breeding objective of the
FV breed. This dual purpose selection is likely to act on the two QTL identified in our study.
Animals known to carry favorable alleles for the chromosome 14 and 21 QTL could now be more
stringently selected with regard to beef traits. However, the identification of QTL that either affect
prenatal or postnatal growth but not both would facilitate to efficiently improve postnatal beef
performance without antagonistically compromising calving ease. In any case, conventional
selection schemes seem to allow favorable selection responses for calving ease and postnatal
growth despite the genetic antagonism ([27],[28],[29]).
A key factor for successfully mapping of a QTL for a complex trait with very low heritability such
as pCE was the use of reliably estimated breeding values for calving traits. If one assumes a
heritability of 0.08, a LD between marker SNPs and QTL of r2 = 0.35 and 4% of the genetic
variation explained by the QTL, one would require approximately 20,000 individuals for the
successful identification of a QTL (see Material and Methods). Using EBVs with a reliability of

2 nd Chapter Calving Ease and Growth QTL in Cattle 37
90%, i.e. a quasi heritability of 0.9, requires less than 1800 animals to detect association. Breeding
values are routinely estimated for many traits and are thus indispensable for dissecting complex trait
variation in livestock species.
Another key factor for successfully mapping the two QTL was careful correction for extensive
relationship among the study animals. The adjustment along 773 axes of variation allowed to
account for major as well as for more subtle relationships that can possibly not be revealed by
pedigree analyses. The association signal on chromosome 21 became apparent only when
population structure was corrected for. Thus, PCA based elimination of false positive association
signals might enable the detection of QTL with a smaller impact on the trait variation that would
otherwise be “buried” in the false positive signals. Suggestive signals (P < 1 x 10 -3, Supporting
Table 4) are thus more likely to represent real QTL.
Our findings about two highly significant QTL for pCE as well as about additional suggestive QTL
are supported by several previous studies on calving ease and growth trait QTL, based on
microsatellite marker analyses. Kneeland et al. [30] identified three regions on chromosome 14 to
affect birth weight in a composite breed. The proximal region from 26.0 to 26.7 cM most likely
corresponds to the highly significant QTL region identified in our study, the more distal region
between 36.2 and 46.2 cM may corroborate a suggestive QTL region resulting from our study.
Davis et al. [31] also identified a QTL affecting birth weight at 42 cM. Koshkoih et al. [32] provide
additional evidence for two birth weight QTL on chromosome 14 at 26 and 50 cM, respectively, in a
cross of Limousin and Jersey animals. Maltecca et al. [33] recently identified a birth weight QTL at
19 cM on chromosome 14 in a Jersey – Holstein cross. There are also reports on QTL for
postnatally measured growth traits in Wagyu ([34],[35]) and a Jersey – Limousin cross [36],
indirectly supporting our suggestive evidence for a secondary pCE QTL on chromosome 14. Casas

2 nd Chapter Calving Ease and Growth QTL in Cattle 38
et al. [37] and Davis et al. [31] identified a QTL for birth weight in the very proximal region of
chromosome 21 in crosses of Brahman with Hereford and Charolais, respectively, providing
supportive evidence for the pCE QTL identified in the present study.
There is also support in the literature for suggestive QTL on other chromosomes: Olsen et al. [38]
and Holmberg and Andersson-Ecklund [39] identified in a Swedish and Norwegian dairy cattle
population, respectively, a dystocia / stillbirth QTL at 36 – 37 cM on chromosome 6. We observe a
suggestive pCE QTL at about 40 Mb on chromosome 6. Gutierrez-Gil et al. [40] identified a fetal
growth / birth weight QTL in the same region based on a Charolais – Holstein cross. Eberlein et al.
[41] provide evidence for the gene (NCAPG) encoding the Non-SMC Condensin I Complex,
Subunit G to encompass this QTL, also based on a Charolais – Holstein cross. However, a
prominent calving ease QTL in the Holstein breed on chromosome 18 [2] could not be detected in
the present study or is not segregating in the Fleckvieh breed.
A preliminary candidate gene analysis identified a highly significantly pCE-associated SNP in a
cistron encoding a ribosomal protein (RPS20) and a internally nested small nucleolar RNA
(SNORD54). The SNP affects a polyadenylation site. Alternative polyadenylation at tandem poly(A)
sites yield transcripts with different 3' UTR sequences providing the potential of differential
regulation of mRNA expression by RNA binding proteins and / or miRNAs ([42],[43]). The marker
allele causing the gain of an upstream polyadenylation signal is associated with a lower pCE EBV,
i.e. a higher incidence of calving difficulties. This is hypothetically compatible with a shorter and
more highly expressed mRNA encoding ribosomal components, leading to a higher ribosome
assembly rate and concomitantly stronger fetal growth. Thus we consider the polymorphism as a
candidate quantitative trait nucleotide (QTN) position. Interestingly, the pCE QTL on BTA21 is also
in a chromosome region encoding factors involved in ribosomal assembly, specifically small
2 nd Chapter Calving Ease and Growth QTL in Cattle 39
nucleolar RNAs (snoRNAs). It is therefore possible that both QTL affect ribosomal biogenesis.
Mutation disturbing ribosome assemblies are often associated with abnormal fetal growth ([44],
[45]).
Acknowledgements
This study is part of the project FUGATO-plus GenoTrack and was financially supported by the
German Ministry of Education and Research, BMBF (grants 0315134A and 0315134D), the
Förderverein Biotechnologieforschung e.V. (FBF), Bonn, and Lohmann Tierzucht GmbH,
Cuxhaven.
References
1. Goddard ME, Hayes BJ (2009) Mapping genes for complex traits in domestic animals and their use in breeding programmes. Nat Rev Genet 10: 381-391.
2. Cole JB, VanRaden PM, O’Connell JR, Van Tassell CP, Sonstegard TS, Schnabel RD, et al. (2009) Distribution and location of genetic effects for dairy traits. Journal of Dairy Science 92: 2931-2946.
3. Barendse W, Reverter A, Bunch RJ, Harrison BE, Barris W, Thomas MB (2007) A Validated Whole-Genome Association Study of Efficient Food Conversion in Cattle. Genetics 176: 1893-1905.
4. Daetwyler HD, Schenkel FS, Sargolzaei M, Robinson JAB (2008) A Genome Scan to Detect Quantitative Trait Loci for Economically Important Traits in Holstein Cattle Using Two Methods and a Dense Single Nucleotide Polymorphism Map. J. Dairy Sci. 91: 3225-3236.
5. Manolio TA, Collins FS, Cox NJ, Goldstein DB, Hindorff LA, Hunter DJ, et al. (2009) Finding the missing heritability of complex diseases. Nature 461: 747-753.
6. Steinbock L, Nasholm A, Berglund B, Johansson K, Philipsson J (2003) Genetic Effects on Stillbirth and Calving Difficulty in Swedish Holsteins at First and Second Calving. J. Dairy Sci. 86: 2228-2235.
7. Lin HK, Oltenacu PA, Van Vleck LD, Erb HN, Smith RD (1989) Heritabilities of and genetic correlations among six health problems in Holstein cows. Journal of Dairy Science 72: 180-186.
8. Seidenspinner T, Bennewitz J, Reinhardt F, Thaller G (2009) Need for sharp phenotypes in QTL detection for calving traits in dairy cattle. Journal of Animal Breeding and Genetics =

2 nd Chapter Calving Ease and Growth QTL in Cattle 40
Zeitschrift Für Tierzüchtung Und Züchtungsbiologie 126: 455-462.
9. Van Tassell CP, Wiggans GR, Misztal I (2003) Implementation of a Sire-Maternal Grandsire Model for Evaluation of Calving Ease in the United States. J. Dairy Sci. 86: 3366-3373.
10. Freer B (2008) Easy calving - not so difficult. Hereford Breed Journal 2008: 176 - 177.
11. Devlin B, Roeder K (1999) Genomic control for association studies. Biometrics 55: 997-1004.
12. Price AL, Patterson NJ, Plenge RM, Weinblatt ME, Shadick NA, Reich D (2006) Principal components analysis corrects for stratification in genome-wide association studies. Nat Genet 38: 904-909.
13. Purcell S, Neale B, Todd-Brown K, Thomas L, Ferreira MAR, Bender D, et al. (2007) PLINK: a tool set for whole-genome association and population-based linkage analyses. American Journal of Human Genetics 81: 559-575.
14. Cole J (2007) PyPedal: A computer program for pedigree analysis. Computers and Electronics in Agriculture 57: 107-113.
15. Jolliffe IT (2002) Principal Component Analysis. 2nd ed. Springer, Berlin; 2002.
16. Scheet P, Stephens M (2006) A fast and flexible statistical model for large-scale population genotype data: applications to inferring missing genotypes and haplotypic phase. American Journal of Human Genetics 78: 629-644.
17. Sabeti PC, Reich DE, Higgins JM, Levine HZP, Richter DJ, Schaffner SF, et al. (2002) Detecting recent positive selection in the human genome from haplotype structure. Nature 419: 832-837.
18. Gremme G, Brendel V, Sparks ME, Kurtz S (2005) Engineering a software tool for gene structure prediction in higher organisms. Information and Software Technology 47: 965-978.
19. Zimin AV, Delcher AL, Florea L, Kelley DR, Schatz MC, Puiu D, et al. (2009) A whole-genome assembly of the domestic cow, Bos taurus. Genome Biology 10: R42-R42.
20. Quackenbush J, Cho J, Lee D, Liang F, Holt I, Karamycheva S, et al. (2001) The TIGR Gene Indices: analysis of gene transcript sequences in highly sampled eukaryotic species. Nucleic Acids Research 29: 159 -164.
21. Lewis SE, Searle SMJ, Harris N, Gibson M, Lyer V, Richter J, et al. (2002) Apollo: a sequence annotation editor. Genome Biology 3: RESEARCH0082.
22. Gudbjartsson DF, Walters GB, Thorleifsson G, Stefansson H, Halldorsson BV, Zusmanovich P, et al. (2008) Many sequence variants affecting diversity of adult human height. Nat Genet 40: 609-615.
23. Horsthemke B, Wagstaff J (2008) Mechanisms of imprinting of the Prader-Willi/Angelman region. American Journal of Medical Genetics. Part A 146A: 2041-2052.
2 nd Chapter Calving Ease and Growth QTL in Cattle 41
24. Bachellerie J-P, Cavaillé J, Hüttenhofer A (2002) The expanding snoRNA world. Biochimie 84: 775-790.
25. Meijering A (1984) Dystocia and stillbirth in cattle - A review of causes, relations and implications. Livestock Production Science 11: 143-177.
26. Johanson JM, Berger PJ (2003) Birth Weight as a Predictor of Calving Ease and Perinatal Mortality in Holstein Cattle. J. Dairy Sci. 86: 3745-3755.
27. MacNeil MD (2003) Genetic evaluation of an index of birth weight and yearling weight to improve efficiency of beef production. Journal of Animal Science 81: 2425-2433.
28. Bennett GL (2008) Experimental selection for calving ease and postnatal growth in seven cattle populations. I. Changes in estimated breeding values. Journal of Animal Science 86: 2093-2102.
29. Bennett GL, Thallman RM, Snelling WM, Kuehn LA (2008) Experimental selection for calving ease and postnatal growth in seven cattle populations. II. Phenotypic differences. J. Anim Sci. 86: 2103-2114.
30. Kneeland J, Li C, Basarab J, Snelling WM, Benkel B, Murdoch B, et al. (2004) Identification and fine mapping of quantitative trait loci for growth traits on bovine chromosomes 2, 6, 14, 19, 21, and 23 within one commercial line of Bos taurus. Journal of Animal Science 82: 3405-3414.
31. Davis GP, Hetzel DJS, Corbet NJ, Scacheri S, Lowden S, Renaud J, et al. (1998) The mapping of Quantitative Trait Loci for birth weight in a tropical beef herd. Proceedings 6th World Congress on Genetics Applied to Livestock Production Armidale Australia 441-444.
32. Koshkoih A, Pitchford WS, Bottema CDK, Verbyla AP, Gilmour AR (2006) Mapping multiple QTL for birth weight in cattle using a mixedl model approach. Proceedings of the 8th World Congress on Genetics Applied to Livestock Production 13-18 August, 2006 1-4.
33. Maltecca C, Weigel KA, Khatib H, Cowan M, Bagnato A (2009) Whole-genome scan for quantitative trait loci associated with birth weight, gestation length and passive immune transfer in a Holstein x Jersey crossbred population. Animal Genetics 40: 27-34.
34. Mizoshita K, Watanabe T, Hayashi H, Kubota C, Yamakuchi H, Todoroki J, et al. (2004) Quantitative trait loci analysis for growth and carcass traits in a half-sib family of purebred Japanese Black (Wagyu) cattle. Journal of Animal Science 82: 3415-3420.
35. Takasuga A, Watanabe T, Mizoguchi Y, Hirano T, Ihara N, Takano A, et al. (2007) Identification of bovine QTL for growth and carcass traits in Japanese Black cattle by replication and identical-by-descent mapping. Mammalian Genome 18: 125-136.
36. Morris CA, Pitchford WS, Cullen NG, Hickey SM, Hyndman DL, Crawford AM, et al. (2002) Additive effects of two growth QTL on cattle chromosome 14. 7th World Congress on Genetics Applied to Livestock Production, August 19-23, 2002, Montpellier, France 494-494.
37. Casas E, Shackelford SD, Keele JW, Koohmaraie M, Smith TPL, Stone RT (2003) Detection
2 nd Chapter Calving Ease and Growth QTL in Cattle 42
of quantitative trait loci for growth and carcass composition in cattle. Journal of Animal Science 81: 2976-2983.
38. Olsen HG, Hayes BJ, Kent MP, Nome T, Svendsen M, Lien S (2010) A genome wide association study for QTL affecting direct and maternal effects of stillbirth and dystocia in cattle. Animal Genetics 41: 273-280.
39. Holmberg M, Andersson-Eklund L (2006) Quantitative trait loci affecting fertility and calving traits in Swedish dairy cattle. Journal of Dairy Science 89: 3664-3671.
40. Gutierrez-Gil B, Williams JL, Homer D, Burton D, Haley CS, Wiener P (2009) Search for quantitative trait loci affecting growth and carcass traits in a cross population of beef and dairy cattle. J. Anim Sci. 87: 24-36.
41. Eberlein A, Takasuga A, Setoguchi K, Pfuhl R, Flisikowski K, Fries R, et al. (2009) Dissection of Genetic Factors Modulating Fetal Growth in Cattle Indicates a Substantial Role of the Non-SMC Condensin I Complex, Subunit G (NCAPG) Gene. Genetics 183: 951-964.
42. Sandberg R, Neilson JR, Sarma A, Sharp PA, Burge CB (2008) Proliferating Cells Express mRNAs with Shortened 3’ Untranslated Regions and Fewer MicroRNA Target Sites. Science 320: 1643 -1647.
43. Licatalosi DD, Darnell RB (2010) RNA processing and its regulation: global insights into biological networks. Nat Rev Genet 11: 75-87.
44. Freed EF, Bleichert F, Dutca LM, Baserga SJ (2010) When ribosomes go bad: diseases of ribosome biogenesis. Molecular bioSystems 6: 481-493.
45. Lempiäinen H, Shore D (2009) Growth control and ribosome biogenesis. Current Opinion in Cell Biology 21: 855-863.

2 nd Chapter Calving Ease and Growth QTL in Cattle - Supporting information 43
Supporting information for the
2nd Chapter

2 nd Chapter Calving Ease and Growth QTL in Cattle - Supporting information 44
Supporting Table 1: Characteristics of the considered estimated breeding values (EBVs) of 1800
Fleckvieh bulls
EBV Mean ( ) Standard deviation ( )
Mean reliability (
r 2 )
Daily gain (DG) 101.07 11.68 0.92
Paternal calving ease (pCE) 101.09 10.07 0.92
Paternal stillbirth incidence (pSB) 100.55 9.39 0.83
Body size (BS) 100.86 9.97 0.90
Supporting Table 2: Primers used for the re-sequencing of bovine LYN, PLAG1, RPS20, SOX17
and TGS1 genes
Gene Primer_id Region Direction Sequence
LYN 6964 PROM forward GGCCAGTACTTTGCATGTGA
6965 EX1 reverse ATTACGCAGCCATGTTTTGA
6966 EX2 forward GCTCTGCAGGACTGTTCCTC
6967 EX2 reverse GATGGAGAGATGGACGGATG
6968 EX3 forward GAACAGGGAAGGTGAACGAA
6969 EX3 reverse GGCAGCACAGATGGATAAGG
6970 EX4 forward CCCATGGTATGCAGGATCTTA
6971 EX5 reverse TCACTTGGCTGTAAAGCTGAAA
6972 EX6 forward AGGGCCATGTTGTTTATCCA
6973 EX6 reverse ATGGACTGTAGCCCACCAAG
7010 EX6 forward CCCCATAATGCCAATCTTGT
7011 EX6 reverse TGATCCTGCAACTTTATCCAAA
6974 EX7 forward CTTGGCGAGTTGGAAATGAT
6975 EX7 reverse CTGGAAGAGGGCATGACAAC
6976 EX8 forward CCAGGGAAGTCCCTAAAGGT
6977 EX8 reverse TTCTCCAGGCAAGAATACCG
7006 EX8 forward TCCCTTCTTTTCCCTCCCTA
7007 EX8 reverse CGAGCCTGCTGTTGATAGTCT
6978 EX9 forward GTCAAAGGGGACAGGTCAGA
6979 EX9 reverse GGGGTAGACAGGGAAGGAAA
6980 EX10 forward GAAAAGCTGGGACAATGACG
6981 EX10 reverse TGCCTGTTGTAATCGCTTTG
6982 EX11 forward TCCTTCTCCAGGGGATCTTT
6983 EX11 reverse GAGGAGCCCTGTGTCTTGTC

2 nd Chapter Calving Ease and Growth QTL in Cattle - Supporting information 45
7012 EX11 forward CCGCAAAGAAGGAAAGTGTG
7013 EX11 reverse GACAAGAAGGCGGAGAAGTG
6984 EX12 forward CTTGGGGCTAGGTCTTCAGT
6985 3'UTR reverse TCTGCGACTCACTGAAATGG
PLAG1 6986 PROM forward TTCTCTGGGCCTCTCACTTT
6987 EX1 reverse AGCTTCTCCGATGACAGGTT
6988 EX2 forward GGATCTCAGGGGATCTGTGA
6989 EX2 reverse GCGGAAAGAGGTGGATACAA
6990 EX3 forward GGTCTGCGGTGTTTAGGTGT
6991 EX3 reverse GGAGGAGTTCGTCCTTGATG
6992 EX3 forward GCACATGAAGAAGAGCCACA
6993 EX3 reverse CCGTGGGACTCTACTGGAAA
6994 EX3 forward AGGAGGAGGCACACTCTTCA
6995 3'UTR reverse CAGCAAACATTTGAGCCAGA
RPS20 6996 PROM forward TGCAGATGACACCACCCTTA
6997 PROM reverse CGGAGTTCACCCAAACTCAT
7016 PROM forward AGATGGGCATACCAGACCAC
7017 PROM reverse GGCCAAGTAATGTCTCTGCTTT
6998 EX1 forward ACCTCATGCGAAGAGCTGAC
7014 EX1 reverse CCTTACGCCTTCCTCTTTGA
6999 EX2 forward CCTGGAGGCATCTCATAAGC
7015 EX2 reverse AACACGGCACACACCAAGT
7000 EX3 forward CAGGGAATGGGCTTATGAGA
7001 EX3 reverse GCCAAAGCTCCAGATGTTTC
7002 EX4 forward CCGGTTGCTTTTAAACATGG
7003 3'UTR reverse TGAGTTCCTTGCCTTTTACCA
SOX17 7138 PROM forward GTTGGCTGATGTTTGGTGTG
7139 PROM reverse CAGGTCCCAAGTTTCAGCTC
7413 PROM forward CCAAGCATCGAAACACAAAA
7414 PROM reverse GGTGTCTCTCCACCCCCTAC
7415 PROM forward TCCATCCTATGCATCCTGTG
7416 PROM reverse TGGCCAAAAAGTGGTTGTAG
7417 PROM forward TGAATCTCAGAGACCCAGGAA
7418 PROM reverse TTCGAGAGGCCTTCTTTGTG
7419 PROM forward GGGCAAGGTCCTTAACGTCT
7420 PROM reverse ACTCAACCTGGAGCTGAGGA
7140 EX1 forward TTTTCTTAGGGGCAGGTGTC
7141 EX1 reverse ACTCACCCAGCATCTTGCTC
7532 EX1 forward TGAGCTGAAACTTGGGACCT
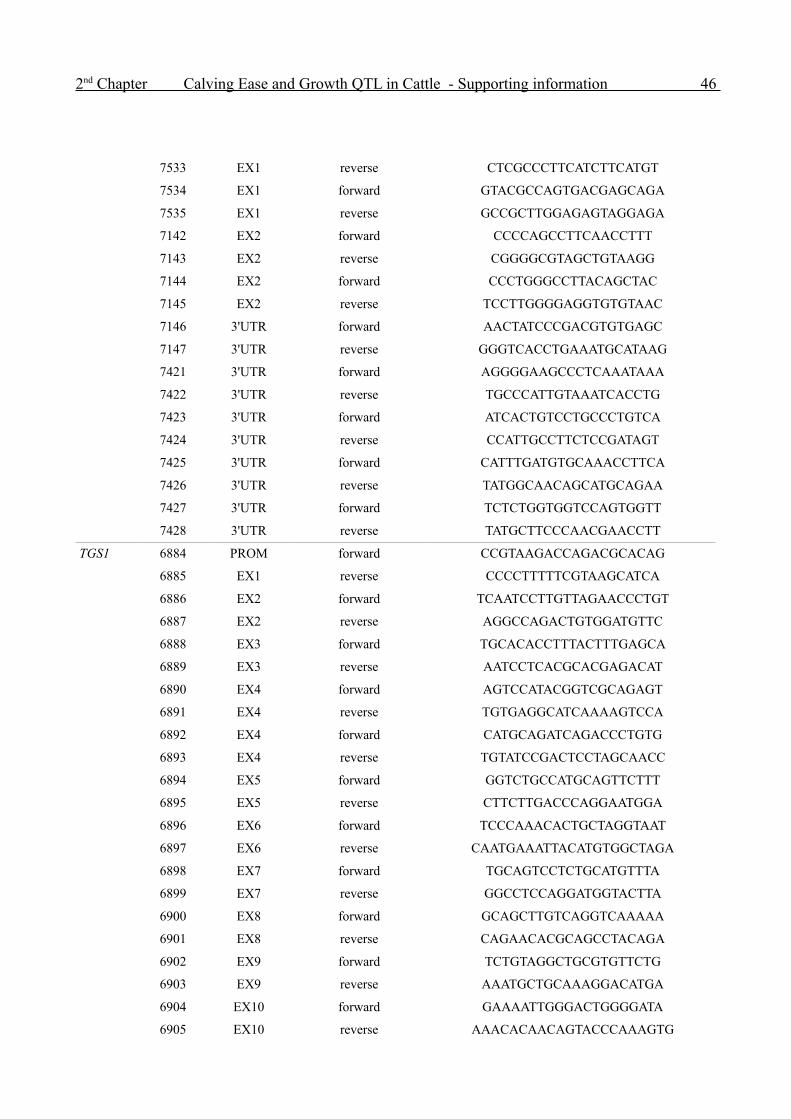
2 nd Chapter Calving Ease and Growth QTL in Cattle - Supporting information 46
7533 EX1 reverse CTCGCCCTTCATCTTCATGT
7534 EX1 forward GTACGCCAGTGACGAGCAGA
7535 EX1 reverse GCCGCTTGGAGAGTAGGAGA
7142 EX2 forward CCCCAGCCTTCAACCTTT
7143 EX2 reverse CGGGGCGTAGCTGTAAGG
7144 EX2 forward CCCTGGGCCTTACAGCTAC
7145 EX2 reverse TCCTTGGGGAGGTGTGTAAC
7146 3'UTR forward AACTATCCCGACGTGTGAGC
7147 3'UTR reverse GGGTCACCTGAAATGCATAAG
7421 3'UTR forward AGGGGAAGCCCTCAAATAAA
7422 3'UTR reverse TGCCCATTGTAAATCACCTG
7423 3'UTR forward ATCACTGTCCTGCCCTGTCA
7424 3'UTR reverse CCATTGCCTTCTCCGATAGT
7425 3'UTR forward CATTTGATGTGCAAACCTTCA
7426 3'UTR reverse TATGGCAACAGCATGCAGAA
7427 3'UTR forward TCTCTGGTGGTCCAGTGGTT
7428 3'UTR reverse TATGCTTCCCAACGAACCTT
TGS1 6884 PROM forward CCGTAAGACCAGACGCACAG
6885 EX1 reverse CCCCTTTTTCGTAAGCATCA
6886 EX2 forward TCAATCCTTGTTAGAACCCTGT
6887 EX2 reverse AGGCCAGACTGTGGATGTTC
6888 EX3 forward TGCACACCTTTACTTTGAGCA
6889 EX3 reverse AATCCTCACGCACGAGACAT
6890 EX4 forward AGTCCATACGGTCGCAGAGT
6891 EX4 reverse TGTGAGGCATCAAAAGTCCA
6892 EX4 forward CATGCAGATCAGACCCTGTG
6893 EX4 reverse TGTATCCGACTCCTAGCAACC
6894 EX5 forward GGTCTGCCATGCAGTTCTTT
6895 EX5 reverse CTTCTTGACCCAGGAATGGA
6896 EX6 forward TCCCAAACACTGCTAGGTAAT
6897 EX6 reverse CAATGAAATTACATGTGGCTAGA
6898 EX7 forward TGCAGTCCTCTGCATGTTTA
6899 EX7 reverse GGCCTCCAGGATGGTACTTA
6900 EX8 forward GCAGCTTGTCAGGTCAAAAA
6901 EX8 reverse CAGAACACGCAGCCTACAGA
6902 EX9 forward TCTGTAGGCTGCGTGTTCTG
6903 EX9 reverse AAATGCTGCAAAGGACATGA
6904 EX10 forward GAAAATTGGGACTGGGGATA
6905 EX10 reverse AAACACAACAGTACCCAAAGTG

2 nd Chapter Calving Ease and Growth QTL in Cattle - Supporting information 47
6906 EX11 forward CTGCTCAGAAGATGCAGTCG
6907 EX11 reverse CCAGGAACAGGTTCTGAGGA
6908 EX12 forward AGGAACCTGGAGGGCTAGAG
6909 EX12 reverse GCTATGTCAGGTGTGCAGGA
6910 EX13 forward TGAACATTTGAGATGCCTCATT
6911 3'UTR reverse GCCAAAGCCATGTTTTGTTT
Supporting Table 3: Correlation between the estimated breeding values EBVs for daily gain (DG),
paternal calving ease (pCE), paternal stillbirth incidence (pSB) and body size (BS) of 1800 animals
pCE pSB BS
DG -0.21 -0.18 0.39
pCE 0.86 -0.36
pSB -0.23
Supporting Table 4: SNPs showing suggestive associations (1.14 x 10⁻⁶ < P <1 x 10⁻³) with the
estimated breeding value (EBV) for paternal calving ease (pCE)
SNP Chromosome
Minor allele and MAF
Physical position (BP)
Trait Eigenstrat statistic
P value
ARS-BFGL-NGS-93455 1 A (0.24) 109,649,036 pCE 12.10 5.10 x 10⁻⁴ 0.17
BTA-49059-no-rs 2 A (0.02) 112,990,834 pCE 12.04 5.22 x 10⁻⁴ 0.47
ARS-BFGL-NGS-19373 4 G (0.4) 119,924,805 pCE 16.18 5.75 x 10⁻⁵ 0.18
ARS-BFGL-NGS-32612 5 A (0.42) 110,671,789 pCE 11.49 7.00 x 10⁻⁴ 0.15
ARS-BFGL-NGS-13748 5 A (0.42) 110,704,158 pCE 11.32 7.66 x 10⁻⁴ 0.15
Hapmap26308-BTC-057761 6 G (0.22) 38,576,012 pCE 11.81 5.91 x 10⁻⁴ 0.18
BTB-00251059 6 G (0.06) 42,190,501 pCE 15.09 1.02 x 10⁻⁴ 0.35
Hapmap47224-BTA-24614 6 G (0.44) 43,303,952 pCE 11.29 7.81 x 10⁻⁴ -0.15
Hapmap23217-BTA-152007 7 A (0.42) 28,940,286 pCE 10.94 9.40 x 10⁻⁴ -0.17
ARS-BFGL-NGS-104767 10 A (0.17) 1,361,856 pCE 11.14 8.45 x 10⁻⁴ -0.21
BTA-70225-no-rs 10 G (0.39) 56,285,758 pCE 12.75 3.57 x 10⁻⁴ -0.16
ARS-BFGL-NGS-55539 10 A (0.31) 58,488,593 pCE 10.86 9.82 x 10⁻⁴ 0.18
BTB-01518485 14 G (0.14) 58,203,661 pCE 13.40 2.52 x 10⁻⁴ 0.26

2 nd Chapter Calving Ease and Growth QTL in Cattle - Supporting information 48
BTB-01518486 14 A (0.1) 58,262,807 pCE 15.33 9.03 x 10⁻⁵ 0.28
BTB-01289984 14 G (0.2) 58,491,253 pCE 13.79 2.04 x 10⁻⁴ 0.18
BTB-00574555 14 A (0.1) 59,225,067 pCE 13.78 2.05 x 10⁻⁴ 0.28
UA-IFASA-7897 14 A (0.12) 59,280,392 pCE 16.96 3.81 x 10⁻⁵ 0.29
ARS-BFGL-NGS-27017 15 A (0.18) 57,333,896 pCE 12.54 3.97 x 10⁻⁴ 0.20
ARS-BFGL-NGS-94657 17 G (0.47) 74,234,279 pCE 13.48 2.42 x 10⁻⁴ -0.13
UA-IFASA-6850 17 G (0.34) 74,256,192 pCE 11.51 6.91 x 10⁻⁴ -0.13
Hapmap51998-BTA-43053 18 G (0.27) 36,985,552 pCE 11.15 8.39 x 10⁻⁴ -0.17
BTB-01393816 20 A (0.21) 2,754,521 pCE 11.62 6.52 x 10⁻⁴ -0.19
Hapmap40409-BTA-26097 20 G (0.27) 11,576,011 pCE 16.28 5.47 x 10⁻⁵ 0.21
ARS-BFGL-NGS-42400 24 A (0.47) 47,413,118 pCE 11.90 5.61 x 10⁻⁴ 0.15
BTB-01710538 25 G (0.1) 29,635,262 pCE 10.98 9.23 x 10⁻⁴ 0.23
BTB-00920322 26 C (0.47) 3,930,593 pCE 16.33 5.33 x 10⁻⁵ -0.14
ARS-BFGL-NGS-16336 26 A (0.35) 34,398,368 pCE 11.92 5.54 x 10⁻⁴ -0.59
Hapmap42269-BTA-61597 26 A (0.29) 41,041,883 pCE 15.80 7.06 x 10⁻⁵ -0.42
UA-IFASA-6120 29 G (0.27) 37,014,709 pCE 13.38 2.54 x 10⁻⁴ -0.19
ARS-BFGL-NGS-104213 29 G (0.02) 37,152,168 pCE 15.64 7.68 x 10⁻⁵ -0.59
Supporting Table 5: Characterization of the PLAG1, RPS20, LYN, SOX17 and TGS1
polymorphisms. The * indicates SNPs that were genotyped in 810 animals of the study population.
Gene SNP_ID Localization SNP AminoAcid
PLAG1 ss250608717 INT2 AT
ss250608718 PROM CT
RPS20 ss250608719 EX3 CT G42
ss250608720* INT3 CT
ss250608721* 3'UTR AG
ss250608722 3'UTR AG
ss250608723 PROM AC
ss250608724 PROM AG
ss250608725 PROM AG
ss250608726 PROM CG
LYN ss250608727 INT11 CG
ss250608728 INT11 CT

2 nd Chapter Calving Ease and Growth QTL in Cattle - Supporting information 49
ss250608729 EX12 CT T454
ss250608730 EX12 AG T489
ss250608731 3'UTR CT
ss250608732 INT10 CT
ss250608733 INT4 CT
ss250608734 INT5 AG
ss250608735 INT1 AG
ss250608736 INT2 GT
ss250608737 INT11 AG
ss250608738 EX6 CT G177
ss250608739 EX6 CT S205
SOX17 ss250608740 3'END AG
ss250608741* EX1 AG A50T
TGS1 ss250608742 EX3 CT S90
ss250608743 INT3 CT
ss250608744 INT3 AT
ss250608745 EX4 CT S297T
ss250608746 INT4 CT
ss250608747 INT2 AG
ss250608748 INT5 CT
ss250608749 INT6 AG
ss250608750 INT6 AG
ss250608751 INT6 CT
ss250608752 3'UTR CG
ss250608753 INT11 GT
ss250608754 INT12 INS T
ss250608755 INT10 CG
ss250608756 EX9 DEL GAA K626-
ss250608757 INT10 GT
ss250608758 INT7 CT
ss250608759 EX11 AT I733
ss250608760 EX11 CT V758
ss250608761 EX8 AG P561
ss250608762* EX8 GT P594S
ss250608763 INT8 CT
ss250608764 PROM CG

2 nd Chapter Calving Ease and Growth QTL in Cattle - Supporting information 50
Supporting Figure 1: Pairwise pedigree vs. IBD relationship for 1823 Fleckvieh bulls before (A)
and after (B) the exclusion of 23 animals with inconsistencies.
Supporting Figure 2: Manhattan plot for association of 43863 SNPs with the estimated breeding
value (EBV) for paternal calving ease (pCE) without considering population stratification.
The red dots represent SNPs with P < 1.14 x 10⁻⁶ (Bonferroni corrected significance level).

2 nd Chapter Calving Ease and Growth QTL in Cattle - Supporting information 51
Supporting Figure 3: Population stratification within the study population.
(A) Distribution of the coefficients of relationship of 1800 Fleckvieh animals. (B) Heatmap of the
coefficients of relationship presents cluster of related individuals. (C) Plot of the first two
eigenvectors visualizing recent introgression of Holstein-Friesian into the Fleckvieh breed (through
RENNER or RADI, both 25% HF) and resulting stratification.

2 nd Chapter Calving Ease and Growth QTL in Cattle - Supporting information 52
Supporting Figure 4: Manhattan plots and corresponding Quantile-quantile plots for association of
43863 SNPs with the expected breeding value for paternal stillbirth incidence (A), body size (B)
and daily gain (C) after correction for population stratification.
The red dots represent SNPs with P < 1.14 x 10⁻⁶ (Bonferroni corrected significance level). The 95%
concentration band under the null hypothesis of no association is indicated by the shaded area in the
QQ plots. The black symbols represent the P values of the entire study (triangles represent SNPs
with P < 1 x 10⁻⁸). The blue dots indicate the P values excluding those from the associated regions
on chromosome 14.

2 nd Chapter Calving Ease and Growth QTL in Cattle - Supporting information 53
Supporting Figure 5: Detailed view of the region on chromosome 21 delineated by the haplotype
associated with the estimated breeding value (EBV) for paternal calving ease (pCE).
(A) Map of genes contained in this region. (B) P values of 20 SNPs from analysis of association
with the pCE – EBV in 1800 Fleckvieh animals. (C) Heatmap of the pairwise linkage
disequilibrium (r2).

3rd Chapter
Genome-wide association study uncovers four QTL predisposing to
supernumerary teats in cattle
Hubert Pausch*, Simone Jung*, Christian Edel§, Reiner Emmerling§, Kay-Uwe Götz§,
Ruedi Fries*
* Lehrstuhl fuer Tierzucht, Technische Universitaet Muenchen, 85354 Freising, Germany
§ Institut fuer Tierzucht, Bayerische Landesanstalt für Landwirtschaft, 85586 Poing,
Germany
published in Animal Genetics 43(6): 689–695

3 rd Chapter Supernumerary Teats in Cattle 55
Summary
Supernumerary teats (hyperthelia, SNTs) are a common abnormality of the bovine udder with a
medium to high heritability and a postulated oligogenic or polygenic inheritance pattern. SNTs not
only negatively affect machine milking ability but also act as a reservoir for bacteria. A genome-
wide association study was carried out in order to identify genes involved in the development of
SNTs in the dual-purpose Fleckvieh breed. 2467 progeny-tested bulls were genotyped at 43,698
SNPs and daughter yield deviations (DYDs) for “udder clearness” (UC) were used as high-
heritability phenotypes. Massive structuring of the study population was accounted for by principal
components analysis-based and mixed model-based approaches. Four loci on BTA5, BTA6, BTA11
and BTA17 were significantly associated with the UC DYD. Three associated regions contain genes
of the highly conserved Wnt signalling pathway. The four QTL totally account for 10.7% of the
variance of the UC DYD while the major fraction of the DYD variance is attributable to
chromosomes with no identified QTL. Our results support both an oligogenic and a polygenic
inheritance pattern of SNTs in cattle. The identified candidate genes permit insights in the genetic
architecture of teat malformations in cattle and provide clues to unravel the molecular mechanisms
of mammary gland alterations in cattle and other species.
Introduction
Supernumerary teats (hyperthelia, SNTs) represent a common abnormality of the bovine udder.
SNTs negatively affect machine milking ability, especially if SNTs are connected to lactating
mammary glands ([1],[2]). SNTs may be positioned at the rear udder (caudal), between the normal
front and rear teats (intercalary) or as appendix of normal teats (ramal). Caudal SNTs are the most
frequent abnormality [3]. More than 40% of the cows of the Fleckvieh (FV) breed exhibit SNTs [2].
Other breeds are affected to a lesser degree, e.g., 31% of Brown Swiss cows and 15% of Holstein
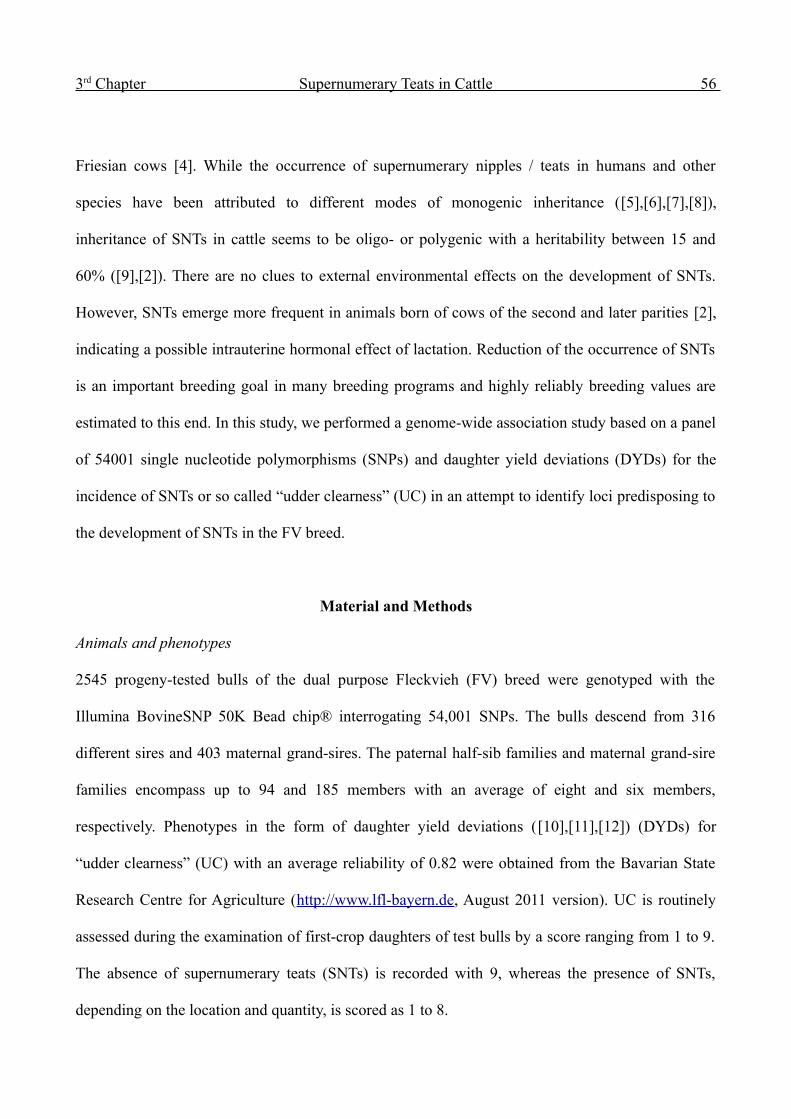
3 rd Chapter Supernumerary Teats in Cattle 56
Friesian cows [4]. While the occurrence of supernumerary nipples / teats in humans and other
species have been attributed to different modes of monogenic inheritance ([5],[6],[7],[8]),
inheritance of SNTs in cattle seems to be oligo- or polygenic with a heritability between 15 and
60% ([9],[2]). There are no clues to external environmental effects on the development of SNTs.
However, SNTs emerge more frequent in animals born of cows of the second and later parities [2],
indicating a possible intrauterine hormonal effect of lactation. Reduction of the occurrence of SNTs
is an important breeding goal in many breeding programs and highly reliably breeding values are
estimated to this end. In this study, we performed a genome-wide association study based on a panel
of 54001 single nucleotide polymorphisms (SNPs) and daughter yield deviations (DYDs) for the
incidence of SNTs or so called “udder clearness” (UC) in an attempt to identify loci predisposing to
the development of SNTs in the FV breed.
Material and Methods
Animals and phenotypes
2545 progeny-tested bulls of the dual purpose Fleckvieh (FV) breed were genotyped with the
Illumina BovineSNP 50K Bead chip® interrogating 54,001 SNPs. The bulls descend from 316
different sires and 403 maternal grand-sires. The paternal half-sib families and maternal grand-sire
families encompass up to 94 and 185 members with an average of eight and six members,
respectively. Phenotypes in the form of daughter yield deviations ([10],[11],[12]) (DYDs) for
“udder clearness” (UC) with an average reliability of 0.82 were obtained from the Bavarian State
Research Centre for Agriculture (http://www.lfl-bayern.de, August 2011 version). UC is routinely
assessed during the examination of first-crop daughters of test bulls by a score ranging from 1 to 9.
The absence of supernumerary teats (SNTs) is recorded with 9, whereas the presence of SNTs,
depending on the location and quantity, is scored as 1 to 8.
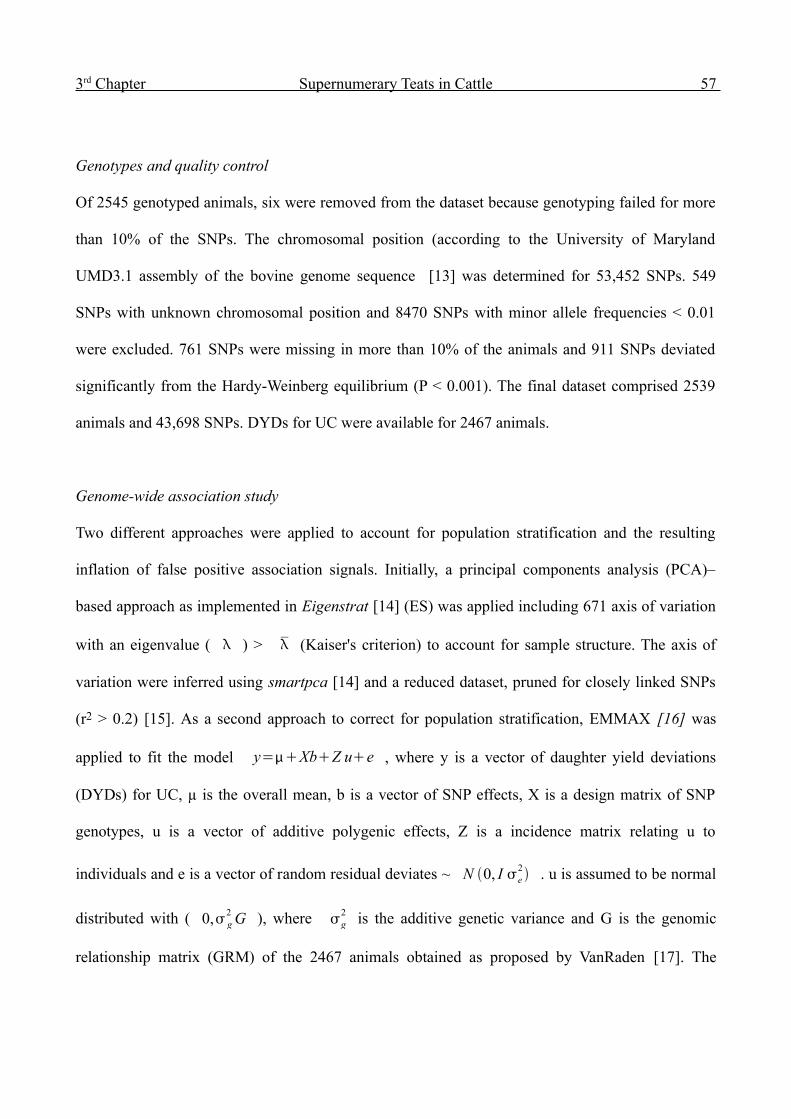
3 rd Chapter Supernumerary Teats in Cattle 57
Genotypes and quality control
Of 2545 genotyped animals, six were removed from the dataset because genotyping failed for more
than 10% of the SNPs. The chromosomal position (according to the University of Maryland
UMD3.1 assembly of the bovine genome sequence [13] was determined for 53,452 SNPs. 549
SNPs with unknown chromosomal position and 8470 SNPs with minor allele frequencies < 0.01
were excluded. 761 SNPs were missing in more than 10% of the animals and 911 SNPs deviated
significantly from the Hardy-Weinberg equilibrium (P < 0.001). The final dataset comprised 2539
animals and 43,698 SNPs. DYDs for UC were available for 2467 animals.
Genome-wide association study
Two different approaches were applied to account for population stratification and the resulting
inflation of false positive association signals. Initially, a principal components analysis (PCA)–
based approach as implemented in Eigenstrat [14] (ES) was applied including 671 axis of variation
with an eigenvalue ( ) > (Kaiser's criterion) to account for sample structure. The axis of
variation were inferred using smartpca [14] and a reduced dataset, pruned for closely linked SNPs
(r2 > 0.2) [15]. As a second approach to correct for population stratification, EMMAX [16] was
applied to fit the model y=XbZ ue , where y is a vector of daughter yield deviations
(DYDs) for UC, µ is the overall mean, b is a vector of SNP effects, X is a design matrix of SNP
genotypes, u is a vector of additive polygenic effects, Z is a incidence matrix relating u to
individuals and e is a vector of random residual deviates ~ N 0, I e2 . u is assumed to be normal
distributed with ( 0, g2 G ), where g
2 is the additive genetic variance and G is the genomic
relationship matrix (GRM) of the 2467 animals obtained as proposed by VanRaden [17]. The

3 rd Chapter Supernumerary Teats in Cattle 58
genomic inflation factor was calculated according to Devlin and Roeder [18] and SNPs with P <
1.14 x 10⁻⁶ (Bonferroni-corrected significance level) in either of the models were considered as
significantly associated.
Partitioning of the genetic variance onto particular chromosomes
In order to partitioning the DYD variance onto different chromosomes and QTL, a GRM was built
(see above) for the 30 chromosomes and four QTL separately. The GRM for each of the four
identified QTL was built based on SNPs within a 5 Mb interval surrounding the most significantly
associated SNP. All other SNPs except those within the 5 Mb interval were used to build the GRM
for the chromosome harbouring the QTL. We applied GCTA [19] to fit the model y=∑i=1
34
g i+e ,
where y is a vector of DYDs for UC, g is a vector of genetic effects attributed to the i th
chromosome / QTL, and e is a vector of random residual deviates. g i is assumed to be normal
distributed with N 0,G i gi2 , where Gi is the GRM built using SNPs of the ith chromosome /
QTL. Variance components were estimated with the effects of all chromosomes / QTL fitted
simultaneously. The proportion of variance attributable to the ith chromosome / QTL was calculated
as σi2/ (∑
j=1
34
σ j2+σe
2) .

3 rd Chapter Supernumerary Teats in Cattle 59
Results
Association study
Five SNPs delimitating three QTL regions on BTA5, BTA11 and BTA17 met the genome-wide
threshold of significance of P < 1.14 x 10⁻⁶ after PCA-based correction of population structure
(Figure 1A). The successful elimination of false positive association signals is evidenced by a
genomic inflation factor of 1.01. The characteristics of the significantly associated SNPs are listed
in Table 1.
The mixed model-based approach yielded an inflation factor of 0.99 and six significantly associated
SNPs within four QTL regions on BTA5, BTA6, BTA11 and BTA17, among them ARS-BFGL-
NGS-10494 on BTA6, which did not meet the threshold of significance with the PCA-based model
(Table 1)(Figure 1B).
Table 1: Significantly associated SNPs with the daughter yield deviation for “udder clearness”
in 2467 Fleckvieh animals
Chromosome SNP-id Physical position (Basepairs)
SNT-predisposing allele and allele frequency
P (PCA – based model)
P (Mixed model)
Neighboring genes
5 ARS-BFGL-NGS-26008
163,482 A (0.65) 4.78 x 10⁻⁷ 2.38 x 10⁻⁷ LOC783893, LOC783966, LOC782348BTB-01498763 186,792 A (0.65) 6.52 x 10⁻⁷ 3.69 x 10⁻⁷
6 ARS-BFGL-NGS-10494
18,961,422 G (0.59) 1.41 x 10⁻⁵ 1.89 x 10⁻⁸ LEF1, DKK2
11 BTA-16600-no-rs 11,612,663 A (0.20) 1.67 x 10⁻⁷ 7.72 x 10⁻¹¹ EXOC6B
BTB-02007301 11,754,597 A (0.18) 1.90 x 10⁻⁷ 1.96 x 10⁻¹¹
17 Hapmap49912-BTA-21169
62,783,598 A (0.56) 7.10 x 10⁻¹⁰ 8.57 x 10-10 TBX3, TBX5, RBM19
Six SNPs located on four different chromosomes meet the genome-wide significance threshold of P
< 1.14 x 10⁻⁶. The P values are given for the PCA-based as well as for the mixed model-based
approach to account for population stratification. The bold typed letters indicate genome-wide
significance. The SNPs are arranged according to their physical position, based on the UMD3.1
assembly of the bovine genome sequence.
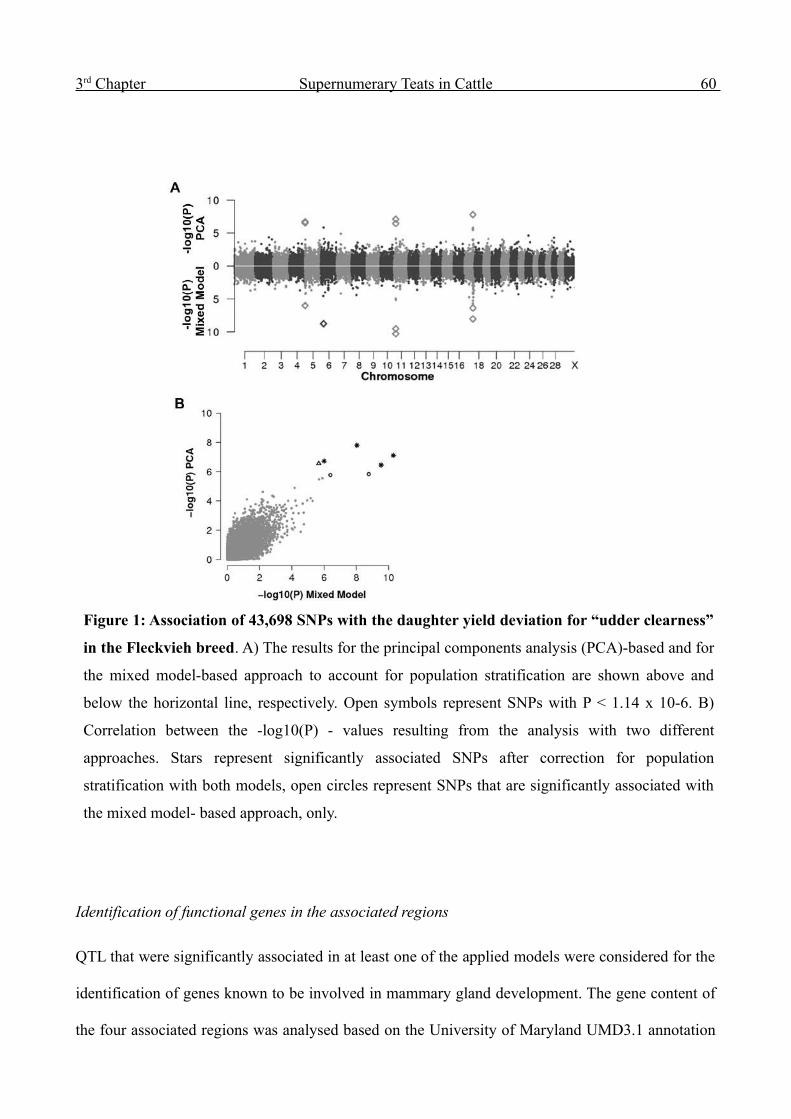
3 rd Chapter Supernumerary Teats in Cattle 60
Identification of functional genes in the associated regions
QTL that were significantly associated in at least one of the applied models were considered for the
identification of genes known to be involved in mammary gland development. The gene content of
the four associated regions was analysed based on the University of Maryland UMD3.1 annotation
Figure 1: Association of 43,698 SNPs with the daughter yield deviation for “udder clearness”
in the Fleckvieh breed. A) The results for the principal components analysis (PCA)-based and for
the mixed model-based approach to account for population stratification are shown above and
below the horizontal line, respectively. Open symbols represent SNPs with P < 1.14 x 10⁻⁶. B)
Correlation between the -log10(P) - values resulting from the analysis with two different
approaches. Stars represent significantly associated SNPs after correction for population
stratification with both models, open circles represent SNPs that are significantly associated with
the mixed model- based approach, only.

3 rd Chapter Supernumerary Teats in Cattle 61
[13]. The BTA5 region contains a cluster of sequences (LOC783893, LOC783966) similar to genes
encoding ankyrin repeat domain containing proteins that are known to be involved in Wnt signalling
[20], as well as frizzled-3 (LOC782348), a gene encoding a transmembrane receptor required for the
activation of Wnt signalling [21]. The associated region on BTA6 contains the lymphoid enhancer
binding factor 1 encoding gene (LEF1) and the dickkopf homolog 2 encoding gene (DKK2). LEF1
mediated Wnt signalling is required for the morphogenesis of the mammary gland during
embryogenesis [22], while DKK2 acts as an inhibitor of the canonical Wnt signalling [23]. Two
members of the T-Box transcription factor gene family, TBX3 and TBX5 and the RNA binding motif
protein 19 encoding gene RBM19 are in the associated region on BTA17. TBX3 is regulated as
downstream target of Wnt signalling [24]. Two associated SNPs on BTA11 are located in introns of
the exocyst complex component 6B encoding gene EXOC6B. The protein encoded by EXOC6B
belongs to the network for the generation of the apical surface and lumen during gland formation
[25].
Assessing the impact of the four QTL
Alleles lowering the DYD for UC can be considered as alleles that are predisposing to SNTs. We
determined the SNTs-predisposing allele for the most significantly associated SNP for each of the
four identified QTL regions. Figure 2 presents the frequency distribution of animals with an
increasing number of SNTs-predisposing alleles (from 0 to 8). The DYD for UC decreases nearly
linearly from 0.73 (0 alleles) to -0.22 (7 alleles) with an increasing number of predisposing alleles.
Animals with 8 SNTs-predisposing alleles were not considered due to the low number of
observations (n=4). Fitting a linear regression model yielded an average substitution effect of -0.14
DYD points for each SNTs-predisposing allele, corresponding to −0.19σ of the UC DYD.

3 rd Chapter Supernumerary Teats in Cattle 62
Proportion of variance explained by each chromosome
Genomic relationship matrices for the 2467 animals were built for each chromosome / QTL
separately in order to partitioning the genetic variance onto different chromosomes. The proportion
of the DYD variance attributable to a particular chromosome / QTL was then estimated with the
effects of all chromosomes / QTL fitted simultaneously. Totally, the 43,698 SNPs account for
52.27% of the DYD variance. The contribution of particular chromosomes varies strongly (Figure
3). A major fraction of the DYD variance is attributable to BTA5 (6.90%), BTA11 (4.94%), BTA6
(4.83%) and BTA17 (3.94%) the four chromosomes harbouring significantly associated SNPs for
the UC DYD. Interestingly, a large fraction of the DYD variance results from BTA6, although
Figure 2: The combined impact of the four identified QTL on BTA5, BTA6, BTA11 and
BTA17 on the daughter yield deviation for “udder clearness” in the Fleckvieh breed. 2467
Fleckvieh animals are grouped according to the number of alleles that predispose to supernumerary
teats (SNTs). Black symbols represent the median daughter yield deviation (DYD) for “udder
clearness” (UC) for each group. The black line is a linear regression line through these points,
whereas the black dotted line represents the population mean. The grey bars indicate the number of
animals with an increasing number of the SNTs-predisposing alleles.

3 rd Chapter Supernumerary Teats in Cattle 63
association analysis with PCA-based correction of population structure did not reveal significantly
associated SNPs on this chromosome. The major fraction of the DYD variance on BTA6, BTA11
and BTA17 is attributed to the identified QTL, whereas the QTL on BTA5 accounts only for a
minor fraction of the chromosomal variance.
Discussion
We carried out an association study with a medium-sized sample of 2467 progeny-tested Fleckvieh
bulls and a dense set of 43,698 genome-wide distributed SNPs. This enabled the detection of four
QTL predisposing to supernumerary teats in cows. We accounted for the massively structured study
Figure 3: Partitioning of the DYD variance onto 30 chromosomes and four identified QTL.
The grey shaded bars indicate the fraction of DYD variance attributed to a particular chromosome
and the corresponding standard error. The dark grey bars represent the fraction of DYD variance
attributed to each of the four identified QTL regions. The black triangles represent the cumulative
proportion of DYD variance explained.

3 rd Chapter Supernumerary Teats in Cattle 64
population by using a mixed model-based and a PCA-based approach. Both approaches have
already been successfully applied to identifying QTL in highly structured cattle populations (e.g.
[26],[27]). The PCA–based approach allowed for the identification of three QTL on BTA5, BTA11
and BTA17 for UC. The mixed model-based approach uncovered an additional QTL on BTA6.
However, the P value of the corresponding SNP derived from the PCA-based approach is only
slightly above the threshold of significance. Different treatment of the effective genomic
relationship among the animals seems to be the major reason for the different P values. A subset of
671 principal components was extracted to represent the relatedness between animals with the
PCA-based model, while the entire SNP information was incorporated in the genomic relationship
matrix for the mixed model. The mixed model-based approach leads to a better sensitivity at
maximum specificity as manifested by a unity inflation factor.
The four identified QTL can be considered as the major determinants for the development of SNTs
in the FV breed since the four QTL account for 10.71% of the DYD variance. However, the largest
proportion of the DYD variance is attributable to chromosomes with no identified QTL. BTA20,
e.g., with no identified QTL, explains nearly 2.4% of the DYD variance. Thus the genetic
architecture of the UC DYD is characterized by a large number of genes with small effects and only
few genes with major effects, as it is typical for many complex quantitative traits [28]. These
findings agree with an oligogenic / polygenic inheritance pattern for SNTs as proposed by Brka [2].
However, one must be aware of the complexity of the phenotype in the present study. Breeding
value estimation for UC is carried out based on scoring the locations and shapes of SNTs. More
specific phenotypes with regard to the positions of SNTs, i.e. caudal, intercalary or ramal, might
allow for the detection of distinct QTL for different types of SNTs. It is well known, that distinct
signalling pathways are essential for the development of specific mammary placodes [29].

3 rd Chapter Supernumerary Teats in Cattle 65
The candidate genes identified in the QTL regions indicate the highly conserved Wnt / ß-catenin
signalling pathway as the major determinant for the development of SNTs in cattle. Wnt signalling
not only initiates the development of the embryonic mammary gland [30], but also induces
mammary placode formation via TBX3 expression [31]. Mutations resulting in a loss of function of
TBX3 have been shown to cause the ulnar mammary syndrome (UMS) in humans and mice, for
which both supernumerary as well as aplastic nipples and mammary glands are characteristic ([32],
[33],[34]). In cattle, the genomic region on chromosome 17 encompassing TBX3 is associated with
absent teats in Japanese Black cattle [35], supporting our findings of a QTL for mammary gland
morphology on BTA17.
The appearance of SNTs ranges from rudimentary buds to fully developed teats. Discontinuous Wnt
signalling via LEF1 leads to underdeveloped mammary placodes [36], resulting in rudimentary teats
and teat malformations. The prevention of malformations of the mammary gland such as inverted
teats is a major objective of swine breeding. Polymorphisms within the coding region of LEF1 have
already been shown to be associated with the occurrence of inverted teats in swine [37]. The
candidate genes resulting from the present study may therefore provide clues for identifying
molecular alterations leading to teat abnormalities even in other species than cattle.
DKK2, a second functional candidate in the associated region on BTA6, is in close vicinity to LEF1.
Possibly, both genes DKK2 and LEF1 are involved in the development of SNTs in cattle. DKK2 acts
as an antagonist of the Wnt signalling pathway and locally down-regulates Wnt signalling during
normal eye development, whereas a lack of DKK2 expression results in an increased ectopic
activity of the Wnt signalling [38]. An increased activity of the Wnt signalling pathway results in the
formation of ectopic placode-like structures [39]. An analogous mechanism was reported for
frizzled 3, a functional candidate in the BTA5 QTL-region. frizzled 3 acts as a transmembrane

3 rd Chapter Supernumerary Teats in Cattle 66
receptor for Wnt proteins and activates the canonical Wnt signalling pathway [40]. Over-expression
of frizzled-3 was shown to result in ectopic eye development [41]. Similar interactions of DKK2 and
frizzled 3 with Wnt signalling during embryonic mammary gland development are plausible, as
SNTs can be considered as ectopic features of the mammary gland.
EXOC6B, located in the QTL region of BTA11 is another functional candidate gene for teat
morphology and function. Its product is an exocyst component and may therefore affect lumen
formation ([25],[42]) in supernumerary teats. Variants of this gene may predispose to lactating
SNTs, which are particularly undesirable.
As primiparous cows are not lactating during pregnancy, the hormonal environment of the fetus
differs for the first vs. later parities. Pregnancy and lactation result in distinct hormone release
patterns in mammals, implicating differential expression of genes within the Wnt signalling
pathway [43]. Our results provide evidence for Wnt signalling being involved in abnormal teat
development. The higher incidence of SNTs in cows born from later parities [2] may therefore be
explained by a stronger response to lactational hormones of Wnt signalling in pertinently
predisposed animals.
Acknowledgements
This study is part of FUGATO-plus GenoTrack and was financially supported by the German
Ministry of Education and Research, BMBF (grants 0315134A and 0315134D), the Förderverein
Biotechnologieforschung e.V. (FBF), Bonn, and Lohmann Tierzucht GmbH, Cuxhaven.

3 rd Chapter Supernumerary Teats in Cattle 67
References
1. Warren G (1934) The Occurrence of Polythelia in Dairy Cattle. Journal of Dairy Science 17: 559-569.
2. Brka M, Reinsch N, Kalm E (2002) Frequency and Heritability of Supernumerary Teats in German Simmental and German Brown Swiss Cows. Journal of Dairy Science 85: 1881-1886.
3. Wiener G (1962) Supernumerary teats in cattle. Zeitschrift für Tierzüchtung und Züchtungsbiologie 77: 382-392.
4. Brka M, Reinsch N, Junge W, Kalm E (2000) Frequency and heritability of supernumerary teats in German Holstein. Züchtungskunde 72: 17-27.
5. Schmidt H (1998) Supernumerary nipples: prevalence, size, sex and side predilection -- a prospective clinical study. European Journal of Pediatrics 157: 821-823.
6. Leung AK (1988) Familial supernumerary nipples. American Journal of Medical Genetics 31: 631-635.
7. Toumbis-Ioannou E, Cohen PR (1994) Familial polythelia. Journal of the American Academy of Dermatology 30: 667-668.
8. Goertzen B, Ibsen HL (1951) Supernumerary Mammae in Guinea Pigs. Journal of Heredity 42: 307-311.
9. Skjervold H (1960) Supernumerary Teats in Cattle. Hereditas 46: 71-74.
10. VanRaden PM, Wiggans GR (1991) Derivation, calculation, and use of national animal model information. Journal of Dairy Science 74: 2737-2746.
11. Mrode RA, Swanson GJT (2004) Calculating cow and daughter yield deviations and partitioning of genetic evaluations under a random regression model. Livestock Production Science 86: 253-260.
12. Edel C, Emmerling R, Götz K-U (2008) Optimized Aggregation of Phenotypes for MA-BLUP Evaluation in German Fleckvieh. Interbull Bulletin 40: 178-183.
13. Zimin AV, Delcher AL, Florea L, Kelley DR, Schatz MC, Puiu D, et al. (2009) A whole-genome assembly of the domestic cow, Bos taurus. Genome Biology 10: R42-R42.
14. Price AL, Patterson NJ, Plenge RM, Weinblatt ME, Shadick NA, Reich D (2006) Principal components analysis corrects for stratification in genome-wide association studies. Nat Genet 38: 904-909.
15. Patterson N, Price AL, Reich D (2006) Population Structure and Eigenanalysis. PLoS Genet 2: e190.
16. Kang HM, Sul JH, Service SK, Zaitlen NA, Kong S-yee, Freimer NB, et al. (2010) Variance component model to account for sample structure in genome-wide association studies. Nat

3 rd Chapter Supernumerary Teats in Cattle 68
Genet 42: 348-354.
17. VanRaden PM (2008) Efficient Methods to Compute Genomic Predictions. Journal of Dairy Science 91: 4414-4423.
18. Devlin B, Roeder K (1999) Genomic control for association studies. Biometrics 55: 997-1004.
19. Yang J, Lee SH, Goddard ME, Visscher PM (2011) GCTA: a tool for genome-wide complex trait analysis. American Journal of Human Genetics 88: 76-82.
20. Schwarz-Romond T, Asbrand C, Bakkers J, Kühl M, Schaeffer H-J, Huelsken J, et al. (2002) The ankyrin repeat protein Diversin recruits Casein kinase Iepsilon to the beta-catenin degradation complex and acts in both canonical Wnt and Wnt/JNK signaling. Genes & Development 16: 2073-2084.
21. Yang-Snyder J, Miller JR, Brown JD, Lai CJ, Moon RT (1996) A frizzled homolog functions in a vertebrate Wnt signaling pathway. Current Biology: CB 6: 1302-1306.
22. Boras-Granic K, Chang H, Grosschedl R, Hamel PA (2006) Lef1 is required for the transition of Wnt signaling from mesenchymal to epithelial cells in the mouse embryonic mammary gland. Developmental Biology 295: 219-231.
23. Logan CY, Nusse R (2004) The Wnt signaling pathway in development and disease. Annual Review of Cell and Developmental Biology 20: 781-810.
24. Eblaghie MC, Song S-J, Kim J-Y, Akita K, Tickle C, Jung H-S (2004) Interactions between FGF and Wnt signals and Tbx3 gene expression in mammary gland initiation in mouse embryos. Journal of Anatomy 205: 1-13.
25. Bryant DM, Datta A, Rodríguez-Fraticelli AE, Peränen J, Martín-Belmonte F, Mostov KE (2010) A molecular network for de novo generation of the apical surface and lumen. Nature Cell Biology 12: 1035-1045.
26. Sahana G, Guldbrandtsen B, Lund MS (2011) Genome-wide association study for calving traits in Danish and Swedish Holstein cattle. Journal of Dairy Science 94: 479-486.
27. Pausch H, Flisikowski K, Jung S, Emmerling R, Edel C, Götz K-U, et al. (2011) Genome-Wide Association Study Identifies Two Major Loci Affecting Calving Ease and Growth-Related Traits in Cattle. Genetics 187: 289 -297.
28. Goddard ME The validity of genetic models underlying quantitative traits. Livestock Production Science 72: 117-127.
29. Watson CJ, Khaled WT (2008) Mammary development in the embryo and adult: a journey of morphogenesis and commitment. Development (Cambridge, England) 135: 995-1003.
30. Turashvili G, Bouchal J, Burkadze G, Kolar Z (2006) Wnt signaling pathway in mammary gland development and carcinogenesis. Pathobiology: Journal of Immunopathology, Molecular and Cellular Biology 73: 213-223.

3 rd Chapter Supernumerary Teats in Cattle 69
31. Hens JR, Wysolmerski JJ (2005) Key stages of mammary gland development: molecular mechanisms involved in the formation of the embryonic mammary gland. Breast Cancer Research: BCR 7: 220-224.
32. Bamshad M, Le T, Watkins WS, Dixon ME, Kramer BE, Roeder AD, et al. (1999) The spectrum of mutations in TBX3: Genotype/Phenotype relationship in ulnar-mammary syndrome. American Journal of Human Genetics 64: 1550-1562.
33. Bamshad M, Krakowiak PA, Watkins WS, Root S, Carey JC, Jorde LB (1995) A gene for ulnar-mammary syndrome maps to 12q23-q24.1. Human Molecular Genetics 4: 1973-1977.
34. Klopocki E, Neumann LM, Tönnies H, Ropers H-H, Mundlos S, Ullmann R (2006) Ulnar-mammary syndrome with dysmorphic facies and mental retardation caused by a novel 1.28 Mb deletion encompassing the TBX3 gene. European Journal of Human Genetics: EJHG 14: 1274-1279.
35. Ihara N, Watanabe T, Sato Y, Itoh T, Suzuki T, Sugimoto Y (2007) Oligogenic transmission of abnormal teat patterning phenotype (ATPP) in cattle. Animal Genetics 38: 15-19.
36. Veltmaat JM, Mailleux AA, Thiery JP, Bellusci S (2003) Mouse embryonic mammogenesis as a model for the molecular regulation of pattern formation. Differentiation; Research in Biological Diversity 71: 1-17.
37. Tetzlaff S, Jonas E, Phatsara C, Murani E, Ponsuksili S, Schellander K, et al. (2009) Evidence for association of lymphoid enhancer-binding factor-1 (LEF1) with the number of functional and inverted teats in pigs. Cytogenetic and Genome Research 124: 139-146.
38. Gage PJ, Qian M, Wu D, Rosenberg KI (2008) The canonical Wnt signaling antagonist DKK2 is an essential effector of PITX2 function during normal eye development. Developmental Biology 317: 310-324.
39. Chu EY, Hens J, Andl T, Kairo A, Yamaguchi TP, Brisken C, et al. (2004) Canonical WNT signaling promotes mammary placode development and is essential for initiation of mammary gland morphogenesis. Development (Cambridge, England) 131: 4819-4829.
40. Bhanot P, Brink M, Samos CH, Hsieh JC, Wang Y, Macke JP, et al. (1996) A new member of the frizzled family from Drosophila functions as a Wingless receptor. Nature 382: 225-230.
41. Rasmussen JT, Deardorff MA, Tan C, Rao MS, Klein PS, Vetter ML (2001) Regulation of eye development by frizzled signaling in Xenopus. Proceedings of the National Academy of Sciences of the United States of America 98: 3861-3866.
42. Datta A, Bryant DM, Mostov KE (2011) Molecular regulation of lumen morphogenesis. Current Biology: CB 21: R126-136.
43. Boras-Granic K, Wysolmerski JJ (2008) Wnt signaling in breast organogenesis. Organogenesis 4: 116-122.

4th Chapter
Identification of QTL for UV-protective eye area pigmentation in
cattle by progeny phenotyping and genome-wide association analysis
Hubert Pausch*, Xiaolong Wang*, Simone Jung*, Dieter Krogmeier§, Christian Edel§,
Reiner Emmerling§, Kay-Uwe Götz§, Ruedi Fries*
* Lehrstuhl fuer Tierzucht, Technische Universitaet Muenchen, 85354 Freising, Germany
§ Institut fuer Tierzucht, Bayerische Landesanstalt für Landwirtschaft, 85586 Poing,
Germany
published in PLoS ONE 7(5): e36346

4 th Chapter Ambilateral circumocular pigmentation in cattle 71
Abstract
Pigmentation patterns allow for the differentiation of cattle breeds. A dominantly inherited white
head is characteristic for animals of the Fleckvieh (FV) breed. However, a minority of the FV
animals exhibits peculiar pigmentation surrounding the eyes (ambilateral circumocular
pigmentation, ACOP). In areas where animals are exposed to increased solar ultraviolet radiation,
ACOP is associated with a reduced susceptibility to bovine ocular squamous cell carcinoma
(BOSCC, eye cancer). Eye cancer is the most prevalent malignant tumour affecting cattle. Selection
for animals with ACOP rapidly reduces the incidence of BOSCC. To identify quantitative trait loci
(QTL) underlying ACOP, we performed a genome-wide association study using 658,385 single
nucleotide polymorphisms (SNPs). The study population consisted of 3579 bulls of the FV breed
with a total of 320,186 progeny with phenotypes for ACOP. The proportion of progeny with ACOP
was used as a quantitative trait with high heritability (h2=0.79). A variance components based
approach to account for population stratification uncovered twelve QTL regions on seven
chromosomes. The identified QTL point to MCM6, PAX3, ERBB3, KITLG, LEF1, DKK2, KIT,
CRIM1, ATRN, GSDMC, MITF and NBEAL2 as underlying genes for eye area pigmentation in
cattle. The twelve QTL regions explain 44.96% of the phenotypic variance of the proportion of
daughters with ACOP. The chromosomes harbouring significantly associated SNPs account for
54.13% of the phenotypic variance, while another 19.51% of the phenotypic variance is attributable
to chromosomes without identified QTL. Thus, the missing heritability amounts to 7% only. Our
results support a polygenic inheritance pattern of ACOP in cattle and provide the basis for efficient
genomic selection of animals that are less susceptible to serious eye diseases.

4 th Chapter Ambilateral circumocular pigmentation in cattle 72
Introduction
High-density SNP panels offer a new approach to deciphering the genetic architecture of complex
traits [1] [2]. Large scale genome-wide association studies (GWAS) have identified hundreds of
variants contributing to the genetic variation of quantitative traits in humans, e.g. [3] [4].
Comprehensive GWAS have also been applied successfully to identify quantitative trait loci (QTL)
for important traits in livestock species, frequently facilitated by using breeding values (or daughter
yield deviations) e.g. [5],[2],[6]. Breeding values are highly heritable phenotypes as they are
estimated on the basis of a large number of progeny records. Utilizing breeding values as
phenotypes not only compensates smaller sample size in livestock GWAS [7] but also enables QTL
mapping for traits which are recorded in the progeny.
Phenotypes for skin and coat pigmentation are readily accessible and accurately recordable traits
with medium to high heritabilities ([8], [9]). Skin and coat pigmentation traits have been studied
and characterized extensively in humans (see [10] for a review), in laboratory animals [11] and in
domestic animals (see [12] for a review). Variations of skin and coat colours naturally arose in the
course of adaption to altering environmental conditions, e.g. reaction to thermal stress [13] and
increasing exposure to ultraviolet (UV) radiation [14].
Excessive exposure to UV radiation and a lack of ambilateral circumocular pigmentation (ACOP)
are two predisposing factors to bovine ocular squamous cell carcinoma (BOSCC, eye cancer) [15]
[16] [17]. Eye cancer is the most prevalent malignant tumour affecting cattle and causes substantial
economic losses [16]. Breeds with white heads, e.g. Fleckvieh and Hereford, are particularly
susceptible to BOSCC [18]. While the incidence of BOSCC in pertinently exposed Simmental (i.e.
Fleckvieh) cattle is up to 53% [19], investigations concerning the prevalence of BOSCC in German
herds have not been performed. Although there is evidence for a genetic predisposition to BOSCC,
4 th Chapter Ambilateral circumocular pigmentation in cattle 73
the heritability for BOSCC is low [20]. The susceptibility to BOSCC is considerably reduced in
animals with ACOP, a highly heritable trait which can be easily identified [21]. Since the
heritability for eye-area pigmentaion is higher than for the susceptibility to BOSCC ([20],[21]),
selection for ACOP is expected to rapidly decrease the number of affected animals [22] [17].
Furthermore, eye irritation and subsequent infection with bovine infectious keratoconjunctivitis
(BIK, pinkeye) is more frequent in cattle without ACOP [23]. Selection for ACOP reduces the
incidence of BIK and thus enhances animal welfare in areas with increased solar radiation.
However, as excessive exposure to UV radiation is not a major challenge for German cattle,
selection for ACOP does not take place in the German FV population.
The aim of the present study was to gain insights into the genetic architecture of a special aspect of
skin pigmentation and to provide the basis for more efficient selection for animals that are less
susceptible to serious eye diseases. Recording the pigmentation status in large progeny groups of
artificial insemination bulls provided a highly heritable phenotype for a genome-wide association
study. Using densely spaced SNPs, the association study identified twelve QTL regions.
Material and Methods
Animals and phenotypes
The proportion of daughters with ACOP (Figure 1) was assessed for 3579 progeny tested bulls of
the Fleckvieh (FV) breed. Eye-area pigmentation is routinely recorded during the examination of
first-crop daughters of test bulls as a categorical trait. However, phenotypes for ACOP are not
recorded routinely for male animals. Phenotypic records for 320,186 FV cows were provided from
the Bavarian State Research Center for Agriculture (http:// www.lfl.bayern.de ). The number of
daughters per sire ranged from 20 to 3949 with a median of 59 daughters. An approximately
normally distributed phenotype was obtained by square root transformation of the proportion of
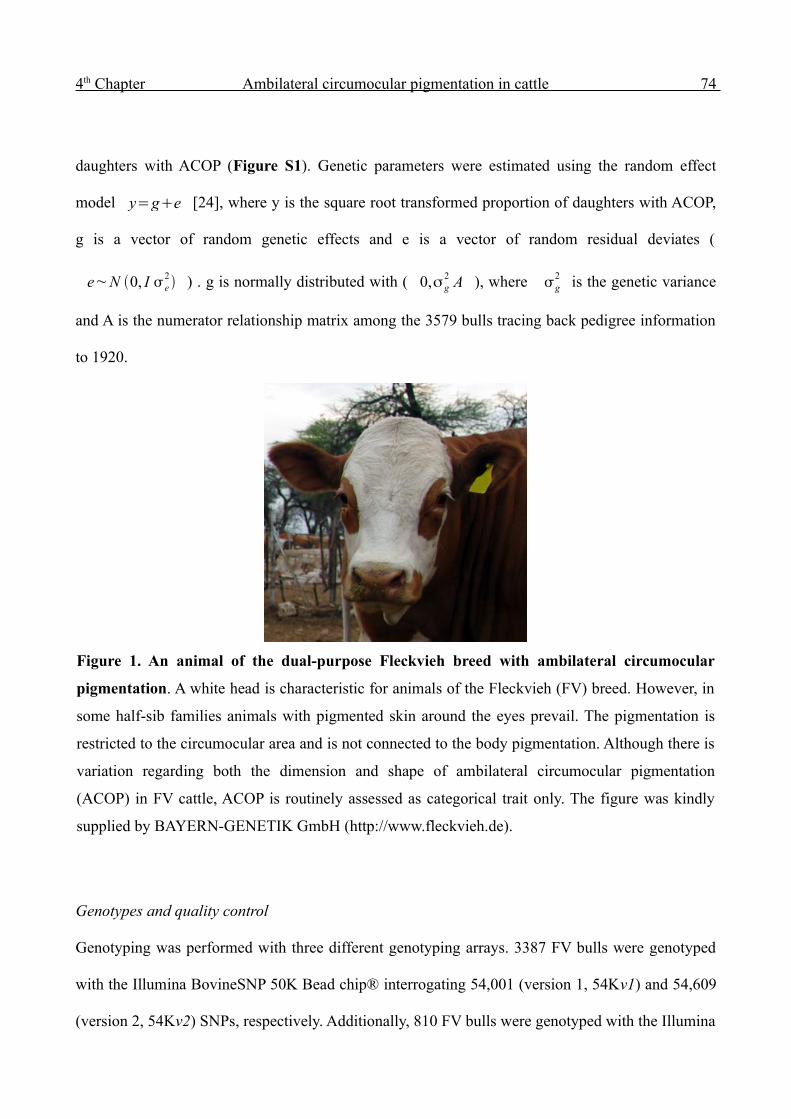
4 th Chapter Ambilateral circumocular pigmentation in cattle 74
daughters with ACOP (Figure S1). Genetic parameters were estimated using the random effect
model y=ge [24], where y is the square root transformed proportion of daughters with ACOP,
g is a vector of random genetic effects and e is a vector of random residual deviates (
e~N 0, I e2 ) . g is normally distributed with ( 0,σ g
2 A ), where g2 is the genetic variance
and A is the numerator relationship matrix among the 3579 bulls tracing back pedigree information
to 1920.
Genotypes and quality control
Genotyping was performed with three different genotyping arrays. 3387 FV bulls were genotyped
with the Illumina BovineSNP 50K Bead chip® interrogating 54,001 (version 1, 54Kv1) and 54,609
(version 2, 54Kv2) SNPs, respectively. Additionally, 810 FV bulls were genotyped with the Illumina
Figure 1. An animal of the dual-purpose Fleckvieh breed with ambilateral circumocular
pigmentation. A white head is characteristic for animals of the Fleckvieh (FV) breed. However, in
some half-sib families animals with pigmented skin around the eyes prevail. The pigmentation is
restricted to the circumocular area and is not connected to the body pigmentation. Although there is
variation regarding both the dimension and shape of ambilateral circumocular pigmentation
(ACOP) in FV cattle, ACOP is routinely assessed as categorical trait only. The figure was kindly
supplied by BAYERN-GENETIK GmbH (http://www.fleckvieh.de).

4 th Chapter Ambilateral circumocular pigmentation in cattle 75
BovineHD Bead chip® interrogating 777,962 SNPs (777K). 521 bulls of the 777K data set were
also genotyped with the 54Kv1 genotyping array (Table S1-S3). The chromosomal position of the
SNPs was determined according to the University of Maryland UMD3.1 assembly of the bovine
genome sequence [25]. Quality control was performed for the three datasets separately using
PLINK [26]. Animals with more than 10% missing genotypes were not considered for further
analyses. Those SNPs with unknown, Y-chromosomal or mitochondrial position or if genotyping
failed in more than 10% of the animals were excluded. Additionally, SNPs with a minor allele
frequency (MAF) < 0.5% and SNPs showing significant (P < 0.0001) deviation from the Hardy-
Weinberg Equilibrium were omitted for subsequent analysis. The genomic relationship was
calculated as proposed by VanRaden [27] and compared with the pedigree relationship. Animals
showing major discrepancies of the pedigree and genomic relationship were omitted. A detailed
overview of the number of SNPs and animals not passing the quality criteria is given in Table S1.
In silico genotyping
A subset of 38,820 SNPs was interrogated with all three genotyping arrays. However, genotypes for
488, 394 and 611,702 SNPs were exclusively interrogated with the 54Kv1, 54Kv2 and 777K array,
respectively (Table S2 & S3). The datasets were combined and missing genotypes were inferred
using findhapV2 [28]. After genotype imputation, the resulting dataset comprised 3643 animals and
658,385 SNPs with an average genotyping rate of 99.68% per individual. Progeny records were
available for 3579 individuals only.
Evaluation of imputation accuracy
Imputation accuracy was evaluated within 802 animals of the high-density dataset to assess the
quality of the imputed genotypes. We randomly selected 400 animals as reference population with
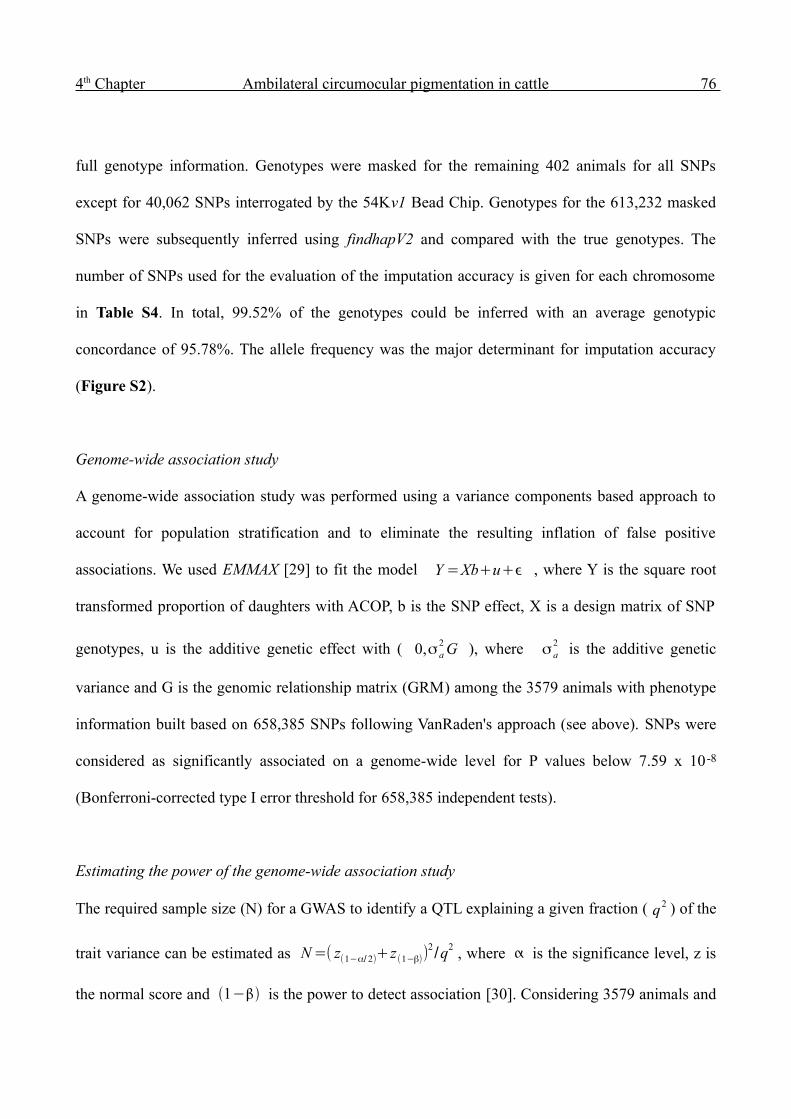
4 th Chapter Ambilateral circumocular pigmentation in cattle 76
full genotype information. Genotypes were masked for the remaining 402 animals for all SNPs
except for 40,062 SNPs interrogated by the 54Kv1 Bead Chip. Genotypes for the 613,232 masked
SNPs were subsequently inferred using findhapV2 and compared with the true genotypes. The
number of SNPs used for the evaluation of the imputation accuracy is given for each chromosome
in Table S4. In total, 99.52% of the genotypes could be inferred with an average genotypic
concordance of 95.78%. The allele frequency was the major determinant for imputation accuracy
(Figure S2).
Genome-wide association study
A genome-wide association study was performed using a variance components based approach to
account for population stratification and to eliminate the resulting inflation of false positive
associations. We used EMMAX [29] to fit the model Y =Xb+u+ϵ , where Y is the square root
transformed proportion of daughters with ACOP, b is the SNP effect, X is a design matrix of SNP
genotypes, u is the additive genetic effect with ( 0,σ a2 G ), where σ a
2 is the additive genetic
variance and G is the genomic relationship matrix (GRM) among the 3579 animals with phenotype
information built based on 658,385 SNPs following VanRaden's approach (see above). SNPs were
considered as significantly associated on a genome-wide level for P values below 7.59 x 10 -8
(Bonferroni-corrected type I error threshold for 658,385 independent tests).
Estimating the power of the genome-wide association study
The required sample size (N) for a GWAS to identify a QTL explaining a given fraction ( q2 ) of the
trait variance can be estimated as N =( z(1−α/ 2)+z(1−β))2 /q2 , where is the significance level, z is
the normal score and 1− is the power to detect association [30]. Considering 3579 animals and

4 th Chapter Ambilateral circumocular pigmentation in cattle 77
the Bonferroni-corrected significance threshold for an average number of 22.000 tests per
chromosome, the power to detect a QTL accounting for at least 1% of the trait variance is
approximately 90% in the present study.
Partitioning of the genetic variance
In order to estimate the proportion of phenotypic variance attributed to a particular chromosome, a
GRM was built (see above) for each of the 30 chromosomes separately. We used GCTA [31] to fit
the model y=∑i=1
30
g i+e , where y is a vector of the square root transformed proportion of
daughters with ACOP, g is a vector of genetic effects attributed to the ith chromosome, and e is a
vector of random residual deviates. g i is assumed to be normally distributed with N (0,G i σ2
g i)
, where Gi is the GRM built based on SNPs on the i th chromosome. Variance components were
estimated with the effects of all chromosomes fitted simultaneously and the proportion of
phenotypic variance attributable to the ith chromosome was calculated as σ gi
2 /(∑j=1
30
σg j
2 +σ e2) . To
estimate the proportion of phenotypic variance explained by each of the twelve identified QTL
regions, SNPs within a 5 Mb interval centred on the most significantly associated SNP were
considered for building the GRM for each QTL region. All SNPs except those within the 5 Mb
interval were used to build the GRM for the chromosome harbouring the QTL. Variance
components were estimated with the effects of all 30 chromosomes and twelve QTL regions fitted
simultaneously (see above).

4 th Chapter Ambilateral circumocular pigmentation in cattle 78
Results
The proportion of daughters with ambilateral circumocular pigmentation (ACOP) (Figure 1) was
obtained by phenotyping a median number of 59 daughters for 3579 bulls. It ranged from 0 to
69.1% with an average of 22.6% of the daughters per genotyped sire. After square root
transformation, 66.67%, 95.87% and 99.89% of the values were within one, two and three standard
deviations, respectively (Figure S1). The resulting trait is a highly heritable progeny-derived
phenotype for the bulls. Using the numerator relationship matrix among the 3579 animals built
based on in-depth pedigree information in a random effect model, the heritability was estimated to
be 0.79 (± 0.04).
Association study
The genome-wide association study based on a variance components based approach to account for
population stratification identified twelve QTL regions on seven chromosomes (Figure 2). Among
them, eight met the Bonferroni-corrected threshold for genome-wide significance, four were
significantly associated on a chromosome-wide scale. A detailed overview of the characteristics of
the identified QTL regions is given in Table 1 and Figure S3. An additional analysis conditional on
the most significantly associated SNP indicates the presence of a second independent QTL on BTA6
and BTA22, respectively (Table 2, Figure S4 & S5).
Identification of functional genes within the associated regions
The gene content of the associated regions was analysed based on the University of Maryland
UMD3.1 assembly of the bovine genome [25]. Strong association was observed in close vicinity to
KIT (BTA6), KITLG, ERBB3 (BTA5) and MITF (BTA22), four genes which play central roles in the
migration of melanoblast cells and melanocyte development [32][33][34]. Two QTL on BTA2 point

4 th Chapter Ambilateral circumocular pigmentation in cattle 79
to PAX3 and MCM6 as candidate genes for ACOP in cattle. PAX3 is a transcription factor known to
be involved in melanogenesis [35]. MCM6 is up-regulated during pheomelanogenesis [36]. A QTL
on BTA6, although only associated on a chromosome-wide level, is located between DKK2 and
LEF1. DKK2 plays an essential role during eye development [37]. LEF1 interacts with MITF via
Wnt signalling [38]. The QTL on BTA11 is in close vicinity to CRIM1, which is up-regulated in
developing ocular tissues [39]. ATRN, a candidate gene for the BTA13 QTL, was shown to
influence coat colour in mice [40]. On BTA14, association of a region containing GSDMC (alias
MLZE) was observed. MLZE is up-regulated in growing metastatic melanomas and is supposed to
be important for melanoma progression [41]. A QTL on BTA22 identifies NBEAL2 as candidate
gene for ACOP. NBEAL2 shows homology to LYST, which is responsible for pigmentation defects
in humans and mice [42] [43]. We found no gene in immediate vicinity of the third BTA22 QTL.
Figure 2. Manhattan plot of association of 658,385 SNPs with the proportion of daughters
with ambilateral circumocular pigmentation in 3579 bulls of the Fleckvieh breed. The
chromosomes are separated with alternating colours. Orange and red dots indicate chromosome-
wide and genome-wide (P < 7.59 x 10⁻⁸) significantly associated SNPs, respectively. The vertical
axis is truncated for P values below -log10(10-41). Twelve identified QTL regions are indicated
with arrows and gene identifiers.
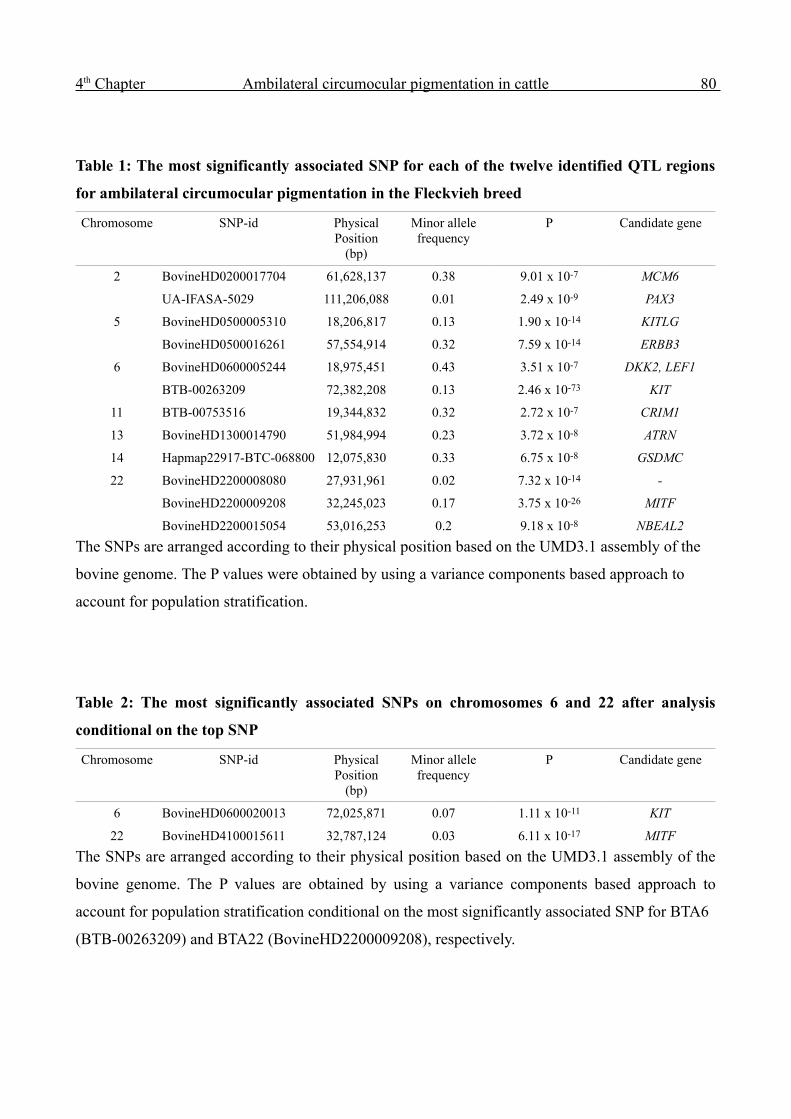
4 th Chapter Ambilateral circumocular pigmentation in cattle 80
Table 1: The most significantly associated SNP for each of the twelve identified QTL regions
for ambilateral circumocular pigmentation in the Fleckvieh breed
Chromosome SNP-id Physical Position
(bp)
Minor allele frequency
P Candidate gene
2 BovineHD0200017704 61,628,137 0.38 9.01 x 10⁻⁷ MCM6
UA-IFASA-5029 111,206,088 0.01 2.49 x 10-9 PAX3
5 BovineHD0500005310 18,206,817 0.13 1.90 x 10⁻¹⁴ KITLG
BovineHD0500016261 57,554,914 0.32 7.59 x 10⁻¹⁴ ERBB3
6 BovineHD0600005244 18,975,451 0.43 3.51 x 10⁻⁷ DKK2, LEF1
BTB-00263209 72,382,208 0.13 2.46 x 10-73 KIT
11 BTB-00753516 19,344,832 0.32 2.72 x 10⁻⁷ CRIM1
13 BovineHD1300014790 51,984,994 0.23 3.72 x 10⁻⁸ ATRN
14 Hapmap22917-BTC-068800 12,075,830 0.33 6.75 x 10⁻⁸ GSDMC
22 BovineHD2200008080 27,931,961 0.02 7.32 x 10⁻¹⁴ -
BovineHD2200009208 32,245,023 0.17 3.75 x 10⁻²⁶ MITF
BovineHD2200015054 53,016,253 0.2 9.18 x 10⁻⁸ NBEAL2
The SNPs are arranged according to their physical position based on the UMD3.1 assembly of the
bovine genome. The P values were obtained by using a variance components based approach to
account for population stratification.
Table 2: The most significantly associated SNPs on chromosomes 6 and 22 after analysis
conditional on the top SNP
Chromosome SNP-id Physical Position
(bp)
Minor allele frequency
P Candidate gene
6 BovineHD0600020013 72,025,871 0.07 1.11 x 10⁻¹¹ KIT
22 BovineHD4100015611 32,787,124 0.03 6.11 x 10⁻¹⁷ MITF
The SNPs are arranged according to their physical position based on the UMD3.1 assembly of the
bovine genome. The P values are obtained by using a variance components based approach to
account for population stratification conditional on the most significantly associated SNP for BTA6
(BTB-00263209) and BTA22 (BovineHD2200009208), respectively.

4 th Chapter Ambilateral circumocular pigmentation in cattle 81
Allelic effects of significantly associated SNPs
Alleles raising the proportion of daughters with ACOP were determined for the most significantly
associated SNP for each QTL (Table 1 & Table 2). Figure 3 shows the frequency distribution of
animals with an increasing number of alleles (from 1 to 16) predisposing to an increased number of
progeny with ACOP. The proportion increases nearly linearly with an increasing number of
predisposing alleles. Bulls with at least 15 predisposing alleles had > 50% progeny with ACOP
while the fraction is <20% for sires with less than seven predisposing alleles.
Variance explained by all SNPs
The genomic relationship matrix, which was also applied for the genome-wide association study,
was fitted in a mixed linear model to estimate the proportion of phenotypic variation accounted for
by all 658,385 SNPs. To quantify the benefit of a high-density SNP map, the genomic relationship
based on only 43,029 SNPs, which were genotyped in all animals, was estimated additionally. The
very dense SNP map explains 73.64% of the phenotypic variation (i.e.93.22% of the heritability)
while the medium-dense map explains 69.97% (i.e. 88.56% of the heritability) (Figure S6).
Partitioning of the genetic variation
We next built genomic relationship matrices among the 3579 animals for each chromosome
separately in order to partitioning the phenotypic variation onto different chromosomes. The
proportion of phenotypic variation attributable to a particular chromosome was then estimated with
the effects of all chromosomes fitted simultaneously. The contribution of particular chromosomes
varies strongly (Figure 4). A major fraction of the phenotypic variation is attributable to BTA5
(10.68%), BTA6 (18.29%) and BTA22 (12.53%), three chromosomes harbouring at least two
identified QTL for ACOP. Totally, the seven chromosomes with identified QTL account for 54.13%

4 th Chapter Ambilateral circumocular pigmentation in cattle 82
of the phenotypic variation. This fraction decreases to 50.82% when the genomic relationship
matrices built based on SNPs of the medium-density datasets were fitted (Figure S6). There was no
significant association between chromosome length (in Mb units) and the proportion of phenotypic
variance explained (P=0.22, r2=0.06) (Figure S7).
Figure 3. The effect of 14 significantly associated SNPs on the proportion of daughters with
ambilateral circumocular pigmentation. 3579 Fleckvieh animals are grouped according to the
number of alleles that predispose to ambilateral circumocular pigmentation (ACOP). The blue
boxplots represent the proportion of daughters with ACOP for each group. The grey bars indicate
the number of sires with an increasing number of predisposing alleles.

4 th Chapter Ambilateral circumocular pigmentation in cattle 83
Twelve identified QTL regions totally account for 44.96% of the phenotypic variance (i.e. 56.91%
of the heritability). A major fraction of the phenotypic variance is attributable to the QTL regions
encompassing KITLG (7.87%), KIT (14.56%) and MITF (11.33%) on chromosomes 5, 6 and 22,
respectively (Figure 4, Table 3). While the identified QTL on BTA2 and BTA22 almost account for
the entire chromosome variance, the QTL on BTA11 and BTA14 explain only a minor part of the
particular chromosome variance. A QTL on BTA22 explains only a marginal fraction of the
phenotypic variation.
Figure 4. Chromosomal partitioning of the phenotypic variance. The grey and blue bars indicate
the fraction of phenotypic variance attributed to a particular chromosome and QTL region,
respectively. The triangles represent the cumulative proportion of phenotypic variance attributable
to the 30 chromosomes.
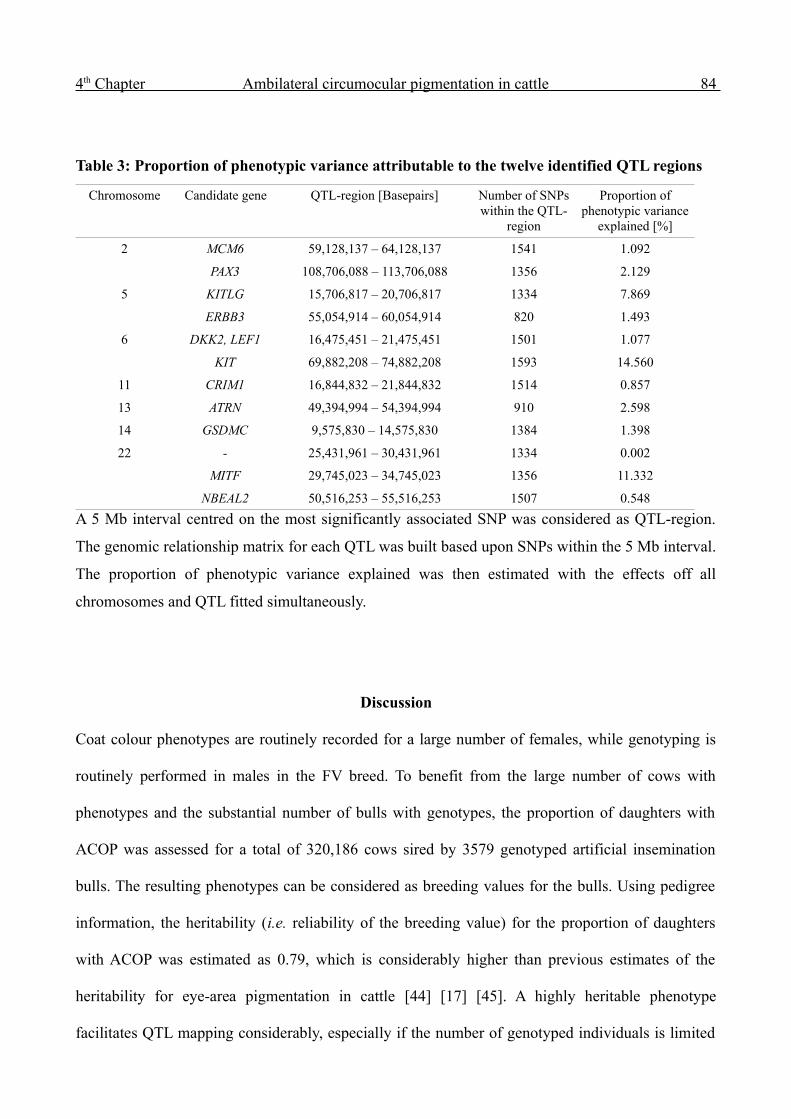
4 th Chapter Ambilateral circumocular pigmentation in cattle 84
Table 3: Proportion of phenotypic variance attributable to the twelve identified QTL regions
Chromosome Candidate gene QTL-region [Basepairs] Number of SNPs within the QTL-
region
Proportion of phenotypic variance
explained [%]
2 MCM6 59,128,137 – 64,128,137 1541 1.092
PAX3 108,706,088 – 113,706,088 1356 2.129
5 KITLG 15,706,817 – 20,706,817 1334 7.869
ERBB3 55,054,914 – 60,054,914 820 1.493
6 DKK2, LEF1 16,475,451 – 21,475,451 1501 1.077
KIT 69,882,208 – 74,882,208 1593 14.560
11 CRIM1 16,844,832 – 21,844,832 1514 0.857
13 ATRN 49,394,994 – 54,394,994 910 2.598
14 GSDMC 9,575,830 – 14,575,830 1384 1.398
22 - 25,431,961 – 30,431,961 1334 0.002
MITF 29,745,023 – 34,745,023 1356 11.332
NBEAL2 50,516,253 – 55,516,253 1507 0.548
A 5 Mb interval centred on the most significantly associated SNP was considered as QTL-region.
The genomic relationship matrix for each QTL was built based upon SNPs within the 5 Mb interval.
The proportion of phenotypic variance explained was then estimated with the effects off all
chromosomes and QTL fitted simultaneously.
Discussion
Coat colour phenotypes are routinely recorded for a large number of females, while genotyping is
routinely performed in males in the FV breed. To benefit from the large number of cows with
phenotypes and the substantial number of bulls with genotypes, the proportion of daughters with
ACOP was assessed for a total of 320,186 cows sired by 3579 genotyped artificial insemination
bulls. The resulting phenotypes can be considered as breeding values for the bulls. Using pedigree
information, the heritability (i.e. reliability of the breeding value) for the proportion of daughters
with ACOP was estimated as 0.79, which is considerably higher than previous estimates of the
heritability for eye-area pigmentation in cattle [44] [17] [45]. A highly heritable phenotype
facilitates QTL mapping considerably, especially if the number of genotyped individuals is limited

4 th Chapter Ambilateral circumocular pigmentation in cattle 85
[46]. Nine of the twelve identified QTL for ACOP account for at least 1% of the trait variance.
Although the limited number of genotyped animals restricted the power to detect QTL with small
effects, the present study identified three QTL that account for less than 1% of the trait variance.
The coat pigmentation phenotype assessed in this study is a quantitative trait with numerous loci
with small effects and few loci with large effects. Twelve identified QTL regions can be considered
as the major determinants for ACOP in cattle as they explain 44.96% of the phenotypic variation.
The seven chromosomes with identified QTL account for 54.13% of the phenotypic variation. A
substantial fraction of the phenotypic variation is attributable to chromosomes without identified
QTL. Increasing the number of genotyped animals might enable the detection of additional QTL
with minor effect sizes [47], however the number of detectable QTL is limited even in studies with
very large sample sizes [48]. The present study nevertheless demonstrates both the leverage
potential of progeny phenotyping and the utility of a dense marker map for unravelling the genetic
architecture of complex traits in livestock animals. Totally, the 658,385 and 43,029 SNPs accounted
for ~93% and ~89% of the heritability. These fractions are distinctly higher than those reported for
traits with similar heritability in human genetics [49] [1]. Presumably due to the considerably lower
number of independent chromosome segments in cattle, resulting from a small effective population
size and concomitant substantial long-range linkage disequilibrium [46]. Our results display that
applying dense SNP panels allows to capture most of the genetic variation of complex traits in
highly structured livestock populations and thus reduces the 'missing heritability' [50].
High density genotyping of a minor fraction of the animals of our study population enabled the
accurate imputation of ~96% of the genotypes for the remaining animals genotyped at a lower
density (Figure S2). This agrees with findings in the American Holstein population [28]. The actual
imputation accuracy for the complete study population is supposed to be even higher, since only
4 th Chapter Ambilateral circumocular pigmentation in cattle 86
half of the animals with high-density genotypes were applied as reference population for the
evaluation of imputation accuracy whereas genotypes for the remaining animals were set to
missing. Increasing the number of reference individuals with high-density genotypes enables a
better resolution of the haplotype structure of the population implicating higher imputation accuracy
[51] [52]. Our results demonstrate that the availability of a dense SNP panel and concomitant
genotype imputation enables the mapping of QTL for complex traits in livestock populations at a
better resolution.
Eight of the twelve identified QTL point to genes, i.e. MCM6, PAX3, KITLG, ERBB3, KIT, ATRN,
MITF and NBEAL2, affecting various coat colour phenotypes in cattle and other species via
pigment cell genesis and/or pigment formation (e.g. [36], [34], and [32] for a review). Interestingly,
two of the identified QTL for ACOP in the FV breed are in close vicinity to genes affecting eye
morphogenesis during embryonal development, i.e. DKK2 [37] and CRIM1 [39]. The QTL on
BTA14 points to GSDMC (alias MLZE) as candidate gene for ACOP in cattle. There are no clues for
a direct contribution of MLZE to mammalian pigmentation traits or embryonal eye development.
However, expression of MLZE in growing metastatic melanomas implies a contribution of MLZE to
melanoma progression [41] [53] and thus possibly to normal melanocyte development.
The identified candidate genes for ACOP interact in a complex fashion, e.g. during melanocyte
development and melanocyte migration [54],[55]. Two candidate genes for ACOP (LEF1, PAX3)
encode transcription factors regulating the promoter for the BTA22 candidate gene MITF [55]. The
BTA6 candidate gene KIT encodes a transmembrane receptor for the mast cell growth factor
encoded by the BTA5 candidate gene KITLG [56]. Previous studies evidenced that KIT alleles
acting in a dominant fashion completely inhibit pigmentation in pigs [57]. A similar mechanism is
plausible for eye-area pigmentation in cattle. However, the present study accounts for additive

4 th Chapter Ambilateral circumocular pigmentation in cattle 87
effects only as the applied phenotype is recorded in the progeny of genotyped artificial insemination
bulls. Direct phenotypes for ACOP were not available for the genotyped animals. The proportion of
daughters with ACOP is a progeny-derived phenotype for the bulls and acts therefore purely
additively. Thus, we cannot dissect non-additive effects, although they are likely to explain a
substantial fraction of the genetic variation for complex traits, such as coat colour [58][59].
Assessing phenotypes for ACOP in the genotyped male animals might enable to quantify the extent
of non-additive effects. However, the identification of non-additive effects on a genome-wide scale
requires large sample sizes and is computationally demanding ([60],[61]). Investigating causal
variants directly for non-additive effects overcomes the substantial burden of multiple testing and
concomitantly restricts computational costs [62]. However, the present study illustrates the
complexity in revealing causal variants in livestock populations. Significantly associated QTL
regions might expand over several million base pairs due to extensive linkage disequilibrium (e.g.
Figure S8), rendering the identification of underlying variants/mechanisms a difficult task. Access
to large independent validation populations [63] and comprehensive functional investigations [64],
respectively, is indispensable for the fine-mapping of QTL regions in livestock populations.
Pigmentation around the eyes is highly correlated with eye-lid and corneoscleral pigmentation [22].
Corneoscleral pigmentation considerably reduces the susceptibility to bovine infectious
keratoconjunctivitis (BIK) [23] and eye cancer (BOSCC) [65]. In the present study, the number of
progeny with ACOP increased to > 50% with an increasing number of favourable QTL alleles of the
sire. The selection of bulls based on these QTL alleles might rapidly increase the number of
progeny with ACOP and thus contribute to reducing the incidence of BIK and BOSCC in areas of
increased solar radiation [21]. However, since the twelve identified QTL regions account for 56.9%

4 th Chapter Ambilateral circumocular pigmentation in cattle 88
of the heritability only, genome-wide evaluation of sires using the entire set of high-density SNPs
should allow to most efficiently increase the proportion of progeny with ACOP and thus should
reduce the incidence of serious health problems in cattle.
Acknowledgements
The authors acknowledge the Arbeitsgemeinschaft Süddeutscher Rinderzüchter und
Besamungsorganisationen e.V. (ASR) and the Förderverein Biologietechnologieforschung e.V.
(FBF) for sharing genotype data.
References
1. Yang J, Manolio TA, Pasquale LR, Boerwinkle E, Caporaso N, Cunningham JM, et al. (2011) Genome partitioning of genetic variation for complex traits using common SNPs. Nat Genet 43: 519–525.
2. Hayes BJ, Pryce J, Chamberlain AJ, Bowman PJ, Goddard ME (2010) Genetic Architecture of Complex Traits and Accuracy of Genomic Prediction: Coat Colour, Milk-Fat Percentage, and Type in Holstein Cattle as Contrasting Model Traits. PLoS Genet 6: e1001139.
3. Gudbjartsson DF, Walters GB, Thorleifsson G, Stefansson H, Halldorsson BV, Zusmanovich P, et al. (2008) Many sequence variants affecting diversity of adult human height. Nat Genet 40: 609–615.
4. Lango Allen H, Estrada K, Lettre G, Berndt SI, Weedon MN, Rivadeneira F, et al. (2010) Hundreds of variants clustered in genomic loci and biological pathways affect human height. Nature 467: 832–838.
5. Sahana G, Guldbrandtsen B, Lund MS (2011) Genome-wide association study for calving traits in Danish and Swedish Holstein cattle. Journal of Dairy Science 94: 479–486.
6. Cole JB, VanRaden PM, O’Connell JR, Van Tassell CP, Sonstegard TS, Schnabel RD, et al. (2009) Distribution and location of genetic effects for dairy traits. Journal of Dairy Science 92: 2931–2946.
7. Pausch H, Flisikowski K, Jung S, Emmerling R, Edel C, Götz K-U, et al. (2011) Genome-Wide Association Study Identifies Two Major Loci Affecting Calving Ease and Growth-Related Traits in Cattle. Genetics 187: 289 –297.
8. Clark P, Stark AE, Walsh RJ, Jardine R, Martin NG (1981) A twin study of skin reflectance. Annals of Human Biology 8: 529–541.

4 th Chapter Ambilateral circumocular pigmentation in cattle 89
9. Frisancho AR, Wainwright R, Way A (1981) Heritability and components of phenotypic expression in skin reflectance of Mestizos from the Peruvian Lowlands. American Journal of Physical Anthropology 55: 203–208.
10. Rees JL (2003) Genetics of hair and skin color. Annual Review of Genetics 37: 67–90.
11. Bennett DC, Lamoreux ML (2003) The color loci of mice--a genetic century. Pigment Cell Research / Sponsored by the European Society for Pigment Cell Research and the International Pigment Cell Society 16: 333–344.
12. Andersson L (2001) Genetic dissection of phenotypic diversity in farm animals. Nature Reviews. Genetics 2: 130–138.
13. Finch VA, Western D (1977) Cattle Colors in Pastoral Herds: Natural Selection or Social Preference? Ecology 58: 1384–1392.
14. Jablonski NG, Chaplin G (2000) The evolution of human skin coloration. Journal of Human Evolution 39: 57–106.
15. Newton R, Reeves G, Beral V, Ferlay J, Parkin D (1996) Effect of ambient solar ultraviolet radiation on incidence of squamous-cell carcinoma of the eye. The Lancet 347: 1450–1451.
16. Heeney JL, Valli VE (1985) Bovine ocular squamous cell carcinoma: an epidemiological perspective. Canadian Journal of Comparative Medicine. Revue Canadienne De Médecine Comparée 49: 21–26.
17. Anderson DE (1991) Genetic study of eye cancer in cattle. The Journal of Heredity 82: 21–26.
18. Guilbert HR, Wahid A, Wagnon KA, Gregory PW (1948) Observations on pigmentation of eyelids of Hereford cattle in relation to occurrence of ocular epitheliomas. Journal of Animal Science 7: 426 –429.
19. Den Otter W, Hill FW, Klein WR, Everse LA, Ruitenberg EJ, Van der Ven LT, et al. (1995) Ocular squamous cell carcinoma in Simmental cattle in Zimbabwe. American Journal of Veterinary Research 56: 1440–1444.
20. Russell WC, Brinks JS, Kainer RA (1976) Incidence and Heritability of Ocular Squamous Cell Tumors in Hereford Cattle. Journal of Animal Science 43: 1156 –1162.
21. Nishimura H, Frisch J (1977) Eye cancer and circumocular pigmentation in Bos taurus, Bos indicus and crossbred cattle. Aust. J. Exp. Agric. 17: 709–711.
22. Vogt DW, Anderson DE, Easley GT (1963) Studies on Bovine Ocular Squamous Carcinoma (“Cancer Eye”) XIV. Heritabilities, Phenotypic Correlations, and Genetic Correlations Involving Corneoscleral and Lid Pigmentation. Journal of Animal Science 22: 762 –766.
23. Ward JK, Nielson MK (1979) Pinkeye (bovine infectious keratoconjunctivitis) in beef cattle. Journal of Animal Science 49: 361–366.
24. Clifford D, McCullagh P (2006) The regress function. R newsletter 6: 6–10.
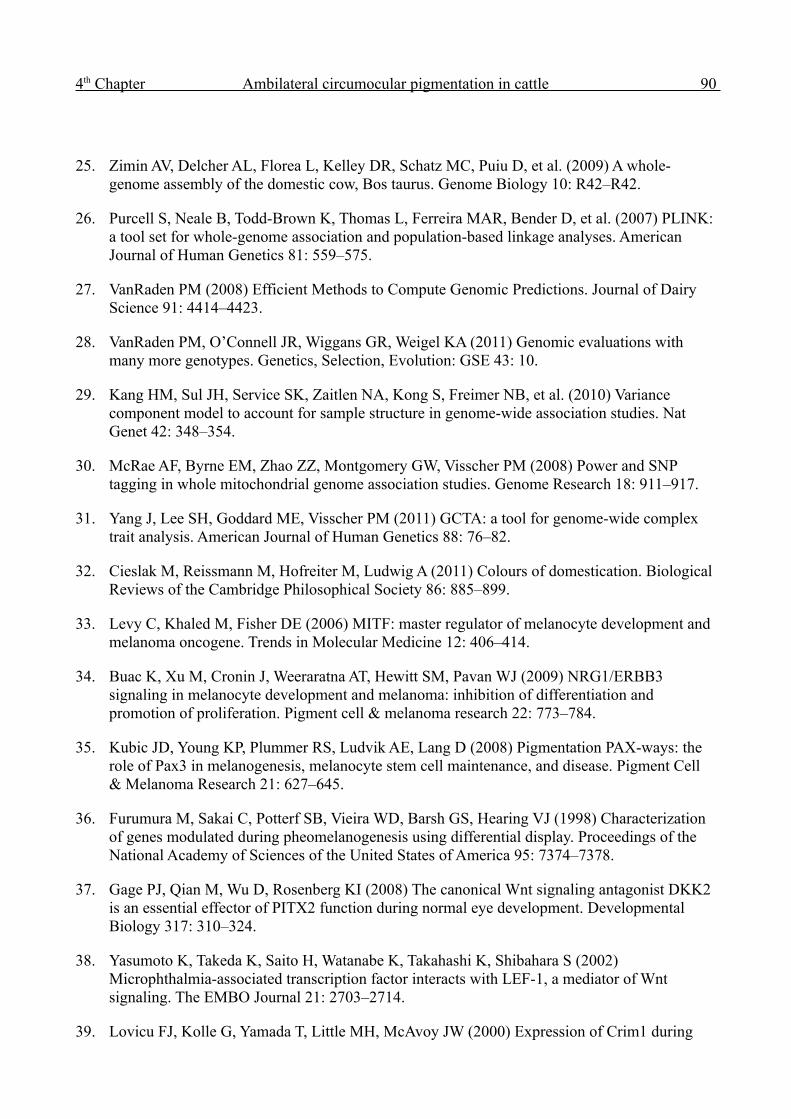
4 th Chapter Ambilateral circumocular pigmentation in cattle 90
25. Zimin AV, Delcher AL, Florea L, Kelley DR, Schatz MC, Puiu D, et al. (2009) A whole-genome assembly of the domestic cow, Bos taurus. Genome Biology 10: R42–R42.
26. Purcell S, Neale B, Todd-Brown K, Thomas L, Ferreira MAR, Bender D, et al. (2007) PLINK: a tool set for whole-genome association and population-based linkage analyses. American Journal of Human Genetics 81: 559–575.
27. VanRaden PM (2008) Efficient Methods to Compute Genomic Predictions. Journal of Dairy Science 91: 4414–4423.
28. VanRaden PM, O’Connell JR, Wiggans GR, Weigel KA (2011) Genomic evaluations with many more genotypes. Genetics, Selection, Evolution: GSE 43: 10.
29. Kang HM, Sul JH, Service SK, Zaitlen NA, Kong S, Freimer NB, et al. (2010) Variance component model to account for sample structure in genome-wide association studies. Nat Genet 42: 348–354.
30. McRae AF, Byrne EM, Zhao ZZ, Montgomery GW, Visscher PM (2008) Power and SNP tagging in whole mitochondrial genome association studies. Genome Research 18: 911–917.
31. Yang J, Lee SH, Goddard ME, Visscher PM (2011) GCTA: a tool for genome-wide complex trait analysis. American Journal of Human Genetics 88: 76–82.
32. Cieslak M, Reissmann M, Hofreiter M, Ludwig A (2011) Colours of domestication. Biological Reviews of the Cambridge Philosophical Society 86: 885–899.
33. Levy C, Khaled M, Fisher DE (2006) MITF: master regulator of melanocyte development and melanoma oncogene. Trends in Molecular Medicine 12: 406–414.
34. Buac K, Xu M, Cronin J, Weeraratna AT, Hewitt SM, Pavan WJ (2009) NRG1/ERBB3 signaling in melanocyte development and melanoma: inhibition of differentiation and promotion of proliferation. Pigment cell & melanoma research 22: 773–784.
35. Kubic JD, Young KP, Plummer RS, Ludvik AE, Lang D (2008) Pigmentation PAX-ways: the role of Pax3 in melanogenesis, melanocyte stem cell maintenance, and disease. Pigment Cell & Melanoma Research 21: 627–645.
36. Furumura M, Sakai C, Potterf SB, Vieira WD, Barsh GS, Hearing VJ (1998) Characterization of genes modulated during pheomelanogenesis using differential display. Proceedings of the National Academy of Sciences of the United States of America 95: 7374–7378.
37. Gage PJ, Qian M, Wu D, Rosenberg KI (2008) The canonical Wnt signaling antagonist DKK2 is an essential effector of PITX2 function during normal eye development. Developmental Biology 317: 310–324.
38. Yasumoto K, Takeda K, Saito H, Watanabe K, Takahashi K, Shibahara S (2002) Microphthalmia-associated transcription factor interacts with LEF-1, a mediator of Wnt signaling. The EMBO Journal 21: 2703–2714.
39. Lovicu FJ, Kolle G, Yamada T, Little MH, McAvoy JW (2000) Expression of Crim1 during

4 th Chapter Ambilateral circumocular pigmentation in cattle 91
murine ocular development. Mechanisms of Development 94: 261–265.
40. He L, Gunn TM, Bouley DM, Lu X-Y, Watson SJ, Schlossman SF, et al. (2001) A biochemical function for attractin in agouti-induced pigmentation and obesity. Nat Genet 27: 40–47.
41. Watabe K, Ito A, Asada H, Endo Y, Kobayashi T, Nakamoto K, et al. (2001) Structure, expression and chromosome mapping of MLZE, a novel gene which is preferentially expressed in metastatic melanoma cells. Japanese Journal of Cancer Research: Gann 92: 140–151.
42. Su Y, Balice-Gordon RJ, Hess DM, Landsman DS, Minarcik J, Golden J, et al. (2004) Neurobeachin Is Essential for Neuromuscular Synaptic Transmission. The Journal of Neuroscience 24: 3627 –3636.
43. Faigle W, Raposo G, Amigorena S (2000) Antigen presentation and lysosomal membrane traffic in the Chediak-Higashi syndrome. Protoplasma 210: 117–122.
44. Anderson DE, Chambers D, Lush JL (1957) Studies on Bovine Ocular Squamous Carcinoma (“Cancer Eye”) III. Inheritance of Eyelid Pigmentation. Journal of Animal Science 16: 1007 –1016.
45. Barlow R, O’Neill G (1980) Performance of Hereford and crossbred Hereford cattle in the subtropics of New South Wales: genetic analyses of pre-weaning performance of first-cross calves. Australian Journal of Agricultural Research 31: 417.
46. Goddard ME, Hayes BJ (2009) Mapping genes for complex traits in domestic animals and their use in breeding programmes. Nat Rev Genet 10: 381–391.
47. Klein R (2007) Power analysis for genome-wide association studies. BMC Genetics 8: 58.
48. Chamberlain AJ, McPartlan HC, Goddard ME (2007) The Number of Loci That Affect Milk Production Traits in Dairy Cattle. Genetics 177: 1117–1123.
49. Yang J, Benyamin B, McEvoy BP, Gordon S, Henders AK, Nyholt DR, et al. (2010) Common SNPs explain a large proportion of the heritability for human height. Nat Genet 42: 565–569.
50. Maher B (2008) Personal genomes: The case of the missing heritability. Nature 456: 18–21.
51. Huang L, Li Y, Singleton AB, Hardy JA, Abecasis G, Rosenberg NA, et al. (2009) Genotype-Imputation Accuracy across Worldwide Human Populations. The American Journal of Human Genetics 84: 235–250.
52. Druet T, Schrooten C, de Roos APW (2010) Imputation of genotypes from different single nucleotide polymorphism panels in dairy cattle. Journal of Dairy Science 93: 5443–5454.
53. Chien AJ, Moore EC, Lonsdorf AS, Kulikauskas RM, Rothberg BG, Berger AJ, et al. (2009) Activated Wnt/ß-catenin signaling in melanoma is associated with decreased proliferation in patient tumors and a murine melanoma model. Proceedings of the National Academy of Sciences 106: 1193 –1198.

4 th Chapter Ambilateral circumocular pigmentation in cattle 92
54. Baxter LL, Loftus SK, Pavan WJ (2009) Networks and pathways in pigmentation, health, and disease. Wiley Interdisciplinary Reviews: Systems Biology and Medicine 1: 359–371.
55. Lin JY, Fisher DE (2007) Melanocyte biology and skin pigmentation. Nature 445: 843–850.
56. Picardo M, Cardinali G (2011) The Genetic Determination of Skin Pigmentation: KITLG and the KITLG/c-Kit Pathway as Key Players in the Onset of Human Familial Pigmentary Diseases. J Invest Dermatol 131: 1182–1185.
57. Carlborg O, Haley CS (2004) Epistasis: too often neglected in complex trait studies? Nat Rev Genet 5: 618–625.
58. Song YS, Wang F, Slatkin M (2010) General Epistatic Models of the Risk of Complex Diseases. Genetics 186: 1467 –1473.
59. Lee SH, van der Werf JHJ, Hayes BJ, Goddard ME, Visscher PM (2008) Predicting Unobserved Phenotypes for Complex Traits from Whole-Genome SNP Data. PLoS Genet 4: e1000231.
60. Wong MY, Day NE, Luan JA, Chan KP, Wareham NJ (2003) The detection of gene–environment interaction for continuous traits: should we deal with measurement error by bigger studies or better measurement? International Journal of Epidemiology 32: 51–57.
61. McCarthy MI, Hirschhorn JN (2008) Genome-wide association studies: potential next steps on a genetic journey. Hum. Mol. Genet. 17: R156–165.
62. Cordell HJ (2009) Detecting gene-gene interactions that underlie human diseases. Nature reviews. Genetics 10: 392–404.
63. Pryce JE, Bolormaa S, Chamberlain AJ, Bowman PJ, Savin K, Goddard ME, et al. (2010) A validated genome-wide association study in 2 dairy cattle breeds for milk production and fertility traits using variable length haplotypes. Journal of Dairy Science 93: 3331–3345.
64. Karim L, Takeda H, Lin L, Druet T, Arias JAC, Baurain D, et al. (2011) Variants modulating the expression of a chromosome domain encompassing PLAG1 influence bovine stature. Nat Genet 43: 405–413.
65. Anderson DE (1963) Genetic aspects of cancer with special reference to cancer of the eye in the bovine. Annals of the New York Academy of Sciences 108: 948–962.

4 th Chapter Ambilateral circumocular pigmentation in cattle – Supporting information 93
Supporting information for the
4th Chapter
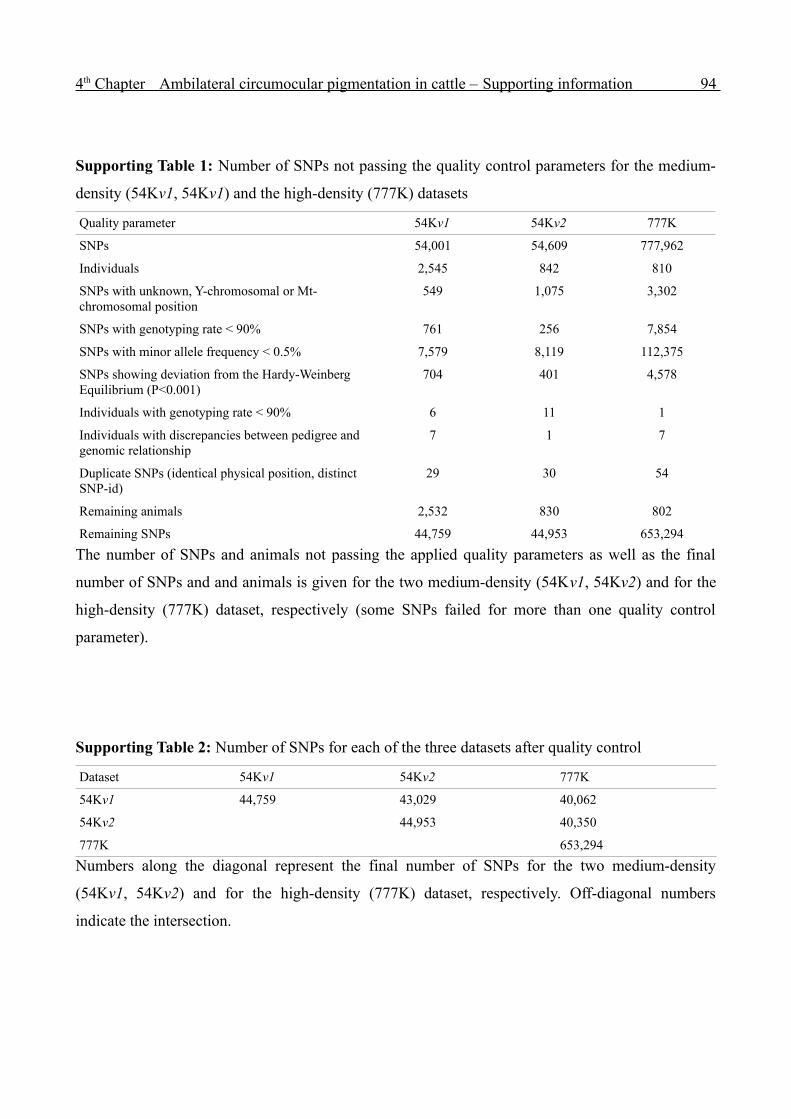
4 th Chapter Ambilateral circumocular pigmentation in cattle – Supporting information 94
Supporting Table 1: Number of SNPs not passing the quality control parameters for the medium-
density (54Kv1, 54Kv1) and the high-density (777K) datasets
Quality parameter 54Kv1 54Kv2 777K
SNPs 54,001 54,609 777,962
Individuals 2,545 842 810
SNPs with unknown, Y-chromosomal or Mt-chromosomal position
549 1,075 3,302
SNPs with genotyping rate < 90% 761 256 7,854
SNPs with minor allele frequency < 0.5% 7,579 8,119 112,375
SNPs showing deviation from the Hardy-Weinberg Equilibrium (P<0.001)
704 401 4,578
Individuals with genotyping rate < 90% 6 11 1
Individuals with discrepancies between pedigree and genomic relationship
7 1 7
Duplicate SNPs (identical physical position, distinct SNP-id)
29 30 54
Remaining animals 2,532 830 802
Remaining SNPs 44,759 44,953 653,294
The number of SNPs and animals not passing the applied quality parameters as well as the final
number of SNPs and and animals is given for the two medium-density (54Kv1, 54Kv2) and for the
high-density (777K) dataset, respectively (some SNPs failed for more than one quality control
parameter).
Supporting Table 2: Number of SNPs for each of the three datasets after quality control
Dataset 54Kv1 54Kv2 777K
54Kv1 44,759 43,029 40,062
54Kv2 44,953 40,350
777K 653,294
Numbers along the diagonal represent the final number of SNPs for the two medium-density
(54Kv1, 54Kv2) and for the high-density (777K) dataset, respectively. Off-diagonal numbers
indicate the intersection.

4 th Chapter Ambilateral circumocular pigmentation in cattle – Supporting information 95
Supporting Table 3: Number of animals for each of the three datasets after quality control
Dataset 54Kv1 54Kv2 777K
54Kv1 2,532 - 521
54Kv2 830 -
777K 802
Numbers along the diagonal represent the final number of animals for the two medium-density
(54Kv1, 54Kv2) and for the high-density (777K) dataset, respectively. Off-diagonal numbers
indicate the intersection.
Supporting Table 4: Number of SNPs used for the evaluation of the imputation accuracy
Chromo-
some
Chromosome
length [Mb]
Number of high-
density SNPs
Average distance
between two high-
density SNPs [bp]
Number of
medium-
density SNPs
Average distance
between two
medium-density
SNPs [bp]
1 158.34 40,100 3948 2607 60,665
2 137.06 33,962 4024 2070 65,977
3 121.43 30,848 3935 1907 63,520
4 120.83 30,482 3957 1936 62,235
5 121.19 29,777 4069 1648 73,515
6 119.46 30,781 3880 1969 60,474
7 112.64 28,290 3981 1751 64,219
8 113.38 24,935 4546 1812 62,346
9 105.71 26,663 3964 1578 66,877
10 104.3 27,127 3844 1652 62,440
11 107.31 28,544 3758 1691 63,419
12 91.16 22,267 4091 1280 71,106
13 84.24 18,409 4569 1372 61,149
14 84.65 19,369 4339 1418 58,682
15 85.3 21,860 3899 1267 66,809
16 81.72 21,055 3878 1249 65,104
17 75.15 19,808 3793 1223 61,280
18 66 17,556 3751 1008 64,947
19 64.06 17,289 3699 1058 60,115
20 72.04 19,426 3703 1193 60,022
21 71.6 18,336 3903 1056 67,461
22 61.44 16,605 3691 995 61,529

4 th Chapter Ambilateral circumocular pigmentation in cattle – Supporting information 96
23 52.53 13,751 3815 811 64,475
24 62.71 15,987 3918 973 63,891
25 42.9 11,947 3581 743 57,610
26 51.68 13,932 3707 834 61,168
27 45.41 11,948 3800 735 61,761
28 46.31 11,832 3909 736 62,794
29 51.51 13,302 3864 800 63,958
30 148.82 17,106 8699 690 215,681

4 th Chapter Ambilateral circumocular pigmentation in cattle – Supporting information 97
Supporting Figure 1: Distribution of the applied phenotype.
The boxplot (A) and histogram (B) display the distribution of the square root transformed
proportion of daughters with ambilateral circumocular pigmentation. The deviation from the
expected Gaussian normal distribution is only marginal (C). 66.67%, 95.87% and 99.89% of the
values are within one two and three standard deviations, respectively.
Supporting Figure 2: Accuracy of the imputed genotypes.
Imputation accuracy was assessed based on genotypes of 613,232 chromosome-wide distributed
SNPs of 402 animals. The proportion of correctly imputed alleles is displayed as a function of the
allele frequency. The boxplots show the results for allele frequency bins of 2.5%. The concordance
between imputed and true allele was poor (41.06%) for rare alleles (i.e. alleles with a frequency
<2.5%), while imputation of frequent alleles (i.e. alleles with a frequency >65%) resulted in an
allelic concordance > 99%.

4 th Chapter Ambilateral circumocular pigmentation in cattle – Supporting information 98
Supporting Figure 3: Detailed overview of the identified QTL
The gene content of the QTL regions on BTA2 (A,B), BTA5 (C, D), BTA6 (E, F), BTA11 (G),
BTA13 (H), BTA14 (I) and BTA22 (J, K, L) was assessed based on the University of Maryland
(UMD3.1) assembly of the bovine genome. Red colour indicates the putative functional candidate
gene. The diamond represents the most significantly associated SNP while different colours
represent the linkage disequilibrium (r2) between the most significantly associated SNP and all
other SNPs within the displayed region. The heatmap displays the pairwise linkage disequilibrium.
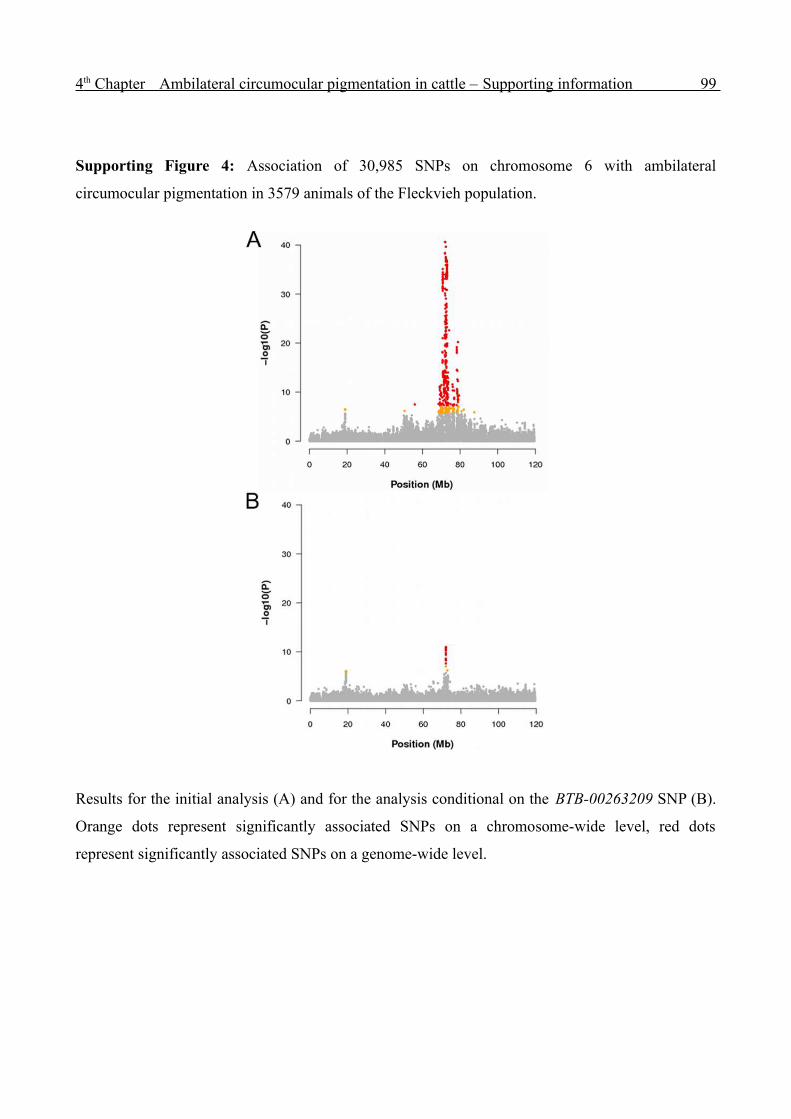
4 th Chapter Ambilateral circumocular pigmentation in cattle – Supporting information 99
Supporting Figure 4: Association of 30,985 SNPs on chromosome 6 with ambilateral
circumocular pigmentation in 3579 animals of the Fleckvieh population.
Results for the initial analysis (A) and for the analysis conditional on the BTB-00263209 SNP (B).
Orange dots represent significantly associated SNPs on a chromosome-wide level, red dots
represent significantly associated SNPs on a genome-wide level.

4 th Chapter Ambilateral circumocular pigmentation in cattle – Supporting information 100
Supporting Figure 5: Association of 16,722 SNPs on chromosome 22 with ambilateral
circumocular pigmentation in 3579 animals of the Fleckvieh population.
Results for the initial analysis (A) and for the analysis conditional on the BovineHD2200009208
SNP (B). Orange dots represent significantly associated SNPs on a chromosome-wide scale, red
dots represent significantly associated SNPs on a genome-wide scale.

4 th Chapter Ambilateral circumocular pigmentation in cattle – Supporting information 101
Supporting Figure 6: Effect of different marker densities on the chromosomal partitioning of the
genetic variance.
The grey and blue bars indicate the fraction of phenotypic variance attributed to a particular
chromosome using the genomic relationship matrices built based on medium-density and high-
density SNP information, respectively.
Supporting Figure 7: Correlation between chromosome length and the fraction of phenotypic
variance explained.
The estimate of the proportion of phenotypic variance explained by a particular chromosome is
displayed as a function of the physical chromosome length (in Mb units). Red numbers indicate
chromosomes with identified QTL. The blue line is a linear regression line with slope 3.2 x 10⁻⁴ (r2
= 0.06).

5th Chapter
General Discussion

5 th Chapter General Discussion 103
General approach
Genome-wide association studies (GWAS) were performed in the German Fleckvieh (FV)
population in an attempt to identify underlying genomic regions for complex traits by using high-
density SNP panels. Massive structuring of the study population and the resulting inflation of false
positive association signals was accounted for by using principal components analysis and mixed
model based approaches, respectively. The utilisation of highly heritable progeny-derived
phenotypes facilitated the mapping of 18 quantitative trait loci (QTL) for paternal calving ease, the
presence of supernumerary teats and ambilateral circumocular pigmentation in the FV population.
Using progeny-derived phenotypes for genome-wide association analyses
Phenotypes for most economically important traits are recorded in female animals in cattle breeding
programs. The genetic value of male animals can be obtained for these traits via breeding value
estimation [1]. The resulting breeding values are highly heritable as they are assessed based on a
large number of progeny records. Georges et al. [2] demonstrated the leverage potential of applying
progeny-derived phenotypes for QTL mapping in granddaughter designs. Using highly heritable
phenotypes also considerably increases the power to identify QTL in GWAS [3],[4]. In Chapter 2 of
the present thesis, the mapping of two QTL affecting calving ease, a trait with low heritability (h2 <
10% [5],[6]) was facilitated by using estimated breeding values (EBVs) for a comparatively small
sample of 1829 artificial insemination bulls of the German FV population. However, using EBVs as
phenotypes for GWAS is supposed to cause a substantial inflation of false positive associations as
EBVs accumulate family information [7]. A widely-used approach to account for the contribution of
relatives is de-regressing the EBVs and weighting the information source appropriately [8].
Nevertheless, daughter yield deviations (DYDs) were claimed to be the phenotypes of choice for
QTL studies in pedigreed populations [9],[10]. DYDs reflect the progeny average and are thus not
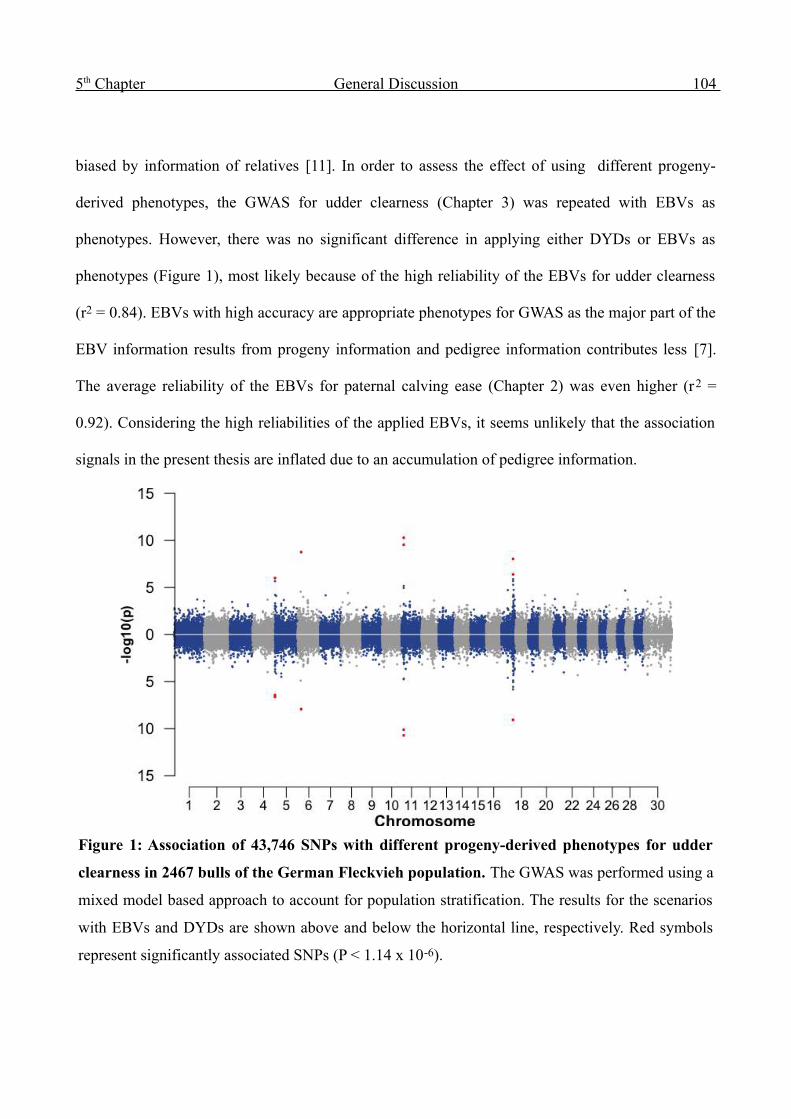
5 th Chapter General Discussion 104
biased by information of relatives [11]. In order to assess the effect of using different progeny-
derived phenotypes, the GWAS for udder clearness (Chapter 3) was repeated with EBVs as
phenotypes. However, there was no significant difference in applying either DYDs or EBVs as
phenotypes (Figure 1), most likely because of the high reliability of the EBVs for udder clearness
(r2 = 0.84). EBVs with high accuracy are appropriate phenotypes for GWAS as the major part of the
EBV information results from progeny information and pedigree information contributes less [7].
The average reliability of the EBVs for paternal calving ease (Chapter 2) was even higher (r2 =
0.92). Considering the high reliabilities of the applied EBVs, it seems unlikely that the association
signals in the present thesis are inflated due to an accumulation of pedigree information.
Figure 1: Association of 43,746 SNPs with different progeny-derived phenotypes for udder
clearness in 2467 bulls of the German Fleckvieh population. The GWAS was performed using a
mixed model based approach to account for population stratification. The results for the scenarios
with EBVs and DYDs are shown above and below the horizontal line, respectively. Red symbols
represent significantly associated SNPs (P < 1.14 x 10⁻⁶).

5 th Chapter General Discussion 105
This thesis provides evidence for the leverage potential of applying progeny-derived phenotypes for
the identification of QTL for complex traits in livestock populations. Using EBVs is especially
beneficial for the mapping of QTL for functional traits with low heritability such as calving ease
(Chapter 2). However, progeny-derived phenotypes act purely additively as they are not directly
assessed in the genotyped animals. Therefore, they do not allow to unravel non-additive effects.
However, non-additive effects such as epistasis and dominance might substantially contribute to the
genetic variation of complex traits [12],[13]. The GWAS in Chapter 4 identified candidate genes for
eye-area pigmentation that are well known to interact in a complex fashion, however the data did
not allow to quantify the extent of non-additive effects. Access to direct phenotypes and genotyping
of female animals, respectively, is indispensable to quantify the extent of non-additive effects for
the analysed traits.
Genetic architecture of the analysed traits
The results of the GWAS confirm the infinitesimal model with numerous loci with small effects and
only few loci with large effects for three analysed traits [14]. Two, four and twelve major loci were
identified for paternal calving ease, the presence of supernumerary teats and the proportion of
daughters with ambilateral circumocular pigmentation, respectively. The significantly associated
regions explain from 10% to 45% of the respective trait variation and can be considered as the
major genetic determinants for the traits in the FV population. Increasing the sample size and
applying denser SNP panels might allow for the identification of additional QTL with smaller
effects [3], however the number of detectable QTL is even limited in large scale GWAS [15] and
depends on the genetic architecture of the trait [16],[17]. In the present thesis, QTL could be
identified on chromosomes explaining a large fraction of the trait variation (Figure 2). However, a
substantial fraction of the trait variation results from chromosomal regions without identified QTL.
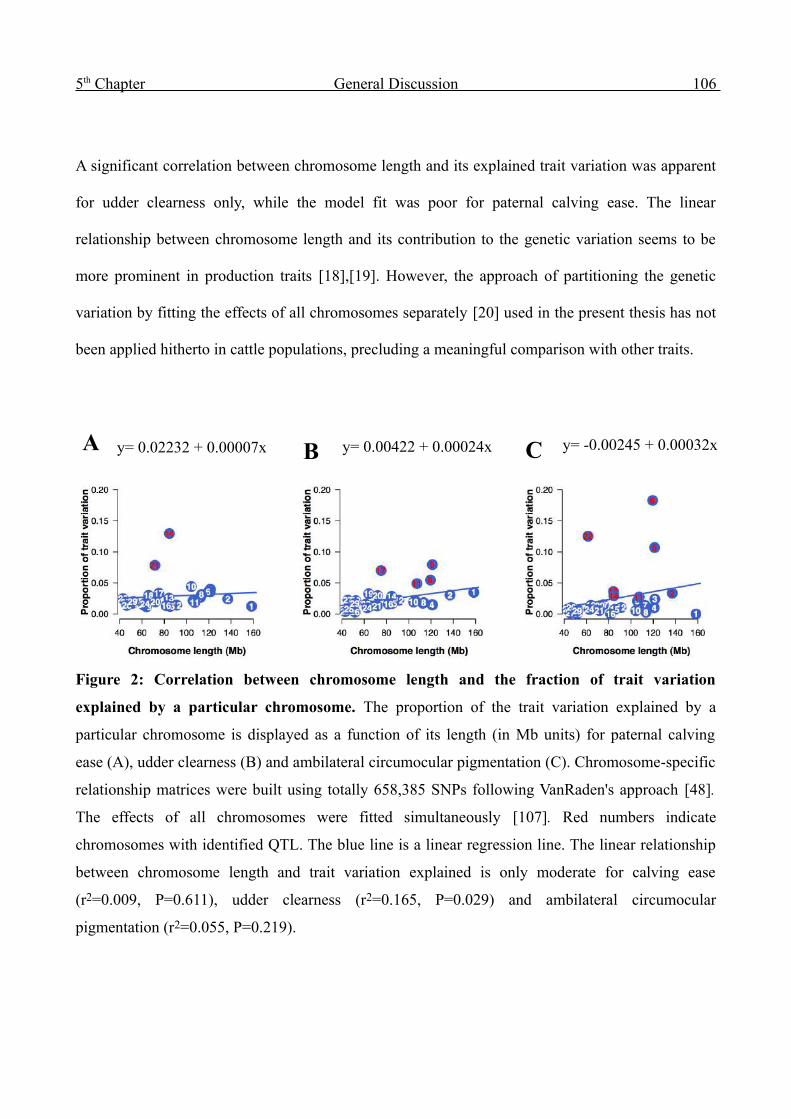
5 th Chapter General Discussion 106
A significant correlation between chromosome length and its explained trait variation was apparent
for udder clearness only, while the model fit was poor for paternal calving ease. The linear
relationship between chromosome length and its contribution to the genetic variation seems to be
more prominent in production traits [18],[19]. However, the approach of partitioning the genetic
variation by fitting the effects of all chromosomes separately [20] used in the present thesis has not
been applied hitherto in cattle populations, precluding a meaningful comparison with other traits.
Figure 2: Correlation between chromosome length and the fraction of trait variation
explained by a particular chromosome. The proportion of the trait variation explained by a
particular chromosome is displayed as a function of its length (in Mb units) for paternal calving
ease (A), udder clearness (B) and ambilateral circumocular pigmentation (C). Chromosome-specific
relationship matrices were built using totally 658,385 SNPs following VanRaden's approach [48].
The effects of all chromosomes were fitted simultaneously [107]. Red numbers indicate
chromosomes with identified QTL. The blue line is a linear regression line. The linear relationship
between chromosome length and trait variation explained is only moderate for calving ease
(r2=0.009, P=0.611), udder clearness (r2=0.165, P=0.029) and ambilateral circumocular
pigmentation (r2=0.055, P=0.219).
y= 0.02232 + 0.00007x y= 0.00422 + 0.00024x y= -0.00245 + 0.00032xA B C
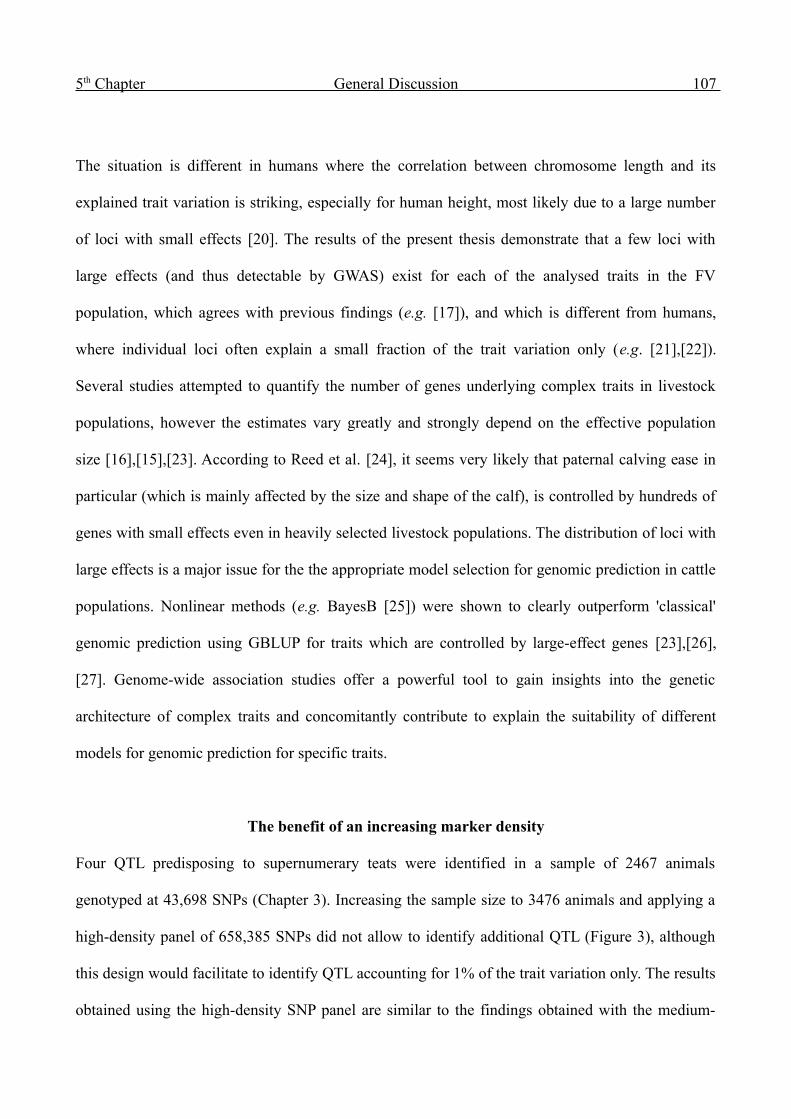
5 th Chapter General Discussion 107
The situation is different in humans where the correlation between chromosome length and its
explained trait variation is striking, especially for human height, most likely due to a large number
of loci with small effects [20]. The results of the present thesis demonstrate that a few loci with
large effects (and thus detectable by GWAS) exist for each of the analysed traits in the FV
population, which agrees with previous findings (e.g. [17]), and which is different from humans,
where individual loci often explain a small fraction of the trait variation only (e.g. [21],[22]).
Several studies attempted to quantify the number of genes underlying complex traits in livestock
populations, however the estimates vary greatly and strongly depend on the effective population
size [16],[15],[23]. According to Reed et al. [24], it seems very likely that paternal calving ease in
particular (which is mainly affected by the size and shape of the calf), is controlled by hundreds of
genes with small effects even in heavily selected livestock populations. The distribution of loci with
large effects is a major issue for the the appropriate model selection for genomic prediction in cattle
populations. Nonlinear methods (e.g. BayesB [25]) were shown to clearly outperform 'classical'
genomic prediction using GBLUP for traits which are controlled by large-effect genes [23],[26],
[27]. Genome-wide association studies offer a powerful tool to gain insights into the genetic
architecture of complex traits and concomitantly contribute to explain the suitability of different
models for genomic prediction for specific traits.
The benefit of an increasing marker density
Four QTL predisposing to supernumerary teats were identified in a sample of 2467 animals
genotyped at 43,698 SNPs (Chapter 3). Increasing the sample size to 3476 animals and applying a
high-density panel of 658,385 SNPs did not allow to identify additional QTL (Figure 3), although
this design would facilitate to identify QTL accounting for 1% of the trait variation only. The results
obtained using the high-density SNP panel are similar to the findings obtained with the medium-

5 th Chapter General Discussion 108
density dataset. This implies that increasing the sample size is more important for QTL detection
than increasing the number of SNPs. A number of ~40,000 SNPs seems sufficient for genome-wide
analyses in cattle populations [28]. Similar conclusions are drawn in studies considering genomic
selection where improving the accuracy of genomic predictions is the most important issue. While
enlarging the reference population substantially increases the accuracy of genomic breeding values,
applying denser SNP panels results in moderate gain only [29],[30].
The utility of high-density SNP panels for genome-wide analysis of complex traits in cattle has so
far been evaluated for the Holstein-Friesian (HF) populations only. However, the characteristics of
distinct cattle populations differ considerably [31]. While the effective population size (Ne) for HF
is < 100 [32],[33],[34], a Ne of ~140 was estimated for the FV population (see Appendix). Ne is the
major determinant for the number of existing independent chromosome segments [23], implying
that denser SNP panels are necessary to capture the genetic variation for populations with large Ne.
Although increasing the SNP density did not allow for the identification of additional QTL for
supernumerary teats, the results presented in Chapter 4 provide evidence for the advantage of
applying high-density SNP panels for genome-wide analysis of complex traits in the FV population.
The medium-density and the high-density SNP map account for 88.56% and 93.22% of the
heritability, respectively. Furthermore, the P-values obtained using the high-density SNP panel are
clearly smaller than those obtained using the medium-density SNP panel (Figure 3). These findings
provide evidence that the increased density of the 777K-panel allows to pinpoint QTL in cattle
populations much more precisely than the 54K-panel. The very dense SNP map enables to capture
genetic effects at a better resolution and might result in substantially higher accuracies of genomic
breeding values at least in the FV population.
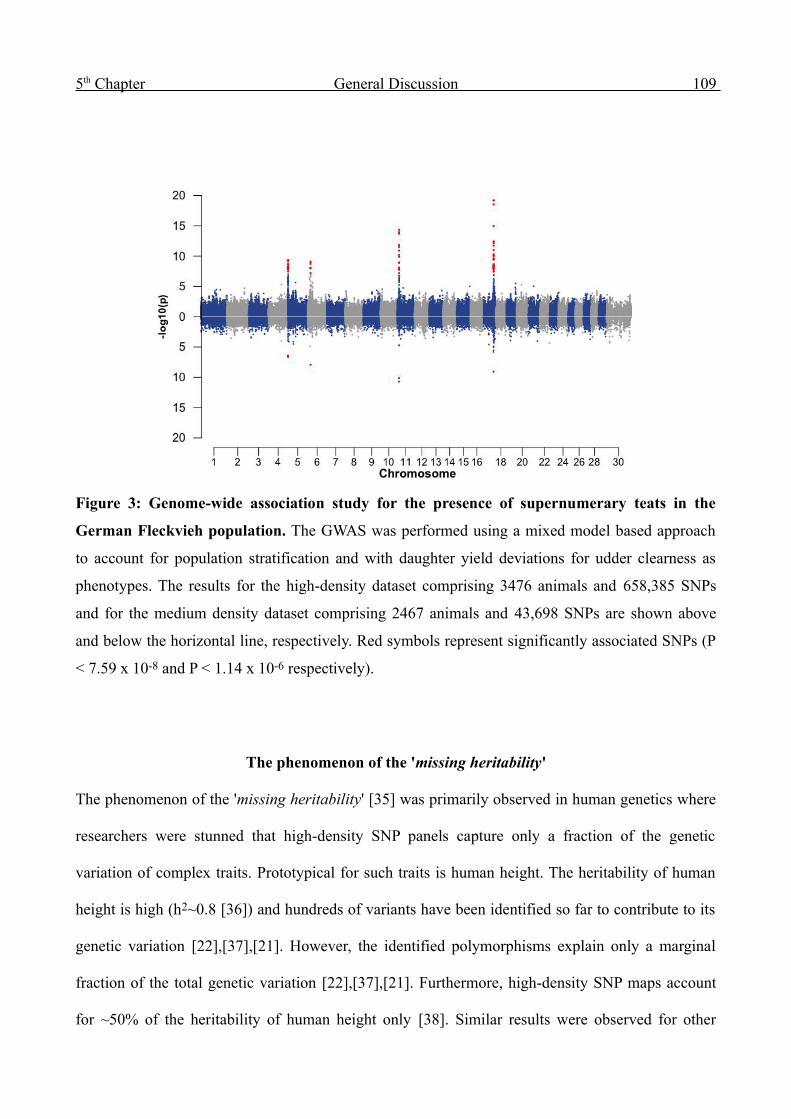
5 th Chapter General Discussion 109
The phenomenon of the 'missing heritability'
The phenomenon of the 'missing heritability' [35] was primarily observed in human genetics where
researchers were stunned that high-density SNP panels capture only a fraction of the genetic
variation of complex traits. Prototypical for such traits is human height. The heritability of human
height is high (h2~0.8 [36]) and hundreds of variants have been identified so far to contribute to its
genetic variation [22],[37],[21]. However, the identified polymorphisms explain only a marginal
fraction of the total genetic variation [22],[37],[21]. Furthermore, high-density SNP maps account
for ~50% of the heritability of human height only [38]. Similar results were observed for other
Figure 3: Genome-wide association study for the presence of supernumerary teats in the
German Fleckvieh population. The GWAS was performed using a mixed model based approach
to account for population stratification and with daughter yield deviations for udder clearness as
phenotypes. The results for the high-density dataset comprising 3476 animals and 658,385 SNPs
and for the medium density dataset comprising 2467 animals and 43,698 SNPs are shown above
and below the horizontal line, respectively. Red symbols represent significantly associated SNPs (P
< 7.59 x 10⁻⁸ and P < 1.14 x 10⁻⁶ respectively).

5 th Chapter General Discussion 110
complex [20] and mendelian traits [39]. The authors claim that both imperfect linkage
disequilibrium (LD) between causal variants and array-based SNPs and rare variants, that are not
captured by common genotyping arrays, are the reason for the missing heritability [38]. However,
recent investigations also indicate, that genetic interactions might cause 'phantom heritability',
implying an inflation of pedigree-based heritability estimates [40]. The situation in cattle
populations seems to be different. Individual loci explain a large fraction of the genetic variation of
complex traits (Chapter 4, [17],[41]) and the fraction of genetic variation captured by SNPs is
considerably higher in cattle populations than in humans [42],[43],[44]. It is supposed that the
number of rare variants contributing to the genetic variation of complex traits is much lower in
livestock populations than in humans [43] due to strong artificial selection and a distinctly smaller
number of independent chromosomal segments [23]. Goddard and Hayes [45] showed that the
number of detectable QTL (QTL with moderate to large effects) remains unchanged while the
number of QTL with small effect size decreases considerably under artificial selection. The findings
of this thesis support this hypothesis, as a small number of QTL with medium to large effects was
identified for each of the analysed traits. The missing heritability for ambilateral circumocular
pigmentation was estimated to be only 7% in the FV population when using high-density SNP
panels (Chapter 4). The results of the present thesis imply that applying denser SNP panels is
beneficial in the FV population (Table 1) which agrees with previous simulation experiments in
cattle [46]. However, investigations in humans and model organisms indicate, that increasing the
number of SNPs above a certain density does not increase the estimates of the genomic heritability
[38],[47], which, again, can be explained by a large Ne and thus a larger number of rare variants
contributing to the genetic variation of complex traits in these species.

5 th Chapter General Discussion 111
Table 1: Heritability estimates for three complex traits in the FV population
NRM GRM (45K) GRM (658K)
Ambilateral circumocular pigmentation
0.796 0.699 0.736
Udder clearness (EBV) 0.976 0.694 0.725
Udder clearness (DYD) 0.598 0.560 0.585
Paternal calving ease 0.985 0.814 0.844
The heritabilities were estimated by fitting either the pedigree-based relationship matrix (NRM) or
the genomic relationship matrix (GRM) in a random effect model. The relationship matrices were
built for 3645 artificial insemination bulls of the FV population. The pedigree relationship was built
tracing back pedigree information to 1920. The genomic relationship matrices were built following
VanRaden's approach [48] and were based upon medium-density (~45K) and high-density (~658K)
SNP information.
Using high-density SNP panels for the identification of mendelian traits in cattle
Besides the genome-wide analysis of complex traits and concomitant genomic evaluation of
populations, high-density SNP panels offer an invaluable tool for the identification of mendelian
disorders in livestock species [49],[50]. As individual artificial insemination bulls generate tens of
thousands of progeny, deleterious alleles may accumulate within few generations and sustainably
endanger existing breeding schemes [51],[52]. The availability of high-density genotype
information facilitates the systematic identification of segments of extended homozygosity (i.e.
autozygosity) in affected animals (see Appendix). However, very dense SNP panels are required to
detect autozygous segments when a large number of generations separates the affected animals from
the founder of the mutation [53],[54]. Thus, the power to pinpoint chromosomal segments
underlying emerging congenital defects is considerably increased by using the recently introduced
high-density SNP panels comprising more than 650,000 SNPs.

5 th Chapter General Discussion 112
Biological relevance of the identified QTL
The present study identified QTL for three breeding objectives of the FV breeding program.
Calving ease is a major breeding objective in cattle populations as calving difficulties (dystocia) are
often accompanied with calf losses and thus substantially compromise animal and economical
welfare. Furthermore, dystocia seriously compromises milk production and reproductive
performance of pertinently affected cows [55],[56],[57],[58]. The present study provides evidence
that two major QTL on BTA14 and BTA21 explain a large fraction of the genetic variation of
calving difficulties most likely due to enhancing fetal growth. Selection of animals carrying
favourable QTL alleles might rapidly reduce the incidence of calving difficulties. However, as the
two QTL also explain a substantial fraction of the genetic variation of daily gain and body size,
such selection is likely to counteract postnatal growth parameters. Nevertheless, reducing calving
difficulties and concomitantly enhancing postnatal growth parameters is possible in cattle
populations [59]. A polymorphism ablating a polyadenylation signal of the gene encoding the
ribosomal protein S20 (RPS20) was supposed to be the underlying QTN for the BTA14 QTL. In the
meantime Karim et al. [60] and Littlejohn et al. [61] provided evidence that variants modulating the
expression of PLAG1, an adjacent gene of RPS20, are likely to be the underlying polymorphisms
for the growth QTL on BTA14. However, the final proof of causality remains left.
The QTL affecting the development of supernumerary teats (SNTs) pinpoint genes of the highly
conserved Wnt signalling pathway. The present study confirms the proposed oligogenic inheritance
pattern of SNTs in cattle [62], although the presence of supernumerary nipples/teats has been
attributed to different modes of monogenic inheritance in other mammals [63],[64],[65]. The
incidence of supernumerary nipples in humans was hitherto exclusively attributed to variations
within TBX3 [66],[67],[68], a gene that was also identified to be associated with SNTs in the present
study. Despite the high frequency of supernumerary nipples in humans [69], the identification of

5 th Chapter General Discussion 113
underlying variants was performed in small-sized family designs only. GWAS have not been
performed yet. As supernumerary features of the mammary line appear from rudimentary buds to
fully developed lactating glands (polymastia) [70], it seems plausible that variation within one gene
(e.g. TBX3) is required for the development of SNTs while polymorphisms within distinct genes
(e.g. EXOC1, LEF1) determine the shape of SNTs [71]. Accessory mammary tissue accompanies
with an increased incidence of urogenital malformations and urogenital cancer in humans [72],[73].
Although the number of investigations is limited, there is evidence for a correlation between the
presence of SNTs and fertility traits in cattle [74]. Reducing the incidence of SNTs might thus
increase the reproductive performance in cattle, however additional investigations are necessary to
confirm this hypothesis. While SNTs in cattle negatively affect milking ability and act as bacteria
reservoir [75],[76], teat number and teat morphology are important reproduction traits in swine
breeding programs [77]. Several QTL have been identified for teat number and teat malformations
in swine [78],[79]. It seems likely that the QTL identified in the present study determine both the
teat number and the teat morphology even in other species than cattle.
Chapter 4 reports the first GWAS in cattle based on a high-density map of >650,000 SNPs. The
mapping of twelve QTL regions affecting a special aspect of skin pigmentation was facilitated by
introducing progeny-derived phenotypes for the bulls. The results confirm that ambilateral
circumocular pigmentation (ACOP) is highly heritable in cattle [80]. Applying rather progeny-
derived than direct phenotypes for the genotyped bulls even increased the heritability to 79%.
ACOP considerably reduces the incidence of serious eye diseases in areas where animals are
exposed to increased solar UV radiation [80],[81],[82]. Although the twelve identified QTL regions
already account for 56.91% of the heritability, applying the entire high-density SNP panel allows to
most efficiently select for animals with ACOP. Currently, EBVs for ACOP are not available for the
German FV population. However, especially South African cattle breeding organisations demand

5 th Chapter General Discussion 114
animals with eye-area pigmentation (http://www.wsff.info). Breeding values for ACOP are likely to
increase the attractiveness of the FV breed and might contribute to enlarge the FV population
beyond Europe. The present study certainly demonstrates the leverage potential of applying
progeny-derived phenotypes for efficient selection of animals with eye-area pigmentation.
Quality of the current bovine genome build
The chromosomal position of the SNPs as well as the gene content of associated genomic regions
was determined based on the UMD3.1 assembly of the bovine genome [83]. However, as the
number of re-sequenced animals is still limited, the current assembly relies on sequence information
of a single animal and still contains a significant number of gaps [31]. Thus, the current assembly
must still be considered as a draft version. For instance, the lack of detailed knowledge about the
genomic organization of the proximal region of BTA21 precluded to further dissect one of the QTLs
for paternal calving ease in the present study (Chapter 2). Significant improvements of the bovine
assembly are expected in the near future due to numerous finished and ongoing bovine sequencing
projects [84],[85],[86],[87]. Furthermore, the applied SNP panels contain both a substantial number
of SNPs with undetermined position and a significant number of misplaced SNPs [88],[89] which
are uninformative for GWAS. For the high-density dataset, 5039 (0.65%) misplaced SNPs were
identified (see Appendix). Although incorrectly placed SNPs are particularly obstructive for
haplotype-based analysis such as homozygosity mapping and the identification of selective sweeps
[90], the position of significantly associated SNPs should also be validated in GWAS to avoid
misinterpretation of significant associations [91].

5 th Chapter General Discussion 115
Reproducibility of the associations
The replication of significantly associated genomic regions in independent populations is crucial to
validate identified QTL [92]. However, some phenotype patterns are present in few cattle breeds
only (e.g. eye-area pigmentation), rendering the access to large validation sets a difficult task.
Dividing the mapping population into reference and validation population overcomes this issue
[93], albeit at the cost of loosing power to detect association. The present study used progeny-
derived phenotypes (EBVs, DYDs), as the recording of direct phenotypes for a large number of
animals was not feasible. The replication of association signals resulting from GWAS using EBVs
requires similar definitions of EBVs in the discovery and the validation population. However,
underlying models for breeding value estimation differ between cattle breeds. Associations in
validation populations might be biased when the used phenotypes differ only slightly [94]. This
issue is especially apparent considering breeding values for calving traits, where evaluation models
differ substantially among cattle breeds [5]. Two QTL explaining a large fraction of the genetic
variation of paternal calving ease and growth related traits were identified on BTA14 and BTA21 in
the FV population (Chapter 2). However, neither the QTL on BTA14 nor the QTL on BTA21 was
identified in a replication study with 2339 HF animals genotyped at 44,245 SNPs (Figure 4). The
GWAS in HF revealed strong association at the distal region of BTA18 (position of the most
significantly associated SNP (UMD3.1-assembly): 56,561,695 bp) which agrees with the findings
of Cole et al. [95]. Neither the GWAS performed in this thesis nor GWAS in the American HF
population [95],[96] provide evidence for the presence of a QTL on BTA14 in the HF population.
However, in the meantime the QTL for birth weight and growth related traits on BTA14 was
validated in numerous independent studies [60],[61],[97],[98]. Several explanations are plausible
for the lack of association in the HF population. On the one hand there is the possibility that the
QTL is not segregating in the HF population. However, Karim et al. [60] showed that the QTL on

5 th Chapter General Discussion 116
BTA14 indeed segregates in the HF population at high frequency (0.78). On the other hand it seems
likely that the QTL accounts for a small fraction of the genetic variation only, requiring larger
sample sizes for its detection. However, there is evidence that the QTL accounts for a comparatively
large fraction of the genetic variation of growth-related traits in HF [60] and thus should be
detectable in the sample consisting of 2339 HF animals. Using high-heritability phenotypes (such as
EBVs) should allow to detect QTL accounting for at least 3% of the trait variation in a sample of
2339 genotyped animals (see Chapter 2). Most likely, the QTL remained undetected in the HF
sample because of the rather indirect phenotype 'paternal calving ease'. As EBVs for paternal
calving traits mainly reflect fetal growth, birth weight would be a more precise phenotype to
identify QTL for fetal growth. The heritability for birth weight is considerably higher than for
calving traits [99]. However, data collecting for birth weight is expensive and time consuming and
thus not standardised in cattle breeding programs. Additionally, Seidenspinner et al. [5] pointed out
that parity-specific phenotypes are preferable for the mapping of calving traits in cattle, whereas
EBVs for paternal calving traits are currently estimated across parities in the German HF population
(http://www.vit.de).
In summary, these findings show that precisely defined phenotypes are indispensable for the
replication of association signals in validation populations which is also emphasized by Barendse
[94]. Furthermore, this is evidence that QTL explaining a large fraction of the trait variation might
remain undetected in validation populations without well-defined phenotypes. Although the
replication of associations in validation populations is currently considered as the gold standard to
define true variants [92], an unsuccessful replication study should not be considered as the criterion
for excluding potentially functional variants. Nevertheless, fine mapping of QTL regions and
subsequent identification of underlying genetic variants requires independent validation populations
to distinguish between true and linked polymorphisms [100].

5 th Chapter General Discussion 117
Impacts for practical animal breeding
The integration of underlying genetic variants in breeding programs (i.e. marker assisted selection,
MAS) enhances genetic gain, especially for low-heritability and heavily accessible traits [101],
[102]. Thus, MAS based on the identified QTL for calving ease might add a valuable tool to reduce
the incidence of dystocia in cattle. However, the present study provides markers in LD with the
QTN only. Addressing the QTN directly would be more efficient and persistent [103],[102]. The
success of MAS mainly depends on the fraction of genetic variation explained by the markers.
According to Meuwissen and van Arendonk [104], MAS based on two markers explaining
approximately 10% of the trait variation should increase genetic gain by 4% in conventional
progeny-testing breeding schemes. However, the concept of MAS appears obsolete in the era of
genomic selection where genotype information of tens of thousands of SNPs is considered
simultaneously to assess the genetic value of individuals [25]. The results in Chapter 4 demonstrate
that twelve major QTL indeed account for 56.91% of the heritability, but a substantial fraction of
Figure 4: Genome-wide association study for paternal calving ease in the German Holstein-
Friesian population. After stringent quality control, 2339 animals and 44,245 SNPs were used for
the association analysis. The GWAS was performed using a mixed model based approach to
account for population stratification and with estimated breeding values for paternal calving ease as
phenotypes. Red symbols represent genome-wide significantly associated SNPs (P < 1.13 x 10⁻⁶).

5 th Chapter General Discussion 118
the heritability is attributable to anonymous SNPs. Genome-wide evaluation of populations utilizes
both QTL variation as well as polygenic variation and thus results in higher genetic gain than MAS.
Nevertheless, as the reliabilities of genomic breeding values depend on the heritability of the trait
[105], the integration of QTN-information in genomic breeding schemes might add a valuable tool
to increase the reliabilities for functional traits. Furthermore, using highly informative markers for
MAS might be especially useful for improving small livestock populations where a limited number
of animals precludes efficient genomic selection [27],[106].
References
1. Henderson CR (1953) Estimation of Variance and Covariance Components. Biometrics 9: 226–252.
2. Georges M, Nielsen D, Mackinnon M, Mishra A, Okimoto R, Pasquino AT, et al. (1995) Mapping Quantitative Trait Loci Controlling Milk Production in Dairy Cattle by Exploiting Progeny Testing. Genetics 139: 907 –920.
3. Goddard ME, Hayes BJ (2009) Mapping genes for complex traits in domestic animals and their use in breeding programmes. Nat Rev Genet 10: 381–391.
4. Feng S, Wang S, Chen C-C, Lan L (2011) GWAPower: a statistical power calculation software for genome-wide association studies with quantitative traits. BMC Genetics 12: 12.
5. Seidenspinner T, Bennewitz J, Reinhardt F, Thaller G (2009) Need for sharp phenotypes in QTL detection for calving traits in dairy cattle. Journal of Animal Breeding and Genetics = Zeitschrift Für Tierzüchtung Und Züchtungsbiologie 126: 455–462.
6. Steinbock L, Nasholm A, Berglund B, Johansson K, Philipsson J (2003) Genetic Effects on Stillbirth and Calving Difficulty in Swedish Holsteins at First and Second Calving. J. Dairy Sci. 86: 2228–2235.
7. Ekine CC, Rowe SJ, Bishop SC, de Koning DJ (2010) What Is The Best Phenotype For Genome-Wide Association Studies In Data With Defined Pedigrees. Proceedings of the 9th World Congress on Genetic Applied to Livestock Production (WCGALP), Leipzig, Germany
8. Garrick Dorian TJ (2009) Deregressing estimated breeding values and weighting information for genomic regression analyses. Genetics Selection Evolution 41: 55.
9. Hoeschele I, VanRaden PM (1993) Bayesian analysis of linkage between genetic markers and

5 th Chapter General Discussion 119
quantitative trait loci. I. Prior knowledge. Theoretical and Applied Genetics 85: 953–960.
10. Thomsen H, Reinsch N, Xu N, Looft C, Grupe S, Kuhn C, et al. (2001) Comparison of estimated breeding values, daughter yield deviations and de-regressed proofs within a whole genome scan for QTL. Journal of Animal Breeding and Genetics 118: 357–370.
11. VanRaden PM, Wiggans GR (1991) Derivation, Calculation, and Use of National Animal Model Information. Journal of Dairy Science 74: 2737–2746.
12. Carlborg O, Haley CS (2004) Epistasis: too often neglected in complex trait studies? Nat Rev Genet 5: 618–625.
13. Carlborg O, Kerje S, Schütz K, Jacobsson L, Jensen P, Andersson L (2003) A global search reveals epistatic interaction between QTL for early growth in the chicken. Genome Research 13: 413–421.
14. Fisher RA (1918) The correlation between relatives on the supposition of Mendelian inheritance. Transactions of the Royal Society of Edinburgh 52: 399–433.
15. Chamberlain AJ, McPartlan HC, Goddard ME (2007) The Number of Loci That Affect Milk Production Traits in Dairy Cattle. Genetics 177: 1117–1123.
16. Hayes B, Goddard ME (2001) The distribution of the effects of genes affecting quantitative traits in livestock. Genetics, Selection, Evolution: GSE 33: 209–229.
17. Hayes BJ, Pryce J, Chamberlain AJ, Bowman PJ, Goddard ME (2010) Genetic Architecture of Complex Traits and Accuracy of Genomic Prediction: Coat Colour, Milk-Fat Percentage, and Type in Holstein Cattle as Contrasting Model Traits. PLoS Genet 6: e1001139.
18. Fries R, Pausch H (2011) Individual genome sequencing of livestock animals - En route to genomic selection 2.0. Zuechtungskunde 83: 371–381.
19. Pimentel E da CG, Erbe M, König S, Simianer H (2011) Genome partitioning of genetic variation for milk production and composition traits in Holstein cattle. Frontiers in Livestock Genomics 2: 19.
20. Yang J, Manolio TA, Pasquale LR, Boerwinkle E, Caporaso N, Cunningham JM, et al. (2011) Genome partitioning of genetic variation for complex traits using common SNPs. Nat Genet 43: 519–525.
21. Gudbjartsson DF, Walters GB, Thorleifsson G, Stefansson H, Halldorsson BV, Zusmanovich P, et al. (2008) Many sequence variants affecting diversity of adult human height. Nat Genet 40: 609–615.
22. Lango Allen H, Estrada K, Lettre G, Berndt SI, Weedon MN, Rivadeneira F, et al. (2010) Hundreds of variants clustered in genomic loci and biological pathways affect human height. Nature 467: 832–838.
23. Daetwyler HD, Pong-Wong R, Villanueva B, Woolliams JA (2010) The Impact of Genetic Architecture on Genome-Wide Evaluation Methods. Genetics 185: 1021 –1031.

5 th Chapter General Discussion 120
24. Reed DR, Lawler MP, Tordoff MG (2008) Reduced body weight is a common effect of gene knockout in mice. BMC genetics 9: 4.
25. Meuwissen TH, Hayes BJ, Goddard ME (2001) Prediction of total genetic value using genome-wide dense marker maps. Genetics 157: 1819–1829.
26. Clark SA, Hickey JM, Werf JH van der (2011) Different models of genetic variation and their effect on genomic evaluation. Genetics Selection Evolution 43: 18.
27. VanRaden PM, Van Tassell CP, Wiggans GR, Sonstegard TS, Schnabel RD, Taylor JF, et al. (2009) Invited review: reliability of genomic predictions for North American Holstein bulls. Journal of Dairy Science 92: 16–24.
28. McKay SD, Schnabel RD, Murdoch BM, Matukumalli LK, Aerts J, Coppieters W, et al. (2007) Whole genome linkage disequilibrium maps in cattle. BMC Genetics 8: 74.
29. VanRaden PM, O’Connell JR, Wiggans GR, Weigel KA (2011) Genomic evaluations with many more genotypes. Genetics, Selection, Evolution: GSE 43: 10.
30. Lund MS, de Ross SP, de Vries AG, Druet T, Ducrocq V, Fritz S, et al. (2011) A common reference population from four European Holstein populations increases reliability of genomic predictions. Genetics Selection Evolution 43: 43.
31. The Bovine HapMap Consortium (2009) Genome-Wide Survey of SNP Variation Uncovers the Genetic Structure of Cattle Breeds. Science 324: 528–532.
32. Qanbari S, Pimentel ECG, Tetens J, Thaller G, Lichtner P, Sharifi AR, et al. (2010) The pattern of linkage disequilibrium in German Holstein cattle. Animal Genetics 41: 346–356.
33. Sargolzaei M, Schenkel FS, Jansen GB, Schaeffer LR (2008) Extent of Linkage Disequilibrium in Holstein Cattle in North America. Journal of Dairy Science 91: 2106–2117.
34. Stachowicz K, Sargolzaei M, Miglior F, Schenkel FS (2011) Rates of inbreeding and genetic diversity in Canadian Holstein and Jersey cattle. Journal of Dairy Science 94: 5160–5175.
35. Maher B (2008) Personal genomes: The case of the missing heritability. Nature 456: 18–21.
36. Visscher PM (2008) Sizing up human height variation. Nat Genet 40: 489–490.
37. Weedon MN, Lango H, Lindgren CM, Wallace C, Evans DM, Mangino M, et al. (2008) Genome-wide association analysis identifies 20 loci that influence adult height. Nat Genet 40: 575–583.
38. Yang J, Benyamin B, McEvoy BP, Gordon S, Henders AK, Nyholt DR, et al. (2010) Common SNPs explain a large proportion of the heritability for human height. Nat Genet 42: 565–569.
39. Lee SH, Wray NR, Goddard ME, Visscher PM (2011) Estimating Missing Heritability for Disease from Genome-wide Association Studies. The American Journal of Human Genetics 88: 294–305.

5 th Chapter General Discussion 121
40. Zuk O, Hechter E, Sunyaev SR, Lander ES (2012) The Mystery of Missing Heritability: Genetic Interactions Create Phantom Heritability. Proceedings of the National Academy of Sciences [Internet] [cited 2012 May 28];Available from: http://www.pnas.org/content/early/2012/01/04/1119675109
41. Thaller G, Krämer W, Winter A, Kaupe B, Erhardt G, Fries R (2003) Effects of DGAT1 variants on milk production traits in German cattle breeds. Journal of Animal Science 81: 1911–1918.
42. Veerkamp RF, Mulder HA, Thompson R, Calus MPL (2011) Genomic and pedigree-based genetic parameters for scarcely recorded traits when some animals are genotyped. Journal of dairy science 94: 4189–4197.
43. Haile‐Mariam M, Nieuwhof GJ, Beard KT, Konstatinov KV, Hayes BJ (2012) Comparison of heritabilities of dairy traits in Australian Holstein‐Friesian cattle from genomic and pedigree data and implications for genomic evaluations. Journal of Animal Breeding and Genetics [Internet] [cited 2012 May 28];Available from: http://onlinelibrary.wiley.com/doi/10.1111/j.1439-0388.2012.01001.x/abstract
44. Wang X, Wurmser C, Pausch H, Jung S, Reinhardt F, Tetens J, et al. (2012) Identification and dissection of four major QTL affecting milk fat content in the German Holstein-Friesian population. submitted
45. Goddard ME, Hayes B (2003) The effect of artificial selection on the distribution of QTL effects. http://www.aaabg.org/livestocklibrary/2003/35-38.pdf [Internet] [cited 2012 May 27];Available from: http://livestocklibrary.com.au/handle/1234/5445
46. Solberg TR, Sonesson AK, Woolliams JA, Meuwissen THE (2008) Genomic Selection Using Different Marker Types and Densities. Journal of Animal Science 86: 2447–2454.
47. Ober U, Ayroles JF, Stone EA, Richards S, Zhu D, Gibbs RA, et al. (2012) Using Whole-Genome Sequence Data to Predict Quantitative Trait Phenotypes in Drosophila melanogaster. PLoS genetics 8: e1002685.
48. VanRaden PM (2008) Efficient Methods to Compute Genomic Predictions. Journal of Dairy Science 91: 4414–4423.
49. Charlier C, Coppieters W, Rollin F, Desmecht D, Agerholm JS, Cambisano N, et al. (2008) Highly effective SNP-based association mapping and management of recessive defects in livestock. Nat Genet 40: 449–454.
50. VanRaden PM, Olson KM, Null DJ, Hutchison JL (2011) Harmful recessive effects on fertility detected by absence of homozygous haplotypes. Journal of Dairy Science 94: 6153–6161.
51. Drögemüller C, Reichart U, Seuberlich T, Oevermann A, Baumgartner M, Kühni Boghenbor K, et al. (2011) An Unusual Splice Defect in the Mitofusin 2 Gene (MFN2) Is Associated with Degenerative Axonopathy in Tyrolean Grey Cattle. PLoS ONE 6: e18931.
52. Shuster DE, Kehrli ME, Ackermann MR, Gilbert RO (1992) Identification and prevalence of a

5 th Chapter General Discussion 122
genetic defect that causes leukocyte adhesion deficiency in Holstein cattle. Proceedings of the National Academy of Sciences of the United States of America 89: 9225–9229.
53. Dunner S, Charlier C, Farnir F, Brouwers B, Canon J, Georges M (1997) Towards interbreed IBD fine mapping of the mh locus: double-muscling in the Asturiana de los Valles breed involves the same locus as in the Belgian Blue cattle breed. Mammalian Genome: Official Journal of the International Mammalian Genome Society 8: 430–435.
54. Womack J, editor (2012) Bovine Genomics. Wiley-Blackwell; 2012.
55. Dematawewa CM, Berger PJ (1997) Effect of dystocia on yield, fertility, and cow losses and an economic evaluation of dystocia scores for Holsteins. Journal of Dairy Science 80: 754–761.
56. Meijering A (1984) Dystocia and stillbirth in cattle - A review of causes, relations and implications. Livestock Production Science 11: 143–177.
57. Mangurkar BR, Hayes JF, Moxley JE (1984) Effects of calving ease-calf survival on production and reproduction in Holsteins. Journal of Dairy Science 67: 1496–1509.
58. Thompson JR, Pollak EJ, Pelissier CL (1983) Interrelationships of Parturition Problems, Production of Subsequent Lactation, Reproduction, and Age at First Calving. J. Dairy Sci. 66: 1119–1127.
59. Bennett GL, Thallman RM, Snelling WM, Kuehn LA (2008) Experimental selection for calving ease and postnatal growth in seven cattle populations. II. Phenotypic differences. J. Anim Sci. 86: 2103–2114.
60. Karim L, Takeda H, Lin L, Druet T, Arias JAC, Baurain D, et al. (2011) Variants modulating the expression of a chromosome domain encompassing PLAG1 influence bovine stature. Nat Genet 43: 405–413.
61. Littlejohn M, Grala T, Sanders K, Walker C, Waghorn G, Macdonald K, et al. Genetic variation in PLAG1 associates with early life body weight and peripubertal weight and growth in Bos taurus. Animal Genetics [Internet] [cited 2012 Jan 6];Available from: http://onlinelibrary.wiley.com/doi/10.1111/j.1365-2052.2011.02293.x/abstract
62. Brka M, Reinsch N, Kalm E (2000) Determination of the inheritance pattern of hyperthelia in cattle by maximum likelihood analysis 1. Journal of Animal Breeding and Genetics 117: 425–431.
63. Leung AK (1988) Familial supernumerary nipples. American Journal of Medical Genetics 31: 631–635.
64. Toumbis-Ioannou E, Cohen PR (1994) Familial polythelia. Journal of the American Academy of Dermatology 30: 667–668.
65. Goertzen B, Ibsen HL (1951) Supernumerary Mammae in Guinea Pigs. Journal of Heredity 42: 307–311.

5 th Chapter General Discussion 123
66. Bamshad M, Krakowiak PA, Watkins WS, Root S, Carey JC, Jorde LB (1995) A gene for ulnar-mammary syndrome maps to 12q23-q24.1. Human Molecular Genetics 4: 1973–1977.
67. Bamshad M, Le T, Watkins WS, Dixon ME, Kramer BE, Roeder AD, et al. (1999) The spectrum of mutations in TBX3: Genotype/Phenotype relationship in ulnar-mammary syndrome. American Journal of Human Genetics 64: 1550–1562.
68. Klopocki E, Neumann LM, Tönnies H, Ropers H-H, Mundlos S, Ullmann R (2006) Ulnar-mammary syndrome with dysmorphic facies and mental retardation caused by a novel 1.28 Mb deletion encompassing the TBX3 gene. European Journal of Human Genetics: EJHG 14: 1274–1279.
69. Schmidt H (1998) Supernumerary nipples: prevalence, size, sex and side predilection -- a prospective clinical study. European Journal of Pediatrics 157: 821–823.
70. Galli-Tsinopoulou A, Krohn C, Schmidt H (2001) Familial polythelia over three generations with polymastia in the youngest girl. European Journal of Pediatrics 160: 375–377.
71. Watson CJ, Khaled WT (2008) Mammary development in the embryo and adult: a journey of morphogenesis and commitment. Development (Cambridge, England) 135: 995–1003.
72. Brown J, Schwartz RA (2004) Supernumerary Nipples and Renal Malformations: A Family Study. Journal of Cutaneous Medicine and Surgery: Incorporating Medical and Surgical Dermatology 8: 170–172.
73. Urbani CE, Betti R (1996) Aberrant mammary tissue and nephrourinary malignancy. Cancer Genetics and Cytogenetics 87: 88–89.
74. Schmahlstieg R, Smidt D (1958) Do supernumerary teats give an indication of fertility? Züchtungskunde 30: 118–128.
75. Warren G (1934) The Occurrence of Polythelia in Dairy Cattle. Journal of Dairy Science 17: 559–569.
76. Brka M, Reinsch N, Kalm E (2002) Frequency and Heritability of Supernumerary Teats in German Simmental and German Brown Swiss Cows. Journal of Dairy Science 85: 1881–1886.
77. Hirooka H, de Koning DJ, Harlizius B, van Arendonk JA, Rattink AP, Groenen MA, et al. (2001) A whole-genome scan for quantitative trait loci affecting teat number in pigs. Journal of Animal Science 79: 2320–2326.
78. Ding N, Guo Y, Knorr C, Ma J, Mao H, Lan L, et al. (2009) Genome-wide QTL mapping for three traits related to teat number in a White Duroc × Erhualian pig resource population. BMC Genetics 10: 6.
79. Tetzlaff S, Jonas E, Phatsara C, Murani E, Ponsuksili S, Schellander K, et al. (2009) Evidence for association of lymphoid enhancer-binding factor-1 (LEF1) with the number of functional and inverted teats in pigs. Cytogenetic and Genome Research 124: 139–146.
80. Nishimura H, Frisch J (1977) Eye cancer and circumocular pigmentation in Bos taurus, Bos

5 th Chapter General Discussion 124
indicus and crossbred cattle. Aust. J. Exp. Agric. 17: 709–711.
81. Ward JK, Nielson MK (1979) Pinkeye (bovine infectious keratoconjunctivitis) in beef cattle. Journal of Animal Science 49: 361–366.
82. Anderson DE (1963) Genetic aspects of cancer with special reference to cancer of the eye in the bovine. Annals of the New York Academy of Sciences 108: 948–962.
83. Zimin AV, Delcher AL, Florea L, Kelley DR, Schatz MC, Puiu D, et al. (2009) A whole-genome assembly of the domestic cow, Bos taurus. Genome Biology 10: R42–R42.
84. Eck S, Benet-Pages A, Flisikowski K, Meitinger T, Fries R, Strom T (2009) Whole genome sequencing of a single Bos taurus animal for SNP discovery. Genome Biology 10: R82.
85. Kawahara-Miki R, Tsuda K, Shiwa Y, Arai-Kichise Y, Matsumoto T, Kanesaki Y, et al. (2011) Whole-genome resequencing shows numerous genes with nonsynonymous SNPs in the Japanese native cattle Kuchinoshima-Ushi. BMC Genomics 12: 103.
86. Zhan B, Fadista J, Thomsen B, Hedegaard J, Panitz F, Bendixen C (2011) Global assessment of genomic variation in cattle by genome resequencing and high-throughput genotyping. BMC Genomics 12: 557.
87. Stothard P, Choi J-W, Basu U, Sumner-Thomson JM, Meng Y, Liao X, et al. (2011) Whole genome resequencing of black Angus and Holstein cattle for SNP and CNV discovery. BMC Genomics 12: 559.
88. Bohmanova J, Sargolzaei M, Schenkel FS (2010) Characteristics of linkage disequilibrium in North American Holsteins. BMC Genomics 11: 421.
89. Pausch H, Aigner B, Emmerling R, Edel C, Götz K-U, Fries R (2012) Imputation of high-density genotypes in the Fleckvieh population. submitted to Genetics Selection Evolution
90. Corbin LJ, Blott SC, Swinburne JE, Vaudin M, Bishop SC, Woolliams JA The identification of SNPs with indeterminate positions using the Equine SNP50 BeadChip. Animal Genetics [Internet] [cited 2012 Jan 6];Available from: http://onlinelibrary.wiley.com/doi/10.1111/j.1365-2052.2011.02243.x/abstract
91. Lawrence R, Day-Williams AG, Mott R, Broxholme J, Cardon LR, Zeggini E (2009) GLIDERS--a web-based search engine for genome-wide linkage disequilibrium between HapMap SNPs. BMC Bioinformatics 10: 367.
92. Liu Y-J, Papasian CJ, Liu J-F, Hamilton J, Deng H-W (2008) Is replication the gold standard for validating genome-wide association findings? PloS One 3: e4037.
93. Hayes BJ, Bowman PJ, Chamberlain AJ, Savin K, van Tassell CP, Sonstegard TS, et al. (2009) A Validated Genome Wide Association Study to Breed Cattle Adapted to an Environment Altered by Climate Change. PLoS ONE 4: e6676.
94. Barendse W (2011) The effect of measurement error of phenotypes on genome wide association studies. BMC Genomics 12: 232.
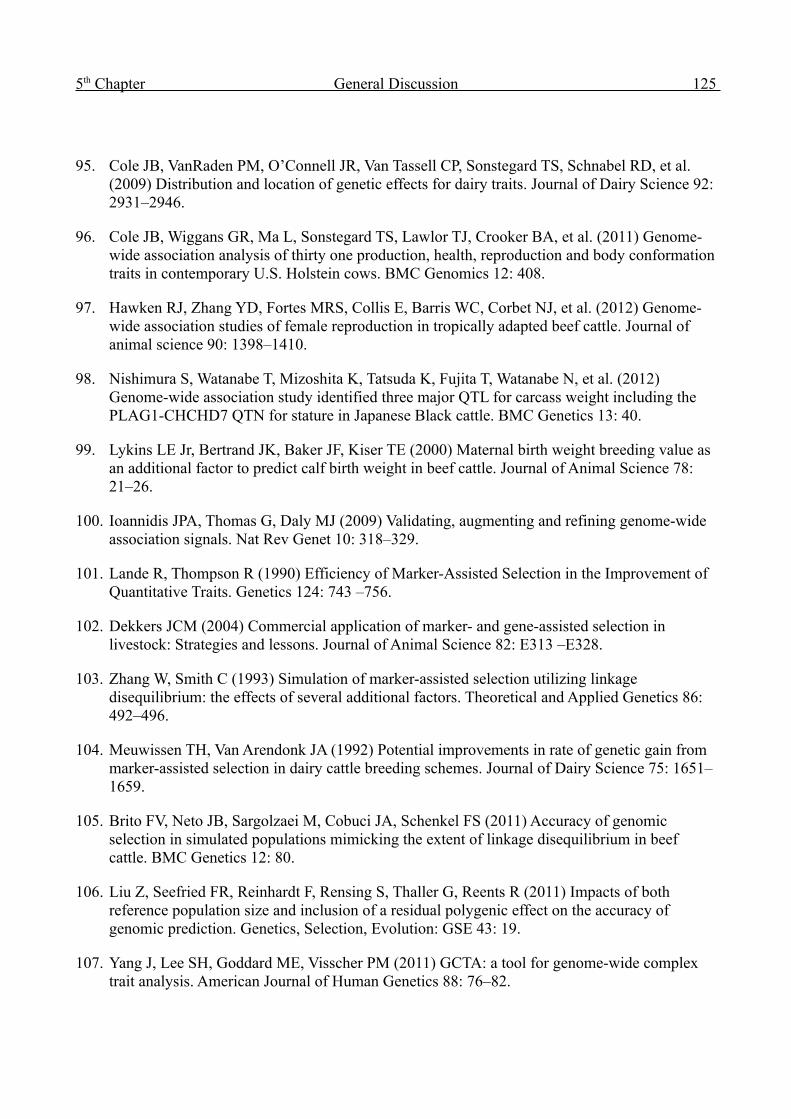
5 th Chapter General Discussion 125
95. Cole JB, VanRaden PM, O’Connell JR, Van Tassell CP, Sonstegard TS, Schnabel RD, et al. (2009) Distribution and location of genetic effects for dairy traits. Journal of Dairy Science 92: 2931–2946.
96. Cole JB, Wiggans GR, Ma L, Sonstegard TS, Lawlor TJ, Crooker BA, et al. (2011) Genome-wide association analysis of thirty one production, health, reproduction and body conformation traits in contemporary U.S. Holstein cows. BMC Genomics 12: 408.
97. Hawken RJ, Zhang YD, Fortes MRS, Collis E, Barris WC, Corbet NJ, et al. (2012) Genome-wide association studies of female reproduction in tropically adapted beef cattle. Journal of animal science 90: 1398–1410.
98. Nishimura S, Watanabe T, Mizoshita K, Tatsuda K, Fujita T, Watanabe N, et al. (2012) Genome-wide association study identified three major QTL for carcass weight including the PLAG1-CHCHD7 QTN for stature in Japanese Black cattle. BMC Genetics 13: 40.
99. Lykins LE Jr, Bertrand JK, Baker JF, Kiser TE (2000) Maternal birth weight breeding value as an additional factor to predict calf birth weight in beef cattle. Journal of Animal Science 78: 21–26.
100. Ioannidis JPA, Thomas G, Daly MJ (2009) Validating, augmenting and refining genome-wide association signals. Nat Rev Genet 10: 318–329.
101. Lande R, Thompson R (1990) Efficiency of Marker-Assisted Selection in the Improvement of Quantitative Traits. Genetics 124: 743 –756.
102. Dekkers JCM (2004) Commercial application of marker- and gene-assisted selection in livestock: Strategies and lessons. Journal of Animal Science 82: E313 –E328.
103. Zhang W, Smith C (1993) Simulation of marker-assisted selection utilizing linkage disequilibrium: the effects of several additional factors. Theoretical and Applied Genetics 86: 492–496.
104. Meuwissen TH, Van Arendonk JA (1992) Potential improvements in rate of genetic gain from marker-assisted selection in dairy cattle breeding schemes. Journal of Dairy Science 75: 1651–1659.
105. Brito FV, Neto JB, Sargolzaei M, Cobuci JA, Schenkel FS (2011) Accuracy of genomic selection in simulated populations mimicking the extent of linkage disequilibrium in beef cattle. BMC Genetics 12: 80.
106. Liu Z, Seefried FR, Reinhardt F, Rensing S, Thaller G, Reents R (2011) Impacts of both reference population size and inclusion of a residual polygenic effect on the accuracy of genomic prediction. Genetics, Selection, Evolution: GSE 43: 19.
107. Yang J, Lee SH, Goddard ME, Visscher PM (2011) GCTA: a tool for genome-wide complex trait analysis. American Journal of Human Genetics 88: 76–82.

6th Chapter
Outlook

6 th Chapter Outlook 127
Outlook
This thesis shows the leverage potential of applying high-density SNP panels for the identification
of quantitative trait loci (QTL) in cattle. However, significantly associated genomic regions often
extend to several million base pairs due to the small effective population size and concomitant high
linkage disequilibrium (LD) in livestock populations. The identified regions often contain numerous
functional candidate genes, rendering the identification of the underlying variant(s) a difficult task.
Furthermore, causal variants affecting regulatory elements may be located very distantly from the
regulated gene, complicating theirs identification considerably [1]. Future genome-wide association
studies (GWAS) will exploit whole-genome sequence information and subsequent genotype
imputation for the identification of quantitative trait nucleotides (QTN) for complex traits. Re-
sequencing a small number of key animals enables to assess a large fraction of the global genomic
variation of livestock populations [2],[3]. The subsequent population-wide imputation of whole-
genome sequence information of a small number of highly informative individuals is feasible and
provides highly reliable genotypes [2],[4] (see Appendix). Using whole-genome sequence
information considerably increases the power of GWAS as “true” QTN can be tested directly for
association rather than anonymous SNPs in LD with QTN only (Figure 1, Appendix). However,
adjacent potential functional variants are often in complete LD, precluding the final proof of
causality even after applying a large number of functional investigations [5]. Furthermore, several
polymorphic sites might accumulate in form of a composite QTL, rendering the dissection of the
underlying genetic mechanisms still a difficult task [6],[7]. Access to large validation populations
will be an indispensable prerequisite to differentiate between 'true' and linked effects. The direct
investigation and validation of functional candidate QTNs in independent cattle populations will
become feasible in the near future by exploiting the large amount of sequence data generated in
ongoing collaborations (such as the 1000 bull genomes project).
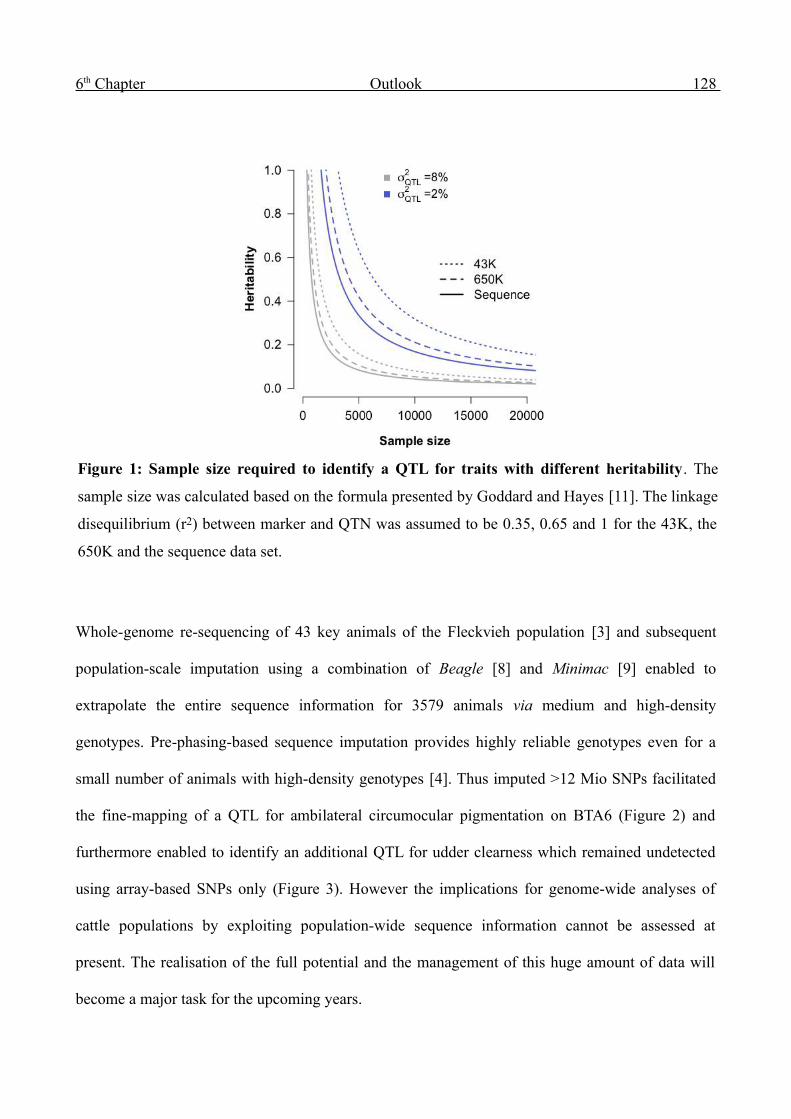
6 th Chapter Outlook 128
Whole-genome re-sequencing of 43 key animals of the Fleckvieh population [3] and subsequent
population-scale imputation using a combination of Beagle [8] and Minimac [9] enabled to
extrapolate the entire sequence information for 3579 animals via medium and high-density
genotypes. Pre-phasing-based sequence imputation provides highly reliable genotypes even for a
small number of animals with high-density genotypes [4]. Thus imputed >12 Mio SNPs facilitated
the fine-mapping of a QTL for ambilateral circumocular pigmentation on BTA6 (Figure 2) and
furthermore enabled to identify an additional QTL for udder clearness which remained undetected
using array-based SNPs only (Figure 3). However the implications for genome-wide analyses of
cattle populations by exploiting population-wide sequence information cannot be assessed at
present. The realisation of the full potential and the management of this huge amount of data will
become a major task for the upcoming years.
Figure 1: Sample size required to identify a QTL for traits with different heritability. The
sample size was calculated based on the formula presented by Goddard and Hayes [11]. The linkage
disequilibrium (r2) between marker and QTN was assumed to be 0.35, 0.65 and 1 for the 43K, the
650K and the sequence data set.

6 th Chapter Outlook 129
Figure 2: Detailed view of the QTL for ambilateral circumocular pigmentation on
chromosome 6 identified by the genome-wide association study in Chapter 4. Whole-genome
re-sequencing of 43 key animals resulted in the detection of 8492 SNPs for the BTA6 QTL region
(71.4 Mb – 73.5 Mb). These SNPs were imputed for 3579 Fleckvieh bulls applying a combination
of Beagle [8] and Minimac [9]. The bottom plot presents the results of the association study using
777K-genotypes only, the top plot presents the results for the association study exploiting whole-
genome sequence information. The GWAS indicates the presence of two approximately 0.5 Mb
distant albeit linked regions (see also Chapter 4). Remarkably, both association signals result from
intergenic regions and indicate regulatory sites as underlying variants. Different colour indicates the
linkage disequilibrium (r2) with the most significantly associated SNP. SNPs and genes were
annotated based on the UMD3.1 assembly of the bovine genome [10].

6 th Chapter Outlook 130
References
1. Enattah NS, Sahi T, Savilahti E, Terwilliger JD, Peltonen L, J|[auml]|rvel|[auml]| I (2002) Identification of a variant associated with adult-type hypolactasia. Nature Genetics 30: 233–237.
2. Gusev A, Shah MJ, Kenny EE, Ramachandran A, Lowe JK, Salit J, et al. (2012) Low-pass genome-wide sequencing and variant inference using identity-by-descent in an isolated human population. Genetics 190: 679–689.
3. Jansen S, Aigner B, Pausch H, Wysocki M, Eck S, Benet-Pages A, et al. (2013) Assessment of the genomic variation in a cattle population by re-sequencing of key animals at low to medium coverage. submitted to BMC Genomics
4. Pausch H, Aigner B, Emmerling R, Edel C, Götz K-U, Fries R (2013) Imputation of high-density genotypes in the Fleckvieh cattle population. GSE 45: 3.
5. Karim L, Takeda H, Lin L, Druet T, Arias JAC, Baurain D, et al. (2011) Variants modulating the expression of a chromosome domain encompassing PLAG1 influence bovine stature. Nat Genet 43: 405–413.
6. Bickel RD, Kopp A, Nuzhdin SV (2011) Composite Effects of Polymorphisms near Multiple Regulatory Elements Create a Major-Effect QTL. PLoS Genet 7: e1001275.
7. Georges M (2011) The long and winding road from correlation to causation. Nat Genet 43: 180–181.
8. Browning BL, Browning SR (2009) A Unified Approach to Genotype Imputation and
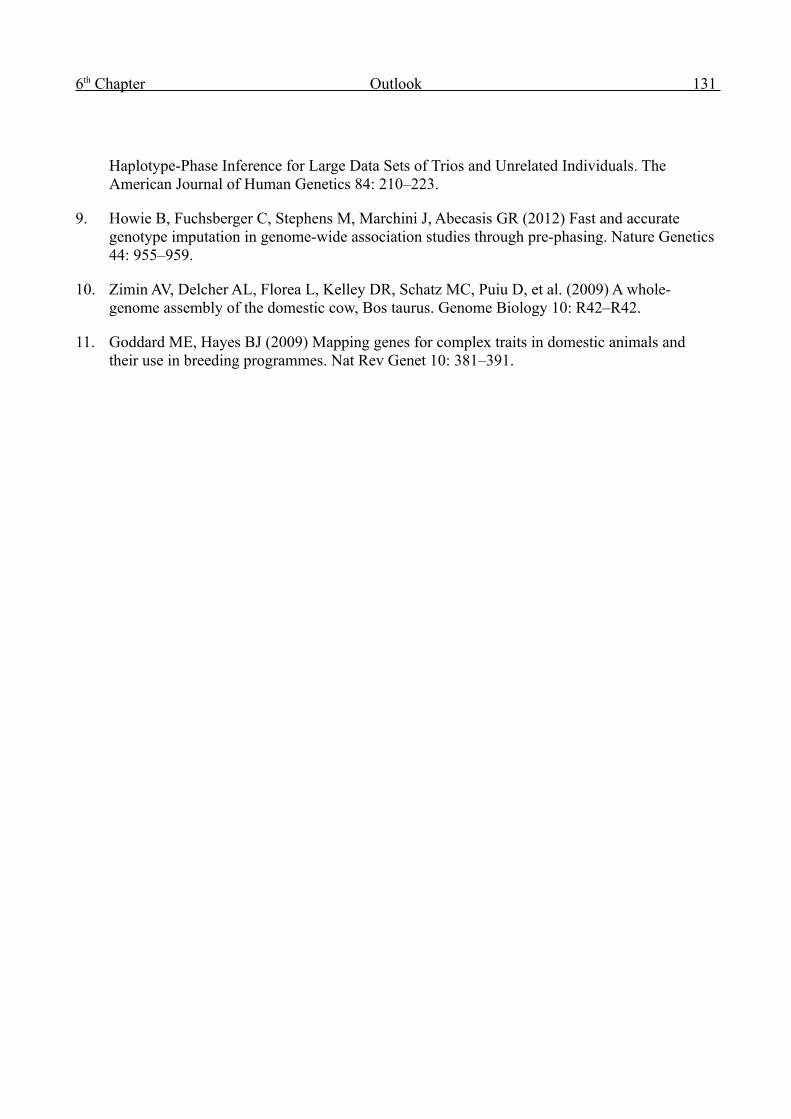
6 th Chapter Outlook 131
Haplotype-Phase Inference for Large Data Sets of Trios and Unrelated Individuals. The American Journal of Human Genetics 84: 210–223.
9. Howie B, Fuchsberger C, Stephens M, Marchini J, Abecasis GR (2012) Fast and accurate genotype imputation in genome-wide association studies through pre-phasing. Nature Genetics 44: 955–959.
10. Zimin AV, Delcher AL, Florea L, Kelley DR, Schatz MC, Puiu D, et al. (2009) A whole-genome assembly of the domestic cow, Bos taurus. Genome Biology 10: R42–R42.
11. Goddard ME, Hayes BJ (2009) Mapping genes for complex traits in domestic animals and their use in breeding programmes. Nat Rev Genet 10: 381–391.
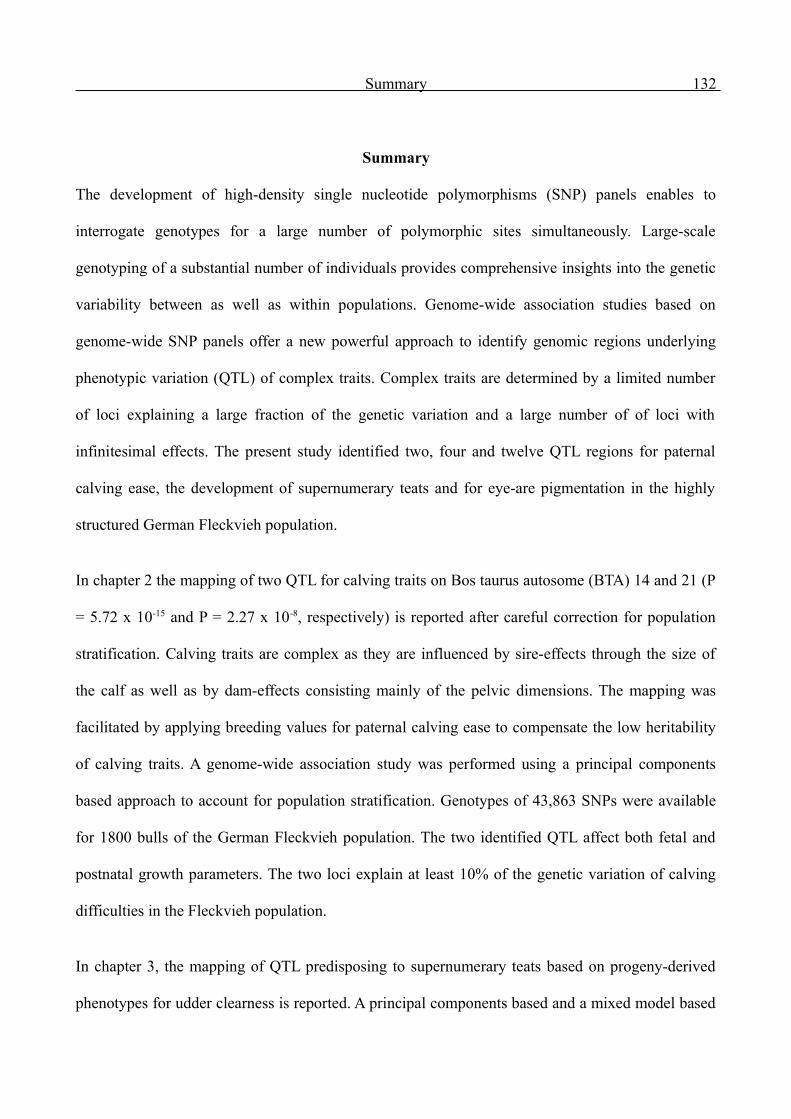
Summary 132
Summary
The development of high-density single nucleotide polymorphisms (SNP) panels enables to
interrogate genotypes for a large number of polymorphic sites simultaneously. Large-scale
genotyping of a substantial number of individuals provides comprehensive insights into the genetic
variability between as well as within populations. Genome-wide association studies based on
genome-wide SNP panels offer a new powerful approach to identify genomic regions underlying
phenotypic variation (QTL) of complex traits. Complex traits are determined by a limited number
of loci explaining a large fraction of the genetic variation and a large number of of loci with
infinitesimal effects. The present study identified two, four and twelve QTL regions for paternal
calving ease, the development of supernumerary teats and for eye-are pigmentation in the highly
structured German Fleckvieh population.
In chapter 2 the mapping of two QTL for calving traits on Bos taurus autosome (BTA) 14 and 21 (P
= 5.72 x 10⁻¹⁵ and P = 2.27 x 10⁻⁸, respectively) is reported after careful correction for population
stratification. Calving traits are complex as they are influenced by sire-effects through the size of
the calf as well as by dam-effects consisting mainly of the pelvic dimensions. The mapping was
facilitated by applying breeding values for paternal calving ease to compensate the low heritability
of calving traits. A genome-wide association study was performed using a principal components
based approach to account for population stratification. Genotypes of 43,863 SNPs were available
for 1800 bulls of the German Fleckvieh population. The two identified QTL affect both fetal and
postnatal growth parameters. The two loci explain at least 10% of the genetic variation of calving
difficulties in the Fleckvieh population.
In chapter 3, the mapping of QTL predisposing to supernumerary teats based on progeny-derived
phenotypes for udder clearness is reported. A principal components based and a mixed model based

Summary 133
approach to account for population stratification were compared using real-world data. The study
population consisted of 2467 bulls genotyped for 43,698 SNPs. Four QTL on BTA5, BTA6, BTA11
and BTA17 were identified. The four QTL explain a substantial fraction of the genetic variation of
supernumerary teats. However, a large fraction of the genetic variation results from chromosomes
without identified QTL. The findings confirm the proposed polygenic inheritance pattern of
supernumerary teats in cattle. The four QTL pinpoint genes of the highly conserved Wnt-signalling
pathway as the major genetic determinants for teat malformations in cattle.
Chapter 4 reports a genome-wide association study for a special aspect of skin pigmentation in
cattle. The study population consisted of 3579 bulls of the FV breed with a total of 320,186 progeny
with phenotypes for ACOP. The proportion of daughters with ambilateral circumocular
pigmentation was applied as phenotype with high heritability (h2 = 0.79). Genotypes were available
for 658,385 SNPs. Twelve genomic regions were highly significantly associated. The identified
QTL point to MCM6, PAX3, ERBB3, KITLG, LEF1, DKK2, KIT, CRIM1, ATRN, GSDMC, MITF
and NBEAL2 as underlying genes for eye area pigmentation in cattle. The twelve QTL regions
explain 56.91% of the heritability, while the entire SNP map accounts for 93.22% of the heritability.
The results support a polygenic inheritance pattern of eye-area pigmentation in cattle and provide
the basis for efficient genomic selection of animals that are less susceptible to serious eye diseases.

Zusammenfassung 134
Zusammenfassung
Die Entwicklung hoch-dichter SNP Arrays ermöglicht die Abfrage einer großen Anzahl von
Genotypen für polymorphe Positionen im Hochdurchsatz-Verfahren. Die Genotypisierung einer
umfangreichen Anzahl an Individuen liefert umfassende Erkenntnisse über die genetische Diversität
innerhalb und zwischen Populationen. Die Verwendung von hoch-dichter SNP Information für
genomweite Assoziationsstudien ist ein schlagkräftiger Ansatz zur Identifizierung genomischer
Regionen welche die phänotypische Ausprägung komplexer Merkmale maßgeblich beeinflussen
(Quantitative trait loci, QTL). Die genetische Architektur komplexer Merkmale wird durch eine
kleine Anzahl an QTL mit großen Effekten und eine große Anzahl an QTL mit infinitesimal kleinen
Effekten bestimmt. Die vorliegende Arbeit beschreibt die Identifikation von insgesamt 18 QTL für
den paternalen Geburtsverlauf, die Euterreinheit und die beidseitige Augenpigmentierung beim
Fleckvieh.
In Kapitel 2 wird über die Kartierung von zwei QTL für den paternalen Kalbeverlauf beim
Fleckvieh auf Chromosom 14 und Chromosom 21 (P = 5.72 x 10 -15 and P = 2.27 x 10⁻⁸) berichtet.
Die Merkmale des Kalbeverlaufs werden sowohl durch paternale Effekte (die Größe des Kalbes) als
auch durch maternale Effekte (Größe und Form des Geburtskanals) beeinflusst. Erst die
Verwendung von sicher geschätzten Zuchtwerten für den paternalen Kalbeverlauf kompensierte die
niedrigen Heritabilitäten für Kalbemerkmale und ermöglichte die Kartierung der beiden QTL. Der
Datensatz bestand aus 1800 Bullen mit Genotypen für 43,698 SNPs. Die Populationsstruktur wurde
über einen Haupkomponenten-basierten Ansatz berücksichtigt. Die beiden QTL beeinflussen
sowohl prä- als auch postnatale Wachstumsparameter beim Rind und erklären mindestens 10% der
genetischen Variation für Kalbeschwierigkeiten in der Fleckvieh Population.
Zusammenfassung 135
Kapitel 3 beschreibt die Kartierung von QTL für die Entwicklung überzähliger Zitzen unter
Verwendung von nachkommen-basierten Phänotypen. In einem realen Datensatz wurde ein
Hauptkomponenten-basierter mit einem auf einem gemischten Modell beruhenden Ansatz zur
Berücksichtigung von Populationsstruktur verglichen. Der Datensatz umfasste 2467 Bullen die an
43,698 SNPs genotypisiert wurden. Vier QTL auf BTA5, BTA6, BTA11 und BTA17 konnten
identifiziert werden. Die vier QTL erklären einen beträchtlichen Anteil der genetischen Variation für
die Ausprägung überzähliger Zitzen beim Fleckvieh. Jedoch resultiert ein Großteil der genetischen
Variation von Chromosomen, für die keine QTL identifiziert werden konnten. Die Ergebnisse
bestätigen die Vermutung dass es sich bei der Euterreinheit beim Rind um ein polygenes Merkmal
handelt. Gene des hoch konservierten Wnt-Signalwegs konnten als Haupt-Einflussfaktoren für
Zitzenmissbildungen beim Rind ausgemacht werden.
In Kapitel 4 wurde eine genomweite Assoziationsstudie für eine besondere Erscheinungsform der
Fellpigmentierung durchgeführt. Die analysierte Population bestand aus 3579 Bullen von denen
insgesamt 320,186 Nachkommen hinsichtlich der beidseitigen Augenpigmentierung phänotypisiert
waren. Der Anteil an Töchtern mit beidseitiger Augenpigmentierung wurde als Phänotyp mit hoher
Heritabilität (h2 = 0.79) für die Bullen verwendet. Hoch-dichte Genotypen für 658,385 SNPs waren
verfügbar. Insgesamt konnten zwölf signifikant assoziierte QTL identifiziert werden. In
unmittelbarer Nähe zu den QTL liegen MCM6, PAX3, ERBB3, KITLG, LEF1, DKK2, KIT, CRIM1,
ATRN, GSDMC, MITF und NBEAL2. Die zwölf QTL erklären 56.91% der Heritabilität, jedoch
erklären die gesamten SNPs insgesamt 93.22% der Erblichkeit. Die Ergebnisse lassen vermuten,
dass es sich bei der beidseitigen Augenpigmentierung um eine polygenes Merkmal handelt und
dienen als Basis für die effiziente genomische Selektion von weniger anfälligen Tieren für
schwerwiegende Augenerkrankungen.

Appendices
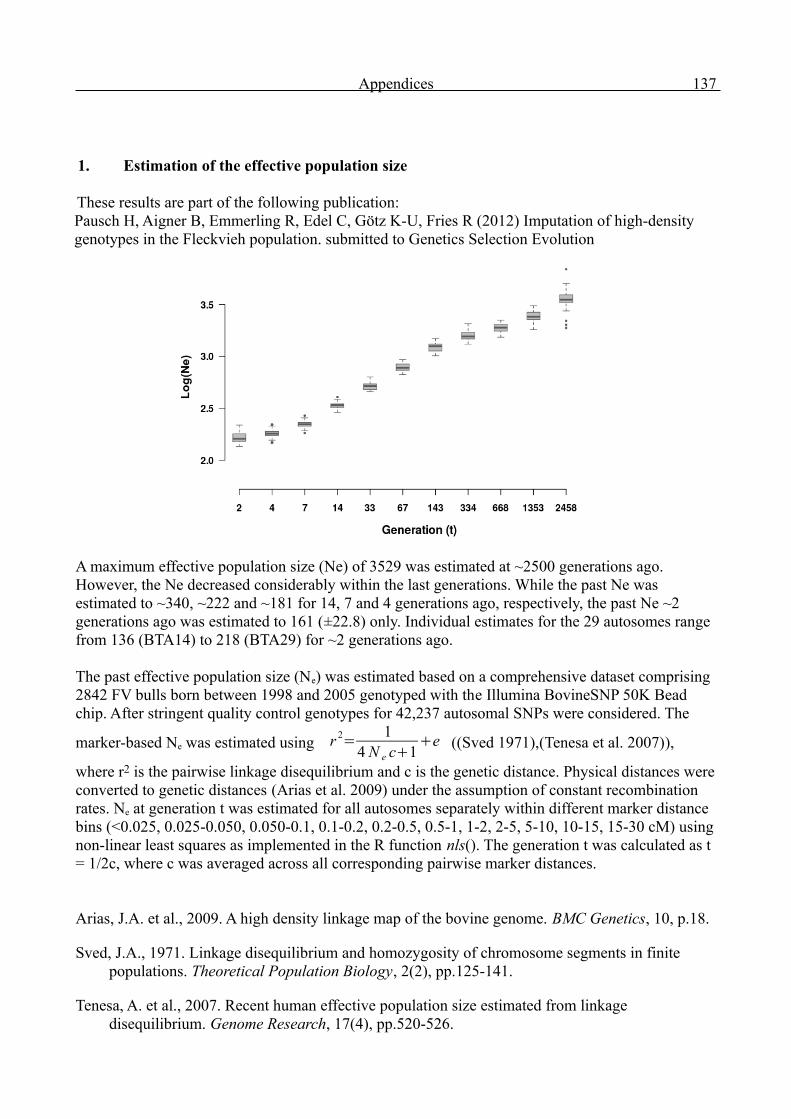
Appendices 137
1. Estimation of the effective population size
These results are part of the following publication:Pausch H, Aigner B, Emmerling R, Edel C, Götz K-U, Fries R (2012) Imputation of high-density genotypes in the Fleckvieh population. submitted to Genetics Selection Evolution
A maximum effective population size (Ne) of 3529 was estimated at ~2500 generations ago. However, the Ne decreased considerably within the last generations. While the past Ne was estimated to ~340, ~222 and ~181 for 14, 7 and 4 generations ago, respectively, the past Ne ~2 generations ago was estimated to 161 (±22.8) only. Individual estimates for the 29 autosomes range from 136 (BTA14) to 218 (BTA29) for ~2 generations ago.
The past effective population size (Ne) was estimated based on a comprehensive dataset comprising 2842 FV bulls born between 1998 and 2005 genotyped with the Illumina BovineSNP 50K Bead chip. After stringent quality control genotypes for 42,237 autosomal SNPs were considered. The
marker-based Ne was estimated using r 2= 14 N e c+1
+e ((Sved 1971),(Tenesa et al. 2007)),
where r2 is the pairwise linkage disequilibrium and c is the genetic distance. Physical distances were converted to genetic distances (Arias et al. 2009) under the assumption of constant recombination rates. Ne at generation t was estimated for all autosomes separately within different marker distance bins (<0.025, 0.025-0.050, 0.050-0.1, 0.1-0.2, 0.2-0.5, 0.5-1, 1-2, 2-5, 5-10, 10-15, 15-30 cM) using non-linear least squares as implemented in the R function nls(). The generation t was calculated as t = 1/2c, where c was averaged across all corresponding pairwise marker distances.
Arias, J.A. et al., 2009. A high density linkage map of the bovine genome. BMC Genetics, 10, p.18.
Sved, J.A., 1971. Linkage disequilibrium and homozygosity of chromosome segments in finite populations. Theoretical Population Biology, 2(2), pp.125-141.
Tenesa, A. et al., 2007. Recent human effective population size estimated from linkage disequilibrium. Genome Research, 17(4), pp.520-526.

Appendices 138
2. Fine-mapping of the bovine Arachnomelia-Syndrome(Poster presented at the EAAP Annual Meeting 2011, Stavanger)
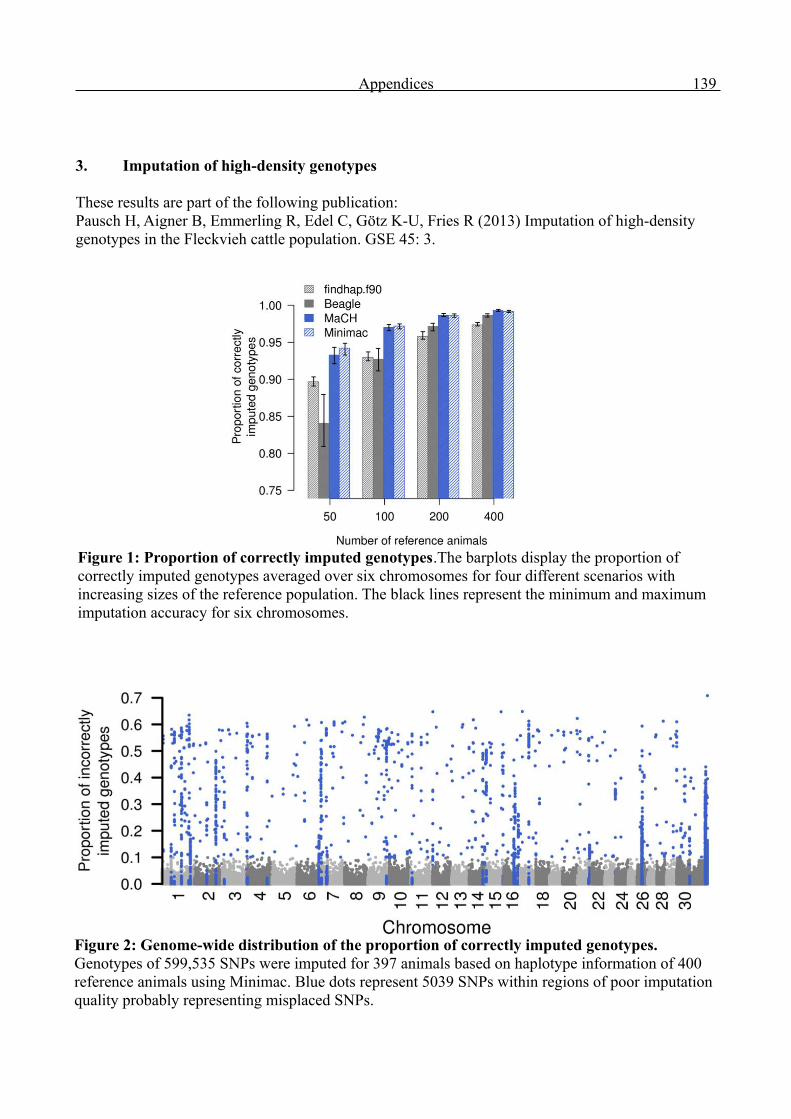
Appendices 139
3. Imputation of high-density genotypes
These results are part of the following publication:Pausch H, Aigner B, Emmerling R, Edel C, Götz K-U, Fries R (2013) Imputation of high-density genotypes in the Fleckvieh cattle population. GSE 45: 3.
Figure 1: Proportion of correctly imputed genotypes.The barplots display the proportion of correctly imputed genotypes averaged over six chromosomes for four different scenarios with increasing sizes of the reference population. The black lines represent the minimum and maximum imputation accuracy for six chromosomes.
Figure 2: Genome-wide distribution of the proportion of correctly imputed genotypes. Genotypes of 599,535 SNPs were imputed for 397 animals based on haplotype information of 400 reference animals using Minimac. Blue dots represent 5039 SNPs within regions of poor imputation quality probably representing misplaced SNPs.
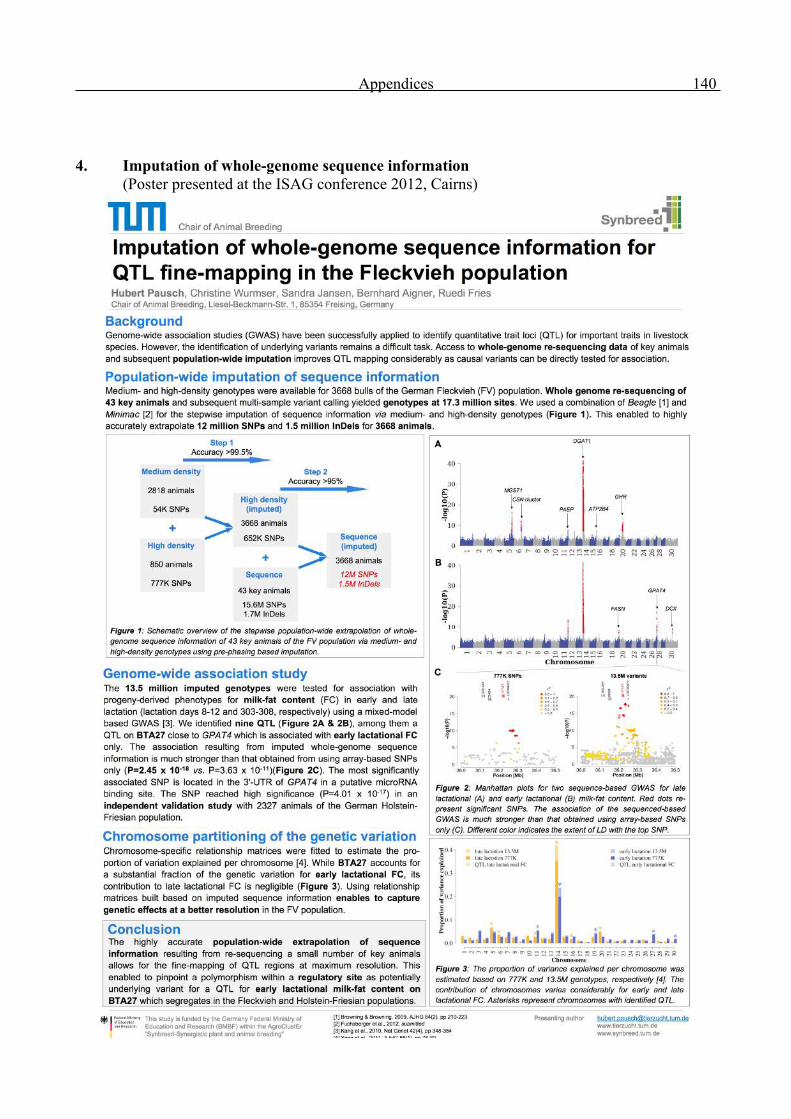
Appendices 140
4. Imputation of whole-genome sequence information(Poster presented at the ISAG conference 2012, Cairns)
Acknowledgements 141
Acknowledgements
First of all I owe my deepest gratitude to my supervisor Prof. Dr. Ruedi Fries for giving me the
opportunity to work in his group, for supporting my work in any respects and for providing me with
all facilities needed for the completion of this thesis.
Secondly, I'd like to thank the Bundesministerium für Bildung und Forschung (BMBF) and the
Förderverein für Biotechnologieforschung (FBF) for financial support within the projects
GenoTrack and Synbreed.
I want to thank Prof. Dr. Aurélien Tellier for chairing the examination board and Prof. Dr. Chris-
Carolin Schön, Assoc. Prof. Dr. Ben Hayes and Prof. Dr. Thomas Meitinger for acting as co-
referees of this thesis.
I also want to express my gratitude to Dr. Kay-Uwe Götz, Dr. Reiner Emmerling, Dr. Christian Edel
and Dr. Dieter Krogmeier from the Bavarian State Research Center, Institute of Animal Breeding
(LfL-ITZ) for providing any kind of data and for numerous fruitful discussions.
Science is team work – so I'd like to extend my thanks to all my colleagues from the Chair of
Animal breeding, not mentioned by name, who supported me and my work in any respects. I
especially want to thank you, Sandra, Simone and Tini for your friendship, for numerous
discussions and for encouraging and supporting me during the last three years. I also want to
mention Birgit Hoffmann for her help in administrative matters.
Last but not least, special thanks to all my friends and especially to my family. You always
supported me without reserve and you remind me that life consists of much more than work alone.