CONTROL PERSPECTIVES OF THE CATTLE TICK ...
167
ELKIN GUSTAVO FORERO BECERRA CONTROL PERSPECTIVES OF THE CATTLE TICK Rhipicephalus microplus AND HEMOPARASITES Babesia bovis AND Anaplasma marginale Tese apresentada à Universidade Federal de Viçosa como parte das exigências do Programa de Pós-Graduação em Medicina Veterinária, para obtenção do título de Doctor Scientiae. VIÇOSA MINAS GERAIS – BRASIL 2017
-
Upload
khangminh22 -
Category
Documents
-
view
1 -
download
0
Transcript of CONTROL PERSPECTIVES OF THE CATTLE TICK ...

ELKIN GUSTAVO FORERO BECERRA
CONTROL PERSPECTIVES OF THE CATTLE TICK Rhipicephalus microplus AND HEMOPARASITES Babesia bovis AND
Anaplasma marginale Tese apresentada à Universidade Federal de Viçosa como parte das exigências do Programa de Pós-Graduação em Medicina Veterinária, para obtenção do título de Doctor Scientiae.
VIÇOSA MINAS GERAIS – BRASIL
2017

Ficha catalográfica preparada pela Biblioteca Central da UniversidadeFederal de Viçosa - Câmpus Viçosa
T
Forero Becerra, Elkin Gustavo, 1979-
F715c2017
Control perspectives of the Cattle Tick Rhipicephalusmicroplus and hemoparasites Babesia bovis and Anaplasmamarginale / Elkin Gustavo Forero Becerra. – Viçosa, MG, 2017.
xviii, 147f. : il. (algumas color.) ; 29 cm.
Inclui apêndices.
Orientador: Marlene Isabel Vargas Viloria.
Tese (doutorado) - Universidade Federal de Viçosa.
Inclui bibliografia.
1. Carrapato como transmissor de doenças. 2. Rhipicephalusmicroplus. 3. Bovinos - Doenças. 4. Bovinos - Vacinação.I. Universidade Federal de Viçosa. Departamento de Veterinária.Programa de Pós-graduação em Medicina Veterinária. II. Título.
CDD 22 ed. 595.429


ii
To my family who support me
throughout the hard, intense years
of the doctoral academic studies.

iii
ACKNOWLEDGEMENTS
To my parents, Gustavo and Brígida, as well as to my siblings, Astrid, Ronald and
Andrés, and my nice Valentina, for their moral and economic support in every step of the
doctorate course.
To Dr. Joaquín Patarroyo, for his wise guidance in the scientific research. His
continuous encouragement for asking the pertinent questions has sown inside my mind
the critical thought about noble, viable, real, and ulterior motives of any scientific
approach. Gratias maximas tibi ago.
To Dr. Marlene Vargas, for his inestimable support at every administrative process
requirement in Brazil, as well as in Colombia and the United States of America.
To Dr. Massaro Ueti, for his exceptional patience to me, as well as my work, during the
doctoral internship in the Washington State University (Pullman, WA, USA). His timely
advice was essential for a good work. Also, I will be everlastingly grateful for his
invaluable help at every administrative requirement that he had to sign.
To Dr. Wendy Brown and Dr. Jim Deringer, for allowing my participation in the scientific
research with Outer Membrane proteins of Anaplasma marginale at the Washington
State University, and for their scientific support, assistance, and encourage at the lab.
To Adriana María Henao Moreno, Brunna Esteves, and Leandro Araujo. You people
were more than my labmates; you were my role models for routine laboratory activities.
Especially, my deepest gratitude to Brunna Esteves for her assistance in some key
laboratory activities, particularly those of the second chapter.
To Byron Hernández and Guillermo Marín. Fellas, your friendship during the first part of
my doctoral academic formation kept me up to deal the unexpected spreading of
Macondo’s realism in both Viçosa and the UFV.

iv
To Daniel Fernando González Mendoza, my closest buddy and compadre, for his
technical assistance and companion in all the field collections carried out in Colombia.
Also, I really appreciated his intervention about getting the laboratory and the
equipment, as in Tunja (BY, Colombia) as in Arauca (AR, Colombia).
To Gina Gallego, Javier Antonio Benavides, Alejandra Mencía Guevara, Bindu
Rhagavan, Tomohiro Okagawa, and Hala Elsayed, for their friendship and sharing with
me their multicultural meetings in the Washington State University and in Pullman (WA,
USA). Personally, thanks a lot to Gina Gallego for her understanding and fellowship.
To Rosineia Cunha, for her timely, right administrative assistance at the Secretary of
Post-Graduate Studies (Department of Veterinary Medicine, Universidade Federal de
Viçosa). Thank you very much Rosi!
To the Washington State University and its staff, for allowing my internship as Research
Scholar.
To the Universidade Federal de Viçosa, for allowing my doctoral academic formation.
Special thanks to Colciencias (Departamento Administrativo de Ciencia, Tecnología, e
Innovación) in Colombia. Being awarded as one of the Colombian Bicentennial
Scholarship recipients has been one of my proudest achievements in my life. Also, the
scholarship funded the international intership and some materials for the first chapter.
Thanks to anyone who might help me, in way or another, to get successfully my doctor’s
degree at the Universidade Federal de Viçosa, Viçosa (MG, Brazil).

v
“…in most situations, the thing that you naturally want to do
is probably about the best thing you could do”.
A lemma by Neyman and Pearson in the theory of testing as
described by Ani Adhikari in edX Stat2.1X course, 2014.
“Better the hard truth, I say,
than the comforting fantasy”.
Carl Sagan
“Omne ignoto pro magnifico est”
Tacitus, Agricola, Book 1, 30

vi
BIOGRAPHY OF THE AUTHOR
ELKIN GUSTAVO FORERO BECERRA, the eldest child of Gustavo Forero
Tolosa and Brígida Becerra Becerra, born in Sogamoso (BY, Colombia) on November,
2nd, 1979.
He finished his Elementary School studies at the “Escuela Gabriel Agudelo” in
Belencito district, Nobsa (BY, Colombia), on November, 1990 and got his High School
degree at the “Colegio Nacional de Bachillerato Técnico Industrial Gustavo Jiménez” in
Sogamoso (BY, Colombia) on November, 1996.
In August 1997, he began the Veterinary Medicine and Zootechnics (MVZ is the
acronym in Spanish) course at the Universidad Pedagógica y Tecnológica de Colombia
(UPTC) in Tunja (BY, Colombia). His MVZ degree occurred in July, 2004 after the
conclusion of a long rural internship in Puerto Boyacá (BY, Colombia) entitled “Rural
Woman and Food Security: A Case Study”. During his studies at UPTC he was awarded
four times with the “Matrícula de Honor” (an exemption award of the fee costs for one
academic semester) because of his outstanding grades.
Then, he approved the selection process for the Master Student position at the
College of Veterinary Medicine and Zootechnics (FMVZ) in the Universidad Nacional de
Colombia (UNAL), Bogotá. D.C. (Colombia) and he started his studies on February,
2005. He got his Master degree on March, 2008 with a veterinary epidemiology work
entitled “Associated risk factors to myiasis by Cochliomyia hominivorax on cattle farms in
Puerto Boyacá, Colombia”. During his studies at UNAL he was awarded once with a
partial exemption of the fee costs for one academic semester and later he was awarded
with the full Exceptional Postgrad Student scholarship for other academic semester.
From 2009-2012, he kept a position as a substitute Professor of the Veterinary
Parasitology class and Head of Diagnostics of the Veterinary Parasitology Laboratory at
the FMVZ-UNAL, Bogotá, D.C. (Colombia).
On March, 2013 he began his doctoral studies at the Universidade Federal de
Viçosa (Viçosa, MG, Brazil) in the Laboratório de Biologia e Controle de Hematozoários
e Vetores (LBCHV) no Instituto de Biotecnologia Aplicada à Agropecuária (BIOAGRO).

vii
TABLE OF CONTENTS
LIST OF ILLUSTRATIONS xi
LIST OF TABLES xiii
LIST OF ABBREVIATIONS AND ACRONYMS xv
RESUMO xvii
ABSTRACT xviii
1. CHAPTER I: DETECTION OF RESISTANCE GENES TO SYNTHETIC
PYRETHROIDS AND Babesia spp. IN Rhipicephalus microplus AND CATTLE
BLOOD SAMPLES FROM COLOMBIA 1
1.1. INTRODUCCIÓN 2
1.1.1. Resistance to acaricides 2
1.1.1.1. Mechanisms of action of Synthetic pyrethroids (SP) 3
1.1.1.1.1. Synthetic pyrethroids (SP) 3
1.1.1.1.2. Mechanisms of resistance 3
1.1.1.1.3. Synthetic pyrethroids resistance 4
1.1.2. Bovine babesiosis 5
1.1.2.1. Cattle immunity mechanisms against B. bovis 6
1.1.2.2. Economic and veterinary public health importance of B. bovis 7
1.1.2.3. Developing of a synthetic vaccine against B. bovis 8
1.1.2.4. Diagnosis of B. bovis by serological tests and nucleic acid-based diagnostic assays 11
1.2. MATERIAL AND METHODS 13
1.2.1. Applied epidemiological questionnaires and further analysis for acaricide resistance
and bovine babesiosis 13
1.2.2. Selection of sampling sites in Colombia and tick collection methods 13
1.2.3. Collection of cattle serum and blood samples 16
1.2.4. Tick control samples for acaricide susceptibility 17
1.2.5. DNA extraction of pooled tick samples 18
1.2.5.1. Tick DNA extraction by the Phenol:Chloroform:Isoamyl method 18
1.2.5.2. Tick DNA extraction using a commercial kit 19
1.2.6. DNA isolation of dried blood spot samples 19
1.2.7. Detection of mutant genes involved in synthetic pyrethroids resistance 19
1.2.8. B. bovis rra gene and B. bigemina rap-1c gene PCR assays 21
1.2.9. Agarose gel electrophoresis and its developing under ultraviolet light 22
1.2.10. Indirect ELISA for detection anti-SBbo23290 antibodies for B. bovis 23
1.2.10.1. Modified criss-cross serial dilution analysis 24

viii
1.2.10.2. Indirect ELISA test protocol 25
1.3. RESULTS AND DISCUSSION 26
1.3.1. Epidemiological questionnaire analysis for acaricide resistant 26
1.3.2. Mutant Genotype of CzEst9 gene for Synthetic Pyrethroids Resistance 34
1.3.3. Mutant Genotype of IIIS6 gene for Synthetic Pyrethroids Resistance 36
1.3.4. Epidemiological questionnaire analysis for bovine babesiosis perception 38
1.3.5. Indirect ELISA for detection of anti-SBbo23290 antibodies for B. bovis 39
1.3.6. PCR assays results for B. bovis detection 44
1.3.6.1. Tick dragging samples 44
1.3.6.2. Tick removal samples 45
1.3.6.3. Blood samples 45
1.3.7. PCR assays results for B. bigemina detection 47
1.3.7.1. Tick dragging samples 47
1.3.7.2. Tick removal samples 48
1.3.7.3. Blood samples 48
1.3.8. Identification of Babesia spp. by ELISA and PCR in other studies 49
1.4. CONCLUSIONS 51
REFERENCES 53
2. CHAPTER II: TRANSFORMATION PROCESS OF Pichia pastoris KM71 WITH
THE SYNTHETIC GENE H1SBbo23290 DERIVATIVE FROM Babesia bovis
RAP-1 PROTEIN 60
2.1. INTRODUCTION 61
2.1.1. Synthetic genes 61
2.1.2. Pichia pastoris as biological system for protein expression 61
2.1.3. Transformation methods for recombinant expression of proteins 63
2.2. MATERIAL AND METHODS 65
2.2.1. The synthetic gene SBbo2390 65
2.2.2. Plasmid vector pPIC9K 66
2.2.3. Linearization process 67
2.2.4. Electroporation process 67
2.2.5. Selection of P. pastoris transformants 68
2.2.6. PCR assays 69
2.2.7. Fermentation process and protein expression 70
2.3. RESULTS AND DISCUSSION 72
2.3.1. DNA extraction of the plasmid pPIC9K 72
2.3.2. Linearization of the plasmid pPIC9K 74
2.3.3. Selection of P. pastoris transformants 80
2.3.4. PCR assays 80

ix
2.3.5. Fermentation process and protein expression 82
2.3.6. H1SBbo23290 and transformation issues 83
2.4. CONCLUSIONS 87
REFERENCES 88
3. CHAPTER III: BOVINE IMMUNE RESPONSE PRODUCE BY OMP7, OMP8, AND
OMP9 OUTER MEMBRANE PROTEINS FROM Anaplasma marginale St. MARIES
STRAIN IN CONFINED EXPERIMENTAL IMMUNIZED STEERS 90
3.1. INTRODUCTION 91
3.1.1. Bovine anaplasmosis 91
3.1.2. Bovine immune mechanisms against Anaplasma marginale 92
3.1.3. Vaccine research against Anaplasma marginale 93
3.1.4. A. marginale outer membrane proteins as vaccine candidates 94
3.2. MATHERIAL AND METHODS 97
3.2.1. Experimental animals 97
3.2.2. Preparation of the immunogen and immunizations 98
3.2.3. Immunizations of experimental animals with OM prep 98
3.2.4. Selected outer membrane proteins and its peptides 99
3.2.5. PBMC (peripheric blood mononuclear cells) isolation 101
3.2.6. Cellular proliferation assays 102
3.2.7. Recombinant proteins as antigens 106
3.2.8. Overlapping peptides spanning as antigens 107
3.2.9. Statistical analysis 109
3.3. RESULTS AND DISCUSSION 111
3.3.1. OM prep assay for all animals 111
3.3.2. Recombinant proteins PBMC assays for each animal 112
3.3.2.1. Animal 48406 112
3.3.2.2. Animal 48411 113
3.3.2.3. Animal 48422 113
3.3.2.4. Animal 48432 114
3.3.2.5. Animal 48453 114
3.3.3. T-cell line assays with every peptide for each animal 115
3.3.3.1. Animal 48406 115
3.3.3.2. Animal 48411 115
3.3.3.3. Animal 48422 116
3.3.3.4. Animal 48432 116
3.3.3.5. Animal 48453 116
3.3.4. Cellular proliferation assays in other studies 117
3.3.5. Working with frozen vials 121

x
3.3.6. A proposal for developing a vaccine candidate against Anaplasma marginale 122
3.4. CONCLUSIONS 126
REFERENCES 128
APPENDIX A – Project conditions verification for the CEUA certification committee 131
APPENDIX B – Certificate by the Ethics Committee in Animal Use at UFV 132
APPENDIX C – Informed consent form applied to every interviewee before starting the interview
and sample collection (Spanish Version that was applied) 133
APPENDIX D – Acaricide resistance detection in ticks from cattle production regions in
Colombia (Spanish Version that was applied) 134
APPENDIX E – Detection of Babesia spp. in collected ticks from different municipalities in
Colombia (Spanish Version that was applied) 135
APPENDIX F – Acaricide sensitivity profile of Brazilian R. microplus samples to some
commercial acaricides 136
APPENDIX G – Tick DNA extraction using the Phenol:Chloroform:Isoamyl method 137
APPENDIX H – Modified DNeasy Tissue & Blood kit protocol for Tick DNA 138
APPENDIX I – Modified Illustra Tissue & Cells genomicPrep Mini Spin Kit protocol for DNA
isolation from blood dried spot samples 139
APPENDIX J – Modified protocol for determining the optimal antigen concentration 140
APPENDIX K – Indirect ELISA protocol to detect SBbo23290 specific antibodies 141
APPENDIX L – Modified alkaline lysis method for plasmid DNA extraction from E. coli recipients
(Mini-prep) 142
APPENDIX M – Miniprep of Plasmid DNA by Alkaline Lysis with SDS 143
APPENDIX N – DNA extraction from P. pastoris by Phenol:Chloroform method 144
APPENDIX O – Protocols for Buffy Coat Method for PBMC isolation, cell counting on a
hemocytometer, and freezing PBMC 145
APPENDIX P – Protocol for getting viable cells from frozen cell vials 146
APPENDIX Q – A proposal for developing a vaccine candidate against Anaplasma marginale 147

xi
LIST OF ILLUSTRATIONS
Figure 1 – Comparison of resistance mechanisms (susceptible & resistant ticks) 4
Figure 2 – Main pathophysiological events of B. bovis cytoadherence 6
Figure 3 – Relative frequency of mixtures of commercial formulation and/or household intended
acaricide effect products used for cattle tick infestation in tick removal farms 31
Figure 4 – Map of the pPIC9K vector 66
Figure 5 – Restriction map of H1Bbo23290 sequence generated by NEBcutter 79
Figure 6 – Drawing of the immunizations showing the OM prep assay 102
Figure 7 – PBMC assays using recombinant proteins for each experimental animal 103
Figure 8 – A general drawing for a PBMC proliferation assay to the A. marginale OMP7, OMP8,
and OMP9 whole recombinant proteins 104
Figure 9 – T-cell line assays with all overlapping peptides spanning for each animal 104
Figure 10 – A general drawing for mapping T-cell epitopes to all-overlapping peptides spanning
of A. marginale OMP7, OMP8, and OMP9 proteins 105
Image 1 – Agarose gels electrophoresis of CzEst9 PCR products for Tick Dragging samples (A)
and Tick Removal samples (B) 35
Image 2 – Agarose gels electrophoresis of digested CzEst9 PCR products with EcoR I for Tick
Dragging samples (A) and Tick Removal samples (B) 35
Image 3 – Agarose gels electrophoresis of IIIS6 wild genotype PCR products for Dragging Tick
samples (A) and Removal Tick samples (B) 37
Image 4 – Agarose gels electrophoresis of IIIS6 mutant genotype PCR products (soaked in an
Ethidium Bromide solution) for Dragging Tick samples (A) and Removal Tick samples (B) 37
Image 5 – Primary (A) and semi-nested PCR (B) for the B. bovis rra gene in Tick Dragging
Samples from Colombia 45
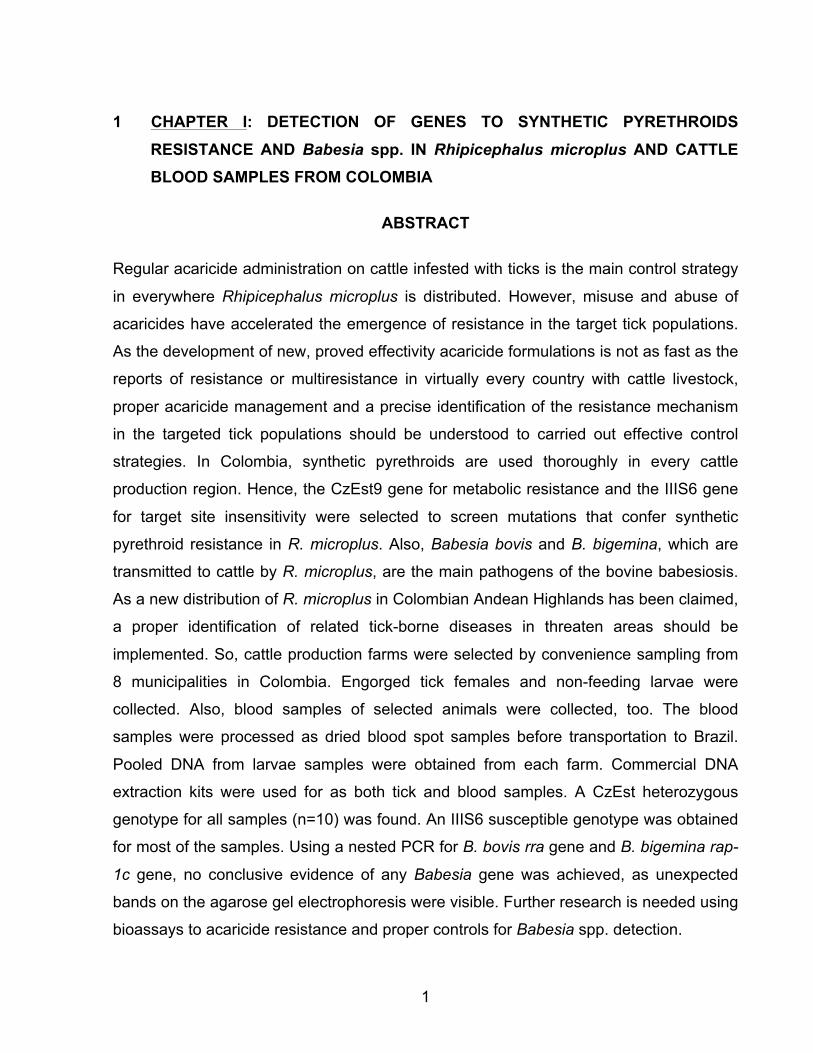
Image 6 – Primary (A) and semi-nested PCR (B) for the B. bovis rra gene in Tick Removal
Samples from Colombia 45
Image 7 – Primary (A) and semi-nested PCR (B) for the B. bovis rra gene in Cattle Dried Blood
Spot Samples from Colombia 46
Image 8 – Primary (A) and nested PCR (B) for the B. bigemina rap-1c gene in Tick Dragging
Samples from Colombia 47
Image 9 – Primary (A) and nested PCR (B) for the B. bigemina rap-1c gene in Tick Removal
Samples from Colombia 48
Image 10 – Primary (A) and nested PCR (B) for the B. bigemina rap-1c gene in Cattle Dried Blood
Spot Samples from Colombia 49

xii
Image 11 – Agarose gel electrophoresis for plasmid DNA and PCR products of pPIC9K
transformant vectors with H1Bbo23290 and H2Bbo23290 72
Image 12 – Agarose gel electrophoresis for linearized plasmid DNA of pPIC9K transformant
vectors with H1Bbo23290 or H2Bbo2390 73
Image 13 – Typical agarose gel electrophoresis results for pPIC9K plasmids DNA 73
Image 14 – Agarose gel electrophoresis results for pPIC9K plasmids DNA with bench protocols
or a commercial kit protocol 74
Image 15 – Two periods comparison of enzymatic digestion for the pPIC9K plasmids DNA with
the restriction enzyme Sac I (R5268) 75
Image 16 – Two periods comparison of enzymatic digestion for the pPIC9K plasmids DNA
(bench and commercial protocols) with the restriction enzyme Sac I (R6061) 75
Image 17 – Typical agarose gel electrophoresis results of plasmid DNA linearization (37ºC x 4h)
with Sac I (R6061) using the commercial or the bench protocol 76
Image 18 – Agarose gel electrophoresis results of concentrated plasmid DNA linearization and
subsequent PCR product enzymatic digestion (Sac I at 37ºC x 4h) 77
Image 19 – Several enzymatic digestion reactions (Sac I R6061 at 37ºC x 4h) for H1Bbo23290
and H2Bbo23290 plasmids DNA 77
Image 20 – Comparison of restriction enzymes and two enzymatic digestion periods using the
pPIC9K H1 plasmid DNA 78
Image 21 – Agarose gel electrophoresis of linearized pPIC9K H1 vector with or without
purification 78
Image 22 – Agarose gel electrophoresis of linearized H1 plasmid DNA 79
Image 23 – Typical photographs of the selective and non-selective media plates with
electroporated P. pastoris with linearized H1 plasmid DNA 80
Image 24 – Agarose gel electrophoresis for screening potential P. pastoris transformants with
H1Bbo23290 synthetic gene 81
Image 25 – Agarose gel electrophoresis for DNA extraction and subsequent PCR assays of each
P. pastoris transformant under the improved protocol 81
Image 26 – Agarose gel electrophorese for DNA extraction and PCR assays of P. pastoris
transformant (clone) A3 with H1Bbo23290 82
Image 27 – Agarose gel electrophoresis for DNA extraction and PCR assays of all remainder
P. pastoris transformants (clones) with H1Bbo23290 82
Image 28 – SDS-PAGE after silver nitrate staining for supernatant of the P. pastoris A3 clone
using three different dilutions and two sample buffers 83
Image 29 – Experimental steers at WSU Animal Facility 97

xiii
LIST OF TABLES
Table 1 – Some reports of acaricide resistance to OPs, SPs and AZ in Colombia 2
Table 2 – Reports of immunity to purified or designed antigens to B. bovis 9
Table 3 – B. bovis antigens under research for developing a subunit vaccine against bovine
babesiosis 10
Table 4 – Some characteristics of the localities for tick dragging 14
Table 5 – Some characteristics of the localities for tick removal 15
Table 6 – Eggs and larvae weight from removal tick females 16
Table 7 – Sera and blood collected samples from surveyed farms in Colombia 17
Table 8 – Commercial chemical acaricides for R. microplus sensitivity tests on Brazilian samples
in Embrapa, Gado de Leite, Juíz de Fora (MG) 18
Table 9 – Sequences of the oligonucleotide primers used in the PCR assays and expected PCR
product sizes based on R. microplus genes 20
Table 10 – Sequences of the oligonucleotide primers used in the PCR assays and expected PCR
product sizes based on B. bovis and B. bigemina genes 22
Table 11 – Main characteristics of the surveyed farms in Colombia according to sample collection
method and used acaricide 26
Table 12 – Characterization of a few aspects of the farms cattle market 28
Table 13 – Characterization of the tick control in the surveyed farms 29
Table 14 – Characterization of the babesiosis perception in the surveyed farms 39
Table 15 – Data of collected cattle sera from Colombia 40
Table 16 – Optical densities at 450 nm of ELISA for each triplicate sample, Plate 1 41
Table 17 – Optical densities at 450 nm of ELISA for each triplicate sample, Plate 2 41
Table 18 – Establishing the positivity threshold for each 96-wells plate 42
Table 19 – Number and percentage of positive and negative animals according to age, origin,
and municipality elevation 43
Table 20 – Data of processed cattle blood dried spots from Colombia 46
Table 21 – Main features about B. bovis Bv60 (RAP-1) protein 65
Table 22 – Main features about the B. bovis RAP-1-derived synthetic gene SBbo23290 65
Table 23 – Sequences of the oligonucleotide primers used in the PCR assays and expected PCR
product size 69
Table 24 – Vantages and disadvantage of A. marginale live and subunit vaccines 93
Table 25 – Main characteristics of the experimental animals 97
Table 26 – Main features about A. marginale OMP7, OMP8, and OMP9 proteins, and A. centrale
OMP7 protein 99

xiv
Table 27 – CPM statistics of PBMC proliferation assay for all steers (Dec/16/14) 111
Table 28 – Selected PBMC assays of each animal with rOMPs 112
Table 29 – Selected T-cell line assays with overlapping peptides spanning 115

xv
LIST OF ABBREVIATIONS AND ACRONYMS
aa amino acid
APC Antigen Presenting Cells
AZ amitraz
Bbo UFV-1 Pathogenic strain of Babesia bovis isolated at the UFV.
BIOAGRO Instituto de Biotechnologia Aplicada à Agropecuaria (Research Institute for Applied
Agricultural Biotechnology)
Bgl II A type II restriction endonuclease enzyme isolated from Bacillus globigii
BOD Biochemical oxygen demand
BoLA Bovine lymphocyte antigen A-type or bovine major histocompatibility complex
bp base pair (any of pairs of nucleotides in DNA sequences)
CD4+ T-cell T-lymphocytes expressing the Cluster of Differentiation 4 transmembrane glycoprotein
CD8+ T-cell T-lymphocytes expressing the Cluster of Differentiation 8 transmembrane glycoprotein
cRPMI complete Roswell Park Memorial Institute medium.
CV Clínica Veterinaria (Veterinary Hospital)
CVFA Clínica Veterinaria Francisco de Asis (Francisco de Asis Veterinary Hospital)
DNA Deoxyribonucleic acid
ELISA Ezyme-linked Immunosorbent Assay
EMBRAPA Empresa Brasileira de Pesquisa Agropecuária (Brazilian Agricultural Research
Corporation)
EDTA Ethylenediaminetetraacetic acid
EcoR I A type II restriction endonuclease enzyme isolated from Escherichia coli
FIDIC Fundación Instituto Colombiano de Inmunología (Colombian Foundation Research
Institute for Immunology)
FUJDC Fundación Universitaria Juan de Castellanos (Juan de Castellanos Higher Education
Foundation)
x g or Relative Centrifugal Force (RCF) is the amount of accelerative force to a sample in a
centrifuge
H1Bbo23290 Original version of the synthetic peptide derived from Babesia bovis RAP-1
H2Bbo23290 Modified version of the synthetic peptide derived from Babesia bovis RAP-1
HBSS Hank’s Balanced Salt Solution
IL Interleukin
INF-γ Interferon gamma (a cytokine)
iRBC infected red blood cells (erythrocytes)
irrPBMC Irradiated peripheric blood mononuclear cells

xvi
kDa Kilodalton (unit of atomic mass)
KM71 A strain of Pichia pastoris used in biological expression systems for heterologous proteins.
LBCHV Laboratório de Biologia e Controle de Hematozoários e Vetores (Laboratory of Biology
and Control of Hemoparasites and Vectors)
LC Laboratorio Clínico (Clinical diagnose laboratory)
Na+ Sodium ion
OMP An Outer Membrane protein family of Anaplama marginale
OM prep Outer Membrane purified fractions of Anaplasma marginale
OPs Organophosphates
PBMC Peripheric blood mononuclear cells
PCR Polymerase Chain Reaction
pPIC9K A plasmid used as a vector for recombinant expression of a foreing gene in Pichia
PTM1 Pichia trace metals 1 solution
r Symbol for recombinant
R2 Coefficient of determination
RAP-1 Rhoptry associated protein 1
RFLP Restriction Fragment Length Polymorphism
Sac I A type II restriction endonuclease enzyme isolated from Streptomyces achromogenes
SBbo23290 Synthetic peptide derived from Babesia bovis RAP-1 protein
SD Standard deviation
SDS-PAGE A polyacrylamide gel electrophoresis that uses sodium duodecil sulfate
SI Stimulation index
SnSAG5 SAG5 protein of Sarcocystis neurona
sp The abbreviation of species singularis (when one species is tacit included)
spp The abbreviation of species pluralis (when several species are tacit included)
SPs Synthetic pyrethroids
TCGF T-cell growing factor
TCL T-cell line
TNF-α Tumor necrosis factor alpha
UFV Universidade Federal de Viçosa (Federal University of Viçosa)
uRBC uninfected red blood cells (erythrocytes)
WC1+ Workshop Cluster 1 subpopulation of bovine γδ T-cells
WSU Washington State University
x Average (arithmetic mean)
YPD Yeast Extract + Peptone + Dextrose medium
YPDS Yeast Extract + Peptone + Dextrose + Sorbitol medium

xvii
RESUMO
FORERO BECERRA, Elkin Gustavo, D.Sc., Universidade Federal de Viçosa, fevereiro de 2017. Perspectivas de controle do carrapato do boi Rhipicephalus microplus e dos hemoparasitos Babesia bovis e Anaplasma marginale. Orientadora: Marlene Isabel Vargas Viloria. Coorientadores: Joaquín Hernán Patarroyo Salcedo, Artur Kanadani Campos e Massaro Wilson Ueti.
Recentemente, R. microplus tem ampliado a sua distribuição a altitudes maiores na
Colômbia. A identificação dos mecanismos de resistência a acaricidas é requerida, e
também do diagnóstico e dos candidatos a vacina dos patógenos transmitidos Babesia
bovis e Anaplasma marginale. Restrições devidas a patentes e requirementos da bolsa
de doutorado estabeleceram três capítulos à tese de DSc. Capítulo 1: Deteção de
genes de resistência a piretroides sintéticos e de Babesia spp. em amostras de
Rhipicephalus microplus e sangue bovino da Colômbia. Amostras de Rhipicephalus
microplus (teleoginas e larvas) e de sangue bovino foram coletadas de fazendas
selecionadas em 8 municípios na Colômbia. Uma triagem por PCR procurando
mutações nos genes CzEst9 e IIIS6, os quais conferem resistência a piretroides
sintéticos, mostrou que todas as amostras de carrapatos foram heterozigóticas para
CzEst9 e a maioria mostraram suscetibilidade para IIIS6. Uma triage por nested PCR
para a deteção dos genes rra de Babesia bovis e rap-1c de B- bigemina resultou em
bandas adicionais evitando evidência conclusiva. Capítulo 2: Processo de transfor-
mação de Pichia pastoris KM71 com o gene sintético H1Bbo23290 derivado da
proteina RAP-1 de Babesia bovis. O processo de transformação de Pichia pastoris
KM71 com H1Bbo23290 (um candidato vicinal promissório contra a babesiose bovina)
não foi bem sucedido. A extração de DNA plasmidial e a sua posterior linharização
foram os maiores obstáculos. Capítulo 3: Resposta immune bovina produzida pelas
proteínas da membrana externa de Anaplasma marginale OPM7, OMP8, e OMP9
da cepa St. Maries em novilhos experimentais confinados e imunizados. As
proteínas OMP7, OMP8, e OMP9 de A. marginale e A. centrale foram usadas para
testar a presença de potenciais sequencias conservadas. As proteínas recombinates e
seus peptídeos superpostos periódicamente foram usados em ensaios de proliferação
de células T. Epítopes de células T, imunogênicos e conservados foram identificados.

xviii
ABSTRACT
FORERO BECERRA, Elkin Gustavo, D.Sc., Universidade Federal de Viçosa, February, 2017. Control perspectives of the Cattle Tick Rhipicephalus microplus and hemoparasites Babesia bovis and Anaplasma marginale. Advisor: Marlene Isabel Vargas Viloria. Co-advisers: Joaquín Hernán Patarroyo Salcedo, Artur Kanadani Campos and Massaro Wilson Ueti.
Recently, R. microplus has extended its distribution to higher altitudes in Colombia.
Proper identification of acaricide resistance mechanisms is required, as well as tick-
borne diseases diagnosis and vaccine candidates for Babesia bovis and Anaplasma
marginale. Patent restrictions and the scholarship funding requirements established
three separated, but related, chapters for the DSc thesis. Chapter 1: Detection of
genes to synthetic pyrethroids resisntance and Babesia spp. in Rhipicephalus
microplus and cattle blood samples from Colombia. Samples of R. microplus
(engorged females and larvae) and cattle blood were collected from selected farms in 8
municipalities in Colombia. A PCR screening for mutations on CzEst 9 and IIIS6 genes
that confer synthetic pyrethroid resistance showed all tick samples had a heterozygous
genotype to CzEst9 and most of the samples had an IIIS6 susceptible genotype. A
nested PCR screening for detection of B. bovis rra and B. bigemina rap-1c genes
resulted in unexpected bands prevented conclusive evidence. Chapter 2:
Transformation process of Pichia pastoris KM71 with the synthetic gene
H1Bbo23290 derivative from Babesia bovis RAP-1 protein. The transformation
process of Pichia pastoris KM71 with H1Bbo23290 (a promising vaccine candidate
against bovine babesiosis) was unsuccessful. Plasmid DNA extraction and subsequent
linearization were the major obstacles. Chapter 3: Bovine immune response
produced by OMP7, OPM8, and OMP9 Outer Membrane proteins from Anaplasma
marginale St. Maries strain in confined experimental immunized animals. OMP7,
OMP8, and OMP9 proteins were used to test potential conserved sequences containing
CD4 T-cell epitopes. Using in vitro T-cell proliferation assays to test recombinant A.
marginale and A. centrale OMP7, OMP8, and OMP9, and their overlapping peptides
spanning each protein, conserved immunogenic T-cell epitopes were been identified in
some peptides.
1
1 CHAPTER I: DETECTION OF GENES TO SYNTHETIC PYRETHROIDS
RESISTANCE AND Babesia spp. IN Rhipicephalus microplus AND CATTLE
BLOOD SAMPLES FROM COLOMBIA
ABSTRACT
Regular acaricide administration on cattle infested with ticks is the main control strategy
in everywhere Rhipicephalus microplus is distributed. However, misuse and abuse of
acaricides have accelerated the emergence of resistance in the target tick populations.
As the development of new, proved effectivity acaricide formulations is not as fast as the
reports of resistance or multiresistance in virtually every country with cattle livestock,
proper acaricide management and a precise identification of the resistance mechanism
in the targeted tick populations should be understood to carried out effective control
strategies. In Colombia, synthetic pyrethroids are used thoroughly in every cattle
production region. Hence, the CzEst9 gene for metabolic resistance and the IIIS6 gene
for target site insensitivity were selected to screen mutations that confer synthetic
pyrethroid resistance in R. microplus. Also, Babesia bovis and B. bigemina, which are
transmitted to cattle by R. microplus, are the main pathogens of the bovine babesiosis.
As a new distribution of R. microplus in Colombian Andean Highlands has been claimed,
a proper identification of related tick-borne diseases in threaten areas should be
implemented. So, cattle production farms were selected by convenience sampling from
8 municipalities in Colombia. Engorged tick females and non-feeding larvae were
collected. Also, blood samples of selected animals were collected, too. The blood
samples were processed as dried blood spot samples before transportation to Brazil.
Pooled DNA from larvae samples were obtained from each farm. Commercial DNA
extraction kits were used for as both tick and blood samples. A CzEst heterozygous
genotype for all samples (n=10) was found. An IIIS6 susceptible genotype was obtained
for most of the samples. Using a nested PCR for B. bovis rra gene and B. bigemina rap-
1c gene, no conclusive evidence of any Babesia gene was achieved, as unexpected
bands on the agarose gel electrophoresis were visible. Further research is needed using
bioassays to acaricide resistance and proper controls for Babesia spp. detection.

2
1.1 INTRODUCTION
1.1.1 Resistance to Acaricides
Amid the tick species of veterinary importance, Rhipicephalus microplus
represents the biggest threat to productivity, competitiveness of cattle industry from
worlds’ tropical and subtropical regions (LODOS et al., 2000). The most common
method of tick control is based on use of commercial synthetic acaricides (PATARROYO
et al., 2009). Notwithstanding, R. microplus has developed acaricide resistance virtually
to every single commercial product that is used, or has been used, in most of the
countries where its chemical control is current under carrying out. Several reports for
next acaricide effect families have been published: organophospahates (OPs)
(PATARROYO and COSTA, 1980); carbamates (LI et al., 2005); amitraz (AZ) (LI et al,
2004); avermectins (PÉREZ-COGOLLO et al, 2010); pyrethroids (BAFFI et al., 2007);
phenylpyrazole compounds (CASTRO-JANER et al., 2010). In Colombia, there are
several publications about acaricide resistance. A selected list is presented on Table 1.
Table 1. Some reports of acaricide resistance to OPs, SPs and AZ in Colombia. Municipality (State) Strain Method Resistance Profile Reference
Socorro (ST) Montecitos LPT, AIT
Chlorfenvinphos, Coumaphos,
Diazinon, Deltamethrin,
Cypermethrin, and Amitraz
Benavides et al. (2000)
Socorro (ST) Montecitos mLIT Ivermectin Benavides and Romero (2000)
Ibagué (TO) --- AIT, PCR Cypermethrin Díaz and Vallejo (2013)
Several locations (ST,
CU, AN, TO, QD, CL,
HU and BY)
--- AIT Ethion and Amitraz Araque et al. (2014)
Two locations (AN) --- AIT Cypermethrin, Amitraz López-Arias et al. (2014)
Two locations (AN) --- AIT Cypermethrin, Amitraz Puerta et al. (2015)
LPT = Larval packet test. AIT = Adult immersion test. mLIT = modified larval immersion test. PCR = Polymerase chain reaction.
Under these circumstances, a new discovery of acaricide resistance in R.
microplus poses uncertainty to any perspective of chemical control in long-term

3
(ANGUS, 1996). Besides, a population under chemical synthetic compound pressure
can accumulate several resistance mechanisms (GEORGHIOU, 1986). Because of the
widespread use of synthetic pyrethroid compounds against R. microplus in Colombia
(Table 1), as well as the availability of non-expensive, specific tools for molecular
detection of resistance, understanding the problem in selected cattle production areas
represents a baseline.
1.1.1.1 Mechanisms of action of Synthetic pyrethroids (SP)
1.1.1.1.1 Synthetic pyrethroids (SP)
Pyrethroids stimulate the opening of the voltage-gate sodium channels (Na+) and
avoid their closure leading to an axonal membrane depolarization (BEUGNET and
FRANC, 2012). The extension of the voltage-gate sodium channels deactivation alters
the depolarization-repolarization cycle (SODERLUND et al., 2002), where axonal
membrane cannot be repolarized and it is kept in a permanent depolarization condition
paralyzing and killing the arthropod. The sudden shock showed by some insects treated
with pyrethroids, in which all movement just cease and death is apparent, is known as
knock-down effect (BEUGNET and FRANC, 2012).
1.1.1.1.2 Mechanisms of resistance
Mutant genes that confer insecticide/acaricide resistance can be structural or
regulator kind (ECKERT et al., 1986). A mutation in a structural gene can lead to a
critical modification of a protein (target site sensitivity reduction) or enzyme (increased
capability of pesticide metabolism). On the other hand, a mutation in a regulator gene
can lead to a transcription rate alteration of a structural gene (ECKERT et al., 1986). It is
known that some pesticide resistance cases have been limited to a single amino acid
replacement, and that kind of substitution can happen in the same amino acid in
different species exposed to the same pesticide (FFRENCH-CONSTANT, 2007). Three

4
main categories of resistance mechanisms to pesticides have been presented
(GUERRERO et al., 2012) (see Figure 1):
a) Reduce penetration: alterations in the ability of an acaricide to enter into a
treated individual.
b) Metabolic detoxification: changes on detoxification or sequestration of an
acaricide by a tick individual.
c) Target site insensitivity: an amino acid mutation happens in an allele of the
gene coding the target molecule preventing the appropriate attack by the
acaricide.
Figure 1 – Comparison of resistance mechanisms (susceptible & resistant ticks). Source: Adapted and modified from Georghiou (1994), Kalfke (2008) and Flapp (1986).
1.1.1.1.3 Synthetic pyrethroids resistance

5
Only the α-subunit is one of the several subunits that form the voltage-gate
sodium channels, and it is required for the channel function. The α-subunit has four
internally homologous domains labeled I to IV (MARBAN et al., 1998). Regarding the
studies reviewed by Guerrero et al. (2012), a specific mutation on Domain III
(phenylalanine to isoleucine) confers a very high level of resistance to permethrin,
cypermethrin, and flumethrin in the homozygous state. Also, mutations on Domain II
(leucine to isoleucine or glycine to valine changes) convey lesser levels of resistance to
permethrin, cypermethrin, and flumethrin.
On the other hand, using biochemical synergists (piperonyl butoxide and triphenyl
phosphate), a specific esterase (CzEst9), that hydrolyzed permethrin, has been
identifyied. However, a specific involvement of cytochrome P450s and glutathione S-
transferases in pyrethroid resistance has not been identified. Finally, the target site
insensitivity (e.g., IIIS6 gene) plays a major role in synthetic pyrethroids resistance
where this mechanism coexists with metabolic resistance (GUERRERO et al., 2012).
1.1.2 Bovine babesiosis
Bovine babesiosis is a tick-borne disease mainly caused by Babesia bovis
(BABES, 1888) and B. bigemina (SMITH AND KILBORNE, 1893) in South America. The
geographic distribution of this disease is conditioned by the presence of its main vector,
R. microplus (GUGLIELMONE, 1995). The frequency of bovine babesiosis is associated
to an irregular rate of transmission, host susceptibility, and the strain virulence
(UILENBERG, 2006). All costs related to tick control and babesiosis treatment justify the
searching of alternative control methods under an Integrated Tick Management
perspective.
In that way, the synthetic subunit candidate vaccine against B. bovis –
SBbo23290–, developed in Brazil (PATARROYO et al., 1999), represents an opportunity

6
to reduce costs and risks about bovine babesiosis in cattle production. There are not
reports of any subunit commercial vaccine against B. bovis in the world. Hence, the
recombinant expression of the synthetic peptide (SBbo23290) is necessary for its
industrial-scale production.
1.1.2.1 Cattle immunity mechanisms against B. bovis
B. bovis causes an acute infection in adult cattle, frequently fatal, which will have
a persistent infection state after recovery, but resistant to the clinic disease (BROWN et
al., 2006). Generalized blood circulation disturbances are consequence of the host
immune response (WRIGTH et al., 1988). Cytoadherence of numerous infected
erythrocytes with B. bovis merozoites to endothelial cells of microvasculature walls will
lead to neurologic syndromes (ALLRED, 2003) and respiratory distress (Figure 2).
Figure 2 – Main pathophysiological events of B. bovis cytoadherence. Source: Adapted from Vargas and Patarroyo (2004).
B. bovis has five ways to evade the host immune response (ALLRED, 2003): (i)
rapid antigenic variation; (ii) cytoadhesion and sequestration; (iii) binding of host proteins
to infected red blood cells (iRBC); the monoallelic expression of different members of
multigene families; and (5) establishment of a poorly understood transient
immunosuppression. Overproduction of pro-inflammatory cytokines (e.g. INF-γ e TNF-α)

7
and Nitrous Oxide (NO), as a response to the B. bovis intraerythrocytic stages, worsen
the disease (BROWN AND PALMER, 1999).
Survivor cattle to B. bovis infection, because of a natural recovery or a
consequence of chemotherapy, will remain as persistently infected individuals but
resistant to clinic disease (BROWN et al., 2006). This associated immunity depends on
antigens presentation of the parasite to CD4+ T cells by Antigen Presenting Cells (APC).
Then, splenic macrophages are activated and neutralizing antibodies are produced to
destroy iRBC and extracellular merozoites (BROWN AND PALMER, 1999).
The immune basis for the age-related resistance to B. bovis infection in calves
would be linked to an innate immune response in the primary infection with higher,
earlier production of IL-12, INF-γ and NO (BROWN et al., 2006). Because of the B. bovis
rapid antigenic variation to escape the cattle immune system, it is essential to establish
conserved epitopes for T cells with the goal of include them in subunit vaccines
(BROWN AND PALMER, 1999).
1.1.2.2 Economic and veterinary public health importance of B. bovis
B. bovis and B. bigemina are the main pathogens of bovine babesiosis, a illness
sometimes severe and sometimes fatal because of its intraerythrocytic development
(VIAL AND GORENFLOT, 2006). The economic costs associated to bovine babesiosis
have been estimated based on mortality, loss of body condition score, abortion,
production decrease (milk, beef, or work), carrying out control measures, and impact in
the cattle international trade (BOCK et al., 2004). Callow (1979) reported a lower
pathogenicity in B. bigemina infections when compared to B. bovis in Australia. On the
other hand, the concept of enzootic stability has been used to stand for keeping a
minimal level of the tick burden in the long term on cattle population, especially young
individuals. In that way, transmission rates of hemoparasites will be enough to make
easier the development of protective immunity in the infected individuals (UILENBERG,
2006).

8
Hence, all measures seeking a reduction of the parasitic population levels of ticks
will cause a significative reduction in transmission rates of bovine babesiosis pathogens,
too (JOHNSTON et al., 1981). However, validity and usefulness of this epidemiological
concept in the R. microplus-B. bovis-Bos taurus system (B. taurus taurus and B. taurus
indicus), out of the Queensland region (Australia), have not been carried out under
different population, operative, and ecologic dynamics (JONSSON et al., 2012).
Although there are relative effective babesiacides for bovine babesiosis treatment
(BOCK et al., 2004), the probability of success will decrease if the treatment is delayed
until the animal gets thinner because of fever and anemia. In such conditions, the
indiscriminate use of anti-Babesia agents can result in development of resistant
parasites to drugs, a situation that will require the generation of highly specific
babesiacides with low toxicity to the host (MOSQUEDA et al., 2012; VIAL AND
GORENFLOT, 2006).
1.1.2.3 Developing of a synthetic vaccine against B. bovis
By reason of cattle getting a long-term immunity after a single infection with
Babesia spp., this characteristic has been used to generate live attenuated vaccines
against bovine babesiosis in several countries around the world (BOCK et al., 2004). In
that sense, an efficient method of cattle immunization was developed in Australia, in the
second half of last century, using live attenuated strains of B. bovis (CALLOW AND
MELLORS, 1966).
However, this kind of vaccines has several disadvantages (risk of contamination
with pathogens, reversion of the vaccine attenuated strain, need for a vaccine cold chain
infrastructure, etc.) (see BOCK et al., 2004) leading to other approaches. Therefore,
antigens that provide protective immunity have been searched in order to avoid the use
of live attenuated strains (Table 2).

9
A big problem of Babesia antigens obtained from infected erythrocytes is the
separation of the erythrocyte components (see PATARROYO et al., 1995), as well as its
mass production. As a result, other antigens and approachs have been researched in
order to develop a commercial vaccine against B. bovis (Table 1.3). In that way, the
SBbo23290 synthetic peptide was designed at the LBCHV-BIOAGRO of the Federal
University of Viçosa (PATARROYO et al., 1999). The recognition of the SBbo23290
synthetic peptide by cattle PBMC and T-cell proliferation assays resulted in higher
production levels of INF-γ, TNF-α, and IL12 when compared with control (Concanavalin
A), after a previous exposition to an attenuated B. bovis strain (Bbo UFV-1) (FREITAS,
2001).
Table 2 – Reports of immunity to purified or designed antigens to B. bovis. Reference Antigen Description
Mahoney (1967) Uncharacterized Lyophilization of erythrocyte extracts infected with B. bovis. Immunized
animals did not showed clinical signs of bovine babesiosis.
Mahoney and Wright (1976) Infected erythrocyte
antigen (IEA)
Subcutaneous inoculation of IAE gave protection against B. bovis
challenge in cattle, being similar to babesiosis subclinical infection.
Mahoney et al. (1981) Soluble antigen and
IEA
Both soluble antigen and IEA protected splenectomized calves against
B. bovis challenge. The soluble fraction could have a better potential as
a subunit vaccine.
Wright et al. (1983) A 44 KDa molecule
Isolation of a purified protective fraction of B. bovis with monoclonal
antibodies and induction of protective immunity in splenectomized
calves.
Wright et al. (1985) A 29 KDa molecule Antigen purification and splenectomized bovine vaccination using
Freund’s complete adjuvant. The immunization was successful.
Waltisbuhl et al. (1987) 800 KDa and 300
KDa fractions
Most of the splenectomized, immunized calves survived (75%), using
the 300 KDa fraction, when comparing with the 800 KDa fraction group.
Goodger et al. (1992) 11C5 Antigen identified by W11C5 (murine monoclonal antibody). The immu-
nization was successful. Potential synthesis using recombinant DNA.
Patarroyo et al. (1995) Exoantigen with
6,500 IAE units
The exoantigen was collected from the in vitro culture supernatant of
the B. bovis BbUFV1 strain. Cattle were immunized successfully.
Patarroyo et al. (1999) Synthetic peptide
SBbo23290
The antigen was designed from the Rhoptria Associated Protein 1
(RAP-1) resulting in the bound of two synthetic peptides (5084 & 5081).
Jardim (2005) and Castro (2005) found an effective, antigen-specific immune
response to the SBbo23290 synthetic peptide by lymph nodes histology, circulating
lymphocytes profile, ELISA test, and clinical assessment in vaccinated experimental
bovines previously exposed to a B. bovis virulent strain (Bbo UFV-1).

10
Table 3 – B. bovis antigens under research for developing a subunit vaccine against bovine babesiosis.
Antigen Localization in B. bovis life cycle stages
Year of first publication Stages in the tick host Stages in the ruminant host
MSA-1 and MSA-2 x x 1989
RAP-1 x x 1991
SPB-1, 2, 3, 4 x 1992
SBbo23290 x 1999
vesa and smorfs x 2001
BbTRAP x 2003
RRA x 2007
BboRhop68 x 2010
Bbo-MIC-1 x 2010
Bov57 x x 2010
Bovipain-2 x 2010
Bbo-6cys A, B, C, D, E, F x 2011
Source: Adapted from Suárez and Noh (2011).
Later, experimental bovines were simultaneously vaccinated with the B. bovis
SBbo23290 and R. microplus SBm7462 synthetic peptides in a polyvalent or
monovalent form. Measuring the humoral responses, Benavides (2006) found high
levels of IgG1 on IgG2 to SBbo23290. Also, the specific IgG1 for SBbo23290 showed
cross protection with SBm7462. Hence, crossed responses conferred by intraclonal
competitions could be determining the immunological effect in polyvalent and
monovalent form vaccinations Benavides (2006).
In the same way, Oliveira (2006) analyzed the leukocyte kinetic of these
experimental animals and found more prominence for the B cells CD21+ and T cells
WC1+, as well as a significant increase in T cells CD4+. So, a high association between
SBbo23290 and SBm7462 conferred protection and high levels of T cell WC1+ and
CD4+ was concluded.
Finally, Hernández-Ortiz (2014), using Pichia pastoris KM71, supposedly having
the synthetic gene H1Bbo23290, got the expressed protein after a fermentation process.
Then, the protein was identified by Western Blotting test. Next, experimental bovines
were vaccinated once every 30 days for three times with this protein. Later, these
vaccinated animals were challenged with a B. bovis virulent strain (Bbo UFV-1). As a

11
result, vaccinated group had the same or even worst clinical responses to the biological
challenge when compared with the control group. According to Hernández-Ortiz (2014),
a higher dose of infected erythrocytes (iRBC) with the Bbo UFV-1 virulent strain (2.4 x
106 iRBC/mL) than previous works (BENAVIDES, 2006; JARDIM, 2005), low body
condition score for the experimental animals in the vaccinated group, and an antigen
dilution issue before vaccination could be probable causes for a non-protective immune
response. At that time, the research team at the LBCHV-BIOAGRO never considered
potential flaws in the P. pastoris rSBbo23290 clones.
1.1.2.4 Diagnosis of B. bovis by serological tests and nucleic acid-based
diagnostic assays
Since the ELISA technique was designed and successfully tested in 1971,
several kits have been developed for different purposes in immunodiagnostic (LEQUIN,
2005). The serological diagnostic of Babesia spp. has been a challenge because of lack
of specificity and cross-reactivity between Babesia species, as well as related
Apicomplexa genus, from animal blood samples. In initial use of ELISA technique for
babesiosis immune diagnosis, the detection of early infection, along with a prompt
absence verification of the pathogen circulating in the blood after autosterilization or
chemotherapy, represented a challenge (TODOROVIC, 1975).
As an indirect diagnostic method for detecting antibodies or antigens, the ELISA
technique is useful for detecting low Babesia densities below the sensitivity of direct
methods (SALIH et al., 2015). Commercial ELISA kits for B. bovis has been developed
and epidemiologically tested (ECHAIDE et al., 1995). Although indirect and competitive
ELISA tests using recombinant merozoite surface and rhoptry-associated antigens of B.
bovis has been developed, there is still no well-validated ELISA available for B.
bigemina (OIE, 2014).
In this context, Jardim (2005) used an indirect ELISA technique for a successful
detection of antibodies anti-SBbo23290. Since then, this technique is used for testing

12
sera of vaccinated experimental animals with SBbo23290 after challenge with Bbo UFV-
1 at the Laboratorio de Biologia e Controle de Hematozoários e Vetores (LBCHV),
Instituto de Biotecnologia Aplicada à Agropecuária (BIOAGRO), Universidade Federal
de Viçosa (UFV). As recent ELISA methods include the use of recombinant antigens
and the use of monoclonal antibodies, increasing specificity and diminishing unspecific
binding and signal (MOSQUEDA et al., 2012), the expression of the SBbo23290 peptide
in a biological system was the next step.
On the other hand, it is important to keep in mind limitations of immunological and
serological methods lending to the essential use of parallel molecular diagnostics
(SKOTARZAK, 2008), mainly as a research tool or monitoring of the treatment
(SOLANO-GALLEGO et al., 2016). In that way, several Polymerase Chain Reaction
(PCR) techniques has been developed describing parasitemias as low as 10-6 to 10-7%
(CALDER et al., 1996). Using standard PCR and Real Time PCR, a few as 35 B. bovis
parasite/µL and 0.35 B. bovis parasite/µL were the detection limits, respectively (ZHANG
et al., 2016). Also, because of the high degree of 18S rDNA sequence identity exists
between many Babesia spp., the complete 18S rRNA gene (about 1,700 bp) should
always be analyzed, especially in newly recognized organisms (HUNFELD et al., 2008).

13
1.2 MATERIAL AND METHODS
1.2.1 Applied epidemiological questionnaires and further analysis for
acaricide resistance and bovine babesiosis
An epidemiological questionnaire was applied to the owner or farm manager at
the moment of sample collection. The approval of Ethics Committee in Animal Use is
shown in Appendix A and B. The explained, informed consent form was applied to every
respondent (Appendix C). The questionnaire form (main page) for asking about
acaricide resistant factors is presented in Appendix D. All questions asked to all
interviewees, with the exception of six additional questions (2.3, 2.4, 2.11, 2.12, 2.21,
and 2.22 highlighted in blue in Appendix D) that were asked only in farms where the tick
removal methodology was made. This methodology was a succeeding activity, as well
as the new questions, as a result of several technical advices and literature review.
Unfortunately, because of limiting resources, it was not possible to do a new interview to
the previously survey respondents. All answers of every questionnaire were categorized
and a database was made for subsequent descriptive statistics analysis in Microsoft
Excel® Mac Version (14.1.0). No statistics test association was used for any variable as
no biological assay was carried out to verify the resistance phenotype of the tick
samples.
Also a questionnaire form (main page), asking about bovine babesiosis
perception by the surveyed farmers, is presented in Appendix E. A database was carried
out with the same methodology described above. No statistics test association was used
for any variable as it depended of an undisputed Babesia spp. genes detection.
1.2.2 Selection of sampling sites in Colombia and tick collection methods

14
Five cattle farms were selected by convenience sampling from different
municipalities of Colombia (South America) between January and February 2014 (Table
4). At each farm, free-living tick larvae were collected by the dragging technique
(SUCEN, 2004; OLIVEIRA et al., 2000). Briefly, at least a 70 m lineal transect was
sampled for about 1 hour on pasture using a white flannelette (1.50 x 0.90 m attached to
two wood bars on shorter sides) keeping it close to grass. Attached tick larvae were
grabbed with pliers and placed into 2 mL microcentrifuge snap top tubes with absolute
isopropanol. Samples were stored at room temperature until their processing at the
LBCHV-BIOAGRO-UFV (Brazil).
Table 4 – Some characteristics of the localities for tick dragging. Collection Date Municipality/State Municipality Elevation Farm Number of tick larvae*
January 24th, 2014 Arcabuco (BY) 2,575 m.a.s.l. A1 532
January 29th, 2014 San José de Pare (BY) 1,545 m.a.s.l. J 641
February 1st, 2014 Pajarito (BY) 793 m.a.s.l. P 538
February 1st, 2014 Yopal (CS) 390 m.a.s.l. Y 1,007
February 28th, 2014 Ginebra (VC) 1,100 m.a.s.l. R 623
m.a.s.l. = Meters above sea level. *Counting of tick larvae were carried out under laboratory conditions in Brazil.
Then, about 6 to 16 tick larvae per farm were taken for fixation on glass slides
using a Hoyer’s solution provided by Department of Entomology (UFV, Brazil). These
specimens were identified as Rhipicephalus (Boophilus) microplus under light
microscopy using the taxonomic key of Clifford et al. (1961). The remainder tick larvae
were stored in cryovials on liquid nitrogen (N2) until further processing.
Later, a second sampling was carried out farms were selected by convenience
sampling from different municipalities of Colombia between January and February 2016
(Table 5). At each farm, this time, partially or fully engorged female ticks were manually
removed from selected cattle. All removed ticks from the same animal were placed into
a previously prepared, disposable plastic recipient. Next, under laboratory conditions in
Colombia (Laboratorio Clínico (LC), Clinica Veterinaria “Francisco de Asis” (CVFA),
Fundación Universitaria “Juan De Castellanos” (FUJDC), Soracá (BY)), each female
was placed on an individual well of not new 24-well plates. Each spot was marked to
identify the origin of each tick female.

15
Table 5 – Some characteristics of the localities for tick removal. Collection Date Municipality/State Municipality Elevation Farm Removed female ticks
January 13th, 2016 Güicán (BY) 2,983 m.a.s.l. G Several
January 22nd, 2016 Arauca (AR) 125 m.a.s.l. K Several
January 22nd, 2016 Arauca (AR) 125 m.a.s.l. V Several
January 27th, 2016 Oiba (ST) 1,420 m.a.s.l. O1 1
January 27th, 2016 Oiba (ST) 1,420 m.a.s.l. O2 Several
January 28th, 2016 Oiba (ST) 1,420 m.a.s.l. O3 Several
February 06th, 2016 Arcabuco (BY) 2,575 m.a.s.l. A2 Several
Then, each plate was placed inside an incubator at 26ºC with tray full of water to
provide a relative humidity about 80%. Plates were monitored three times per week.
After oviposition was finished, each tick dead female was removed from the plate and
discarded as a biological waste, according to the FUJDC protocol. Subsequently, each
eggs mass inside each well was grabbed and placed into 4 mL identified clear glass
bottle and kept inside the incubator. Not one of the masses hatched before traveling to
Brazil, so all bottles were kept at ambient temperature during transportation.
Later at the LBCHV-BIOAGRO-UFV, all bottles were placed inside a BOD
incubator (Câmara de Incubação B.O.D. mod. 347, FANEM®, São Paulo, Brazil) at 22ºC
with a tray full of water. It was waiting until all eggs had hatched before grabbing the
emerged larvae. Some eggs masses had a partial or complete hatching while G, K, and
V samples were completely unhatched. After that, each bottle was placed at 0ºC for
about two hours. Later, each bottle was placed in prone position inside a 50 mL Falcon
tube. A centrifugation was done at 2,000 x g x 10 minutes (Heraeus Multifuge 1XR
Centrifuge, Thermo Fisher Scientific, Langenselbold, Germany). Next, all larvae of each
bottle and tube were collected with a metallic, small measuring spoon and placed on a
small, plastic kitchen strainer (∼1 mm mesh size) for separation of shells from larvae.
Straining was done over a clean glass plate. Then, all larvae were grabbed with pliers
and placed inside a 1.5 mL microcentrifuge tube. Before the next sample, the strainer
and the spoon were thoroughly washed with distilled water and neutral soap. Also, a fine
observation of the strainer mesh was done using a stereoscope to warrant the free
condition of ticks. Finally, all samples were weighted at a scale (semi-analytical balance
Gehaka BG200, São Paulo, Brazil) and their results are presented in Table 6.

16
Table 6 – Eggs and larvae weight from removal tick females.
Sample ID Weight (mg) of empty
microtube
Weight (mg) of filled
microtube
Contents
Weight (mg) Contents description
G 938 957 19 Only eggs
A2 908 959 51 Larvae
O1 940 954 14 Mainly eggs and a few larvae
O2 894 909 15 Larvae
O3 896 930 34 Larvae
K 931 970 39 Only eggs
V 955 974 19 Only eggs
1.2.3 Collection of cattle serum and blood samples
New, sterile vacutainer EDTA tubes and serum tubes were used to sample 50
animals for serum and 22 for blood, respectively, in ten farms of four municipalities of
Colombia (Table 7). Blood sample collection was made at jugular vein of selected cattle
by puncture with a sterile needle. About half of the vacutainer volume or more was filled
with blood. When animal position prevented a safe access to the jugular vein, because
of inappropriate facilities for restriction, the coccygeal vein was chosen instead. Every
case, only two attempts for blood collection were carried out when the first one was
unsuccessful. Subsequently, all samples were transported inside a polystyrene thermal
insulation cool box with ice. Later, all samples blood samples were processed under the
LC-CVFA-FUJDC conditions in Soracá (BY, Colombia), except Arauca samples that
were processed in the Laboratorio Clínico (LC), Clínica Veterinaria (CV), Universidad
Cooperativa de Colombia (UCC), Arauca (AR, Colombia).
In order to keep the samples viable until laboratory analysis in Brazil, a new
quarter piece of a Whatman® Filter Paper (Cat No. 1441-150, Ashless, Circles, 150 mm
∅) was used to place on it a few drops of blood of each sampled animal with a sterile
syringe. Also, it was available only one Whatman® FTA Classic Card (WB120205, four
sample areas per card) that was used for blood samples from Arcabuco (BY, Colombia).

17
Each piece of Whatman® Filter Paper was identified matching the sampled animal
information.
Table 7 – Sera and blood collected samples from surveyed farms in Colombia. Municipality (State) Farm Herd Selected animals Serum samples Blood samples
Güicán (BY) G 10 4 4 4
Arcabuco (BY) A2 11 5 5 5
Arcabuco (BY) A3 5 3 3 0
Arcabuco (BY) A4 12 12 12 0
Arcabuco (BY) A5 11 3 3 0
Arcabuco (BY) A6 10 1 1 0
Oiba (ST) O2 9 3 3 3
Oiba (ST) O3 15 4 4 3
Arauca (AR) K 800 7 7 2
Arauca (AR) V 30 8 8 5
Total 964 50 50 22
Finally, except for Arauca samples, all serum tubes were centrifuged at 1,500 rpm
x 5 min in the LC-CVFA-FUJDC, Soracá (BY, Colombia). Arauca samples were
centrifuged at LC-CV-UCC, Arauca (AR, Colombia). For each serum sample, 1 mL
aliquots were made into new 1.5 mL microcentrifuge tubes and kept under freezing
conditions in Tunja (BY, Colombia). Later, all these sera were lyophilized at Fundación
Instituto Colombiano de Inmunología (FIDIC) in Bogotá (D.C., Colombia) and
transported to the LBCHV-BIOAGRO-UFV in Viçosa (MG, Brazil).
1.2.4 Tick control samples for acaricide susceptibility
Tick larvae controls for acaricide susceptibility were obtained in EMBRAPA, Dairy
Cattle Branch, Juíz de Fora (MG, Brazil). Descriptions of those controls are available in
Appendix F. Also, a detailed description of the commercial acaricides used for tick
sensitivity test by EMBRAPA is shown in Table 8. As shown in Appendix F, none of the
12 EMBRAPA samples were delivered as susceptible to SPs. However, some samples

18
were labeled as moderate or resistant to SPs. On the other hand, any of the three
categories to organophosphates (OPs) sensitivity was found in the EMBRAPA samples.
Table 8 – Commercial chemical acaricides for R. microplus sensitivity tests on Brazilian samples in Embrapa, Gado de Leite, Juíz de Fora (MG). No. ID Commercial Name Active Ingredient Acaricide Family Brand
1 Cyperclor Plus Pulverização Cypermethrin, Chlorpyriphos SPs, OPs CEVA
2 Flytion SP Cypermethrin, Chlorpyriphos SPs, OPs CLARION
3 Couro Limpo Cypermethrin, Chlorpyriphos SPs, OPs NOXON
4 Colosso FC30 Cypermethrin, Chlorpyrifos, Fenthion SPs, OPs OURO FINO
5 Neguvon + Asuntol Plus Metrifonate, Coumaphos, Cyfluthrin OPs, SPs BAYER
6 Colosso Pulverização Cypermethrin, Chlorpyrifos SPs, OPs OURO FINO
7 Ciclorfos Cypermethrin, Chlorpyrifos SPs, OPs EUROPHARMA
8 Carrapaticida e Sarnicida UCB Chlorfenvinphos (Supona) OPs UCB
9 Triatox Pulverização Amitraz Formamidines SHERING-PLOUGH
10 Butox P CE25 Deltamethrin SPs MSD
11 Combo Pulverização Cypermethrin, Chlorpyriphos SPs, OPs HERTAPE
12 Maximo Pulverização Cypermethrin, Chlorpyriphos SPs, OPs BIOVET
13 Ectofos Dichlorvos, Chlorpyriphos OPs VALLÉE
14 Colpo 75 Cypermethrin, Dichlorvos, SPs, OPs UCB
Source: Original.
1.2.5 DNA extraction of pooled tick samples
1.2.5.1 Tick DNA extraction by the Phenol:Chloroform:Isoamyl method
The DNA of all tick dragging samples was extracted using the Phenol:Chlo-
roform:Isoamyl method (Phenol solution equilibrated with 10 mM Tris-HCl, pH 8.0, with 1
mM EDTA for molecular biology, P4557, Sigma-Aldrich, Saint Louis, MO, USA;
Chloroform:Isoamyl alcohol 24:1, C0549, Sigma-Aldrich, Saint Louis, MO, USA), as
described in Appendix G. Because of no protocols for DNA tick extraction were available
at the LBCHV at that time, standardization had to be done resulting in the Appendix G.
However, non-optimal results were gotten and it was decided to get new samples from
Colombia using a commercial kit.

19
1.2.5.2 Tick DNA extraction using a commercial kit
DNA extraction of all tick removal samples was carried out using the DNeasy
Blood & Tissue Kit (50) (69504, QIAGEN Group, Hilden, Germany) with a modified
protocol (Appendix H).
1.2.6 DNA isolation of dried blood spot samples
DNA isolation of selected dried blood spot samples was carried out using the
Illustra Tissue & Cells genomicPrep Mini Spin Kit (50) (28-9042-75, GE Healthcare UK
Limited, Buckinghamshire, United Kingdom) with a modified protocol (Appendix I).
1.2.7 Detection of mutant genes involved in synthetic pyrethroids resistance
The primer sequences to detect mutations on genes that coding for a esterase or
sodium channel proteins, as well as the PCR methodologies, were based on Faza et al.
(2013), Hernandez et al. (2002), Hernandez et al. (2000) and Guerrero et al. (2001;
2002a). In Table 9 is a description of primer sequences. Reaction mixtures for PCR,
both CzEst9 and IIIS6 assays, contained 5X Green GoTaq® Flexi Buffer (10 µL), 25 mM
MgCl2 solution (4 µL), 10 mM dNTPs mix (1 µL), 10 µM of forward primer (1 µL), 10 µM
of reverse primer (1 µL), GoTaq® Hot Start Polymerase (0.25 µL), <0.5 µg template DNA
(0.5-3 µL) in a final volume of 50 µL using sterile filtered Milli-q water. One PCR reaction
was carried out for CzEst9 mutant detection using GS138B as forward primer and
GS139R as reverse primer, related to SPs metabolic resistance. Reaction mixtures for
PCR, both CzEst9 and IIIS6 assays, contained 5X Green GoTaq® Flexi Buffer (10 µL),
25 mM MgCl2 solution (4 µL), 10 mM dNTPs mix (1 µL), 10 µM of forward primer (1 µL),
10 µM of reverse primer (1 µL), GoTaq® Hot Start Polymerase (0.25 µL), <0.5 µg

20
template DNA (0.5-3 µL) in a final volume of 50 µL using sterile filtered Milli-q water.
One PCR reaction was carried out for CzEst9 mutant detection using GS138B as
forward primer and GS139R as reverse primer, related to SPs metabolic resistance.
Table 9 – Sequences of the oligonucleotide primers used in the PCR assays and expected PCR product sizes based on R. microplus genes.
Acaricide Familiy Primer Name Sequence Product Size Source Gene Name
Synthetic Pyrethroids
GS138B 5’ AGCATCGACCTCTCGTCCAAC 3’ 372 bp CzEst9
GS139R 5’ GTCGGCATACTTGTCTTCGATG 3’
FG221 5’ TTATCTTCGGCTCCTTCT 3’ 68 bp
IIIS6 FG227 5’ TTGTTCATTGAAATTGTCGA 3’
FG222 5’ TTATCTTCGGCTCCTTCA 3’ 68 bp
FG227 5’ TTGTTCATTGAAATTGTCGA 3’
CzEst9 = Esterase 9 from Coatzacoalcos strain (Cz) (GUERRERO et al., 2002a). IIIS6 = S6 transmembrane segment of domain III of the sodium channel (GUERRERO et al., 2001).
For SPs target site insensitivity of IIIS6 two PCR reactions were made, one for
the wild genotype characterization (presence of allele A of susceptibility) using the
primer pair FG221/FG227, and the other for amplification of mutant gene (resistant allele
B) with primer pair FG222/FG227.
For the CzEst9 mutant gene detection, the thermal cycler (NyxTechnik ATC 401,
San Diego, CA, USA) was programed as follow (FAZA et al., 2013): an initialization step
at 95ºC for 5 min, followed by 10 cycles with denaturing at 95ºC for 1 min, annealing at
65ºC for 1 min (with decrease of 1ºC per cycle), and extension at 72ºC for 1 min,
followed by 30 cycles with denaturing at 95ºC for 1 min, annealing at 60ºC for 1 min,
and extension at 72ºC for 1 min, with a final extension at 72ºC for 7 min.
On the other hand, the thermo-cycling conditions used for IIIS6 mutant gene
detection consisted of the same steps as for OP protocol, only with a variation of
annealing at 55ºC for 1 min in the 30 cycles stage (FAZA et al., 2013). At the end of
the PCR reactions, both CzEst9 and IIIS6 protocols included a hold stage at 4ºC for a
few moments before clearing the thermal cycler.

21
A subsequent enzymatic digestion was necessary only for PCR products of
CzEst9. The protocol of the EcoR I restriction enzyme (EcoR I from Escherichia coli
BS5, R6265, SIGMA-ALDRICH, Saint Louis, MO, USA) was carried out as follow: 6-13
µL of DNA sample (1 µg/µL), 3 µL of 10X Restriction Enzyme Buffer SH (B3657), and 1-
1.2 µL of EcoR I (10 U/µL) in a final volume of 30 µL using sterile filtered Milli-q water.
The reaction was incubated in water bath at 37ºC for 3 hours.
1.2.8 B. bovis rra gene and B. bigemina rap-1c gene PCR assays
Genomic and plasmidial DNA controls, and primers for B. bovis rra gene and B.
bigemina rap-1c gene (Table 10) were kindly provided by Dr. Carlos Suárez and Paul
Lacy from Washington State University (WSU). Primary PCR reactions for ticks samples
were performed in a final volume of 50 µL following the protocol for GoTaq® Hot Start
Polymerase (M5005, Promega, Madison, WI, USA): 10 µL of Colorless GoTaq® Flexi
Buffer; 4 µL 25 mM MgCl2 solution; 1 µL of 10 mM (each) dNTPs Mix (individual stock of
dATP, dCTP, dGTP, and dTTP, Promega, Madison, WI, USA); 1 µL of 20 pM Bbov-
RRA-N-F3; 1 µL of 20 pM Bbov-RRA-N-R; 0.25 µL of GoTaq® Hot Start Polymerase (5
u/µL); 0.5 to 2 µL of each Template DNA (<0.5 µg/50 µL); and 32.25 to 29.75 µL of
sterile Milli-q water.
The volume for the template DNA samples was calculated based on Nanodrop
DNA quantifications (Nanodrop 2000c Spectrophotometer, Thermo Scientific,
Wilmington, DE, USA). They ranged between 1,975 and 2,275 µg/µL for tick dragging
samples and between 90,6 ng/µL to 971 ng/µL for tick removal samples (all had A260/280
ratio <1.7). The seminested PCR (B. bovis rra gene) and the nested PCR (B. bigemina
rap-1c gene) assays utilized 2 µL of the primary PCR product as template.

22
Table 10 – Sequences of the oligonucleotide primers used in the PCR assays and expected PCR product sizes based on B. bovis and B. bigemina genes.
Parasite Primer Name Sequence Product Size* Source Gene Name
Babesia
bovis
Bbov-RRA-N-F3 5’-AATGGCATCTGGGCTAAGTG-3’ 823 bp B. bovis Rhoptry
associated protein
related antigen (rra) gene
Bbov-RRA-N-R 5’-CAGCCCATTTCACAGGTTTT-3’
Bbov-RRA-N-F 5’-TGTTCCTGAGCCGCTATCTT-3’ 387 bp
Bbov-RRA-N-R 5’-CAGCCCATTTCACAGGTTTT-3’
Babesia
bigemina
BgRAP-1C-F-TOPO 5’-ATGATTCACTACGCTTGCCTC-3’ 600 bp B. bigemina Rhoptry
associated protein
(rap-1c) gene
BG-1CX-R 5’-GTCTTGTAGTATATGGCGGTCAT-3’
Bbg-R1C-N-F1 5’-TCTCGAAGACAGCGAACAGA-3’ 236 bp
Bbg-R1C-N-R1 5’-GTCAAGCTGGTAGGGGTCAG-3’
*As described by Mahmoud et al. (2015).
The thermocycling conditions used for the B. bovis primary PCR were: 95°C for 3
min followed by 25 cycles, each consisting of denaturation at 94°C for 30 sec, annealing
at 60°C for 1 min, and extension at 72°C for 1 min. The program also included a final
extension step at 72°C for 5 min. For the semi-nested PCR the same conditions were
used except the number of cycles used was 35 (MAHMOUD et al., 2015). The
thermocycling conditions used for the B. bigemina primary PCR consisted of: 95°C for 3
min followed by 25 cycles, each consisting of denaturation at 95°C for 30 sec, annealing
at 61.2°C for 30 sec, and extension at 72 °C for 30 sec, followed by a final extension
step at 72°C for 5 min. The thermocycling conditions used for the B. bigemina nested
PCR were: 95°C for 3 min followed by 35 cycles, each consisting of denaturation at
95°C for 30 sec, annealing at 63.1°C for 30 sec, and extension at 72°C for 30 sec,
followed by a final extension step at 72°C for 5 min (MAHMOUD et al., 2015).
For dried blood spot samples, primary PCR reactions (B. bovis and B. bigemina
genes) used 10 µL of template DNA because of the low quantity found in Nanodrop
analysis. Concentrations ranged from 2,0 to 5,3 ng/µL (A260/280 ratio <1.7). Remained
primary PCR reaction conditions were the same as for tick DNA samples. All conditions
for seminested and nested PCR reactions were identical of those tick DNA samples.
1.2.9 Agarose gel electrophoresis and its developing under ultraviolet light

23
All PCR or enzymatic digestion products were submitted to agarose gel
electrophoresis following next procedure: on a piece of Parafilm® paper 1 µL of
Blue/Orange 6X Loading Dye (G190A, Promega, Madison, WI, USA), 5 µL of the DNA
sample, and 2 µL of 3X staining solution (GelRedTM Nucleic Acid Gel Stain, 10,000X in
water, 41003, BiotiumTM, Hayward, CA, USA) were mixing by pipetting. Then, each
sample was placed on the respective well in the agarose gel, previously submerged in
TBE 1X into the electrophoresis tray. Also, the procedure was repeated with 5 µL of the
molecular marker (PCR Markers, G361A, Promega, Madison, WI, USA). Then,
horizontal agarose gel electrophoresis (Bio-Rad Wide Mini-Sub Cell GT Systems and
Bio-Rad PowerPac 200, Hercules, CA, USA) was carried out with 80 volts for less than 1
hour.
For CzEst9 PCR products 2% agarose (Agarose High Resolution A4718 SIGMA-
ALDRICH, Saint Louis, MO, USA) in TBE 1X, 1:10 dilution of stock TBE 10X (890 mM
Tris (108 g), 890 mM boric acid (55 g), and 2.546 mM EDTA (7.44 g)) was used. PCR
products of IIIS6 protocols were submitted directly to 3% agarose in TBE 1X for
electrophoresis without any previous enzymatic digestion. For Babesia spp. PCR
products, 2% agarose was used to prepare all those gels.
In cases where faint bands were predictably just only visible, the gel was soaked
in a solution of Ethidium Bromide (10 µL of Ethidium Bromide (10 mg/mL) in 500 mL
H2O) for 15 minutes. Finally, the developing for every gel was done in an UV
transilluminator (Fotodocumentador para gel de eletroforese L-PIX Touch, Loccus,
Cotia, SP, Brazil).
1.2.10 Indirect ELISA for detection anti-SBbo23290 antibodies for B. bovis

24
1.2.10.1 Modified criss-cross serial dilution analysis
In order to determine the optimal antigen concentration of the SBbo23290
synthetic peptide from B. bovis RAP-1 protein (see Chapter 2) a modified cross-serial
dilution analysis was carried out (see Appendix J). A positive serum for B. bovis (Animal
66 inoculated with Bbo UFV-1 virulent strain, 1999, 1:500 dilution), and a negative
serum (a newborn calf without any calostrum ingestion) were used. So, the SBbo23290
peptide was weighted on an analytical scale (Bosch Wägessystem GmBH, model SAE
200, 61108843, Jungingen, Germany) to get 1 mg, using a new, previously tared 1.5 mL
microcentrifuge tube. Then, 1 mL of 50 mM Sodium Carbonate/Bicarbonate Buffer pH
9.6 (Coating Buffer) was added to get a dilution of 1 mg/mL. A total of five
microcentrifuge tubes were used.
Because the peptide pellet did not get a complete dilution after vortex mixing with,
a sonication was made in a Lab-Line® Ultratrip Labsonic System (Lab-Line Instruments,
Inc, Melrose Park, IL, USA) for an estimated time of five to 10 seconds per three times.
Maximum amplitude and tune were used by reason of the voltmeter indicator be
damaged at that time. At least 10 to 15 seconds were waited between sonications. After
finishing this process for each peptide dilution, it was repeated twice for all peptide
dilutions.
Then, the protocol of Appendix J was followed from step G. Using a one Nunc
MaxiSorb® flat-bottom 96-wells plate and SBbo2390 at 1µg/100µL per well of Coating
Buffer, row A (12 wells) was chosen for 1:100 positive serum dilution, as well as row B
and C for 1:200 and 1:400 dilutions, respectively. It was the same for negative serum in
rows E, F, and G. Rows D and H received antigen only.
The antigen concentration of 1µg/100 µL was selected because it has been
successful tested several times by the LBCHV-BIOAGRO-UFV protocol. The optical
densities were red with a 450 nm absorbance filter in a Thermo ScientificTM MultiskanTM
FC Microplate Photometer with Incubator (Thermo Fisher Scientific, Rastatie, Finland)

25
with the assistance of the Skanlt Software 2.5.1 RE for Multiskan FC (Thermo Fisher
Scientific, Rastatie, Finland).
1.2.10.2 Indirect ELISA test protocol
After obtaining the best antigen concentration (see Section 1.2.10.1), the 50
lyophilized were resuspended in 1 mL of PBS pH 7.4 (see Appendix K) per tube and
mixed with vortex. Then, it was followed the protocol described in Appendix K, using the
SBbo23290 peptide as antigen at a concentration of 1 µg/200 µL of Coating Buffer per
well. A triplicate for each control and serum was made, calculating the arithmetic
average of the optical densities and its standard deviation (SD), by Microsoft Excel®,
using a 450 nm absorbance filter in a Thermo ScientificTM MultiskanTM FC Microplate
Photometer with Incubator (Thermo Fisher Scientific, Rastatie, Finland) with the
assistance of the Skanlt Software 2.5.1 RE for Multiskan FC (Thermo Fisher Scientific,
Rastatie, Finland). Two Nunc MaxiSorb® flat-bottom 96-well plates were used.
Establishing +2SD, as a point of reference from the positive control optical densities
average, a screening for positive sera was made.

26
1.3 RESULTS AND DISCUSSION
1.3.1 Epidemiological questionnaire analysis for acaricide resistant
A brief summary of every surveyed farm is shown on Table 11. Tick dragging was
carried out in five farms and Tick removal in six farms. Only one farm was categorized
as dairy production system while four farms (36%) had beef production system and six
farms (54%) were dual-purpose (Table 11). Ten out of 11 farms have 60 or less cattle,
while only one farm reported 800 bovines. Except for one farm, all other farms used
some active ingredient of either organophosphates or synthetic pyrethroids, or both of
them. Also, four farms (36%) reported the use of Amitraz within the last three
treatments. Finally, all farms described crossbred animals in their herds (Table 11).
Table 11 – Main characteristics of the surveyed farms in Colombia according to sample collection method and used acaricide.
Municipality (State) Farm ID Breeds System Herd Sample Used Acaricide*
San José de Pare (BY) J Crossbreed Beef 18 Tick dragging Metrifonate
Arcabuco (BY) A1 Crossbreed Dual-purpose 8 Tick dragging Ivermectin
Pajarito (BY) P Crossbreed Dual-purpose 19 Tick dragging Cypermethrin
Ginebra (VC) R Crossbreed Dual-purpose 37 Tick dragging Cypermethrin, Ethion, Amitraz,
Yopal (CS) Y Crossbreed Dual-purpose 30 Tick dragging Ethion
Güicán (BY) G Crossbreed Dairy 10 Tick removal Cypermethrin
Arcabuco (BY) A2 Crossbreed Dual-purpose 11 Tick removal Cypermethrin, Ethion, Amitraz,
Oiba (ST) O1 Crossbreed Beef 60 Tick removal Ethion, Amitraz
Oiba (ST) O2 Crossbreed Beef 9 Tick removal Ethion, Amitraz
Oiba (ST) O3 Sim, BS, Xs Dual-purpose 15 Tick removal Ethion, Cypermethrin, Chlorpyrifos
Arauca (AR) K Crossbreed Beef 800 Tick removal Cypermethrin
*Last three treatments according to the answered questionnaire. Sim = Simmental; BS = Brown Swiss; Xs = Crossbreed.
The size herd was as low as one bovine in a characterization survey for acaricide
resistance in the State of São Paulo (Brazil) (MENDES et al., 2011). These authors
selected, mainly, small family owned dairy farms, with no more than 50 head of
crossbred B. indicus and B. taurus cattle. This selection coincides with most of the farms
surveyed in the present study (see Table 11). One advantage of include a larger herd

27
size in the survey is the comparison between high and low technical profiles. However,
scarce resources limited the selection of farms for the present research.
As shown in Table 11, most of the farms (55%) reported a Dual-purpose type of
cattle production and only one farm (9%) had a dairy production type. Ten out of 11 farm
used organophosphates and/or synthetic pyrethroids in the last three treatmenst, while
only one farm reported ivermectin for tick control. Domingues (2011) found 91% of the
farms (n=25) a dairy production type and most of the farms use to combine different
acaricides for tick control. The intensity of the cattle production and the association of
different acaricides are good indicator of a selective pressure for acaricide resistance.
During the interview, it was possible to identify a pure breed phenotype of Simmental
and Brown Swiss cattle in a few animals in the Farm O3. Because of that, it is probable
that some pure breed animals be a part of the other herds. However, most of the farms
had a reported crossbred phenotype and it was considered representative of the cattle
population. To better understand the cattle market demands for the surveyed farms,
some features are presented in Table 12.
About a quarter of the respondents do not purchase cattle (Table 12) as they
breed their own cattle for herd replacement purposes. Most of the interviewees (55%)
prefer to buy the cattle directly to the farmer, while 18% purchases animals in cattle
market. The absence of answers for auction purchases indicates the small-scale cattle
production of the surveyed farms. It explains why 45% of the farmers have a low
frequency of cattle purchase (if the purchase was done between one to five years ago)
or none (27%) (see Table 12). Regarding some expenses, the price of acaricides was
variable as expected in such an inhomogeneous group of farms. In that way, 36% of the
surveyed farms invest less than COP$25,000 (<US$8.6), other 36% invest between
COP$25,000 to 100,000 (US$8.6-34.4), 9% buys acaricide products over COP$100,000
(>US$34.4), and 18% does not know (Table 12). The first group had a size herd
between 11 to 18 animals, while the second one had between nine to 37 animals, and
the only one farm with a big budget for purchasing acaricides reported 30 cattle.
Because of that the size of the cattle herd was not related to the acaricide price. Two

28
respondents do not know the price of the acaricides as the boss or other person use to
carry the purchases out.
Table 12 – Characterization of a few aspects of the farms cattle market.
Farm information Organized answers according to frequency
Interviewees (%) 1st place % 2nd place % 3rd place % 4th place %
Cattle purchase source* Farmer
6 55
Cattle Market
2 18
Auction
0 0
NP
3 27 11 (100%)
Frequency of cattle purchase Low
5 45
High
3 27
None
3 27 –
– 11 (100%)
Origin of cattle purchase Local
6 55
Farm
4 36
Foreign
1 9 –
– 11 (100%)
Price** of 1 bottle of acaricide <$25K
4 36
$25-100K
4 36
>$100K
1 9
DK
2 18 11 (100%)
Price*** of 1 L of milk $0.7-1K
6 55
<$0.7K
4 36
>$1K
1 9 –
– 11 (100%)
Price*** of 1 Kg of live cattle $3-3.5K
6 55
<$3K
3 27
>$3.5K
2 18 –
– 11 (100%)
*Two interviewees reported more than one answer. However, it was chose the most probable source. **In Colombian current money (COP). K = multiplied by 1,000. The bottle does not represent a standard volume for the reported acaricides. Also, two interviewees did not know any acaricide price as other person carries out the purchases. ***In Colombian current money (COP). NP = No purchase. DK = Do not know.
Cattle product prices of the surveyed farms were in the expected national
average, except for some farms that showed low prices in their products. Over a half of
the farms reported COP$700 to 1,000 (US$0.24 to 0.34) for 1 liter of milk, whereas 36%
had low prices. The Farm K reported COP$1,100 (US$0.38) per liter, a common price in
Arauca state. Also, relative similar proportions were found for Kg of live cattle. Without
taking into account the Farm K, the price of 1 L of milk was better for some farms than
others (see Table 12), coinciding with the range of prices found by Andrade et al. (2008)
in 20 farms of the “Altiplano Cundiboyacense” region. However, these authors show the
total price of the animal in a range of age instead of use Kg of live animal as a criterion.
It seems a better approach, as the cattle price is dependent of some factors like age,
stage of production, etc. Also, the low frequency of purchases of replacement animals is
reported by Andrade et al. (2008). On the other hand, the questionnaire inquired into
different activities for tick control in order to assess potential risk factors for acaricide
resistance (Table 13).

29
Table 13 – Characterization of the tick control in the surveyed farms.
Farm information 1st place % 2nd place % 3rd place % 4th place % Interviewees
(%)
Concern about tick control High
9 82
Low
2 18
None
0 0 –
– 11 (100%)
Perception of failed tick control Yes
10 91
No
1 9
DK
0 0 –
– 11 (100%)
Current control on expectations No
6 55
Yes
5 45
DK
0 – –
– 11 (100%)
Changing of herd size/breed No
8 73
Breed
2 18
S and B
1 9
Size
0 0 11 (100%)
Acaricide use under suspicion No
8 73
Yes
3 27
DK
0 0
11 (100%)
Timing for acaricide treatment q3wk
4 36
Tick visible
3 27
High B
3 27
q2wk
1 9 11 (100%)
Criterion for acaricide selection Vet Adv
4 67
Boss Com
1 17
NB Adv
1 17 –
– 6 (100%)
Criterion for acaricide changing Inefficient
3 50
Rotation
3 50
Vet Adv
0
Other
0 6 (100%)
Label acaricide indications Label
3 50
Higher D
2 33
Vet Adv
1 17 –
– 6 (100%)
Personal protective equipment No
5 83
Yes
1 17 –
– –
– 6 (100%)
Knowledge of the tick life cycle No
5 83
Yes
1 17 –
– –
– 6 (100%)
DK = Do not know. S and B = Size herd and breed. q3wk = each three weeks. High B = High burden of ticks. q2wk = each two weeks. Vet Adv = Veterinarian advice. Boss Com = Boss command. NB Adv = Neighbor advice. Higher D = Higher dose than recommended.
So, 82% of interviewees reported high concern about tick control, whereas farms
R and G (18%) showed low concern. No potential relationship was found between these
two farms and the lack of concern, taking into account that similar activities and
misconceptions about tick control were shared with the high concern farms. It is
interesting that these two farms reported a perception of failed tick control in the past, as
well as most of the other farms (91%), while the respondent of farm O1 (9%) reported no
apparent experience with acaricide failure. Also, for 55% of farmers the acaricide being
used does not achieve the expected goal (Table 13).
In a Brazilian survey carried out in a region of Minas Gerais (Brazil)
(DOMINGUES, 2011), one farm with a cattle herd size exclusively of females reported

30
no use of acaricides, as well as no concern for ecto and endoparasites. Also, almost
50% (n=93) of farmers, in a survey carried out in Minas Gerais (Brazil), pointed out the
cattle tick as a problem for dairy breeding in their farms (AMARAL, 2008). So, most of
the interviewees of any of these two studies stated the cattle ticks as a problem, as well
as the present study (see Table 13), while all surveyed farmers experienced problems
with the cattle tick control (MENDES et al., 2011).
The major influence for the acaricide selection is the veterinarian in 67% of cases
(n=6), as shown in Table 13. By contrast, none of the six interviewees asks for the
veterinarian advice to change the acaricide under use (see Table 13). Mendes et al.
(2011) found the salesmanship indication as the top influence of producer’s choices for
selecting acaricides. The recommendation by Embrapa was the second major influence
of the farmers interviewed by Amaral (2008), as well as the respondents analyzed by
Domingues (2011). For changing the acaricide, inefficacy was the criterion showed by
Amaral (2008) in the first place, as the same result presented in Table 13.
An initial sign of the acaricide resistance extension happens when the type of
cattle breed is changed or the number of animals is reduced. Thus, 73% of the
respondents did not change the breed or the herd size. However, 18% (J and G)
changed the breed of the cattle because of acaricide resistance and 9% (Y) had to
modify both breed and herd size. In addition, the timing for the acaricide treatment
followed the conventional every three weeks period in 36% of the farms (see Table 13),
whereas remainder farms did wrong choices like treating when ticks are visible (27%),
using higher doses than recommended (27%), or treating more often than
recommended (9%). A proper training in tick control for farms with wrong choices (A1, Y,
R, G, K, A2, and O1) could improve the timing.
In that sense, 27% of interviewees applied an acaricide according with infestation,
while a regular interval between treatments was reported in 45% of the farms. Still, 63%
of farmers make a wrong treatment against ticks (see Table 13). It is interesting that the

31
proportion of respondents treating according with infestation here is lower than 54.5%,
46%, and 37% presented by Domingues (2011), Amaral (2008), and Mendes (2011).
A key matter about acaricide resistance is the mixture of two or more active
principles for treatments. In that sense, Figure 3 shows the acaricide mixtures reported
for the interviewees. Most of the respondents (Figure 3) said that no mixtures are carried
out at the moment of the treatment against ticks. Still, five farmers use to mixture
commercial acaricides between them or even a combination with household cleaning
products or otherwise dispensable byproducts. Farm A2 mixes Asuntol® (Coumaphos)
with Ganabaño® (Cypermethrin) occasionally, being both of them approved for cattle
treatments.
Figure 3 – Relative frequency of mixtures of commercial formulation and/or household intended acaricide effect products used for cattle tick infestation in tick removal farms. The Farm ID is in parenthesis.
However, a household insecticide, Baygon® (d-allethrin, Permethrin, and
Tetramethrin), is used in a mixure with Neguvon® (Metrifonate) in the Farm Y. Baygon®
is not approved for veterinary use representing a potential health risk for animals. In
case of the Farm O3, a mixture is carried out using Neguvon® + Cooking oil + a few
drops of LorsbanTM 4 EC (Chlorpyrifos). LorsbanTM 4 EC is an agricultural insecticide
with no indications for veterinary use. Even more surprising is the practice in Farm P
about mix Neguvon® with used motor oil (e.g., dispensable waste of mowing machine,
55%
9% 9% 9% 9% 9%
No mixtures Asuntol® + Ganabaño® (A2)
Neguvon® + Baygon® (Y)
Neguvon® + used motor oil (P)
Acaricide bath solution + Cresol
(G)
Acaricide bath solution +
Chlorine or Neguvon® + cooking oil +
Lorsban® (O3)
Re
lati
ve
fre
qu
en
cy
of
an
sw
ers
(n
=11
)
Mixtures of products for acaricide treatment by farm

32
bikes, etc.) applying to ticks by direct contact. Also, the acaricide bath solution is mixed
with cleaning products like Cresol (Farm G) or Chlorine (Farm O3). Any of these
cleaning products are not approved for veterinary use representing a dangerous practice
for cattle.
It is interesting to point out that Farmers G and O3 answered following any label
indications for the acaricide use. In the same way, the Farmer A2 follows only the
veterinarian advice for acaricide use without reading the label indications. This could
explain the mixture of commercial acaricides in Farm A2. Also, A2 and O3 report to
follow the veterinarian advice for acaricide selection, while G use to listen the Neighbor
advice for acaricide selection (Table 13). Following the label indications scored the first
place in Table 12, which is conflicting with the wrong timing for acaricide treatment.
According to Amaral (2008), some factors of concerned were the acaricide use until
reaching the lost of efficacy and acaricide changing without proper efficacy test. Some
elements of a favourable scenario for acaricide resistance include indiscriminate choice
of the acaricide, frequent use of spray formulations, high frequency of treatments, and
random substitutions of acaricide families (MENDES et al., 2011). Accumulation of
resistance mechanisms to acaricides can occur when mixing different acaricides.
Unfortunately, questions 2.3 and 2.12 in Appendix D were not asked to farmers Y
and P, as described in Section 1.3.1. The six additional questions were asked only to
the six farmers where Tick Removal methodology was carried out. So, 67% of them trust
in the veterinarian advice for acaricide selection while farms G and O1 attend boss
commands (17%) or neighbor advice (17%), respectively (Table 13). Notwithstanding,
none of the interviewees follow the veterinarian advice for changing the acaricide
product. Half of them change the product because of inefficiency (G, K, and O3), and
the other half owing to a schedule rotation product (O1, O2, and A2). This is why some
respondents do not change the acaricide under resistance suspicion.
Follow the label indications is a warrant of a proper acaricide use. Even so, 33%
of interviewees (O2 and O3) use a higher dose than recommended and 17% (Farm A2)

33
follow the veterinarian instructions instead of reading the label (Table 13). It seems that
the veterinarian advice is only asked at the veterinary shop during the acaricide
purchase. Further research is necessary to establish actual interactions of veterinary
services directly in the farms.
Despite of the importance about using the personal protective equipment (PPE)
for spraying acaricides, most of the surveyed farmers (83%) do not use it (Table 13).
Only one interviewee (Farm A2) uses the PPE, as a part of a previous training in
spraying insecticides on vegetables by a National Colombian Institution. Also, an
astonishing majority (83%) ignores any knowledge about the life cycle of cattle ticks with
only Farmer O2 knowing the period of the parasitic stage (three weeks).
Due to several answers were given by the same respondent, the question about
Equipment for Acaricide Treatment was not included in Table 13. In that way, all
interviewees use a backpack sprayer for applying commercial acaricides on the cattle.
Also, half of them (farms O2, O3, and A2) use injection for acaricide treatment with
commercial ivermectin. Finally, farms O3 and A2 include applications of commercial
pour-on presentations of acaricides.
As an open-ended question, Frequency of Acaricide Changing was difficult to
categorize due to a very few coincidences between answers and it was not showed on
Table 13. That said, it was not found an established schedule for changing the acaricide
active principle. Answers like “at all bath times” (Farm G), “after running out the acaricide
under use” (Farm O1), or “when the acaricide is not useful anymore” (Farm O3) are
perfect examples. Farm O2 report the veterinarian advice for changing the acaricide
drug. Remainder respondents pointed out a regular frequency that varied between two
to six month. These answers are perceptions and thus they constitute a baseline for
further, deeper, and more precise research.
No sources of cattle tick control information were asked in the present study. In
Table 13, most of the six interviewed farmers do not know the life cycle of R. microplus.

34
The veterinarian ranked number one of information source in the survey by Domingues
(2011). Neighbors got the second position in Mendes et al. (2011) and the next-to-last
position in Domingues (2011). It is important because just one out of the six surveyed
farmers reported the use of the Personal Protective Equipment (PPE) (Table 13)
because of a previous training. Amaral (2008) found that barely 15% use effectively the
PPE in a proper, complete way. However, this author shows that 67% of respondents
said they use of the PPE for spraying acaricide.
1.3.2 Mutant Genotype of CzEst9 gene for Synthetic Pyrethroids Resistance
Agarose gels electrophoresis for CzEst9 PCR products and EcoR I digested
products were developed by UV illumination, both Dragging Tick and Removal Tick
samples (images 1 and 2). One gel for each kind of collected sample, pre and post-
digestion, was made in order to offer as much resolution of the DNA fragments bands as
possible. The all samples PCR products of CzESt9 were about 372 bp (Image 1). After
enzymatic digestion with EcoR I, all samples showed three bands of 372 bp, 300 bp,
and 72 bp (Image 2).
About Embrapa phenotypic controls, 84/14 also had those three bands. The
248/13 Embrapa sample presented, at least, two distinct bands of 372 and 300 bp. In
that way, all samples, as a pooled genomic DNA, have a heterozygous genotype for the
CzEst9 gene, which has been associated to metabolic resistance for SPs in R.
microplus (GUERRERO et al., 2002a). The Embrapa control 84/14 have not a
homozygous resistant genotype being an imperfect resistant control. A similar situation
occurs with the moderate resistant control 248/13, presented two out of three bands
(372 bp and 300 bp) that characterize the heterozygous genotype. The lost band (72 bp)
for 248/13 is not even a faint image probably because of a different degree of enzymatic
digestion.

35
A
B
Image 1 – Agarose gels electrophoresis of CzEst9 PCR products for Tick Dragging samples (A) and Tick Removal samples (B). A: Std = Standard molecular weight marker; J = San José de Pare farm; A1 = Arcabuco 1 farm; Arcabuco 2 farm; P = Pajarito farm; R = Ginebra farm; Y = Yopal farm; 84 = Embrapa tested resistant ticks to SPs; 248/13 = Embrapa tested moderate resistant ticks to SPs; w = sterile milli-q water. B: G = Güicán farm; O1 = Oiba 1 farm; O2 = Oiba 2 farm; O3 = Oiba 3 farm; K = Arauca farm. The same standard and controls (84, 248, and w) as the A-figure.
A
B
Image 2 – Agarose gels electrophoresis of digested CzEst9 PCR products with EcoR I for Tick Dragging samples (A) and Tick Removal samples (B). A: Std = Standard molecular weight marker; J = San José de Pare farm; A1 = Arcabuco 1 farm; Arcabuco 2 farm; P = Pajarito farm; R = Ginebra farm; Y = Yopal farm; 84/14 = Embrapa tested resistant ticks to SPs; 248/13 = Embrapa tested moderate resistant ticks to SPs; w = sterile milli-q water. B: G = Güicán farm; O1 = Oiba 1 farm; O2 = Oiba 2 farm; O3 = Oiba 3 farm; K = Arauca farm. The same standard and controls (84, 248, and w) as the A-figure.
Although PCR controls of wild and mutant CzEst9 gene (Guerrero et al., 2002a)
for SPs resistance were not available for this research, tick samples with tested
susceptibility phenotype to SPs were provided by Embrapa (Appendix F). Hernández et
al. (2002) found two different alleles for CzEst9 in R. microplus larvae, a wild-type allele
(susceptible genotype), and a mutant-type allele (resistant genotype). According to
these authors, it is not possible to estimate the allele frequency from pooled genomic
DNA of R. microplus larvae. It is necessary to work with individual larva to determine the
percentages of the three possible tick genotypes within each larvae population.

36
Due to all the above, it cannot be determined the extension of the homozygous
mutant genotype in any of the samples, as they were made from pooled larvae. Díaz
and Vallejo (2013) used 30 R. microplus DNA samples of a 2-weeks bioassay survivor
teleogines with cypermetrhin from a cattle farm in Ibagué (TO, Colombia) and found next
allelic frequencies for CzEst9 susceptible and mutant phenotypes: 85.7% of resistant
heterozygous; 9.5% of resistant homozygous; and 4.8% of sensible homozygous.
Although it is advantageous to screen for resistance genotype in a short time
using PCR assay for adult ticks, resistance bioassays for SPs are necessary to
determine the expression of the resistance phenotype. In that way, Guerrero et al.
(2002b) found that a resistant Cz strain had high levels of permethrin hydrolysis
(metabolic detoxification) with CzEst9 when compared with SF strain and two pyrethroid
susceptible strains. Faza et al. (2013) pointed out the semidominance phenomenon as a
possible explanation for discrepancies between genotypic and phenotypic resistant
acaricide profiles of R. microplus, where a single semidominant gene is expressed in a
lesser extension in heterozygous individuals than in resistant homozygous.
In fact, Guerrero et al. (2002a) did not found a clear genotype pattern of SF strain
survival associated with the CzEst9 genotype, because the percentage of heterozygous
survivors to permethrin was greater than homozygous survivors. Also, an advantage of
performing resistance bioassays in R. microplus is getting the esterase profiles of the
suspicious strains and correlate them with the metabolic detoxification or with the target
site insensitivity to CzEst9 or other putative esterases (ABDULLAH et al., 2012).
1.3.3 Mutant Genotype of IIIS6 gene for Synthetic Pyrethroids Resistance
All agarose gels electrophoresis of IIIS6 PCR wild and mutant products of all
samples are shown in images 3 and 4.

37
A
B
Image 3 – Agarose gels electrophoresis of IIIS6 wild genotype PCR products for Dragging Tick samples (A) and Removal Tick samples (B). Std = Standard molecular weight marker; J = San José de Pare farm; A1 = Arcabuco 1 farm; Arcabuco 2 farm; P = Pajarito farm; R = Ginebra farm; Y = Yopal farm; G = Güicán farm; O1 = Oiba 1 farm; O2 = Oiba 2 farm; O3 = Oiba 3 farm; K = Arauca farm. 84/14 = Embrapa tested resistant ticks to SPs; 248/13 = Embrapa tested moderate resistant ticks to SPs.
A
B
Image 4 – Agarose gels electrophoresis of IIIS6 mutant genotype PCR products (soaked in an Ethidium Bromide solution) for Dragging Tick samples (A) and Removal Tick samples (B). Std = Standard molecular weight marker; J = San José de Pare farm; A1 = Arcabuco 1 farm; Arcabuco 2 farm; P = Pajarito farm; R = Ginebra farm; Y = Yopal farm; G = Güicán farm; O1 = Oiba 1 farm; O2 = Oiba 2 farm; O3 = Oiba 3 farm; K = Arauca farm. 84/14 = Embrapa tested resistant ticks to SPs; 248/13 = Embrapa tested moderate resistant ticks to SPs.
All PCR products of Dragging Tick and Removal Tick samples, as wells as control
samples, for the IIIS6 wild allele (images 3 and 4), were pretty obvious. By contrast,
IIIS6 mutant allele produced no band for most of the samples and controls. Barely
visible are the faint bands of G and 84/14 samples. Hence, most of the samples have a
homozygous sensitive genotype for the S6 transmembrane segment of the domain III of
the para-like sodium channel. Only G and 84/14 samples show a heterozygous resistant
genotype, as the sensitive allele was detected (images 3 and 4).
Most of the samples had a wild genotype for the IIIS6 gene. Barely visible bands
for G and 84/14 samples point out a heterozygous genotype for the F1550I IIIS6
mutation (T2134A in the DNA sequence) (Lovis et al, 2012). Unfortunately, the 84/14

38
Embrapa sample (pooled DNA) is not a perfect resistant control, as it is not homozygous
resistant. However, the 248/13 Embrapa sample was perfect as the sensible control
(images 3 and 4). According with Guerrero et al. (2012) the F à I amino acid
substitution in IIIS6 confers a very high level of target site insensitivity to permetrhin,
cypermethrin, and flumethrin in a homozygous phenotype. However, Lovis et al. (2012)
found different resistant phenotypes with distinct geographical distributions for the
sodium channel gen of R. microplus. Following their findings, the F1550I IIIS6 mutation
is widespread but limit to Mexico, whereas the L64I IIS4-5 linker mutation is present in
Argentina, Brazil, South Africa, and Australia, and G72V IIS4-5 linker mutation was
discovered in Australia based on the samples origin. Even so, the geographical
boundary between the IIIS6 mutation found in Mexico and the IIS4-5 linker mutations
found in South America is not known yet. Also, PCR assays should not substitute for
bioassays but the two should be carried out in conjunction when possible for acaricide
resistance detection (LOVIS et a., 2012). Because of that, my findings represent a first
step for understanding the SPs resistance extension in some farms in Colombia.
In addition, the finding of the heterozygosity to F1550I IIIS6 mutation in the Farm
G (Image 7,B) is a strong indicator of a selective pressure with SPs. It is necessary to
perform acaricide bioassays, a larger sampling of cattle farms and regions, a screening
for multiple mutations in the sodium channel gene, as well as for enzymes involved in
metabolic detoxification, and a monitoring of tick control strategies over time in selected
farms. Finally, it is intriguing the heterozygous genotype in the Farm G because its
geographic position should be a limiting environment for cattle tick populations, in spite
of R. microplus specimens have been collected in the Municipality of Güicán in the past
(CORTÉS-VECINO et al., 2010). Further research is needed in that region.
1.3.4 Epidemiological questionnaire analysis for bovine babesiosis perception

39
Table 14 shows the answer of surveyed farmers about their bovine babesiosis
perception, where most of the farmers report observations of Cattle Tick Fever, but they
do not remember ill animals or babesiosis dianogstics in their farms.
Table 14 – Characterization of the babesiosis perception in the surveyed farms.
Farm Information Organized answers according to frequency
Interviewees (%) Yes (%) No (%)
Observation of fever on tick infested cattle 6 (60) 4 (40) 10 (100)
Observation of blood in urine on tick infested cattle 3 (30) 7 (70) 10 (100)
Observation of ill or dead animals with tick infestations 5 (50) 5 (50) 10 (100)
Knowledge of the Colombian common name “Ranilla
Roja” for cattle babesiosis 8 (80) 2 (20) 10 (100)
Remembering ill or dead animals because of babesiosis 0 (0) 10 (100) 10 (100)
Remembering any babesiosis diagnosis in the farm 2 (20) 8 (80) 10 (100)
Also, according to questionnaires data, the number of bovines per farm in most of
the surveyed farms ranged from 9 to 30 (Table 11). Farm K reported 800 animals. So,
the number of calves under 1 year of age was less than ten for farms with at least one
positive serum (A4, V, O2, O3, A1), while Farm K with sample S37 positive reported 240
younger yearling calves. Considering the treatment question, six out of the interviewees
did not use any babesiacidal drug, as they do not need it. Amid the remainder farms, A6
reported to use Diminazene Aceturate for babesiosis treatment, A3 said to use
Oxytetraciclina for any tick fever event, while farms A4 and A5 use acaricides (pyretroids
or organophosphates) as the only way to deal with babesiosis. Finally, all interviewees
wanted to be involved in a research about bovine babesiosis.
1.3.5 Indirect ELISA for detection of anti-SBbo23290 antibodies for B. bovis
The modified criss-cross serial dilution analysis (Section 1.2.10.1) determined the
best antigen concentration (SBbo23290) at 1 µg/well and a serum dilution of 1:200. In
that way, before starting the ELISA test, a description of the 50 cattle used sera for the
indirect ELISA test is presented in Table 15. Also, the optical densities average for each

40
triplicate sample of the indirect ELISA test is presented in Table 16 from Plate 1 and in
Table 17 for Plate 2.
Table 15 – Data of collected cattle sera from Colombia. No. Municipality (State) Farm Animal Sex Age (months) Breed Serum ID*
1 Arcabuco (BY) A3 Lucero Male 7 Holstein S1
2 Arcabuco (BY) A3 Pirulo Male 8 Norm x Holst S2
3 Arcabuco (BY) A3 Chato Male 9 Normande S3
4 Arcabuco (BY) A4 Hijo-Muñeca Male 7 Normande S4
5 Arcabuco (BY) A4 Orejas Male 9 Gyr x Holst S5
6 Arcabuco (BY) A4 Daniela Female 10 Holstein S6
7 Arcabuco (BY) A4 Pardo Male 7 BS x Zebu S7
8 Arcabuco (BY) A4 Mono Male 8 Zebu S8
9 Arcabuco (BY) A4 Barcina Female 9 Normande S9
10 Arcabuco (BY) A4 Negro Male 10 Holst x Zebu S10
11 Arcabuco (BY) A4 Mona Female 8 Norm x Zebu S11
12 Arcabuco (BY) A4 Norberto Male 9 Normande S12
13 Arcabuco (BY) A4 Holstein-Hato Female 7 Holstein S13
14 Arcabuco (BY) A4 Petit Male 6 Holstein S14
15 Arcabuco (BY) A4 Carretera Male 8 Holstein S15
16 Arcabuco (BY) A5 Pricila Female 9 Normande S16
17 Arcabuco (BY) A5 Mamá-Garrapatoso Female 60 Normande S17
18 Arcabuco (BY) A5 Mono-Carretero Male 8 Normande S18
19 Arcabuco (BY) A6 Sofía Female 8 Holstein S19
20 Güicán (BY) G Brincona Female 1 Normande S20
21 Güicán (BY) G Pintado Male 4 Normande S21
22 Güicán (BY) G Barcina Female 6 Normande S22
23 Güicán (BY) G Cachivoltiada Female 72 Normande S23
24 Arauca (AR) V Hija-Caraqueña Female 5 Zebu S24
25 Arauca (AR) V Duma Female 84 Zebu S29
26 Arauca (AR) V Paraíso Female 84 Zebu S30
27 Arauca (AR) V Cachito Female 48 Zebu S33
28 Arauca (AR) V Caraqueña Female 72 Zebu S34
29 Arauca (AR) V Hijo-Paraíso Male 7 Zebu S36
30 Arauca (AR) V Hijo-Duma Male 7 Zebu S38
31 Arauca (AR) V Panorama Female 72 Zebu S39
32 Arauca (AR) K 9467-2 Female 60 Zebu S25
33 Arauca (AR) K 940418-5 Female 60 Zebu S26
34 Arauca (AR) K 9117 Female 60 Zebu S27
35 Arauca (AR) K 940425-6 Female 60 Zebu S28
36 Arauca (AR) K 940418-2 Female 36 Zebu S31
37 Arauca (AR) K Hijo 1598-5 Macho B Male 2 Zebu S35
38 Arauca (AR) K 1159933 Female 60 Zebu S37
39 Oiba (ST) O2 Linda Female 18 Zebu S41
(continued)

41
Table 15 – (Continued). Date Municipality (State) Farm Animal Sex Age Breed Serum ID
40 Oiba (ST) O2 La Osita Female 18 Zebu S42
41 Oiba (ST) O2 Carmela Female 20 Zebu S48
42 Oiba (ST) O3 Estrellita Female 15 Gyr x Holst S43
43 Oiba (ST) O3 Pecas Male 72 Brown Swiss S44
44 Oiba (ST) O3 La Jersey Female 48 Jersey S46
45 Oiba (ST) O3 Kenworth Female 14 Simmental S49
46 Arcabuco (BY) A2 Laura Female 108 Normande S54
47 Arcabuco (BY) A2 Canela Female 5 Normande S55
48 Arcabuco (BY) A2 Muñeca Female 72 Normande S57
49 Arcabuco (BY) A2 Sorpresa Female 1 Normande S58
50 Arcabuco (BY) A2 Lulú Female 96 Normande S62
Norm = Normande. Holst = Holstein. BS = Brown Swiss. *Positive sera are highlighted in green and potential ones in orange.
Table 16 – Optical densities at 450 nm of ELISA for each triplicate sample, Plate 1. Sample OD450x SD Sample OD450x SD Sample OD450x SD
Blank 0.063 0.008 S7 1.089 0.102 S18 1.193 0.032
Conjugated 0.053 0.003 S8 1.124 0.081 S19 1.030 0.061
Antigen 0.064 0.003 S9 1.176 0.005 S20 1.107 0.028
Positive 1.030 0.091 S10 1.154 0.031 S21 1.209 0.050
Negative 0.088 0.019 S11 1.089 0.034 S22 1.116 0.018
S1 0.857 0.028 S12 1.138 0.065 S23 1.134 0.017
S2 0.800 0.015 S13 1.063 0.015 S24 1.185 0.016
S3 0.911 0.098 S14 1.214 0.039 S25 1.173 0.030
S4 1.088 0.103 S15 1.061 0.061 S26 1.154 0.003
S5 0.944 0.048 S16 1.093 0.073 S27 1.209 0.026
S6 1.054 0.079 S17 1.205 0.010 S18 1.193 0.032
OD450x = Optical densities average at 450 nm. SD = Standard deviation.
Table 17 – Optical densities at 450 nm of ELISA for each triplicate sample, Plate 2 Sample OD450x SD Sample OD450x SD Sample OD450x SD
Blank 0.076 0.005 S35 0.842 0.040 S49 1.236 0.004
Conjugated 0.069 0.006 S36 1.165 0.059 S54 1.144 0.109
Antigen 0.072 0.003 S37 1.129 0.016 S55 1.107 0.025
Positive 0.873 0.089 S38 1.047 0.057 S57 1.319 0.015
Negative 0.096 0.014 S39 1.029 0.054 S58 1.115 0.004
S28 0.787 0.024 S41 1.107 0.025 S62 1.318 0.028
S29 0.766 0.023 S42 1.133 0.045 … … …
S30 0.848 0.048 S43 1.187 0.014 … … …
S31 1.017 0.082 S44 1.151 0.044 … … …
S33 0.976 0.037 S46 1.213 0.027 … … …
S34 0.959 0.037 S48 1.279 0.023 … … …
OD450x = Optical densities average at 450 nm. SD = Standard deviation.

42
Following the directions for screening positive sera (Section 1.2.10.2), a positivity
threshold was established (Table 18).
Table 18 – Establishing the positivity threshold for each 96-wells plate. Plate Sample OD450x SD OD450x + 2SD
1 Positive 1.030 0.091 1.212
2 Positive 0.873 0.089 1.052
In that way, the total of positive animals over the positivity threshold (OD450x +
2SD) is 15 (30%). However, three sera on Plate 1 (orange highlighted rows in Table 16)
and one serum on Plate 2 (orange highlighted row in Table 17) were really close to the
threshold limit. Hence, these sera should be included in the positive group for
confirmation on more specific and sensitive test. The frequency of positivity related to
some characteristics of the herd and municipality altitude in the surveyed farms are
presented in Table 19.
Regarding only the 15 positive sera, more than half were less than 20 months old
(Table 19). It was because of the active searching for young animals as a more reliable
way to establish earlier expositions to Babesia spp. Also, all positive animals came from
a local purchase, although the foreign purchase could be portrayed inaccurately by the
reason of the convenience sampling.
About Municipality elevations, no positive sera were found in the highest
Municipality Elevation (Güicán (BY)), although serum 21 (S21 in Table 14) was really
close to the positivity threshold. It is interesting that six (40%) of positive sera came from
two (A2 and A4) out of six farms of Arcabuco (BY). Also, Arauca samples should have
shown positivity to B. bovis since Colombian Eastern Plains have been considered
endemic across this region for a long time (CORRIER et al., 1978).

43
Table 19 – Number and percentage of positive and negative animals according to age, origin, and municipality elevation.
Characteristic Positive (%) Negative (%) TOTAL (%)
Animals Age
> 36 months 6 (40) 12 (34) 18 (36)
20 to 36 months 1 (7) 0 (0) 1 (2)
< 20 months 8 (53) 23 (66) 31 (62)
TOTAL (%) 15 (100) 35 (100) 50 (100)
Origin
Born in the farm 0 (0) 17 (49) 17 (34)
Local Purchase 15 (100) 14 (40) 29 (58)
Foreign Purchase 0 (0) 4 (11) 4 (8)
TOTAL (%) 15 (100) 35 (100) 50 (100)
Municipality elevation
Güicán, BY (2,983 m.a.s.l.) 0 (0) 4 (11) 4 (8)
Arcabuco, BY (2,575 m.a.s.l.) 6 (40) 18 (51) 24 (48)
Oiba, ST (1,420 m.a.s.l.) 7 (47) 0 (0) 7 (14)
Arauca, AR (125 m.a.s.l.) 2 (13) 13 (37) 15 (30)
TOTAL (%) 15 (100) 35 (100) 50 (100)
Cortés-Vecino et al. (2010) found Rhipicephalus microplus ticks in a farm of
Güicán (BY) at 2,550 m.a.s.l., as well as other unsuspected cattle localities from
Colombia, claiming for an expansion of the regular distribution range of this tick along
with Pulido-Herrera et al. (2015). In that way, R. microplus-borne diseases like Babesia
spp. could be spread on those places with proper conditions for endemic instability.
Although the model for the endemic-stability concept has been disputed about its
original conditions and present applications in Australia and abroad (JONSSON et al.,
2012), it is possible to survey the exposition rates to Babesia spp. for epidemiological
purposes (RÍOS et al., 2010; RODRÍGUEZ-PERAZA et al., 2016).
Most of the interviewees reported observations of fever or even ill or dead cattle
being infested by ticks (Table 14). Even more, 80% of respondents knew the common
Colombian name for bovine babesiosis. However, 100% of them did not remember ill or
dead animals in the farm because of bovine babesiosis, and barely 20% of interviewees
remembered a babesiosis diagnosis in the herd, as far as they knew. It is puzzling, even
for an endemic babesiosis region like Arauca, when only one out of eight sera of Farm V
and one out of seven sera of Farm K (tables 15, 16, and 17) showed a positive antibody

44
level in the indirect ELISA, being negative most of the old cow sera. Ríos et al. (2010)
and Rodríguez-Peraza et al. (2016) claimed endemic stability to babesiosis when
positive young cattle (between three to nine months old) for Babesia spp. assessed by
indirect immunefluorescence reached over 75% of the surveyed population in farms
from Colombia and Venezuela, respectively. In such conditions, ill or dead animals by
babesiosis could be a rare event. In the present research, a large cattle population in
more municipalities by a random sampling could clarify this situation.
Also, it should be consider the cut-off values established for a positivity threshold
in this research (see Section 1.2.10.2) because methodologies for commercial kits use
to follow the percent inhibition based on the mean negative control (MAHMOUD et al.,
2015) or twice the mean percentage positivity of the negative sera (ECHAIDE et al.,
1995). Besides, previous cross-reactivity studies of the SBbo23290 antigen at the
LBCHV-BIOAGRO-UFV pointed out a recognition probability of other cattle parasite
Apicomplexa because of the highly conserved epitope sequence (unpublished
information). Hence, for a conclusive approach, a comparison of the present ELISA
results with a commercial kit, should be carried out.
1.3.6 PCR assays results for B. bovis detection
1.3.6.1 Tick dragging samples
The screening for B. bovis rra gene on Tick Dragging samples is deployed on
Image 5. Although primary PCR showed an amplification product of 823 bp for genomic
and plasmidial DNA positive controls, as expected (MAHMOUD et al., 2015), the semi-
nested PCR result was really a disappointment because of the appearance of several
amplification products in the same sample lane for all samples (see Image 5,B). It was
45
not possible to do again the PCR assays because of a lack of enough scholarship
resources for funding the needed reagents. Also, DNA controls for B. bovis were run out.
A
B
Image 5 – Primary (A) and semi-nested PCR (B) for the B. bovis rra gene in Tick Dragging Samples from Colombia. Std = Standard molecular weight marker; J = San José de Pare farm; A1 = Arcabuco 1 farm; P = Pajarito farm; R = Ginebra farm; Y = Yopal farm; gDNA = genomic DNA of B. bovis; pDNA = plasmidial DNA with rra gene.
1.3.6.2 Tick removal samples
The PCR assays results for Tick Removal Samples for the rra gene of B. bovis
are presented in Image 6. The result of the semi-nested PCR (Image 6,B) was as
discouraged as the Image 5,B. Lacking of enough economical resourced prevented new
PCR assays and sample collections.
A
B
Image 6 – Primary (A) and semi-nested PCR (B) for the B. bovis rra gene in Tick Removal Samples from Colombia. Std = Standard molecular weight marker; G = Güicán farm; A2 = Arcabuco 2 farm; O1 = Oiba 1 farm; O2 = Oiba 2 farm; O3 = Oiba 3 farm; K = Arauca 1 farm; V = Arauca 2 farm; gDNA = genomic DNA of B. bovis; pDNA = plasmidial DNA with rra gene.
1.3.6.3 Blood samples

46
Table 20 shows the data about the dried blood spot samples that were processed
by a commercial kit (see Section 1.2.6). However, regarding the budget limitations, only
four samples from the Farm G in Whatman filter paper and four samples from the Farm
A2 in FTA® Cards were selected for PCR assays (Image 7).
Table 20 – Data of processed cattle blood dried spots from Colombia. No. Municipality (State) Farm Animal Sex Age (months) Breed Blood ID*
1 Güicán (BY) G Brincona Female 1 Normande B20
2 Güicán (BY) G Pintado Male 4 Normande B21
3 Güicán (BY) G Barcina Female 6 Normande B22
4 Güicán (BY) G Cachivoltiada Female 72 Normande B23
5 Arauca (AR) V Paraíso Female 84 Zebu B30
6 Arauca (AR) V Caraqueña Female 72 Zebu B34
7 Arauca (AR) V Hijo-Paraíso Male 7 Zebu B36
8 Arauca (AR) V Hijo-Duma Male 7 Zebu B38
9 Arauca (AR) V Panorama Female 72 Zebu B39
10 Arauca (AR) K Hijo 1598-5 Macho B Male 2 Zebu B35
11 Arauca (AR) K 1159933 Female 60 Zebu B37
12 Oiba (ST) O2 Linda Female 18 Zebu B41
13 Oiba (ST) O2 La Osita Female 18 Zebu B42
14 Oiba (ST) O2 Carmela Female 20 Zebu B48
15 Oiba (ST) O3 Estrellita Female 15 Gyr x Holst B43
16 Oiba (ST) O3 Pecas Male 72 Brown Swiss B44
17 Oiba (ST) O3 Kenworth Female 14 Simmental B49
18 Arcabuco (BY) A2 Laura Female 108 Normande B54W
19 Arcabuco (BY) A2 Canela Female 5 Normande B55W
20 Arcabuco (BY) A2 Muñeca Female 72 Normande B57W
21 Arcabuco (BY) A2 Sorpresa Female 1 Normande B58W
22 Arcabuco (BY) A2 Lulú Female 96 Normande B62
Norm = Normande. Holst = Holstein. BS = Brown Swiss. * Samples with ‘W’ correspond to FTA® Cards, Whatman.
A
B
Image 7 – Primary (A) and semi-nested PCR (B) for the B. bovis rra gene in Cattle Dried Blood Spot Samples from Colombia. Std = Standard molecular weight marker; B20 = blood sample 20; B21 = blood sample 21; B22 = blood sample 22; B23 = blood sample 23; B55W = blood sample 55 from FTA® Card; B57W = blood sample 57 from FTA® Card; B58W = blood sample 58 from FTA® Card; B62 = blood sample 62; gDNA = genomic DNA of B. bovis; pDNA = plasmidial DNA with rra gene.

47
Not surprisingly, several other amplification products than 387 bp appeared in the
same lane of all samples, controls included, for the semi-nested PCR (Image 7,B). A
shortened scholarship budget plus absence of more B. bovis DNA controls avoided new
PCR assays. It has to be notice that positive and negative cattle blood controls about B.
bovis DNA were not available, as well as the positive and negative pooled tick DNA to B.
bovis, for a proper comparison of the results. However, the work intended to build a
baseline data for screening a potential positivity for B. bovis in cattle regions in order to
apply for a larger budget in the future.
1.3.7 PCR assays results for B. bigemina detection
1.3.7.1 Tick dragging samples
The PCR assays for rap-1c gene detection of B. bigemina in the Tick Dragging
samples are shown in the Image 8.
A
B
Image 8 – Primary (A) and nested PCR (B) for the B. bigemina rap-1c gene in Tick Dragging Samples from Colombia. Std = Standard molecular weight marker; J = San José de Pare farm; A1 = Arcabuco 1 farm; P = Pajarito farm; R = Ginebra farm; Y = Yopal farm; gDNA = genomic DNA of B. bigemina; pDNA = plasmidial DNA with rap-1c gene.
Although a very notorious, singular band is observed on the lane of J sample,
remainder samples, as well as controls, showed several amplification products. As the

48
same results happened with all B. bovis semi-nested PCR assays, an issue with the
samples themselves should be taken into account.
1.3.7.2 Tick removal samples
For Tick Removal Samples, the PCR assays for B. bigemina screening are
deployed in Image 9. Again, nested PCR results had more than one band per lane for
almost every sample. It is interesting to observe more conspicuous bands in the control
lanes than samples, coinciding with the nested PCR results for Tick Dragging Samples
(Image 8).
A
B
Image 9 – Primary (A) and nested PCR (B) for the B. bigemina rap-1c gene in Tick Removal Samples from Colombia. Std = Standard molecular weight marker; G = Güicán farm; A2 = Arcabuco 2 farm; O1 = Oiba 1 farm; O2 = Oiba 2 farm; O3 = Oiba 3 farm; K = Arauca 1 farm; V = Arauca 2 farm; gDNA = genomic DNA of B. bigemina; pDNA = plasmidial DNA with rap-1c gene.
1.3.7.3. Blood samples
About the screening for B. bigemina in the selected Dried Blood Spots, Image 10
shows no bands for any sample for the nested PCR assay. However, several
amplification products in control lanes can be noticed.
The pattern of the control lanes amplifications in the three nested PCR assays for
B. bigemina are quite similar. The semi-nested PCR assays for B. bovis shows less
bands per lane, but they share a similar pattern.

49
A
B
Image 10 – Primary (A) and nested PCR (B) for the B. bigemina rap-1c gene in Cattle Dried Blood Spot Samples from Colombia. Std = Standard molecular weight marker; Std = Standard molecular weight marker; B20 = blood sample 20; B21 = blood sample 21; B22 = blood sample 22; B23 = blood sample 23; B55W = blood sample 55 from FTA® Card; B57W = blood sample 57 from FTA® Card; B58W = blood sample 58 from FTA® Card; B62 = blood sample 62; gDNA = genomic DNA of B. bigemina; pDNA = plasmidial DNA with rap-1c gene.
1.3.8 Identification of Babesia spp. by ELISA and PCR in other studies
Concerning the PCR results (sections 1.3.6 and 1.3.7), all semi-nested and
nested PCR assays for B. bovis rra and B. bigemina rap-1c genes represented a
discourage outcome along with the scholarship budget limitation. Mahmoud et al. (2015)
show a single band at each sample lane after agarose gel electrophoresis separation of
PCR products of B. bovis rra and B. bigemina rap-1c genes, respectively.
Notwithstanding, these authors also show several bands at the control DNA plasmid
lanes for as both B. bovis and B. bigemina. Thus, perhaps not all the PCR assays of
sections 1.3.6 and 1.3.7 are wrong, but new PCR assays and sample collections are
needed. Using a different set of primers targeting B. bovis gp45 and B. bigemina rap-1
genes, and without a detailed data of the samples, Mtshali and Mtshali (2013)
demonstrate the occurrence of Babesia in cattle from different South African provinces.
However, they used frozen blood from EDTA-coated vacutainer tubes for getting the
DNA samples. Mahmoud et al. (2015) used a different approach washing blood samples
three times with PBS pH 7.2 and stored at -20ºC. Also, these authors used FTA® Elute
cards for DNA extraction of blood samples.
Field Blood sampling on filter-paper pieces for hemoparasites diagnosis and
research have been recommended (KANEKO, 2008). In fact, Török et al. (2002) claim

50
that 17α-Hydroxyporgesterone estimates in dried blood spots on filter-paper cards
(autoclaved or not) stored for more than a decade can reliably be used for retrospective
examinations and population studies. Although different filter paper types have been
used for pathogen detection studies, just a couple of brands are US Food and Drug
Administration (FDA)-approved (SMIT et al. 2014).
In that way, Smith and Burgoyne (2004) point out that not all filter papers are
suitable for carrying blood samples for long-term storage, as they do not protect the
sample from spoiling and degradation. The authors recommend the FTA® paper for
wildlife research. Assays should not be transferred between paper types without
additional evaluation (SMIT et al. 2014). Also, strict conditions during collection, drying,
storage, and transportation of dried blood spots are critical to avoid bacterial growth and
alterations in the elution time or integrity of the specimen (MEI et al., 2001).
In the present study, one of the several protocols recommended for the kit
manufacturer was chosen (Appendix I) and followed for blood DNA extractions.
However, the filter paper type (Section 1.2.3), as well as the drying time of less than 4
hours recommended by Mei et al. (2001), could be issues that explain the non-expected
bands at the semi-nested and nested PCR assays (sections 1.3.6 and 1.3.7). The
limited budget prevented new sample collections and PCR assays. However, the
aberrant bands appeared on semi-nested and nested PCR assays for tick samples.
Also, the Taq polymerase was not the same as the one used by Mahmoud et al. (2015).

51
1.4 CONCLUSIONS
• All collected samples in Colombia were heterozygous for CzEst9 mutant
genotype. Because of the use of pooled DNA, it could not be established the
allelic frequencies for homozygocity resistant genotype.
• A faint band for the IIIS6 mutant genotype was found in the Farm G (Güicán, BY),
being the only sample considered as heterozygous for the sodium channel
mutation. Remainder samples had the susceptible genotype.
• The presence of CzEst9 mutation in all samples points out a strong selective
pressure of R. microplus with synthetic pyrethroids for metabolic detoxification.
The presence of both CzEst9 and IIIS6 mutations in Farm G indicates a potential
accumulation of pyrethroid resistance mechanisms.
• As no bioassay was carried out with any synthetic pyrethroid, it cannot be related
the detected mutations with the expression of the mutant alleles. In fact, a wide-
range of alternative molecular targets has to be considered before establishing a
relationship between the mutant genotype and the expressed genotype. A
genetic and expressed profile of esterases had to be done with each sample to
establish the cause of the metabolic resistance for synthetic pyrethroids.
• Further research is needed with those samples. Also, a larger sampling of farms
and regions is advisable, as well as testing other groups of acaricides like
organophosphates, formamidines (Amitraz), and macrocyclic lactones
(ivermectin).
• Positive sera from indirect ELISA test with the SBbo23290 synthetic peptide
should be interpreted carefully, as its highly conserved sequence could have
common epitopes with other Apicomplexan parasites of cattle. A comparison with

52
a commercial kit using previous documented, assayed cattle sera controls should
be considered.
• No conclusive detection of B. bovis rra and B. bigemina rap-1c genes can be
asserted from semi-nested and nested PCR assays for as both pooled tick DNA
samples and dried blood spot samples. Issues concerning collection, drying,
storage, and transportation of dried blood samples might have influence the blood
sample results, but similar outcomes were showed for tick samples.
• Retesting the samples by new PCR assays or repeating the sample collection in
Colombia was prevented because of the scholarship budget limitation. Enough
funding will be required to continue this research for a publishable version.
• Statistical frequency analysis of the babesiosis perception questionnaires has a
restricted interpretation to the answers themselves because of the inconclusive
results of molecular and serological test. Also, a random sampling technique,
after getting a proper funding, would let clarify the complete impact of the
babesiosis in the selected cattle regions.

53
REFERENCES
ABDULLAH, S.; YADAV, C.L.; VATSYA, S. Esterase profile of Rhipicephalus (Boophilus) microplus populations collected from Northern India exhibiting varied susceptibility to deltamethrin. Experimental and Applied Acarology, v58, n3, p.315-25. 2012. ALLRED, D.R. Babesiosis: persistence in the face of adversity. Trends in Parasitology, v19, n2, p.51-55. 2003. AMARAL, M.A.Z. Aplicação e uso por produtores do controle estratégico do carrapato bovino adotado pela Embrapa Gado de Leite. 2008. 78 f. Tese (Doutorado) – Curso de Pós-Graduação em Ciências Veterinárias, Instituto de Veterinária, Universidade Federal Rural do Rio de Janeiro, Seropédica, RJ. ANDRADE, R.; MANRIQUE, F.; PETERS, K. Características productivas y de gestión de fincas lecheras
en Boyacá. Revista MVZ Córdoba, v13, n2, p.1333-1342 2008. ANGUS, B.M. The history of the cattle tick Boophilus microplus in Australia and achievements in its control. International Journal for Parasitology, v26, n12, p.1341-1355. 1996. BABES, V. 1988. Sur l’hémoglobinurie bactérienne du boeuf. Comptes Rendus de l’Académie des Sciences, v107, p.692-694. BAFFI, M.A.; de SOUZA, G.R.; VIEIRA, C.U.; de SOUSA, C.S.; GOURLART, L.R.; BONETTI, A.M. Identification of point mutations in a putative carboxylesterase and their association with acaricide resistance in Rhipicephalus (Boophilus) microplus (Acari: Ixodidae). Veterinary Parasitology, v148, n3-4, p.301-309. 2007. BENAVIDES, J.A. Avaliação dos peptídeos sintéticos SBbo23290 e SBm7462 na forma monovalente e polivalente em bovinos desafiados com Rhipicephalus (Boophilus) microplus (Canestrini, 1887) e Babesia bovis (Babes, 1888; Starcovici, 1893). 2006. 60 f. Tese (Mestrado) – Departamento de Veterinária, Universidade Federal de Viçosa, Viçosa, MG. BEUGNET, F.; FRANC, M. Insecticide and acaricide molecules and/or combina-tions to prevent pet infestations by ectoparasites. Trends in Parasitology, v28, n7, p.267-279. 2012. BOCK, R.; JACKSON, L.; De VOS, A.; JORGENSEN, W. Babesiosis of Cattle. Parasitology, v129, p.S247-S269. 2004. BROWN, W.C.; PALMER, G.H. Designing blood-stage vaccines against Babesia bovis and Babesia bigemina. Parasitology Today, v15, n7, p.275-281. 1999. BROWN, C.; NORIMINE, J.; KNOWLES, D.P.; GOFF, W.L. Immune control of Babesia bovis infection. Veterinary Parasitology, v138, p.75-87. 2006. CALDER, J.A.; REDDY, G.R.; CHIEVES, L.; COURTNEY, C.H.; LITTELL, R.; LIVENGOOD, J.R.; NORVAL, R.A.; SMITH, C.; DAME, J.B. Monitoring Babesia bovis infections in cattle by using PCR-based tests. Journal of Clinical Microbiology, v34, n11, p.2748-2755. 1996. CALLOW, L.L.; MELLORS, L.T. A new vaccine for Babesia argentina infection prepared in splenectomised calves. Australian Veterinary Journal, v42, n12, p.464-465. 1966.

54
CALLOW, LL. Some aspects of the epidemiology and control of bovine babesiosis in Australia. Journal of the South African Veterinary Association, v50, p.353-356. 1979. CASTRO, C.C.M. Estudo experimental da resposta imune celular de bovinos vacinados com o peptide sintético SBbo23290 no controle da babesiose por Babesia bovis (Babes, 1888). 2005. 85 f. Tese (Mestrado) – Departamento de Veterinária, Universidade Federal de Viçosa, Viçosa, MG. CASTRO-JANER, E.; RIFRAN, L.; GONZÁLEZ, P.; PIAGGIO, J.; GIL, A.; SCHUMAKER, T.T. Rhipicephalus (Boophilus) microplus (Acari: Ixodidae) resistance to fipronil in Uruguay evaluated by in vitro bioassays. Veterinary Parasitology, v169, n1-2, p.172-177. 2010. CORRIER, D.E.; CORTES, J.M.; THOMPSON, K.C.; RIAÑO, H.; BECERRA, E.; RODRIGUEZ, R. A field survey of bovine anaplasmosis, babesiosis and tick vector prevalence in the eastern plains of Colombia. Tropical Animal Health and Production, v10, n2, p.91-92. 1978. CORTÉS-VECINO, J.A.; BETANCOURT-ECHEVERRI, J.A.; ARGÜELLES-CÁRDENAS, J.; PULIDO-HERRERA, L.A. Distribución de garrapatas Rhipicephalus (Boophilus) microplus en bovinos y fincas del Altiplano Cundiboyacense (Colombia). Revista Corpoica: Ciencia y Tecnología Agropecuaria, v11, n1, p.73-84. 2010. DIAZ, E.; VALLEJO, G. Identificación de un polimorfismo del gen Est9 relacionado con resistencia a piretroides en Rhipicephalus (Boophilus) microplus. Revista MVZ Córdoba, v18, S1, p.3708-3714, 2013. DOMINGUES, L.N. Práticas de controle e perfil de suscetibilidade de Haematobia irritans irritans (Linnaeus, 1758) (Diptera: Muscidae) e Rhipicephalus (Boophilus) microplus (Canestrini, 1887) (Acari: Ixodidae) à cipermetrina e clorpirifós na mesorregião do Triângulo Mineira e Alto Paranaíba, MG, 2010. 2011. 62 f. Tese (Doutorado) – Escola de Veterinária, Universidade Federal de Minas Gerais, Belo Horizonte, MG. ECHAIDE, S.T. de, ECHAIDE, I.E.; GAIDO, A.B.; MANGOLD, A.J.; LUGARESI, C.I.; VANZINI, V.R.; GUGLIELMONE, A.A. Evaluation of an enzyme-linked immunosorbent assay kit to detect Babesia bovis antibodies in cattle. Preventive Veterinary Medicine, v24, n4, p.277-283, 1995. ECKERT, J.W.; GEORGOPOULOS, S.G.; GRESSEL, J.; HAMMOCK, B.D.; HOUGHTON, J.M.; KAUKEINEN, D.; MACNICHOLL, A.; METCALF, R.L.; O’BRIEN, T.; PLAPP, F.W.; RAGSDALE, N.; TAVARES, J.E. (Workshop Participants). Genetic, Biochemical, and Prhysiological Mechanisms of Resistance to Pesticides. Em: Pesticide resistance: strategies and tactics for management. Comitte on Strategies of the Management of Pesticide Resistance Pest Populations, Board on Agriculture, National Research Council. Washington, D.C.: National Academy Press. 1986: 45-53. FAZA, A.P.; PINTO, I.S.; FONSECA, I.; ANTUNES, G.R.; MONTEIRO, C.M.; DAEMON, E.; MUNIZ, M.S.; MARTINS, M.F.; FURLONG, J.; PRATA, M.C. A new approach to characterization of the resistance of populations of Rhipicephalus microplus (Acari: Ixodidae) to organophosphate and pyrethroid in the state of Minas Gerais, Brazil. Experimental Parasitology, v134, n4, p.519-23. 2013 FFRENCH-CONSTANT, R.H. 2007. Which came first: insecticides or resistance? Trends in Genetics, v23, n1, p.1-4. FLAPP, F.W. Genetics and Biochemistry of Insecticide Resistance in Arthropods: Prospects for the Future. In: Pesticide resistance: strategies and tactics for management. Comitte on Strategies of the Management of Pesticide Resistance Pest Populations, Board on Agriculture, National Research Council. Washington, D.C.: National Academy Press. 1986: 74-86. FREITAS, C.M.B. Avaliação da resposta imune de bovinos inoculados com amostra atenuada de Babesia bovis (Starcovici, 1893). 2001. 105 f. Tese (Mestrado) – Departamento de Veterinária, Universidade Federal de Viçosa, Viçosa. MG.

55
GEORGHIOU, G.P. The magnitude of the resistance problema. In: Pesticide resistance: strategies and tactics for management. Comitte on Strategies of the Management of Pesticide Resistance Pest Populations, Board on Agriculture, National Research Council. Washington, D.C.: National Academy Press. 1986: 14-43. GEORGHIOU, G.P. Principles of insecticide resistance management. Phytoprotection, v75, n4, p.51-59. 1994. GOODGER, B.V.; WALTISBUHL, D.J.; WRIGHT, I.G.; WHITE, M. Babesia bovis: analysis of and preliminary vaccination studies with a defined infected erythrocyte membrane binding antigen. International Journal for Parasitology, v22, n4, p.533-535. 1992. GUERRERO, F.D.; DAVEY, R.B.; MILLER, R.J. Use of an allele-specific polymerase chain reaction assay to genotype pyrethroid resistant strains of Boophilus microplus (Acari: Ixodidae). Journal of Medical Entomology, v38, n1, p.44-50. 2001. GUERRERO, F.D.; LI, A.Y.; HERNANDEZ, R. Molecular diagnosis of pyrethroid resistance in Mexican strains of Boophilus microplus (Acari: Ixodidae). Journal of Medical Entomology, v39, n5, p.770-6. 2002a. GUERRERO, F.D.; PRUETT, J.H.; LI A.Y. Molecular and biochemical diagnosis of esterase-mediated pyrethroid resistance in a Mexican strain of Boophilus microplus (Acari: Ixodidae). Experimental and Applied Acarology, v28, n1-4, p.257-64. 2002b. GUERRERO, F.D.; LOVIS, L.; MARTINS, J.R. Acaricide resistance mechanisms in Rhipicephalus (Boophilus) microplus. Revista Brasileira de Parasitologia Veterinária, v21, n1, p.1-6. 2012. GUGLIELMONE, A.A. Epidemiology of babesiosis and anaplasmosis in South and Central America. Veterinary Parasitology, v57, p.109-119. 1995. HERNANDEZ, R.; HE, H.; CHEN, A.C.; WAGHELA, S.D.; WAYNE IVIE, G.; GEORGE, J.E.; GALE WAGNER, G. Identification of a point mutation in an esterase gene in different populations of the southern cattle tick, Boophilus microplus. Insect Biochemestry and Molecular Biology, v30, n10, p.969-977. 2000. HERNANDEZ, R.; GUERRERO, F.D.; GEORGE, J.E.; WAGNER, G.G. Allele frequency and gene expression of a putative carboxylesterase-encoding gene in a pyrethroid resistant strain of the tick Boophilus microplus. Insect Biochemestry and Molecular Biology, v32, n9, p.1009-1016. 2002. HERNÁNDEZ-ORTIZ, Byron Abdel. Imunização experimental de bovinos com o peptide recombinante rBbo23290 para o controle de Babesia bovis (Babes, 1888, Starcovici, 1893): avaliação de parâmetros clínicos e imunológicos. 2014. 71 f. Tese (Mestrado) – Departamento de Veterinária, Universidade Federal de Viçosa, Viçosa, MG. HUNFELD, K.P.; HILDEBRANDT, A.; GRAY, J.S. Babesiosis: recent insights into an ancient disease. International Journal of Parasitology, v38, n11, p.1219-1237. 2008. JARDIM, L.F.B. Avaliacão da resposta imune em bovinos inoculados com o imunógeno sintético SBbo23290 e desafiados com amostra virulenta de Babesia bovis (Babes, 1888) Starcovici, 1893. 2005. 54 f. Tese (Mestrado) – Departamento de Veterinária, Universidade Federal de Viçosa, Viçosa, MG. JOHNSTON, L.A.Y.; HAYDOCK, K.P.; LEATCH, G. The effect of two systems of cattle tick (Boophilus microplus) control on tick populations, transmission of Babesia spp. and Anaplasma spp. and production of Brahman crossbred cattle in the dry tropics. Australian Journal of Experimental Agriculture and Animal Husbandry, v21, p.256-267. 1981.

56
JONSSON, N.N.; BOCK, R.E.; JORGENSEN, W.K.; MORTON, J.M.; STEAR, M.J. Is endemic stability of tick-borne disease in cattle a useful concept? Trends in Parasitology, v28, n3, p.85-89. 2012. KANEKO, A. Field blood sampling. In: Methods in Malaria Research. Moll, K.; Ljunström, I,; Perlmann, H.; Scherf, A.; Wahlgren, M. (eds.). 5th ed. p. 308-312. Manassas, (VA, USA): MR4/ATCC. 2008. KLAFKE, G.M. Resistência de R. (B.) microplus contra os carrapaticidas, Capítulo 6. Em: Rhipicephalus (Boophilus) microplus: Biologia, Controle e Resistência. Pereira M.C. et al. São Paulo: MedVet. 2008: 81-105. LEQUIN, R.M. Enzyme immunoassay (EIA)/enzyme-linked immunosorbent assay (ELISA). Clinical Chemistry, v51, n12, p.2415-2418. 2005. LI, A.Y.; DAVEY, R.B.; MILLER, R.J.; GEORGE, J.E. Detection and characterization of Amitraz resistance in the Southern Cattle Tick, Boophilus microplus (Acari: Ixodidae). Journal of Medical Entomology, v41, n2, p.:193-200. 2004. LI, A.Y.; DAVEY, L.R.; GEORGE, J.E. Carbaryl resistance in Mexican strains of the southern cattle tick (Acari: Ixodidae). Journal of Economic Entomology, v98, n2, p.552-556. 2005
LODOS, J.; BOUE, O,; de la FUENTE, J. A model to simulate the effect of vaccination against Boophilus ticks on cattle. Veterinary Parasitology, v87, p.315-326. 2000. LOVIS, L.; GUERRERO, F.D.; MILLER, R.J.; BODINE, D.M.; BETSCHART, B.; SAGER, H. Distribution patterns of three sodium channel mutations associated with pyrethroid resistance in Rhipicephalus (Boophilus) microplus populations from North and South America, South Africa and Australia. International Journal for Parasitology: Drugs and Drug Resistance, v2, p.216-224. 2012. MAHMOUD, M.S.; KANDIL, O.M.; NASR, S.M.; HENDAWY, S.H.; HABEEB, S.M.; MABROUK, D.M.; SILVA, M.G.; SUAREZ, C.E. Serological and molecular diagnostic surveys combined with examining hematological profiles suggests increased levels of infection and hematological response of cattle to babesiosis infections compared to native buffaloes in Egypt. Parasites & Vectors, v8:319. 2015. MAHONEY, D.F. Bovine babesiosis: the immunization of cattle with killed Babesia argentina. Experimental Parasitology, v20, n1, 125-129. 1967. MAHONEY, D.F.; WRIGHT, I.G. Babesia argentina: immunization of cattle with a killed antigen against infection with a heterologous strain. Veterinary Parasitology, v2, n3, p.273-282. 1976. MAHONEY, D.F.; WRIGHT, I.G.; GOODGER, B.V. Bovine babesiosis: the immunization of cattle with fractions of erythrocytes infected with Babesia bovis (syn. B. argentina). Veterinary Immunology and Immunopathology, v2, n2, p.145-156. 1981. MARTINS JR, FURLONG J. Avermectin resistance of the cattle tick Boophilus microplus in Brazil. Veterinary Record, v149, n2, p64. 2001. MARBAN, E.; YAMAGISHI, T.; TOMASELLI, G.F. Structure and function of voltage-gate sodium channels. Journal of Physiology, v508, n3, p.647-657. 1998. MEI, J.V.; ALEXANDER, J.R.; ADAM, B.W.; HANNON, W.H. Use of filter paper for the collection and analysis of human whole blood specimens. The Journal of Nutrition, v131, n5, p.1631S-6S. 2001. MENDES, M.C.; LIMA, C.K.; NOGUEIRA, A.H.; YOSHIHARA, E.; CHIEBAO, D.P.; GABRIEL, F.H.; UENO, T.E.; NAMINDOME, A.; KLAFKE, G.M. Resistance to cypermethrin, deltamethrin and chlorpyriphos in populations of Rhipicephalus (Boophilus) microplus (Acari: Ixodidae) from small farms of the State of São Paulo, Brazil. Veterinary Parasitology, v178, n3-4, p.383-388. 2011.

57
MOSQUEDA, J.; OLVERA-RAMÍREZ, A.; AGUILAR-TIPACAMÚ, G.; CANTÓ, G.J. Current Advances in Detection and Treatment of Babesiosis. Current Medicinal Chemistry, v19, p.1504-1518. 2012. MTSHALI, M.S.; MTSHALI, P.S. Molecular diagnosis and phylogenetic analysis of Babesia bigemina and Babesia bovis hemoparasites from cattle in South Africa. BMC (BioMed Central) Veterinary Research, v9:154. 2013. OLIVEIRA, P.R.; BORGES, L.M.; LOPES, C.M.; LEITE, R.C. Population dynamics of the free-living stages of Amblyomma cajennense (Fabricius, 1787) (Acari: ixodidae) on pastures of Pedro Leopoldo, Minas Gerais State, Brazil. Veterinary Parasitology, v92, n4, p.295-301. 2000. OIE (World Oragnization for Animal Health). Bovine Babesiosis. Chapter 2.4.2. Manual of Diagnostic Tests and Vaccines for Terrestrial Animals (mammals, birds, and bees). 7th Edition. Volume 1. 2012. NB: Version Adopted by the World Assembly of Delegates of the OIE in May 2014. OLIVEIRA, P.R.; BORGES, L.M.; LOPES, C.M.; LEITE, R.C. Population dynamics of the free-living stages of Amblyomma cajennense (Fabricius, 1787) (Acari: ixodidae) on pastures of Pedro Leopoldo, Minas Gerais State, Brazil. Veterinary Parasitology, v92, n4, p.295-301. 2000. OLIVEIRA, D.C.P. Avaliação da cinética leucocitária sanguínea em bovinos após aplicação simultânea dos imunógenos sintéticos anti-Babesia bovis (SBbo23290) e anti-Rhipicephalus (Boophilus) microplus (SBm7462). 2006. 93 f. Tese (Mestrado) – Departamento de Veterinária, Universidade Federal de Viçosa, Viçosa, MG. PATARROYO JH, COSTA JO. Susceptibility of Brazilian samples of Boophilus microplus to organophosphorus acaricides. Tropical Animal Health and Production, v12, n1, p.6-10. 1980. PATARROYO, J.H.; PRATES, A.A.; TAVARES, C.A.P.; MAFRA,C.L.; VARGAS, M.I. Exoantigens of an attenuated strain of Babesia bovis used as a vaccine against bovine babesiosis. Veterinary Parasitology, v59, 189-199. 1995. PATARROYO, J.H.; VARGAS, M.I.; FREITAS, C.M.; MACEDO, P.A.; PRATES, A.A.; PORTELA, R.W.; CAETANO, B.C. Mapeamento dos epítopos T-reativos sa proteína Bv 60 (RAP-1) de Babesia bovis. In: SEMINÁRIO BRASILEIRO DE PARASITOLOGIA VETERINÁRIA, XI, Salvador, 1999. Anais. Salvador: Colégio Brasileiro de Parasitologia Veterinária, 1999. p.197. PATARROYO, J.H.; VARGAS, M.I.; GONZÁLEZ, C.Z.; GUZMÁN, F; MARTINS-FILHO, O.A.; AFONSO, L.C.C; VALENTE, F.L.; PECONICK, A.P.; MARCIANO, A.P.; PATARROYO, A.M.; SOSSAI, S. Immune response of bovines stimulated by synthetic vaccine SBm74621 against Rhipicephalus (Boophilus) microplus. Veterinary Parasitology, v166, p.333-339. 2009. PÉREZ-COGOLLO, L.C; RODRÍGUEZ-VIVAS, R.I.; RAMÍREZ-CRUZ, G.T.; MILLER, R.J. First report of the cattle tick Rhipicephalus microplus resistant to ivermectin in Mexico. Veterinary Parasitology, v168, p.165-169. 2010. PULIDO-HERRERA, L.A.; RUDAS-LL, A.; BETANCOURT, J.A.; GRANT, W.E.; VILCHEZ, S.J.
Distribución inusual y potencial de la garrapata común del ganado (Rhipicephalus (Boophilus) microplus) en zonas tropicales de alta montaña de los Andes colombianos. Biota Colombiana, v16, n2, p.75-95. 2015. RÍOS, L.A.; ZAPATA R.; REYES, J.; MEJÍA, J.; BAENA A. Estabilidad enzoótica de babesiosis bovina en la región de Puerto Berrío, Colombia. Revista Científica (FCV-LUZ), v20, n5, p.485-492. 2010. RODRÍGUEZ-PERAZA, J.L.; FORLANO-RIERA, M.D.; MELÉNDEZ, R.D. Dinámica de anticuerpos e incidencia de Babesia bigemina en becerras en una unidad de producción en el Municipio Crespo del Estado Lara, Venezuela. Revista Científica (FCV-LUZ), v26, n3, p.136-141. 2016.

58
SALIH, D.A.; EL HUSSEIN, A.M.; SINGLA, L.D. Diagnostic approaches for tick-borne haemoparasitic diseases in livestock. Journal of Veterinary Medicine and Animal Health, v7, n2, p.45-56. 2015. SKOTARCZAK, B. Babesiosis as a disease of people and dogs. Molecular diagnostics: a review. Veterinarni Medicina, v53, n5, p.229–235. 2008. SMIT, P.W.; ELLIOTT, I.; PEELING, R.W.; MABEY, D.; NEWTON, P.N. An overview of the clinical use of filter paper in the diagnosis of tropical diseases. American Journal of Tropical Medicine and Hygiene, v90, n2, p.195-210. 2014. SMITH, T.; KILBORNE, F.L. Investigations into the nature, causation, and prevention of Texas or Southern Cattle Fever. 8th and 9th Reports, Bureau of Animal Industry (USDA), p.177-304. 1893. SMITH, L.M.; BURGOYNE, L.A. Collecting, archiving and processing DNA from wildlife samples using FTA databasing paper. BMC (BioMed Central) Ecology, v4:4. 2004 SODERLUND, D.M.; CLARK, J.M.; SHEETS, L.P.; MULLIN, L.S.; PICCIRILLO, V.J.; SARGENT, D.; STEVENS, J.T.; WEINER, M.L. Mechanisms of pyrethroid neurotoxicity: implications for cumulative risk assessment. Toxicology, v171, n1, p.3-59. 2002. SOLANO-GALLEGO, L.; SAINZ, Á.; ROURA, X.; ESTRADA-PEÑA, A.; MIRÓ, G. A review of canine babesiosis: the European perspective. Parasites & Vectors, v9:336. 2016. SUÁREZ, C.E.; NOH, S. Emerging perspectives in the research of bovine babesiosis and anaplasmosis. Veterinary Parasitology, v180, p.109-125. 2011. SUCEN. Superintendência de Controle de Endemias-SP. Manual de Vigilância Acarológica, São Paulo: SUCEN, 2004, 62p. TODOROVIC, R.A. Serological diagnosis of babesiosis: a review. Tropical Animal Health and Production, v7, n1, p.1-14. 1975. TÖRÖK, D,; MÜHL, A.; VOTAVA, F.; HEINZE, G.; SÓLYOM, J.; CRONE, J.; STÖCKLER-IPSIROGLU, S.; WALDHAUSER, F. Stability of 17α-hydroxyprogesterone in dried blood spots after autoclaving and prolonged storage. Clinical Chemstry, v48, n2, p.370-372. 2002 UILENBERG, G. Babesia: A historical overview. Veterinary Parasitology, v138, p.3-10. 2006. VARGAS, M.I.; PATARROYO, J.H. Patofisiologia da infecção por Babesia bovis. Revista Brasileira de Parasitologia Veterinária, v13, s1, p.48-52. 2004 VIAL, H.; GORENFLOT, A. Chemotherapy against babesiosis. Veterinary Parasitology, v138, p.147-160. 2006. WALTISBUHL, D.J.; GOODGER, B.V.; WRIGHT, I.G.; MIRRE, G.B.; COMMINS, M.A. Babesia bovis: vaccination studies with three groups of high molecular weight antigens from lysate of infected erythrocytes. Parasitology Research, v73, n4, p.319-323. 1987. WRIGHT, I.G.; WHITE, M.; TRACEY-PATTE, P.D.; DONALDSON, R.A.; GOODGER, B.V.; WALTISBUHL, D.J.; MAHONEY, D.F. Babesia bovis: isolation of a protective antigen by using monoclonal antibodies. Infection and Immunity, v41, n1, p.244-250. 1983. WRIGHT, I.G.; MIRRE, G.B.; RODE-BRAMANIS, K.; CHAMBERLAIN, M.; GOODGER, B.V.; WALTISBUHL, D.J. Protective vaccination against virulent Babesia bovis with a low-molecular-weight antigen. Infection and Immunity, v48, n1, p. 109-113. 1985.

59
WRIGHT, I.G.; GOODGER, B.V.; CLARK, I.A. Immunopathophysiology of Babesia bovis and Plasmodium falciparum infections. Parasitology Today, v4, n8, p.214-218. 1988. ZHANG, B.; SAMBONO, J.L.; MORGAN, J.A.T.; VENUS, B.; ROLLS, P.; LEW-TABOR, A.E. An Evaluation of Quantitative PCR Assays (TaqMan® and SYBR Green) for the Detection of Babesia bigemina and Babesia bovis, and a Novel Fluorescent-ITS1-PCR Capillary Electrophoresis Method for Genotyping B. bovis Isolates. Veterinary Sciences, v3, n3:23. 2016.

60
2 CHAPTER II: TRANSFORMATION PROCESS OF Pichia pastoris KM71 WITH
THE SYNTHETIC GENE H1SBbo23290 DERIVATIVE FROM Babesia bovis
RAP-1 PROTEIN
ABSTRACT
The synthetic gene H1Bbo23290 was produced by the combination of two peptides
(5081 and 5084), derivative of the Babesia bovis Bv60 (RAP-1) protein, getting a
sequence of 161 bp. The synthetic protein has 42 aa with 5.83 kDa and an isolectric
point of 9.45. This synthetic gene has been used to test its potential immune protection
in challenged experimental vaccinated bovines. It was promising as a vaccine
candidate. Regarding the availability of the yeast transformation technology, it was
planning the recombinant production of this synthetic protein. So, the pPIC9K vector,
previously manufactured with the gene H1Bbo23290 and inserted in Escherichia coli,
and the Pichia pastoris KM71 recipient were selected. Bench and commercial protocols,
according with the lab research team directions, were followed. However, the extraction
and subsequent linearization of the plasmid DNA were quite difficult. After the
standardization of the respective protocols, an electroporation was carried out. Then,
selective media (YPD + Geneticin) on plates were used to screening for potential
transformants. Later, a PCR assay was used to verify the P. pastoris transformants with
H1Bbo23290. After several attempts, no a single clone was obtained. Also, a
fermentation of a suspected P. pastoris transformant was carried out in a bench-scale
bioreactor. Several factors of the transformation process are discussed.

61
2.1 INTRODUCTION
2.1.1 Synthetic genes
De novo gene synthesis is an increasingly cost-effective method for building
genetic constructs, being the expression of an encoded protein the most common
purpose (WELCH et al., 2011). There are many ways a gene’s sequence can influence
protein expression (effects on mRNA levels, translation velocity, efficiency of initiation,
and rates of charged tRNA consumption) through distinct interactions with cellular
machinery and each can be associated with different types and combinations of
sequence elements (GUSTAFSSON et al., 2012).
Although, there is no a single simple formula to guarantee success for designing
of gene sequences to encode proteins, there are several straightforward steps that can
be taken to greatly increase the probability that a designed sequence will result in the
expression of the encoded protein (WELCH et al., 2011). In this context, reverse
vaccinology uses pathogen sequences to predict exposed antigenic proteins that can be
then tested experimentally (LUCIANI et al., 2012). Taking into account this approach, 30
synthetic peptides were used in five experimental bovines (Bos taurus) to determine B
and T-cell epitopes to Babesia bovis RAP-1 protein. In that way, the synthetic peptides
5081 (aa 271 – 290) and 5088 (aa 391 – 410) stimulated lymphocytes taken from both
inoculated animals with the B. bovis Bbo UFV-1 strain and cell culture supernatants
(PATARROYO et al., 1999). Subsequently, some of these peptides were synthetized in
a single peptide known as SBbo23290 (unpublished information).
2.1.2 Pichia pastoris as biological system for protein expression
A few years ago, the Pichia pastoris strains most commonly used around the
world for protein production were reclassified as the species Komagataella phaffii

62
(KURTZMAN, 2009). However, the two species K. phaffi and K. pastoris are now co-
branded as P. pastoris, being both species used for heterologous protein expression.
More precisely, the GS115 strain (an auxotrophic mutation of K. phaffii NRRL Y-11430
derived by chemical mutagenesis) is widely used for protein production around the world
(LOVE et al., 2016).
Since the foreign protein product expressed in a prokaryote system like
Escherichia coli may be typically obtained as insoluble, miss-folded inclusion bodies,
subsequent solubilization and re-folding steps are required. Thus, E. coli is not generally
suitable to use in expression studies with proteins that contains a high level of disulphide
connectivity or proteins that require other types of post-translational modifications (e.g.,
glycosylation, proline cis/trans isomerizetion, disulphide isomerization, lipidation,
sulphation, phosphorylation, and cleavage of the amino-terminal methionine residue)
(DALY et al., 2005).
In that way, P. pastoris expression systems have significant advantages over E.
coli expression system for producing a foreign mature protein (DALY et al., 2005). Also,
as methylotrophic yeast, P. pastoris is able to metabolize methanol as a sole carbon
source for energy through a specific metabolic pathways using several unique enzymes
(FICKERS, 2014). So, the methanol-inducible alcohol oxidase 1 (AOX1) accounts for
more than 90% of the expressed enzymes in the cell, whilst the methanol-inducible
alcohol oxidase 2 (AOX2) constitutes less than 10% (DARBY et al., 2012). Regarding
the methanol utilization, there are three phenotypes of P. pastoris host strains
(MACAULEY-PATRICK et al., 2005):
• Mut+ (Methanol utilization plus phenotype) grows on methanol at the wild-type
rate and requires high feedings rates of methanol in large-scale fermentations.
• Muts (Methanol utilization slow phenotype) has a disruption in the AOX1 gene
relaying on the weaker AOX2 gene for slower growing and methanol utilization
rate.
• Mut– (Methanol utilization minus phenotype) is unable to grow on methanol,
since that kind of strains has both AOX genes deleted.

63
The Pichia host strain KM71 has mutation in the histidinol dehydrogenase gene
(his4), which prevents it from synthesizing histidine (His–). Thus, transformants are
selected for their inability to grow on histidine deficient-medium. Also, KM71 has a
mutation in the arginosuccinate lyase gene (arg4) that prevents the strain from growing
in the absence of arginine. Finally, the KM71 strain contains a non-functional aox1 gene
relying on the AOX2 enzyme to consume methanol slowly (Muts). Hence, the genotype
of KM71 is his4, aox1::ARG4, arg4 and its phenotype is Muts, His– (DALY et al., 2005;
BALMURUGAN et al., 2007).
The AOX2 gene yields 10-20 times less AOX activity than AOX1 gene. However,
the AOX2 promoter can be efficient if the physicochemical environment has been
optimized, and if anti-foam agents (e.g., oleic acid), that improve transcriptional
regulation of AOX2, have been added (MACAULEY-PATRICK et al., 2005). The AOX1
promoter is tightly repressed by glucose, but it is induced over 1,000-fold in cells shifted
to methanol as a sole carbon source. For this reason, growth in glycerol is
recommended for the optimal induction with methanol (BALMURUGAN et al., 2007). P.
pastoris has a respiratory metabolism and can be cultured to exceptionally high cell
densities (hundreds of grams per liter) on glycerol-containing media, often yielding a
culture resembling a paste at the end of the experiment (DARBY et al., 2012).
2.1.3 Transformation methods for recombinant expression of proteins
P. pastoris has a propensity for homologous recombinations between native and
exogenous DNAs (FICKERS, 2014). For the overexpression of a heterologous protein in
P. pastoris, the most common used method is the stable integration of an expression
vector into the P. pastoris genome via homologous recombination (GASSER et al.,
2013). So, the expression vector/cassette contains regions that are homologous to the
P. pastoris genome and hence integration can occur via gene insertion or gene
replacement. Gene replacements result in a single copy transformants, but usually more
genetically stable, when they are compared to gene insertions (DALY et al., 2005).
There are several techniques for yeast transformation grouped arbitrarily together in two

64
categories (GIETZ and WOODS, 2001): the spheroblast method and the intact yeast cell
transformation (LiAc/ssDNA/PEG, electroporation, Glass Bead method, and Biolistic
transformation).
Electroporation has become increasingly popular and can be used successfully
with antibiotic-resistant methods (DALY et al., 2005). Regarding the electroporation
method, during the electric pulse application to the cell, aqueous pores are formed in the
lipid bilayer (cell membrane). Once the external source (imposed electric field or charge
imbalance) is removed, the pore follows the reverse sequence of formation events and
closes within tens to hundreds of nanoseconds (REM and MICKLAVCIC, 2016).
In any case, the expression of a foreign gene in P. pastoris comprises three main
steps: (a) insertion of the native or synthetic gene into an expression vector; (b)
introduction of the expression vector into the P. pastoris host; (c) examination of
potential strains for the expression of the foreign gene (MACAULEY-PATRICK et al.,
2005). The standard set up of vectors is a bi-functional system enabling replication in E.
coli and maintenance in P. pastoris using as selection markers either auxotrophic
markers (e. g., HIS4) or genes conferring resistance to drugs (e.g., geneticin) (AHMAD
et al., 2014).
Therefore, the P. pastoris expression vector pPIC9K contains the functional HIS4
gene and a gene conferring resistant to G418 (geneticin). This approach allows
transformation and selection for His+ transformants that are resistant to high levels of
G418 and therefore can contain multiple copies of the expression vector (DALY et al.,
2005). Finally, the most common protein monitoring methods include bioactivity assays,
ELISA, SDS-PAGE, and Western blots coupled with band density scanning (POTVIN et
al., 2012).

65
2.2 MATERIAL AND METHODS
2.2.1 The synthetic gene SBbo2390
Based on the findings by Patarroyo et al. (1999), who used several synthetic
peptides of the B. bovis Bv60 (RAP-1) protein for mapping B and T-cell epitopes in
experimental cattle, the synthetic peptide SBbo23290 was developed in the Laboratório
de Biología e Controle de Hematozoários e Vetores (LBCHV), Instituto de Biotecnologia
Aplicada à Agropecuária (BIOAGRO), Universidade Federal de Viçosa (UFV), MG,
Brazil (unpublished information). Some characteristics of the B. bovis Bv60 (RAP-1)
protein are presented on Table 21.
Table 21 – Main features about B. bovis Bv60 (RAP-1) protein. Organism Strain Protein Genbank* aa** Sequence***
B. bovis Mo7 Bv60
(RAP-1) Q17115 565
MRIISGVVGCLFLVFSHHVSAFRHNQRVGSLAPAEVVGDLTSTLETADTLMTLRDHMHNITKDMKHVLSNGREQIVNDVCSNAPEDSNCREVVNNYADRCEMYGCFTIDNVK
YPLYQEYQPLSLPNPYQLDAAFRLFKESASNPAKNSVKREWLRFRNGANHGDYHYFVTGLLNNNVVHEEGTTDVEYLVNKVLYMATMNYKTYLTVNSMNAKFFNRFSFTTKI
FSRRIRQTLSDIIRWNVPEDFEERSIERITQLTSSYEDYMLTQIPTLSKFARRYAD
MVKKVLLGSLTSYVEAPWYKRWIKKFRDFFSKNVTQPTKKFIEDTNEVTKNYLKANVAEPTKKFMQDTHEKTKGYLKENVAEPTKTFFKEAPQVTKHFFDENIGQPTKEFFR
EAPQATKHFLDENIGQPTKEFFREAPQATKHFLGENIAQPTKEFFKDVPQVTKKVITENIAQPTKEFRREVPHATMKVLNENIAQPAKEIIHEFGTGAKNFISAAHEGTKQF
LNETVGQPTKEFLNGALETTKDALHHLGKSSEEANLYDATENTTQANDSTTSNGED
TAGYL
*Accession number. **Number of amino acids. ***As it is deployed in FASTA in the GenBank.
Later, two further versions of the synthetic gene SBbo23290 were developed
(unpublished information), and optimized for expression in P. pastoris, whose main
characteristics are shown in Table 22.
Table 22 – Main features about the B. bovis RAP-1-derived synthetic gene SBbo23290. Gene Name Gene Length GC% Synthetic Peptides Protein Length Amino acid change (position)
H1Bbo23290 161 bp 40.41 5081 + 5084 42 aa* R (14th-15th aa) and M (36th aa)
H2Bbo23290 161 bp 38.99 5081 + 5084 42 aa* K (14th-15th aa) and N (36th aa)
*If the histidine tail (6 aa) before the first cysteine were included, it would be 48 aa in length.
The amino acid sequence changes between the two synthetic versions of
SBbo23290 were made searching an optimization of their performance related to the

66
cattle immune response. It was supposed that several P. pastoris transformants with
H1Bbo23290 were obtained during a previous MSc student research (HERNÁNDEZ-
ORTIZ, 2014). Notwithstanding, those clones were false positive as no amplification of
any PCR product was possible after several attempts (data not shown). In consequence,
a new P. pastoris transformation process was started only with H1Bbo23290.
2.2.2 Plasmid vector pPIC9K
The plasmid vector pPIC9K (Invitrogen, USA) (Figure 4) was chosen by the
research team at the LBCHV-BIOAGRO-UFV to carry the synthetic genes H1Bbo23290
and H2Bbo23290.
Figure 4 – Map of the pPIC9K vector. Source: User Manual, Multi-Copy Pichia Expression Kit (Invitrogen, USA).
The vector pPIC9K with each synthetic gene was purchased, introduced into and
expressed in E. coli cells at the LBCHV-BIOAGRO-UFV as a part of the lab routine

67
activities some time before starting the present research. In order to get enough plasmid
DNA for the P. pastoris transformation process, a replication of the E. coli recipients was
made using LB (Luria-Bertani) medium according to the User Manual, Multi-Copy Pichia
Expression Kit (Invitrogen, USA).
Initially, the E. coli recipients were growth and the plasmid DNA was extracted
following the routine bench protocol of the LBCHV-BIOAGRO-UFV (Appendix L).
However, no DNA band was visible in the agarose gel after the electrophoresis.
Because of that, this protocol was improved (Appendix M). Nevertheless, it did not work
again. So, after several weeks and tests, it was decided to use the PureYielTM Plasmid
Maxiprep System (25 preps, A2393, Promega, Madison, WI, USA) according to
manufacturer instructions. Thus, the plasmid DNA was obtained successfully.
2.2.3 Linearization process
The linearization of the plasmid DNA was a difficult process at the LBCHV-
BIOAGRO-UFV. During several months, different protocols and brands for the restriction
enzyme Sac I (R6061, Promega, Madison, WI, USA and R5268, Sigma, St. Louis, MO,
USA) were used for getting a proper plasmid DNA linearization. Also, a Wizard® SV Gel
and PCR Clean-Up System kit (50 preps, A9281, Promega, Madison, WI, USA) was
used to purified the linearized plasmid DNA before the electroporation step. Also, an
agarose gel electrophoresis (0.7 to 1% at 80V over 40 minutes) was carried out after
each linearization event to verify the linearized plasmid DNA.
2.2.4 Electroporation process

68
Besides of the User Manual, Multi-Copy Pichia Expression Kit (Invitrogen, USA),
several protocols (bench protocols, Internet forums, and published articles) were taken
into account to modify or improve some electroporation process steps in order to
achieve a successful P. pastoris transformation. Briefly, a substitution of the P. pastoris
medium (B instead of YPD medium); a unique Geneticin concentration (0.25 mg/mL) in
the YPD plates; an overnight pre-warm of YPD plates at 30ºC before inoculation with
electroporated cells; an incubation period at 30ºC for 2 hours of electroporated cells
before starting their culturing in a shaker; a bent-glass rod for spreading the
electroporated cells inoculum on the YPD plates; and 48 hours for culturing the
electroporated cells in B liquid medium.
Following the Invitrogen User Manual directions, the next protocol was used for
competent P. pastoris KM71 cells: 1,500 V, 25 µF, and 200 Ω. A Gene Pulser® Cuvette
(0.2 cm electrode gap, Cat No. 165-2086, Bio-Rad, USA) was used for combination of
80 µL of competent P. pastoris cells and over 2.5 µg of linearized, purified plasmid DNA
(usually 20 µL of volume). Also, an Electroporator Gene Pulser XcellTM (Bio-Rad, USA)
was used for electroporation of competent P. pastoris cells plus linearized plasmid DNA.
2.2.5 Selection of P. pastoris transformants
YPD plates with Geneticin (0.25 mg/mL) and, at least, one YPD plate without
Geneticin inoculated with electroporated cells were placed inside an Incubator at 30ºC
until visualizing 3 mm diameter isolated colonies (clones). After that, a single clone of
each selective YPD plate was taken with an inoculation loop and placed into 10 mL of B
medium in a 50 mL centrifuge tube or into 50 mL of B medium in a 250 mL sterile
Erlenmeyer. Later, these flasks were placed into a Shaker for incubation at 30ºC x 190
rpm x 48 hours. Then, a DNA extraction of each replicated clones was carried out
following the instructions on Appendix N.

69
2.2.6 PCR assays.
P. pastoris clones with the synthetic gene rSBm7462®, derived from the R.
microplus Bm86 protein at the LBCHV-BIOAGRO-UFV, were used as controls for the
PCR products of the inserted gene. About PCR assays, the primers used are described
in Table 23.
Table 23 – Sequences of the oligonucleotide primers used in the PCR assays and expected PCR product sizes.
Vector Primer Name Sequence Product Size* Source Gene Names
pPIC9K 5’ AOX1 5’-GACTGGTTCCAATTGACAAGC-3’ 492 bp AOX1
H1Bbo23290** 3’ AOX1 5’-GCAAATGGCATTCTGACATCC-3’ 161 bp
653 bp
*In P. pastoris KM71, because of the ARG4 insert in AOX1, the PCR product about screening Muts integrants is 3.6 kb. Consider this fragment to the size of your insert to interpret your PCR results. **Gene of interest. Source: Original modifications based on the User Manual, Multi-Copy Pichia Expression Kit (Invitrogen, USA).
All PCR reactions for testing P. pastoris transformants with H1Bbo23290 were
performed in a final volume of 50 µL following the next protocol for Taq DNA
Polymerase (from Thermus aquaticus, D1806, Sigma-Aldrich, St. Louis, MO, USA): 5 µL
of 10x PCR Buffer; 1 µL of 10 mM (each) dNTPs Mix (individual stock of dATP, dCTP,
dGTP, and dTTP, Promega, Madison, WI, USA); 1 µL of 5 mM 5’ AOX1; 1 µL of 5 mM 3’
AOX1; 0.5 µL of 5U/µL Taq DNA Polymerase); 0.5 to 2 µL of each Template DNA
(typically <1 µg); and 36.5 to 38 µL of sterile Milli-q water. When Taq Polymerase D1806
seemed to be useless, it was replaced with GoTaq® Green Master Mix (M7122,
Promega, Madison, WI, USA) following next protocol: 10 µL of GoTaq® Green Master
Mix; 1 µL of 5 mM 5’ AOX1; 1 µL of 5 mM 3’ AOX1; 0.5 µL of 5U/µL Taq DNA
Polymerase); and 1 µL of each Template DNA (typically <1 µg).
The volume for the template P. pastoris transformants DNA was calculated based
on Nanodrop DNA quantifications (Nanodrop 2000c Spectrophotometer, Thermo
Scientific, Wilmington, DE, USA). They ranged between 100 to 3,700 ng/µL (typically
around 500 ng/µL). Most of the P. pastoris samples had A260/280 ratio >1.8. Regarding
plasmid DNA samples (pPIC9K), their Nanodrop quantification ranged between 80 to

70
100 ng/µL after DNA extraction. Later, their values were around 4.5 µg/µL after DNA
concentration, and around 400 ng/µL after linearization and purification. Also, most of
these plasmid samples had A260/280 ratio >1.8. The thermocycling conditions used for
screening P. pastoris transformants with H1Bbo23290 were (User Manual, Multi-Copy
Pichia Expression Kit (Invitrogen, USA): Hot Start at 94ºC for 2 min, denaturation at
94ºC for 1 min, 30 cycles of annealing at 55ºC for 1 min each, extension at 72ºC for 1
min, and finale extension at 72ºC for 7 min.
Later, all samples were placed on the agarose gel following next procedure: on a
piece of Parafilm® paper 1 µL of Blue/Orange 6X Loading Dye (G190A, Promega,
Madison, WI, USA), 5 µL of the DNA sample, and 2 µL of 3X staining solution
(GelRedTM Nucleic Acid Gel Stain, 10,000X in water, 41003, BiotiumTM, Hayward, CA,
USA) were mixing by pipetting. Also, the procedure was repeated with 5 µL of the
molecular marker (PCR Markers, G361A, Promega, Madison, WI, USA). Then, each
sample was placed on the respective well in the agarose gel, previously submerged in
TBE 1X into the electrophoresis tray. Finally, the developing for every gel was done in
an UV transilluminator (Fotodocumentador para gel de eletroforese L-PIX Touch,
Loccus, Cotia, SP, Brazil).
2.2.7 Fermentation process and protein expression
Following the advice of the LBCHV research team, a fermentation process of one
of the potential P. pastoris transformant clones was carried out. It follows all directions
established at the LBCHV-BIOAGRO-UFV protocols. Briefly, B medium (58.5 g KH2PO4;
39,3 g (NH4)2SO4; 41.38 g MgSO4•7H2O; 2.25 g CaCl2•2H2O; 11.25 g Yeast Extract;
200 mL Glycerol; ddH2O up to 4.5 L) was poured into a 7.5 L glass container of a bench-
scale bioreactor (Biorreator de Bancada Tec-Bio 7.5, Aeração Tec-Bio-A, Bombas Tec-
Bio-B, Controle Tec-Bio-C, Termostatização Tec-Bio-T, Software TecBioSoft, Tecnal,
Piracicaba, SP, Brazil). Then, it was sterilized at 1.05 kgf/cm2 x 20 min. Later, the

71
software for controlling the bench-scale reactor was activated. At that moment, the
content of one potential P. pastoris transformant vial was poured into 200 mL of B
medium, previously sterilized in a 1 L Erlenmeyer, and placed in a Shaker at 28-30ºC x
190 rpm x 96 hours.
Then, 12 mL of PMT1 (6 g CuSO4•5H2O; 0.08 g NaI; 3 g MnSO4•H2O; 0.2 g
Na2MoO4•2H2O; 0.02 g H3BO3; 0.5 g CaCl2; 20 g ZnCl2; 65 g FeSO4•7H2O; 0.2 g D-
Biotin; 5 mL H2SO4; ddH2O up to 1 L) and 1.5 mL of anti-foam were poured into a 1 L
sterilized bottle with the 200 mL of the potential P. pastoris transformant culture after
approximately 96 hours. Next, the bottle was connected to the bench-scale bioreactor
and the fermentation process was activated. Around 96 hours later, 400 mL of a
sterilized ddH2O and Glycerol (200:200 mL) mixture were poured into a 1 L sterilized
bottle together with 6.5 mL of PTM1. Then, it was connected to the bench-scale
bioreactor as nutrients source. Almost 72 hours later, 400 mL of absolute methanol were
poured into a 1 L sterilized bottle and connected to the bioreactor. In that way, the
potential H1Bbo23290 protein expression was started by the induction of the AOX2
gene. Over 2 mL of absolute methanol are injected into the bioreactor automatically for a
4-days period. Afterwards, over 4.5 L of supernatant were collected after harvesting the
yeast fermentation.
Later, the bicinchoninic acid assay was carried out, according to LBCHV-
BIOAGRO-UFV protocol, to determine the protein concentration in the collected
supernantant. In addition, a silver nitrate staining of a SDS-PAGE gel with the collected
supernatant sample was made. According to ExPASy Bioinformatics Resource Portal
(web.expasy.org), the H1Bbo23290 protein has a theoretical isoelectric point of 9.45 and
a molecular weight of 5.83 kDa (histidine tail included).

72
2.3 RESULTS AND DISCUSSION
2.3.1 DNA extraction of the plasmid pPIC9K
Using the protocol on Appendix M, no band for a plasmid DNA was visible after
the agarose gel electrophoresis (Image 11-A), although it was possible to get a PCR
product at a similar extension of a P. pastoris transformant with a synthetic gene
derivative from Sarcocistys neurona SnSAG1 protein (Image 11-B).
A
B
Image 11 – Agarose gel electrophoresis for plasmid DNA and PCR products of pPIC9K transformant vectors with H1Bbo23290 and H2Bbo23290 A: H1 = H1Bbo23290 plasmid DNA; H2 = H2Bbo23290 plasmid DNA; h1 = H1Bbo23290 plasmid DNA (1:10 dilution); h2 = H2Bbo23290 plasmid DNA (1:10 dilution); 5y = P. pastoris transformant SnSAG1 DNA. B: M = molecular marker in base pair; H1 = H1Bbo23290 PCR product; H2 = H2Bbo23290 PCR product; 5y = P. pastoris transformant SnSAG1 DNA PCR product; w = sterile milli-q water; 5y = P. pastoris transformant SnSAG1 DNA (1:10 dilution) PCR product.
Regarding the successful PCR result (Image 11-B), it was decided to continue
with the transformation process of P. pastoris KM71 for as both H1Bbo23290 and
H2Bbo23290 synthetic genes. However, after repeated attempts, no colony grew on any
selective media plates (see Section 2.2.5), but it was detected bacterial contamination
on some of them. Without any evidence of a successful linearization (previous works at
the LBCHV did not considered such a evidence necessary), all activities focused on the
linearization step. As it was suspected, the extraction of the plasmid DNA and its
linearization were not working (Image 12).

73
A
B
Image 12 – Agarose gel electrophoresis for linearized plasmid DNA of pPIC9K transformant vectors with H1Bbo23290 or H2Bbo2390. A: M= molecular marker in base pair; H1 = H1Bbo23290 plasmid DNA; H2 = H2Bbo23290 plasmid DNA; w = sterile milli-q water; h1 = H1Bbo23290 plasmid DNA (1:10 dilution); h2 = H2Bbo23290 plasmid DNA (1:10 dilution). B: M= molecular marker in base pair; H1 = H1Bbo23290 plasmid DNA; H2 = H2Bbo23290 plasmid DNA; 12/2 = P. pastoris transformant DNA (inserted gene of Neospora caninum NcSAG4 protein); 5yd = P. pastoris transformant DNA (1:10 dilution) (inserted gene of S. neurona SnSAG5 protein); TE = Tris-EDTA buffer.
Some of the plasmid DNA samples got a 1:10 DNA concentration dilution in order
to facilitate its appearance in the agarose gel electrophoresis. In subsequent attempts,
the E. coli with pPIC9K–H1Bbo23290 and –H2Bbo23290 were cultured in liquid and
solid medium intending to increase the plasmid DNA extraction following the protocol in
Appendix M. Still, several underachievement results were obtained again (Image 13).
A
B
Image 13 – Typical agarose gel electrophoresis results for pPIC9K plasmids DNA. A: M= molecular marker in base pair; H1 = H1Bbo23290 plasmid DNA (liquid LB medium); H2 = H2Bbo23290 plasmid DNA (liquid LB medium); H2p = H2Bbo23290 plasmid DNA (solid LB medium); 12/2 = P. pastoris transformant DNA (inserted gene of Neospora
caninum NcSAG4 protein); TE = Tris-EDTA buffer. B: M= molecular weight in base pair; H1 = H1Bbo23290 plasmid DNA; H2 = H2Bbo23290 plasmid DNA; 12/2 = P. pastoris transformant DNA (inserted gene of Neospora caninum NcSAG4 protein); w = sterile milli-q water.
In that way, the protocol on Appendix M was modified into the protocol on
Appendix N. On a subsequent availability of a commercial kit for plasmid DNA extraction

74
(see Section 2.2.2), the three protocols were compared (Image 14-A), and then only the
commercial kit protocol was implemented (Image 14-B and -C).
A
B
C
Image 14 – Agarose gel electrophoresis results for pPIC9K plasmids DNA with bench protocols or a commercial kit protocol. A: H1p = H1Bbo23290 plasmid DNA from solid LB medium (Appendix 1 protocol); H1a = H1Bbo23290 plasmid DNA from liquid LB medium (Appendix 1 protocol); H1b = H1Bbo23290 plasmid DNA from liquid LB medium (Appendix 2 protocol); H2p = H2Bbo23290 plasmid DNA from solid LB medium (Appendix 1 protocol); H2a = H2Bbo23290 plasmid DNA from liquid LB medium (Appendix 1 protocol); H2b = H2Bbo23290 plasmid DNA from liquid LB medium (Appendix 2 protocol). B: H1 = H1Bbo23290 plasmid DNA (commercial kit); H2 = H2Bbo23290 plasmid DNA (commercial kit); Sn5 = SnSAG5 plasmid DNA; TE = Tris-EDTA buffer. C: M = molecular marker in base pair; H1 = H1Bbo23290 plasmid DNA (commercial kit); H2 = H2Bbo23290 plasmid DNA (commercial kit); Sn5 = SnSAG5 plasmid DNA.
The H2 samples on Image 14-A appeared degraded. No satisfactory explanation
was elaborated at that time. Focusing on bench and commercial protocols comparison
for H1 samples, the LBCHV research time considered that two bands on the same lane
for the commercial protocol could be a potential contamination. Because of that new
attempts were carried out (Image 14-B) to rule out a contamination of the commercial kit.
Finally, no double bands were observed in subsequent plasmid DNA extractions (Image
14-C). Consequently, the commercial kit (see Section 2.2.2) was selected for getting the
plasmid DNA.
2.3.2 Linearization of the plasmid pPIC9K
Two periods for enzymatic digestion of the pPIC9K plasmid DNA with the
restriction enzyme Sac I R5268 (see Section 2.2.3) were compared (Image 15).

75
A
B
Image 15 – Two periods comparison of enzymatic digestion for the pPIC9K plasmids DNA with the restriction enzyme Sac I (R5268). A, enzymatic digestion at 37ºC x 1h: M= molecular marker in base pair; H1d = H1Bbo23290 plasmid DNA (1:10 dilution); H2 = H2Bbo23290 plasmid DNA; H2p = H2Bbo23290 plasmid DNA (solid LB medium); Sn5 = SnSAG5 plasmid DNA. B, enzymatic digestion at 37ºC x 4h: The same samples as the A-figure.
However, no band was unequivocally visible on the plasmids DNA lanes when
compared with the control plasmid DNA (Image 15). These plasmids DNA samples
came from the bench protocol on Appendix M. As a consequence, the plasmids DNA
from protocols comparison (Image 14-A) were used to the best period for the enzymatic
digestion (Image 16).
A
B
Image 16 – Two periods comparison of enzymatic digestion for the pPIC9K plasmids DNA (bench and commercial protocols) with the restriction enzyme Sac I (R6061). A, enzymatic digestion at 37ºC x 4h: M= molecular marker in kilobase pair; H2p = H2Bbo23290 plasmid DNA from solid LB medium (Appendix 1 protocol); H1 = H1Bbo23290 plasmid DNA from liquid LB medium (Appendix 1 protocol); H2 = H2Bbo23290 plasmid DNA from liquid LB medium (Appendix 2 protocol); H1 = H1Bbo23290 plasmid DNA (commercial kit); H2 = H2Bbo23290 plasmid DNA (commercial kit); 5yd = P. pastoris transformant SnSAG5 (1:10 dilution); Sn5 = plasmid DNA of SnSAG5. B, enzymatic digestion at 37ºC x 16h: The same samples, except the 5yd sample.
By reason of two bands on the same sample lane being considered as a
successful linearization by the LBCHV research team, the Image 16 shows a failed
linearization of the plasmid DNA. Although two DNA bands closed together are visible
on sample lanes that came from the commercial protocol, a wider separation between
them was expected.

76
Several linearization attempts were carried out until find the two bands per lane
as the linearized control plasmid DNA using only 4 hours of enzymatic digestion (Image
17), because no difference was found on Image 16.
A
B
Image 17 – Typical agarose gel electrophoresis results of plasmid DNA linearization (37ºC x 4h) with Sac I (R6061) using the commercial or the bench protocol. A, samples processed by the commercial kit: M= molecular marker in kilobase pair; H1 = H1Bbo23290 plasmid DNA; H2 = H1Bbo23290 plasmid DNA; Sn5 = SnSAG5 plasmid DNA; w = sterile milli-q water. B, samples processed by either the commercial or the bench protocol: M= molecular marker in kilobase pair; H1 = H1Bbo23290 plasmid DNA (commercial protocol); H2 = H2Bbo23290 plasmid DNA (commercial protocol); H1 = H1Bbo23290 plasmid DNA (bench protocol); H2 = H2Bbo23290 plasmid DNA (bench protocol); Sn5 = SnSAG5 plasmid DNA.
No double-bands were visible in Image 17 and it represented a failed linearization
of the plasmids DNA. In account of that result, a plasmid DNA concentration was carried
out intending a better enzymatic digestion (Image 18-A). Also, the PCR product from the
plasmid DNA was submitted to enzymatic digestion surveying for PCR product
modifications (Image 18-B). No two-bands lanes were visible in Image 18-A, but no
additional bands were visible with the PCR product of the plasmid DNA in Image 18-B.
The last result means that the enzymatic digestion does not affect the integrity of the
PCR product. Following this conclusion, the PCR product bands were extracted and
purified using a commercial kit (see Section 2.2.3). Unfortunately, starting around 500
ng/µL for the PCR products (See Section 2.2.6), the quantification dropped to almost 3
ng/µL (≈45 µL total volume) after the purification step. So, this linearized plasmid DNA
was ruled out as the minimal required quantity for electroporation is between 5-20 µg.
Because of the huge quantity required for the electroporation step (according to
Invitrogen Manual it must be between 5-20 µg of linearized plasmid DNA), multiple
enzymatic digestions (Image 19) were planned to get enough linearized DNA for the P.
pastoris KM71 transformation following the Sac I R6061 instructions (1 µg of plasmid
DNA in a final volume reaction of 20 µL).

77
A
B
Image 18 – Agarose gel electrophoresis results of concentrated plasmid DNA linearization and subsequent PCR product enzymatic digestion (Sac I at 37ºC x 4h) A, concentrated plasmid DNA (according to the commercial protocol) and plasmid DNA (commercial protocol): M= molecular marker in kilobase pair; H1c = H1Bbo23290 concentrated plasmid DNA; H2c = H2Bbo23290 concentrated plasmid DNA; H1 = H1Bbo23290 plasmid DNA; H2 = H2Bbo23290 plasmid DNA; Sn5 = SnSAG5 plasmid DNA. B, enzymatic digestion of PCR products from A-figure.
Image 19 – Several enzymatic digestion reactions (Sac I R6061 at 37ºC x 4h) for H1Bbo23290 and H2Bbo23290 plasmids DNA. Top, linearization of H1Bbo23290 plasmid DNA samples: M= molecular marker in kilobase pair; H1 = H1Bbo23290 plasmid DNA; Wells 1-18 represent a sample of each Sac I individual reactions. Bottom, linearization of 21Bbo23290 plasmid DNA samples: M= molecular marker in kilobase pair; H2 = H2Bbo23290 plasmid DNA; Wells 19 and 20 represent Sac I reactions of H1. Wells 1-12 represent a sample of each Sac I individual reactions; H1r = H1 PCR product; H2r = H2 PCR product; Sn5 = SnSAG5 plasmid DNA; w = sterile milli-q water.
Nevertheless, no double band was visible either on sample lanes or the control
lane (Image 19-Sn5). The LBCHV research team expected a band as near to the PCR
product as possible. As a consequence of this failed linearization, a comparison
between enzymes and brands was made to understand if the problem was in the
restriction enzyme (Image 20). At this point, the transformation process was focused
only to the H1Bbo23290 synthetic gene.

78
A
B
Image 20 – Comparison of restriction enzymes and two enzymatic digestion periods using the pPIC9K H1 plasmid DNA. A, enzymatic digestion at 37ºC x 3h: M= molecular marker in kilobase pair; H1 = H1Bbo23290 plasmid DNA; E1 = H1 with Sac I R6061; E2 = H1 with Sac I R5268; E3 = H1 with Bgl II 15213-028; Sn5 = SnSAG5 plasmid DNA; e1 = Sn5 with Sac I R6061; e2 = Sn5 with Sac I R5268; e3 = Sn5 with Bgl II 15213-028; H1r = H1 PCR product. B, enzymatic digestion at 37ºC x 12h: The same samples as the A-figure.
Images 20-A and 20-B show that the Bgl II restriction enzyme was the only one
that produced two bands on the same lane for the H1 sample. However, the two bands
produced on the control lane were in different levels. Also, Sac I is working on SnSAG5
no matter the brand. According to the research team of a Molecular Biology laboratory at
the BIOAGRO-UFV the parameters for the restriction enzyme reaction can be modified
just varying the volume of the DNA template and restriction enzyme. Remainder
parameters (buffer and water volume) should be kept following the manufacturer
recommendations. In that way, a new Sac I (R5268) reaction was prepared using up to
20 µL of DNA template (around 350 ng/µL) comparing two volumes of the restriction
enzyme, 1 and 3 µL, to a final volume of 30 µL (Image 21). The period of enzymatic
digestion was extended up to 8h as advised by external personnel.
A
B
Image 21 – Agarose gel electrophoresis of linearized pPIC9K H1 vector with or without purification. A, enzymatic digestion at 37ºC x 8h and PCR products: M= molecular marker in kilobase pair; H1 = H1Bbo23290 plasmid DNA; H1L = Linearized H1 using 3 µL of Sac I (R5268); h1L = Linearized H1 using 1 µL of Sac I (R5268); H1r = H1L PCR product; h1r = h1L PCR product. B, enzymatic digestion at 37ºC x 8h and then purification of the reaction DNA product: The same samples as the A-figure, except the PCR products, and including sterile milli-q water (w).

79
No double-bands were visible on lane h1L (Image 21-A), but there was a PCR
amplification of this linearized product. So, as advised by the research team of a
Molecular Biology laboratory, a purification of the linearized products was made before
the electroporation step in order to get a clean linearized product. The agarose gel
electrophoresis of such as purified linearized plasmid DNA is showed in Image 21-B. As
a consequence, after each linearization a subsequent purification step was implemented
before starting the electroporation of competent cells. However, in spite of purification,
sometimes the linearized product did not show the two bands per lane, although it had
always a lesser base pair length than plasmid DNA. Also, the PCR product was in the
expected base pair length (Image 22).
A
B
C
Image 22 – Agarose gel electrophoresis of linearized H1 plasmid DNA. A, enzymatic digestion at 37ºC x 8h; B, enzymatic digestion at 37ºC x 8h and then purification; C, PCR product of the linearized product in the B-figure. M = molecular marker in base pair (A and B) and in kilobase pair (C); H1 = H1Bbo23290 plasmid DNA (A and B); H1L = Linearized product of H1 (B); H1 = H1L PCR product (C). w = sterile water.
Figure 5 – Restriction map of H1Bbo23290 sequence generated by NEBcutter. Source: http://nc2.neb.com/NEBcutter2/index.php
Linear Sequence: H1Bbo23290
Cleavage code Enzyme name code
blunt end cut
5’ extension
3’ extension
cuts 1 strand
Available from NEBHas other supplierNot commercially available
∗: cleavage affected by CpG methylation#: cleavage affected by other methylation
(enz. name): ambiguous site
Display: - All commercial single cutter restriction enzymes
- Main non-overlapping, min. 100 aa ORFs
GC=43%, AT=57%
1 161
∗BsiEI
∗HaeIII
∗EagI
∗EaeI
∗NotI
MslI
HpyCH4V
LpnPIBlpI
MwoI
BspCNI
AgsIMseIMlyI
PleI
HinfIEarIBfaITspRI
HpyCH4III
BtsIMutI
HphI
EcoRI
MluCI
ApoI

80
Finally, the Figure 5 deploys theoretical target sites for all restriction enzymes that
could attack the H1Bbo23290 synthetic sequence, where is clear that Sac I does not
appear at all. It means that Sac I does not represent any menace to the H1Bbo23290
sequence integrity, if used under proper conditions.
2.3.3 Selection of P. pastoris transformants
Following the Invitrogen Manual directions (see sections 2.2.4 and 2.2.5), the
electroporated P. pastoris cells were spread on selective media plates. The appearance
of the selected colonies on YPD + Geneticin plates and the unselected growing on the
control plates is shown in Image 23.
A
B
C
Image 23 – Typical photographs of the selective and non-selective media plates with electroporated P. pastoris with linearized H1 plasmid DNA. A: A few clones are visible (YPD + 0.25 mg/mL Geneticin). B: Several clones are visible (YPD + 0.25 mg/mL Geneticin). C: Growing on non-selective media or control (YPD without Geneticin).
2.3.4 PCR assays
After getting the DNA of the P. pastoris transformants (clones), a PCR assay was
carried out in order to verify the inserted gene (see Section 2.2.6). Thereby, Image 24
shows no PCR products for five screened clones

81
Image 24 – Agarose gel electrophoresis for screening potential P. pastoris transformants with H1Bbo23290 synthetic gene. M = molecular marker in kilobase pair; 1-5 = P. pastoris supposedly transformants (clones); 4G = P. pastoris transformant with 7462 synthetic gene derivative from R. microplus (fourth generation).
Following subsequent modifications to the original protocol (see Section 2.2.5), at
least 16 clones were obtained and surveyed for transformation evidence through PCR
assays (Image 25).
A
B
Image 25 – Agarose gel electrophoresis for DNA extraction and subsequent PCR assays of each P. pastoris transformant under the improved protocol. A, DNA extraction of each clone: M = molecular marker in base pair; the letter represent the selective medium plate and the number represent the ordinal selected clone; Cx = non-selective medium plate colonies; 5E = P. pastoris transformant with 7462 synthetic gene; w = sterile milli-q water. B, PCR assay for each clone: The samples are the same as A-figure.
Unfortunately, a band of DNA appeared on the control reaction lane (w) pointing
out contamination with a foreign DNA. Still, the LBCHV research team decided to test at
least one of the best clones according to the strong appearance of the PCR products.
Between clones A3 and G2, the first one was chosen for fermentation in order to screen
for a potential production of the H1Bbo23290 protein. Nevertheless, the clone A3 and
the other clones were screening through PCR assays for H1Bbo23290 insertion with
negative results (images 26 and 27).
In spite of using an improved, modified protocol, no successful transformation was
achieved. Unfortunately, the scholarship and doctorate period was over.

82
A
B
Image 26 – Agarose gel electrophorese for DNA extraction and PCR assays of P. pastoris transformant (clone) A3 with H1Bbo23290. A, DNA extraction of A3 clone with two resuspension media: w = sterile milli-q water; A3a and A3b = twin DNA samples of A3 clone resuspended in sterile milli-q water; TE = Tris-EDTA buffer; A3c and A3d = twin DNA samples of A3 clone resuspended in TE buffer. B, PCR assay for A3 clone with two resuspension media: M = molecular marker in base pair; A3a-d are the same samples as the A-figure; 5E = P. pastoris transformant with 7462 synthetic gene.
A
B
Image 27 – Agarose gel electrophoresis for DNA extraction and PCR assays of all remainder P. pastoris transformants (clones) with H1Bbo23290. A, DNA extraction of each clone: The letter represent the selective medium plate and the number represent the ordinal selected clone in the same plate; A3c = DNA samples of A3c clone resuspended in TE buffer. TE = Tris-EDTA buffer. B, PCR assay for each clone: The samples are the same as A-figure, except A3c and TE, and including 5E (P. pastoris transformant with 7462 synthetic gene).
2.3.5 Fermentation process and protein expression
The fermentation process was achieved as described in Section 2.2.7. The
supernatant was analyzed by the bicinchoninic acid assay determining a concentration
of 1.06 mg/mL (R2 = 0.9966). It was considered a lower concentration than expected as
compared with the usual concentration of the harvested supernatant of the rSBm7462
protein (around 2 mg/mL).
Also, a SDS-PAGE of the supernatant was carried out (see Section 2.3.7) in
order to screening for potential proteins with a molecular weight less than 6 kDa (Image

83
28). It should be noted that no filtration step was carried out because it was decided to
save the filter, regarding the negative PCR assay for A3 clone.
No proteins with a molecular weight compatible with the H1 synthetic gene (see
Section 2.2.7 and Image 28) were detected. It was not surprising as the PCR assay
showed no amplifications for the P. pastoris A3 clone (Image 26). Unfortunately, both
the scholarship and the doctorate academic period were over and these activities cannot
be continued.
Image 28 – SDS-PAGE after silver nitrate staining for supernatant of the P. pastoris A3 clone using three different dilutions and two sample buffers. M = Molecular weight in kDa; Lanes 1-3 represent the dilutions 1:3, 1:4, and 2:3 of sample buffer A and P. pastoris A3 supernatant, respectively; Lanes 4-6 represent the dilutions 1:3, 1:4, and 2:3 of sample buffer B and P. pastoris A3 supernatant, respectively; Lanes 7-8 represent the dilutions 1:3 of sample buffer A and P. pastoris KM71 supernatant and 1:4 of sample buffer B and P. pastoris KM71 supernatant.
2.3.6 H1SBbo23290 and transformation issues
The findings by Jardim (2005) and Castro (2005) about experimental cattle
immune response to the synthetic peptide SBbo23290 pointed out a promising vaccine
candidate. However, intraclonal competitions of stimulated T-cells on experimental
cattle, after administration of a polyvalent vaccine with the synthetic peptides

84
SBbo23290 and SBm7462, decreased the protective efficacy of the last one
(BENAVIDES, 2006).
Regarding the successful production of several recombinant proteins in the P.
pastoris biological system (e.g., rSBm7462®), a transformation of P. pastoris KM71 with
SBbo23290 alone or combined with SBm7462® was carried out at the LBCHV-
BIOAGRO-UFV. Hernández-Ortiz (2014) describes superficially the transformation
process to get P. pastoris transformants with the synthetic peptide SBbo23290, but he
does not present any evidence to support the transformation process nor the
sequentiation of the P. pastoris transformat PCR products or the expressed protein. Still,
the author used the obtained protein, after the fermentation process, to vaccinate
experimental bovines that were challenge with the B. bovis virulent strain Bbo UFV-1.
Also, he found that the synthetic peptide SBbo23290 was ineffective to establish an
immune protection against bovine babesiosis in the experimental animals.
In my research for this thesis objective, all the P. pastoris transformants with
SBbo23290 stored at the LBCHV-BIOAGRO-UFV were screening by PCR assays with
no positive results at all. Two clones of SBbo23290 –6 and 7– gave a faint band on the
respective agarose gel electrophoresis (data not shown). After the sequentiation of the
PCR products (Macrogen Inc., Seoul, South Korea), they were false negative as their
sequence had 771 bp, larger than 653 bp of the PCR product integrant (see Table 3),
and no a single significant similarity was found between that sequence and the gene of
interest sequence (H1Bbo23290) using BLAST® (Basic Local Alignment Tool, NCIBI,
USA). Because of that, the initial thesis objective had to be modified to include the P.
pastoris transformation with the synthetic gene H1Bbo23290.
The basis for a successful into P. pastoris consists of high efficient, competent
yeast cells and a linearized construct that must be able to integrate into the yeast
genome (WEIDNER et al., 2010). Using electroporation as the transformation method,
up to 105 transformants/µg DNA can be yielded up (GASSER et al., 2013).
Notwithstanding, several factors can affect the efficiency of the transformation. Starting

85
from the plasmid pPIC9K digested with Sac I to transform P. pastoris G115, Wu and
Letchworth (2004) found that the high efficiency occurred at the lowest concentrations of
DNA. For example, the 1-10 ng range of DNA produced an average of 1.5 to 4 millions
of transformants, while at the highest DNA concentration (1 µg) the transformation
produced an average of 260,000 transformants.
Also, the transformation process is more efficient at higher cell densities of P.
pastoris. At 1 x 10¹⁰ cells/mL, the transformation efficiency reached more that 3 million
transformants/µL, whereas only about 64,000 transformants/µg were obtained at 0.5 x
109 cells/mL (WU AND LETCHWORTH, 2004). It is interesting the small quantity of
linearized DNA (ng) used by these authors different from the huge quantity (5-20 µg)
recommended by the User Manual of the Multi-Copy Pichia expression kit (Invitrogen,
USA). It was most common to me to get a linearized DNA less than 5 µg that higher
using the commercial kit (see Section 2.2.3).
Regarding the expression vector, the large size of pPIC9K (9.3 kb, see Figure 14)
makes in vitro cloning steps more difficult, and integration of such large vector typically
results in transformants that are genetically less stable. In fact, large episomal plasmid
can be lost during repeated generations as they are mitotically unstable. Additionally,
gene replacement transformants are usually more genetically stable than gene insertion
transformants (DALY et al., 2005). These factors could explain why all supposed P.
pastoris transformants with Sbbo23290 from Hernández-Ortiz (2014) were found as
non-transformants.
Madden et al. (2015) recommend cleaning and concentrating the linear DNA after
digestion, prior to transformation. The cleaning step, with the proper commercial kit
(Section 2.2.3), was implemented, but the concentration was dismissed as the cleaning
step reduced significantly the amount of linear DNA to repeat a new cleaning after the
concentration. It should be noted that Madden et al. (2015) also recommend a linear
DNA in water, rather than a solution with salts, in order to reduce the conductivity of the

86
sample during the electroporation step. Using the commercial kit, the linear DNA was
always resuspended in sterile, nuclease-free water provided by the manufacturer.
According to Lin-Cereghino et al. (2008), when the recovery time (the period
between electroporation and plating) varied from 0 to 16 h, it was found that cells
needed at least 1 h to demonstrate sufficient G418 resistance. In that sense and
following the same advise in several protocols, after electroporation 1 mL of 1 M Sorbitol
was added to the P. pastoris cells and then they were kept under 30ºC for 2 h before
plating. It was done for all 16 P. pastoris clones in Figure 17.
Finally, considering a potential high prevalence of false-positive colonies (high
transformation background), the problem with the resistance marker-based screening is
supposedly caused by cell stress and cell rupture. Depending on the mechanism of
antibiotic resistance conferred by the resistance marker, untransformed cells may
survive in the vicinity of ruptured transformants. So, some vectors use a maker
gene expression driven by the weak ARG4 promoter (AHMAD et al., 2014). Also, the
Tn903kanr gene in pPIC9K has a bacterial promoter and transcriptional termination
sequences resulting in a poor expression in yeast. By replacing the original
transcriptional control elements of this gene with those from yeast, Lin-Cereghino et al.
(2008) found that the expression of Tn903kanr gene in P. pastoris was improved
significantly.
Taking into account the false-positive colonies issue, the User Manual of pPIC9K
(A Pichia Vector for Multicopy Integration and Secreted Expression, Invitrogen, USA)
recommend to purify the putative Geneticin® resistant clones by streaking for single
colonies on YPD and then confirming Geneticin® resistant on YPD-Geneticin® resistant
plates. However, the scholarship and the doctorate course coming deadlines prevented
further activities.

87
2.4 CONCLUSIONS
• No P. pastoris transformants with the synthetic gene H1Bbo23290, derivative
from B. bovis RAP-1 protein, were detected in PCR assays. Also, no protein from
the harvested fermentation supernatant of a suspected P. pastoris clone was
identified around 6 kDa in SDS-PAGE. Although the LBCHV research team
protocols and directions were obeyed and revisited, an expert trained
accompaniment is critical for achieving every transformation step successfully.
• Plasmid DNA extraction and linearization were the major obstacles to achieve the
P. pastoris trasformants with the synthetic gene H1Bbo23290 on time. Also,
reaching the required amount of the purified linear DNA, according to Nanodrop®
quantification, was a laborious, time-consuming activity. Even thought some
bench protocols are an economic, improved tool for experienced lab technicians,
the cost-benefit relation of commercial protocols should be considered with naïve
lab students.
• The pPIC9K vector with the synthetic gene H1Bbo23290 was already available at
the LBCHV before starting the transformation process and it was assumed as a
proper integrant. So, a standardization of the P. pastoris KM71 might require a
sequentiation of the construct before transforming into Pichia. In addition, the
transformation of P. pastoris is a multi-step process that would benefit from a task
division beyond the lone worker project.

88
REFERENCES
AHMAD, M.; HIRZ, M.; PICHLER, H.; SCHWAB, H. Protein expression in Pichia pastoris: recent achievements and perspectives for heterologous protein production. Applied Microbiology and Biotechnology, v98, n12, p.5301-5317. 2014 BALAMURUGAN, V.; REDDY, G.R.; SURYANARAYANA, V.V.S. Pichia pastoris: A notable heterologous expression system for the production of foreign proteins-Vaccines. Indian Journal of Biotechnology, v6, p.175-186. 2007. BENAVIDES, J.A. Avaliação dos peptídeos sintéticos SBbo23290 e SBm7462 na forma monovalente e polivalente em bovinos desafiados com Rhipicephalus (Boophilus) microplus (Canestrini, 1887) e Babesia bovis (Babes, 1888; Starcovici, 1893). 2006. 60 f. Tese (Mestrado) – Departamento de Veterinária, Universidade Federal de Viçosa, Viçosa, MG. CASTRO, C.C.M. Estudo experimental da resposta imune celular de bovinos vacinados com o peptide sintético SBbo23290 no controle da babesiose por Babesia bovis (Babes, 1888). 2005. 85 f. Tese (Mestrado) – Departamento de Veterinária, Universidade Federal de Viçosa, Viçosa, MG. DALY, R.; HEARN, M.T. Expression of heterologous proteins in Pichia pastoris: a useful experimental tool in protein engineering and production. Journal of Molecular Recognition, v18, n2, p.119-38. 2005. DARBY, R.A.; CARTWRIGHT, S.P.; DILWORTH, M.V.; BILL, R.M. Which yeast species shall I choose? Saccharomyces cerevisiae versus Pichia pastoris (review). Methods in Molecular Biology, v866, p.11-23. 2012 FICKERS, P. Pichia pastoris: a workhorse for recombinant protein production. Current Research in Microbiology and Biotechnology, v2, n3, 354-363. 2014. GASSER, B.; PRIELHOFER, R.; MARX, H.; MAURER, M.; NOCON, J.; STEIGER, M.; PUXBAUM, V.; SAUER, M.; MATTANOVICH, D. Pichia pastoris: protein production host and model organism for biomedical research. Future Microbiology, v8, n2, p.191-208. 2013 GIETZ, R.D.; WOODS, R.A. Genetic transformation of yeast. Biotechniques, v30, n4, p.816-831. 2001. GUSTAFSSON, C.; MINSHULL, J.; GOVINDARAJAN, S.; NESS, J.; VILLALOBOS, A.; WELCH, M. Engineering genes for predictable protein expression. Protein Expression and Purification, v83, n1, p. 37-46. 2012. HERNÁNDEZ-ORTIZ, B.A. Imunização experimental de bovinos com o peptide recombinante rBbo23290 para o controle de Babesia bovis (Babes, 1888, Starcovici, 1893): avaliação de parâmetros clínicos e imunológicos. 2014. 71 f. Tese (Mestrado) – Departamento de Veterinária, Universidade Federal de Viçosa, Viçosa, MG. JARDIM, L.F.B. Avaliacão da resposta imune em bovinos inoculados com o imunógeno sintético SBbo23290 e desafiados com amostra virulenta de Babesia bovis (Babes, 1888) Starcovici, 1893. 2005. 54 f. Tese (Mestrado) – Departamento de Veterinária, Universidade Federal de Viçosa, Viçosa, MG. KURTZMAN, C.P. Biotechnological strains of Komagataella (Pichia) pastoris are Komagataella phaffii as determined from multigene sequence analysis. Journal of Industrial Microbiology and Biotechnology, v36, n11, p.1435-1438. 2009

89
LOVE, K.R.; SHAH, K.A.; WHITTAgKER, C.A.; WU, J.; BARTLETT, M.C.; MA, D.; LEESON, R.L.; PRIEST, M.; BOROWSKY, J.; YOUNG, S.K.; LOVE, J.C. Comparative genomics and transcriptomics of Pichia pastoris. BMC (BioMed Central) Genomics, v17:550. 2016 LIN-CEREGHINO, J,; HASHIMOTO, M.D.; MOY, A.; CASTELO, J.; ORAZEM, C.C.; KUO, P.; XIONG, S.; GANDHI, V.; HATAE, C.T.; CHAN, A.; LIN-CEREGHINO, G.P. Direct selection of Pichia pastoris expression strains using new G418 resistance vectors. Yeast, v25, n4, p.293-299. 2008. LUCIANI, F.; BULL, R.A.; LLOYD, A.R. Next generation deep sequencing and vaccine design: today and tomorrow. Trends in Biotechnology, v30, n9, p.433-452. 2012. MACAULEY-PATRICK, S.; FAZENDA, M.L.; MCNEIL, B.; HARVEY, L.M. Heterologous protein production using the Pichia pastoris expression system. Yeast, v22, n4, p.249-270. 2005 MADDEN, K.; TOLSTORUKOV, I.; CREGG, J. Electroporation of Pichia pastoris. Chapter 8. In: Genetic Transformation Systems in Fungi, Volume 1. van den Berg, M.A.; Maruthachalam, K. (Eds.). Basel (Switzerland): Springer International Publishing. 2015, p.87-91. PATARROYO, J.H.; VARGAS, M.I.; FREITAS, C.M.; MACEDO, P.A.; PRATES, A.A.; PORTELA, R.W.; CAETANO, B.C. Mapeamento dos epítopos T-reativos sa proteína Bv 60 (RAP-1) de Babesia bovis. In: SEMINÁRIO BRASILEIRO DE PARASITOLOGIA VETERINÁRIA, XI, Salvador, 1999. Anais. Salvador: Colégio Brasileiro de Parasitologia Veterinária, 1999. p.197. POTVIN, G.; AHMAD, A.; ZHANG, Z. Bioprocess engineering aspects of heterologous protein production in Pichia pastoris: A review. Biochemical Engineering Journal, v64, p.91-105. 2012. REMS, L.; MIKLAVČIČ, D. Tutorial: Electroporation of cells in complex materials and tissue. Journal of Applied Physics, v119:201101. 2016 WEIDNER, M; TAUPP, M.; HALLAM, S.J. Expression of recombinant proteins in the methylotrophic yeast Pichia pastoris. Journal of Visualized Experiments (JoVE), n36, e1862. 2010. WELCH, M.; VILLALOBOS, A.; GUSTAFSSON, C.; MINSHULL, J. Designing genes for successful protein expression. Methods in Enzymology, v498, p.43-66. 2011. WU, S.; LETCHWORTH, G.J. High efficiency transformation by electroporation of Pichia pastoris pretreated with lithium acetate and dithiothreitol. Biotechniques, v36, n1, p.152-154. 2004.

90
3 CHAPTER III: BOVINE IMMUNE RESPONSE PRODUCED BY OMP7, OMP8,
AND OMP9 OUTER MEMBRANE PROTEINS FROM Anaplasma marginale
ST. MARIES STRAIN IN CONFINED EXPERIMENTAL IMMUNIZED STEERS
ABSTRACT
Anaplasma marginale outer membrane (OM) fractions delivered as a vaccine with
saponin protect cattle against homologous strain challenge. OM proteins (OMPs)
represent a low risk alternative compared with the live Anaplasma centrale vaccine.
Nevertheless, it is not clear which protein epitopes of A. marginale OM immunogen
complex induce a strong, protective humoral and cellular immune response. Recently,
several new antigens have been identified in the OM and are under consideration as
candidates for a potential multi-epitope vaccine. Among these, OMP7, OMP8, and
OMP9 are strain-conserved proteins shown to stimulate CD4 T cell recall responses in
several OM vaccinates. These three proteins are related and share several sequences
that are also conserved in the A. centrale vaccine strain single protein homologue
designated OMP7. We hypothesize that conserved sequences within this family of
proteins will contain CD4 T-cell epitopes, and could be protective against homologous
and heterologous A. marginale strain challenge. Using in vitro Antigen Presenting Cells
and T-cell proliferation assays to test recombinant A. marginale and A. centrale OMP7,
OMP8, and OMP9, and their overlapping peptides spanning each protein, conserved
immunogenic T-cell epitopes have been identified in two out of five animals for five
peptides (OMP7c_8, OMP7m_7, OMP8m_7, OMP8m_9, and OMP9m_7). High
background numbers in several cellular proliferation assays of all experimental animals
were observed. Operative issues during PBMC and TCL assays are discussed. Finally,
a proposal for mapping B- and T-cell epitopes for A. marginale is presented using a
different approach to get a vaccine candidate in a shorter time.

91
3.1 INTRODUCTION
3.1.1 Bovine anaplasmosis
Bovine anaplasmosis is a febrile disease caused by an obligatory intraerythrocytic
bacterium known as Anaplasma marginale (AUBRY AND GEALE, 2011). Stuen et al.
(2013) show five species for Anaplasma genus: A. marginale, A. bovis, A. ovis, A.
phagocytophilum, and A. platys. A less virulent strain of A. marginale, previously
recognized as a different species, has gotten a new taxonomy classification as A.
marginale subspecies centrale (AGNES et al., 2011).
This cattle disease is present in tropical and subtropical regions, becoming as a
production-limiting factor to livestock. As an infectious, non-contagious disease different
ways of transmission (mechanical –dipterans and fomites–, biological –ticks–, and
placental transfer) make easier a wide variability in its seroprevalence rates, devoting to
the setting-up of geographic, enzootic-stable regions (KOCAN et al., 2010; AUBRY AND
GEALE, 2011). If all A. marginale strains are infectious to or transmissible by ticks in
natural conditions remains as a matter of discussion (KOCAN et al., 2010).
Regardless of the animal age at infection, cattle will remain as persistently
infected individuals for long-life as they can develop the clinical disease (AUBRY AND
GEALE, 2011). Bovine anaplasmosis acute phase includes loss weight, fever, abortion,
a diminished milk production, and dead in some cases (KOCAN et al., 2008).
Tetracyclines and imidocarb have been used in the prophylaxis and treatment of bovine
clinical anaplasmosis, but they do not reliably eliminate persistent infection (Aubry &
Geale, 2011). Imidocarb treatment for A. marginale can have side effects (DOYLE et al.,
2016). In addition, available control measures against bovine anaplasmosis had
practical, technical, and economic limitations. However, vaccination appears to be an
economic, effective way for a partial control of bovine anaplasmosis. Because of the live

92
vaccines against A. marginale represent a potential biohazards to vaccinated animals,
higher storage cost, and lack of protection against heterologous strains, searching for
subunit vaccines, safer and relatively less expensive, make an alternative up for
developing a successful vaccine (AUBRY AND GEALE, 2011; KOCAN et al., 2010).
3.1.2 Bovine immune mechanisms against Anaplasma marginale
Exposed cattle, which recover from an A. marginale infection, develop immunity
against a homologous challenge. Nevertheless, those recovered animals remain as A.
marginale carriers and the reservoir for transmission by blood feeding vectors (TEBELE
et al., 1991).
After A. marginale acute infection (>109 infected red blood cells (iRBC)/mL), cattle
develop persistent infections, which are characterized by sequencial cycles of
rickettsemia (≥106 iRBC/mL) each five weeks, approximately. An acute rickettsemia is
controlled by a primary immune response (PALMER et al., 1999). However, antigenic
variants in the A. marginale outer membrane facilitate an emergency of persistent
infection. The last one will be controlled over time as specific immune responses against
those variants are developed (PALMER et al., 1999).
Bovine immune response against A. marginale is based on INF-γ expression by T
CD4+ lymphocytes, which increases opsonization IgG2 synthesis and, at the same time,
actives several functions in macrophages: receptors expression, phagocytosis,
phagolysosome fusion, and release of a bactericide Nitric Oxide (KOCAN et al., 2010).
Production of specific antibodies (opsonization IgG2) against major surface proteins
(MSP) epitopes in the A. marginale outer membrane is necessary to provide a specific
phagocytosis by activated macrophages (PALMER et al., 1999).

93
3.1.3 Vaccine research against Anaplasma marginale
Live vaccines are produced in splenectomized calves in order to facilitate a high
parasitemia and obtaining less pathogenic isolates. So, iRBC are inoculated in calves
starting a persistent infection, which produce a protective immunity for long-life. A.
marginale live vaccines have been developed with A. marginale and A. marginale
centrale strains (KOCAN et al., 2003). Killed vaccines consist of lyophilized antigens
made from hemolysed erythrocytes, which were infected with A. marginale. A
purification process is needed for reducing the erythrocyte stromal amount in the
vaccine and avoids a hemolytic anemia in the immunized animals (KOCAN et al., 2010).
Vantages and disadvantages of those kinds of vaccines are shown in the Table 24.
Table 24 – Vantages and disadvantage of A. marginale live and subunit vaccines. LIVE VACCINES SUBUNIT VACCINES
VANTAGES
- Long-life protection against clinical disease.
- Usually, revaccination is not required.
- Low risk of contamination with undesirable
infectious agents.
- Less expensive storage.
- Post-inoculation reactions have a minimal clinical
importance.
DISADVANTAGES
- Potential production of erythocytic isoantibodies,
which can cause hemolytic anemia.
- Transmission risk of other pathogens, which cause
persistent infections in cattle.
- Blood derived live vaccines should be restricted to
areas where they are produced.
- A. marginale attenuated vaccines could become
virulent after consecutive passes by cattle or ticks.
- High cost in purification of A. marginale from
erythrocytes.
- Dependence of live animals as source of antigen.
- Usually, provided protective immunity is lower.
- Requirement for booster immunizations.
- Difficulties in standardization.
- Lack of cross-protection against isolates from
widely geographic separated areas.
Source: Kocan et al. (2010, 2003); Aubry and Geale, (2011).
Evidence seems to appoint that some vaccines are more effective when they are
produced from local isolates (KOCAN et al., 2003). In addition, phylogenetic studies
have recognized more A. marginale genotypes in nature than it had been thought,
representing a serious limiting factor for a vaccine development that provides a cross-
protection (KOCAN et al., 2010). The development of new, effective vaccines against A.
marginale is going to face the ability to provide cross-protection against different
phenotypes, activation of specific immune responses in the host during natural

94
infections, or blocking of either bovine erythrocytes infection or tick intestinal epithelial
cells. In that way, a decodification of the concrete nature of the bovine immune
response, as well as the identification of the A. marginale associated key antigens
should be a priority in research for finding and choosing the best vaccine candidates
(KOCAN et al., 2010).
3.1.4 A. marginale outer membrane proteins as vaccine candidates
As it is known that A. marginale Outer Membrane (OM) proteins have the ability
to produce a protective immune response in cattle (lysis of initial bodies, blocking of
receptors, or antibody-mediated phagocytosis), immunizations with its outer membrane
fractions would induce a protective immunity. Probably, this could be due to exposed
polypeptides in its outer membrane surface (TEBELE et al., 1991).
Outer membrane fractions of the A. marginale Norton Zimbabwe strain initial
bodies were used to immunize cattle against homologous challenge. When they were
compared with the control group (non-immunized and adjuvant-immunized animals), it
was find a statistical significance for values of low anemia and low rickettsemia during
acute infection. A 31 kDa protein was identified by antigenic specificity of produced
antibodies in two fractions that were separated through different density grades. Also,
calves with antibody titers >103 against membrane antigens were completely protected
against rickettsemia (TEBELE et al., 1991).
The A. marginale outer membrane fraction is constituted by at least six surface
major polypeptides (MSP-1a, MSP-1b, MSP-2, MSP-3, MSP-4, & MSP-5). Thus, IgG2
antibodies production against epitopes of these proteins, particularly native purified
MSP-1 and MSP-2, induce protection against experimental challenge. However, A.
marginale MSP proteins can change their structure and antigenicity when different
strains are compared (BROWN et al., 1998).

95
Using MSP-1, MSP-2, and MSP-3 proteins from five A. marginale strains, with the
addition of one Anaplasma ovis strain, in the form of purified outer membrane antigens,
Brown et al. (1998) demonstrated a complete protection against the development of a
persistent infection in immunized animals after challenge. In addition, they identified
common epitopes, which are recognized by T cell, in the MSP-1, MSP-2, and MSP-3
proteins, as it was demonstrated by specific IgG antibodies production against those
MSPs. It represents a strong TH response.
Because none of the MSPs proteins, in the individual form, induce an immune
protection equivalent to immunogenic fractions of the A. marginale outer membrane,
identification of critical antigens, alone or in combination, from outer membrane proteins
(OMP) would make easier the understanding of the protective immunogenic complex
composition of the outer membrane (LOPEZ et al., 2005). In that sense, Lopez et al.
(2005) used immunological, proteomic, and genomic approaches and characterize 21
new proteins of the immunogenic complex of the A. marginale outer membrane.
The greatest breakthrough in this searching came from the complete sequenced
genome of the A. marginale St. Maries strain, which showed that the outer membrane is
dominated by two protein families containing immunodominant polypeptides: msp2 and
msp1 superfamilies (BRAYTON et al., 2005). Subsequently, using the High-throughput
technology and immunizations with a A. marginale outer membrane fraction in cattle,
which expressed different MHC-II haplotypes, new antigens were identified (OMP4,
OMP9, Elongation Factor-Tu, Ana29, and OMA87) that meaningfully stimulated a T
lymphocytes proliferation (LOPEZ et al., 2008).
Searching conserved proteins that provide protective immunity and potential
interaction between them, it was selected the Type IV secretion system (T4SS) of A.
marginale. So, proteins of this system were screened out according to the induction of
IgG and T CD4+ cells stimulation in immunized animals with A. marginale outer
membrane. Thus, VirB9-1, VirB9-2, and VirB10 proteins induced the greatest IgG
responses and T cells responses in the most of the experimental animals. Also, an

96
associated specific IgG production to T helper cells could depend on association with
partner proteins (MORSE et al., 2012a).
In that sense, VirB9-1, VirB9-2, and VirB10 proteins were tested for determining
the T cells immune response extension and the wider presentation of multiple peptide
epitopes to the MHC-II. Thus, Morse et al. (2012b) exposed overlap spanning peptides
of those proteins to antigen presenting cells (APC) from three different haplotypes of
experimental cattle. According to the haplotype, a different number of immunostimulant
peptides was presented in combination or exclusive form. So, a test of these proteins as
multiepitope vaccines would be justified.
Recently, several new antigens have been identified in the OM and are under
consideration as candidates for a potential multi-epitope vaccine. Among these new
antigens, OMP7, OMP8, and OMP9 are strain-conserved proteins that stimulate CD4+ T
cell recall responses in several OM vaccinates. These three proteins are related and
share several sequences that are also conserved in the A. centrale vaccine strain single
protein homologue designated OMP7. It has been hypothesized that conserved
sequences within this family of proteins will contain CD4+ T-cell epitopes, and could be
protective against homologous and heterologous A. marginale strain challenge. Using in
vitro T-cell proliferation assays to test recombinant A. marginale and A. centrale OMP7,
OMP8, and OMP9, and their overlapping peptides spanning each protein, conserved
immunogenic T-cell epitopes have been identified.

97
3.2 MATERIAL AND METHODS
3.2.1 Experimental animals
Five Holstein steers were kept under barn conditions and constant care of the
Veterinary College staff at Washington State University Animal Facilities (Image 29).
Some detailed information of each animal is shown in Table 25.
Image 29 – Experimental steers at WSU Animal Facility.
Table 25 – Main characteristics of the experimental animals. ID BREED AGE SEX ALLELES RFLP
48406 Holstein ≈ 1 year old Male *2703/*2703 23/23
48411 Holstein ≈ 1 year old Male *1201/*1501 8/16
48422 Holstein ≈ 1 year old Male *1201/*1201 8/8
48432 Holstein ≈ 1 year old Male *1101/*1402 22/27
48453 Holstein ≈ 1 year old Male *1501/*1501 16/16
BoLA DRB3* 1201 allele 222/266 83% to HLA DRB1*4.
The bovine lymphocyte antigen-DRB3 alleles of these five calves were
determined previously with a similar methodology used by Noh et al. (2008). All animals

98
were immunized and their bloods were used for cellular proliferation assays. No control
animals were selected as comparisons were done with media only. All animals were
challenge with A. marginale St. Maries strain, for a different experiment, a couple of
weeks before the last cellular proliferation assay.
3.2.2 Preparation of the immunogen and immunizations
The A. marginale OM prep was gotten according to Lopez et al., (2005) with
some modifications. A total of 23 tubes were placed under sonication and a total of eight
rounds were executed. At all times, temperature of the sonicator was kept low with iced
water circulating in it. Also, all tubes were kept on ice. Sucrose solutions were done in
10 mM HEPES pH 7.4. Dilutions were measured on refractometer (Milton Roy
Company®) in a series of three times for each dilution percentage.
After getting dilutions of sucrose solutions, a sample of the resuspended pellet is
collected and poured out in other tube. Then sets of layers of different dilutions of
sucrose solutions are added. This step must be done so precisely that it needs to be
carried out very slowly. The different layers for each sucrose solution must be
distinguishable. The retained proteins in each dilution were detected by electrophoresis.
3.2.3 Immunizations of experimental animals with OM prep
The formula for preparation of one dose for one animal was carried out as follow,
considering OM prep stock concentration was 0.1 mg/mL: 6 mg Saponin, 60 µg OM
prep (0.1 mg/mL), and 0.7 mL 1X PBS to 1.3 mL final volume. All experimental animals
were immunized four times with a subcutaneous injection around scapular region at 3-

99
week intervals (Oct-24-2014, Nov-14-2014, Dec-05-2014, and Dec-26-2014). Although
some of the animals experimented a kind of health disturbance during the experiment
(e.g., diarrhea or temporary lameness), it was considered irrelevant as no illness or
serious condition was diagnosed.
3.2.4 Selected outer membrane proteins and its peptides
Three proteins of A. marginale outer membrane immunogen complex were
selected because of their conserved sequences in order to identify CD4+ T-cell epitopes
that could be protective against A. marginale challenge. Also, the A. centrale strain
Israel OMP7 protein was chosen as positive control. Detailed information about these
three proteins is shown on Table 26.
Table 26 – Main features about A. marginale OMP7, OMP8, and OMP9 proteins, and A. centrale OMP7 protein.
ORGANISM STRAIN PROTEIN GENBANK* aa** SEQUENCE***
A. marginale St. Maries OMP7 ABB86360.1 355
MVRSFLLGAVVAGTIAFGSSAVAAGFGGDDTDFYLGFGLAPAFGSVADFYAEVPGA
ADSALPYRKDAIGGGETSPFDLDWEGSGTKGSKYPIKFQHSSPFGVVGSVGVRYST
GRLELEAVRERFPIMKVSGRAWTKGDSMFLLVDDAIVRLVTGQIDSDDPAAAALRALSSSTQYGELHNLADALSSEIGARTGQGDLKHVGASSVDALTATKLVAAALGHRHG
RRVAYPTAMKKRAMILLSAAARVKSADIVKKRSMILTALGRIGGYKIEIPAVAANTFGANYCYDVSTVNMGGLSPYGCVGIGMSFLKVAKTGTPRFTYGAKLGVSYELSPQA
SIFVDGAYRRVMEYKEQCR
A. marginale St. Maries OMP8 ABB86366.1 399
MVRSFLLSAVVVGAIAFGSSAVAAGFGGDDTDFYLGFGLAPAFGNVADFYAEVPGAADSALPYRKDAIGGGETSPFDFDWEESGTKGSKYPIKFQHNSLFGVVGSIGVRHST
GRLEFEAMRERFPIMKVSGRVWAKGDSMFLLVDDAVVRVATGQRGVNDSDSKTVKSLSKALPEHRDFLSLEDALLTARQDFMVQKGTLSYTGASTDDAAAAAKIVAMAYGRQ
FGKVDLTPERRRKAMLLLAAATAVGEEEREIVKRAHMIRAAFGSIGGHKIEIPAVA
ANTFGANYCYDVSTVNMGGLSPYGCVSAGMSFLKVVKNSVPKFTYGAKLGVSYELSPRARVFVGGAYRRVMGYGERCRVSTLSAASGYREYTERENIRARVSFGLHYLALEA
GLRFILA
A. marginale St. Maries OMP9 ABB86372.1 373
MVRSFLLSAVVAGALAFGSSAVAAGFGGDDTDFYLGFGLAPAFGDVADFYAEVPGAADSALPYRKDAVGSWETSPFDFDWEGSGTKGSKYPIKFQRRSLFGMVGSVGVRHSN
SRLEFEAACERFPVMKVSGRTWAKGDSIFLLVDDAVVRFATGQRSAGDTDNQAVKSLHDLTVEHADLDALFSALNTAIQQRKTAHREGGALTHTGTTREDALAATQIVARAW
GRKYGSGGLGAAETRRRAALLLAAAARVGAEEREIVEKAHMIGIALGGIGGYRIKI
PAVVANTFGANYCYDISTVNVRGLSPYGCVSIGMSFLKVAENSAPKFTYGAKLGVSYELSPRARVFVDGAYRRAVEYSERCRVSTLSAASDYS
A. centrale Israel OMP7 ACZ48862.1 404
MVVARSFLWGAIVAGAVFAFGSPAVAGGLGDSDTGFYLGFGLAPSFGGVSDFYAEVPGAADAALPYRKDAAGGGDTSPFDFDWMGAGASAGSKYPIKFQRSSLFGVMGNAGV
RYSASRLELEAVRERFPIWKVGGRTWTKGDSLFLLVDDAIVRLATGQSDHDDPAAK
ALRALYASDHEDFTSLVSELGSAVQTRTTQRAILAHTGASSVDTHTATRLVAAAFGRRYGRRSVDSVAMKQRAMLLLAAAAKVGVQERQQITKLSFIEAALSRIGGHKIEIP
AVVANTFGANYCYDISSASGWYGGFSPYGCIGVGMSFVRVTKNSTPRFTYGAKLGVSYDLSPQAKVFVGGAYRRVMDYSERCRVSTLSPSSGYSEYTEGENIRARLSFGLHY
LALEAGLRFVLA
*Accession number. **Number of amino acids. ***As it is deployed in FASTA in the GenBank.
In a previous work, overlapping peptides spanning for each protein were gotten.
As those peptides were found lyophilized, it was necessary to dilute them in 1X PBS +

100
10% DMSO in order to get a final concentration of 1 mg/mL. Later, a new dilution with
cRPMI was necessary to get a final concentration of 1 µg/20 µL for in vitro T-cell
proliferation assays. All lyophilized peptides (overlapping peptides spanning) were
weighed on a four digits scale (Mettler AE 100 Analytical Balance). Twenty vials, series
number 1 to 20, were available for each OMP7m, OPM8m, OMP9m, and OMP7c. So, a
total of 80 peptides were used. Most of these lyophilized peptides were diluted at 1
mg/mL using 10% 1X PBS, 10% DMSO, and 80% sterile ddH2O.
In order to get a final concentration of 1 µg/20 µL for each peptide, a new dilution
were done as follow: 30 µL each peptide plus 570 µL cRPMI to a 600 µL final
concentration. Two peptides (OMP7c_9 and OMP8m_12) were found with a rehydrated
pellet. These two peptides were diluted as follows: 3 µL each peptide plus 597 µL
cRPMI to a 600 µL final concentration. All peptides were put on the mixer (Vortex)
before taking the sample. Later, all peptide dilutions (1 µg/20 µL) were labeled and
stored at -20ºC. In a similar way, the A. marginale OMP7, OMP8, and OMP9
recombinant proteins were diluted for T-cell proliferation assays, too.
At least, a final volume of 400 µL of these dilutions was done for three times
during the proliferation assays. A number of new volumes for controls were gotten, too.
As the total volume of rOMP2 was found to be not enough for several proliferation
assays, it was decided to use a duplicate of this protein instead of a triplicate. Because
rOMP2 was run out after some assays it was replaced by rMSA1 (Babesia bovis
Merozoite Surface Antigen 1 – recombinant form). So, it means that rOMP2 was used as
a negative control for some assays, while for remained assays rMSA1 was used. Those
proteins were never used simultaneously. Finally, uninfected red blood cells (uRBC),
from stock, were used as negative control to dismiss any cell response to remained
proteins of the erythrocyte membrane.
A. marginale St. Maries strain outer membrane preparation (OM prep), T-cell
growth factor (TCGF), and Clostridium sp. were used as positive controls. OM prep is
the immunogen complex of the A. marginale outer membrane that contains the three

101
selected proteins. TCGF stimulates lymphocytes to grow and divide, in that way,
verifying the responsiveness of the cells. Lastly, experimental animals were previously
vaccinated against Clostridium sp. checking the responsiveness of the cells to a known
antigen.
3.2.5 PBMC (peripheric blood mononuclear cells) isolation
New complete RPMI (cRPMI) was prepared when the old one was almost run
out. In order to avoid a thermal shock of the cells, cRPMI was taken out of the fridge and
placed on Water Bath (37ºC) for 15 minutes, at least. Sometimes, it was enough to let
cRPMI under room temperature (~ 26ºC) for 1 hour, at least, to get a temperature less
than cold when touched with hands (about 18ºC). Also, one bottle of 1 L Hank’s
Balanced Salt Solution (HBSS (1X), Gibco®) was combined with 4 mL 0.5 M EDTA
(Invitrogen®) and kept under ~ 4ºC. Ficoll (Histopaque® - 1077, Sigma) was store in the
fridge, too.
Before starting PBMC isolation (Appendix O), HBSS with EDTA, as well as Ficoll,
were taken out and let at room temperature for about one hour until getting a
temperature less than cold when touched with hands (about 18ºC). When it wasn’t
enough time, they were placed on Water Bath (37ºC) for 15 minutes, at least. Also, it
was used 50 mL conical-bottom, sterile tubes (VWR® High-Performance centrifuge
tubes with flat caps, Polypropylene) for centrifugation of blood and PBMC isolation.
None of these tubes were reused and all of them were dismissed.
Alseviers (see Appendix O) was kept on ice during its use under fume hood at
almost all times. Alseviers was used for washing PBMC until get a clear supernatant.
During those washes, sometimes ACK lysis solution (see Appendix O) was used for
ridding out remained erythrocytes. About 2 mL were used for the PBMC pellet for 20
seconds before adding Alseviers and centrifuge (Appendix O). However, sometimes

102
about 2 minutes proven be more effective as 20 seconds weren’t enough, demanding a
second or a third ACK lysis solution addition. PBMC isolation was done under fume
hood at all times. Sometimes, more than one experimental animal sample was used. In
all cases, a strict labeling was carried out for every single 50 mL tube until getting PBMC
for experimental, individual animal. Likewise, lab coat and gloves were used at all times,
as well as an absorbent paper towel covering the work area inside the fume hood.
3.2.6 Cellular proliferation assays
After the third OM prep vaccination, a PBMC proliferation assay for all
experimental animals was carried out in order to check if they had responsed to the A.
marginale outer membrane immunogen complex (see Figure 6). Several controls were
used for this assay (see datails on Section 3.2.6).
Figure 6 – Drawing of the immunizations showing the OM prep assay.
Fresh PBMC was isolated according to the protocol in Appendix O. Using one
triplicate for every antigen dilution, as well as their controls and a few extra wells, a total

103
of 25 wells per animal were setting up in two 96-well plates. An electronic sequential
dispensing pipette was used to apply 90 µL of Media solution per well (2x10⁵ PBMC).
Pulsing and harvesting followed the available protocols at WSU. The details for this
assay are found in Section 3.2.6.
Later, several PBMC proliferation assays were carried out for A. marginale
OMP7, OPM8, and OPM9 recombinant proteins (see figures 7 and 8). For details see
Section 3.2.6. It was considered to run several or even all animal at the same time for all
cellular proliferation assays. Nevertheless, a sort of drawbacks prevented to do this, like
the ficoll step during PBMC isolation (Appendix O) taking about one hour when it was
collected 500 mL blood from just one animal.
Figure 7 – PBMC assays using recombinant proteins for each experimental animal.
Animals in brown had mostly bad results. Animals in green had mostly good results. Circled numbers represent the ordinal position date of each assay for each animal. Green circles represent good results, yellow circles represent barely acceptable results, and red circles represent bad results. The lightning symbol represent the biological challenge of the experimental animals with a A. marginale virulent strain for other experiment. The house symbol represent the end of the internship.
In the same way, sketchs for all T-cell line proliferation assays to map T-
lymphocytes epitopes of cattle to all-overlapping peptides spanning of A. marginale St.
Maries strain OMP7, OMP8 and OMP9 proteins, is shown in figures 9 and 10.

104
Figure 8 – A general drawing for a PBMC proliferation assay to the A. marginale OMP7, OMP8, and OMP9 whole recombinant proteins.
Figure 9 – T-cell line assays with all overlapping peptides spanning for each animal. Conventions are identical to Figure 7.

105
Figure 10 – A general drawing for mapping T-cell epitopes to all-overlapping peptides spanning of A. marginale OMP7, OMP8, and OMP9 proteins.
In addition, getting unfrozen, washed, ficolled irradiated PBMC to the required
amount for T-cell proliferation assay (figure 8 and 10) took about three hours, and if the
amount wasn’t enough, getting new viable irradiated PBMC from frozen stock took other
three hours. A simultaneous way could bring up confusion during calculations, as well as
it would delay the process for some already samples. So, it made so difficult to run
several animals at a time.
Some of the last proliferation assays got 6 days for resting and for T-cell line,
instead of 7 days, because of a protocol for PBMC proliferation assay pointed out that

106
“culture for assay for 6 days” was enough (see Section 3.2.7). As a last observation,
viability of frozen irradiated PBMC was decreased in half or less after thaw. Because of
a lot of dead cells in the hemocytometer, often ficolling the irradiated PBMC pellet was
necessary to ridding out the dead cells. Keeping the Mr. Frosty inside a fridge (4ºC)
before placing the vials and then put the vials inside it and stored it in a freezer (-20ºC)
for one or two hours before bring it to the ultrafreezer (-80ºC) seemed to work about
reducing the quantity of dead cells.
3.2.7 Recombinant proteins as antigens
A triplicate, in tissue culture plate (96-well plate round bottom with lid, Sarstedt®),
was carried out for every recombinant protein, as well as for their controls. All plates
were new and sterile at the very moment of using, and they were dismissed after finish
the proliferation assay. All PBMC proliferation assays were repeated several times for
almost all of the experimental animals in order to get the most reliable results. Also, the
final concentration of antigens per well was 1 and 10 µg. Mostly, antigens were placed
on the 96-well plate a day before addition of PBMC, as a way to save time. Those plates
with antigens were labeled and stored in the fridge (4ºC) and their sides were enveloped
with Parafilm (“M”® Laboratory Film, American National CanTM) to avoid evaporation.
PBMC solution per well for recombinant proteins consisted of 2x10⁵ PBMC and
80 µL Medium. It has to be noted that PBMC proliferation assays were made with fresh
blood in all cases. Following the placing of PBMC, the plate was put inside a plastic
container together with a 50 mL tissue culture flask with ddH2O for humidity
requirements, and a cap was put over it loosely. Then, the container was placed inside a
CO2 incubator (Thermo® Forma Series II Water Jacketed CO2 incubator HEPA 100) at
37ºC with 5.0% CO2.

107
After six days in the CO2 incubator (see Figure 8), the plate was taken out and
pulse with 3H-Thymidine (Perkin Elmer® [Methyl-3H]-Thymidine, 2Ci(74.0GBq)/mMole,
>97%, 250µCi (9.25 MBq)) at 0.25 µCi (25 µL)/well. It was done under a specific fume
hood for working with radioactive materials. 3H-Thymidine was stored in a mini
refrigerator at side of the fume hood. An electronic sequential dispensing pipette
(Rainin® EDP3 Plus single channel LTS for volumes up to 1000 µL) was used for
applying 3H-Thymidine. Harvesting of pulsed cells was done about 18 hour after pulsing
at all times for consistency, although the protocol noted a period between 6-18 hours.
The disposal of radioactive waste was carried out according to WSU protocols. The
results of each well (counts per minute of ionizing radiation) were saved as a Microsoft
Excel file. Later, the same software was used to run a statistical analysis.
In order to look for potential radioactive spills or splashes of 3H-Thymidine, after
working on the fume hood and surrounding area, a swipe survey was carried out. The
swipe survey followed the Laboratory Monitoring Guide of the Radiation Protection
Program Manual (Radiation Safety Office, Washington State University). A swipe
sample (also known as smears, swipes, and swabs) is use to estimate the levels of
removable contamination while scans static measurements with survey instruments to
locate and quantify the total surface contamination. If the total contamination, as
measured by a survey instrument, is below the limit/investigation level for removable
activity, it might be no necessary to evaluate the latter (FRAME AND ABELQUIST,
1999). A swipe (small cotton or filter paper disk) is used to wipe over an area (usually
over 100 cm2) piking up potentially contaminating debris (contenting alpha and beta
radiation levels typically) that is counted in the swipe counter (BYRNES, 2000).
3.2.8 Overlapping peptides spanning as antigens
As shown in Figure 10, a T-cell line for exposing to overlapping peptides
spanning in searching of T-cell epitopes was settle. In the first week, a fresh PBMC was

108
gotten in order to expose it to OM prep for seven days, using 4x10⁶ PBMC/well, 1.5 mL
Medium/well, 1 µg/mL OM prep, and two 24-well plates. These 24-well plates were
stored in CO2 incubator for seven days (Figure 10).
Later, on day 7, the content of each well for one 24-well plate is taken and poured
in a 50 mL tube. As a way to increase the recovery of OM prep stimulated cells,
additional 0.5 mL of cRPMI were pouren into each well and then sucking up with a 10
mL serum pipette. Recovery solution was poured into the 50 mL tube. Thus, two
centrifugations (each 250 x g x 10 min at 10ºC) were done to ridding out the antigen
(OM prep). Then, the T-cell line was let resting for seven days together with irradiated
PBMC (Figure 10).
For the resting assay 7x10⁵ 1-week T-cell/well, 2x10⁵ irrPBMC/well, and 1.5 mL
Medium/well were used. It has to be noted that T-cell proliferation assays were made
with fresh PBMC for the first week (Figure 10) in all cases. However, for third week
sometimes frozen irradiated PBMC was used, as it was available. In those cases,
sometimes it was impossible to get the required irradiated PBMC total amount for those
assays from available frozen irradiated PBMC vials. When it happened, it was decided
to adjust the available number of T-cells and irradiated PBMC, otherwise whatever
available number was used for those assays.
Once seven days were completed for T-cell line in resting (2-week T-cell line), the
content of each 24-well plate was collected in a similar manner as described for
completed OM prep stimulation assay. Also, fresh PBMC was isolated and about a half
of PBMC pellet was used to irradiation, exposing it to 67Cobalt for 6 minutes and 45
seconds. In that way, that PBMC pellet should have received 3,000 rads to abolish the
participation of B-cells as Antigen Presenting Cells (APC) (KRUISBEEK et al., 2004).
With rested T-cell line, a triplicate, in tissue culture plate (96-well plate round
bottom with lid, Sarstedt®), was carried out for every overlapping spanning peptide, as
well as for their controls. It demanded three 96-well plates for 20 peptides of each
recombinant protein. All plates were new and sterile at the very moment of using, and

109
they were dismissed after finish the proliferation assay. In general, placing antigens on
the 96-well plate was done a day before addition of T-cell line, as a way to save time.
Those plates with antigens were labeled and stored in the fridge (4ºC) and their sides
were enveloped with Parafilm (“M”® Laboratory Film, American National CanTM) to avoid
evaporation. The requirements for T-cell line solution were 3x10⁴ 2-week T-cell line,
2x10⁵ irrPBMC/well, 80 µL Medium/well, and 1 µg/mL of each peptide/well. Storage in
CO2 incubator was done in a similar way of PBMC proliferation assay.
After three days in the CO2 incubator (see Figure 10), the plate was taken out and
pulse with 3H-Thymidine at 0.25 µCi (25 µL)/well. Harvesting of pulsed cells was done
about 18 hour after pulsing at all times for consistency. The disposal of radioactive
waste was carried out according to WSU protocols. The results of each well (counts per
minute of ionizing radiation) were saved as a Microsoft Excel file. Later, the same
software was used to run a statistical analysis. These proliferation assays were repeated
several times in order to get the most reliable results.
3.2.9 Statistical analysis
A statistic analysis was carried out with the triplicates of every recombinant
protein, and its controls, as well for every overlapping peptide spanning, and its controls,
for PBMC and T-cell line proliferation assays, respectively. Also, a stimulation index of
every antigen, as compared with absolute negative control, was obtained. Finally, a T-
test was employed for detecting statistical significance of those averages. Statistics
were: the average (arithmetic mean) of the counts per minute (CPM) of ionizing
radiation; Standard Deviation (SD) of the average; Stimulation Index (SI) representing
the quoting between every antigen CPM average and the CPM average of the negative
control (unexposed cells); and a t-test in order to detect if every antigen CPM average
and the control CPM average were significantly different form each other.

110
Those statistics were run in Excel, specifically with the same Excel file gotten
from the Beta Scintillation Machine for counts per minute of ionizing radiation by 3H-
Thymidine present in pulsed cells. Statistical significance wasn’t the only one criterion
for pointing out a good stimulation of cells, as the absolute value of every well was
revised for evaluating antigens performance. Nevertheless, statistical significance was
the criterion to repeat several times cellular proliferation assays, as a way of getting the
most reliable results (low value of standard deviation, particularly of absolute negative
control, as well as higher stimulation index and statistical significance).

111
3.3 RESULTS AND DISCUSSION
3.3.1 OM Prep assay for all animals
PBMC proliferation assay counts per minute (CPM) with OM prep stimulation for
all animals, after the third immunization, are summarized on Table 27.
Table 27 – CPM statistics of PBMC proliferation assay for all steers (Dec/16/14). 48406 48411 48422
CPMx (SD) SI (α=5%) CPMx (SD) SI (α=5%) CPMx (SD) SI (α=5%)
Cells only 24380 (5845) 1 (N/A)* 2024 (2916) 1 (N/A) 559 (159) 1 (N/A)
OM prep 10µg/mL 10275 (702) 0.42 (P<0.05) 28239 (5415) 13.95 (P<0.00) 4320 (1212) 7.73 (P<0.05)
OM prep 1µg/mL 16353 (1117) 0.67 (P>0.05) 30205 (1809) 14.92 (P<0.00) 6867 (1905) 12.28 (P<0.05)
48432 48453
CPMx (SD) SI (α=5%) CPMx (SD) SI (α=5%)
Cells only 127 (40) 1 (N/A) 1476 (640) 1 (N/A)
OM prep 10µg/mL 8325 (735) 65.55 (P<0.05) 9359 (1390) 6.34 (P<0.00)
OM prep 1µg/mL 7166 (863) 56.42 (P<0.00) 12723 (2767) 8.62 (P<0.00)
N/A = Not applicable
In general, when comparing absolute values of every well, all animal PBMCs
were responsiveness to OM prep. However, animal 48406 had the worst background as
absolute negative control (cells only). So, 48406 performance wasn’t good at all. In
contrast, animals 48422, 48432, and 48453 had the best results with cells only and OM
prep dilutions, as their standard deviations (SD) were lower. That said, 48432 had the
highest SI for both OM prep dilutions. Because of that, animal 48432 was considered at
that moment as the one with the best relative responsiveness to OM prep.
Animals 48422 and 48453 had good OM prep stimulation with a relative low SD.
Animal 48411 had a SD higher than absolute negative control making obscure any
comparison. This animal got the best absolute cellular proliferation for both OM prep
dilutions.

112
3.3.2 Recombinant proteins PBMC assays for each animal
In order to focus the attention on relevant results, a selection of the most
representative assay for each animal is presented on Table 28.
Table 28 – Selected PBMC assays of each animal with rOMPs. 48406 (Mar/31/15) 48411 (May/19/15) 48422 (May/19/15)
CPMx (SD) SI (α=5%) CPMx (SD) SI (α=5%) CPMx (SD) SI (α=5%)
Media only 8955.7 (4617.0) 1 (N/A)* 130.2 (98.7) 1 (N/A) 419.8 (888.7) 1 (N/A)
rOMP7 10µg/mL 14566.3 (8599.7) 1.63 (P>0.05) 10438.7 (1984.8) 80.2 (P<0.01) 6219.0 (2374.9) 14.81 (P<0.05)
1µg/mL 3791.7 (1658.8) 0.42 (P>0.05) 2059.3 (2377.6) 15.8 (P>0.05) 6406.3 (3955.0) 15.26 (P>0.05)
rOMP8 10µg/mL 11317.7 (3005.6) 1.26 (P>0.05) 11489.3 (742.7) 88.3 (P<0.00) 8111.0 (943.2) 19.32 (P<0.00)
1µg/mL 10049.0 (4949.4) 1.12 (P>0.05) 6114.7 (2508.9) 47.0 (P<0.05) 5310.7 (4026.4) 12.65 (P>0.05)
rOMP9 10µg/mL 6902.3 (8106.3) 0.77 (P>0.05) 4419.7 (2157.1) 34.0 (P<0.05) 3144.0 (1056.2) 7.49 (P<0.05)
1µg/mL 3660.7 (3620.4) 0.41 (P>0.05) 2286.0 (1992.8) 17.6 (P>0.05) 3441.7 (1782.7) 8.20 (P<0.05)
48432 (Jun/02/15) 48453 (Apr/21/15)
CPMx (SD) SI (α=5%) CPMx (SD) SI (α=5%)
Media only 106.0 (14.4) 1 (N/A) 1030.7 (650.5) 1 (N/A)
rOMP7 10µg/mL 7487.0 (3577.5) 70.63 (P<0.05) 20040.0 (1068.9) 19.44 (P<0.00)
1µg/mL 599.7 (474.1) 5.66 (P>0.05) 6921.3 (1562.0) 6.72 (P<0.01)
rOMP8 10µg/mL 14865.0 (2439.8) 140.24 (P<0.00) 13828.3 (1036.1) 13.42 (P<0.00)
1µg/mL 6676.7 (433.9) 62.99 (P<0.00) 13300.0 (1324.8) 12.90 (P<0.00)
rOMP9 10µg/mL 5166.0 (7243.2) 48.74 (P>0.05) 15729.7 (2352.2) 15.26 (P<0.00)
1µg/mL 249.7 (192.7) 2.36 (P>0.05) 9496.7 (1207.6) 9.21 (P<0.00)
*N/A = Not applicable.
3.3.2.1 Animal 48406
This animal had a very high CPM background values (media only) in the PBMC
proliferation assay with OM prep for all animals at the same time (Table 27). Because of
that condition, it was considered to be the last animal for testing in the experiment. As
shown on Table 28 a high background persists, as expected according with the previous
PBMC assay results (Table 27). However, two shot of 3H-Thymidine solution were
placed during pulsing on two blank, free-antigen wells (B6 and B9), by mistake. As blank
wells, their CPM values would suppose to be low (less than 100), but they were around
two thousand (data not shown) showing a potential contamination of 3H-Thymidine

113
solution. As a consequence, this and other assays (data not shown) could have had
masked their real results. However, no bacterial or fungal growing was detected after
taking a sample of that 3H-Thymidine solution, placing about 80 µL/well in two wells of a
96-well plate, and keeping it inside a CO2 incubator for 24 hours.
According to statistics deployed on Table 28, media only got a bad SD. It means
a value higher than 50% of the average CPM making it useless for comparisons. In the
same way, all targeted recombinant proteins, as well as their negative controls, had bad
SD. OM recombinant proteins were poor proliferative. In fact, rOMP7 (1 µg/mL) and
rOMP9 (both concentrations) got a SI less than 1 meaning that they were less
proliferative than the absolute negative control. In contrast, OM prep (1 µg/mL) had good
statistics. However, they were weakly proliferative with OM prep getting just over 5 times
a SI (P<0.0005). Those results were disappointing, although they were expected.
3.3.2.2 Animal 48411
Table 28 shows a SI from several to tens for every recombinant protein. However,
only two of them reached a statistical significance (P<0.01) and with a SI over 80 times.
Those proteins were rOMP7 10 µg/mL and rOMP8 10 µg/mL, which got a low SD. In
contrast, the remained recombinant proteins had bad SD, as well as the negative control
(media only). This disparity between proteins, even between controls, in the same plate
assay was a constant.
3.3.2.3 Animal 48422
Table 28 presents a really bad SD for media only, as it is twice higher than
average CPM. It is because just one well got about 20 times the media of remained
wells (data not shown). Without that outstanding value, statistics for media only are
really great, but as there is no a conclusive explanation for that value, as well a
consistent high variation inside triplets in the same assay, it was considered to present
raw information as faithful to the reality as possible.

114
In that way, OM prep (1 µg/mL) got almost 50 times a SI with a low SD. However,
all recombinant target proteins got a moderate APC response. In fact, just four of these
proteins showed a P<0.05 with a SI between 7.5 and 14.8, but its SD are dangerously
high. Only rOMP8 10 µg/mL got a low SD.
3.3.2.4 Animal 48432
Results of this PBMC proliferation assay (Table 28) were a kind of letdown. Low
CPM values were gotten for media only, with a very low SD, the same cannot be said for
all the targeted recombinant proteins. The rOMP7 and rOMP9, in both concentrations,
had bad SD. So, only rOMP8, in both concentrations, had good statistics and a P<0.005.
It is remarkable the high SI for both concentrations of rOMP8 (Table 30).
In general, targeted recombinant proteins showed a good SI at 10 µg/mL. In
contrast, at 1 µg/mL only rOMP8 got a good APC stimulation. It has to be warned that a
challenge with A. marginale virulent strain, as a part of other experiment, was done with
all experimental steers on May 20th, 2015. It supposes to not affect immediately the
immune response, so it is improbable an interference of this event. Also, this assay was
my last participation as the experiment was considered finished at that moment.
3.3.2.5 Animal 48453
Looking at the Table 28, media only had relative low CPM values, if they are
compared with previous assays (data not shown), but its SD was too high. In contrast, at
10 µg/mL, all targeted recombinant proteins were moderately proliferative (SI between
13.4 and 19.4; P<0.005), while at 1 µg/mL only rOMP8 was moderately proliferative with
a SI of 12.9 (Table 1.16). It seems confusing that OM prep was weakly proliferative while
it was surpassed by APC response to recombinant proteins (data not shown). In fact,
this was the first assay with such an observation until this point of the experiment.

115
3.3.3 T-cell line assays with every peptide for each animal
In order to focus the attention on relevant results, a selection of the most
representative assay for each animal is presented on Table 29.
Table 29 – Selected T-cell line assays with overlapping peptides spanning. 48406 (Apr/07/15) 48432 (May/04/15) 48453 (Apr/25/15)
CPMx (SD) SI (α=5%) CPMx (SD) SI (α=5%) CPMx (SD) SI (α=5%)
Media only 14508 (2189.8) 1 (N/A)* 1087.7 (213.0) 1 (N/A) 1961.5 (333.4) 1 (N/A)
10% TCGF 47704.3 (2189.8) 3.29 (P<0.00) 38270.0 (483.3) 35.19 (P<0.00) 44984.7 (442.6) 22.93 (P<0.00)
OM prep (1µg/mL) 48914.3 (2812.7) 3.37 (P<0.00) 52457.7 (1752.9) 48.23 (P<0.00) 54241.3 (373.5) 27.65 (P<0.00)
None (N/A) >1.4 (N/A) >3.5 (N/A) >9.0
48411 (May/19/15) 48422 (Feb/14/15)
CPMx (SD) SI (α=5%) CPMx (SD) SI (α=5%)
Media only 274.7 (114.7) 1 (N/A) 199 (66) 1 (N/A)
10% TCGF 32790.7 (1219.7) 119.38 (P<0.00) 55224 (4365) 278.20 (P<0.00)
OM prep (1µg/mL) 41281.0 (564.8) 150.29 (P<0.00) 52482 (670) 264.39 (P<0.00)
OMP7c_8 17516.0 (4251.0) 63.77 (P<0.01) 26456 (5464) 133.28 (P<0.01)
OMP7m_7 11439.7 (5118.5) 41.65 (P<0.05) 22770 (2981) 114.71 (P<0.00)
OMP8m_7 5911.3 (1544.4) 21.52 (P<0.05) 24466 (5211) 123.25 (P<0.05)
OMP8m_9 12384.0 (1293.2) 45.09 (P<0.00) 39079 (5417) 196.87 (P<0.05)
OMP9m_7 10746.7 (2853.0) 39.13 (P<0.05) 26150 (689) 131.74 (P<0.01)
OMP9m_11 8364.0 (744.2) 30.45 (P<0.00) 14335 (6176) 72.22 (P<0.05)
*N/A = Not applicable.
3.3.3.1 Animal 48406
Table 29 shows a TCL proliferation assay with high background values, an
expected result, as it was the only animal with previous findings of high background
values (see tables 27 and 28). The highest SI for peptides was 1.37 and a lot of them
got a SI less than 1 (Table 29). From the beginning, animal 48406 was not considered a
good responder because of its high background values.
3.3.3.2 Animal 48411

116
One out of six wells for media only had a CPM value about three times less as
compared with the others. Because of that, media only got a high SD, but its CPM
values fit into the expected range. So, according to Table 29, OM prep (1 µg/mL) had
over 150 times a SI (P<0.0001). So, 12 peptides got a statistical significance (P<0.05)
with SI between 6 and 63 (data not shown). Interesting, these peptides were the same
that got relevance in the previous TCL assay (data not shown). In that way, the same
five peptides (OMP7c_8, OMP7m_7, OMP8m_7, OMP8m_9, and OMP9m_9) got a SI
between 21 and 63. It really could represent a shared immunogen, conserved sequence
those four proteins for a good T-cell stimulation in this animal.
3.3.3.3 Animal 48422
The TCL assay showed a great statistics for controls with OM prep (1 µg/mL)
getting over 260 times a SI. Six peptides (OMP7c_8, OMP7m_7, OMP8m_7,
OMP8m_9, OMP9m_7, and OMP9m_11) reached a statistical significance (P<0.05) with
a SI between 72 and 196, and relative low SD (Table 29). Four of these peptides got a
similar response with last TCL assay for animal 48411. It reinforces the evidence of an
immunogenic, conserved sequence amid those proteins, still with not so good SD.
These results were considered very encourage at the moment, and animal 48422 was
thought to be a positive responder.
3.3.3.4 Animal 48432
Positive controls got lows SD with statistical significance (P<0.0005). OM prep (1
µg/mL) had 48 times a SI and 13 CPM units higher than 10% TCGF. Notwithstanding,
the highest SI value of peptides was just over 3.5, with ten peptides getting statistical
significance (P<0.05), but none of them got the highest SI value.
3.3.3.5 Animal 48453

117
CPM values for media only weren’t as low as expected, but they weren’t too high
at all. So, as average CPM were almost two thousand with a low SI, it is appropriate for
doing comparisons with antigens in the assay. In that way, positive controls got good
statistics with OM prep (1 µg/mL) having over 27 times a SI (P<0.0000). However, most
of the peptides got a SI under 2 times with rOMP9_10 getting a SI of about 9 times
(P<0.01) and rOMP9_8 with a SI of 2.55 (P>0.05). As it was the second TCL assay in a
row for 48453 with a bad proliferative response, a new TCL assay were planned.
3.3.4 Cellular proliferation assays in other studies
A PBMC assay was made for all experimental animals in order to test their
response to the fraction of the A. marginale St. Maries strain Outer Membrane (OM). It
showed good results as four out of five animals had APC stimulation with statistical
significance. This assay was started on December 10th 2015, after the third
immunization with a homologous OM fraction and harvested on December 16th 2015.
Before starting the experiment, no lymphocyte proliferation assay with PBMC was
made, where A. marginale OM prep and its recombinant proteins could be compared in
order to dismiss naïve responsiveness animals, as done by Zhang et al. (2003).
However, WSU personnel tested experimental animals, performing a baseline analysis
(seronegativity for A. marginale) before starting the experiment. Besides, those animals
were born and raised in confinement in a non-endemic region.
According to Abbott et al. (2004), it was verified that A. marginale-specific INF-γ-
secreting cells are predominantly CD4+ T lymphocytes. Because of that a T-cell line
proliferation assay would facilitate the multiplication of those cells. However, there have
been reports of PBMC cultured with A. marginale develop into long-term cell lines
containing more than 90% WC1+ γδ T-cells (LAHMERS et al., 2005). In fact, it is known
that some factors like irradiation, fixation, or intracellular infection in an autologous

118
mixed lymphocyte reaction could alter APC, physically or chemically, stimulating WC1+
γδ T-cells to grow (TUO et al., 1999).
Following these lines, the high CPM values in background in PBMC and TCL
assays could be explained as a probable high population of WC1+ γδ T-cells, usually
about 40-70% in circulating peripheral blood lymphocytes in young calves (PLATTNER
AND HOSTETTER, 2011; MCGILL et al., 2014), getting self-reactive in those wells with
media only. Tuo et al. (1999) deployed a three-color flow cytometric analysis of the
expansion of CD6+ CD8+ γδ T-cells (from five calves) by IL-2 and IFN-τ comparing with
fresh PBMC and medium alone. Interesting, they showed that WC1+ γδ T-cells grew
over 20% with medium alone being the highest proportion for these cells in those
cultures.
Nevertheless, Lahmers et al. (2005) only found that WC1+ γδ T-cells did
proliferate and produce INF-γ following stimulation with APC and A. marginale MSP2,
but not with APC and medium alone. Perhaps, T-cell proliferation in mixed lymphocyte
cultures should require a depletion of T-cell subpopulations (like WC1+ γδ T-cells) as a
way to avoid responder T-cells in the stimulator cell population (KRUISBEEK et al.,
2004). However, a depletion of a γδ T-cell population with monoclonal antibodies was
considered too expensive at the time of our experiment.
Although several factors were considered, including 3H-Thymidine solution
contamination and human error, for explaining those background numbers with medium
alone or uRBC in some PBMC and TCL assays of all experimental animals, no
conclusive evidence could be obtained. From a different approach, without forgetting a
potential involvement of several factors, a statistical management of the data could offer
a new perspective.
In a previous work (Zhang et al. 2003), a response of culture cells was considered
positive if the SI>3.0 and CPM>1000. Kruisbeek et al. (2004) consider ΔCPM (difference
in CPM) a rather preferred parameter than SI values, as small changes in background

119
values will result in large changes in SI and should be interpreted with caution. In that
way, background responses are considered as additive rather than synergistic when
obtaining a ΔCPM (BENNETT AND RILEY, 1992). Also, based on the ratio of counts, SI
was chosen for our experiment because an individual with high background count is
more likely to be classed as a responder if ΔCPM is used rather than SI (BENNETT
AND RILEY, 1992).
By other hand, in our experiment, it seems that raw counts within several
individuals replicate readings (background and antigens), in different PBMC and TCL
assays, as well as in different experimental animals, were not normally distributed, as
high SD were often found. Notwithstanding, none normality distribution test was made.
According to Bennett and Riley (1992), a logarithmic transformation could produce
something very like a standard normal distribution with such a transformation stabilizing
the variance. In that way, test of mean response should be based on the log(SI) rather
than on the raw SI, otherwise the use of a t-test to compare the mean SI would not be
valid (BENNETT AND RILEY, 1992).
However, none mathematic transformation was carried out as no conclusive
explanation was gotten for background numbers considering different factors. That said
and ignoring the human factor and operative issues, cellular immune responses were
induced in all calves immunized to the A. marginale St. Maries strain OM prep. It is not
surprising as it has been reported immunogenicity to A. marginale Outer Membrane
fractions (Tebele et al., 1991; Brown et al., 1998; Lopez et al., 2005; Noh et al., 2008;
Morse et al., 2012).
About PBMC proliferation assays, moderate to strong APC proliferative
responses were stimulated by rOMP8 at 10 µg/mL, in all PBMC assays, for four out of
five experimental animals. As background CPM values were always high for animal
48406, responses to targeted recombinant OM proteins were poorly proliferative for its
unique PBMC assay. APC responses for rOMP8 at 1 µg/mL and for both concentrations

120
of rOMP7 and rOMP9 were highly variable, even for the same animal in different
replicated assays.
At 10 µg/mL, rOMP7 and rOMP9 were a little higher proliferative than rOMP8 for
animal 48453 (see Section 3.3.2.5). It is necessary to note that animals 48411 and
48432 got four PBMC assays during the experiment, while remained animals got just
three or less. Also, only animal 48432 had two of those assays after the biological
challenge with A. marginale virulent strain.
Regarding TCL assays, poor to moderate T-cell responses were found for
animals 48432, 48453, and 48406. In fact, for these experimental animals, all T-cell
responses to imbricated peptides spanning were poorly proliferative. Because of that
they were categorized as non-responsive. In contrast, animals 48411 and 48422 had
moderate to strong T-cell proliferative stimulation by OM prep at 1µg/mL. Although
background SD value was too high in almost every assay, moderate to strong T-cell
responses, with statistical significance mostly, were obtained by five peptides at least.
Those peptides were common to 48411 and 48422 and are OMP7c_8, OMP7m_7,
OMP8m_7, OMP8m_9, and OMP9m_7.
Abbott et al. (2005) had a drawback when the well-characterized
immunodominant major surface protein 2 (MSP2) did not stimulate strong anamnestic
CD4+ T-cell and IgG responses in animals vaccinated with conserved and variant-
specific epitopes of the homologous protein. Because of that, subdominant and
conserved surface proteins represented an alternative for focusing on a protective
vaccine. In that way, Noh et al. (2006) confirmed that A. marginale OMP7 to 9 proteins
were expressed mainly within infected erythrocytes. Also, by analysis of their sequences
in acute and persistent infection in both vertebrate and invertebrate hosts, they found a
high degree of conservation when comparing St. Maries strain and Florida strain
genomes.

121
Later, Morse et al. (2012b) worked with proteins from the A. marginale conserved
type IV secretion system (T4SS) and found that three proteins (VirB9-1, VirB9-2, and
VirB10) induced the strongest IgG and T-cell responses in most of the six experimental
animals. But, three of those animals with BoLA II DRB3 each one with RFLP type 8/23,
3/16, and 16/27 lacked T-cell responses to VirB9-1, VirB9-1 and VirB9-2, and VirB9-2
and VirB10, respectively. In our experiment, animals 48411, 48422, and 48453 shared
alleles and RFLP types. Only two of them, 48411 and 48422, were categorized as good
responders to five peptides.
Holstein animals with DRB3 haplotypes *1101/*1201, *1101/*1501, *0101/*1501,
and *1501/*1501 were found to be IgG responders to linked and unlinked A. marginale
OM proteins after a homologous immunization (NOH et al., 2013). In our experiment,
only animal 48453 had one of those haplotypes (*1501/*1501), but our animal was not
categorized as a good T-cell responder. DRB3 haplotypes *1201/*1501 and
*1201/*1201 were found in our experiment as good responders 48411 and 48422,
respectively. Maybe, a common allele would be involved in good humoral and cellular
immune responses, though precise evidence is needed for such an assertion.
3.3.5 Working with frozen vials
A protocol for getting viable cells from frozen vials is presented on Appendix P.
Working with frozen vials represented a huge quantity of time and laborious work, as
well as a higher consume of some reagents and material. Ignoring human errors during
the whole process, it seems to me that working with fresh irradiated, homologous
PBMC, as well as fresh resting T-cell line, is less expensive, less time-consuming, and
less laborious than working with frozen vials.
Freezing technology for keeping viable eukaryotic cells over time has facilitated
their use in research and other fields. However, as a 2wkCL culture is growing day after

122
day on the same media for seven days, and gamma-irradiated PBMC got about 3,000
rads, these conditions could make those cells weaker and susceptible for freezing. It
was more often to fail that being right about getting the minimal number of cells with a
few frozen vials, considering the human factor.
Taking into account the employment of frozen vials was usually an arduous,
discouraging lab work, it seems reasonable to propose the use of fresh cells for this kind
of cellular proliferation assays. Nevertheless, fresh cells only can be obtained from live
animals, dealing with a sensitive political matter, as well as economic restrains. Also,
depending on the cell type a standardization of using frozen vials could be far away of
being a reality because of the natural idiosyncrasy in each experimental animal.
Even so, an improvement of preparing, freezing, and using this kind of frozen
cells would represent more success in preparing cellular proliferation assays and getting
their results at low cost. Otherwise, working with fresh blood and fresh cultured cells will
go on as the best alternative.
3.3.6 A proposal for developing a vaccine candidate against Anaplasma
marginale
Antigen Presenting Cells (APC) and T lymphocytes proliferation in in vitro assays,
as described by Lopez et al. (2008) and Morse et al. (2012a), is a limiting factor for
mapping T-cell epitopes in some countries. Thus, we propose an alternative
methodology for developing a vaccine candidate against A. marginale (Appendix Q).
Eight experimental female calves would need to be used for mapping the epitopes of B
and T lymphocytes. All animals have to be seronegative and blood PCR negative for A.
marginale, as well as for common cattle infectious diseases. Except for Animal Zero,
there is no need for splenectomization. All animals will be kept under confinement
conditions with ad libitum feeding and water.

123
After getting the A. marginale live inoculum from Animal Zero (all samples of
Animal Zero will be used as controls), the first animal will be infected and monitored for
about a month. Later on days 30 to 35 post-infection, according to clinical evolution, a
blood sample will be taken and inoculated into the second animal. Then, the first animal
will be treated against A. marginale infection. If its life is threatened by the infection, the
animal must be removed from the experiment immediately. About a month later, a
bleeding will be made on the second animal and a sample of its blood will be inoculated
into the third. This process will be repeated until it reaches the last animal. A one-month
post-infection period was chosen based on a presumption that the emergence of
antigenic variants would take place at approximately five-week intervals in an infected
animal (PALMER et al., 1999). Consequently, after several animal passing, some
variants could be recognized in a relatively short term. We propose up to a seventh
animal passing in order to look for an immunogenic pressure on the expression of A.
marginale MSP-1 and MSP-2 variants.
Parasitemia will be measured by thin, peripheral blood smears post-infection on
days 14, 21, 25, 29, and daily after the first sign of fever. After treatment, it will be
measured once per week for two additional weeks, at least. Sera will be collected on
day 0 before infection, and once per week before treatment. Those sera will be purified,
split into aliquots, and stored in a freezer. Also, infected Red Blood Cells (iRBC), as well
as fresh Peripheral Blood Mononuclear Cells (PBMC), after each animal passing, will be
collected. Later, each fresh PBMC passing will be screened by flow cytometry,
searching for specific T-cell and B-cell populations (CD4 γδ, CD4 αβ, CD8, CD19,
CD21).
Also, each passing iRBC will be used for getting A. marginale initial bodies.
Those initial bodies will be broken by sonication in order to get the surface proteins.
Later, using SDS-PAGE, each protein will be visualized and variant recognition will be
made by immunoblotting with each heterologous animal passing serum. The results will
be compared with the flow cytometry results from each PBMC passing. Subsequently, a
sequentiation of each expressed MSP will be carried out in order to look for known and

124
novel proteins. Then, in silico comparisons between constant and variant sequences of
each passing protein expressed will be made using well-characterized immunodominant
A. marginale surface proteins as a frame of reference. In that way, those sequences will
be used to predict B-cell epitopes by computational methods. Moreover, the complete
sequence of those proteins with medium to high immunogenic potential will be
chemically synthetized in several overlapping peptide spanning (OPS).
In a second experimental step, an indirect ELISA test will be done using each
OPS as an antigen with the last serum of each animal passing in order to confirm the
computational predictions of B-cell epitopes. Those sera will be exposed to both a fixed
peptide quantity varying in serum dilution and a fixed serum dilution varying in the
peptide quantity. In that way, a mapping of B-lymphocytes will be achieved. Next, those
OPS selected by ELISA tests will be exposed to Antigen Presenting Cells (APC) and T-
cell line (TCL) proliferation assays using each passing PBMC. As controls, Concanavalin
A (ConA) and well-characterized immunodominant A. marginale MSPs and will be used.
In addition, the measurement of cell proliferation will be based on available techniques
(e.g., commercial kits). Also, using the supernatant of each cell proliferation assay,
peptides inducing an expression of cytokines INF-γ, TNF-α, IL-12, IL-10, IL-6, and IL-4
will be targeted as TH response is expected using RT-PCR and ELISA techniques.
According to ELISA titers; the cytokines profile; cell proliferation results; αβ and γδ
T-cell receptors (TCRs) sequentiation of the stimulated T-cells; and in silico
immunogenicity predictions; specific amino acid sequences will be selected for chemical
synthesis. Later, one gene or several genes will be designed with those selected
sequences. Ideally, only one designed gene will be transfected into a biological protein
expression system (e.g., Pichia pastoris). The product of that system (a peptide) will be
separated according to its mass and isoelectric point.
In a third step, experimental female calves will be immunized with those synthetic
peptides. A prescapular lymph node biopsy of one experimental animal will be used to
observe lymphocyte immune response to those antigens, as well as to monitor the

125
proper antigen dosage. Also, PBMC smears with acridine orange will be made to
visualize the apoptosis extension of activated lymphocytes. Later, a biological challenge
with an A. marginale virulent strain must be used to test the achieved immune protection
from previous immunizations. Hopefully, a potential vaccine candidate will emerge from
the entire process.
We think it is a feasible way of developing a vaccine candidate against A.
marginale working with a local strain and a limited budget in some countries. Although
there are other lines of research, our proposal could result in a vaccine candidate within
a relatively short term, representing a faster way under tropical and subtropical research
and development conditions.

126
3.4 CONCLUSIONS
• There is no conclusive explanation for atypical high background (medium alone)
numbers in both PBMC and TCL assays for all experimental animals. Several
factors like human error, operative issues, irradiation, fixation, and/or intracellular
infection can be considered in a potential chemical or physical alteration of APC,
stimulating WC1+ γδ T-cell to grow. Besides of correcting the human factor, a
depletion of WC1+ γδ T-cell of experimental animals with high background
numbers should be considered.
• Only two out of five experimental animals, 48411 and 48422, were categorized as
good responders to TCL assays with overlapping peptides spanning. These
animals showed moderate to strong proliferative responses to five peptides at 10
µg/mL (OMP7c_8, OMP7m_7, OMP8m_7, OMP8_9, and OMP9m_7), as well as
to OM prep at 1 µg/mL. About PBMC assays with OM recombinant proteins, only
rOMP8 at 10 µg/mL got moderate to strong APC proliferative response for
animals 48411, 48422, 48432, and 48453. Remained recombinant proteins had
too much variation, even between assays of the same animal, to obtain any
conclusive evidence.
• Good responder animals 48411 and 48422 shared one allele on DRB3 haplotype
(see Table 2). No more evidence was gotten during the experiment in order to
find a genetic relationship with T-cell proliferative stimulation in vitro.
• Background CPM values had high SD in several PBMC and TCL assays in all
experimental animals. None statistic test for normal distribution was made to
proceed with a logarithmic transformation of CPM values, as well as SI values,
because there had not conclusive explanation for high CPM values with medium
alone. A normality test should be considered for interpreting our PBMC and TCL
assay results after getting a formal explanation for that phenomenon.

127
• Operative issues about preparing, freezing, and using frozen cells in PBMC and
TCL assays must be improved in order to get lower costs and to achieve good
operative practices in time and resources management efficiency. Otherwise,
working with fresh blood and fresh cultured cells will be always the best option.
Implications of working with and keeping experimental animals for a long-term
should be considered.

128
REFERENCES ABBOTT, J.R.; PALMER, G.H.; HOWARD, C.J.; HOPE, J.C.; BROWN, W.C. Anaplasma marginale Major Surface Protein 2 CD4+ T-cell epitopes are evenly distributed in conserved and Hypervariable Regions (HVR), whereas linear B-cell epitopes are predominantly located in the HVR. Infection and Immunity, v72, n12, p.7360-7366. 2004. ABBOTT, J.R.; PALMER, G.H.; KEGERREIS, K.A.; HETRICK, P.F.; HOWARD, C.J.;
HOPE, J.C.;
BROWN, W.C. Rapid and Long-Term Disappearance of CD4+ T Lymphocyte Responses Specific for Anaplasma Marginale Major Surface Protein-2 (MSP2) in MSP2 Vaccinates following Challenge with Live A. marginale. The Journal of Immunology, v174, p.6702-6715. 2005. AGNES, J.T.; KELLY, A.B.; LaFOLLETE, M.; NORIMINE, J.; BROWN, W.; PALMER, G.H. Identification of Anaplasma marginale Outer Membrane Proteins antigens conserved between A. marginale Sensu Stricto Strains and the Live A. marginale subsp. centrale Vaccine. Infection and Immunity, v79, n3, p.1311-1318. 2011. AUBRY, P.; GEALE, P.W. A review of bovine anaplasmosis. Transboundary and Emerging Diseases, v58, n1, p.1-30. 2011. BENNETT, S.; RILEY, E.M. The statistical analysys of data from immunoepidemiological studies. Journal of Immunological Methods, v146, p.229-239. 1992. BROWN, W.C.; SHKAP, V.; ZHU, D.; McGUIRE, T.C.; TUO, W.; McELWAIN, T.F.; PALMER, G.H. CD4+
T-lymphocyte and immunoglobulin G2 responses in calves immunized with Anaplasma marginale Outer Membranes and protected against homologous challenge. Infection and Immunity, v66, n11, p.5406-5413. 1998. BRAYTON, K.A.; KAPPMEYER, L.S.; HERNDON, D.R.; DARK, M.J.; TIBBALS, D.L.; PALMER, G.H.; McGUIRE, T.C.; KNOWLES, Jr. D.P. Complete genome sequencing of Anaplasma marginale reveals that the surface is skewed to two superfamilies of outer membrane proteins. Proceedings of the National Academy of Sciences of the United States of America, v102, n3, p.844-849. 2005. BYRNES, Mark E. Chapter 4, Sampling and Surveying Radiological Environments. p.128. In: Sampling and Surveying Radiological Environments. Boca Raton (FL, USA): CRC, Press. 2000. 440 pages. ISBN 1-56670-364-6. DOYLE, R.L.; FRITZEN, A.; BOTTARI, N.B.; ALVES, M.S.; Da SILVA, A.D.; MORSCH, V.M.; SCHETINGER, M.R.; MARTINS, J.R.; SANTOS, J.S.; MACHADO, G.; Da SILVA, A.S. Imidocarb dipropionate in the treatment of Anaplasma marginale in cattle: Effects on enzymes of the antioxidant, cholinergic, and adenosinergic systems. Microbial Pathogenesis, v97, p.226-230. 2016. FRAME, P.W.; ABELQUIST, E.W. Use of Smears for Assessing Removable Contamination. The Radiation Protection Journal Health Physics, v76, s2, p.S57-S66. 1999. KOCAN, K.M.; de la FUENTE, J.; GUGLIELMONE, A.A.; MELÉNDEZ, R.D. Antigens and alternatives for control of Anaplasma marginale infection in cattle. Clinical Microbiological Reviews, v16, n4, p.698-712. 2003. KOCAN, K.M.; de la FUENTE, J.; BLOUIN, E.F. Characterization of the tick-pathogen-host-interface of the tick-borne rickettsia Anaplasma marginale. Chapter 15. In: Ticks, Biology, Disease and Control. Alan S. Bowman and Patricia A. Nutall (eds.). Cambridge University Press, 2008. p.325-343.

129
KOCAN, K.M.; de la FUENTE, J.; BLOUIN, E.F.; COETZEE, J.F.; EWING, S.A. The natural history of Anaplasma marginale. Veterinary Parasitology, v167, n2-4, p.95-107. 2010. KRUISBEEK, A.M.; SHEVACH, E.; THORNTON, A.M. Unit 3.12 Proliferative assays for T-cell function. Current Protocols in Immunology, s60: 3.12.1-3.12.20. 2004. LAHMERS, K.K.; NORIMINE, J.; ABRAHAMSEN, M.S.; PALMER, G.H.; BROWN, W.C. The CD4
T cell
immunodominant Anaplasma marginale major surface protein 2 stimulates γδ T cell clones that express unique T cell receptors. Journal of Leukocyte Biology, v77, p.199-208. 2005. LOPEZ, J.E.;
SIEMS, W.F.; PALMER, G.H.; BRAYTON, K.A.;
McGUIRE, T.C.;
NORIMINE, J.; BROWN,
W.C. Identification of novel antigenic proteins in a Complex Anaplasma marginale Outer Membrane immunogen by mass spectrometry and genomic mapping. Infection and Immunity, v73, n12, p.8109-8118. 2005. LOPEZ, J.E.; BEARE, P.A.; HEINZEN, R.A.; NORIMINE, J.; LAHMERS, K.K.; PALMER, G.H.; BROWN, W.C. High-throughput identification of T-lymphocyte antigens from Anaplasma marginale expressed usong in vitro transcription and translation. Journal of Immunological Methods, v332, n1- 2, p.129-141. 2008. McGILL, J.L.; SACCO, R.E.; BALDWIN, C.L.; TELFER, J.C.; PALMER, M.V.; WATERS, W.R. The role of gamma delta T cells in immunity to Mycobacterium bovis infection in cattle. Veterinary Immunology and Immunopathology, v159: 133-143. 2014. MORSE, K.; NORIMINE, J.; PALMER, G.H.; SUTTEN, E.L.; BASZLER, T.V.; BROWN, W.C. Association and evidence for linked recognition of Type IV Secretion System proteins VirB9-1, VirB9-2, and VirB10 in Anaplasma marginale. Infection and Immunity, v80, n1, p.215-227. 2012a. MORSE, K.; NORIMINE, J.; HOPE, J.C.; BROWN, W.C. Breadth of the CD4+
T cell response to
Anaplasma marginale VirB9-1, VirB9-2 and VirB10 and MHC class II DR and DQ restriction elements. Immunogenetics, v64, p.507-523. 2012b. NOH, S.M.;
BRAYTON, K.A.;
KNOWLES, D.P.;
AGNES, J.T.;
DARK, M.J.;
BROWN, W.C.;
BASZLER,
T.V.; PALMER, G.H. Differential Expression and sequence conservation of the Anaplasma marginale
msp2 gene superfamily Outer Membrane Proteins. Infection and Immunity, v74, n6, p.3471-3479. 2006. NOH, S.M.; BRAYTON,
K.A.; BROWN, W.C.;
NORIMINE, J.;
MUNSKE, G.R.; DAVITT, C.M.;
PALMER,
G.H. Composition of the surface proteome of Anaplasma marginale and its role in protective immunity induced by Outer Membrane immunization. Infection and Immunity, v76, n5, p.2219-2226. 2008. NOH, S.M.; TURSE, J.E.; BROWN, W.C.; NORIMINE, J.; PALMER, G.H. Linkage between Anaplasma marginale Outer Membrane Proteins enhances immunogenicity but is not required for protection from challenge. Clinical and Vaccine Immunology, v20, n5, p.651-656. 2013. PALMER, G.H.; RURANGIRWA, F.R.; KOKAN, K.M.; BROWN, W.C. Molecular basis for vaccine development against ehrlichial pathogen Anaplasma marginale. Parasitology Today, v5, n7, p.281- 286. 1999. PLATTNER, B.L.; HOSTETTER, J.M. Comparative Gamma Delta T cell Immunology: A focus on mycobacterial disease in cattle. Veterinary Medicine International, 2011. v2011, Article ID 214384, 8 pages. doi:10.4061/2011/214384. STUEN, S.; GRANQUIST, E.G.; SILAGHI, C. Anaplasma phagocytophilum, a widespread multi-host pathogen with highly adaptative strategies. Frontiers in Cellular Infection and Microbiology, v3, article31, doi: 10.3389/fcimb.2013.00031. 2013.

130
TEBELE, N.; McGUIRE, T.C.; PALMER, G.H. Induction of Protective Immunity by Using Anaplasma marginale Initial Body Membranes. Infection and Immunity, v59, n9, p.3199-3204. 1991. TUO, W.; BAZER, F.W.;
DAVIS, W.C.; ZHU, D.; BROWN, W.C. Differential effects of type I IFNs on the
growth of WC1- CD8+
γδ T cells and WC1+
CD8-
γδ T cells in vitro. The Journal of Immunology, v162,
p.245-253. 1999. ZHANG, Y.; PALMER, H.; ABBOTT, J.R.; HOWARD, C.J.; HOPE, J.C.; BROWN, W.C. CpG ODN 2006 and IL-12 are comparable for priming Th1 lymphocyte and IgG responses in cattle immunized with a rickettsial outer membrane protein in alum. Vaccine, v21, p.3307–3318. 2003.

131
APPENDIX A – Project conditions verification for the CEUA certification committee.

132
APPENDIX B – Certificate by the Ethics Committee in Animal Use at UFV.

133
APPENDIX C – Informed consent form applied to every interviewee before starting the interview and sample collection (Spanish Version that was applied).
Fecha NOTA Consentimiento informado para permitir trabajo de campo colectar teleoginas de R. microplus y muestras de sangre y suero de bovinos seleccionados día mes año
TÉRMINO DE CONSENTIMIENTO INFORMADO Y EXPLICADO Yo, Elkin Gustavo Forero Becerra, estudiante del Doctorado en Medicina Veterinaria, del Departamento de Veterinaria, y adscrito al Laboratorio de Biología y Control de Hematozoarios y Vectores del Instituto de Biotecnología Aplicada Agropecuaria (BIOAGRO) de la Universidad Federal de Viçosa (UFV) (Viçosa, Minas Gerais, Brasil), en asocio con Daniel Fernando González Mendoza, Profesor y Director del Centro de Investigaciones en Pequeños Rumiantes de la Fundación Universitaria “Juan de Castellanos” (FUJDC) – Sede Tunja, lo invitamos a usted a participar como voluntario del estudio titulado: Detección de Resistencia a Garrapaticidas y presencia de Babesia spp. en Regiones Ganaderas de Colombia. Esta investigación busca detectar la presencia de genes que codifican para la resistencia a garrapaticidas organofosforados y piretroides en garrapatas colectadas de fincas de regiones ganaderas de Colombia. Igualmente, a partir de las muestras de garrapatas, sangre y suero sanguíneo, detectar la presencia de genes de Babesia bovis y B. bigemina con el fin de relacionarla con la ampliación de la distribución de R. microplus en el trópico alto colombiano. Este estudio es financiado con recursos propios de la beca de doctorado de Departamento Administrativo de Ciencia, Tecnología, e Investigación de Colombia (Colciencias) (Convocatoria 568/2012) y tiene el apoyo del Instituto de Investigaciones Científicas (INICIEN) de la FUJDC (Tunja, BY, Colombia), y del Laboratório de Biologia e Controle de Hematozoários e Vetores (LBCHV), BIOAGRO, UFV (Viçosa, MG, Brasil). La colecta de garrapatas en potreros seleccionados se realizará arrastrando una flanela blanca en un trayecto de 70 m de longitud aprox. La colecta de garrapatas de tamaño mayor 4 mm de longitud consistirá en el retiro manual de los especímenes encontrados sobre los bovinos, bajo condiciones de restricción física seguras, tanto para el animal como para el colector. Adicionalmente, se colectarán muestras de sangre con dos tubos vacutainer, uno para sangre completa y el otro para obtener suero sanguíneo, de algunos bovinos previamente seleccionados. Estas actividades no representan ningún riesgo para los animales, las personas, o la finca, y la información derivada resulta esencial para la planeación de medidas de control adecuadas. Aún cuando la investigación no configura riesgos directos al ganadero, se considera que la restricción física de los animales seleccionados para la toma de garrapatas y muestras de sangre y suero podría generar preocupaciones. Al respecto, se emplearán los métodos de restricción física que evitan cualquier riesgo para la seguridad y bienestar del animal. También, el método de colecta de sangre y suero sanguíneo se realizará con procedimiento de antisepsia y materiales estériles. Solamente dos punciones serán realizadas para reducir cualquier tipo de riesgo para el animal. Cualquier tipo de información o duda que pudiere existir puede ser solicitada por medio de los contactos incluidos en la hoja “Información del Proyecto” anexa a este consentimiento informado. Su participación es voluntaria y usted podrá retirar su consentimiento o interrumpir su participación en cualquier momento, sin perjuicios de cualquier índole. Vale recordar que las informaciones de esta investigación serán confidenciales y divulgadas apenas en eventos o publicaciones científicas, no habiendo en ningún caso identificación de los voluntarios ni de las fincas, siendo así asegurado el sigilo absoluto en su participación. En constancia de aceptación de este consentimiento informado: ______________________ __________________________ ___________________ Nombre del Propietario Firma del Propietario Lugar y fecha

134
APPENDIX D – Acaricide resistance detection in ticks from cattle production regions in Colombia (Spanish Version that was applied).
Formato de colecta de datos adjuntos al envío de muestras de garrapatas
Serie
Fecha día mes año
NOTA Encuesta epidemiológica realizada por entrevista personal con el fin de asociar factores de riesgo a la presencia de genes de resistencia a garrapaticidas en garrapatas Rhipicephalus microplus, en fincas seleccionadas por conveniencia en regiones ganaderas, a partir de colecta de larvas en potreros de pastoreo. 1. IDENTIFICACIÓN DE LA FINCA 1.1. Nombre de la Finca: 1.2. Administrador o propietario
1.3. Vereda/Municipio/Departamento
1.4. ¿Cuál(es) raza(s) maneja?:
1.5. Tipo de producción bovina:
1.6. Número total de bovinos:
1.7. Bovinos <1 año de edad:
1.8. Bovinos 1-3 años de edad:
1.9. Bovinos >3 años de edad:
1.10. Presencia bovinos ajenos: £Alta £Baja £Ninguna £No sabe
1.11. Otros animales-potrero: £Alta £Baja £Ninguna £No sabe
1.12. ¿Cuáles especies?
1.13. Protocolo de Cuarentena:
1.14. Instalaciones/equipos baño £Sí £No
1.15. Registro de baños-garrapata £Sí £No £No sabe
2. IDENTIFICACIÓN DE FACTORES DE RIESGO PARA RESISTENCIA A GARRAPATICIDAS 2.1. ¿Cuánta preocupación tiene por el control de
garrapatas en su finca? 2.2. El control de garrapatas con garrapaticidas ¿le ha falla-
do en alguna ocasión? £Mucha £Poca £Ninguna £Sí £No £No sabe
2.3. Criterio de selección del garrapaticida: 2.4. Equipos utilizados para el tratamiento: £Precio £Propaganda £Consejo de vecinos £Prueba £Otro ¿Cuál?
£Bomba espalda £Pulverizador £Bañadero £Pour-on £Inyección £Otro ¿Cuál?
2.5. El producto garrapaticida que usa actualmente ¿cumple sus expectativas de control?
2.6. ¿Ha cambiado el número de bovinos y/o la raza por el fracaso del control garrapaticida?
£Sí £No £No sabe £Número £Raza £No
2.7. ¿Ha usado el mismo garrapaticida desde que tuvo sospecha de resistencia?
2.8. ¿Con qué frecuencia cambia de producto garrapati-cida?
£Sí £No £No sabe
2.9. ¿Cuál(es) garrapaticid(as) ha usado en los últi-mos tres tratamientos y con qué frecuencia?
2.10. ¿Cuándo decide aplicar el tratamiento garrapaticida?
2.11. Criterio para el cambio del garrapaticida: 2.12. Formas de preparación: £Ineficiencia £Rotación £Recomendación técnica £Otro ¿Cual?
£Según protocolo £Más producto £Menos producto £Aplicación directa £Combinación £Otro ¿Cuál?
2.13. Si realiza combinaciones con otro(s) producto(s) o adyuvante(s), descríbalas.
2.14. Tipo de compra de bovinos
£ Productor £Feria £Subasta
2.15. En los últimos 5 años ¿con qué frecuencia compró bovinos para su finca?
2.16. ¿La compra fue hecha en la región?
2.17. ¿Conoce el período de espera para la eliminación (leche/carne) de garrapaticida que usa?
2.18. ¿Cuál cree que es la causa, en su finca, de la resis-tencia a garrapaticidas?
£Sí £No
2.19. ¿Cuál es el costo de un (1) frasco* del producto garrapaticida usado?
2.20. ¿Cuántos animales trata con un (1) frasco* del garrapaticida usado?
2.21. ¿Aplica con ropa de protección individual? 2.22. ¿Conoce el ciclo de vida de la garrapata? £Sí £No ¿Por qué?: __No sabe ___días sobre el animal __días en el pasto
2.23. ¿Utiliza el producto garrapaticida según las recomendaciones del fabricante?
2.24. Si realiza una o varias estrategias de control alternativo de garrapatas, descríbalas.
2.25. ¿Cuál es el precio de venta de un litro de leche en su finca?
2.26. ¿Cuál es el precio de venta de un Kg de carne en pie en su finca?
2.27. ¿Tiene interés de participar en una investigación científica al respecto a largo plazo? £Sí £No

135
APPENDIX E – Detection of Babesia spp. in collected ticks from different municipalities in Colombia (Spanish Version that was applied).
Formato de colecta de datos adjuntos al envío de muestras de garrapatas
Serie
Fecha día mes año
NOTA Encuesta epidemiológica realizada por entrevista personal para detectar Babesia spp. a partir de larvas colectadas en pasturas u obtenidas de teleoginas en laboratorio, así como también de muestras de sangre de animales seleccionados. 3. IDENTIFICACIÓN DE LA FINCA 3.1. Nombre de la Finca: 3.2. Administrador o propietario
3.3. Vereda/Municipio/Departamento
3.4. ¿Número total de bovinos?:
3.5. Bovinos <1 año de edad:
3.6. ¿Dónde compra los bovinos?:
3.7. ¿Ha observado en sus animales fiebre asociada a la presencia de garrapatas?: £Sí £No
3.8. ¿Ha observado “orina con sangre” en los animales debido a la presencia de garrapatas?: £Sí £No
3.9. ¿Ha observado animales enfermos o muertos con presencia de garrapatas?: £Sí £No
3.10. ¿Conoce los términos “ranilla roja” o babesiosis?: £Sí £No
3.11. ¿Se ha enfermado o muerto algún animal de babesiosis?: £Sí £No
3.12. ¿Se ha diagnosticado babesiosis bovina en su finca?: £Sí £No
3.13. ¿Qué tratamiento ha usado contra la babesiosis?:
3.14. ¿Con qué frecuencia se ha presentado babesiosis?:
3.15. ¿Le gustaría participar en una investigación al respecto? £Sí £No
4. OBSERVACIONES DEL ENTREVISTADO
5. OBSERVACIONES DEL ENTREVISTADOR
Nombre del entrevistador: ______________________________________________________________________________ Firma del entrevistador: _____________________________ Firma del supervisor _________________________________

136
APPENDIX F – Acaricide sensitivity profile of Brazilian R. microplus samples to some commercial acaricides.
Sample Municipality (State) Date Products* Efficiency (%) Acaricide Family**
100-90 90-50 50-30 30-0 SP OP AZ
261/14 São José dos Campos (SP) 26Jan15 1-7 ü
M M-S M-S 8-10 ü
13/15 Afonso Cláudio (ES) 18Mar15
1, 4 ü
N N N 2, 5 ü
3, 6-10 ü
06/15 Texeira de Freitas (BA) 20Feb15
5, 8 ü
M S N 2, 4, 10 ü
6 ü
1, 3, 7, 9 ü
84/14 Coronel Pacheco (MG) 29May14
1, 2, 4 ü
N N N 3, 5 ü
6, 8-10 ü
247/14 Conceição do Rio Verde (MG) 15Dec14
1, 2, 4, 8 ü
N S N 7 ü
3, 5, 6, 9, 10 ü
186/14 Paraty (RJ) 05Sep14
1, 2, 4, 5, 8 ü
N S N 6, 3 ü
9, 10 ü
248/13 Euclides da Cunha P. (SP) 28Nov13 1-3,5-9,11,12 ü
M S S 10 ü
153/13 Formosa (GO) 24Jul13
1-3, 7, 9, 11 ü
N M S 8 ü
6, 13 ü
5, 10 ü
186/13 Coronel Pacheco (MG) 30Aug13
1,2,6-9,11-13 ü
N S S 3 ü
5 ü
10 ü
148/13 Caçu (GO) 24Jul13
1, 2, 7, 11 ü
M M M 8-10 ü
3, 5, 6, 13 ü
128/13 Araxá (MG) 27Jun13
1-3, 7, 11 ü
M M-S M-S 6, 8, 9 ü
10, 13 ü
5, 14 ü
Source: After the tick sensitivity tests to acaricides of EMBRAPA, Gado de Leite, Juíz de Fora (MG).
*A detailed description of each product is found in the Table 1, Chapter 4.
**Sensitivity profile according to EMBRAPA; SP = Synthetic Pyrethroids; OP = Organophosphates; AZ = Amitraz.
S = Sensitive (efficiency acaricide percentage over 90%); M = Moderate (efficiency acaricide percentage around 50%);
N = No sensitive (efficiency acaricide percentage under 30%).

137
APPENDIX G – Tick DNA extraction using the Phenol:Chloroform:Isoamyl method. A. ADITION OF LIQUID NITROGEN (N2) 1. Put larvae in 2 mL snap-top microtubes. Add a few drops of
liquid N2 to facilitate maceration. Wait for N2 evaporation. pCRITICAL The fresher the specimens, the better the DNA extraction. Do not close the microtube lid with N2 inside, as it can explode because N2 evaporation. uKEY A few drops of liquid N2 will make easier the maceration process. uKEY Weight or count specimens before storage.
B. MACERATION 2. Add 300 µL of grinding buffer and do maceration using an
autoclaved, plastic stick. Do it for 30 min under stereoscope 3. Keep vials on ice while macerating their content. pCRITICAL The finest the maceration, the better DNA extraction.
B. LYSIS 4. Add 300µL of lysis buffer & incubate on ice for 15 min. 5. Add 25µL Proteinase K (final concentration of 100µg/mL). 6. Mix by inversion 50X or vortex vigorously. 7. Incubate at 56ºC x 16h. uKEY The higher the quantity of Proteinase K, the higher the lysis of proteins. If overnight seems to be not enough, use 24h instead.
C. DNA EXTRACTION(PHENOL:CHLOROFORM:ISOAMIL) 8. After 16h of incubation, add 300µL of Phenol and 300µL of
Chloroform:Isoamyl alcohol 24:1. Mix by inversion 25X. 9. Centrifuge at 17000 x g x 5 minutes. 10. Transfer ½ of the upper phase to a new microtube. 11. Avoid touching the interphase. Just take the upper phase. pCRITICAL Repeat steps 7-10 a couple times. If interphase still seems dirty additional repetitions will be needed.
12. After last stage of Phenol:Chloroform:Isoamyl, add 1X of the volume of Chloroform:Isoamyl alcohol 24:1 only.
13. Mix by inversion 25X. pCRITICAL Chloroform or Chloroform:Isoamyl 24:1 will remove any remains of Phenol in the upper phase. �CAUTION Use double-gloves and screw-cap tubes for Phenol:Chloroform:Isoa-myl DNA extraction. Check Phenol smell on gloves. Work only under fume hood.
14. Centrifuge at 17000 x g x 5 minutes. 15. Transfer upper phase to a new 1.5 mL microtube, taking
care of measuring the transferred volume. D. DNA PRECIPITATION 16. Add 0.1X 3M NaOAc and 1X Ethanol of sample volume. uKEY Adding 1 mL Glycogen (20mg/mL) will co-precipitate DNA making easier a pellet visualization.
17. Mix by vortex and incubate at -20ºC overnight. 18. Centrifuge at 17000 x g x 30 min. Discard supernatant. E. WASHING AND DNA RESUSPENSION 19. Wash pellet with 500µL Ethanol 70%. 20. Mix by vortex. 21. Centrifuge at 17000 x g x 5 minutes. Discard supernatant 22. Centrifuge again at 17000 x g x 1 min. Take as much
Etanol as possible with a pipette without touching the DNA pellet.
23. To warrant a complete drying of DNA pellet, vials must be put on a clean paper towel for 60 minutes at room ºT.
24. Resuspend the pellet in 50µL of TE buffer. 25. Do not resuspend by pipetting or vortex. Let overnight at
4ºC in order to get a passive resuspension. ¢PAUSE Storage at -20ºC for short time. Storage at -80ºC for long time.
QUANTIFICATION AND EVALUATION OF THE PELLET 26. Do Agarose Gel Electrophoresis (1%) with 5µL DNA. 27. Uso Nanodrop. Reference value must be A260/280 = 1.8. 28. For PCR analysis better use several dilutions of the pellet
(1:100, 1:1000, 1:10 000).
PREPARATION OF SOLUTIONS
1M Tris-HCl (pH 8.0) Tris-base 1.211 g
Sterile Milli-q H2O 8 mL Adjust to pH 8.0 by adding concentrated HCl. Adjust the volume to 10 mL with ddH2O. . Autoclave at 15 psi (1.05 kgf/cm2) x 20 min . 0.5M EDTA (pH 8.0)
EDTA 1.461 g Sterile Milli-q H2O 8 mL Adjust to pH 8.0 by adding 10N NaOH. EDTA will be soluble only at pH 8.0! If necessary, add ddH2O to 10 mL. . Autoclave at 15 psi (1.05 kgf/cm2) x 20 min . 1M NaCl
NaCl 0.584 g Sterile Milli-q H2O q.s.p. 10 mL Dissolve by stirring. Autoclave at 15 psi (1.05 kgf/cm2) x 20 min .
1M Sucrose (Saccharose)
Saccharose 3.423 g Sterile Milli-q H2O q.s.p. 10 mL Dissolve by stirring. Autoclave at 15 psi (1.05 kgf/cm2) x 20 min .
Grinding buffer pH 8.0
Tris-HCl pH 8.0 10 mM (v/v) NaCl 60 mM (v/v) Sucrose 30 mM (v/v) EDTA pH 8.0 10 mM (v/v) Sterile Milli-q H2O q.s.p. 50 mL . Check pH to 8.0. If needed, adjust with 1N HCl Lysis buffer pH 8.0
Tris-HCl 300 mM (v/v) SDS 40 mM (v/v) EDTA 20 mM (v/v) Sterile Milli-q H2O q.s.p. 50 mL . Check pH to 8.0. If needed, adjust with 1N HCl 3M Sodium Acetate (NaOAc) (pH 5.2) CH3COONa•3H2O 40.824 g Sterile Milli-q H2O q.s.p. 80 mL Adjust pH to 5.2 with Glacial Acetic Acid. Adjust the volume to 100 mL with ddH2O. . Autoclave at 15 psi (1.05 kgf/cm2) x 20 min . TE buffer Tris-HCl (pH7.4)100 mM(10mL of10mL1MTris-HCl pH7.4) EDTA (pH 8.0) 10 mM (1 mL of 10 mL 1M EDTA pH8.0) ------------------------ Sterile Milli-q H2O q.s.p.100 mL --------- . Autoclave at 15 psi (1.05 kgf/cm2) x 20 min. Do aliquots._
RECOMMENDATIONS - Centrifuge larvae before maceration. Use of pestle and mortar could mean a contamination risk and potential loss of sample. Make an ID for every tube/sample during all stages. - Place samples on ice x 2 min before storage at -20ºC/-80ºC - If sample volume + Ethanol 70% were higher than vial volume capacity, use absolute isopropanol at equal volume of the sample (e.g., 500µL sample + 500µL isopropanol).
Source: After Faza et al., 2013. Exp Parasitol.134: 519-523 with modifications; WSU and UFJF personal communications.

138
APPENDIX H – Modified DNeasy Tissue & Blood kit protocol for Tick DNA*. A. Weighing of the samples
1- Weigh each tick sample in a previously tared, new 1.5 mL microcentrifuge tube. Make the proper identification.
B. Maceration
2- Add a few drops of liquid nitrogen (N2) (not included with the kit) to each microcentrifuge tube with a 200 µL pipette. Let
the lid open.
3- After completing the evaporation of N2, add 100-200 µL of PBS working solution pH 7.4 (not included with the kit),
according to the appreciation of the sample volume.
4- Macerate with an autoclaved plastic stick for 30 minutes. Keep the microcentrifuge tube on ice for a few seconds the whole
time, unless PBS appears frozen. In that case, place the microcentrifuge tube on a common plastic rack for a few seconds
until PBS be unfrozen. Use an individual exclusive plastic stick for each sample.
5- Add 180 µL of ATL buffer to all samples, as well as the extraction control.
6- Macerate each sample for short time Using an individual, autoclaved 1 mL tip with the top sealed by the heat of a candle.
Clean the inside walls of the microcentrifuge tube for sticky samples.
C. Lysis
7- Add 20 µL of Proteinase K (included with the kit).
8- Seal the lid of each microcentrifuge tube using Parafilm® (not included with the kit).
9- Mix by vortexing for 20 seconds. Then do a pulse on a microcentrifuge.
10- Place on an appropriate floating rack and put it on water bath at 56ºC x 5 hours.
11- During incubation, take the microcentrifuge tubes out each 90 minutes and repeat the step 9. Do the same after finishing
the incubation time.
D. DNA extraction
12- Add 200 µL of Buffer AL and mix thoroughly by vortexing for 20 seconds.
13- Add 200 µL of absolute Ethanol (not included with the kit) and mix thoroughly by vortexing for 20 seconds.
14- Centrifuge all samples at (600 x g) 2,500 rpm for 30 seconds. Pipet the supernatant into a DNeasy Spin Column,
previously coupled with a 2 mL tube (included with the kit).
15- Centrifuge the sample for 1 minute at 6,000 x g (8,000 rpm). Discard the flow-through and collection tube.
16- Transfer the spin column to a new 2 mL collection tube (included with the kit).
17- Add 500 µL of Buffer AW1 to each sample. Centrifuge for 1 minute at 6,000 x g (8,000 rpm). Discard the flow-through and
collection tube.
18- Transfer the spin column to a new 2 mL microcentrifuge tube (not included with the kit).
19- Add 500 µL of Buffer AW2 to each sample. Centrifuge for 6 minutes at 20,000 x g (14,000 rpm) on order to warrant a
complete drying of the column.
20- Carefully, transfer the spin column to a new 1.5 mL microcentrifuge tube (not included with the kit). Discard the flow-
through and the old microcentrifuge tube.
E. DNA elution
1- Add 55 µL of Buffer AE to the center of the spin column membrane.
2- Incubate for 5 minutes at room temperature (15-25ºC).
3- Centrifuge for 1 minute at 6,000 x g (8,000 rpm). Do not discard the flow-through. It is the extracted DNA.
4- Increase the DNA recovery for pipetting (100 µL pipette) the total eluted volume again into the same spin column.
5- Repeat steps 2 and 3.
6- Remove the spin column and put the lid on the tube. Make a proper ID and store at -20ºC for further research.
*This protocol is based on the Molecular Identification of Ricketssia spp. in Ticks by the Pontificia Universidad Javeriana (Bogotá,
D.C., Colombia).

139
APPENDIX I – Modified Illustra Tissue & Cells genomicPrep Mini Spin Kit protocol for DNA isolation from blood dried spot samples*.
NOTE: Reagents and columns are provided with the kit. Phosphate-buffered saline (PBS) is required.
A. Homogenization of the samples
1- Use a Harris Uni-core disponsable punch (6 mm) to remove a sample disc from the center of a dried blood spot sample.
Place the disc in a clean RNase/DNase free 1.5 mL microcentrifuge tube.
2- Add 1 mL of PBS/sample and incubate at room temperature for 5 minutes. This time can be extended if needed.
3- Macerate the disc using a 20-gauge sterile syringe needle and remove the disc. It should appear washed out.
4- Centrifuge at 16,000 x g x 2 minutes. Discard the supernatant.
5- Add 50 µL of PBS to each sample.
6- Centrifuge for 10 seconds at 2,000 x g.
B. Lysis
7- Add 50 µL of Lysis Buffer Type 1 to each sample.
8- Add 10 µL of Proteinase K to each sample and mix by vortexing for 15 seconds.
9- Incubate for 1 hour at 56ºC.
10- Centrifuge for 10 seconds at 2,000 x g.
C. RNA removal
11- Add 5 µL of RNase A (20 mg/mL) to each sample.
12- Incubate for 15 minutes at room temperature.
D. Purification
13- Add 500 µL of Lysis Buffer Type 4 to each sample and mix by vortexing for 15 seconds.
14- Incubate at 10 minutes at room temperature.
15- Pipet the sample into a Tissue & Cells Mini Column coupled in a collection tube.
16- Centrifuge for 1 minute at 11,000 x g. Discard the flow-through.
E. Wash and dry
17- Switch on the water bath and set the temperature in 70ºC. Do aliquots 200 µL of the Elution Buffer Type 5.
18- Add 500 µL of Lysis Buffer Type 4 to each sample.
19- Centrifuge for 1 minute at 11,000 x g. Discard the flow-through.
20- Add 500 µL of Wash Buffer Type 6 to the column.
21- Pre-heat aliquots of the Elution Buffer Type 5 at 70ºC for 3 minutes.
22- Centrifuge the column for 3 minutes at 11,000 x g. Discard the collection tube.
F. Elution
23- Transfer the column to a new 1.5 mL DNase-free microcentrifuge tube.
24- Add 50 µL of pre-warmed Elution Buffer Type 5.
25- Incubate for 1 minute at room temperature.
26- Centrifuge for 1 minute at 11,000 x g.
27- Increase DNA recover about 25% by pipetting the flow-through again into the same column,
28- Centrifuge for 1 minute at 11,000 x g.
29- Discard the column but retain the flow-through.
30- Store the purified genomic DNA at -20ºC until needed.
*This protocol is based on the protocol of GE Healthcare 2010, Application Note 28-9222-22 AA, Sample Collection, Reliable
Extraction of DNA from WhatmanTM FTATM Cards.

140
APPENDIX J – Modified protocol for determining the optimal antigen concentration. A. ANTIGEN (Ag) CONCENTRATIONS (⊗) DILUTIONS 1. Prepare 2mL of Ag at 0.25µg, 0.5µg, 1µg, 2µg, & 4µg* per
100µL each in 50 mM Sodium Carbonate/Bicarbonate buffer pH 9.6 (Coating buffer). Use exclusive maps for this.
uKEY Use 2mL microfuges tubes and a fresh buffer solution. Ag is lyophilized. pCRITICAL Prepare enough for Ag replicates and considering sera replicates. ¢PAUSE Antigens and sera can be stored for long time (years) at -20ºC.
*Pure Ag solution ⊗ are usually <2µg/mL. Pure Ag preparations are not essential, but >3% of the total protein (TP) should be Ag. The TP shouldn’t exceed 10µg/mL.
B. PLATE SENSIBILIZATION WITH Ag 2. Using a multichannel pipettor, dispense 100 µL/well of Ag
solution into each well of an Immulon microtiter plate for each Ag ⊗ replicate. For each Ag replicate it should be Blank, Conjugated alone, and Ag alone replicates. Don’t add any Ag solution on Blank and Conjugated alone repli-cates. Their wells must keep empty.
pCRITICAL Use a 96 wells plate map for applying Ag solution to each well. Also, use autoclaved, disposable tips for each replicate.
3. Tap or shake the plate to ensure that the Ag solution is evenly distributed over the bottom of each well.
4. Seal with plastic wrap and incubate overnight at 4ºC. C. RINSE AND BLOCKING 5. Wash 3 times as follow: rinse coated plate with washing
buffer, flicking the liquid into the sink after each rinse. Then, wrap the plate in a large paper towel and flick it face down onto several paper towels to remove any residual liquid.
6. Fill each well (except Blank & Conjugated alone replicates) with 150µL/well of blocking buffer w/ a multichannel pipettor and add 150µl/well of PBS only to control replicates.
7. Seal as in step 4 and incubate for 1 h at 37ºC. D. PRIMARY ANTIBODY (Ab) DILUTION (SERA) 8. Rinse with washing buffer as in step 5, only 3 times. 9. Dilute each problem serum, as well as positive and nega-
tive sera control, at 1:100 in incubation buffer. 10. Add 100µL/well of diluted sera according to the Ag repli-
cates, except control replicates w/ a multichannel pipettor 11. In Blank, Conjugated alone, and Ag alone add 100µL/well
of incubation buffer. pCRITICAL Use a 96 wells plate map for applying serum solution to each well.
12. Seal as in step 4 and incubate for 2 h at 37ºC. uKEY Equilibrium binding is generally achieved after 5 or 10 h. Thus, the specific signal may be significantly increased by longer incubations.
E. CONJUGATED SECONDARY Ab DILUTION 13. Rinse with washing buffer as in step 5, only 6 times. 14. Do the Anti-Bovine IgG (whole molecule)-Peroxidase, Ab
produced in rabbit (SIGMA A5295), dilution at 1:20,000 (1µL of IgG Peroxidase in 19.999mL of ddH2O for 1 plate)
15. Make the dilution with incubation buffer and add 100µL/ well to all wells w/ a multichannel pipettor.
16. Seal as in step 4 and incubate for 2 h at 37ºC. F. DEVELOPING AND ABSORBANCE MEASURE 17. Rinse with washing buffer as in step 5, only 6 times. 18. Add 100µL/well to all wells of developing solution w/ a
multichannel pipettor under partial room darkness. pCRITICAL Do as fast and as precise as possible. Be ready for ELISA Reader.
19. Put the plate on the ELISA Plate Reader using a 450-nm emission filter. Analyze results according to ELISA sheet.
20. Discard the plate according to dangerous liquids protocol. G. Ab ⊗ DILUTIONS 21. Keeping the Ag ⊗ fixed (best from step 19), dilute primary
Ab at 1:100, 1:200, & 1:400 as in step 9. Do from step 3.
PREPARATION OF SOLUTIONS
50 mM Sodium Carbonate/Bicarbonate buffer, pH 9.6 Na2CO3 0.159 g
NaHCO3 0.293 g NaN3 (optional*) 0.020 g ddH2O 80 mL Adjust to pH 9.6 by adding concentrated HCl (1N). Adjust the volume to 100 mL with ddH2O. . Don’t autoclave. Store at 4ºC short or at -20ºC longer time. Phosphate-buffered Saline (PBS) – Working solution NaCl 137 mM (8 g) KCl 2.7 mM (0.2 g) Na2HPO4 10 mM (1.44 g) (anhydrous) or Na2HPO4•7H2O 4.3mM
KH2PO4 2 mM (0.24 g) (anhydrous) If using Na2HPO4•7H2O then KH2PO4 1.4mM ddH2O 800 mL
Dissolve by stirring. Adjust to pH 7.4 with HCl (1N). Add ddH2O to 1 Liter. Autoclave at 1.05 kgf/cm2 x 20 min.
It is optional to filter w/ 0.22µm ∅ after autoclaving. . Washing buffer (for one plate) (24h before)
NaCl 18 g Tween 20 0.5 mL ddH2O q.s.p 2 L Dissolve by stirring, slowly avoiding foam formation. ______Do not autoclave. Store at room temperature._____ Blocking Solution I (Casein 2%) (24h before) Casein 2 g (Amicase® Casein, Acid Hydrolysate) PBS pH7.4 q.s.p 100 mL Do not autoclave. Store at <0ºC, no bacterial contamination. Citrate-Phosphate buffer (Substrate buffer) (24h before) Na2HPO4 0.719 g Citric acid 0.519 g ddH2O q.s.p 100 mL Adjust pH to 5.0. Do not autoclave. Store at <0ºC, no bacterial contamination. Incubation buffer – Do a preparation 24h before starting PBS pH7.4 q.s.p 87.5 mL Casein 2% 12.5 mL Tween 20 50 µL Dissolve by stirring. No pH adjustment according to LBCHV protocol. Do not autoclave. Store at <0ºC, no bacterial contamination. Developing Solution – Do a fresh preparation Substrate buffer 30 mL o-Phenilenediamine (OPD) 6 mg H2O2 30% 3.75 µL (add in a dark room)
Make sure of proper dilution by shaking, briefly. . Use as fast as possible as reaction will occur immediately. .
RECOMMENDATIONS
- ELISA maps must be designed before starting. - Do fresh solutions. If frozen, let overnight at room ºT. - OPD dilution is better with PBS at room ºT. - ELISA Plate Reader must be ready before developing step. - Calculi the whole processing time for one plate. Then, it can be timed for the total number of plates.
Source: Basic Protocol, Unit 11.2. In: Ausubel et al. Short Protocols in Molecular Biology. 5th Ed. Wiley. USA: 2002. “ELISA normal” protocol of LBCHV. In: Lab-Book identified as “ELISA e Blotting Técnica purificação IgG Espanha”.

141
APPENDIX K – Indirect ELISA protocol to detect SBbo23290 specific antibodies. A. ANTIGEN/SERUM OPTIMAL CONCENTRATIONS (⊗) 1. Make sure that antigen (Ab) and specific antibody (Ab) op-
timal ⊗ were gotten previously before starting. pCRITICAL A wrong Ag/Ab ⊗ is going to make the ELISA test a total useless. ¢PAUSE Sera can be stored for years at -20ºC, better if they are lyophilized. uKEY See Criss-Cross Serial Dilution Analysis protocol.
B. PLATE SENSIBILIZATION WITH Ag 2. Prepare enough Ag at 1µg/200µL in 50 mM Sodium Car-
bonate/Bicarbonate buffer pH 9.6 (Coating buffer). Use an exclusive map for this before applying. Verify control wells.
3. Using a multichannel pipettor, dispense 200 µL/well of Ag solution into each well of an Immulon microtiter plate. Be sure of let Blank, Conjugated alone, and Ag alone replica-tes as cotronls. Don’t add any Ag solution on Blank and Conjugated alone replicates. Their wells must keep empty.
pCRITICAL Use a 96 wells plate map for applying Ag solution to each well. Also, use autoclaved, disposable tips for each replicate.
4. Tap or shake the plate to ensure that the Ag solution is evenly distributed over the bottom of each well.
5. Seal with plastic wrap and incubate overnight at 4ºC. C. RINSE AND BLOCKING 6. Wash 3 times as follow: rinse coated plate with washing
buffer, flicking the liquid into the sink after each rinse. Then, wrap the plate in a large paper towel and flick it face down onto several paper towels to remove any residual liquid.
7. Fill each well (except Blank & Conjugated alone replicates) with 200µL/well of blocking buffer w/ a multichannel pipettor and add 200µl/well of PBS only to control replicates.
8. Seal as in step 4 and incubate for 1 h at 37ºC. D. PRIMARY ANTIBODY (Ab) DILUTION (SERA) 9. Rinse with washing buffer as in step 5, only 3 times. 10. Add 199µL/well of incubation buffer with a Multichannel
pipettor. 11. Add 1µL (1µg/µL) of target sera per well, also positive
and negative sera controls, according to the ELISA map, except in non-serum control well replicates.
12. In Blank, Conjugated alone, and Ag alone wells add 200µL/well of incubation buffer.
pCRITICAL Use a 96 wells plate map for applying serum solution to each well.
13. Seal as in step 5 and incubate for 2 h at 37ºC. uKEY Equilibrium binding is generally achieved after 5 or 10 h. Thus, the specific signal may be significantly increased by longer incubations. pCRITICAL Do 1 plate per day. Several plates increase probability of mistakes.
E. CONJUGATED SECONDARY Ab DILUTION 14. Rinse with washing buffer as in step 5, only 6 times. 15. Do the Anti-Bovine IgG (whole molecule)-Peroxidase (Ab
produced in rabbit-SIGMA A5295), dilution at 1:20,000 (1µL of IgG Peroxidase in 19.999mL of ddH2O for 1 plate)
16. Make the dilution with incubation buffer and add 200µL/ well to all wells with a multichannel pipettor.
17. Seal as in step 5 and incubate for 2 h at 37ºC. F. DEVELOPING AND ABSORBANCE MEASURE 18. Rinse with washing buffer as in step 6, only 6 times. 19. Add 200µL/well to all wells of developing solution w/ a
multichannel pipettor under partial room darkness. pCRITICAL Do as fast and as precise as possible. Be ready for ELISA Reader.
20. Put the plate on the ELISA Plate Reader using a 450-nm emission filter. Analyze results according to ELISA sheet.
21. Discard the plate according to dangerous liquids protocol. pCRITICAL Make sure that 450-nm emission filter was the same used in the op-
timal Ag/Ab ⊗ determination by Serial Dilutions Analysis.
PREPARATION OF SOLUTIONS
50 mM Sodium Carbonate/Bicarbonate buffer, pH 9.6 Na2CO3 0.159 g
NaHCO3 0.293 g NaN3 (optional*) 0.020 g ddH2O 80 mL Adjust to pH 9.6 by adding concentrated HCl (1N). Adjust the volume to 100 mL with ddH2O. . Don’t autoclave. Store at 4ºC short or at -20ºC longer time. Phosphate-buffered Saline (PBS) – Working solution NaCl 137 mM (8 g) KCl 2.7 mM (0.2 g) Na2HPO4 10 mM (1.44 g) (anhydrous) or Na2HPO4•7H2O 4.3mM
KH2PO4 2 mM (0.24 g) (anhydrous) If using Na2HPO4•7H2O then KH2PO4 1.4mM ddH2O 800 mL
Dissolve by stirring. Adjust to pH 7.4 with HCl (1N). Add ddH2O to 1 Liter. Autoclave at 1.05 kgf/cm2 x 20 min.
It is optional to filter w/ 0.22µm ∅ after autoclaving. . Washing buffer (for one plate) (24h before)
NaCl 18 g Tween 20 0.5 mL ddH2O q.s.p 2 L Dissolve by stirring, slowly avoiding foam formation. ______Do not autoclave. Store at room temperature._____ Blocking Solution I (Casein 2%) (24h before) Casein 2 g (Amicase® Casein, Acid Hydrolysate) PBS pH7.4 q.s.p 100 mL Do not autoclave. Store at <0ºC, no bacterial contamination. Citrate-Phosphate buffer (Substrate buffer) (24h before) Na2HPO4 0.719 g Citric acid 0.519 g ddH2O q.s.p 100 mL Adjust pH to 5.0. Do not autoclave. Store at <0ºC, no bacterial contamination. Incubation buffer – Do a preparation 24h before starting PBS pH7.4 q.s.p 87.5 mL Casein 2% 12.5 mL Tween 20 50 µL Dissolve by stirring. No pH adjustment according to LBCHV protocol. Do not autoclave. Store at <0ºC, no bacterial contamination. Developing Solution – Do a fresh preparation Substrate buffer 30 mL o-Phenilenediamine (OPD) 6 mg H2O2 30% 3.75 µL (add in a dark room)
Make sure of proper dilution by shaking, briefly. . Use as fast as possible as reaction will occur immediately. .
RECOMMENDATIONS
- ELISA maps must be designed before starting. - Do fresh solutions. If frozen, let overnight at room ºT. - OPD dilution is better with PBS at room ºT. - ELISA Plate Reader must be ready before developing step. - Calculate the whole processing time for one plate. Then, it can be timed for the total number of plates.
Source: Protocol I, Chapter I. In: Sambrook & Russell. Molecular Clonning, a lab manual. 3rd Ed. CSHL Press. NY: 2001.

142
APPENDIX L – Modified alkaline lysis method for plasmid DNA extraction from E. coli recipients (Mini-prep).
A. Cells growing
1- Pour o the content of one E. coli recipients vial into 50 mL LB medium in a previous sterilized 250 mL Erlenmeyer. Incubate
at 37ºC x 200 rpm during 18 hours.
B. Cell lysis
2- Centrifuge the bacterial culture at 8,000 x g x 20 minutes. Use a 50 mL centrifuge tube.
3- Resuspend bacterial pellet by adding 2 mL of Solution I (25 mM Tris, pH 8.0; 10 mM EDTA; 50 mM Glucose) and vortexing.
4- Add 4 mL of Solution II (0.2 N NaOH; 1% SDS). Do a fresh preparation before using it. Mix gently by inverting the
centrifuge tube several times.
5- Incubate on ice for 5 minutes.
6- Add 3 mL of Solution III (3 M Sodium Acetate; 2 M Acetic acid; adjust pH to 4.8-5.0). Mix by inverting the centrifuge tube
several times.
7- Centrifuge at 8,000 x g x 20 minutes.
8- Transfer supernatant to a new 15 mL centrifuge tube and centrifuge at 8,000 x g x 20 minutes.
9- Transfer supernatant to a new 15 mL centrifuge tube.
10- Add 1X volume of isopropanol. Mix by inverting the centrifuge tube several times.
11- Centrifuge at 8,000 x g x 30 minutes.
12- Discard supernatant and allow the dryness of the pellet by inverting the tube and placing it on a clean paper towel.
C. DNA precipitation
13- Resuspend in 150 µL of TE (10 mM Tris, pH 8.0; 1 mM EDTA).
14- Transfer to a 1.5 mL microcentrifuge tube and add 50 µL of RNAse A (50 mg/mL).
15- Incubate on water bath at 37ºC x 30 minutes.
16- Add 110 µL of 7.5 M Ammonium Acetate and mix by vortexing.
17- Centrifuge at 10,000 rpm x 15 min.
18- Transfer supernatant to a new 1.5 mL microcentrifuge tube.
19- Add 750 µL of absolute Ethanol to each 200 µL of supernatant. Mix by inverting the microcentrifuge tube several times.
20- Centrifuge at 10,000 rpm x 10 min.
21- Discard supernatant and wash the pellet with 250 µL of 70% Ethanol.
22- Centrifuge at 10,000 rpm x 10 min.
23- Discard the supernatant allow the dryness of the pellet by inverting the tube and placing it on a clean paper towel. A
complete dryness of the pellet is required before continue to the next step.
24- Resuspend the pellet in 30 µL of water.

143
APPENDIX M – Miniprep of Plasmid DNA by Alkaline Lysis with SDS. A. CULTURING A E. coli recipient clone 1. Take a clone cryovial from a box in the -80º freezer. 2. Pour the cryovial content into 5 mL LB medium in a 50 mL
sterile tube (1:4 bacterial volume:tube volume). 3. Incubate the culture overnight at 37ºC, over 200 rpm. pCRITICAL Use laminar flow chamber. Use incubation with vigorous agitation. ¢PAUSE Specimens can be stored for long time (years) at -80ºC. uKEY Do appropriate hygiene.
B. PREPARATION OF CELLS 4. Pour 1.5 mL of culture into a 2 mL sterile microfuge tube. uKEY Store the unused portion of the original culture at 4ºC.
5. Centrifuge at 14,000 rpm x 1 min x 4ºC. 6. Remove the supernatant by aspiration, leaving the bacte-
rial pellet as dry as possible. pCRITICAL Traces of medium make plasmid DNA resistant to cleavage by enzyme digestion. Avoid this by resuspending the bacterial pellet in ice-cold STE (0.25x original bacterial culture volume) and centrifuge again. uKEY Hold microtube at angle, the pellet on upper side. Insert tip just beneath meniscus on lower side. Keep tip end away from pellet. Remove drops from walls.
C. LYSIS OF CELLS 7. Resuspend pellet by vortexing in 100 µL of ice-cold SOL I. pCRITICAL Be sure that bacterial pellet is completely dispersed in SOL I. uKEY Vortexing two microtubes at a time w/ their bases touching to resuspend.
8. Add 200µL of fresh prepared SOL II to each resuspension. pCRITICAL Do not vortex. Store the microtube on ice. uKEY Close the tube tightly. Make sure entire inner surface had contact SOL II.
9. Mix the content by inverting the tube rapidly 5x. 10. Add 150µL of ice-cold SOL III. Close the tube tightly. 11. Mix by inverting the tube 15x. uKEY Disperse SOL III through the viscous bacterial lysate.
12. Store on ice 3-5 minutes. 13. Centrifuge at 14,000 rpm x 5 min x 4ºC. 14. Transfer supernatant to a new 2 mL sterile tube. 15. Add a supernatant equal volume (1x) of Phenol:Chloro-
form (0.5x:0.5x). Mix the phases by vortexing vigourously. 16. Centrifuge at 14,000 rpm x 5 min x 4ºC. 17. Transfer aqueous phase to a new sterile microtube. 18. Add a supernatant equal volume (1x) of Chloroform. uKEY Just Chloroform extraction will remove residual Phenol from upper phase.
19. Mix by vortexing. Centrifuge at 14,000 rpm x 5 min x 4ºC. 20. Transfer upper phase to a new 1.5 mL sterile microtube. D. RECOVERY OF PLASMID DNA 21. Add 2x aqueous phase equal volume of Ethanol absolute
at room temperature. Mix the solution by vortexing. 22. Allow the solution to stand for 2 min at room temperature. 23. Centrifuge at 14,000 rpm x 5 min x 4ºC. 24. Remove supernatant by gentle aspiration. uKEY Hold microtube at an angle, while the pellet on upper side. Insert tip just beneath meniscus on lower side. Keep tip end away from pellet.
25. Using a sterile disposable pipette tip, remove any drops of fluid adhering to the walls of the microtube.
uKEY Add nothing. Centrifuge at 3,000 x g x 1 min x 4ºC helps to remove EtOH.
26. Add 1mL 70% Ethanol. Invert the closed tube 15x times. 27. Centrifuge at 14,000 rpm x 5 min x 4ºC. 28. Again remove supernatant by gentle aspiration. uKEY Add nothing. Centrifuge at 3,000 x g x 1 min x 4ºC helps to remove EtOH. pCRITICAL Be careful as the pellet sometimes doesn’t adhere to the microtube. 29. To warrant a complete drying of DNA pellet, vials must be
put on a clean paper towel for 15 minutes at room ºT. pCRITICAL A complete dryness of the microtube is highly recommended before resuspension of the DNA pellet.
30. Dissolve pellet in 50µL TE (pH 7.4) containing 20µg/mL DNAse-free RNAse A (pancreatic RNAse). Shake gently for a few seconds. Let at 4ºC overnight to resuspend.
31. Store DNA solution at -20ºC. pCRITICAL DNA should not be resuspended by pipetting or vigorous vortexing as it will shear.
PREPARATION OF SOLUTIONS
1M Tris-HCl (pH 8.0) Tris-base 1.211 g
ddH2O 8 mL Adjust to pH 8.0 by adding concentrated HCl. Adjust the volume to 10 mL with ddH2O. . Autoclave at 15 psi (1.05 kgf/cm2) x 20 min . 0.5M EDTA (pH 8.0)
EDTA 1.461 g ddH2O 8 mL Adjust to pH 8.0 by adding 10N NaOH. EDTA will be soluble only at pH 8.0! If necessary, add ddH2O to 10 mL. . Autoclave at 15 psi (1.05 kgf/cm2) x 20 min . 1M NaCl
NaCl 0.584 g ddH2O q.s.p 10 mL Dissolve by stirring. . Autoclave at 15 psi (1.05 kgf/cm2) x 20 min .
Alkaline Lysis Solution I (SOL I) Glucose 50 mM (0.9 g for 100 mL final volume) Tris-HCl (pH 8.0) 25 mM (2.5mL of 10mL 1MTris-Cl pH 8) EDTA (pH 8.0) 10 mM (2mL of 10mL 0.5M EDTA pH 8) ddH2O q.s.p. 100 mL . Autoclave at 15 psi (1.05 kgf/cm2) x 15 min. Store at 4ºC.. Alkaline Lysis Solution II (SOL II)–Do a fresh preparation NaOH 0.2 N (200µL of 10N NaOH) pCRITICAL Freshly diluted from a 10 N stock.
SDS 1% (w/v) (0.1 g for 10 mL final volume) ddH2O q.s.p 10 mL . Alkaline Lysis Solution III (SOL III) 5M Potassium acetate 60 mL Glacial acetic acid 11.5 mL ddH2O 28.5 mL . Store at 4ºC. Transfer to an ice bucket just before use.___ STE NaCl 100 mM (10mL of 10mL 1M NaCl) Tris-Cl (pH 8.0) 10 mM (1mL of 10mL 1M Tris-Cl pH8.0) EDTA (pH 8.0) 1 mM (200µL of 10mL 1MTris-Cl pH 8) ddH2O q.s.p 100 mL . Autoclave at 15 psi (1.05 kgf/cm2) x 15 min. Store at 4ºC.. Ethanol 70% Absolute Ethanol 35 mL ddH2O q.s.p. 15 mL Final volume 50 mL TE buffer Tris-HCl (pH 7.4)100 mM(10mL of10mL1MTris-HClpH7.4) EDTA (pH 8.0) 10 mM (1 mL of 10 mL 1M EDTA pH8.0) ----------------------------------- ddH2O q.s.p. 100 mL --------- . Autoclave at 15 psi (1.05 kgf/cm2) x 20 min. Do aliquots._ .
RECOMMENDATIONS - Identify every tube for each individual sample every time. - H2O (Milli-Q, autoclaved) can form crystals after freezing. - Use next equation for calculation mg/mL of DNA: A260 X Dilution Factor x 50 = µg/mL
Source: Protocol I, Chapter I. In: Sambrook & Russell. Molecular Clonning, a lab manual. 3rd Ed. CSHL Press. NY: 2001.

144
APPENDIX N – DNA extraction from P. pastoris by Phenol:Chloroform method. A. CULTURING THE Pichia pastoris CLONE 1. Take the clone cryovial from a box in the -80º freezer. 2. Add 50 mL YPD or B medium to a 200 mL sterile flask, or
15 mL to a 50 mL sterile centrifuge tube (at least 1:3 or 1:4) 3. Wait until cryovials content melt, then pour one (1) cryovial
in the flask. Put it on the Shaker: 30ºC, 200 rpm, overnight. pCRITICAL Avoid any contamination with bacteria. Use laminar flow chamber. ¢PAUSE Specimens can be stored for long time (years) at -80ºC. uKEY Make a 2
nd culture from the 1
st one (a few hours). Do appropriate hygiene.
Sometimes, a longer time in the shaker (e.g., 48 hours) is used.
B. MACERATION 4. Take 1.5mL of the overnight culture and place into a 2 mL
microtube. Centrifuge at 10,000 rpm x 15 min. 5. Resuspend the pellet in ≈30µL residual liquid. Add three
(≈0.3 g) sterile glass balls (0.45 mm ∅) + 400µL Triton/SDS solution (lysis solution). Vortex 2 min.
uKEY Save ≈30 µL of residual liquid after centrifugation, before resuspension.
C. LYSIS AND DNA EXTRACTION �CAUTION Use double-gloves and screw-cap tubes for Phenol:Chloroform:Isoa-myl DNA extraction. Check Phenol smell on gloves. Work only under fume hood. 6. Add 200µL Phenol and 200µL Chloroform. uKEY It is optional to use Chloroform:Isoamyl (24:1). Same volume: 200µL. 7. Vortex 2 min. Centrifuge at 14,000 rpm x 5 min. 8. Transfer upper phase (400µL) to a new microtube. Avoid
touching the interphase. Just take the upper phase. uKEY It is optional to add 1X volume of Chloroform:Isoamyl (24:1) to remove any remains of Phenol in the upper phase. Mix well before proceeding. Centrifuge at 14,000 rpm x 5 min. Transfer the supernatant to a new microtube. pCRITICAL Repeat step 8 if the interphase still seems dirty. Repeat if needed.
9. Add 2 µL of 50 mg/mL RNAse A. 10. Incubate at 37ºC x 30 min (water bath or PCR incubation) D. DNA PRECIPITATION 11. Centrifuge at 14,000 rpm x 5 min. 12. Transfer the supernatant to a new microtube. 13. Add 0.1x 3M Sodium Acetate and 2x Ethanol absolute. uKEY 1X is the volume of the supernatant.
14. Incubate at -80ºC x 2 min. uKEY It is optional to incubate at -20ºC x 60 min.
E. WASHING AND DNA RESUSPENSION 15. Centrifuge at 14,000 rpm x 5 min. Discard supernatant. 16. Wash pellet with 500µL Ethanol 70%. 17. Vortex for a few seconds. 18. Centrifuge at 14,000 rpm x 5 min. Discard supernatant. uKEY It is optional to repeat steps 16-18 one more time. 19. Centrifuge at 2,000rpm x30sec. Take as much Ethanol as
possible with a pipette without touching the DNA pellet. 20. Don’t add anything to the microtube. Centrifuge again. uKEY Do this centrifugation at 2,000rpm x 30sec. Collect any remains of EtOH.
21. To warrant a complete drying of DNA pellet, put vials on a clean paper towel for 60 minutes at room ºT.
22. Resuspend the pellet in 30-50µL of TE buffer (or Milli-q sterile water).
uKEY TE buffer is recommended for long time storage and multiple procedures. pCRITICAL A complete dryness of the microtube is highly recommended before resuspension of the DNA pellet. ¢PAUSE Storage at 4ºC or -20ºC for short time. Storage at -80ºC for long time.
QUANTIFICATION AND EVALUATION OF THE PELLET 23. Do Agarose Gel (1%) Electrophoresis (80V x 40 min) with
5µL DNA + 1µL Loading dye 6X + 2µL Gel Red per well. Put a molecular marker (5µL) in one well + Loading Dye + Gel Red. Use resuspension medium as a control.
24. Do Spectrophotometry in Nanodrop. Use resuspension medium as control. Reference value A260/280 = 1.8.
25. Do PCR analysis using the appropriate Taq polymerase protocol. Repeat steps 27 and 28 with the PCR product.
PREPARATION OF SOLUTIONS
1M Tris-HCl (pH 8.0) Tris-base 1.211 g
ddH2O 8 mL Adjust to pH 8.0 by adding concentrated HCl. Adjust the volume to 10 mL with ddH2O. . Autoclave at 15 psi (1.05 kgf/cm2) x 20 min . 1M EDTA (pH 8.0)
EDTA 2.922 g ddH2O 8 mL Adjust to pH 8.0 by adding 10N NaOH. EDTA will be soluble only at pH 8.0! If necessary, add ddH2O to 10 mL. . Autoclave at 15 psi (1.05 kgf/cm2) x 20 min . 1M NaCl
NaCl 0.584 g ddH2O q.s.p 10 mL Dissolve by stirring in a magnetic plate. . Autoclave at 15 psi (1.05 kgf/cm2) x 20 min . Triton/SDS Solution (Lysis Solution) Tris-HCl 10 mM (1 mL of 10 mL 1M Tris-Cl pH 8.0) Triton X-100 2% (v/v) (2 mL for 100 mL final volume) SDS 1% (w/v) (1 g for 100 mL final volume) NaCl 100 mM (10 mL of 10 mL 1M NaCl) EDTA 1 mM (100 µL of 10 mL 1M EDTA) ------------------------------ ddH2O q.s.p. 100 mL --------------- Sterilize by filtering (use 1 sterile filter 0.2 µm up to 60 mL, i.e., 1 sterile syringe of 60 mL has to be used once. . Avoid to shake the solution as SDS is a soap (foamy) . CHOLOROFORM:ISOAMYL ALCOHOL 24:1 uKEY A commercial form is already prepared and it is better!
Chloroform 48 mL Isoamyl alcohol 2 mL Final Volume 50 mL . Prepare under fume hood only 3M Sodium Acetate (pH 5.2) CH3COONa•3H2O 40.824 g ddH2O 80 mL Adjust pH to 5.2 with Glacial Acetic Acid. Adjust the volume to 100 mL with ddH2O. . Autoclave at 15 psi (1.05 kgf/cm2) x 20 min . Ethanol 70% Absolute Ethanol 35 mL ddH2O q.s.p. 15 mL Final volume 50 mL TE buffer Tris-HCl (pH 8.0)100 mM (10 mL of 1M Tris-HCl pH 8.0) EDTA (pH 8.0) 10 mM (1 mL of 1M EDTA pH 8.0) ----------------------------------- ddH2O q.s.p. 100 mL --------- . Autoclave at 15 psi (1.05 kgf/cm2) x 20 min______ .
RECOMMENDATIONS - Identify every tube for each individual sample every time. - H2O (Milli-Q, autoclaved) can form crystals after freezing. - Use next equation for calculation mg/mL of DNA: A260 x Dilution Factor x 50 = µg/mL
Source: LBCHV protocol as carried out by Brunna Esteves (PATSOS technician).

145
APPENDIX O – Protocols for Buffy Coat Method for PBMC isolation, cell counting on a hemocytometer, and freezing PBMC.
PBMC isolation
1- Get all material for blood collection ready:
a. One or two 60 mL sterile syringe with 3.5 mL 0.5 M EDTA, or if it will be needed, one 500 mL vacuum glass evacuated
container with lid (Baxter®) with 21 mL 0.5 M EDTA.
b. 16 ∅ needles for 60 mL syringes and 20 ∅ needles for 500 mL vacuum bottles.
c. Extension lines for blood collection from syringes and from bottles.
d. Labels.
2- Place absorbent paper on the work area inside the fume hood.
3- Split the blood samples in enough 50 mL conical-bottom, sterile polypropylene tubes.
4- Centrifuge whole blood at 1200 x g x 30 minutes (∼18ºC).
5- Transfer buffy coat to a new 50 mL tube and dilute, at least, 1 in 3 with Phenol red-free HBSS with to 30-35 mL total volume
(e.g., 10 mL Buffy Coat + 20 mL HBSS with EDTA).
6- Underlay those 30-35 mL (Buffy Coat + HBSS with EDTA) with ∼15 mL Ficoll. Add Histopaque very slowly with a 10 mL serum
pipette.
7- Centrifuge at 900 x g x 30 minutes (∼18ºC). Remove PBMC from interface. Don’t take too much Ficoll only buffy coat.
8- Combine PBMC up to 10 mL and dilute to 30-50 mL final volume with Alseviers. Centrifuge at 500 x g x 15 min (10ºC).
9- Discard supernatant, resuspend pellet in Alseviers, and bring volume to 25-50 mL with Alseviers.
10- It can combine of the same animal at this step. Centrifuge at 250 x g x 15 minutes (10ºC).
11- Repeat wash with Alseviers until the supernatant is clear (no foggy visibility; fingers can be observed easily through the tube),
and make final resuspension of PBMC pellet in cRPMI 1640.
Protocol for counting in Neubauer’s hemocytometer
1- 90 µL of 0.4% Trypan blue in 1X PBS are poured into a 1 mL plastic, round-bottom test tube. Use one tube for each different
dilution, e. g., for 101 dilution one test tube, 102 dilution other test tube, etc. In general, 103 dilution was used.
2- Take 10 µL of PBMC and pour into the first tube to get a final volume of 100 µL (90 µL Trypan Blue + 10 µL PBMC), now being
101 dilution.
3- Take 10 µL of 101 dilution and pour into the second tube to get a final volume of 100 µL (90 µL Trypan Blue + 10 µL 101
dilution), now being 101 dilution. Continue in this way until reach the target dilution, which usually is chosen by the low amount
of cells for counting.
4- For counting, upper right square, center square, and lower left square were chosen from the hemocytometer.
5- Those three numbers were used to get an average. Then it was by the used dilution, as well as hemocytometer factor (104).
Lastly, the number was converted to scientific notation together with the total volume of PBMC in the 50 mL tube (e.g., 12 x 103
x 104 = 12 x 107 = 1.2 x 10⁸ PBMC/mL in 300 µL = 3.6 x 10⁷ PBMC total).
Freezing PBMC
1- Thaw a 50 mL tissue culture flask with ∆FCS. Later, remove 5 mL. Add 5 mL DMSO (Dimethyl Sulfoxide) to remain 45 mL
∆FCS. Shake thoroughly.
2- Calculate the volume of ∆FCS + 10% DMSO to add keeping DMSO percentage as near as possible to 10% (e.g., for 1 mL
PBMC add 11 mL ∆FCS + 10% DMSO and divide in 11 screw caps cryotubes of 1.8 mL).
3- Place those cryotubes on a Mr. FrostyTM freezing container.
4- Store Mr. Frosty on ultrafreezer (-80ºC). Sometimes after thaw, cells viability was better if Mr. Frosty was stored previously for
a couple of hours on fridge (4ºC), then about one hour on freezer (-20ºC) before take it to the ultrafreezer.

146
APPENDIX P – Protocol for getting viable cells from frozen cell vials. 1- Pick vials up from liquid nitrogen storage according to database. Use protection
gloves and tweezers. Transport the vials to the lab on ice.
2- Thaw them on water bath (37ºC) for a few seconds.
3- Pour the content in a 50 mL tube, filled up with about 25 mL of cRPMI.
4- Centrifuge at 250 x g x 10 minutes (no brake). It is known as a wash.
5- Dismiss supernatant. Lightly, rattle the bottom of the tube until get a dissolved pellet.
Filling up with 25 mL of cRPMI.
6- Centrifuge at 250 x g x 10 minutes (no brake).
7- Dismiss supernatant. Lightly, rattle the bottom of the tube until get a dissolved pellet.
Put the tube on ice.
8- Do the counting on hemocytometer (Appendix 6).
9- If dead cells surpass 30 or 40%, do ficolling.
10- Mix the cell pellet with cRPMI (about 22-25 mL final volume),
11- In other 50 mL tube about 10 mL Ficol must be placed.
12- Suck up the pellet solution with a 10 mL serum pipette and eject it over the other
tube ficol surface, very slowly (about 1 minute to empty the pipette).
13- Centrifuge at 900 x g x 30 minutes (no brake).
14- Take the viable cells from the interface between Ficol and cRPMI, as described on
Appendix 6. Add cRPMI (about 25 mL).
15- Centrifuge at 500 x g x 15 minutes (no brake). Then, repeat only step 5.
16- Centrifuge at 250 x g x 10 minutes (no brake). Then, repeat only step 5.
17- Then, repeat only step 5.
18- If dead cells surpass 30 or 40%, do ficolling, again (repeat from step 9).

147
APPENDIX Q – A proposal for developing a vaccine candidate against Anaplasma marginale.