Statistical Detection of Chromosomal Homology Using Density ...
Upload
incarcursosCategory
view
1download
0
Genome Size, Karyotype Polymorphism andChromosomal Evolution in Trypanosoma cruziRenata T. Souza1., Fabio M. Lima1., Roberto Moraes Barros1, Danielle R. Cortez1, Michele F. Santos1,
Esteban M. Cordero1¤, Jeronimo Conceicao Ruiz2, Samuel Goldenberg3, Marta M. G. Teixeira4, Jose
Franco da Silveira1*
1 Departamento de Microbiologia, Imunologia e Parasitologia, Escola Paulista de Medicina, Universidade Federal de Sao Paulo, Sao Paulo, Brazil, 2 Centro de Pesquisas
Rene Rachou, Fiocruz, Minas Gerais, Brazil, 3 Instituto Carlos Chagas, Parana, Brazil, 4 Departamento de Parasitologia, Instituto de Ciencias Biomedicas, Universidade de
Sao Paulo, Sao Paulo, Brazil
Abstract
Background: The Trypanosoma cruzi genome was sequenced from a hybrid strain (CL Brener). However, high allelicvariation and the repetitive nature of the genome have prevented the complete linear sequence of chromosomes beingdetermined. Determining the full complement of chromosomes and establishing syntenic groups will be important indefining the structure of T. cruzi chromosomes. A large amount of information is now available for T. cruzi and Trypanosomabrucei, providing the opportunity to compare and describe the overall patterns of chromosomal evolution in theseparasites.
Methodology/Principal Findings: The genome sizes, repetitive DNA contents, and the numbers and sizes of chromosomesof nine strains of T. cruzi from four lineages (TcI, TcII, TcV and TcVI) were determined. The genome of the TcI group wasstatistically smaller than other lineages, with the exception of the TcI isolate Tc1161 (Jose-IMT). Satellite DNA content wascorrelated with genome size for all isolates, but this was not accompanied by simultaneous amplification ofretrotransposons. Regardless of chromosomal polymorphism, large syntenic groups are conserved among T. cruzi lineages.Duplicated chromosome-sized regions were identified and could be retained as paralogous loci, increasing the dosage ofseveral genes. By comparing T. cruzi and T. brucei chromosomes, homologous chromosomal regions in T. brucei wereidentified. Chromosomes Tb9 and Tb11 of T. brucei share regions of syntenic homology with three and six T. cruzichromosomal bands, respectively.
Conclusions: Despite genome size variation and karyotype polymorphism, T. cruzi lineages exhibit conservation ofchromosome structure. Several syntenic groups are conserved among all isolates analyzed in this study. The syntenicregions are larger than expected if rearrangements occur randomly, suggesting that they are conserved owing to positiveselection. Mapping of the syntenic regions on T. cruzi chromosomal bands provides evidence for the occurrence of fusionand split events involving T. brucei and T. cruzi chromosomes.
Citation: Souza RT, Lima FM, Barros RM, Cortez DR, Santos MF, et al. (2011) Genome Size, Karyotype Polymorphism and Chromosomal Evolution in Trypanosomacruzi. PLoS ONE 6(8): e23042. doi:10.1371/journal.pone.0023042
Editor: Gustavo Henrique Goldman, Universidade de Sao Paulo, Brazil
Received March 29, 2011; Accepted July 4, 2011; Published August 12, 2011
Copyright: � 2011 Souza et al. This is an open-access article distributed under the terms of the Creative Commons Attribution License, which permitsunrestricted use, distribution, and reproduction in any medium, provided the original author and source are credited.
Funding: This work was supported by grants from Fundacao de Amparo a Pesquisa do Estado de Sao Paulo/FAPESP (www.fapesp.br) and Conselho Nacional deDesenvolvimento Cientıfico e Tecnologico/CNPq (www.cnpq.br) (Brazil) to JFS. RTS and DRC were awarded postdoctoral and master fellowships by FAPESP,respectively. FML and RMB were awarded doctoral fellowships by FAPESP. The funders had no role in study design, data collection and analysis, decision topublish, or preparation of the manuscript.
Competing Interests: The authors have declared that no competing interests exist.
* E-mail: [email protected]
. These authors contributed equally to this work.
¤ Current address: Department of Biological Sciences, The Border Biomedical Research Center (BBRC), University of Texas at El Paso, El Paso, Texas, United States ofAmerica
Introduction
Trypanosoma cruzi is a protozoan parasite transmitted to
vertebrate hosts by insect vectors causing Chagas disease, also
known as American trypanosomiasis. The disease is endemic in
Latin America and affects approximately eight million people [1],
with an increasing number of cases in non-endemic countries
including the United States and Europe [2,3]. The disease has a
broad spectrum of clinical symptoms, which may reflect parasite
and host genetic factors. T. cruzi is a complex taxon that
demonstrates remarkable genetic heterogeneity [4,5]. Natural
populations of T. cruzi undergo clonal evolution with rare events of
genetic recombination [6]. However, hybrid lineages have been
identified in natural T. cruzi populations [7,8,9,10]. On the basis of
a number of genetic and biochemical markers, the strains of T.
cruzi have been divided into six discrete typing units (DTU)
designed as TcI to VI [11].
Trypanosome genetic material is organized into small chromo-
somes, which are poorly condensed during cell division, precluding
the use of conventional cytogenetic analysis. The T. cruzi
PLoS ONE | www.plosone.org 1 August 2011 | Volume 6 | Issue 8 | e23042
karyotype is poorly defined; identification of each of the individual
chromosomes has been problematic as many are of small-size or
very similar. Therefore, the precise relationships between
homologous chromosomes have yet to be determined. There is a
significant variation in the size of chromosomes among strains
[12,13,14,15,16,17], and although the genome is generally diploid,
the sizes of homologous chromosomes differ considerably
[13,14,18,19,20]. Differences of up to 50% in the sizes of
genetically equivalent chromosomes were detected in the karyo-
types of various strains, suggesting that major chromosomal
rearrangements occurred during the evolution of T. cruzi.
Studies based on flow cytometry, microfluorometry, chemical
and renaturation kinetic analyses have demonstrated variation of up
to 40% of the total DNA content among T. cruzi strains and clones
[21,22,23,24,25,26,27]. The absolute amount of total DNA (nuclear
+ kinetoplast) varies from 0.12 to 0.33 pg per cell among various
strains and clones isolated from the same strain [21,22,23,25,27].
The wide variation in genome size observed among eukaryotic
species is more closely correlated with the amount of repetitive DNA
than with the number of coding genes. In T. cruzi repeat sequences
account for at least 50% [28]. The genome of T. cruzi was sequenced
using a whole-genome sequencing approach from a hybrid strain
(clone CL Brener) originated from genetic recombination of TcII
and TcIII [8,11,28,29]. Sequence strategy resulted in high sequence
coverage from two parental haplotypes. However, high allelic
variation and the repetitive nature of the genome have prevented
the complete linear sequence of T. cruzi chromosomes being
determined. Therefore, determining the full complement of
chromosomes, identifying chromosome-specific markers and estab-
lishing syntenic and linkage genetic groups are important for
defining the molecular karyotype and structure of T. cruzi
chromosomes.
In this study, the genome organization of various T. cruzi strains
was analyzed using genetic and computational approaches. The
following questions were addressed: (1) What is the range of
genome sizes and repetitive DNA contents (satellite DNA and
retrotransposons) across strains from T. cruzi DTUs?; (2) What is
the contribution of repetitive DNA to variability in genome size
and chromosomal polymorphism?; (3) By analyzing large homol-
ogous chromosomal segments, what is the level of synteny among
these strains? To address these questions genome sizes, repetitive
DNA contents, and the numbers and sizes of chromosomes of nine
strains from four DTUs including two clones from a hybrid strain,
were determined and compared. The size distribution of syntenic
blocks of clone CL Brener among the T. cruzi DTUs was
examined. Two T. cruzi megabase chromosomes were compared
with their counterparts in T. brucei; comparison between T. cruzi
and T. brucei chromosomes could help the reconstruction of the
ancestral trypanosome karyotype.
Methods
Ethics StatementThis study was carried out in strict accordance with the
recommendations in the Guide for the Care and Use of Laboratory
Animals of the National Institutes of Health. The protocol was
approved by the Committee on the Ethics of Animal Experiments of
the Federal University of Sao Paulo (Permit Number: CEP09555-
07). All surgery was performed under sodium pentobarbital
anesthesia, and all efforts were made to minimize suffering.
ParasitesNine isolates from the main lineages of T. cruzi [11] were used in
this study. Three isolates belonged to group TcI (clone Dm28c,
Tc1161 (Jose-IMT) isolate and G strain), two to the TcII group
(clone Esmeraldo-cl3 and Y strain), one to the TcV group (clone
SO3-cl5) and three to the TcVI group (CL strain, CL-strain
derived clones CL Brener and CL 14). CL Brener was kindly
provided by Dr. Bianca Zingales (IQ-USP), clone Dm28c by Dr.
Samuel Goldenberg (ICC-Fiocruz), Y, G and CL strains and CL-
strain derived clone CL 14 by Dr. Nobuko Yoshida (UNIFESP),
clone SO3-cl5 by Dr. Marta de Lana (UFOP) and clone
Esmeraldo-cl3 by Dr. Santuza Teixeira (UFMG). Tc1161 (Jose-
IMT) was obtained from the Trypanosomatid Culture Collection
(TryCC) of the Department of Parasitology, USP and was
provided by Marta M. G. Teixeira (ICB-USP). Parasites were
maintained by cyclic passage in mice and in axenic cultures at 28
uC in liver-infusion tryptose medium (LIT) containing 10% fetal
calf serum.
Synchronization of parasite cultures and flow cytometryEpimastigotes were diluted to a final concentration of 36106
parasites per mL and maintained in the exponential growth phase
for 24 h at 28uC. Hydroxyurea (20 mM) was added to the
cultures, and after incubation for 24 h the number of parasites was
determined using a Neubauer-counting chamber. Cells were
washed with PBS and fixed with 50% methanol for 10 min at 0uC.
After washing with PBS, parasites were resuspended in PBS
(66106 cells/mL) containing 20 mg/mL propidium iodide and
16 mg/mL RNase and subjected to flow cytometry analysis in a
custom-designed flow cytometer (Becton-Dickinson FACScalibur).
Cultures without hydroxyurea (HU) were used as controls.
Determination of total DNA contentGenome size of isolates from groups TcI (clone Dm28c, Tc1161
isolate and G strain), TcII (clone Esmeraldo-cl3 and Y strain), TcV
(clone SO3-cl5) and TcVI (CL strain, CL-strain derived clones CL
Brener and CL 14) were determined after several control
experiments had been carried out. Epimastigotes of T. cruzi strains
were arrested with HU and total DNA was isolated from 108 cells
as described previously [30]. DNA content was estimated using a
fluorescent nucleic acid stain for dsDNA ‘‘Quant-iTTM dsDNA
Assay Kit, High Sensitivity - 0.2-100 ng’’ (Invitrogen) as described.
This kit provides accurate quantification, comparing DNA
samples with pre-diluted DNA standards. Fluorescence intensity
was read on a GENios Fluorometer (Magellan program) using
485 nm excitation and 535 nm emission wavelengths. Between
three and seven independent assays were performed on each
isolate and all experiments were carried out in triplicate. To assess
the reliability of the assay using large DNA molecules, unbroken
chromosomal DNA and sonic wave broken DNA were compared.
Control experiments demonstrated that fluorophore incorporation
was the same for both samples (data not shown). The next control
experiment involved calculating the percentage yield obtained in
DNA extraction experiments using a recovered radioactive
experiment. T. cruzi chromosomal DNA was incubated overnight
with 10 U endonuclease AscI in an appropriate restriction buffer
at 37uC. After digestion, restriction fragments were labeled with
5 mCi [a-32P]dCTP, 0.02 mM dGTP and 5 U Klenow fragment
in the same buffer at 65uC for 1 h (adapted protocol described by
Cornillot et al., 2002) [31]. Known amounts of labeled DNA were
added before total DNA extraction. Taking into account the
percentage of radioactivity recovered, the real DNA mass in each
T. cruzi isolate could be determined. Three independent assays
were performed in triplicate (data not shown).
For statistical analysis, the one-way ANOVA test was performed
using GraphPad InStat version 3.05 (GraphPad software, San
Diego, CA). The statistical significance level was set at P,0.05.
T. cruzi Chromosome Structure and Evolution
PLoS ONE | www.plosone.org 2 August 2011 | Volume 6 | Issue 8 | e23042
Data presented were the result of a minimum of three independent
experiments and plotted as mean 6 SD.
Copy-number measurementsThe copy numbers of repetitive sequences were determined
approximately using dot-blot hybridization. DNA samples were
denatured with NaOH (0.4 M) for 10 min, chilled on ice and
diluted with an equal volume of 2 M ammonium acetate. DNA
was quantified using an ultra-sensitive fluorescent nucleic acid
stain for double-stranded DNA [‘‘Quant-iTTM dsDNA Assay Kit,
High Sensitivity - 0.2-100 ng’’ kit (Invitrogen)]. Various amounts
of genomic DNA from T. cruzi strains (clones Dm28c, Esmeraldo-
cl3, SO3-cl5 and CL Brener; Tc1161 isolate; G and Y strains)
were applied to nylon membranes (Amersham) using a dot-blot
apparatus (Bio-Rad). DNA was fixed by exposure to 150 mJ of UV
radiation in a ‘‘GS Gene LinkerTM UV chamber’’ (Bio-Rad).
Standard samples containing repetitive sequences DNA were
loaded on the same filters to provide a standard scale. The
following recombinant plasmids were used: clone F3.17, which
carries part of the intergenic region from the L1Tc retro-
transposon and part of reverse transcriptase (nt 1333 to 2021 of
L1Tc, GenBank accession number X83098); clone F4.10, which
carries 3.3 units of satellite DNA (195-bp repeats, GenBank
accession number AY520076) and pUC18 as a background
control. Filters were hybridized in exactly the same way as the
chromoblots. After autoradiographic exposure, the amount of 32P
in each spot was determined by liquid scintillation counting. The
amount of probe sequence in the trypanosome DNA samples was
estimated from a graph of the counts present in the spots of each
repetitive sequence. Copy numbers of repetitive sequences in the
various T. cruzi genomes were calculated taking into consideration
the genome size determined in this study. The pUC18 control was
used to normalize experiment data.
For statistical analysis, a one-way ANOVA test was performed
using GraphPad InStat version 3.05 (GraphPad software, San
Diego, CA). The statistical significance level was set at P,0.05.
Data presented were the result of at least three independent
experiments and plotted as mean 6 SD.
Separation of T. cruzi chromosomal DNA by pulsed-fieldgel electrophoresis (PFGE)
Epimastigotes from T. cruzi were grown to late logarithmic phase.
Cells were collected in PBS and mixed with an equal volume of 1%
low-melting point agarose. Approximately 16107 cells (100 mL) were
used for each gel plug; these were incubated in a solution containing
0.5 M EDTA (pH 8.0), 1% sodium lauryl sarcosinate (Sarkosyl) and
1 mg/mL proteinase K at 50uC for 48 h, and stored at 4uC in 0.5 M
EDTA (pH 8.0). Chromosomal bands were separated on agarose gels
using a Gene Navigator System (Amersham Pharmacia Biotech, NJ,
USA) and a hexagonal electrode array. PFGE was carried out using
1.2% agarose gels in 0.5X TBE (45 mM Tris; 45 mM boric acid;
1 mM EDTA, pH 8.3) at 13uC for 132 h as previously described
[18]. Gels were stained with ethidium bromide (0.5 mg/mL) and
photographed. DNA samples were incubated with 0.25 M HCl for
45 min, denatured with 0.5 M NaOH/1 M NaCl for 20 min,
neutralized with 1 M Tris-base/0.5 M NaCl for 20 min and
transferred to nylon membranes in 20X SSC (1X SSC = 0.15 M
NaCl and 0.015 M sodium citrate). The membranes were hybridized
as described below.
HybridizationMembranes were pre-hybridized in a solution containing
50% formamide/5X SSC/5X Denhardt’s solution (Invitrogen)/
0.1 mg/mL salmon sperm DNA/ 0.1 mg/mL tRNA at 42uC for
1 h and hybridized overnight at 42uC with 32P-labeled probes.
Following hybridization, membranes were subjected to two washes
(30 min each at 42 uC) in 2X SSC containing 0.1% SDS and 0.1%
sodium pyrophosphate and two additional washes at 56 uC in
0.1X SSC containing 0.1% SDS and 0.1% sodium pyrophos-
phate. They were then exposed to X-ray film. The gene
identification and the accession number of each marker used as
probe are indicated in Table S4.
Bioinformatic analysisT. cruzi contigs and scaffolds were assembled into 41 platforms
named chromosomes (TcChr)[32]. The chromosome-sized scaf-
folds assigned to the Esmeraldo and non-Esmeraldo haplotypes
were designated S and P, respectively. The T. cruzi clone CL
Brener (TcChr) and T. brucei (Tb) chromosomes used in this study
were obtained from EuPathDB Project (http://tritrypdb.org/
tritrypdb). Whole genome alignments between TcChr P and S
were performed using tblastx algorithm [33] and implemented
through big_blast.pl script (from Sanger Institute) that was
modified by Jeronimo Ruiz. TcChr chromosomes were also used
in similarity searches using tblastx algorithm against the T. brucei
genomic sequence.
A locally compiled database (DB) of T. cruzi sequences was built
by parsing sequences from GenBank. Chromosome-specific
markers from this database were used as anchors in similarity
searches. Similarity searches against this locally compiled DB were
carried out using the BLAST and FASTA program package
algorithms [34,35]. The annotation and graphical output of
chromosome-specific markers were obtained using the Artemis
Comparison Tool [36] (http://www.sanger. ac.uk/resources/
software/act).
Results
We selected nine strains from the four major T. cruzi lineages
[TcI (DTU I), TcII (DTU IIb), TcV (DTU IId) and TcVI (DTU
IIe)] that are very well characterized in terms of epidemiological,
biological and pathological features [4,8,11,21,37,38,39,40]. The
isolates of DTUs I, II, V and VI predominate in endemic areas
and are responsible for most cases of human Chagas’ disease in
Central America (mostly TcI) and South America (mostly TcII).
Isolates of DTU I are the most widespread isolates of T. cruzi
circulating in sylvatic cycles (in all Latin America) and domestic
cycles (in Central America, Colombia and Venezuela). Charac-
terization of a large number of isolates evidenced important
genetic population diversity within DTU I [39,41,42]. For these
reasons, three isolates from TcI diverging in host and geographic
origin were included in this study.
Fluorescent nucleic acid stain for double-stranded DNAaccurately estimates genome sizes of T. cruzi isolates
The genome size, repetitive DNA content and karyotype of nine
different isolates from the main lineages of T. cruzi were estimated
and compared. Clone CL Brener (TcVI) was chosen for this study
as it is the reference strain for the genome sequencing project. The
ability of the fluorescent dye to estimate the genome size
accurately in three isolates from group TcI (clone Dm28c,
Tc1161 isolate and G strain), two isolates from group TcII (clone
Esmeraldo-cl3 and Y strain), one isolate from group TcV (clone
SO3-cl5) and three isolates from group TcVI (CL strain and CL-
derived clones CL Brener and CL 14) was assessed. The analysis
was performed using parasites arrested with HU, which inactivates
ribonucleoside diphosphate reductase, thereby preventing cells
T. cruzi Chromosome Structure and Evolution
PLoS ONE | www.plosone.org 3 August 2011 | Volume 6 | Issue 8 | e23042
from leaving the G1/S phase of the cell cycle. Non-treated
trypanosomes presented with a profile comprising two peaks
representing cells with 2C and 4C DNA contents, respectively (Fig.
S1). After 24 h incubation with HU, the proportion of 2C cells
increased at least 1.7-fold compared with the corresponding 4C
cells, indicating that epimastigotes were arrested in the G1 phase
(Fig. S1). These results are in agreement with those obtained by
Elias et al. [43]. Cells that were post-S phase at the time of HU
addition would have progressed through the cell cycle and re-
entered G1.
Epimastigote cells in the G1-phase of the cell cycle were used to
estimate DNA content by quantifying the dsDNA. Control
experiments were performed using well-established haploid and
diploid S. cerevisiae lineages. The estimated nuclear DNA contents
of haploid and diploid yeast lineages were 0.01386060.001989
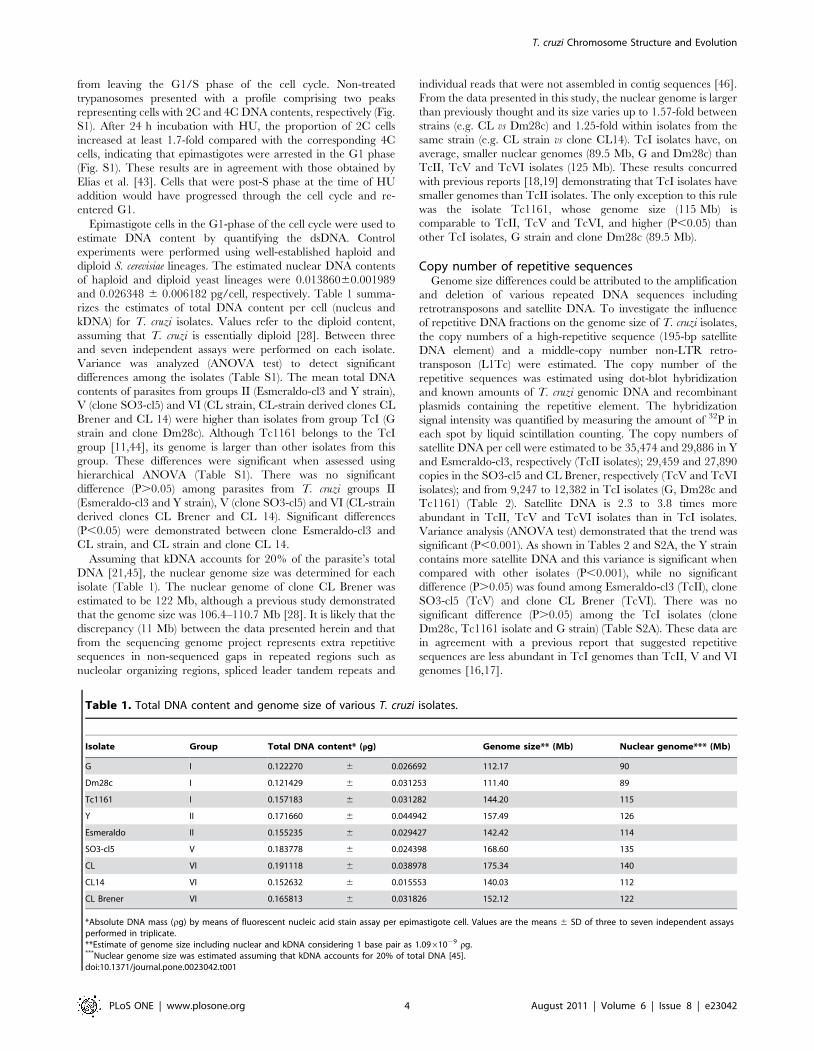
and 0.026348 6 0.006182 pg/cell, respectively. Table 1 summa-
rizes the estimates of total DNA content per cell (nucleus and
kDNA) for T. cruzi isolates. Values refer to the diploid content,
assuming that T. cruzi is essentially diploid [28]. Between three
and seven independent assays were performed on each isolate.
Variance was analyzed (ANOVA test) to detect significant
differences among the isolates (Table S1). The mean total DNA
contents of parasites from groups II (Esmeraldo-cl3 and Y strain),
V (clone SO3-cl5) and VI (CL strain, CL-strain derived clones CL
Brener and CL 14) were higher than isolates from group TcI (G
strain and clone Dm28c). Although Tc1161 belongs to the TcI
group [11,44], its genome is larger than other isolates from this
group. These differences were significant when assessed using
hierarchical ANOVA (Table S1). There was no significant
difference (P.0.05) among parasites from T. cruzi groups II
(Esmeraldo-cl3 and Y strain), V (clone SO3-cl5) and VI (CL-strain
derived clones CL Brener and CL 14). Significant differences
(P,0.05) were demonstrated between clone Esmeraldo-cl3 and
CL strain, and CL strain and clone CL 14.
Assuming that kDNA accounts for 20% of the parasite’s total
DNA [21,45], the nuclear genome size was determined for each
isolate (Table 1). The nuclear genome of clone CL Brener was
estimated to be 122 Mb, although a previous study demonstrated
that the genome size was 106.4–110.7 Mb [28]. It is likely that the
discrepancy (11 Mb) between the data presented herein and that
from the sequencing genome project represents extra repetitive
sequences in non-sequenced gaps in repeated regions such as
nucleolar organizing regions, spliced leader tandem repeats and
individual reads that were not assembled in contig sequences [46].
From the data presented in this study, the nuclear genome is larger
than previously thought and its size varies up to 1.57-fold between
strains (e.g. CL vs Dm28c) and 1.25-fold within isolates from the
same strain (e.g. CL strain vs clone CL14). TcI isolates have, on
average, smaller nuclear genomes (89.5 Mb, G and Dm28c) than
TcII, TcV and TcVI isolates (125 Mb). These results concurred
with previous reports [18,19] demonstrating that TcI isolates have
smaller genomes than TcII isolates. The only exception to this rule
was the isolate Tc1161, whose genome size (115 Mb) is
comparable to TcII, TcV and TcVI, and higher (P,0.05) than
other TcI isolates, G strain and clone Dm28c (89.5 Mb).
Copy number of repetitive sequencesGenome size differences could be attributed to the amplification
and deletion of various repeated DNA sequences including
retrotransposons and satellite DNA. To investigate the influence
of repetitive DNA fractions on the genome size of T. cruzi isolates,
the copy numbers of a high-repetitive sequence (195-bp satellite
DNA element) and a middle-copy number non-LTR retro-
transposon (L1Tc) were estimated. The copy number of the
repetitive sequences was estimated using dot-blot hybridization
and known amounts of T. cruzi genomic DNA and recombinant
plasmids containing the repetitive element. The hybridization
signal intensity was quantified by measuring the amount of 32P in
each spot by liquid scintillation counting. The copy numbers of
satellite DNA per cell were estimated to be 35,474 and 29,886 in Y
and Esmeraldo-cl3, respectively (TcII isolates); 29,459 and 27,890
copies in the SO3-cl5 and CL Brener, respectively (TcV and TcVI
isolates); and from 9,247 to 12,382 in TcI isolates (G, Dm28c and
Tc1161) (Table 2). Satellite DNA is 2.3 to 3.8 times more
abundant in TcII, TcV and TcVI isolates than in TcI isolates.
Variance analysis (ANOVA test) demonstrated that the trend was
significant (P,0.001). As shown in Tables 2 and S2A, the Y strain
contains more satellite DNA and this variance is significant when
compared with other isolates (P,0.001), while no significant
difference (P.0.05) was found among Esmeraldo-cl3 (TcII), clone
SO3-cl5 (TcV) and clone CL Brener (TcVI). There was no
significant difference (P.0.05) among the TcI isolates (clone
Dm28c, Tc1161 isolate and G strain) (Table S2A). These data are
in agreement with a previous report that suggested repetitive
sequences are less abundant in TcI genomes than TcII, V and VI
genomes [16,17].
Table 1. Total DNA content and genome size of various T. cruzi isolates.
Isolate Group Total DNA content* (rg) Genome size** (Mb) Nuclear genome*** (Mb)
G I 0.122270 6 0.026692 112.17 90
Dm28c I 0.121429 6 0.031253 111.40 89
Tc1161 I 0.157183 6 0.031282 144.20 115
Y II 0.171660 6 0.044942 157.49 126
Esmeraldo II 0.155235 6 0.029427 142.42 114
SO3-cl5 V 0.183778 6 0.024398 168.60 135
CL VI 0.191118 6 0.038978 175.34 140
CL14 VI 0.152632 6 0.015553 140.03 112
CL Brener VI 0.165813 6 0.031826 152.12 122
*Absolute DNA mass (rg) by means of fluorescent nucleic acid stain assay per epimastigote cell. Values are the means 6 SD of three to seven independent assaysperformed in triplicate.**Estimate of genome size including nuclear and kDNA considering 1 base pair as 1.0961029 rg.***Nuclear genome size was estimated assuming that kDNA accounts for 20% of total DNA [45].doi:10.1371/journal.pone.0023042.t001
T. cruzi Chromosome Structure and Evolution
PLoS ONE | www.plosone.org 4 August 2011 | Volume 6 | Issue 8 | e23042
L1Tc presented 1.2 to 2.2-fold variation in copy number among
the various isolates. Significant differences were evident (P,0.001)
between of the majority of the isolates (Table S2B). However, no
significant difference (P.0.05) was demonstrated between Dm28c
and Y, Dm28c and CL Brener, or Tc1161 and SO3-cl5. L1Tc is
more abundant in Tc1161 and SO3-cl5 genomes and less
abundant in the G strain and clone Esmeraldo-cl3. There was
no association between high numbers of this repetitive sequence
and TcII, V and VI groups.
Satellite DNA and L1Tc fractions account for 4.47% (5.44 Mb)
and 2.6% (3.18 Mb), respectively, of the genome of clone CL
Brener. This is in agreement with an estimate of abundance of
satellite DNA (5.13%) in clone CL Brener [46] using individual
reads rather than assembled contig sequences generated by the T.
cruzi sequencing consortium [28]. Satellite DNA and L1Tc
fractions comprised 8.62 Mb or 7.1% of the nuclear genome of
CL Brener. The content of a T. cruzi species-specific sequence
(TcTREZO) in the genomes of CL Brener, G, Dm28c and
Tc1161 was determined. TcTREZO is a site-specific element
composed of three sub-regions that have sequence similarity with
other T. cruzi sequences [47]. The copy number of TcTREZO-
related sequences was estimated to be 3,998 elements per cell in
CL Brener and 1,693; 1,546; 1,593 copies in G, Dm28c and
Tc1161, respectively. TcTREZO is 2.5 times more abundant in
CL Brener than TcI isolates. Previously, we used the RepeatMas-
ker script to estimate the number of copies of TcTREZO in the T.
cruzi database [47]. Using the 1,573-bp sequence of TcTREZO
(AF508945) formatted as a custom library, we identified 173 copies
of the complete element per haploid genome. Taken together,
these results suggest that the majority of TcTREZO tandem
sequences were not incorporated into the CL Brener assembled
contig sequences. Furthermore, most of TcTREZO sequences are
truncated (94%).
Our results are in agreement with those from Sylvio X10/1
genome project, a TcI isolate which genome was fully sequenced
recently [48]. By comparison repetitive sequences content between
Sylvio X10/1 and CL Brener, Franzen et al. did not find
significant difference in LTR/LINE copy number and low
number of satellite DNA comparing to CL Brener genome. The
Sylvio X10/1 genome size was estimated to be 88 Mb, similar to
TcI genomes studied herein (G strain and Dm28c).Furthermore,
they confirmed that multigenic families (e.g. MASP, mucin, DGF-
1, GP63 and RHS gene families) are less abundant in Sylvio X10/
1 and underlie genome size difference between these two genomes
fully sequenced (Sylvio X10/1 and CL Brener) [48].
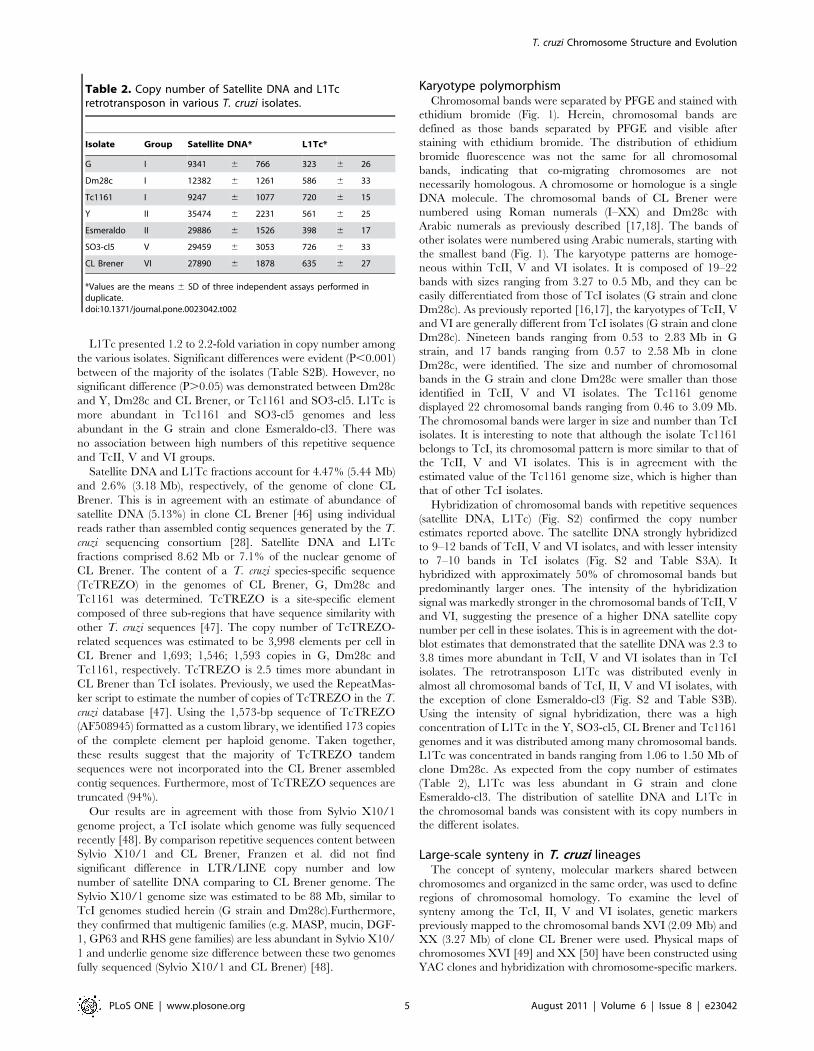
Karyotype polymorphismChromosomal bands were separated by PFGE and stained with
ethidium bromide (Fig. 1). Herein, chromosomal bands are
defined as those bands separated by PFGE and visible after
staining with ethidium bromide. The distribution of ethidium
bromide fluorescence was not the same for all chromosomal
bands, indicating that co-migrating chromosomes are not
necessarily homologous. A chromosome or homologue is a single
DNA molecule. The chromosomal bands of CL Brener were
numbered using Roman numerals (I–XX) and Dm28c with
Arabic numerals as previously described [17,18]. The bands of
other isolates were numbered using Arabic numerals, starting with
the smallest band (Fig. 1). The karyotype patterns are homoge-
neous within TcII, V and VI isolates. It is composed of 19–22
bands with sizes ranging from 3.27 to 0.5 Mb, and they can be
easily differentiated from those of TcI isolates (G strain and clone
Dm28c). As previously reported [16,17], the karyotypes of TcII, V
and VI are generally different from TcI isolates (G strain and clone
Dm28c). Nineteen bands ranging from 0.53 to 2.83 Mb in G
strain, and 17 bands ranging from 0.57 to 2.58 Mb in clone
Dm28c, were identified. The size and number of chromosomal
bands in the G strain and clone Dm28c were smaller than those
identified in TcII, V and VI isolates. The Tc1161 genome
displayed 22 chromosomal bands ranging from 0.46 to 3.09 Mb.
The chromosomal bands were larger in size and number than TcI
isolates. It is interesting to note that although the isolate Tc1161
belongs to TcI, its chromosomal pattern is more similar to that of
the TcII, V and VI isolates. This is in agreement with the
estimated value of the Tc1161 genome size, which is higher than
that of other TcI isolates.
Hybridization of chromosomal bands with repetitive sequences
(satellite DNA, L1Tc) (Fig. S2) confirmed the copy number
estimates reported above. The satellite DNA strongly hybridized
to 9–12 bands of TcII, V and VI isolates, and with lesser intensity
to 7–10 bands in TcI isolates (Fig. S2 and Table S3A). It
hybridized with approximately 50% of chromosomal bands but
predominantly larger ones. The intensity of the hybridization
signal was markedly stronger in the chromosomal bands of TcII, V
and VI, suggesting the presence of a higher DNA satellite copy
number per cell in these isolates. This is in agreement with the dot-
blot estimates that demonstrated that the satellite DNA was 2.3 to
3.8 times more abundant in TcII, V and VI isolates than in TcI
isolates. The retrotransposon L1Tc was distributed evenly in
almost all chromosomal bands of TcI, II, V and VI isolates, with
the exception of clone Esmeraldo-cl3 (Fig. S2 and Table S3B).
Using the intensity of signal hybridization, there was a high
concentration of L1Tc in the Y, SO3-cl5, CL Brener and Tc1161
genomes and it was distributed among many chromosomal bands.
L1Tc was concentrated in bands ranging from 1.06 to 1.50 Mb of
clone Dm28c. As expected from the copy number of estimates
(Table 2), L1Tc was less abundant in G strain and clone
Esmeraldo-cl3. The distribution of satellite DNA and L1Tc in
the chromosomal bands was consistent with its copy numbers in
the different isolates.
Large-scale synteny in T. cruzi lineagesThe concept of synteny, molecular markers shared between
chromosomes and organized in the same order, was used to define
regions of chromosomal homology. To examine the level of
synteny among the TcI, II, V and VI isolates, genetic markers
previously mapped to the chromosomal bands XVI (2.09 Mb) and
XX (3.27 Mb) of clone CL Brener were used. Physical maps of
chromosomes XVI [49] and XX [50] have been constructed using
YAC clones and hybridization with chromosome-specific markers.
Table 2. Copy number of Satellite DNA and L1Tcretrotransposon in various T. cruzi isolates.
Isolate Group Satellite DNA* L1Tc*
G I 9341 6 766 323 6 26
Dm28c I 12382 6 1261 586 6 33
Tc1161 I 9247 6 1077 720 6 15
Y II 35474 6 2231 561 6 25
Esmeraldo II 29886 6 1526 398 6 17
SO3-cl5 V 29459 6 3053 726 6 33
CL Brener VI 27890 6 1878 635 6 27
*Values are the means 6 SD of three independent assays performed induplicate.doi:10.1371/journal.pone.0023042.t002
T. cruzi Chromosome Structure and Evolution
PLoS ONE | www.plosone.org 5 August 2011 | Volume 6 | Issue 8 | e23042
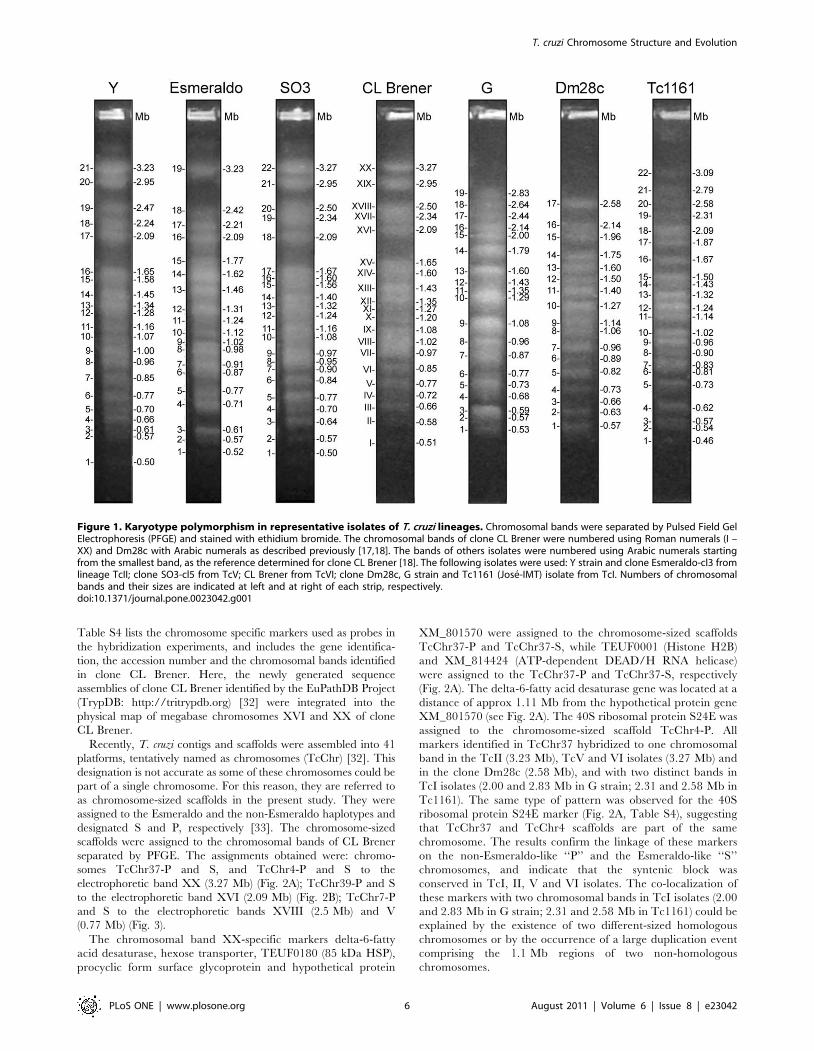
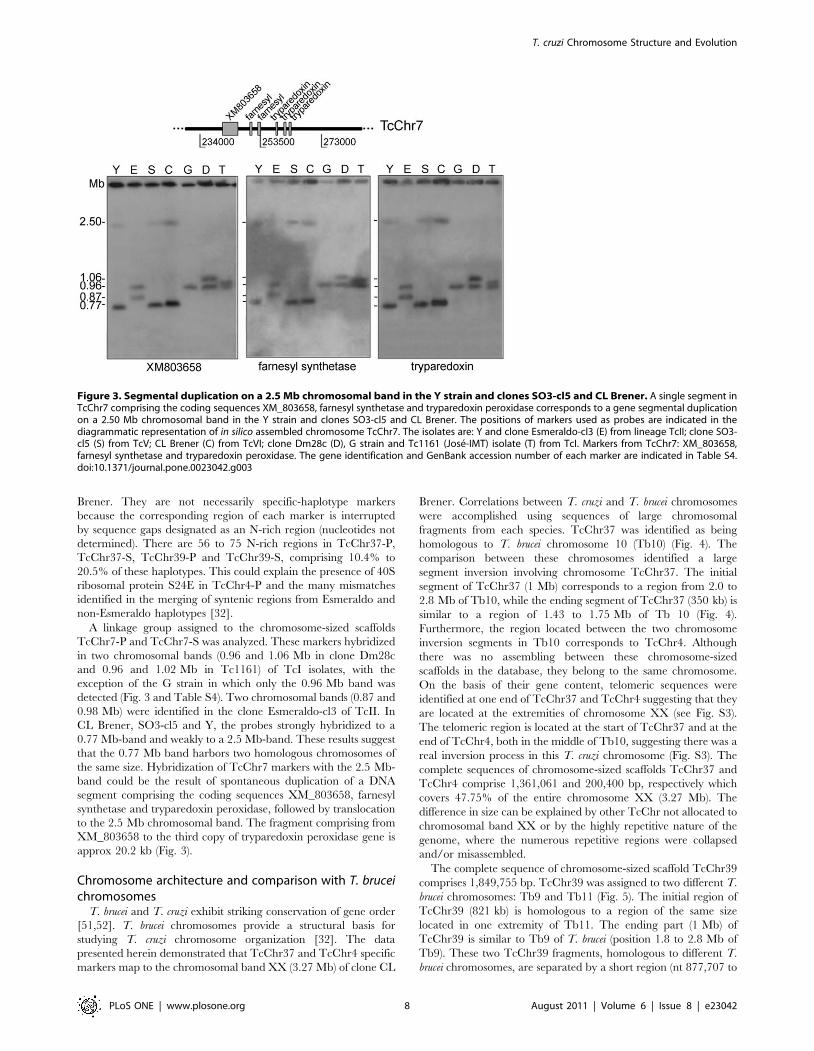
Table S4 lists the chromosome specific markers used as probes in
the hybridization experiments, and includes the gene identifica-
tion, the accession number and the chromosomal bands identified
in clone CL Brener. Here, the newly generated sequence
assemblies of clone CL Brener identified by the EuPathDB Project
(TrypDB: http://tritrypdb.org) [32] were integrated into the
physical map of megabase chromosomes XVI and XX of clone
CL Brener.
Recently, T. cruzi contigs and scaffolds were assembled into 41
platforms, tentatively named as chromosomes (TcChr) [32]. This
designation is not accurate as some of these chromosomes could be
part of a single chromosome. For this reason, they are referred to
as chromosome-sized scaffolds in the present study. They were
assigned to the Esmeraldo and the non-Esmeraldo haplotypes and
designated S and P, respectively [33]. The chromosome-sized
scaffolds were assigned to the chromosomal bands of CL Brener
separated by PFGE. The assignments obtained were: chromo-
somes TcChr37-P and S, and TcChr4-P and S to the
electrophoretic band XX (3.27 Mb) (Fig. 2A); TcChr39-P and S
to the electrophoretic band XVI (2.09 Mb) (Fig. 2B); TcChr7-P
and S to the electrophoretic bands XVIII (2.5 Mb) and V
(0.77 Mb) (Fig. 3).
The chromosomal band XX-specific markers delta-6-fatty
acid desaturase, hexose transporter, TEUF0180 (85 kDa HSP),
procyclic form surface glycoprotein and hypothetical protein
XM_801570 were assigned to the chromosome-sized scaffolds
TcChr37-P and TcChr37-S, while TEUF0001 (Histone H2B)
and XM_814424 (ATP-dependent DEAD/H RNA helicase)
were assigned to the TcChr37-P and TcChr37-S, respectively
(Fig. 2A). The delta-6-fatty acid desaturase gene was located at a
distance of approx 1.11 Mb from the hypothetical protein gene
XM_801570 (see Fig. 2A). The 40S ribosomal protein S24E was
assigned to the chromosome-sized scaffold TcChr4-P. All
markers identified in TcChr37 hybridized to one chromosomal
band in the TcII (3.23 Mb), TcV and VI isolates (3.27 Mb) and
in the clone Dm28c (2.58 Mb), and with two distinct bands in
TcI isolates (2.00 and 2.83 Mb in G strain; 2.31 and 2.58 Mb in
Tc1161). The same type of pattern was observed for the 40S
ribosomal protein S24E marker (Fig. 2A, Table S4), suggesting
that TcChr37 and TcChr4 scaffolds are part of the same
chromosome. The results confirm the linkage of these markers
on the non-Esmeraldo-like ‘‘P’’ and the Esmeraldo-like ‘‘S’’
chromosomes, and indicate that the syntenic block was
conserved in TcI, II, V and VI isolates. The co-localization of
these markers with two chromosomal bands in TcI isolates (2.00
and 2.83 Mb in G strain; 2.31 and 2.58 Mb in Tc1161) could be
explained by the existence of two different-sized homologous
chromosomes or by the occurrence of a large duplication event
comprising the 1.1 Mb regions of two non-homologous
chromosomes.
Figure 1. Karyotype polymorphism in representative isolates of T. cruzi lineages. Chromosomal bands were separated by Pulsed Field GelElectrophoresis (PFGE) and stained with ethidium bromide. The chromosomal bands of clone CL Brener were numbered using Roman numerals (I –XX) and Dm28c with Arabic numerals as described previously [17,18]. The bands of others isolates were numbered using Arabic numerals startingfrom the smallest band, as the reference determined for clone CL Brener [18]. The following isolates were used: Y strain and clone Esmeraldo-cl3 fromlineage TcII; clone SO3-cl5 from TcV; CL Brener from TcVI; clone Dm28c, G strain and Tc1161 (Jose-IMT) isolate from TcI. Numbers of chromosomalbands and their sizes are indicated at left and at right of each strip, respectively.doi:10.1371/journal.pone.0023042.g001
T. cruzi Chromosome Structure and Evolution
PLoS ONE | www.plosone.org 6 August 2011 | Volume 6 | Issue 8 | e23042
The chromosomal band XVI-specific markers phosphatidyli-
nositol (3,5) kinase, H49, JL8, katanin, iron-sulfur cluster assembly
protein, syntaxin and ankyrin were assigned to the chromosome-
sized scaffolds TcChr39-P and TcChr39-S, while the hypothetical
protein XM_811099 was assigned to the TcChr39-S, and
hypothetical protein XM_811753 to the TcChr39-P. TcChr39-P
and TcChr39-S are approximately 1.85 Mb in length. The
XM_811753 was located approx 1.79 Mb from ankyrin (Fig. 2B).
These markers hybridized with two chromosomal bands in the Y
strain (2.09 and 2.24 Mb), CL Brener and SO3-cl5 (2.09 and 2.34
Mb), and with a chromosomal band (2.09 or 2.14 Mb) in
Esmeraldo-cl3 and TcI isolates (Fig. 2B). The two chromosomal
bands identified in hybrids and Y could be different-sized
chromosomes, as demonstrated in clone CL Brener [49]. The
results confirm that this large syntenic block is conserved in TcI,
TcII, TcV and TcVI isolates.
Despite strong chromosomal conservation, some markers are
found only in one haplotype (TcChr-P or TcChr-S) of clone CL
Figure 2. Conservation of large syntenic regions in the genome of T. cruzi lineages. Linkage groups from TcChr37 and TcChr4 (Panel A)and TcChr39 (Panel B) were mapped on chromosomal bands. Specific markers from in silico assembled T. cruzi chromosomes (TcChr) werehybridized with chromosomal bands separated by PFGE. The positions of markers used as probes are indicated in the diagrammatic representation ofin silico assembled chromosomes (TcChr37 and 4, and TcChr39).The isolates are: Y and clone Esmeraldo-cl3 (E) from lineage TcII; clone SO3-cl5 (S)from TcV; clone CL Brener (C) from TcVI; clone Dm28c (D), G strain and Tc1161 (Jose-IMT) isolate (T) from TcI. Markers from TcChr37: XM_801570,THTc, TEUF0001, TEUF0180, TcProcyclic, DEAD-H and delta-6. The marker 40S is located in TcChr4. Markers from TcChr39: XM_811753, H49, PI3,5K,XM_811099, JL8, katanin, iron-sulfur, syntaxin and ankyrin. The gene identification and GenBank accession number of each marker are indicated inTable S4.doi:10.1371/journal.pone.0023042.g002
T. cruzi Chromosome Structure and Evolution
PLoS ONE | www.plosone.org 7 August 2011 | Volume 6 | Issue 8 | e23042
Brener. They are not necessarily specific-haplotype markers
because the corresponding region of each marker is interrupted
by sequence gaps designated as an N-rich region (nucleotides not
determined). There are 56 to 75 N-rich regions in TcChr37-P,
TcChr37-S, TcChr39-P and TcChr39-S, comprising 10.4% to
20.5% of these haplotypes. This could explain the presence of 40S
ribosomal protein S24E in TcChr4-P and the many mismatches
identified in the merging of syntenic regions from Esmeraldo and
non-Esmeraldo haplotypes [32].
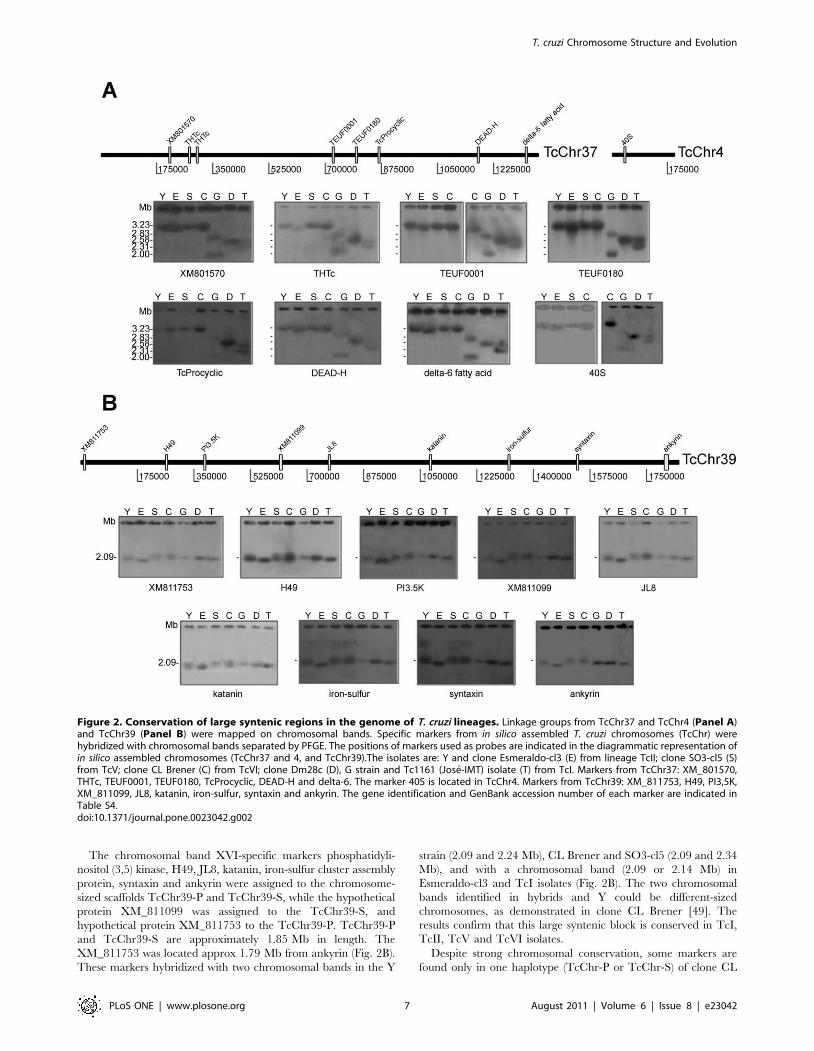
A linkage group assigned to the chromosome-sized scaffolds
TcChr7-P and TcChr7-S was analyzed. These markers hybridized
in two chromosomal bands (0.96 and 1.06 Mb in clone Dm28c
and 0.96 and 1.02 Mb in Tc1161) of TcI isolates, with the
exception of the G strain in which only the 0.96 Mb band was
detected (Fig. 3 and Table S4). Two chromosomal bands (0.87 and
0.98 Mb) were identified in the clone Esmeraldo-cl3 of TcII. In
CL Brener, SO3-cl5 and Y, the probes strongly hybridized to a
0.77 Mb-band and weakly to a 2.5 Mb-band. These results suggest
that the 0.77 Mb band harbors two homologous chromosomes of
the same size. Hybridization of TcChr7 markers with the 2.5 Mb-
band could be the result of spontaneous duplication of a DNA
segment comprising the coding sequences XM_803658, farnesyl
synthetase and tryparedoxin peroxidase, followed by translocation
to the 2.5 Mb chromosomal band. The fragment comprising from
XM_803658 to the third copy of tryparedoxin peroxidase gene is
approx 20.2 kb (Fig. 3).
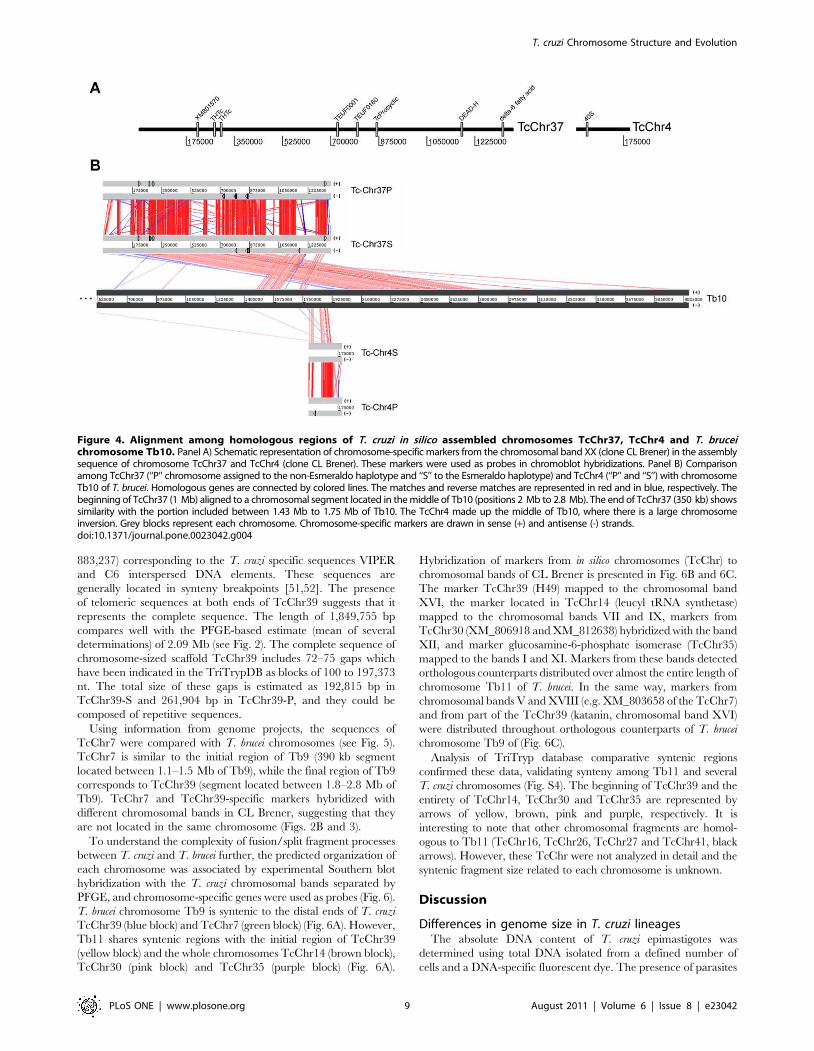
Chromosome architecture and comparison with T. bruceichromosomes
T. brucei and T. cruzi exhibit striking conservation of gene order
[51,52]. T. brucei chromosomes provide a structural basis for
studying T. cruzi chromosome organization [32]. The data
presented herein demonstrated that TcChr37 and TcChr4 specific
markers map to the chromosomal band XX (3.27 Mb) of clone CL
Brener. Correlations between T. cruzi and T. brucei chromosomes
were accomplished using sequences of large chromosomal
fragments from each species. TcChr37 was identified as being
homologous to T. brucei chromosome 10 (Tb10) (Fig. 4). The
comparison between these chromosomes identified a large
segment inversion involving chromosome TcChr37. The initial
segment of TcChr37 (1 Mb) corresponds to a region from 2.0 to
2.8 Mb of Tb10, while the ending segment of TcChr37 (350 kb) is
similar to a region of 1.43 to 1.75 Mb of Tb 10 (Fig. 4).
Furthermore, the region located between the two chromosome
inversion segments in Tb10 corresponds to TcChr4. Although
there was no assembling between these chromosome-sized
scaffolds in the database, they belong to the same chromosome.
On the basis of their gene content, telomeric sequences were
identified at one end of TcChr37 and TcChr4 suggesting that they
are located at the extremities of chromosome XX (see Fig. S3).
The telomeric region is located at the start of TcChr37 and at the
end of TcChr4, both in the middle of Tb10, suggesting there was a
real inversion process in this T. cruzi chromosome (Fig. S3). The
complete sequences of chromosome-sized scaffolds TcChr37 and
TcChr4 comprise 1,361,061 and 200,400 bp, respectively which
covers 47.75% of the entire chromosome XX (3.27 Mb). The
difference in size can be explained by other TcChr not allocated to
chromosomal band XX or by the highly repetitive nature of the
genome, where the numerous repetitive regions were collapsed
and/or misassembled.
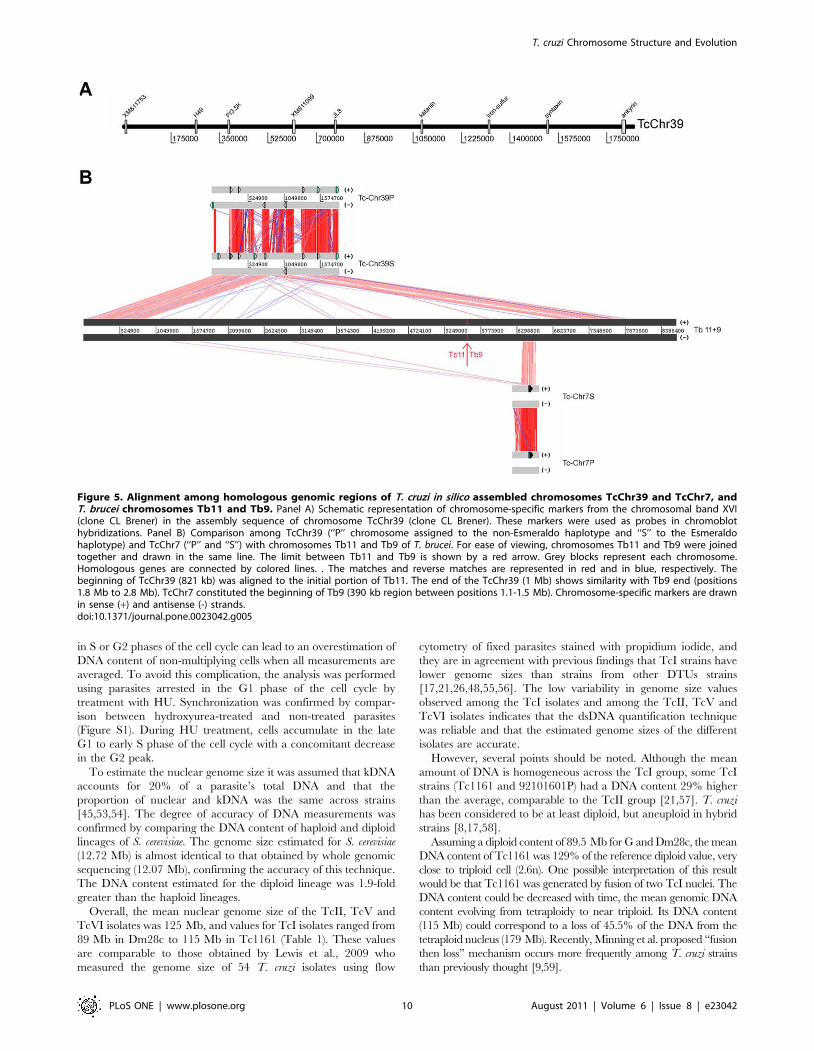
The complete sequence of chromosome-sized scaffold TcChr39
comprises 1,849,755 bp. TcChr39 was assigned to two different T.
brucei chromosomes: Tb9 and Tb11 (Fig. 5). The initial region of
TcChr39 (821 kb) is homologous to a region of the same size
located in one extremity of Tb11. The ending part (1 Mb) of
TcChr39 is similar to Tb9 of T. brucei (position 1.8 to 2.8 Mb of
Tb9). These two TcChr39 fragments, homologous to different T.
brucei chromosomes, are separated by a short region (nt 877,707 to
Figure 3. Segmental duplication on a 2.5 Mb chromosomal band in the Y strain and clones SO3-cl5 and CL Brener. A single segment inTcChr7 comprising the coding sequences XM_803658, farnesyl synthetase and tryparedoxin peroxidase corresponds to a gene segmental duplicationon a 2.50 Mb chromosomal band in the Y strain and clones SO3-cl5 and CL Brener. The positions of markers used as probes are indicated in thediagrammatic representation of in silico assembled chromosome TcChr7. The isolates are: Y and clone Esmeraldo-cl3 (E) from lineage TcII; clone SO3-cl5 (S) from TcV; CL Brener (C) from TcVI; clone Dm28c (D), G strain and Tc1161 (Jose-IMT) isolate (T) from TcI. Markers from TcChr7: XM_803658,farnesyl synthetase and tryparedoxin peroxidase. The gene identification and GenBank accession number of each marker are indicated in Table S4.doi:10.1371/journal.pone.0023042.g003
T. cruzi Chromosome Structure and Evolution
PLoS ONE | www.plosone.org 8 August 2011 | Volume 6 | Issue 8 | e23042
883,237) corresponding to the T. cruzi specific sequences VIPER
and C6 interspersed DNA elements. These sequences are
generally located in synteny breakpoints [51,52]. The presence
of telomeric sequences at both ends of TcChr39 suggests that it
represents the complete sequence. The length of 1,849,755 bp
compares well with the PFGE-based estimate (mean of several
determinations) of 2.09 Mb (see Fig. 2). The complete sequence of
chromosome-sized scaffold TcChr39 includes 72–75 gaps which
have been indicated in the TriTrypDB as blocks of 100 to 197,373
nt. The total size of these gaps is estimated as 192,815 bp in
TcChr39-S and 261,904 bp in TcChr39-P, and they could be
composed of repetitive sequences.
Using information from genome projects, the sequences of
TcChr7 were compared with T. brucei chromosomes (see Fig. 5).
TcChr7 is similar to the initial region of Tb9 (390 kb segment
located between 1.1–1.5 Mb of Tb9), while the final region of Tb9
corresponds to TcChr39 (segment located between 1.8–2.8 Mb of
Tb9). TcChr7 and TcChr39-specific markers hybridized with
different chromosomal bands in CL Brener, suggesting that they
are not located in the same chromosome (Figs. 2B and 3).
To understand the complexity of fusion/split fragment processes
between T. cruzi and T. brucei further, the predicted organization of
each chromosome was associated by experimental Southern blot
hybridization with the T. cruzi chromosomal bands separated by
PFGE, and chromosome-specific genes were used as probes (Fig. 6).
T. brucei chromosome Tb9 is syntenic to the distal ends of T. cruzi
TcChr39 (blue block) and TcChr7 (green block) (Fig. 6A). However,
Tb11 shares syntenic regions with the initial region of TcChr39
(yellow block) and the whole chromosomes TcChr14 (brown block),
TcChr30 (pink block) and TcChr35 (purple block) (Fig. 6A).
Hybridization of markers from in silico chromosomes (TcChr) to
chromosomal bands of CL Brener is presented in Fig. 6B and 6C.
The marker TcChr39 (H49) mapped to the chromosomal band
XVI, the marker located in TcChr14 (leucyl tRNA synthetase)
mapped to the chromosomal bands VII and IX, markers from
TcChr30 (XM_806918 and XM_812638) hybridized with the band
XII, and marker glucosamine-6-phosphate isomerase (TcChr35)
mapped to the bands I and XI. Markers from these bands detected
orthologous counterparts distributed over almost the entire length of
chromosome Tb11 of T. brucei. In the same way, markers from
chromosomal bands V and XVIII (e.g. XM_803658 of the TcChr7)
and from part of the TcChr39 (katanin, chromosomal band XVI)
were distributed throughout orthologous counterparts of T. brucei
chromosome Tb9 of (Fig. 6C).
Analysis of TriTryp database comparative syntenic regions
confirmed these data, validating synteny among Tb11 and several
T. cruzi chromosomes (Fig. S4). The beginning of TcChr39 and the
entirety of TcChr14, TcChr30 and TcChr35 are represented by
arrows of yellow, brown, pink and purple, respectively. It is
interesting to note that other chromosomal fragments are homol-
ogous to Tb11 (TcChr16, TcChr26, TcChr27 and TcChr41, black
arrows). However, these TcChr were not analyzed in detail and the
syntenic fragment size related to each chromosome is unknown.
Discussion
Differences in genome size in T. cruzi lineagesThe absolute DNA content of T. cruzi epimastigotes was
determined using total DNA isolated from a defined number of
cells and a DNA-specific fluorescent dye. The presence of parasites
Figure 4. Alignment among homologous regions of T. cruzi in silico assembled chromosomes TcChr37, TcChr4 and T. bruceichromosome Tb10. Panel A) Schematic representation of chromosome-specific markers from the chromosomal band XX (clone CL Brener) in the assemblysequence of chromosome TcChr37 and TcChr4 (clone CL Brener). These markers were used as probes in chromoblot hybridizations. Panel B) Comparisonamong TcChr37 (‘‘P’’ chromosome assigned to the non-Esmeraldo haplotype and ‘‘S’’ to the Esmeraldo haplotype) and TcChr4 (‘‘P’’ and ‘‘S’’) with chromosomeTb10 of T. brucei. Homologous genes are connected by colored lines. The matches and reverse matches are represented in red and in blue, respectively. Thebeginning of TcChr37 (1 Mb) aligned to a chromosomal segment located in the middle of Tb10 (positions 2 Mb to 2.8 Mb). The end of TcChr37 (350 kb) showssimilarity with the portion included between 1.43 Mb to 1.75 Mb of Tb10. The TcChr4 made up the middle of Tb10, where there is a large chromosomeinversion. Grey blocks represent each chromosome. Chromosome-specific markers are drawn in sense (+) and antisense (-) strands.doi:10.1371/journal.pone.0023042.g004
T. cruzi Chromosome Structure and Evolution
PLoS ONE | www.plosone.org 9 August 2011 | Volume 6 | Issue 8 | e23042
in S or G2 phases of the cell cycle can lead to an overestimation of
DNA content of non-multiplying cells when all measurements are
averaged. To avoid this complication, the analysis was performed
using parasites arrested in the G1 phase of the cell cycle by
treatment with HU. Synchronization was confirmed by compar-
ison between hydroxyurea-treated and non-treated parasites
(Figure S1). During HU treatment, cells accumulate in the late
G1 to early S phase of the cell cycle with a concomitant decrease
in the G2 peak.
To estimate the nuclear genome size it was assumed that kDNA
accounts for 20% of a parasite’s total DNA and that the
proportion of nuclear and kDNA was the same across strains
[45,53,54]. The degree of accuracy of DNA measurements was
confirmed by comparing the DNA content of haploid and diploid
lineages of S. cerevisiae. The genome size estimated for S. cerevisiae
(12.72 Mb) is almost identical to that obtained by whole genomic
sequencing (12.07 Mb), confirming the accuracy of this technique.
The DNA content estimated for the diploid lineage was 1.9-fold
greater than the haploid lineages.
Overall, the mean nuclear genome size of the TcII, TcV and
TcVI isolates was 125 Mb, and values for TcI isolates ranged from
89 Mb in Dm28c to 115 Mb in Tc1161 (Table 1). These values
are comparable to those obtained by Lewis et al., 2009 who
measured the genome size of 54 T. cruzi isolates using flow
cytometry of fixed parasites stained with propidium iodide, and
they are in agreement with previous findings that TcI strains have
lower genome sizes than strains from other DTUs strains
[17,21,26,48,55,56]. The low variability in genome size values
observed among the TcI isolates and among the TcII, TcV and
TcVI isolates indicates that the dsDNA quantification technique
was reliable and that the estimated genome sizes of the different
isolates are accurate.
However, several points should be noted. Although the mean
amount of DNA is homogeneous across the TcI group, some TcI
strains (Tc1161 and 92101601P) had a DNA content 29% higher
than the average, comparable to the TcII group [21,57]. T. cruzi
has been considered to be at least diploid, but aneuploid in hybrid
strains [8,17,58].
Assuming a diploid content of 89.5 Mb for G and Dm28c, the mean
DNA content of Tc1161 was 129% of the reference diploid value, very
close to triploid cell (2.6n). One possible interpretation of this result
would be that Tc1161 was generated by fusion of two TcI nuclei. The
DNA content could be decreased with time, the mean genomic DNA
content evolving from tetraploidy to near triploid. Its DNA content
(115 Mb) could correspond to a loss of 45.5% of the DNA from the
tetraploid nucleus (179 Mb). Recently, Minning et al. proposed ‘‘fusion
then loss’’ mechanism occurs more frequently among T. cruzi strains
than previously thought [9,59].
Figure 5. Alignment among homologous genomic regions of T. cruzi in silico assembled chromosomes TcChr39 and TcChr7, andT. brucei chromosomes Tb11 and Tb9. Panel A) Schematic representation of chromosome-specific markers from the chromosomal band XVI(clone CL Brener) in the assembly sequence of chromosome TcChr39 (clone CL Brener). These markers were used as probes in chromoblothybridizations. Panel B) Comparison among TcChr39 (‘‘P’’ chromosome assigned to the non-Esmeraldo haplotype and ‘‘S’’ to the Esmeraldohaplotype) and TcChr7 (‘‘P’’ and ‘‘S’’) with chromosomes Tb11 and Tb9 of T. brucei. For ease of viewing, chromosomes Tb11 and Tb9 were joinedtogether and drawn in the same line. The limit between Tb11 and Tb9 is shown by a red arrow. Grey blocks represent each chromosome.Homologous genes are connected by colored lines. . The matches and reverse matches are represented in red and in blue, respectively. Thebeginning of TcChr39 (821 kb) was aligned to the initial portion of Tb11. The end of the TcChr39 (1 Mb) shows similarity with Tb9 end (positions1.8 Mb to 2.8 Mb). TcChr7 constituted the beginning of Tb9 (390 kb region between positions 1.1-1.5 Mb). Chromosome-specific markers are drawnin sense (+) and antisense (-) strands.doi:10.1371/journal.pone.0023042.g005
T. cruzi Chromosome Structure and Evolution
PLoS ONE | www.plosone.org 10 August 2011 | Volume 6 | Issue 8 | e23042

It is interesting to note that 92101601P and Tc1161 strains have
diverse origins; 92101601P was isolated from Didelphis marsupialis in
the United States [21,57] and Tc1161 (Jose-IMT) from a north-
eastern Brazilian patient with end-stage chronic Chagasic
cardiomyopathy [44]. The results presented herein agree with
recent findings that sylvatic TcI populations are more genetically
diverse than previously thought [21,39,41]. Recently, Cura et al.
proposed a subdivision in TcI group (TcI a- TcI e) based on
microsatellite motif of the intergenic spacer of Spliced-Leader gene
relating to geographical distribution and transmission cycle [41]
while Ocana- Mayorga et al. identified geneticatlly distinct groups
in TcI studying microsatellite data for ten variable loci [42].
Furthermore, in Tc1161 there are more chromosomal bands that
are larger than in other TcI isolates, suggesting that the genome
size changes could have occurred due to chromosomal aneuploidy.
It is suggested that changes in genome size in TcI strains are
relatively small and occur frequently, and involve gains of
chromosomes. Karyotypic variations are frequent among trypano-
somes and may be due to the non-disjunction of chromosomes at
mitosis and the irregularity of genetic exchange in these organisms
[38,60].
The TcI group differs from other groups (TcII, TcV and TcVI)
with regard to their genome size, and satellite DNA content is
correlated with genome size for all isolates. This has not been
accompanied by the simultaneous amplification of retrotranspo-
sons. The increase in genome size of TcII, TcV and TcVI isolates
cannot be attributed solely to an increase in its satellite DNA
amount. Other non-coding, repetitive DNA elements such as
microsatellites, simple sequence repeats and large gene families of
surface proteins can account for differences in genome size. In
addition, karyotypic changes involving the gain of chromosomes
were observed. Although the DNA content differs significantly
among the T. cruzi lineages, the grouping of isolates by genome
size agrees with the phylogenetic grouping, except for TC1161.
Synteny, chromosome polymorphism and evolutionRegardless of chromosomal polymorphism, large syntenic
groups are conserved among T. cruzi lineages (TcI, TcII, TcV
and TcVI). Two large syntenic groups of 1.1 and 1.8 Mb in size
(TcChr37 and TcChr39) were mapped to chromosomal bands
XX and XVI of clone CL Brener, respectively. All specific
markers demonstrated the same hybridization pattern in each
Figure 6. Split and fusion events among T. cruzi and T. brucei chromosomes. Panel A) Comparison among homologous regions of T. cruzichromosomes TcChr39, TcChr7, TcChr14, TcChr30 and TcChr35 and T. brucei chromosomes Tb11 and Tb9. The homologous regions of TcChr7 (greenbox) and the end of TcChr39 (blue box) comprise the beginning and the end of Tb9, respectively. The beginning of TcChr39 and the entire T. cruzichromosomes TcChr14, TcChr30 and TcChr35 were assigned to different regions of Tb11. Soft and dark grey blocks represent T. cruzi and T. bruceichromosomes, respectively. Panel B) Markers XM_803658 and katanin located in T. cruzi homologous regions to Tb9 were hybridized withchromosomal bands of clone CL Brener. Panel C) Markers located in T. cruzi homologous regions to Tb11 were hybridized with chromosomal bandsof clone CL Brener. The probes were the following: H49, leucyl, XM_806918, XM_812638 and glucosamine. The gene identification and the accessionnumber of each marker are indicated in Table S4.doi:10.1371/journal.pone.0023042.g006
T. cruzi Chromosome Structure and Evolution
PLoS ONE | www.plosone.org 11 August 2011 | Volume 6 | Issue 8 | e23042
isolate, suggesting the maintenance of gene order. Recently,
strong synteny was confirmed by Sylvio X10/1 (TcI) genome
sequencing data after comparison with CL Brener database [48].
Despite the large genetic distances that separate the lineages of T.
cruzi [61], they exhibit conservation of chromosome structure.
The syntenic regions are much larger than expected if
rearrangements occur randomly, suggesting that they are
conserved owing to positive selection. The results suggest a
highly dynamic genome, which could be sorted into stable regions
with genes coding for core activities, and dynamic regions where
repetitive sequences and multigenic families are located. By array
comparative genomic hybridization, Minning et al. described
widespread Copy Number Variation among T. cruzi isolates [59].
It is more frequent in hot-spot sites where there are located a
great number of repetitive elements and multigenic family in
every chromosome [59].
The other syntenic group (TcChr7) was assigned to a single
chromosomal band in the G strain, and two bands of similar size
in isolates Esmeraldo-cl3, Dm28c and Tc1161 which could
correspond to size-polymorphic homologous chromosomes.
However, in other isolates (Y, CL Brener and SO3-cl5) the
TcChr7 markers hybridized with two bands that differ greatly in
size, 0.77 Mb (band V) and 2.5 Mb (band XVIII). The strong
hybridization of the 0.77 Mb band with TcChr7 markers suggests
that this band contains two homologous chromosomes of the
same size. The weak hybridization signal of TcChr7 markers with
the 2.5 Mb-band could be explained by the occurrence of a
segment duplication in the 0.77 Mb-band followed by an
insertion event in the larger 2.5 Mb-chromosome. By means of
array comparative genomic hybridization, Minning et al.
described that aneuploidies of chromosomes fragments are clearly
evident [59]. The authors demonstrated a segmental aneuploidy
in Brazil strain involving a 500 kb-fragment in the TcChr39 [59].
Herein, the duplicated chromosome-sized region was retained on
both chromosomal bands as paralogous loci, increasing the
dosage of several genes.
The results demonstrated that the integration of in silico
assembled chromosome sequences and the molecular karyotype
allowed the chromosomes present in the chromosomal bands to be
identified and errors to be corrected, improving the quality of
these complementary resources. This provides a valuable resource
for comparative genomics of distinct T. cruzi lineages and between
trypanosomatids.
Comparison of the genomes of Trypanosoma species is essential
for identifying genetic changes involved in the acquisition of
unique features in each species such as virulence factors (antigenic
variation and antigenic variability), and developmental intracellu-
lar forms. By comparing the in silico assembled T. cruzi sequences
with T. brucei chromosomes, homologous chromosomal regions in
T. brucei would be defined. The chromosomeTb9 shares various
regions of syntenic homology with T. cruzi chromosomes TcChr7
and 39, and chromosome Tb11 with TcChr14, 30, 35 and 39.
The mapping of the syntenic regions on T. cruzi chromosomal
bands provides evidence for the occurrence of fusion and split
events involving T. brucei and T. cruzi chromosomes. Specific
markers for the T. cruzi chromosomes belong to syntenic regions
on Tb9 and Tb11 chromosomes hybridized with distinct
chromosomal bands in CL Brener. For instance, markers of Tb9
were mapped to T. cruzi chromosomal bands V, XVI and XVIII,
whereas markers for Tb11 hybridized with bands I, VII, IX, XI,
XII, and XVI. By comparing the sequences of large chromosomal
fragments from T. brucei, T. cruzi and L. major, Ghedin et al.
proposed two alternative hypotheses to explain the genomic
architecture in trypanosomatids [52]. The first hypothesis assumes
that the ancestor of trypanosomatids had large chromosomes
similar to those observed in T. brucei. Therefore, two independent
fragmentation events would have occurred, one in the lineage
leading to Leishmania and another leading to T. cruzi. Alternatively,
if the ancestral state corresponded to smaller chromosomes only
one event had to occur, a chromosomal fusion in the lineage
leading to T. brucei.
Available information cannot determine which of these two
hypotheses is most likely. However, the results presented in this
study favor the second hypothesis. The data confirmed the
occurrence of fusion and split events involving T. brucei and T.
cruzi chromosomes, and suggest that the common ancestor of
trypanosomes had small chromosomes and a more fragmented
genomic organization; during speciation these fragments joined
in different combinations, forming different genomes at the same
time. It is likely that there is a selective pressure to keep gene
order, although several karyotypic changes could be genetically
neutral.
In the present study, data from chromosomal mapping and
karyotyping were integrated with genome sequence data. The
integrated map facilitated draft genome assembly and is a valuable
resource for comparative genomics of trypanosomatids.
Supporting Information
Figure S1 Flow cytometry analysis demonstrating DNAsynchronization after HU treatment of T. cruzi epimas-tigotes. Panels A, B, C and D present Flow cytometry analysis of
propidium iodide-stained epimastigotes of G strain (TcI), Y strain
(TcII), clone SO3-cl5 (TcV) and clone CL Brener (TcVI),
respectively. Histograms of non-treated-parasites are presented
on the left and those treated with 20 mM HU for 24 h are
presented on the right. The number above the first peak
corresponds to the percentage of cells in G1 phase and that above
the second peak to the S/G2 phase.
(TIF)
Figure S2 Mapping of repetitive element satellite DNAand L1Tc retrotransposons on chromosomal bands ofvarious isolates. Chromosomal bands of Y strain and clone
Esmeraldo-cl3 (E) from TcII; SO3-cl5 (S) from TcV; clone CL
Brener (C) from TcVI; and clone G strain, clone Dm28c (D) and
Tc1161 (Jose-IMT) isolate (T) from lineage TcI were separated by
PFGE, transferred to nylon membranes and hybridized with
probes satellite DNA and L1Tc, shown at left and at right of the
figure, respectively.
(TIF)
Figure S3 Illustration of synteny between the chromo-somal band XX of clone CL Brener and T. bruceichromosome 10 (Tb10). Panel A) Schematic representation of
a chromosome comprising the scaffolds TcChr37 and TcChr4
within chromosomal band XX. The complete sequences of
chromosome-sized scaffolds TcChr37 and TcChr4 comprise
41.6% of the entire chromosome XX (3.27 Mb). Panel B) The
beginning of TcChr37 (red rectangle, 1 Mb) aligned to a
chromosomal segment located at the middle of Tb10 (positions
2 Mb to 2.8 Mb). The end of the TcChr37 (blue rectangle,
350 kb) shows similarity with the portion included between
1.43 Mb to 1.75 Mb of Tb10. The TcChr4 (green rectangle)
comprises the middle of Tb10 where there is a large chromosome
inversion. Alignment among homologous genomic regions of T.
cruzi chromosomes TcChr37 and TcChr4, and T. brucei chromo-
some Tb10. Homologous genes are connected by grey lines. On
the basis of their gene contents, telomeric regions are located in
T. cruzi Chromosome Structure and Evolution
PLoS ONE | www.plosone.org 12 August 2011 | Volume 6 | Issue 8 | e23042
the beginning of TcChr37 and at the end of TcChr4. Telomeric
sequences located at the extremities of chromosome XX are
indicated by red and green triangles, respectively. Soft and dark
grey blocks represent T. cruzi and T. brucei chromosomes,
respectively.
(TIF)
Figure S4 Overview of Tb11 compared with T. cruziEsmeraldo genomic sequences using TriTrypDB com-parative syntenic regions analysis. Tb11 was assigned to
different T. cruzi chromosomes. The beginning of TcChr39,
TcChr14, TcChr30 and TcChr35 are represented by yellow,
brown, pink and purple arrows, respectively. Fragments belonging
to other TcChr are demonstrated with black arrows. As
demonstrated in Fig. 6, the syntenic regions located in Tb11 are
distributed in different T. cruzi chromosomes: TcChr39 was
assigned to chromosomal band XVI, TcChr14 to bands VII and
IX, TcChr30 to band XII and TcChr35 to bands I and XI. The
gene identification and the accession number of each marker are
indicated in Table S4.
(TIF)
Table S1 Variance analysis (ANOVA) of genome sizes inT. cruzi isolates.
(XLS)
Table S2 Variance analysis (ANOVA) of Satellite DNA(A) and L1Tc retrotransposon (B) copy numbers invarious T. cruzi isolates.(XLS)
Table S3 Chromosome localization of Satellite DNA (A)and L1Tc retrotransposon (B) in various T. cruziisolates.(XLS)
Table S4 Chromosomal localization of T. cruzi markersused in hybridization experiments.(XLS)
Acknowledgments
We thank Dr. Nobuko Yoshida for kindly providing clone CL14 and
strains G, Y and CL used in several experiments and Dr. Bianca Zingales
(IQ-USP), Dr. Marta de Lana (UFOP) and Dr. Santuza Teixeira (UFMG)
for providing clone CL Brener, clone SO3-cl5 and clone Esmeraldo-cl3,
respectively. We also thank BioMedES (http://www.biomedes.co.uk/) for
revision of the English language.
Author Contributions
Conceived and designed the experiments: RTS FML JCR JFdS.
Performed the experiments: RTS FML RMB DRC MFS. Analyzed the
data: RTS FML EMC JCR SG MMGT JFdS. Contributed reagents/
materials/analysis tools: JCR SG MMGT. Wrote the paper: RTS JFdS.
References
1. Rassi A, Jr., Rassi A, Marin-Neto JA (2010) Chagas disease. Lancet 375:1388–1402.
2. Schmunis GA, Yadon ZE (2010) Chagas disease: a Latin American healthproblem becoming a world health problem. Acta Trop 115: 14–21.
3. Bern C, Montgomery SP, Herwaldt BL, Rassi A, Jr., Marin-Neto JA, et al.
(2007) Evaluation and treatment of chagas disease in the United States: asystematic review. JAMA 298: 2171–2181.
4. Tibayrenc M (2003) Genetic subdivisions within Trypanosoma cruzi (Discrete
Typing Units) and their relevance for molecular epidemiology and experimental
evolution. Kinetoplastid Biol Dis 2: 12.
5. Tibayrenc M (1998) Genetic epidemiology of parasitic protozoa and otherinfectious agents: the need for an integrated approach. Int J Parasitol 28: 85–104.
6. Tibayrenc M, Ward P, Moya A, Ayala FJ (1986) Natural populations of
Trypanosoma cruzi, the agent of Chagas disease, have a complex multiclonalstructure. Proc Natl Acad Sci U S A 83: 115–119.
7. Tomazi L, Kawashita SY, Pereira PM, Zingales B, Briones MR (2009)
Haplotype distribution of five nuclear genes based on network genealogies and
Bayesian inference indicates that Trypanosoma cruzi hybrid strains arepolyphyletic. Genet Mol Res 8: 458–476.
8. Westenberger SJ, Barnabe C, Campbell DA, Sturm NR (2005) Two
hybridization events define the population structure of Trypanosoma cruzi.Genetics 171: 527–543.
9. Gaunt MW, Yeo M, Frame IA, Stothard JR, Carrasco HJ, et al. (2003)
Mechanism of genetic exchange in American trypanosomes. Nature 421:
936–939.
10. de Freitas JM, Augusto-Pinto L, Pimenta JR, Bastos-Rodrigues L, Goncalves VF,et al. (2006) Ancestral genomes, sex, and the population structure of
Trypanosoma cruzi. PLoS Pathog 2: e24.
11. Zingales B, Andrade SG, Briones MR, Campbell DA, Chiari E, et al. (2009) Anew consensus for Trypanosoma cruzi intraspecific nomenclature: second
revision meeting recommends TcI to TcVI. Mem Inst Oswaldo Cruz 104:
1051–1054.
12. Henriksson J, Pettersson U, Solari A (1993) Trypanosoma cruzi: correlationbetween karyotype variability and isoenzyme classification. Exp Parasitol 77:
334–348.
13. Henriksson J, Aslund L, Pettersson U (1996) Karyotype variability inTrypanosoma cruzi. Parasitol Today 12: 108–114.
14. Henriksson J, Dujardin JC, Barnabe C, Brisse S, Timperman G, et al. (2002)
Chromosomal size variation in Trypanosoma cruzi is mainly progressive and is
evolutionarily informative. Parasitology 124: 277–286.
15. Henriksson J, Aslund L, Macina RA, Franke de Cazzulo BM, Cazzulo JJ, et al.(1990) Chromosomal localization of seven cloned antigen genes provides
evidence of diploidy and further demonstration of karyotype variability inTrypanosoma cruzi. Mol Biochem Parasitol 42: 213–223.
16. Pedroso A, Cupolillo E, Zingales B (2003) Evaluation of Trypanosoma cruzi
hybrid stocks based on chromosomal size variation. Mol Biochem Parasitol 129:
79–90.
17. Vargas N, Pedroso A, Zingales B (2004) Chromosomal polymorphism, gene
synteny and genome size in T. cruzi I and T. cruzi II groups. Mol Biochem
Parasitol 138: 131–141.
18. Cano MI, Gruber A, Vazquez M, Cortes A, Levin MJ, et al. (1995) Molecular
karyotype of clone CL Brener chosen for the Trypanosoma cruzi genome
project. Mol Biochem Parasitol 71: 273–278.
19. Henriksson J, Porcel B, Rydaker M, Ruiz A, Sabaj V, et al. (1995) Chromosome
specific markers reveal conserved linkage groups in spite of extensive
chromosomal size variation in Trypanosoma cruzi. Mol Biochem Parasitol 73:
63–74.
20. Santos MR, Cano MI, Schijman A, Lorenzi H, Vazquez M, et al. (1997) The
Trypanosoma cruzi genome project: nuclear karyotype and gene mapping of
clone CL Brener. Mem Inst Oswaldo Cruz 92: 821–828.
21. Lewis MD, Llewellyn MS, Gaunt MW, Yeo M, Carrasco HJ, et al. (2009) Flow
cytometric analysis and microsatellite genotyping reveal extensive DNA content
variation in Trypanosoma cruzi populations and expose contrasts between
natural and experimental hybrids. Int J Parasitol 39: 1305–1317.
22. McDaniel JP, Dvorak JA (1993) Identification, isolation, and characterization of
naturally-occurring Trypanosoma cruzi variants. Mol Biochem Parasitol 57:
213–222.
23. Thompson CT, Dvorak JA (1989) Quantitation of total DNA per cell in an
exponentially growing population using the diphenylamine reaction and flow
cytometry. Anal Biochem 177: 353–357.
24. Castro C, Craig SP, Castaneda M (1981) Genome organization and ploidy
number in Trypanosoma cruzi. Mol Biochem Parasitol 4: 273–282.
25. Lanar DE, Levy LS, Manning JE (1981) Complexity and content of the DNA
and RNA in Trypanosoma cruzi. Mol Biochem Parasitol 3: 327–341.
26. Dvorak JA, Hall TE, Crane MS, Engel JC, McDaniel JP, et al. (1982)
Trypanosoma cruzi: flow cytometric analysis. I. Analysis of total DNA/organism
by means of mithramycin-induced fluorescence. J Protozool 29: 430–437.
27. Kooy RF, Ashall F, Van der Ploeg M, Overdulve JP (1989) On the DNA content
of Trypanosoma cruzi. Mol Biochem Parasitol 36: 73–76.
28. El-Sayed NM, Myler PJ, Bartholomeu DC, Nilsson D, Aggarwal G, et al. (2005)
The genome sequence of Trypanosoma cruzi, etiologic agent of Chagas disease.
Science 309: 409–415.
29. Machado CA, Ayala FJ (2001) Nucleotide sequences provide evidence of genetic
exchange among distantly related lineages of Trypanosoma cruzi. Proc Natl
Acad Sci U S A 98: 7396–7401.
30. Araya J, Cano MI, Gomes HB, Novak EM, Requena JM, et al. (1997)
Characterization of an interspersed repetitive DNA element in the genome of
Trypanosoma cruzi. Parasitology 115((Pt6)): 563–570.
31. Cornillot E, Keller B, Cushion MT, Metenier G, Vivares CP (2002) Fine
analysis of the Pneumocystis carinii f. sp. carinii genome by two-dimensional
pulsed-field gel electrophoresis. Gene 293: 87–95.
32. Weatherly DB, Boehlke C, Tarleton RL (2009) Chromosome level assembly of
the hybrid Trypanosoma cruzi genome. BMC Genomics 10: 255.
T. cruzi Chromosome Structure and Evolution
PLoS ONE | www.plosone.org 13 August 2011 | Volume 6 | Issue 8 | e23042
33. Altschul SF, Gish W, Miller W, Myers EW, Lipman DJ (1990) Basic local
alignment search tool. J Mol Biol 215: 403–410.
34. Pearson WR, Lipman DJ (1988) Improved tools for biological sequence
comparison. Proc Natl Acad Sci U S A 85: 2444–2448.
35. Pearson WR, Miller W (1992) Dynamic programming algorithms for biological
sequence comparison. Methods Enzymol 210: 575–601.
36. Carver TJ, Rutherford KM, Berriman M, Rajandream MA, Barrell BG, et al.
(2005) ACT: the Artemis Comparison Tool. Bioinformatics 21: 3422–3423.
37. Brisse S, Dujardin JC, Tibayrenc M (2000) Identification of six Trypanosoma
cruzi lineages by sequence-characterised amplified region markers. Mol
Biochem Parasitol 111: 95–105.
38. Campbell DA, Westenberger SJ, Sturm NR (2004) The determinants of Chagas
disease: connecting parasite and host genetics. Curr Mol Med 4: 549–562.
39. Llewellyn MS, Miles MA, Carrasco HJ, Lewis MD, Yeo M, et al. (2009)
Genome-scale multilocus microsatellite typing of Trypanosoma cruzi discrete
typing unit I reveals phylogeographic structure and specific genotypes linked to
human infection. PLoS Pathog 5: e1000410.
40. Miles MA, Llewellyn MS, Lewis MD, Yeo M, Baleela R, et al. (2009) The
molecular epidemiology and phylogeography of Trypanosoma cruzi and parallel
research on Leishmania: looking back and to the future. Parasitology 136:
1509–1528.
41. Cura CI, Mejia-Jaramillo AM, Duffy T, Burgos JM, Rodriguero M, et al. (2010)
Trypanosoma cruzi I genotypes in different geographical regions and
transmission cycles based on a microsatellite motif of the intergenic spacer of
spliced-leader genes. Int J Parasitol 40: 1599–1607.
42. Ocana-Mayorga S, Llewellyn MS, Costales JA, Miles MA, Grijalva MJ (2010)
Sex, subdivision, and domestic dispersal of Trypanosoma cruzi lineage I in
southern Ecuador. PLoS Negl Trop Dis 4: e915.
43. Elias MC, Faria M, Mortara RA, Motta MC, de Souza W, et al. (2002)
Chromosome localization changes in the Trypanosoma cruzi nucleus. Eukaryot
Cell 1: 944–953.
44. Teixeira MM, da Silva FM, Marcili A, Umezawa ES, Shikanai-Yasuda MA,
et al. (2006) Short communication: Trypanosoma cruzi lineage I in
endomyocardial biopsy from a north-eastern Brazilian patient at end-stage
chronic Chagasic cardiomyopathy. Trop Med Int Health 11: 294–298.
45. Degrave W, Fragoso SP, Britto C, van Heuverswyn H, Kidane GZ, et al. (1988)
Peculiar sequence organization of kinetoplast DNA minicircles from Trypano-
soma cruzi. Mol Biochem Parasitol 27: 63–70.
46. Martins C, Baptista CS, Ienne S, Cerqueira GC, Bartholomeu DC, et al. (2008)
Genomic organization and transcription analysis of the 195-bp satellite DNA in
Trypanosoma cruzi. Mol Biochem Parasitol 160: 60–64.
47. Souza RT, Santos MR, Lima FM, El-Sayed NM, Myler PJ, et al. (2007) New
Trypanosoma cruzi Repeated Element That Shows Site Specificity for Insertion.
Eukaryot Cell 6: 1228–1238.
48. Franzen O, Ochaya S, Sherwood E, Lewis MD, Llewellyn MS, et al. (2011)
Shotgun Sequencing Analysis of Trypanosoma cruzi I Sylvio X10/1 andComparison with T. cruzi VI CL Brener. PLoS Negl Trop Dis 5: e984.
49. Santos MR, Lorenzi H, Porcile P, Carmo MS, Schijman A, et al. (1999) Physical
mapping of a 670-kb region of chromosomes XVI and XVII from the humanprotozoan parasite Trypanosoma cruzi encompassing the genes for two
immunodominant antigens. Genome Res 9: 1268–1276.50. Porcile PE, Santos MR, Souza RT, Verbisck NV, Brandao A, et al. (2003) A
refined molecular karyotype for the reference strain of the Trypanosoma cruzi
genome project (clone CL Brener) by assignment of chromosome markers. Gene308: 53–65.
51. El-Sayed NM, Myler PJ, Blandin G, Berriman M, Crabtree J, et al. (2005)Comparative genomics of trypanosomatid parasitic protozoa. Science 309:
404–409.52. Ghedin E, Bringaud F, Peterson J, Myler P, Berriman M, et al. (2004) Gene
synteny and evolution of genome architecture in trypanosomatids. Mol Biochem
Parasitol 134: 183–191.53. Telleria J, Lafay B, Virreira M, Barnabe C, Tibayrenc M, et al. (2006)
Trypanosoma cruzi: sequence analysis of the variable region of kinetoplastminicircles. Exp Parasitol 114: 279–288.
54. Westenberger SJ, Cerqueira GC, El-Sayed NM, Zingales B, Campbell DA, et al.
(2006) Trypanosoma cruzi mitochondrial maxicircles display species- and strain-specific variation and a conserved element in the non-coding region. BMC
Genomics 7: 60.55. Branche C, Ochaya S, Aslund L, Andersson B (2006) Comparative karyotyping
as a tool for genome structure analysis of Trypanosoma cruzi. Mol BiochemParasitol 147: 30–38.
56. Nozaki T, Dvorak JA (1991) Trypanosoma cruzi: flow cytometric analysis of
developmental stage differences in DNA. J Protozool 38: 234–243.57. Barnabe C, Yaeger R, Pung O, Tibayrenc M (2001) Trypanosoma cruzi: a
considerable phylogenetic divergence indicates that the agent of Chagas diseaseis indigenous to the native fauna of the United States. Exp Parasitol 99: 73–79.
58. Gibson WC, Miles MA (1986) The karyotype and ploidy of Trypanosoma cruzi.
Embo J 5: 1299–1305.59. Minning TA, Weatherly DB, Flibotte S, Tarleton RL (2011) Widespread, focal
copy number variations (CNV) and whole chromosome aneuploidies inTrypanosoma cruzi strains revealed by array comparative genomic hybridiza-
tion. BMC Genomics 12: 139.60. Sterkers Y, Lachaud L, Crobu L, Bastien P, Pages M (2011) FISH analysis
reveals aneuploidy and continual generation of chromosomal mosaicism in
Leishmania major. Cell Microbiol 13: 274–283.61. Briones MR, Souto RP, Stolf BS, Zingales B (1999) The evolution of two
Trypanosoma cruzi subgroups inferred from rRNA genes can be correlated withthe interchange of American mammalian faunas in the Cenozoic and has
implications to pathogenicity and host specificity. Mol Biochem Parasitol 104:
219–232.
T. cruzi Chromosome Structure and Evolution
PLoS ONE | www.plosone.org 14 August 2011 | Volume 6 | Issue 8 | e23042
Copyright © 2022 FDOKUMEN