Genetics of amyotrophic lateral sclerosis in the Han Chinese
174
Genetics of amyotrophic lateral sclerosis in the Han Chinese Ji He A thesis submitted for the degree of Master of Philosophy at The University of Queensland in 2015 The University of Queensland Diamantina Institute 1
-
Upload
khangminh22 -
Category
Documents
-
view
4 -
download
0
Transcript of Genetics of amyotrophic lateral sclerosis in the Han Chinese

Genetics of amyotrophic lateral sclerosis in the Han Chinese
Ji He
A thesis submitted for the degree of Master of Philosophy at
The University of Queensland in 2015
The University of Queensland Diamantina Institute
1

Abstract
Amyotrophic lateral sclerosis is the most frequently occurring neuromuscular degenerative
disorders, and has an obscure aetiology. Whilst major progress has been made, the
majority of the genetic variation involved in ALS is, as yet, undefined. In this thesis,
multiple genetic studies have been conducted to advance our understanding of the genetic
architecture of the disease. In the light of the paucity of comprehensive genetic studies
performed in Chinese, the presented study focused on advancing our current
understanding in genetics of ALS in the Han Chinese population. To identify genetic
variants altering risk of ALS, a genome-wide association study (GWAS) was performed.
The study included 1,324 Chinese ALS cases and 3,115 controls. After quality control, a
number of analyses were performed in a cleaned dataset of 1,243 cases and 2,854
controls that included: a genome-wide association analysis to identify SNPs associated
with ALS; a genomic restricted maximum likelihood (GREML) analysis to estimate the
proportion of the phenotypic variance in ALS liability due to common SNPs; and a gene-
based analysis to identify genes associated with ALS. There were no genome-wide
significant SNPs or genes associated with ALS. However, it was estimated that 17% (SE:
0.05; P=6×10⁻⁵) of the phenotypic variance in ALS liability was due to common SNPs. The
top associated SNP was within GNAS (rs4812037; p =7×10⁻⁷). GNAS was also the most
associated gene from the gene-based study (p =2×10⁻⁵). Based on GWAS data, a
fragment-length and repeat-primed PCR was performed to determine GGGGCC copy
number and expansion within the C9orf72 gene in the cohorts (1,092 sporadic ALS and
1,062 controls) from China.
A haplotype analysis of 23 SNPs within and surrounding the C9orf72 gene was performed.
The C9orf72 hexanucleotide (GGGGCC)n repeat expansion (HRE) was found in three
sALS patients (0.3%) but not in control subjects (p = 0.25, Fisher’s exact test). Two cases
2

with HRE did not harbor four risk alleles that have previously been determined to be
strongly associated with ALS in Caucasian populations. The presence of risk alleles
(including rs2814707 and rs384992) of the 20-SNP consensus risk founder haplotype in
Caucasians demonstrated that two of the three cases shared a novel haplotype carrying
HRE. The low frequency (1.8%) of the 20-SNP consensus risk haplotype and the distinct
allele distribution in Chinese ALS patients compared to Caucasian populations indicates
that the C9orf72 HRE is not from the same single founder haplotype involved in Caucasian
populations. In addition, using next generation sequencing, a population-specific
mutational spectrum of ALS demonstrated that mutations in SOD1 are the most common
causative mutations in fALS in the Han Chinese population.
To identify further genetic associations, a novel strategy based on functional annotations
and current understanding of ALS for specifically filtering candidate genes has been
suggested. These findings broaden the spectrum of causative mutations in ALS and are
essential for optimal design of strategies of mutational analysis and genetic counselling of
Han Chinese ALS patients.
To conclude, the presented study with the largest non-Caucasian ALS cohorts showed the
heterogeneity of ALS in the Chinese Han population and laid the foundation for further
genetic studies of ALS in Mainland China.
3

Declaration by author
This thesis is composed of my original work, and contains no material previously published
or written by another person except where due reference has been made in the text. I
have clearly stated the contribution by others to jointly-authored works that I have included
in my thesis.
I have clearly stated the contribution of others to my thesis as a whole, including statistical
assistance, survey design, data analysis, significant technical procedures, professional
editorial advice, and any other original research work used or reported in my thesis. The
content of my thesis is the result of work I have carried out since the commencement of
my research higher degree candidature and does not include a substantial part of work
that has been submitted to qualify for the award of any other degree or diploma in any
university or other tertiary institution. I have clearly stated which parts of my thesis, if any,
have been submitted to qualify for another award.
I acknowledge that an electronic copy of my thesis must be lodged with the University
Library and, subject to the policy and procedures of The University of Queensland, the
thesis be made available for research and study in accordance with the Copyright Act
1968 unless a period of embargo has been approved by the Dean of the Graduate School.
I acknowledge that copyright of all material contained in my thesis resides with the
copyright holder(s) of that material. Where appropriate I have obtained copyright
permission from the copyright holder to reproduce material in this thesis.
4

Publications during candidature
Amyotrophic Lateral Sclerosis Genetic Studies: From Genome-wide Association
Mapping to Genome Sequencing. He J, Mangelsdorf M, Fan D, Bartlett P, Brown MA.
Neuroscientist. 2014 Nov 5. pii: 1073858414555404;
Publications included in this thesis
Chapter 1. Literature review: Amyotrophic Lateral Sclerosis Genetic Studies: From
Genome-wide Association Mapping to Genome Sequencing. He J, Mangelsdorf M, Fan D,
Bartlett P, Brown MA. Neuroscientist. 2014 Nov 5. pii: 1073858414555404;
5
Contributor Statement of contribution
Ji He Data collection and analysis(80%)
Wrote the paper (70%)
Mangelsdorf M Data collection and analysis(20%)
Wrote and edited paper (30%)
Fan D, Bartlett P, Brown MA Edited paper (70%)
Contributor Statement of contribution
Ji He Data collection and analysis(80%)
Wrote the paper (70%)
Mangelsdorf M Data collection and analysis(20%)
Wrote and edited paper (30%)
Fan D, Bartlett P, Brown MA Edited paper (70%)

Contributions by others to the thesis
Dr. Marie Mangelsdorf, Prof. Dongsheng Fan, Prof Peter Visscher, Prof Naomi Wray, Prof.
Perry Bartlett and, Prof. Matthew A. Brown were involved in the conception and design of
studies in the thesis; and the acquisition, analysis and interpretation of data. Chapter 1:
edited by Ji He, Dr. Marie Mangelsdorf, Prof. Dongsheng Fan, Prof. Perry Bartlett and
Prof. Matthew A. Brown. Chapter 2: edited by Ji He, Dr. Marie Mangelsdorf, Dr Beben
Benyamin, Prof. Dongsheng Fan and Prof. Matthew A. Brown. Katie Cremin, Jessica
Haris, Lawrie Wheeler and Brooke Gardiner co-contributed in carrying out microarray
genotyping assays. The analysis is also contributed by Dr. Xin Wu, Prof. Huji Xu, Dr.
Beben Benyamin, Dr. Paul Leo. Chapter 3: Ji He, Dr. Marie Mangelsdorf, Prof. Dongsheng
Fan and Prof. Matthew A. Brown wrote the manuscript. Repeat-Primed PCR study is co-
contributed with Lu Tang and Prof. Dongsheng Fan, Haplotype SNP Analysis is co-
contributed with Katie Cameron, Jessica Harris, Lawrie Wheeler, Brooke Gardiner, Dr. Xin
Wu, Prof. Huji Xu, Dr. Beben Benyamin, Dr. Paul Leo and Professor Matthew A. Brown.
Chapter 4: edited by Ji He, Dr. Marie Mangelsdorf, Prof. Dongsheng Fan and Prof.
Matthew A. Brown. Whole Exome Sequencing with Next Generation Sequencing is co-
contributed by Sharon Song, Lisa Anderson, Janette Edson and Brooke Gardener,
variants analysis is co-contributed by Dr. Mhairi Marshall, Dr. Paul Leo and Dr. Marie
Mangelsdorf. Chapter 5: edited by Ji He, Dr. Marie Mangelsdorf, Prof. Dongsheng Fan,
Prof. Perry Bartlett and Prof. Matthew A. Brown. All authors read and approved the final
manuscript.
6

Statement of parts of the thesis submitted to qualify for the award of another degree
None
7

Acknowledgements
The author gratefully acknowledges the receipt of a University of Queensland
Postgraduate Research Scholarship (UQPRS) and MND scholarship (UQ Diamantina
Institute) to support the work reported in this thesis.
I would like to thank my supervisor Dr.Marie Mangelsdorf, Dr.Beben Benyamin and Prof.
Matthew A. Brown for their guidance, support and complimentary insights into scientific
and clinical aspects of my project. Also, I would like to thank Dr. Paul Leo for his support in
statistic analysis and modelling, Prof. Dongsheng Fan and Prof Huji Xu for their support in
the study, writing my thesis and paper. Likewise, I would like to thank the members,
present and past, of the University of Queensland Diamantina Institute (UQDI) and
Queensland Brain Institute (QBI) for their patience, assistance and friendship.
I would like to thank my family, especially my father, mother and brother, and friends for
their ongoing support, patience and understanding.
This project would not have been possible without the time and blood samples cheerfully
donated by amyotrophic lateral sclerosis patients of the Peking University Third Hospital.
The people and institutions that made specific contribution to this thesis are acknowledged
in the relevant chapters.
8

Keywords
Neurodegenerative disease, amyotrophic lateral sclerosis, genetic study, genome-wide
association study, haplotype analysis, next-generation sequencing study.
Australian and New Zealand Standard Research Classifications (ANZSRC)
ANZSRC code: 110904, Neurology and Neuromuscular Diseases, 40%,
ANZSRC code: 060102, Bioinformatics, 30%
ANZSRC code: 060405, Gene Expression, 30%
Fields of Research (FoR) Classification
FoR code: 1109, Neuroscience, 40%
FoR code: 0601, Biochemistry and Cell Biology, 30%
FoR code: 0604, Genetics, 30%
9

Table of Contents
Table of Contents.............................................................................................................9
List of Tables ...................................................................................................................12
List of Figures...................................................................................................................14
List of Abbreviation..........................................................................................................16
CHAPTER 1: LITERATURE REVIEW ...............................................................................21
I. Amyotrophic Lateral Sclerosis (ALS) ....................................................................22
1. Introduction ............................................................................................................22
2. Genetics of Amyotrophic Lateral Sclerosis.........................................................31
3. C9orf72 gene and ALS...........................................................................................34
II. Genome-wide Association Study (GWAS) ...........................................................36
1. Introduction ............................................................................................................36
2. The design of ALS GWAS .....................................................................................36
3. Haplotype phasing .................................................................................................38
4. GWAS results in ALS.............................................................................................39
III. Next Generation Sequencing................................................................................45
1. Introduction ............................................................................................................45
2. Limitations of NGS in ALS ....................................................................................47
IV. ALS genetic studies in Mainland China ..............................................................48
V. Conclusion ..............................................................................................................49
VI. Aims........................................................................................................................50
CHAPTER 2: A GENOME-WIDE ASSOCIATION STUDY OF ALS IN HAN CHINESE ...51
I. Introduction ..............................................................................................................52
II. Materials and Methods ...........................................................................................53
1. Participants.............................................................................................................53
2. Genotyping procedures.........................................................................................53
10

3. Statistical analysis ................................................................................................56
III. Results ...................................................................................................................65
1. Association analyses............................................................................................65
2. Genes-based association study and Heritability estimation ............................66
IV. Discussion ............................................................................................................73
V. Conclusion:............................................................................................................76
CHAPTER 3: C9ORF72 SCREENING AND HAPLOTYPE PHASING ANALYSIS ..........77
I. Introduction .............................................................................................................78
II. Material and Methods ............................................................................................79
1. Participants............................................................................................................79
2. Repeat-primed PCR ...............................................................................................80
3. Haplotype SNP analysis, principal-component analysis and validation ..........80
III. Results ...................................................................................................................86
IV. Discussion ............................................................................................................93
V. Conclusion .............................................................................................................96
CHAPTER 5: NGS DATA ANALYSIS IN FAMILIAL AND SPORADIC ALS....................97
I. Introduction ..............................................................................................................98
II. Material and Methods ............................................................................................99
1. General summary for the analysis strategy ........................................................99
2. Patients and healthy controls ............................................................................101
3. Mutation screening ..............................................................................................101
4. Whole Exome Sequencing (WES) with NGS....................................................106
III. Result ...................................................................................................................109
1. SOD1 (NM_000454) mutations ............................................................................109
2. C9ORF72 hexanucleotide repeat expansion in fALS........................................112
3. TARDBP (NM_007375) mutations ......................................................................112
11

4. FUS (NM_004960) mutations..............................................................................112
5. Oligogenic basis in the Chinese cohorts and ANG (NM_001097577) mutations
...................................................................................................................................112
6. DCTN1 (NM_004082) mutations and Family 2011-037 .....................................116
7. fALS with no causative mutation identified in known ALS genes ................119
IV. Discussion ..........................................................................................................125
1. C9orf72 screening................................................................................................125
2. Characteristic clinical phenotypes identified...................................................126
3. Oligogenic nature of ALS ....................................................................................128
V. Conclusion ............................................................................................................130
I. General summary..................................................................................................132
II. Limitations and future expectation of the thesis ...............................................134
III. Final conclusion...................................................................................................136
REFERENCE....................................................................................................................138
APPENDIXAppendix. C2 …………………………………………………..………………………………145
Appendix. C3……………………………………………………………………………………158
Appendix. C4……………………………………………………………………………………163
APPENDIX REFERENCE …………………………………………………………………..…173
12

List of the Tables
Tables in Chapter 1
Table C1.1. Causative genes in MND and the methods employed………………………...25
Table C1.2. Main results reported by genome-wide or large-scale strategies in ALS studies
………………………………………………………………………..………………......41
Table C1.3. Major replications (including genome wide association studies) for variants in
ALS studies………………………………………………………………………………………..43
Tables in Chapter 2
Table C2.1. Detailed information in the genotyping of Chinese cohorts……………………55
Table C2.2.1. Quality controls information in separate cohorts………………………...……58
Table C2.2.2. Quality controls information for combined samples………………..………...59
Table C2.2.3. Ethnic outlier and relatedness check…………………………………………..60
Table C2.3. Demographics of the case cohort analyzed for the Chinese GWAS…………67
Table C2.4.Top 20 hits SNPs with PCs and sex adjustment in the Chinese GWAS……...68
Table C2.5 Direct replication of SNPs with the genome-wide association test…………….69
Table C2.6 Top 20 hits genes with PCs and sex adjustment in the Chinese GWAS……..70
Tables in Chapter 3
Table C3.1. Protocols for the two-step PCR and primers for the set of 23 SNPs within and
surrounding the C9orf72 gene…………………………………………………………………..83
13

Table C3.2. Demographics of the case and control cohorts analysed for the frequency of
the HRE in C9orf72.. . . . . . . . . . . . . . . . . . . . . . . . . . .. . . . . . . . . . . . . . . . . . . . . . . . . . . .88
Table C3.3 Clinical characteristics of sporadic ALS patients carrying the HRE……...…....89
Table C3.4.The genotyping data of the single nucleotide polymorphisms (SNPs)………..90
Table C3.5. Frequencies of haplotype in the imputed data…………………………………..92
Tables in Chapter 3
Table C4.1. Primer designed for PCR and Sanger sequencing……………….…………..103
Table C4.1 SOD1 (NM_000454) mutations screening in the Chinese ALS cohorts .……112
Table C4.2 TARDBP (NM_007375) mutations screening in the Chinese ALS cohorts…115
Table C4.3 FUS (NM_004960) mutations screening in the Chinese cohorts…………….116
Table C4.4. ANG (NM_001097577) mutations screening in the Chinese cohorts……….117
Table C4.5 DCTN1 (NM_004082) mutations screening in the Chinese cohorts…………119
Table C4.6. A filtering strategy in WES data analysis for ALS candidate variants……….123
14

List of Figures
Figures in Chapter 1
Figure C1.1. Proposed molecular targets and mechanisms underlying neurodegeneration
in ALS………………………………………………………………………………………………29
Figures in Chapter 2
Figure C2.1.1. The principal components analysis (PCA) of samples used for haplotype
analysis and the reference samples from the HapMap project. (Before QC)………………61
Figure C2.1.2. The principal components analysis (PCA) of samples used for haplotype
analysis and the reference samples from the HapMap project. (After QC) …………….….62
Figure C2.2. Quantile-Quantile plots showed an acceptable genetic inflation (λ < 1.01)…63
Figure C2.2 Manhattan plots showed no genome-wide significant signal …………………71
Figure.C2.3. Plots of most significant SNPs generated by Locuszoom
(http://csg.sph.umich.edu/locuszoom/) in the Chinese GWAS ……………………….……..72
Figure.C2.4. Power of the statistical test according to the sample size, OR and MAF when
significance is 5×10⁻⁸. ………………………………….…….……………….…….…….……..73
Figures in Chapter 3
Figure C3.1. 3 cases with mutation found in 1,092 cases and none in 1,062 controls...…93
15

Figures in Chapter 4
Figure C4.1. Candidate mutations filtering strategy……………………..…………………..101
Figure C4.2. Ch_MND_2012-265 SOD1 pedigree(p.H47R)………..…….………………..113
Figure C4.3. Ch_MND_2011-037 DCTN1 pedigree…………………………………………120
Figure C4. Pedigree information of Ch_MND_2009-048 for an example in the NGS
analysis………………………………………………………………………………...…………122
16
List of Abbreviations used in the thesis
AD Autosomal Dominant
ALS Amyotrophic Lateral Sclerosis
ALS2 Alsin
ALSFRS-R Revised Amyotrophic Lateral Sclerosis- Functional Rating
Scale
ANG Angiogenin
APOE Apolipoprotein E
AR Autosomal Recessive
ATXN2 Ataxin 2
C9ORF72 Chromosome 9 Open Reading Frame 72
CARD9 Caspase recruitment domain family, member 9
CASP10 Caspase 10, Apoptosis-Related Cysteine Protease
CASP8 Caspase 8, Apoptosis-Related Cysteine Protease
CD40LG CD40 Ligand
CEU Utah residents with ancestry from northern and western
Europe
CHAT Choline Acetyltransferase
CHB Han Chinese in Beijing
CHMP2B Chmp Family, Member 2b
CI Confidence Interval
CNTF Ciliary Neurotrophic Factor
CYBB Cytochrome B(-245), Beta Subunit
DC Dendritic Cell
DCTN1 Dynactin 1
17

DNA Deoxyribonucleic Acid
DYNC1H1 Dynein, Cytoplasmic 1, Heavy Chain 1
ELISA Enzyme-Linked Immunosorbent Assay
EM expectation maximization
FALS Familiar Amyotrophic Lateral Sclerosis
FAS Flail Arm Syndrome
FIG4 Fig4, S. Cerevisiae, Homolog
FLS flail leg syndrome
FTD Frontotemporal Dementia
FTLD Frontotemporal Lobar Degeneration
FUS Fused In Sarcoma
GCTA Genome-wide Complex Trait Analysis
GNAS Guanine Nucleotide Binding Protein, Alpha Stimulating
Activity
GREML Genomic Restricted Maximum Likelihood
GRIA3 Glutamate Receptor, Ionotropic, Ampa 3
GRM Genetic Relationship Matrix
GWAS Genome-Wide Association Study
HR Hazard Ratio
HRE Hexanucleotide Repeat Expansion
IBD Identical By Descent
IBS Identical By State
IFIH1 Interferon-Induced Helicase
IL23R Interleukin-23 receptor
JPT Japanese in Tokyo
KIF1A Kinesin Family Member 1a
18
LMN Lower Motor Neuron
MAF Minor Allele Frequency
MAPT Microtubule-Associated Protein Tau
MLR Multiple Linear Regression
MND Motor Neuron Disease
MS Mass Spectrometry
MSA Multiple System Atrophy
NEFH Neurofilament Protein, Heavy Polypeptide
NEFL Neurofilament Protein, Light Polypeptide
NGS Next Generation Sequencing
NOS Nitric Oxide Synthase 1
OPTN Optineurin
OR Odds Ratio
PARK7 Park7 Gene
PBP Progressive Bulbar Palsy
PCR Polymerase Chain Reaction
PD Parkinson Disease
PLS Primary Lateral Sclerosis
PMA Progressive Muscular Atrophy
PNPLA6 Patatin-Like Phospholipase Domain-Containing Protein 6
PRNP Prion Protein
PRPH Peripherin
PSP Progressive Supranuclear Palsy
QC Quality Control
REML Restricted Maximum Likelihood
RNA Ribonucleic Acid
19

ROC Receiver Operation Curve
SALS Sporadic Amyotrophic Lateral Sclerosis
SCA Spinocerebellar Ataxia
SEM Standard Error Of The Mean
SETX Senataxin
SIGMAR1 Sigma Nonopioid Intracellular Receptor 1
SMA Spinal Muscular Atrophy
SMN1 Survival Of Motor Neuron 1
SMN2 Survival Of Motor Neuron 2
SNCA Synuclein, Alpha
SNP Single Nucleotide Polymorphism
SOD1 Superoxide Dismutase 1
SOD2 Superoxide Dismutase 2
SORBS1 sorbin and SH3 domain containing 1
SPAST Spastin
STR Short Tandem Repeat
TARDBP Tar Dna-Binding Protein
TGFb Transforming Growth Factor beta
TNFRSF6 Tumor Necrosis Factor Receptor Superfamily, Member 6
TNFSF6 Tumor Necrosis Factor Ligand superfamily, Member 6
TRPM7 Transient Receptor Potential Cation Channel, Subfamily
M, Member 7
UBQLN2 Ubiquilin 2
UMN Upper Motor Neuron
UMND Upper Motor Neuron
USA United State America
20

VAPB Vesicle-Associated Membrane Protein B
VAPB Vesicle-Associated Membrane Protein-Associated Protein
B
VCP Valosin-Containing Protein
VCP Valosin-Containing Protein
VEGAS versatile gene based association study
VEGFA Vascular Endothelial Growth Factor A
WES Whole exome sequencing
WGS Whole genome sequencing
XBP X Box-Binding Protein 1
21

CHAPTER 1: LITERATURE REVIEW
22

I. Amyotrophic Lateral Sclerosis (ALS)
1. Introduction
Amyotrophic lateral sclerosis (ALS) a progressive neurodegenerative disease involving
both upper motor neurons (UMN) and lower motor neurons (LMN). UMN signs include
hyperreflexia, extensor plantar response, increased muscle tone, and weakness in a
topographic representation. LMN signs include weakness, muscle wasting, hyporeflexia,
muscle cramps and fasciculation, but initial presentation varies. Affected individuals
typically present with either asymmetric focal weakness of the extremities (stumbling or
poor handgrip) or bulbar findings (dysarthria, dysphagia). Other findings may include
muscle fasciculation, muscle cramps, and labile affect. Regardless of initial symptoms,
atrophy and weakness eventually affect other muscles. The disease typically has a late
onset and is often fatal within 3-5 years. No effective treatments exist for ALS. The only
current treatment is riluzole, which is thought to affect glutamate metabolism and only
modestly extends survival time[1]. The world-wide incidence of ALS is approximately 0.3 to
7.0 new cases per 100,000 each year[2]. Nearly 10% of ALS cases are classified as
familial ALS (fALS)[3], where in a family history of the disease is known. In these families,
the pattern is primarily consistent with autosomal dominant inheritance, although other
hereditary patterns have been found [4]. Approximately half of familial cases can be
explained by specific gene (Table C1.1). The remaining 90% of ALS cases are termed
sporadic ALS (sALS), where no family history is evident. The genetic aetiology of both
sALS and nearly 50% of fALS cases remains obscure. Whether sALS is primarily
polygenic or due to highly penetrant de novo mutations or inherited mutations with low
penetrance is unclear, but critical in the design of future gene-mapping studies. Detailed
information regarding these ALS-related genes is available via the ALS online genetics
23

database (http://alsod.iop.kcl.ac.uk/), the ALS mutation database
(https://reseq.lifesciencedb.jp/resequence/SearchDisease.do?targetId=1), and the
ALSGene database (http://www.alsgene.org) [5-7].
Exploring the genetic aetiology of ALS has provided fundamental insights into the process
underlying neuron degeneration and majority of our current knowledge of ALS. On this
basis, considerable efforts have been devoted to unravel pathophysiological mechanisms.
Multiple pathogenic processes have been reported that support the view of multiple routes
to a common endpoint of progressive upper motor neuron and lower motor neuron loss
(Figure C1.1).
To advance our current understanding of the aetiopathogenesis of this disease, extensive
candidate gene and hypothesis free gene-mapping studies have been pursued. In recent
years, revolutions in genetic techniques have taken place. The development of genome-
wide association studies (GWAS) has provided a powerful tool for the identification of
common variants associated with common disease. Similarly, next generation sequencing
(NGS) methods have proven effective in mapping mutations underlying single gene
diseases. Multiple GWAS and NGS studies have collectively identified a large number of
novel genetic variants associated with increased risk of ALS development. These
approaches each make assumptions about the underlying genetic architecture of disease,
especially for sporadic cases, can be complex to perform[8], and depend on accurate
clinical phenotyping for success. Thus whilst many robust associations have been
identified with mutations and common variants with ALS, false positive findings have also
occurred [9]. Given this situation, in this chapter I seek to summarize the current state of
understanding of the genetics of ALS, especially regarding the genetics of the condition in
24

Han Chinese, and to examine the performance and limitations of GWAS thus far along
with the expectations for NGS in the study of ALS.
25

Table C1.1. Causative Genes in MND and the methods employed.
Gene Location Inheritance Allelic Disorders (OMIM#) Encoded Protein function Ref. Evidence
SOD1* 21q22.1 AD or AR - Superoxide dismutase [10] 1
C9ORF72* 9p21.2 AD ALS and/or FTD Unknown [11, 12] 1
FUS* 16p11.2 AD or AR; de
novo
ALS with or without FTD,
ETM4 (614782),
translocation fusion genes
associated with tumors
RRM protein, RNA metabolism [13, 14] 1
OPTN** 10p15-14 AD or AR POAG (137760) Vesicular trafficking, signal transduction [15] 1
SETX* 9q34 AD (juvenile
onset)
SCAR1 (606002) DNA/RNA helicase; transcription termination [16] 1
ALSIN* 2q33 AR (juvenile
onset)
PLSJ (606353), IAHSP
(607225)
Guanine nucleotide exchange factor; AMPA
receptor trafficking, endosome/membrane
trafficking
[17, 18] 1
VAPB* 20q13.33 AD SMAFK (182980) ER organization [19] 1
DCTN1** 2p13 AD HMN7B (607641), Perry
syndrome (168605)
Dynactin; axonal transport of vesicles and
organelles
[20] 1
SPG11* 15q14
15q15.1-
AR (juvenile
onset)
SPG Spatacsin, intracellular trafficking, motor
neuron and axon development
[21] 1
26

TARDBP** 1p36 AD ALS with or without FTD,
FTLD
RRM protein, RNA metabolism [22] 2
SQSTM1** 5q35.3 AD PDB Autophagy, ubiquitin proteasome pathway [23] 2
FIG4** 6q21 AD or AR CMT4J (611228) Phosphatidinositol 3,5-biphosphate 5-
phosphatase; membrane trafficking,
endolysosome function
[24] 2
ANG** 14q11 AD - Ribonuclease A superfamily; RNA functions [25] 2
UBQLN2* Xp11.21 XD ALS with or without FTD Ubiquilin protein family, protein degradation
and autophagy
[26] 2
VCP*** 9p13.3 AD ALS with or without FTD,
MSP (167320)
AAA+ family; endocytosis and vesicular
trafficking
[27] 3
PFN1*** 17p13.2 AD - Inhibits actin polymerization [28] 3
CHMP2b** 3p11.2 AD FTD3 Chromatin modifying/CHMP family,
endocytosis and vesicular trafficking, protein
degradation
[29] 4
PRPH** 12q12 AD - Type III intermediate filament protein; Axonal
regrowth
[30, 31] 5
TAF15** 17q12 AD Translocation fusion genes
in EMC
RRM protein, RNA metabolism [32] 5
27

EWSR1** 22q12.2 AD Translocation fusion genes
in ESFT, PNE (612219),
EMC
RRM protein, RNA metabolism [33] 5
HNRNPA1*** 12q13.1 AD MSP RRM protein, RNA metabolism [34] 7
DAO** 12q24 AD - Oxidative deamination of D-amino acids [35] 7
SIGMAR1* 9p13.3 AD (juvenile
onset)
- ER chaperone [36] 7
ATXN2 12q24 SCA2 (183090) Polyglutamine protein, RNA metabolism [37] 6
NEFH** 22q12.2 AD - Neurofilament, heavy polypeptide [12] 6
SMN1 5q13.2 SMA (253300) RRM protein, RNA metabolism [38, 39] 6
Mode types; AD: autosomal dominant; AR: autosomal recessive; XD: X-linked dominant. *, ** and *** indicate the gene was first
identified in ALS patients by positional cloning, candidate gene screening and WES respectively. SCA2: Spinocerebellar ataxia-2;
CMT4J: Charcot-Marie-Tooth, autosomal recessive, type 4J; PLSJ: Primary lateral sclerosis, juvenile; IAHSP: Infantile onset
ascending spastic paralysis; SCAR1: Spinocerebellar ataxia, autosomal recessive; ETM4: hereditary essential tremor-4; SMAFK:
Spinal muscular atrophy, late-onset, Finkel type; POAG: Primary open angle glaucoma; MSP: Multisystem proteinopathy; FTD3:
Frontotemporal dementia, chromosome 3-linked; EMC: extraskeletal myxoid chondrosarcoma; ESFT; ewing sarcoma family of
tumors; PNE: peripheral neuroepithelioma; PDB: Paget disease of bone; SPG: Spastic paraplegia; Evidence:1.They have linkage
in one family (LOD>3), and mutation segregates with disease, and not in normal population, and mutations in SALS or other small
28

families,2.Variants are found in multiple small families (that do not achieve LOD>3), segregate, multiple sporadics, not found in
normals,3.Variants are found in multiple small families (that do not achieve LOD>3), segregate, not found in normal, not in
sporadic,4.Found in 1 small family and multiple sporadic cases, not in normal population – some support from functional
data,5.Found in multiple sporadic cases not in normals, with strong functional data,6.CNV/particular alleles present in MND
patients significantly more than control, 7.Found in 1 family.
29
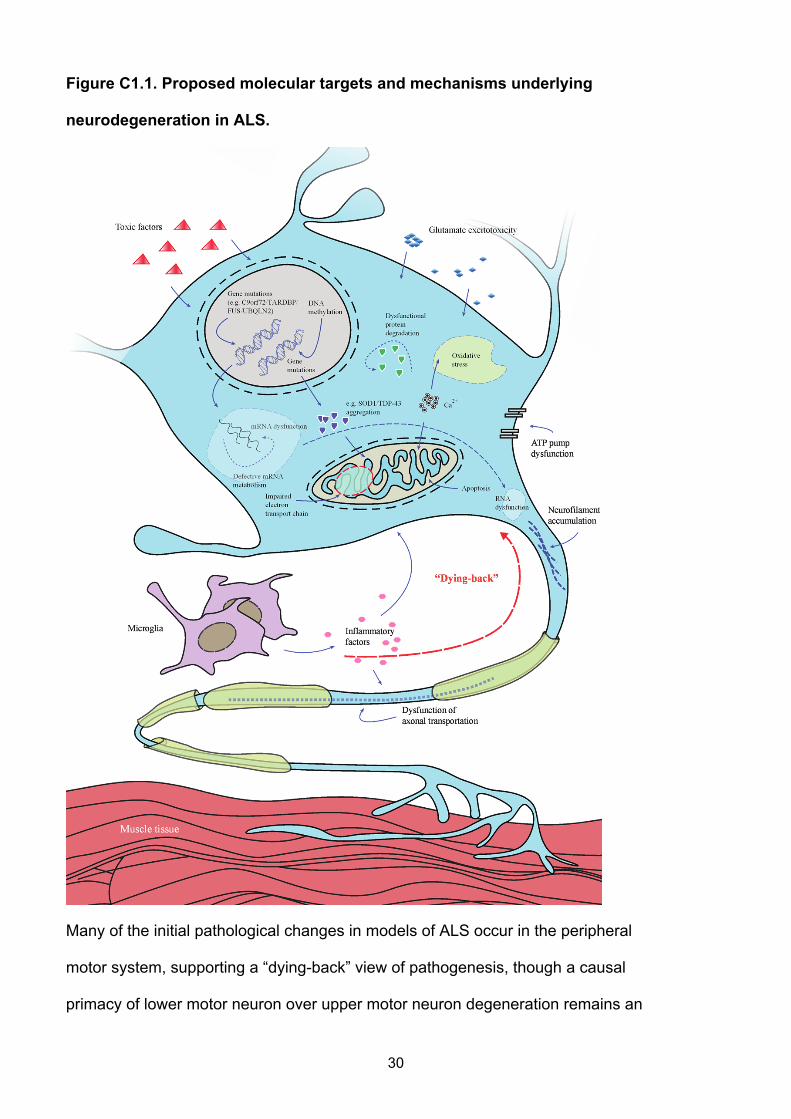
Figure C1.1. Proposed molecular targets and mechanisms underlying
neurodegeneration in ALS.
Many of the initial pathological changes in models of ALS occur in the peripheral
motor system, supporting a “dying-back” view of pathogenesis, though a causal
primacy of lower motor neuron over upper motor neuron degeneration remains an
30

issue of debate. The transgenic SOD1 mouse model has been used extensively to
dissect the likely pathogenic mechanisms. Many of these illustrated pathways are
mechanisms of cell death common to a range of neurological disorders whereas
more recent genetic discoveries have yet to be elucidated at a molecular level.
Pathophysiological mechanisms involved in ALS might include combinations of
glutamate excitoxicity, generation of free radicals, mutant enzymes, as well as
disruption of axonal transport processes and mitochondrial dysfunction. Mutations
in several ALS causative genes are related to the formation of intracellular
aggregates. Mitochondrial dysfunction, which is associated with increased
production of reactive oxygen species and aggregates of SOD1, might induce
increased susceptibility to glutamate-mediated excitotoxicity, disturbance in energy
production and apoptosis. Activation of microglia results in secretion of cytokines
resulting in further toxicity.
31

2. Genetics of Amyotrophic Lateral Sclerosis
2.1. Heritability of ALS
Caucasian twin studies have shown that the disease concordance rate in identical
monozygotic twins is ~10%, whereas the concordance rate in dizygotic twins is very low
(0/122 twins) as is the parent-offspring concordance rate (~1%) [40]. From these twin
concordance rates, the heritability of ALS has been calculated to be 61%, taking into
account the low population prevalence of the disease. In monogenic autosomal diseases,
the parent-offspring concordance rate is generally high unless the penetrance is low [41,
42]. Thus, the low parent-offspring and twin concordance rates are most consistent with
models involving either large numbers of common or rare variants, especially variants with
low penetrance, rather than single high penetrant variants in each individual. The
heritability is population-dependant, but few twin studies have been conducted to estimate
the heritability from Chinese population or even other Asian populations.
2.2. Genetic Complexity of ALS
2.2.1. Blurred distinction between sporadic and familial ALS
Although it has been reported that 10% of ALS is familial, when the genealogy of ALS
cases is investigated more thoroughly, the prevalence of a family history increases at least
to 20% in some prospective studies [43, 44]. Establishing familiality is difficult in late onset
diseases, and it is likely that this leads to underestimation of the familiality of ALS. It is
often quite difficult for adult children of ALS patients to accurately recall their parent's
symptoms, particularly if decades have passed since the event, when the diagnosis of ALS
may not have been considered. In addition, the hypothesis that sALS and fALS may share
a diverse genetic aetiology is consistent with the observation that they are clinically
32

indistinguishable [45]. This is further supported by increasing demonstration that ‘sporadic’
cases are often caused by the same mutations previously been reported in familial cases.
For example, superoxide dismutase 1 (SOD1)-positive and TAR DNA-binding protein 43
(TDP-43)-positive inclusions have been found in both sALS and fALS[46, 47]. Moreover,
first-degree relatives of patients with ALS have an increased disease incidence compared
to unrelated individuals, indicating familiality [48]. Additionally, the hexanucleotide repeat
expansion (HRE) mutation in the C9orf72 gene is associated with a founder haplotype.
The expansion is found both in familial cases and in a high proportion of “sporadic” ALS
cases (21% of Finnish sALS) [12], and, albeit at low frequency, in control populations
(prevalence of expansions 0.15% in 1958 British Birth Cohort) [49]. The C9orf72
expansion occurs on a common risk haplotype, which is prone to expansion of the
hexanucleotide repeat for reasons that are not yet understood. Thus whilst the common
founder haplotype is prevalent in the population, further mutation (expansion of the
hexanucleotide repeat) on this haplotype leads to ALS, at least partially explaining the
occurrence of sALS due to C9orf72 expansions in families with no previous history of the
disease [11].
Combined, this evidence indicates that sALS diagnosis does not exclude the possibility of
familial inheritance even with “definite” negative familial histories. There is increasing
consensus therefore that the term 'sporadic' is inappropriate as it suggests only non-
genetic causes, whereas the term 'isolated' ALS might be more accurate as it
encompasses environmental and/or genetic causes[50].
33

2.2.2. Disease heterogeneity
ALS demonstrates both clinical and genetic heterogeneity, but to date genetic
explanations for the clinical heterogeneity have been incomplete. Three clinical variants
are widely recognized, including progressive bulbar palsy (PBP), classic onset and
progressive muscular atrophy (PMA)[51]. By and large, bulbar onset appears to advance
more rapidly and PMA may have a better prognosis [51, 52]. Besides these three, other
forms have been recognized in recent years. Brachial amyotrophic diplegia (flail arm
syndrome, FAS) and the pseudopolyneuritic variant (flail leg syndrome, FLS) are
instructive examples. Compared with classic type, FAS and FLS have a prolonged course
[53]. Furthermore, these clinical variants appear to have a male predominance, which may
suggest that other gender-related genes are involved, although such genes have yet to be
identified [54].
Recent genetic research has taken clinical heterogeneity into account, but has yet to
identify individual variants or genomic profiles associated with different ALS clinical
patterns[55, 56]. An Italian study [57] involving 228 ALS patients reported a potential
correlation between the upper motor neuron-predominant phenotype and KIFAP3. This
finding has not been replicated in subsequent GWAS studies. This may be because in
some studies clinical subgroups were not clearly defined, and in others the study power
was insufficient. Whatever the explanation, clear genotype-phenotype correlation to
explain the different presentations is lacking.
Studies of familial ALS have been particularly successful in identifying disease-causative
mutations, but families with mutations in different genes are often clinically
indistinguishable. In addition to the locus heterogeneity, there is also extensive allelic
heterogeneity. For example, since mutations in the SOD1 gene were confirmed as a cause
34

of dominantly inherited fALS in 1993[10], at least 160 disease-causative mutations in this
gene have been reported [58, 59]. If genetic or locus heterogeneity is as extensive in ALS,
designs of studies would struggle to identify the mutations or genes involved.
3. C9orf72 gene and ALS
The discovery of association with C9orf72 region is the most well known of these. In 2010,
three ALS-GWASs reported a novel susceptibility locus associated with the disease on
chromosome 9p where C9orf72 is located [60-62]. Another independent GWAS of ALS
with pathologically confirmed FTLD/TDP (frontotemporal lobar degeneration/TAR DNA-
binding protein)[63] identified the same chromosomal region. Linkage of ALS–FTLD to this
region was first identified in 2006 [64, 65], indicating that the chromosome 9p gene defect
overlaps the candidate region for both FTD and ALS. Three genes were found in a
haplotype block with strong association: MOBKL2B, IFNK and C9orf72. A hexanucleotide
(GGGGCC)n repeat expansion(HRE) in C9orf72 was recently identified as the gene defect
associated with ALS and FTD [11, 12]. Although the pathological mechanism by which the
GGGGCC repeat causes ALS is not yet fully established, genetic studies have
demonstrated that GGGGCC repeats of greater than 30 repeats are causative for ALS,
FTD and ALS/FTD. These correlations have been replicated in many autosomal
dominantly inherited cases with both FTD and ALS [63, 66], and recently C9orf72
expansions have also been found in cohorts with a variety of neurodegenerative diseases
including Alzheimer disease, sporadic Creutzfeldt-Jakob disease, Huntington disease-like
syndrome, and other nonspecific neurodegenerative disease syndromes [49].
To date, the frequencies of the C9orf72 repeat expansions in more than 10 ALS cohorts
from Caucasian populations range from 10.95% to 47% in fALS and 3.20% to 21.1% in
sALS[67-73]. The reported frequencies in Asia have been lower. Two Japanese studies
35

report that the frequencies of the repeat expansion range from 0-3.4% in fALS and 0-0.4%
in sALS[73, 74]. In contrast, a small study in Taiwanese of Han Chinese ancestry reported
higher frequencies of the repeat expansion (18.2% in fALS patients and 2.0% in sALS
patients)[75]. The GGGGCC repeat has also been found in neurologically healthy controls
(~0.2 %) as well as in Italian geriatric cases without ALS or dementia (1.2%)[71, 76-79].
This could be due to the late age of onset of ALS, or due to reduced penetrance of the
GGGGCC repeat, which is estimated to be non-penetrant in individuals less than 35 years
of age, 50% penetrant by 58 years, and almost fully penetrant at 80 years[78].
Most reports about C9orf72 repeat expansion frequencies in different populations support
the hypothesis that the pathogenic repeat expansion in C9orf72 arose from a single
founder haplotype[11, 67, 80] both in Caucasian and Asian populations [73, 75], as tagged
by the A allele of rs3849942,which occurs in most reported C9orf72 GGGGCC repeat-
carrying ALS cases and the A allele of rs2814707, which has been used as a significant
genetic association marker of chromosome 9p21 in the Flanders-Belgian cohort of patients
with FTLD, FTLD-ALS, and ALS (odds ratio 2.6, 95% CI 1.5-4.7; p=0.001). It has been
estimated that the repeat expansion occurred once ~1,500 years ago[78]. To date, in
cases from mainland China, GGGGCC repeats have been reported only in one case of
familial ALS/FTD and one case of sporadic FTD, and no GGGGCC repeats have been
identified in pure ALS cases[81-83]. The European founder haplotype was consistently
observed in the Chinese patients with C9orf72 GGGGCC repeats.
36

II. Genome-wide Association Study (GWAS)
1. Introduction
Traditional genetic strategies such as linkage studies, positional cloning studies or
candidate-gene sequencing have had major success in finding mutations in familial ALS.
However, their potential is limited by the low availability of families with recurrent disease
to study, challenges associated with family studies in late onset diseases, and by the low
power of linkage analysis to identify low penetrant variants. As cases are often
misdiagnosed and/or are dead before recurrence occurs within individual families, few
families with DNA samples from multiple affected and unaffected members are available.
The variability in the age of onset, even within families, means that coding unaffected
members of families can be misleading, when they may develop ALS later in life.
Additionally there are now several examples of ALS mutations with incomplete penetrance
(for example in SOD1[84] and TARDBP[85]), the presence of which can also affect linkage
studies. Given these challenges with traditional linkage mapping approaches, and the
possibility that many sALS cases may be due to low penetrant common founder variants,
in recent years alternate methods involving GWAS and exome sequencing have been
employed to identify the genetic variants in ALS.
2. The design of ALS GWAS
GWAS identifies loci associated with disease where cases or controls share stretches of
DNA (haplotypes) in which a disease-causing mutation has occurred in a distant common
founder. By typing SNPs across the genome, these disease-associated haplotypes are
identified by differences in frequencies of SNPs between cases and controls. The marker
SNPs may not be the causal variants, but being found on the same haplotype and
37

correlated with the disease-causing variant, a feature termed ‘linkage disequilibrium’.
Association in GWAS studies may thus represent true association (where the genotyped,
associated SNP is directly involved in the disease), linkage disequilibrium (where the
genotyped, associated SNP is merely a marker for a haplotype bearing the true disease-
causing variant), population stratification (where differences in ethnicity between cases
and controls lead to spurious associations), genotyping error, cryptic relatedness (where
the assumption that cases and controls are not closely related to one another is not met,
leading to inflation of association test statistics). With careful data quality controls and the
correction for genome-wide significance (generally used p value threshold <5x10⁻⁸),
GWAS findings have generally proven to be robust and reproducible.
Sample size requirements for GWAS are large and challenging to achieve, particularly for
low frequency diseases such as ALS [86]. In most diseases this has led to the formation of
large consortia pooling resources to achieve adequate power. Where separate studies are
performed, meta-analysis methods and software for either the original genotype data or
summary statistics have been developed to achieve sufficient power. There has been
some success to date employing GWAS in ALS, and some of that raw data has been
made publicly available to augment resource for other studies of ALS. More recently, the
largest association study in ALS to date was established. A total of 13,225 individuals,
6,100 cases and 7,125 controls for almost 7 million SNPs (imputed data) were included in
the analysis [87]. However, the sample size requirements highlight that to make real
progress in this disease, similar or larger studies would be required to continue,
particularly to identify rare variants, even if they have quite high penetrance. For example,
to achieve 80% power to identify a variant with minor allele frequency of 0.1% and odds
ratio for disease of even 2 will require >9,000 cases to be studied[86]. Such sample sizes
have been achieved for diseases probably less common than ALS. For example, in
38
Crohn’s disease, which has a prevalence of 0.1%, more than 77,000 cases have been
reported in a single study [88]. As discussed above there are unique challenges in
recruiting patients with ALS that make it particularly challenging to achieve such large
numbers, but given the great potential of genetics in this disease, greater emphasis on
recruitment and more collaborative studies is necessary.
3. Haplotype phasing
Enormous amounts of genotype data are being generated both from increasingly
comprehensive and inexpensive genome-wide SNP microarrays and from ever more
affordable whole-genome and whole-exome sequencing tools. The vast amount of
information in these data can be exploited through phased haplotype analyses (including
analysis for the founder effect), which identify the alleles that are co-located on the same
chromosome. However, because sequencing and SNP array data generally take the form
of unphased genotypes, it is not directly observed which of the two parental chromosomes,
or haplotypes, a particular allele falls on. Sanger sequencing, the most widely used
technique and current gold standard, is incapable of separating phases without allele-
specific capture or allele-specific amplification and library techniques such as long-range
PCR or chromosomal isolation have been used to determine haplotypes in diploid
individuals, but these approaches are technologically demanding and often cost-
prohibitive.
Though limited by the practical techniques in the laboratory, given the genotypes for a
number of individuals, the haplotypes can be inferred by haplotype resolution or haplotype
phasing techniques. These methods work by applying the observation that certain
haplotypes are common in certain genomic regions. Therefore, given a set of possible
haplotype resolutions, these methods choose those that use fewer different haplotypes
39

overall. The specifics of these methods vary. Several approaches to this problem have
been proposed, notably Clark’s algorithm and the EM algorithm (which produces an
estimate of the maximum likelihood of haplotype frequencies)[89]. Stephens et al. [90]
introduced two Bayesian approaches, one (“naive Gibbs sampler” method) that used a
simple Dirichlet prior distribution, and a second, more sophisticated approach in which the
prior approximated the coalescent. Results on simulated SNP and microsatellite data, as
well as more limited comparisons using real data, suggested that this second approach,
implemented in the software PHASE, produced consistently more accurate haplotype
estimates than previous methods. A further advantage of a Bayesian approach is the
ability to provide accurate measures of uncertainty in statistically estimated haplotypes,
which can be used in subsequent analyses [90]. PHASE has for some time been
considered a “gold standard” for accuracy among population-based haplotyping
algorithms[91].
4. GWAS results in ALS
In the past 7 years, approximately more than 8,000 ALS patients (including patients of
white European and Asian descents), and many more control subjects, have been
involved in large-scale ALS studies. This has resulted in the identification of some novel
SNPs that appear to be associated with the disorder (Table C1.2). However, with the
exception of the chromosome 9p21 locus, most associated SNPs or genes show poor
replication in different populations or even between ALS GWAS studies (Table C1.3),
which very likely represents type 1 errors due to insufficient sample size and statistical
power. This is a particular problem in genetic studies of ALS, likely because the disease is
rare and it is hard for individual groups to achieve adequate sample sizes. Robustly proven
differences in associations at specific loci can be highly informative regarding the primary
disease-causative variants, which can be hard to pinpoint in specific populations,
40

particularly at loci with extensive linkage disequilibrium surrounding them. This is also an
issue in trans-ethnic studies, where for example even the findings for the chromosome
9p21.2 locus are inconclusive in Asian populations.
41

Table C1.2. Main results reported by genome-wide or large-scale strategies in ALS studies.
Original study
MAF Pooled P value
No Ref. SNP Chr GENE Description
Controls Patients
Pooled OR
(95% CI) P value Bonferroni
Correction
1 [92] rs2306677 12p11 ITPR2 A calcium channel on
the endoplasmic
reticulum
0.07 0.11 1.58(1.30-1.91) 3.28×10⁻⁶ Exceed
2 [55] rs6700125 1 FLJ10986
(FGGY)
Unknown, possible
role in metabolism
0.32 0.41 1.35(1.13-1.62) 6.00×10⁻⁴ Exceed
3 [93] rs10260404 7 DPP6 A transmembrane
protein binding A-
type neuronal
potassium channels
0.42(Irish) 0.34(Irish) 1.37(1.2–1.56) 2.53×10⁻⁶ Failed
4 rs12608932 19 UNC13A Encoding
presynaptic proteins
found in central and
neuromuscular
synapses
0.37 0.40 1.20 2.50×10⁻¹⁴ Exceed
5
[62]
rs2814707 9 MOBKL2B Unknown 0.23 0.26 1.16 7.45×10⁻⁹ Exceed
42

6 rs3849942 9 C9orf72 Unknown 0.23 0.26 1.15 1.01×10⁻⁸ Exceed
7 rs2708909 7p12.3 SUNC1 0.50 0.45 1.17(1.11–1.23) 6.98×10⁻⁷ Failed
8
[94]
rs2708851 7p12.3 SUNC1
Encodes a 40.5kDa
nuclear envelope
protein Sad1 and
UNC84 domain
containing 1
0.50 0.45 1.17(1.11–1.23) 1.16×10⁻⁶ Failed
9 [95] rs2275294 20q13 ZNF512B A regulator of the
TGF signaling
pathway
0.41 0.41 1.32 (1.21–1.44) 6.7×10⁻¹⁰ Exceed
Ref.: Reference; SNP: single nucleotide polymorphisms; Chr: Chromosome; MAF: minor allele frequency;
43

Table C1.3. Major replications (including genome wide association studies) for variants in ALS studies.
GENE REPLICATIONRef. Region of
Cohorts
Study Method
ITPR2 FGGY DPP6 KIFAP3 UNC13A 9p21 Locus
[93] Ireland GWAS x X p = 2.53×10⁻⁶ -
[96] USA/Dutch Replication - p = 5.04×10⁻⁸ -
[97] North Europe Replication - X -
[98] France and
Quebec
Replication - X X -
[99] Europe /
USA
GWAS x X X Corrected p=
0.021
-
[94] Italy /
Germany /
USA
GWAS x X X -
[100] Irish / Polish /
USA / Dutch
GWAS - X -
[62] Europe /
USA
GWAS x X X - Table 2
[61] Europe /USA GWAS x X X - x p=5.14×10⁻⁸
[60] Finland GWAS - x
[101] Italy Replication - X -
44

[57] Italy Replication - x -
[95] Japan Large-scale
association
study
X
[102] China /
Japan
Replication - x x
[56] USA High-density
GWAS
x X X x x x
[103] China Replication x X X x -
[104] Italy Replication - p=8×10⁻⁹; OR=4.0
[105] Dutch/Belgia
n/ Swedish
Replication - p<0.005 (sic) -
[106] Europe /USA Meta-analysis - Overall p=0.0088
Ref.: Reference; -: The direct replication for the implicated gene was not included, x: Negative results
45

III. Next Generation Sequencing
1. Introduction
The high demand for low-cost sequencing has driven the development of high-throughput
sequencing (or next-generation sequencing) technologies that parallelize the sequencing
process, producing thousands or millions of sequences concurrently. High-throughput
sequencing technologies are intended to lower the cost of DNA sequencing beyond what
is possible with standard dye-terminator methods.
Next Generation Sequencing (NGS) techniques, including whole-exome sequencing
(WES) and whole-genome sequencing (WGS), have enabled major advances in
addressing monogenic disorders. These techniques have enabled gene-mapping studies
for rare diseases caused by mutations to be performed in the absence of pedigreed
samples required for linkage mapping. Instead, either small numbers of unrelated affected
individuals or small families can now be successfully investigated. This has proven
revolutionary in monogenic disease research, stimulating another boom in gene-
discoveries for diseases that had previously not been mapped due to insufficient
pedigreed samples. The approach has already proven productive in fALS, where it has
been used to identify disease-causing mutations [27, 28] that are strongly supported as
ALS-causing mutations from functional studies.
As GWAS are poor at identifying low frequency (minor allele frequency (MAF) <5%) and
rare (MAF <1%) alleles, it has been suggested that large numbers of such variants may
explain the failure of GWAS to identify the variants responsible for a large proportion of the
heritability of individual diseases [107]. However, this remains an unproven hypothesis,
with little evidence to date to support the
46

existence of significant numbers of low frequency or rare variants with greater penetrance
than common variants. The few reported examples of high penetrant rare alleles have
generally occurred in genes already known to be associated with disease through common
variant studies, such as IL23R[108], CARD9[109] and IFIH1[110]. This may represent
experimental bias, as sufficiently large studies to detect rare variants are still works in
progress. However, in ALS it is clear that rare high penetrant variants do contribute
significantly to the disease – these are the variants that cause fALS, and are increasingly
being identified in sALS.
The same NGS approaches used with NGS to map monogenic diseases are now being
used to map rare high penetrant variants in more genetically complex diseases, such as
sALS. Unlike monogenic diseases, sALS creates a new challenge due to genetic and
locus heterogeneity and the possibility that sALS is oligo- or polygenic, with more than one
disease-causing variant operating in individuals. This requires much larger sample sizes to
be studied and more complex analyses to be performed, inevitably involving greater cost.
However, given that sALS may be substantially caused by rare or even de novo mutations,
these challenges will have to be faced to advance the understanding of the genetics of this
disease. In the majority of cases the arguments for variants being disease causing have
been strengthened by evidence of segregation with disease in fALS, along with
identification of mutations in sporadic cases. For PRPH and EWSR1, mutations have only
been described in sALS, however convincing functional data accompanied the variant
discovery. Functional methods for determining the relevance of rare sequence variants to
ALS pathogenesis will be of value in concert with NGS.
47

2. Limitations of NGS in ALS
Although there are clear advantages to NGS, it is not without drawbacks. As the name
implies, WES is designed to capture the whole exome. In reality it does not, and about 5%
of the exome is not captured in typical exome sequencing experiments. Further, not all
monogenic diseases are due to mutations in coding regions, and therefore may not be
detected using exome sequencing. An additional technical challenge is that WES using
short-read sequencing technologies such as Illumina sequencing chemistry has difficulties
in sequencing repeats and insertion/deletions, as the short reads cannot be
unambiguously aligned against reference genomes. Some relevant examples of the
limitations of WES exist in ALS gene-mapping include:
TARDBP and FUS are known to regulate splicing of pre-mRNA by binding to
sites within introns[85]; WES may not identify mutations at these binding
sites and thus if mutations at sites in genes targeted by TARDBP or FUS
were involved in ALS, they would not be detected by WES.
An intronic hexanucleotide repeat in C9orf72 gene has been identified
though linkage mapping and several GWASs and the finding has been
replicated independently. This locus is difficult to detect by WES as it is
intronic, and also by WGS, due to the difficulty aligning short-read data of
stretches of microsatellite and minisatellite DNA sequences. This weakness
may be overcome using longer read technologies such as single molecule
real-time sequencing (Pacific Bioscience sequencing), which has a read
length of up to 10 kb, compared with short 2x100 or 2x150 bp paired-end
reads typically produced by, for example, Illumina sequencing.
Thus, sequencing is not at this point a technology capable of identifying all potential ALS-
causative variants, and it should be noted still requires the large sample sizes discussed
above to achieve adequate power. NGS approaches have great potential and are capable
48

of identifying a substantial fraction of variants that are not within the scope of GWAS.
Advances in sequencing technologies, decreasing cost of sequencing and initiatives such
as Project MinE (www.projectmine.com) aiming to raise funds and generate whole
genome sequence from 15,000 ALS subjects, will lead to data being rapidly produced over
the coming years, allowing in-depth genetic analysis.
IV. ALS genetic studies in Mainland China
China is the most populous country in the world, with over 1.3 billion citizens. Though
there is no definitive epidemiological data about the incidence and prevalence of ALS in
Chinese, experience in clinical practice suggest that it is not a very rare disease, and that it
is likely that large numbers of Chinese are affected. Information about the epidemiology
and genetics of ALS in China have rapidly expanded during the last 10 years. Though no
significant difference in the features of clinical phenotypes in non-Caucasian populations
has been reported, a multi-center investigation[111] confirmed the earlier age at onset of
ALS in China as compared with other countries. Further population-based case-control
investigations reported different frequencies of genetic risk factors for Chinese ALS
patients, such as PFN1[112], VCP[113] and possibly the C9orf72 gene. But there is still
much more to be learnt. The majority of Chinese genetic research involves only the
replication of Caucasian findings in small cohorts rather than gene-discovery projects in
cohorts of sufficient size and statistical power. Even the recently published first Chinese
ALS GWAS [26] suffered because of insufficient sample size in the discovery stage.
Therefore, it is essential for comprehensive genetic studies conducted in Chinese ALS
cohorts, both because China’s large population means large case cohorts are available for
49
what is a low frequency disease, and because differences in the genetic ancestry of
Chinese may lead to new gene discoveries and better ability to define key disease-
associated variants.
V. Conclusion
Among various studies in ALS, genetic discoveries have provided major advances in the
understanding of the diseases causation. Development of new methods for gene-mapping,
particularly using high throughput sequencing is promising for the acceleration of gene
discoveries. There is also a clear need to perform more studies in populations of different
ethnicity. Systems biology approaches, including multiple modalities such as DNA
sequencing, transcriptomics, proteomics and epigenomics are likely to be very useful as
well, particularly with functional genomics research into the mechanisms by which genetic
mutations cause ALS. As ever there is no ‘one size fits all’ solution to ALS research, but
the increasing capability of this research tools is bringing major advances to studies of this
disease. In other disease areas such as immune-mediated diseases, success in gene-
mapping has been so great in the past 5 years of the GWAS era that the bottleneck has
clearly moved on to determining how disease-associated variants lead to disease. It is
expected that this will similarly be the problem facing ALS research in the near future.
50

VI. Aims
The aims of the current study were:
i. To identify susceptibility genes for ALS in Han Chinese by GWAS;
ii. To investigate the association of the C9orf72 hexanucleotide repeat expansion
(HRE) and surrounding SNPs with ALS in Chinese samples and to determine if the
repeat expansion observed in Chinese cases has arisen from the same founder
haplotype as it has in cases of European descent;
iii. To identify low-frequency and rare nonsynonymous variants in familial and sporadic
ALS cases.
51

CHAPTER 2: A GENOME-WIDE ASSOCIATION STUDY OF ALS IN HAN CHINESE
52

I. Introduction
In recent years, the genome-wide association study (GWAS) design has become a
powerful and widely employed approach for the identification of common variants
associated with disease. Multiple GWASs have collectively identified a large number of
novel genetic variants associated with increased risk of ALS development, such as
ITPR2[92], DPP6[93], and C9orf72[62]. The largest GWAS for ALS to date involved 6,100
cases and 7,125 controls of Caucasian ancestry[87]. A novel locus with genome-wide
significance at chromosome 17q11.2 was reported. However, with the exception of the
chromosome 9p21 locus, most associated SNPs or genes show poor replication in
independent populations.
Phenotypic variation in complex traits is affected by genetic and environmental factors and
their interactions. The quantification of the genetic variance is thus relevant in the study of
multifactorial diseases. The proportion of phenotype explained by genetic variance, which
termed as “heritability”, is typically estimated in close relatives such as twin pairs. This
estimate can be confounded by shared environment factors, which are assumed to be
similar in both monozygotic and dizygotic twin pairs.
In order to advance our understanding of the aetiopathogenesis of ALS and to identify
susceptibility genes for this disease in Han Chinese, GWAS has been pursued. In addition,
the heritability explained by common variation was assessed, to expand our understanding
in genetics of ALS.
53

II. Materials and Methods
1. Participants
Patients attending the ALS specialty clinic at the Department of Neurology of Peking
University Third Hospital, Beijing, China, from 2003-2013 were recruited. All patients were
diagnosed with ALS according to El Escorial revised criteria [114] by a neurologist who
specialized in ALS. In the present analysis, the sporadic cases were defined based on
their self-report and clinical interview. The control samples were from individuals who
attended the same hospital and Shanghai Changzheng Hospital, and who did not have a
medical or family history of neurological disorders. All patients and controls provided
written informed consent for the clinical and genetic studies during their visit to the
neurologist. The ethics committee at Peking University Third Hospital and Changzheng
Hospital approved the collection of DNA samples from case and control subjects.
2. Genotyping procedures
A genome-wide genotyping was performed in 1,324 patients and 3,115 healthy controls at
discovery stage by using Illumina HumanOmniZhongHua DNA analysis microarrays
(900,015 SNPs/individual), using manufacturer’s protocols (Illumina, San Diego). Bead
intensity data was processed and normalized for each sample, and genotypes extracted,
in Genome Studio (Ilumina, San Diego).
The genome-wide association study was conducted with:
54

i. Illumina HumanOmniZhongHua Beads Array V1.0/V1.1(Illumina, San Diego):
(http://www.illumina.com/products/human-omni-zhonghua.ilmn)
ii. HumanOmniExpress BeadChip Kit(Illumina, San Diego):
(http://www.illumina.com/products/human_omni_express_beadchip_kits.ilmn)
iii. Iscan (array scanner, Illumina, San Diego):
(http://www.illumina.com/systems/iscan.ilmn)
iv. The whole genotyping process followed the company's standard protocols.
55

Table C2.1: Detailed information in the genotyping of Chinese cohorts
Parameter Cases Controls Samples genotyped with
another version of microarray
N Individuals 1,014 3,115 310 cases
Genotyping
Chip
OmniZhongHua-8 v1.0 OmniZhongHua-8 v1.0 OmniZhongHua-8 v1.1
N SNPs 900,015 900,015 894,517
Sex
information
Male: 638;
Female: 368;
Unknown: 8
Male: 1317;
Female: 1788;
Unknown: 10
Male: 200;
Female: 130
Proportion of
SNPs passed
quality
control
0.988 0.993 0.996
N: Number.
56

3. Statistical analysis
3.1. Quality control and meta-analysis of genotyping data
QC of samples and genotyped SNPs was performed by using the PLINK software
package[115] and EIGENSTRAT[116]. Detailed information regarding the QC in
individuals and SNPs is showed in Table C2.2.1, Table C2.2.2 and Table C2.2.3.
3.1.1. Quality control for individuals
Individuals were excluded if sample call rate was < 99% or phenotype-genotype gender
was discordant. The proportion of heterozygous autosomal markers in each individual was
calculated by heterozygosity rate. Outliers were excluded at the extreme tails (± 3 s.d.
from the mean). Using a subset of LD independent SNPs cryptic relatedness was
calculated by pair wise identical-by-descent (IBD) estimation that accounts for the
proportion of alleles similar between individuals. Individuals with proportion of IBD value of
> 0.05, suggestive that the individuals involved were related, were removed.
3.1.2. Quality control for markers
SNPs on sex and mitochondrial chromosomes, and with genotype call rate < 99%, were
removed. None of SNPs found with differential call rate between cases and controls (p
value < 10-6) after removing SNPs with low call rate. Minor allele frequency (MAF) filter
was chosen to be > 1%. SNPs identified with the significant deviation (p value < 10-6) from
Hardy-Weinberg equilibrium were removed.
Ancestry differences between individuals were detected by principal component analysis
(PCA, Figure C2.1). Principal component axes were generated by genotypes of a genome-
57

wide subset of LD-independent SNPs using EIGENSTRAT software, and outliers identified
by the first 2 principal components (PCs) were removed (± 6 s.d. from the mean).
In the present study, the genotypes were tested for association with ALS status by logistic
regression analysis (PLINK package) including sex information and the specific PCs as
confounder covariates to control population stratification. The level of genomic inflation
was assessed using quantile-quantile plots and using the λ(gc) statistic (R package
software)(Figure C2.1.1 and Figure C2.1.2). Genomic inflation as assessed by λ(gc) was
found to be minimal (λ(gc) < 1.01)(Figure C2.2).
58
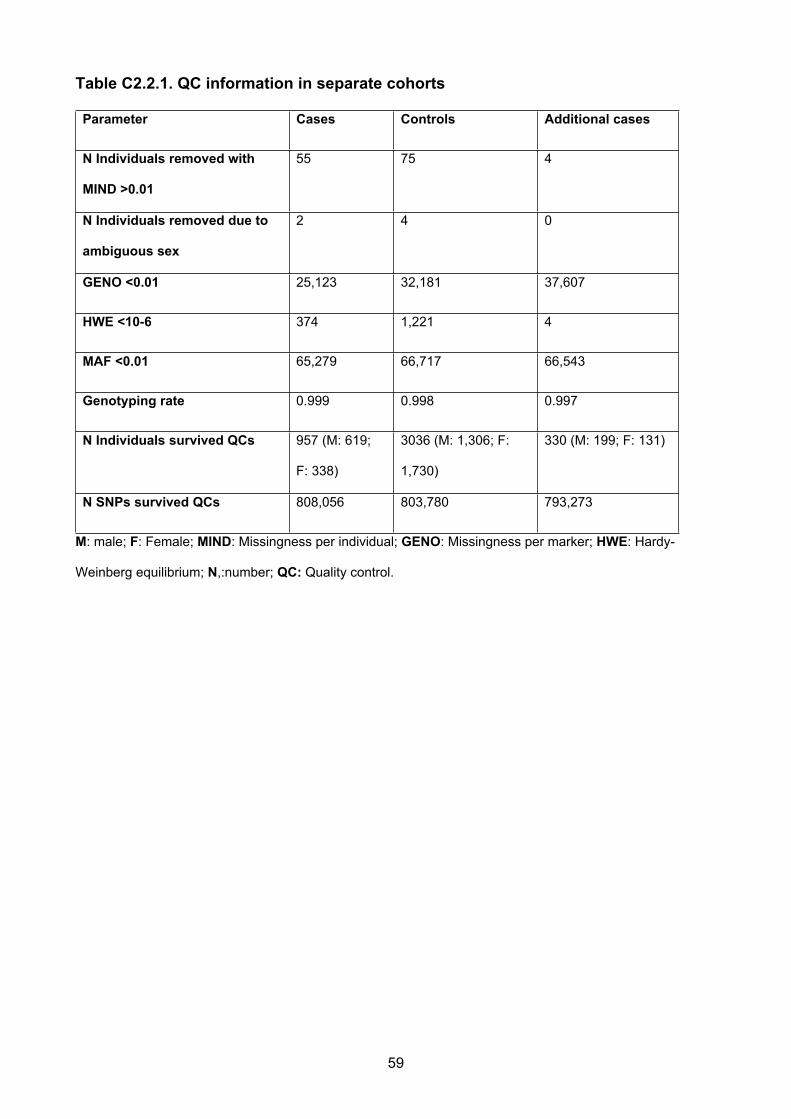
Table C2.2.1. QC information in separate cohorts
Parameter Cases Controls Additional cases
N Individuals removed with
MIND >0.01
55 75 4
N Individuals removed due to
ambiguous sex
2 4 0
GENO <0.01 25,123 32,181 37,607
HWE <10-6 374 1,221 4
MAF <0.01 65,279 66,717 66,543
Genotyping rate 0.999 0.998 0.997
N Individuals survived QCs 957 (M: 619;
F: 338)
3036 (M: 1,306; F:
1,730)
330 (M: 199; F: 131)
N SNPs survived QCs 808,056 803,780 793,273
M: male; F: Female; MIND: Missingness per individual; GENO: Missingness per marker; HWE: Hardy-
Weinberg equilibrium; N,:number; QC: Quality control.
59

Table C2.2.2. QC information for combined samples
Parameter Combined Samples
N Individuals removed with MIND >0.01 0
N Individuals removed due to ambiguous sex 0
GENO <0.01 0
HWE <10-6 2
MAF <0.01 0
SNPs with differential call rate (P<10-6) in
Cases and Controls after QC
2
Genotyping rate 0.999
N Individuals survived QCs 4,117 (M: 2,020; F: 2,097);
1,243 cases, 2,854 controls
and 20 missing
N SNPs in common between datasets and
survived QCs
753,038
M, male; F, Female; MIND, Missingness per individual; GENO, Missingness per marker; HWE, Hardy-
Weinberg equilibrium; N, number, QC: Quality Control.
60

Table C2.2.3. Ethnic outlier and relatedness check
QCs Number
Individuals removed due to cryptic
relatedness (GR >0.05)
195 (11 Cases; 194 Controls)
Individuals removed based on ethnic
outliers detection
30 (15 Cases; 15 Controls)
TOTAL Individuals survived QCs 4,088 (1238 Cases; 2850 Controls)
TOTAL SNP survived QCs 753,038
GR: Genetic relatedness; SNP: Single nucleotide polymorphism; QC: Quality control
61

Figure C2.1.1. The principal components analysis (PCA) of samples used for haplotype analysis and the reference samples
from the HapMap project (Before QC).
−0.02 0.00 0.02 0.04 0.06 0.08
−0.0
4−0
.02
0.00
0.02
0.04
0.06
0.08
PC Analysis
principal component 1
prin
cipa
l com
pone
nt 2
●●●●●●●●
●● ●●●
●●● ●●
●●●●●●●●● ●
●●●●●● ●●●●●●
●●●●
●●
● ●●●●● ●●
●
●●
●●●● ●● ●●
●●●●●●● ●
●● ●●●●●●● ●● ●●
●●●●●●●●
●●●●●●●●● ●●●● ●
●●
●●●●
●
●●●●●
●●●●● ●
●●
●
●
●●
●●●●
●
●●
● ●● ●● ●●●
●●●●●●●● ●
●●●
●●●●●●●●
● ●●
● ●●
● ●
●
●●●●●●
●●●●
●●●●●●● ●●
● ●●●●●
● ●●●●
●
●●●●●
●●● ●●●●●●
●●
●●●
●●● ●●● ●●●●
●●●
● ●●●
●●●● ●● ●●●●●● ●●
●
●●●●
●
●●●●
●●● ●
● ●●●●●● ●●●●●
●●
●●
●●●●
●●● ●●
●
●
●
●● ●●●
●●●●
●● ●●● ●
●
●●●
●
●●
●●
● ●● ●●●●●●● ●●
●
●
● ●●●●●
●● ●
●●●●●●
●●
●●●●●
●
●
● ●
●●●●●●●●
●
●
●●●
●●
●● ●●
●●●●
● ● ●●
●● ●
●●
++++++++++++++++++++++++++ ++++++++++
+++++++++++++++++++++++++++
+++++++++++++++++++++++ ++++
+++++++++++++++++++++++++++++++++++++++++++++++++
+++ +
++
+ ++++++++++++
+++++++++++++++++++++++
++++++++++++++++++++++++++
+++ +++++++++++
+
++++++++++++++
++
++++++++++ +++
++++++++++
+++++++++++++++++++
+++++++++++++++++++++++ ++++ ++++++++++
+++++++ +++++++++ ++++++++
+++++++++ +++++ +++++++++
+++++++++++ +++++++++++
++++++++++++++++++++++
+++
++++++++
++++++ +++++++++++++++++++++++
+++++++++ +++++++++++++++++++++++++++++++++++ ++++++++ +++++
+++++++++
+++++++++++++++++++++++++++++++++++++++++ +++++++++++++++++++
+++++ +++++++++++++
++++++ ++++++++++++ +++++++++++++++
+++++++++++++++++++++++ +++++++++++ +
++++
++++++
+++++++++
+++++++++++++++++
+++++++++++++++++ ++++++++++ ++++++++++++++++++++++++
++++++ +++++++++++++++++ +++++++++++++++++++++++++++++++++++++++
+ +++++++++++++++++++++ +++++++++++++++++++++ +++++++++++++++
++++++++++++++++++ +++++++++++++++++++
+++++++++++++ ++++++++++++
+++ +++ ++++++++++++++ ++++++++++++++++++
+++++++++
+++++++++
+
+++++++++++
++ ++++++++ +++++++++++++++++++++++++++++++++
+ ++++
+++++++++ +++
++++++++++++++++ ++++++++++++++
+++++++++++++++++
+++++++++++++++++++++
++++++++++++++++++ +++++++++++++++ ++++++++++ +++++++++++++
++ ++++ ++++++ +++++++++++++++ +++++++++++++++++
++++++++++++++ ++++++++++++++++++++++++++++++ +++++++++++++++++++++++++++++++++
+++++++++++++++++++++++++++++++++++++
++++++++++++++++++++++++++++++++++
++++++++++++
++++++ +++++++++++++ +++ +++++++++++++++++++++++++++++++++ ++++ ++++++++++++++++++++++++++++++++++++++++++
++
+++++++++++++++++++++++++++++++++++ ++++++++
++++++++++++++++++++
++++++++ +++++++++++++++++++++++++++++++++++++++++++++++++++ ++++ +++++++++++++++++++++++++ +++++++ ++++++++++++++ ++++++++++++++++++++++++++++++ +++++++++++
+++++++++++ ++++++
+++++++++++++++++++++++++++++++++++
+++++++++++++++++++++++++++++
++++++++++++++++++++++++++++++++++++++++++++++++++++++++++
++++++++++++++++
++ +++++++
+++++++++++++++++++ +++++
++++++++
++++++
++++++++++++ ++++++++++++
++++ +++++++++++++++
++++++++++++++++++++++ ++++++++++++++
++ ++++++++ +++ +++
+++++++++
+++++++++++++ ++++++++
++++++++++ ++++++++++++++++++++++++++++++++++++++++
++++++++++++ +++++++++++++
+++++++++++++++++ ++ ++++
+++++++++++++++++++++++++++++++++++++++++++
+++++++++++
+++++++++++++++++++
++++++++++++
+++++++++
+ ++++++++++++++++
+++++++++++++++++++++++++++++++++++++++++++++ ++ +++++++++++ +++++++++++++++++++++++++++++++++ ++++++++++++++++++++++++++++
+++++++++++++++++++++++++++++++
+++++++ +++
+++++++++++ ++++++++++++++++++
++++++++++++++++++++++++++++++++++++++++++++++++++
+++++++++++++++++++++++++++++++++++++++++++++++++++++ +++++ ++++++++++++++
+++ ++
+ +++
++++++++++++++++++++++++++++++
++++++++++++++
+++++++++++++++++++++++ ++
+++++++ ++++++
++++
+++++ +++++++++++++++++++++ +
+++++++
++
+++++++++++++++++++++
+++++++++++++++++
++ ++ +++ +++++++++
++++++++
+ ++++++++++++++++++++ +
++ +
++ +
+++
+++++++
+++++++++ ++++++ +++++
+++++ ++++++++
++++++++++++++
+++++ ++++++++++++++++
+++++++++++++++++
++
++++++++++ ++
++++ +++++
+++
++++++
+++++++++++++++
+++++++++
+
+++++++
+++++++++++++
++++++++
++++++++ +++++++++
+++++++++++++++++++++++++++++
+
++++++++++++++++ +++++++++
+++++ ++++++
+++++++++++ +
+++ ++
+++++++++++++
+ +++++++++++
+++
++++ ++++ ++++++
++++++++++++ ++
++++++ ++++++++++++
+++++++++ +++
++++++++
++++
++++++
+++++++
+++++++
++++++++
++++
++++++++++
+++ +++++++++++++++++++++++++
+++ ++++++++
+++++
++
+++++++++++
++
++++++ ++++++ +++
+++++++++++++++++++ ++
++ +++++++++
+++ +++++ ++++++++
+++++ ++++++ +++
++++++++++++++ +
++++++++
+++++++++++++++++++++
+++
++++++
++++++++++++++
++++++++++++ +
++++ +++ ++++++++ ++++++ +++++++++++ ++++++
++
+ ++++++++ ++++ ++++++
+++++++ ++
+++++++++++
+ ++++++++
+++++++++++
+++++++++
++++++ ++++++++++++ ++++++++++++++++++++++
+++++++++
+
+++++
++++++++++++
++++
+++++++++++
+++++++++++++++++++ ++++ + +
+++++++ +++ +
++
+++++
++++
+++++++++++
+++++++++
++++++
++++
++
+++++++++++++++++ +++++
++
+++++++ +++++++++++++
+ ++
+++++++++ ++++++++
+++++
++++++++++++++++++ +++++++++++++
++++++++++++++++ +++++++++++
++++ ++++++++++ ++++ +++++
++
+++++++ +++ +++++++++++++++++
++
++++
+++++++++ +++++ ++++++++++++
++ +++++++
+++++ +++++++++++ ++ ++++
++++++++ ++
+++++
+++
●
●
●
●
LegendJPTCHBYRICEUCTRLCASE
62

Figure C2.1.2. The principal components analysis (PCA) of samples used for haplotype analysis and the reference samples
from the HapMap project. (After QC)
63

Figure C2.2. Quantile-Quantile plots showed an acceptable genetic inflation (λ < 1.01).
64

3.2. Estimation of the genetic variance tagged by all SNPs
The genomic restricted maximum likelihood (GREML) method implemented in GCTA
(Genome-wide Complex Trait Analysis) software [117] was used to quantify the proportion
of additive genetic variance (narrow sense heritability) explained by all common SNPs.
GREML uses a linear mixed-effect model that includes a random effect to estimate the
polygenic component of trait variation. It was performed using 4,088 individuals (controls)
whose pair- wise relationship was estimated to be <0.05 and used a REML algorithm to
estimate the variance explained by SNPs data. Genetic relationships between pairs of
individuals were calculated in the cohorts previously tested for cryptic relatedness and
excluded if the proportion of IBD (identical-by-descent) estimate was >0.05[117]. The
genetic relationship matrix (GRM) was estimated including genotypes filtered by MAF
>0.01. Filtered genotype data were submitted to GRM analysis, and GRMs output data
were used in the restricted maximum-likelihood (REML) analysis. The analysis was
conducted by fitting the specific principal components as covariates to control for possible
population stratification. The variance estimate was transformed from the observed scale
(V(1)/Vp) to a liability scale(V(1)/Vp_L) under the assumption of an ALS prevalence of 2
per 100,000.
3.3. Gene-based Association Study
Gene-based tests for association are increasingly being seen essential and could be
directly used in pathway approach studies. Thus to identify novel associated genes,
versatile gene-based association study (VEGAS) was conducted. VEGAS incorporates
information from a full set of markers (or a defined subset) within a gene and accounts for
linkage disequilibrium between markers (based on Hapmap CHB+JPT) by using
simulations from the multivariate normal distribution. Given the known genes are ~20,000,
a Bonferroni corrected threshold of p value was estimated < 2.8 × 10⁻⁶.
65

III. Results
1. Association analyses
Initially 4,439 genotyped individuals (1,324 cases, 3,115 controls) were genotyped. After
QCs, 1,243 cases and 2,854 controls with genotypic information from 753,038 SNPs were
analysed. Full description of the cases included in this study is reported in Table C2.3,
Figure C2.3 and C2.4.The Statistical power has been estimated with cleaned data, OR
and MAF, which is presented in Figure C2.5.
As a result of the genome-wide association test alone, no loci were observed that reached
genome-wide threshold of significance (p < 5 x 10⁻⁸). The three most strongly associated
SNPs were:
i. rs4812037 (p = 7.03 x 10⁻⁷, OR 1.36, MAF cases: 0.268, controls: 0.238) on
chromosome 20 located in the intron of the GNAS (Guanine Nucleotide Binding
Protein, Alpha Stimulating Activity) region
ii. KGP3002248 (p = 2.97 x 10⁻⁶, OR: 0.78; MAF cases: 0.108, controls: 0.129), and
SNP KGP10613998 (p value: 4.59 x 10⁻⁶, OR: 0.79) both on chromosome 10
located in the SORBS1 gene.
Details of the top 20 most strongly associated SNPs are presented in Table C2.4.
Additionally, examination of these previously associated loci in the cohort, as an
independent replication study found no significant evidence for association in any loci
previously reported in Caucasian or non-Caucasian populations as susceptibility. This
study showed that the six previously identified loci in Caucasian populations did not have
any evidence of association in Chinese (Table C2.6, Pall > 0.05,except for rs6703183, p =
0.038, with a genome-wide association test, all SNPs surrounding the reported loci
66

±400Kb has been checked by using LOCUSZOOM[118], detailed information is offered in
appendix C2), and none of SNPs reported in the previous Chinese ALS showed evidence
of association[94]. These findings were not different after adjustment for gender and
ethnicity using principal components in a logistic regression analysis (appendix C2). The
study power [85] has been calculated and detailed information is presented in figure C2.4.
2. Genes-based association study and Heritability estimation
After using VEGAS, no clusters of significant markers could be identified passing the
threshold for corrected significance (P < 2.5 ×10⁻⁶). However, the result of gene-based
analysis was consistent with the GWAS result. The most strongly associated gene was still
GNAS (gene p value = 1.8 ×10⁻⁵). Details of the 20 most strongly associated SNPs are
presented in Table C2.5. In addition, examination of these previously reported causing
gene in the cohort, as an independent replication study found no significant evidence for
associations (Pall > 0.05), including the C9orf72, SOD1, TARDBP, FUS, OPTN.
It was calculated that 17% (SE: 5%; p value =6×10⁻⁵) of the phenotypic variance in ALS
liability was due to common SNPs by GCTA.
67

Table C2.3. Demographics of the Chinese GWAS case cohort
Cases passed GWAS 1,243
Onset age (year) 53.15(±11.94)
Number of cases Percentages
Missing data for age of onset 133 10.70%
Bulbar onset 158 12.71%
Spinal onset 744 59.86%
Missing data of onset position 341 27.43%
68

Table C2.4.Top 20 hits SNPs in the Chinese GWAS
Chr SNP Base Position (hg19) Minor Allele OR P value
20 rs4812037 57410978 G 1.36 7.03×10⁻⁷
10 KGP3002248 102898924 G 0.78 2.97×10⁻⁶
10 KGP10613998 130284254 T 0.79 4.59×10⁻⁶
10 rs1998911 97266538 T 0.79 9.76×10⁻⁶
4 KGP3005168 4249034 C 1.39 1.33×10⁻⁵
13 rs4444189 108025668 A 0.78 1.45×10⁻⁵
15 KGP3351805 100855592 T 0.80 2.06×10⁻⁵
5 rs10941853 20740586 A 0.81 2.47×10⁻⁵
1 rs2386551 247554949 T 1.27 2.52×10⁻⁵
14 KGP3125887 79847238 A 0.75 2.57×10⁻⁵
9 rs7849703 90073584 C 1.23 2.73×10⁻⁵
23 rs5963786 37475133 A 1.43 2.80×10⁻⁵
8 rs12548732 133429049 A 0.79 3.00×10⁻⁵
16 KGP16448885 3188573 A 1.39 3.07×10⁻⁵
5 KGP578954 2890462 T 1.31 3.38×10⁻⁵
3 KGP2319595 143854678 T 0.61 3.42×10-05
15 rs34988193 65235776 G 0.75 3.77×10⁻⁵
21 rs2212816 28432500 T 0.81 4.01×10⁻⁵
6 rs978308 77814697 A 1.22 4.11×10⁻⁵
21 rs762178 34399401 G 0.75 4.36×10⁻⁵
SNP: single nucleotide polymorphism; Chr: Chromosome.
69

Table C2.5 Replication Findings for ALS-associated SNPs from previous studies
SNP Ref Chr GENE Position Allele MAF Power
(P=0.05)
P value
rs2306677 [92] 12 ITPR2 26636386 C/T 0.20 0.68 0.29
rs6700125 [55] 1 FLJ10986 59702797 C/T 0.10 0.56 0.29
rs10260404 [93] 7 DPP6 154210798 C/T 0.18 0.68 0.77
rs12608932 [62] 19 UNC13A 17752689 A/C 0.26 0.69 0.21
rs2814707 [62] 9 MOBKL2B 27536397 A/G 0.033 0.28 0.89
rs3849942 [62] 9 C9orf72 27543281 A/G 0.053 0.26 0.97
rs8141797 [94] 22 SUSD2 24582041 - - - -
rs6703183 [94] 1 CAMK1G 209712889 C/T 0.34 0.64 0.04
rs34517613 [87] 17 SARM1 23634379 C/T 0.11 0.72 0.29
rs1788776 [87] 18 ANKRD29 19498035 - - -
SNP: single nucleotide polymorphisms; Ref: reference; Chr: Chromosome; MAF: Minor allele frequency.
Power (P=0.05): Statistical power[86] calculated with MAF, OR, sample size, when significance is chosen to
be 0.05.
70

Table C2.6.Top 20 gene associations within the Chinese GWAS
Chr Gene N SNPs Start Stop P value
20 GNAS 45 56848189 56919645 1.80×10-05
10 SORBS1 129 97061519 97311161 7.30×10-05
17 SUZ12 4 27288184 27352162 9.20×10-05
20 RNF114 17 47986320 48003829 0.000165
10 ACSL5 32 114123905 114178128 0.00017
15 MTFMT 15 63080902 63109030 0.000178
20 RNF114 17 47986320 48003829 0.00018
19 KIR3DX1 24 59735819 59748836 0.000186
10 ZDHHC6 24 114180047 114196662 0.000206
15 MTFMT 15 63080902 63109030 0.000217
17 UTP6 13 27214302 27252842 0.000226
2 RHBDD1 21 227409016 227569836 0.000271
17 C17orf79 12 27203011 27210369 0.000273
15 SPG21 22 63042415 63069304 0.000302
20 SPATA2 18 47953335 47965475 0.00041
1 WDR64 64 239913504 240031580 0.000424
15 FBXO22 9 73983254 74013999 0.000438
2 BBS5 20 170044251 170071411 0.000453
10 TLX1 27 102880251 102887526 0.000454
10 TD1 34 102839067 102880893 0.000482
SNP: single nucleotide polymorphisms; Chr: Chromosome; N: Number.
71

Figure C2.2. Manhattan plot
72

Figure.C2.3. Plots of most significant loci generated by Locuszoom
(http://csg.sph.umich.edu/locuszoom/) in the Chinese GWAS
73

Figure.C2.4. Power of the statistical test[86] according to the sample size, OR and
MAF when significance is 5×10⁻⁸.
1 1.2 1.4 1.6 1.8 2 2.2 2.4 2.6 2.8 3
0.000%
10.000%
20.000%
30.000%
40.000%
50.000%
60.000%
70.000%
80.000%
90.000%
100.000%
MAF = 0.1MAF = 0.2MAF = 0.3MAF = 0.4MAF = 0.5
OR
Gen
etic
Pow
er
74

IV. Discussion
Though overall 4,080 individuals were included in the analysis, no GW-significant SNP
associations (p < 5.0×10⁻⁸) or gene-based associations (p < 2.5×10⁻⁶) were observed.
Several factors may have contributed to this lack of genome-wide significant results.
Perhaps most importantly, although the study has been planned carefully in order to
maximize the probability of finding novel associations, the sample size is still not large
enough. The study power depends on assumptions about the underlying disease model, in
addition to effect sizes and sample sizes[119]. Effect sizes of 1.5 or smaller might be
typical of what would now be expected for most variants affecting susceptibility to common
human diseases. For effect sizes at the top of this range (1.3–1.5) very large studies (say
2,000–3,000 cases and the same number of controls) are needed to have reasonable
power, while for smaller effect sizes even studies of 5000 cases and 5000 controls have
very little power. However, such a sample size is challenging to achieve particularly given
the low frequency of ALS.
The most strongly associated, though not GW-significant, association falls inside the intron
of GNAS gene, which was consistent with the VEGAS result. Several other SNPs with
reported stronger associations in previous ALS GWAS studies did not meet criteria for
statistical significance in the replication analysis. The top associated SNP (rs4812037) is
within GNAS region. The lead SNP at this locus was in LD with SNPs in the GNAS,
GNAS-AS1 gene. Multiple transcript variants encoding different isoforms have been found
for GNAS gene. The alternative splicing of downstream exons is observed, which results in
different forms of the stimulatory G-protein alpha subunit, a key element of the classical
75

signal transduction pathway linking receptor-ligand interactions with the activation of
adenylyl cyclase and a variety of cellular responses. Mutations in this gene have
previously been reported to result in some congenital diseases including endocrine-related
diseases and disorders of skeletal development. An antisense transcript is produced from
an overlapping locus on the opposite strand. GNAS-AS1, one of the transcripts produced
from this locus, and the antisense transcript, are paternally expressed noncoding RNAs,
and may regulate imprinting in this region. No neurological role for this gene has
previously been reported.
This GWAS, which is the largest such study of ALS in the Han Chinese population, allows
us to perform a direct comparison with GWAS findings in populations of European
ancestry and previous reported Chinese GWAS findings. Notably, our study showed that
previously identified loci in European populations did not have any evidence of association
in the Chinese cohorts (Pall > 0.05), and one recently reported SNPs in a Chinese GWAS
study did not show association (Pall > 0.05). Both the current study in the Chinese
population and the GWAS performed in the population of European ancestry had sufficient
power to replicate the associations identified in the other population. The negative
replications in GWAS findings between the Chinese and European populations might
suggest heterogeneity of ALS genetic susceptibility in the two populations, or the identified
susceptibility loci might be population-specific genetic risk factors for ALS.
A recent report[120] describing a Chinese ALS cohort suggested that epidemiological
characteristics of Chinese MND patients were similar to those observed in international
populations. However a separate investigation[111] confirmed the earlier age at onset of
ALS in China as compared to Caucasian populations. In addition, the significantly low
frequency of known ALS causing genes has been reported in Asian populations, including
76

the rare mutations in C9orf72 and VCP. Given the negative replication in this presented
GWAS, the differences between populations could be explained by the ancestry-related
heterogeneity. The differences between the results of the current study and those of other
GWAS for ALS could also be due to the differences in LD and haplotype patterns in the
two populations. It is possible that, although the same causal variants exist in both
Chinese and European populations, some of the causal variants were not efficiently
tagged by any SNPs screened in the GWAS analyses and thus were not detected in popu-
lations beyond the original one in which they were discovered.
It is calculated that the heritability of ALS due to common variation is 17% based on a
prevalence of 2 per 100,000, although the true prevalence of ALS may be higher as
consequence of increasing age in the human population. Twin studies estimate heritability
due to all genetic variation including rare monogenic forms of the disease; the method
used in this study in contrast estimated heritability captured by the genotypes available
and therefore mainly captures common polymorphisms either directly typed or imputed.
The difference between heritability estimated from twin studies and from analysis of
common SNP polygenic variation suggests a substantial role for variation not captured by
genome wide association studies. Alternately, since shared environment is greater within
families (ie within twin pairs) than between unrelated individuals, the difference may relate
to environmental effects. Nonetheless, this is the first time that the heritability of the
Chinese ALS has been estimated based on common variations, and indicates the
existence of common susceptibility loci in Chinese ALS.
The failure of the replication of the previous Chinese findings highlights the importance of
the sample size to achieve adequate power in GWAS studies. Although the P values of in
the previous Chinese susceptibility loci were genome-wide significant, it is still could not be
77
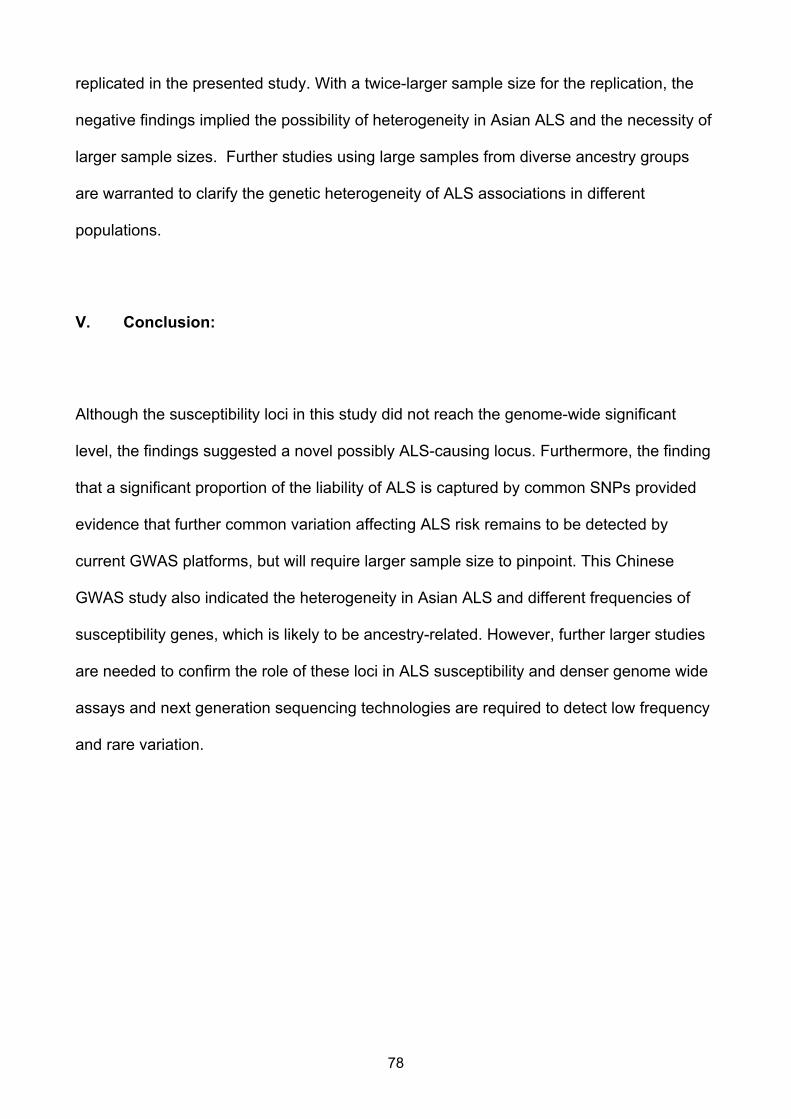
replicated in the presented study. With a twice-larger sample size for the replication, the
negative findings implied the possibility of heterogeneity in Asian ALS and the necessity of
larger sample sizes. Further studies using large samples from diverse ancestry groups
are warranted to clarify the genetic heterogeneity of ALS associations in different
populations.
V. Conclusion:
Although the susceptibility loci in this study did not reach the genome-wide significant
level, the findings suggested a novel possibly ALS-causing locus. Furthermore, the finding
that a significant proportion of the liability of ALS is captured by common SNPs provided
evidence that further common variation affecting ALS risk remains to be detected by
current GWAS platforms, but will require larger sample size to pinpoint. This Chinese
GWAS study also indicated the heterogeneity in Asian ALS and different frequencies of
susceptibility genes, which is likely to be ancestry-related. However, further larger studies
are needed to confirm the role of these loci in ALS susceptibility and denser genome wide
assays and next generation sequencing technologies are required to detect low frequency
and rare variation.
78

CHAPTER 3: C9ORF72 SCREENING AND HAPLOTYPE PHASING ANALYSIS
79

I. Introduction
A large hexanucleotide (GGGGCC) repeat expansion (HRE) in the first intron of the
chromosome 9 open reading frame 72 gene (C9orf72), located at chromosome 9p21, has
been identified as the most common mutation detected in ALS and frontotemporal
dementia (FTD) patients in Caucasian populations[11, 79]. When compared with patients
not carrying the HRE, carriers show some distinct clinical characteristics, including a
higher frequency of bulbar onset, shorter survival rates, and a higher frequency of family
history and comorbid cognitive impairment. The C9orf72 HRE is more frequent among
patients with onset > 61 years of age[121].
A common founder risk haplotype and the single nucleotide polymorphism (SNP) for the
rs3849942 A allele occur in most reported C9orf72 HRE-carrying ALS cases in diverse
populations, and it has been proposed that the repeat expansion arose in a single
common founder ~1,500 years ago[78]. The HRE has also been found in neurologically
healthy controls (~0.2 %) as well as in Italian geriatric cases without ALS or dementia
(1.2%)[71, 76-79]. The relatively high frequency of the HRE amongst controls (compared
with the lifetime risk of ALS) may be explained by the late age of onset of ALS, or due to
reduced penetrance of the HRE, which is estimated to be non-penetrant in individuals less
than 35 years of age, 50% penetrant by 58 years and almost fully penetrant at 80
years[78]. Evidence that the HRE itself is disease-causing, rather than another variant in
linkage disequilibrium with it, lies in the presence of repeat-positive RNA foci in post-
mortem brain and spinal cord from HRE carriers, similar to RNA foci seen in other repeat-
expansion disorders[11]. Additionally, in induced pluripotent stem cell-differentiated
neurons from HRE carriers, antisense oligonucleotides targeting the GGCCCC repeat
80

reduced the number of RNA foci as well as other pathological characteristics of the cells
(e.g. glutamate-mediated excitotoxicity)[122].
There are several hypotheses about the functional consequences of the HRE, including
gain-of-function RNA toxicity and repeat-associated non-ATG translation of toxic di-
peptides[11, 123]. A loss-of-function mechanism has also been proposed, whereby the
HRE leads to apparent reduction of C9orf72 mRNA in HRE carriers[11, 124]. Recently,
abnormal methylation of the CpG island upstream of the repeat was found in 73% of HRE
carriers[125]. Hence, the HRE might produce aberrant CpG methylation of the C9orf72
promoter and downregulation of C9orf72 transcripts[11, 124, 125].
To date, large cohorts of Caucasian ALS cases have been assessed for C9orf72 HRE,
however comparatively few studies of small cohorts of Asian cases have been
conducted[78, 81-83]. It was aimed to more accurately determine the frequency of the
C9orf72 HRE in a large cohort of Chinese sALS subjects, and investigate its relationship
with the SNP haplotypes surrounding C9orf72.
II. Material and Methods
1. Participants
Patients attending the ALS specialty clinic at the Department of Neurology of Peking
University Third Hospital, Beijing, China, from 2003-2013 were recruited. Patients in the
case cohort were diagnosed with ALS according to El Escorial revised criteria[114] by a
neurologist specializing in ALS. In the present analysis, only sALS cases were included
based on self-report and clinical interview. The cohort consisted of 65% males, while mean
81

age of onset of sALS was 49.7 ± 12.2 years. The proportion of patients with bulbar onset
was 17%. The control samples were from individuals who attended the same hospital and
Shanghai Changzheng Hospital, and who had no medical or family history of neurological
disorders. All patients and control subjects were from mainland China and of Chinese
origin. Control cohorts were age- and sex-matched neurologically healthy individuals.
Table C3.1 describes the demographic characteristics of the case cohort and control
subjects. All patients and controls provided written informed consent for the clinical and
genetic studies during their visit to the neurologist. The Peking University Third Hospital
and Changzheng Hospital ethics committees approved the collection of DNA samples from
case and control subjects.
2. Repeat-primed PCR
Genomic DNA from 1,092 patients with sALS and 1,062 controls subjects was extracted
from blood using standard protocols. Two-step polymerase chain reaction (PCR) was
performed to detect C9orf72 HRE as previously described[11]. Briefly, fluorescent
fragment-length analysis was performed with genotyping primers. The samples with a
homozygous peak pattern were analyzed by fluorescent repeat-primed PCR to identify
HREs. The primers and protocols for two-step PCR are listed in Table C3.1. HRE was
defined as repeat number greater than 30[79] indicated by the typical “saw-tooth” pattern
seen by repeat-primed PCR.
3. Haplotype SNP analysis, principal-component analysis and validation
Genome-wide genotyping was performed using Illumina HumanOmniZhongHua DNA
analysis arrays (900,015 SNPs/individual) and manufacturer’s protocols. Bead intensity
data was processed and normalized for each sample, and genotypes extracted in Genome
Studio (Illumina, San Diego). In order to
82

predict haplotypes with greater accuracy a larger cohort of 3,115 control samples was
used for haplotype analysis. 939 cases and 2,850 controls survived after QC with 784,352
SNPs/individual. SNP genotypes from HRE carriers were validated by direct sequencing.
Twenty of the SNPs tested were of the consensus risk founder haplotype in several ALS
populations[80], and three additional SNPs flanking the repeat were assessed. Haplotype
analysis of the 23 SNPs within and surrounding C9orf72 was performed by direct
investigation and data imputation (using IMPUTE2[126], with the 1,000 Genomes Project
reference panel, Phase I version 3) to determine whether the Chinese patients carried the
founder haplotype associated with a risk for ALS. Haplotype reconstruction and frequency
estimations were performed using PHASE (version 2.1.1, Chicago, IL)[90]. Principal
component analysis (PCA) was conducted by using the software package
EIGENSTRAT[116]. Detailed methods regarding the reagents applied and other
information are provided in Appendix C3.
83

Table C3.1. Protocols for the two-step PCR and primers for the set of 23 SNPs within
and surrounding the C9orf72 gene.
Table C3.1. 1. Primer sequences for the repeat-primed PCR
Step Primer name Sequence
Chr9:27563580F FAM-CAAGGAGGGAAACAACCGCAGCCFragment length PCR
Chr9:27563465R GCAGGCACCGCAACCGCAG
MRX-F FAM-TGTAAAACGACGGCCAGTCAAGGAGGGAAACAAC
CGCAGCC
MRX-M13R CAGGAAACAGCTATGACC
Repeat-primed PCR
MRX-R1 CAGGAAACAGCTATGACCGGGCCCGCCCCGACCACGC
CCCGGCCCCGGCCCCGG
84
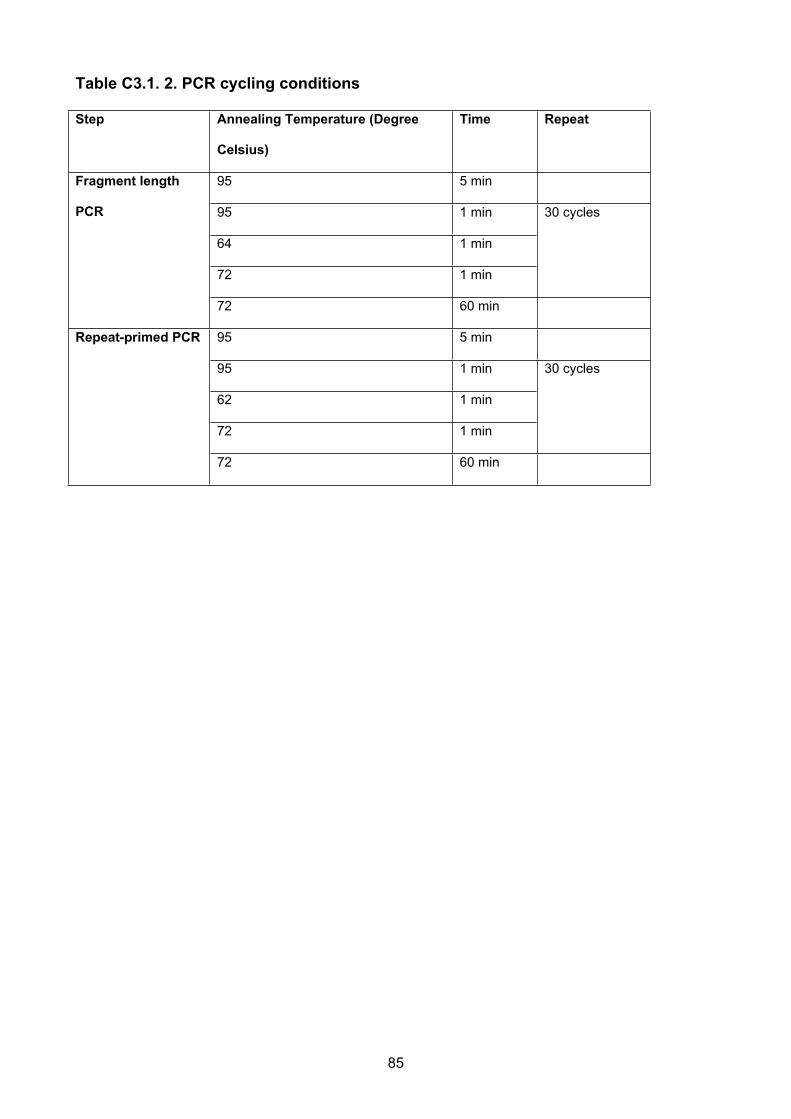
Table C3.1. 2. PCR cycling conditions
Step Annealing Temperature (Degree
Celsius)
Time Repeat
95 5 min
95 1 min
64 1 min
72 1 min
30 cycles
Fragment length
PCR
72 60 min
95 5 min
95 1 min
62 1 min
72 1 min
30 cycles
Repeat-primed PCR
72 60 min
85

Table C3.1. 3. PCR primers for the set of 23 SNPs within and surrounding the
C9orf72 gene.
rs number Position Forward primer Reverse primer
rs1822723a 27478052 TGCAAGGTAAGATGCTGGAA TTGCTTCTTCCCTGGTTCTG
rs4879515 a 27482235 TGAACGAAAAGCACGGTAAA AGTAAGCCCCCAAAGGAGAC
rs868856 a 27489251 GGTCTGACAGAAGCCTTTGC TGGCTCCCACGGTAGTTTTA
rs7046653 a 27490967 CATCGATGCTGTAGGCACAA TCTCATCGTTCCGAAGAAAT
rs1977661 a 27502986 TCACAGGAAAGTAGGCAGGAA TCCTCCAGTCTAGTCACCCCTA
rs903603 a 27529316 CTGCTCGCTCCCGATCTC CCCAGGCGCACTTTTGTA
rs10812610 a 27533984 GGTTTCTATCCAGTGTCCCAGA GCATGTTTGGGTCTCCATCT
rs2814707 a 27536397 GCCTCCTGTAATTGCTCACC TCCCCTTTTCACCTCTCTCA
rs3849942 a 27543281 TCAGAGTGCTGTGGTACGATT GCGCTCCACAGATGGATACT
rs700791 27545960 ACAGCAGGGATTCACACTCG ACACTTTCATCTGCAAAGCTAGG
rs10122902 a 27556780 TGAAGTGGCTCTCCAGAAGG TTTGCACACACTCATGAATAGC
rs10757665 a 27557919 TTGAAAATGCACAAAAGCCTAA GGATTTAAGCAATTCCTATGTATGTGT
rs1565948 a 27559733 GGTTTGCTGAAATTGAAAGATACA TCATCTTGATTTCATTGTCTTCG
rs774359 a 27561049 GGCACTCAACAAATACTGGCTA CTTTTTCCATCCAGCAGTGG
rs2453554 27561800 AGCAAGGGGCCATGATTTCT GTGGGAGGATCCCAGCTCTT
rs2282241 a 27572255 TTCTCAGACTTTGGGAAACTTTTA TGCCAACATAGCCAAACAAA
C9orf72
repeat
expansion
27573483
rs11789520 27574515 GCGTCATCTTTTACGTGGGC GAACAGTAGGAAAAGGGTCTGT
rs1948522 a 27575785 CACCCCATAATCCACTCACC CCTTTCGGAATGGCAGTATC
rs1982915 a 27579560 GGCCAGTTTCATGCAATTCT TGTTTCAGGGTTGATATCACAAA
rs2453556 a 27586162 ATCATCCACTCCCCTCCTCT AACCAAGCAGCCATGAAAAG
rs702231 a 27588731 AACCATCTGTCTTCCTTCCATGTC AGGCAGTGTTTACTCGCCAC
rs696826 a 27589657 TTGCTGGAGTGTTTGCAGAG ATGAACCCAGCTGTCTCACC
rs2477518 a 27599746 CGTTTTGGGAAATCGCTTAG CAGGTGAAACCCATTTGTCA
* from the 20 SNP consensus risk founder haplotype.
86
III. Results
The HRE was identified in three Chinese patients with sALS
(Ch_MND_11134;Ch_MND_8446;Ch_MND_9059) of the 1,092(0.3%) cases genotyped,
and was not found in controls (p=0.25, Fisher’s exact test). The average repeats number
in the 1,089 ALS patients without the HRE was 3.79 ± 2.59(range 2-25), while the repeat
number in the 1,062 control subjects was 3.84 ± 2.60 (range 2-23). The repeat number
distribution of the alleles is shown in Figure C3.1. All three HRE carriers showed classic
clinical manifestation of ALS with progressive respiratory dysfunction. The detailed clinical
presentations are summarized in Table C3.2 and C3.3. PCA showed minimal evidence for
population stratification. The three patients carrying the HRE were not ethnic outliers and
are not closely related to one another (genomic relationship matrix elements [127]<0.01).
Genotypes were generated from 23 SNP loci located within 121 kilobases of C9orf72. In
single marker analysis, no SNPs or haplotypes showed any significant association with
ALS risk. The total set of consensus Caucasian risk alleles and risk allele A of rs2814707
was not found in the three HRE carriers (Table C3.4). Five alleles emphasized in defining
the 20-SNP Caucasian founder risk haplotype (A of rs2814707 as well as A of rs3849942,
C of rs774359, G of rs2282241, and G of rs1982915) were not present in two of the three
cases (Ch_MND_9059 and Ch_MND_11134). For the two SNPs flanking the repeat
(rs2282441 and rs11789520), these two cases were homozygous for T and C alleles,
while the Caucasian founder carries G and T alleles respectively, indicating the presence
of a different haplotype to the European founder chromosome. The inferred haplotypes in
the three HRE carriers were consistently robust to different PHASE parameters (deviations
from the stepwise mutation model or inclusion of microsatellite loci, appendix C3). One
haplotype (TTGGAAACCCGTGTCACCAAAGT, Fcases=0.049, Fcontrols=0.056, Table
C3.4 and C3.5) on which the HRE resides, was observed both in Ch_MND_11134 and
87

Ch_MND_8446. Ch_MND_9059 shared a haplotype containing part of the European 20
consensus SNPs (12/20).
88
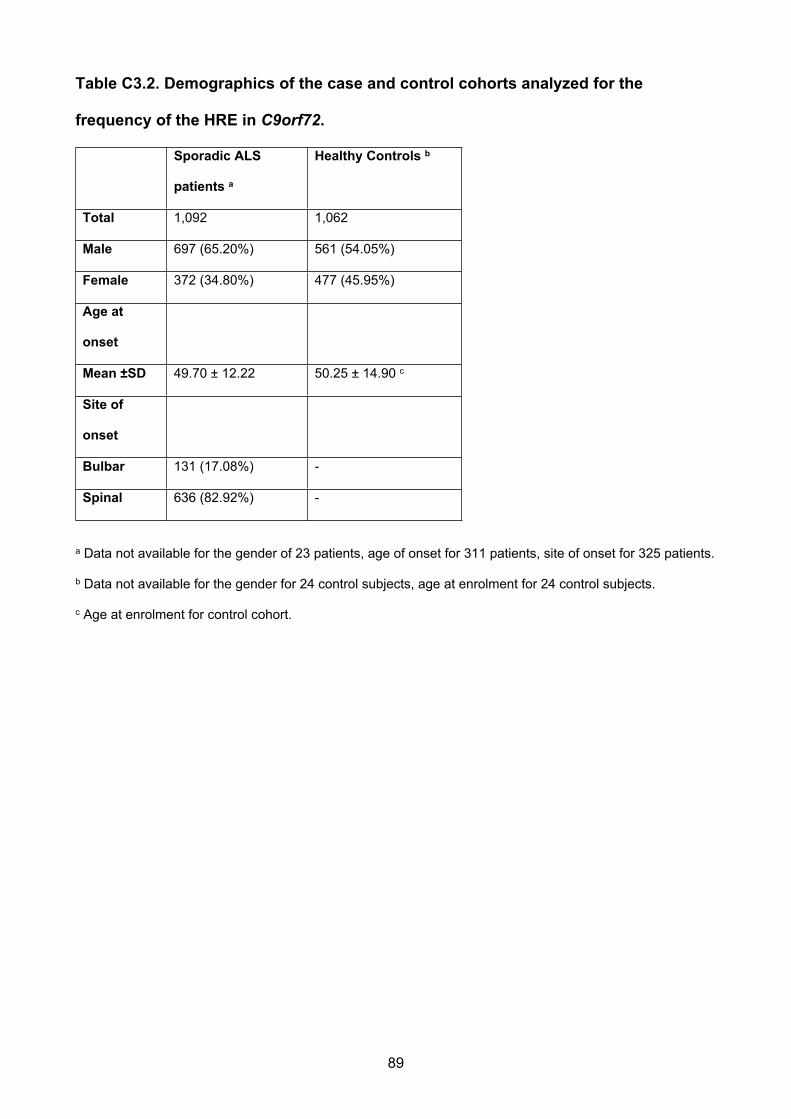
Table C3.2. Demographics of the case and control cohorts analyzed for the
frequency of the HRE in C9orf72.
Sporadic ALS
patients a
Healthy Controls b
Total 1,092 1,062
Male 697 (65.20%) 561 (54.05%)
Female 372 (34.80%) 477 (45.95%)
Age at
onset
Mean ±SD 49.70 ± 12.22 50.25 ± 14.90 c
Site of
onset
Bulbar 131 (17.08%) -
Spinal 636 (82.92%) -
a Data not available for the gender of 23 patients, age of onset for 311 patients, site of onset for 325 patients.
b Data not available for the gender for 24 control subjects, age at enrolment for 24 control subjects.
c Age at enrolment for control cohort.
89

Table C3.3 Clinical characteristics of sporadic ALS patients carrying the HRE.
Case Gender Age at
onset
(years)
Site of
onset
Bulbar
involved
Clinical certainty
at enrolment
Length of
survival
(months)
Ch_MND_8446 Male 58 Spinal
(right arm)
Yes Probable ALS 40
Ch_MND_9059 Male 58 Spinal
(upper
limbs)
Yes Probable ALS 15
Ch_MND_11134 Male 54 Spinal (left
leg)
Yes Definite ALS 40
90

Table C3.4. SNP data for C9orf72 hexanucleotide-associated hapolotype in cases
carrying repeat expansions.
Marker PositionReference/
Alternative
Risk
alleleFreq CHB
Common
alleles in
3 cases
Ch_MND_
11134
Ch_MND_
8446
Ch_MND_
9059
rs1822723* 27478052 C/T C C=0.63 T T T C C a C
rs4879515* 27482235 C/T T T=0.71 T** T a T T a T T a T
rs868856* 27489251 T/C T C=0.62 C T C T T a T
rs7046653* 27490967 A/G A G=0.62 G A G A A a A
rs1977661 * 27502986 C/A C C=0.72 A C A C C a C
rs903603* 27529316 C/T C T=0.61 T C T C C a T
rs10812610* 27533984 C/A C A=0.61 A C A C C a A
rs2814707* 27536397 G/A A G=0.95 G G G G G G G
rs3849942* 27543281 A/G` A G=0.93 G G G G A G G
rs700791 27545960 C/A A C=0.93 C C C C A C C
rs10122902* 27556780 G/A G G A G G A G
rs10757665* 27557919 T/C T G=0.68 T** T a T T a T T a T
rs1565948* 27559733 G/A G A=0.89 G a A G a G A G
rs774359* 27561049 T/C C C=0.56 T T T T C T T
rs2453554 27561800 C/T T T=0.93 C C C C T C C
rs2282241* 27572255 G/T G G=0.92 T T T T G T T
C9orf72
repeat
expansion
27573483 30+ 2 30+ 2 30+ 2
rs11789520 27574515 C/T T C=0.93 C C C C T C C
rs1948522* 27575785 C/T C C=0.92 C** C a C C a C C a C
rs1982915* 27579560 A/G G A=0.84 A A A A G A A
rs2453556* 27586162 A/G G A=0.53 A A G A G A G
rs702231* 27588731 C/A A A=0.63 A** A a C A a C A a A
rs696826* 27589657 A/G G G=0.99 G** G a G G a G G a G
rs2477518* 27599746 T/C T T=0.84 T** T a T T a T T a C
Freq CHB: allele frequencies in Han Chinese in Beijing, China from 1,000 genomes
(www.1000genomes.org/); *: from the 20-SNP consensus risk founder haplotype; **: from the alleles that are
shared with the European 20 consensus SNPs and 3 cases; a: The alleles that are shared with the European
91

20 consensus SNPs; Ch_MND_11134 and Ch_MND_8446 share the same haplotype where the repeat
located. Bold indicates alleles from the European haplotype absent in the Chinese HRE carriers.
92

Table C3.5. Frequencies of C9orf72 hexanucleotide repeat-associated SNP
haplotype in the imputed data in different cohorts.
Individuals European 20-
SNP
haplotype in
Chinese
cohorts
23 SNP
haplotype
shared in 2
cases with
repeat
Haplotype
shared in all
cases with
repeat
Haplotype
shared in 3
cases and
European
Cases (n=939) 33 89 374 470
Controls
(n=2,850)
105 310 1,174 1,469
p value (χ2-test) 0.89 0.26 0.50 0.47
Haplotype
Frequency in
cases(%)
1.8 4.9 23 30
Haplotype
Frequency in
controls(%)
1.9 5.6 23 30
Haplotype
Frequency in the
Chinese
cohorts(%)
1.8 5.4 23 30
93

Figure C3.1. C9orf72 hexanucleotide repeat lengths in Chinese ALS cases and healthy controls. Three cases with mutation
found in 1,092 cases and none in 1,062 controls
0
5
10
15
70
2 3 4 5 6 7 8 9 10 11 12 13 14 15 16 17 18 19 23 25 30+
Per
cent
age
%
Repeats Number
sALS
control
94

IV. Discussion
This study confirms that C9orf72 repeat expansions are less prevalent in patients of
Chinese compared to Caucasian ethnicity. The expansion was identified in 3/1,092 cases
compared to 0/1,062 controls. Most likely because of the low prevalence, this difference
does not achieve statistical significance (Fisher’s exact test, p=0.25). The HRE has
previously been identified in Caucasian control subjects with an observed frequency of 0-
0.4%[71, 76, 78, 79], similar to the frequency found in the Chinese sALS cohort. Given the
lack of statistical significance of the association of the HRE with ALS in Chinese, this study
is unable to provide statistical or functional proof that the HREs detected in the Chinese
cohort are the cause of ALS in the three identified cases. However, the HRE was not
found in 1,062 Chinese controls in the study, or Chinese healthy controls reported by
others[81, 83].
The frequency of the C9orf72 HRE in several Caucasian ALS cohorts range from 10.95% -
47% in fALS and 3.20% - 21.1% in sALS[70-72, 78, 121, 124, 128]. However, the reported
frequencies in Asian samples have been lower. Four studies have reported a low
frequency of HRE in Japanese ALS cases (0 - 3.4% in fALS, and 0.4% sALS)[73, 78, 129,
130] and a higher frequency was reported in cases from Taiwan of Han Chinese ancestry
(18.2% in fALS, and 2.0% in sALS)[75]. In the present study, the author reports that the
frequency of the C9orf72 HRE in Chinese sALS patients is 0.3%. To date, this is the
largest cohort screened in non-Caucasian ALS cases. Previous reports about C9orf72
HRE in different populations support the hypothesis that the pathogenic HRE arose from a
single founder haplotype both in Caucasian and Asian populations[11, 73, 75, 78, 80, 81,
129, 130], although for cases in Taiwan it was postulated that the HRE was introduced in
the 17th century when Taiwan was under Dutch and Spanish colonial rule. The conjecture
95

that Asian HREs arose on the same European founder seems inconsistent with the
mutation occurring in a founder 1,500 years ago[78]. The expansions identified in this
study were present on ancestral haplotypes that were distinct from the haplotype in
populations of European ancestry. Haplotype analysis indicated that the previously
reported 20-SNP consensus haplotype did not occur in the three HRE carriers from China.
The A allele of rs2814707 has been used as a significant genetic association marker of
chromosome 9p21 in the Flanders-Belgian cohort of patients with FTLD, FTLD-ALS, and
ALS (odds ratio 2.6, 95% CI 1.5-4.7; p=0.001)[124]. However, this allele was not found in
the cases carrying the C9orf72 HRE, corresponding with the absence of association
between rs2814707 on 9p21and sALS in Japanese or Chinese populations[102]. The A
allele of rs3849942 has also been associated with an increased risk of ALS[76], and this
variant was not detected in Ch_MND_9059 or Ch_MND_11134. Four additional SNP
alleles present on the European founder haplotype were also not found in these two
patients. The fact that the C9orf72 HREs did not occur on the previously reported 20-SNP
haplotype was further confirmed by haplotype analysis. A novel haplotype was found in 2/3
patients carrying the HRE. The third patient carried the partial haplotype of European
ancestry, broadly consistent with previous studies within non-Caucasian populations.
Correspondingly, the author detected a low frequency of the common Caucasian risk
haplotype in a large Chinese cohort (Fcases= 0.018, Fcontrols=0.019, p=0.743, Table
C3.3). Importantly, the identification of three HREs in Chinese ALS cases that have arisen
on independent haplotypes from the European founder, support the notion that the HRE is
the ALS causing mutation, rather than another variant in linkage disequilibrium with it.
Bulbar onset and cognitive impairment are more common in ALS patients with the C9orf72
HRE[131, 132]. The three Chinese patients harboring the C9orf72 expansion presented
with spinal onset but no cognitive impairment. Although the age of onset has been
96
reported to be younger in sALS patients with the HREs compared to those without
expansions, the patients developed the symptoms at a relatively older age (Table C3.1
and C3.2). Given that only three HRE carriers reported, it is not possible for us to make
conclusions regarding the role of the HRE or CpG methylation in disease onset or
progression in Chinese ALS.
The size distribution of normal alleles also differs between the Han Chinese cohort and
that reported in Caucasians[76]. Caucasian chromosomes contain a range of alleles with
up to 43 copies[76, 125] whereas in the Chinese samples alleles with more than 12
repeats were rarely observed. For disease-causing repeat expansion mutations at other
loci a lower frequency of larger, normal alleles in populations was related with a reduced
incidence of repeat expansion and disease (e.g. myotonic dystrophy[133]). This result is
consistent with this also being the case for C9orf72 HREs in Han Chinese. The European
risk haplotype has been associated some Caucasian chromosomes containing five copies
of the repeat, most containing eight, and with all larger alleles[76]. In the Chinese sample,
alleles with five copies represented less than 1% of alleles, and eight copies less than 6%,
compared with Caucasians where they represent ~20% and ~16% respectively. At the
C9orf72 locus in Caucasians, the allele frequencies and haplotypes reported support that
the first mutation was production of moderately unstable alleles with five copies, and a
second to produce more unstable alleles with eight copies. At this stage the repeat was
likely further destabilised and all larger alleles contain the “risk haplotype”. The rules for
dynamic mutation appear to apply to the C9orf72 repeat where upon transmission, a
dynamic mutation allele has a higher chance of mutation that its predecessor[134]. Three
HREs have been identified in Han Chinese ALS patients, and at least two of these did not
originate from the Caucasian founder, suggesting that dynamic mutation of the C9orf72
97

hexanucleotide repeat, independent of the European founder chromosome, does occur,
but is rare.
V. Conclusion
In conclusion, the present study demonstrates the low frequency of the C9orf72 HRE in
Chinese sALS patients from mainland China. The distinct SNP alleles and haplotypes from
the European 20-SNP consensus risk haplotype indicate that the C9orf72 expansion in
Chinese sALS patients is not from the same single founder haplotype involved in
populations of European descent.
98

CHAPTER 4: NGS DATA ANALYSIS IN FAMILIAL AND SPORADIC ALS
99
I. Introduction
Cases of familial ALS (fALS) are most commonly diagnosed when similar clinical
phenotypes are reported or observed in other family members of the proband. However,
the inheritance pattern is sometimes difficult to be determined, because it is affected by
multiple factors including the environmental factors, events in the person's development or
the penetrance of the genetic defect causing disease. fALS is commonly considered as a
monogenic but genetically heterogeneous disease, which could follow an autosomal
dominant, autosomal recessive, or X-chromosomal trait of inheritance. To date, mutations
in more than 20 genes have been implicated in ALS (Table C1.1), with approximately half
of these genes associated with dominantly inherited fALS. The high heritability shown in
fALS has enabled the identification of several genetic causes, of which mutations in SOD1,
FUS, TARDBP and C9orf72 are the most frequent[135].
Recently, it has been hypothesised that the incomplete penetrance in ALS could be
caused by a complex inheritance of risk variants in multiple genes[136]. The most
compelling evidence for the oligogenic basis was found in individuals with a p.N352S
mutation in TARDBP, detected in both familial and sporadic ALS cases in a Caucasian
study (50% of whom had an additional mutation (ANG, C9orf72 or homozygous TARDBP).
On this basis, this chapter focused on the role of rare genetic variants in ALS within most
common ALS genes and reported oligogenic basis in particular genes (including C9orf72,
SOD1, TARDBP, FUS and ANG) and further exploring and describing the prevalence of
possible causative genes in a certain cohorts of Han Chinese ALS patients.
100

II. Material and Methods
1. General summary for the analysis strategy
To comprehensively characterize the contribution of rare variants in ALS, this study
conducted a genome-wide analysis based on sequencing regions of interest (exons in
~20,000 known genes) using high throughput DNA-sequencing technologies on the
Chinese ALS cohorts. A strategy (Figure C4.1) was developed in the analysis for both
known ALS genes and previously unassociated genes, using next-generation sequencing
(NGS) among fALS cases, with comparisons to sporadic ALS (sALS) cases and healthy
controls. After screening for possible causative mutations in SOD1/TARDBP and for
extended hexanucleotide repeat expansions in C9orf72 by Sanger sequencing, all coding
exons and some flanking sequences of genes across the whole genome were captured,
individually barcoded and followed by HiSeq2000 sequencing. The candidate variants in
fALS were then validated using Sanger sequencing and annotated by function possibility
and literature review.
101

Figure C4.1. Candidate mutations filtering strategy
SOD1,TARDBPscreening in 34probandsSanger sequencing in 34 fALSprobands
Known ALSgenes/variantsscreeningWhole exomesequencing(NGS, currentdata) (15/34 probands+193cases/103 healthy controls)
Sanger sequencingvalidation andsegregation analysis
Unknown ALSgenes/variants(Strategy)Functional Annotation/Sangersequencing/Segregationanalysis
102

2. Patients and healthy controls
77 participants composing of 34 probands and 43 relatives from unrelated Han Chinese
fALS families and 193 independent sporadic ALS cases were recruited for this study. The
family history was confirmed with self-reported familial history and clinical data of affected
family members. Next generation sequencing data was also generated from 103 Chinese
healthy controls. All patients and controls provided written informed consent for the clinical
and genetic studies during their visit to the neurologist. The Peking University Third
Hospital and Changzheng Hospital ethics committees approved the collection of samples
from case and control subjects.
3. Mutation screening
3.1 SOD1/TARDBP mutations screening and variants validation by Sanger
sequencing in fALS
Genomic DNA was extracted from peripheral blood lymphocytes using protocols described
in appendix C1. Primer pairs for SOD1/TARDBP were used to sequence all exons and
exon-intron boundaries in all 34 fALS probands. PCR products were purified from
unincorporated nucleotides by using Exonuclease and alkaline phosphatase with a
standard protocol provided in appendix C4. In addition, to validate the variations identified
with WES, the corresponding gene regions surrounding the variations were amplified by
PCR and sequenced by Sanger sequencing in an ABI 3130 Genetic Analyzer (PE
Biosynthesis, USA). Primers for variations located in candidate genes were generated
using Primer3plus (http://www.bioinformatics.nl/cgi-bin/primer3plus/primer3plus.cgi). The
Sanger sequencing analysis was performed by DNASTAR (Version 2.3.0.131). The
detailed methods for reagents applied, Sanger sequencing and other information are
offered in appendix C4.
103

Table C4.1. Primer designed for PCR and Sanger sequencing:
Table C4.1.1. Primers designed for Sanger sequencing and PCR replication in the
presented study.
hSOD
1-Fx1
TTTGGGGCCAGAGTGGGCGA hSOD1-Rx1 GACCCGCTCCTAGCAAAGGT
hSOD
1-Fx2
CTGTGAGGGGTAAAGGTAAATC hSOD1-Rx2 AACAAGTTGAGGGGTTTTAACG
hSOD
1-Fx3
TGTTCCCTTCTCACTGTGGC hSOD1-Rx3 AGGTGGGGGAAACACGGAATTA
hSOD
1-Fx4
CCCATCTTTCTTCCCAGAGC hSOD1-Rx4 CCGCGACTAACAATCAAAGTGA
hSOD
1-Fx5
GTAGTGATTACTTGACAGCCCA hSOD1-Rx5 ATCAGTTTCTCACTACAGGTAC
hTAR
DBP-
Fx2
GAACTCTGACATGGTTTGGGT hTARDBP-
Rx2
CTCGTGGTCTTCCAAACTTGT
hTAR
DBP-
Fx3
CAGAAAAGCACCTCAGACACT hTARDBP-
Rx3
ATGCTAGATACTCATTCACTGG
hTAR
DBP-
Fx4
TTAAGCCACTGCATCCAGTTG hTARDBP-
Rx4
CACCCTGCCGCTATCTTTTC
hTAR
DBP-
Fx5
GTTACTCTTCACTGAAGCCTTAC hTARDBP-
Rx5
CGGGACATATCGTTAAGGAGA
hTAR
DBP-
Fx6
TGCTTATTTTTCCTCTGGCT hTARDBP-
Rx6
CTCCACACTGAACAAACCAA
hJMJD GAAGGAAACCTGAGGAGGATG hJMJD1C- TTCAATTCATTCTCTGGCTTCTG
104

1C-
Fx5
Rx5
hDCT
N1-
Fx2
TGT TTA CCT GTG TCT TTC AGA
CG
hDCTN1-Rx2 CAC AAA AGA AGG GCG TGA AT
hFUS-
Fx5
CTGGGATTGTGATTGTGTTTTT hFUS-Rx5 CAGACAAAGCTGAAGACATCTC
AC
105
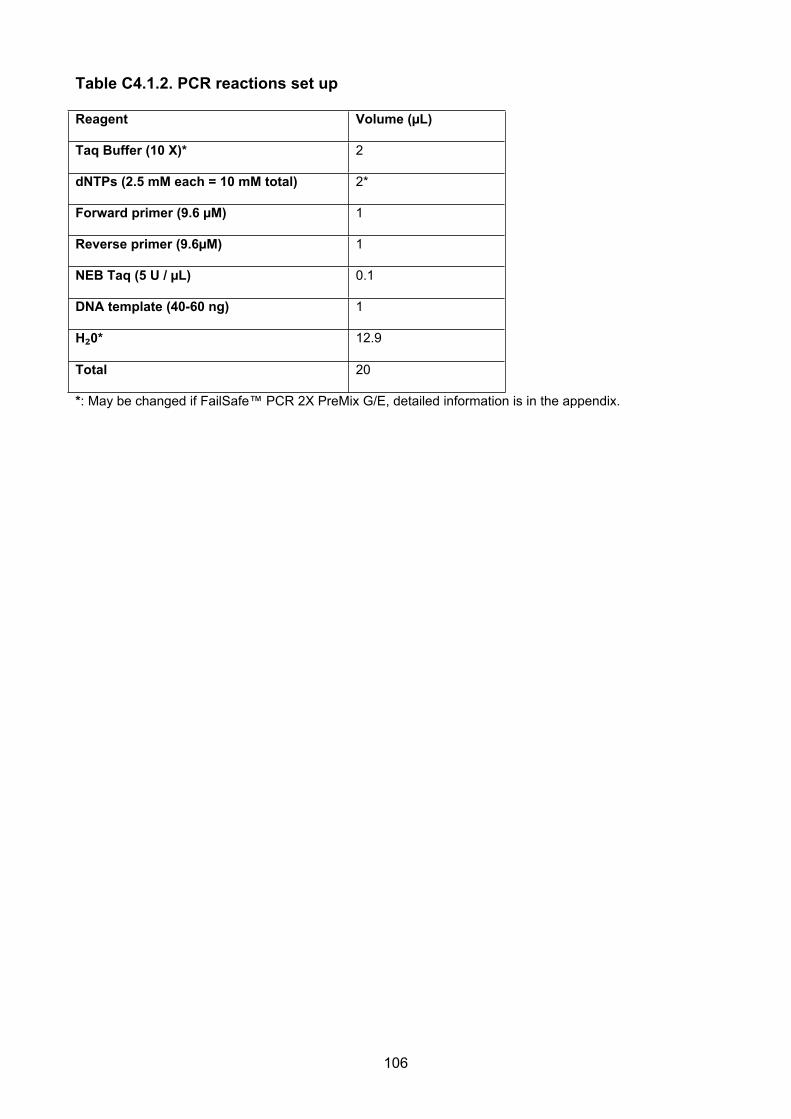
Table C4.1.2. PCR reactions set up
Reagent Volume (µL)
Taq Buffer (10 X)* 2
dNTPs (2.5 mM each = 10 mM total) 2*
Forward primer (9.6 µM) 1
Reverse primer (9.6µM) 1
NEB Taq (5 U / µL) 0.1
DNA template (40-60 ng) 1
H₂0* 12.9
Total 20
*: May be changed if FailSafe™ PCR 2X PreMix G/E, detailed information is in the appendix.
106

Table C4.1. 3 PCR cycling conditions
Step Annealing Temperature
(Degree Celsius)
Time
1 94 1m
2 94 30s
3 60 30s
4 72 30s
5 Cycle step2-4 10 times
6 94 30s
7 55 30s
8 72 30s
9 Cycle step6-8 25 times
10 72 2m
11 4 Hold
m: minutes; s: seconds
107

4. Whole Exome Sequencing (WES) with NGS
4.1 Sequencing methods
Whole-exome sequencing technique was applied as described in Appendix C4. The high-
throughput sequencing was performed on 15 probands from independent families after
SOD1/C9orf72 gene screening and QC, as well as with 193 independent sporadic cases
by using the Nimblegene SeqCap EZ Exon libraries that enable enrichment of the whole
exons, which based on the latest database builds and offering a 64 Mb sequence capture
(Roche Technologies). Sequencing was performed using an Illumina Hiseq2000 (Illumina,
San Diego) sequencer, with paired-end reads.
Next Generation sequencing was conducted with Illumina HiSeq® Sequencing System
(Illumina, San Diego, Inc.) including:
i. TruSeq Nano DNA Sample Prep Kit/ TruSeq SBS Kit v3-HS(Illumina, San
Diego):
ii. The capture kits were adopted: SeqCap EZ Library SR Version 4.0. Roche
NimbleGen, Inc:
iii. Sequencer: Illumina HiSeq 2000 (Illumina, San Diego):
iv. The whole sequencing process followed the company's standard protocols.
4.2 WES sequencing QC, alignment and variants calling
Analysis entailed removing reads that failed quality filtering via an in-house pipeline
(Contributed by Mhairi Marshall, Paul Leo, The University of Queensland Diamantina
Institute), and mapping those reads that passed filtering to human genome reference
(Genome Reference Consortium GRCh37, hg19) by using BWA v.0.5.9r16.28.
Realignment around known indels from the 1000 Genomes study and recalibration of base
108

quality scores was performed with GATK 1.1.5.30. Variant calling and independent filtering
were performed with SAMtools mpileup v.0.1.1731 and GATK Unified Genotyper
v.1.3.31,32 was used to merge these call-sets.
4.3 Functional prediction of missense variation as reference
The functional impact of missense variation was analyzed with the PolyPhen-2
(Polymorphism Phenotyping v2; http://genetics.bwh.harvard.edu/pph2/) and SIFT
algorithm (Sorting Intolerant From Tolerant; http://sift.bii.a-star.edu.sg/). The impact of
mutation is evaluated as benign, possibly damaging, or probably damaging based on the
representation of a score ranging from 0 to 1. SIFT scores ranges from 0 to 1. The amino
acid substitution is predicted damaging if the score is < 0.05, and tolerated if the score is >
0.05. For Polyphen2 scores, higher score means more damaging ranging from 0 to 1. To
examine the evolutionary conservation of the mutated sites, the sequence orthologs of the
candidate genes were retrieved from other species indicated in homologene in NCBI
(http://www.ncbi.nlm.nih.gov/homologene) and conducted a multiple sequence alignment
using MegAlign (Version 2.3.0.131, DNASTAR, Inc.) or a quick comparison conducted by
using Vertebrate Multiz Alignment and Conservation (https://genome.ucsc.edu/). The
species for the comparison included rhesus, mouse, dog, elephant, chicken, zebrafish,
lamprey and human genome (hg19).
4.4 Variant filtering to identify candidate causative variants.
Exon variant profiles were filtered to remove all variants occurring in dbSNP138, the
1000Genomes, and NHLBI Exons project with a minor allele frequency >0.5% for cases
samples (based on the Mendelian disease model and definition of “rare variants”). From
the remaining variants, those affecting protein coding regions (including non-synonymous
changes and indels) and known splice sites were then filtered against an in-house exons
109

Caucasian database to remove variants occurring with a frequency of >0.5%. A dominant
mode of inheritance was prioritized according to detailed clinical phenotype in ALS
pedigree. Coverage of the genes known to cause ALS was manually analyzed with
Integrated Genome Viewer (IGV)[137]. Further filtering was performed according to the
observed Mendelian inheritance pattern, functional annotation, and genomic conservation
(Table C4.6.2).
4.5 Known ALS genes and variants screening
Whole-exome sequencing (WES) was applied to the families of Chinese ancestry in which
several individuals had been diagnosed with ALS and familial history with the aim of
identifying the common causative mutation or mutations. To ensure the complete
sequencing coverage of all coding regions in known ALS causing genes, the quality and
reliability of NGS data was evaluated based on the percentage of readable bases and the
coverage depth in the targeted region. In known ALS genes (Table C1.1), the mean
coverage depth was > 30×, with > 99% of bases readable in coding exons regions,
indicating the high capability for variant identification in most of the exons.
In addition, a literature review was performed for articles published in PubMed before Mar
2014, using the specific mutations as the key words for cohort studies for candidate
variants clarification. Further, to complete the integrity of the database screening, detailed
information regarding these ALS-related genes was acquired through the amyotrophic
lateral sclerosis online genetics database (ALSoD, http://alsod.iop.kcl.ac.uk/), the ALS
mutation database
(https://reseq.lifesciencedb.jp/resequence/SearchDisease.do?targetId=1), and the
ALSGene database (http://www.alsgene.org). All variants previously reported to be
110

pathogenic mutations detected by WES in the fALS cases were considered probably
causative mutations and were confirmed through Sanger sequencing.
III. Results
1. SOD1 (NM_000454) mutations
Mutations in SOD1 were the most common in the fALS cohort of all known ALS genes
(reported in ALSoD or ALSGene database). Six fALS patients and one sporadic case
carried a causative mutation in the SOD1 gene, accounting for 18% of fALS cases in the
cohort. All patients with SOD1 mutation had spinal onset and no one had cognitive
impairment. The mean age at onset was 47.8 (±11) years, which is similar to the overall
case cohorts. 1 in 193 (1/193) sporadic cases were found to carry the c.401A> T, p.E133V
variant, whcih is known to cause a typical ALS phenotype[138]. The mutations identified
are listed in Table C4.1.
One, novel, SOD1 (p. V118insGTAAAA) mutation was identified, affecting gene splicing. A
similar insertion mutation (p.V118insAAAAC) has been previously reported. The
segregation of this mutation with fALS in the pedigrees could not be conducted because
DNA samples from other affected family members were unavailable.
In addition, another fALS(Ch_MND_2012-265) who carried SOD1 mutation p.H46R was
diagnosed with the REM sleep behaviour disorder (RBD) accompanied with left leg
weakness at age 50 (Figure C4.2). These symptoms progressed to generalized weakness
and wasting of all muscles in 4 limbs approximately 3 years after onset. His father was
reported to have died of ALS at age 73, without a clear history of RBD. A sibling of the
111

proband had similar clinical phenotype (with ALS and RBD diagnosis) but declined to
participate in the study.
112

Table C4.1 SOD1 (NM_000454) mutations screening in the Chinese ALS cohorts
FID SID Mutations Reported in
ALSoD/
ALSgene
Sex Diagnosis Onset
position
Onset
age
(years)
Ch_MND_2012-211 12206 c.357_358ins
GTAAAA
p.V118insGTA
AAA
No Male ALS Spinal 56
Ch_MND_2012-265 12260 c. 140 A>G p.H46R Yes Male ALS/REM sleep
behavior disorder
(RBD)
Spinal 54
Ch_MND_2012-256 12252 c. 116 T>G p.L39R Yes Male ALS Spinal 54
Ch_MND_2012-129 12129 c. 441 T>A p.G147X Yes Male ALS Spinal 44
Ch_MND_2012-174 12171 c. 401 A>T p.E133V Yes Female ALS Spinal 46
Ch_MND_2008-308 8479 c. 305 A>G p.D102G Yes Male ALS Spinal 56
sALS 7016 c. 401 T>A p.E133V Yes Male ALS Spinal 55
FID: Family ID; SID: Sample ID
113

Figure C4.2. Ch_MND_2012-265 SOD1 pedigree( p.H47R).
114

2. C9orf72 hexanucleotide repeat expansion in fALS
No abnormal C9orf72 repeat expansions were observed in samples from fALS patients. In
the fALS group, the most common number of repeats was two (48/68; 70.59%), followed
by six (9/68; 13.24%) repeats. The average number of repeats was 3.30(± 2.23, range 2 –
12 repeats) in the fALS patients.
3. TARDBP (NM_007375) mutations
All patients with mutations in TARDBP found harbored missense mutations (Table C4.2).
Among them, only one had a bulbar onset and no one had symptoms of frontotemporal
dementia (FTD). The age at onset ranged from 22– 70 years.
4. FUS (NM_004960) mutations
5 patients with ALS had missense mutations in FUS (Table C4.3), including 2 fALS and 2
sporadic ALS (sALS) cases, accounting for (2/15 in fALS, 2/193 in sALS)2.3% of all ALS
cases. Among them, 1 sporadic female case with mutation p.P525L had spinal onset with
young onset (16 years) and rapidly progressive disease. The age at onset was range 16-
48 years. One sALS and one unrelated fALS patients shared mutation p.R521C.
5. Oligogenic basis in the Chinese cohorts and ANG (NM_001097577) mutations
In the present study, none of patients with TARDBP mutations had an additional mutation
in ANG or C9orf72. Moreover, the presented study including 15 fALS and 193 sALS did
not detect FUS, SOD1 and C9orf72 mutations in combination with ANG mutations (Table
C4.4). Due to the quality of DNA, the three samples previous reported with C9orf72
pathogenic expansion (Chapter 2) could not be available for the further tests.
115
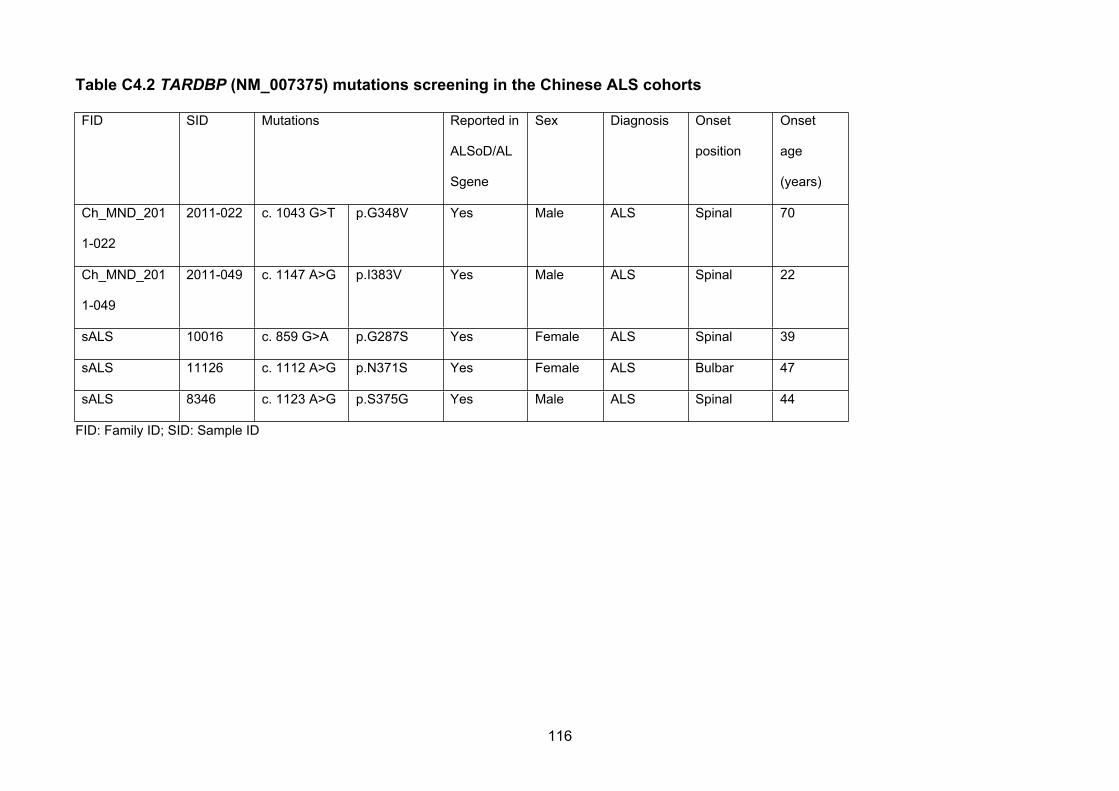
Table C4.2 TARDBP (NM_007375) mutations screening in the Chinese ALS cohorts
FID SID Mutations Reported in
ALSoD/AL
Sgene
Sex Diagnosis Onset
position
Onset
age
(years)
Ch_MND_201
1-022
2011-022 c. 1043 G>T p.G348V Yes Male ALS Spinal 70
Ch_MND_201
1-049
2011-049 c. 1147 A>G p.I383V Yes Male ALS Spinal 22
sALS 10016 c. 859 G>A p.G287S Yes Female ALS Spinal 39
sALS 11126 c. 1112 A>G p.N371S Yes Female ALS Bulbar 47
sALS 8346 c. 1123 A>G p.S375G Yes Male ALS Spinal 44
FID: Family ID; SID: Sample ID
116

Table C4.3 FUS (NM_004960) mutations screening in the Chinese cohorts
FID SID Mutations Reported in
ALSoD/ALSgene
Sex Diagnosis Onset age Onset position
Ch_MND_2009-
165
2009-165 c. 1561
C>T
p.R521C Yes Male ALS 36 Spinal
Ch_MND_2008-
194
2008-194 c. 1570 A>T p.R524W Yes Female ALS 48 Spinal
sALS 11105 c. 1561 C
>T
p.R521C Yes Female ALS 31 Spinal
sALS 11027 c. 1577 C
>T
p. P526L Yes Female Juvenile
ALS
16 Spinal
FID: Family ID; SID: Sample ID
117

Table C4.4. ANG (NM_001097577) mutations screening in the Chinese cohorts
FID SID Mutations Sex Affection Diagnosis Onset
position
Onset age
sALS 10001 c.203 C>T p.T68I Female Yes ALS Spinal 51
sALS 10161 c.379 G>A p.V127I Male Yes ALS Spinal 55
FID: Family ID; SID: Sample ID
118

6. DCTN1 (NM_004082) mutations and Family 2011-037
One novel DCTN1 ALS causing variation (c. 175 G>C;p.G59R) was detected in fALS case
Ch_MND_2011-037 (Figure C4.3). A similar missense mutation (p.G59S) in ALS patients
has been previously reported. The variant did not present in the ~100 healthy control
chromosomes sequenced in this study, dbSNP138, the 1000Genomes or NHLBI Exons
project and was predicted to be deleterious by in silico analyses with Polyphen2 and SIFT.
The analysis revealed the same variant in one of affected sibling. Subsequent Sanger
sequencing of an additional ‘unaffected’ individual (Ch_MND_2011-037: 12037.WD,
currently 40 years old, near the age of onset of the two affected siblings), who had
consanguineous parents did not have the heterozygous missense mutation. Further tests
could not be conducted to verify segregation of the mutations with more affected case in
the pedigrees because DNA samples from other affected family members were
unavailable. In addition, heterozygous missense mutations of the DCTN1 gene were
detected in 3 independent sporadic case of ALS (Table C4.5).
119

Table C4.5 DCTN1 (NM_004082) mutations screening in the Chinese cohorts
FID SID Mutations Sex Affection Diagnosis Onset
position
Onset age
sALS 10142 c. 3034 C>T p.R1012W Male Yes ALS Spinal 55
sALS 11168 c. 2126 A>T p.N709I Female Yes ALS Spinal 50
sALS 9144 c. 1574 G>A p.R525Q Male Yes ALS Spinal 40
Ch_MND_2011-
037:12
2011-037 c. 175 G>C p.G59R Female Yes ALS Spinal 33
Ch_MND_2011-
037:10
12037 c. 175 G>C p.G59R Male Yes ALS Spinal 40
Ch_MND_2011-
037:42
123077.WD - Male No
(Currently)
- - 40
FID: Family ID; SID: Sample ID
120

Figure C4.3. Ch_MND_2011-037 DCTN1 pedigree
121

7. fALS with no causative mutation identified in known ALS genes
10 fALS patients studied with whole exome sequencing were not found to carry mutations
in any of the known ALS genes. After QC and NGS data analysis in both affected siblings
in one of family ALS without any known ALS gene, Ch_MND_2009-048 (Figure C4.4),
there were still around 500 previously unknown genetic variants identified.
A disease-specific variants filtering strategy was developed based on the current
understanding in insights of genetics of ALS, trying to narrow down the list of candidate
genes through functional annotation of candidate variants including relationships with
known ALS genes (e.g. RNA binding proteins), mutation position, tissue expression
pattern and animal models, combined with the frequency investigation of the current
cohorts of both familial and sporadic cases (Table C4.6). There were 58 candidates
variants left. As limited by sample size and lack of functional replication, these candidate
variants apparently would require more replication and more informative segregation
analysis to be confirmed. However, this strategy for screening of allelic variants of known
ALS genes may represent a novel method to analyse the rare genetic variants contributing
to ALS pathogenesis, especially given the evident difficulties exist in acquiring informative
ALS families due to the late onset and frequent misdiagnosis of ALS.
122

Figure C4.4. Pedigree information of Ch_MND_2009-048 as an example of the NGS analysis (WES data)
123
*

Table C4.6. A filtering strategy in WES data analysis for ALS candidate variants
Table C4.6.1. Clinical phenotypes in Ch_MND_2009-048
FID SID Sequenced Sex Affection Diagnosis Onset position Onset age
Ch_MND-2009-048 09047.D1 Yes Male Yes ALS Spinal 62
Ch_MND-2009-048 09047 Yes Male Yes ALS Spinal 60
Ch_MND-2009-048 09047.D2 No Male No No - 54(Current
age)
124

Table C4.6.2. A disease-specific candidate variants filtering strategy based on the current understanding in genetics of ALS
(WES data)
Annotation methods with whole
exome sequencing
Remained candidate
genetic variants in 2
affected brothers from the
Ch_MND_2009-048
Strength of the hypothesis in variants
filtering and suggestions
Specific considerations in ALS
Quality control for the sequencing
data
More than 2,000 Strong -
Frequency check (<0.5%) and
screening for the variants are SNPs
or that found controls.
More than 500 Strong, e.g. a typical Mendelian disease; The oligogenic basis of fALS was
reported.
Inheritance of pedigree AD/AR models are
acceptable (due to the
specific and small pedigree,
but only 1 candidate variant
fit the AR model)
Strong Difficulties are common in the family
recruitment and phenotype determination
due to the low prevalence and a possible
blurred penetrance. Many ALS genes
have multiple models of inheritance
(Table C1.1).
Known ALS genes screening Only 1 possible variant found
in NEFH, but excluded for the
mutation type and position.
Strong A core analysis in fALS candidate gene
screening but an oligogenic basis should
be also considered in both familial and
125
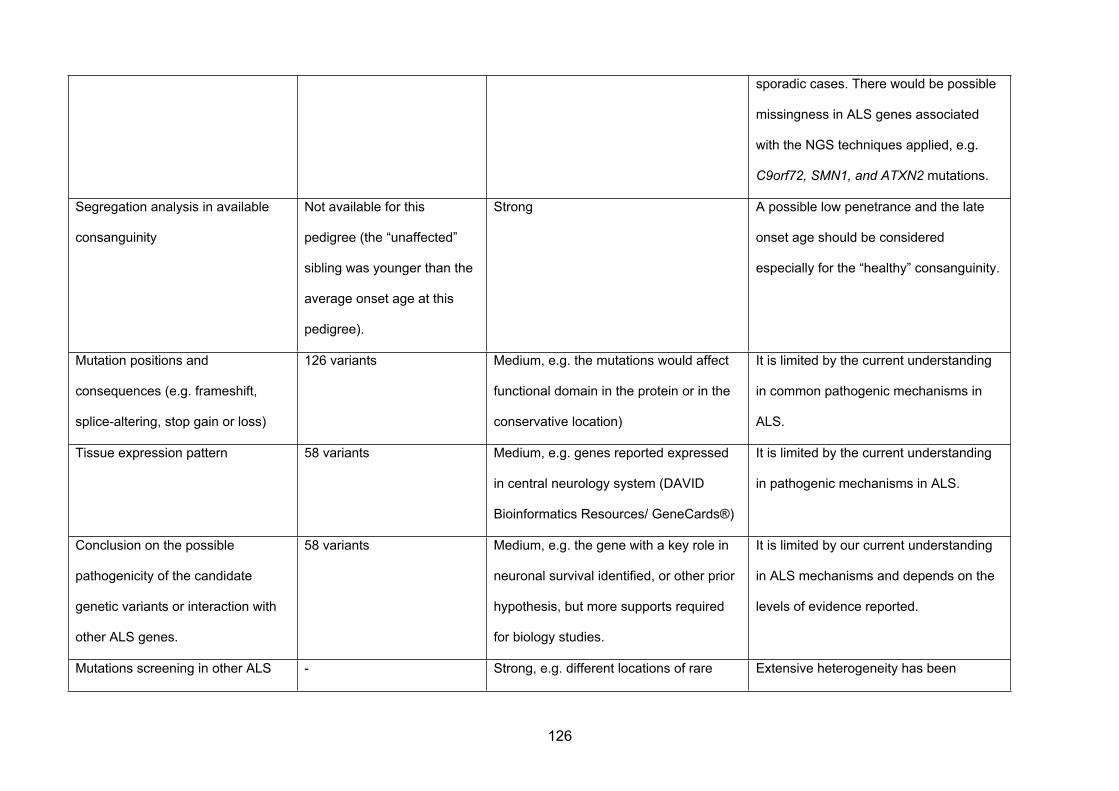
sporadic cases. There would be possible
missingness in ALS genes associated
with the NGS techniques applied, e.g.
C9orf72, SMN1, and ATXN2 mutations.
Segregation analysis in available
consanguinity
Not available for this
pedigree (the “unaffected”
sibling was younger than the
average onset age at this
pedigree).
Strong A possible low penetrance and the late
onset age should be considered
especially for the “healthy” consanguinity.
Mutation positions and
consequences (e.g. frameshift,
splice-altering, stop gain or loss)
126 variants Medium, e.g. the mutations would affect
functional domain in the protein or in the
conservative location)
It is limited by the current understanding
in common pathogenic mechanisms in
ALS.
Tissue expression pattern 58 variants Medium, e.g. genes reported expressed
in central neurology system (DAVID
Bioinformatics Resources/ GeneCards®)
It is limited by the current understanding
in pathogenic mechanisms in ALS.
Conclusion on the possible
pathogenicity of the candidate
genetic variants or interaction with
other ALS genes.
58 variants Medium, e.g. the gene with a key role in
neuronal survival identified, or other prior
hypothesis, but more supports required
for biology studies.
It is limited by our current understanding
in ALS mechanisms and depends on the
levels of evidence reported.
Mutations screening in other ALS - Strong, e.g. different locations of rare Extensive heterogeneity has been
126

cohorts (fALS/sALS) or other
neurodegenerative disease (such as
PD/FTD)
variants that cause similar functional
consequences.
reported in ALS genes. The similar
phenomenon would improve our
understanding in the common pathways
of neurodegenerative diseases.
Animal models Supplementary reference Weak -
Multiple prediction tools in silico Supplementary reference Weak It is always required the biological
replication.
127

IV. Discussion
A Han Chinese ALS cohort consisting of 15 fALS family and 193 unrelated ALS patients
was screened for whole exons mutations in the major ALS genes by applying NGS
combined with Sanger sequencing technology. The study focused on the most common
causing genes, including SOD1, FUS, TARDBP and C9orf72.
In Caucasian populations, the most frequently identified mutations in ALS patients are the
C9orf72 hexanucleotide repeat expansions, accounting for 21.7%–57.1% of fALS and
3.6%–21% of sALS. The second-most common mutations of ALS in Caucasians occurred
in SOD1 gene (20% of fALS cases)[139], followed by FUS and TARDBP mutations (3%-
5% in fALS and 1% -1.5% in sALS, respectively)[140] . However, in the present ALS
cohorts, causative mutations were most commonly found in the SOD1 gene (6/34 fALS,
1/193 sALS), followed by TARDBP (2/15 fALS, 3/193 sALS), FUS (2/15 fALS, 2/193
sALS), DCTN1 (1/15 fALS, 3/193 sALS), ANG (0/15fALS, 2/193 sALS) and C9orf72 (0/34
fALS, 3/1000 sALS) genes. No candidate mutations in other known ALS genes in fALS
(10/15) were detected. Even limited by the fALS sample size, 8% ALS cases were found to
carry a mutation in common ALS genes within the presented cohorts. This study
represents an independent survey of genetic aetiology of ALS to date in mainland China
and demonstrates a different mutational spectrum of ALS from those in Caucasian
populations.
1. C9orf72 screening
C9orf72 repeat expansions have been identified in Caucasian ALS cohorts, occurring in
21.7 – 57.9% of fALS patients [11, 79]. By contrast, studies of ALS patients in eastern Asia
have revealed that the frequency of C9orf72
128

repeat expansion is extremely low: paucity of C9orf72 repeat expansion was previously
observed in a subset of this Chinese fALS cohort (see chapter 3). In the present study,
C9orf72 repeat expansions were not observed in 34 fALS patients. This result is consistent
with the previous study in Chapter 2. As discussed previously, this finding indicates that
C9orf72 repeat expansion and its founder affect might not play an important role in ALS
among the population of mainland China.
2. Characteristic of clinical phenotypes identified
2.1 SOD1 and RBD
SOD1 is clinically characterised by a classical ALS phenotype[141]. A pathomorphologic
hallmark of SOD1-linked fALS is SOD1 immuno-positive inclusions found within motor
neurons, which could partially explain the phenomenon that cognitive impairment is very
rare and bulbar onset is less frequent in SOD1 mutations than in other fALS types[142].
However, the fALS cases with a confirmed SOD1 mutation (p.L84F) were reported to be
accompanied with RDB within affected family members[143]. Currently, though still limited
by sample size, the trans-ethnic finding in a SOD1/ RBD family indicated SOD1 mutations
play multiple roles in the degenerative neurological disease. Furthermore, the association
between RBD and synucleinopathies is well known, probably indicating a possible
pathway of SOD1 gene involved. This case study would promote future attentions in
clinical practice and investigation to identify the underlying pathogenic mechanism of
SOD1.
2.2. FUS and Juvenile ALS
Juvenile amyotrophic lateral sclerosis (jALS) is a rare form of motor neuron disease and
occurs before 25 years of age. De novo mutations in FUS were previously suggested to be
129
associated with juvenile-onset sALS [14, 144]. The mutation p.P525L was previously
described in patients with autosomal dominant ALS [14, 144]is located in an evolutionary
conserved residue at the C-terminal end of the protein in close vicinity to most other
reported mutations. This finding support the association of FUS mutations with juvenile-
onset sALS of Chinese origin and highlights the importance for mutation screening of the
FUS gene in ALS patients with a young age of onset, aggressive progression, and
sporadic occurrence.
2.3. DCTN1 mutations
Encoded by DCTN1, Dynactin is a complex motor protein involved in the retrograde axonal
transport, disturbances of which may lead to the clinical manifestation of fALS. Recently it
has been shown that DCTN1-mRNA is reduced in the motor cortex and spinal cord of
sALS patients. Immunohistochemistry revealed degeneration and loss of neurons and
poor expression of dynactin subunits[145]. Mutations in DCTN1 have been reported to be
associated with ALS or ALS-like syndromes[146] and other degenerative disease,
including Parkinson’s disease and Perry syndrome[147]. Though one of the mutations in
DCTN1 gene (p. R525Q) and several other known mutations have been previously
associated with cases both of fALS and familial Parkinson[148], the mutation of p. R59 has
only been reported in ALS families, suggesting different functional domains in the protein
may lead to different neurodegenerative phenotypes. The present study demonstrates for
the first time the presence of DCTN1 mutations in the Han Chinese population, as well as
highlights the possibility of clinical heterogeneity in DCTN1 gene mutations.
130

3. Oligogenic nature of ALS
It has been hypothesized that ALS could be caused by a complex inheritance of risk
variants in multiple genes, which usually could cause an incomplete penetrance of the
disease. Even in familial ALS cases, incomplete penetrance is often observed. A previous
study[136] reported mutations in TARDBP, FUS, and SOD1 in 97 families and large
cohorts of sporadic ALS patients and control subjects. In Caucasians, 50% of patients with
this TARDBP mutation had an additional mutation in other ALS genes, including ANG or
C9orf72[136]. However, the present study including 15 fALS and 193 sALS did not detect
any FUS and TARDBP mutations in combination with ANG mutations. Statistical analysis
demonstrated that the difference in the patients with TARDBP mutations across
population[136] is significant (0/5 in Han Chinese: 7/14[136] in Caucasian; P <0.01).
The most compelling evidence for the oligogenic basis was found in individuals with a
TARDBP mutation p.N352S, which was detected in five fALS families and three apparently
unrelated sALS patients in the Caucasian study[136]. Genealogical and haplotype
analyses revealed that these individuals shared a common ancestor. In addition, a similar
founder effect might possibly lead to a high frequency of TARDBP mutations in
Taiwan[149]. Given the absence of the mutation p.N352S in TARDBP in the Chinese Han
cohort and the low frequency of the oligogenic mutations in the presented study, It
therefore suggested that the oligogenic aetiology of ALS might be more correlated to
certain Caucasian common founder affection.
Ten out of 33 fALS have causative mutations in SOD1, TARDBP and FUS. Thus, in
clinical practice, sequencing whole coding regions of SOD1, TARDBP and FUS should be
considered as the first-line tests to search for mutations of fALS patients with Chinese
origin. But given the extreme low frequency in both familial and sporadic cases, whether or
131

not genotyping of the C9orf72 expansions by repeat-primed PCR should be a first-line test
in Chinese ALS patients should be reconsidered.
Other known ALS genes were not detected in the presented fALS cohorts, possibly due to
the rarity of mutations of these genes in fALS patients of Chinese ethnicity. For example,
mutations in VCP and PFN1 have also been reported to be rare or absent in other Chinese
populations[141].
V. Conclusion
In conclusion, this study has demonstrated that mutations in SOD1 are the most common
causative mutations in fALS in the Han Chinese population. A substantial difference in the
frequency of mutations in C9orf72 gene between Chinese and Caucasian populations has
been demonstrated. In addition, a novel strategy based on functional annotations and
current understanding of ALS for specifically filtering candidate genes has been
suggested. These findings broaden the spectrum of causative mutations in ALS and are
essential for optimal design of strategies of mutational analysis and genetic counselling of
Han Chinese ALS patients.
132

CHAPTER 5: GENERAL SUMMARY
133

I. General summary
ALS is the most frequently occurring neuromuscular degenerative disorders, and has an
obscure aetiology. No effective treatments exist for ALS; over 50 well-designed clinical
trials have been conducted in ALS over the last 25 years and with the exception of the
riluzole trial, all have failed[150]. However riluzole only modestly extends survival time.
Multiple genetic studies have been conducted to advance our understanding of the
disease, employing a variety of techniques such as linkage mapping in families, to
genome-wide association studies and sequencing based approaches such as whole
exome sequencing and whole genome sequencing, even a few epigenetic analyses.
Whilst major progress has been made, the majority of the genetic variation involved in ALS
is undefined. Given few comprehensive genetic studies performed in the Chinese cohorts,
in order to advance our understanding of the aetiopathogenesis of ALS, this study aimed
to use modern genetic GWAS and sequencing approaches to identify further ALS
susceptibility genes.
In first part of the study for sporadic ALS, though no single locus was significantly
associated with increased risk of developing disease, potentially associated candidate
SNPs were identified. In addition, the study confirmed significant common-variant
heritability of ALS in the Chinese cohorts has been observed for the first time More
importantly, the raw genotype data and corresponding DNA samples have established an
independent and powerful genetic resource for ALS researchers that can be data-mined
and augmented with additional studies to identify genetic variants underlying this fatal
neurodegenerative disease.
134

Rapid progress in the field of ALS has occurred in recent years, largely due to discovery of
mutations in the C9orf72 gene. This thesis thus reported the currently largest cohort
analysis of the C9orf72 hexanucleotide repeat and in ALS in a non-Caucasian population.
A series of comprehensive genetic tests, including repeat copy number genotyping and
whole-genome genotyping, along with a detailed evaluation of clinical phenotypes was
conducted. The author has shown distinct genetic differences in C9orf72 repeat expansion
between the Chinese and Caucasian populations. The low frequency in both familial and
sporadic cases and distinct SNP alleles and haplotypes from the European consensus risk
haplotype indicated that the C9orf72 expansion does not make a significant contribution to
ALS (monogeneic or oligogenic) in Chinese ALS.
For the familial ALS, a population-specific mutational screen of ALS demonstrated that
mutations in SOD1 are the most common causative mutations in the Han Chinese
population. Besides a substantial difference in the frequencies of mutations in C9orf72, the
oliogenic mutations in TARDBP were not observed, indicating heterogeneity in ALS
cohorts as well.
This thesis has helped define the genetic architecture of ALS in Chinese patients,
including both sporadic and familial cases, indicating a independent genetic nature of ALS
in the Chinese population, which has similarities but also significant differences particularly
with Caucasians. These findings support the extension of genetic studies in Han Chinese,
indicating that they are likely to contribute significant new and potentially different findings
to genetic associations identified in Caucasian cohorts.
135

II. Limitations and future direction
Though the study could draw some significant conclusion, it is still preliminary and not
without limitations due to several reasons:
The limitation in design due to the small sample size is apparent, and is likely to remain a
problem for some time due to the low prevalence low incidence and short course of the
disease) of ALS, leading to the limited power of the present studies. However, the digital
nature of the GWAS and NGS data allows it to be supplemented with genotype information
from additional sample series, thereby increasing power over time.
The case-control study makes assumptions about the underlying genetic architecture of
disease, especially for sporadic cases, can be complex to perform[8], and depends on
accurate clinical phenotyping for success. As there is no sensitive biomarker or methods in
the ALS diagnosis, the El Escorial criteria127] currently applied in ALS diagnosis mainly
relying on the exclusion for other differential diagnosis to achieve adequate specificity. The
modest specificity of this classification criteria in disease diagnosis may lead to increased
clinical and consequently genetic heterogeneity amongst “cases”, potentially decreasing
the power of the detection in the case-control study. The extensive heterogeneity of ALS
including clinical heterogeneity, allelic heterogeneity and loci heterogeneity that has been
reported in ALS would reduce the power of all genetic studies in this disease, though not
lead to false positives.
The pathophysiological mechanisms underlying ALS are multifactorial, with a complex
interaction between genetic factors and molecular pathways. To date more than 20 genes
and loci have been associated with ALS, with mutations in DNA/RNA-regulating genes
136

including the recently described C9orf72 gene, suggesting an important role for
dysregulation of RNA metabolism in ALS pathogenesis. While such advances have
contributed to our current understanding of the causes of most cases of fALS and their
underlying pathophysiological consequences, they only explain a small fraction of SALS
with the aetiology of most sALS cases remaining unexplained.
The author would suggest the following future studies to follow up the research presented
in this thesis:
Aim 1:
I. To increase the sample size/combine with other studies, trans-ethnic;
II. Functional testing of novel suggested susceptibility loci (such as functional test
of GNAS in the neurons).
Aim 3:
III. To increase sample size of the fALS cohort and sequencing more sporadic
cases;
IV. Functional and statistical tests, such as burden tests in different pathogenic
pathways or genes.
III. Final conclusion
This study has lessons for and contributions to future studies of the genetic basis of ALS in
Asian population. Firstly, it has established what is currently the largest non-Caucasian
ALS cohort. It has clearly shown a different genetic characteristic of ALS in the Chinese
Han population, and indicated a possible direction for future studies. Moreover, this
137

research has laid a concrete foundation for a serious of comprehensive genetic studies of
ALS in Mainland China, which could be followed by combining studies, or even other trails.
138

REFERENCE
1. Miller, R.G., J.D. Mitchell, and D.H. Moore, Riluzole for amyotrophic lateral sclerosis (ALS)/motor neuron disease (MND). Cochrane Database Syst Rev, 2012. 3: p. CD001447.
2. Cronin, S., O. Hardiman, and B.J. Traynor, Ethnic variation in the incidence of ALS: a systematic review. Neurology, 2007. 68(13): p. 1002-7.
3. Byrne, S., et al., Rate of familial amyotrophic lateral sclerosis: a systematic review and meta-analysis. Journal of neurology, neurosurgery, and psychiatry, 2011. 82(6): p. 623-7.
4. Siddique, T. and S. Ajroud-Driss, Familial amyotrophic lateral sclerosis, a historical perspective. Acta myologica : myopathies and cardiomyopathies : official journal of the Mediterranean Society of Myology / edited by the Gaetano Conte Academy for the study of striated muscle diseases, 2011. 30(2): p. 117-20.
5. Wroe, R., et al., ALSOD: the Amyotrophic Lateral Sclerosis Online Database. Amyotrophic Lateral Sclerosis, 2008. 9(4): p. 249-50.
6. Yoshida, M., et al., A mutation database for amyotrophic lateral sclerosis. Human Mutation, 2010. 31(9): p. 1003-10.
7. Lill, C.M., et al., Keeping up with genetic discoveries in amyotrophic lateral sclerosis: the ALSoD and ALSGene databases. Amyotrophic lateral sclerosis : official publication of the World Federation of Neurology Research Group on Motor Neuron Diseases, 2011. 12(4): p. 238-49.
8. Hardiman, O. and M. Greenway, The complex genetics of amyotrophic lateral sclerosis. Lancet Neurology, 2007. 6(4): p. 291-2.
9. Garber, K., Genetics. The elusive ALS genes. Science, 2008. 319(5859): p. 20.10. Rosen, D.R., et al., Mutations in Cu/Zn superoxide dismutase gene are associated with
familial amyotrophic lateral sclerosis. Nature, 1993. 362(6415): p. 59-62.11. DeJesus-Hernandez, M., et al., Expanded GGGGCC hexanucleotide repeat in noncoding
region of C9ORF72 causes chromosome 9p-linked FTD and ALS. Neuron, 2011. 72(2): p. 245-56.
12. Renton, A.E., et al., A hexanucleotide repeat expansion in C9ORF72 is the cause of chromosome 9p21-linked ALS-FTD. Neuron, 2011. 72(2): p. 257-68.
13. Vance, C., et al., Mutations in FUS, an RNA processing protein, cause familial amyotrophic lateral sclerosis type 6. Science, 2009. 323(5918): p. 1208-11.
14. Kwiatkowski, T.J., Jr., et al., Mutations in the FUS/TLS gene on chromosome 16 cause familial amyotrophic lateral sclerosis. Science, 2009. 323(5918): p. 1205-8.
15. Maruyama, H., et al., Mutations of optineurin in amyotrophic lateral sclerosis. Nature, 2010. 465(7295): p. 223-6.
16. Chen, Y.Z., et al., DNA/RNA helicase gene mutations in a form of juvenile amyotrophic lateral sclerosis (ALS4). Am J Hum Genet, 2004. 74(6): p. 1128-35.
17. Hadano, S., et al., A gene encoding a putative GTPase regulator is mutated in familial amyotrophic lateral sclerosis 2. Nat Genet, 2001. 29(2): p. 166-73.
18. Yang, Y., et al., The gene encoding alsin, a protein with three guanine-nucleotide exchange factor domains, is mutated in a form of recessive amyotrophic lateral sclerosis. Nat Genet, 2001. 29(2): p. 160-5.
19. Nishimura, A.L., et al., A mutation in the vesicle-trafficking protein VAPB causes late-onset spinal muscular atrophy and amyotrophic lateral sclerosis. Am J Hum Genet, 2004. 75(5): p. 822-31.
20. Munch, C., et al., Point mutations of the p150 subunit of dynactin (DCTN1) gene in ALS. Neurology, 2004. 63(4): p. 724-6.
21. Orlacchio, A., et al., SPATACSIN mutations cause autosomal recessive juvenile amyotrophic lateral sclerosis. Brain, 2010. 133(Pt 2): p. 591-8.
22. Sreedharan, J., et al., TDP-43 mutations in familial and sporadic amyotrophic lateral sclerosis. Science, 2008. 319(5870): p. 1668-72.
23. Fecto, F., et al., SQSTM1 mutations in familial and sporadic amyotrophic lateral sclerosis. Arch Neurol, 2011. 68(11): p. 1440-6.
139

24. Chow, C.Y., et al., Deleterious variants of FIG4, a phosphoinositide phosphatase, in patients with ALS. Am J Hum Genet, 2009. 84(1): p. 85-8.
25. Greenway, M.J., et al., ANG mutations segregate with familial and 'sporadic' amyotrophic lateral sclerosis. Nat Genet, 2006. 38(4): p. 411-3.
26. Deng, H.X., et al., Mutations in UBQLN2 cause dominant X-linked juvenile and adult-onset ALS and ALS/dementia. Nature, 2011. 477(7363): p. 211-5.
27. Johnson, J.O., et al., Exome sequencing reveals VCP mutations as a cause of familial ALS. Neuron, 2010. 68(5): p. 857-64.
28. Wu, C.H., et al., Mutations in the profilin 1 gene cause familial amyotrophic lateral sclerosis. Nature, 2012. 488(7412): p. 499-503.
29. Parkinson, N., et al., ALS phenotypes with mutations in CHMP2B (charged multivesicular body protein 2B). Neurology, 2006. 67(6): p. 1074-7.
30. Gros-Louis, F., et al., A frameshift deletion in peripherin gene associated with amyotrophic lateral sclerosis. J Biol Chem, 2004. 279(44): p. 45951-6.
31. Leung, C.L., et al., A pathogenic peripherin gene mutation in a patient with amyotrophic lateral sclerosis. Brain Pathol, 2004. 14(3): p. 290-6.
32. Ticozzi, N., et al., Mutational analysis reveals the FUS homolog TAF15 as a candidate gene for familial amyotrophic lateral sclerosis. American journal of medical genetics. Part B, Neuropsychiatric genetics : the official publication of the International Society of Psychiatric Genetics, 2011. 156B(3): p. 285-90.
33. Couthouis, J., et al., Evaluating the role of the FUS/TLS-related gene EWSR1 in amyotrophic lateral sclerosis. Human Molecular Genetics, 2012. 21(13): p. 2899-911.
34. Kim, H.J., et al., Mutations in prion-like domains in hnRNPA2B1 and hnRNPA1 cause multisystem proteinopathy and ALS. Nature, 2013. 495(7442): p. 467-73.
35. Mitchell, J., et al., Familial amyotrophic lateral sclerosis is associated with a mutation in D-amino acid oxidase. Proc Natl Acad Sci U S A, 2010. 107(16): p. 7556-61.
36. Al-Saif, A., F. Al-Mohanna, and S. Bohlega, A mutation in sigma-1 receptor causes juvenile amyotrophic lateral sclerosis. Ann Neurol, 2011. 70(6): p. 913-9.
37. Elden, A.C., et al., Ataxin-2 intermediate-length polyglutamine expansions are associated with increased risk for ALS. Nature, 2010. 466(7310): p. 1069-75.
38. Corcia, P., et al., Abnormal SMN1 gene copy number is a susceptibility factor for amyotrophic lateral sclerosis. Ann Neurol, 2002. 51(2): p. 243-6.
39. Blauw, H.M., et al., SMN1 gene duplications are associated with sporadic ALS. Neurology, 2012. 78(11): p. 776-80.
40. Al-Chalabi, A., et al., An estimate of amyotrophic lateral sclerosis heritability using twin data. Journal of neurology, neurosurgery, and psychiatry, 2010. 81(12): p. 1324-6.
41. Risch, N., Linkage strategies for genetically complex traits. I. Multilocus models. Am J Hum Genet, 1990. 46(2): p. 222-8.
42. Risch, N., Linkage strategies for genetically complex traits. II. The power of affected relative pairs. Am J Hum Genet, 1990. 46(2): p. 229-41.
43. Chio, A., et al., Large proportion of amyotrophic lateral sclerosis cases in Sardinia due to a single founder mutation of the TARDBP gene. Archives of neurology, 2011. 68(5): p. 594-8.
44. van Es, M.A., et al., Large-scale SOD1 mutation screening provides evidence for genetic heterogeneity in amyotrophic lateral sclerosis. Journal of neurology, neurosurgery, and psychiatry, 2010. 81(5): p. 562-6.
45. Andersen, P.M., et al., Phenotypic heterogeneity in motor neuron disease patients with CuZn-superoxide dismutase mutations in Scandinavia. Brain : a journal of neurology, 1997. 120 ( Pt 10): p. 1723-37.
46. Forsberg, K., et al., Novel antibodies reveal inclusions containing non-native SOD1 in sporadic ALS patients. Plos One, 2010. 5(7): p. e11552.
47. Bosco, D.A., et al., Wild-type and mutant SOD1 share an aberrant conformation and a common pathogenic pathway in ALS. Nature neuroscience, 2010. 13(11): p. 1396-403.
48. Fallis, B.A. and O. Hardiman, Aggregation of neurodegenerative disease in ALS kindreds. Amyotrophic lateral sclerosis : official publication of the World Federation of Neurology Research Group on Motor Neuron Diseases, 2009. 10(2): p. 95-8.
140

49. Beck, J., et al., Large C9orf72 hexanucleotide repeat expansions are seen in multiple neurodegenerative syndromes and are more frequent than expected in the UK population. American Journal of Human Genetics, 2013. 92(3): p. 345-53.
50. Yang, J., P.M. Visscher, and N.R. Wray, Sporadic cases are the norm for complex disease. Eur J Hum Genet, 2010. 18(9): p. 1039-43.
51. del Aguila, M.A., et al., Prognosis in amyotrophic lateral sclerosis: a population-based study. Neurology, 2003. 60(5): p. 813-9.
52. Norris, F., et al., Onset, natural history and outcome in idiopathic adult motor neuron disease. J Neurol Sci, 1993. 118(1): p. 48-55.
53. Wijesekera, L.C., et al., Natural history and clinical features of the flail arm and flail leg ALS variants. Neurology, 2009. 72(12): p. 1087-94.
54. Gamez, J., C. Cervera, and A. Codina, Flail arm syndrome of Vulpian-Bernhart's form of amyotrophic lateral sclerosis. Journal of neurology, neurosurgery, and psychiatry, 1999. 67(2): p. 258.
55. Dunckley, T., et al., Whole-genome analysis of sporadic amyotrophic lateral sclerosis. New England Journal of Medicine, 2007. 357(8): p. 775-88.
56. Kwee, L.C., et al., A high-density genome-wide association screen of sporadic ALS in US veterans. Plos One, 2012. 7(3): p. e32768.
57. Orsetti, V., et al., Genetic variation in KIFAP3 is associated with an upper motor neuron-predominant phenotype in amyotrophic lateral sclerosis. Neuro-degenerative diseases, 2011. 8(6): p. 491-5.
58. Birve, A., et al., A novel SOD1 splice site mutation associated with familial ALS revealed by SOD activity analysis. Human Molecular Genetics, 2010. 19(21): p. 4201-6.
59. Zinman, L., et al., A mechanism for low penetrance in an ALS family with a novel SOD1 deletion. Neurology, 2009. 72(13): p. 1153-9.
60. Laaksovirta, H., et al., Chromosome 9p21 in amyotrophic lateral sclerosis in Finland: a genome-wide association study. Lancet Neurology, 2010. 9(10): p. 978-85.
61. Shatunov, A., et al., Chromosome 9p21 in sporadic amyotrophic lateral sclerosis in the UK and seven other countries: a genome-wide association study. Lancet Neurology, 2010. 9(10): p. 986-994.
62. van Es, M.A., et al., Genome-wide association study identifies 19p13.3 (UNC13A) and 9p21.2 as susceptibility loci for sporadic amyotrophic lateral sclerosis. Nature genetics, 2009. 41(10): p. 1083-7.
63. Gijselinck, I., et al., Identification of 2 Loci at chromosomes 9 and 14 in a multiplex family with frontotemporal lobar degeneration and amyotrophic lateral sclerosis. Archives of neurology, 2010. 67(5): p. 606-16.
64. Morita, M., et al., A locus on chromosome 9p confers susceptibility to ALS and frontotemporal dementia. Neurology, 2006. 66(6): p. 839-44.
65. Vance, C., et al., Familial amyotrophic lateral sclerosis with frontotemporal dementia is linked to a locus on chromosome 9p13.2-21.3. Brain : a journal of neurology, 2006. 129(Pt 4): p. 868-76.
66. Herdewyn, S., et al., Whole-genome sequencing reveals a coding non-pathogenic variant tagging a non-coding pathogenic hexanucleotide repeat expansion in C9orf72 as cause of amyotrophic lateral sclerosis. Human Molecular Genetics, 2012. 21(11): p. 2412-9.
67. Majounie, E., et al., Frequency of the C9orf72 hexanucleotide repeat expansion in patients with amyotrophic lateral sclerosis and frontotemporal dementia: a cross-sectional study. Lancet Neurol, 2012. 11(4): p. 323-30.
68. Millecamps, S., et al., Phenotype difference between ALS patients with expanded repeats in C9ORF72 and patients with mutations in other ALS-related genes. Journal of Medical Genetics, 2012. 49(4): p. 258-63.
69. Garcia-Redondo, A., et al., Analysis of the C9orf72 gene in patients with amyotrophic lateral sclerosis in Spain and different populations worldwide. Hum Mutat, 2013. 34(1): p. 79-82.
70. Mok, K.Y., et al., High frequency of the expanded C9ORF72 hexanucleotide repeat in familial and sporadic Greek ALS patients. Neurobiol Aging, 2012. 33(8): p. 1851 e1-5.
71. Ratti, A., et al., C9ORF72 repeat expansion in a large Italian ALS cohort: evidence of a founder effect. Neurobiol Aging, 2012. 33(10): p. 2528 e7-14.
141

72. Sabatelli, M., et al., C9ORF72 hexanucleotide repeat expansions in the Italian sporadic ALS population. Neurobiol Aging, 2012. 33(8): p. 1848 e15-20.
73. Ogaki, K., et al., Analysis of C9orf72 repeat expansion in 563 Japanese patients with amyotrophic lateral sclerosis. Neurobiol Aging, 2012. 33(10): p. 2527 e11-6.
74. Konno, T., et al., Japanese amyotrophic lateral sclerosis patients with GGGGCC hexanucleotide repeat expansion in C9ORF72. J Neurol Neurosurg Psychiatry, 2013. 84(4): p. 398-401.
75. Tsai, C.P., et al., A hexanucleotide repeat expansion in C9ORF72 causes familial and sporadic ALS in Taiwan. Neurobiol Aging, 2012. 33(9): p. 2232 e11-2232 e18.
76. Beck, J., et al., Large C9orf72 Hexanucleotide Repeat Expansions Are Seen in Multiple Neurodegenerative Syndromes and Are More Frequent Than Expected in the UK Population. Am J Hum Genet, 2013.
77. Galimberti, D., et al., Incomplete Penetrance of the C9ORF72 Hexanucleotide Repeat Expansions: Frequency in a Cohort of Geriatric Non-Demented Subjects. J Alzheimers Dis, 2014. 39(1): p. 19-22.
78. Majounie, E., et al., Frequency of the C9orf72 hexanucleotide repeat expansion in patients with amyotrophic lateral sclerosis and frontotemporal dementia: a cross-sectional study. Lancet Neurol, 2012. 11(4): p. 323-30.
79. Renton, A.E., et al., A hexanucleotide repeat expansion in C9ORF72 is the cause of chromosome 9p21-linked ALS-FTD. Neuron, 2011. 72(2): p. 257-68.
80. Mok, K., et al., Chromosome 9 ALS and FTD locus is probably derived from a single founder. Neurobiol Aging, 2012. 33(1): p. 209 e3-8.
81. Jiao, B., et al., Identification of C9orf72 repeat expansions in patients with amyotrophic lateral sclerosis and frontotemporal dementia in mainland China. Neurobiol Aging, 2014. 35(4): p. 936 e19-22.
82. Liu, R., et al., C9orf72 repeat expansions are not detected in Chinese patients with familial ALS. Amyotroph Lateral Scler Frontotemporal Degener, 2013. 14(7-8): p. 630-1.
83. Zou, Z.Y., et al., Screening for C9orf72 repeat expansions in Chinese amyotrophic lateral sclerosis patients. Neurobiol Aging, 2013. 34(6): p. 1710 e5-6.
84. Gamez, J., et al., I112M SOD1 mutation causes ALS with rapid progression and reduced penetrance in four Mediterranean families. Amyotroph Lateral Scler, 2011. 12(1): p. 70-5.
85. Orru, S., et al., High frequency of the TARDBP p.Ala382Thr mutation in Sardinian patients with amyotrophic lateral sclerosis. Clinical Genetics, 2012. 81(2): p. 172-8.
86. Purcell, S., S.S. Cherny, and P.C. Sham, Genetic Power Calculator: design of linkage and association genetic mapping studies of complex traits. Bioinformatics, 2003. 19(1): p. 149-50.
87. Fogh, I., et al., A genome-wide association meta-analysis identifies a novel locus at 17q11.2 associated with sporadic amyotrophic lateral sclerosis. Hum Mol Genet, 2013.
88. Jostins, L., et al., Host-microbe interactions have shaped the genetic architecture of inflammatory bowel disease. Nature, 2012. 491(7422): p. 119-24.
89. Excoffier, L. and M. Slatkin, Maximum-likelihood estimation of molecular haplotype frequencies in a diploid population. Mol Biol Evol, 1995. 12(5): p. 921-7.
90. Stephens, M., N.J. Smith, and P. Donnelly, A new statistical method for haplotype reconstruction from population data. Am J Hum Genet, 2001. 68(4): p. 978-89.
91. Marchini, J., et al., A comparison of phasing algorithms for trios and unrelated individuals. Am J Hum Genet, 2006. 78(3): p. 437-50.
92. van Es, M.A., et al., ITPR2 as a susceptibility gene in sporadic amyotrophic lateral sclerosis: a genome-wide association study. Lancet Neurology, 2007. 6(10): p. 869-77.
93. Cronin, S., et al., A genome-wide association study of sporadic ALS in a homogenous Irish population. Human Molecular Genetics, 2008. 17(5): p. 768-74.
94. Chio, A., et al., A two-stage genome-wide association study of sporadic amyotrophic lateral sclerosis. Human Molecular Genetics, 2009. 18(8): p. 1524-32.
95. Iida, A., et al., A functional variant in ZNF512B is associated with susceptibility to amyotrophic lateral sclerosis in Japanese. Human Molecular Genetics, 2011. 20(18): p. 3684-92.
96. van Es, M.A., et al., Genetic variation in DPP6 is associated with susceptibility to amyotrophic lateral sclerosis. Nature genetics, 2008. 40(1): p. 29-31.
142

97. Van Es, M.A., et al., Analysis of FGGY as a risk factor for sporadic amyotrophic lateral sclerosis. Amyotrophic lateral sclerosis : official publication of the World Federation of Neurology Research Group on Motor Neuron Diseases, 2009. 10(5-6): p. 441-7.
98. Daoud, H., et al., Analysis of DPP6 and FGGY as candidate genes for amyotrophic lateral sclerosis. Amyotrophic lateral sclerosis : official publication of the World Federation of Neurology Research Group on Motor Neuron Diseases, 2010. 11(4): p. 389-91.
99. Landers, J.E., et al., Reduced expression of the Kinesin-Associated Protein 3 (KIFAP3) gene increases survival in sporadic amyotrophic lateral sclerosis. Proceedings of the National Academy of Sciences of the United States of America, 2009. 106(22): p. 9004-9.
100. Cronin, S., et al., Screening for replication of genome-wide SNP associations in sporadic ALS. European Journal of Human Genetics, 2009. 17(2): p. 213-8.
101. Fogh, I., et al., No association of DPP6 with amyotrophic lateral sclerosis in an Italian population. Neurobiology of Aging, 2011. 32(5): p. 966-7.
102. Iida, A., et al., Replication analysis of SNPs on 9p21.2 and 19p13.3 with amyotrophic lateral sclerosis in East Asians. Neurobiol Aging, 2011. 32(4): p. 757 e13-4.
103. Chen, Y., et al., No association of five candidate genetic variants with amyotrophic lateral sclerosis in a Chinese population. Neurobiology of Aging, 2012. 33(11): p. 2721.e3-5.
104. Ratti, A., et al., C9ORF72 repeat expansion in a large Italian ALS cohort: evidence of a founder effect. Neurobiology of Aging, 2012. 33(10): p. 2528.e7-2528.e14.
105. Diekstra, F.P., et al., UNC13A is a modifier of survival in amyotrophic lateral sclerosis. Neurobiology of Aging, 2012. 33(3): p. 630.e3-8.
106. Mok, K., et al., Chromosome 9 ALS and FTD locus is probably derived from a single founder. Neurobiology of Aging, 2012. 33(1): p. 209 e3-8.
107. Manolio, T.A., et al., Finding the missing heritability of complex diseases. Nature, 2009. 461(7265): p. 747-53.
108. Momozawa, Y., et al., Resequencing of positional candidates identifies low frequency IL23R coding variants protecting against inflammatory bowel disease. Nature genetics, 2011. 43(1): p. 43-7.
109. Rivas, M.A., et al., Deep resequencing of GWAS loci identifies independent rare variants associated with inflammatory bowel disease. Nature genetics, 2011. 43(11): p. 1066-73.
110. Nejentsev, S., et al., Rare variants of IFIH1, a gene implicated in antiviral responses, protect against type 1 diabetes. Science, 2009. 324(5925): p. 387-9.
111. Liu, M.S., L.Y. Cui, and D.S. Fan, Age at onset of amyotrophic lateral sclerosis in China. Acta Neurol Scand, 2014. 129(3): p. 163-7.
112. Chen, Y., et al., PFN1 mutations are rare in Han Chinese populations with amyotrophic lateral sclerosis. Neurobiol Aging, 2013. 34(7): p. 1922 e1-5.
113. Zou, Z.Y., et al., Screening of VCP mutations in Chinese amyotrophic lateral sclerosis patients. Neurobiol Aging, 2013. 34(5): p. 1519 e3-4.
114. Brooks, B.R., et al., El Escorial revisited: revised criteria for the diagnosis of amyotrophic lateral sclerosis. Amyotroph Lateral Scler Other Motor Neuron Disord, 2000. 1(5): p. 293-9.
115. Purcell, S., et al., PLINK: a tool set for whole-genome association and population-based linkage analyses. Am J Hum Genet, 2007. 81(3): p. 559-75.
116. Price, A.L., et al., Principal components analysis corrects for stratification in genome-wide association studies. Nat Genet, 2006. 38(8): p. 904-9.
117. Yang, J., et al., GCTA: a tool for genome-wide complex trait analysis. Am J Hum Genet, 2011. 88(1): p. 76-82.
118. Pruim, R.J., et al., LocusZoom: regional visualization of genome-wide association scan results. Bioinformatics, 2010. 26(18): p. 2336-7.
119. Chapman, J.M., et al., Detecting disease associations due to linkage disequilibrium using haplotype tags: a class of tests and the determinants of statistical power. Hum Hered, 2003. 56(1-3): p. 18-31.
120. Cui, F., et al., Epidemiological characteristics of motor neuron disease in Chinese patients. Acta Neurol Scand, 2014.
121. Millecamps, S., et al., Phenotype difference between ALS patients with expanded repeats in C9ORF72 and patients with mutations in other ALS-related genes. J Med Genet, 2012. 49(4): p. 258-63.
143

122. Donnelly, C.J., et al., RNA toxicity from the ALS/FTD C9ORF72 expansion is mitigated by antisense intervention. Neuron, 2013. 80(2): p. 415-28.
123. Mori, K., et al., The C9orf72 GGGGCC Repeat Is Translated into Aggregating Dipeptide-Repeat Proteins in FTLD/ALS. Science, 2013.
124. Gijselinck, I., et al., A C9orf72 promoter repeat expansion in a Flanders-Belgian cohort with disorders of the frontotemporal lobar degeneration-amyotrophic lateral sclerosis spectrum: a gene identification study. Lancet Neurol, 2012. 11(1): p. 54-65.
125. Xi, Z., et al., Hypermethylation of the CpG island near the G4C2 repeat in ALS with a C9orf72 expansion. Am J Hum Genet, 2013. 92(6): p. 981-9.
126. Howie, B., J. Marchini, and M. Stephens, Genotype imputation with thousands of genomes. G3 (Bethesda), 2011. 1(6): p. 457-70.
127. Yang, J., et al., Common SNPs explain a large proportion of the heritability for human height. Nat Genet, 2010. 42(7): p. 565-9.
128. Garcia-Redondo, A., et al., Analysis of the C9orf72 Gene in Patients with Amyotrophic Lateral Sclerosis in Spain and Different Populations Worldwide. Hum Mutat, 2013. 34(1): p. 79-82.
129. Ishiura, H., et al., C9ORF72 repeat expansion in amyotrophic lateral sclerosis in the Kii peninsula of Japan. Arch Neurol, 2012. 69(9): p. 1154-8.
130. Konno, T., et al., Japanese amyotrophic lateral sclerosis patients with GGGGCC hexanucleotide repeat expansion in C9ORF72. J Neurol Neurosurg Psychiatry, 2012.
131. Snowden, J.S., et al., Frontotemporal dementia with amyotrophic lateral sclerosis: a clinical comparison of patients with and without repeat expansions in C9orf72. Amyotroph Lateral Scler Frontotemporal Degener, 2013. 14(3): p. 172-6.
132. Stewart, H., et al., Clinical and pathological features of amyotrophic lateral sclerosis caused by mutation in the C9ORF72 gene on chromosome 9p. Acta Neuropathol, 2012. 123(3): p. 409-17.
133. Zerylnick, C., et al., Normal variation at the myotonic dystrophy locus in global human populations. Am J Hum Genet, 1995. 56(1): p. 123-30.
134. Sutherland, G.R. and R.I. Richards, Simple tandem DNA repeats and human genetic disease. Proc Natl Acad Sci U S A, 1995. 92(9): p. 3636-41.
135. Leblond, C.S., et al., Dissection of genetic factors associated with amyotrophic lateral sclerosis. Exp Neurol, 2014.
136. van Blitterswijk, M., et al., Evidence for an oligogenic basis of amyotrophic lateral sclerosis. Hum Mol Genet, 2012. 21(17): p. 3776-84.
137. Thorvaldsdottir, H., J.T. Robinson, and J.P. Mesirov, Integrative Genomics Viewer (IGV): high-performance genomics data visualization and exploration. Brief Bioinform, 2013. 14(2): p. 178-92.
138. Moreira, L.G., et al., Structural and functional analysis of human SOD1 in amyotrophic lateral sclerosis. PLoS One, 2013. 8(12): p. e81979.
139. Cudkowicz, M.E., et al., Epidemiology of mutations in superoxide dismutase in amyotrophic lateral sclerosis. Ann Neurol, 1997. 41(2): p. 210-21.
140. Lattante, S., G.A. Rouleau, and E. Kabashi, TARDBP and FUS mutations associated with amyotrophic lateral sclerosis: summary and update. Hum Mutat, 2013. 34(6): p. 812-26.
141. Chen, S., et al., Genetics of amyotrophic lateral sclerosis: an update. Mol Neurodegener, 2013. 8: p. 28.
142. Sabatelli, M., A. Conte, and M. Zollino, Clinical and genetic heterogeneity of amyotrophic lateral sclerosis. Clin Genet, 2013. 83(5): p. 408-16.
143. Ebben, M.R., et al., REM behavior disorder associated with familial amyotrophic lateral sclerosis. Amyotroph Lateral Scler, 2012. 13(5): p. 473-4.
144. Chio, A., et al., Two Italian kindreds with familial amyotrophic lateral sclerosis due to FUS mutation. Neurobiol Aging, 2009. 30(8): p. 1272-5.
145. Alonazi, K.A., et al., Modeling aortic valve closure under the action of a ventricular assist device. Conf Proc IEEE Eng Med Biol Soc, 2013. 2013: p. 679-82.
146. Fujioka, S., P. Tacik, and Z.K. Wszolek, DCTN1 Mutations and Progressive Supranuclear Palsy-Like Phenotype. JAMA Neurol, 2014. 71(5): p. 655.
147. Tacik, P., et al., Three families with Perry syndrome from distinct parts of the world. Parkinsonism Relat Disord, 2014.
144

148. Vilarino-Guell, C., et al., Characterization of DCTN1 genetic variability in neurodegeneration. Neurology, 2009. 72(23): p. 2024-8.
149. Zlotogora, J., High frequencies of human genetic diseases: founder effect with genetic drift or selection? Am J Med Genet, 1994. 49(1): p. 10-3.
150. Goyal, N.A. and T. Mozaffar, Experimental trials in amyotrophic lateral sclerosis: a review of recently completed, ongoing and planned trials using existing and novel drugs. Expert Opin Investig Drugs, 2014: p. 1-11.
145

APPENDIX
146

Appendix. C2
Appendix.C2.1 DNA extraction methods
Appendix.C2.1.1. Genomic DNA is extracted using Bio-Tech Co., Ltd. Beijing Aide
Lai genomic DNA kit.
1. Peripheral venous blood 2ml in EDTA tubes.
2. Add pre-cooled (4°C) 2-3ml distilled water into the blood collection tube (EDTA), and
mix it by inversion or vortex. Then centrifuge tubes 10 min (4°C/ 3000rpm).
3. Remove the supernatant, avoid pouring the precipitation out, and repeat the above
process with distilled water washing.
4. Add the “erythrocyte lysate” 2-3ml, mixing by inversion of the tube (6-8 times), keep it
at room temperature for 8-10 minutes, inverse the tube several times during the
incubation.
5. Centrifuge the blood collection tube for 5min (20°C/3000g) and remove the
supernatant, avoid pouring out the precipitation. Repeat this “erythrocyte lysate”
washing process.
6. Remove the supernatant, and resuspend the precipitation to be fully dispersed.
7. Add 2ml “leukocyte lysate” and keep oscillating tubes until no visible clumps observed.
Keep it overnight at room temperature.
8. Add 0.67ml “protein precipitation solution“ in each tube and vortex it for 20s.
9. Centrifuge the tubes for 10min (20 °C/3000Xg). Extract the supernatant to a 15ml
centrifuge tube; avoid taking the precipitation or floats on the surface.
10.Add 2ml isopropanol in to 15ml tubes. Gently invert tubes up and down around 10
times or more until the DNA precipitation appears.
11.Centrifuge tubes for 5min (20 °C/3000Xg). Remove the supernatant.
147

12.Add 75% alcohol 2ml, invert the tubes several times gently,
13.Centrifuge tubes for 3 min (20 °C/3000Xg). Remove the supernatant. Repeat the
washing process above with 75% alcohol.
14.Dry the precipitate in air 30-60min, (avoid drying time is too long to dissolve DNA).
15.Add 100μl “DNA buffer”, keep it in 65 °C water bath for 30min to promote dissolution or
at room temperature overnight,
16.The DNA is stored in 4 °C or -20 °C.
148

Appendix.C2.1.2. DNA was extracted by Chloroform.
1. Retrieve blood tubes from -20 °C freezer and defrost (30-60 minutes at room).
2. Fill out the user and extraction date for each sample on the appropriate paper logger.
3. Turn on clean cabinet and let run for ~20 min before use.
4. Switch on the waterbath to 65 °C.
5. Label one 50mL falcon, 15mL falcon and 1.5mL eppendorph tube for each sample.
6. Pour defrosted blood into 50 mL Falcon tube.
7. Using a transfer pipette rinse the blood tube with lysis buffer and add this to the falcon
tube.
8. Add cold Lysis Buffer until volume is 40 mL and mix by inversion.
9. Centrifuge at 1300 x g for 10 minutes.
10.Gently pour off supernatant into waste container, be careful not to disturb the pellet.
11.Blot the edge of the falcon tubes on an absorbent tissue to remove any blood droplets.
12.Add 25mL of cold lysis buffer to each tube.
13.Resuspend the pellet by vortexing.
14.Centrifuge tubes at 1300 x g for 10 minutes.
15.Pour off supernatant into the waste container.
16.Blot the edge of the falcon tubes on an absorbent tissue to remove any remaining
liquid.
17.Add 750 µL of 5 M Sodium Perchlorate to the tubes.
18.Resuspend the pellet (Set a 1000 µL pipette to a volume of 800 µL and use filter tips).
19.Using a pipette boy and serological pipette add 3 mL of Solution B and shake to mix
well.
20. Incubate tubes at room temperature for 15 min, shaking occasionally.
21. Incubate in a water bath at 65 °C for at least 30 min (can be incubated overnight).
22.Cool the tubes to room temperature (10 - 15 min).
149

23.Using a pipette boy and serological pipette add 3 mL of Chloroform and mix by
inversion.
24.Centrifuge at 3500 rpm for 7 min, the solution will separate into three layers.
25.Use a transfer pipette to collect the upper aqueous layer into a 15 mL Falcon tube.
26.Dispose the Chloroform waste into the Chloroform waste bottle.
27.Add 8 mL ice-cold 100% ethanol to the tubes.
28.Mix thoroughly by inversion.
29.Transfer the DNA with a 1000 µL piptte tip into the Eppendorff tube.
30.Add 200µL of 1 x TE (pH 8.0) and ensure the pellet is immersed in the liquid.
150

Appendix.C2.1.3. DNA purity analysis
DNA purity analysis was conducted by using Nanodrop 2000(Thermo Fisher Scientific Inc,
USA), Trinean System (DropSense96 platform/cDrop vesion 1.2/1.3, TRINEAN nv,
Belgium). Results include: DNA concentration (ng / μl), A260 values, A280 value,
A260/A280, A260/A230. The quality of DNA was determined within a range 1.8
<A260/A280 <2.0.
Appendix.C2.2 Statistical genetic analysis in the Chinese GWAS
Appendix.C2.2.1. QC steps in the genome-wide association study.
1. Creation of BED files from Genomestudio (Illumina, San Diego,
www.illumina.com/software/genomestudio_software.ilmn)
2. Identification of individuals with discordant sex information
3. Identification of all markers with an excessive missing data rate
4. Test markers for different genotype call rates between cases and controls
5. Removal of all markers failing QC
6. Identification of individuals with elevated missing data rates or outlying
heterozygosity rate:
7. Identification of duplicated or related individuals
8. Identification of individuals of divergent ancestry
9. Removal of all individuals failing QC
10.Statistical analysis and regression analysis with principal components and sex
information
i. Association test (analysis of regression combined with other phenotypes and
covariant)
ii. Quality control by quantile-quantile plots and λ (GC)
151

Appendix.C2.3.2. Analysis methods and resources
Appendix.C2.3.2.1. Computational resource:
High performance computing facilities were offered by:
i. The University of Queensland Diamantina Institute (UQDI), The University of
Queensland, Brisbane, Australia: http://www.di.uq.edu.au/
ii. Queensland Brain Institute, The University of Queensland, Brisbane,
Australia: http://www.qbi.uq.edu.au/facilities
Appendix.C2.3.2.2. Software applied
1. PLINK software
o http://pngu.mgh.harvard.edu/~purcell/plink/download.shtml
2. SMARTPCA.pl: software for running PCA
o http://genepath.med.harvard.edu/~reich/Software.htm
3. Statistical software for data analysis and graphing:
o R
o http://cran.r-project.org/
o Locuszoom[1]
o http://csg.sph.umich.edu/locuszoom/
o Microsoft Offices 2011 software
o http://www.microsoftstore.com/Office
o Adobe illustrator softer CS6
o http://www.adobe.com/cn/products/illustrator.html
4. Reference data and R.script in open resource:
152

o HapMap:
o http://hapmap.ncbi.nlm.nih.gov/
o The 1,000 Genomes Project
o http://www.1000genomes.org/
o Reference data used in the analysis:
o http://www.well.ox.ac.uk/~carl/gwa/nature-protocols
153

Appendix.C2.4. Plots of loci generated by
Locuszoom[1](http://csg.sph.umich.edu/locuszoom/) results from the Chinese
GWAS with sex and PCs adjustments
154

155

156

157

Appendix.C2.5 CHR SNP BP Alternative allele OR P
20 rs4812037 57410978 G 1.40 2.31×10⁻⁷
20 rs6128441 57402992 G 1.40 2.53×10⁻⁷
20 rs3761264 57413371 G 1.39 4.24×10⁻⁷
20 rs4812040 57421544 A 1.40 4.25×10⁻⁷
20 KGP22754761 57403052 C 1.38 1.12×10⁻⁶
20 rs6123832 57418071 T 1.37 1.79×10⁻⁶
20 rs1800900 57415110 A 1.37 1.83×10⁻⁶
20 rs965808 57408426 C 1.36 2.70×10⁻⁶
5 rs7732824 115349682 G 0.75 3.61×10⁻⁶
16 KGP16448885 3188573 A 1.44 6.20×10⁻⁶
10 KGP312887 130294077 T 1.27 6.35×10⁻⁶
2 KGP3675121 175923056 A 1.27 6.96×10⁻⁶
5 KGP578954 2890462 T 1.35 7.42×10⁻⁶
1 rs2295746 233226430 G 1.32 1.25×10⁻⁵
20 KGP1550964 57444209 C 1.35 1.27×10⁻⁵
10 KGP10613998 130284254 T 0.79 1.35×10⁻⁵
10 rs1998911 97266538 T 0.78 1.38×10⁻⁵
2 rs4129274 83480213 T 1.31 1.95×10⁻⁵
15 KGP487014 100866865 C 0.75 1.96×10⁻⁵
7 rs1100687 145081764 G 1.39 2.18×10⁻⁵
158

Appendix C3.
Appendix C3.1 1. Reagents applied:
1. Isopropanol: AR, Beijing Chemical Plant, stored at room temperature.
2. Ethanol (75%,100%): Beijing Zhen Yu Minsheng Pharmaceutical Co., stored at
room temperature.
3. 50 × TAE (Tris-acetate electrophoresis buffer): Beijing Soledad Technology Co.,
stored at room temperature.
4. EB substitutes: Gelred, Biotium,
5. Agarose: Biowest Agarose, stored at room temperature.
6. DMSO (dimethyl sulfoxide): Star World source, stored at room temperature.
7. DNA Marker:O 'RangeRuler, 20bp DNA Ladder, stored at -20 °C.
PCR Mix applied: containing 100mM KCL, 20mM Tris-HCL, 3mM MgCl2, 400μM
8. dNTP Mixture, 0.1U/μl Taq DNA polymer, bromophenol blue and other enhancers
and stabilizers, Guangzhou Dongsheng biological Technology Co., Ltd.
9. Ultra-pure water: Guangzhou Dongsheng Biotech Co., Ltd., stored at -20 °C.
10.Primer synthesised: Beijing Bioko peak Biotechnology Co., Ltd., 10 × liquor stored
at -20 °C,
11.Deionized water: Homemade
159

Appendix C3.1 2. Facilities and equipment applied:
1. PCR instrument: GeneAmp PCR System 9700, Applied Biosystem Inc., USA; Veriti
96 well Thermal Cycler, Applied Biosystem Inc., USA.
2. Centrifuges applied: Microfuge 22R Centrifuge, BECKMAN COULTER; Microfuge
64R Centrifuge, BECKMAN COULTER; Microfuge X-15R Centrifuge, BECKMAN
COULTER, USA.
3. Electronic Balance: HR-200, A & D Company, Japan.
4. Electrophoresis: BG-Power 600, BAYGENE, USA.
5. DNA quality analysis system: Nanodrop 2000, Thermo, USA.
6. Gel imager: GENE GENIUS, BIO IMAGING SYSTEM, USA.
7. Purified water: RESERVOIR cascada RO WATER, PALL Corporation, USA; Milli-Q
Integral Water Purification System, Merck KGaA, Darmstadt, Germany.
160

Appendix C3.2. The results of the haplotype analysis of the 23 SNPs within and
surrounding the C9orf72 gene in the Chinese Han samples
Appendix C3.2.1. The Output with short burn-in (default; iteration: 100; thinning
interval: 1; burn-in: 100)
Ch_MND_11134 TTGGAAACCCGTGTCA 30 CCAAAGT TTAACGCCCCATATCA 2 CCAGCGT
Ch_MND_8446 TTGGAAACCCGTGTCA 30 CCAAAGT CTAACGCCTAGTGCTC 2 TCGGCGT
Ch_MND_9059 CTAACGCCCCATATCA 30 CCAAAGT CTAACAACCCGTGTCA 2 CCAGAGC
Appendix C3.2.2. The Output with long burn-in (iteration: 100; thinning interval: 1;
burn-in: 500)
Ch_MND_11134 TTGGAAACCCGTGTCA 30 CCAAAGT TTAACGCCCCATATCA 2 CCAGCGT
Ch_MND_8446 TTGGAAACCCGTGTCA 30 CCAAAGT CTAACGCCTAGTGCTC 2 TCGGCGT
Ch_MND_9059 CTAACGCCCCATATCA 30 CCAAAGT CTAACAACCCGTGTCA 2 CCAGAGC
Appendix C3.2.3. The output without microsatellite loci (iteration: 100; thinning
interval: 1; burn-in: 100)
Ch_MND_11134 TTGGAAACCCGTGTCA CCAAAGT TTAACGCCCCATATCA CCAGCGT
Ch_MND_8446 TTGGAAACCCGTGTCA CCAA(C)GT CTAACGCCTAGTGCTC TCGG(A)GT
Ch_MND_9059 CTAACGCCCCATATCA CCA(G)AG(C) CTAACAACCCGTGTCA CCA(A)AG(T)
Different parameters in the analyses were used to check for the consistency. The
haplotype with the posterior probability >0.90 was accepted. Brackets: The alleles with
probability <0.90.
161
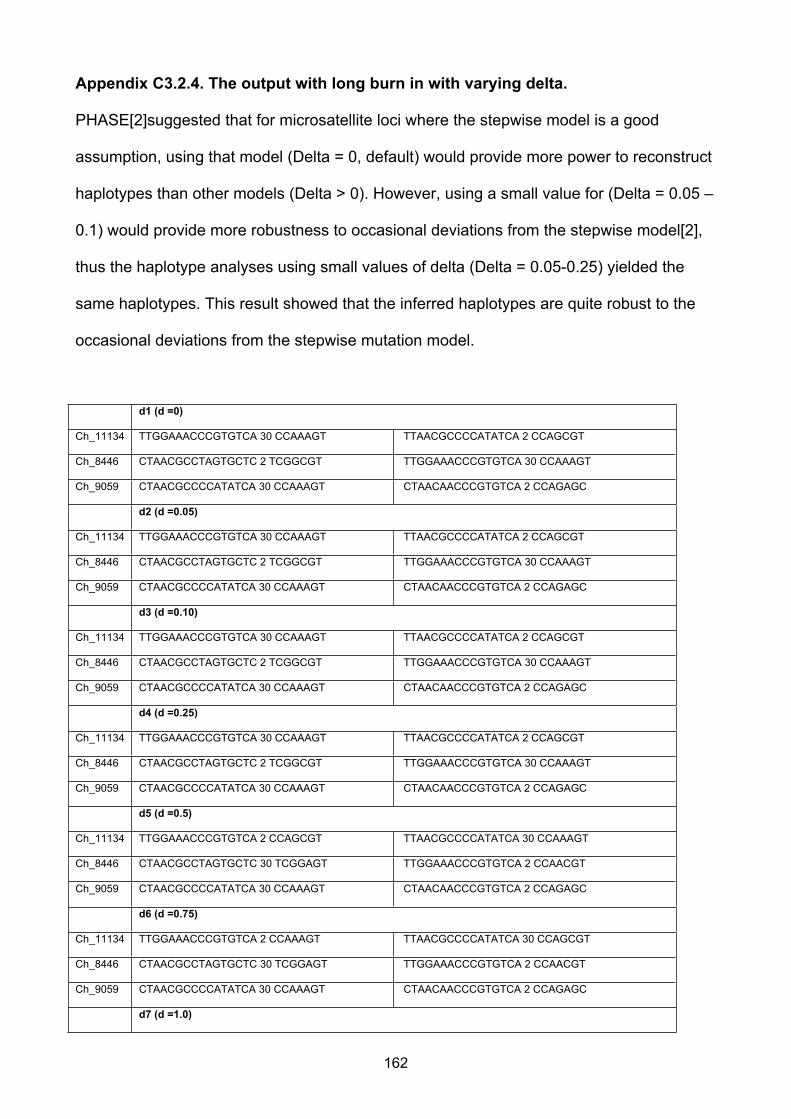
Appendix C3.2.4. The output with long burn in with varying delta.
PHASE[2]suggested that for microsatellite loci where the stepwise model is a good
assumption, using that model (Delta = 0, default) would provide more power to reconstruct
haplotypes than other models (Delta > 0). However, using a small value for (Delta = 0.05 –
0.1) would provide more robustness to occasional deviations from the stepwise model[2],
thus the haplotype analyses using small values of delta (Delta = 0.05-0.25) yielded the
same haplotypes. This result showed that the inferred haplotypes are quite robust to the
occasional deviations from the stepwise mutation model.
d1 (d =0)
Ch_11134 TTGGAAACCCGTGTCA 30 CCAAAGT TTAACGCCCCATATCA 2 CCAGCGT
Ch_8446 CTAACGCCTAGTGCTC 2 TCGGCGT TTGGAAACCCGTGTCA 30 CCAAAGT
Ch_9059 CTAACGCCCCATATCA 30 CCAAAGT CTAACAACCCGTGTCA 2 CCAGAGC
d2 (d =0.05)
Ch_11134 TTGGAAACCCGTGTCA 30 CCAAAGT TTAACGCCCCATATCA 2 CCAGCGT
Ch_8446 CTAACGCCTAGTGCTC 2 TCGGCGT TTGGAAACCCGTGTCA 30 CCAAAGT
Ch_9059 CTAACGCCCCATATCA 30 CCAAAGT CTAACAACCCGTGTCA 2 CCAGAGC
d3 (d =0.10)
Ch_11134 TTGGAAACCCGTGTCA 30 CCAAAGT TTAACGCCCCATATCA 2 CCAGCGT
Ch_8446 CTAACGCCTAGTGCTC 2 TCGGCGT TTGGAAACCCGTGTCA 30 CCAAAGT
Ch_9059 CTAACGCCCCATATCA 30 CCAAAGT CTAACAACCCGTGTCA 2 CCAGAGC
d4 (d =0.25)
Ch_11134 TTGGAAACCCGTGTCA 30 CCAAAGT TTAACGCCCCATATCA 2 CCAGCGT
Ch_8446 CTAACGCCTAGTGCTC 2 TCGGCGT TTGGAAACCCGTGTCA 30 CCAAAGT
Ch_9059 CTAACGCCCCATATCA 30 CCAAAGT CTAACAACCCGTGTCA 2 CCAGAGC
d5 (d =0.5)
Ch_11134 TTGGAAACCCGTGTCA 2 CCAGCGT TTAACGCCCCATATCA 30 CCAAAGT
Ch_8446 CTAACGCCTAGTGCTC 30 TCGGAGT TTGGAAACCCGTGTCA 2 CCAACGT
Ch_9059 CTAACGCCCCATATCA 30 CCAAAGT CTAACAACCCGTGTCA 2 CCAGAGC
d6 (d =0.75)
Ch_11134 TTGGAAACCCGTGTCA 2 CCAAAGT TTAACGCCCCATATCA 30 CCAGCGT
Ch_8446 CTAACGCCTAGTGCTC 30 TCGGAGT TTGGAAACCCGTGTCA 2 CCAACGT
Ch_9059 CTAACGCCCCATATCA 30 CCAAAGT CTAACAACCCGTGTCA 2 CCAGAGC
d7 (d =1.0)
162

Ch_11134 TTGGAAACCCGTGTCA 30 CCAAAGT TTAACGCCCCATATCA 2 CCAGCGT
Ch_8446 CTAACGCCTAGTGCTC 2 TCGGCGT TTGGAAACCCGTGTCA 30 CCAAAGT
Ch_9059 CTAACGCCCCATATCA 30 CCAGAGC CTAACAACCCGTGTCA 2 CCAAAGT
163

Appendix. C4
Appendix C4.1.1 Reagents Used:
1. Taq polymerase: Taq DNA Polymerase (5,000 units/ml), New England Biolabs, Inc.
2. ThermoPol® Buffer (Supplied with 10X Reaction Buffer): New England Biolabs,Inc.
1X ThermoPol® Reaction Buffer:
20 mM Tris-HCl
10 mM (NH4)2SO4
10 mM KCl
2 mM MgSO4
0.1% Triton® X-100
3. dNTP solutions: Deoxynucleotide (dNTP) Solution Set,( 100 mM, 25 μmol of each),
New England Biolabs, Inc.
4. Purified water: The purification was processed by Milli-Q water purifier(Milli-Q
Integral Water Purification System, Merck KGaA, Darmstadt, Germany)
5. Primers were synthesized by Integrated DNA Technologies Australia, Inc
164

Appendix C4.1.2. Facilities and equipment applied:
1. PCR instrument: GeneAmp PCR System 9700, Applied Biosystem Inc., USA; Veriti
96 well Thermal Cycler, Applied Biosystem Inc., USA.
2. Centrifuges applied: Microfuge 22R Centrifuge, BECKMAN COULTER; Microfuge
64R Centrifuge, BECKMAN COULTER; Microfuge X-15R Centrifuge, BECKMAN
COULTER, USA.
3. Electronic Balance:HR-200, A & D Company, Japan.
4. Electrophoresis: BG-Power 600, BAYGENE, USA.
5. DNA quality analysis system: Nanodrop 2000, Thermo, USA.
6. Gel imager: GENE GENIUS, BIO IMAGING SYSTEM, USA.
7. Purified water: RESERVOIR cascada RO WATER, PALL Corporation, USA; Milli-Q
Integral Water Purification System, Merck KGaA, Darmstadt, Germany.
8. FailSafe™ PCR 2X PreMix G/E used in SOD1 exon 1 PCR and TARDBP exon 6
PCR reactions (Epicentre, Illumina, San Diego company, USA)
165

Appendix. C4.3. ABI 3130 Sequencing methods
Appendix. C4.3.1 Sequencing PCR
Appendix. C4.3.1.1. Purified PCR product input for sequencing PCR.
PCR product Total ng in cycle sequencing reaction
100–200 bp 1–3 ng
200–500 bp 3–10 ng
500–1000 bp 5–20 ng
1000–2000 bp 10–40 ng
>2000 bp 20–50 ng
166

Appendix. C4.3.1.2.The Sequencing PCR is set up in tubes or a PCR plate, as
follows:
Reagent Volume (µL)
Big Dye Seq Buffer (5 X) 4
Big Dye 1
F or R (5 µM) 0.65
Template x
H₂0 x
Total 20
167

Appendix. C4.3.1.3.Sequencing PCR program
Temperature Time
96 ˚C 5 min 1 x
96 ˚C 10 sec
50 ˚C 5 sec
60 ˚C 4 min
25 X
168
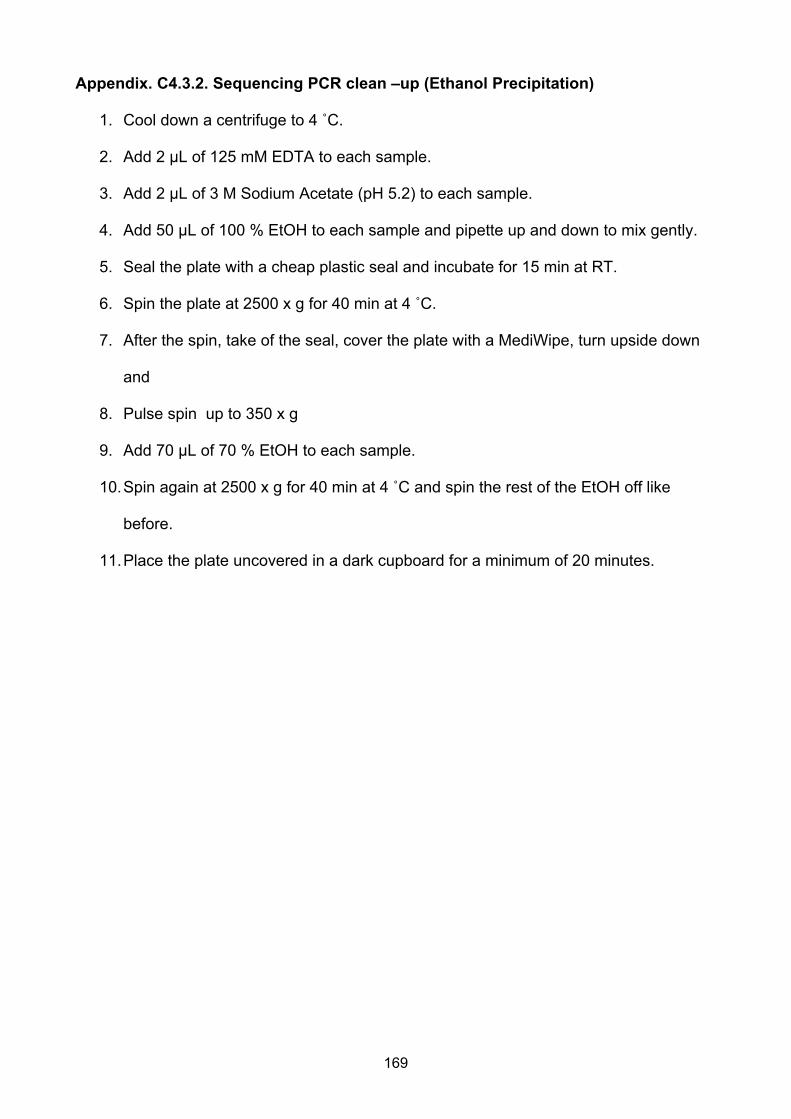
Appendix. C4.3.2. Sequencing PCR clean –up (Ethanol Precipitation)
1. Cool down a centrifuge to 4 ˚C.
2. Add 2 µL of 125 mM EDTA to each sample.
3. Add 2 µL of 3 M Sodium Acetate (pH 5.2) to each sample.
4. Add 50 µL of 100 % EtOH to each sample and pipette up and down to mix gently.
5. Seal the plate with a cheap plastic seal and incubate for 15 min at RT.
6. Spin the plate at 2500 x g for 40 min at 4 ˚C.
7. After the spin, take of the seal, cover the plate with a MediWipe, turn upside down
and
8. Pulse spin up to 350 x g
9. Add 70 µL of 70 % EtOH to each sample.
10.Spin again at 2500 x g for 40 min at 4 ˚C and spin the rest of the EtOH off like
before.
11.Place the plate uncovered in a dark cupboard for a minimum of 20 minutes.
169

Appendix. C4.3.3. Sequencing Electrophoresis and analysis
1. Prepare the sample sheet on the sanger sequencer computer
2. Resuspend samples by adding 10 µL of H₂O and 10 µL of HiDi Formamide to each
sample.
3. Pipette up and down to mix gently, and denature at 96˚C for 2 mins and place on
ice when
4. Sequence the prepared samples in ABI 3730 (Applied Biosystem) In the ABI
Sequencing Software (Foundation DATA Collection V3)
5. The sequencing trace result were analyzed with SeqMan Pro. (DNAStar, Version
2.3.0.131, DNASTAR, Inc.)
170

Appendix.C4.4 Next Generation sequencing with Illumina HiSeq® Sequencing
System (Illumina, San Diego, Inc.)
Appendix.C4.4.1.Next Generation sequencing is conducted with:
1. TruSeq Nano DNA Sample Prep Kit/ TruSeq SBS Kit v3-HS(Illumina, San Diego):
a. http://support.illumina.com/sequencing/sequencing_instruments/hiseq_2000/
kits.ilmn
2. The capture kits were adopted: SeqCap EZ Library SR Version 4.0. Roche
NimbleGen, Inc:
3. Hiseq 2000(Illumina, San Diego):
o http://support.illumina.com/sequencing/sequencing_instruments/hiseq_20
00.ilmn
4. The whole sequencing process strictly followed the company's standard protocols.
171

Appendix.C4.4.2. High performance computing facilities were offered by:
The University of Queensland Diamantina Institute (UQDI), The University of
Queensland, Brisbane, Australia: http://www.di.uq.edu.au/
Queensland Brain Institute, The University of Queensland, Brisbane, Australia:
http://www.qbi.uq.edu.au/facilities
172

Appendix.C4.5. Workflow for the in-house pipeline (contributed by Mhairi Marshall
and Paul Leo, The University of Queensland Diamantina Institute (UQDI))
1. Demultiplexing (CASAVA, Illumina, San Diego): Raw sequencing data in fastq
format
o http://support.illumina.com/sequencing/sequencing_software/casava.ilmn
2. Quality Control for raw sequencing data (fastQC)
o http://www.bioinformatics.babraham.ac.uk/projects/fastqc/
3. Alignment (BWA[3])
4. Mark duplicates (Picard)
o http://samtools.sourceforge.net
5. Indel Realignment (GATK[4] IndelRealigner)
o GATK best practice: https://www.broadinstitute.org/gatk/
6. Base Quality Score Recalibration (GATK BaseRecalibrator)
7. Variants Calling (GATK HaplotypeCaller in gVCF mode)
8. Joint Genotyping (GATK GenotypeGVCFs)
9. Raw variants including both SNPs and Indels
10.Variant Recalibration (GATK VariantRecalibrator)
11.Analysis-Ready Variants including both SNPs and Indels
12.Variants Annotation (ANNOVAR[5])
173

APPENDIX REFERENCE
1. Pruim, R.J., et al., LocusZoom: regional visualization of genome-wide association
scan results. Bioinformatics, 2010. 26(18): p. 2336-7.
2. Stephens, M., N.J. Smith, and P. Donnelly, A new statistical method for haplotype
reconstruction from population data. Am J Hum Genet, 2001. 68(4): p. 978-89.
3. Li, H. and R. Durbin, Fast and accurate short read alignment with Burrows-Wheeler
transform. Bioinformatics, 2009. 25(14): p. 1754-60.
4. McKenna, A., et al., The Genome Analysis Toolkit: a MapReduce framework for
analyzing next-generation DNA sequencing data. Genome Res, 2010. 20(9): p.
1297-303.
5. Liu, X., X. Jian, and E. Boerwinkle, dbNSFP: a lightweight database of human
nonsynonymous SNPs and their functional predictions. Hum Mutat, 2011. 32(8): p.
894-9.
174