Unclogging Bottlenecks of Christian Privilege in the Classroom
Upload
independentCategory
view
1download
0
Original Article
Folia Primatol 2007;78:73–87 DOI: 10.1159/000097058
Genetic Variability in Four Alouatta Species Measured by Means of Nine DNA Microsatellite Markers: Genetic Structure and Recent Bottlenecks
M. Ruiz-Garcia a P. Escobar-Armel
a D. Alvarez a M. Mudry
b M. Ascunce
b G. Gutierrez-Espeleta c J.M. Shostell
d
a Unidad de Genética (Grupo de Genética de Poblaciones-Biología Evolutiva),
Departamento de Biología, Facultad de Ciencias, Pontificia Universidad Javeriana, Bogotá , Colombia; b
GIBE, Departamento de Biología, Facultad de Ciencias Exactas y Naturales, Universidad de Buenos Aires, Buenos Aires , Argentina; c
Escuela de Biología, Universidad de Costa Rica, San José , Costa Rica; d
Department of Biology, Penn State University, Uniontown, Pa. , USA
Key Words Alouatta � DNA microsatellites � Bottlenecks � Genetic structure
Abstract We used microsatellite DNA to study the population genetics of 4 Alouatta species
from Central and South America. Our main findings include the following: (1) A. senicu-lus had the highest level of microsatellite variability while A. caraya and A. palliata had the lowest mean number of alleles per locus and the lowest expected heterozygosity, respectively; (2) the samples of A. seniculus and A. palliata came from different regions and were not in Hardy-Weinberg equilibrium (HWE) which may indicate a Wahlund ef-fect and differentiated gene pools – in contrast, A. macconnelli and A. caraya were in HWE; (3) the microsatellite genetic heterogeneity of the 4 Alouatta species was similar to the karyotype divergence found among these Alouatta species; the species pair with the lowest level of heterogeneity (genetic differentiation) was A. seniculus/A. caraya , while the Central American species, A. palliata , was highly differentiated from the other 3 South American species; (4) we recommend the establishment of a conservation plan to help protect A. caraya because the Cornuet and Luikart procedure demonstrated a recent bottleneck for this species. Copyright © 2007 S. Karger AG, Basel
Received: December 22, 2005 Accepted after revision: April 12, 2006
Prof. Manuel Ruiz-García, PhDDepartamento de Biología, Facultad de Ciencias Pontificia Universidad Javeriana, Cra 7A No 43–82Bogotá DC (Colombia), Tel./Fax +57 1 320 8320E-Mail [email protected]
© 2007 S. Karger AG, Basel0015–5713/07/0782–0073$23.50/0
Accessible online at:www.karger.com/fpr
Fax +41 61 306 12 34E-Mail [email protected]

Folia Primatol 2007;78:73–8774 Ruiz-Garcia /Escobar-Armel /Alvarez /Mudry /Ascunce /Gutierrez-Espeleta /Shostell
Introduction
Alouatta (howler monkeys) is the unique living genus within the subfamilyAlouattinae (or Mycetinae) [Rylands et al., 2000; Groves, 2001] and is one of the 15 Neotropical primate genera currently living in Latin America. Howler monkeys are among the largest Neotropical primates, being similar in size to individuals within the Ateles, Brachyteles and Lagothrix genera. In the current work, we analyze the ge-netics of 4 Alouatta species.
The distribution of Alouatta palliata (mantled howler), which may include 3 subspecies (A. palliata mexicana , A. palliata palliata and A. palliata aequatorialis) , extends from southern Mexico throughout all of Central America to the Pacific west coast of Colombia and Ecuador. A. seniculus (red howler) is distributed in northern South America, north of the Amazon River, in the east and south into Bolivia in the west. The distribution of A. macconnelli includes Surinam, French Guiana and the Amazonian area of Brazil. Many authors have classified A. macconnelli within A. seniculus even though they have extensive chromosome differences [De Lima and Seuánez, 1991; Groves, 2001] and should be considered as completely isolated spe-cies. A. caraya (black howler) is distributed in southern Brazil, eastern Bolivia, Para-guay and northern Argentina.
Karyotypic analyses of this widely distributed genus have demonstrated that the chromosome complement is extremely diverse among its species [Bonvicino et al., 2001]. These analyses have led to frequent reviews of the number of species in each geographic region and to an increase in the number of identified species. It would be helpful to identify other methods that would facilitate the discrimination between previously defined Alouatta species. One potentially helpful method is via an analy-sis of DNA microsatellites.
Distribution patterns are impacted by a number of factors, which in some cases may result in bottlenecks and reduced gene diversity. The analyses of some Alouatta species have provided evidence of recent bottlenecks [James et al., 1997] which have in turn led to the establishment of conservation measures to protect the identified species and its habitat. Unfortunately, many Alouatta species have not been simi-larly examined from a molecular population genetics point of view, including the ones in our study.
Recent developments of molecular procedures based on polymerase chain reac-tion (PCR) methodology has helped population geneticists to analyze and determine the genetic structure and the levels of genetic variability of many wild species by us-ing only small fragments of hair, faecal material or various body tissues such as bone. Among the most remarkable molecular markers used in these analyses are STRPs (short tandem repeat polymorphisms, microsatellites) which are composed of tan-dem, repetitive units of 2–6 base pairs in length [Weber and May, 1989]. STRPs are randomly distributed, highly polymorphic and frequently found inside eukaryotic genomes. The small amount of DNA needed for these molecular analyses has helped the investigator to use noninvasive procedures when sampling wild animals which has in turn led to a strong incorporation of molecular techniques in the study of population biology dynamics [Bruford and Wayne, 1993]. These molecular advanc-es have not been rigorously applied to the study of many wild species, including those of the genus Alouatta .

Genetic Variability in Four Alouatta Species 75Folia Primatol 2007;78:73–87
The main goals of this study include the following: (1) to determine the micro-satellite gene diversity in the 4 species of Alouatta stated above; (2) to determine if there is evidence of Hardy-Weinberg equilibrium (HWE) at the STRPs studied in the 4 species and to search the possible relationship with subdivision events throughout the distribution of these species (Wahlund effect); (3) to determine the levels of mo-lecular microsatellite genetic heterogeneity between Alouatta species and to evaluate the discrimination power of the microsatellites employed; (4) to determine the exis-tence of some recent bottlenecks on the gene pools of the Alouatta species studied.
Material and Methods
Samples and Molecular Procedures A total of 159 Alouatta from 4 different species (n = 84 A. seniculus ; n = 48 A. palliata ;
n = 20 A. caraya; n = 7 A. macconnelli ) were sampled ( fig. 1 , table 1 ). All samples were obtained directly from live or dead field specimens. The dead animals were hunted by Native Indian
Fig. 1. Map with the geographical areas where Alouatta species were sampled. Numbers of samples are indicated on the map. In Colombia, departments where samples were obtained are indicated.
2
14
7Costa RicaA. palliatapalliata
MéxicoA. palliatamexicana
ColombiaA. palliataaequatorialis Bolivia
Argentina
French GuianaA. macconnellii
20
7167
17
33
42
2
1
2
A. s. seniculus
433
6
Colombia (84)La Guajira
Meta
Chocó
Antioquia
Putumayo
Amazonas
AtlánticoBolivar
Vichada
Magdalena
Caquetá
Arauca
ECUADOR
A. caraya
BRAZIL
PERU
VENEZUELA

Folia Primatol 2007;78:73–8776 Ruiz-Garcia /Escobar-Armel /Alvarez /Mudry /Ascunce /Gutierrez-Espeleta /Shostell
communities. The A. seniculus samples were collected from the Colombian regions of La Gua-jira, Meta, Antioquia, Chocó, Amazonas, Vichada, Putumayo, Magdalena and Atlántico. Ad-ditionally, 4 skin samples of A. seniculus were obtained from the Mammalian museum in the Instituto von Humboldt at Villa de Leyva (Colombia). A total of 3 subspecies of A. palliata were collected from Mexico (n = 2 A. palliata mexicana , States of Costuxtla and Tabasco), Colombia (n = 3 A. palliata aequatorialis, Chocó) and throughout Costa Rica (n = 43 A. palliata palliata ). The samples of A. caraya were collected from the island of Brasilera and 3 other locations in the Argentinean Chaco (n = 14) and in 3 different geographical areas in Bolivia (n = 6), while the samples of A. macconnelli were collected from 3 different geographical locations in French Gui-ana at the Carnopi River.
DNA was extracted from samples of blood, skin, bone and teeth via the phenol-chloroform method [Sambrook et al., 1989] and from hair using the Chelex 10% method [Walsh et al., 1991].
Table 1. Sample sizes, morphological subspecies, countries, specific geographic origins, type of samples and sources of the 159 Alouatta samples from the 4 different species (A. seniculus, A. palliata, A. caraya and A. macconnelli) studied herein
Species n Subspeciesand origin
Geographic origin, type of samples and sources
Alouattaseniculus
84 A. s. seniculusColombia
La Guajira (20 samples, all blood drops), Meta (7 samples, blood, hair and teeth), Antioquia (16 samples, all blood) Chocó (7 samples, blood and teeth), Amazonas (17 samples, blood, hair, teeth and bones), Vichada (3 samples, teeth), Putumayo (3 samples, teeth and bones), Magdalena (2 samples, teeth), Atlántico (2 samples, teeth), Caquetá (2 samples, hair and teeth), Arauca (1 sample, teeth), Bolivar (4 samples, teeth and bones); M.R.G., P.E.A., D.A., Indian tribes across all Colombia, F. Nassar, J. Gardeazábal, L.M. Borrero, D.M. Ramírez, Instituto von Humboldt (4 skin samples)
Alouattapalliata
48 A. p. palliataCosta Rica
Across all Costa Rica (43 samples, blood and hairs);G.G.E., M.R.G., D.A., P.E.A.
A. p. mexicanaMexico
Costuxtla (1 sample, DNA), Tabasco (1 sample, DNA);L. Cortés-Ortiz
A. p. aequatorialisColombia
Chocó (3 samples, teeth and bones);M.R.G.
Alouattacaraya
20 A. carayaArgentina
Isla Brasilera and 3 other geographical points, Argentinian Chaco (14 samples, blood drops);M.M., M.A.
A. carayaBolivia
Santa Cruz Department and diverse localities at the Mamoré River (6 samples, hairs);M.R.G., D.A.
Alouattamacconnelli
7 A. macconnelliFrench Guiana
Carnopi River (4 samples of muscle tissue and 3 samples of hairs from 3 localities);F. Catzeflis, M.R.G.
Genetic Variability in Four Alouatta Species 77Folia Primatol 2007;78:73–87
Nine microsatellite markers (AP40, AP68, AP74, D5S111, D5S117, D6S260, D8S165, D14S51 and D17S804) were used in the current study. Most but not all of the markers amplified in all the Alouatta species. The AP40, AP68 and AP74 markers were designed for A. palliata while the remaining markers were designed for humans. Several studies have demonstrated that these human microsatellites have clearly amplified for Neotropical primates [Rogers et al., 1995; Ellesworth and Hoelzer, 1998; Witte and Rogers, 1999]. Therefore, the human markers that these authors used successfully in diverse Neotropical primates were also used in our study.
The final PCR volume and reagent concentrations for the DNA extraction from blood, skin, bone and teeth were 25 � l, with 3 � l of MgCl 2 3 m M , 2.5 � l of buffer 10 ! , 1 � l of dNTPs 0.04 m M , 1 � l of each primer (forward and reverse; 4 pmol), 13.5 � l of H 2 O, 2 � l of DNA and 1 Taq polymerase unit per reaction (1 � l). For the PCR reactions with hairs, the overall volume was 50 � l, with 20 � l of DNA and twofold amounts of MgCl 2 , buffer, dNTPs, primers and Taq polymerase.
All PCR reactions were carried out in a Perkin Elmer Geneamp PCR System 9,600 ther-mocycler for 5 min at 95 ° C, 30 one-min cycles at 95 ° C, 1 min at the most accurate annealing temperature (57 ° C for AP40, 50 ° C for AP68 and 52 ° C for the remaining markers), 1 min at 72 ° C and 5 min at 72 ° C. The amplification products were kept at 4 ° C until they were used. The PCR amplification products were run in denatured 6% polyacrylamide gels in a Hoefer SQ3 sequencer vertical chamber. Depending on the size of the markers analyzed and the presence of 35 W as a constant, the gels were stained with AgNO 3 (silver nitrate) after 2–3 h of migration. The molecular weight markers used were � 174 (cut with Hin dIII) and Hin f.
The PCR reactions were repeated 3 times for DNA extracted from hairs, teeth and bones in order to confirm the genotypes obtained from these tissues. Therefore, allelic dropout was highly improbable. The existence of null alleles cannot be totally excluded, which could increase the number of false homozygous genotypes. Nevertheless, it is improbable that all loci were af-fected in the same way, and that this was the cause of systematic deviations from HWE.
Population Genetics Analyses The mean number of alleles per locus and the expected heterozygosity H [Nei, 1973]
were calculated for the 4 Alouatta species studied and differences among estimates were sta-tistically analyzed with a Student t test. The heterozygosity data were arcsine transformed prior to analysis, as proposed by Archie [1985]. A re-calculation of the allele number esti-mates was carried out normalizing for the different sample sizes by using bootstrapping and jackknifing approaches. For the bootstrap procedure, a number from each sample equal to the smallest sample size with replacement was taken, while the jackknife takes a number equal to the smallest sample size without replacement. The AGARst program was employed for this task.
The HWE was estimated using the F statistic of Weir and Cockerham [1984]. This proce-dure was used to calculate the degree of excess of homo- and heterozygous genotypes within each Alouatta species, and the Markov chain method (with 2,000 dememorization, 100 batches at 2,000 iterations per batch) [Raymond and Rousset, 1995] was used to measure the proba-bilities. The Fisher method was used to analyze the global HWE estimates (by loci and by species).
Two strategies were used to calculate genetic heterogeneity among species pairs. First, the gene frequencies of the 9 microsatellites were tested with Markov chains (2,000 dememoriza-tions, 40 batches at 2,000 iterations per batch). Second, Wright’s F statistics [1951], with the procedure of Michalakis and Excoffier [1996], were applied. The standard deviations of the F statistics and the confidence intervals (95 and 99%) were calculated with jackknifing and boot-strapping over loci, respectively. The significance of F st (genetic heterogeneity, subpopulation with regard to total) was calculated with the G test (10,000 allele randomizations, random mat-ing assumed) and with the log-likelihood G test (10,000 genotype randomizations, random mating not assumed) for among species values [Goudet et al., 1996]. The significances of F is and F it were similarly calculated (10,000 randomizations of alleles within and overall for the species analyzed). Nei’s [1973] gene diversity analysis was also used to measure the gene heterogeneity between species as well as the repeat number of allele (R st ) statistic [Slatkin, 1995; Rousset, 1997;
Folia Primatol 2007;78:73–8778 Ruiz-Garcia /Escobar-Armel /Alvarez /Mudry /Ascunce /Gutierrez-Espeleta /Shostell
Goodman, 1997]. These analyses are useful to determine the STRPs that most clearly discrim-inate among the 4 Alouatta species studied and to determine the degree of gene variability of each of these species relative to their genus.
The last genetics population analysis [Cornuet and Luikart, 1996; Luikart et al., 1998] was used to detect recent bottleneck events. Those species that have experienced recent bottlenecks have a decreased number of alleles and decreased expected levels of heterozygosity. However, the allele number is reduced faster than the expected heterozygosity and therefore the value of the expected heterozygosity calculated through the allele number with a coalescence method is lower than the expected heterozygosity obtained from the allele frequencies. For neutral mark-ers, in a population in mutation-gene drift equilibrium, there is an equal probability that a given locus has a slight excess or deficit of expected heterozygosity from allele frequencies in regard to the heterozygosity calculated from the number of alleles. On the contrary, in a bottle-necked population, a large fraction of the loci analyzed will exhibit a significant excess of the expected heterozygosity from allele frequencies. Four tests (sign, standardized differences, Wil-coxon’s signed rank tests and a graphical method [Luikart et al., 1998]) were used to calculate the probability of a recent bottleneck in the 4 Alouatta species studied. Populations which have not suffered a recent bottleneck event will yield an L shape distribution (a large proportion of alleles at low frequency), whereas recently bottlenecked populations will show a mode shift dis-tribution, with fewer alleles at a low frequency.
Results
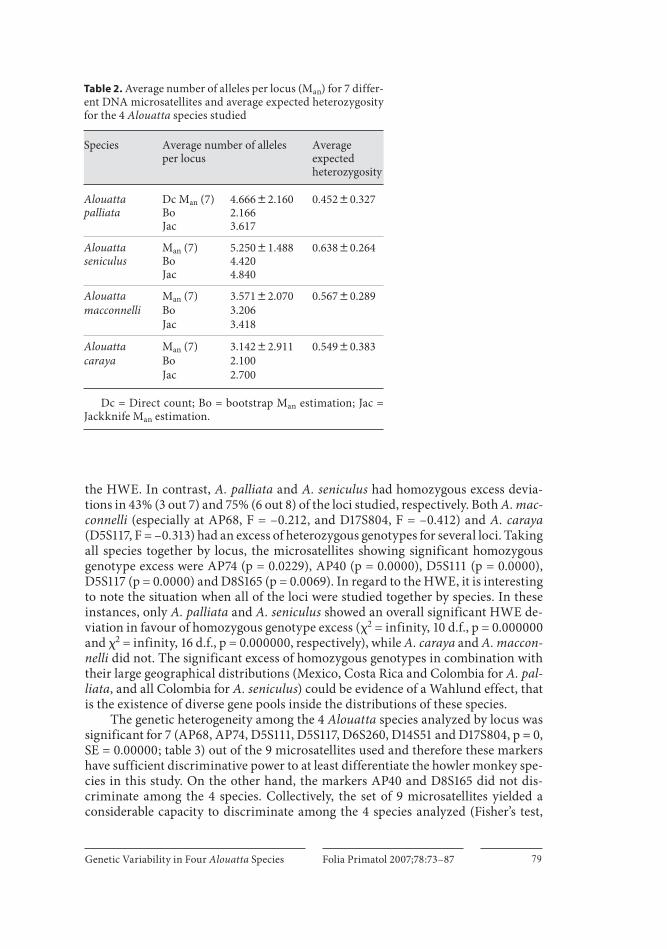
A. caraya had the lowest mean number of alleles per locus for the loci studied (3.14 8 2.91 SE), while A. seniculus had the highest (5.25 8 1.49 SE; table 2 ). The other 2 Alouatta species studied showed intermediate values. A. caraya/A. seniculus was the only significantly different comparison pair (t = 2.867, 10 d.f., p ! 0.02). The bootstrap and jackknife procedures for small and variable sample sizes again showed that A. seniculus was the species with the highest mean allele number (4.42–4.84), while A. caraya was the species with the lowest (2.10–2.70). Therefore, these extreme mean allele numbers were not the result of different sample sizes analyzed for these Alouatta species.
A. seniculus had the highest expected heterozygosity (0.638 8 0.264 SE), and A. palliata had the lowest (0.452 8 0.327 SE; table 2 ). There was no significantly differ-ent comparison pair of heterozygosity among the 4 Alouatta species studied. In ad-dition, the sample size of each species did not significantly affect the levels of micro-satellite gene diversity (mean allele number and heterozygosity; regression, p 1 0.05).
By locus, the microsatellites which introduced more genetic variability per spe-cies were D17S804 and D8S165 for A. caraya , AP74 and AP68 for A. palliata , D5S117 and D8S165 for A. seniculus and D5S111 and AP68 for A. macconnelli . Therefore, each howler species has specific microsatellites that provide large contributions to genetic diversity.
The results of the HWE analyses were as follows: there was a significant excess of homozygosity by locus in A. palliata (AP68: F = 0.303, p = 0.036; D5S111: F = 0.819, p = 0.0000; D5S117: F = 0.316, p = 0.0438), A. seniculus (AP74: F = 0.451, p = 0.0036; AP40: F = 1, p = 0.0000; D5S111: F = 0.91, p = 0.0000; D5S117: F = 0.686, p = 0.0000; D8S165: F = 0.243, p = 0.0186; D17S804: F = 0.528, p = 0.0137), A. caraya (D8S165: F = 0.127, p = 0.0462), but not in A. macconnelli. Therefore A. macconnelli and A. caraya (with the exception of D8S165) did not show evidence of deviation from
Genetic Variability in Four Alouatta Species 79Folia Primatol 2007;78:73–87
the HWE. In contrast, A. palliata and A. seniculus had homozygous excess devia-tions in 43% (3 out 7) and 75% (6 out 8) of the loci studied, respectively. Both A. mac-connelli (especially at AP68, F = –0.212, and D17S804, F = –0.412) and A. caraya (D5S117, F = –0.313) had an excess of heterozygous genotypes for several loci. Taking all species together by locus, the microsatellites showing significant homozygous genotype excess were AP74 (p = 0.0229), AP40 (p = 0.0000), D5S111 (p = 0.0000), D5S117 (p = 0.0000) and D8S165 (p = 0.0069). In regard to the HWE, it is interesting to note the situation when all of the loci were studied together by species. In these instances, only A. palliata and A. seniculus showed an overall significant HWE de-viation in favour of homozygous genotype excess ( � 2 = infinity, 10 d.f., p = 0.000000 and � 2 = infinity, 16 d.f., p = 0.000000, respectively), while A. caraya and A. maccon-nelli did not. The significant excess of homozygous genotypes in combination with their large geographical distributions (Mexico, Costa Rica and Colombia for A. pal-liata , and all Colombia for A. seniculus ) could be evidence of a Wahlund effect, that is the existence of diverse gene pools inside the distributions of these species.
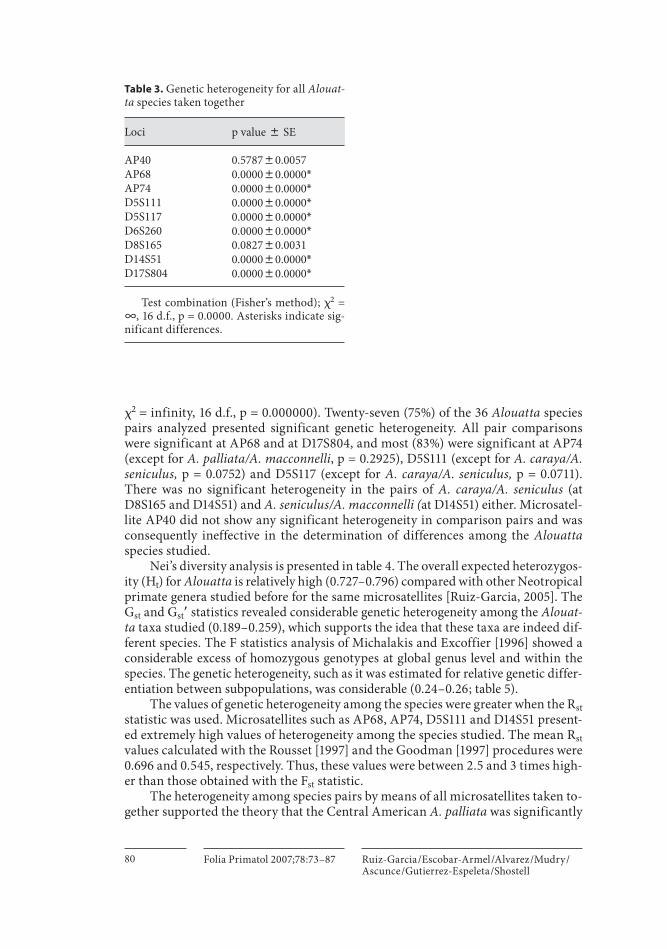
The genetic heterogeneity among the 4 Alouatta species analyzed by locus was significant for 7 (AP68, AP74, D5S111, D5S117, D6S260, D14S51 and D17S804, p = 0, SE = 0.00000; table 3 ) out of the 9 microsatellites used and therefore these markers have sufficient discriminative power to at least differentiate the howler monkey spe-cies in this study. On the other hand, the markers AP40 and D8S165 did not dis-criminate among the 4 species. Collectively, the set of 9 microsatellites yielded a considerable capacity to discriminate among the 4 species analyzed (Fisher’s test,
Table 2. Average number of alleles per locus (Man) for 7 differ-ent DNA microsatellites and average expected heterozygosity for the 4 Alouatta species studied
Species Average number of allelesper locus
Average expected heterozygosity
Alouatta palliata
Dc Man (7)BoJac
4.66682.1602.1663.617
0.45280.327
Alouatta seniculus
Man (7)BoJac
5.25081.4884.4204.840
0.63880.264
Alouatta Man (7) 3.57182.070 0.56780.289macconnelli Bo 3.206
Jac 3.418
Alouatta Man (7) 3.14282.911 0.54980.383caraya Bo 2.100
Jac 2.700
Dc = Direct count; Bo = bootstrap Man estimation; Jac = Jackknife Man estimation.
Folia Primatol 2007;78:73–8780 Ruiz-Garcia /Escobar-Armel /Alvarez /Mudry /Ascunce /Gutierrez-Espeleta /Shostell
� 2 = infinity, 16 d.f., p = 0.000000). Twenty-seven (75%) of the 36 Alouatta species pairs analyzed presented significant genetic heterogeneity. All pair comparisons were significant at AP68 and at D17S804, and most (83%) were significant at AP74 (except for A. palliata/A. macconnelli , p = 0.2925), D5S111 (except for A. caraya/A. seniculus, p = 0.0752) and D5S117 (except for A. caraya/A. seniculus, p = 0.0711). There was no significant heterogeneity in the pairs of A. caraya/A. seniculus (at D8S165 and D14S51) and A. seniculus/A. macconnelli ( at D14S51) either. Microsatel-lite AP40 did not show any significant heterogeneity in comparison pairs and was consequently ineffective in the determination of differences among the Alouatta species studied.
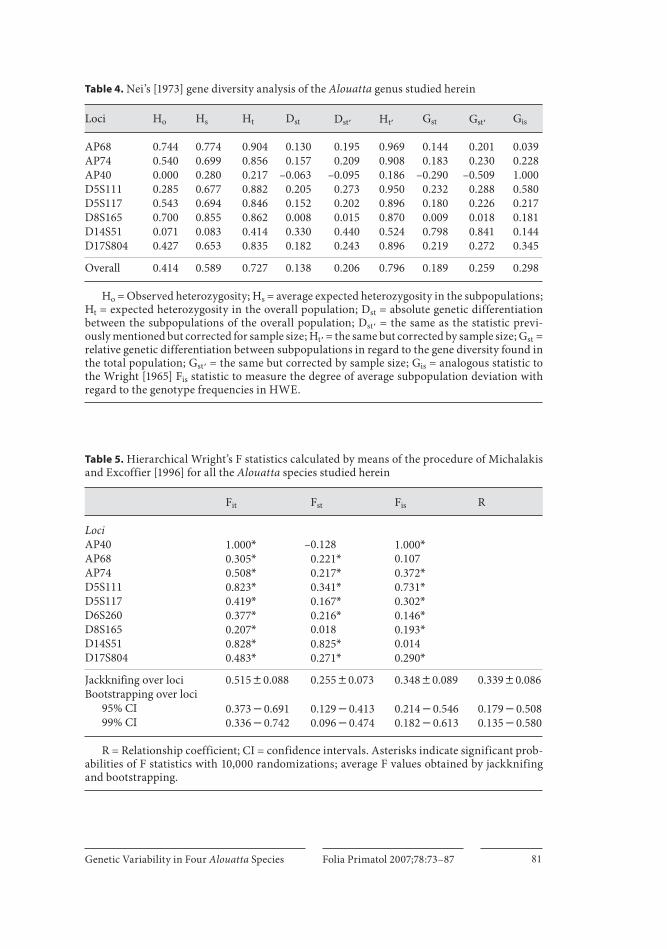
Nei’s diversity analysis is presented in table 4 . The overall expected heterozygos-ity (H t ) for Alouatta is relatively high (0.727–0.796) compared with other Neotropical primate genera studied before for the same microsatellites [Ruiz - Garcia, 2005]. The G st and G st � statistics revealed considerable genetic heterogeneity among the Alouat-ta taxa studied (0.189–0.259), which supports the idea that these taxa are indeed dif-ferent species. The F statistics analysis of Michalakis and Excoffier [1996] showed a considerable excess of homozygous genotypes at global genus level and within the species. The genetic heterogeneity, such as it was estimated for relative genetic differ-entiation between subpopulations, was considerable (0.24–0.26; table 5 ).
The values of genetic heterogeneity among the species were greater when the R st statistic was used. Microsatellites such as AP68, AP74, D5S111 and D14S51 present-ed extremely high values of heterogeneity among the species studied. The mean R st values calculated with the Rousset [1997] and the Goodman [1997] procedures were 0.696 and 0.545, respectively. Thus, these values were between 2.5 and 3 times high-er than those obtained with the F st statistic.
The heterogeneity among species pairs by means of all microsatellites taken to-gether supported the theory that the Central American A. palliata was significantly
Table 3. Genetic heterogeneity for all Alouat-ta species taken together
Loci p value 8 SE
AP40 0.578780.0057AP68 0.000080.0000*AP74 0.000080.0000*D5S111 0.000080.0000*D5S117 0.000080.0000*D6S260 0.000080.0000*D8S165 0.082780.0031D14S51 0.000080.0000*D17S804 0.000080.0000*
Test combination (Fisher’s method); �2 = G, 16 d.f., p = 0.0000. Asterisks indicate sig-nificant differences.
Genetic Variability in Four Alouatta Species 81Folia Primatol 2007;78:73–87
Table 4. Nei’s [1973] gene diversity analysis of the Alouatta genus studied herein
Loci Ho Hs Ht Dst Dst� Ht� Gst Gst� Gis
AP68 0.744 0.774 0.904 0.130 0.195 0.969 0.144 0.201 0.039AP74 0.540 0.699 0.856 0.157 0.209 0.908 0.183 0.230 0.228AP40 0.000 0.280 0.217 –0.063 –0.095 0.186 –0.290 –0.509 1.000D5S111 0.285 0.677 0.882 0.205 0.273 0.950 0.232 0.288 0.580D5S117 0.543 0.694 0.846 0.152 0.202 0.896 0.180 0.226 0.217D8S165 0.700 0.855 0.862 0.008 0.015 0.870 0.009 0.018 0.181D14S51 0.071 0.083 0.414 0.330 0.440 0.524 0.798 0.841 0.144D17S804 0.427 0.653 0.835 0.182 0.243 0.896 0.219 0.272 0.345
Overall 0.414 0.589 0.727 0.138 0.206 0.796 0.189 0.259 0.298
Ho = Observed heterozygosity; Hs = average expected heterozygosity in the subpopulations; Ht = expected heterozygosity in the overall population; Dst = absolute genetic differentiation between the subpopulations of the overall population; Dst� = the same as the statistic previ-ously mentioned but corrected for sample size; Ht� = the same but corrected by sample size; Gst = relative genetic differentiation between subpopulations in regard to the gene diversity found in the total population; Gst� = the same but corrected by sample size; Gis = analogous statistic to the Wright [1965] Fis statistic to measure the degree of average subpopulation deviation with regard to the genotype frequencies in HWE.
Table 5. Hierarchical Wright’s F statistics calculated by means of the procedure of Michalakis and Excoffier [1996] for all the Alouatta species studied herein
Fit Fst Fis R
LociAP40 1.000* –0.128 1.000*AP68 0.305* 0.221* 0.107AP74 0.508* 0.217* 0.372*D5S111 0.823* 0.341* 0.731*D5S117 0.419* 0.167* 0.302*D6S260 0.377* 0.216* 0.146*D8S165 0.207* 0.018 0.193*D14S51 0.828* 0.825* 0.014D17S804 0.483* 0.271* 0.290*
Jackknifing over loci 0.51580.088 0.25580.073 0.34880.089 0.33980.086Bootstrapping over loci
95% CI 0.37340.691 0.12940.413 0.21440.546 0.17940.50899% CI 0.33640.742 0.09640.474 0.18240.613 0.13540.580
R = Relationship coefficient; CI = confidence intervals. Asterisks indicate significant prob-abilities of F statistics with 10,000 randomizations; average F values obtained by jackknifing and bootstrapping.
Folia Primatol 2007;78:73–8782 Ruiz-Garcia /Escobar-Armel /Alvarez /Mudry /Ascunce /Gutierrez-Espeleta /Shostell
different from other South American Alouatta species ( A. seniculus , p = 0.0001; A. macconnelli , p = 0.0001; A. caraya , p = 0.045). There were no significant differences in heterogeneity among A. seniculus/A. caraya (p = 0.996), A. caraya/A. macconnelli (p = 0.946) and A. seniculus/A. macconnelli (p = 0.619), which emphasizes that the Central American species is the most divergent of the 4 Alouatta species studied, and the genetic relatedness among the 3 South American species is more pronounced.
Only 1 of the 4 Alouatta species studied, A. caraya , showed evidence of a recent bottleneck: for the infinite allele mutation model, the standardized differences test showed a positive significant bottleneck event (T 2 = 1.467, p = 0.041) for this species. The Wilcoxon test also showed significant bottleneck results for an infinite allele mutation model (p = 0.039) as well as for a stepwise mutation model (p = 0.0481). Moreover, the graphical analysis offered a shifted mode in the allele frequency dis-tribution, typical of a bottlenecked population for A. caraya . In contrast, for the other Alouatta species no evidence of a recent bottleneck was detected. Even for A. palliata (T 2 = –2.813, p = 0.00245) and A. seniculus (T 2 = –1.732, p = 0.041), the stan-dardized difference test, for the stepwise mutation model, showed significant evi-dences of gene flow or population expansion, that is evolutionary events contrary to a recent bottleneck. Although we detected no bottleneck evidence in A. macconnelli , its allele frequency distribution had a shifted mode, which may indicate a spurious result reflective of a small sample size.
Discussion
The DNA microsatellite results show that A. seniculus had the highest genetic diversity, measured as mean allele number per locus and expected heterozygosity, of the 4 Alouatta species studied. A. seniculus also had the largest distribution range. On the other hand, the 2 most peripheral populations studied, A. caraya and A. pal-liata , showed the lowest mean allele number per locus and the lowest expected het-erozygosity, respectively. The mean allele number per locus seemed to be more sen-sitive in the detection of significant differences among Alouatta species pairs than the expected heterozygosity. These reported differences were not significantly af-fected by sample size.
The gene diversity levels detected in Alouatta are higher than those detected using the same microsatellites and other markers in studies of other Neotropical pri-mates. For example, Ruiz-García et al. [in press] determined, for Ateles (H t = 0.67) and for Cebus (H t = 0.61), overall gene diversity levels lower than those detected for Alouatta (H t = 0.73–0.80). Ruiz-García [2005] estimated the gene diversity levels of 7 different Neotropical primate species with the same microsatellites applied in Alouatta . These values were as follows: Cebus albifrons , H = 0.452, Cebus apella , H = 0.378, Cebus capucinus , H = 0.239, Saimiri sciureus , H = 0.521, Aotus nancy-maae , H = 0.275, Ateles fusciceps , H = 0.415, and Lagothrix lagotricha , H = 0.538. The value obtained for A. seniculus (H = 0.638) was significantly higher than all these values with the exception of that of L. lagotricha . Even the lowest heterozygosity value found, that of A. palliata (H = 0.452), is higher than the values obtained for 2 species of Cebus and 1 species of Aotus . Other authors with different genetic markers have also identified high values of heterozygosity in diverse Alouatta species. Melo et al. [1992] reported a value of 0.061 after analyzing 50 Alouatta belzebul belzebul
Genetic Variability in Four Alouatta Species 83Folia Primatol 2007;78:73–87
using 18 isoenzymes and plasma proteins, which is a high value for a primate with these kinds of markers. Furthermore, isoenzyme results at the carbonic anhydrase II locus showed considerable heterozygosity levels in A. belzebul (H = 0.058) and in A. seniculus (H = 0.116) [Sampaio et al., 1991]. The mean heterozygosity values with-in Alouatta seniculus troops, surveyed in Venezuela, ranged from 0.057 to 0.135, whereas the mean heterozygosity in woodland populations was 0.106 and in gallery populations reached 0.089 based on 29 biochemical loci [Pope, 1992], which are very high values for a mammal with this type of marker, as is the average heterozygosity (H = 0.1) found by Sampaio et al. [1996] for Brazilian populations of A. seniculus by means of protein electrophoresis. Therefore, the high levels previously found with isoenzyme markers were validated using DNA microsatellites in Alouatta . Contrary to these results, Figueiredo et al. [1998] showed that the mitochondrial cytochrome oxidase II nucleotide sequences in A. seniculus have a very low variation although only 2 samples were identical. Of the 620 base pairs studied at the cytochrome oxi-dase II gene, 18 base pairs were variable sites, although 13 were apomorphic muta-tions, leaving only 5 informative sites. The genetic distances among the haplotypes determined by Figueiredo et al. [1998] in A. seniculus were very low (0–1.15%). The nuclear diversity seems very high for these South American Alouatta species (isoen-zymes and microsatellites), while their mitochondrial cytochrome oxidase II gene diversity is more restricted. This may indicate constrictive natural selection affect-ing this mitochondrial gene in A. seniculus .
It is remarkable that the Alouatta species studied with the lowest heterozygos-ity was A. palliata (Central American species) as it was previously determined with isoenzyme markers. Malgrem [1979] and Malgrem and Brush [1978] used 20 bio-chemical loci in 170 individuals captured in Costa Rica and calculated a heterozy-gosity value of only 0.01. Another Central American Alouatta species ( A. pigra in Belize), also showed a low heterozygosity value (0.021) [James et al., 1997]. In this study, 36 allozyme loci were used and only 5.6% of these loci were polymorphic. The same authors also reported extremely low mtDNA gene diversity levels in this Cen-tral American Alouatta species. These results agree quite well with 4 historical pop-ulation crashes in recent times (devastating hurricanes and yellow fever epidemic). The lowest heterozygosity level detected in A. palliata could be motivated by these facts. However, the differences in heterozygosity between Central and South Amer-ican Alouatta species were smaller when microsatellites, instead of isoenzymes (and blood groups), were used. Furthermore, microsatellite loci are conspicuously more polymorphic than the traditional biochemical loci. Therefore, they could be the tar-gets of population genetic studies on primate species, and their use could help reveal evolutionary events that modulate the genetic structure of Neotropical primate spe-cies. The lower heterozygosity level that we report for A. palliata supports the find-ings of Rylands et al. [1997] that this species is seriously threatened due to its limited distribution, forest destruction, hurricanes and epizootic epidemics. A. seniculus and A. caraya were among the few primates to receive a ‘safe’ (no longer threatened) status by Wolfheim [1983]. Our microsatellite gene diversity results for A. seniculus could support the quoted status, but they completely disagree in the case of A. ca-raya . We reported that A. caraya presented the lowest mean number of alleles per locus and there is also some evidence of a recent bottleneck. Our results agree with the low genetic distance estimates between the A. caraya cytochrome b haplotypes reported by Nascimento et al. [2005], which means that no abundant genetic hetero-
Folia Primatol 2007;78:73–8784 Ruiz-Garcia /Escobar-Armel /Alvarez /Mudry /Ascunce /Gutierrez-Espeleta /Shostell
geneity was presented in this species. Now that we have identified A. caraya as having low genetic diversity, the appropriate conservation methods should be applied in or-der to protect and improve its status.
The analysis of the HWE revealed that 2 of the 4 species studied were not in equilibrium, but were homozygous genotype excess. These species were A. palliata and A. seniculus (43 and 75%, respectively, of the markers not in HWE). Several pos-sible explanations for the heterozygous deficiencies [Rooney et al., 1999; Spong et al., 2000] are: population subdivision (Wahlund effect), strong genetic drift and endog-amy, hitchhiking, null alleles, synteny or natural selection in favor of homozygous genotypes. The most plausible explanation for our case is population subdivision. Strong gene drift and elevated consanguinity can be discarded since the genetic di-versity levels and the average number of alleles per locus were considerable. If gene drift was important, we would expect lower levels of gene diversity than those ob-tained herein. Hitchhiking and synteny were discarded since the loci studied were deliberately distributed in different chromosomes, and the possibility of all loci be-ing affected is remote. The same explanation could be used to discard natural selec-tion in favor of homozygosity. Null alleles also seem unlikely to produce high and similar levels of homozygous excess, simultaneously for all the loci studied. Perhaps an individual locus could be affected, but it is highly improbable that all the loci analyzed (9 microsatellites) present the same phenomenon simultaneously with sim-ilar magnitude in some species and not in others. Allelic dropout was highly improb-able because the PCR reactions were repeated 3 times for DNA extracted from hairs, teeth and bones to ratify the genotypes obtained from these tissues. Therefore, these deviations may suggest the existence of a Wahlund effect within these species. This seems probable in the case of A. palliata , because we analyzed several animals from previously assigned morphological and geographic subspecies ( A. p. palliata , A. p. mexicana , A. p. aequatorialis ), which emphasizes the existence of real molecu-lar differences among these A. palliata populations. In contrast, the samples of A. seniculus studied were all from Colombia, where only the subspecies A. seniculus se-niculus has been defined [Hernández-Camacho and Cooper, 1976]. We can affirm that there are highly diverse molecular gene pools of A. seniculus in Colombia, which are not recognized at the morphological level. This suggests that a new systematic revision of this species is required at the Colombian level. On the contrary, in the cases of A. caraya and A. macconnelli no significant deviations in favor of homozy-gous excess were detected. For the first species, we combined samples from Argen-tina and Bolivia, but this did not introduce homozygous excess by the Wahlund ef-fect. This revealed microsatellite allele frequencies that were similar among popula-tions of this species in different South American countries and were in contradiction to the findings of Nascimento et al. [2005].
The majority of the markers analyzed yielded significant heterogeneity between the 4 Alouatta species studied. The following microsatellites, AP68, AP74, D5S111, D5S117, D14S51 and D17S804, significantly discriminated among these species. It is remarkable that the species pair A. seniculus/A.caraya presented the lowest signifi-cant differences and that A. palliata presented the highest significant difference rel-ative to the 3 South American species, which agrees quite well with the findings of Cortés-Ortiz et al. [2003] using 3 mitochondrial genes.
The overall gene heterogeneity among the 4 species studied was significantly higher (G st = 0.189–0.259) than that determined for different species of Cebus (G st =

Genetic Variability in Four Alouatta Species 85Folia Primatol 2007;78:73–87
0.08–0.11) and different species of Ateles (G st = 0.105–0.123) with the same micro-satellite set. The R st results (0.545–0.696) were extremely high for Alouatta com-pared with Cebus (0.256–0.331) and Ateles (0.251). Therefore, the microsatellite mo-lecular evolution seems to be more rapid in Alouatta than in other Neotropical pri-mates, such as Cebus and Ateles . Note that the use of differences in the variance of the repeat numbers of the alleles (R st ) is more relevant in describing differences be-tween the Alouatta species than the allele frequencies (F st ).
A significant recent bottleneck was detected in only A. caraya . This result is rel-evant because traditionally this species has not been considered to be in a dangerous conservation position as was mentioned before. Another striking result was that a recent bottleneck was not detected in A. palliata although this species had the lowest level of gene diversity. In contrast, other authors have shown recent bottlenecks in several Central American howler species [Malgrem, 1979; James et al., 1997]. It is possible that we did not detect a recent bottleneck in this species because the DNA markers employed were extremely polymorphic prior to the demographic reduction. However, another explanation as to why no bottleneck was detected in A. palliata is probably better. As was mentioned previously, three different suspecies (A. p. pallia-ta, from Costa Rica; A. p. mexicana, from Mexico; and A. p. aequatorialis, from Co-lombia) were used in the analysis, therefore the A. palliata sample reflects a set which contains differentiated gene pools and this makes it difficult to detect recent bottle-necks using the Cornuet and Luikart [1996] procedure.
The analysis of the molecular microsatellite genetic structure within the Alou-atta genus is a powerful and straightforward method that is helpful in determining the evolution of these species and for presenting new insights into their genetic con-servation. Our laboratory is currently conducting similar studies with other Neo-tropical primate genera including Ateles , Lagothrix , Cebus , Saimiri , Aotus , Callice-bus and Saguinus .
Acknowledgments
The first author (M.R.G.) thanks the Dean of the Faculty of Sciences and the Academic Viceroy of the Pontificia Universidad Javeriana of Bogota, Colombia, for their financial sup-port. Thanks also go to the Instituto von Humboldt at Villa de Leyva for the use of their facili-ties and for providing the opportunity to remove skin samples from its howler monkey pelt collection for the extraction of DNA. Special thanks go to the ex-curator of the mammalogy collection, Miss. Yaneth Muñoz-Sabas, and the directors of the Instituto von Humboldt, Dr. Christian Samper and Dr. Fernando Gast. M.R.G. is indebted to many people throughout all Colombia, who provided hair or tissue samples (teeth, bone, skin) from howler monkeys main-tained in captivity or that had been hunted. Indeed, many thanks go to Luz Mercedes Borrero and Marcela Ramirez for providing samples of red howler monkeys from the Antioquia region, to Fernando Nassar for providing samples of red howler monkeys from La Guajira and to Dr. François Catzeflis, who provided 4 of the 7 DNA samples used of A. macconnelli from French Guiana. Similarly, many thanks go to Dr. Liliana Cortés-Ortiz (Xalapa, Mexico), who provided 2 DNA samples of A. palliata mexicana . This work is dedicated to the memory of Prof. José Ig-nacio ‘El Mono’ Hernández-Camacho, the real pioneer of primatology in Colombia, who died in 2001. May he rest in peace.

Folia Primatol 2007;78:73–8786 Ruiz-Garcia /Escobar-Armel /Alvarez /Mudry /Ascunce /Gutierrez-Espeleta /Shostell
References
Archie JW (1985). Statistical analysis of heterozygosity data: independent sample comparisons. Evolu-tion 39: 623–637.
Bruford MW, Wayne RK (1993). Microsatellites and their application to population genetics studies. Current Opinion in Genetics and Development 3: 939–943.
Bonvicino CR, Lemos B, Seuánez HN (2001). Molecular phylogenetics of howler monkeys (Alouatta, Platyrrhini). A comparison with karyotypic data. Chromosoma 110: 241–246.
Cornuet JM, Luikart G (1996). Description of power analysis of two tests for detecting recent popula-tion bottlenecks from allele frequency data. Genetics 144: 2001–2014.
Cortés-Ortiz L, Bermingham E, Rico C, Rodríguez-Luna E, Sampaio I, Ruiz-García M (2003). Molecu-lar systematics and biogeography of the Neotropical monkey genus, Alouatta . Molecular Phyloge-netics and Evolution 26: 64–81.
De Lima MMC, Seuánez HN (1991). Chromosome studies in the red howler monkey, Alouatta seniculus stramineus (Platyrrhini, Primates): description of an X 1 X 2 Y 1 Y 2 /X 1 X 1 X 2 X 2 sex-chromosome sys-tem and karyological comparisons with other subspecies. Cytogenetic and Genome Research 57: 151–156.
Ellesworth JA, Hoelzer GA (1998). Characterization of microsatellite loci in a New World primate, the mantled howler monkey ( Alouatta palliata ). Molecular Ecology 7: 657–658.
Figueiredo WB, Carvalho-Filho NM, Schneider H, Sampaio I (1998). Mitochondrial DNA sequences and the taxonomic status of Alouatta seniculus populations in Northeastern Amazonia. Neotrop-ical Primates 6: 73–77.
Goodman SJ (1997). R ST Calc: a collection of computer programs for calculating estimates of genetic differentiation from microsatellite data and determining their significances. Molecular Ecology 6: 881–885.
Goudet J, Raymond M, Demeeus T, Rousset F (1996). Testing differentiation in diploid populations. Genetics 144: 1933–1940.
Groves C (2001). Primate Taxonomy . Washington, Smithsonian Institution Press. Hernández-Camacho J, Cooper RW (1976). The nonhuman primates of Colombia. In Neotropical Pri-
mates: Field Studies and Conservation (Thorington RW, Heltheydes PG, eds.), pp 35–69. Wash-ington, National Academy of Sciences.
James RA, Leberg PL, Quattro JM, Vrijenhoek RC (1997). Genetic diversity in black howler monkeys (Alouatta pigra) . American Journal of Physical Anthropology 102: 329–336.
Luikart G, Allendorf F, Sherwin B, Cornuet JM (1998). Distortion of allele frequency distribution pro-vides a test for recent population bottleneck. Journal of Heredity 86: 319–322.
Malgrem LA (1979). Empirical Population Genetics of Golden Mantled Howling Monkeys Alouatta pal-liata in Relation to Population Structure, Social Dynamics and Evolution. PhD dissertation, Uni-versity of Connecticut, Storrs.
Malgrem LA, Brush AH (1978). Isoenzymes and plasma proteins in eight groups of golden mantled howling monkeys ( Allouatta palliata ). In Recent Advances in Primatology (Chivers DJ, Joysey KA, eds.), pp 283–285. New York, Academic Press.
Melo ACA, Sampaio MIC, Schneider MPC, Schneider H (1992). Biochemical diversity and genetic dis-tance in two species of the genus Saguinus . Primates 33: 217–225.
Michalakis Y, Excoffier L (1996). A generic estimation of population subdivision using distances be-tween alleles with special reference to microsatellite loci. Genetics 142: 1061–1064.
Nascimento FF, Bonvicino CR, da Silva FCD, Schneider MPC, Seuánez NH (2005). Cytochrome b poly-morphisms and population structure of two species of Alouatta (Primates: Alouattinae). Cytoge-netic and Genome Research 108: 78–86.
Nei M (1973). Analysis of gene diversity in subdivided populations. Proceedings of the National Acad-emy of Sciences of the USA 70: 3321–3323.
Pope T (1992). The influence of dispersal patterns and mating systems on genetic differentiation with-in and between populations of the red howler monkey ( Alouatta seniculus ). Evolution 46: 1112–1118.
Raymond M, Rousset F (1995). GENEPOP (version 1.2): population genetics software for exact tests and ecumenicism. Journal of Heredity 86: 248–249.
Rogers J, Witte SM, Sliffer MA (1995). Five new microsatellite DNA polymorphisms in squirrel monkey ( Saimiri boliviensis ). American Journal of Primatology 36: 151.
Rooney AP, Honeycutt RL, Davis SK, Derr JN (1999). Evaluating a putative bottleneck in a population of bowhead whales from patterns of microsatellite diversity and genetic disequilibria. Journal of Molecular Evolution 49: 682–690.
Rousset F (1997). Genetic differentiation and estimation of gene flow from F-statistics under isolation by distance. Genetics 145: 1219–1228.

Genetic Variability in Four Alouatta Species 87Folia Primatol 2007;78:73–87
Ruiz-García M (2005). The use of several microsatellite loci applied to 13 Neotropical primates revealed a strong recent bottleneck event in the woolly monkey ( Lagothrix lagotricha ) in Colombia. Pri-mate Report 71: 27–55.
Ruiz-Garcia M, Parra A, Romero-Alean N, Escobar-Armel P, Shostell J (in press). Genetic characteriza-tion and phylogenetic relationships between Ateles species (Atelidae, Primates) by means of DNA microsatellite markers and craniometric data. Primate Report .
Rylands AB, Rodríguez-Luna E, Cortés-Ortiz L (1997). Neotropical primate conservation – The species and the IUCN/SSC primate specialist group network. Primate Conservation 17: 46–69.
Rylands AB, Schneider H, Langguth A, Mittermeier RA, Groves CP, Rodríguez-Luna E (2000). An as-sessment of the diversity of New World primates. Neotropical Primates 8: 61–93.
Sambrook J, Fritsch EF, Maniatis T (1989). Molecular Cloning: A Laboratory Manual, 2nd ed. Cold Spring Harbor, Cold Spring Harbor Laboratory Press.
Sampaio MIC, Schneider MPC, Barroso CMI, Silva BTF, Schneider H, Encarnación F, Montoya E, Sal-zano FM (1991). Carbonic anhydrase II in New World monkeys. International Journal of Prima-tology 12: 389–402.
Sampaio I, Schneider MPC, Schneider H (1996). The taxonomy of the Alouatta seniculus group: bio-chemical and chromosome data. Primates 37: 67–75.
Slatkin M (1995). A measure of population subdivision based on microsatellite allele frequencies. Ge-netics 139: 457–462.
Spong G, Johansson M, Björklund M (2000). High genetic variation in leopards indicates large and long-term stable population size. Molecular Ecology 9: 1773–1782.
Walsh PS, Metzger DA, Higuchi R (1991). Chelex 100 as a medium for simple extraction of DNA for PCR-based typing from forensic material. Biotechniques 10: 506–513.
Weber JL, May PE (1989). Abundant class of human DNA polymorphisms which can be typed using the polymerase chain reaction. The American Journal of Human Genetics 44: 388–396.
Weir BS, Cockerham CC (1984). Estimating F-statistics for the analysis of population structure. Evolu-tion 38: 1358–1370.
Witte SM, Rogers J (1999). Microsatellite polymorphisms in Bolivian squirrel monkeys. American Jour-nal of Primatology 47: 75–84.
Wolfheim JH (1983). Primates of the New World: Distribution, Abundance and Conservation . Seattle, University of Washington Press.
Wright S (1951). The genetical structure of populations. Annals of Eugenics 15: 323–354.
Copyright © 2022 FDOKUMEN