Using Computational Intelligence to Identify Performance Bottlenecks in a Computer System
Genet. Res., Camb. (2001), 77, pp. 167–181. With 5 figures. Printed in the United Kingdom # 2001 Cambridge University Press 167
Effects of bottlenecks on quantitative genetic variation in
the butterfly Bicyclus anynana
ILIK J. SACCHERI" , $*, RICHARD A. NICHOLS# PAUL M. BRAKEFIELD"
"Research Group in E�olutionary Biology, Institute of E�olutionary and Ecological Sciences, Uni�ersity of Leiden, Kaiserstraat 63, PO Box9516, 2300 RA Leiden, The Netherlands#School of Biological Sciences, Queen Mary & Westfield College, Uni�ersity of London, Mile End Road, London E1 4NS, UK$Conser�ation Genetics Group, Institute of Zoology, The Zoological Society of London, Regent’s Park, London NW1 4RY, UK
(Recei�ed 19 No�ember 1997 and in re�ised form 7 August 2000)
Summary
The effects of a single population bottleneck of differing severity on heritability and additive
genetic variance was investigated experimentally using a butterfly. An outbred laboratory stock
was used to found replicate lines with one pair, three pairs and 10 pairs of adults, as well as
control lines with approximately 75 effective pairs. Heritability and additive genetic variance of
eight wing pattern characters and wing size were estimated using parent–offspring covariances in
the base population and in all daughter lines. Individual morphological characters and principal
components of the nine characters showed a consistent pattern of treatment effects in which
average heritability and additive genetic variance was lower in one pair and three pair lines than in
10 pair and control lines. Observed losses in heritability and additive genetic variance were
significantly greater than predicted by the neutral additive model when calculated with coefficients
of inbreeding estimated from demographic parameters alone. However, use of molecular markers
revealed substantially more inbreeding, generated by increased variance in family size and
background selection. Conservative interpretation of a statistical analysis incorporating this
previously undetected inbreeding led to the conclusion that the response to inbreeding of the
morphological traits studied showed no significant departure from the neutral additive model. This
result is consistent with the evidence for minimal directional dominance for these traits. In
contrast, egg hatching rate in the same experimental lines showed strong inbreeding depression,
increased phenotypic variance and rapid response to selection, highly indicative of an increase in
additive genetic variance due to dominance variance conversion.
1. Introduction
The role of population bottlenecks in adaptive
evolution rests crucially on how genetic drift and
inbreeding affect heritable variation of quantitative
characters (Lande, 1980). In a purely additive model,
with no selection, a bottleneck of Ne
individuals
reduces additive genetic variance VA
by a factor of
1}2Ne, lowering the ability of the population to
respond to selection (Wright, 1951 ; Falconer &
* Corresponding author. Present address : Population and Evol-utionary Biology Research Group, School of Biological Sciences,University of Liverpool, Nicholson Building, Brownlow Street,Liverpool L69 3GS, UK. Tel : 44 (0)151 7945116. Fax: 44(0)151 7945094. e-mail : saccheri!liverpool.ac.uk
Mackay, 1996). In reality, many polygenic characters
deviate from additivity to some degree (reviewed in
Moreno, 1994). In light of this, several theoretical
studies have found that, under certain model assump-
tions, inbreeding can lead to a net increase (or
!1}2Nereduction) in V
Athrough the ‘conversion’ of
non-additive genetic variance. This non-additive vari-
ance was hitherto unavailable to selection because it
was in the form of dominance variance (Robertson,
1952; Willis & Orr, 1993), epistatic variance (Good-
night, 1987, 1988; Cheverud & Routman, 1996;
Lo! pez-Fanjul et al., 1999) or both (Tachida &
Cockerham, 1989; Whitlock et al., 1993). However,
the validity of these models for a given trait is highly
dependent on its underlying genetic architecture (i.e.
I. J. Saccheri et al. 168
the relative magnitudes of additive, dominance and
epistatic variances, as well as the distribution of allelic
effects), which is, in general, unknown (Barton &
Turelli, 1989). Moreover, it is difficult to predict
whether selection will act unconditionally against the
novel genotypes produced by inbreeding, such that
any increase in VA
is counterbalanced by a reduction
in mean fitness, hence compromising its adaptive
value.
The endurance of the debate on the likelihood of
bottleneck-induced increases in VA
(e.g. Coyne et al.,
2000; Goodnight & Wade, 2000) stems from the
fundamental implications of such effects for founder
event speciation (e.g. Barton & Charlesworth, 1984;
Carson & Templeton, 1984; Barton, 1989; Carson,
1990; Templeton, 1996), Wright ’s shifting balance
(e.g. Wright, 1977; Whitlock, 1995) and the evol-
utionary consequences of metapopulation dynamics
(Lande, 1992; Harrison & Hastings, 1996). A fuller
understanding of the effect of drift on polygenic
variation is also of applied importance in the
conservation of biodiversity (Frankham, 1999).
The debate has been fuelled by the results of
laboratory experiments : some demonstrate close
concordance to the neutral additive model, while
others have found significant deviations from this
classical model. The most influential of these empirical
studies was that of Bryant et al. (1986), followed up in
Bryant & Meffert (1993), showing that VA
for some
morphological characters of Musca domestica can
increase substantially after bottlenecks. Bottleneck-
induced increases in VA
have also been shown for
sternopleural bristle number (Lints & Bourgois, 1984),
viability (Lo! pez-Fanjul & Villaverde, 1989; Garcı!a et
al., 1994) and courtship song (Ritchie & Kyriacou,
1994) in Drosophila melanogaster ; and for viability
(Ferna! ndez et al., 1995) and fitness (Ruano et al.,
1996; Wade et al., 1996) in Tribolium castaneum. In
contrast, some earlier experiments (Da Silva, 1961 ;
James, 1971 ; Frankham, 1980; Franklin, 1980) found
that bottlenecked lines of Drosophila exhibited a
reduced short-term response to artificial selection on
sternopleural or abdominal bristle number. Moreover,
for a bottleneck of one breeding pair, the magnitude
of the response was close to the expected three
quarters of the response of non-bottlenecked lines, in
all four experiments. More recently, Wade et al.
(1996) found that the reduction in the realized
heritability of pupal weight in differentially inbred
lines of T. castaneum was of the order predicted by the
neutral additive model. Similarly, Whitlock & Fowler
(1999), on the basis of a highly replicated isofemale
treatment, concluded that the change in VA
for D.
melanogaster wing size and shape was consistent with
neutral additive expectations.
In most of the cases presented above the observed
pattern of response to inbreeding can be accounted
for by variation in dominance variance for the traits
under study (Willis & Orr, 1993). Increases in VA
are
usually associated with characters showing inbreeding
depression (Bryant et al., 1986; Lo! pez-Fanjul &
Villaverde, 1989; Garcı!a et al., 1994; Ferna! ndez et al.,
1995; Ruano et al., 1996; Wade et al., 1996), implying
that dominance variance (as opposed to epistatic
variance) is the major contributor to the increase. In
contrast, studies which conform to the neutral additive
model measured either VA
of bristle number in
Drosophila (Da Silva, 1961 ; James, 1971 ; Frankham,
1980; Franklin, 1980), heritability of pupal weight in
T. castaneum (Wade et al., 1996) or VA
of wing size
and shape in D. melanogaster (Whitlock & Fowler,
1999). These characters show minimal inbreeding
depression (e.g. Latter & Robertson, 1962; Kidwell &
Kidwell, 1966; Goodwill, 1975), indicating no sub-
stantial directional dominance for these characters.
A notable exception to this trend is the absence of
any significant reduction in VA
for adult body weight
in mice inbred to an average coefficient of inbreeding
of 0±39 (Cheverud et al., 1999). Given the minimal
inbreeding depression for this trait, direct evidence for
epistasis (from QTL data) and high level of ex-
perimental replication this is the most convincing
example to date of inbreeding-induced epistatic to
additive variance conversion. Loss of VA
may also be
retarded by selection against homozygotes in com-
bination with linkage disequilibrium (see Latter et al.,
1995), as reported by Tantawy & Reeve (1956) who
found that VA
for wing size in D. melanogaster
showed no significant decline up to 50–60% in-
breeding and remained higher than expected up to
nearly 90% inbreeding.
The present experiment was conducted to inves-
tigate the effects of single generation bottlenecks
(founder events) of different size on quantitative
genetic variation of morphological characters – wing
size and pattern – in the satyrine butterfly Bicyclus
anynana (Butler). This butterfly has a wing pattern
which is both highly variable and easily measured.
Moreover, the wing pattern is known to be under
strong visual selection in relation to attacks by
vertebrate predators (Brakefield, 1997). Wing pattern
diversity is also a feature of the speciose genus
Bicyclus, consisting of about 80 species (Condamin,
1973). In nature, B. anynana populations are probably
more stable and also more spatially substructured
(Brakefield & Reitsma, 1991) than Musca or Droso-
phila populations, which are typically very large, yet
prone to crashes, partly as a result of more ephemeral
food resources and more rapid turnover of generations
(e.g. Sevenster & van Alphen, 1993). The influence of
demographic history and ecology on genetic archi-
tecture is complex (Roff, 2000), but is likely to have
implications for the response to bottlenecks (see
Saccheri et al., 1996).
Bottleneck effects on quantitati�e genetic �ariation in Bicyclus anynana 169
It is evident from the foregoing overview that, in
order to critically assess the influence of genetic
architecture on the response of VA
to bottlenecks, one
should ideally (pre)select a suite of traits which vary
substantially with respect to additive, dominance and
epistatic variances. For practical reasons it was not
possible to study the non-additive components of
variance directly, though the magnitude of directional
dominance was assessed. Furthermore, while the
change in VA
was measured for morphological traits
only, we also report on the likely genetic basis of the
selection response of a major component of fitness
(egg-larva viability) in the same experimental lines
(Saccheri et al., 1996).
The aim of this experiment was to provide results
which could be compared with previous empirical
studies, particularly those of Bryant et al. (1986), and
with the neutral additive model, using a novel model
organism. A specific strength of this study is that the
degree of inbreeding in the experimental lines was
estimated directly with molecular markers (Saccheri et
al., 1999), overcoming the difficulty of uncertain Ne
encountered by some other bottleneck experiments.
This paper describes the effects of the bottlenecks on
heritability and additive genetic variance within lines
for wing size and a series of wing pattern characters.
Given the paucity of empirical data on this important
issue, primarily on a few traits in four species (D.
melanogaster, M. domestica, T. castaneum and Mus
musculus), fresh data describing the response of very
different traits in an unrelated species are of substantial
interest for understanding the response of polygenic
traits to inbreeding.
2. Materials and methods
(i) Experimental populations
A laboratory population of B. anynana was established
from approximately 80 gravid females collected from
the wild at a single locality (Nkhata Bay) in Malawi in
August 1988. Prior to the experiment the stock was
maintained for about 20 generations at a population
size of 400–600 adults with some overlap of gener-
ations. High levels of allelic diversity and hetero-
zygosity detected by single-locus DNA fingerprinting
and allozyme electrophoresis (Saccheri et al., 1999)
suggest that the stock population at the start of the
experiment had not undergone any substantial bottle-
neck and that the husbandry technique was effective
in maintaining genetic variability.
Previous experimental results (e.g. Bryant et al.,
1986) and theoretical predictions suggest that the
largest changes in additive genetic variance are most
likely to occur for population bottleneck sizes (founder
events) of 20 or fewer individuals. Consequently,
daughter populations were derived from the base
population according to four treatments, differing in
the number of individuals used to start the ex-
perimental populations or lines. The founder numbers
used were two, six, 20 and c. 300 (control treatment),
replicated six times for the smallest bottleneck and
four times for the rest.
Husbandry techniques are detailed in Saccheri et al.
(1996). With the exception of the control lines (see
below), all lines were established from clutches of
known parentage in the following way. One hundred
and twenty-five clutches were collected over 7 days
from females isolated in copula. From those clutches
with more than 40 fertile eggs (representing 80% of all
fertile clutches and 57% of all clutches, including non-
fertile ones) the required number of clutches (i.e. one,
three or 10) were randomly chosen to found the
bottlenecked populations of one pair, three pairs and
10 pairs. These populations were then allowed to
freely increase in size to a maximum adult population
size of about 300, controlled by random culling of
larvae. Three generations elapsed before data were
collected (population sizes from P to F3 are given in
Saccheri et al., 1999).
It was impractical to establish control lines with
clutches obtained from mating pairs collected in
copula. However, to control for the small chance that
the procedure for choosing clutches to found bottle-
neck lines was biased with respect to genotype, two
types of control were used. Initially, four populations
each consisting of 150 virgin females and 150 virgin
males were established and random mating allowed
for 2 weeks. For two of these populations we collected
eggs from the entire population; these eggs were used
to found two control lines. For the remaining two
populations we collected clutches from all females
individually, but only used those clutches with more
than 40 fertile eggs (85 and 60 clutches from each
population respectively) to found the other two control
lines. In subsequent generations, all females were
given equal opportunity to lay eggs on potted maize
plants placed in the cages for a fixed period of time, all
control lines being maintained at an adult population
size of about 300. Clutches used to found the 10 pair
and control lines were culled randomly to keep larval
densities equivalent in all lines. No differences in
inbreeding were detected between the two types of
control (see Saccheri et al., 1999).
(ii) Morphological measurements
Butterflies to be measured were frozen and dissected
to separate the wings from the body, which was
required for molecular analysis (Saccheri et al., 1999).
Nine morphological characters were measured on the
ventral surface of the hind wing (Fig. 1) : the areas of
three concentric rings of colour constituting the fifth
and largest of the eyespots occuring in the distal part
of the wing (referred to as white area, black area and
I. J. Saccheri et al. 170
4
1
2
3
9
6, 7
5, 8
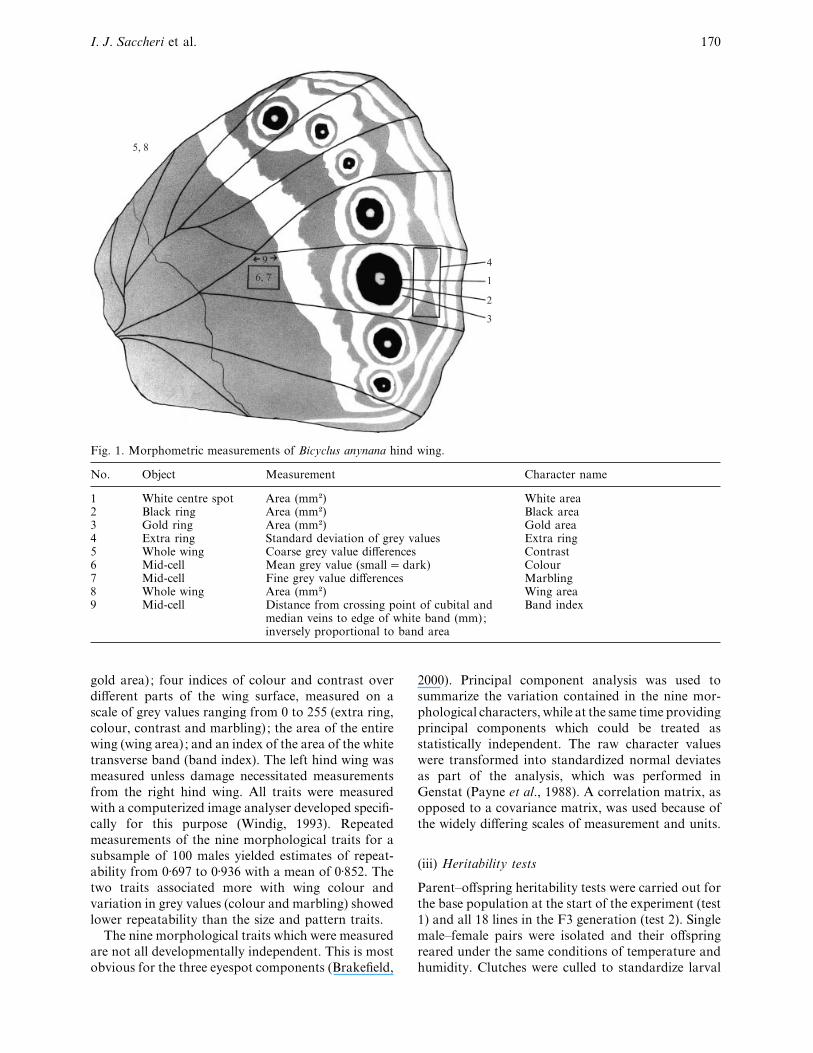
Fig. 1. Morphometric measurements of Bicyclus anynana hind wing.
No. Object Measurement Character name
1 White centre spot Area (mm#) White area2 Black ring Area (mm#) Black area3 Gold ring Area (mm#) Gold area4 Extra ring Standard deviation of grey values Extra ring5 Whole wing Coarse grey value differences Contrast6 Mid-cell Mean grey value (small¯dark) Colour7 Mid-cell Fine grey value differences Marbling8 Whole wing Area (mm#) Wing area9 Mid-cell Distance from crossing point of cubital and
median veins to edge of white band (mm);inversely proportional to band area
Band index
gold area) ; four indices of colour and contrast over
different parts of the wing surface, measured on a
scale of grey values ranging from 0 to 255 (extra ring,
colour, contrast and marbling) ; the area of the entire
wing (wing area) ; and an index of the area of the white
transverse band (band index). The left hind wing was
measured unless damage necessitated measurements
from the right hind wing. All traits were measured
with a computerized image analyser developed specifi-
cally for this purpose (Windig, 1993). Repeated
measurements of the nine morphological traits for a
subsample of 100 males yielded estimates of repeat-
ability from 0±697 to 0±936 with a mean of 0±852. The
two traits associated more with wing colour and
variation in grey values (colour and marbling) showed
lower repeatability than the size and pattern traits.
The nine morphological traits which were measured
are not all developmentally independent. This is most
obvious for the three eyespot components (Brakefield,
2000). Principal component analysis was used to
summarize the variation contained in the nine mor-
phological characters, while at the same time providing
principal components which could be treated as
statistically independent. The raw character values
were transformed into standardized normal deviates
as part of the analysis, which was performed in
Genstat (Payne et al., 1988). A correlation matrix, as
opposed to a covariance matrix, was used because of
the widely differing scales of measurement and units.
(iii) Heritability tests
Parent–offspring heritability tests were carried out for
the base population at the start of the experiment (test
1) and all 18 lines in the F3 generation (test 2). Single
male–female pairs were isolated and their offspring
reared under the same conditions of temperature and
humidity. Clutches were culled to standardize larval
Bottleneck effects on quantitati�e genetic �ariation in Bicyclus anynana 171
PC1 PC2
Control
Treatment 1
Treatment 2
Treatment 3
Midparent value
Off
spri
ng v
alue
(a)
(b)
(c)
Parents
Parents
Off
spri
ngO
ffsp
ring
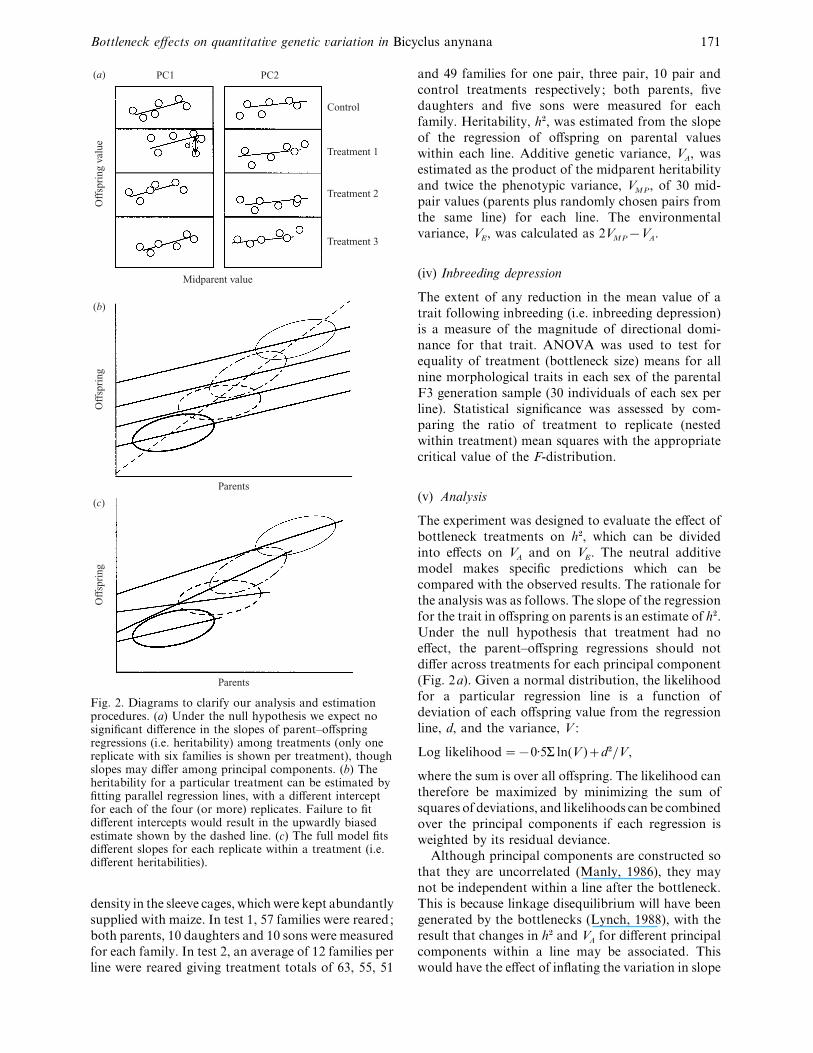
Fig. 2. Diagrams to clarify our analysis and estimationprocedures. (a) Under the null hypothesis we expect nosignificant difference in the slopes of parent–offspringregressions (i.e. heritability) among treatments (only onereplicate with six families is shown per treatment), thoughslopes may differ among principal components. (b) Theheritability for a particular treatment can be estimated byfitting parallel regression lines, with a different interceptfor each of the four (or more) replicates. Failure to fitdifferent intercepts would result in the upwardly biasedestimate shown by the dashed line. (c) The full model fitsdifferent slopes for each replicate within a treatment (i.e.different heritabilities).
density in the sleeve cages, which were kept abundantly
supplied with maize. In test 1, 57 families were reared;
both parents, 10 daughters and 10 sons were measured
for each family. In test 2, an average of 12 families per
line were reared giving treatment totals of 63, 55, 51
and 49 families for one pair, three pair, 10 pair and
control treatments respectively ; both parents, five
daughters and five sons were measured for each
family. Heritability, h#, was estimated from the slope
of the regression of offspring on parental values
within each line. Additive genetic variance, VA, was
estimated as the product of the midparent heritability
and twice the phenotypic variance, VMP
, of 30 mid-
pair values (parents plus randomly chosen pairs from
the same line) for each line. The environmental
variance, VE, was calculated as 2V
MP®V
A.
(iv) Inbreeding depression
The extent of any reduction in the mean value of a
trait following inbreeding (i.e. inbreeding depression)
is a measure of the magnitude of directional domi-
nance for that trait. ANOVA was used to test for
equality of treatment (bottleneck size) means for all
nine morphological traits in each sex of the parental
F3 generation sample (30 individuals of each sex per
line). Statistical significance was assessed by com-
paring the ratio of treatment to replicate (nested
within treatment) mean squares with the appropriate
critical value of the F-distribution.
(v) Analysis
The experiment was designed to evaluate the effect of
bottleneck treatments on h#, which can be divided
into effects on VA
and on VE. The neutral additive
model makes specific predictions which can be
compared with the observed results. The rationale for
the analysis was as follows. The slope of the regression
for the trait in offspring on parents is an estimate of h#.
Under the null hypothesis that treatment had no
effect, the parent–offspring regressions should not
differ across treatments for each principal component
(Fig. 2a). Given a normal distribution, the likelihood
for a particular regression line is a function of
deviation of each offspring value from the regression
line, d, and the variance, V :
Log likelihood¯®0±5Σ ln(V )d#}V,
where the sum is over all offspring. The likelihood can
therefore be maximized by minimizing the sum of
squares of deviations, and likelihoods can be combined
over the principal components if each regression is
weighted by its residual deviance.
Although principal components are constructed so
that they are uncorrelated (Manly, 1986), they may
not be independent within a line after the bottleneck.
This is because linkage disequilibrium will have been
generated by the bottlenecks (Lynch, 1988), with the
result that changes in h# and VA
for different principal
components within a line may be associated. This
would have the effect of inflating the variation in slope
I. J. Saccheri et al. 172
Table 1. Estimates of the coefficient of inbreeding at F3, used to
calculate the expected heritability and additi�e genetic �ariance for each
bottleneck size, according to three series of estimates (see text)
Bottleneck size E(null) E(demographic) E(molecular)
One pair 0 0±27 0±32Three pairs 0 0±10 0±12Ten pairs 0 0±03 0±07Control 0 0±01 0±02
between replicates (measured by the Expectation¬bottleneck size¬replicate term in Tables 4–6) and
reducing it between principal components (pc) of the
same replicate (Expectation¬replicate¬pc). In fact
the mean squares for these two terms were very
similar, but it might be considered prudent to interpret
the data using the former term as the denominator in
F-tests. Correlated changes for different principal
components within lines may also reflect variation in
inbreeding among replicate lines within treatments,
but the precision of our estimates for h# is insufficient
to study the behaviour of individual replicates.
Each treatment (bottleneck size) slope (heritability)
was estimated by fitting a common slope to all
replicate lines of the treatment, while allowing for
different intercepts for each replicate. In effect, this
procedure fitted a set of parallel straight lines (four or
six per treatment) through the data (Fig. 2b). This
estimation procedure is preferable to taking the mean
slope because the precision of the estimates differs
between replicates. Fitting parallel lines takes this into
account automatically. Notice that this approach is
not equivalent to pooling the data across replicates,
which would lead to upwardly biased h# estimates due
to differentiation among replicate line means (Fig.
2b).
A test for deviation from parallel regression lines
(Fig. 2a) was conducted by fitting a different slope to
each treatment and testing for a significant improve-
ment in fit (Expectation¬bottleneck size in Tables
4–6). Any improvement in fit produced by allowing a
different slope for each replicate (Fig. 2c) quantifies
the different response of the replicates of each
treatment (Expectation¬bottleneck size¬replicate in
Tables 4–6). Terms were also introduced to quantify
the different response of principal components within
replicates (Expectation¬replicate¬pc in Tables 4–6).
A more stringent null hypothesis is that the ratio of
slopes for each principal component is predicted by
the neutral additive model and the effective population
size Neof each bottleneck. In that case the regressions
were transformed to be parallel using the procedure
described below. Deviation from the null expectation
was tested in the same way by fitting a separate slope
for each treatment, and again information was
combined across principal components by weighting
each regression by its residual deviance.
If one assumes that the morphological characters
have no non-additive variance, as is reasonable based
on our observations implying small dominance vari-
ance, and that environmental variance is unaffected
by inbreeding, the expected heritability after inbreed-
ing is given by
E(h#t)¯
h#
!(1®F
t)
(1®h#
!Ft)
where E(h#t) and F
tare the heritability and inbreeding
coefficient at time t, and h#
!is the original heritability
in the base population (Falconer & Mackay, 1996).
For the analysis of heritability, the expected deviation
of offspring values from the mean was calculated as
(midparent value–line mean)[E(h#t),
for each principal component. E(h#t) is the ratio of the
expected additive variance, E(VA), and the expected
midparental phenotypic variance, E(VMP
). A second
approach attempted to account for differences in
environmental variance between replicates in order to
focus on the response of VA. In this analysis the
expected deviation of offspring values from the mean
was calculated as
(midparent value–line mean)[E(h#t)[
E(VMP
)
VMP
,
where E(VMP
)¯VA!
(1®Ft)V
E!, V
E!being the ad-
ditive and environmental variances in the base
population, respectively. The observed heritabilities
and phenotypic variances for the base population
were not substantially different from the control
averages, but as the base population was reared under
slightly different conditions, the control estimates
were used for h#
!and V
MP!.
Three different expectations, referred to as E(null),
E(demographic) and E(molecular), were specified by
different estimates of Ft
for each bottleneck size
(Table 1). E(null) is equivalent to the null hypothesis
that the bottlenecks have no effect ; E(demographic)
are the null expectations from the calculation that
Bottleneck effects on quantitati�e genetic �ariation in Bicyclus anynana 173
includes inbreeding due to observed population sizes
and variances in family size in the F1 and F2 (see
Saccheri et al., 1996) ; and E(molecular) uses the
estimates obtained from the analysis of allozyme and
minisatellite data (Saccheri et al., 1999). The control
data were included in each analysis, with Ftset to zero.
The estimated slope for control values against their
expectation need not be zero. This scheme allowed for
error in the estimation of h#
!and V
MP!which could
otherwise lead to a systematic deviation from expecta-
tions across all the treatments.
3. Results
(i) Principal component analysis
Plots of the cumulative frequency distribution of each
character against the cumulative normal were linear,
Table 2. Principal component character loadings
Character loadings
Principal component
1 2 3 4 5 6
White area ®0±445 ®0.198 ®0±035 0±044 0±358 ®0±225Black area ®0±437 ®0±298 0±097 0±098 0±281 ®0±064Gold area ®0±480 ®0±213 0±056 0±123 0±086 0±188Extra ring ®0±374 0±340 ®0±323 ®0±400 ®0.136 ®0±110Contrast ®0±428 0±227 ®0±043 ®0±312 ®0±475 0±090Colour ®0±148 0±507 0±371 0±198 0±222 0±664Marbling ®0±107 0±507 0±387 0±335 ®0±013 ®0±664Wing area ®0±107 ®0±375 0±507 0±134 ®0±642 0±033Band index 0±111 ®0±069 0±580 ®0±739 0±284 ®0±087
Eigenvalue (%) 32 21 13 10 10 5
The eigenvalues (as percentages) and eigenvectors of the correlation matrix for the nine wing characters measured in B.anynana. The first six principal components are shown; the largest loadings for each principal component are underlined.Note that band index is inversely proportional to band area.
Table 3. Analysis of co�ariance from the GLM of offspring �alues with the midparental �alues as the
explanatory �ariate (control only)
Source of variation d.f. s.s. m.s. v.r. Pa
Offspring sex¬replicateb¬pc 47 281±055 5±980 7±67 *Tryc parent sex¬offspring sex 4 428±032 107±008 137±33 ***Midparent 1 425±013 425±013 545±45 ***Midparent¬pc 5 15±358 3±072 3±94 nsMidparent¬replicate 3 2±761 0±920 1±18 nsMidparent¬replicate¬pc 15 55±394 3±693 4±74 nsReplicate¬pc¬family 246 757±457 3±079 3±95 *Residual 2574 2005±671 0±779
Total 2891 3542±708 1±225
* 0±01!P% 0±05; ** 0±001!P% 0±01 ; ***P% 0±001 ; ns, non-significant.a Levels of significance are calculated in relation to the m.s. for replicate¬pc¬family as the denominator (with the exceptionof the P value for replicate¬pc¬family, where the residual m.s. is the denominator). P value for offspring sex¬replicate¬pcrefers to the separate effects of replicate and pc, which were the only factors in this group that differed significantly in theirmeans.b Replicate stands for replicate within treatment.c Try is an option in generalized linear modelling which adds terms then drops them.
indicating that the characters are normally distributed.
A principal component analysis was carried out on all
the test 2 offspring (1042 females and 985 males), these
being in a better preserved state than the parent
generation sample (Table 2). The first three principal
components can each be interpreted in a straight-
forward way: PC1 (which explains 31% of the total
variation) is essentially an index of eyespot size, large
eyespots being associated with high values of extra
ring and contrast ; PC2 (21%) is essentially an index
of darkness and grain in the mid-cell ; and PC3 (13%)
contrasts wing area and band area. PC4, PC5 and
PC6 are more difficult to interpret, but are consistent
with other data sets and each explains between 5%
and 10% of the total variation.
I. J. Saccheri et al. 174
0.8
0.7
0.6
0.5
0.4
0.3
0.2
0.1
1.0
0.9
0.8
0.7
0.6
0.5
0.4
0.3
0.2
0.7
0.6
0.5
0.4
0.3
0.2
0.1
0.7
0.6
0.5
0.4
0.3
0.2
0.8
0.7
0.6
0.5
0.4
0.3
0.2
0.1
0.6
0.5
0.4
0.3
0.2
0.1
0.7
0.6
0.5
0.4
0.3
0.2
0.1
0.7
0.6
0.5
0.4
0.3
0.2
0.9
0.0
0.0
0.0 0.1 0.2 0.30.0 0.1 0.2 0.3
Coefficient of inbreeding
Extra ring Band index
Wing areaGold area
Black area Colour
ContrastWhite areaH
erit
abil
ity
0.0 0.1 0.2 0.30.0 0.1 0.2 0.3
0.0 0.1 0.2 0.30.0 0.1 0.2 0.3
0.0 0.1 0.2 0.30.0 0.1 0.2 0.3
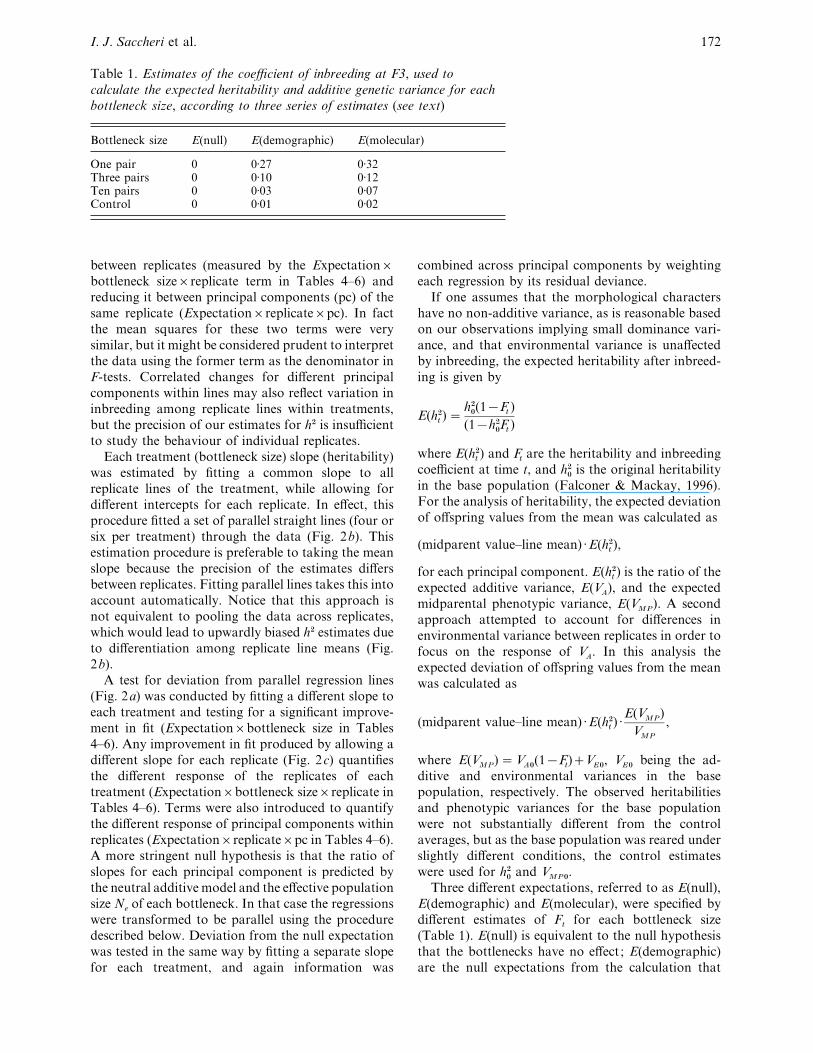
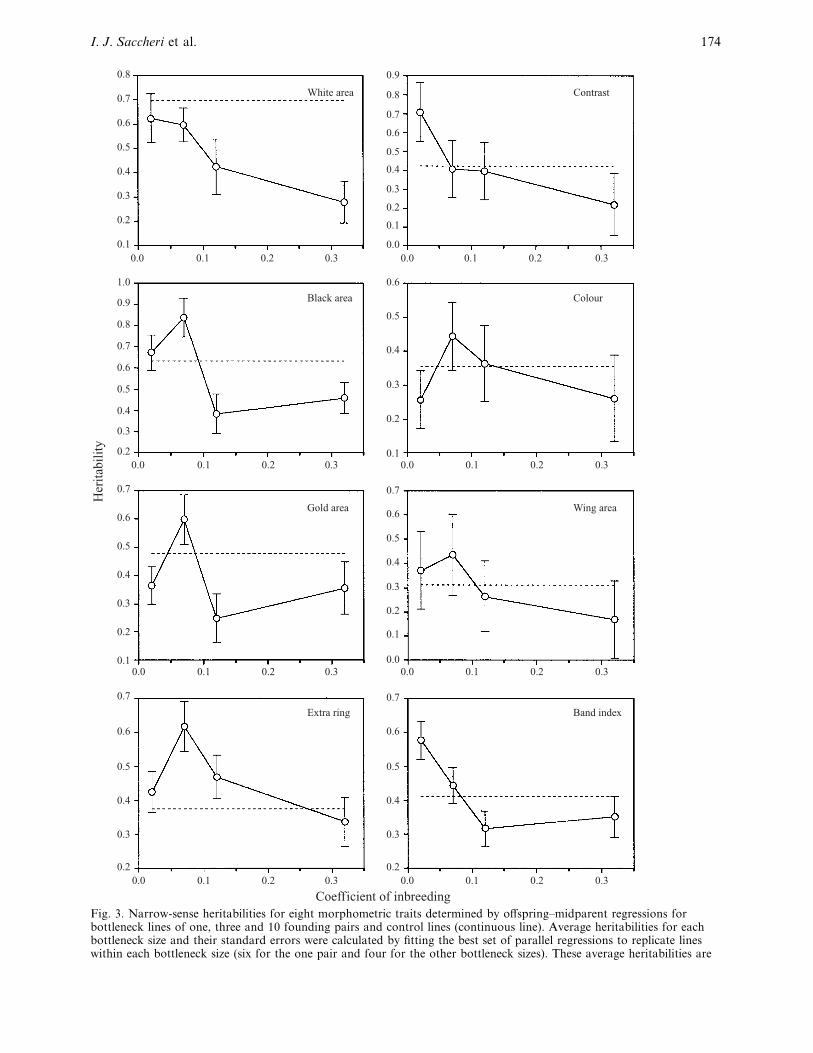
Fig. 3. Narrow-sense heritabilities for eight morphometric traits determined by offspring–midparent regressions forbottleneck lines of one, three and 10 founding pairs and control lines (continuous line). Average heritabilities for eachbottleneck size and their standard errors were calculated by fitting the best set of parallel regressions to replicate lineswithin each bottleneck size (six for the one pair and four for the other bottleneck sizes). These average heritabilities are
Bottleneck effects on quantitati�e genetic �ariation in Bicyclus anynana 175
(ii) Inbreeding depression
There was no detectable inbreeding depression for any
of the morphological traits and, by extension, for the
principal components. The one significant result (P¯0±04) was for male wing area. However, the pattern of
line and treatment means shows that this result, which
is primarily due to two low three pair lines, cannot be
accounted for by inbreeding depression. Such a lack
of evidence for directional dominance also suggests
little dominance variance in general for these traits.
(iii) Heritability, additi�e genetic �ariance and
en�ironmental �ariance
An initial exploratory analysis of principal component
heritabilities was performed on the four control lines
(Table 3). There was a significant common family
effect (replicate¬pc¬family), so mean squares of
previous terms were compared with the ‘family ’ mean
square to assess their level of statistical significance.
Separate intercepts were first fitted for sons and
daughters (offspring sex), replicate lines and each of
the six principal components. Only replicates and
principal components differed significantly in mean
(remembering that female and male values were
standardized), as might be expected due to environ-
mental variance between cages and the differing
character composition of principal components. The
pooled sums of squares obtained by fitting a different
slope for each parent sex and their interaction with
each offspring sex is not significantly larger than the
sum of squares for the regression of all offspring on
midparent values. This result indicates that h# do not
differ significantly between parent or offspring sex and
validates the use of midparent h# in subsequent
analyses. Somewhat surprisingly, principal compo-
nents do not appear to differ significantly with respect
to their h# (midparent¬pc). There were no significant
differences in h# among the four replicates (mid-
parent¬replicate), or any significant interaction be-
tween replicates and principal components with
respect to h# (midparent¬replicate¬pc).
Character heritabilities are not independent and
cannot therefore be combined directly, but are shown
to illustrate the results in their simplest form (Fig. 3).
In general, there is a clear tendency for the one pair
and three pairs bottleneck size lines to have lower h#
than the 10 pairs and control bottleneck lines. The
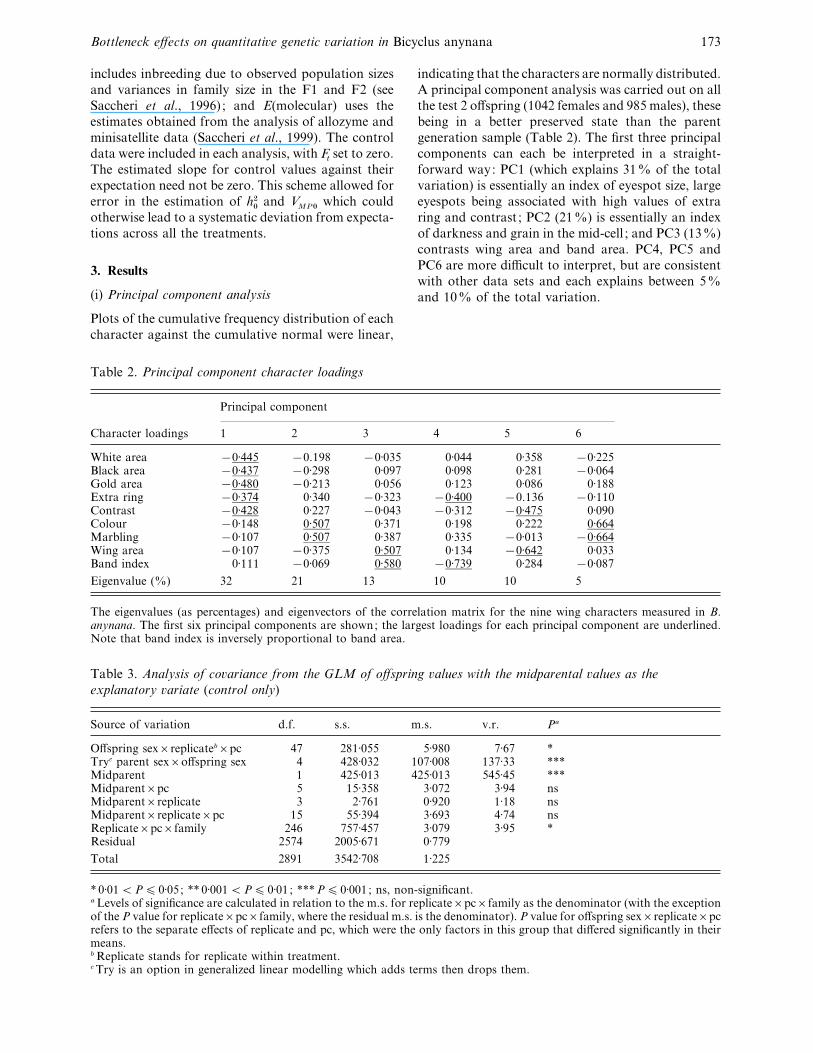
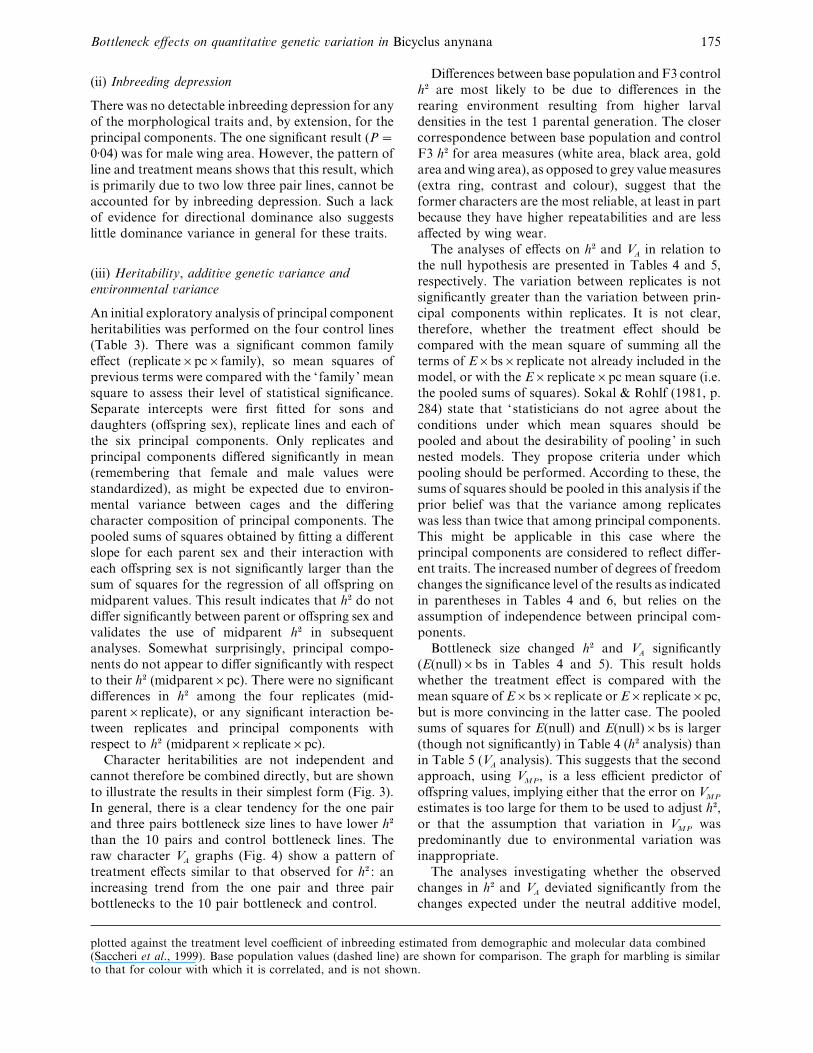
raw character VA
graphs (Fig. 4) show a pattern of
treatment effects similar to that observed for h# : an
increasing trend from the one pair and three pair
bottlenecks to the 10 pair bottleneck and control.
plotted against the treatment level coefficient of inbreeding estimated from demographic and molecular data combined(Saccheri et al., 1999). Base population values (dashed line) are shown for comparison. The graph for marbling is similarto that for colour with which it is correlated, and is not shown.
Differences between base population and F3 control
h# are most likely to be due to differences in the
rearing environment resulting from higher larval
densities in the test 1 parental generation. The closer
correspondence between base population and control
F3 h# for area measures (white area, black area, gold
area and wing area), as opposed to grey value measures
(extra ring, contrast and colour), suggest that the
former characters are the most reliable, at least in part
because they have higher repeatabilities and are less
affected by wing wear.
The analyses of effects on h# and VA
in relation to
the null hypothesis are presented in Tables 4 and 5,
respectively. The variation between replicates is not
significantly greater than the variation between prin-
cipal components within replicates. It is not clear,
therefore, whether the treatment effect should be
compared with the mean square of summing all the
terms of E¬bs¬replicate not already included in the
model, or with the E¬replicate¬pc mean square (i.e.
the pooled sums of squares). Sokal & Rohlf (1981, p.
284) state that ‘statisticians do not agree about the
conditions under which mean squares should be
pooled and about the desirability of pooling’ in such
nested models. They propose criteria under which
pooling should be performed. According to these, the
sums of squares should be pooled in this analysis if the
prior belief was that the variance among replicates
was less than twice that among principal components.
This might be applicable in this case where the
principal components are considered to reflect differ-
ent traits. The increased number of degrees of freedom
changes the significance level of the results as indicated
in parentheses in Tables 4 and 6, but relies on the
assumption of independence between principal com-
ponents.
Bottleneck size changed h# and VA
significantly
(E(null)¬bs in Tables 4 and 5). This result holds
whether the treatment effect is compared with the
mean square of E¬bs¬replicate or E¬replicate¬pc,
but is more convincing in the latter case. The pooled
sums of squares for E(null) and E(null)¬bs is larger
(though not significantly) in Table 4 (h# analysis) than
in Table 5 (VA
analysis). This suggests that the second
approach, using VMP
, is a less efficient predictor of
offspring values, implying either that the error on VMP
estimates is too large for them to be used to adjust h#,
or that the assumption that variation in VMP
was
predominantly due to environmental variation was
inappropriate.
The analyses investigating whether the observed
changes in h# and VA
deviated significantly from the
changes expected under the neutral additive model,
I. J. Saccheri et al. 176
0.0009
0.19
0.12
20
18
16
14
12
8
4.0
3.5
3.0
2.5
2.0
1.5
1.0
55
45
40
35
30
25
90
80
70
60
50
40
30
0.014
4.5
0.5
20
0.0 0.1 0.2 0.30.0 0.1 0.2 0.3
Coefficient of inbreeding
Extra ring Band index
Wing areaGold area
Black area Colour
ContrastWhite areaA
ddit
ive
gene
tic
vari
ance
0.0 0.1 0.2 0.30.0 0.1 0.2 0.3
0.0 0.1 0.2 0.30.0 0.1 0.2 0.3
0.0 0.1 0.2 0.30.0 0.1 0.2 0.3
0.0008
0.0007
0.0006
0.0005
0.0004
0.0003
0.0002
0.0001
0.17
0.15
0.13
0.11
0.09
0.07
0.11
0.10
0.09
0.08
0.07
0.06
0.05
0.04
10
6
0.013
0.012
0.011
0.010
0.009
0.008
0.007
50
Fig. 4. Additive genetic variances for eight morphometric traits averaged across replicate lines within each bottlenecksize, plotted against the treatment level coefficient of inbreeding.
Bottleneck effects on quantitati�e genetic �ariation in Bicyclus anynana 177
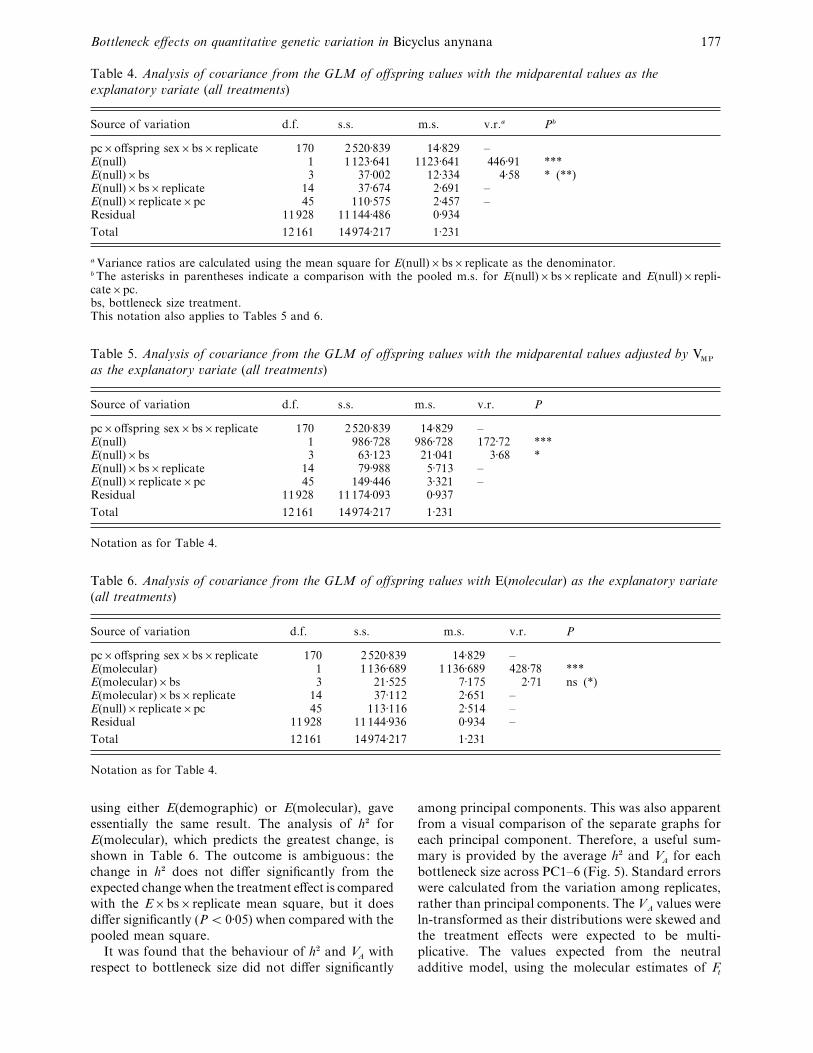
Table 4. Analysis of co�ariance from the GLM of offspring �alues with the midparental �alues as the
explanatory �ariate (all treatments)
Source of variation d.f. s.s. m.s. v.r.a Pb
pc¬offspring sex¬bs¬replicate 170 2520±839 14±829 –E(null) 1 1123±641 1123±641 446±91 ***E(null)¬bs 3 37±002 12±334 4±58 * (**)E(null)¬bs¬replicate 14 37±674 2±691 –E(null)¬replicate¬pc 45 110±575 2±457 –Residual 11928 11144±486 0±934
Total 12161 14974±217 1±231
a Variance ratios are calculated using the mean square for E(null)¬bs¬replicate as the denominator.b The asterisks in parentheses indicate a comparison with the pooled m.s. for E(null)¬bs¬replicate and E(null)¬repli-cate¬pc.bs, bottleneck size treatment.This notation also applies to Tables 5 and 6.
Table 5. Analysis of co�ariance from the GLM of offspring �alues with the midparental �alues adjusted by VMP
as the explanatory �ariate (all treatments)
Source of variation d.f. s.s. m.s. v.r. P
pc¬offspring sex¬bs¬replicate 170 2520±839 14±829 –E(null) 1 986±728 986±728 172±72 ***E(null)¬bs 3 63±123 21±041 3±68 *E(null)¬bs¬replicate 14 79±988 5±713 –E(null)¬replicate¬pc 45 149±446 3±321 –Residual 11928 11174±093 0±937
Total 12161 14974±217 1±231
Notation as for Table 4.
Table 6. Analysis of co�ariance from the GLM of offspring �alues with E(molecular) as the explanatory �ariate
(all treatments)
Source of variation d.f. s.s. m.s. v.r. P
pc¬offspring sex¬bs¬replicate 170 2520±839 14±829 –E(molecular) 1 1136±689 1136±689 428±78 ***E(molecular)¬bs 3 21±525 7±175 2±71 ns (*)E(molecular)¬bs¬replicate 14 37±112 2±651 –E(null)¬replicate¬pc 45 113±116 2±514 –Residual 11928 11144±936 0±934 –
Total 12161 14974±217 1±231
Notation as for Table 4.
using either E(demographic) or E(molecular), gave
essentially the same result. The analysis of h# for
E(molecular), which predicts the greatest change, is
shown in Table 6. The outcome is ambiguous: the
change in h# does not differ significantly from the
expected change when the treatment effect is compared
with the E¬bs¬replicate mean square, but it does
differ significantly (P! 0±05) when compared with the
pooled mean square.
It was found that the behaviour of h# and VA
with
respect to bottleneck size did not differ significantly
among principal components. This was also apparent
from a visual comparison of the separate graphs for
each principal component. Therefore, a useful sum-
mary is provided by the average h# and VA
for each
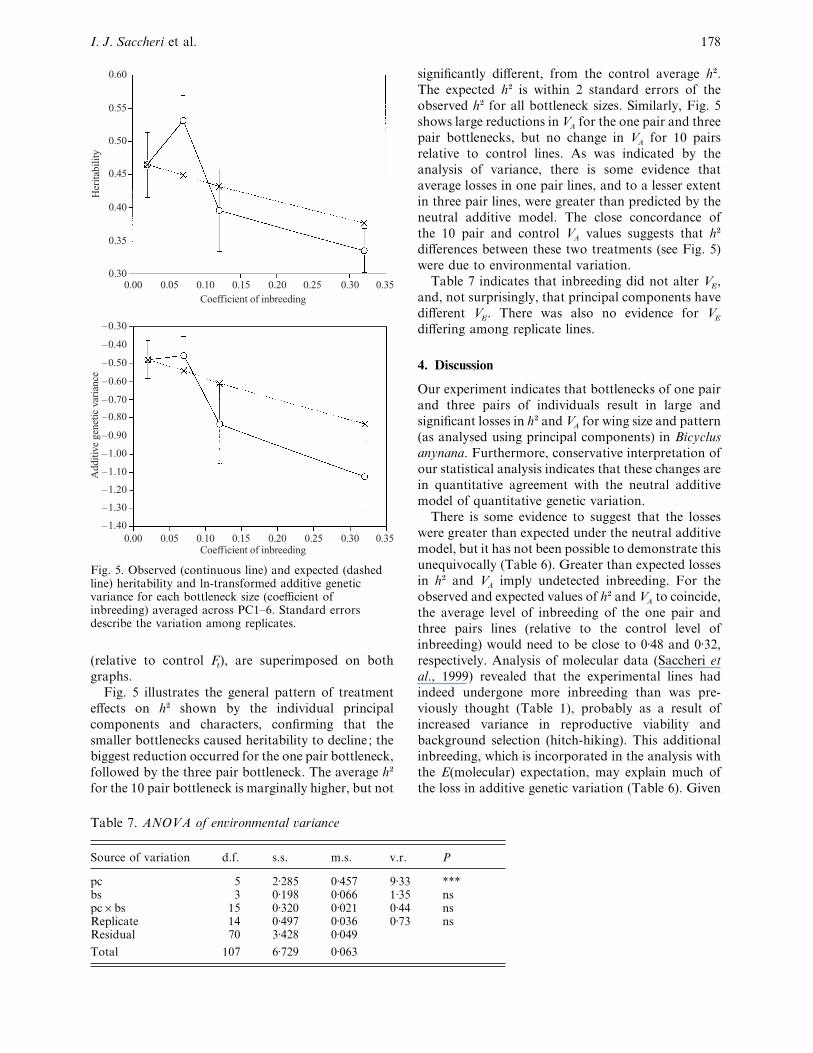
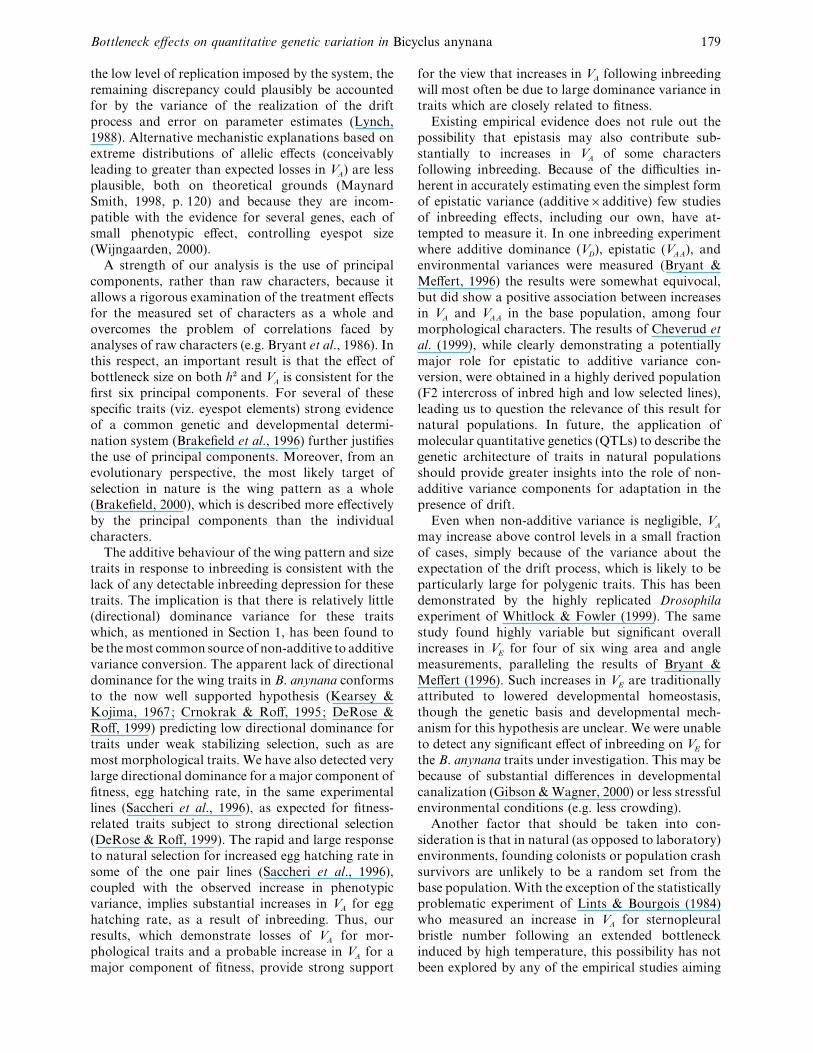
bottleneck size across PC1–6 (Fig. 5). Standard errors
were calculated from the variation among replicates,
rather than principal components. The VA
values were
ln-transformed as their distributions were skewed and
the treatment effects were expected to be multi-
plicative. The values expected from the neutral
additive model, using the molecular estimates of Ft
I. J. Saccheri et al. 178
0.60
0.55
0.50
0.45
0.40
0.35
0.30
–0.30
–0.40
–0.50
–0.60
–0.70
–0.80
–0.90
–1.00
–1.10
–1.20
–1.30
–1.400.00 0.05 0.10 0.15 0.20 0.25 0.30 0.35
0.00 0.05 0.10 0.15 0.20 0.25 0.30 0.35Coefficient of inbreeding
Coefficient of inbreeding
Add
itive
gen
etic
var
ianc
eH
erita
bilit
y
Fig. 5. Observed (continuous line) and expected (dashedline) heritability and ln-transformed additive geneticvariance for each bottleneck size (coefficient ofinbreeding) averaged across PC1–6. Standard errorsdescribe the variation among replicates.
(relative to control Ft), are superimposed on both
graphs.
Fig. 5 illustrates the general pattern of treatment
effects on h# shown by the individual principal
components and characters, confirming that the
smaller bottlenecks caused heritability to decline; the
biggest reduction occurred for the one pair bottleneck,
followed by the three pair bottleneck. The average h#
for the 10 pair bottleneck is marginally higher, but not
Table 7. ANOVA of en�ironmental �ariance
Source of variation d.f. s.s. m.s. v.r. P
pc 5 2±285 0±457 9±33 ***bs 3 0±198 0±066 1±35 nspc¬bs 15 0±320 0±021 0±44 nsReplicate 14 0±497 0±036 0±73 nsResidual 70 3±428 0±049
Total 107 6±729 0±063
significantly different, from the control average h#.
The expected h# is within 2 standard errors of the
observed h# for all bottleneck sizes. Similarly, Fig. 5
shows large reductions in VA
for the one pair and three
pair bottlenecks, but no change in VA
for 10 pairs
relative to control lines. As was indicated by the
analysis of variance, there is some evidence that
average losses in one pair lines, and to a lesser extent
in three pair lines, were greater than predicted by the
neutral additive model. The close concordance of
the 10 pair and control VA
values suggests that h#
differences between these two treatments (see Fig. 5)
were due to environmental variation.
Table 7 indicates that inbreeding did not alter VE,
and, not surprisingly, that principal components have
different VE. There was also no evidence for V
E
differing among replicate lines.
4. Discussion
Our experiment indicates that bottlenecks of one pair
and three pairs of individuals result in large and
significant losses in h# and VA
for wing size and pattern
(as analysed using principal components) in Bicyclus
anynana. Furthermore, conservative interpretation of
our statistical analysis indicates that these changes are
in quantitative agreement with the neutral additive
model of quantitative genetic variation.
There is some evidence to suggest that the losses
were greater than expected under the neutral additive
model, but it has not been possible to demonstrate this
unequivocally (Table 6). Greater than expected losses
in h# and VA
imply undetected inbreeding. For the
observed and expected values of h# and VA
to coincide,
the average level of inbreeding of the one pair and
three pairs lines (relative to the control level of
inbreeding) would need to be close to 0±48 and 0±32,
respectively. Analysis of molecular data (Saccheri et
al., 1999) revealed that the experimental lines had
indeed undergone more inbreeding than was pre-
viously thought (Table 1), probably as a result of
increased variance in reproductive viability and
background selection (hitch-hiking). This additional
inbreeding, which is incorporated in the analysis with
the E(molecular) expectation, may explain much of
the loss in additive genetic variation (Table 6). Given
Bottleneck effects on quantitati�e genetic �ariation in Bicyclus anynana 179
the low level of replication imposed by the system, the
remaining discrepancy could plausibly be accounted
for by the variance of the realization of the drift
process and error on parameter estimates (Lynch,
1988). Alternative mechanistic explanations based on
extreme distributions of allelic effects (conceivably
leading to greater than expected losses in VA) are less
plausible, both on theoretical grounds (Maynard
Smith, 1998, p. 120) and because they are incom-
patible with the evidence for several genes, each of
small phenotypic effect, controlling eyespot size
(Wijngaarden, 2000).
A strength of our analysis is the use of principal
components, rather than raw characters, because it
allows a rigorous examination of the treatment effects
for the measured set of characters as a whole and
overcomes the problem of correlations faced by
analyses of raw characters (e.g. Bryant et al., 1986). In
this respect, an important result is that the effect of
bottleneck size on both h# and VA
is consistent for the
first six principal components. For several of these
specific traits (viz. eyespot elements) strong evidence
of a common genetic and developmental determi-
nation system (Brakefield et al., 1996) further justifies
the use of principal components. Moreover, from an
evolutionary perspective, the most likely target of
selection in nature is the wing pattern as a whole
(Brakefield, 2000), which is described more effectively
by the principal components than the individual
characters.
The additive behaviour of the wing pattern and size
traits in response to inbreeding is consistent with the
lack of any detectable inbreeding depression for these
traits. The implication is that there is relatively little
(directional) dominance variance for these traits
which, as mentioned in Section 1, has been found to
be the most common source of non-additive to additive
variance conversion. The apparent lack of directional
dominance for the wing traits in B. anynana conforms
to the now well supported hypothesis (Kearsey &
Kojima, 1967; Crnokrak & Roff, 1995; DeRose &
Roff, 1999) predicting low directional dominance for
traits under weak stabilizing selection, such as are
most morphological traits. We have also detected very
large directional dominance for a major component of
fitness, egg hatching rate, in the same experimental
lines (Saccheri et al., 1996), as expected for fitness-
related traits subject to strong directional selection
(DeRose & Roff, 1999). The rapid and large response
to natural selection for increased egg hatching rate in
some of the one pair lines (Saccheri et al., 1996),
coupled with the observed increase in phenotypic
variance, implies substantial increases in VA
for egg
hatching rate, as a result of inbreeding. Thus, our
results, which demonstrate losses of VA
for mor-
phological traits and a probable increase in VA
for a
major component of fitness, provide strong support
for the view that increases in VA
following inbreeding
will most often be due to large dominance variance in
traits which are closely related to fitness.
Existing empirical evidence does not rule out the
possibility that epistasis may also contribute sub-
stantially to increases in VA
of some characters
following inbreeding. Because of the difficulties in-
herent in accurately estimating even the simplest form
of epistatic variance (additive¬additive) few studies
of inbreeding effects, including our own, have at-
tempted to measure it. In one inbreeding experiment
where additive dominance (VD), epistatic (V
AA), and
environmental variances were measured (Bryant &
Meffert, 1996) the results were somewhat equivocal,
but did show a positive association between increases
in VA
and VAA
in the base population, among four
morphological characters. The results of Cheverud et
al. (1999), while clearly demonstrating a potentially
major role for epistatic to additive variance con-
version, were obtained in a highly derived population
(F2 intercross of inbred high and low selected lines),
leading us to question the relevance of this result for
natural populations. In future, the application of
molecular quantitative genetics (QTLs) to describe the
genetic architecture of traits in natural populations
should provide greater insights into the role of non-
additive variance components for adaptation in the
presence of drift.
Even when non-additive variance is negligible, VA
may increase above control levels in a small fraction
of cases, simply because of the variance about the
expectation of the drift process, which is likely to be
particularly large for polygenic traits. This has been
demonstrated by the highly replicated Drosophila
experiment of Whitlock & Fowler (1999). The same
study found highly variable but significant overall
increases in VE
for four of six wing area and angle
measurements, paralleling the results of Bryant &
Meffert (1996). Such increases in VE
are traditionally
attributed to lowered developmental homeostasis,
though the genetic basis and developmental mech-
anism for this hypothesis are unclear. We were unable
to detect any significant effect of inbreeding on VE
for
the B. anynana traits under investigation. This may be
because of substantial differences in developmental
canalization (Gibson & Wagner, 2000) or less stressful
environmental conditions (e.g. less crowding).
Another factor that should be taken into con-
sideration is that in natural (as opposed to laboratory)
environments, founding colonists or population crash
survivors are unlikely to be a random set from the
base population. With the exception of the statistically
problematic experiment of Lints & Bourgois (1984)
who measured an increase in VA
for sternopleural
bristle number following an extended bottleneck
induced by high temperature, this possibility has not
been explored by any of the empirical studies aiming
I. J. Saccheri et al. 180
to assess the consequences of bottlenecks for VA. If,
for example, the more heterozygous genomes are
favoured, for which there is increasing evidence (Keller
et al., 1994; Saccheri et al., 1998), VA
for the selected
traits themselves or for those traits in linkage
disequilibrium with the selected regions may increase,
or decrease less than predicted by the neutral additive
model.
There now exists an accumulated body of work
indicating that bottlenecks are likely to cause losses in
VA
of most characters most of the time, but increases
in others. The evolutionary consequences of bottle-
necks are therefore less predictable than implied by
the neutral additive model. An important consider-
ation is the relative fitness contribution of characters
which gain VA
and those that lose VA. Future studies
aiming to make a general assessment of the effect of
bottlenecks on quantitative characters should choose
characters carefully, including a range of contrasting
genetic architectures (i.e. varying relative magnitudes
of additive, dominance and epistatic variances) and
presumed selective regimes (major determinants of
fitness versus weakly selected traits). The present
study has also emphasized the need to obtain accurate
estimates of the level of inbreeding when interpreting
the effects of bottlenecks on quantitative genetic
variation, and suggests that cryptic selection (Saccheri
et al., 1999) can accelerate the loss of VA.
Estimates of heritabilities, phenotypic variances
and means are available on request from I.J.S.
We thank R. Heywood, E. Schlatmann and B. de Winter fortheir assistance during the experimental work. Bas Zwanand three anonymous reviewers provided valuable com-ments. This research was funded by the Institute of Zoologyand the University of Leiden. The final period of writing wassupported by the European Union TMR Network ‘Frag-land’.
References
Barton, N. H. (1989). Founder effect speciation. InSpeciation and its Consequences (ed. D. Otte & J. A.Endler), pp. 229–256. Sunderland, MA: Sinauer Asso-ciates.
Barton, N. H. & Charlesworth, B. (1984). Genetic revolu-tions, founder effects, and speciation. Annual Re�iew ofEcology and Systematics 15, 133–164.
Barton, N. H. & Turelli, M. (1989). Evolutionary quan-titative genetics : How little do we know? Annual Re�iewof Genetics 23, 337–370.
Brakefield, P. M. (1997). Phenotypic plasticity and fluctuat-ing asymmetry as responses to environmental stressin the butterfly Bicyclus anynana. In En�ironmentalStress, Adaptation and E�olution. (ed. R. Bijlsma & V.Loeschcke), pp. 65–78. Basel : Birkha$ user.
Brakefield, P. M. (2000). The structure of a character andthe evolution of patterns. In E�olutionary Biology ofCharacters (ed. G. P. Wagner). New York: AcademicPress (in press).
Brakefield, P. M. & Reitsma, N. (1991). Phenotypic plas-ticity, seasonal climate and the population biology of
Bicyclus butterflies (Satyridae) in Malawi. EcologicalEntomology 16, 291–303.
Brakefield, P. M., Gates, J., Keys, D., Kesbeke, F.,Wijngaarden, P. J., Monteiro, A., French, V. & Carroll,S. B. (1996). Development, plasticity and evolution ofbutterfly eyespot patterns. Nature 384, 236–242.
Bryant, E. H. & Meffert, L. M. (1993). The effect of serialfounder flush cycles on quantitative genetic variation inthe housefly. Heredity 70, 122–129.
Bryant, E. H. & Meffert, L. M. (1996). Nonadditive geneticstructuring of morphometric variation in relation to apopulation bottleneck. Heredity 77, 168–176.
Bryant, E. H., McCommas, S. A. & Combs, L. M. (1986).The effect of an experimental bottleneck upon quantitativegenetic variation in the housefly. Genetics 114, 1191–1211.
Carson, H. L. (1990). Increased genetic variance after apopulation bottleneck. Trends in Ecology and E�olution 5,228–230.
Carson, H. L. & Templeton, A. R. (1984). Genetic revolu-tions in relation to speciation phenomena: the foundingof new populations. Annual Re�iew of Ecology andSystematics 15, 97–131.
Cheverud, J. M. & Routman, E. J. (1996). Epistasis as asource of increased additive genetic variance at populationbottlenecks. E�olution 50, 1042–1051.
Cheverud, J. M., Vaughn, T. T., Pletscher, L. S., King-Ellison, K., Bailiff, J., Adams, E., Erickson, C. &Bonislawski, A. (1999). Epistasis and the evolution ofaddititve genetic variance in populations that pass througha bottleneck. E�olution 53, 1009–1018.
Condamin, M. (1973). Monographie du genre Bicyclus(Lepidoptera, Satyridae). Memoires de l’Institut Fonda-mental d ’Afrique Noire 88, Ifan-Dakar.
Coyne, J. A., Barton, N. H. & Turelli, M. (2000). Is Wright ’sshifting balance process important in evolution? E�olution54, 306–317.
Crnokrak, P. & Roff, D. A. (1995). Dominance variance:associations with selection and fitness. Heredity 75,530–540.
Da Silva, J. M. P. (1961). Limits of response to selection.PhD thesis, University of Edinburgh.
DeRose, M. A. & Roff, D. A. (1999). A comparison ofinbreeding depression in life-history and morphologicaltraits in animals. E�olution 53, 1288–1292.
Falconer, D. S. & Mackay, T. F. C. (1996). Introduction toQuantitati�e Genetics, 4th edn. Harlow, Essex: Longman.
Ferna! ndez, A., Toro, M. A. & Lo! pez-Fanjul, C. (1995). Theeffect of inbreeding on the redistribution of geneticvariance of fecundity and viability in Tribolium castaneum.Heredity 75, 376–381.
Frankham, R. (1980). The founder effect and response toartificial selection in Drosophila. In Selection Experimentsin Laboratory and Domestic Animals (ed. A. Robertson),pp. 87–90. Wallingford: Commonwealth AgriculturalBureau.
Frankham, R. (1999). Quantitative genetics in conservationbiology. Genetical Research 74, 237–244.
Franklin, I. R. (1980). Evolutionary change in smallpopulations. In Conser�ation Biology: An E�olutionary-Ecological Perspecti�e. (ed. M. E. Soule! & B. A. Wilcox),pp. 135–149. Sunderland, MA: Sinauer Associates.
Garcı!a, N., Lo! pez-Fanjul, C. & Garcı!a-Dorado, A. (1994).The genetics of viability in Drosophila melanogaster :effects of inbreeding and artificial selection. E�olution 48,1277–1285.
Gibson, G. & Wagner, G. (2000). Canalization in evol-utionary genetics : a stabilizing theory? BioEssays 22,372–380.
Bottleneck effects on quantitati�e genetic �ariation in Bicyclus anynana 181
Goodnight, C. J. (1987). On the effect of founder events onepistatic genetic variance. E�olution 41, 80–91.
Goodnight, C. J. (1988). Epistasis and the effect of founderevents on the additive genetic variance. E�olution 42,441–454.
Goodnight, C. J. & Wade, M. J. (2000). The ongoingsynthesis : a reply to Coyne, Barton, and Turelli. E�olution54, 317–324.
Goodwill, R. (1975). An analysis of the mode of gene actionaffecting pupa weight in Tribolium castaneum. Genetics79, 219–229.
Harrison, S.&Hastings,A. (1996).Genetic and evolutionaryconsequences of metapopulation structure. Trends inEcology and E�olution 11, 180–183.
James, J. W. (1971). The founder effect and response toartificial selection. Genetical Research 16, 241–250.
Kearsey,M. J. & Kojima, K. (1967). The genetic architectureof body weight and egg hatchability in Drosophilamelanogaster. Genetics 56, 23–37.
Keller, L. F., Arcese, P., Smith, J. N. M., Hochachka,W. M. & Stearns, S. C. (1994). Selection against inbredsong sparrows during a natural population bottleneck.Nature 372, 356–357.
Kidwell, J. F. & Kidwell, M. M. (1966). The effects ofinbreeding on body weight and abdominal chaeta numberin Drosophila melanogaster. Canadian Journal of Geneticsand Cytology 8, 207–215.
Lande, R. (1980). Genetic variation and phenotypic evol-ution during allopatric speciation. American Naturalist116, 463–479.
Lande, R. (1992). Neutral theory of quantitative geneticvariance in an island model with local extinction andcolonization. E�olution 46, 381–389.
Latter, B. D. H., Mulley, J. C., Reid, D. & Pascoe, L.(1995). Reduced genetic load revealed by slow inbreedingin Drosophila melanogaster. Genetics 139, 287–297.
Latter, B. D. H. & Robertson, A. (1962). The effects ofinbreeding and artificial selection on reproductive fitness.Genetical Research 3, 110–138.
Lints, F. A. & Bourgois, M. (1984). Population crash,population flush and genetic variability in cage popula-tions of Drosophila melanogaster. Genetics, Selection,E�olution 16, 45–56.
Lo! pez-Fanjul, C. & Villaverde, A. (1989). Inbreedingincreases genetic variance for viability in Drosophilamelanogaster. E�olution 43, 1800–1804.
Lo! pez-Fanjul, C., Ferna! ndez, A. & Toro, M. A. (1999). Therole of epistasis in the increase in the additive geneticvariance after population bottlenecks. Genetical Research73, 45–59.
Lynch, M. (1988). Design and analysis of experiments onrandom drift and inbreeding depression. Genetics 120,791–807.
Manly, B. F. J. (1986). Multi�ariate Statistical Methods: APrimer. London: Chapman and Hall.
Maynard Smith, J. (1998). E�olutionary Genetics, 2nd edn.Oxford: Oxford University Press.
Moreno, G. (1994). Genetic architecture, genetic behaviour,and character evolution. Annual Re�iew of Ecology andSystematics 25, 31–44.
Payne, R. W., Lane, P. W., Ainsley, A. E., Bicknell, K. E.,Digby, P. G. N., Harding, S. A., Leech, P. K., Simpson,H. R., Todd, A. D., Verrier, P. J. & White, R. P. (1988).Genstat 5 Reference Manual. New York: Oxford Uni-versity Press.
Ritchie, M. G. & Kyriacou, C. P. (1994). Genetic variabilityin courtship song in a population of Drosophila melano-gaster. Animal Beha�iour 48, 425–434.
Robertson, A. (1952). The effect of inbreeding on thevariation due to recessive genes. Genetics 37, 189–207.
Roff, D. (2000). The evolution of the G matrix : selection ordrift? Heredity 84, 135–142.
Ruano, R. G., Silvela, L. S., Lo! pez-Fanjul, C. & Toro,M. A. (1996). Changes in the additive variance of a fitness-related trait with inbreeding in Tribolium castaneum.Journal of Animal Breeding and Genetics 113, 93–97.
Saccheri, I. J., Brakefield, P. M. & Nichols, R. A. (1996).Severe inbreeding depression and rapid fitness rebound inthe butterfly Bicyclus anynana (Satyridae). E�olution 50,2000–2013.
Saccheri, I., Kuussaari, M., Kankare, M., Vikman, P.,Fortelius, W. & Hanski, I. (1998). Inbreeding andextinction in a butterfly metapopulation. Nature 392,491–494.
Saccheri, I. J., Wilson, I. J., Nichols, R. A., Bruford, M. W.& Brakefield, P. M. (1999). Inbreeding of bottleneckedbutterfly populations: estimation using the likelihood ofchanges in marker allele frequencies. Genetics 151,1053–1063.
Sevenster, J. G. & van Alphen, J. M. (1993). A life historytrade-off in Drosophila species and community structurein variable environments. Journal of Animal Ecology 62,720–736.
Sokal, R. R. & Rohlf, F. J. (1981). Biometry. New York:W. H. Freeman.
Tachida, H. & Cockerham, C. C. (1989). A building blockmodel for quantitative genetics. Genetics 121, 839–844.
Tantawy, A. O. & Reeve, E. C. R. (1956). Studies inquantitative inheritance. IX. The effects of inbreeding atdifferent rates in Drosophila melanogaster. Zeitschrift fuX rindukt. Abstammungs- und Vererbungslehre 87, 648–667.
Templeton, A. R. (1996). Experimental evidence for thegenetic-transilience model of speciation. E�olution 50,909–915.
Wade, M. J., Shuster, S. M. & Stevens, L. (1996). In-breeding: its effect on response to selection for pupalweight and the heritable variance in fitness in the flourbeetle, Tribolium castaneum. E�olution 50, 723–733.
Whitlock, C. M., Phillips, P. C. & Wade, M. J. (1993). Geneinteraction affects the additive genetic variance in sub-divided populations with migration and extinction.E�olution 47, 1758–1769.
Whitlock, M. C. (1995). Variance-induced peak shifts.E�olution 49, 252–259.
Whitlock, M. C. & Fowler, K. (1999). The changes ingenetic and environmental variance with inbreeding inDrosophila melanogaster. Genetics 152, 345–353.
Wijngaarden, P. J. (2000). The genetic basis of eyespot size :an analysis of line crosses. Heredity (in press).
Willis, J. H. & Orr, H. A. (1993). Increased heritablevariation following population bottlenecks: the role ofdominance. E�olution 47, 949–957.
Windig, J. J. (1993). The genetic background of plasticity inwing pattern of Bicyclus butterflies. PhD thesis, Universityof Leiden.
Wright, S. (1951). The genetical structure of populations.Annals of Eugenics 15, 323–354.
Wright, S. (1977). E�olution and the Genetics of Populations.Experimental Results and E�olutionary Deductions, vol. 3.Chicago: University of Chicago Press.
Copyright © 2022 FDOKUMEN