Low genetic and morphological differentiation between an introduced population of dunnocks in New...
17
Low genetic and morphological differentiation in the European species complex of Rosa sherardii, R. mollis and R. villosa (Rosa section Caninae subsection Vestitae) ALEXANDRA KELLNER 1 *, CHRISTIANE M RITZ 2 and VOLKER WISSEMANN FLS 1 1 Department of Systematic Botany, Institute of Botany, Justus-Liebig-University, Heinrich-Buff-Ring 38, D-35392 Gießen, Germany 2 Department of Botany, Senckenberg Museum of Natural History Görlitz, P. O. Box 300 154, 02806 Görlitz, Germany Received 18 October 2012; revised 22 August 2013; accepted for publication 22 August 2013 The polyploid species complex of Rosa villosa sensu lato (Rosa section Caninae subsection Vestitae) consists of three morphologically similar polyploid species: R. sherardii, R. mollis and R. villosa. Whereas R. sherardii is distributed in central Europe, R. mollis and R. villosa represent a vicariant species pair occurring in northern Europe and in mountains of central and eastern Europe, respectively. In this study we analysed multiple data sets (morphology, cytology, microsatellites, AFLP and plastid DNA sequences) to re-evaluate the systematics of these species and to examine whether cytological differences are reflected in the taxonomy and geographical distributions. Furthermore, these data sets were used to evaluate hypotheses explaining the vicariant distribution of R. mollis and R. villosa. None of these data sets revealed a clear-cut differentiation between the species. Cytological and molecular data argued for a discrete taxonomic position of the predominantly pentaploid R. sherardii, but these data did not support a separation between the mostly tetraploid R. mollis and R. villosa. Population genetics revealed that samples of the latter species were assembled according to ploidy, but not to species affiliation or geographical distribution. Thus, we assume that the cytologically polymorphic original species had a continuous range prior to the last glaciation period and survived on nunataks or in non-glaciated coastal regions in northern Europe, but that it failed to recover its former range after the retreat of the ice sheets. © 2013 The Linnean Society of London, Botanical Journal of the Linnean Society, 2014, 174, 240–256. ADDITIONAL KEYWORDS: AFLP – atpB-rbcL IGS – dog rose – glacial refugia – microsatellites – taxonomy. INTRODUCTION Dog roses, Rosa L. section Caninae (DC.) Ser., domi- nate the European wild rose flora in frequency and species number. Section Caninae comprises approxi- mately 50 species in central Europe (Henker, 2000); they are mostly found in hedges of the open land- scape. All species of the section are polyploid and their chromosome sets are inherited by a unique unbalanced meiosis, the Canina meiosis (Täckholm, 1920, 1922; Blackburn, 1925). In the tetra-, penta- or hexaploid plants (2n =4x,5x,6x = 28, 35, 42; base number x = 7) two sets of chromosomes pair during meiosis (bivalents), whereas the other sets remain unpaired (univalents). During the microsporogenesis, one set of the paired homologous chromosomes is transmitted to the pollen grain, whereas, during the megasporogenesis, one set of the paired homologous chromosomes and all sets of univalents are transmit- ted to the egg cell. Egg cells hence become triploid, tetraploid and pentaploid in tetraploid, pentaploid and hexaploid individuals, respectively. The merger of monoploid pollen grains and polyploid egg cell even- tually restores the somatic ploidy and causes a pro- nounced matroclinal inheritance. The preferential pairing of only two chromosome sets leads to a high level of fixed heterozygosity, as the univalent-forming *Corresponding authors. E-mail: [email protected] Botanical Journal of the Linnean Society, 2014, 174, 240–256. With 6 figures © 2013 The Linnean Society of London, Botanical Journal of the Linnean Society, 2014, 174, 240–256 240
-
Upload
independent -
Category
Documents
-
view
0 -
download
0
Transcript of Low genetic and morphological differentiation between an introduced population of dunnocks in New...
Low genetic and morphological differentiation in theEuropean species complex of Rosa sherardii, R. mollisand R. villosa (Rosa section Caninae subsectionVestitae)
ALEXANDRA KELLNER1*, CHRISTIANE M RITZ2 and VOLKER WISSEMANN FLS1
1Department of Systematic Botany, Institute of Botany, Justus-Liebig-University, Heinrich-Buff-Ring38, D-35392 Gießen, Germany2Department of Botany, Senckenberg Museum of Natural History Görlitz, P. O. Box 300 154, 02806Görlitz, Germany
Received 18 October 2012; revised 22 August 2013; accepted for publication 22 August 2013
The polyploid species complex of Rosa villosa sensu lato (Rosa section Caninae subsection Vestitae) consists of threemorphologically similar polyploid species: R. sherardii, R. mollis and R. villosa. Whereas R. sherardii is distributedin central Europe, R. mollis and R. villosa represent a vicariant species pair occurring in northern Europe and inmountains of central and eastern Europe, respectively. In this study we analysed multiple data sets (morphology,cytology, microsatellites, AFLP and plastid DNA sequences) to re-evaluate the systematics of these species and toexamine whether cytological differences are reflected in the taxonomy and geographical distributions. Furthermore,these data sets were used to evaluate hypotheses explaining the vicariant distribution of R. mollis and R. villosa.None of these data sets revealed a clear-cut differentiation between the species. Cytological and molecular dataargued for a discrete taxonomic position of the predominantly pentaploid R. sherardii, but these data did notsupport a separation between the mostly tetraploid R. mollis and R. villosa. Population genetics revealed thatsamples of the latter species were assembled according to ploidy, but not to species affiliation or geographicaldistribution. Thus, we assume that the cytologically polymorphic original species had a continuous range prior tothe last glaciation period and survived on nunataks or in non-glaciated coastal regions in northern Europe, but thatit failed to recover its former range after the retreat of the ice sheets. © 2013 The Linnean Society of London,Botanical Journal of the Linnean Society, 2014, 174, 240–256.
ADDITIONAL KEYWORDS: AFLP – atpB-rbcL IGS – dog rose – glacial refugia – microsatellites – taxonomy.
INTRODUCTION
Dog roses, Rosa L. section Caninae (DC.) Ser., domi-nate the European wild rose flora in frequency andspecies number. Section Caninae comprises approxi-mately 50 species in central Europe (Henker, 2000);they are mostly found in hedges of the open land-scape. All species of the section are polyploid andtheir chromosome sets are inherited by a uniqueunbalanced meiosis, the Canina meiosis (Täckholm,1920, 1922; Blackburn, 1925). In the tetra-, penta- orhexaploid plants (2n = 4x, 5x, 6x = 28, 35, 42; base
number x = 7) two sets of chromosomes pair duringmeiosis (bivalents), whereas the other sets remainunpaired (univalents). During the microsporogenesis,one set of the paired homologous chromosomes istransmitted to the pollen grain, whereas, during themegasporogenesis, one set of the paired homologouschromosomes and all sets of univalents are transmit-ted to the egg cell. Egg cells hence become triploid,tetraploid and pentaploid in tetraploid, pentaploidand hexaploid individuals, respectively. The merger ofmonoploid pollen grains and polyploid egg cell even-tually restores the somatic ploidy and causes a pro-nounced matroclinal inheritance. The preferentialpairing of only two chromosome sets leads to a highlevel of fixed heterozygosity, as the univalent-forming
*Corresponding authors. E-mail:[email protected]
bs_bs_banner
Botanical Journal of the Linnean Society, 2014, 174, 240–256. With 6 figures
© 2013 The Linnean Society of London, Botanical Journal of the Linnean Society, 2014, 174, 240–256240
genomes are protected from recombination duringmeiosis (Nybom et al., 2006). High levels of heterozy-gosity have generally been regarded as a driving forcebehind the success of polyploids (Levin, 2000; Soltis &Soltis, 2000) and are expected to increase with risingploidy (Brochmann et al., 2004). In the case of dogroses, tetraploid plants should therefore be less vari-able than penta- or hexaploids owing to their lowernumber of univalent genomes.
In many dog rose species, intraspecific variation ofcytotypes has been reported (Henker, 2000), but thegenetic differentiation of cytotypes and the geographi-cal distribution of cytotypes within the range of aspecies have not been investigated. However, studiesin other genera have demonstrated that differencesbetween cytotypes promote plant speciation, forinstance in Saxifraga L. (Gudahl et al., 2005), Narcis-sus L. (Zonneveld, 2008) and Cerastium L. (Letz et al.,2012). In contrast, two important evolutionary mecha-nisms may effectively counteract genetic differentia-tion among cytotypes: hybridization and repeatedtransformation of cytotypes into each other (particu-larly through involvement of unreduced gametes inzygote formation). The evolution of the polyploidCaninae has been strongly influenced by hybridiza-tion, because the section itself is thought to have arisenthrough multiple hybridization events (Wissemann,2000; Ritz, Schmuths & Wissemann, 2005), and alsoseveral dog rose species are interspecific hybrids (DeCock et al., 2008; Ritz & Wissemann, 2011; Herklotz,2012; Vander Mijnsbrugge & Beeckman, 2012). Thenatural formation of these hybridogenic species wasaccompanied by an increase in ploidy attributable tothe merger of unreduced gametes (Ritz & Wissemann,2011; Herklotz, 2012).
Section Caninae are divided into six subsectionsbased on morphology (Henker, 2000). SubsectionVestitae H. Christ include Rosa mollis Sm., R. pseudo-scabriuscula (R.Keller) Henker & G.Schulze, R.sherardii Davies, R. tomentosa Sm. and R. villosa L.For all of these species, tetra-, penta- and hexaploidindividuals have been reported, based on rather anec-dotal chromosome counts (Henker, 2000). Spontane-ous, fertile hybrids have also been reported betweenmembers of subsection Vestitae (e.g. R. mollis ×R. sherardii, R. sherardii × R. tomentosa; Graham &Primavesi, 1993), between Vestitae and dog roses ofother subsections (e.g. R. mollis × R. canina; Graham& Primavesi, 1993) and between Vestitae and‘non-dog roses’ [e.g. R. × mangii Eigner & Wissemann(R. mollis × R. rugosa); Eigner & Wissemann, 1999].Vestitae are characterized by straight or slightlycurved prickles and tomentose leaves bearing turpen-tine scented glands (Henker, 2000). Rosa pseudoscabri-uscula and R. tomentosa are characterized bydeciduous sepals and a narrow diameter of the stylar
orifice (≤ 1 mm). In contrast, R. mollis, R. sherardiiand R. villosa often have erect, persistent sepals and awide diameter of the orifice (> 1 mm). The last threementioned species have been treated as R. villosa s.l.(Haeupler & Schönfelder, 1988) and a close relation-ship was also indicated by a population genetic analy-sis using random amplified polymorphic DNA (RAPD)data (Olsson, 1999). The morphological differencesbetween the three taxa are summarized in Table 1.Rosa sherardii is more clearly differentiated fromR. mollis and R. villosa by the shape of prickles andthe margin of sepals, but morphological differencesbetween R. mollis and R. villosa are restricted to a fewrather variable characters (the size of the terminalleaflet, the margin of leaves and petals, the surface ofstems). Furthermore, leaves and hips are reported tobe larger in R. villosa (Nilsson, 1967; Henker, 2000;Jäger, 2011); however, deviating dwarf forms ofR. villosa have been described from the Alps (Henker,2000). Thus, species identification is ambiguous andoften influenced by information about the geographicallocality of the specimens.
Rosa sherardii is distributed from central Europe toGreat Britain, southern Scandinavia and the BalticStates (Henker, 2000; Kurtto, Lampinen & Junikka,2004) and Rosa mollis is found exclusively in north-ern Europe and reaches the southern edge of itsdistribution area in northern Germany (Eigner, 1993;Henker, 2000; Kurtto et al., 2004). Rosa villosa isnaturally distributed in the European high moun-tains (e.g. the Alps, Pyrenees, Balkans, Caucasus),but has frequently been used as a crop plant for itshigh content of ascorbic acid (Timmermann & Müller,1994; Henker, 2000; Ercisli, 2007; Gunes, 2010) and iswidely naturalized in Europe (Henker, 2000; Kurttoet al., 2004). This disjunction of R. mollis andR. villosa is unique in roses, but fits with the distri-bution pattern of many arctic–alpine plant species,which has been explained by various recolonizationscenarios after the last glaciation approximately12 000 years ago. Some studies have shown thatplants must have survived in refuges some distancefrom the glaciated areas (Stehlik, 2003; Bettin et al.,2007; Parisod, 2008; Jadwiszczak et al., 2011),whereas others have shown that plants survived inthe glaciated area on ice-free mountain tops (Stehlik,2000; Stehlik et al., 2002; Michl et al., 2010;Westergaard et al., 2011) or along coastlines in Scan-dinavia (Abbott & Brochmann, 2003). Therefore,R. mollis has also been treated as a geographicallyseparated subspecies or variety of R. villosa (Nilsson,1967; Nybom, Olsson & Werlemark, 1996; 1997, 2004;Henker, 2000).
In the present study, we aimed to re-evaluate thetaxonomy of R. mollis, R. villosa and R. sherardiibased on morphological characters, the ploidy of indi-
POPULATION GENETICS IN DOG ROSES (VESTITAE) 241
© 2013 The Linnean Society of London, Botanical Journal of the Linnean Society, 2014, 174, 240–256

viduals, and population genetic differentiationinferred from microsatellites, AFLPs and plastid DNAsequences. Particularly, we evaluated the correspond-ence of cytology with the molecular and morphologicaldifferentiation of populations. We assessed whetherobserved patterns of differentiation are betterexplained by geographical distance or taxonomy.Population genetic data were used to discriminatebetween alternative hypotheses explaining the vicari-ant distribution of R. mollis in northern Europe vs.R. villosa in the European Alps, either by postglacialre-colonization or survival of the ice ages in refugialocated in both extant distribution areas.
MATERIAL AND METHODSPLANT MATERIAL
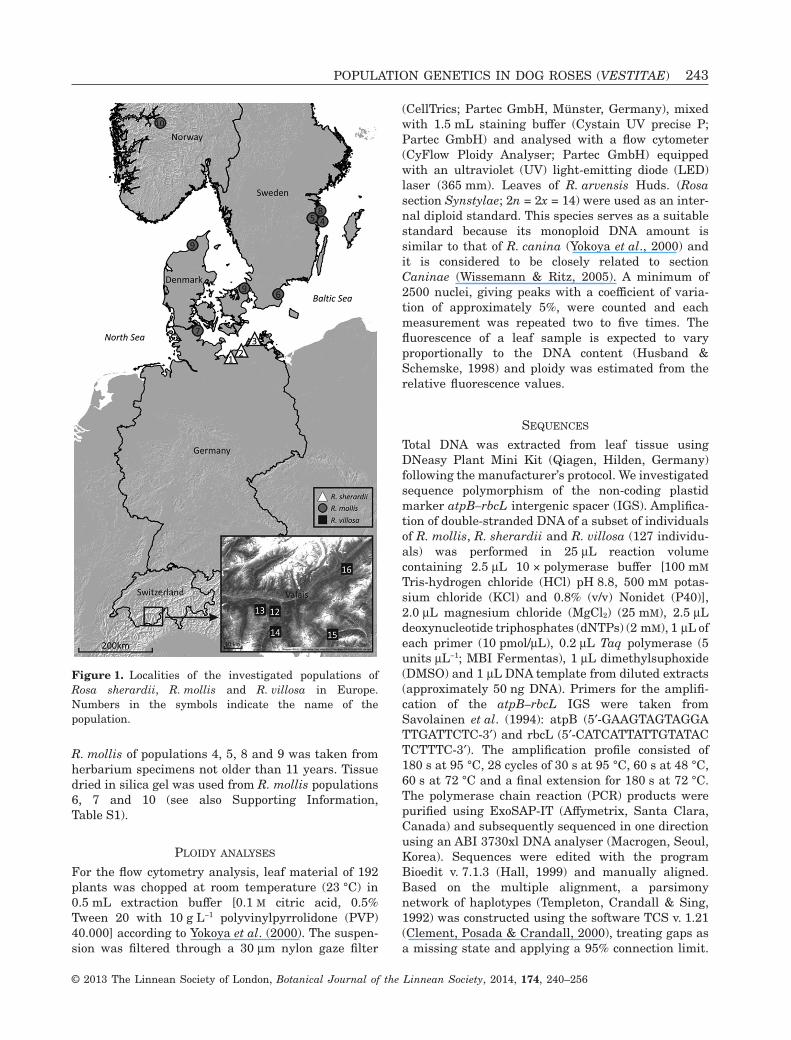
We sampled 30 individuals from three populations ofR. sherardii along the German coast of the Baltic Seaand 99 individuals from six populations of R. villosain the Valais (Switzerland; Fig. 1; see also Supporting
Information, Table S1). Material of R. mollis was col-lected in southern Sweden (four populations, 48 indi-viduals), from one population in northern Germanyand two individuals each from Denmark and Norway(Fig. 1; see also Supporting Information, Table S1). Intotal, 192 individuals were collected from 16 popula-tions. As morphological differences between R. mollisand R. villosa are ambiguous (Henker, 2000; Table 1),discrimination between the two species relied on thegeographical origin of the plants only: samples fromScandinavia were classified as R. mollis and plantsfrom the Valais (Switzerland) as R. villosa (Henker,2000; Kurtto et al., 2004). The identification ofR. sherardii was based on characters given by Henker(2000); for example, its falcate prickles, acute stipulesand short pedicels (Table 1). Leaf tissue of R. sherar-dii and R. villosa was stored in silica gel for furthermolecular investigations (see also Supporting Infor-mation, Table S1) and representative specimens ofeach population were deposited in the herbariumof the University of Gießen (GIE). Leaf material of
Table 1. Overview of taxonomically important characters in Rosa sherardii, R. mollis and R. villosa taken from theliterature
Character R. sherardii R. mollis R. villosa
Stem Stem surface Young branches pruinose* Pruinose*†‡ Not pruinose*‡Prickles Falcate*†‡ with decurrent
base*Straight*†§ Straight*†§
Leaf Stipules Acute andstraight–diverging‡
Falcate and slightlyincurved‡§
Falcate and slightlyincurved‡§
Leaflet shape Wide elliptic–ovate* Elliptic–ovate*†;oval–suborbicular‡
Oblong–ovate*†‡; withparallel runningmarginsa
Length of theterminal leaflet
No information available 2.0–3.5 cm*† 5.0–7.0 cm*†
Flower Sepals Deeply divided; shorterthan petals*
Frequently entire; longerthan petals*
Frequently entire; longerthan petals*
Petals Deep pink to deep red*† Deep pink or white*¶;margins rarely withglands*†§
Deep red to pink*;margins withglands*†§**
Hip Pedicel Shorter or as long aship†**
No information available Usually longer than hip**
Hip width 1.0–1.5 cm* (> 2.5 cm)† 1.0–1.5 cm* 2.0–2.5 cm*Diameter of
the orifice1.5–2.0 cm*† 1.5–2.5 cm* 2.5–4.0 cm*
Ripening Late (VIII–XI)*‡ Early (VIII)*†‡ Early (VIII)*†‡Cytotology Ploidy 2n = 4x, 5x, 6x = 28, 35,
42*2n = 4x, 5x, 6x = 28, 35,
42*2n = 4x, 7x = 28, 56*
Distribution Central Europe to GreatBritain, southernScandinavia, BalticStates*††
Northern Europe tonorthern Germany*¶**
Alps, Pyrenees, Balkans,Caucasus* **; widelycultivated in Europe*
*Henker (2000), †Jäger (2011), ‡Nilsson (1967), §Jäger (1999), ¶Eigner (1993), **Timmermann & Müller (1994), ††Kurttoet al. (2004).
242 A. KELLNER ET AL.
© 2013 The Linnean Society of London, Botanical Journal of the Linnean Society, 2014, 174, 240–256
R. mollis of populations 4, 5, 8 and 9 was taken fromherbarium specimens not older than 11 years. Tissuedried in silica gel was used from R. mollis populations6, 7 and 10 (see also Supporting Information,Table S1).
PLOIDY ANALYSES
For the flow cytometry analysis, leaf material of 192plants was chopped at room temperature (23 °C) in0.5 mL extraction buffer [0.1 M citric acid, 0.5%Tween 20 with 10 g L−1 polyvinylpyrrolidone (PVP)40.000] according to Yokoya et al. (2000). The suspen-sion was filtered through a 30 μm nylon gaze filter
(CellTrics; Partec GmbH, Münster, Germany), mixedwith 1.5 mL staining buffer (Cystain UV precise P;Partec GmbH) and analysed with a flow cytometer(CyFlow Ploidy Analyser; Partec GmbH) equippedwith an ultraviolet (UV) light-emitting diode (LED)laser (365 mm). Leaves of R. arvensis Huds. (Rosasection Synstylae; 2n = 2x = 14) were used as an inter-nal diploid standard. This species serves as a suitablestandard because its monoploid DNA amount issimilar to that of R. canina (Yokoya et al., 2000) andit is considered to be closely related to sectionCaninae (Wissemann & Ritz, 2005). A minimum of2500 nuclei, giving peaks with a coefficient of varia-tion of approximately 5%, were counted and eachmeasurement was repeated two to five times. Thefluorescence of a leaf sample is expected to varyproportionally to the DNA content (Husband &Schemske, 1998) and ploidy was estimated from therelative fluorescence values.
SEQUENCES
Total DNA was extracted from leaf tissue usingDNeasy Plant Mini Kit (Qiagen, Hilden, Germany)following the manufacturer’s protocol. We investigatedsequence polymorphism of the non-coding plastidmarker atpB–rbcL intergenic spacer (IGS). Amplifica-tion of double-stranded DNA of a subset of individualsof R. mollis, R. sherardii and R. villosa (127 individu-als) was performed in 25 μL reaction volumecontaining 2.5 μL 10 × polymerase buffer [100 mM
Tris-hydrogen chloride (HCl) pH 8.8, 500 mM potas-sium chloride (KCl) and 0.8% (v/v) Nonidet (P40)],2.0 μL magnesium chloride (MgCl2) (25 mM), 2.5 μLdeoxynucleotide triphosphates (dNTPs) (2 mM), 1 μL ofeach primer (10 pmol/μL), 0.2 μL Taq polymerase (5units μL−1; MBI Fermentas), 1 μL dimethylsuphoxide(DMSO) and 1 μL DNA template from diluted extracts(approximately 50 ng DNA). Primers for the amplifi-cation of the atpB–rbcL IGS were taken fromSavolainen et al. (1994): atpB (5′-GAAGTAGTAGGATTGATTCTC-3′) and rbcL (5′-CATCATTATTGTATACTCTTTC-3′). The amplification profile consisted of180 s at 95 °C, 28 cycles of 30 s at 95 °C, 60 s at 48 °C,60 s at 72 °C and a final extension for 180 s at 72 °C.The polymerase chain reaction (PCR) products werepurified using ExoSAP-IT (Affymetrix, Santa Clara,Canada) and subsequently sequenced in one directionusing an ABI 3730xl DNA analyser (Macrogen, Seoul,Korea). Sequences were edited with the programBioedit v. 7.1.3 (Hall, 1999) and manually aligned.Based on the multiple alignment, a parsimonynetwork of haplotypes (Templeton, Crandall & Sing,1992) was constructed using the software TCS v. 1.21(Clement, Posada & Crandall, 2000), treating gaps asa missing state and applying a 95% connection limit.
Figure 1. Localities of the investigated populations ofRosa sherardii, R. mollis and R. villosa in Europe.Numbers in the symbols indicate the name of thepopulation.
POPULATION GENETICS IN DOG ROSES (VESTITAE) 243
© 2013 The Linnean Society of London, Botanical Journal of the Linnean Society, 2014, 174, 240–256

Different haplotypes foundin each species were depos-ited in GenBank (R. sherardii: HE999629, HE999630;R. mollis: HE999623, HE999624, HE999625; R.villosa: HE999626, HE999627, HE999627).
DNA FINGERPRINTS
We analysed ten microsatellite DNA loci in 192 indi-viduals of the three species. Primer sequences weretaken from Esselink, Smulders & Vosman (2003) andthe protocol followed the description given in Kellner,Ritz & Wissemann (2012).
For the AFLP study, we analysed the same indi-viduals as used for the microsatellites. The AFLPprocedure was based on Vos et al. (1995), with thefollowing changes: digestion and ligation reactionswere performed simultaneously at room temperatureovernight (Weising et al., 2005). The 30 µl reactionmixture contained 300 ng genomic DNA, 3 μL 10 × Y-Tango buffer (33 mM Tris-acetate pH 7.9, 10 mM
magnesium acetate, 66 mM potassium acetate,0.1 mg mL−1 bovine serum albumin), 3 units of eachrestriction enzyme EcoRI and MseI (MBI Fermentas),0.5 μL of each adapter (5 pmol μL−1 of EcoRIa5′-CTCGTAGACTGCGTACC-3′ and 50 pmol μL−1 ofMseIa 5′-GACGATGAGTCCTGAG-3′), 1.1 μL 10 ×ligation buffer [100 mM Tris-HCl pH 7.8100 mM
MgCl2 100 mM dithiothreitol (DTT), 5 mM ATP] and 1unit of T4 ligase (MBI Fermentas).
Pre-amplification was performed in a volume of10 μL containing 1 μL ligated template DNA, 1 μL10 × polymerase buffer (see above), 0.8 μL MgCl2
(25 mM), 1 μL of dNTPs (2 mM), 0.3 μl of each pre-selective primer at 10 pmol μL–1 containing one selec-tive nucleotide (EcoRI + A 5′-GACTGCGTACCAA-TTCA-3′ and MseI + C 5′-GATGAGTCCTGAGTAAC-3′) and 0.5 units Taq polymerase (MBI Fermentas).The PCR was performed for 20 cycles of 30 s at 94 °C,30 s at 60 °C and 60 s at 72 °C.
Products of the pre-amplification were dilutedtenfold and used as templates for the selectiveamplification. Eight selective primer-pair combina-tions were analysed: E33/M49 (selective nucleotidesAAG/CAG), E44/M49 (ATC/CAG), E33/M50 (AAG/CAT), E44/M50 (ATC/CAT), E33/M54 (AAG/CCT),E44/M54 (ATC/CCT), E33/M58 (AAG/CGT) and E44/M58 (ATC/CGT). Primers were labelled with eitherinfrared dye (IRD) 700 nm or IRD 800 nm. The PCRprofile consisted of one cycle of 30 s at 94 °C, 30 s at65 °C and 60 s at 72 °C, then 11 cycles of 30 s at94 °C, 30 s at 65–58 °C (0.7 °C reduction per cycle),and 60 s at 72 °C, then and 24 cycles of 30 s at94 °C, 30 s at 56 °C, and 60 s at 72 °C. Amplifiedproducts were separated on 6% polyacrylamide gelusing an automated sequencer (LI-COR 4000; BadHomburg, Germany). The fragment sizes were deter-
mined with a size standard 50 to 700 bp IRD 700/800 (LI-COR) using the software SAGAMX (LI-COR),and polymorphic fragments were scored in the sizerange 70–450 bp. To verify the reproducibility ofamplified fragments, we analysed on average 26individuals two to four times as positive controls foreach primer combination. We then removed thosebands from the data set that were detected in < 75%of pairwise comparisons of the positive controls. Bythis procedure, approximately 38% of all fragmentswere deleted, but the reproducibility increased from85% to 95% and, for two primer combinations, to100%.
The AFLP and microsatellite data sets were ana-lysed as presence–absence data. Microsatellites weretreated as allelic phenotypes as a reliable determina-tion of allelic genotypes was not possible in mostpolyploid individuals. Both data sets contained a lownumber of missing values (< 3.2% in the microsatel-lite data set; < 0.8% in the AFLP data set), whichwere substituted by the most frequent character stateof the respective population. In both data sets wedocumented the number of private alleles and AFLPfragments for each species. Nearly half of theR. mollis samples were taken from herbarium speci-mens and it is known that the reliability of AFLPdata depends on age and condition of herbariumspecimens (Vos et al., 1995; Blears, de Garndis &Trevors, 1998). Therefore, we counted the proportionof absent fragments in the subset of data derived fromherbarium specimens (28 individuals of R. mollis) andcompared it with the data gathered from silica gel-dried material (30 individuals of R. sherardii, 35 ofR. mollis and 99 of R. villosa).
As the effect of the Canina meiosis is to violate theassumption of populations being in Hardy–Weinbergequilibrium, we calculated simple band-based esti-mates of genetic diversity within populations: theShannon index (SI) and the Sørensen (Bray–Curtis)distances (SD, Legendre & Legendre, 1998; see alsoZimmermann et al., 2010). For both data sets,Shannon indices were calculated with the programGenAlEx 6.5 beta 4 (Peakall & Smouse, 2006, 2012)and the Sørensen (Bray–Curtis) distances wereobtained using the multiple response permutationprocedure of the program PC-ORD v. 6.07. The result-ing Sørensen distance matrix was then used toperform a principal coordinate analysis (PCoA) inPC-ORD.
To evaluate methodological problems of the finger-printing techniques, we performed a Mantel testusing GenAlEx to test for a correlation betweengenetic distances derived from AFLP and from micro-satellite data. A second Mantel test excluded theherbarium specimens of R. mollis. The distribution ofmolecular variance (AMOVA) within and among
244 A. KELLNER ET AL.
© 2013 The Linnean Society of London, Botanical Journal of the Linnean Society, 2014, 174, 240–256
populations and among species was calculated usingthe program ARLEQUIN v. 3.11 (Excoffier, Laval &Schneider, 2005).
MORPHOLOGY
We measured 25 morphological characters in 39 indi-viduals of R. mollis, 30 individuals of R. sherardii and99 individuals of R. villosa (Table 2, see also Support-ing Information, Table S2). We were not able toanalyse R. mollis populations 6 and 10 as only leafsamples dried in silica gel were available (see also
Supporting Information, Table S2). Selection and ter-minology of morphological characters followed mainlyLeaf Architecture Working Group (1999) and De Cocket al. (2008) (Table 2, see also Supporting Informa-tion, Table S2). Measurements, a principal componentanalysis and a canonical discriminant analysis of thedata were conducted according to methods describedin Kellner et al. (2012). Additionally, measurements oftwo taxonomically important characters, length andwidth of the terminal leaflet, were visualized in box–whisker plots and compared with an analysis of vari-ance (ANOVA) using SPSS v. 20.
RESULTSPLOIDY
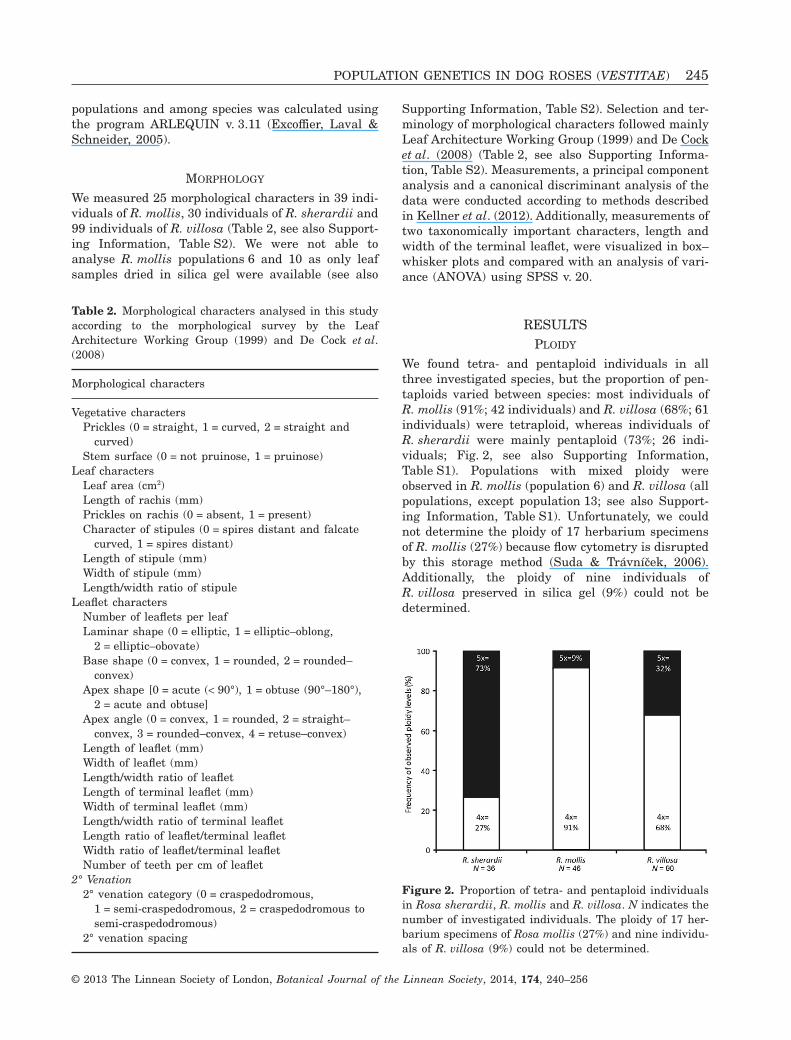
We found tetra- and pentaploid individuals in allthree investigated species, but the proportion of pen-taploids varied between species: most individuals ofR. mollis (91%; 42 individuals) and R. villosa (68%; 61individuals) were tetraploid, whereas individuals ofR. sherardii were mainly pentaploid (73%; 26 indi-viduals; Fig. 2, see also Supporting Information,Table S1). Populations with mixed ploidy wereobserved in R. mollis (population 6) and R. villosa (allpopulations, except population 13; see also Support-ing Information, Table S1). Unfortunately, we couldnot determine the ploidy of 17 herbarium specimensof R. mollis (27%) because flow cytometry is disruptedby this storage method (Suda & Trávnícek, 2006).Additionally, the ploidy of nine individuals ofR. villosa preserved in silica gel (9%) could not bedetermined.
Table 2. Morphological characters analysed in this studyaccording to the morphological survey by the LeafArchitecture Working Group (1999) and De Cock et al.(2008)
Morphological characters
Vegetative charactersPrickles (0 = straight, 1 = curved, 2 = straight and
curved)Stem surface (0 = not pruinose, 1 = pruinose)
Leaf charactersLeaf area (cm2)Length of rachis (mm)Prickles on rachis (0 = absent, 1 = present)Character of stipules (0 = spires distant and falcate
curved, 1 = spires distant)Length of stipule (mm)Width of stipule (mm)Length/width ratio of stipule
Leaflet charactersNumber of leaflets per leafLaminar shape (0 = elliptic, 1 = elliptic–oblong,
2 = elliptic–obovate)Base shape (0 = convex, 1 = rounded, 2 = rounded–
convex)Apex shape [0 = acute (< 90°), 1 = obtuse (90°–180°),
2 = acute and obtuse]Apex angle (0 = convex, 1 = rounded, 2 = straight–
convex, 3 = rounded–convex, 4 = retuse–convex)Length of leaflet (mm)Width of leaflet (mm)Length/width ratio of leafletLength of terminal leaflet (mm)Width of terminal leaflet (mm)Length/width ratio of terminal leafletLength ratio of leaflet/terminal leafletWidth ratio of leaflet/terminal leafletNumber of teeth per cm of leaflet
2° Venation2° venation category (0 = craspedodromous,
1 = semi-craspedodromous, 2 = craspedodromous tosemi-craspedodromous)
2° venation spacing
Figure 2. Proportion of tetra- and pentaploid individualsin Rosa sherardii, R. mollis and R. villosa. N indicates thenumber of investigated individuals. The ploidy of 17 her-barium specimens of Rosa mollis (27%) and nine individu-als of R. villosa (9%) could not be determined.
POPULATION GENETICS IN DOG ROSES (VESTITAE) 245
© 2013 The Linnean Society of London, Botanical Journal of the Linnean Society, 2014, 174, 240–256
SEQUENCES
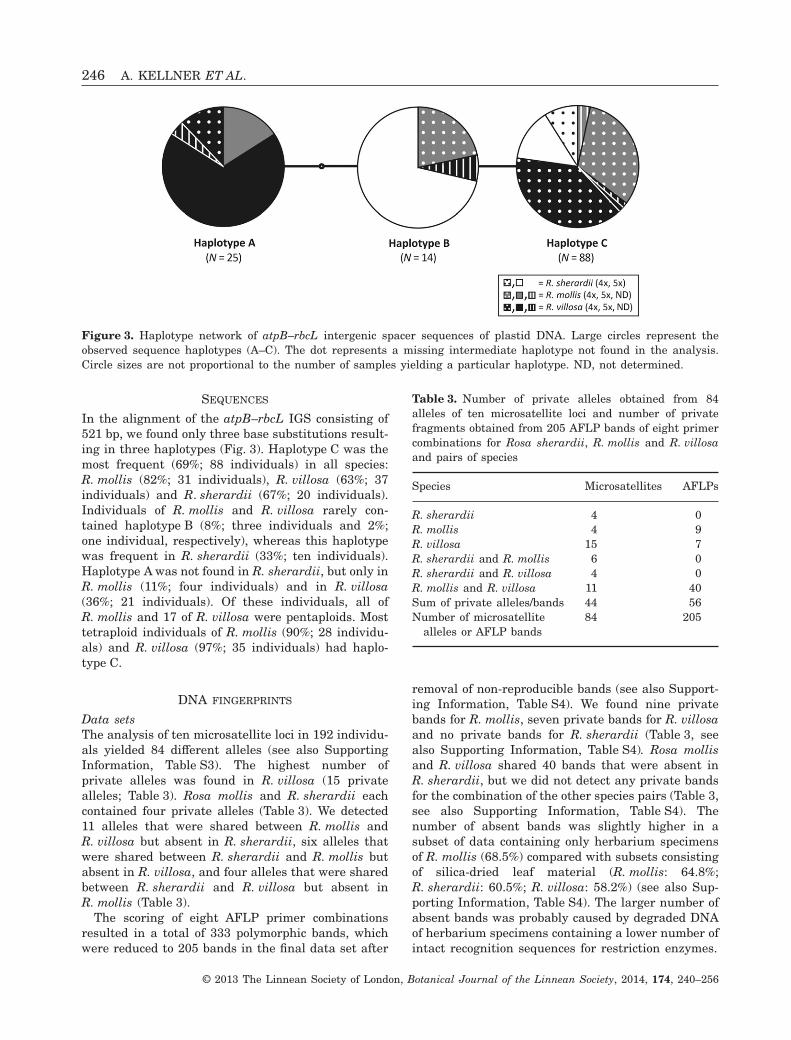
In the alignment of the atpB–rbcL IGS consisting of521 bp, we found only three base substitutions result-ing in three haplotypes (Fig. 3). Haplotype C was themost frequent (69%; 88 individuals) in all species:R. mollis (82%; 31 individuals), R. villosa (63%; 37individuals) and R. sherardii (67%; 20 individuals).Individuals of R. mollis and R. villosa rarely con-tained haplotype B (8%; three individuals and 2%;one individual, respectively), whereas this haplotypewas frequent in R. sherardii (33%; ten individuals).Haplotype A was not found in R. sherardii, but only inR. mollis (11%; four individuals) and in R. villosa(36%; 21 individuals). Of these individuals, all ofR. mollis and 17 of R. villosa were pentaploids. Mosttetraploid individuals of R. mollis (90%; 28 individu-als) and R. villosa (97%; 35 individuals) had haplo-type C.
DNA FINGERPRINTS
Data setsThe analysis of ten microsatellite loci in 192 individu-als yielded 84 different alleles (see also SupportingInformation, Table S3). The highest number ofprivate alleles was found in R. villosa (15 privatealleles; Table 3). Rosa mollis and R. sherardii eachcontained four private alleles (Table 3). We detected11 alleles that were shared between R. mollis andR. villosa but absent in R. sherardii, six alleles thatwere shared between R. sherardii and R. mollis butabsent in R. villosa, and four alleles that were sharedbetween R. sherardii and R. villosa but absent inR. mollis (Table 3).
The scoring of eight AFLP primer combinationsresulted in a total of 333 polymorphic bands, whichwere reduced to 205 bands in the final data set after
removal of non-reproducible bands (see also Support-ing Information, Table S4). We found nine privatebands for R. mollis, seven private bands for R. villosaand no private bands for R. sherardii (Table 3, seealso Supporting Information, Table S4). Rosa mollisand R. villosa shared 40 bands that were absent inR. sherardii, but we did not detect any private bandsfor the combination of the other species pairs (Table 3,see also Supporting Information, Table S4). Thenumber of absent bands was slightly higher in asubset of data containing only herbarium specimensof R. mollis (68.5%) compared with subsets consistingof silica-dried leaf material (R. mollis: 64.8%;R. sherardii: 60.5%; R. villosa: 58.2%) (see also Sup-porting Information, Table S4). The larger number ofabsent bands was probably caused by degraded DNAof herbarium specimens containing a lower number ofintact recognition sequences for restriction enzymes.
Figure 3. Haplotype network of atpB–rbcL intergenic spacer sequences of plastid DNA. Large circles represent theobserved sequence haplotypes (A–C). The dot represents a missing intermediate haplotype not found in the analysis.Circle sizes are not proportional to the number of samples yielding a particular haplotype. ND, not determined.
Table 3. Number of private alleles obtained from 84alleles of ten microsatellite loci and number of privatefragments obtained from 205 AFLP bands of eight primercombinations for Rosa sherardii, R. mollis and R. villosaand pairs of species
Species Microsatellites AFLPs
R. sherardii 4 0R. mollis 4 9R. villosa 15 7R. sherardii and R. mollis 6 0R. sherardii and R. villosa 4 0R. mollis and R. villosa 11 40Sum of private alleles/bands 44 56Number of microsatellite
alleles or AFLP bands84 205
246 A. KELLNER ET AL.
© 2013 The Linnean Society of London, Botanical Journal of the Linnean Society, 2014, 174, 240–256
Genetic diversityThe range of the average Sørensen distances perpopulation was similar to the range of the Shannonindices when based on microsatellites (SD = 0.000–0.286, SI = 0.000–0.245) or on AFLPs (SD = 0.066–0.476, SI = 0.024–0.366) (Table 4). We obtained zerovalues for the genetic diversity of population 10 ofR. mollis, but we could sample only two individuals inthis population (Table 4). Values for the speciesR. sherardii (SD = 0.224/0.179, SI = 0.192/0.206) andR. villosa (SD = 0.235/0.265, SI = 0.238/0.348) weresimilar, independent of whether they were based onmicrosatellites or AFLPs. Genetic diversities esti-mated for R. mollis differed much more betweenmicrosatellite data (SD = 0.198, SI = 0.201) and AFLPdata (SD = 0.420, SI = 0.378). The Sørensen distancesespecially were highest in populations for which DNAwas extracted from herbarium specimens (popula-tions 4, 5, 8, 9; see also Supporting Information,Table S1), but the Shannon index was highest in onepopulation for which DNA was extracted from mate-rial preserved with silica gel (population 7; see alsoSupporting Information, Table S1) and in three popu-
lations for which DNA was extracted from herbariumspecimens (populations 4, 5, 8; see also SupportingInformation, Table S1).
Principal coordinate analysisThe PCoA based on Sørensen distances calculatedfrom microsatellites and AFLPs are presented inFigure 4. In the microsatellite analysis, the first twoaxes explained 29.9% and 13.9% of the variance, butthey did not separate species (Fig. 4A). Samples ofR. mollis and R. sherardii were nearly completelyintermixed and overlapped with samples of R. villosa.Individuals of R. villosa were split into two groups,which correspond to different ploidies, but not to thegeographical origin of individuals. The pentaploidindividuals of R. villosa clustered with the pentaploidindividuals of R. mollis from population 6 and thetetraploid individuals of R. villosa clustered withmost of the tetraploid R. mollis (Fig. 4A). In the PCoAof the AFLP data set, the first two axes explained22.1% and 9.2% of the variance, but they also did notreveal any distinct separation between the species(Fig. 4B). Samples of R. sherardii overlapped almost
Table 4. Average Sørensen distances of genetic dissimilarity and average Shannon diversity for each investigatedpopulation and for each species based on 84 alleles of ten microsatellite loci and 205 AFLP bands of eight primercombinations
SpeciesPopulationidentification
No. ofindividuals
Average Sørensen distancesfor populations/species
Average Shannon diversityfor populations/species
Microsatellites AFLPs Microsatellites AFLPs
R. sherardii 1 14 0.180 0.142 0.163 0.1562 8 0.014 0.095 0.011 0.0923 8 0.028 0.120 0.026 0.121
Species Species Species Species0.224 0.179 0.192 0.206
R. mollis 4 10 0.222 0.473 0.176 0.3365 12 0.225 0.463 0.191 0.3666 22 0.133 0.263 0.127 0.2727 11 0.068 0.256 0.062 0.2598 4 0.224 0.476 0.133 0.2929 2 0.286 0.473 0.155 0.153
10 2 0 0.066 0 0.024Species Species Species Species0.198 0.419 0.201 0.378
R. villosa 11 21 0.235 0.234 0.190 0.30312 26 0.250 0.190 0.245 0.25913 4 0.117 0.253 0.072 0.25114 18 0.202 0.243 0.179 0.25015 24 0.113 0.213 0.130 0.27016 6 0.166 0.245 0.125 0.227
Species Species Species Species0.235 0.265 0.238 0.348
POPULATION GENETICS IN DOG ROSES (VESTITAE) 247
© 2013 The Linnean Society of London, Botanical Journal of the Linnean Society, 2014, 174, 240–256
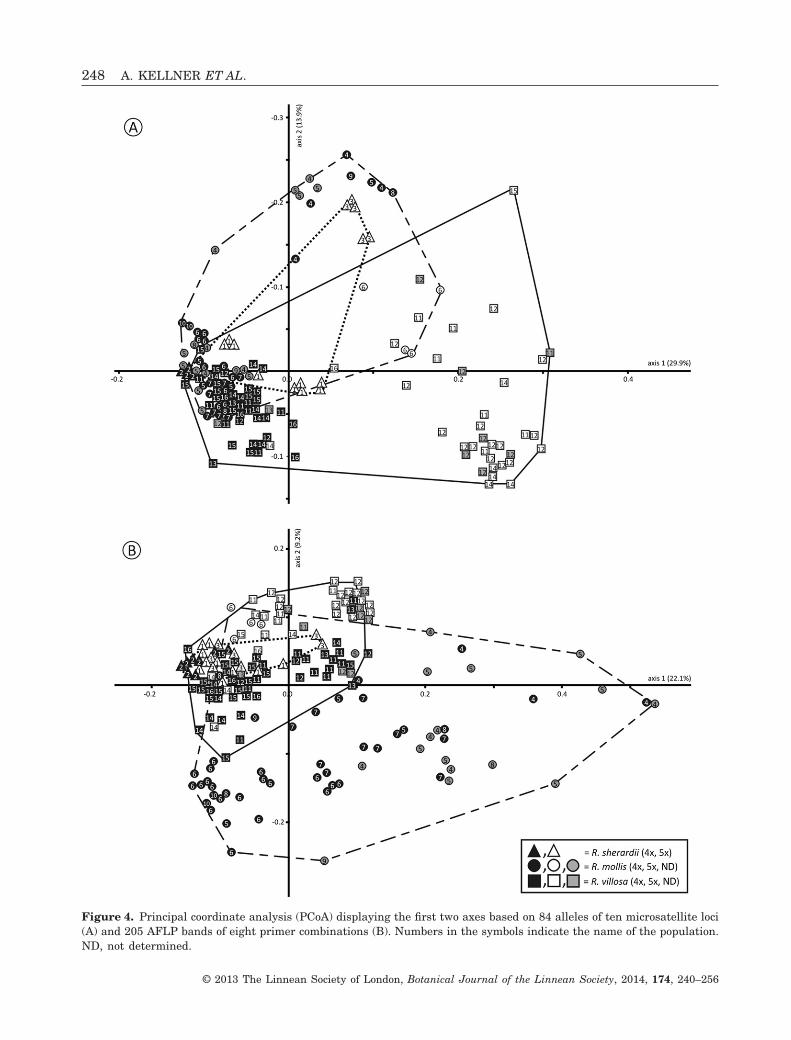
Figure 4. Principal coordinate analysis (PCoA) displaying the first two axes based on 84 alleles of ten microsatellite loci(A) and 205 AFLP bands of eight primer combinations (B). Numbers in the symbols indicate the name of the population.ND, not determined.
248 A. KELLNER ET AL.
© 2013 The Linnean Society of London, Botanical Journal of the Linnean Society, 2014, 174, 240–256
entirely with those of R. villosa. In contrast to themicrosatellite data, samples of R. mollis were scat-tered widely across the diagram, but the pentaploidindividuals of population 6 were close to the penta-ploid individuals of R. villosa (Fig. 4B). Thus, the splitbetween ploidies in R. villosa was again observed, butit was much less pronounced than in the microsatel-lite data (Fig. 4A).
Mantel testGenetic distances calculated from microsatellite datawere weakly correlated with those from AFLP data(r2 = 0.21; P < 0.001). However, the correlationincreased if samples taken from herbarium specimenswere excluded from the analysis (r2 = 0.30; P < 0.001),suggesting that AFLP fingerprinting was influencedby age or storing conditions of the samples.
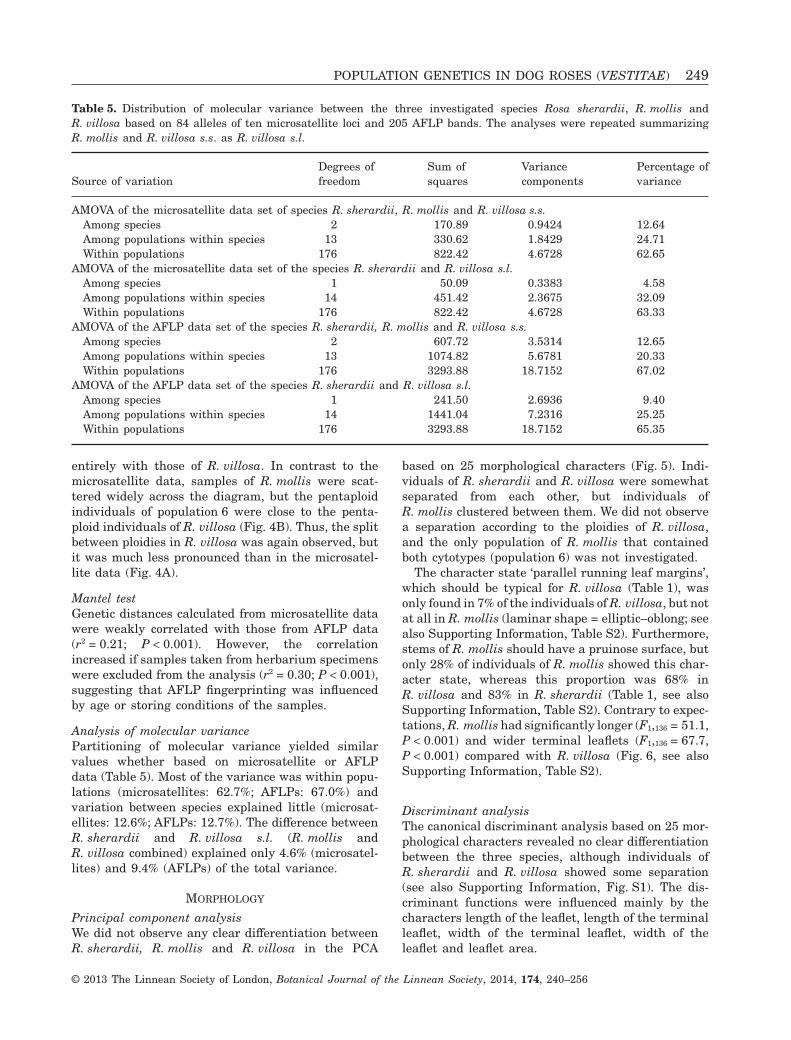
Analysis of molecular variancePartitioning of molecular variance yielded similarvalues whether based on microsatellite or AFLPdata (Table 5). Most of the variance was within popu-lations (microsatellites: 62.7%; AFLPs: 67.0%) andvariation between species explained little (microsat-ellites: 12.6%; AFLPs: 12.7%). The difference betweenR. sherardii and R. villosa s.l. (R. mollis andR. villosa combined) explained only 4.6% (microsatel-lites) and 9.4% (AFLPs) of the total variance.
MORPHOLOGY
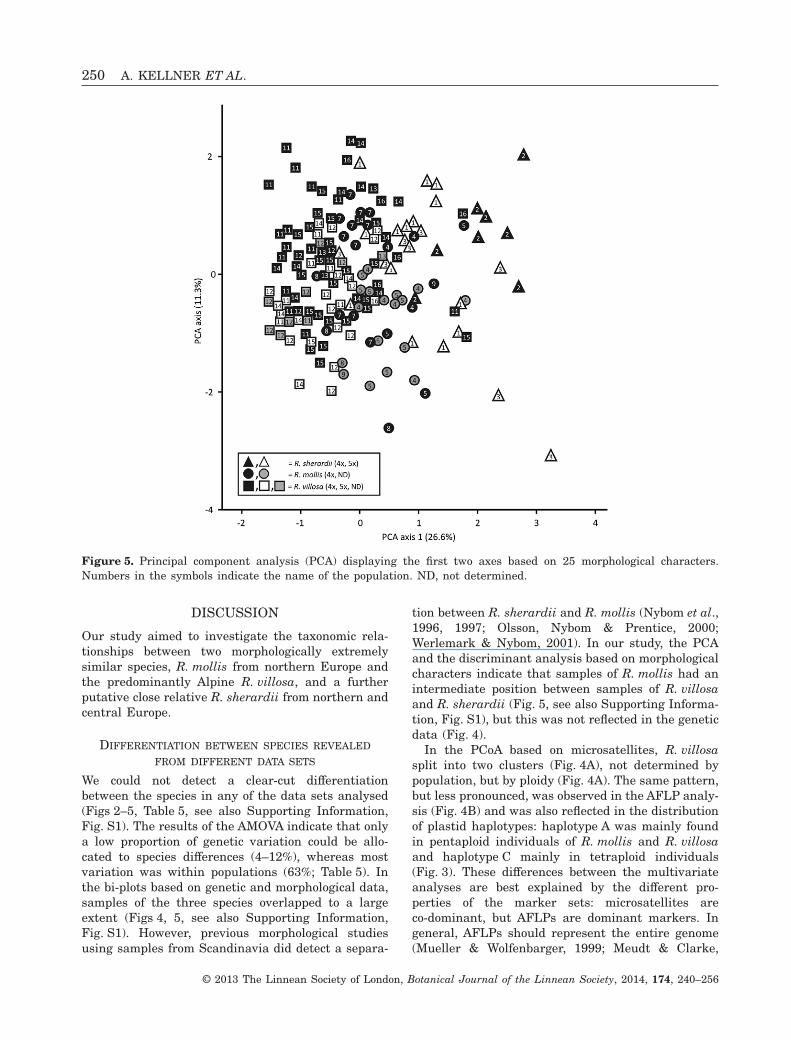
Principal component analysisWe did not observe any clear differentiation betweenR. sherardii, R. mollis and R. villosa in the PCA
based on 25 morphological characters (Fig. 5). Indi-viduals of R. sherardii and R. villosa were somewhatseparated from each other, but individuals ofR. mollis clustered between them. We did not observea separation according to the ploidies of R. villosa,and the only population of R. mollis that containedboth cytotypes (population 6) was not investigated.
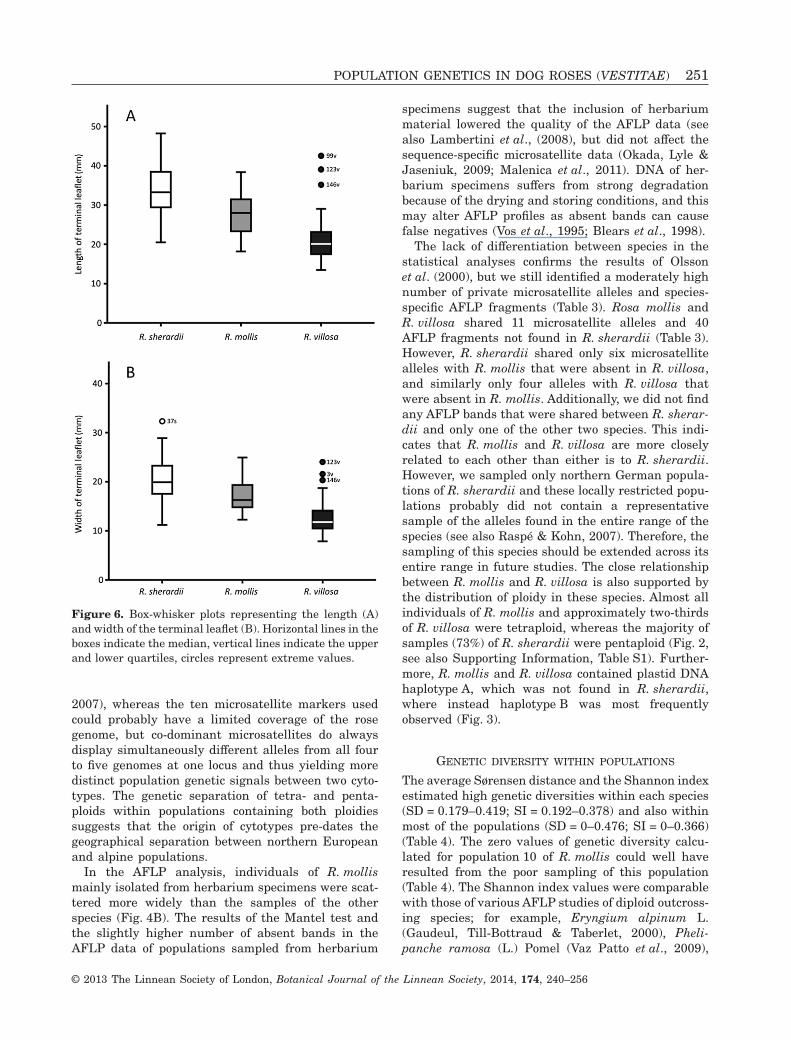
The character state ‘parallel running leaf margins’,which should be typical for R. villosa (Table 1), wasonly found in 7% of the individuals of R. villosa, but notat all in R. mollis (laminar shape = elliptic–oblong; seealso Supporting Information, Table S2). Furthermore,stems of R. mollis should have a pruinose surface, butonly 28% of individuals of R. mollis showed this char-acter state, whereas this proportion was 68% inR. villosa and 83% in R. sherardii (Table 1, see alsoSupporting Information, Table S2). Contrary to expec-tations, R. mollis had significantly longer (F1,136 = 51.1,P < 0.001) and wider terminal leaflets (F1,136 = 67.7,P < 0.001) compared with R. villosa (Fig. 6, see alsoSupporting Information, Table S2).
Discriminant analysisThe canonical discriminant analysis based on 25 mor-phological characters revealed no clear differentiationbetween the three species, although individuals ofR. sherardii and R. villosa showed some separation(see also Supporting Information, Fig. S1). The dis-criminant functions were influenced mainly by thecharacters length of the leaflet, length of the terminalleaflet, width of the terminal leaflet, width of theleaflet and leaflet area.
Table 5. Distribution of molecular variance between the three investigated species Rosa sherardii, R. mollis andR. villosa based on 84 alleles of ten microsatellite loci and 205 AFLP bands. The analyses were repeated summarizingR. mollis and R. villosa s.s. as R. villosa s.l.
Source of variationDegrees offreedom
Sum ofsquares
Variancecomponents
Percentage ofvariance
AMOVA of the microsatellite data set of species R. sherardii, R. mollis and R. villosa s.s.Among species 2 170.89 0.9424 12.64Among populations within species 13 330.62 1.8429 24.71Within populations 176 822.42 4.6728 62.65
AMOVA of the microsatellite data set of the species R. sherardii and R. villosa s.l.Among species 1 50.09 0.3383 4.58Among populations within species 14 451.42 2.3675 32.09Within populations 176 822.42 4.6728 63.33
AMOVA of the AFLP data set of the species R. sherardii, R. mollis and R. villosa s.s.Among species 2 607.72 3.5314 12.65Among populations within species 13 1074.82 5.6781 20.33Within populations 176 3293.88 18.7152 67.02
AMOVA of the AFLP data set of the species R. sherardii and R. villosa s.l.Among species 1 241.50 2.6936 9.40Among populations within species 14 1441.04 7.2316 25.25Within populations 176 3293.88 18.7152 65.35
POPULATION GENETICS IN DOG ROSES (VESTITAE) 249
© 2013 The Linnean Society of London, Botanical Journal of the Linnean Society, 2014, 174, 240–256
DISCUSSION
Our study aimed to investigate the taxonomic rela-tionships between two morphologically extremelysimilar species, R. mollis from northern Europe andthe predominantly Alpine R. villosa, and a furtherputative close relative R. sherardii from northern andcentral Europe.
DIFFERENTIATION BETWEEN SPECIES REVEALED
FROM DIFFERENT DATA SETS
We could not detect a clear-cut differentiationbetween the species in any of the data sets analysed(Figs 2–5, Table 5, see also Supporting Information,Fig. S1). The results of the AMOVA indicate that onlya low proportion of genetic variation could be allo-cated to species differences (4–12%), whereas mostvariation was within populations (63%; Table 5). Inthe bi-plots based on genetic and morphological data,samples of the three species overlapped to a largeextent (Figs 4, 5, see also Supporting Information,Fig. S1). However, previous morphological studiesusing samples from Scandinavia did detect a separa-
tion between R. sherardii and R. mollis (Nybom et al.,1996, 1997; Olsson, Nybom & Prentice, 2000;Werlemark & Nybom, 2001). In our study, the PCAand the discriminant analysis based on morphologicalcharacters indicate that samples of R. mollis had anintermediate position between samples of R. villosaand R. sherardii (Fig. 5, see also Supporting Informa-tion, Fig. S1), but this was not reflected in the geneticdata (Fig. 4).
In the PCoA based on microsatellites, R. villosasplit into two clusters (Fig. 4A), not determined bypopulation, but by ploidy (Fig. 4A). The same pattern,but less pronounced, was observed in the AFLP analy-sis (Fig. 4B) and was also reflected in the distributionof plastid haplotypes: haplotype A was mainly foundin pentaploid individuals of R. mollis and R. villosaand haplotype C mainly in tetraploid individuals(Fig. 3). These differences between the multivariateanalyses are best explained by the different pro-perties of the marker sets: microsatellites areco-dominant, but AFLPs are dominant markers. Ingeneral, AFLPs should represent the entire genome(Mueller & Wolfenbarger, 1999; Meudt & Clarke,
Figure 5. Principal component analysis (PCA) displaying the first two axes based on 25 morphological characters.Numbers in the symbols indicate the name of the population. ND, not determined.
250 A. KELLNER ET AL.
© 2013 The Linnean Society of London, Botanical Journal of the Linnean Society, 2014, 174, 240–256
2007), whereas the ten microsatellite markers usedcould probably have a limited coverage of the rosegenome, but co-dominant microsatellites do alwaysdisplay simultaneously different alleles from all fourto five genomes at one locus and thus yielding moredistinct population genetic signals between two cyto-types. The genetic separation of tetra- and penta-ploids within populations containing both ploidiessuggests that the origin of cytotypes pre-dates thegeographical separation between northern Europeanand alpine populations.
In the AFLP analysis, individuals of R. mollismainly isolated from herbarium specimens were scat-tered more widely than the samples of the otherspecies (Fig. 4B). The results of the Mantel test andthe slightly higher number of absent bands in theAFLP data of populations sampled from herbarium
specimens suggest that the inclusion of herbariummaterial lowered the quality of the AFLP data (seealso Lambertini et al., (2008), but did not affect thesequence-specific microsatellite data (Okada, Lyle &Jaseniuk, 2009; Malenica et al., 2011). DNA of her-barium specimens suffers from strong degradationbecause of the drying and storing conditions, and thismay alter AFLP profiles as absent bands can causefalse negatives (Vos et al., 1995; Blears et al., 1998).
The lack of differentiation between species in thestatistical analyses confirms the results of Olssonet al. (2000), but we still identified a moderately highnumber of private microsatellite alleles and species-specific AFLP fragments (Table 3). Rosa mollis andR. villosa shared 11 microsatellite alleles and 40AFLP fragments not found in R. sherardii (Table 3).However, R. sherardii shared only six microsatellitealleles with R. mollis that were absent in R. villosa,and similarly only four alleles with R. villosa thatwere absent in R. mollis. Additionally, we did not findany AFLP bands that were shared between R. sherar-dii and only one of the other two species. This indi-cates that R. mollis and R. villosa are more closelyrelated to each other than either is to R. sherardii.However, we sampled only northern German popula-tions of R. sherardii and these locally restricted popu-lations probably did not contain a representativesample of the alleles found in the entire range of thespecies (see also Raspé & Kohn, 2007). Therefore, thesampling of this species should be extended across itsentire range in future studies. The close relationshipbetween R. mollis and R. villosa is also supported bythe distribution of ploidy in these species. Almost allindividuals of R. mollis and approximately two-thirdsof R. villosa were tetraploid, whereas the majority ofsamples (73%) of R. sherardii were pentaploid (Fig. 2,see also Supporting Information, Table S1). Further-more, R. mollis and R. villosa contained plastid DNAhaplotype A, which was not found in R. sherardii,where instead haplotype B was most frequentlyobserved (Fig. 3).
GENETIC DIVERSITY WITHIN POPULATIONS
The average Sørensen distance and the Shannon indexestimated high genetic diversities within each species(SD = 0.179–0.419; SI = 0.192–0.378) and also withinmost of the populations (SD = 0–0.476; SI = 0–0.366)(Table 4). The zero values of genetic diversity calcu-lated for population 10 of R. mollis could well haveresulted from the poor sampling of this population(Table 4). The Shannon index values were comparablewith those of various AFLP studies of diploid outcross-ing species; for example, Eryngium alpinum L.(Gaudeul, Till-Bottraud & Taberlet, 2000), Pheli-panche ramosa (L.) Pomel (Vaz Patto et al., 2009),
Figure 6. Box-whisker plots representing the length (A)and width of the terminal leaflet (B). Horizontal lines in theboxes indicate the median, vertical lines indicate the upperand lower quartiles, circles represent extreme values.
POPULATION GENETICS IN DOG ROSES (VESTITAE) 251
© 2013 The Linnean Society of London, Botanical Journal of the Linnean Society, 2014, 174, 240–256
Campanula sabatia De Not. (Nicoletti et al., 2012) andCochlearia pyrenaica DC. (Cires et al., 2011). Highlevels of within-population diversity may point to highoutcrossing rates in dog roses, as detected by Kellneret al. (2012), who found a high percentage of sponta-neous hybrids (45%) between the tetraploid R. mollisand the diploid R. rugosa in the field. Jürgens, Seitz &Kowarik (2007) observed high RAPD-based variationwithin populations, but low variation among popula-tions in the pentaploid R. canina. In contrast, geneticcomparisons between offspring and their parents in anatural dog rose population in Germany revealedrather high rates of selfing (Ritz & Wissemann, 2011).Thus, an alternative explanation for high levels ofgenetic diversity may be the fixed heterozygosity of theallopolyploid dog roses because of the unbalancedCanina meiosis (Ritz et al., 2005). As documented bymicrosatellite data, the univalent forming genomesretain high levels of genetic diversity because they areexcluded from meiotic recombination (Nybom et al.,2006). This hypothesis predicts higher levels of geneticdiversity in the pentaploid R. sherardii possessingthree univalent genomes compared with the tetraploidR. mollis and R. villosa containing only two univalentgenomes. However, this was not the case (Table 4);perhaps the results were affected by our limited sam-pling of R. sherardii.
Sørensen distances and Shannon indices ofR. villosa were in the same range as those obtainedfor R. sherardii and R. mollis. Thus, populations ofR. villosa sampled in a small-scale alpine landscapewith strong geographical fragmentation apparentlydid not suffer from restricted gene flow, as shown alsofor some herbaceous alpine plant species (Stoecklin,Kuss & Pluess, 2009). Sørensen distances andShannon indices of R. sherardii and R. villosaobtained from AFLP data were in the same range asthose calculated from microsatellite data, but diver-sity indices of R. mollis obtained from AFLPs weretwice as high as those from microsatellites (Table 4).We assume that these higher values based on AFLPsprobably resulted from the more variable band pat-terns of herbarium specimens of R. mollis plants (seeabove).
TAXONOMIC IMPLICATIONS
Rosa sherardii is differentiated from R. mollis andR. villosa by its falcate prickles with a decurrent base(Henker, 2000) and by its deeply divided sepals thatare shorter than the petals, in contrast to straightprickles and entire sepals longer than the petals ofR. mollis and R. villosa (Table 1). Unfortunately, wedid not investigate flower characters, but we observedalmost straight prickles in most individuals ofR. sherardii (see also Supporting Information,
Table S2). However, our sampling of R. sherardii wasrestricted to northern Germany (Fig. 1) and this char-acter state might be special to these populations.Although multivariate statistics did not clearly sepa-rate R. sherardii from R. mollis and R. villosa (Figs 4,5), the predominantly pentaploid chromosomenumber (Fig. 2), the absence of haplotype A inR. sherardii (Fig. 3) with the morphologically dis-criminating characters (Table 1) support its status asa separate taxon. These results are comparable withother studies, demonstrating that differences betweencytotypes facilitated plant speciation (Saxifraga:Gudahl et al., 2005; Narcissus: Zonneveld, 2008;Cerastium: Letz et al., 2012). However, to fix thetaxonomic status of R. sherardii we need additionaldata from its entire distribution area, and the twoother closely related species R. tomentosa andR. pseudoscabriuscula should also be investigated.
Rosa villosa differs from R. mollis in the size of theterminal leaflet and in whether the leaflets haveparallel margins (Nilsson, 1967; Henker, 2000).However, these differences were not confirmed in ourstudy (see Fig. 6, see also Supporting Information,Table S2). Furthermore, R. mollis should be differen-tiated by its pruinose stems (Nilsson, 1967; Henker,2000). This character was rare in R. mollis and couldalso be observed in R. villosa (see also SupportingInformation, Table S2). Our sampling of R. villosawas restricted to the Valais in Switzerland and theseplants probably correspond to the dwarf forms men-tioned by Henker (2000). However, we assume thatthese populations represent the original morphotypeof this species, and that the larger individuals foundin lowlands, especially in Germany and Scandinavia,are strongly influenced by cultivation. Rosa villosahas been cultivated for centuries, resulting in largeplants with increased fruit size (Bakker, Maes &Kruijer, 2011). Because of the lack of genetic or mor-phological differentiation, we prefer to treat R. villosasensu Ehrendorfer (1973), including the northerly dis-tributed R. mollis.
NATURAL DISJUNCTION BETWEEN R. MOLLIS AND
R. VILLOSA
We suppose that the disjunct distribution between thepopulation of R. villosa from northern Europe(R. mollis) and populations from mountainous regionsof central and southern Europe (Fig. 1) is a conse-quence of the latest glaciation. The close floristicaffinity of the arctic and alpine floras has beenexplained by several survival scenarios of plant speciesduring the last glaciation period in the Pleistocene(c. 12 000 years ago), and is a matter of ongoing debatein biogeography. One scenario predicts that plantspecies survived in peripheral refugia and recolonized
252 A. KELLNER ET AL.
© 2013 The Linnean Society of London, Botanical Journal of the Linnean Society, 2014, 174, 240–256
their former ranges after the retreat of the glaciers(Stehlik, 2003; Bettin et al., 2007; Parisod, 2008;Jadwiszczak et al., 2011). Other studies have sug-gested that some species survived the glaciation onisolated ice-free mountain tops within the ice shield, socalled nunataks (Stehlik, 2000; Stehlik et al., 2002;Michl et al., 2010; Westergaard et al., 2011) or onexposed continental shelves in, for example, northernand western Scandinavia (Abbott & Brochmann,2003). The low genetic and morphological differentia-tion between the northerly distributed populations ofR. villosa (= R. mollis) and the alpine populations(Figs 2–5) suggests that the range of the species wascontinuous prior to the last glaciation. In contrast tothe comparable values of genetic diversity betweengeographically separated populations (Table 4), pro-nounced differences between genetic diversity of south-ern and northern populations were found in typicalarctic–alpine herbs such as Saxifraga cernua L.(Bauert et al., 1998) and Ranunculus glacialis L.(Schönswetter et al., 2003), implying postglacialrecolonization events from areas of high genetic vari-ation towards areas of low genetic variation. Weassume that the southern populations of our dog rosespecies (R. villosa s.s.) survived along the southernedge of the ice sheet or were restricted to nunataks inthe Alps, as shown for Eritrichium Schrad. ex Gaudin(Stehlik, 2000). The northern populations (R. mollis)probably grew in non-glaciated regions that existed in,for example, southern Norway (Nesje & Dahl, 1992;Arnold et al., 2002) or on nunataks (Winguth et al.,2005; Linge et al., 2006; Paus et al., 2006), as could beshown for Arenaria humifusa Wahlenb. and Saginacaespitosa (J.Vahl) Lange (Westergaard et al., 2011).After the retreat of the ice sheets, the species complexof R. mollis and R. villosa failed to recover its formercontinuous distribution.
An alternative explanation for the genetic similar-ity between the two regions is that dog roses hybrid-ize easily and thus the genetic differentiation mighthave been hindered by gene flow via more widespreaddog rose species. As a third possibility, R. mollis andR. villosa (Fig. 2) may have originated polyphyleti-cally by independent hybridization events, with theirgenetic similarity then attributable to their sharedtetraploidy (in contrast to the pentaploid R. sherar-dii). However, because of the striking morphologicalsimilarity between R. mollis and R. villosa, and theirshared plastid DNA haplotypes (Fig. 3), we regard theglacial refugia hypothesis as more likely.
ACKNOWLEDGEMENTS
We thank the members of the nature protecting agen-cies of the ‘Landesamt für Landwirtschaft, Umweltund ländliche Räume Schleswig-Holstein’ for permis-
sion to collect plant material in the nature conserva-tion area Geltinger Birk. We thank the members ofthe ‘Integrierte Station Geltinger Birk’ for their helpduring sampling, H. Kämmer (Talheim, Germany) forproviding herbarium specimens and A. Eigner(Lebrade, Germany) for useful information. We thankD. Esselink (Plant Research International B.V., Wage-ningen, the Netherlands) for providing the primers ofthe microsatellite loci and H. Nybom and her col-leagues (Department of Plant Breeding andBiotechnology-Balsgård, Swedish University of Agri-cultural Sciences, Kristianstad, Sweden) for the prac-tical course about microsatellite techniques. Wethank J. Föller, H. Krufczik, A. Opitz, E. Karn and E.Stempinski (Department of Systematic Botany,Justus-Liebig-University Gießen, Germany) and Th.Wilke and his colleagues (Department of AnimalEcology and Systematics, Gießen, Germany) for theirkind help during field and laboratory work. We wouldlike to thank M. Ritz and K. Wesche (Department ofBotany, Senckenberg Museum of Natural HistoryGörlitz, Germany) for their help with statistics and J.M. C. Hutchinson (Department of Zoology, Sencken-berg Museum of Natural History Görlitz, Germany)for language editing. We thank the three anonymousreviewers and editor for their very helpful commentsand suggestions.
REFERENCES
Abbott RJ, Brochmann C. 2003. History and evolution ofthe Arctic flora: in the footsteps of Eric Hultén. MolecularEcology 12: 299–313.
Arnold NS, van Andel TH, Valen V. 2002. Extent anddynamics of the Scandinavian ice sheet during OxygenIsotope Stage 3 (65,000-25,000 yr B.P.). QuaternaryResearch 57: 38–48.
Bakker P, Maes B, Kruijer H. 2011. De wilde rozen (RosaL.) van Nederland. Gorteria 35: 1–173.
Bauert MR, Kalin M, Baltisberger M, Edwards PJ. 1998.No genetic variation detected within isolated relict popula-tions of Saxifraga cernua in the Alps using RAPD markers.Molecular Ecology 7: 1519–1527.
Bettin O, Cornejo C, Edwards PJ, Holderegger R. 2007.Phylogeography of the high alpine plant Senecio halleri(Asteraceae) in the European Alps: in situ glacial survivalwith postglacial stepwise dispersal into peripheral areas.Molecular Ecology 16: 2517–2524.
Blackburn KB. 1925. Chromosomes and classification in thegenus Rosa. American Naturalist 59: 200–204.
Blears MJ, de Garndis SA, Trevors JT. 1998. Amplifiedfragment length polymorphism (AFLP): a review of theprocedure and its applications. Journal of Microbiology andBiotechnology 21: 99–114.
Brochmann C, Brysting AK, Alsos IG, Borgen L, GrundtHH, Scheen AC, Elven R. 2004. Polyploidy in Arctic
POPULATION GENETICS IN DOG ROSES (VESTITAE) 253
© 2013 The Linnean Society of London, Botanical Journal of the Linnean Society, 2014, 174, 240–256
plants. Biological Journal of the Linnean Society 82: 521–536.
Cires E, Samain M-S, Goetghebeur P, Fernández PrietoJA. 2011. Genetic structure in peripheral Western Euro-pean populations of the endangered species Cochlearia pyr-enaica (Brassicaceae). Plant Systematics and Evolution 297:75–85.
Clement M, Posada D, Crandall KA. 2000. TCS – a com-puter program to estimate gene genealogies. MolecularEcology 9: 1657–1659.
De Cock K, Vander Mijnsbrugge K, Breyne P,Van Bockstaele E, Van Slycken J. 2008. Morphologicaland AFLP-based differentiation within the taxonomicalcomplex section Caninae (subgenus Rosa). Annals of Botany102: 685–697.
Ehrendorfer F. 1973. Liste der Gefäßpflanzen Mitteleuropas.Stuttgart: G. Fischer.
Eigner A. 1993. Große Sorgen um Rosa mollis auf derGeltinger Birk. Kieler Notizen zur Pflanzenkunde inSchleswig-Holstein und Hamburg 22: 30–31.
Eigner A, Wissemann V. 1999. Rosa × mangii, eine neueintersektionelle Hybride charakterisiert durch morpholo-gische und genetische Untersuchungen. Haussknechtia 7:35–40.
Ercisli S. 2007. Chemical composition of fruits in somerose (Rosa spp.) species. Food Chemistry 104: 1379–1384.
Esselink GD, Smulders MJM, Vosman B. 2003. Identifi-cation of cut rose (Rosa hybrida) and rootstock varietiesusing robust sequence tagged microsatellite site markers.Theoretical and Applied Genetics 106: 277–286.
Excoffier L, Laval G, Schneider S. 2005. Arlequin(version 3.0): an integrated software package for populationgenetics data analysis. Evolutionary Bioinformatics 1:47–50.
Gaudeul M, Till-Bottraud I, Taberlet P. 2000. Geneticdiversity in an endangered alpine plant, Eryngium alpinumL. (Apiaceae), inferred from AFLP markers. MolecularEcology 9: 1625–1637.
Graham GG, Primavesi AL. 1993. Roses of Great Britainand Ireland. London: Botanical Society of the British Isles,1–208.
Gudahl AS, Gabrielsen TM, Scheen A-C, Borgen L,Steen SW, Spjelkavik S, Brochmann C. 2005. The Saxi-fraga rivularis complex in Svalbard: molecules, ploidy andmorphology. Flora 200: 207–221.
Gunes M. 2010. Pomological and phenological characteristicsof promising rose hip (Rosa) genotypes. African Journal ofBiotechnology 9: 6301–6306.
Haeupler H, Schönfelder P. 1988. Atlas der Farn- undBlütenpflanzen der Bundesrepublik Deutschland. Stuttgart:Ulmer.
Hall TA. 1999. BioEdit: a user-friendly biological sequencealignment editor and analysis.
Henker H. 2000. Rosa. In: Conert HJ, Jäger EJ, KadereitJW, Schultze-Motel W, Wagenitz G, Weber HE, eds. Illus-trierte Flora von Mitteleuropa. Berlin: Parey Buchverlag,1–108.
Herklotz V. 2012. Populationsgenetik und Hybridisierungvon Hundsrosen auf dem Strohmberg (Oberlausitz/Sachsen). Master Thesis, IHI Zittau, Germany.
Husband BC, Schemske DW. 1998. Cytotype distribution ata diploid–tetraploid contact zone in Chamerion (Epilobium)angustifolium (Onagraceae). American Journal of Botany85: 1688–1694.
Jadwiszczak KA, Banaszek A, Jabłonska E, Sozinov OV.2011. Could Betula humilis have survived the last glacia-tion at a current margin of its distribution? Testing thehypothesis of a glacial refugium using nuclear microsatel-lites. Plant Systematics and Evolution 297: 147–156.
Jäger EJ. 1999. Rothmaler − Exkursionsflora vonDeutschland − Gefäßpflanzen Grundband. Heidelberg:Spektrum Akademischer Verlag.
Jäger EJ. 2011. Rothmaler − Exkursionsflora vonDeutschland − Gefäßpflanzen Grundband. Heidelberg:Spektrum Akademischer Verlag.
Jürgens AH, Seitz B, Kowarik I. 2007. Genetic differentia-tion of Rosa canina (L.) at regional and continental scales.Plant Systematics and Evolution 269: 39–53.
Kellner A, Ritz CM, Wissemann V. 2012. Hybridization byinvasive Rosa rugosa Thunb. threatens the genetic integrityof native Rosa mollis Sm. Botanical Journal of the LinneanSociety 170: 472–484.
Kurtto A, Lampinen R, Junikka L. 2004. Atlas FloraeEuropaeae − distribution of vascular plants in Europe.Vol. 13. Rosaceae (Spiraea to Fragaria, excl. Rubus). Hel-sinki: The Committee for Mapping the Flora of Europe andSocietas Biologica Fennica Vanamo.
Lambertini C, Frydenberg J, Gustafsson MHG, Brix H.2008. Herbarium specimens as a source of DNA for AFLPfingerprinting of Phragmites (Poaceae): possibilities andlimitations. Plant Systematics and Evolution 272: 223–231.
Leaf Architecture Working Group. 1999. Manual of leafarchitecture – morphological description and categorizationof dicotyledonous and net-veined monocotyledonous angio-sperms. Washington: Leaf Architecture Working Group.
Legendre P, Legendre L. 1998. Numerical ecology. Amster-dam: Elsevier.
Letz DR, Dancák M, Danihelka J, Šarhanová P. 2012.Taxonomy and distribution of Cerastium pumilum andC. glustinosum in Central Europe. Preslia 84: 33–69.
Levin DA. 2000. The origin, expansion and demise of plantspecies. New York: Oxford University Press.
Linge H, Brook EJ, Nesje A, Raisbeck GM, Yiou F, ClarkH. 2006. In situ Be-10 exposure ages from southeasternNorway: implications for the geometry of the WeichselianScandinavian ice sheet. Quaternary Science Reviews 25:1097–1109.
Malenica N, Šimon S, Besendorfer V, Maletic E, KonticJK, Pejic I. 2011. Whole genome amplification and micro-satellite genotyping of herbarium DNA revealed the identityof an ancient grapevine cultivar. Die Naturwissenschaften98: 763–772.
Meudt HM, Clarke AC. 2007. Almost forgotten or latestpractice? AFLP applications, analyses and advances. Trendsin Plant Science 12: 106–117.
254 A. KELLNER ET AL.
© 2013 The Linnean Society of London, Botanical Journal of the Linnean Society, 2014, 174, 240–256
Michl T, Huck S, Schmitt T, Liebrich A, Haase P, BuedelB. 2010. The molecular population structure of the tall forbCicerbita alpina (Asteraceae) supports the idea of crypticglacial refugia in central Europe. Botanical Journal of theLinnean Society 164: 142–154.
Mueller UG, Wolfenbarger LL. 1999. AFLP genotyping andfingerprinting. Trends in Ecology and Evolution 14: 389–394.
Nesje A, Dahl SO. 1992. Geometry, thickness and isostaticloading of the late Weichselian Scandinavian ice-sheet.Norsk Geologisk Tidsskrift 72: 271–273.
Nicoletti F, De Benedetti L, Airò M, Ruffoni B, MercuriA, Minuto L, Casazza G. 2012. Spatial genetic structure ofCampanula sabatia, a threatened narrow endemic speciesof the Mediterranean Basin. Folia Geobotanica 47: 249–262.
Nilsson Ö. 1967. Drawings of Scandinavian plants 1–8 RosaL. Botaniska Notiser 120: 1–408.
Nybom H, Carlson-Nilsson U, Werlemark G, Uggla M.1997. Different levels of morphometric variation in threeheterogamous dog rose species (Rosa sect. Caninae,Rosaceae). Plant Systematics and Evolution 204: 207–224.
Nybom H, Esselink GD, Werlemark G, Leus L, VosmanB. 2006. Unique genomic configuration revealed by micro-satellite DNA in polyploid dog roses, Rosa sect. Caninae.Journal of Evolutionary Biology 19: 635–648.
Nybom H, Esselink GD, Werlemark G, Vosman B. 2004.Microsatellite DNA marker inheritance indicates preferen-tial pairing between two highly homologous genomes inpolyploid and hemisexual dog roses, Rosa L. sect. CaninaeDC. Heredity 92: 139–150.
Nybom H, Olsson Å, Werlemark G. 1996. Morphometricvariation in Nordic dog roses (Rosa sect. Caninae,Rosaceae). Symbolae Botanicae Upsaliensis 31: 59–68.
Okada M, Lyle M, Jaseniuk M. 2009. Inferring the intro-duction history of the invasive apomictic grass Cortaderiajubata using microsatellite markers. Diversity and Distri-butions 15: 148–157.
Olsson Å. 1999. Morphometric and molecular variation in theNordic dog roses (Rosa sect. Caninae, Rosaceae). Disserta-tion. Lund University. Lund, Sweden.
Olsson Å, Nybom H, Prentice HC. 2000. Relationshipsbetween Nordic dog roses (Rosa L. sect. Caninae, Rosaceae)assessed by RAPDs and elliptic Fourier analysis of leafletshape. Systematic Botany 25: 511–521.
Parisod C. 2008. Postglacial recolonisation of plants in thewestern Alps of Switzerland. Botanica Helvetica 118: 1–12.
Paus A, Velle G, Larsen J, Nesje A, Lie O. 2006. Lategla-cial nunataks in central Scandinavia: biostratigraphical evi-dence for ice thickness from Lake Flafattjonn, Tynset,Norway. Quaternary Science Reviews 25: 1228–1246.
Peakall R, Smouse PE. 2006. GENALEX 6: genetic analysisin Excel. Population genetic software for teaching andresearch. Molecular Ecology Resources 6: 288–295.
Peakall R, Smouse PE. 2012. GenALEx 6.5: genetic analysisin Excel. Population genetic software for teaching andresearch – an update. Bioinformatics 28: 2537–2539.
Raspé O, Kohn JR. 2007. Population structure at the S-locusof Sorbus aucuparia L. (Rosaecae, Maloideae). MolecularEcology 16: 1315–1325.
Ritz CM, Schmuths H, Wissemann V. 2005. Evolution byreticulation: European dog roses originated by multiplehybridization across the genus Rosa. Journal of Heredity 96:4–14.
Ritz CM, Wissemann V. 2011. Microsatellite analyses ofartifical and spontaneous dog rose hybrids reveal the hybri-dogenic origin of Rosa micrantha by the contribution ofunreduced gametes. Journal of Heredity 102: 217–227.
Savolainen V, Manen J-F, Douzery E, Spichiger R. 1994.Molecular phylogeny of family related to Celastrales basedon rbcL 5′ flanking sequences. Molecular Phylogenetics andEvolution 3: 27–37.
Schönswetter P, Paun O, Tribsch A, Niklfeld H. 2003.Out of the Alps: Colonization of Northern Europe by eastalpine populations of the glacier buttercup Ranunculusglacialis L. (Ranunculaceae). Molecular Ecology 12: 3373–3381.
Soltis PS, Soltis DE. 2000. The role of genetic and genomicattributes in the success of polyploids. Proceedings of theNational Academy of Sciences of the United States ofAmerica 97: 7051–7057.
Stehlik I. 2000. Nunataks and peripheral refugia for alpineplants during quaternary glaciation in the middle part ofthe Alps. Botanica Helvetica 110: 25–30.
Stehlik I. 2003. Resistance or emigration? Response of alpineplants to the ice ages. Taxon 52: 499–510.
Stehlik I, Blattner FR, Holderegger R, Bachmann K.2002. Nunatak survival of the high alpine plant Eritrichiumnanum (L.) Gaudin in the central Alps during the ice ages.Molecular Ecology 11: 2027–2036.
Stoecklin J, Kuss P, Pluess AR. 2009. Genetic diversity,phenotypic variation and local adaptation in the alpinelandscape: case studies with alpine plant species. BotanicaHelvetica 119: 125–133.
Suda J, Trávnícek P. 2006. Estimation of relative nuclearDNA content in dehydrated plant tissues by flow cytometry.Current Protocols in Cytometry 7.30.2: 1–14.
Täckholm G. 1920. On the cytology of the genus Rosa.Svensk Botanisk Tidskrift 14: 300–311.
Täckholm G. 1922. Zytologische Studien über die GattungRosa. Acta Horti Bergiani 7: 97–381.
Templeton AR, Crandall KA, Sing CF. 1992. Acladistic analysis of phenotypic associations with haplotypesinferred from restriction endonuclease mapping and DNAsequence data. III. Cladogram estimation. Genetics 132:619–633.
Timmermann G, Müller G. 1994. Wildrosen und WeißdorneMitteleuropas. Stuttgart: Verlag des Schwäbischen Alb-vereins e.V.
Vander Mijnsbrugge K, Beeckman H. 2012. Geographi-cally differentiating morphology of genetically similar dogroses: consequences of canina meiosis. Plant Systematicsand Evolution 298: 1733–1742.
Vaz Patto MC, Fernández-Apricio M, Satovic Z,Rubiales D. 2009. Extent and pattern of genetic differen-tiation within and between European populations of Pheli-panche ramosa revealed by amplified fragment lengthpolymorphism analysis. Weed Research 49: 48–55.
POPULATION GENETICS IN DOG ROSES (VESTITAE) 255
© 2013 The Linnean Society of London, Botanical Journal of the Linnean Society, 2014, 174, 240–256
Vos P, Hogers R, Bleeker M, Reijans M, Vandelee T,Hornes M, Frijters A, Pot J, Peleman J, Kuiper M,Zabeau M. 1995. AFLP – a new technique for DNA finger-printing. Nucleic Acids Research 23: 4407–4414.
Weising K, Nybom H, Wolff K, Kahl G. 2005. DNA finger-printing in plants – principles, methods and applications.Milton Park: Taylor and Francis Group.
Werlemark G, Nybom H. 2001. Skewed distribution of mor-phological characters scores and molecular markers in threeinterspecific crosses in Rosa section Caninae. Hereditas 134:1–13.
Westergaard KB, Alsos IG, Popp M, Engelskjøn T,Flatberg KI, Brochmann C. 2011. Glacial survival maymatter after all: nunatak signatures in the rare Europeanpopulations of two west-arctic species. Molecular Ecology20: 376–393.
Winguth C, Mickelson DM, Larsen E, Darter JR, MoellerCA, Stalsberg K. 2005. Thickness evolution of the Scan-dinavian Ice Sheet during the Late Weichselian in Nordf-jord, western Norway: evidence from ice-flow modeling.Boreas 34: 176–185.
Wissemann V. 2000. Molekulargenetische undmorphologisch-anatomische Untersuchungen zur Evolutionund Genomzusammensetzung von Wildrosen der SektionCaninae (DC.) Ser. Botanische Jahrbücher für Systematik,Pflanzengeschichte und Pflanzengeographie 122: 357–429.
Wissemann V, Ritz CM. 2005. The genus Rosa (Rosoideae,Rosaceae) revisited: molecular analysis of nrITS-1 and atpB–rbcL intergenic spacer (IGS) vs. conventional taxonomy.Botanical Journal of the Linnean Society 147: 275–290.
Yokoya K, Roberts AV, Mottley J, Lewis R, BrandhamPE. 2000. Nuclear DNA amounts in roses. Annals of Botany85: 557–561.
Zimmermann H, Ritz CM, Hirsch H, Renison D, WescheK, Hensen I. 2010. Highly rediced genetic diversity of Rosarubiginosa L. populations in the invasive range. Interna-tional Journal of Plant Sciences 171: 435–446.
Zonneveld BJM. 2008. The systematic value of nuclear DNAcontent for all species of Narcissus L. (Amaryllidaceae).Plant Systematics and Evolution 275: 109–132.
SUPPORTING INFORMATION
Additional Supporting Information may be found in the online version of this article at the publisher’s web-site:
Figure S1. Discriminant analysis of R. sherardii, R. mollis and R. villosa based on 25 morphological characters.Table S1. Identification numbers, ploidy levels and sampling details of the three investigated species R. sherar-dii, R. mollis and R. villosa.Table S2. Measurements of the 25 morphological characters of R. sherardii, R. mollis and R. villosa.Table S3. Allelic phenotypes of the ten microsatellite loci of R. sherardii, R. mollis and R. villosa.Table S4. Main matrix of the AFLP data set based on eight primer combinations.
256 A. KELLNER ET AL.
© 2013 The Linnean Society of London, Botanical Journal of the Linnean Society, 2014, 174, 240–256