Energetic Bottlenecks and Other Design Constraints in Avian ...
Upload
independentCategory
view
5download
0
e c o l o g i c a l m o d e l l i n g 1 9 4 ( 2 0 0 6 ) 150–161
avai lab le at www.sc iencedi rec t .com
journa l homepage: www.e lsev ier .com/ locate /eco lmodel
Secondary extinctions in ecological networks:Bottlenecks unveiled
Stefano Allesinaa,b,∗, Antonio Bodinia, Cristina Bondavalli a
a Department of Environmental Sciences, University of Parma, Parma, Italyb Department of Fisheries and Wildlife, Michigan State University, 13 Natural Resources Building, East Lansing, MI 8834, USA
a r t i c l e i n f o
Article history:
Available online 29 November 2005
a b s t r a c t
In ecosystems, a single extinction event could eventually precipitate in a mass extinction,
involving species that may be several connections away from the target of the perturbation.
Keywords:
Cascading extinctions
Secondary extinctions
Ecological networks
Bottlenecks
Error
Attack
Dominators
This topic has been illuminated by recent studies on network mechanics, thanks to the
concepts of hub, error and targeted removal, attack sensitivity, small world, and so forth. To
forecast the effects of a species removal one can use an algorithm that unfolds a complex
food web into a topologically simpler scheme, called its dominator tree. This structure is
simple, elegant, and highly informative; all the bottlenecks and the effects of species removal
are clearly traceable.
While food web studies are mostly qualitative, in this paper the use of the dominator tree is
extended to weighted food webs, in which link magnitude is specified. These structures were
obtained from ecological flow networks. In eight of these food webs, the analysis consisted in
removing links that were weaker than a threshold of magnitude and building the dominator
tree associated to the remaining structure. By progressively increasing the threshold up to
the value that would make the graph disconnected, we had the opportunity to investigate
patterns of dominance as a function of link magnitude.
© 2005 Elsevier B.V. All rights reserved.
1. Introduction
In ecosystems, feeding relations give rise to multiple reticulateconnections between a diversity of consumers and resources.Such intricate web makes impacts spreading several linksaway from the affected taxon and a single extinction eventmay precipitate cascades of further extinction (Greenwood,1987). Because this phenomenon, acknowledged by ecologistswith the term “secondary extinction”, has important impli-cations for the conservation of biodiversity (Spencer et al.,1991) unveiling its patterns and mechanisms is of fundamen-tal importance.
Distant fields of science provided evidences that theanatomy of complex, web-like structures is the appropriate
∗ Corresponding author. Tel.: +1 734 741 2370; fax: +1 734 741 2055.E-mail address: [email protected] (S. Allesina).
locus of explanation for functions and dynamics. For exam-ple, the topology of social relationships may help assessingthe magnitude of the health risk in human societies (Cohen etal., 2000); the anatomy of trade flows between countries mayshed light on the dynamics of the global economic processes(Krempel and Plumper, 2003); the properties of metabolicnetworks can explain the tolerance of simple organisms toenvironmental modification or pharmaceutical interventions(Hartwell et al., 1999). It came, therefore, natural for ecolo-gists to consider food web understanding crucial for a correctgrasp of secondary extinction and to apply methodologies andalgorithms that produced good results in other contexts. Thiscross-fertilization has developed in particular between theo-retical ecology and the Internet’s structure exploration.
0304-3800/$ – see front matter © 2005 Elsevier B.V. All rights reserved.doi:10.1016/j.ecolmodel.2005.10.016

e c o l o g i c a l m o d e l l i n g 1 9 4 ( 2 0 0 6 ) 150–161 151
Recently, Albert et al. (2000) introduced the analogy of bio-logical extinctions into computer science studying how ran-dom or targeted disconnection of some servers would affectthe connectedness of the Internet (cascading disconnections).Their results revealed that the Internet is very resistant torandom disconnections (error tolerant) but attack prone, as acoordinate disconnection of a few very important nodes (hubs)could isolate entire branches of the net.
These features of the Internet network were tested on eco-logical food webs (Sole and Montoya, 2001; Dunne et al., 2002),which resulted to be error resistant and attack prone as well. Inparticular, they approached the question of attack sensitivityby simulating the removal of nodes in decreasing order of con-nectivity. However, node connectivity in scale-free networks(such as the Internet) plays a different role in comparisonwith non-scale-free structures (food webs) (Dunne et al., 2002).In the Internet system, in fact, removing the few hubs withthe highest number of connections seriously hampers com-munication between the remaining nodes; in food webs, itis not necessarily so. In that case, the first few extinctionswould produce huge cascading effects, but the “extinctioncurve” that accounts for secondary extinction events showsa sort of lag, meaning that the first few disconnections, whichinvolve the most connected species, may not cause importanteffects (Allesina and Bodini, 2004). Although we maintain thatstudying food web architecture is fundamental to understand
assessed, and indices of error and attack sensitivity were cal-culated. Results highlight that species that in the qualitativefood web seemed to receive energy from a multiplicity of non-overlapping pathways, they might have few dominators whenthe magnitude of fluxes is considered. This modifies the pat-terns of food web resistance to errors and attacks in relationto a complete qualitative approach.
2. Materials and methods
2.1. Ecological networks and their properties
Trophic interactions in food webs may resemble the intricateweb of routers and data-transfer lines by which computersare connected to each other in the Internet system. This anal-ogy has suggested that ecosystems could be described, asthe Internet, using un-weighted, un-oriented graphs (Sole andMontoya, 2001). The parallelism between computer networksand ecosystem could be, however, misleading, for a series ofreasons that are summarized in the few points below.
2.1.1. Orientation-asymmetryWhen two servers are connected with one another, the infor-mation can flow between the two in either ways; in ecosys-tems, instead, if one focuses only on matter and energy ascurrency, flows are bottom–up oriented (from resources to con-
sumers). Accordingly, one can shape food webs as digraphs(directed graphs).2.1.2. Mass conservationInternet and food web topology have been described by un-weighted graphs. However, given the constraints imposed tonatural systems by mass conservation, a more appropriatedescription of ecological webs should be based on weightednetworks, leaving un-weighted networks for computer sci-ence, where information can be multiplied indefinitely. Anynode (species) in an ecological network obeys the mass bal-ance equation:
∂Bi
∂t= Zi − Ei − Di + T·i − Ti· (1)
in which the biomass variation of the ith component (∂Bi/∂t)is a function of matter entering the compartment from theoutside environment (Zi), increased by the quota of inflowfrom other species (T·i where the dot sign stands for summa-tion across all the species) and reduced by the fraction thatis exported to the outer environment (Ei), dissipated (Di), orfed to other species (Ti·). If all nodes have null derivatives thesystem is at steady state. In this case, we can represent theecosystem as a matrix, where every coefficient stands for theflux from the row to the column node (compartment).
2.1.3. Single-source and dissipationIn computer networks, every single machine can act as sourceof information; this does not hold for natural systems. Thedissipative nature of ecological systems imposes that the out-side environment provides a continuous supply of energyto the system. In graph theoretical language, this featurerequires that ecological networks are rooted in a special
secondary extinction, we have the reason to believe that suchstudy may be facilitated by the use of dominator trees. Thesetrees are topological structures that make visible the linearpathways that are essential for energy delivery in complexfood webs (Allesina and Bodini, 2004). By these structures, onecan easily identify which nodes are likely to cause the greatestimpact if removed. This is because dominator analysis illumi-nates which are the bottlenecks in the pathways that connectthe fundamental source of energy (external environment) toany node (species or guild).
However, dominator tree analysis has been to date purelyqualitative and dominance (i.e. interdependence) is calculatedon the base of presence/absence of links between species.Links having different magnitude are considered equivalentin the computation. Nonetheless, interaction strength playsa major role in channeling energy through the vast array ofpathways that makes up a food web, and this may affect pat-terns of interdependence and dominance between species. Inthis paper, the effect of interaction strength on dominancerelations has been assessed on a set of eight real food webs.Because, likely, only links that are strong enough are essen-tial to sustain the species in the food web, the search fordominator trees should be performed only considering theselinks, while neglecting the others. But this requires that oneknows which links are important and which can be discardedfrom the analysis. Such knowledge is difficult to achieve, andalmost impossible for large food webs. So, we followed anapproach in which links that are weaker than an imposedthreshold are removed, thus, assuming that they cannot pro-vide enough energy to sustain the species. By progressivelyincreasing this threshold, up to a value that would make thegraph disconnected, and performing dominator tree searchon the remaining links at every step, we created different sce-narios for dominance in which secondary extinction has been

152 e c o l o g i c a l m o d e l l i n g 1 9 4 ( 2 0 0 6 ) 150–161
Table 1 – Statistics for each of the analyzed systems
Network Nodes Edges Min edges Min ES Max ES Min AS Max AS Max thres
Baydry 126 1987 300 0.008192 0.0096 0.024 0.048 0.1094574Baywet 126 1956 259 0.008192 0.011136 0.024 0.096 0.1279146Cypdry 69 574 114 0.015787 0.028114 0.058824 0.323529 0.1858526Cypwet 69 565 111 0.015787 0.035251 0.058824 0.308824 0.1866415Gramdry 67 798 89 0.01584 0.034435 0.030303 0.727273 0.2472287Gramwet 67 798 108 0.01584 0.024793 0.030303 0.333333 0.2008547Mangdry 95 1367 209 0.011091 0.012902 0.031915 0.085106 0.1342635Mangwet 95 1368 229 0.011091 0.012336 0.031915 0.06383 0.1183497
For each of the analyzed systems (network), it shows: (1) the number of nodes including the root (nodes); (2) the number of edges in the originalweb (edges), and at the end of the procedure (Min edges); (3) the minimum error sensitivity (Min ES), that was calculated on the original config-uration and maximum ES (Max ES) obtained in the very last step of the procedure; (4) attack sensitivity (AS), minimum and maximum, for theoriginal network and the final structure, respectively. Max threshold (Max thres) is the value that if exceeded, would make the network discon-nected. A detailed description of the analyzed networks can be found at the ATLSS website (http://www.cbl.umces.edu/∼bonda/ATLSS.html).
node that represents the external environment as provider ofenergy/matter; this special node is called “root” or “source”node. Note that this representation takes into account the sev-eral ways energy/matters enter the system: flows of energy toprimary producers, immigration, resuspension of nutrients,etc. All these flows are sketched as coming from the root node.
According to all the above considerations, we approachedthe study of secondary extinction in ecosystem using ecolog-ical flow networks instead of the typical empirical food websemployed in other studies (Sole and Montoya, 2001; Dunneet al., 2002). Flow networks, in fact, offer several advantages.They are depicted as oriented graphs so that building thetopology of the associated food web is relatively straightfor-ward; the compartments which import matter and energy (itoccurs in the various forms, see the above paragraph) areclearly identified, so that connecting the system to the rootnode becomes straightforward; a magnitude is attached toeach link (flow); this allows quantitative investigations.
In particular, we concentrated our efforts on the mostresolved ecological networks up to date, which were pro-duced for the ATLSS Project by the University of Maryland(http://www.cbl.umces.edu/∼bonda/ATLSS.html). These net-works represent four ecosystems (aquatic and terrestrial,namely the Florida Bay, the Cypress Wetlands, the Grammi-noid Marshes, and the Mangroves Ecosystem) in two sea-sonal snapshots (dry and wet seasons). These networkshave the advantage of being constructed with coherent and
top–down regulatory effect (e.g. removing a predator maylead to competitive exclusion of one its prey), but ecologicalflow networks allow investigating secondary extinction inthe bottom–up perspective typical of the trophic-dynamicsapproach to ecosystem, so that this is the domain in whichthis work must be framed. Accommodating the two perspec-tives in a unique framework is not easy because they makeuse of different tools (Allesina and Bodini, 2004) and it is notamong the objectives of this work. The main methodologicaltool used in this work is the dominator tree. It reduces anyfood web into a series of pathways that describe the linearsequence of steps through which energy is passed from onespecies to another in the ecosystem. By the use of dominatortrees, one can identify without ambiguity which nodes areessential to the survival of other nodes. Any species along thebranches of this topological construction is said to dominatethose that follow it because these latter necessarily dependon the former to satisfy their energy requirement. In otherwords, this construction makes dominance relationshipsvisible. Dominator trees are constructed by tracing a directconnection from any species to its immediate dominator, aspecies without which the former cannot survive. Considerthe hypothetical food web depicted in Fig. 1 (graph on theleft). Species E receives medium from species C and D, bothof which, in turn, depend on A. The extinction of either Cor D does not put E at risk of survival because at least onepathway remains at its disposal. On the contrary, extinction
homogenous rules by the same team of scientists. Moreover,the networks comprise a great number of nodes and links(Table 1).
2.2. Bottlenecks and dominator trees
We represented the selected ecosystems as nodes(species/group of species) connected by weighted, directedlinks (carbon flows in mg C y−1 m−2) to form a rooted net-work. The inputs in the original networks determined theway the root (external environment) is linked to the systemvariables. Tracing the consequences of a single extinctionevent was possible according to the idea that whenevera node is removed, all the nodes that rely on it for beingconnected to the source would go extinct as well. Secondaryextinction may also be the consequence of variations in
of A inevitably drives E (and B and D as well!) to extinction.Thus, A is the unique species necessary for E to survive andthe dominator tree trace a direct connection from A to E.Given that A is essential for E and C as well the dominatortree depicts a direct connection from A to both these nodes.Because the dominator tree illustrates through its directlinks only the dominance relations, there are no connectionsbetween C, D and E because none of these species is essentialfor the survival of any of the others.
We state that given a network G with N nodes (N − 1 speciesand the root) connected by E edges associated with weights W,a node A is a dominator of node B (A = dom (B)) if and onlyif every path from r (root of the network) to B contains A.According to this definition, every node dominates itself. Aproper dominator C of a node B is defined as C = dom (B), C �= B.Every node has an immediate dominator; A is the immediate

e c o l o g i c a l m o d e l l i n g 1 9 4 ( 2 0 0 6 ) 150–161 153
Fig. 1 – Sample network (left) and corresponding dominator tree (right). The removal of node A would cause thedisconnection of nodes C–E, while the removal of any other node different from the root would cause no secondaryextinction. The error sensitivity of this network (see below) would be ES = 3/25 = 12%, while attack sensitivity (AS) = 3/5 = 60%.This means that a random extinction would make disappear another 12% of species on average, while a targeted removalcan extinguish 60% of the network (maximum potential damage).
dominator of B if A = dom (B) and every C = dom (A) is also adominator of B. Linking every node with its immediate dom-inator defines the so called dominator tree (Lengauer andTarjan, 1979; see Allesina and Bodini, 2004 for a detaileddescription).
2.3. Errors and attacks
When a species goes extinct, one or more other species maydisappear because they are left without connection to theroot. Extinction events may be thought as of two types: ran-dom (Albert’s concept of “error”, Albert et al., 2000) and tar-geted (Albert’s “attack”), being the latter a term that definesremovals that create as much damage as possible in termsof secondary extinction. We proposed (Allesina and Bodini,2004) that network robustness to random losses and attackscould be tested by two indices calculated from the domi-nator tree. The so called error sensitivity index (ES), pro-vides a measure of how robust ecological networks are withrespect to random disconnections and it is calculated asthe averaged sum of the number of proper dominators ofevery node i [dom (i)] divided by the overall number of nodes(the root node is always excluded form these calculationsbecause its removal would trivially make the whole networkdisappear):
E∑ |dom (i)| − 1
Tttfcow
nfn
tion:
AS = max
{|dom (i) − 1|
(N − 1)
}, ∀i �= r (3)
AS ranges from 0 (no secondary extinctions) to 1 (a singleextinction leads all species to extinction). Indices of error andattack sensitivity are calculated in Fig. 1 for the network thererepresented.
2.4. Dominators on weighted networks
All the fluxes between nodes measured in a given period oftime can be stored as coefficients of a matrix T[tij]. Because bydominator trees, we explore potential cascading extinctionsdue to energy shortage, we may expect that this phenomenoncannot be avoided whether nodes remain connected to theroot through weak links. Only links that are strong enough(that carry enough currency) guarantee that species survive.In a purely qualitative dominator tree, this distinction is nottaken into account, and it is sufficient that a species remainssomehow connected to the root for not going to extinction, nomatter how much energy it obtains through such connection.However, if we introduce flow intensity dominance patternsare likely to change. This can be intuitively appreciated usingthe same example proposed to describe dominator trees (see
S =i�=r
(N − 1)2(2)
his index ranges from 0, as in the case of star-like dominatorrees, where every node is directly attached to the root, to 0.5,hat is the upper limit for chain-like dominator trees. In theormer case, a single, random removal does not produce cas-ading extinction at all, because all the nodes directly dependn the root. In the latter, on average, a random disconnectionill cause half of the nodes to disappear.
Targeted attacks will cause a cascading extinction if theode removed dominates at least another node. We can, there-
ore, measure the attack sensitivity (AS) as the maximumumber of extinctions, we can cause by a single disconnec-
previous section). With reference to Fig. 1, if D received 90%of its requisite medium from C and the other 10% from B,the extinction of C would likely cause D to vanish, as too lit-tle energy would reach it through B.1 As a consequence, Cbecomes necessary for D, and it appears a dominator of thislatter species, while in the qualitative case, only A played therole of dominator for D.
1 If A–D were individuals, the entire amount of energy (100%)would be necessary for D to survive, so that even the lack of theweak flow would cause its death. Populations, instead, can sur-vive with less energy at a lower number of individuals, unless thisamount reduces population abundance below the minimum viablelevel.
154 e c o l o g i c a l m o d e l l i n g 1 9 4 ( 2 0 0 6 ) 150–161
In this study, we consider the magnitude of links as akey factor in defining dominance relation between species.The main idea is that only certain pathways guarantee thatspecies receive enough energy. When these paths are inter-rupted because one node disappears, secondary extinctionsoccur, no matter whether the species remain connected to theroot through other weak paths. In practice, the analysis hasbeen performed according to the following procedure: we con-sidered the original webs, removed links weaker than a certainthreshold, thus, assuming that they could not guarantee thesurvival of the species they pointed to if left alone to provideenergy, and build up the dominator trees on the remainingstructure.2 The value of the threshold was increased up to avalue above which the graph became disconnected. For anystep of this procedure, we investigated patterns of secondaryextinction in the resulting dominator trees, while testing thenetwork for sensitivity to errors and attacks. In summary, theentire procedure was conducted on matrix T[tij] in the follow-ing way:
• we divided every non-zero coefficient by the row sum (everycoefficient represents the fractional importance of each linkwith respect to food intake);
• we removed every link whose importance is below a giventhreshold;
• we computed dominator trees and relative statistics;• we augmented the threshold and performed the above steps
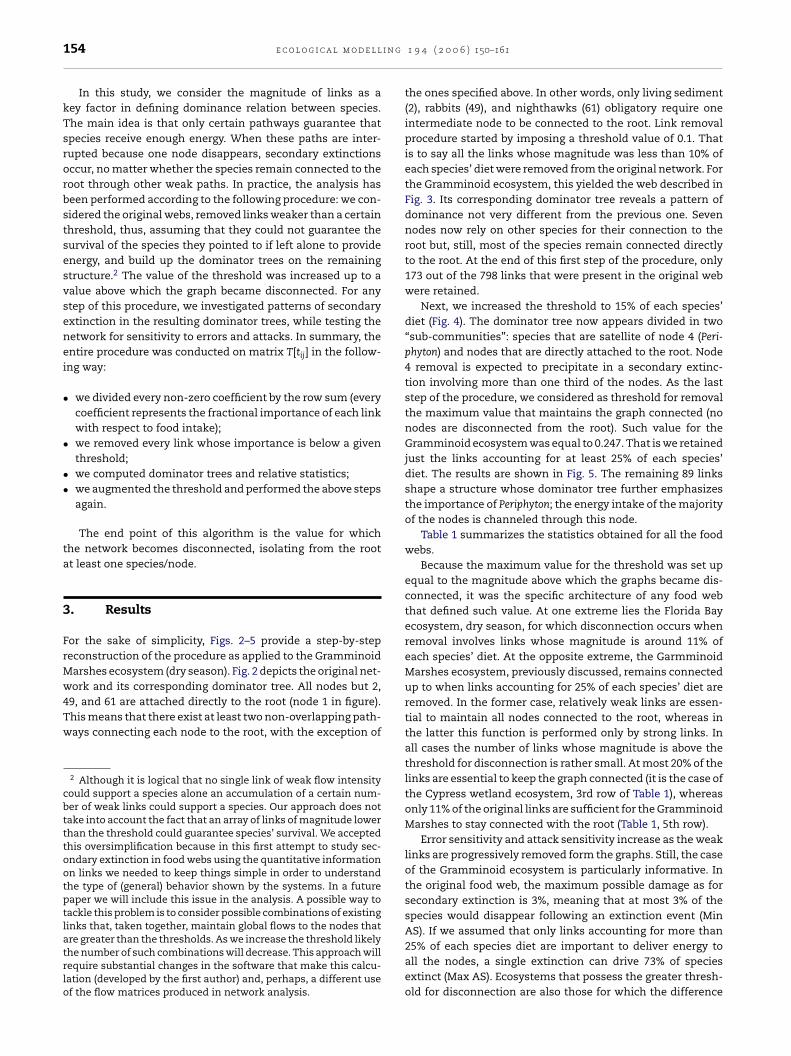
the ones specified above. In other words, only living sediment(2), rabbits (49), and nighthawks (61) obligatory require oneintermediate node to be connected to the root. Link removalprocedure started by imposing a threshold value of 0.1. Thatis to say all the links whose magnitude was less than 10% ofeach species’ diet were removed from the original network. Forthe Gramminoid ecosystem, this yielded the web described inFig. 3. Its corresponding dominator tree reveals a pattern ofdominance not very different from the previous one. Sevennodes now rely on other species for their connection to theroot but, still, most of the species remain connected directlyto the root. At the end of this first step of the procedure, only173 out of the 798 links that were present in the original webwere retained.
Next, we increased the threshold to 15% of each species’diet (Fig. 4). The dominator tree now appears divided in two“sub-communities”: species that are satellite of node 4 (Peri-phyton) and nodes that are directly attached to the root. Node4 removal is expected to precipitate in a secondary extinc-tion involving more than one third of the nodes. As the laststep of the procedure, we considered as threshold for removalthe maximum value that maintains the graph connected (nonodes are disconnected from the root). Such value for theGramminoid ecosystem was equal to 0.247. That is we retainedjust the links accounting for at least 25% of each species’diet. The results are shown in Fig. 5. The remaining 89 linksshape a structure whose dominator tree further emphasizes
again.
The end point of this algorithm is the value for whichthe network becomes disconnected, isolating from the rootat least one species/node.
3. Results
For the sake of simplicity, Figs. 2–5 provide a step-by-stepreconstruction of the procedure as applied to the GramminoidMarshes ecosystem (dry season). Fig. 2 depicts the original net-work and its corresponding dominator tree. All nodes but 2,49, and 61 are attached directly to the root (node 1 in figure).This means that there exist at least two non-overlapping path-ways connecting each node to the root, with the exception of
2 Although it is logical that no single link of weak flow intensitycould support a species alone an accumulation of a certain num-ber of weak links could support a species. Our approach does nottake into account the fact that an array of links of magnitude lowerthan the threshold could guarantee species’ survival. We acceptedthis oversimplification because in this first attempt to study sec-ondary extinction in food webs using the quantitative informationon links we needed to keep things simple in order to understandthe type of (general) behavior shown by the systems. In a futurepaper we will include this issue in the analysis. A possible way totackle this problem is to consider possible combinations of existinglinks that, taken together, maintain global flows to the nodes thatare greater than the thresholds. As we increase the threshold likelythe number of such combinations will decrease. This approach willrequire substantial changes in the software that make this calcu-lation (developed by the first author) and, perhaps, a different useof the flow matrices produced in network analysis.
the importance of Periphyton; the energy intake of the majorityof the nodes is channeled through this node.
Table 1 summarizes the statistics obtained for all the foodwebs.
Because the maximum value for the threshold was set upequal to the magnitude above which the graphs became dis-connected, it was the specific architecture of any food webthat defined such value. At one extreme lies the Florida Bayecosystem, dry season, for which disconnection occurs whenremoval involves links whose magnitude is around 11% ofeach species’ diet. At the opposite extreme, the GarmminoidMarshes ecosystem, previously discussed, remains connectedup to when links accounting for 25% of each species’ diet areremoved. In the former case, relatively weak links are essen-tial to maintain all nodes connected to the root, whereas inthe latter this function is performed only by strong links. Inall cases the number of links whose magnitude is above thethreshold for disconnection is rather small. At most 20% of thelinks are essential to keep the graph connected (it is the case ofthe Cypress wetland ecosystem, 3rd row of Table 1), whereasonly 11% of the original links are sufficient for the GramminoidMarshes to stay connected with the root (Table 1, 5th row).
Error sensitivity and attack sensitivity increase as the weaklinks are progressively removed form the graphs. Still, the caseof the Gramminoid ecosystem is particularly informative. Inthe original food web, the maximum possible damage as forsecondary extinction is 3%, meaning that at most 3% of thespecies would disappear following an extinction event (MinAS). If we assumed that only links accounting for more than25% of each species diet are important to deliver energy toall the nodes, a single extinction can drive 73% of speciesextinct (Max AS). Ecosystems that possess the greater thresh-old for disconnection are also those for which the difference

ec
ol
og
ica
lm
od
el
lin
g1
94
(20
06
)150–161
155
Fig. 2 – Gramminoid Marshes ecosystem, dry season (left), and corresponding dominator tree (right). Correspondence between nodes and species/group of species/pools:(1) root; (2) living sediments; (3) living POC; (4) Periphyton; (5) macrophytes; (6) Utricularia; (7) floating vegetation; (8) Apple snail; (9) freshwater prawn; (10) Crayfish; (11)mesoinvertebrates; (12) other macroinvertebrates; (13) large aquatic insects; (14) terrestrial invertebrates; (15) fishing spider; (16) Gar; (17) Shiners and Minnows; (18)Chubsuckers; (19) catfish; (20) flagfish; (21) Topminnows; (22) bluefin killifish; (23) killifishes; (24) Mosquitofishes; (25) Poecilids; (26) Pigmy sunfish; (27) bluespottedsunfish; (28) Warmouth; (29) dollar sunfish; (30) Redear sunfish; (31) spotted sunfish; (32) other Centrarchids; (33) largemouth Bass; (34) Cichlids; (35) other large fishes; (36)other small fishes; (37) salamanders; (38) salamander larvae; (39) large frogs; (40) medium frogs; (41) small frogs; (42) tadpoles; (43) turtles; (44) snakes; (45) lizards; (46)alligators; (47) muskrats; (48) rats and mice; (49) rabbits; (50) raccoons; (51) opossum; (52) otter; (53) mink; (54) white tail deer; (55) bobcat; (56) panthers; (57) grebes; (58)bitterns; (59) ducks; (60) snailkites; (61) nighthawks; (62) Gruiformes; (63) Cape Sable seaside sparrow; (64) Passerines; (65) sediment carbon; (66) labile detritus; (67)refractory detritus. For further information of species, please refer to the ATLSS website (http://www.cbl.umces.edu/∼bonda/ATLSS.html). This network contains 67 nodesand 798 links. The network in its original form possesses: ES = 1.584E−2 and AS = 3.0E−2.

156e
co
lo
gic
al
mo
de
ll
ing
19
4(2
00
6)
150–161
Fig. 3 – Gramminoid Marshes ecosystem, dry season, and corresponding dominator tree when the links with factionary importance less than 0.1 are eliminated. In thiscase, the network would contain 173 links (out of 798). Consequently, the corresponding dominator tree possess more branches; this reflects in ES and AS values thatbecomes 1.68E−2 and 4.54E−2, respectively.

ec
ol
og
ica
lm
od
el
lin
g1
94
(20
06
)150–161
157
Fig. 4 – Gramminoid Marshes ecosystem, dry season, and corresponding dominator tree when the links with factionary importance less than 0.15 are eliminated. Thenetwork is further reduced to 127 links (out of 798): ES = 2.36E−2 and AS = 3.48E−1.

158e
co
lo
gic
al
mo
de
ll
ing
19
4(2
00
6)
150–161
Fig. 5 – Gramminoid Marshes ecosystem, dry season, and corresponding dominator tree at the last step of the procedure. Any further removal of weak links would makethe network disconnected. In this situation (89 links, threshold = 0.247): ES = 3.44E−2 and AS = 7.27E−1.

e c o l o g i c a l m o d e l l i n g 1 9 4 ( 2 0 0 6 ) 150–161 159
Fig. 6 – ES values for the considered networks in the two seasonal snapshots (left: dry season and right: wet season).Threshold values indicate the filter used for presence/absence of links. ES increase monotonically with the threshold untilthe value that makes the network disconnected is reached.
between Max AS and Min AS is the highest and can reach oneorder of magnitude (Cypress and Gramminoid ecosystems).Such a sharp difference does not characterize error sensitivityalthough also coefficient ES increases as links are removed.However, whereas Max AS gets close to its maximum possiblevalue (1, extinction of 100% of the species) ES remains far fromits maximum possible value (0.5) for all the networks but theFlorida Bay (wet season). This means that after the majorityof weak links are removed these webs resemble much morea star than a linear chain. Both ES and AS grow as step func-tions as shown in Figs. 6 and 7; link removal does not changethe indices until a “critical” threshold is reached. Remarkably,all the curves possess the same shape, suggesting that thisfeature could be generalized.
The initial values for the two seasons do coincide for everynetwork examined, but there are seasonal differences as formaximum values and curve shape. All the functions seemto possess a sort of “lag”; both ES and AS grow slowly upto a certain threshold. When this critical value is reached(see the Gramminoid ecosystem and the Florida Bay), ESand AS seem to grow exponentially. Because these indicescannot exceed the limit of 0.5 and 1, respectively, we canexpect an inflection point (visible in Cypress–dry seasoncurve).
4. Discussion
The idea that the loss of individual species may pro-duce “domino extinctions” in ecosystems is not new. Pimm(1979, 1980) explored this issue in the framework of thediversity–stability debate and used rather simple food webs(maximum no. of species = 15, organized into chains of threespecies) that visualized multiple interactions governed byclassical Lotka–Volterra equations. The same type of mod-els was used more recently to explore secondary extinctionin the context of biodiversity and its conservation (Lundberget al., 2000). The majority of these dynamic models are multi-trophic assembly models rather than descriptions of real foodwebs; they were especially constructed to forecast the riskof secondary extinction in real communities as a functionof general features, such as number of species per func-tional group, omnivory, intensity of competition. The effectof interaction strength seems to be such that risk of sec-ondary extinction increases when the distribution of linksmagnitude changes from uniform to skew (Borrvall et al.,2000). In other words, communities with few strong linksand many weak links would be more prone to secondaryextinction.

160 e c o l o g i c a l m o d e l l i n g 1 9 4 ( 2 0 0 6 ) 150–161
Fig. 7 – AS values for the considered networks in the two seasonal snapshots (left: dry season and right: wet season).Threshold values indicate the filter used for presence/absence of links. AS, as in the case for ES, increase with the thresholduntil disconnection of the network is produced.
Results presented here, although obtained studying energyflow networks instead of the dynamics of species interactions,recall those findings but from a different perspective. Figs. 2–5show, for the Gramminoid ecosystem, that when the mini-mum amount of energy a single link must carry to functionas a viable connection augments, the number of bottlenecks(node upon which other species obligatory depend for theirenergy requirements) increases, and so does the risk of sec-ondary extinction. If species survival is guaranteed when theyreceive at least the energy delivered through pathways com-posed by strong links (those representing >25% of a species’food intake), this bulk of energy is concentrated in 89 out ofthe 798 original links and is channeled through fundamen-tal nodes that are not visible when all links (and pathways)are considered equivalent (compare Fig. 5 with Fig. 2). In par-ticular, these nodes are 4 (Periphyton), 11 (mesoivertebrates),5 (macrophytes), 9 (freshwater prawn): their extinction wouldproduce a cascade of secondary extinctions and they can beconsidered as keystone species in the Gramminoid ecosys-tem (Power et al., 1996; Allesina and Bodini, 2004). In gen-eral, the higher the threshold the more prone the networksbecome to random and selective extinctions, as shown byvalues of indices ES and AS in Table 1 and their trends inFigs. 6 and 7.
The qualitative food webs can be considered as special rep-resentations of networks with uniform distribution of interac-tion strength. When thresholds are imposed to select links onthe base of their magnitude, we observed that most links areremoved for rather low values of the filter. That is the major-ity of the links in the selected food webs are weak and stronginteraction represent 10–20% of the total linkage patrimony ofthese ecosystems (see Table 1). In these food webs, distribu-tions of link strength are clearly skewed (Ulanowicz and Wolff,1991) and the dominator tree analysis shows a greater risk ofsecondary extinction, a result that matches with the outcomesof dynamic analysis. Also, these results support the idea thatin real food webs there is a preponderance of weak interactionsbetween species (Berlow, 1999; Kokkoris et al., 1999; Montoyaand Sole, 2003).
Studies conducted on dynamics-based models revealedthat the loss of species from lower trophic levels would causegreater risk of loosing additional species (Borrvall et al., 2000).This matches with our results, although our approach, basedon energy flow, is bottom–up in nature and does not considerthe top–down perspective that is defined by the flow of regula-tory effects due to predators (Allesina and Bodini, 2004). In thecase of the Gramminoid ecosystem among the species that arelikely to cause greater damage in term of secondary extinction

e c o l o g i c a l m o d e l l i n g 1 9 4 ( 2 0 0 6 ) 150–161 161
two are primary producers (Periphyton and macrophytes) andanother two (freshwater prawn and mesoinvertebrates) feedat level 2.27 in a food web that counts up to five trophic levels(Heymans et al., 2002).
As a final remark, we point out that all the resultsdiscussed in this paper have been obtained without con-sidering that species can modify their connections andswitch to entirely different prey when the original source ofenergy becomes missing or scarcely available. Even thoughincluding switching would be very important, the collectedfood webs contain no data that would allow this kind ofinvestigation.
Results of this analysis open up opportunities for researchon structural features of food webs. Interestingly enough,the disconnection of the networks occurred when most ofthe links were removed (80–89% of links) and this meansthat stronger links (the backbone) of food webs are close toform a spanning tree (that would be composed by exactlyN − 1 links, Garlaschelli et al., 2003), that is the collectionof pathways that allow energy to reach all species at theminimum cost. In the Gramminoid food web the spanningtree would count as many as 66 links, while 89 links arerequired to maintain the network connected. This suggeststhat stronger, essential links are topologically arranged insuch a way that delivery is somehow optimized. The issueis certainly promising and deserves to be further investi-gated.
A
R(ttt
r
A
A
Berlow, E.L., 1999. Strong effects of weak interactions inecological communities. Nature 398, 330–334.
Borrvall, C., Ebenman, B., Jonssonn, T., 2000. Biodiversitylessens the risk of cascading extinction in model food webs.Ecol. Lett. 3, 131–136.
Cohen, S., Brissette, I., Skoner, D., Doyle, W., 2000. Socialintegration and health: the case of the common cold. J. Soc.Struct. 1 (3), 1–7.
Dunne, J.A., Williams, R.J., Martinez, N.D., 2002. Food-webstructure and network theory: the role of connectance andsize. Proc. Natl. Acad. Sci. U.S.A. 99, 1922–12917.
Garlaschelli, D., Caldarelli, G., Pietronero, L., 2003. Universalscaling relations in food webs. Nature 423, 165–167.
Greenwood, S.R., 1987. The role of insects in tropical forestfood webs. Mar. Biol. 16, 267–271.
Hartwell, L.H., Hopfield, J.J., Leibler, S., Murray, A.W., 1999. Frommolecular to modular cell biology. Nature 402, 47–52.
Heymans, J.J., Ulanowicz, R.E., Bondavalli, C., 2002. Networkanalysis of the South Florida graminoid marshes andcomparison with nearby cypress ecosystems. Ecol. Model.149, 5–23.
Kokkoris, G.D., Troumbis, A.Y., Lawton, J.H., 1999. Patterns ofspecies interaction strength in assembled theoreticalcompetition communities. Ecol. Lett. 2, 70–74.
Krempel, L., Plumper, T., 2003. Exploring the dynamics ofinternational trade by combining the comparativeadvantages of multivariate statistics and networkvisualization. J. Soc. Struct. 4, 1–22.
Lengauer, T., Tarjan, R.E., 1979. A fast algorithm for findingdominators in a flowgraph. ACM Trans. Prog. Lang. Syst. 1,121–141.
cknowledgements
esearch supported partly by the European CommissionProject DITTY Contract No. EVK3-2001-00226) and partly byhe Ph.D. Program in Ecology, University of Parma. SA wouldhank the ISEM for the bursary that allowed him to presenthis work to the ECEM.
e f e r e n c e s
lbert, R., Hawoong, J., Barbasi, A.L., 2000. Error and attacktolerance of complex networks. Nature 406, 378–381.
llesina, S., Bodini, A., 2004. Who dominates whom in theecosystem? Energy flow bottlenecks and cascadingextinctions. J. Theor. Biol. 230 (3), 351–358.
Lundberg, P., Ranta, E., Kaitala, V., 2000. Species loss leads tocommunity closure. Ecol. Lett. 3, 465–468.
Montoya, J.M., Sole, R.V., 2003. Topological properties of foodwebs: from real data to community assembly models. Oikos102, 614–622.
Pimm, S.L., 1979. Complexity and stability: another look atMacArthur original hypothesis. Oikos 33, 351–357.
Pimm, S.L., 1980. Food web design and the effect of speciesdeletion. Oikos 35, 139–149.
Power, M.E., Tilman, D., Estes, J.A., et al., 1996. Challenges inthe quest for keystones: identifying keystone species isdifficult but essential to understanding how loss of specieswill affect ecosystems. Bioscience 46, 609–620.
Sole, R.V., Montoya, J.M., 2001. Complexity and fragility inecological networks. Proc. R. Soc. Lond. B 268, 2039–2045.
Spencer, C.N., McClelland, B.R., Stanford, J.A., 1991. Shrimpstocking, salmon collapse and eagle displacement.Bioscience 41, 14–21.
Ulanowicz, R.E., Wolff, W.F., 1991. Ecosystem flow networks:loaded dice? Math. Biosci. 103, 45–68.
Copyright © 2022 FDOKUMEN