Consumption of wheat bran modified by autoclaving reduces fat mass in hamsters

Molecular Ecology (2005)
14
, 1473–1483 doi: 10.1111/j.1365-294X.2005.02519.x
© 2005 Blackwell Publishing Ltd
Blackwell Publishing, Ltd.
Genetic spatial structure of European common hamsters (
Cricetus cricetus
) — a result of repeated range expansion and demographic bottlenecks
K . NEUMANN,
*
J . R . MICHAUX,
†
S . MAAK,
‡
H . A. H. JANSMAN,
§
A . KAYSER,
*
G . MUNDT
*
and R . GATTERMANN
*
*
Institute of Zoology, Martin-Luther-University Halle-Wittenberg, Domplatz 4, D-06108 Halle (Saale), Germany,
†
Unité de recherches en zoogéographie, Institut de Zoologie, Quai Van Beneden, 22, 4020 Liège, Belgium,
‡
Institute of Animal Breeding and Husbandry with Veterinary Clinic, Martin-Luther-University Halle-Wittenberg, Adam-Kuckhoff-Str. 35, D-06108 Halle (Saale), Germany,
§
ALTERRA Green World Research, Centre for Ecosystems, PO Box 47, NL-6700 AA Wageningen, The Netherlands
Abstract
The spatial genetic structure of common hamsters (
Cricetus cricetus
) was investigated usingthree partial mitochondrial (mt) genes and 11 nuclear microsatellite loci. All marker systemsrevealed significant population differentiation across Europe. Hamsters in central andwestern Europe belong largely to two allopatric mitochondrial lineages south and northwestof the Carpathian and Sudetes. The southern group, ‘Pannonia’, comprises populationsinside the Carpathian basin (Czech Republic, Hungary) while the second group, ‘North’,includes hamsters from Belgium, the Netherlands, France, and Germany. Isolation of thelineages is maintained by a combination of geographical and ecological barriers. Both mainphylogeographical groups show signs of further subdivision. North is separated intohighly polymorphic central German and less polymorphic western populations, whichmost likely split during late glacial expansion (15 000–10 000
BP
). Clock estimates based onhaplotype distributions predict a divergence of the two major lineages 85 000–147 000
BP
.Expansion times fall during the last glaciation (115 000–10 000
BP
) corroborating fossil data,which identify
Cricetus cricetus
as characteristic of colder climatic phases. Despite theallopatry of mt haplotypes, there is an overlap of nuclear microsatellite alleles betweenphylogeographical units. Although there are strong evidence that Pannonian hamstershave persisted inside the Carpathian basin over the last 50 000 years, genetic differentiationamong European hamsters has mainly been caused by immigration from different easternrefugia. Possible source populations are likely to be found in the Ukrainian and the southernRussian plains — core areas of hamster distribution. From there, hamsters have repeatedlyexpanded during the Quaternary.
Keywords
: bottlenecks, common hamster, glacial refugia, phylogeography, postglacial expansion
Received 20 September 2004; revision accepted 26 January 2005
Introduction
The oscillation of warm and cold phases during theQuaternary has promoted extensive shifts of distributionareas, and hence population diversity in many temperateanimals (Cooper
et al
. 1995; Taberlet
et al
. 1998; Seddon
et al
.2001). Survival in separate refugia has led to the allopatricformation of differing genetic lineages during stadials. Glacial
refugia for European small mammals were mainly locatedin the Mediterranean, the Balkans, the Urals and theCaucasus/Carpathian region (Markova
et al
. 1995; Hewitt1996; Taberlet
et al
. 1998; Jaarola & Searle 2002) with addi-tional retreat areas in central Europe (Bilton
et al
. 1998;Brunhoff
et al
. 2003). Range expansion caused further geneticdifferentiation (Conroy & Cook 2000a; Milá
et al
. 2000)because of serial bottlenecking in founder populationsand the selection of alleles favourable in a novel environ-ment (Rogers 1995; Ibrahim
et al
. 1996; Hewitt 1999).Species arriving in new habitats were still confronted with
Correspondence: Karsten Neumann, Fax: + 49-(0)345 5527152;E-mail: [email protected]

1474
K . N E U M A N N
E T A L .
© 2005 Blackwell Publishing Ltd,
Molecular Ecology
, 14, 1473–1483
climatic changes. This happened, in particular, towardsthe end of the last glacial (16 000
bp
) and the beginning ofthe Holocene (10 000
bp
) as this period was characterizedby several warm and cold (Dryas) spells. Spreading woodsand increased humidity during the Atlantikum (7500–4500
bp
) and early Sub-Atlantikum (2800–2000
bp
) musthave caused habitat losses for taxa adapted to arid con-tinental climates
Phylogeographical studies on small rodents have focusedmainly on species with relatively wide and northerly reach-ing distributions (Jaarola & Tegelström 1995; Jaarola &Searle 2002; Brunhoff
et al
. 2003). Despite similarities, suchas the importance of southern European refugia, there is alarge species-specific variance among phylogeographicalpatterns (Haynes
et al
. 2003; Michaux
et al
. 2003).To complement these studies on small rodents, we here
aim to infer the genetic phylogeography of the commonhamster,
Cricetus cricetus
, which is somewhat different frommost of the previously analysed muroids in its ecologicalpreferences and adaptability. The main distribution area ofthis semifossorial and facultatively hibernating animal liesin the eastern European and western Asian plains where itoccupies steppe, meadows and steppe-forests (Berdyugin& Bolshakov 1998; Nechay 2000). The northern speciesboundary roughly coincides with 55
°
northern latitude,although in Russia it extends up to 59
°
northern latitude(Niethammer & Krapp 1982). Common hamsters in west-ern and central Europe are largely restricted to agriculturalsites with deep loess soils and suitable microclimates(Grulich 1975; Nechay
et al
. 1977). Palaeontological data sug-gest that
C. cricetus
underwent repeated range shifts duringthe Quaternary (Storch 1974; Markova
et al
. 1995; Kowalski2001). Wood clearances during Neolithic and medieval timescreated the last significant advances of the common hamster(Dupont 1932; Werth 1936; Clason 1999). Formerly highlyabundant, hamsters have suffered from a Europe-widepopulation reduction over the last 40 years (Backbier &Gubbels 1998; Murariu 1998; Nechay 2000). The mostdramatic population collapses have occurred along thewestern frontier of the distribution (Libois & Rosoux 1982;Baumgart 1996). A previous study has shown that geneticdepauperization of western hamsters, which are consideredto represent the subspecies
Cricetus cricetus canescens
(Mitchell-Jones
et al
. 1999), is not only caused by the currentdecline but also historical events (Neumann
et al
. 2004).Changes in agricultural management are suspected toprovide the main reason for the progressive disappearanceof the species (Nechay
et al
. 1977; Nechay 2000) but poten-tial climatic effects have not yet been examined.
We conducted this study to investigate the followingquestions: Does the phylogeographical structure of thecommon hamster match that of other European muroids?Is it in agreement with a late/postglacial expansion modeland, if so, where are the locations of potential refugia? Did
population structure evolve under ecological and geo-graphical constraints?
Exploring the glacial history of common hamsters notonly supports species-specific conservation measures butmay also enhance our general understanding of populationdevelopments along species boundaries.
Materials and methods
Population sampling
Sampling concentrated mainly on populations in centraland western Europe covering the range of the twosubspecies,
Cricetus cricetus canescens
and
Cricetus cricetuscricetus
. Additionally, we included hamsters from EuropeanRussia, as well as single specimens each from Romania,Poland and western Siberia. A total of 435 specimens werecollected from more than 60 localities in eight countries.Table 1 shows sampling localities and the number ofindividuals examined. Figure 1 gives details of geographicaldistributions.
DNA extraction
Genomic DNA isolation from fresh or ethanol fixed materialssuch as ear, liver, muscle, hair and skin followed a standardprotocol supplied with the E.Z.N.A. Tissue DNA Kit IIsystem (Peqlab Biotechnologie).
Mitochondrial DNA analysis
We investigated three partial mitochondrial (mt) regions:control region (
ctr
), 16S rRNA (
16S
) and cytochrome
b
(cyt
b
). Before the experiment, we compared polymerase chainreaction (PCR) products obtained from hair, ear and liverof the same animal to exclude tissue-specific amplificationof pseudogenes. No additional gene copies were found.All three amplified mt genes proved either similar or almostidentical to previously published Cricetinae sequences(Nakamichi
et al
. 1998; Hashiguchi & Ikushima 1998;Smulders
et al
. 2003). To avoid extensive sequencing, wedid not use the same number of individuals for every gene.Control region sequences obtained in a previous studywere included (Neumann
et al
. 2004). PCR amplification,purification and sequencing of DNA followed largelythe procedure described in Neumann
et al
. (2004). A PCRproduct of 421 bp was amplified.
Two novel internal sequencing primers were designed forthe control region (DlInt1: 5
′
-ATTCCCCTAGCATATAAG-CAT-3
′
, annealing temperature 50
°
C; DlInt2: 5
′
-GTGGGCG-GGTTGCTGGTTTCT-3
′
, annealing temperature 60
°
C).Partial 16S rRNA (554 bp total fragment length) was
amplified and sequenced using original shrew primers at54
°
C annealing temperature (Quérouil
et al
. 2001).

S P A T I A L S T R U C T U R E O F C O M M O N H A M S T E R S
1475
© 2005 Blackwell Publishing Ltd,
Molecular Ecology
, 14, 1473–1483
Table 1 Sampling locations of European common hamsters and numbers of individuals included in mitochondrial (ctr) and microsatelliteanalyses. Note that not all animals were investigated for all three mt genes
Sampling region Location (country) Sample ID
Analysed individuals
Total mt Loci ctr Microsatellites
Western populations Limburg (the Netherlands) W1 28 18 28Flanders (Belgium) W2 10 9 10Alsace (France) W3 67 20 67Northrhine-Westfalia (Germany) W4 7 3 7Baden-Wuerttemberg (Germany) W5 33 20 32Rhineland-Pfalz (Germany) W6 2 2 2Hessen (Germany) W7 1 1 —
Central German populations Lower Saxony (Germany) C1 24 18 17Saxony-Anhalt (Germany) C2 97 20 97Thuringia (Germany) C3 35 20 35
Carpathian Basin/Pannonia Southern Moravia (Czech Republic) P1 65 24 65seven locations across Hungary P2 40 25 40
Other samples from Europe/Asia Brzezie (Poland) E1 1 1 1Craiova (Romania) E2 1 1 —Mozdok/Caucasus (Russia) E3 2 2 1Saratov (Russia) E4 1 1 —Kirov (Russia) E5 2 2 2Ural/Ekaterinburg (Russia) E6 19 12 19Novosibirsk (Russia) E7 1 1 1
Total 435 200 424
Fig. 1 Geographical distribution of Cricetus cricetus samples (circles) and proposed expansion routes (arrows). Grey areas refer to the recentdistribution range according to Panteleyev (1998) and Mitchell-Jones et al. (1999). Question marks indicate potential glacial refugia deducedfrom fossil records (Markova et al. 1995). Legend: circles (dark grey), West; light grey, Central; black, Pannonia; white, Poland, Romania,Russia. See Table 1 for sample symbols.

1476
K . N E U M A N N
E T A L .
© 2005 Blackwell Publishing Ltd,
Molecular Ecology
, 14, 1473–1483
Cytochrome
b
(984 bp total fragment length) was ampli-fied using primers L14841 (Kocher
et al
. 1989) and HCRIC3(5
′
-GATGAAAGGGTATTCTACTGGTTG-3
′
) at 50
°
Cannealing temperature. Sequencing was carried out usingflanking and internal primers (CbLint1: 5
′
-ACGTACTAC-CATGAGGTCAAAT-3
′
, annealing temperature 51
°
C;CbLint2: 5
′
-TCCCGCACACATTAAACC-3
′
, annealingtemperature 50
°
C; CbHint1: 5
′
-GTGGATTTGCAGGAG-TATAAT-3
′
, annealing temperature 50
°
C; CbHint2:5
′
-AATGATTTGGCCTCATGGGAG-3
′
, annealing tempera-ture 53
°
C; CbHint3: 5
′
-CGGCAGATGTGGGTTACTGAT-3
′
,annealing temperature 58
°
C).Sequences were aligned in
proseq
(version 2.9, D.A.Filatov, University of Birmingham, UK) and the number ofhaplotypes (
N
H
) scored. Nucleotide diversity
π
(based onhaplotypes in percentage) within groups and net distance
D
a
(
%) between phylogroups were calculated using theKimura 2-parameter (K2P) method (
mega
2.1, Kumar
et al
.2001). Net distance corrects distance measures betweengroups by subtracting mean within-group distances.Parsimony (Templeton
et al
. 1992) and median-joining(Bandelt
et al
. 1999) networks were constructed using
tcs
1.18 software (Clement
et al
. 2000) and
network
4101(www.fluxus-engineering.com), respectively. Minimumevolution (ME: K2P distance, neighbour-joining methodfor initial tree building, maximum number of trees = 1000;Rzhetsky & Nei 1993) and maximum-parsimony (MP:heuristic search, close-neighbour-interchange method withthe random addition of 1000 trees; Nei & Kumar 2000) treeswere computed in
mega
2.1. Robustness of nodes wasconfirmed by bootstrapping (1000 replicates). Two hamsterspecies,
Cricetulus migratorius
and
Cricetulus griseus,
wereincorporated as outgroup species. Fu’s
F
S
(Fu 1997) test andpairwise mismatch distributions within populations (Rogers1995) were chosen to detect recent population growth(
arlequin
2.001; Schneider
et al.
2000). Parametric bootstrap-ping (1000 replicates) was carried out to test whether mis-match patterns obtained fit with a sudden-expansion model(Schneider & Excoffier 1999). Relative rate tests were per-formed to detect potential rate variation between phylo-genetic groups and between genes. We chose the two-clustertest option (Takezaki
et al
. 1995) as implemented in
phyltest
2.0 written by Kumar (Pennsylvania State University). Theprogram allows the incorporation of multiple sequencesinto one lineage. Two lineages were then compared againsta third outgroup. Level of incongruence between genes wastested with
paup
4b5 (option Hompart). This approach usesthe incongruence length difference (ILD) test with the par-simony criterion; 1000 randomizations were performedon variable sites only (Farris 1985);
C. migratorius
and
C. griseus
served as outgroups. For molecular clock analyses on mthaplotypes, we used a divergence rate of 7.5–13% as pro-posed by Galbreath & Cook (2004) for
Microtus oeconomus.
Their rates were applied to combined cyt
b and ctr sequences
and are based on divergence calculations obtained fromtwo different arvicolid genera Lemmus (Fedorov & Stenseth2001) and Microtus (Conroy & Cook 2000b).
Microsatellite analysis
Hamsters were genotyped at 11 microsatellite loci (Neumann& Jansman 2004). Mean number of alleles (A) and observedheterozygosity (HO) were calculated in genepop (Raymond& Rousset 1995). Rogers’ genetic distance, Dr (Rogers 1972)between populations and population groups was computedin populations (http://www.cnrs-gif.fr/pge/index.php?lang = en). Bootstrapping was carried out over the numberof loci. The resulting tree was drawn in treeview (Page 1996).Allele size range, R, was measured as the sum of possiblemutational steps deduced from overall allele distributionsto account for unusual size mutants, which do not affectthe actual size span.
Results
Table 2 provides diversity measures for mitochondrial andmicrosatellite loci as well as the number of individualsincluded in different analyses.
Mitochondrial data
Thirty-six ctr haplotypes (new haplotypes under AJ633722–38, GenBank) were found in 200 individuals. Twenty-ninesites proved variable among 337 bp of sequence, of which16 mutations were parsimony informative. Only fourtransversions were observed. Two of them occurred in asingle Russian haplotype (Mozdok, Caucasus).
Seventeen 16S haplotypes (AJ633739–55) were identifiedin 130 animals. Sixteen out of 468 nucleotides provedvariable and 11 were parsimony informative. Five of 18mutations were transversions.
Twenty-seven cyt b haplotypes (AJ633756–82) wereidentified in 46 individuals. Nine hundred twenty-five(925) base pairs of sequence yielded 35 singletons and 27parsimony-informative substitutions. Nine transversionswere identified. Two haplotypes, Cb26 (Novosibirsk, Russia)and Cb27 (Brzezie, Poland), contained, in each case, twotransversions. Fifteen mutations lead to amino acid changes.
The numbers of informative sites were either lower than(ctr, 16S) or equal (cyt b) to haplotype numbers suggestinghomoplasy. To enhance resolution, we combined ctr and16S in networks because both of these two DNA sequenceswere obtained from the largest numbers of individuals(n = 130). Parsimony as well as median-joining networksshowed complex structures among haplotypes (for singlegenes as well as combined) as a consequence of recurrentmutations. Homoplasy was detected between German andRussian individuals and also inside Germany. Mutations

S P A T I A L S T R U C T U R E O F C O M M O N H A M S T E R S 1477
© 2005 Blackwell Publishing Ltd, Molecular Ecology, 14, 1473–1483
between affected haplotypes were down weighted inmedian-joining networks (Bandelt et al. 1999). Networks(Fig. 2, only the median-joining network based on com-bined 16S + ctr sequences is shown) as well as gene trees(Fig. 3, only the ME tree based on all mt genes combined isshown) consistently separated western and centralEuropean hamsters into two well-defined lineages. Clade‘North’ comprises all populations from Germany, France,Belgium and the Netherlands and therefore combines theoriginal groups ‘West’ and ‘Central’ (see also Table 2).Hamsters from the Czech Republic and Hungary form thesecond clade ‘Pannonia’. Both lineages do not share anymitochondrial haplotypes. Diversity values for cyt b and ctrbetween North and Pannonia were rather similar (Pannonia:NHctr = 13, NHcyt b = 13; πctr = 1.1 ± 0.3%, πcyt b = 0.6 ± 0.2%vs. North: NHctr = 16, NHcyt b = 9; πctr = 0.9 ± 0.3%, πcyt b =0.4 ± 0.1%). Pannonian hamsters proved invariant for 16Sunlike all other populations. Da values between the twophylogeographical groups were as Da ctr = 1.0 ± 0.4%, Da 16S= 1.3 ± 0.5%, Da cytb = 0.9 ± 0.3%, Da comb. = 1.1 ± 0.3%.
Both main lineages show signs of further substructuring.The northern lineage is divided into highly polymorphicpopulations from central Germany (Central; C1–C3,NH = 8–13) and less polymorphic western hamsters (West;W1–W7, NH = 1–5). West appears highly bottlenecked,with very low π values (ctr = 0.5 ± 0.2%, 16S = 0.2 ± 0.2%,cyt b = 0). Overlapping haplotypes between West andCentral were restricted to the ctr sequences (Dl01, Dl07) butonly the MP tree showed significant genetic divergence.All tree-making methods confirm a significant separationof Hungarian and Czech hamsters within the Pannonianlineage and show almost identical topologies. Haplotypesfrom Poland (E1) and Russia (E3–7) do not consistentlycluster with any of the other groups (single genes). Thereis evidence for more than one phylogeographical lineage inthe eastern sample (E3, E5 + E6, E7) although the existenceof a single and very heterogeneous eastern phylogroupcannot fully be excluded. One well-supported cladecomprises hamsters from Kirov (E5) and the Ural area(E6), which are close to the species’ northern boundary. A
Table 2 Mitochondrial (NH, haplotype number; π, nucleotide diversity) and microsatellite diversity measures of European commonhamster phylogroups. Allelle number (A), size range (R) and observed heterozygosity (HO) represent means over all loci. Microsatelliteallele range is calculated as number of mutational steps and not as sequence length differences. Parameters of expansion (Tau/FS) are basedon pairwise mismatches of mt haplotypes
Phylogroups(Sample ID)
Mitochondrial Loci Microsatellite Loci
NH (n) ctr 16S cyt b all combined π ± SE Tau (95% CI)/FS A ± SE (n) R ± SE HO ± SE
West 5 (78) 0.5 ± 0.2 1.52 (0.00–2.97), P = 0.117/−4.29, P < 0.001 6.55 ± 1.00 5.9 ± 0.97 0.38 ± 0.06(W1–W7) 2 (43) 0.2 ± 0.2 — (137)
1 (10) 0 —5 (10) 0.1 ± 0.1 3.00 (0.45–4.31), P = 0.560/−3.83, P = 0.001
Central 13 (58) 0.9 ± 0.3 2.97 (0.94–4.36), P = 0.678/−12.92, P < 0.001 11.09 ± 1.46 9.8 ± 1.26 0.69 ± 0.04(C1–C3) 8 (30) 0.4 ± 0.2 2.24 (0.21–3.76), P = 0.024/−7.42, P < 0.001 (148)
8 (12) 0.4 ± 0.1 2.73 (0.86–5.92), P = 0.972/−4.99, P < 0.0017 (10) 0.3 ± 0.1 8.32 (4.10–12.99), P = 0.690/−5.16, P = 0.005
North 16 (136) 0.9 ± 0.3 2.83 (0.76–4.06), P = 0.217/−18.61, P < 0.001 11.55 ± 1.53 10.5 ± 0.13 0.55 ± 0.04(W1–7 + C1–3) 10 (73) 0.4 ± 0.2 2.43 (0.20–3.85), P = 0.024/−10.38, P < 0.001 (285)
9 (22) 0.4 ± 0.1 3.47 (1.22–5.60), P = 0.947/−6.06, P = 0.00112 (20) 0.4 ± 0.1 8.32 (3.81–13.17), P = 0.700/−5.16, P = 0.006
Pannonia 13 (44) 1.1 ± 0.3 3.70 (1.46–5.42), P = 0.784/−11.51, P < 0.001 13.27 ± 1.34 15.0 ± 1.81 0.76 ± 0.02(P1, P2) 1 (40) 0 — (105)
13 (18) 0.6 ± 0.2 7.74 (3.33–11.85), P = 0.537/−4.99, P < 0.00110 (14) 0.5 ± 0.1 5.65 (2.40–14.58), P = 0.260/−3.87, P = 0.017
E1–E7 7 (20) 1.1 ± 0.3 7.4 ± 0.45 9.4 ± 0.83 0.60 ± 0.046 (17) 0.6 ± 0.2 (24)5 (6) 1.6 ± 0.36 (12) 1.2 ± 0.2
Total 36 (200) 1.5 ± 0.3 5.16 (2.90–6.57), P = 0.401/−25.57, P < 0.001 17.36 ± 2.79 16.8 ± 1.65 0.60 ± 0.0317 (130) 0.9 ± 0.3 2.20 (0.52–6.41), P = 0.008/−16.26, P < 0.001 (414)27 (46) 1.2 ± 0.2 13.83 (8.14–18.02), P = 0.779/−19.33, P < 0.00128 (46) 1.1 ± 0.2 26.43 (18.43–31.94), P = 0.26/−10.58, P < 0.001
*Note that mean allele size ranges do not include Ccrµ6 whereas other microsatellite measures are based on all 11 loci.

1478 K . N E U M A N N E T A L .
© 2005 Blackwell Publishing Ltd, Molecular Ecology, 14, 1473–1483
Polish hamster associated with this group when the MEmethod was applied. According to the networks, Romania(E2) represents a link between Russian and Pannonianhamsters.
Pairwise mismatch analyses of mitochondrial genesrevealed unimodal patterns for all population groups,congruent with a recent expansion/contraction scenario.Goodness-of-fit tests confirm the correctness of the mis-match distributions for all single gene analyses, except for16S in Central and North (both P = 0.024), and for combinedgenes in all cases. P values above 0.05 confirm suddenexpansion. Fu’s FS rejects constant size for single genes(P = 0.001) and combined genes (P = 0.017–0.001).
The relative rate test indicated no significant rate hetero-geneity between phylogeographical groups or betweengenes (ctr: Z = 1.344, 16S: Z = 1.344, cyt b: Z = 0.380, all notsignificant) using the K2P distance. To carry out the test,we compared the groups North and Pannonia against athird group containing all eastern samples (E1–7). Highcongruence between mt genes (P = 0.001) was also provenby an ILD test. These results and the fact that all mt genesshow similar π values for the entire sample (πctr = 1.5 ±0.3%, π16S = 0.9 ± 0.3%, πcyt b = 1.2 ± 0.2) allow their com-bination for time estimates. Based on that, we obtainedthe following molecular datings: 85 000–147 000 bp(95%CI: 39 000–225 000 years) for the split betweenNorth and Pannonia, 37 000–64 000 years (95%CI: 17 000–102 000 years) for the expansion of North and 25 000–44 000 years (95%CI: 11 000–112 000 years) for the expansionof Pannonia.
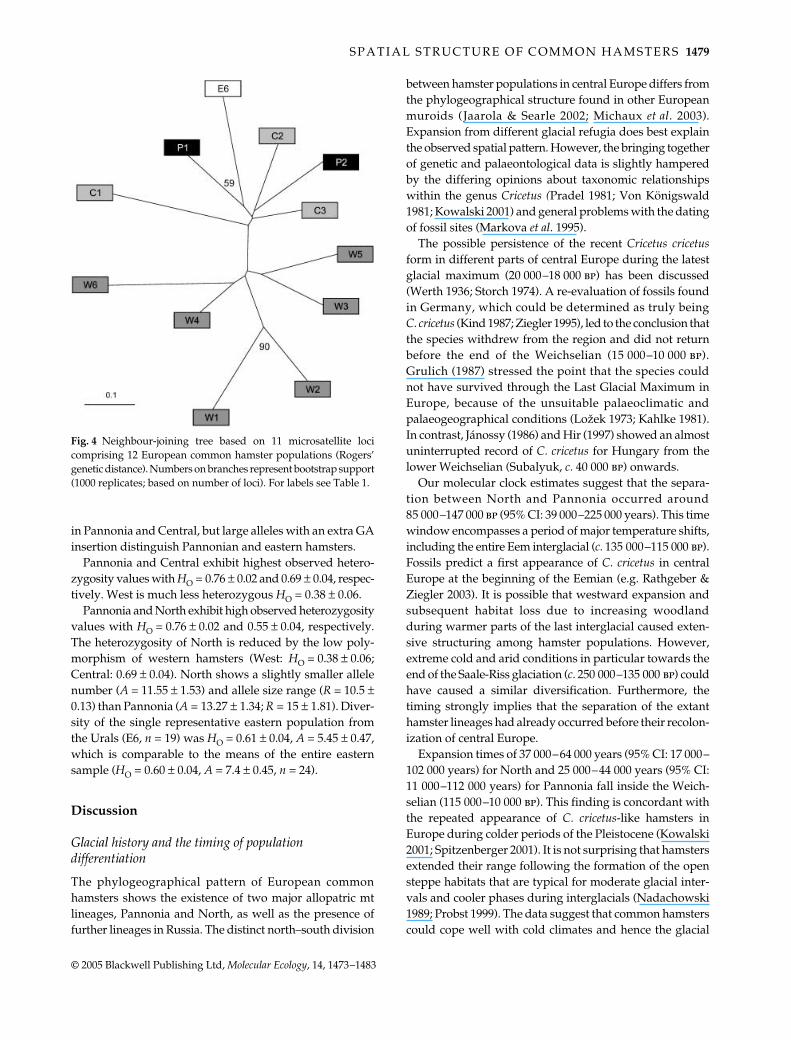
Microsatellites
DNA profiles of 414 individuals were obtained. The NJ treehas only limited resolution and a star-like topology (Fig. 4).The low bootstrap significance reflects the similar allelecompositions of geographical groups. Two microsatelliteloci, Ccrµ3 and Ccrµ6, harbour unusual allele length variants.A 192-bp allele having an additional single nucleotideinsertion is found in central German populations as well asacross Hungary. A characteristic gap dividing small andlarge size alleles at the tetranucleotide locus Ccrµ6 occurs
Fig. 2 Median-joining network based oncombined ctr + 16S haplotypes (n = 43)obtained from European common hamsters(n = 130). Small empty circles refer to missingintermediates with relevance for constructionof links. Links were modified in cases wheremore than one connection was possible.Numbers on links refer to mutational stepsdividing haplotypes. Geographic locationsare indicated as shown in Table 1 andFig. 1.
Fig. 3 Consensus ME tree based on 28 combined mt haplotypes(ctr + 16S + cyt b) of 16 common hamster populations. Numbers onbranches correspond to boostrap support (1000 replicates; ME/MP).Haplotypes of two related hamster species Cricetulus griseus andCricetulus migratorius served as outgroups. Labels are as in Table 1.
S P A T I A L S T R U C T U R E O F C O M M O N H A M S T E R S 1479
© 2005 Blackwell Publishing Ltd, Molecular Ecology, 14, 1473–1483
in Pannonia and Central, but large alleles with an extra GAinsertion distinguish Pannonian and eastern hamsters.
Pannonia and Central exhibit highest observed hetero-zygosity values with HO = 0.76 ± 0.02 and 0.69 ± 0.04, respec-tively. West is much less heterozygous HO = 0.38 ± 0.06.
Pannonia and North exhibit high observed heterozygosityvalues with HO = 0.76 ± 0.02 and 0.55 ± 0.04, respectively.The heterozygosity of North is reduced by the low poly-morphism of western hamsters (West: HO = 0.38 ± 0.06;Central: 0.69 ± 0.04). North shows a slightly smaller allelenumber (A = 11.55 ± 1.53) and allele size range (R = 10.5 ±0.13) than Pannonia (A = 13.27 ± 1.34; R = 15 ± 1.81). Diver-sity of the single representative eastern population fromthe Urals (E6, n = 19) was HO = 0.61 ± 0.04, A = 5.45 ± 0.47,which is comparable to the means of the entire easternsample (HO = 0.60 ± 0.04, A = 7.4 ± 0.45, n = 24).
Discussion
Glacial history and the timing of population differentiation
The phylogeographical pattern of European commonhamsters shows the existence of two major allopatric mtlineages, Pannonia and North, as well as the presence offurther lineages in Russia. The distinct north–south division
between hamster populations in central Europe differs fromthe phylogeographical structure found in other Europeanmuroids (Jaarola & Searle 2002; Michaux et al. 2003).Expansion from different glacial refugia does best explainthe observed spatial pattern. However, the bringing togetherof genetic and palaeontological data is slightly hamperedby the differing opinions about taxonomic relationshipswithin the genus Cricetus (Pradel 1981; Von Königswald1981; Kowalski 2001) and general problems with the datingof fossil sites (Markova et al. 1995).
The possible persistence of the recent Cricetus cricetusform in different parts of central Europe during the latestglacial maximum (20 000–18 000 bp) has been discussed(Werth 1936; Storch 1974). A re-evaluation of fossils foundin Germany, which could be determined as truly beingC. cricetus (Kind 1987; Ziegler 1995), led to the conclusion thatthe species withdrew from the region and did not returnbefore the end of the Weichselian (15 000–10 000 bp).Grulich (1987) stressed the point that the species couldnot have survived through the Last Glacial Maximum inEurope, because of the unsuitable palaeoclimatic andpalaeogeographical conditions (Lo6ek 1973; Kahlke 1981).In contrast, Jánossy (1986) and Hir (1997) showed an almostuninterrupted record of C. cricetus for Hungary from thelower Weichselian (Subalyuk, c. 40 000 bp) onwards.
Our molecular clock estimates suggest that the separa-tion between North and Pannonia occurred around85 000–147 000 bp (95% CI: 39 000–225 000 years). This timewindow encompasses a period of major temperature shifts,including the entire Eem interglacial (c. 135 000–115 000 bp).Fossils predict a first appearance of C. cricetus in centralEurope at the beginning of the Eemian (e.g. Rathgeber &Ziegler 2003). It is possible that westward expansion andsubsequent habitat loss due to increasing woodlandduring warmer parts of the last interglacial caused exten-sive structuring among hamster populations. However,extreme cold and arid conditions in particular towards theend of the Saale-Riss glaciation (c. 250 000–135 000 bp) couldhave caused a similar diversification. Furthermore, thetiming strongly implies that the separation of the extanthamster lineages had already occurred before their recolon-ization of central Europe.
Expansion times of 37 000–64 000 years (95% CI: 17 000–102 000 years) for North and 25 000–44 000 years (95% CI:11 000–112 000 years) for Pannonia fall inside the Weich-selian (115 000–10 000 bp). This finding is concordant withthe repeated appearance of C. cricetus-like hamsters inEurope during colder periods of the Pleistocene (Kowalski2001; Spitzenberger 2001). It is not surprising that hamstersextended their range following the formation of the opensteppe habitats that are typical for moderate glacial inter-vals and cooler phases during interglacials (Nadachowski1989; Probst 1999). The data suggest that common hamsterscould cope well with cold climates and hence the glacial
Fig. 4 Neighbour-joining tree based on 11 microsatellite locicomprising 12 European common hamster populations (Rogers’genetic distance). Numbers on branches represent bootstrap support(1000 replicates; based on number of loci). For labels see Table 1.

1480 K . N E U M A N N E T A L .
© 2005 Blackwell Publishing Ltd, Molecular Ecology, 14, 1473–1483
maximum caused certainly a retreat, but did not significantlyaffect the population size of initially expanding populations.Interestingly, the expansion time for Pannonian hamstersis associated with the arrival of C. cricetus in Hungary dur-ing the Subalyukian substage (Janossy 1986). Fossils, andthe high genetic diversity of recent populations, support anuninterrupted presence of common hamsters in Hungaryover the last 40 000–50 000 years. Hamsters were pushedback from the western parts of the Carpathian basin by thelast glacial advance, as documented for Austrian populations(Spitzenberger 2001), but probably survived in theHungarian plains. The lack of variability at the 16S locus inPannonian hamsters is intriguing because this cannotsimply be explained by a past bottleneck, as other mt geneswere not affected. The conservation of 16S in Pannonia provedsignificant relative to expectation (Fisher exact test, P = 0.011).However, it should be mentioned that the unexplainedinvariance does not substantially alter time estimates(e.g. expansion time of Pannonia calculated from cyt b + ctronly; 34 000–60 000 years, 95% CI: 16 000–154 000 years).
As already deduced from the divergence time estimate,the isolation in a Hungarian refugium did not significantlycontribute to the genetic separation between North andPannonia, which must have occurred earlier, most likely ineastern refugia. Additional evidence for this comes fromRomanian mt haplotypes which are intermediate betweenthose of Pannonian and Russian hamsters. Although wehad only one Romanian sample from outside the Car-pathian basin, its association with Pannonian and Russiananimals is informative. It reflects a southern expansionroute which was still used by Ukrainian hamsters duringgradations in the 20th century (Calinescu 1931). The mostimportant retreat areas presumably existed in the largesouthern Russian steppe zone, which represents the maindistribution centre of the species (Niethammer & Krapp1982; Nechay 2000). Markova et al. (1995) showed fromfossil records that, at the end of the last glaciation, theRussian hamster range contracted to the west with the Uralsforming an eastern boundary. Recolonization of Siberiaand central Asia started from there at the end of the Valdai(Weichselian) epoch (15 000–10 000 bp). In a similar way,hamsters abandoning the western range during the lastglacial advance may have returned from such an easternrefugium when the climate improved, establishing thenorthern lineage. A highly structured retreat zone formedby the Ukrainian and southern Russian plains may haveserved as a source of repeated population expansion toshift species boundaries throughout the entire Pleistocene(Fig. 1). This is supported by fossil records for that regionover the last 130 000 years (Markova et al. 1995). The existenceof further lineages in the Russian sample gives evidence forthe heterogeneous structure of the eastern retreat area. Thecommon hamster may therefore provide a phylogeograph-ical pattern that differs from those previously found for
other small mammals (Bilton et al. 1998; Jaarola & Searle2002). However, Haynes et al. (2003) reported two maineastern European lineages in Microtus arvalis, another rodentadapted to open landscapes. More frequent spatial popu-lation movements along the northern boundary of therefugium could have led to recurrent acquisition of mthaplotypes explaining homoplasy in North but not inPannonia. Evidence for expansion from a bottleneck (118 000–204 000 bp, 95% CI: 68 000–266 000 years) is found for theentire hamster sample. This may indicate that all extantCricetus hamsters could have originated from a smallpopulation in the middle Pleistocene, perhaps during thepenultimate glaciation.
Despite significant differences between mt haplotypes,there are obvious similarities at the nuclear level. Highmutation rates in microsatellites may cause notable levelsof homoplasy in distantly related populations (Estoup et al.1995; Jarne & Lagoda 1996) explaining the lack of resolu-tion when using allele frequencies to discriminate hamsterpopulations. In contrast, a specific allele-spacing pattern atlocus Ccrµ6 and the unexpected sequence variant at locusCcrµ3 are very likely identical by descent. The 192-bp alleleat locus Ccrµ3, found in central German and Hungarianhamsters, shows not only an additional nucleotide inser-tion but also three-point mutations not found in otheralleles with regular dinucleotide variation (185, 191, 193,195 bp). This accumulation of mutations identifies this par-ticular allele as one which already has persisted for a longtime in hamster populations. The evidence for sympatrythat is seen at the nuclear level can be readily explained bythe much larger effective population size compared tomaternally inherited genes (Zhang & Hewitt 2003). Thesharing of identical microsatellite alleles, as well as similarallele frequencies, suggests a relatively recent commonancestry of current hamster populations, complementingmt data in this respect.
Spatial structure in western and central Europe is maintained by geographical and ecological barriers
The contemporary phylogenetic structure of commonhamsters in Europe is largely the result of expansion froma highly structured eastern refugium covering the Russianplains. Differentiation is enhanced by lineage sorting causedby further census size fluctuations, and the probable founderevent which led to the division of North into subgroupsCentral and West. A core area for the expansions beingwithin the Russian plains appears very likely, consideringthe fact that common hamsters represent typical continentalsteppe animals adapted to open landscapes. Suitable hamsterhabitats with mesic climates and deep loess soils are notwidely distributed in central and western Europe leadingto a disjunctive pattern of distribution. Therefore, historicand current partitioning of European lineages must be the

S P A T I A L S T R U C T U R E O F C O M M O N H A M S T E R S 1481
© 2005 Blackwell Publishing Ltd, Molecular Ecology, 14, 1473–1483
result of geographical and ecological barriers althoughanthropogenic influence allowed the colonization of pre-viously uninhabitable areas. A very efficient north–southbarrier is provided through a mountain chain formed bythe Carpathians, Sudetes and German uplands isolating thetwo major central European lineages, North and Pannonia.Mountains generally play an important role for the impedi-ment of dispersal in small mammals (Bilton et al. 1998). Asa result, Pannonian hamsters became trapped inside theCarpathian basin. A similar differentiation of southern(Hungary, Slovakia) and northern (the Netherlands,Germany) populations in central Europe was also observedin Microtus arvalis (Haynes et al. 2003). The German uplandsconstitute not only the east–west barrier preventing geneflow between western German hamsters and Pannonia,but also shield central German hamsters from westernhamsters. The subdivision of the northern lineage is theresult of a western expansion by central German hamsters.Star-like topologies and low levels of mt and microsatellitevariability arose from a founder event (Neumann et al.2004) predicted for leading edge dispersal (Hewitt 1996).Once arrived, hamsters spread along the Rhine valleysupported by increased farming in Neolithic times (Dupont1932; Clason 1999). River valleys seem to represent impor-tant migration routes because of suitable microclimaticconditions and extensive agriculture. If German uplandsefficiently interrupted gene flow, westward expansion wasonly possible at times of favourable climatic circumstances,allowing the animals to overcome lower mountains, orbypass them by a northern route. Ecological conditionshad and still have an important influence on the spatialdistribution of common hamsters. An invisible ecolo-gical frontier prevented the establishment of long lastingpopulations in the northern parts of Poland and Germany(Werth 1936; Surdacki 1971). Deteriorating climatic conditionsmay also have caused the separation from central Germanand eastern populations. Several studies show a widerwestern distribution of the common hamster during lateglacial periods (summaries in Niethammer & Krapp 1982and Spitzenberger 2001). It is noteworthy that the Polishsample shows no association with German animals and thusmay have originated from a different wave of expansionthat did not reach Germany. Until now, no contact zoneswere identified between any of the phylogenetic groups.However, hamster sites in Europe are highly fragmentedand recent densities are low, reducing the chance of success-ful dispersal (Nechay 2000). Therefore, any contact zonespresumably only existed temporarily.
Outlook
Fossil records and current genetic structure show a highlydynamic range development of the common hamster inEurope. Multiple wave-like expansion events are consistent
with the species’ high reproductive potential. It is note-worthy that familiar patterns of west–east and north–southdivergence between phylogeographical groups are theresult of expansion routes restrained by ecological andgeographical barriers. Such barriers increase their signi-ficance when they fall close to range limits. The distributionof mtDNA phylogenetic lineages in central Europe doesnot correlate with the proposed existence of a westernsubspecies Cricetus cricetus canescens and an eastern formCricetus cricetus cricetus (Mitchell-Jones et al. 1999) a findingwhich has implications for the conservation programscurrently running. Our results also contradict a study bySmulders et al. (2003) that reported overlapping cytochromeb haplotypes between Dutch and Czech hamsters, but theirstudy experienced some irregularities in the methodology(Smulders, personal communication).
The repeated range fluctuations during Pleistocene andpast Holocene periods allow us to postulate the involvementof climatic factors in the large-scale negative populationtrends in common hamsters seen over the last 40 years.Dramatic declines of hamster populations in the Nether-lands (Backbier & Gubbels 1998), Belgium (Mercelis 2002)and the extinction of northern populations in Germany(Krüger & Krüger 1998) show an ongoing withdrawal ofthe edges of the distribution. Spitzenberger (1998) reportedthat hamsters in Austria mainly retreated from areas witha colder and wet climate. Further studies should focus onthe distribution and changes in the density of hamsterpopulations in relation to climatic factors, for examplewinter humidity. Knowledge about historic range shiftsmay therefore provide valuable guidance. A more detailedanalysis of the spatial genetic structure of eastern Europeancommon hamster populations is required to identifypossible source populations for major central Europeanlineages.
Acknowledgements
We thank G. Becke, S. Hofmann and B. Gebhardt for technicalassistance. The work could only be carried out with the helpof many volunteers, e.g. Z. Bihari, K. Berdyugin, U. Weinholdt,D. Murariu who provided samples across Europe. Special thanksgoes to J. Brookfield, G. Storch and L. Maul for valuable com-ments. We also wish to thank three anonymous reviewers for theirhelpful comments on the manuscript.
References
Backbier LAM, Gubbels EJ (1998) Artenschutzmaßnahmenzur Erhaltung des Feldhamsters Cricetus cricetus in Limburg(Niederlande). In: Ökologie und Schutz des Feldhamsters (edsStubbe M, Stubbe A), pp. 125–136. Wissenschaftliche Beiträgeder Martin-Luther-Universität Halle-Wittenberg.
Bandelt H-J, Forster P, Röhl A (1999) Median-joining networks forinferring intraspecific phylogenies. Molecular Biology and Evolu-tion, 16, 37–48.

1482 K . N E U M A N N E T A L .
© 2005 Blackwell Publishing Ltd, Molecular Ecology, 14, 1473–1483
Baumgart G (1996) Le Hamster d’Europe (Cricetus cricetus L. 1758)en Alsace. Rapport réalisé Pour l’Office National de la Chasse,Gertshiem-67, France.
Berdyugin KI, Bolshakov VN (1998) The common hamster (Crice-tus cricetus L.) in the eastern part of the area. In: Ökologie undSchutz Des Feldhamsters (eds Stubbe M, Stubbe A), pp. 43–79.Wissenschaftliche Beiträge der Martin-Luther-Universität Halle-Wittenberg.
Bilton DT, Mirol PM, Mascheretti S, Fredga K, Zima J, Searle JB(1998) Mediterranean Europe as an area of endemism for smallmammal rather than a source for northwards postglacialcolonization. Proceedings of the Royal Society of London. Series B,Biological Sciences, 265, 1219–1226.
Brunhoff C, Galbreath KE, Fedorov B, Cook JA, Jaarola M (2003)Holarctic phylogeography of the root vole (Microtus oeconomus):implications for Late Quarternary biogeography of high lati-tudes. Molecular Ecology, 12, 957–968.
Calinescu RJ (1931) Über Verbreitung und Einfälle von Cricetuscricetus nehringi MTSCH. in Rumänien. Zeitschrift für Säuge-tierkunde, 6, 231–233.
Clason AT (1999) Bird and mammal species richness in theNetherlands. In: The Holocene History of the European VertebrateFauna (ed. Benecke N), pp. 107–122. Verlag Marie LeidorfGmbH, Germany.
Clement M, Posada D, Crandall KA (2000) tcs: a computerprogram to estimate gene genealogies. Molecular Ecology, 9,1657–1660.
Conroy CJ, Cook JA (2000a) Phylogeography of a post-glacial col-onizer: Microtus longicaudatus (Rodentia: Muridae). MolecularEcology, 9, 165–175.
Conroy CJ, Cook JA (2000b) Molecular systematics of a Holarcticrodent (Microtus: Muridae). Journal of Mammalogy, 81, 344–359.
Cooper SJ, Ibrahim KM, Hewitt GM (1995) Postglacial expansionand genome subdivision in the European grasshopper Chorthip-pus parallelus. Molecular Ecology, 4, 49–60.
Dupont H (1932) La propagation du hamster en Belgique. Bulletinof the Du Musée Royal d’Historie Naturelle En Belgique, 7, 1–43.
Estoup A, Tailliez C, Cornuet J-M, Solignac M (1995) Size homo-plasy and mutational processes of interrupted microsatellites intwo bee species, Apis mellifera and Bombus terrestris (Apidae).Molecular Biology and Evolution, 12, 1074–1086.
Farris JS (1985) Distance data revisited. Cladistics, 1, 67–85.Fedorov VB, Stenseth NC (2001) Glacial survival of the Norwegian
lemming (Lemmus lemmus) in Scandinavia: inference frommitochondrial DNA variation. Proceedings of the Royal Society ofLondon. Series B, Biological Sciences, 268, 809–814.
Fu Y-X (1997) Statistical tests of neutrality against populationgrowth, hitchhiking and background selection. Genetics, 147,915–925.
Galbreath KE, Cook JA (2004) Genetic consequences of Pleistoceneglaciations for the tundra vole (Microtus oeconomus) in Beringia.Molecular Ecology, 13, 135–148.
Grulich I (1975) Zum Verbreitungsgebiet der Art Cricetus cricetus(Mamm.) in der Tschechoslowakei. Zoological Listy, 24, 197–222.
Grulich I (1987) Variability of Cricetus cricetus in Europe. Acta Sci-entiarum Academiae Scientiarum Bohemoslovacae – Brno, 21, 1–53.
Hashiguchi K, Ikushima T (1998) Nucleotide changes in mitochon-drial 16S rRNA gene from different mammalian cell lines. GeneGenetics Systematic, 73, 317–321.
Haynes S, Jaarola M, Searle J (2003) Phylogeography of the commonvole (Microtus arvalis) with particular emphasis on the colonizationof the Orkney archipelago. Molecular Ecology, 12, 951–956.
Hewitt GM (1996) Some genetic consequences of ice ages, andtheir role in divergence and speciation. Biological Journal of theLinnean Society, 58, 247–276.
Hewitt GM (1999) Post-glacial re-colonization of European biota.Biological Journal of the Linnean Society, 68, 87–112.
Hir J (1997) A short scetch of the evolution and stratigraphy of thePlio-Pleistocene cricetids (Rodentia, Mammalia) in Hungary.Folia Historico Naturalia Musei Matraensis, 22, 43–49.
Ibrahim KM, Nichols RA, Hewitt GM (1996) Spatial patterns ofgenetic variation generated by different forms of dispersal dur-ing range expansion. Heredity, 77, 282–291.
Jaarola M, Searle JB (2002) Phylogeography of field voles (Microtusagrestis) in Eurasia inferred from mitochondrial DNA sequences.Molecular Ecology, 11, 2613–2621.
Jaarola M, Tegelström M (1995) Colonization history of northEuropean field voles (Microtus agrestis) revealed by mitochon-drial DNA. Molecular Ecology, 4, 299–310.
Jánossy D (1986) Pleistocene vertebrate faunas of Hungary. Developmentsin Palaeontology and Stratigraphy, vol. 8. Elsevier, Amsterdam.
Jarne P, Lagoda PJL (1996) Microsatellites, from molecules topopulations and back. Trends in Ecology and Evolution, 11, 424–429.
Kahlke HD (1981) Das Eiszeitalter. Urania Verla Leipzig, Jena, Berlin.Kind C-J (1987) Das Felsställe — eine jungpaläolithisch-frühmeso-
lithische Abri-Station bei Ehingen-Mühlen, Alb-Donau-Kreis.Forschungen und Berichte zur Vor-und Fruhgeschickte Baden-Wurttembergs, 23, Stuttgart.
Kocher TD, Thomas WK, Meyer A et al. (1989) Dynamics of mito-chondrial DNA evolution in animals: amplification andsequencing with conserved primers. Proceedings of the NationalAcademy of Sciences of the United States of America, 86, 6196–6200.
Kowalski K (2001) Pleistocene rodents of Europe. Folia Quarter-naria, 72.
Krüger J, Krüger R (1998) Zur früheren Verbreitung des Hamstersin Mecklenburg/Nordostdeutschland. In: Ökologie und Schutzdes Feldhamsters (eds Stubbe M, Stubbe A), pp. 245–249,Wissenschaftliche Beiträge der Martin-Luther-UniversitätHalle-Wittenberg.
Kumar S, Tamura K, Jakobsen IB, Nei M (2001) mega2: MolecularEvolutionary Genetics Analysis software. Bioinformatics, 17,1244–1245.
Libois M, Rosoux R (1982) Le hamster commun (Cricetus cricetusL.) en Belgique: statut actuel et ancien des populations. Annalsde la Société Royale de Zoologie Belge, 112, 227–236.
Lo6ek V (1973) Nature in Quarternary. Prague. (in Czech).Markova AK, Smirnov NG, Kozharinov AV, Kazantseva NE,
Simakova AN, Kitaev LM (1995) Late Pleistocene distributionand diversity of mammals in northern Eurasia (paleofaunadatabase). Paleontologia I Evolució, 28–29, 5–143.
Mercelis S (2002) To hamster or not to hamster? Lutra, 45, 141–146.Michaux JR, Magnanou E, Paradis E, Nieberding C, Libois R
(2003) Mitochondrial phylogeography of the wood mouse(Apodemus sylvaticus) in the western Palearctic region. MolecularEcology, 12, 685–697.
Milá B, Girman DJ, Kimura M, Smith TB (2000) Genetic evidencefor the effect of a postglacial population expansion on the phylo-geography of a North American songbird. Proceedings of the RoyalSociety of London. Series B, Biological Sciences, 267, 1033–1040.
Mitchell-Jones AJ, Amori G, Bogdanowicz W et al. (1999) The Atlasof European Mammals. Poyser, London.
Murariu D (1998) About the hamster (Cricetus cricetus L., 1758 —Cricetidae, Rodentia) in Romania. In: Ökologie und Schutz Des

S P A T I A L S T R U C T U R E O F C O M M O N H A M S T E R S 1483
© 2005 Blackwell Publishing Ltd, Molecular Ecology, 14, 1473–1483
Feldhamsters (eds Stubbe M, Stubbe A), pp. 91–98, WissenschaftlicheBeiträge der Martin-Luther-Universität Halle-Wittenberg.
Nadachowski A (1989) Origin and history of the present rodentfauna in Poland based on fossil evidence. Acta Theriologica, 34,37–53.
Nakamichi N, Rhoads DD, Hayashi JI, Kagawa Y, Matsumura T(1998) Detection, localization, and sequence analyses ofmitochondrial regulatory region RNAs in several mammalianspecies. Journal of Biochemistry, 123, 392–398.
Nechay G (2000) Report on the status of hamsters: Cricetus cricetus,Cricetulus migratorius, Mesocricetus newtoni and other hamsterspecies in Europe. Nature and Environment Series, no. 106.Council of Europe Publishing, Strasbourg.
Nechay G, Hamar M, Grulich I (1977) The common hamster(Cricetus cricetus L.): a review. EPPO Bulletin, 7, 255–276.
Nei M, Kumar S (2000) Molecular Evolution and Phylogenetics.Oxford University Press, New York.
Neumann K, Jansman H (2004) Polymorphic microsatellitesfor the analysis of endangered common hamster populations(Cricetus cricetus L.). Conservation Genetics, 5, 127–130.
Neumann K, Jansman H, Kayser A, Maak S, Gattermann R (2004)Multiple bottlenecks in threatened western European popula-tions of the common hamster Cricetus cricetus (L.). ConservationGenetics, 5, 181–193.
Niethammer J, Krapp F (1982) Handbuch der Säugetiere Europas,Bd2/I, Rodentia II, Wiesbaden.
Page RDM (1996) treeview: an application to display phylo-genetic trees on personal computers. Computer Applications in theBiosciences, 12, 357–358.
Panteleyev PA (1998) The rodents of the Palaearctic fauna: compositionand areas. A.N. Severtzov IEE of RAS, Moscow.
Pradel A (1981) Cricetus cricetus (Linnaeus, 1758) (Rodentia, Mam-malia) from the Pleistocene–Holocene deposits of Saspowskacave (Ojcow, southern Poland). Acta Zoologica Cracov, 25, 293–306.
Probst E (1999) Deutschland in der Urzeit. Orbis, München.Quérouil S, Hutterer R, Barrière P et al. (2001) Phylogeny and evo-
lution of African shrews (Mammalia: Soricidae) inferred from16s rRNA sequences. Molecular Phylogenetics and Evolution, 20,185–195.
Rathgeber T, Ziegler R (2003) Die Säugetiere im Quartär vonBaden-Württemberg. In: Die Säugetiere Baden-Württembergs, Bd 1(eds Braun M, Dieterlen F), pp. 97–139. Eugen Ulmer GmbH &Co. Stuttgart.
Raymond M, Rousset F (1995) genepop (version 1.2): populationgenetics software for exact tests and ecumenicism. Journal ofHeredity, 86, 248–249.
Rogers JS (1972) Measures of genetic similarity and genetic distance.In: Studies in Genetics, 7, 145–153, University Texas Publishers,Austin, TX. 7213.
Rogers AR (1995) Genetic evidence for a Pleistocene populationexplosion. Evolution, 49, 608–615.
Rzhetsky A, Nei M (1993) Theoretical foundation of the minimum-evolution method of phylogenetic inference. Molecular Biologyand Evolution, 10, 1073–1095.
Schneider S, Excoffier L (1999) Estimation of demographic para-
meters from the distribution of pairwise differences when themutation rates vary among sites: application to humanmitochondrial DNA. Genetics, 152, 1079–1089.
Schneider S, Roessli D, Excoffier L (2000) ARLEQUIN, Version 2.000: asoftware for population genetic data analysis. Genetics and BiometryLaboratory, Department of Anthropology, University of Geneva,Switzerland.
Seddon JM, Santucci F, Reeve NJ, Hewitt GM (2001) DNA-footprints of European hedgehogs, Erinaceus europaeus andE. concolor: Pleistocene refugia, postglacial expansion andcolonization routes. Molecular Ecology, 10, 2187–2198.
Smulders MJM, Snoek LB, Booy G, Vosman B (2003) Completeloss of MHC genetic diversity in the common hamster (Cricetuscricetus) population in the Netherlands. Consequences for con-servation strategies. Conservation Genetics, 4, 441–451.
Spitzenberger F (1998) Verbreitung und Status des Hamsters(Cricetus cricetus) in Österreich. In: Ökologie und Schutz DesFeldhamsters (eds Stubbe M, Stubbe A), pp. 111–118. Wissenschaft-liche Beiträge der Martin-Luther-Universität Halle-Wittenberg.
Spitzenberger F (2001) Die Säugetierfauna Österreichs. Bundes-ministerium für Land- und Forstwirtschaft, Umwelt undWasserwirtschaft, Band 13.
Storch G (1974) Die Pleistozän-Holozän-Grenze in der Klein-säugerfauna Deutschlands. Zeitschrift für Säugetierkunde, 39, 84–97.
Surdacki S (1971) The distribution and ranges of the Europeanhamster Cricetus cricetus (Linnaeus, 1758) in Poland. Annals ofUniversity Mariae Curie-Sklodowska Lublin Sectio B, 26, 267–285.
Taberlet P, Fumagalli L, Wust-Saucy A-G, Cosson J-F (1998) Com-parative phylogeography and postglacial colonization routes inEurope. Molecular Ecology, 7, 453–464.
Takezaki N, Razhetsky A, Nei M (1995) Phylogenetic test of themolecular clock and linearized trees. Molecular Biology and Evo-lution, 12, 823–833.
Templeton AR, Crandall KA, Sing CF (1992) A cladistic analysis ofphenotypic associations with haplotypes inferred from restrictionendonuclease mapping and DNA sequence data. Genetics, 132,619–633.
Von Königswald W (1981) Die Säugetierfauna aus der BurghöhleDietfurt. Kölner Jahrbuch, Vor- Frühgeschichte, 15, 123–142.
Werth E (1936) Der gegenwärtige Stand der Hamsterfrage inDeutschland. Arb Biology Reichsanstalt Land- und ForstwirtschaftBerlin, 21, 201–253.
Zhang D-X, Hewitt GM (2003) Nuclear DNA analyses in geneticstudies of populations: practice, problems and prospects. Mole-cular Ecology, 12, 563–584.
Ziegler R (1995) Pleistozäne Säugetierfaunen von Genkingenbei Reutlingen (Baden-Württemberg). Stuttgarter Beiträge ZurNaturkunde B, 234, 1–43.
This study was part of the molecular research at the GeneralZoology section in Halle. The lab has a broad interest in thepopulation genetics and evolution of Palearctic hamsters andother small mammal species.
Copyright © 2022 FDOKUMEN