Consumption of wheat bran modified by autoclaving reduces fat mass in hamsters
19
Consumption of wheat bran modified by autoclaving reduces fat mass in hamsters Scott V. Harding 1, 3 , Harry D. Sapirstein 2,* , Todd C. Rideout 1, 4 , Christopher P. F. Marinangeli 1 , Arshala K. M. Dona 2 , Peter J. H. Jones 1,* 1 Richardson Centre for Functional Foods and Nutraceuticals and 3 Department of Food Science, University of Manitoba, Winnipeg, Manitoba, R3T 2N2. 3 Diabetes and Nutritional Sciences Division, King’s College London, London, UK, SE1 9NH; 4 Department of Exercise and Nutrition Sciences, University at Buffalo, Buffalo, NY, USA * To whom correspondence should be addressed: Prof Harry Sapirstein, Department of Food Science, University of Manitoba, Email: [email protected] or Prof Peter J. H. Jones, Richardson Centre for Functional Foods and Nutraceuticals, University of Manitoba, Email: [email protected] Number of figures: 1 Number of tables: 7 Abbreviations: wheat bran, WB; modified wheat bran, MWB; dual energy X-ray absorptiometry, DXA; total phenolic compounds, TPC; resistant starches, RS; 2,2-diphenyl-1-picrylhydrazyl, DPPH Supported by Natural Sciences and Engineering Research Council of Canada (PJHJ) and Canadian Wheat Board (HDS). Authors’ disclosures: S.V. Harding, H. D. Sapirstein, T. C. Rideout, C. P. F. Marinangeli, A. K. M. Dona, P. J. H. Jones all have no conflicts of interest to report regarding the work presented in this manuscript. Keywords: Adiposity, Wheat Bran, Weight Management, Dual Energy X-Ray Absorptiometry
Transcript of Consumption of wheat bran modified by autoclaving reduces fat mass in hamsters

Consumption of wheat bran modified by autoclaving reduces
fat mass in hamsters
Scott V. Harding1, 3, Harry D. Sapirstein2,*, Todd C. Rideout1, 4, Christopher P. F. Marinangeli1, Arshala
K. M. Dona2, Peter J. H. Jones1,*
1Richardson Centre for Functional Foods and Nutraceuticals and 3Department of Food Science, University of
Manitoba, Winnipeg, Manitoba, R3T 2N2. 3Diabetes and Nutritional Sciences Division, King’s College London,
London, UK, SE1 9NH; 4Department of Exercise and Nutrition Sciences, University at Buffalo, Buffalo, NY, USA
*To whom correspondence should be addressed: Prof Harry Sapirstein, Department of Food Science,
University of Manitoba, Email: [email protected] or Prof Peter J. H. Jones, Richardson Centre for
Functional Foods and Nutraceuticals, University of Manitoba, Email: [email protected]
Number of figures: 1
Number of tables: 7
Abbreviations: wheat bran, WB; modified wheat bran, MWB; dual energy X-ray absorptiometry, DXA; total phenolic compounds, TPC; resistant starches, RS; 2,2-diphenyl-1-picrylhydrazyl, DPPH
Supported by Natural Sciences and Engineering Research Council of Canada (PJHJ) and Canadian Wheat
Board (HDS).
Authors’ disclosures: S.V. Harding, H. D. Sapirstein, T. C. Rideout, C. P. F. Marinangeli, A. K. M. Dona, P. J. H.
Jones all have no conflicts of interest to report regarding the work presented in this manuscript.
Keywords: Adiposity, Wheat Bran, Weight Management, Dual Energy X-Ray Absorptiometry
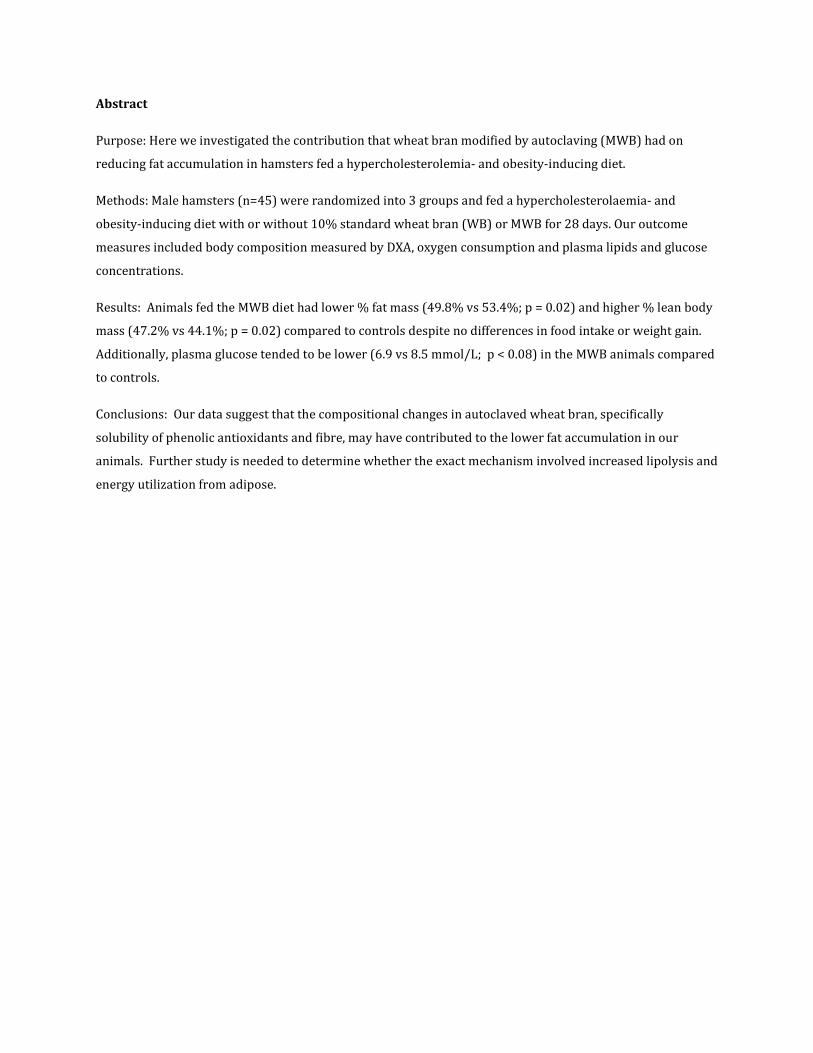
Abstract
Purpose: Here we investigated the contribution that wheat bran modified by autoclaving (MWB) had on
reducing fat accumulation in hamsters fed a hypercholesterolemia- and obesity-inducing diet.
Methods: Male hamsters (n=45) were randomized into 3 groups and fed a hypercholesterolaemia- and
obesity-inducing diet with or without 10% standard wheat bran (WB) or MWB for 28 days. Our outcome
measures included body composition measured by DXA, oxygen consumption and plasma lipids and glucose
concentrations.
Results: Animals fed the MWB diet had lower % fat mass (49.8% vs 53.4%; p = 0.02) and higher % lean body
mass (47.2% vs 44.1%; p = 0.02) compared to controls despite no differences in food intake or weight gain.
Additionally, plasma glucose tended to be lower (6.9 vs 8.5 mmol/L; p < 0.08) in the MWB animals compared
to controls.
Conclusions: Our data suggest that the compositional changes in autoclaved wheat bran, specifically
solubility of phenolic antioxidants and fibre, may have contributed to the lower fat accumulation in our
animals. Further study is needed to determine whether the exact mechanism involved increased lipolysis and
energy utilization from adipose.

Introduction
With considerable lack of clarity as to the definition of a “whole
grain” food, the messages put forward regarding the health
effects of whole grain consumption may be difficult for the
average consumer to interpret. Various jurisdictions have
differing definitions of what constitutes a whole grain food. For
example, the American Association of Cereal Chemists (AACC)
have defined the term “whole grain” as having the same original
composition of endosperm, germ, and bran regardless of whether
the cereal/kernel is whole or reconstituted following milling [1].
Recently, the AACC have added the proviso that a “whole grain
food” must contain at least 8 grams of whole grain per 30 gram
serving [2]. The European Food Safety Authority (EFSA)
recognizes that individual countries within the European Union
(EU) define “whole grain foods” differently (i.e. UK, whole grain
foods must contain ≥51% whole grain ingredients by weight;
Germany, whole grain bread should have at least 90% whole
grain) [3]. The EFSA scientific opinion regarding whole grain
foods helping to prevent chronic diseases does not support the
use of such claims since there is not enough data illustrating a
clear cause and effect relationship [3]. In particular, the EFSA
panel found that defining whole grain foods in the studies
provided to support the health claims an ambiguous task. The
recent scientific position statement by the American Society for
Nutrition (ASN) regarding the consumption of cereal fibres
(whole grain, fibres and bran) on obesity and cardiometabolic
disease risk reduction examines these discrepancies in the
definition of whole grains in more depth [4]. Regardless of the
lack in clarity of the whole grain definition, the number of new
whole grain food products launched worldwide surged 20-fold
between 2000 and 2010 [5].
While the evidence for human health effects is ambiguous for
whole grains in general, increased intakes of foods containing
wheat bran is known to associate with positive health outcomes
in humans. In particular, wheat bran is regularly used as a means
to improve stool regularity and increase fecal bulking [6].
However, the EFSA statement does not support any claims for the
use wheat bran to aid in weight loss or weight maintenance [6].
The ASN scientific statement on cereal fibre or mixtures of whole
grains and bran does support the claim that there is moderate
evidence to suggest that higher consumptions do reduce the risk
of obesity, type 2 diabetes (T2D) and cardiovascular diseases
(CVD) [4]. However, despite epidemiological data supporting
these associations, a mechanistic explanation has not been clearly
shown. In fact, it is not clear whether benefits are tied to
consumption of the entire grain or isolated to bioactive
components contained within a specific fraction.
Wheat endosperm, the source of refined wheat flour, is energy
rich and represents > 80% of grain weight but contains < 10% of
the mineral, vitamin, and dietary fiber content of whole grain [7].
The bran fraction of wheat, generally considered a by-product of
wheat milling, contains the majority of the micronutrients,
dietary fiber and potentially bioactive compounds. In fact, wheat
bran is a significant source of dietary fiber, phenolic compounds
and other phytochemicals which may have health benefits [8-11].
However, despite its compelling nutritive value, wheat bran is
presently predominantly used for animal feed.
What differentiates wheat bran from other cereal brans, such as
oats and barley, is the molecular nature of the fiber or non-starch
polysaccharide (NSP) component. Arabinoxylans or pentosans,
along with the NSP β – glucan, originate in cell walls and
represent the primary dietary fiber source of all cereal grains.
Unlike β–glucans which are the main soluble NSPs of barley and
oats, wheat is distinguished by a relatively low content of β-
glucans and relatively high content of pentosans. The latter are
especially abundant in the bran fraction, comprising about 23-
32% (wt/wt) [12] depending on the genotype source of bran,
where it derives in the milling operation, and content of adhering
starchy endosperm. These fibers including cellulose and inulin,
plus starch and phytic acid make up the majority of the wheat
bran mass, approximately 60%. The balance of the wheat bran
mass is made up of approximately 15% protein, 7% minerals, 5%
lipids, and moisture. While the level of total phenolic compounds
(TPC) in wheat bran is relatively low, as a dietary source it ranks
as major contributor in the human diet since concentrations
range from 2800-5600 mg/kg [13]. The TPC in wheat and bran is
dominated by a single compound, ferulic acid, which comprises
70-95% (wt/wt) of TPC [13].
In human foods, wheat bran is primarily used to boost fiber
content and has been the food industry standard in that regard
for over a century. This use reflects its high level of insoluble
fiber and associated laxative properties which have long been
known as the major health benefit of bran [14]. Several human
studies focusing on the consumption of mixed fiber sources,
including whole wheat, have demonstrated slight to moderate
weight reduction [15-17]. Two of these studies used ready to eat
breakfast cereals while another focused on low glycemic index
foods. While these studies were adequately designed to test the
specific products used, the weight reductions observed were
mainly due to suppression of caloric intake or caloric density of
the diet. Similarly, there are weak in vitro and animal data which
suggest that increased consumption of dietary ferulic acid may
affect fat accumulation in such a way to promote less fat storage
[18,19]. However, there are no human feeding studies which
confirm this hypothesis. Therefore, no direct mechanistic
inferences can be drawn regarding cereal composition and
reduced adiposity.
The primary outcomes of this study were to investigate the effect
of normal (WB) and autoclave-modified wheat bran (MWB)
consumption on 1) adiposity and body composition and 2) blood
lipids in a hamster model of diet induced hypercholesterolemia
and obesity. A previous study demonstrated that autoclaving
significantly increased the water solubility of fiber and
constituent phenolics as well as the antioxidant activity of
extracts [20]. Our two main hypotheses were that autoclave-
modified wheat bran would 1) reduce percentage body fat
accumulation and 2) reduce circulating blood LDL-cholesterol
concentrations, compared to controls consuming calorically
similar diets.
Materials and Methods
Wheat Bran and Modified Wheat Bran. A representative and
commercial sample of milling grade quality Canada Western Red
Spring wheat (~ 1000 kg) was sourced by the Canadian
International Grains Institute (CIGI), Winnipeg, Canada. Wheat
was milled on a Buhler pilot mill to produce bran and flour at an
extraction rate of 76%. Coarse bran was obtained from the
unsifted millstream of the final break roll and separated into
batches, WB and MWB (Table 1). MWB was then produced by
autoclaving at 121 °C with 15 min sterilization at 20 psig (AMSCO
3021, American Sterilizer Co. Pittsburgh, PA). The total autoclave
time was 31 min, and included ~ 5 min at the outset to attain
sterilization conditions, and 10 min after sterilization for drying
at approximately 80°C and -14 psig.
Bran Fractionation. For the purpose of compositional analysis,
WB and MWB were fractionated into water soluble and water-
insoluble components. Typically, 20 g was suspended in
deionized water (1:15 w/v) and the mixture was agitated using a
magnetic stirrer for 18 h at room temperature. Subsequently, the
suspension was filtered to separate insoluble hydrated bran from
soluble material using fiberglass mesh with porosity of ~ 1 mm.
The filtrate was centrifuged at 4,000 x g to obtain a soluble
extract. The latter along with the insoluble residue after filtration
were freeze-dried for subsequent chemical characterization.
Analysis of Bran Composition. Carbohydrate (Table 2) and amino
acid (Table 3) composition analysis was conducted on the
aqueous extract and the fibrous residue for both the WB and
MWB [21,22]. The moisture and protein (N x 5.7) contents of
wheat bran were determined using AACC-International Approved
Methods 44-15A and 46-30, respectively [23,24].
Pentosan Content of Wheat Bran and Extracts. Pentosan content of
wheat bran and freeze-dried water-soluble extracts was
determined in duplicate using a phloroglucinol colorimetric assay
[25]. In this procedure, bran was subjected to pre-hydrolysis
using 0.5 mol/L sulfuric acid to ensure maximal extraction of
pentosans [25]. No pre-hydrolysis was used for aqueous extract
samples.
Total Phenolic Content of Wheat Bran Extracts. Total phenolic
content of freeze-dried water-soluble extracts of wheat bran was
determined in duplicate using a modified version of the Folin-
Ciocalteu method [26,27]. Finely ground sample (30 mg) was
extracted with 100% methanol (1 mL) in microcentrifuge tubes
and vortexed briefly (5 sec) to disperse material. Samples were
extracted for 2 h at room temperature using a RKVSD rotary
mixer (ATR Inc., Laurel, MD) at 20 rpm. Resulting extracts were
centrifuged at 3,180 x g for 10 min. In 2 mL microcentrifuge
tubes, aliquots of the supernatant extract (25 µL) were oxidized
with 0.75 mL of freshly diluted 10% (v/v) Folin-Ciocalteu reagent
and vortexed briefly. After 5 min, the mixture was neutralized
with 0.75 mL of 6% (w/v) sodium carbonate (6 g/100 mL), and
subsequently incubated for 90 min at room temperature in the
dark. Absorbance was measured at 725 nm against a methanol
blank. Ferulic acid was used as the standard for calibration (0 - 3
mM) and results were expressed as ferulic acid equivalents (FAE
µmol/g sample).
DPPH Radical Scavenging Activity of Wheat Bran Extracts. DPPH
radical scavenging activity was performed in duplicate according
to Cheng et al (2006) with some modifications [28]. Finely
ground samples (100 mg) were dispersed in 50% v/v acetone (1
mL) in microcentrifuge tubes and vortexed briefly (5 s) and
subsequently extracted for 2 h at room temperature using a
RKVSD rotary mixer (ATR Inc., Laurel, MD) at 20 rpm. Extracts
were centrifuged at 3,180 x g for 10 min. The absorbance at 515

nm of 0.208 mM DPPH solution for each sample was measured
before sample addition to test tubes. After measuring the initial
absorbance, the supernatant (0.1 ml) for each sample was added
to 3.9 ml of 0.208 mM DPPH solution and vortexed. The solution
was then stored at room temperature for 40 min and the
absorbance at 515 nm was measured again. Trolox standards
were prepared ranging from 0 - 2 mM. All solutions and
incubations were prepared and conducted in the dark. A
standard curve was prepared using trolox and results were
expressed as trolox equivalents (TE µmol/g of sample).
Study Design and Animals. Golden Syrian hamsters (Mesocricetus
auratus; n = 15 per group) were randomized to receive either
control diet alone (Con), formulated in our laboratory (Table 1),
or the same diet with added wheat bran (WB) or modified wheat
bran (MWB). Both normal and modified wheat bran was then
added to the diet in place of corn starch at 10% by weight. The
nutrient composition of the wheat bran is shown in Table 4. This
animal/dietary model is commonly used for cardiometabolic
studies in part because of the similarities in lipid metabolism to
that of humans [29,30].
All animals were then fed the standardized
hypercholesterolemia-inducing diets ad libitum for 28 days with
body weight and food consumption measured every three days
[31]. On day 25, oxygen consumption was measured by indirect
calorimetry using a respiratory gas exchange system for rodents
(MM-100 CWE, Inc. Pennsylvania, USA) and expressed per gram
body weight. On day 28 animals were anesthetized with inhaled
isoflurane and blood sampled by cardiac puncture. Animals were
then killed with an overdose of sodium pentobarbital; body
composition, including total mass, fat mass (FM), lean body mass
(LBM) and bone mineral content (BMC), was determined
immediately by dual emission x-ray absorptiometry (DXA). The
study protocol was approved by the University of Manitoba
Animal Care Committee in accordance to the Canadian Council on
Animal Care Guidelines.
Blood Chemistry. Blood was collected in heparinized tubes and
separated into plasma and packed red blood cells by
centrifugation at 3500 x g for 15 minutes. Plasma glucose,
triglycerides, total cholesterol and HDL cholesterol were
measured using the Vitros Chemistry System 350 (Ortho-Clinical
Diagnostics, Johnson and Johnson, USA).
Statistical Analysis. All outcomes were assessed versus control
animals by student t test using SPSS (Version 20, IBM, Inc.) and P
< 0.05 was considered significant. Pearson correlations were
performed on all animals (n=42) for food intake, final body
weight, % body weight increase, % FM and % LBM with P < 0.05
considered significant. The variance was not homogenous for
cholesterol and non-HDL cholesterol concentrations, therefore
these variables were log transformed for statistical testing but
reported as arithmetic means in this manuscript. All data unless
otherwise indicated are reported as means ± SEM.
Results
Physical Properties of Treatments. Comparing aqueous extracts of
MWB and control bran, the recovery of AOAC 991.43-determined
soluble fiber was 3.2 fold higher, resistant oligosaccharides (RO)
was 2.6-fold higher, inulin was 2.8-fold higher (Table 2). Whereas
there was negligible content of pentosans and β-glucans in water
extracts of control bran, corresponding extracts of MWB
contained 4.4% and 2.5%, respectively (Table 4). Protein
recovery in the aqueous extract was reduced in the MWB
treatment, likely due to thermal denaturation caused by
autoclaving, with the total recovery of individual amino acids
reduced approximately 3-fold compared to WB (Table 3). There
was an increase in phenolic content (74.8 ± 2.1 FAE µmol/g
versus 52.4 ± 1.0 FAE µmol/g; p < 0.05) and DPPH radical
scavenging activity (19.8 ± 0.95 TE, µmol/g versus 3.75 ± 0.18 TE,
µmol/g; p < 0.05) of MWB compared to WB (Figure 1). The
increase in phenolic content and antioxidant activity of aqueous
extracts of the MWB treatment is a reflection of the increase in
pentosan content of the same samples together with ferulic acid
(not measured) which is largely bound to arabinoxylan in wheat
bran as noted previously.
Food Intake, Weight Gain and Oxygen Consumption. No significant
differences were observed amongst groups for initial and final
body weight, % weight gain and food intake during the 28 days of
the experiment (Table 5). Oxygen consumption, measured during
the last week of the experiment, was higher (2.2±0.2 ml/min·g
LBM-1 versus 1.6±0.1 ml/min·g LBM-1; p < 0.05) for the MWB
group compared to control. There were no differences in oxygen
consumption observed between the WB group and control or
MWB. Food intake (g/day) did not correlate with final body
weight, % weight gain, % FM or % LBM.
Body Composition. There were no differences in the body mass,
fat mass or lean mass amongst the treatment groups, as
measured by DXA. However, percent body fat and the lean:fat
mass ratio were lower while percent lean body mass was higher

in MWB animals, compared to controls (Table 6). There were no
differences between the WB animals and either MWB or controls.
Food intake did not correlate with final BW (P=0.31), % BW
increase (P=0.34), % FM (P=0.08) or % LBM (P=0.11).
Blood Biochemistry. Contrary to our hypothesis, no differences
were observed in plasma total cholesterol, non-HDL cholesterol,
HDL cholesterol, triglycerides, glucose, albumin or total protein
between either of the treatment groups or controls (Table 7).
However, there was a trend (p < 0.08) toward lower fasting
glucose in the MWB compared to both WB and controls.
Discussion
Our main finding in this study was a reduction in the % FM in
animals consuming the MWB treatment. Despite no differences
in energy intake across treatment groups, fat accumulation was
lower in MWB treated animals. The consumption of unmodified
WB did not have any effect on adiposity; neither absolute FM nor
% FM was different from control. It is unlikely that the change in
body composition was due to the substitution of wheat bran at
the expense of corn starch in the experimental diet. Replacing the
corn starch with wheat bran reduced the caloric density of the
diet by only 0.22 kcal/g of diet per day. Therefore, the daily
caloric intakes based on mean daily food consumption of each
group would be approximately 35±1.1, 32±1.0 and 33±1.3
kcal/day for the control, WB and MWB, respectively. As there
was no difference in food or caloric intakes and there was no
correlation between food intakes and body composition this
small variation on mean daily caloric intake did not account for
the differences in fat accumulation observed. Therefore, we
speculate that the reduced fat accumulation may have been the
result of either the changes in the carbohydrate properties,
specifically the increased bio-accessibility of fiber and/or
phenolics found in bran.
Modifying the wheat bran in a way that changes the physical
nature of its constituents could possibly modulate the biological
activity of the wheat bran constituents within the digestive tract.
Using autoclave conditions, we have increased the aqueous
recovery of specific NSP (i.e. pentosans, inulin and resistant
oligosaccharides) and total dietary fiber in the aqueous extracts
by approximately three-fold. This increased aqueous recovery
likely increased the exposure of these polysaccharides to the
colonic microflora and facilitated their fermentation. It has been
suggested that the fermentation of NSP in the colon and the
production of short chain fatty acids are strongly linked to the
reduction of adiposity observed with NSP consumption [32,33].
Furthermore, strong evidence from animal studies shows inverse
associations between dietary RS and inulin, and reductions in fat
mass and body weight. In particular, consumption of RS, a form
of soluble or water-dispersible fiber, by rats in a diet induced
obesity study reduced both fat mass and % body fat, with
greatest changes in the mesenteric and subcutaneous adipose
tissue [34]. Similarly, So et al. demonstrated mice consuming
high versus low dietary RS had lower % adiposity despite no
difference in food consumption over 8 weeks [35]. However,
dietary consumption of 25 g NSP and 22 g RS for 4 weeks
increased fecal short chain fatty acid concentrations in healthy
humans, but was not associated with changes in adiposity [36].
Comparable results have also been reported for inulin
supplementation. A study in growing female Sprague-Dawley
rats demonstrated reduced fat mass over 8 weeks of
supplementation with inulin [37]. Similarly, Maurer et al.
reported reduced body weight and fat mass in rats supplemented
with inulin and oligofructose for 6 weeks had compared to
controls and rats fed high protein diets, although in this work
energy consumption was also reduced [38]. However, in both
these studies there was either a decrease in food intake [37] or
energy consumed [38] which accounted for the weight loss. Our
study, while having similar dietary fiber contents but different
physical properties did not result in different food intakes across
groups.
Animal studies examining biological actions of whole grain wheat
and various grain fractions do tend to demonstrate reductions in
adiposity and body composition. For example, Neyrink et al. mice
fed 10% wheat arabinoxylan for 4 weeks were shown to have
reduced body fat compared to controls [33].[31]. However, the
study by Neyrinck and associates examined prebiotic effects of
arabinoxylan supplementation not specifically weight change or
body composition. Several studies using specific oligofructose
supplements report reduced epididymal adipose weight in male
Wistar rats [39-41]. Again, the weight changes and adiposity
observations were secondary as these studies were primarily
designed to examine changes in GLP-1 in response to the
oligofructose feeding.
In addition to fiber, the phenolic content and antioxidant activity
was substantially increased in aqueous MWB extracts, which
would suggest enhanced bio-accessibility or bioavailability of

phenolic compounds, most notably ferulic acid, which is the
predominant factor in wheat antioxidant activity [42]. There is
increasing evidence that foods or beverages with high phenolic
content can modulate physiological and molecular pathways
involved in energy metabolism, adiposity, and obesity [43].
Perhaps most compelling are studies involving phenolic
components or extracts of green tea which is notable for its high
content of catechins. Rodent studies involving experiments
wherein green tea extract or pure catechins were added to an
atherogenic diet have shown significantly reduced body weight
and/or adipose tissue weight [44,45]. The generally favorable
effects of consuming green tea catechins on obesity in mostly
small trials in humans has been recently reviewed [46]. Similar
anti-adiposity outcomes in preclinical trials for other types of
phenolic compounds have been observed for curcumin, the
principal polyphenol in turmeric spice [47] and polyphenol-
enriched (mainly anthocyanidins) extracts of adzuki beans [48].
As noted, the major phenolic compound in wheat bran is ferulic
acid [49] but scant animal data exist on the relationship between
ferulic acid intakes and adiposity [50]. In that study in mice, high
fat diets supplemented with ferulic acid or a related compound,
oryzinol, improved plasma and hepatic lipid profiles, increased
fecal lipid excretion, and lowered final total body mass compared
to controls. However adiposity was not directly measured. Most
of the proposed mechanisms for phenolic intake and reduced
adiposity in this and other studies are still speculative and
require further validation.
We also observed increased oxygen consumption in hamsters
consuming the MWB diet; possibly due to the increased % LBM of
the animals. Alternatively, the increased oxygen consumption
may have been due to direct effects of the MWB in the gut. The
MWB diet treatments could have affected several gastrointestinal
factors directly, including viscosity and digesta transit time, fecal
output and fecal energy content, and microflora diversity. Each
of these factors may individually or in combination affect energy
balance in these animals. Unfortunately, fecal output, caloric
content of the feces and fecal microbial analyses were not
conducted in this study. We do not have a working hypothesis as
to how the MWB might have increased % LBM beyond being the
expected artifact of decreased adiposity. Compositional changes
to the protein (Table 3) of the MWB may have increased the
availability of amino acids and peptides with insulin sensitizing
or mimicking effects in the postprandial period but our study was
not designed to measure those outcomes.
Epidemiological studies have demonstrated a clear inverse
association between whole grain consumption and chronic
disease risk [51-53]. However, data from both population studies
and intervention trials have been inconclusive with some studies
showing whole grain-induced reductions in adiposity while other
showing no effect [54-57]. Unfortunately, little in the way of
evidence exists for a specific mechanism by which increased
whole grain or grain fractions would promote reduced adiposity,
aside from reduced total caloric intake. It has been suggested
that increased bulk of the digesta and changes in the expression
and action of the gut peptides involved the gut-brain axis induce
satiety [58], however, this has not been demonstrated via
intervention trials [59].
A key limitation of our study is the lack of difference observed in
the absolute FM and LBM between the MWB and the controls.
This may be due to high variability in the absolute changes in
body composition between individual hamsters. While the study
was adequately powered for changes in body weight and blood
lipids, there were no available data on changes in body
composition as measured by DXA which could have helped in our
sample size calculation.
In summary, dietary supplementation for 4 weeks with wheat
bran modified by autoclaving resulted in reduced adiposity in
hamsters consuming a hypercholesterolemic and obesity
inducing diet. While the exact underlying mechanisms for these
observations is still not clear, there were significant and
compelling compositional changes in the physicochemical
condition of the bran resulting in increased aqueous recovery of
dietary fiber constituents including phenolic compounds. It
seems plausible that the resulting increase in bio-accessibility or
bioavailability of wheat bran fiber components, including
phenolics, may be involved in the mechanism. Further study is
needed to determine whether the exact mechanism involved
cellular processes such as increased lipolysis and energy
utilization from fat.

Figure 1. Total phenolic content and DPPH radical scavenging activity was determined on aqueous extracts of
untreated and modified wheat bran samples. Both the phenolic content and DPPH scavenging activity was
higher (p < 0.05) in the modified wheat bran extracts compared to the unmodified wheat bran extracts.

Table 1. Nutrient content of wheat bran prior to production of
modified wheat bran.
Nutrient Content
(g/100g)
Fat1 5.0
Carbohydrate2 60.8
Starch 5.2
Sugars 2.5
Fiber 53.1
Protein 12.7
Phytic acid 5.0
Moisture 8.7
Ash 7.5 1Estimated from USDA nutrient data file [7]. 2Further carbohydrate breakdown found in Table 3.

Table 2. Carbohydrate composition (g/100g) of whole, aqueous extract and residues of untreated wheat bran and modified wheat bran.
Whole Bran Aqueous Extract Extract Residue
WB MWB WB MWB WB MWB
Starch 5.2±0.1 4.2±0.2 4.8±0.0 0.4±0.0 - -
Insoluble fiber1 49.4±0.07 48.2±0.21 0.4±0.21 1.6±0.14 72.8±0.35 62.5±0.21
Soluble fiber1 3.7±0.003 4.4±0.21 3.7±0.78 11.7±0.21 2.0±0.14 3.5±0.21
Resistant oligosaccharides2 3.8±0.21 3.8±0.07 8.8±0.14 22.7±0.42 0.1±0.0 0.3±0.07
β-glucan 2.5±0.03 2.6±0.03 nd3 2.5±0.01 2.7±0.007 2.7±0.03
Inulin 1.9±0.13 1.9±0.21 4.6±0.30 13.0±0.28 nd4 nd4
Pentosan 25.7±0.16 25.6±0.25 0.08±0.0 4.42±0.01 - -
Total Dietary Fiber5 56.9 56.4 12.9 35.7 74.9 66.3
Values are means ± SD. 1Insoluble and soluble fiber (AOAC 991.43). 2Resistant oligosaccharides (AOAC 2001.03); not measured by AOAC 991.43. 3Not detected (<0.6%). 4Not detected (<0.5%). 5Sum of insoluble and soluble fiber by AOAC 991.43 plus resistant oligosaccharides. Soluble fiber includes β-glucan and inulin. Untreated wheat bran, WB; autoclaved modified wheat bran, MWB.

Table 3. Amino acid composition of whole, aqueous extract and residues of untreated wheat bran and modified wheat bran.
Whole Bran Aqueous Extract Extract Residue
WB MWB WB MWB WB MWB
Aspartic acid 1.12% 1.11% 1.74% 0.39% 0.96% 1.24%
Threonine 0.50% 0.50% 0.57% 0.16% 0.48% 0.60%
Serine 0.61% 0.61% 0.69% 0.21% 0.56% 0.72%
Glutamic acid 2.55% 2.58% 3.10% 1.65% 2.22% 2.76%
Proline 0.76% 0.78% 1.05% 0.43% 0.66% 0.85%
Glycine 0.85% 0.86% 0.95% 0.37% 0.85% 1.01%
Alanine 0.76% 0.77% 0.98% 0.27% 0.74% 0.92%
Valine 0.64% 0.64% 0.75% 0.19% 0.62% 0.78%
Methionine 0.20% 0.20% 0.21% nd1 0.19% 0.23%
Isoleucine 0.45% 0.45% 0.55% 0.14% 0.42% 0.54%
Leucine 0.88% 0.88% 0.95% 0.24% 0.84% 1.06%
Tyrosine 0.43% 0.43% 0.51% 0.15% 0.38% 0.50%
Phenylalanine 0.56% 0.56% 0.58% 0.21% 0.54% 0.65%
Histidine 0.41% 0.40% 0.43% 0.12% 0.38% 0.48%
Lysine 0.59% 0.53% 0.64% 0.16% 0.52% 0.65%
Arginine 1.13% 1.12% 1.22% 0.41% 1.11% 1.28%
Cystine 0.30% 0.26% 0.55% 0.10% 0.21% 0.31%
Total Amino Acids 12.7% 12.7% 15.4% 5.21% 11. 7% 14.6%
1not detected; analyte level below detection limit. Untreated wheat bran, WB; autoclaved modified wheat bran, MWB.

Table 4. Compositions of control and wheat bran-containing
hypercholesterolemia/adiposity-inducing diets.
Ingredients Con WB/MWB
g/kg
Casein 200.0 200.0
Corn starch 260.0 160.0
Wheat bran/modified wheat bran1 0 100.0
Sucrose 330.3 330.3
Lard-sunflower mix (50:50) 50.0 50.0
Cholesterol 2.5 2.5
Cellulose 100.0 100.0
DL-methionine 5.0 5.0
Mineral mixture2 40.0 40.0
Vitamin mixture3 10.0 10.0
Choline bitartrate 2.0 2.0
BHT4 0.2 0.2 1Nutrient breakdown of WB and MWB are presented in Table 2. 2Vitamin mix
AIN-76A (CA40077; Harlan Teklad, Madison, WI) [60]. 3Mineral mix AIN-93M
(TD94047, modified for hamsters; Harlan Teklad, Madison, WI) [61]. 4Butylated
hydroxytoluene, BHT. Untreated wheat bran, WB; autoclaved modified wheat
bran, MWB.

Table 5. Mean body weight, percent body weight gain and daily food intake of male golden Syrian hamsters fed diets with and without untreated wheat bran and modified wheat bran for 28 d1.
Parameter Con WB MWB
Initial body weight (g) 122.0±2.8 122.7±2.7 122.8±2.5
Final body weight (g) 130.8±3.8 131.3±3.1 131.8±3.8
Body weight increase (%) 7.3±2.2 7.2±2.0 7.4±2.1
Food consumption (g/day) 9.7±0.3 9.8±0.3 10.0±0.4
Oxygen consumption (ml/min·g LBM-1) 1.6±0.1 2.0±0.3 2.2±0.2*
Values are mean ± SEM, n = 13-14. *Different from control, P < 0.05. Untreated wheat bran, WB; autoclaved modified wheat bran, MWB.
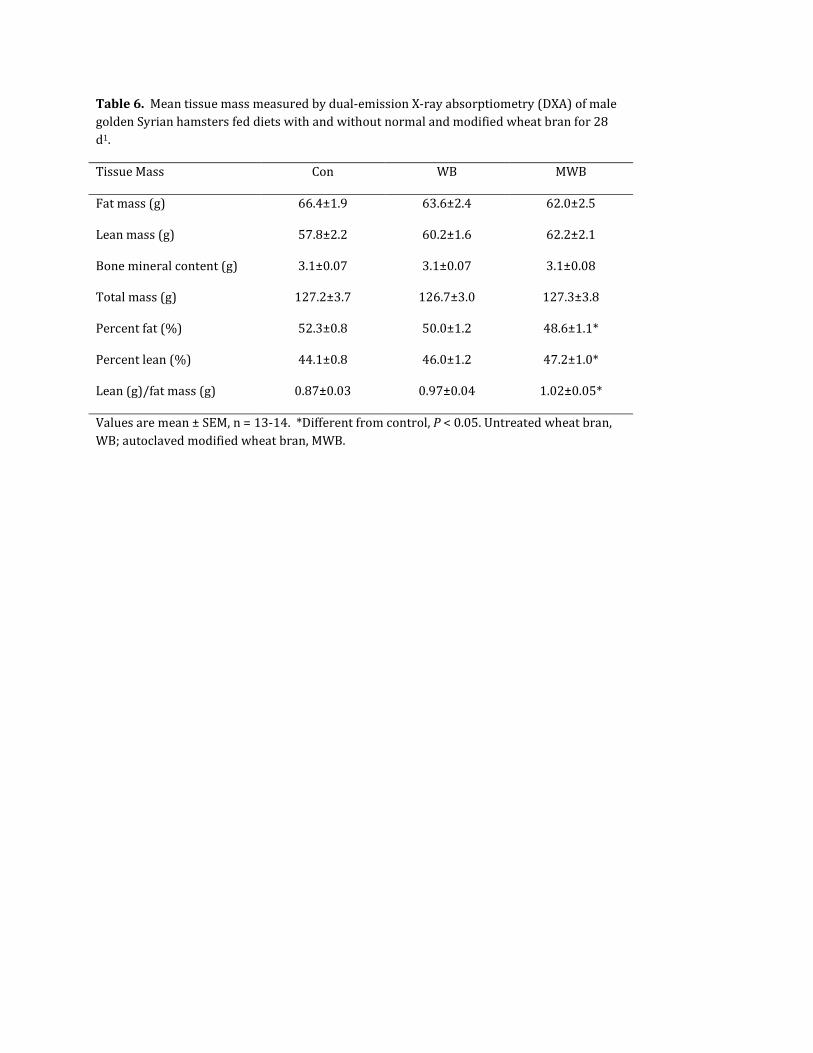
Table 6. Mean tissue mass measured by dual-emission X-ray absorptiometry (DXA) of male golden Syrian hamsters fed diets with and without normal and modified wheat bran for 28 d1.
Tissue Mass Con WB MWB
Fat mass (g) 66.4±1.9 63.6±2.4 62.0±2.5
Lean mass (g) 57.8±2.2 60.2±1.6 62.2±2.1
Bone mineral content (g) 3.1±0.07 3.1±0.07 3.1±0.08
Total mass (g) 127.2±3.7 126.7±3.0 127.3±3.8
Percent fat (%) 52.3±0.8 50.0±1.2 48.6±1.1*
Percent lean (%) 44.1±0.8 46.0±1.2 47.2±1.0*
Lean (g)/fat mass (g) 0.87±0.03 0.97±0.04 1.02±0.05*
Values are mean ± SEM, n = 13-14. *Different from control, P < 0.05. Untreated wheat bran, WB; autoclaved modified wheat bran, MWB.

Table 7. Mean plasma biochemistry of male golden Syrian hamsters fed diets with and without normal and modified wheat bran for 28 d1.
Con WB MWB
Glucose 7.83±0.47 8.05±0.54 6.86±0.46
Total cholesterol 7.48±0.44 8.14±0.33 8.49±0.36
HDL cholesterol 3.75±0.10 3.85±0.04 3.86±0.04
Non-HDL cholesterol 3.73±0.37 4.29±0.31 4.63±0.34
Triglycerides 4.10±0.42 3.82±0.32 4.57±0.37
Total protein 64.86±1.66 61.14±1.21 63.43±1.38
Albumin 31.86±0.89 31.43±1.25 32.50±1.17
1Values are mean ± SEM, n = 13-14.

References
1. AACC-International (1999) AACCI Members Agree on Definition of Whole Grain. AACC International. http://www.aaccnet.org/initiatives/definitions/Pages/WholeGrain.aspx. Accessed 01 July 2013
2. AACC-International (2013) AACCI’s Whole Grains Working Group Unveils New Whole Grain Products Characterization. AACC International. http://www.aaccnet.org/about/newsreleases/Pages/WholeGrainProductCharacterization.aspx. Accessed 01 July 2013
3. EFSA Panel on Dietetic Products NaAN (2010) Scientific Opinion on the substantiation of health claims related to whole grain (ID 831, 832, 833, 1126, 1268, 1269, 1270, 1271, 1431) pursuant to Article 13(1) of Regulation (EC) No 1924/2006. EFSA Journal 8 (10).
4. Cho SS, Qi L, Fahey GC, Jr., Klurfeld DM (2013) Consumption of cereal fiber, mixtures of whole grains and bran, and whole grains and risk reduction in type 2 diabetes, obesity, and cardiovascular disease. Am J Clin Nutr.
5. Whole_Grains_Council (2012) Whole Grain Statistics. Whole Grains Council. http://www.wholegrainscouncil.org/newsroom/whole-grain-statistics. Accessed December 13, 2012
6. EFSA Panel on Dietetic Products NaAN (2010) Scientific Opinion on the substantiation of health claims related to wheat bran fibre and increase in faecal bulk (ID 3066), reduction in intestinal transit time (ID 828, 839, 3067, 4699) and contribution to the maintenance or achievement of a normal body weight (ID 829) pursuant to Article 13(1) of Regulation (EC) No 1924/2006. EFSA Journal 8 (10).
7. (2012) U.S. Department of Agriculture, Agricultural Research Service. http://www.ars.usda.gov/ba/bhnrc/ndl. Accessed December 03, 2012 2012
8. Liyana-Pathirana CM, Shahidi F (2006) Antioxidant properties of commercial soft and hard winter wheats (Triticum aestivum L.) and their milling fractions. J Sci Food Agric 86 (3):477-485.
9. Martinez-Tome M, Murcia MA, Frega N, Ruggieri S, Jimenez AM, Roses F, Parras P (2004) Evaluation of antioxidant capacity of cereal brans. J Agric Food Chem 52 (15):4690-4699.
10. Zhou K, Su L, Yu LL (2004) Phytochemicals and antioxidant properties in wheat bran. J Agric Food Chem 52 (20):6108-6114.
11. Fardet A (2010) New hypotheses for the health-protective mechanisms of whole-grain cereals: what is beyond fibre? Nutr Res Rev 23 (1):65-134.
12. Wang MW, Sapirstein HD, Machet AS, Dexter JE (2006) Composition and distribution of pentosans in millstreams of different hard spring wheats. Cereal Chem 83 (2):161-168.
13. Vitaglione P, Napolitano A, Fogliano V (2008) Cereal dietary fibre: a natural functional ingredient to deliver phenolic compounds into the gut. Trends Food Sci Tech 19 (9):451-463.
14. Raninen K, Lappi J, Mykkanen H, Poutanen K (2011) Dietary fiber type reflects physiological functionality: comparison of grain fiber, inulin, and polydextrose. Nutr Rev 69 (1):9-21.
15. Jimenez-Cruz A, Bacardi-Gascon M, Turnbull WH, Rosales-Garay P, Severino-Lugo I (2003) A flexible, low-glycemic index mexican-style diet in overweight and obese subjects with type 2 diabetes improves metabolic parameters during a 6-week treatment period. Diabetes Care 26 (7):1967-1970.
16. Waller SM, Vander Wal JS, Klurfeld DM, McBurney MI, Cho S, Bijlani S, Dhurandhar NV (2004) Evening ready-to-eat cereal consumption contributes to weight management. J Am Coll Nutr 23 (4):316-321.
17. Mattes RD (2002) Ready-to-eat cereal used as a meal replacement promotes weight loss in humans. J Am Coll Nutr 21 (6):570-577.

18. Totani N, Tateishi S, Takimoto T, Shinohara R, Sasaki H (2012) Ferulic acid esters and weight-loss promoting effects in rats. J Oleo Sci 61 (6):331-336.
19. Alvala R, Alvala M, Sama V, Dharmarajan S, Variam Ullas J, B MR (2013) Scientific evidence for traditional claim of anti-obesity activity of Tecomella undulata bark. J Ethnopharmacol 148 (2):441-448.
20. Madapathage Dona AK (2011) Enhancing Antioxidant Activity and Extractability of Bioactive Compounds of Wheat Bran using Thermal Treatments. Thesis, University of Manitoba, Winnipeg, Canada
21. AOAC-International (2012) Official Method 991.43 - Total, Soluble and Insoluble Dietary Fiber in Foods. Official Methods of Analysis of AOAC International, 19 edn. AOAC-International, Gaithersburg, MD, USA
22. AOAC-International (2012) Official Method 2001.03 - Dietary Fiber Containing Supplemented Resistant Maltodextrin. Official Methods of Analysis of AOAC International, 19 edn. AOAC International, Gaithersburg, MD, USA
23. AACC-International (2012) Moisture - Air-Oven Methods. Approved Methods of Analysis, 11 edn. AACC International, St. Paul, MN, USA. doi:http://dx.doi.org/10.1094/AACCIntMethod-44-15.02
24. AACC-International (2012) Crude Protein -- Combustion Method. Approved Methods of Analysis, 11 edn. AACC International, St. Paul, MN, USA. doi:http://dx.doi.org/10.1094/AACCIntMethod-46-30.01
25. Sapirstein HD, Wang MW, Beta T (2013) Effects of debranning on the distribution of pentosans and relationships to phenolic content and antioxidant activity of wheat pearling fractions. LWT-Food Sci Technol 50 (1):336-342.
26. Singleton VL, Rossi JA (1965) Colorimetry of Total Phenolics with Phosphomolybdic-Phosphotungstic Acid Reagents. Am J Enol Vitic 16 (3):144-158.
27. Gao L, Wang S, Oomah BD, Mazza G (2002) Wheat Quality: Antioxidant activity of wheat millstreams. In: Ng P, Wrigley CW (eds) Wheat Quality Elucidation. AACC International, St. Paul, MN,
28. Cheng Z, Moore J, Yu L (2006) High-throughput relative DPPH radical scavenging capacity assay. J Agric Food Chem 54 (20):7429-7436.
29. Moon YA, Liang G, Xie X, Frank-Kamenetsky M, Fitzgerald K, Koteliansky V, Brown MS, Goldstein JL, Horton JD (2012) The Scap/SREBP pathway is essential for developing diabetic fatty liver and carbohydrate-induced hypertriglyceridemia in animals. Cell Metab 15 (2):240-246.
30. Briand F (2010) The use of dyslipidemic hamsters to evaluate drug-induced alterations in reverse cholesterol transport. Curr Opin Investig Drugs 11 (3):289-297.
31. Harding SV, Rideout TC, Jones PJ (2010) Hepatic nuclear sterol regulatory binding element protein 2 abundance is decreased and that of ABCG5 increased in male hamsters fed plant sterols. J Nutr 140 (7):1249-1254.
32. Dewulf EM, Cani PD, Neyrinck AM, Possemiers S, Van Holle A, Muccioli GG, Deldicque L, Bindels LB, Pachikian BD, Sohet FM, Mignolet E, Francaux M, Larondelle Y, Delzenne NM (2011) Inulin-type fructans with prebiotic properties counteract GPR43 overexpression and PPARgamma-related adipogenesis in the white adipose tissue of high-fat diet-fed mice. J Nutr Biochem 22 (8):712-722.
33. Neyrinck AM, Possemiers S, Druart C, Van de Wiele T, De Backer F, Cani PD, Larondelle Y, Delzenne NM (2011) Prebiotic effects of wheat arabinoxylan related to the increase in bifidobacteria, Roseburia and Bacteroides/Prevotella in diet-induced obese mice. PLoS One 6 (6):e20944.
34. Higgins JA, Jackman MR, Brown IL, Johnson GC, Steig A, Wyatt HR, Hill JO, Maclean PS (2011) Resistant starch and exercise independently attenuate weight regain on a high fat diet in a rat model of obesity. Nutr Metab (Lond) 8:49.
35. So PW, Yu WS, Kuo YT, Wasserfall C, Goldstone AP, Bell JD, Frost G (2007) Impact of resistant starch on body fat patterning and central appetite regulation. PLoS One 2 (12):e1309.

36. McOrist AL, Miller RB, Bird AR, Keogh JB, Noakes M, Topping DL, Conlon MA (2011) Fecal butyrate levels vary widely among individuals but are usually increased by a diet high in resistant starch. J Nutr 141 (5):883-889.
37. Jamieson JA, Ryz NR, Taylor CG, Weiler HA (2008) Dietary long-chain inulin reduces abdominal fat but has no effect on bone density in growing female rats. Br J Nutr 100 (2):451-459.
38. Maurer AD, Eller LK, Hallam MC, Taylor K, Reimer RA (2010) Consumption of diets high in prebiotic fiber or protein during growth influences the response to a high fat and sucrose diet in adulthood in rats. Nutr Metab (Lond) 7:77.
39. Cani PD, Dewever C, Delzenne NM (2004) Inulin-type fructans modulate gastrointestinal peptides involved in appetite regulation (glucagon-like peptide-1 and ghrelin) in rats. Br J Nutr 92 (3):521-526.
40. Cani PD, Neyrinck AM, Maton N, Delzenne NM (2005) Oligofructose promotes satiety in rats fed a high-fat diet: involvement of glucagon-like Peptide-1. Obes Res 13 (6):1000-1007.
41. Kok NN, Morgan LM, Williams CM, Roberfroid MB, Thissen JP, Delzenne NM (1998) Insulin, glucagon-like peptide 1, glucose-dependent insulinotropic polypeptide and insulin-like growth factor I as putative mediators of the hypolipidemic effect of oligofructose in rats. J Nutr 128 (7):1099-1103.
42. Ou SY, Jackson GM, Jiao X, Chen J, Wu JZ, Huang XS (2007) Protection against oxidative stress in diabetic rats by wheat bran feruloyl oligosaccharides. J Agric Food Chem 55 (8):3191-3195.
43. Meydani M, Hasan ST (2010) Dietary polyphenols and obesity. Nutrients 2 (7):737-751.
44. Lee MS, Kim CT, Kim Y (2009) Green tea (-)-epigallocatechin-3-gallate reduces body weight with regulation of multiple genes expression in adipose tissue of diet-induced obese mice. Ann Nutr Metab 54 (2):151-157.
45. Bornhoeft J, Castaneda D, Nemoseck T, Wang P, Henning SM, Hong MY (2012) The protective effects of green tea polyphenols: lipid profile, inflammation, and antioxidant capacity in rats fed an atherogenic diet and dextran sodium sulfate. J Med Food 15 (8):726-732.
46. Rains TM, Agarwal S, Maki KC (2011) Antiobesity effects of green tea catechins: a mechanistic review. J Nutr Biochem 22 (1):1-7.
47. Ejaz A, Wu D, Kwan P, Meydani M (2009) Curcumin inhibits adipogenesis in 3T3-L1 adipocytes and angiogenesis and obesity in C57/BL mice. J Nutr 139 (5):919-925.
48. Kitano-Okada T, Ito A, Koide A, Nakamura Y, Han KH, Shimada K, Sasaki K, Ohba K, Sibayama S, Fukushima M (2012) Anti-obesity role of adzuki bean extract containing polyphenols: in vivo and in vitro effects. J Sci Food Agric 92 (13):2644-2651.
49. Kim K-H, Tsao R, Yang R, Cui SW (2006) Phenolic acid profiles and antioxidant activities of wheat bran extracts and the effect of hydrolysis conditions. Food Chem 95 (3):466-473.
50. Jin Son M, C WR, Hyun Nam S, Young Kang M (2010) Influence of oryzanol and ferulic Acid on the lipid metabolism and antioxidative status in high fat-fed mice. J Clin Biochem Nutr 46 (2):150-156.
51. Jensen MK, Koh-Banerjee P, Hu FB, Franz M, Sampson L, Gronbaek M, Rimm EB (2004) Intakes of whole grains, bran, and germ and the risk of coronary heart disease in men. Am J Clin Nutr 80 (6):1492-1499.
52. de Munter JS, Hu FB, Spiegelman D, Franz M, van Dam RM (2007) Whole grain, bran, and germ intake and risk of type 2 diabetes: a prospective cohort study and systematic review. PLoS Med 4 (8):e261.
53. Liu S, Stampfer MJ, Hu FB, Giovannucci E, Rimm E, Manson JE, Hennekens CH, Willett WC (1999) Whole-grain consumption and risk of coronary heart disease: results from the Nurses' Health Study. Am J Clin Nutr 70 (3):412-419.
54. Koh-Banerjee P, Franz M, Sampson L, Liu S, Jacobs DR, Jr., Spiegelman D, Willett W, Rimm E (2004) Changes in whole-grain, bran, and cereal fiber consumption in relation to 8-y weight gain among men. Am J Clin Nutr 80 (5):1237-1245.
55. Li S, Guerin-Deremaux L, Pochat M, Wils D, Reifer C, Miller LE (2010) NUTRIOSE dietary fiber supplementation improves insulin resistance and determinants of metabolic syndrome in overweight men: a double-blind, randomized, placebo-controlled study. Appl Physiol Nutr Metab 35 (6):773-782.
56. McKeown NM, Troy LM, Jacques PF, Hoffmann U, O'Donnell CJ, Fox CS (2010) Whole- and refined-grain intakes are differentially associated with abdominal visceral and subcutaneous adiposity in healthy adults: the Framingham Heart Study. Am J Clin Nutr 92 (5):1165-1171.
57. McKeown NM, Yoshida M, Shea MK, Jacques PF, Lichtenstein AH, Rogers G, Booth SL, Saltzman E (2009) Whole-grain intake and cereal fiber are associated with lower abdominal adiposity in older adults. J Nutr 139 (10):1950-1955.
58. Slavin J (2004) Whole grains and human health. Nutr Res Rev 17 (1):99-110.
59. Bodinham CL, Hitchen KL, Youngman PJ, Frost GS, Robertson MD (2011) Short-term effects of whole-grain wheat on appetite and food intake in healthy adults: a pilot study. Br J Nutr 106 (3):327-330.
60. Report of the American Institute of Nutrition ad hoc Committee on Standards for Nutritional Studies (1977). J Nutr 107 (7):1340-1348.
61. Reeves PG, Nielsen FH, Fahey GC, Jr. (1993) AIN-93 purified diets for laboratory rodents: final report of the American Institute of Nutrition ad hoc writing committee on the reformulation of the AIN-76A rodent diet. J Nutr 123 (11):1939-1951.