Life Cycle Assessment of Rice Bran Oil Production - Research ...
22
Page 1/22 Life Cycle Assessment of Rice Bran Oil Production: A Case Study in China Lihui Sun ( [email protected] ) Dalian University of Technology Yuying Wang Dalian University of Technology Yuqing Gong Dalian University of Technology Research Article Keywords: Rice bran, Rice bran oil, Cleaner production, Life cycle assessment, Environmental impact Posted Date: April 26th, 2021 DOI: https://doi.org/10.21203/rs.3.rs-423605/v1 License: This work is licensed under a Creative Commons Attribution 4.0 International License. Read Full License
-
Upload
khangminh22 -
Category
Documents
-
view
0 -
download
0
Transcript of Life Cycle Assessment of Rice Bran Oil Production - Research ...
Page 1/22
Life Cycle Assessment of Rice Bran Oil Production:A Case Study in ChinaLihui Sun ( [email protected] )
Dalian University of TechnologyYuying Wang
Dalian University of TechnologyYuqing Gong
Dalian University of Technology
Research Article
Keywords: Rice bran, Rice bran oil, Cleaner production, Life cycle assessment, Environmental impact
Posted Date: April 26th, 2021
DOI: https://doi.org/10.21203/rs.3.rs-423605/v1
License: This work is licensed under a Creative Commons Attribution 4.0 International License. Read Full License
Page 2/22
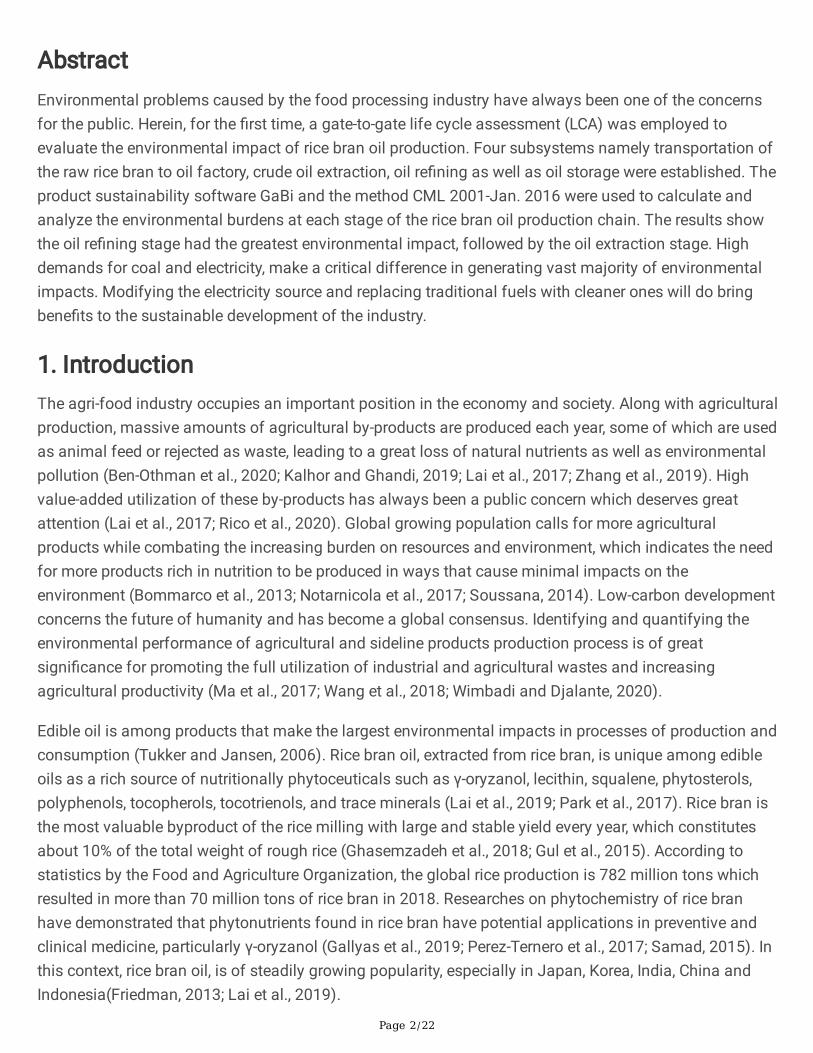
AbstractEnvironmental problems caused by the food processing industry have always been one of the concernsfor the public. Herein, for the �rst time, a gate-to-gate life cycle assessment (LCA) was employed toevaluate the environmental impact of rice bran oil production. Four subsystems namely transportation ofthe raw rice bran to oil factory, crude oil extraction, oil re�ning as well as oil storage were established. Theproduct sustainability software GaBi and the method CML 2001-Jan. 2016 were used to calculate andanalyze the environmental burdens at each stage of the rice bran oil production chain. The results showthe oil re�ning stage had the greatest environmental impact, followed by the oil extraction stage. Highdemands for coal and electricity, make a critical difference in generating vast majority of environmentalimpacts. Modifying the electricity source and replacing traditional fuels with cleaner ones will do bringbene�ts to the sustainable development of the industry.
1. IntroductionThe agri-food industry occupies an important position in the economy and society. Along with agriculturalproduction, massive amounts of agricultural by-products are produced each year, some of which are usedas animal feed or rejected as waste, leading to a great loss of natural nutrients as well as environmentalpollution (Ben-Othman et al., 2020; Kalhor and Ghandi, 2019; Lai et al., 2017; Zhang et al., 2019). Highvalue-added utilization of these by-products has always been a public concern which deserves greatattention (Lai et al., 2017; Rico et al., 2020). Global growing population calls for more agriculturalproducts while combating the increasing burden on resources and environment, which indicates the needfor more products rich in nutrition to be produced in ways that cause minimal impacts on theenvironment (Bommarco et al., 2013; Notarnicola et al., 2017; Soussana, 2014). Low-carbon developmentconcerns the future of humanity and has become a global consensus. Identifying and quantifying theenvironmental performance of agricultural and sideline products production process is of greatsigni�cance for promoting the full utilization of industrial and agricultural wastes and increasingagricultural productivity (Ma et al., 2017; Wang et al., 2018; Wimbadi and Djalante, 2020).
Edible oil is among products that make the largest environmental impacts in processes of production andconsumption (Tukker and Jansen, 2006). Rice bran oil, extracted from rice bran, is unique among edibleoils as a rich source of nutritionally phytoceuticals such as γ-oryzanol, lecithin, squalene, phytosterols,polyphenols, tocopherols, tocotrienols, and trace minerals (Lai et al., 2019; Park et al., 2017). Rice bran isthe most valuable byproduct of the rice milling with large and stable yield every year, which constitutesabout 10% of the total weight of rough rice (Ghasemzadeh et al., 2018; Gul et al., 2015). According tostatistics by the Food and Agriculture Organization, the global rice production is 782 million tons whichresulted in more than 70 million tons of rice bran in 2018. Researches on phytochemistry of rice branhave demonstrated that phytonutrients found in rice bran have potential applications in preventive andclinical medicine, particularly γ-oryzanol (Gallyas et al., 2019; Perez-Ternero et al., 2017; Samad, 2015). Inthis context, rice bran oil, is of steadily growing popularity, especially in Japan, Korea, India, China andIndonesia(Friedman, 2013; Lai et al., 2019).
Page 3/22
Life Cycle Assessment (LCA) is a useful tool in identifying and quantifying the potential environmentalimpacts throughout a product's life cycle, from the raw material acquisition through production, use, end-of-life treatment, recycling and up to the �nal disposal (from cradle to grave). (ISO 14040: 2006 and ISO14044: 2006). System boundaries can vary according to the speci�c research purpose. For the currentstudy, a “from gate to gate” approach was applied.
Many researches have been published on LCA of some major cooking oils. For example, Tsarouhas et al.(2015) assessed the environmental performance of olive oil production by investigated fourteen sub-systems of olive oil production in Greece, aiming to identify key areas for environmental impactimprovement. Khatri et al. (2017) adopt a “from cradle to gate” approach in evaluating the environmentalimpacts of mustard oil production in India. Meanwhile, the effects of system variables such as oilseedprocessing scales, extraction method and allocation choice on the LCA results were also studied. Khanaliet al. (2018) quanti�ed the environmental performance of packaged canola edible oil production inIsfahan province of Iran and comparisons of environmental burdens at each stage were made to providetargeted suggestions to achieve e�cient management as well as reduce environmental footprints. AndKhatri and Jain (2017) in a review analyzed and discussed the application of life cycle analysis in edibleoil systems to make predictions about the challenges that future research in this area might encounter,aiming to provide reference for the transition to sustainable agri-food system. However, none research onLCA of rice bran oil production can be found.
To the best of our knowledge, this is the �rst study to assess the environmental impact of rice bran oilproduction using LCA methodology. The objective was to identify and evaluate the environmental impactpotential of rice bran oil production in the selected enterprise, and further comparative analysis ofsubsystems was conducted to identify the environmental hotspot and key factors that resulted in themajority of impact categories. As to the uncertainty of the research, effect of uncertainty in normalizationstep on the results was considered using a Monte Carlo simulation. Additionally, some practical andfeasible proposals were put forward to promote the transformation and upgrading of edible oilproduction to cleaner production by improving the environmental performance of production activities.
2. Methodology
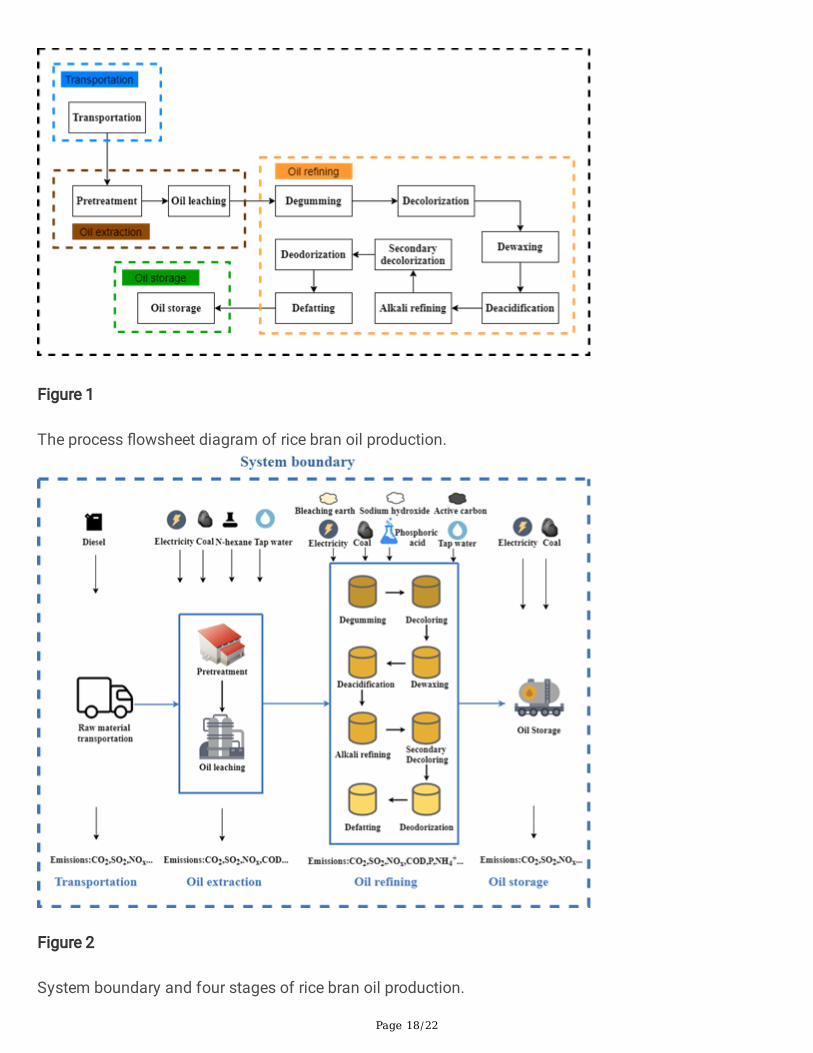
2.1. System descriptionPanjin Best Oil Factory, a rice bran deep processing enterprise, was selected as the research object withannual processing 60000 tons of rice bran, annual production of re�ned rice bran oil 30000 tons. Theproduction process route is the overall optimal for current optimization recommended by the engineer.Speci�c process and data on various stages and processes of rice bran oil production were mainlycollected by interviewing with engineers and technical staff of the plant. The required background datafor material and energy production were extracted from GaBi database. The process �owsheet diagramof rice bran oil production is depicted in Fig. 1.
Page 4/22
The general stages of rice bran oil production include: (1) transportation of the raw rice bran to thefactory, (2) crude oil extraction, (3) oil re�ning, and (4) oil storage. Furthermore, to determine the keyfactors leading to prominent environmental burdens, the oil extraction stage is divided into pretreatmentand oil leaching; and the oil re�ning stage includes degumming, decoloring, dewaxing, deacidi�cation,alkali re�ning, secondary decoloring, deodorization, and defatting processes. The system �ows andboundary of rice bran oil production investigated are shown in Fig. 2.
2.1.1. TransportationThe raw material, rice bran, is transported from rice plants in nearby and surrounding provinces to oilplant by 30-ton diesel trucks. Considering the locations of rice plants and oil plant comprehensively, thetransportation distance was set as 510 km.
2.1.2. Oil extractionTwo sections, pretreatment of raw materials and oil leaching are involved in this stage. Firstly, the rawrice bran enters the pretreatment workshop after separation by chaff rotary sifter. Impurities are removedwith a vibrating screen and a magnetic separator. Subsequently, the rice bran enters the dryer for dryingbefore being delivered to the bulking machine. Due to high moisture content, the puffed rice bran is air-dried and transported to the extraction workshop.
Once entering the extractor, the puffed rice bran is placed in different material compartments and leachedin a countercurrent leaching way. After multiple cycles of leaching, the concentration of the mixed oilgradually decreased, and �nally extracted with pure hexane solvent. At this time, the rice bran becomesbran meal, and is dripped and dried before transported to the desolventizer. The bran meal is heated andthe hexane steam is sent to condense for recovery. The mixed oil is treated by a three-stage evaporator toseparate hexane solvent. The solvent removal process is performed under negative pressure, to ensure alow temperature environment so that the target product is light in color, which facilitates the later oilre�ning.
2.1.3. Oil re�ningThis stage consists of eight steps.
Degumming: The extracted oil from the leaching workshop is pumped into the �lter to remove residualimpurities. After being heated, it is sent to the acid re�ning mixer and fully contacted and mixed with thephosphoric acid and water input by the acid metering pump, so that the colloidal impurities of the oilmainly phospholipids can be hydrolyzed. Then the mixture is pumped into the centrifuge to separate theoil feet. The obtained oil is fully washed with water, which is separated by the centrifuge next. Theresidual water is removed under negative pressure to make the water content ≤ 0.5%.
Decolorization: After degumming, the phospholipid remained in oil is removed with active clay to makepreparations for dewaxing in the later. The oil is quantitatively mixed with activated clay in a negative
Page 5/22
pressure decolorization tower, and �ltered after removing water at 105℃. Usually, a closed leaf �lter isadopted, and the �ltered oil enters the dewaxing crystal growth tank.
Dewaxing: The phosphorus content in oil after decolorizing is ≤ 20ppm, and now it is time for dewaxing.After the decolorized oil enters the dewaxing crystal tank, it is cooled according to the scheduled coolingprocedure. When it drops to 20℃, the oil is fed into the �lter machine by means of differential pressure orscrew pump for �ltration. Employing the box type �lter press or the membrane �lter press, of which theprice of the latter is higher, but the �lter cake can be compacted further after �ltering to enhance the oilyield. During the �ltration process, the ambient temperature should be controlled to be consistent withthat of the oil.
Deacidi�cation: The phosphorus content in dewaxed oil is no more than 5ppm. After passing through theheat exchanger and the heater, the temperature rises to 230–240℃ and the oil enters the physicaldeacidi�cation tower. Under the condition that the vacuum residual pressure at the top of the tower is ≤ 300Pa, the free fatty acids in oil are removed by the direct steam at the bottom of the tower, and the acidvalue of the oil output from the tower is between 2 and 3mgKOH/g. After the oil passes through the heatexchange system, the temperature is further reduced to 50℃ via a cooler.
Alkali re�ning: The oil is proportionally mixed with sodium hydroxide (12% concentration) at 50℃, andthen they are delivered into a centrifugal to separate the soap feet. The clean oil needs to be tested foracid value and grain content. Normally the acid value is between 0.3-0.4mgKOH/g (phenolphthaleinindicator), otherwise the amount of liquid caustic soda should be adjusted. Peculiarly, the acid valueshould be maintained at 1.5mgKOH/g if producing edible oil with high oryzanol content. The alkalire�ned oil needs to be washed with water, which is separated by a centrifuge afterwards. After beingheated, it enters the dryer for negative pressure dehydration to bring the moisture content ≤ 0.5%.
Secondary decolorization: The soap and pigment remained in the alkali re�ned oil need to be removed.For this decolorization, the color of the oil is required to directly reach the target value, usually requiringthe 5-inch groove of the Lovibond colorimeter R/Y/B = 5/35/0, and then the heat-sensitive decolorizationeffect of the deodorization can make it reach R/Y/B = 4/35/0, reaching the national standard for �rstgrade oil. The oil is quantitatively mixed with activated clay in the negative pressure decolorization tower,�ltered after removing water at 105℃, and the decolorized oil enters the temporary storage tank beforedeodorization.
Deodorization: At this time, the phosphorus content in oil is close to zero. After passing through the heatexchanger and the heater, the temperature rises to 240–250℃ and the oil enters the deodorization tower.When the tower top vacuum residual pressure is ≤ 300Pa, the low-boiling point substances in oil will beremoved by the direct steam. Grease retention time in deodorant tower needs to be controlled. Excessiveresidence time will result in generation of toxic substances and the loss of oryzanol. After leaving thetower, the oil is cooled down and enters the degreasing crystal cultivation tank.
Page 6/22
Defatting: The deodorized oil shall be cooled automatically according to the predetermined procedure.When it drops to minus 3℃, the oil is fed into the �lter by differential pressure or screw pump for�ltration. Then the clean oil is �ltered out and stored in a temporary tank. After passing the test, it ispoured into the product oil tank through a safety �lter with a pump.
2.1.4. Oil storageThe re�ned rice bran oil is temporarily stored in storage tanks for further packaging and sale.
2.2. Life cycle assessment (LCA)The study was performed following the methodological framework of LCA based on ISO (InternationalStandardization Organization) 14040 and ISO 14044 standards, which describes the principles andframework coupled with requirements and guidelines for life cycle assessment. There are four phases inan LCA study: 1) the goal and scope de�nition, 2) the inventory analysis, 3) the impact assessment, and4) the interpretation.
2.2.1. Goal and scope de�nitionThe goals of the LCA in this study are: ( ) to determine the material and energy �ows and emissionsthroughout the rice bran oil production chain; ( ) to quantify the potential environmental impacts of therice bran oil production processes in each stage (transportation, oil extraction, oil re�ning, and storage)and phases of different stages (pretreatment and oil leaching in the oil extraction stage; and degumming,decolorizing, dewaxing, deacidi�cation, alkali re�ning, secondary decoloring, deodorization, and defattingin the oil re�ning stage); ( ) to analyze and compare the environmental impacts at each stage and phaseof production chain to identify environmental hotspots as well as factors that are critical to the outcomefor further improvement.
The Functional Unit (FU) was determined to be one ton of re�ned rice bran oil. The system boundary wasfrom gate to gate, including transportation of raw materials from rice factories, auxiliary materials andenergy inputs, rice bran oil production as well as emissions associated with these processes. Thetransport and disposal of by-products are not considered within the system boundaries since we payclose attention to the rice bran oil production process. In addition, no consideration is given to theenvironmental impact of worker activities.
2.2.2. Inventory analysisIn this section, an inventory of raw and auxiliary materials and energy consumed together with pollutantemissions to air, water, and soil throughout the life cycle of rice bran oil production per FU wasestablished.
All data in this study are based on the production capacity and current situation of the enterprise studied.The daily processing capacity of crude oil extraction system is 150 tons, and that of oil re�ning system is200 tons for the purpose of balancing production and sales,
Page 7/22
Transport data on diesel fuel consumption came from truck drivers and the relevant emissions werequanti�ed referring to factors for diesel combustion based on the Eco-invent database. And the transportdistance was determined comprehensively considering the locations of rice plants and the oil plant.
As for systems of the oil extraction, oil re�ning and oil storage, data of each process, including input ofraw and auxiliary materials, energy consumption, intermediate products and process emissions output,were provided by the technical engineer according to the statistical yearbook and EIA reports of theenterprise. The data regarding the electricity generation, hard coal mining and acquisition, as well as theproduction of other auxiliary materials were primarily extracted from the GaBi database.
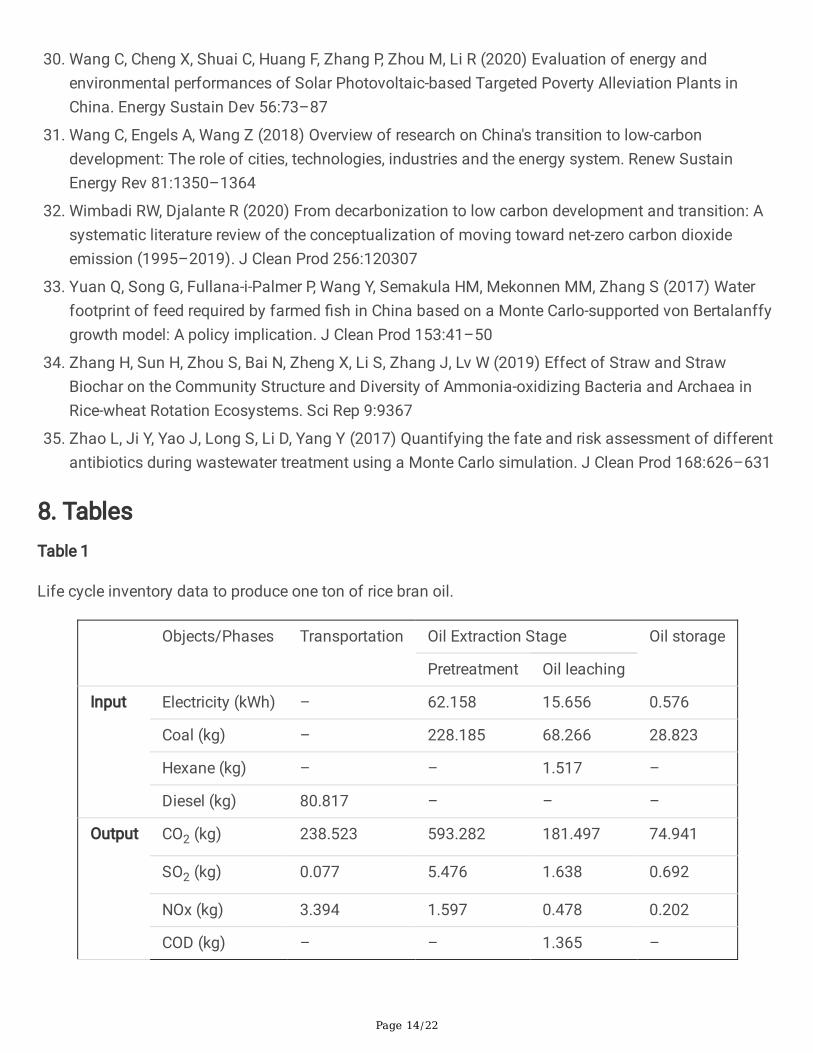
In addition, it is necessary to note that bleaching earth, mainly composed of bentonite, silicon dioxide,ferrous oxide and alumina was neglected in view of its small dosage and insigni�cant environmentalimpact. The waste water produced in the production process is disposed by the sewage treatment systembefore being discharged. The relevant discharge data in this article refers to that after sewage treatment.Finally, the life cycle inventory data to produce one ton of rice bran oil is shown in Table 1.
2.2.3. Impact assessmentThe life cycle impact assessment is the core step of LCA, aiming to identify and evaluate the magnitudeand signi�cance of the potential environmental impacts. For this purpose, GaBi ts version 9.2.1.68software was employed. Mandatory elements: the selection of relevant impact categories, classi�cationand characterization were performed using a midpoint approach and the World 2000 was adopt for thenormalization step. The environmental impact categories investigated are: abiotic depletion potential(elements) (ADPe), abiotic depletion potential (fossil) (ADPf), acidi�cation potential (AP), eutrophicationpotential (EP), freshwater aquatic ecotoxicity potential (FAETP), global warming potential (GWP), humantoxicity potential (HTP), marine aquatic ecotoxicity potential (MAETP), ozone layer depletion potential(ODP), photochemical ozone creation potential (POCP), and terrestrial ecotoxicity potential (TETP).
2.3. AllocationMulti-output systems require allocation, to quantitatively associate inputs and outputs with the relevantproducts. For the present study, co-products were observed in both oil extraction and oil re�ning stages.Referring to study by Khanali et al. (2018), mass allocation is adopted for all subsystems. The inventoryof each process is assigned to all of its products proportionally to their mass. The product systems areshown in Table S1.
2.4. Monte Carlo simulationThe Monte Carlo simulation captures the uncertainty of parameter estimation based on the probabilisticstatistical theory by performing random experiments using the computer software to generate numbersrandomly within the given range of variable parameters (Liu et al., 2017; Yuan et al., 2017). In this paper,the Monte Carlo simulation was employed to analyze the uncertainty of the LCA results with the software
Page 8/22
Oracle Crystal Ball 11.1.2.4. Random trials repeated 10000 times each time. The general steps are asfollows: (1) determine the parameter variables and their distribution functions involved in the model; (2)construct the model; (3) perform multiple random sampling based on the given parameter ranges; and (4)obtain the distribution of the output variables (Zhao et al., 2017).
3. ResultsThe analysis herein is based on the CML2001-Jan. 2016 methodology. Table 2 shows the normalizationresults of rice bran oil production at subsystem level, from transportation of the raw material to there�ned oil storage.
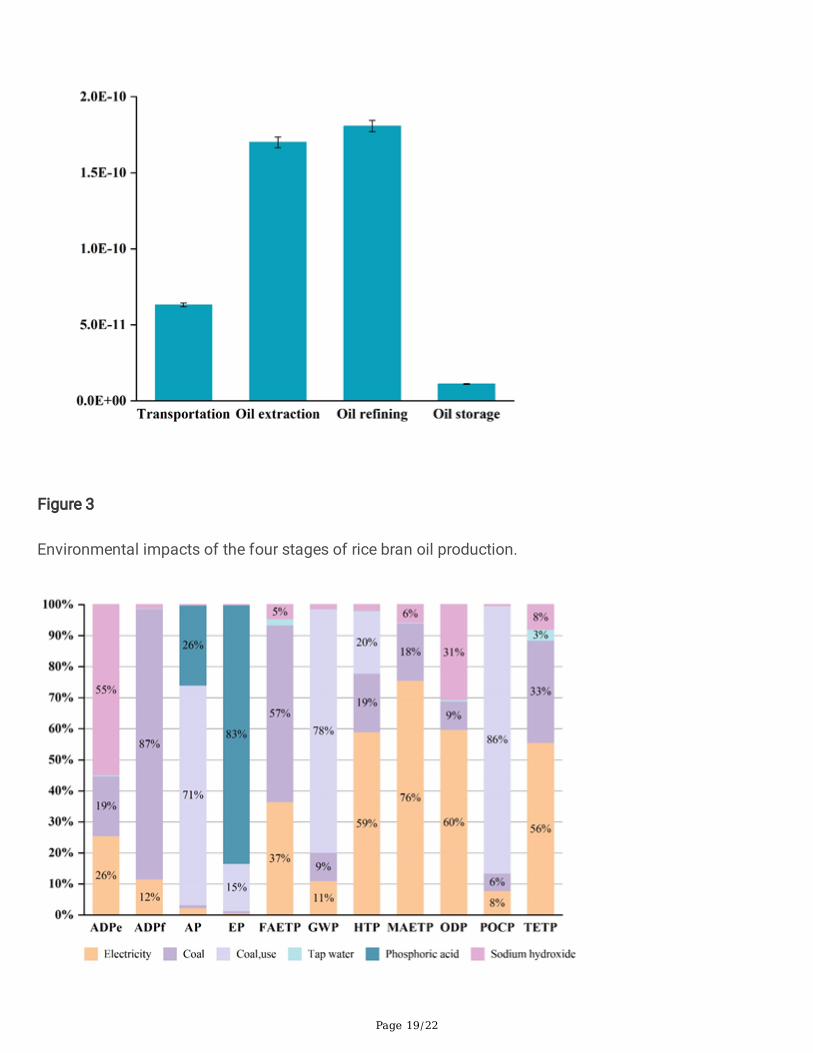
Besides, to consider the uncertainty in the normalization step, 10000 iterations of Monte Carlosimulations were performed and the 95% con�dence interval was calculated. The combined results areshown in Figs. 3. According to the results, the trends of the uncertainty ranges did not change the overallranking of the stages.
As presented in Fig. 3, the normalization results for the transportation, oil extraction, oil re�ning, and oilstorage stages were 6.31E-11 year, 1.70E-10 year, 1.81E-10 year, and 1.11E-11 year, respectively. The oilre�ning stage had the largest environmental impact, slightly higher than the oil extraction, followed by thetransportation and oil storage stages.
As can be seen from the inventory, electricity demand for the re�ning stage was 37.2% higher than the oilextraction, whereas 21.55% higher coal consumption was observed in the extraction stage than that ofthe oil re�ning. Besides, the applications of chemicals such as hexane, sodium hydroxide and phosphoricacid also generate signi�cant impacts on the environment. More details are described below.
According to the characterization results, oil re�ning stage accounts for the largest share in most impactcategories, contributing 35.85–80.51% to all impacts except ADPf, GWP, POCP and FAETP, for which itcontributes 35.95%, 38.9%, 21.67% and 9.8%, respectively. The oil extraction stage contributes most toADPf (41.09%), GWP (44.03%), POCP (68.72%) and transportation contributes 80.15% to FAETP. Nosigni�cant environmental impact was observed in the temporary storage stage.
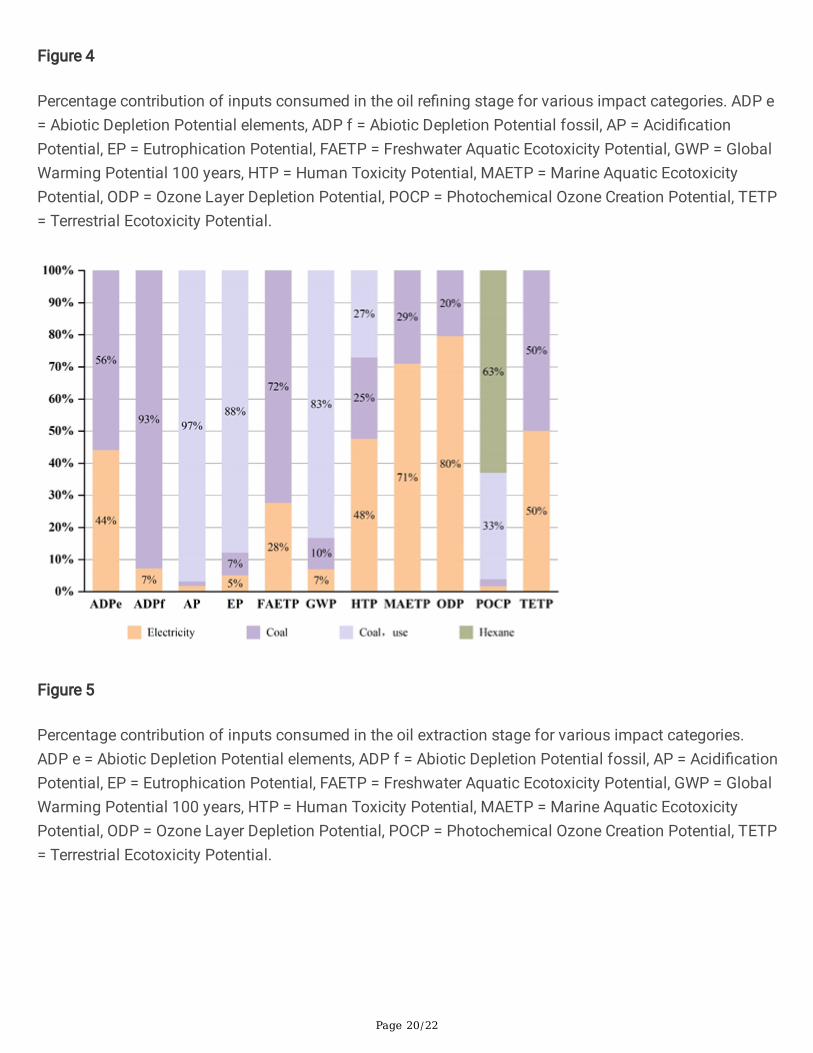
Figure 4 shows the percentage contribution of each input consumed in oil re�ning stage in developingenvironmental impacts. It can be observed that emissions of background systems in generation ofelectricity and coal coupled with those pollutant emissions arising from fossil fuel combustion during oilre�ning constitute the most signi�cant factors in computing impact categories, such as AP, HTP, MAETP,ODP and TETP. Besides, the applications of auxiliary chemicals like sodium hydroxide and phosphoricacid, contribute most to ADPe (55%) and EP (83%) impact categories, respectively.
According to in-depth analysis of normalization results, degumming, deacidi�cation and deodorizationprocesses made outstanding contributions to the environmental impacts compared with the others.
Page 9/22
As shown in Fig. 4, phosphoric acid consumed for the enzymatic hydrolysis of phospholipids indegumming process, is responsible for the vast majority of eutrophication impact (83%) in re�ning stage,but also generates remarkable effect on acidi�cation potential with a contribution of 26%. Furthermore,according to the inventory, high amount of coal is required in both deacidi�cation and deodorizationsteps to maintain the deacidi�cation tower at 230–240℃ and the deodorization tower at 240–250℃ sothat the steam inside the tower can keep carrying away the speci�c components smoothly. Consequently,the releases of sulfur dioxide, and nitrogen oxides from coal combustion in these processes, resulted in ashare of 71% of acidi�cation impact. Additionally, the discharge of wastewater containing phosphorus,COD and ammonia in these three processes plays a secondary role in the formation of EP and AP impactcategories. With regard to MAETP and HTP impact categories, discharges resulted from electrical powergenerating system and coal mining are two major contributors. As depicted in Fig. 4, the contributions toMAETP and HTP impact categories are 76% and 59% for the electricity generation, and 18% and 19% forthe latter contributor, respectively.
Environmental impacts of crude rice bran oil production in the oil extraction stage are exhibited in Fig. 5.Compared with the re�ning stage, oil extraction stage ranked the �rst in fossil fuel consumption,greenhouse gas emissions and photochemical ozone creation aspects. High volumes of raw materialneed to be processed in this stage, which resulted in 21.55% higher coal was consumed than the oilre�ning. As a result, fossil fuel production and emissions made considerable contributions in creations ofADPf and GWP impact categories both at rate of 93%. Meanwhile, the application of hexane solvent forhigher oil extraction rate in oil leaching process, plays a dominant role in aggravating POCP impactcategory.
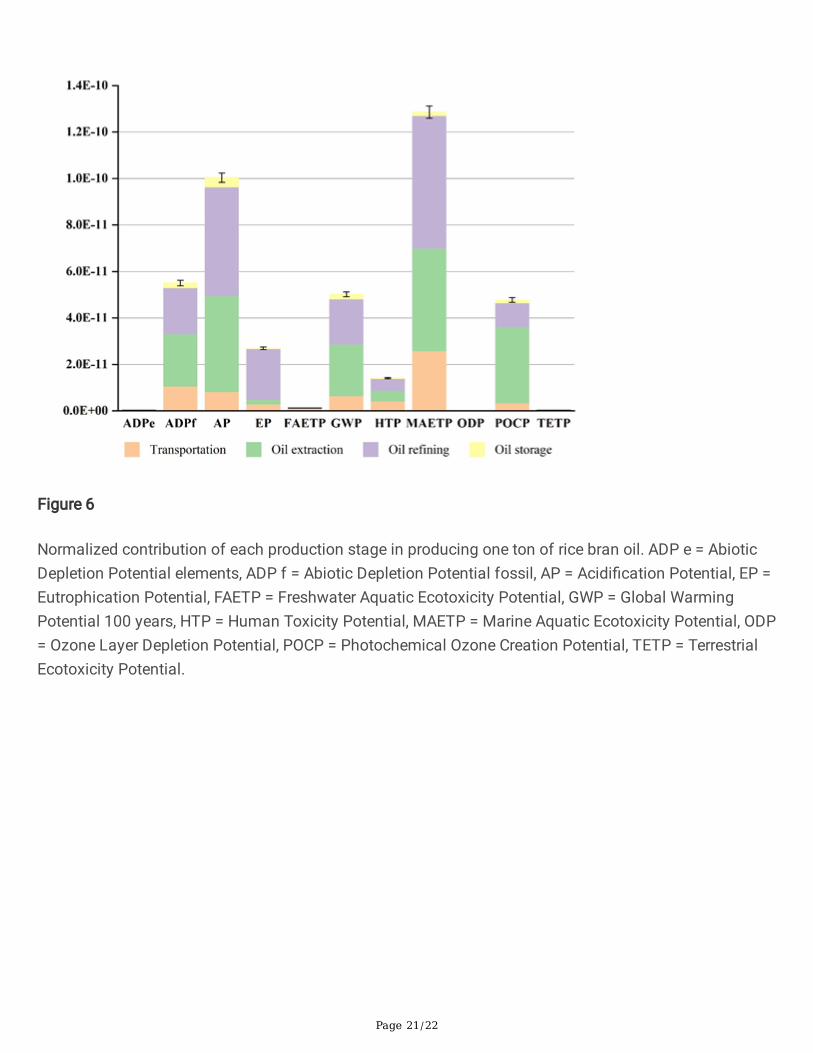
Figure 6 demonstrates the normalized contribution of each stage in producing one ton of rice bran oil. Itis evident that the oil re�ning stage has the highest contribution to the majority of the environmentalimpacts per one ton of rice bran oil production, due to high demands for electricity and fossil fuel whichprovides power for physical and chemical re�ning processes. The oil extraction stage follows next. Fromthe total environmental impact, it is easy to �nd that the MAETP impact category occupies the mostenvironmental burden in producing one ton of rice bran oil, wherein the major contribution arises from thebackground processes in production of energy mix. As graphically represented in Figs. 4–5, electricity atgrid (background processes) serves as the most important contributors in creation of MAETP impactcategory, meanwhile, fossil fuel extraction and processing also plays a signi�cant role. Apart from this,the values for AP, ADPf, GWP, POCP, EP, and HTP impact categories are also prominent. It can beascribable to the emissions of carbon dioxide, sulfur dioxide and nitrogen oxides from energy utilizationand those pollutant discharges during the production of auxiliary chemicals such as phosphoric acid andhexane.
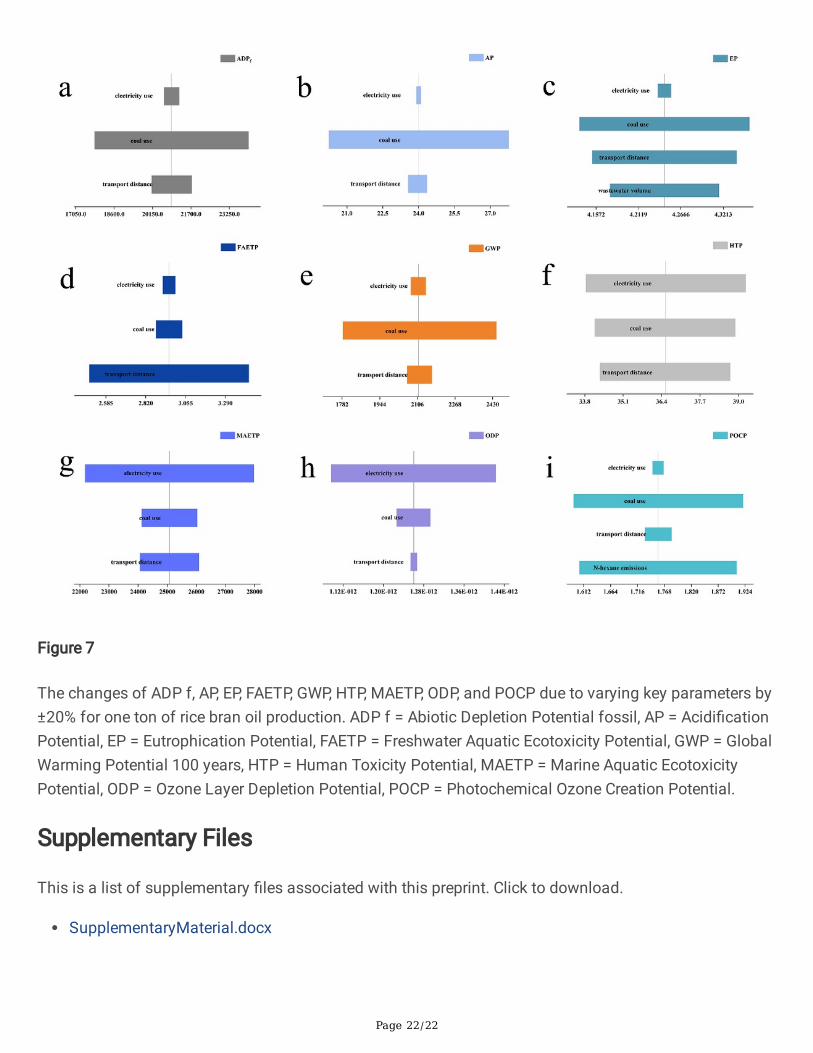
Sensitivity analyses of key parameters are shown in Fig. 7. It indicated that the LCA results were mostsensitive to coal consumption and electricity use. Speci�cally, most of the life cycle impact categories inproducing 1 ton of rice bran oil were most sensitive to coal consumption, such as abiotic fossil depletion,acidi�cation, eutrophication, global warming and photochemical ozone creation potential (Fig. 7a, b, c, e,
Page 10/22
and i). When the coal consumption changed by ± 20%, the life cycle global warming impact changed to2445.89 and 1785.97 kg CO2-eq, respectively, corresponding to 115.9% and 84.63% of the baseline lifecycle global warming impact, respectively. Besides, similar rates of change are observed in ADPf and APimpact categories. A 20% change in coal consumption results in 14.82% and 15.64% changes happeningto abiotic fossil depletion and acidi�cation impacts, respectively. In the same case, POCP changes by9.34% while EP is little �uctuation with a variation of 2.57%. Meanwhile, electricity usage is the secondmost important factor for life cycle environmental impact of rice bran oil production. Varying demand forelectricity by ± 20% led to changes of life cycle marine aquatic ecotoxicity, ozone layer depletion andhuman toxicity impacts by ± 11.56%, ± 12.93% and ± 7.39%, respectively. In addition, freshwater aquaticecotoxicity potential displays the greatest sensitivity to transport distance, generating a variation of ± 15.89% in respect to ± 20% change in transport distance. Other factors, such as wastewater volume andn-hexane discharge, caused 1.65% and 8.9% changes in EP and POCP, respectively, when changed by20%.
4. DiscussionThe environmental performances show that the oil re�ning stage generates the largest environmentalimpact, slightly higher than the oil extraction stage on the whole. The results can be attributed to highlevel of coal and electricity consumption in these stages, which resulted in massive emissions released inboth production and use phases. Energy-intensive characteristics of production lines and a highproportion of coal-based power generation make their dominant roles in developing environmentalimpacts. It can be observed that the enterprise relies mainly on electricity and fossil fuel for powerproviding, which exerts destructive effects on the environment. In many food processing industries,electricity and fuel consumption continues to dominate the generation of environmental impacts,especially MAETP and GWP impact category, for example, in production of processed tomato product DeMarco et al. (2018) and sea cucumber Hou et al. (2019). To reduce emissions from electricity and fuel oilutilization, modifying the electricity source with substitution of portion of the electricity grid withelectricity produced by the installed photovoltaic panels, and replacing the fuel used in the heatexchangers with biogas or lique�ed petroleum gas, to some extent, can prevent the negative effects offossil fuel-derived energy consumption. Wang et al. (2020) revealed that compared with the traditionalcoal-�red electricity generation, the solar photovoltaics electricity generation could reduce carbonemissions by 87.35–94.9%, which turned out to be a good alternative in reducing greenhouse gasemissions.
Reducing reliance on fossil fuels will signi�cantly improve the environmental sustainability of production,which highlights the need for sustainable energy generation and renewable biofuels development(Bórawski et al., 2019). The utilization of crop residues for energy generation can not only reduce theirenvironmental burden on society by refraining from faulty disposal of these leftover materials, but alsoalleviates energy shortages and fossil reserves depletion (Prasad et al., 2020). Quispe et al. (2019)investigated rice husk as an alternative energy source to coal for energy production. And it indicated that
Page 11/22
the environmental impacts of generating 1 MJ energy from rice husks was less than that from coal inglobal warming, acidi�cation and eutrophication categories, decreased by 97%, 88% and 80%,respectively. It can be attractive that substituting fossil fuel partly with rice husk will not only improve theenvironmental performance of the systems studied but also solve the agricultural by-product rice huskdisposal problem. Based on the fact that biomass, as a good resource with characteristics of renewabilityand low pollution however discourages most enterprises due to its low energy density and hightransportation costs, numerous researches have been performed to improve its practicality. For example,Thengane et al. (2020) assessed the life cycle emissions of processing rice husk into torre�ed pellets forenergy generation in different reaction conditions, and highlighted the techno-economic prospects fordecentralized torrefaction facilities at rice mills. Moreover, Unrean et al. (2018) compared three differentrice husk-to-fuel biore�nery technologies-hydrothermal carbonization with pelletization, pyrolysis andanaerobic co-digestion process in aspects of techno-economic performance and environmental impactsand drew the conclusion that compared with direct combustion for combined heat and power, theseconversion technologies had lower impacts on global warming, photochemical oxidation andacidi�cation based on the LCA results. It suggests that co-products utilization combined with biore�nerytechnologies will bring it more competitive than fossil-based and direct combustion-based processes.
5. ConclusionThis study evaluated environmental impact of rice bran oil production for the �rst time using life cyclethinking from the transportation of raw materials to the �nished products before factory. The LCA resultsindicated that the oil re�ning stage had the largest environmental impact, followed by the oil extractionstage, slightly lower at the same order of magnitude. It can be ascribable to the high demands for coaland electricity, which turned out to be the dominant contributors to the most impact categories. To relievethese impacts, modifying the electricity source, for example increasing proportion of electricity fromhydro power and solar photovoltaic, rather than traditional coal-�red ones, and substituting the fuel usedin the boiler and heat exchanger systems with biogas can be bene�cial.
As a supplement to the researches on cleaner production of edible oil industry, this research takes the unitoperations that constitute the processes into account, rather than regarding the industrial process as a“black box”, enhancing the transparency and reproducibility. Based on the LCA results, it is expected toprovide references for enterprises to make decisions on the transformation of energy structure to cleanenergy.
6. DeclarationsCompeting Interest
The authors declare that they have no known competing �nancial interests or personal relationships thatcould have appeared to in�uence the work reported in this paper.
Page 12/22
Acknowledgements
The authors warmly thank Dr. Haochen Hou for the technical support in Monte Carlo simulations. Thisstudy was supported by the General Project of the Natural Science Foundation of Liaoning Province(2019-MS-044).
7. References1. Ben-Othman S, Jõudu I, Bhat R (2020) Bioactives From Agri-Food Wastes: Present Insights and
Future Challenges. Molecules 25:510
2. Bommarco R, Kleijn D, Potts SG (2013) Ecological intensi�cation: harnessing ecosystem services forfood security. Trends Ecol Evol 28:230–238
3. Bórawski P, Bełdycka-Bórawska A, Szymańska EJ, Jankowski KJ, Dubis B, Dunn JW (2019)Development of renewable energy sources market and biofuels in The European Union. J Clean Prod228:467–484
4. De Marco I, Riemma S, Iannone R (2018) Uncertainty of input parameters and sensitivity analysis inlife cycle assessment: An Italian processed tomato product. J Clean Prod 177:315–325
5. Friedman M (2013) Rice brans, rice bran oils, and rice hulls: composition, food and industrial uses,and bioactivities in humans, animals, and cells. J Agric Food Chem 61:10626–10641
�. Gallyas F, Lee S, Yu S, Park HJ, Jung J, Go G-w, Kim W (2019) Rice bran oil ameliorates in�ammatoryresponses by enhancing mitochondrial respiration in murine macrophages. Plos One 14:10
7. Ghasemzadeh A, Baghdadi A, Jaafar ZE, Swamy H, Wahab MK,M, P.E (2018) Optimization ofFlavonoid Extraction from Red and Brown Rice Bran and Evaluation of the Antioxidant Properties.Molecules 23:1863
�. Gul K, Yousuf B, Singh AK, Singh P, Wani AA (2015) Rice bran: Nutritional values and its emergingpotential for development of functional food—A review. Bioactive Carbohydr Diet Fibre 6:24–30
9. Hou H, Shao S, Zhang Y, Kang H, Qin C, Sun X, Zhang S (2019) Life cycle assessment of seacucumber production: A case study, China. J Clean Prod 213:158–164
10. Kalhor P, Ghandi K (2019) Deep Eutectic Solvents for Pretreatment, Extraction, and Catalysis ofBiomass and Food Waste. Molecules 24:4012
11. Khanali M, Mousavi SA, Shari� M, Keyhani Nasab F, Chau K-w (2018) Life cycle assessment ofcanola edible oil production in Iran: A case study in Isfahan province. J Clean Prod 196:714–725
12. Khatri P, Jain S (2017) Environmental life cycle assessment of edible oils: A review of currentknowledge and future research challenges. J Clean Prod 152:63–76
13. Khatri P, Jain S, Pandey S (2017) A cradle-to-gate assessment of environmental impacts forproduction of mustard oil using life cycle assessment approach. J Clean Prod 166:988–997
14. Lai O-M, Jacoby JJ, Leong W-F, Lai W-T (2019) Chapter 2 - Nutritional Studies of Rice Bran Oil. In:Cheong L-Z, Xu X (eds) Rice Bran and Rice Bran Oil. AOCS Press, pp 19–54
Page 13/22
15. Lai WT, Khong NMH, Lim SS, Hee YY, Sim BI, Lau KY, Lai OM (2017) A review: Modi�ed agriculturalby-products for the development and forti�cation of food products and nutraceuticals. Trends FoodSci Technol 59:148–160
1�. Liu J, Li YP, Huang GH, Zhuang XW, Fu HY (2017) Assessment of uncertainty effects on cropplanning and irrigation water supply using a Monte Carlo simulation based dual-interval stochasticprogramming method. J Clean Prod 149:945–967
17. Ma X, Wang Y, Wang C (2017) Low-carbon development of China's thermal power industry based onan international comparison: Review, analysis and forecast. Renew Sustain Energy Rev 80:942–970
1�. Notarnicola B, Sala S, Anton A, McLaren SJ, Saouter E, Sonesson U (2017) The role of life cycleassessment in supporting sustainable agri-food systems: A review of the challenges. J Clean Prod140:399–409
19. Park H-Y, Lee K-W, Choi H-D (2017) Rice bran constituents: immunomodulatory and therapeuticactivities. Food Funct 8:935–943
20. Perez-Ternero C, Alvarez de Sotomayor M, Herrera MD (2017) Contribution of ferulic acid, γ-oryzanoland tocotrienols to the cardiometabolic protective effects of rice bran. Journal of Functional Foods32:58–71
21. Prasad S, Singh A, Korres NE, Rathore D, Sevda S, Pant D (2020) Sustainable utilization of cropresidues for energy generation: A life cycle assessment (LCA) perspective. Biores Technol303:122964
22. Quispe I, Navia R, Kahhat R (2019) Life Cycle Assessment of rice husk as an energy source. APeruvian case study. J Clean Prod 209:1235–1244
23. Rico X, Gullon B, Alonso JL, Yanez R (2020) Recovery of high value-added compounds frompineapple, melon, watermelon and pumpkin processing by-products: An overview. Food Res Int132:109086
24. Samad N (2015) Rice bran oil prevents neuroleptic-induced extrapyramidal symptoms in rats:Possible antioxidant mechanisms. Journal of Food Drug Analysis 23:370–375
25. Soussana J-F (2014) Research priorities for sustainable agri-food systems and life cycleassessment. J Clean Prod 73:19–23
2�. Thengane SK, Burek J, Kung KS, Ghoniem AF, Sanchez DL (2020) Life cycle assessment of rice husktorrefaction and prospects for decentralized facilities at rice mills. J Clean Prod 275:123177
27. Tsarouhas P, Achillas C, Aidonis D, Folinas D, Maslis V (2015) Life Cycle Assessment of olive oilproduction in Greece. J Clean Prod 93:75–83
2�. Tukker A, Jansen B (2006) Environmental Impacts of Products: A Detailed Review of Studies. J IndEcol 10:159–182
29. Unrean P, Lai Fui BC, Rianawati E, Acda M (2018) Comparative techno-economic assessment andenvironmental impacts of rice husk-to-fuel conversion technologies. Energy 151:581–593
Page 14/22
30. Wang C, Cheng X, Shuai C, Huang F, Zhang P, Zhou M, Li R (2020) Evaluation of energy andenvironmental performances of Solar Photovoltaic-based Targeted Poverty Alleviation Plants inChina. Energy Sustain Dev 56:73–87
31. Wang C, Engels A, Wang Z (2018) Overview of research on China's transition to low-carbondevelopment: The role of cities, technologies, industries and the energy system. Renew SustainEnergy Rev 81:1350–1364
32. Wimbadi RW, Djalante R (2020) From decarbonization to low carbon development and transition: Asystematic literature review of the conceptualization of moving toward net-zero carbon dioxideemission (1995–2019). J Clean Prod 256:120307
33. Yuan Q, Song G, Fullana-i-Palmer P, Wang Y, Semakula HM, Mekonnen MM, Zhang S (2017) Waterfootprint of feed required by farmed �sh in China based on a Monte Carlo-supported von Bertalanffygrowth model: A policy implication. J Clean Prod 153:41–50
34. Zhang H, Sun H, Zhou S, Bai N, Zheng X, Li S, Zhang J, Lv W (2019) Effect of Straw and StrawBiochar on the Community Structure and Diversity of Ammonia-oxidizing Bacteria and Archaea inRice-wheat Rotation Ecosystems. Sci Rep 9:9367
35. Zhao L, Ji Y, Yao J, Long S, Li D, Yang Y (2017) Quantifying the fate and risk assessment of differentantibiotics during wastewater treatment using a Monte Carlo simulation. J Clean Prod 168:626–631
8. TablesTable 1
Life cycle inventory data to produce one ton of rice bran oil.
Objects/Phases Transportation Oil Extraction Stage Oil storage
Pretreatment Oil leaching
Input Electricity (kWh) – 62.158 15.656 0.576
Coal (kg) – 228.185 68.266 28.823
Hexane (kg) – – 1.517 –
Diesel (kg) 80.817 – – –
Output CO2 (kg) 238.523 593.282 181.497 74.941
SO2 (kg) 0.077 5.476 1.638 0.692
NOx (kg) 3.394 1.597 0.478 0.202
COD (kg) – – 1.365 –
Page 15/22
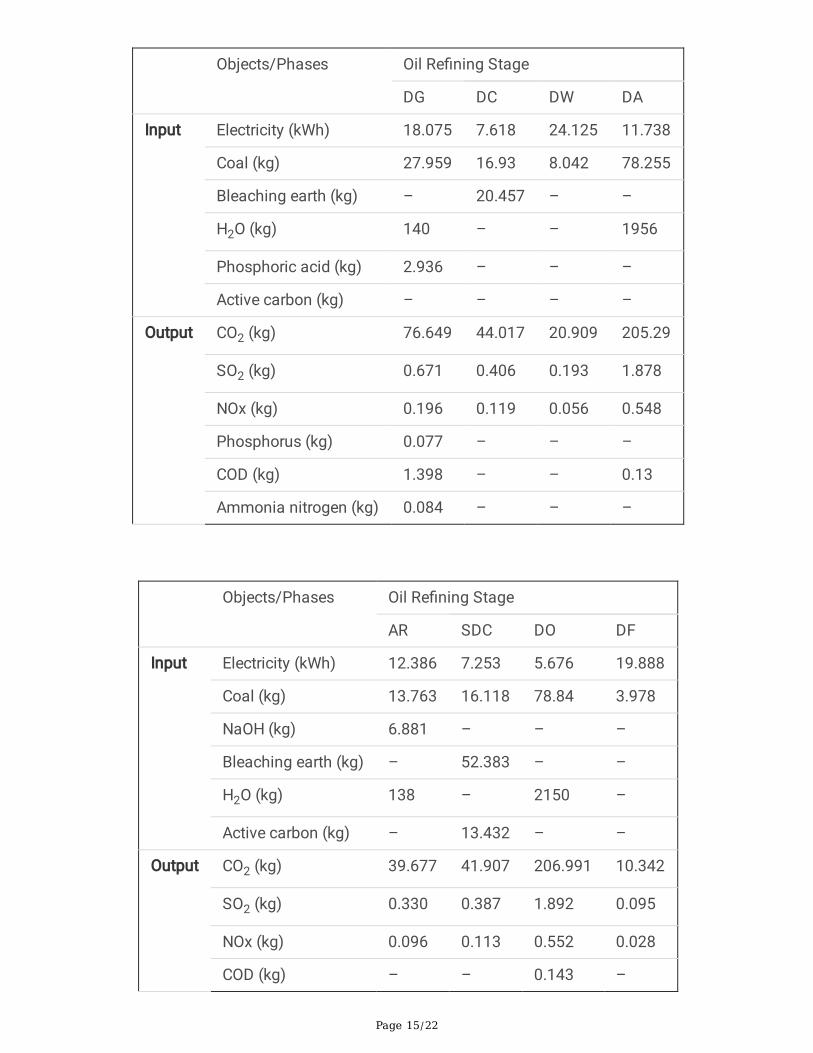
Objects/Phases Oil Re�ning Stage
DG DC DW DA
Input Electricity (kWh) 18.075 7.618 24.125 11.738
Coal (kg) 27.959 16.93 8.042 78.255
Bleaching earth (kg) – 20.457 – –
H2O (kg) 140 – – 1956
Phosphoric acid (kg) 2.936 – – –
Active carbon (kg) – – – –
Output CO2 (kg) 76.649 44.017 20.909 205.29
SO2 (kg) 0.671 0.406 0.193 1.878
NOx (kg) 0.196 0.119 0.056 0.548
Phosphorus (kg) 0.077 – – –
COD (kg) 1.398 – – 0.13
Ammonia nitrogen (kg) 0.084 – – –
Objects/Phases Oil Re�ning Stage
AR SDC DO DF
Input Electricity (kWh) 12.386 7.253 5.676 19.888
Coal (kg) 13.763 16.118 78.84 3.978
NaOH (kg) 6.881 – – –
Bleaching earth (kg) – 52.383 – –
H2O (kg) 138 – 2150 –
Active carbon (kg) – 13.432 – –
Output CO2 (kg) 39.677 41.907 206.991 10.342
SO2 (kg) 0.330 0.387 1.892 0.095
NOx (kg) 0.096 0.113 0.552 0.028
COD (kg) – – 0.143 –
Page 16/22
DG = degumming; DC = decoloring; DW = dewaxing; DA = deacidi�cation; AR = alkali re�ning; SDC =secondary decoloring; DO = deodorization; DF = defatting.
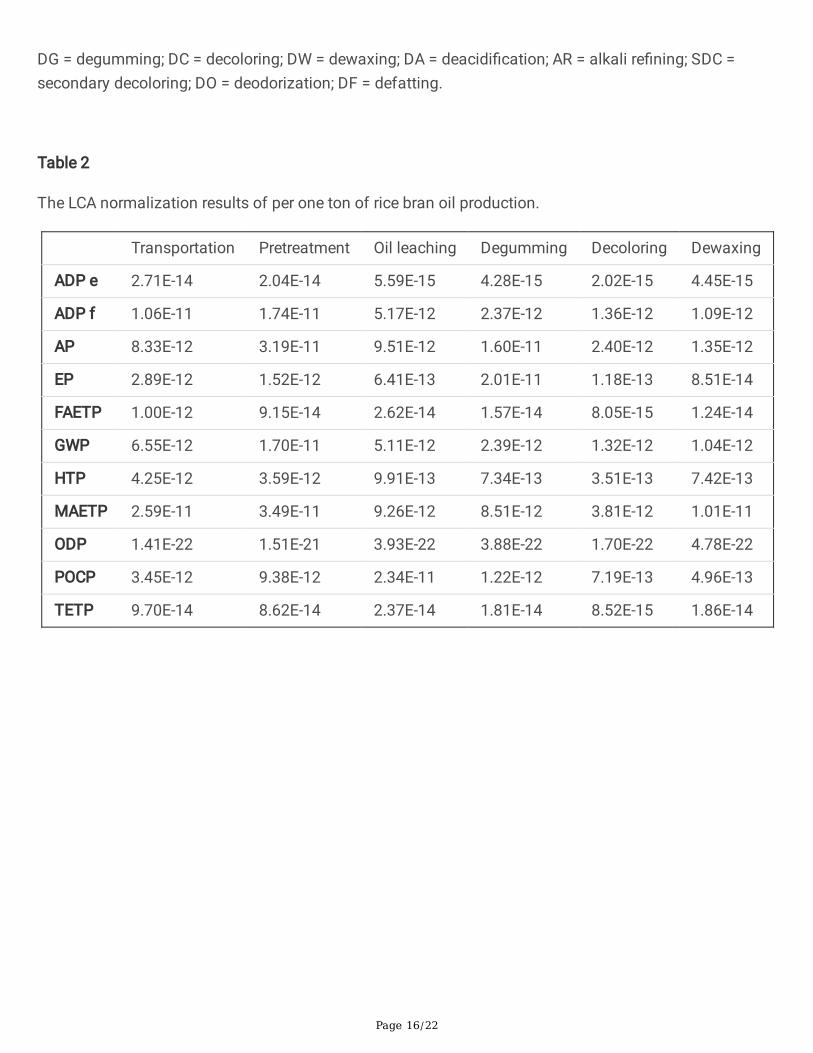
Table 2
The LCA normalization results of per one ton of rice bran oil production.
Transportation Pretreatment Oil leaching Degumming Decoloring Dewaxing
ADP e 2.71E-14 2.04E-14 5.59E-15 4.28E-15 2.02E-15 4.45E-15
ADP f 1.06E-11 1.74E-11 5.17E-12 2.37E-12 1.36E-12 1.09E-12
AP 8.33E-12 3.19E-11 9.51E-12 1.60E-11 2.40E-12 1.35E-12
EP 2.89E-12 1.52E-12 6.41E-13 2.01E-11 1.18E-13 8.51E-14
FAETP 1.00E-12 9.15E-14 2.62E-14 1.57E-14 8.05E-15 1.24E-14
GWP 6.55E-12 1.70E-11 5.11E-12 2.39E-12 1.32E-12 1.04E-12
HTP 4.25E-12 3.59E-12 9.91E-13 7.34E-13 3.51E-13 7.42E-13
MAETP 2.59E-11 3.49E-11 9.26E-12 8.51E-12 3.81E-12 1.01E-11
ODP 1.41E-22 1.51E-21 3.93E-22 3.88E-22 1.70E-22 4.78E-22
POCP 3.45E-12 9.38E-12 2.34E-11 1.22E-12 7.19E-13 4.96E-13
TETP 9.70E-14 8.62E-14 2.37E-14 1.81E-14 8.52E-15 1.86E-14
Page 17/22
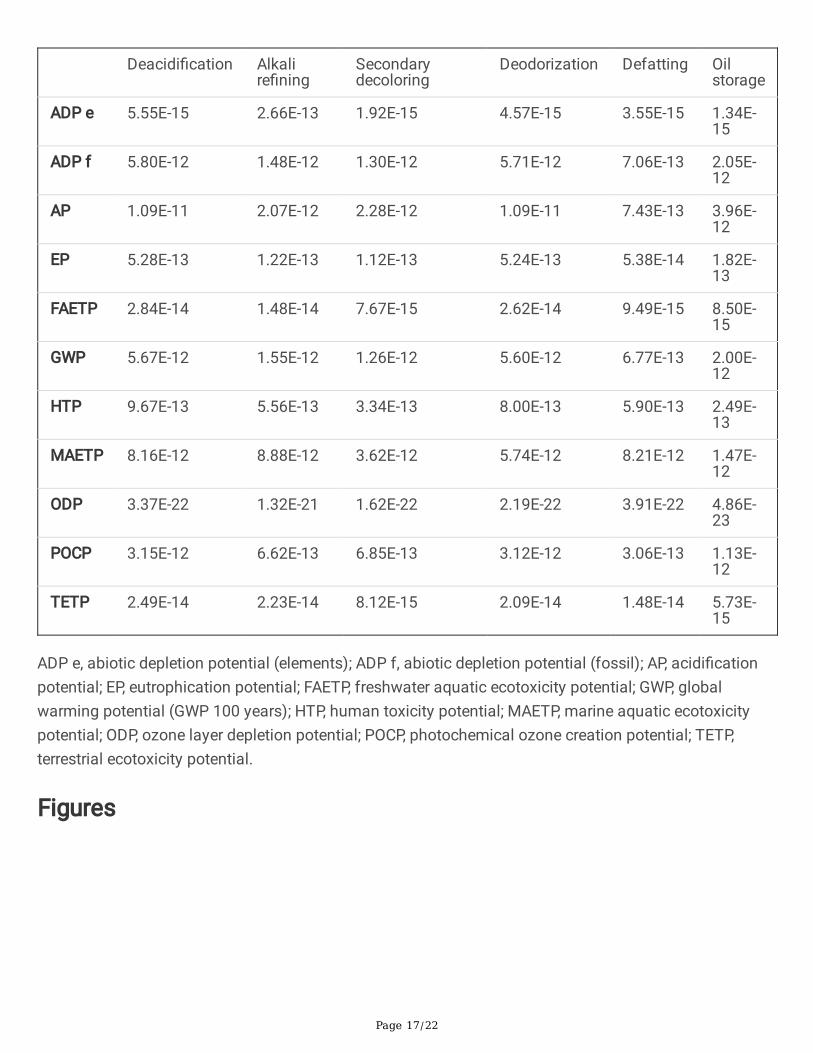
Deacidi�cation Alkalire�ning
Secondarydecoloring
Deodorization Defatting Oilstorage
ADP e 5.55E-15 2.66E-13 1.92E-15 4.57E-15 3.55E-15 1.34E-15
ADP f 5.80E-12 1.48E-12 1.30E-12 5.71E-12 7.06E-13 2.05E-12
AP 1.09E-11 2.07E-12 2.28E-12 1.09E-11 7.43E-13 3.96E-12
EP 5.28E-13 1.22E-13 1.12E-13 5.24E-13 5.38E-14 1.82E-13
FAETP 2.84E-14 1.48E-14 7.67E-15 2.62E-14 9.49E-15 8.50E-15
GWP 5.67E-12 1.55E-12 1.26E-12 5.60E-12 6.77E-13 2.00E-12
HTP 9.67E-13 5.56E-13 3.34E-13 8.00E-13 5.90E-13 2.49E-13
MAETP 8.16E-12 8.88E-12 3.62E-12 5.74E-12 8.21E-12 1.47E-12
ODP 3.37E-22 1.32E-21 1.62E-22 2.19E-22 3.91E-22 4.86E-23
POCP 3.15E-12 6.62E-13 6.85E-13 3.12E-12 3.06E-13 1.13E-12
TETP 2.49E-14 2.23E-14 8.12E-15 2.09E-14 1.48E-14 5.73E-15
ADP e, abiotic depletion potential (elements); ADP f, abiotic depletion potential (fossil); AP, acidi�cationpotential; EP, eutrophication potential; FAETP, freshwater aquatic ecotoxicity potential; GWP, globalwarming potential (GWP 100 years); HTP, human toxicity potential; MAETP, marine aquatic ecotoxicitypotential; ODP, ozone layer depletion potential; POCP, photochemical ozone creation potential; TETP,terrestrial ecotoxicity potential.
Figures
Page 18/22
Figure 1
The process �owsheet diagram of rice bran oil production.
Figure 2
System boundary and four stages of rice bran oil production.
Page 19/22
Figure 3
Environmental impacts of the four stages of rice bran oil production.
Page 20/22
Figure 4
Percentage contribution of inputs consumed in the oil re�ning stage for various impact categories. ADP e= Abiotic Depletion Potential elements, ADP f = Abiotic Depletion Potential fossil, AP = Acidi�cationPotential, EP = Eutrophication Potential, FAETP = Freshwater Aquatic Ecotoxicity Potential, GWP = GlobalWarming Potential 100 years, HTP = Human Toxicity Potential, MAETP = Marine Aquatic EcotoxicityPotential, ODP = Ozone Layer Depletion Potential, POCP = Photochemical Ozone Creation Potential, TETP= Terrestrial Ecotoxicity Potential.
Figure 5
Percentage contribution of inputs consumed in the oil extraction stage for various impact categories.ADP e = Abiotic Depletion Potential elements, ADP f = Abiotic Depletion Potential fossil, AP = Acidi�cationPotential, EP = Eutrophication Potential, FAETP = Freshwater Aquatic Ecotoxicity Potential, GWP = GlobalWarming Potential 100 years, HTP = Human Toxicity Potential, MAETP = Marine Aquatic EcotoxicityPotential, ODP = Ozone Layer Depletion Potential, POCP = Photochemical Ozone Creation Potential, TETP= Terrestrial Ecotoxicity Potential.
Page 21/22
Figure 6
Normalized contribution of each production stage in producing one ton of rice bran oil. ADP e = AbioticDepletion Potential elements, ADP f = Abiotic Depletion Potential fossil, AP = Acidi�cation Potential, EP =Eutrophication Potential, FAETP = Freshwater Aquatic Ecotoxicity Potential, GWP = Global WarmingPotential 100 years, HTP = Human Toxicity Potential, MAETP = Marine Aquatic Ecotoxicity Potential, ODP= Ozone Layer Depletion Potential, POCP = Photochemical Ozone Creation Potential, TETP = TerrestrialEcotoxicity Potential.
Page 22/22
Figure 7
The changes of ADP f, AP, EP, FAETP, GWP, HTP, MAETP, ODP, and POCP due to varying key parameters by±20% for one ton of rice bran oil production. ADP f = Abiotic Depletion Potential fossil, AP = Acidi�cationPotential, EP = Eutrophication Potential, FAETP = Freshwater Aquatic Ecotoxicity Potential, GWP = GlobalWarming Potential 100 years, HTP = Human Toxicity Potential, MAETP = Marine Aquatic EcotoxicityPotential, ODP = Ozone Layer Depletion Potential, POCP = Photochemical Ozone Creation Potential.
Supplementary Files
This is a list of supplementary �les associated with this preprint. Click to download.
SupplementaryMaterial.docx