History of the invasive African olive tree in Australia and Hawaii: evidence for sequential...
17
ORIGINAL ARTICLE History of the invasive African olive tree in Australia and Hawaii: evidence for sequential bottlenecks and hybridization with the Mediterranean olive Guillaume Besnard, 1,† J er emy Dupuy, 1,† Maximilien Larter, 2 Peter Cuneo, 3 David Cooke 4 and Lounes Chikhi 1,5 1 Laboratoire Evolution & Diversit e Biologique, CNRS, UPS, ENFA, UMR 5174, Toulouse, France 2 INRA, UMR 1202 BIOGECO, Universit e de Bordeaux, Talence, France 3 The Australian Botanic Garden, Mount Annan, Royal Botanic Gardens and Domain Trust, Mount Annan, NSW, Australia 4 Department of Primary Industries and Resources PIRSA, Biosecurity SA, Adelaide, SA, Australia 5 Instituto Gulbenkian de Ci^ encia, Oreiras, Portugal Keywords admixture, approximate Bayesian computation, biologic invasion, cuspidata, introgression, microsatellites, Olea europaea, plastid DNA Correspondence Guillaume Besnard, Laboratoire Evolution & Diversit e Biologique, CNRS, UPS, ENFA, UMR 5174, 31062 Toulouse 4, France. Tel.: +0(33) 5 61 55 85 45; e-mail: [email protected] † These authors contributed equally to this work. Received: 3 May 2013 Accepted: 4 September 2013 doi:10.1111/eva.12110 Abstract Humans have introduced plants and animals into new continents and islands with negative effects on local species. This has been the case of the olive that was introduced in Australia, New Zealand and Pacific islands where it became invasive. Two subspecies were introduced in Australia, and each successfully invaded a specific area: the African olive in New South Wales (NSW) and the Mediterranean olive in South Australia. Here, we examine their origins and spread and analyse a large sample of native and invasive accessions with chloroplast and nuclear microsatellites. African olive populations from the invaded range exhibit two South African chlorotypes hence supporting an introduction from South Africa, while populations from South Australia exhi- bit chlorotypes of Mediterranean cultivars. Congruently, nuclear markers sup- port the occurrence of two lineages in Australia but demonstrate that admixture took place, attesting that they hybridized early after introduction. Furthermore, using an approximate Bayesian computation framework, we found strong support for the serial introduction of the African olive from South Africa to NSW and then from NSW to Hawaii. The taxon experienced successive bottlenecks that did not preclude invasion, meaning that rapid decisions need to be taken to avoid naturalization where it has not estab- lished a large population yet. Introduction Biologic invasions are increasingly recognized as one of the major threats to biodiversity worldwide (Mooney and Cleland 2001; Clavero and Garc ıa-Berthou 2005). This is particularly true on islands where recent inva- sions have led to the extinction of many endemic species (Blackburn et al. 2004; Sax and Gaines 2008). Invasive species can have dramatic effects through competition with or predation of native organisms and disturbance of ecosystem functioning (Wilcove et al. 1998; Davis et al. 2005; Richardson and Pysek 2006). Invasive popu- lations are often thought to originate from a very limited number of individuals and therefore challenge the idea that populations going through bottlenecks should suffer from inbreeding and reduced fitness (Facon et al. 2011). To better understand the process of an invasion of a new territory, determining the origins of invasive species as well as the past and incipient evolutionary processes is essential. Several recent studies suggest that exotic spe- cies success is dependent on variable trait combinations, which makes it difficult to identify general determinants of invasiveness (Facon et al. 2006; Van Kleunen et al. 2010; Gurevitch et al. 2011). Specific studies are thus required to understand the recent evolutionary history of invasive species. © 2013 The Authors. Evolutionary Applications published by John Wiley & Sons Ltd. This is an open access article under the terms of the Creative Commons Attribution License, which permits use, distribution and reproduction in any medium, provided the original work is properly cited. 195 Evolutionary Applications ISSN 1752-4571 Evolutionary Applications
Transcript of History of the invasive African olive tree in Australia and Hawaii: evidence for sequential...

ORIGINAL ARTICLE
History of the invasive African olive tree in Australia andHawaii: evidence for sequential bottlenecks andhybridization with the Mediterranean oliveGuillaume Besnard,1,† J�er�emy Dupuy,1,† Maximilien Larter,2 Peter Cuneo,3 David Cooke4
and Lounes Chikhi1,5
1 Laboratoire Evolution & Diversit�e Biologique, CNRS, UPS, ENFA, UMR 5174, Toulouse, France
2 INRA, UMR 1202 BIOGECO, Universit�e de Bordeaux, Talence, France
3 The Australian Botanic Garden, Mount Annan, Royal Botanic Gardens and Domain Trust, Mount Annan, NSW, Australia
4 Department of Primary Industries and Resources PIRSA, Biosecurity SA, Adelaide, SA, Australia
5 Instituto Gulbenkian de Ciencia, Oreiras, Portugal
Keywords
admixture, approximate Bayesian
computation, biologic invasion, cuspidata,
introgression, microsatellites, Olea europaea,
plastid DNA
Correspondence
Guillaume Besnard, Laboratoire Evolution &
Diversit�e Biologique, CNRS, UPS, ENFA, UMR
5174, 31062 Toulouse 4, France.
Tel.: +0(33) 5 61 55 85 45;
e-mail: [email protected]
†These authors contributed equally to this
work.
Received: 3 May 2013
Accepted: 4 September 2013
doi:10.1111/eva.12110
Abstract
Humans have introduced plants and animals into new continents and islands
with negative effects on local species. This has been the case of the olive that
was introduced in Australia, New Zealand and Pacific islands where it became
invasive. Two subspecies were introduced in Australia, and each successfully
invaded a specific area: the African olive in New South Wales (NSW) and
the Mediterranean olive in South Australia. Here, we examine their origins
and spread and analyse a large sample of native and invasive accessions with
chloroplast and nuclear microsatellites. African olive populations from the
invaded range exhibit two South African chlorotypes hence supporting an
introduction from South Africa, while populations from South Australia exhi-
bit chlorotypes of Mediterranean cultivars. Congruently, nuclear markers sup-
port the occurrence of two lineages in Australia but demonstrate that
admixture took place, attesting that they hybridized early after introduction.
Furthermore, using an approximate Bayesian computation framework, we
found strong support for the serial introduction of the African olive from
South Africa to NSW and then from NSW to Hawaii. The taxon experienced
successive bottlenecks that did not preclude invasion, meaning that rapid
decisions need to be taken to avoid naturalization where it has not estab-
lished a large population yet.
Introduction
Biologic invasions are increasingly recognized as one of
the major threats to biodiversity worldwide (Mooney
and Cleland 2001; Clavero and Garc�ıa-Berthou 2005).
This is particularly true on islands where recent inva-
sions have led to the extinction of many endemic species
(Blackburn et al. 2004; Sax and Gaines 2008). Invasive
species can have dramatic effects through competition
with or predation of native organisms and disturbance
of ecosystem functioning (Wilcove et al. 1998; Davis
et al. 2005; Richardson and Pysek 2006). Invasive popu-
lations are often thought to originate from a very limited
number of individuals and therefore challenge the idea
that populations going through bottlenecks should suffer
from inbreeding and reduced fitness (Facon et al. 2011).
To better understand the process of an invasion of a
new territory, determining the origins of invasive species
as well as the past and incipient evolutionary processes
is essential. Several recent studies suggest that exotic spe-
cies success is dependent on variable trait combinations,
which makes it difficult to identify general determinants
of invasiveness (Facon et al. 2006; Van Kleunen et al.
2010; Gurevitch et al. 2011). Specific studies are thus
required to understand the recent evolutionary history of
invasive species.
© 2013 The Authors. Evolutionary Applications published by John Wiley & Sons Ltd. This is an open access article under the terms of the Creative
Commons Attribution License, which permits use, distribution and reproduction in any medium, provided
the original work is properly cited.
195
Evolutionary Applications ISSN 1752-4571
Evolutionary Applications
The olive tree (Olea europaea L., Oleaceae, hereafter
‘the olive’) is often associated with Mediterranean
regions, but it is also known to be invasive and disruptive
to the local flora, particularly in South Australia, New
South Wales (NSW), Norfolk Island, northern New Zea-
land (e.g. Kermadec, Auckland Bay), the Hawaii archipel-
ago and Saint Helena (Spennemann and Allen 2000;
Cuneo and Leishman 2006; GISD 2010). Two olive sub-
species have been spread by humans (Cuneo and Leish-
man 2006; Besnard et al. 2007a): Olea europaea subsp.
europaea (the Mediterranean olive) and O. e. subsp.
cuspidata (Wall. ex G. Don) Cif. (the African olive). The
subspecies show a distinct native regional distribution
(Green 2002; Besnard et al. 2012) – O. e. europaea is a
characteristic taxon of the Mediterranean Basin, while
O. e. cuspidata is distributed from southern and eastern
Africa to southern Asia (Pakistan, India, Iran and China).
The two subspecies are generally easy to distinguish based
on morphological traits (M�edail et al. 2001; Green 2002;
Cuneo and Leishman 2006), and their long geographical
isolation also led to a high, significant genetic divergence
(Rubio de Casas et al. 2006; Besnard et al. 2007b). The
Mediterranean olive was one of the first woody crops and
was spread by human cultivation during the last six mil-
lennia (Kaniewski et al. 2012). Unlike the europaea sub-
species, O. e. cuspidata’s fruit has no commercial value,
but the African olive has been exploited for its hard and
durable wood and can be used as a rootstock, ornamental
or hedging plant (Spennemann and Allen 2000; Starr
et al. 2003).
The history of both invasive olive subspecies is only par-
tially documented (Dellow et al. 1987; Cuneo and Leish-
man 2006). The agricultural development of Australia
gained momentum in the early 1800s and coincided with
the introduction of many plants from Africa and the Medi-
terranean that were climatically suited to Australia. The
Mediterranean olive tree was one of the earliest plant intro-
ductions into Australia by agricultural pioneer John Macar-
thur in 1805. Since then, multiple clones have been
introduced, and more than 100 olive varieties are presently
reported (Sweeney and Davies 1998). During the mid-
1800s, the Macarthur family operated a large nursery at the
famous Camden Park estate in south-west Sydney, NSW,
and shipped potted plants throughout the colony. Plant
listings in the 1843 Camden Park Nursery catalogue
include a number of introduced plants that have since
become environmental weeds, including African olive,
which was established at this time. Isolated trees of African
olive were also reported in the Adelaide region, South Aus-
tralia (Shepherds Hill; Cuneo and Leishman 2006). In con-
trast to continental Australia, the origins of invasive olive
in the oceanic islands and archipelagos are not clearly doc-
umented (GISD 2010). The infestation on Norfolk Island
by the African olive is probably relatively old (during the
19th century; Cuneo and Leishman 2006), while the first
records on Maui (Hawaii) and Saint Helena date back to
the 1960s and early 2000s, respectively (Starr et al. 2003;
GISD 2010).
While human activities contribute to transcontinental
dispersal of O. europaea, birds are responsible for its local
spread (Spennemann and Allen 2000). The dispersal range
and the amount of seeds dispersed depend on the animal
species but probably also on the size of the fruits (Alcantara
and Rey 2003). After dispersal and establishment, the olives
outcompete the native vegetation (such as eucalypts) by
preventing regeneration. Olea europaea forms a crown
under which olive seedlings can grow, but most native flora
cannot (Cuneo and Leishman 2006; Cuneo et al. 2010;
Major 2010). For example, the formation of African olive
canopy in the Cumberland plain woodland resulted in a
78% reduction in native understory plant richness (Major
2010). In addition, the establishment of African olive can
affect the local fauna by changing the vegetation structure
and fruit availability. The speckled warbler has been shown
to be negatively affected by the African olive invasion, while
nonindigenous bird species such as the common starling
and Eurasian blackbird are attracted by the presence of the
African olives. This further encourages the displacement of
the native fauna (DECC 2007). Not only can olive trees
thrive in dry woodlands, they are also highly invasive in
coastal regions. Hence, olives are considered as a serious
threat to the biodiversity of Australia (Manders and Rich-
ardson 1992; Tozer 2003; Cuneo and Leishman 2006; GISD
2010).
The use of genetic data can be useful in reconstructing
the history and hence identifying the source of invasions
and documenting the population dynamics of invaders
(Estoup et al. 2004; Bonhomme et al. 2008; Wilson et al.
2009; Ascunce et al. 2011; Lander et al. 2011; Ndlovu et al.
2013). Such information not only increases our under-
standing of the ecological constraints of the native habitat
of the invader (by comparing the invasive and native habi-
tats), but it can also help unravel evolutionary changes that
have occurred since it was introduced (Prentis et al. 2008;
Dlugosch and Parker 2008; Rey et al. 2012). Previous
genetic characterizations of invasive Olea, using both plas-
tid DNA and nuclear markers, have located the potential
geographical origins of these invasive populations (Besnard
et al. 2007a). Populations near Adelaide (subsp. europaea)
showed high genetic similarities with central and western
Mediterranean cultivars, while Hawaii and NSW popula-
tions (subsp. cuspidata) showed a genetic affinity with
southern African populations. An event of early admixture
between europaea and cuspidata subspecies was reported
(Besnard et al. 2007a), indicating that hybridization could
have played a role in the invasion of the two olive taxa. Yet,
196 © 2013 The Authors. Evolutionary Applications published by John Wiley & Sons Ltd 7 (2014) 195–211
History of the invasive African olive tree Besnard et al.

this hypothesis was strongly criticized by other authors
(Breton et al. 2008), who argued that these two subspecies
are not in contact in the invasive range. Furthermore, Bes-
nard et al. (2007a) found that the NSW cuspidata popula-
tion displayed reduced genetic diversity compared with a
native population from South Africa, suggesting a strong
bottleneck during the introduction in Australia. The
genetic diversity found in the Hawaiian population was
even lower than in NSW. The hypothesis of sequential
introductions was stated but still needs to be tested. Under
this scenario, the first introductions may have occurred
from southern Africa to NSW, and then, NSW may have
been a source of invaders for other regions such as the
Hawaii archipelago (Spennemann and Allen 2000; Starr
et al. 2003; Besnard et al. 2007a).
Recent advances in population genetics have generated
methods to reconstruct the past demographic history of
species. Coalescent theory and Bayesian analysis have pro-
vided a major framework that led to the development of
several inferential methods to study changes in population
size (Hudson 1990; Beaumont 1999). In many cases, the
methods were computationally very demanding even for
simple models (full-likelihood methods). More recently, an
alternative framework, called approximate Bayesian com-
putation (ABC; Beaumont et al. 2002), has emerged. This
flexible framework has been particularly successful for the
estimation of population parameters under complex demo-
graphic histories, especially to investigate the recent coloni-
zation history of invasive species (Pascual et al. 2007;
Beaumont 2010; Csill�ery et al. 2010; Estoup and Guille-
maud 2010; Estoup et al. 2010; Lombaert et al. 2011; Sousa
et al. 2012).
The purpose of our study was to examine the origins
and spread of invasive olives in Australia and Hawaii
using both plastid and nuclear markers. A large sample of
invasive and native accessions was characterized and pro-
vided strong evidence for the Mediterranean (europaea)
and African (cuspidata) origins of Australian invasive
olives as well as for putative admixture between the sub-
species. Then, we used an ABC framework to identify the
most probable among different colonization scenarios and
to infer several key parameters of the foundation history
of olives in East Australia and Hawaii (e.g. duration of
bottlenecks, effective number of founders). Because of the
multiple introductions of Mediterranean cultivars (clones)
from various geographic origins to Australia, probably in
numerous sites over the last 200 years, it appears difficult
at this stage to model the complex origin of invasive
European olive. The presented ABC analyses were thus
only applied to reconstruct the demographic history of
the invasive African olive in Australia and Hawaii, which
seems to be much simpler, based on the results from the
previous and present studies.
Material and methods
Plant sampling
We previously showed that invasive olive populations from
South Australia and NSW have probably derived from
introductions of Mediterranean and southern African trees
(Besnard et al. 2007a,b). To better document the geo-
graphic origins of invasive populations, we used both plas-
tid and nuclear DNA markers to characterize native and
invasive trees of both subspecies cuspidata and europaea.
For each marker, we used a different sample of trees.
First, the plastid DNA (cpDNA) variation was investi-
gated on a large sample of trees (2126 individuals). A recent
study reported cpDNA haplotype profiles for 1797 trees of
subsp. europaea (including 534 Mediterranean cultivars
and 1263 oleasters; Besnard et al. 2013). Here, we charac-
terized 81 accessions from 30 locations covering the whole
native range of the African olive (Table S1) and representa-
tive of lineages A, C1 and C2 (Besnard et al. 2007b). In
addition, 244 individuals from 11 locations were sampled
in the invasive olive range (Table S1): ten locations in Aus-
tralia (NSW locations: Bringelly, Luddenham, Mount An-
nan, Camden Park, Harpers Hill, Ravensworth, Maitland
Park; South Australia locations: Shepherds Hill, Lonsdale,
Brownhill Creek; Fig. 1) and one location in Hawaii
(Maui). Lastly, to test for putative multiple origins of pop-
ulations of African olive in its whole invasive range (GISD
2010), four additional herbarium cuspidata samples from
Raoul Island, Auckland Bay, Norfolk Island and Saint Hel-
ena Island were also characterized (Table S1).
Second, to investigate the colonization history of invasive
populations, we analysed a subsample of 332 trees with
nuclear microsatellites (see below). The 11 invasive popula-
tions from Australia (218 individuals) and Hawaii (26 indi-
viduals) were characterized and compared with putative
source gene pools from the native range, namely the Cape
Town location for the African olive (20 individuals), and a
set of Mediterranean cultivars for subsp. europaea. The 68
Mediterranean cultivated accessions are listed in Table S2.
They were chosen to represent cultivars from the East, Cen-
tral and West Mediterranean gene pools (Haouane et al.
2012). Four invasive locations (i.e. Bringelly, Brownhill
Creek, Lonsdale and Maui) were partially characterized
with eight nuclear microsatellite markers in a previous
study (Besnard et al. 2007a).
In continental Australia, the three main areas invaded by
olive trees – Adelaide hills (sites A-C; South Australia),
Cumberland plain (sites D-G; NSW) and Central Hunter
region (sites H-J; NSW) – were thus sampled (Cuneo and
Leishman 2006) and analysed with both plastid and nuclear
markers. Among locations of Cumberland plain, Camden
Park is considered as an initial introduction site for culti-
vated olives (subsp. europaea) in eastern Australia during
© 2013 The Authors. Evolutionary Applications published by John Wiley & Sons Ltd 7 (2014) 195–211 197
Besnard et al. History of the invasive African olive tree

the early 18th century (Dellow et al. 1987; P. Cuneo, per-
sonal observation), and there, the Mediterranean taxon was
probably in contact with subsp. cuspidata. Trees from this
park are unusually big, and many trees are considered to be
more than 100 years old; most of them (22/25) were male
sterile (P. Cuneo, personal observation; observations per-
formed in November 2010), producing nondehiscent pol-
len with of mix of tetrads and aborted microspores
[reported as phenotype ms2 by Besnard et al. (2000)].
Genetic characterizations
Genomic DNA of each individual was extracted from c.
20 mg of silica-dried leaf using the Plant-DNeasy Minikit
(QIAGEN Inc., GmbH, Hilden, Germany). The plastid gen-
ome is maternally inherited in olive, and strong geographic
patterns of cpDNA variation have been observed making it
very useful for identifying the origins of introduced mate-
rial (Besnard et al. 2000, 2011). For an optimal identifica-
tion of cpDNA haplotypes (or chlorotypes) among all
sampled accessions, 64 cpDNA loci (i.e. microsatellites,
indels and single-nucleotide substitutions) were first inves-
tigated as reported by Besnard et al. (2011). The genetic
diversity within invasive populations and putative source
gene pools was then investigated with eleven nuclear
microsatellite loci [or simple sequence repeats (SSRs)]:
ssrOeUA–DCA1, ssrOeUA–DCA3, ssrOeUA–DCA5, ssr-
OeUA–DCA8, ssrOeUA–DCA9, ssrOeUA–DCA14, ssrOeUA–DCA15, ssrOeUA–DCA18 (Sefc et al. 2000), EMO03 (de la
Rosa et al. 2002), GAPU71A (Carriero et al. 2002) and PA
(ATT)2 (Saumitou-Laprade et al. 2000). These loci were
chosen for their high-to-moderate polymorphism level
(e.g. HT ranging from 0.40 to 0.95 in native populations)
and a low frequency of null alleles in previous studies (Bes-
nard et al. 2007a). For each locus, the forward primer was
labelled with a fluorochrome. Two types of fluorochromes
Figure 1 Geographical locations of the ten populations sampled in Australia and detected chlorotypes form the whole invasive range. A = Lonsdale,
B = Shepherds Hill, C = Brownhill Creek, D = Camden Park, E = Mount Annan, F = Bringelly, G = Luddenham, H = Maitland Park, I = Harpers Hill
and J = Ravensworth. The frequency of chlorotypes found at each location is indicated. Size of pie charts is proportional to the number of individuals
analysed.
198 © 2013 The Authors. Evolutionary Applications published by John Wiley & Sons Ltd 7 (2014) 195–211
History of the invasive African olive tree Besnard et al.

were used: HEX (green) and FAM (blue). Amplification of
each locus was performed separately using previously
described procedures (Baali-Cherif and Besnard 2005).
Three-locus multiplexes were prepared [i.e. PA(ATT)2/
DCA08/DCA09/DCA01/DCA03, DCA18/DCA05/GAPUI71A
and DCA14/EMO03/DCA15] to which 0.02 ll of ROX-500(Applied Biosystems, Foster City, CA, USA) was added as a
reference for the size of DNA segments. Electrophoresis of
PCR products was performed using an ABI PRISM� 3100
Genetic Analyzer (Applied Biosystems), and allele size of
each locus was then determined with GeneMapper.
Data analyses
Plastid haplotype networks
A plastid DNA profile (chlorotype) was defined for each
African olive accession by the combination of alleles from
all plastid loci. Based on these data, the relationships
among chlorotypes were visualized by constructing a
reduced median network implemented in NETWORK version
4.112 (Bandelt et al. 1999). Multistate microsatellites were
treated as ordered alleles and coded by the number of
repeated motifs for each allele (e.g. number of T or A),
whereas the presence or absence of other indels was coded
as 1 and 0, respectively. Basically, this coding strategy
assumes that variation at cpDNA microsatellites is mainly
due to single-step mutations (e.g. Besnard et al. 2007b),
while allowing consideration of length polymorphisms (mi-
crosatellites or indels) with similar weight. The analysis was
performed on the whole cuspidata data set and then only
on sub-Saharan chlorotypes (lineage A).
For the Mediterranean subspecies, we only detected
chlorotypes already reported in the cultivated olive (see
below) by Besnard et al. (2013), who reconstructed the
whole haplotype network for that subspecies. We thus refer
readers to this study.
Population genetic analyses
First, parameters of genetic diversity in the investigated
populations or gene pools (i.e. cultivars) were estimated.
The observed heterozygosity (HO), the expected heterozy-
gosity (HS) and FIS were calculated from allele frequencies
at each nuclear SSR locus using FSTAT version 2.9.4 (Goudet
2005). Significance of FIS was tested by estimating the 95%
confidence interval of the value for each population using
the bootstrap approach implemented in GENETIX (Belkhir
et al. 2004). To account for the difference in sample sizes,
allelic richness (RS) rather than the number of alleles was
also estimated using FSTAT. A Wilcoxon paired test (two-
sided) was then used to evaluate the significance of differ-
ences among genetic diversity measures between invasive
and native populations. Pairwise FST was also computed
using FSTAT between the ten invasive populations. Signifi-
cance of pairwise differentiation was assessed using Bonfer-
roni corrections. Relative contribution of gene flow by
pollen versus seeds (r) was estimated according to Ennos
(1994), but only in South Australia where substantial plas-
tid DNA diversity was observed (HT = 0.50; see results)
allowing estimating FST values for cytoplasmic markers.
STRUCTURE version 2.3.4 (Pritchard et al. 2000) was used
to estimate the number of genetic clusters in our data set.
This model-based clustering method uses multilocus geno-
type data to infer population structure and assign individu-
als to populations. Using the ad hoc DK statistic based on
the rate of change in the log probability of data between
successive K values, STRUCTURE can be used to identify the
number of genetic clusters (Evanno et al. 2005). For each K
value that was retained, each accession was assigned to each
cluster with a posterior membership coefficient (p).
Demographic models and introduction scenarios
An ABC approach was used to infer the recent colonization
history of invasive African olive in Australia and Hawaii. In
this study, we show that invasive trees of subsp. cuspidata
found in Australia and Hawaii were most probably intro-
duced from South Africa or at least belong to the same
genetic cluster (see below). We thus focused on this taxon
to determine which among several scenarios of sequential
colonization was the most probable. Only nuclear SSR data
were used for these inferences because plastid DNA loci
provide low variation among populations, especially in the
invasive range (see below). We used two different imple-
mentations but, due to space limits, only the implementa-
tion based on the DIYABC version 2.0 program (Cornuet
et al. submitted) is presented in detail here. The other
implementation uses the ms program (Hudson 2002),
which allows users to simulate extremely complex demo-
graphic histories, together with several in-house scripts and
published R packages (see Data S1 for details). Three
demographic scenarios or models were considered differing
in the order of introductions all from a South African
source (Fig. S1). In scenario 1, we assume a first introduc-
tion to Australia followed by a second introduction from
Australia to Hawaii. In scenario 2, we assume a first intro-
duction to Hawaii that is followed by second introduction
from Hawaii to Australia. Finally, in scenario 3, we assume
two independent introductions to Australia and Hawaii,
which may have been at different times. For each scenario,
several demographic parameters were defined: the current
effective population size (in units of diploid individuals,
not genes) for the three sampled populations (Ne1, Ne2 and
Ne3 for South Africa, Australia and Hawaii, respectively),
the number of founders in the introduced populations (N1
and N2, respectively, for the first and second colonization
events) and the duration of the initial bottleneck (dbi)
which may be seen as a latency phase assumed to have
© 2013 The Authors. Evolutionary Applications published by John Wiley & Sons Ltd 7 (2014) 195–211 199
Besnard et al. History of the invasive African olive tree

taken place just after the introduction events for the two
invasive populations (db1 and db2, respectively). We note
here that DIYABC only allows instantaneous population
size changes (i.e. no linear or exponential increase or
decrease). As a consequence, it is necessary to assume this
latency phase to discretize a population size increase that
may have been more gradual. Note also, that some authors
(e.g. Crooks and Soule 1999; Facon et al. 2006) have sug-
gested that invasive species have an initial ‘latency’ period
during which the population size remains relatively con-
stant and which is followed by a rapid growth. Finally, two
other parameters correspond to the two introduction
times, or split, for the two colonization events (respectively,
T1 and T2). Because the intensity of a bottleneck event
depends on both the number of effective individuals during
this event and the duration of the event, we also considered
a parameter combining two of the parameters already
mentioned, Ni and dbi. This parameter, Ki = Ni/dbi was
introduced by Wright et al. (2005) as a measure of the
bottleneck severity, and it was separately estimated for
Australian and Hawaiian populations (K1 and K2, respec-
tively). We note, however, that K is inversely related to
the severity of the bottleneck and that small values corre-
spond to severe bottlenecks and large values to less severe
bottlenecks.
For all these demographic parameters, prior distribu-
tions have been implemented according to the current
knowledge on invasive olive (Table 1). We used, for all
parameters, uniform distributions, represented by U[min,
max], where min and max are the lower and upper
bounds of the distribution. The prior distributions for
Ne1, Ne2 and Ne3 were set to U[104, 105] considering that
the size of populations is large in the studied areas (Starr
et al. 2003; Cuneo et al. 2009). For N1 and N2, we used U
[2, 50] as suggested by the putative strong bottleneck dur-
ing the olive introductions (Besnard et al. 2007a). For the
split parameters (T1 and T2), and for db1 and db2, we
used values between one and 40 generations (i.e. U[1, 40],
but see below for nonindependence issues) on the basis of
historical knowledge about the presence of African olive
in Australia and Hawaii (i.e. introduction during the last
200 years; Cuneo and Leishman 2006). We avoided the
difficulty of estimating the generation time of this tree
species by implementing a wide prior distribution. With
an introduction event in Australia estimated at the begin-
ning of 19th century, this prior encompasses short and
long generation times (i.e. from 5 to 200 years/genera-
tion). Note that T1, T2, db1 and db2 are not independent
as the order of the colonization imposes a constraint on
T2 (T2 < T1), whereas T1 can take any value within the
uniform prior defined above. Similarly, the latency peri-
ods cannot be longer than the colonization times (i.e.
T1 > db1 and T2 > db2).
We assumed that the SSRs evolved according to the
stepwise mutation model (SMM) with a uniform muta-
tion rate prior (l) bounded between 10�4 and 10�3 for
Table 1. Mean, median, mode and quantiles for demographic parame-
ters and mutation rate under scenario 1. These results were obtained
with DIYABC version 2.0 (Cornuet et al. submitted). Q2.5% and Q97.5%
are the 2.5% and 97.5% quantile values, respectively. All values were
estimated from 500 000 and 5000 simulated data for priors and poste-
riors, respectively. Modes were not given for Ne1, Ne2, Ne3, N1, N2 and
mu because their prior distributions were uniform.
Parameter Mean Median Mode Q2.5% Q97.5%
Ne1
Prior 54 994 55 017 – 12 248 97 754
Posterior 18 390 16 380 11 857 10 256 37 591
Ne2
Prior 54 988 54 963 – 12 255 97 778
Posterior 59 870 57 880 83 290 12 728 98 262
Ne3
Prior 54 985 55 007 – 12 230 97 771
Posterior 51 500 49 470 18 751 11 634 97 549
N1
Prior 26 26 – 3 49
Posterior 24.6 23.9 23.7 4.93 47.05
N2
Prior 26 26 – 3 49
Posterior 12.1 9.8 5.26 2.38 36.76
db1Prior 16 16 4 1 35
Posterior 7.7 6.9 5.53 1.43 19.9
db2Prior 11 9 1 1 29
Posterior 13.8 13.3 11.96 3.1 27.4
K1
Prior 3.45 1.52 0.99 0.15 21.5
Posterior 3.55 3.33 3.10 1.54 6.59
K2
Priors 5.37 2.58 1.01 0.23 33
Posterior 0.98 0.77 0.59 0.34 2.46
T1Prior 33 34 40 17 40
Posterior 35.5 36.6 39.2 23.9 40
T2Prior 22 22 23 5 37
Posterior 20.2 20 19.8 7.7 33.1
mu
Prior 5e-04 5.5e-04 – 1.2e-04 9.8e-04
Posterior 3.8e-04 3.6e-04 3.2e-04 1.3e-04 7.5e-04
Ne1, Ne2 and Ne3 = population effective sizes (number of individuals)
for South African, NSW and Hawaiian populations, respectively; N1 and
N2 = number of founders for the first and second colonization events
(in NSW and then Hawaii); db1 and db2 = duration of the initial bottle-
neck after introduction in NSW and Hawaii (number of generations),
respectively; K1 and K2 = intensity of the bottleneck in NSW and
Hawaii, respectively; T1 and T2 = introduction times for the two coloni-
zation events (number of generations); mu = SSR mutation rate per
locus and by geneation.
200 © 2013 The Authors. Evolutionary Applications published by John Wiley & Sons Ltd 7 (2014) 195–211
History of the invasive African olive tree Besnard et al.
all loci. In agreement with the STRUCTURE analysis (see
Results), NSW sampled populations were pooled and
analysed as a unique population with the exception of
29 individuals that were identified as early-generation
hybrids on the basis of the STRUCTURE inference (see
below). Nuclear SSR diversity within and between popula-
tions was summarized with 12 different summary statistics.
For the three populations, we computed nine within-
population statistics [mean number of alleles (A), mean
allele size variance (V) and mean heterozygosity across
loci (HT; Nei 1987) for each population] and three
between-population statistics, namely pairwise FST values
(Weir and Cockerham 1984). All these statistics were
computed using DIYABC.
To identify the most probable model, we computed the
posterior probability of the three scenarios above using a
logistic regression approach on the first 1% simulations
(Fagundes et al. 2007; Beaumont 2008). We then estimated
the posterior parameters for that model using the local lin-
ear regressions method of Beaumont et al. (2002). A logit
transformation was applied to ensure that the estimated
values were comprised within the prior limits (Cornuet
et al. 2008).
To validate the results of our ABC modelling approach,
we first simulated data under each of the three models and
applied the ABC algorithm to these data sets to determine
whether we would correctly identify the scenario under
which they were simulated. To do this, we used the ‘confi-
dence in model choice’ function, implemented in DIYABC,
which allowed us to estimate the proportion of type-1 and
type-2 errors. We also evaluated the sensitivity of our infer-
ences by testing different priors.
Finally, we evaluated a Bayesian equivalent of goodness
of fit of the selected scenario, using the model checking
option of DIYABC version 2.0 (Cornuet et al. submitted).
This option allows us to evaluate to what extent the
selected scenario and associated posterior distributions
are corroborated by the observed data. Briefly, if a
model-posterior combination fits the observed data cor-
rectly, then data simulated under this combination with
parameters drawn from posterior distributions should be
close to the observed data. In order for the model fit to
be considered good, the observed statistics had to fall
within the distributions of simulated statistics. We here
simulated 1000 data sets from the posterior distribution
of parameters obtained under scenario 1 to estimate such
distributions. Principal component analysis (PCA) applied
on test statistics vectors was also used as a mean to visu-
alize the fit between simulated and observed data sets. As
recommended by Cornuet et al. (2010), we used sum-
mary statistics as test statistics that were not used for
model selection or parameter estimation in previous ABC
treatments (Table S11).
Results
Maternal origins of invasive olives
In the Adelaide area (South Australia), we found three
Mediterranean chlorotypes (namely E1.1, E2.2 and E3.2),
while in the Sydney area (NSW), a mix of Mediterranean
(E1.1 and E3.2) and African chlorotypes (A.1 and A.2) were
detected as shown in Fig. 1 (see Table S3 for the profile of
each chlorotype). The three Mediterranean chlorotypes
have been previously reported in olive cultivars, although
E2.2 is not frequent (approximately 1%) in the cultivated
pool (Besnard et al. 2011, 2013). Chlorotypes A.1 and A.2
were also detected in the native range but only in the Cape
region, South Africa (Table S3). These two chlorotypes are
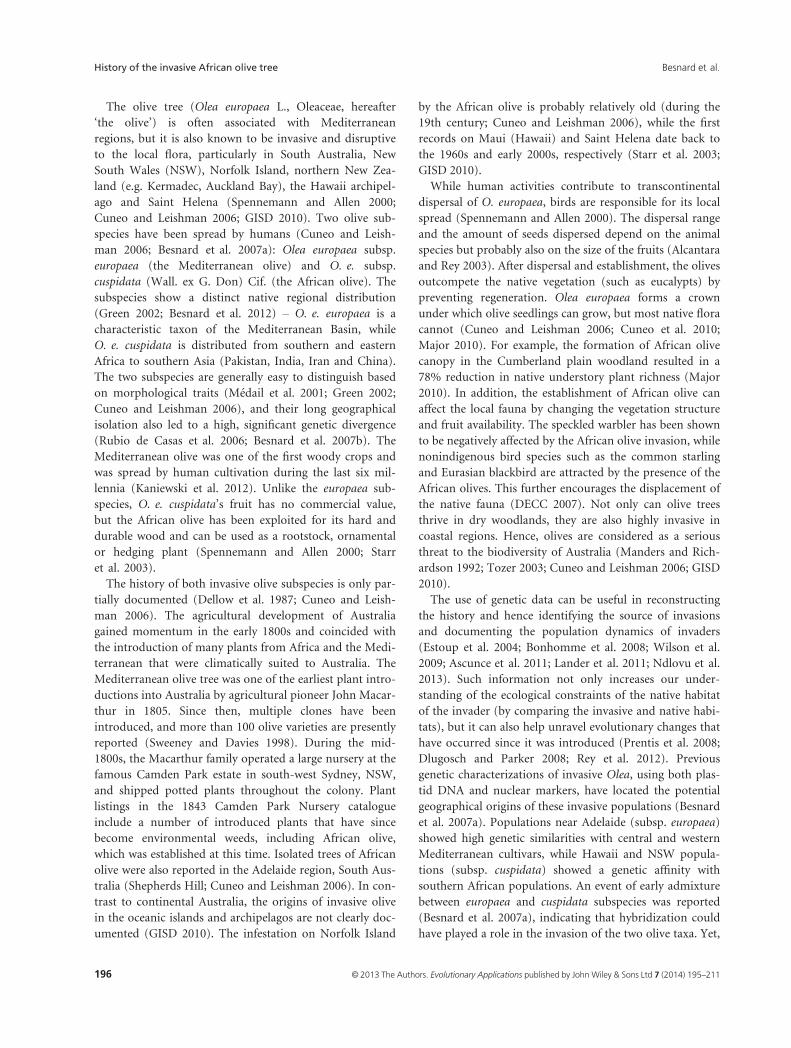
closely related (Fig. 2 and Fig. S2). In our invasive olive
sample, they co-occurred only in the Harpers Hill popula-
tion. Interestingly, the four herbarium African olive sam-
ples from northern New Zealand, Norfolk and Saint
Helena also showed the same chlorotypes A.1 and A.2
A.20
A.18 A.16
A.17A.15
A.21
A.19
A.4A.6
A.12
A.14
A.9
A.10A.5
A.1A.2
A.7
A.8
A.11A.3
KenyaTanzaniaMalawiMascareignes
Zimbabwe
Mozambique
South Africa1 muta on
step
A.13
Figure 2 Reduced median network (Bandelt et al. 1999) of the 21
chlorotypes detected in the African range of subsp. cuspidata (lineage
A; Besnard et al. 2007b). Each chlorotype is represented by a dot,
whose width is proportional to the number of occurrences in our sam-
ple. See Table S3 for chlorotype profiles and geographic origins. The
length of branches is proportional to the number of mutational steps.
The missing, intermediate nodes are indicated by small black points. For
each chlorotype, the country of origin is indicated by a specific colour.
The two African chlorotypes detected in NSW are indicated in red (A.1
and A.2; both were detected in the population of Cape Town, South
Africa).
© 2013 The Authors. Evolutionary Applications published by John Wiley & Sons Ltd 7 (2014) 195–211 201
Besnard et al. History of the invasive African olive tree

(Fig. 1). Populations from the Cumberland Plain mainly
harbour chlorotype A.1, except individual Bringelly no 21
(E1.1), Mt Annan no 17 (E3.2) and all Camden Park indi-
viduals which exhibit Mediterranean chlorotypes E1.1 or
E3.2. Twenty-three of 25 individuals sampled in Camden
Park displayed E3.2, and an examination of mature flowers
indicates a male sterility phenotype ms2 for all of them, but
one which was not flowering, as previously reported in
olive cultivars exhibiting E3 chlorotypes (formerly CCK;
Besnard et al. 2000).
Genetic structure of invasive populations based on
nuclear SSRs and plastid DNA lineages
Based on the complete nuclear SSR data set (Table S4), two
main clusters (E and C) were recognized in the STRUCTURE
analysis (Fig. 3): the first includes all Mediterranean culti-
vars and the South Australian individuals (Lonsdale, Shep-
herds Hill and Brownhill Creek; subsp. europaea), while the
second corresponds to native South African olive trees,
most individuals from NSW (Harpers Hill, Bringelly, Lud-
denham and Maitland Park) and Maui (subsp. cuspidata).
In the invasive range of the African olive, individuals from
Camden Park plus three individuals from Mount Annan
(no 2, 8 and 17) and one from Bringelly (no 21) were
assigned to both clusters C and E suggesting that they cor-
respond to admixed individuals (i.e. hybrids between sub-
species europaea and cuspidata). Two individuals from SA
(Lonsdale no 16 and 22) also appear to be admixed with a
percentage of assignment to cluster C of approximately 10–20%. The Mediterranean and African chloroplast lineages
match with the two clusters as all invasive individuals
assigned to cluster E and C with P > 0.8 show, respectively,
a chlorotype of europaea and cuspidata (Fig. S3). In con-
trast, all individuals exhibiting Mediterranean chlorotypes
in NSW (Camden Park, Bringelly no 21 and Mt Annan no
17) are admixed.
At K = 5, cultivars and invasive olives from South Aus-
tralia are relatively well distinguished into two clusters
(namely EN and EI), while most individuals from South
Africa, NSW and Maui are, respectively, assigned to a spe-
cific cluster (namely CSA, CNSW and CH). Note that at
K = 2, individuals from South Africa are not always
assigned to cluster C with a high P value (Fig. 3). This is
likely due to the strong genetic bottlenecks in invasive Afri-
can olive populations (for instance, many alleles initially
shared between europaea and cuspidata in the native range
could have been lost after bottlenecks and may bias assign-
ments). In contrast, at K = 5, no South African olive indi-
viduals are assigned to Mediterranean clusters with
P > 0.05, while admixture between E and C clusters is still
detected in the Camden Park population, one individual
from Bringelly (no. 21), three individuals from Mt Annan
(no. 2, 8 and 17) and two individuals from Lonsdale (no 16
and 22).
Pairwise FST between invasive populations confirmed the
main patterns observed with the Bayesian clustering
approach (Table S5). In particular, populations from South
Australia and NSW were clearly differentiated (FST ranging
from 0.28 to 0.33, when Camden Park is excluded). These
high levels of differentiation likely reflect the initial differ-
entiation between subspp. cuspidata and europaea (FSTbetween Cape Town and Mediterranean cultivars is 0.23;
P < 0.001). Yet, the genetic differentiation between Austra-
lian and Hawaiian populations of African olive exceeds
0.20 (Table S5) although all SSR alleles found in Maui were
also detected in NSW (Table S4).
Low variation in plastid DNA was detected in the inva-
sive populations of African olive (Fig. 1), and pairwise FSTvalues were thus only estimated for South Australian popu-
lations. Based on this maternal marker, the genetic differ-
entiation between South Australian populations ranged
from 0.21 to 0.39 (Table S5). The high differentiation
based on the plastid genome was unexpected as popula-
tions are in close proximity to each other (max. 16 km).
On the three South Australian populations, the relative
contribution of gene flow by pollen versus seeds (r = 49.8)
indicates that dispersal of pollen is more efficient than seeds
by several orders of magnitude at this small geographic
scale.
Genetic diversity of invasive and native populations based
on nuclear SSRs
The eleven nuclear SSR loci used were polymorphic, but
locus DCA15 was fixed in several populations of African
olive from South Africa, NSW and Hawaii. For the ten loci
that are polymorphic in both subspecies, the allelic richness
revealed in Cape Town was significantly higher than in the
set of 68 Mediterranean olive cultivars (Wilcoxon test:
P < 0.05; Table 2). In contrast, in the invasive range, the
South Australian population (subsp. europaea) displayed
higher allelic richness than NSW populations (subsp. cuspi-
data) but the difference was not significant (Wilcoxon test:
P = 0.16; Table 2). Compared with the putative native
sources (Cape Town and Mediterranean cultivars), a reduc-
tion in allelic richness was found in both Australian inva-
sive lineages (Wilcoxon tests: Cultivars/South Australia,
P < 0.05; Cape Town/New South Wales, P < 0.01;
Table 2); a reduction of 12.1% was revealed in the Mediter-
ranean olive (South Australia), while it was of 57.5% in the
African olive (NSW). The difference between Cape Town
and NSW was also significant for HS (P < 0.01; Table 2).
Among NSW locations, the population from Camden Park
displayed higher RS and HS values compared with all other
populations (Table S7), but the difference between Camden
202 © 2013 The Authors. Evolutionary Applications published by John Wiley & Sons Ltd 7 (2014) 195–211
History of the invasive African olive tree Besnard et al.
p
p
ENEICNSWCHCSA
EC
K = 2
K = 5
–3000
–2000
–1000
0
1000
2000
3000
4000
5000
6000
7000
0 1 2 3 4 5 6 7 8 9 10 11 12 13 14 15K
Ln(K)
0
2
4
6
8
10
12
14
0 1 2 3 4 5 6 7 8 9 10 11 12 13 14 15K
ΔK
SouthernAustralia
Mediterranean cpDNA haplotype South African cpDNA haplotype* *
New South Wales
Med
iterr
anea
ncu
lva
rs
Cam
den
Park
Cape
, Sou
th A
fric
a
Mau
i
(A)
(C)
(B)
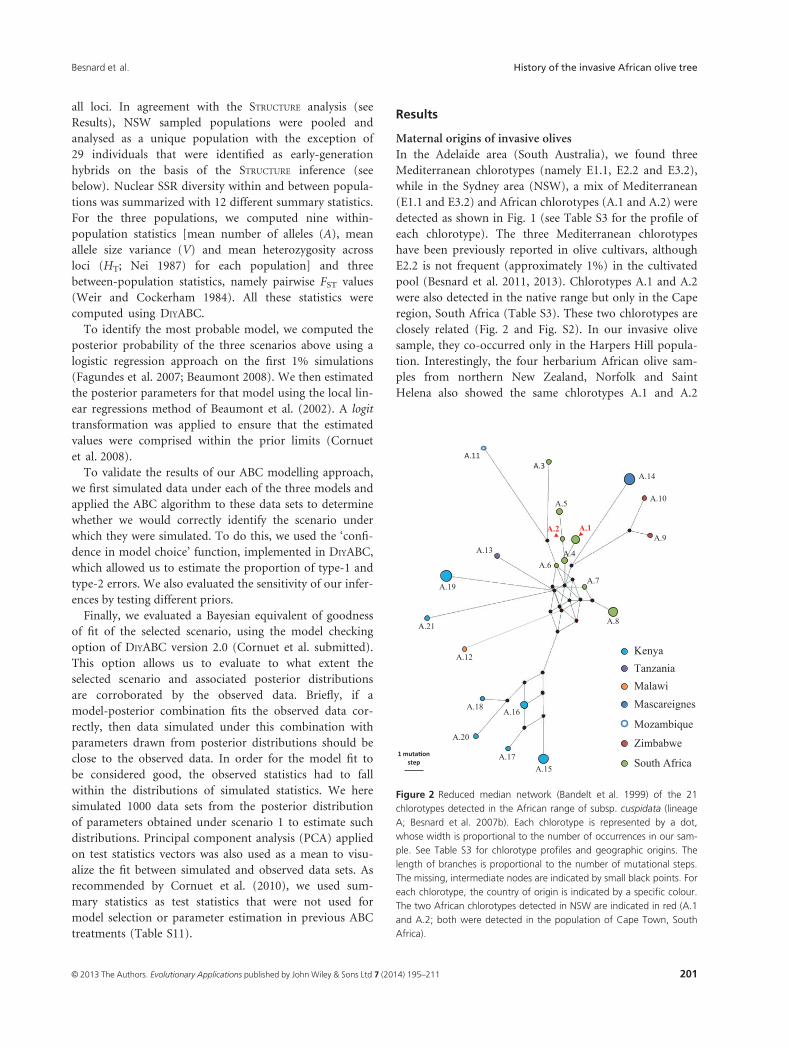
Figure 3 Inference of population structure in native and invasive olive accessions based on 11 nuclear SSRs and using Bayesian simulations with
STRUCTURE (Pritchard et al. 2000). (A) Absolute values of the second-order rate of change of the likelihood distribution divided by the s.d. of the likeli-
hoods (DK) for each K value; (B) Mean log likelihood [Ln(K) � SD] averaged over the ten iterations for each K value; (C) Barplot of the STRUCTURE analy-
sis based on the best two K values (i.e. 2 and 5) according to Ln(K) and DK criteria (Evanno et al. 2005). The percentage of assignment of each
individual to the clusters averaged over ten iterations is shown. Each vertical bar represents an individual. The chloroplast lineages match with the
two clusters defined on nuclear SSRs except for admixed individuals (*indicate Mt Annan no 17 and Bringelly no 21). At K = 2, clusters E and C reflect
the strong genetic differentiation between subspecies europaea and cuspidata, respectively. At K = 5, native and invasive Mediterranean olives are
mostly assigned to clusters EN and EI, respectively. Similarly, African olive individuals from South Africa, NSW and Hawaii are mostly assigned to three
distinct clusters, namely CSA, CNSW and CH.
© 2013 The Authors. Evolutionary Applications published by John Wiley & Sons Ltd 7 (2014) 195–211 203
Besnard et al. History of the invasive African olive tree

Park and NSW (excluding admixed individuals) was signif-
icant only for HS (Wilcoxon test: P < 0.05). In addition,
the population from Maui (Hawaii) was particularly genet-
ically impoverished (Table S7; see also Besnard et al.
2007a) and showed a significantly lower allelic richness and
gene diversity that in African olives from NSW (Wilcoxon
tests: P < 0.05 and P < 0.01, respectively).
Demographic models and introduction scenarios
The ABC analyses, based on nuclear markers, allowed us to
discriminate among the three tested introduction scenarios
for the invasive African olive. From a total of 105 simula-
tions performed under each scenario, scenario 1 was
selected with a posterior probability close to one hence
favouring a sequential scenario with a first introduction
into Australia followed by an introduction into Hawaii
from Australia. The proportion of type-1 and type-2 errors
were estimated (Table S8). Type-1 errors are around 0.14
for scenario 1, whereas the type-2 error ranged from 0.02
to 0.10. The results were similar for scenario 2, whereas
both types of error were almost zero for scenario 3. These
simulations show that the three scenarios are unlikely to be
identified as the most probable scenario when they are
indeed not the true scenarios and they are typically selected
when they are the true scenarios. Altogether, this validation
provides us with strong confidence in our model choice
results.
Because scenario 1 was identified as the most probable,
posterior distributions for the parameters of interest were
inferred for this scenario only. Figure 4 shows the priors
and posteriors for all parameters, and Table 1 provides the
Table 2. Allele size range (in bp), number of alleles (Na), allelic richness (RS for 20 individuals), observed heterozygosity (HO), total diversity (HS) for
each nuclear SSR locus for native and invasive trees of subspp. europaea (Mediterranean olive) and cuspidata (African olive).
Locus
Mediterranean cultivars (native europaea) South Australia* (invasive europaea)
Allele size range Na RS HO HS Allele size range Na RS HO HS
DCA1 208–272 12 6.48 0.75 0.64 208–278 8 5.67 0.78 0.74
DCA3 233–257 11 8.14 0.93 0.86 235–255 7 5.69 0.78 0.76
DCA5 195–215 9 6.95 0.46 0.47 195–209 8 6.72 0.77 0.76
DCA8 127–159 14 9.77 0.93 0.83 127–153 11 9.56 0.85 0.88
DCA9 163–209 16 11.13 0.88 0.85 163–213 14 10.06 0.85 0.87
DCA14 170–190 12 7.89 0.81 0.69 149–190 9 6.25 0.76 0.70
DCA15 247–271 7 4.76 0.77 0.65 247–271 5 4.44 0.71 0.72
DCA18 162–186 12 9.31 0.91 0.86 168–184 8 7.42 0.77 0.84
EMO3 213–226 10 7.92 0.93 0.81 213–226 8 6.55 0.79 0.82
GAPU71A 211–243 9 5.35 0.53 0.47 211–233 6 4.93 0.62 0.61
PA(ATT)2 106–124 6 5.29 0.82 0.77 106–124 6 5.87 0.77 0.78
Average† – 11.1 7.82 0.80‡ 0.73 – 8.5 6.87 0.77 0.78
Locus
Cape Town (native cuspidata) New South Wales* (invasive cuspidata)
Allele size range Na RS HO HS Allele size range Na RS HO HS
DCA1 214–278 20 20.00 0.90 0.95 214–260 8 6.52 0.77 0.77
DCA3 231–281 13 13.00 0.75 0.74 233–237 2 2.00 0.24 0.34
DCA5 196–202 3 3.00 0.40 0.48 200–202 2 2.00 0.33 0.32
DCA8 119–181 21 21.00 0.95 0.94 123–143 11 4.97 0.44 0.44
DCA9 167–215 12 12.00 0.80 0.83 167–237 14 10.35 0.80 0.87
DCA14 146–152 7 7.00 0.75 0.79 145–150 6 4.97 0.75 0.68
DCA15 247 1 1.00 – – 247 1 1.00 – –
DCA18 160–260 21 21.00 0.80 0.96 164–220 16 10.10 0.78 0.86
EMO3 200–219 14 14.00 0.90 0.93 207–213 5 4.48 0.60 0.67
GAPU71A 209–255 14 14.00 0.90 0.93 213–249 9 6.87 0.74 0.76
PA(ATT)2 100–118 5 5.00 0.40 0.39 100–118 4 3.00 0.46 0.45
Average† – 13.0 13.00 0.76 0.79 – 7.7 5.53 0.59 0.62
*Excluding admixed individuals.
†DCA15 was not considered to compute average values because not variable in subsp. cuspidata.
‡The FIS value was significantly different from 0 only for cultivars (FIS = �0.103; CI 95% = [�0.140 to �0.081]), for which the value was significantly
negative. This result indicates heterozygous excess, probably due to human selection of early-generation admixed genotypes, maintained by clonal
growth over long period of times.
204 © 2013 The Authors. Evolutionary Applications published by John Wiley & Sons Ltd 7 (2014) 195–211
History of the invasive African olive tree Besnard et al.

mean, median and mode estimated for these distributions.
For some parameters, the posterior differs noticeably from
the prior (e.g. N2, Ne1; Fig. 4A,B). This suggests that the
genetic data contain substantial information to estimate
these demographic parameters. For other parameters (e.g.
Ne2; Fig. 4B), little information seems to be provided
beyond that present in the prior. We focus on modal values
below, but are aware that the distributions are sometimes
wide and that no single estimate (mean, median or mode)
fully summarizes our results.
As Fig. 4A shows, the posterior for N1 is not very differ-
ent from the prior, but tends to exclude extreme values and
favour the central values with a mode around 20–25 indi-
viduals introduced to Australia. For N2, the situation is dif-
ferent with small values clearly having a stronger support,
suggesting that less than ten individuals were introduced
into Hawaii. For the bottleneck severity in Australia (K1),
the posterior distribution favours values close to 3 and dis-
plays a peak at 3.10. For Hawaii (K2), the posterior distri-
bution displays values lower than 1 and shows a peak at
0.59 indicating a more severe bottleneck than in Australia
(Fig. 4E). For the current population effective size parame-
ters (Ne1, Ne2 and Ne3; Fig. 4B), the posterior distributions
show different patterns. For the South African population
(Ne1), the analysis suggests that values on the lower end of
the distributions are more likely, whereas for the Australian
and Hawaiian populations (Ne2 and Ne3), the posteriors
are very wide and provide no clear information. Regarding
the ‘latency phase’ or duration of the bottleneck, the results
are difficult to interpret. In Australia, the db1 posterior
exhibits a clear peak at the lower end (a modal value
between 2 and 6) and stronger support compared with the
prior for most values below 10–15 generations, hence sup-
porting a rather short ‘latency phase’ if any (Fig. 4C). In
Hawaii, however, the posterior is shifted towards larger val-
ues compared with the prior, with a modal value around
12 generations.
For T1, the time at which olives were introduced in
Australia, we find a mode around 39 generations, which
is close to the upper limit of our prior (Fig. 4D). The
two distributions (prior and posterior) are similar, but
the posterior still seems to provide no support for values
below 20 generations (with a mean generation time of
5 years, that would correspond to 100 years) and thus to
favour an old rather than a recent event. The second
introduction time (T2, to Hawaii) exhibits a posterior
which is also not very different from the prior and seems
to favour slightly more recent event compared with the
prior, perhaps around 19 generations ago but caution is
clearly required here (Fig. 4D).
Note that we obtained similar results with the second
ABC approach. This is described and discussed in the sup-
plementary information (Data S1).
Precision on parameter estimations, sensitivity to priors
and robustness of inference
Several measures of bias and error were computed from
pseudo-observed data. We found a positive bias for most
parameters with small values (< 0.1) for the split times (T1
and T2), values between 0.1 and 0.3 for the number of
founders (N1 and N2) and Ne1, and higher values (between
0.3 and 0.5) for Ne2 and Ne3 (Table S9). The values of the
root of the relative mean square error (RRMSE) followed
the same trend with larger errors for Ne2 and Ne3 and smal-
ler RRMSE values for T1 and T2 which were therefore rea-
sonably estimated (Table S10). Table S11 and Fig. S4 show
the results of the model checking computation. The PCA
representation of model checking exhibits a rather good
recovery of the posterior predictive distribution and the
observed data, showing a certain confidence in the ‘good-
ness of fit’ of our inference (Fig. S4). Numerical results
indicate, however, a substantial excess of test statistics
showing probabilities in the tail areas (i.e. 6 over 24 test
statistics; Table S11). This suggests that the selected sce-
nario and associated posterior distributions are not that
well corroborated by the observed data and hence that our
model-posterior combination probably misses some
aspects of the real evolutionary history. When we used dif-
ferent priors, some of the results changed, whereas some
parameters provided similar posteriors (Table S12). For
instance, we found limited effect on the posterior distribu-
tions for the number of founders (N1 and N2), the severity
of bottleneck (K1 and K2) and the split times (T1 and T2),
whereas some effects could be noted on the three current
effective size parameters (Ne1, Ne2 and Ne3). Altogether,
this suggests that while some of our results should be inter-
preted with care (especially the effective size of popula-
tions), the results on N1, N2, K1, K2, T1 and T2 may be
more reliable.
Discussion
Two olive taxa have been introduced in the invasive range
Our genetic analysis confirmed that all invasive olive
populations sampled until now originated from two dis-
tinct taxa, as first suggested by Besnard et al. (2007a) on
a smaller tree sample. First, the cpDNA variation (Fig. 1)
shows that South Australian olive populations have three
Mediterranean chlorotypes (which are detected in Medi-
terranean olive cultivars; Besnard et al. 2011), while pop-
ulations from NSW (with the exception of Camden Park,
Mount Annan no. 17 and Bringelly no. 21) and Maui
display two African chlorotypes. Interestingly, African
olive individuals from northern New Zealand (Kermadec,
Auckland Bay), Norfolk and Saint Helena exhibit the
same two chlorotypes as NSW and Maui populations,
© 2013 The Authors. Evolutionary Applications published by John Wiley & Sons Ltd 7 (2014) 195–211 205
Besnard et al. History of the invasive African olive tree

Dens
ity
Dens
ity
Effective population sizeNumber of individuals
Dens
ity
Number of generations
Dens
ity
Number of generations
Dens
ity
Intensity of bottleneck (N/db)
(A) (B)
(C)
(E)
(D)
Figure 4 Prior and posterior density curves for all demographic parameters. All posterior and prior densities were computed with DIYABC version 2.0
(Cornuet et al. submitted) and were estimated from 500 000 and 5000 samples, respectively (i.e. the best 1% of the 500 000 simulated data). A.
Effective numbers of founding individuals in the invasive range (N1 and N2); B. Effective population size in number of individuals in both native (Ne1)
and invasive (Ne2 and Ne3) ranges; (C) Latency phase after introduction in the invasive range (db1 and db2; in number of generations); (D) Number of
generations since introduction to NSW, Australia (T1), and since second introduction to Maui, Hawaii (T2); E. Severity of the bottleneck during the first
and the second events of introduction (K1 and K2).
206 © 2013 The Authors. Evolutionary Applications published by John Wiley & Sons Ltd 7 (2014) 195–211
History of the invasive African olive tree Besnard et al.

suggesting a common origin. These two chlorotypes are
closely related (Fig. 2 and Fig. S2), and in the native
range, they were only detected in the Cape Town popula-
tion. The introduction of African olive from South Africa
to the invasive range is strongly supported by these data.
Second, the STRUCTURE analysis based on nuclear SSRs
(Fig. 3) confirms that invasive olive populations in South
Australia and NSW are closely related to Mediterranean
cultivars and South African Olives, respectively. These
results indicate a strong congruence between plastid and
nuclear genetic patterns although gene dispersal by pollen
is more efficient than by seeds by several orders of mag-
nitude (i.e. about 50 times in South Australian popula-
tions). Genetic data are thus powerful tools to trace the
invasion of the two olive lineages, particularly to test for
admixture events (see below).
Admixture between the two olive subspecies can be locally
high
In South Australia, we initially suspected that Shepherds
Hill could be a putative site of simultaneous introductions
for both Mediterranean and African olives. Indeed, while
the Mediterranean subspecies is highly invasive in South
Australia, the African olive has been reported to have also
naturalized at Shepherds Hill (in Cuneo and Leishman
2006). Although no early admixture event has been
detected at this location, two hybrids of early generation
were detected at Lonsdale (located at approximately 12 km
from Shepherds Hill) confirming the initial hypothesis that
the African subspecies has naturalized in this region and
exchanged genes with the Mediterranean olive in South
Australia.
In NSW, our results indicate that Camden Park is a
hybrid population as all individuals display alleles from
subspp. cuspidata and europaea. The occurrence of two
chlorotypes suggests that at least two cultivars of subspecies
europaea have been involved in the constitution of the
Camden Park population. The population of Camden Park
should be relatively old if we consider the size of trees, and
hybridization may have occurred during the first steps of
the African olive invasion in NSW. Camden Park is highly
differentiated from other East Australian populations,
despite close proximity to some of them (Table S5). This
could be due to some limitations for gene flow between
Camden Park and other populations. Particularly, chloro-
type E3.2 is very frequent in Camden Park (23/25), and our
observations confirmed that this cytoplasm is associated
with male sterility (see Besnard et al. 2000). This means
that pollen gene flow from Camden Park is highly reduced.
The lack of dispersal for pollen coupled with low capacity
of fruit dispersal (as shown here in South Australian popu-
lations) may contribute to the highly reduced gene flow
from Camden Park to other invasive populations. Only
three early-generation hybrids were detected at Mount An-
nan, a NSW population only 4–5 km away from Camden
Park, and clearly, panmixia is not attained between these
two adjacent populations.
Species distribution modelling has recently suggested
that the current habitat in NSW is more suitable for the
African olive, while habitat in South Australia is more
suitable for the Mediterranean olive (J. Cornuault, A.
Khimoun, P. Cuneo and G. Besnard, in preparation). We
can thus suspect that subsp. cuspidata is not well adapted
to South Australia and subsp. europaea is not well adapted
to NSW, consistent with our finding that these two subspe-
cies are dominant in the location predicted to be optimal.
This means that ecological requirements may drive the
local success of each olive subspecies. Due to the domi-
nance of one taxon over the other, early-generation hybrids
are expected to be rare on the front of invasion, and
advanced generations, if any, are expected to be back-
crossed to the dominant subspecies.
Evidence for genetic erosion due to recurrent bottlenecks
in the invasive African olive range
Plastid DNA data indicate that the invasive African olive
has been introduced from South Africa (see above). In
addition, all nuclear SSR alleles detected in Maui were also
present in NSW, suggesting that NSW could have been a
source for secondary invasions. Our ABC analysis gave a
strong posterior support to this scenario with sequential
introductions (Fig. S1, Table S8) and rejected independent
colonization of Australia and Hawaii. Thus, the previous
statement of Besnard et al. (2007a) of a sequential coloni-
zation of Hawaii from Australia is validated.
Compared with putative native sources, both invasive
olive subspecies have experienced a significant reduction in
diversity in Australia (Table 2), but a stronger bottleneck
was detected in NSW than South Australia (see also Bes-
nard et al. 2007a). This may be due to an introduction of a
limited number of trees from South Africa (from at least
two mother trees as indicated by the presence of two dis-
tinct African chlorotypes). Consistently, both ABC analyses
indicate that the number of founder trees in NSW was less
than 30 individuals, and the secondary invasion to Hawaii
resulted from an even more reduced number of founder
trees from NSW (less than 10 individuals). Our simulations
also indicate that the bottleneck was more severe in Hawaii
(K = 0.59) than in Australia (K = 3.10; Table 1). The esti-
mates of the number of generations since introduction sup-
ported an early introduction in NSW (T1 > 35
generations) and a more recent introduction in Hawaii
(T2 < 20 generations) and this was supported by the two
ABC analyses that we performed (See Data S1). Altogether,
© 2013 The Authors. Evolutionary Applications published by John Wiley & Sons Ltd 7 (2014) 195–211 207
Besnard et al. History of the invasive African olive tree

congruence between the two different ABC approaches
used, and the robustness of posterior to changes in the
priors suggests a certain confidence in our results and
shows the utility of comparing several methods to validate
inferences. Our results also suggest that the mean genera-
tion time is relatively short in the invaded range (approxi-
mately 5 years, considering an initial introduction to NSW
about 200 years ago).
While we strongly support the use of model-based
approaches such ABC modelling, we would like to point at
several limitations of the ABC approach as applied here and
elsewhere. The first is that DIYABC and in fact most popula-
tion genetics models assume nonoverlapping generations,
which is unlikely to hold for long-living organism such as
the olive tree. How this would affect our results is unclear,
but it suggests that a specific modelling framework should
be developed to study the effect of long-living organisms on
the estimation of population genetics parameters. Another
related issue is that both DIYABC and ms approaches ignore
the fact that the introduction of one olive tree may actually
correspond to the introduction of one female fertilized by
several males (due to the introduction either of trees
bearing fruits, or seed sets collected on a few mothers). This
means that the number of founders estimated here and the
values obtained for several parameters should be considered
cautiously. Altogether, we believe that our results should be
taken as a first step towards a better understanding of the
details of the invasion of several regions by the olive.
Concluding remarks and recommendations on the
invasive olive management
An important result of our study is to conclusively resolve
the issue of O. europaea hybridization raised by Breton
et al. (2008), who stated that natural hybridizations
between europaea and cuspidata subspecies were very unli-
kely to occur in Australia. Here, we have strong evidence
for hybridization in early introduction sites in both NSW
and South Australia. Hybridization is putatively an impor-
tant process during the olive invasion. This phenomenon
could have reduced the negative effects linked to the loss of
genetic diversity that occurred via successive bottlenecks
during the initial colonization events and also helped pop-
ulations to better adapt to new environments (Ellstrand
and Schierenbeck 2000; Figueroa et al. 2003; Facon et al.
2006; Keller and Taylor 2010). Additional investigations
are necessary to determine whether trees at the invasion
front represent introgressed genomes and are responsible
for adaptation to local conditions. In addition, with the
increased cultivation of subspecies europaea throughout
eastern Australia, there is increased potential for hybridiza-
tion and new recombinations with existing invasive popu-
lations of subspecies cuspidata. The impact of this
phenomenon on the olive invasiveness could be also
assessed in the future.
Considering another practical aspect, it is also important
to note that low population size and successive bottlenecks
did not preclude olive invasion, particularly on the Hawaiian
archipelago. Such phenomenon has been already reported
on other invasive organisms and could allow a rapid evolu-
tion of adaptive traits (e.g. Dlugosch and Parker 2008). For
the management of invasive populations, our study shows
the necessity to take rapid decision to stop or limit invasion.
Even with a very small introduced population, of the order
of ten individuals (and probably fewer), the risk of an inva-
sion in large scale is real and deserves to be considered.
Acknowledgements
We thank Stephen McLeod for plant sampling, Silvana del
Vecchio and Ng LZ (Reuben) for their help in the labora-
tory and Jordi Salmona for helpful discussion on the ABC
analyses. This work was partially funded by the Intra-Euro-
pean fellowship PIEF-GA-2008-220813 to GB. This work
has been conducted at Imperial College London (Silwood
Park) and the laboratory EDB, part of the LABEX entitled
TULIP (ANR-10-LABX-41). Herbarium specimens were
provided by Kew Gardens and the British Museum of Nat-
ural History. We thank two referees and A. Estoup for their
suggestions which helped us to clarify and improve the
manuscript.
Literature cited
Alcantara, J. M., and P. J. Rey 2003. Conflicting selection pressures on
seed size: evolutionary ecology of fruit size in a bird-dispersed tree,
Olea europaea. Journal of Evolutionary Biology 16:1168–1176.
Ascunce, M. S., C. C. Yang, J. Oakey et al. 2011. Global invasion history
of the fire ant Solenopsis invicta. Science 331:1066–1068.
Baali-Cherif, D., and G. Besnard 2005. High genetic diversity and clonal
growth in relict populations of Olea europaea subsp. laperrinei (Olea-
ceae) from Hoggar, Algeria. Annals of Botany 96:823–830.
Bandelt, H. J., P. Forster, and A. R€ohl 1999. Median-joining networks
for inferring intraspecific phylogenies. Molecular Biology and Evolu-
tion 16:37–48.
Beaumont, M. A. 1999. Detecting population expansion and decline
using microsatellites. Genetics 153:2013–2029.
Beaumont, M. A. 2008. Joint determination of topology, divergence time
and immigration in population trees. In S. Matsumura, P. Forster,
and C. Renfrew, eds. Simulations, Genetics and Human Prehistory,
pp. 135–154. McDonald, Cambridge, UK.
Beaumont, M. A. 2010. Approximate Bayesian computation in evolution
and ecology. Annual Review of Ecology, Evolution, and Systematics
41:379–406.
Beaumont, M. A., W. Y. Zhang, and D. J. Balding 2002. Approximate
Bayesian computation in population genetics. Genetics 162:2025–
2035.
Belkhir, K., P. Borsa, L. Chikhi, N. Raufaste, and F. Bonhomme 2004.
GENETIX 4.05, logiciel sous Windows TM pour la g�en�etique des
208 © 2013 The Authors. Evolutionary Applications published by John Wiley & Sons Ltd 7 (2014) 195–211
History of the invasive African olive tree Besnard et al.

populations. Laboratoire G�enome, Populations, Interactions CNRS
UMR5000, Universit�e de Montpellier II, France.
Besnard, G., B. Khadari, P. Villemur, and A. Bervill�e 2000. Cytoplasmic
male sterility in the olive (Olea europaea L.). Theoretical and Applied
Genetics 100:1018–1024.
Besnard, G., P. Henry, L. Wille, D. Cooke, and E. Chapuis 2007a. On the
origin of the invasive olives (Olea europaea L., Oleaceae). Heredity
99:608–619.
Besnard, G., R. Rubio de Casas, and P. Vargas 2007b. Plastid and nuclear
DNA polymorphism reveals historical processes of isolation and retic-
ulation in the olive tree complex (Olea europaea). Journal of Biogeog-
raphy 34:736–752.
Besnard, G., P. Hern�andez, B. Khadari, G. Dorado, and V. Savolainen
2011. Genomic profiling of plastid DNA variation in the Mediterra-
nean olive tree. BMC Plant Biology 11:80.
Besnard, G., F. Anthleme, and D. Baali-Cherif 2012. The Laperrine’s
olive tree (Oleaceae): a wild genetic resource of the cultivated
olive and a model-species for studying the biogeography of the
Saharan Mountains. Acta Botanica Gallica – Botany Letters
159:319–328.
Besnard, G., B. Khadari, M. Navascu�es et al. 2013. The complex history
of the olive tree: from Late Quaternary diversification of Mediterra-
nean lineage to primary domestication in the northern Levant. Pro-
ceedings of the Royal Society, Series B 280:20122833.
Blackburn, T. M., P. Cassey, R. P. Duncan, K. L. Evans, and K. J. Gaston
2004. Avian extinction and mammalian introductions on oceanic
islands. Science 305:1955–1958.
Bonhomme, M., A. Blancher, S. Cuartero, L. Chikhi, and B. Crouau-Roy
2008. Origin and number of founders in an introduced insular pri-
mate: estimation from nuclear genetic data. Molecular Ecology
17:1009–1019.
Breton, C., J. Guerin, C. Ducatillion, F. M�edail, C. A. Kull, and A. Bervill�e
2008. Taming the wild and ‘wilding’ the tame: tree breeding and dis-
persal in Australia and the Mediterranean. Plant Science 175:208–209.
Carriero, F., G. Fontanazza, F. Cellini, and G. Giorio 2002. Identification
of simple sequence repeats (SSRs) in olive (Olea europaea L.). Theo-
retical and Applied Genetics 104:31–37.
Clavero, M., and E. Garc�ıa-Berthou 2005. Invasive species are a leading
cause of animal extinctions. Trends Ecology & Evolution 20:110.
Cornuet, J. M., V. Ravign�e, and A. Estoup 2008. Inferring population
history with DIYABC: a user-friendly approach to approximate Bayes-
ian computation. Bioinformatics 24:2713–2719.
Cornuet, J. M., V. Ravign�e, and A. Estoup 2010. Inference on popula-
tion history and model checking using DNA sequence and micro-
satellite data with the software DIYABC (v1.0). BMC Bioinformatics
11:401.
Cornuet, J. M., P. Pudlo, J. Veyssier, A. Dehne-Garcia, M. Gautier, R.
Leblois, J. M. Marin et al. submitted. DIYABC v2.0: a software to make
approximate Bayesian computation inferences about population
history using single nucleotide polymorphism, DNA sequences and
microsatellite data. Bioinformatics http://www.montpellier.inra.fr/
CBGP/diyabc/.
Crooks, J. A., and M. E. Soule 1999. Lag times in population explosions
of invasive species: causes and implications. In O. T. Sandlund, P. J.
Schei, and�A. Viken, eds. Invasive Species and Biodiversity Manage-
ment, pp. 103–125. Kluwer Academic Publishers, Dordrecht, Nether-
lands.
Csill�ery, K., M. G. B. Blum, O. E. Gaggiotti, and O. Franc�ois 2010.Approximate Bayesian Computation (ABC) in practice. Trends in
Ecology & Evolution 25:410–418.
Cuneo, P., and M. R. Leishman 2006. African Olive (Olea europaea
subsp. cuspidata) as an environmental weed in eastern Australia: a
review. Cunninghamia 9:545–577.
Cuneo, P., C. R. Jacobson, and M. R. Leishman 2009. Landscape-scale
detection and mapping of invasive African Olive (Olea europaea L.
spp. cuspidata Wall ex G. Don Ciferri) in SW Sydney, Australia using
satellite remote sensing. Applied Vegetation Science 12:145–154.
Cuneo, P., C. A. Offord, and M. R. Leishman 2010. Seed ecology of the
invasive woody plant African Olive (Olea europaea subsp. cuspidata):
implications for management and restoration. Australian Journal of
Botany 58:342–348.
Davis, M. A., K. Thompson, and J. P. Grime 2005. Invasibility: the local
mechanism driving community assembly and species diversity. Ecog-
raphy 28:696–704.
DECC 2007. Threatened and Pest Animals of Greater Southern Sydney.
Volume 2: Terrestrial vertebrate fauna of Greater Southern Sydney
Region. Fauna of conservation concern and priority pest species.
Department of Environment and Climate Change, Sydney, NSW.
Dellow, J. J., M. Sargeant, and S. Rose 1987. Control of olive, Olea spp.
Proceedings of the Eighth Australian Weeds Conference, Sydney, New
South Wales, Australia, pp. 461–463.
Dlugosch, K. M., and I. M. Parker 2008. Invading populations of an
ornamental shrub show rapid life history evolution despite genetic
bottlenecks. Ecology Letters 11:707–709.
Ellstrand, N. C., and K. A. Schierenbeck 2000. Hybridization as a stimu-
lus for the evolution of invasiveness in plants? Proceedings of the
National Academy of Sciences, USA 97:7043–7050.
Ennos, R. A. 1994. Estimating the relative rates of pollen and seed migra-
tion among plant populations. Heredity 72:250–259.
Estoup, A., and T. Guillemaud 2010. Reconstructing routes of invasion
using genetic data: why, how and so what? Molecular Ecology
19:4113–4130.
Estoup, A., M. A. Beaumont, F. Sennedot, C. Moritz, and J. M. Cornuet
2004. Genetic analysis of complex demographic scenarios: spatially
expanding populations of the cane toad, Bufo marinus. Evolution
58:2021–2036.
Estoup, A., S. J. E. Baird, N. Ray et al. 2010. Combining genetic, histori-
cal and geographical data to reconstruct the dynamics of bioinvasions:
application to the cane toad Bufo marinus. Molecular Ecology
Resources 10:886–901.
Evanno, G., S. Regnault, and J. Goudet 2005. Detecting the number of
clusters of individuals using the software STRUCTURE: a simulation
study. Molecular Ecology 14:2611–2620.
Facon, B., B. J. Genton, J. Shykoff, P. Jarne, A. Estoup, and P. David
2006. A general eco-evolutionary framework for understanding bioin-
vasions. Trends in Ecology & Evolution 21:130–135.
Facon, B., R. A. Hufbauer, A. Tayeh et al. 2011. Inbreeding depression is
purged in the invasive insect Harmonia axyridis. Current Biology
21:424–427.
Fagundes, N. J. R., N. Ray, M. Beaumont, S. Neuenschwander, F. M.
Salzano, S. L. Bonatto, and L. Excoffier 2007. Statistical evaluation of
alternative models of human evolution. Proceedings of the National
Academy of Sciences of the USA 104:17614–17619.
Figueroa, M. E., J. M. Castillo, S. Redondo, T. Luque, E. M. Castellanos,
F. J. Nieva, C. J. Luque et al. 2003. Facilitated invasion by hybridiza-
tion of Sarcocornia species in a salt-marsh succession. Journal of Ecol-
ogy 91:616–626.
Global Invasive Species Database (GISD) 2010. Olea europaea (tree).
http://interface.creative.auckland.ac.nz/database/species/ecology.asp?
si=1585&fr=1&sts=&lang=EN
© 2013 The Authors. Evolutionary Applications published by John Wiley & Sons Ltd 7 (2014) 195–211 209
Besnard et al. History of the invasive African olive tree

Goudet, J. 2005. FSTAT (version 2.9.4): a program to estimate and test
population genetics parameters. http://www2.unil.ch/popgen/soft-
wares/fstat.htm.
Green, P. S. 2002. A revision of Olea L. (Oleaceae). Kew Bulletin 57:91–
140.
Gurevitch, J., G. A. Fox, G. M. Wardle, Inderjit, and D. Taub 2011.
Emergent insights from the synthesis of conceptual frameworks for
biological invasions. Ecology Letters 14:407–418.
Haouane, H., A. El Bakkali, A. Moukhli et al. 2012. Genetic structure
and core collection of the World Olive Germplasm Bank of Marrak-
ech: towards the optimised management and use of Mediterranean
olive genetic resources. Genetica 139:1083–1094.
Hudson, R. R. 1990. Gene genealogies and the coalescent process.
Oxford Surveys in Evolutionary Biology 7:1–44.
Hudson, R. R. 2002. Generating samples under a Wright-Fisher neutral
model of genetic variation. Bioinformatics 18:337–338.
Kaniewski, D., E. Van Campo, T. Boiy, J. F. Terral, B. Khadari,
and G. Besnard 2012. Primary domestication and early uses of
the emblematic olive tree: palaeobotanical, historical and
molecular evidences from the Middle East. Biological Reviews
87:885–899.
Keller, S. R., and D. R. Taylor 2010. Genomic admixture increases fitness
during a biological invasion. Journal of Evolutionary Biology
23:1720–1731.
Lander, T. A., S. Odou-Muratorio, H. Prouillet-Leplat, and E. H. Klein
2011. Reconstruction of a beech population bottleneck using archival
demographic information and Bayesian analysis of genetic data.
Molecular Ecology 20:5182–5196.
Lombaert, E., T. Guillemaud, C. E. Thomas et al. 2011. Inferring the
origin of populations introduced from a genetically structured
native range by approximate Bayesian computation: case study of
the invasive ladybird Harmonia axyridis. Molecular Ecology
20:4654–4670.
Major, R. 2010. African Olive Preliminary Determination. NSW Scien-
tific Committee, Hurstville NSW.
Manders, P. T., and D. M. Richardson 1992. Colonisation of Cape fyn-
bos communities by forest species. Forest Ecology and Management
48:277–293.
M�edail, F., P. Qu�ezel, G. Besnard, and B. Khadari 2001. Systematics,
ecology and phylogeographic significance of Olea europaea L. subsp.
maroccana (Greuter & Burdet) P. Vargas et al., a relictual olive tree in
south-west Morocco. Botanical Journal of the Linnean Society
137:249–266.
Mooney, H. A., and E. E. Cleland 2001. The evolutionary impact of inva-
sive species. Proceedings of the National Academy of Sciences, USA
98:5446–5451.
Ndlovu, J., D. M. Richardson, J. R. U. Wilson, M. O’Leary, and J. J. Le
Roux 2013. Elucidating the native sources of an invasive tree species,
Acacia pycnantha, reveals unexpected native range diversity and struc-
ture. Annals of Botany 111:895–904.
Nei, M. 1987. Molecular Evolutionary Genetics. Columbia University
Press, New York.
Pascual, M., M. P. Chapuis, F. Mestres, J. Balany�a, R. B. Huey, G. W. Gil-
christ, L. Serra et al. 2007. Introduction history of Drosophila subobs-
cura in the New World: a microsatellite-based survey using ABC
methods. Molecular Ecology 16:3069–3083.
Prentis, P. J., J. R. U. Wilson, E. E. Dormontt, D. M. Richardson, and A.
J. Lowe 2008. Adaptive evolution in invasive species. Trends in Plant
Science 13:288–294.
Pritchard, J. K., P. Stephens, and P. Donnelly 2000. Inference of
population structure using multilocus genotype data. Genetics
155:945–959.
Rey, O., A. Estoup, M. Vonshak et al. 2012. Where do adaptive shifts
occur during invasion? A multidisciplinary approach to unravelling
cold adaptation in a tropical ant species invading the Mediterranean
area. Ecology Letters 15:1266–1275.
Richardson, D. M., and P. Pysek 2006. Plant invasions: merging the con-
cepts of species invasiveness and community invasibility. Progress in
Physical Geography 30:409–431.
de la Rosa, R., C. M. James, and K. R. Tobutt 2002. Isolation and charac-
terization of polymorphic microsatellites in olive (Olea europaea L.)
and their transferability to other genera in the Oleaceae. Molecular
Ecology Notes 2:265–267.
Rubio de Casas, R., G. Besnard, P. Sch€oenswetter, L. Balaguer, and P.
Vargas 2006. Extensive gene flow blurs phylogeographic but not phy-
logenetic signal in Olea europaea L. Theoretical and Applied Genetics
113:575–583.
Saumitou-Laprade, P., C. Vassiliadis, J. T. Epplen, and C. Hardt 2000.
Isolation of microsatellite loci for paternity testing in Phillyrea angust-
ifolia L. (Oleaceae). Molecular Ecology 9:112–114.
Sax, D. F., and S. D. Gaines 2008. Species invasions and extinction: the
future of native biodiversity on islands. Proceedings of the National
Academy of Sciences, USA 105:11490–11497.
Sefc, K. M., M. S. Lopes, D. Mendonca, M. Rodrigues dos Santos, M.
Laimer da Camara Machado, and A. da Camara Machado 2000. Iden-
tification of microsatellite loci in olive (Olea europaea) and their char-
acterization in Italian and Iberian olive trees. Molecular Ecology
9:1171–1173.
Sousa, V. C., M. A. Beaumont, P. Fernandes, M. M. Coelho, and L. Chi-
khi 2012. Population divergence with or without admixture: selecting
models using an ABC approach. Heredity 108:521–530.
Spennemann, D. H. R., and L. R. Allen 2000. Feral olives (Olea europaea)
as future woody weeds in Australia: a review. Australian Journal of
Experimental Agriculture 40:889–901.
Starr, F., K. Starr, and L. Loope 2003. Plants of Hawaii. http://www.hear.
org/starr/hiplants/reports/html/
Sweeney, S., and G. Davies 1998. The Olive industry. In K. Hide, ed. The
New Rural Industries: A Handbook for Farmers and Investors, pp.
405–411. RIRDC, Barton.
Tozer, M. 2003. The native vegetation of the Cumberland Plain, Western
Sydney: systematic classification and field identification of communi-
ties. Cunninghamia 8:1–75.
Van Kleunen, M., W. Dawson, J. M. Jeschke, and M. Fischer 2010. Are
invaders different? A conceptual framework of comparative
approaches for assessing determinants of invasiveness. Ecology Letters
13:947–958.
Weir, B. S., and C. C. Cockerham 1984. Estimating F-statistics for the
analysis of population structure. Evolution 38:1358–1370.
Wilcove, D. S., D. Rothstein, J. Dubow, A. Phillips, and E. Losos 1998.
Quantifying threats to imperilled species in the United States. Bio-
sciences 48:607–615.
Wilson, J. R. U., E. E. Dormontt, P. J. Prentis, A. J. Lowe, and D. M.
Richardson 2009. Something on the way you move: dispersal path-
ways affect invasive success. Trends in Ecology & Evolution 24:136–
144.
Wright, S. I., I. V. Bi, S. G. Schroeder, M. Yamasaki, J. F. Doebley, M. D.
McMullen, and B. S. Gaut 2005. The effect of artificial selection on
maize genome. Science 308:1310–1314.
210 © 2013 The Authors. Evolutionary Applications published by John Wiley & Sons Ltd 7 (2014) 195–211
History of the invasive African olive tree Besnard et al.

Data accessibility
Sample locations and microsatellite genetic profiles are
available in Supplementary Information (Tables S1 to S4).
Supporting Information
Additional Supporting Information may be found in the online version
of this article:
Data S1. Alternative ABC implementation using in-house scripts, the
ms program and the abc R package.
Figure S1. The three demographic scenarios of African olive invasion
in Australia and Hawaii.
Figure S2. Reduced-median networks of haplotypes detected in the
native range of subsp. cuspidata.
Figure S3. Barplot of the STRUCTURE analysis for the Australian and
Hawaiian invasive olive populations based on the most probable number
of genetic clusters K = 2.
Figure S4. PCA of the model checking computation in the space of
summary statistics.
Table S1. Geographic origins of native and invasive samples charac-
terized with cpDNA markers.
Table S2. Geographic origins of the 68 Mediterranean cultivars char-
acterized with nuclear SSR markers.
Table S3. Profile and geographic origin of 39 chlorotypes detected in
the native range of subsp. cuspidata compared to the three chlorotypes
shared between Mediterranean cultivars and invasive olives.
Table S4. Nuclear microsatellite dataset for invasive populations.
Table S5. Pairwise genetic differentiation (FST, in percent) between
invasive populations based on nuclear SSRs.
Table S6. Number of alleles (Na), allelic richness (RS), observed and
expected heterozygosities (HO and HS respectively) for each SSR locus
for the three invasive populations of subsp. europaea.
Table S7. Number of alleles (Na), allelic richness (RS), observed and
expected heterozygosities (HO and HS respectively) for each SSR locus
for the six invasive populations of subsp. cuspidata.
Table S8. Type-1 and type-2 error rates for simulated data.
Table S9. Precision on parameter estimations based on 500 pseudo-
observed data sets (pods) with the measure of the relative average bias,
estimated under scenario 1.
Table S10. Precision on parameter estimations based on 500 pseudo-
observed data sets (pods) with the measure of the square Root of the Rel-
ative Mean Square Error (RRMSE) and the Relative Median Absolute
Deviation (RMedAD), estimated under scenario 1.
Table S11. Model checking for introduction scenario 1.
Table S12. Effect of different priors on the posteriors for the real data
sets.
© 2013 The Authors. Evolutionary Applications published by John Wiley & Sons Ltd 7 (2014) 195–211 211
Besnard et al. History of the invasive African olive tree