DC209_.pdf - Hawaii State Legislature
10
DAVIDY. IGE GOVERNOR CRAIG K. HIRAI DIRECTOR ROBERT YU DEPUTY DIRECTOR EMPLOYEES' RETIREMENT SYSTEM STATE OF HAWAl'I DEPARTMENT OF BUDGET AND FINANCE P.O. BOX 150 ADMINISTRATIVE AND RESEARCH OFFICE BUDGET, PROGRAM PLANNING AND MANAGEMENT DIVISION HAWAl'I EMPLOYER-UNION HEALTH BENEFITS TRUST FUNO OFFICE OF THE PUBLIC DEFENDER FINANCIAL ADMINISTRATION DIVISION HONOLULU, HAWAl' I 96810-0150 OFFICE OF FEDERAL AWAAOS MANAGEMENT (OFAM) December 26, 2019 The Honorable Ronald D. Kouchi President and Members of the Senate Thirtieth State Legislature State Capitol, Room 409 Honolulu, Hawaii 96813 The Honorable Scott K. Saiki Speaker and Members of the House of Representatives Thirtieth State Legislature State Capitol, Room 431 Honolulu, Hawaii 96813 Dear President Kouchi, Speaker Saiki and Members of the Legislature: For your information and consideration, I am transmitting a copy of the Actuarial Asset and Liability Stress Test 2019 report, as required by Act 85, Session Laws of Hawaii 2017. In accordance with Section 93-16, Hawaii Revised Statutes, a copy of this report has been transmitted to the Legislative Reference Bureau and the report may be viewed electronically at http://ers.ehawaii.gov/resources/reports-to-leqislature. Sincerely, ~ ~__./ __ . -- Director of Finance Enclosure c: Legislative Reference Bureau ec: Governor's Office: [email protected] Lieutenant Governor's Office: [email protected] Legislative Auditor: [email protected] Department of Budget and Finance: [email protected] No. 1 Capitol District Building, 250 S. Hotel Street, Honolulu, Hawaii 96813 DEPT. COMM. NO. 209
-
Upload
khangminh22 -
Category
Documents
-
view
1 -
download
0
Transcript of DC209_.pdf - Hawaii State Legislature

DAVIDY. IGE GOVERNOR
CRAIG K. HIRAI DIRECTOR
ROBERT YU DEPUTY DIRECTOR
EMPLOYEES' RETIREMENT SYSTEM
STATE OF HAWAl'I DEPARTMENT OF BUDGET AND FINANCE
P.O. BOX 150
ADMINISTRATIVE AND RESEARCH OFFICE BUDGET, PROGRAM PLANNING AND
MANAGEMENT DIVISION HAWAl'I EMPLOYER-UNION HEAL TH BENEFITS TRUST FUNO OFFICE OF THE PUBLIC DEFENDER FINANCIAL ADMINISTRATION DIVISION
HONOLULU, HAWAl'I 96810-0150 OFFICE OF FEDERAL AWAAOS MANAGEMENT (OFAM)
December 26, 2019
The Honorable Ronald D. Kouchi President and Members of the Senate
Thirtieth State Legislature State Capitol, Room 409 Honolulu, Hawaii 96813
The Honorable Scott K. Saiki Speaker and Members of the House of Representatives
Thirtieth State Legislature State Capitol, Room 431 Honolulu, Hawaii 96813
Dear President Kouchi, Speaker Saiki and Members of the Legislature:
For your information and consideration, I am transmitting a copy of the Actuarial Asset and Liability Stress Test 2019 report, as required by Act 85, Session Laws of Hawaii 2017. In accordance with Section 93-16, Hawaii Revised Statutes, a copy of this report has been transmitted to the Legislative Reference Bureau and the report may be viewed electronically at http://ers.ehawaii .gov/resources/reports-to-leqislature.
Sincerely,
~ ~__./ __ . --
Director of Finance
Enclosure
c: Legislative Reference Bureau
ec: Governor's Office: [email protected] Lieutenant Governor's Office: [email protected] Legislative Auditor: [email protected] Department of Budget and Finance: [email protected]
No. 1 Capitol District Building, 250 S. Hotel Street, Honolulu, Hawaii 96813
DEPT. COMM. NO. 209

Retirement Consulting
December 24, 2019
Board ofTrustees Employees' Retirement System of The State of Hawaii City Financial Tower 201 Merchant St., Ste. 1400 Honolulu, HI 96813-2980
Re: Stress Test Annual Report
Dear Members of the Board:
P: 469.524.0000 I F: 469.524.0003 I www.grsconsulting.com
The purpose of this report is to provide the Employees' Retirement System of the State of Hawaii (ERS) with the information it must submit to the legislature as required by ACT- 85 (2017). Act- 85 (2017) requires that the actuary of the ERS perform an annual stress test as defined by the legislation and described below.
Requirements of Annual Stress Test Report
The annual stress test must address the following scenarios:
1. A 30-year projection of the ERS's assets, liabilities, pension debt, service costs, employee contributions, employer contributions, net amortization, benefit payments, payroll, and funded ratio assuming the current actuarial assumptions are met. See Stress Test Exhibit 1.
2. Two 30-year projections of the same items above assuming the actual investment performance in future years is 2% less than the assumed rate of return, but with two different contribution policies.
a. The first scenario shows the projected items assuming that the employer contribution rate in future years would increase if necessary to meet the current funding policy. In other words, if the funding period in a future year exceeds 30 years, the contribution rates would be adjusted to bring the funding period down to 30 years. See Stress Test Exhibit 2A.
b. The second scenario shows the projected items assuming no change in the current statutory contribution rates. See Stress Test Exhibit 2B.
~'i605 r,Jor th Mac../\r thur 13uulc·. ur d Su,tc 870 I, v,ng, lev;,:; 7')038-2631

Board ofTrustees December 24, 2019 Page 2
3. Two 30-year projections of the same items above assuming the actual investment performance in the first year is a negative 20% followed by a 20-year period where investment performance is 2% less than the assumed rate of return, but with two different contribution policies.
a. The first scenario shows the projected items assuming that the employer contribution rate in future years would increase if necessary to meet the current funding policy. In other words, if the funding period in a future year exceeds 30 years, the contribution rates would be adjusted to bring the funding period down to 30 years. See Stress Test Exhibit 3A.
b. The second scenario shows the projected items assuming no change in the current statutory contribution rates. See Stress Test Exhibit 3B.
4. The estimated actuarial accrued liability, the total normal cost for each benefit tier, and the employer normal cost for each benefit tier under the current investment return assumption and using the 10-year average of the 30-year treasuries notes as of the valuation date. See Stress Test Exhibit 4.
Stress Test Summary Results
The information required by the legislation is contained in the tables that follow this letter. The following is some brief commentary concerning the results themselves.
1. As shown in Stress Test Exhibit 1, the ERS is expected to be fully funded (100% funded ratio) in fiscal year ending 2045.
2. Stress Test Exhibits 2A and 2B are nearly identical. This is because the funding period at future valuation dates under both scenarios is never expected to exceed 30 years. The impact of the underperformance is a lengthening of the period of time until the plan is fully funded, but it is never expected to be more than 30 years from a future valuation date. Please note that while it is true that in aggregate the funding period would not exceed 30 years, if the Police and Firefighters were calculated independently, the funding period would barely exceed 30 years in 2040. A small increase in the Police and Firefighter rates is the difference between the two projections.
3. Under the first part of the 3rd Stress Test (see Stress Test Exhibit 3A) the employer contribution rates would ultimately increase to 26.00% of pay for All Other Employees and 48.50% of pay for Police and Firefighters in 2024 and remain at those levels for the foreseeable future. As shown in Stress Test Exhibit 3B (Employer Contributions remain at statutory rates) the funded ratio would decline below 35% but the trust is never exhausted. The funded ratio would begin to slowly climb once the 20-year period of 5% returns ends.
4. The 10-year average of the 30-year treasury notes 0
is 3.29% as of July 1, 2019.

Board ofTrustees December 24, 2019 Page 3
Based on the information reviewed for this report, the stress test shows that the System is sustainable in return environments much lower than currently assumed.
Disclosures
The information contained in this report is based on the preliminary valuation results of the ERS as of June 30, 2019. While the actual valuation results may be slightly different, it is not expected that those changes will have any material impact on the information contained herein.
Except as noted, the data, financial information, and actuarial methods and assumptions are those used in the June 30, 2019 actuarial valuation. These assumptions are detailed in the actuarial valuation report dated January 2020. The results of the actuarial valuation and this "Stress Test" are dependent on the actuarial assumptions used. Actual results can and almost certainly will differ, as actual experience deviates from the assumptions. Even seemingly minor changes in the assumptions can materially change the liabilities, calculated contribution rates and funding periods. Based on the scope of this engagement, we have not performed analysis on the potential range of future measurements based on other factors. The actuarial calculations are intended to provide information for rational decision making.
Joe Newton is a member of the American Academy of Actuaries and meets the Qualification Standards of the American Academy of Actuaries to render the actuarial opinions contained herein.
We look forward to discussing the results of this analysis with the Board.
Sincerely,
Lewis Ward Consultant
Joseph P. Newton Pension Market Leader and Actuary
Enclosures
~ G R ~s Retirem,ent ...., Consulting

Hawaii Employees' Retirement System Stress Test Exhibit 1
(Dollar Amounts in$ Millions)
Unfunded Market Actuarial Actuarial Actuarial Projected Projected
Valuation Value of Value of Accrued Accrued Normal Employee Employer Net Benefit Covered Funded
Date Assets Assets Liability Liability Cost Contributions Contributions Amortization Payments Payroll Ratio
(1) (2) (3) (4) (5) (6) (7) (8) (9) (10) (11) (12)
30-Jun-19 $ 17,227 $ 17,322 $ 31,396 $14,074 $ 656 $ 281 $ 1,067 $ 270 $ 1,568 $ 4,520 55.2%
30-Jun-20 $ 18,291 $ 18,291 $ 32,614 $14,324 $ 670 $ 296 $ 1,202 $ 146 $ 1,662 $ 4,633 56.1% 30-Jun-21 $ 19,385 $ 19,385 $ 33,833 $14,448 $ 686 $ 312 $ 1,235 $ 121 $ 1,758 $ 4,761 57.3% 30-Jun-22 $ 20,506 $ 20,506 $ 35,054 $14,547 $ 703 $ 328 $ 1,269 $ 93 $ 1,855 $ 4,893 58.5%
30-Jun-23 $ 21,657 $ 21,657 $ 36,275 $14,618 $ 721 $ 345 $ 1,305 $ 62 $ 1,954 $ 5,033 59.7%
30-Jun-24 $ 22,840 $ 22,840 $ 37,498 $14,657 $ 739 $ 362 $ 1,342 $ 27 $ 2,056 $ 5,176 60.9% 30-Jun-25 $ 24,057 $ 24,057 $ 38,718 $14,661 $ 758 $ 380 $ 1,380 $ (11) $ 2,159 $ 5,326 62.1%
30-Jun-26 $ 25,308 $ 25,308 $ 39,935 $14,626 $ 777 $ 398 $ 1,420 $ (54) $ 2,263 $ 5,483 63.4% 30-Jun-27 $ 26,601 $ 26,601 $ 41,148 $14,548 $ 798 $ 417 $ 1,462 $ (101) $ 2,367 $ 5,647 64.6% 30-Jun-28 $ 27,937 $ 27,937 $ 42,359 $ 14,422 $ 819 $ 437 $ 1,506 $ (153) $ 2,471 $ 5,818 66.0% 30-Jun-29 $ 29,325 $ 29,325 $ 43,567 $14,243 $ 841 $ 457 $ 1,552 $ (211) $ 2,574 $ 5,998 67.3% 30-Jun-30 $ 30,770 $ 30,770 $ 44,775 $14,005 $ 865 $ 478 $ 1,600 $ (274) $ 2,677 $ 6,186 68.7% 30-Jun-31 $ 32,281 $ 32,281 $ 45,984 $13,703 $ 890 $ 499 $ 1,650 $ (344) $ 2,781 $ 6,382 70.2% 30-Jun-32 $ 33,865 $ 33,865 $ 47,195 $13,330 $ 915 $ 522 $ 1,702 $ (421) $ 2,885 $ 6,586 71.8%
30-Jun-33 $ 35,528 $ 35,528 $ 48,407 $12,879 $ 942 $ 544 $ 1,757 $ (504) $ 2,988 $ 6,797 73.4% 30-Jun-34 $ 37,279 $ 37,279 $ 49,623 $12,344 $ 969 $ 568 $ 1,813 $ (596) $ 3,090 $ 7,019 75.1% 30-Jun-35 $ 39,130 $ 39,130 $ 50,846 $11,716 $ 998 $ 592 $ 1,872 $ (697) $ 3,192 $ 7,248 77.0% 30-Jun-36 $ 41,090 $ 41,090 $ 52,077 $10,987 $ 1,028 $ 618 $ 1,934 $ (807) $ 3,292 $ 7,487 78.9%
30-Jun-37 $ 43,173 $ 43,173 $ 53,319 $10,146 $ 1,059 $ 643 $ 1,998 $ (926) $ 3,390 $ 7,736 81.0% 30-Jun-38 $ 45,391 $ 45,391 $ 54,576 $ 9,185 $ 1,092 $ 670 $ 2,065 $ (1,056) $ 3,486 $ 7,997 83.2% 30-Jun-39 $ 47,762 $ 47,762 $ 55,854 $ 8,092 $ 1,127 $ 698 $ 2,136 $ (1,199) $ 3,580 $ 8,269 85.5%
30-Jun-40 $ 50,303 $ 50,303 $ 57,159 $ 6,856 $ 1,163 $ 726 $ 2,209 $ (1,353) $ 3,671 $ 8,552 88.0% 30-Jun-41 $ 53,031 $ 53,031 $ 58,495 $ 5,464 $ 1,201 $ 754 $ 2,286 $ (1,521) $ 3,759 $ 8,847 90.7% 30-Jun-42 $ 55,967 $ 55,967 $ 59,870 $ 3,903 $ 1,240 $ 784 $ 2,366 $ (1,703) $ 3,846 $ 9,155 93.5% 30-Jun-43 $ 59,133 $ 59,133 $ 61,291 $ 2,158 $ 1,281 $ 815 $ 2,449 $ (1,900) $ 3,929 $ 9,474 96.5%
30-Jun-44 $ 62,549 $ 62,549 $ 62,765 $ 216 $ 1,325 $ 846 $ 2,536 $ (2,113) $ 4,012 $ 9,806 99.7% 30-Jun-45 $ 66,240 $ 66,240 $ 64,297 $ (1,943) $ 1,369 $ 878 $ 2,626 $ (2,344) $ 4,095 $10,150 103.0%
30-Jun-46 $ 70,228 $ 70,228 $ 65,895 $ (4,332) $ 1,416 $ 911 $ 2,718 $ (2,593) $ 4,178 $10,507 106.6% 30-Jun-47 $ 74,537 $ 74,537 $ 67,564 $ (6,973) $ 1,464 $ 944 $ 2,814 $ (2,861) $ 4,261 $10,877 110.3% 30-Jun-48 $ 79,196 $ 79,196 $ 69,312 $ (9,884) $ 1,515 $ 980 $ 2,914 $ (3,153) $ 4,344 $11,260 114.3%
30-Jun-49 $ 84,232 $ 84,232 $ 71,144 $(13,088) $ 1,567 $ 1,015 $ 3,017 $ (3,466) $ 4,430 $11,658 118.4%

Hawaii Employees' Retirement System Stress Test Exhibit 2A - Actual Returns are 5% (2% Less than Assumed)
Scenario A - Contribution Rates Adjusted if Necessary to Keep Future Valuations' Funding Periods at 30 Years or Less (Dollar Amounts in$ Millions)
Unfunded Market Actuarial Actuarial Actuarial Projected Projected
Valuation Value of Value of Accrued Accrued Normal Employee Employer Net Benefit Covered Funded
Date Assets Assets Liability Liability Cost Contributions Contributions Amortization Payments Payroll Ratio
(1) (2) (3) (4) (5) (6) (7) (8) (9) (10) (11) (12)
30-Jun-19 $ 17,227 $ 17,322 $ 31,396 $14,074 $ 656 $ 281 $ 1,067 $ 270 $ 1,568 $ 4,520 55.2%
30-Jun-20 17,947 18,205 32,614 14,410 670 296 1,202 152 1,662 4,633 55.8% 30-Jun-21 18,659 19,113 33,833 14,720 686 312 1,235 140 1,758 4,761 56.5%
30-Jun-22 19,359 19,935 35,054 15,119 703 328 1,269 133 1,855 4,893 56.9%
30-Jun-23 20,045 20,659 36,275 15,616 721 345 1,305 132 1,954 5,033 57.0%
30-Jun-24 20,718 21,361 37,498 16,136 739 362 1,342 131 2,056 5,176 57.0%
30-Jun-25 21,375 22,043 38,718 16,675 758 380 1,380 130 2,159 5,326 56.9%
30-Jun-26 22,016 22,707 39,935 17,228 777 398 1,420 129 2,263 5,483 56.9% 30-Jun-27 22,642 23,354 41,148 17,795 798 417 1,462 127 2,367 5,647 56.8%
30-Jun-28 23,254 23,986 42,359 18,373 819 437 1,506 124 2,471 5,818 56.6%
30-Jun-29 23,854 24,607 43,567 18,961 841 457 1,552 120 2,574 5,998 56.5%
30-Jun-30 24,445 25,218 44,775 19,557 865 478 1,600 115 2,677 6,186 56.3%
30-Jun-31 25,031 25,823 45,984 20,161 890 499 1,650 108 2,781 6,382 56.2%
30-Jun-32 25,613 26,424 47,195 20,771 915 522 1,702 100 2,885 6,586 56.0% 30-Jun-33 26,192 27,023 48,407 21,384 942 544 1,757 91 2,988 6,797 55.8%
30-Jun-34 26,773 27,623 49,623 22,000 969 568 1,813 79 3,090 7,019 55.7%
30-Jun-35 27,361 28,230 50,846 22,616 998 592 1,872 66 3,192 7,248 55.5%
30-Jun-36 27,958 28,845 52,077 23,231 1,028 618 1,934 51 3,292 7,487 55.4%
30-Jun-37 28,569 29,477 53,319 23,842 1,059 643 1,998 33 3,390 7,736 55.3%
30-Jun-38 29,202 30,130 54,576 24,447 1,092 670 2,065 12 3,486 7,997 55.2%
30-Jun-39 29,864 30,812 55,854 25,043 1,127 698 2,136 (12) 3,580 8,269 55.2%
30-Jun-40 30,562 31,531 57,159 25,628 1,163 726 2,210 (40) 3,671 8,552 55.2% 30-Jun-41 31,305 32,297 58,495 26,198 1,201 754 2,287 (71) 3,759 8,847 55.2%
30-Jun-42 32,103 33,119 59,870 26,751 1,240 784 2,368 (105) 3,846 9,155 55.3%
30-Jun-43 32,965 34,007 61,291 27,285 1,281 815 2,452 (143) 3,929 9,474 55.5%
30-Jun-44 33,900 34,969 62,765 27,796 1,325 846 2,538 (185) 4,012 9,806 55.7%
30-Jun-45 34,916 36,015 64,297 28,283 1,369 878 2,628 (230) 4,095 10,150 56.0%
30-Jun-46 36,021 37,152 65,895 28,743 1,416 911 2,720 (280) 4,178 10,507 56.4%
30-Jun-47 37,224 38,390 67,564 29,174 1,464 944 2,816 (333) 4,261 10,877 56.8%
30-Jun-48 38,533 39,737 69,312 29,574 1,515 980 2,915 (391) 4,344 11,260 57.3%
30-Jun-49 39,958 41,204 71,144 29,940 1,567 1,015 3,017 (454) 4,430 11,658 57.9%

Hawaii Employees' Retirement System Stress Test Exhibit 2B - Actual Returns are S% (2% Less than Assumed)
Scenario B - Contribution Rates Kept at Current Statutory Rates (Dollar Amounts in$ Millions)
Unfunded Market Actuarial Actuarial Actuarial Projected Projected
Valuation Value of Value of Accrued Accrued Normal Employee Employer Net Benefit Covered Funded Date Assets Assets Liability Liability Cost Contributions Contributions Amortization Payments Payroll Ratio (1) (2) (3) (4) (5) (6) (7) (8) (9) (10) (11) (12)
30-Jun-19 $ 17,227 $ 17,322 $ 31,396 $14,074 $ 656 $ 281 $ 1,067 $ 270 $ 1,568 $ 4,520 55.2% 30-Jun-20 17,947 18,205 32,614 14,410 670 296 1,202 152 1,662 4,633 55.8% 30-Jun-21 18,659 19,113 33,833 14,720 686 312 1,235 140 1,758 4,761 56.5% 30-Jun-22 19,359 19,935 35,054 15,119 703 328 1,269 133 1,855 4,893 56.9% 30-Jun-23 20,045 20,659 36,275 15,616 721 345 1,305 132 1,954 5,033 57.0% 30-Jun-24 20,718 21,361 37,498 16,136 739 362 1,342 131 2,056 5,176 57.0% 30-Jun-25 21,375 22,043 38,718 16,675 758 380 1,380 130 2,159 5,326 56.9% 30-Jun-26 22,016 22,707 39,935 17,228 777 398 1,420 129 2,263 5,483 56.9% 30-Jun-27 22,642 23,354 41,148 17,795 798 417 1,462 127 2,367 5,647 56.8% 30-Jun-28 23,254 23,986 42,359 18,373 819 437 1,506 124 2,471 5,818 56.6% 30-Jun-29 23,854 24,607 43,567 18,961 841 457 1,552 120 2,574 5,998 56.5% 30-Jun-30 24,445 25,218 44,775 19,557 865 478 1,600 115 2,677 6,186 56.3% 30-Jun-31 25,031 25,823 45,984 20,161 890 499 1,650 108 2,781 6,382 56.2% 30-Jun-32 25,613 26,424 47,195 20,771 915 522 1,702 100 2,885 6,586 56.0% 30-Jun-33 26,192 27,023 48,407 21,384 942 544 1,757 91 2,988 6,797 55.8% 30-Jun-34 26,773 27,623 49,623 22,000 969 568 1,813 79 3,090 7,019 55.7% 30-Jun-35 27,361 28,230 50,846 22,616 998 592 1,872 66 3,192 7,248 55.5% 30-Jun-36 27,958 28,845 52,077 23,231 1,028 618 1,934 51 3,292 7,487 55.4% 30-Jun-37 28,569 29,477 53,319 23,842 1,059 643 1,998 33 3,390 7,736 55.3% 30-Jun-38 29,202 30,130 54,576 24,447 1,092 670 2,065 12 3,486 7,997 55.2% 30-Jun-39 29,864 30,812 55,854 25,043 1,127 698 2,136 (12) 3,580 8,269 55.2% 30-Jun-40 30,562 31,531 57,159 25,628 1,163 726 2,209 (39) 3,671 8,552 55.2% 30-Jun-41 31,305 32,296 58,495 26,199 1,201 754 2,286 (69) 3,759 8,847 55.2% 30-Jun-42 32,101 33,117 59,870 26,753 1,240 784 2,366 (103) 3,846 9,155 55.3% 30-Jun-43 32,961 34,003 61,291 27,288 1,281 815 2,449 (141) 3,929 9,474 55.5% 30-Jun-44 33,894 34,962 62,765 27,802 1,325 846 2,536 (182) 4,012 9,806 55.7% 30-Jun-45 34,907 36,006 64,297 28,292 1,369 878 2,626 (227) 4,095 10,150 56.0% 30-Jun-46 36,010 37,141 65,895 28,754 1,416 911 2,718 (277) 4,178 10,507 56.4% 30-Jun-47 37,210 38,376 67,564 29,188 1,464 944 2,814 (330) 4,261 10,877 56.8% 30-Jun-48 38,517 39,721 69,312 29,591 1,515 980 2,914 (389) 4,344 11,260 57.3% 30-Jun-49 39,940 41,186 71,144 29,958 1,567 1,015 3,017 (453) 4,430 11,658 57.9%
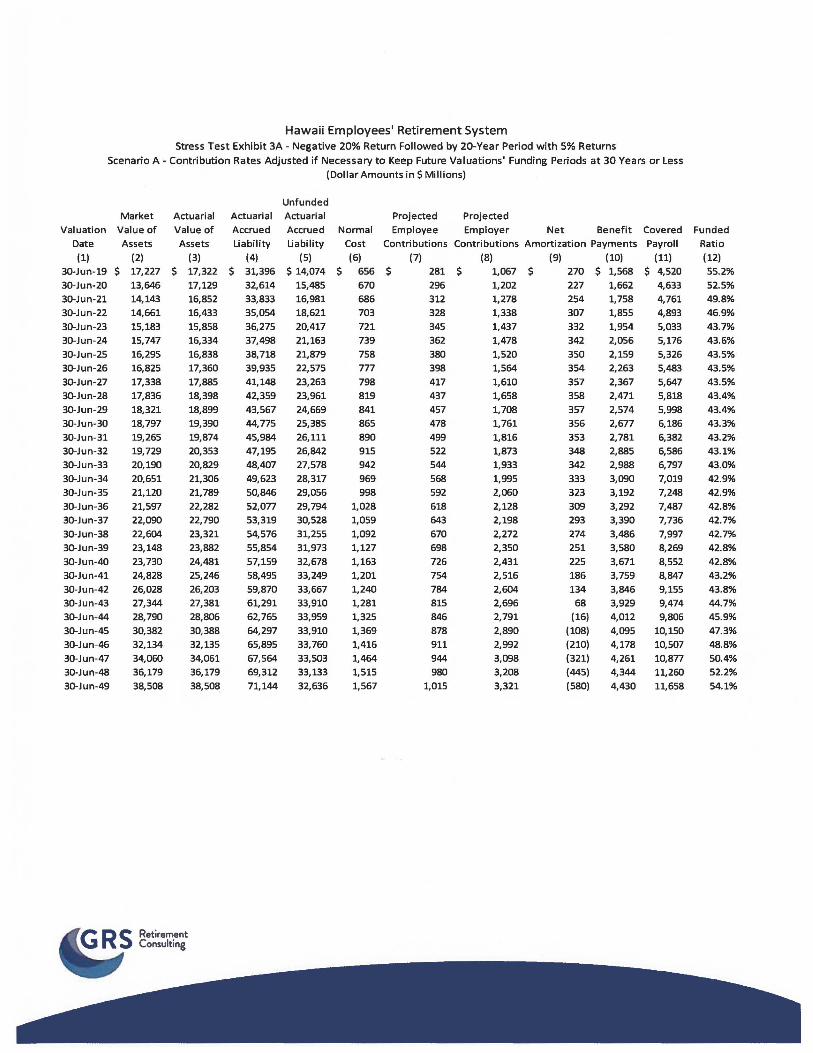
Hawaii Employees' Retirement System Stress Test Exhibit 3A - Negative 20% Return Followed by 20-Year Period with 5% Returns
Scenario A - Contribution Rates Adjusted if Necessary to Keep Future Valuations' Funding Periods at 30 Years or Less
Valuation Date (1)
30-Jun-19 30-Jun-20 30-Jun-21 30-Jun-22 30-Jun-23 30-Jun-24 30-Jun-25 30-Jun-26 30-Jun-27 30-Jun-28 30-Jun-29 30-Jun-30 30-Jun-31 30-Jun-32 30-Jun-33 30-Jun-34 30-Jun-3S 30-Jun-36 3D-Jun-37 3D-Jun-38 30-Jun-39 30-Jun-40 30-Jun-41 30-Jun-42 30-Jun-43 30-Jun-44 30-Jun-4S 30-Jun-46
30-Jun-47 30-Jun-48 30-Jun-49
Market Actuarial Value of Value of
$
Assets Assets (2) 17,227 $ 13,646 14,143 14,661 15,183 15,747 16,295 16,825 17,338 17,836 18,321 18,797 19,265 19,729 20,190 20,651 21,120 21,S97 22,090 22,604 23,148 23,730 24,828 26,028 27,344 28,790 30,382 32,134 34,060 36,179 38,S08
Retirement Consulting
(3) 17,322 17,129 16,852 16,433 15,858 16,334 16,838 17,360 17,885 18,398 18,899 19,390 19,874 20,353 20,829 21,306 21,789 22,282 22,790 23,321 23,882 24,481 25,246 26,203 27,381 28,806 30,388 32,13S 34,061 36,179 38,S08
Actuarial Accrued Liability
(4)
$ 31,396 32,614 33,833 35,054 36,275 37,498 38,718 39,935 41,148 42,359 43,567 44,775 45,984 47,19S 48,407 49,623 S0,846 52,077 S3,319 54,576 SS,854 S7,159 S8,49S S9,870 61,291 62,76S 64,297 65,89S 67,564 69,312 71,144
(Dollar Amounts in$ Millions)
Unfunded Actuarial Projected Projected Accrued Normal Employee Employer Net Benefit Covered Liability Cost Contributions Contributions Amortization Payments Payroll
(5) (6) (7) (8) (9) (10) (11) $14,074 $ 6S6 $ 281 $ 1,067 $ 270 $ 1,568 $ 4,520
15,485 670 296 1,202 227 1,662 4,633 16,981 686 312 1,278 254 1,758 4,761 18,621 703 328 1,338 307 1,855 4,893 20,417 721 345 1,437 332 1,954 5,033 21,163 739 362 1,478 342 2,056 5,176 21,879 758 380 1,520 350 2,159 5,326 22,575 777 398 1,564 354 2,263 5,483 23,263 798 417 1,610 357 2,367 5,647 23,961 819 437 1,658 358 2,471 5,818 24,669 841 457 1,708 357 2,574 5,998 25,385 865 478 1,761 356 2,677 6,186 26,111 890 499 1,816 353 2,781 6,382 26,842 91S S22 1,873 348 2,88S 6,S86 27,S78 942 S44 1,933 342 2,988 6,797 28,317 969 S68 1,99S 333 3,090 7,019 29,056 998 S92 2,060 323 3,192 7,248 29,794 1,028 618 2,128 309 3,292 7,487 30,528 1,059 643 2,198 293 3,390 7,736 31,255 1,092 670 2,272 274 3,486 7,997 31,973 1,127 698 2,350 2S1 3,S80 8,269 32,678 1,163 726 2,431 22S 3,671 8,S52 33,249 1,201 754 2,S16 186 3,7S9 8,847 33,667 1,240 784 2,604 134 3,846 9,155 33,910 1,281 81S 2,696 68 3,929 9,474 33,9S9 1,32S 846 2,791 (16) 4,012 9,806 33,910 1,369 878 2,890 (108) 4,095 10,1S0 33,760 1,416 911 2,992 (210) 4,178 10,507 33,503 1,464 944 3,098 (321) 4,261 10,877 33,133 1,515 980 3,208 (445) 4,344 11,260 32,636 1,567 1,015 3,321 (S80) 4,430 11,658
Funded Ratio (12) 55.2% 52.5% 49.8% 46.9% 43.7% 43.6% 43.5% 43.5% 43.5% 43.4% 43.4% 43.3% 43.2% 43.1% 43.0% 42.9% 42.9% 42.8% 42.7% 42.7% 42.8% 42.8% 43.2% 43.8% 44.7% 45.9% 47.3% 48.8%
50.4% 52.2% 54.1%

Hawaii Employees' Retirement System Stress Test Exhibit 3B - Negative 20% Return Followed by 20-Year Period with 5% Returns
Scenario B - Contribution Rates Kept at Current Statutory Rates (Dollar Amounts in$ Millions)
Unfunded Market Actuarial Actuarial Actuarial Projected Projected
Valuation Value of Value of Accrued Accrued Normal Employee Employer Net Benefit Covered Funded
Date Assets Assets Liability Liability Cost Contributions Contributions Amortization Payments Payroll Ratio
(1) (2) (3) (4) (5) (6) (7) (8) (9) (10) (11) (12)
30-Jun-19 $ 17,227 $ 17,322 $ 31,396 $14,074 $ 656 $ 281 $ 1,067 $ 270 $ 1,568 $ 4,520 55.2% 30-Jun-20 13,646 17,129 32,614 15,485 670 296 1,202 227 1,662 4,633 52.5% 30-Jun-21 14,143 16,852 33,833 16,981 686 312 1,235 298 1,758 4,761 49.8% 30-Jun-22 14,617 16,389 35,054 18,665 703 328 1,269 381 1,855 4,893 46.8% 30-Jun-23 15,066 15,740 36,275 20,535 721 345 1,305 476 1,954 5,033 43.4% 30-Jun-24 15,490 16,073 37,498 21,424 739 362 1,342 501 2,056 5,176 42.9% 30-Jun-25 15,886 16,422 38,718 22,296 758 380 1,380 523 2,159 5,326 42.4% 30-Jun-26 16,252 16,775 39,935 23,160 777 398 1,420 544 2,263 5,483 42.0% 30-Jun-27 16,590 17,120 41,148 24,029 798 417 1,462 563 2,367 5,647 41.6% 30-Jun-28 16,899 17,438 42,359 24,921 819 437 1,506 582 2,471 5,818 41.2% 30-Jun-29 17,181 17,730 43,567 25,837 841 457 1,552 601 2,574 5,998 40.7% 30-Jun-30 17,439 17,998 44,775 26,778 865 478 1,600 620 2,677 6,186 40.2% 30-Jun-31 17,674 18,241 45,984 27,743 890 499 1,650 639 2,781 6,382 39.7% 30-Jun-32 17,888 18,463 47,195 28,731 915 522 1,702 657 2,885 6,586 39.1% 30-Jun-33 18,082 18,664 48,407 29,743 942 544 1,757 676 2,988 6,797 38.6% 30-Jun-34 18,257 18,846 49,623 30,777 969 568 1,813 694 3,090 7,019 38.0% 30-Jun-35 18,419 19,014 50,846 31,832 998 592 1,872 711 3,192 7,248 37.4% 30-Jun-36 18,569 19,169 52,077 32,908 1,028 618 1,934 728 3,292 7,487 36.8% 30-Jun-37 18,711 19,316 53,319 34,002 1,059 643 1,998 744 3,390 7,736 36.2% 30-Jun-38 18,851 19,461 54,576 35,115 1,092 670 2,065 759 3,486 7,997 35.7% 30-Jun-39 18,995 19,610 55,854 36,245 1,127 698 2,136 772 3,580 8,269 35.1% 30-Jun-40 19,150 19,769 57,159 37,389 1,163 726 2,209 784 3,671 8,552 34.6% 30-Jun-41 19,697 20,040 58,495 38,455 1,201 754 2,286 789 3,759 8,847 34.3% 30-Jun-42 20,300 20,444 59,870 39,427 1,240 784 2,366 784 3,846 9,155 34.1% 30-Jun-43 20,969 20,999 61,291 40,292 1,281 815 2,449 769 3,929 9,474 34.3% 30-Jun-44 21,714 21,726 62,765 41,038 1,325 846 2,536 744 4,012 9,806 34.6% 30-Jun-45 22,546 22,551 64,297 41,747 1,369 878 2,626 714 4,095 10,150 35.1% 30-Jun-46 23,475 23,477 65,895 42,419 · 1,416 911 2,718 680 4,178 10,507 35.6% 30-Jun-47 24,513 24,513 67,564 43,051 1,464 944 2,814 640 4,261 10,877 36.3% 30-Jun-48 25,669 25,669 69,312 43,643 1,515 980 2,914 594 4,344 11,260 37.0% 30-Jun-49 26,958 26,958 71,144 44,186 1,567 1,015 3,017 543 4,430 11,658 37.9%

Hawaii Employees' Retirement System
Stress Test Exhibit 4 - Comparison of Cost Items at Current Investment Return Assumption
(7.0%)
Membership Tier
Actuarial Accured Liability
Total Normal Cost%
Employer Normal Cost%
Membership Tier
Actuarial Accured Liability
Total Normal Cost%
Employer Normal Cost%
Dollar Amounts are in$ Millions
All Other Employees
Valuation Assumptions
Hi red Prior to Hi red After
July 1, 2012 June 30, 2012
$24, 792 $552
12.22%
7.83%
11.85%
3.79%
Police and Fire Employees
Valuation Assumptions
Hired Prior to Hired After
July 1, 2012 June 30, 2012
$5,980 $73
27.11%
14.91%
21.66%
7.46%
10-Year Average of 30-Year Treasuries
Hired Prior to Hired After
July 1, 2012 June 30, 2012
$41,020 $1,373
33.76%
29.37%
28.99%
20.93%
10-Year Average of 30-YearTreasuries
Hired Prior to Hired After
July 1, 2012 June 30, 2012
$10,171 $183
73.05%
60.85%
57.04%
42.84%