High and Distinct Range-Edge Genetic Diversity despite Local Bottlenecks
11
High and Distinct Range-Edge Genetic Diversity despite Local Bottlenecks Jorge Assis 1* , Nelson Castilho Coelho 1 , Filipe Alberto 1,2 , Myriam Valero 3 , Pete Raimondi 4 , Dan Reed 5 , Ester Alvares Serrão 1 1 Centro de Ciências do Mar do Algarve, CIMAR-Laboratório Associado, University of Algarve, Campus de Gambelas, Faro, Portugal, 2 Department of Biological Sciences, University of Wisconsin-Milwaukee, Milwaukee, Wisconsin, United States of America, 3 Centre National de la Recherche Scientifique Université́ Pierre et Marie Curie, UMR CNRS, UPMC 7144, Roscoff, France, 4 Department of Biology, University of California Santa Cruz, Santa Cruz, California, United States of America, 5 Marine Science Institute, University of California Santa Barbara, Santa Bárbara, California, United States of America Abstract The genetic consequences of living on the edge of distributional ranges have been the subject of a largely unresolved debate. Populations occurring along persistent low latitude ranges (rear-edge) are expected to retain high and unique genetic diversity. In contrast, currently less favourable environmental conditions limiting population size at such range-edges may have caused genetic erosion that prevails over past historical effects, with potential consequences on reducing future adaptive capacity. The present study provides an empirical test of whether population declines towards a peripheral range might be reflected on decreasing diversity and increasing population isolation and differentiation. We compare population genetic differentiation and diversity with trends in abundance along a latitudinal gradient towards the peripheral distribution range of Saccorhiza polyschides, a large brown seaweed that is the main structural species of kelp forests in SW Europe. Signatures of recent bottleneck events were also evaluated to determine whether the recently recorded distributional shifts had a negative influence on effective population size. Our findings show decreasing population density and increasing spatial fragmentation and local extinctions towards the southern edge. Genetic data revealed two well supported groups with a central contact zone. As predicted, higher differentiation and signs of bottlenecks were found at the southern edge region. However, a decrease in genetic diversity associated with this pattern was not verified. Surprisingly, genetic diversity increased towards the edge despite bottlenecks and much lower densities, suggesting that extinctions and recolonizations have not strongly reduced diversity or that diversity might have been even higher there in the past, a process of shifting genetic baselines. Citation: Assis J, Castilho Coelho N, Alberto F, Valero M, Raimondi P, et al. (2013) High and Distinct Range-Edge Genetic Diversity despite Local Bottlenecks. PLoS ONE 8(7): e68646. doi:10.1371/journal.pone.0068646 Editor: Sharyn Jane Goldstien, University of Canterbury, New Zealand Received March 28, 2013; Accepted May 30, 2013; Published July 10, 2013 Copyright: © 2013 Assis et al. This is an open-access article distributed under the terms of the Creative Commons Attribution License, which permits unrestricted use, distribution, and reproduction in any medium, provided the original author and source are credited. Funding: This study was supported by the FCT - Portuguese Science Foundation (project PTDC/AAC-CLI/109108/2008 (EDGES), project EXCL/AAG- GLO/0661/2012 (EXTANT) and PhD fellowship ref. SFRH / BD / 65702 / 2009). The funders had no role in study design, data collection and analysis, decision to publish, or preparation of the manuscript. Competing interests: The authors have declared that no competing interests exist. * E-mail: [email protected] Introduction Understanding the processes shaping genetic diversity of range-edge populations is an important current challenge, particularly where rich former glacial refugia populations with high conservation value have become isolated in decreasing suitable habitat islands [1]. Accordingly, empirical data for populations at distributional edges do not all support the same general geographic pattern. These can vary from diverse persistent populations where habitat has remained favourable over the long term [2] to margins with small and low density populations where genetic diversity may be lower and clonal reproduction and inbreeding may prevail [3,4]. Such populations might represent the last refugia of threatened distinct genetic diversity [5,6]. The genetic diversity of a population reflects both current and past events. The prediction of lower genetic diversity as a response to reductions in effective population size and gene flow towards edges [7,8] assumes a current trend in abundance, from abundant central regions of distribution towards small and less dense populations; an assumption that has rarely been confirmed empirically. Many studies failed to find evidence for larger abundances at the centre of species distributions [9] and the few that supported the hypothesis were limited to a small number of species [10] and sites [11,12]. Yet, in most studies considering genetic diversity, a decrease in within population diversity and an increase in genetic PLOS ONE | www.plosone.org 1 July 2013 | Volume 8 | Issue 7 | e68646
-
Upload
structbio-pitt -
Category
Documents
-
view
0 -
download
0
Transcript of High and Distinct Range-Edge Genetic Diversity despite Local Bottlenecks
High and Distinct Range-Edge Genetic Diversity despiteLocal BottlenecksJorge Assis1*, Nelson Castilho Coelho1, Filipe Alberto1,2, Myriam Valero3, Pete Raimondi4, Dan Reed5,Ester Alvares Serrão1
1 Centro de Ciências do Mar do Algarve, CIMAR-Laboratório Associado, University of Algarve, Campus de Gambelas, Faro, Portugal, 2 Department ofBiological Sciences, University of Wisconsin-Milwaukee, Milwaukee, Wisconsin, United States of America, 3 Centre National de la Recherche ScientifiqueUniversité́ Pierre et Marie Curie, UMR CNRS, UPMC 7144, Roscoff, France, 4 Department of Biology, University of California Santa Cruz, Santa Cruz,California, United States of America, 5 Marine Science Institute, University of California Santa Barbara, Santa Bárbara, California, United States of America
Abstract
The genetic consequences of living on the edge of distributional ranges have been the subject of a largelyunresolved debate. Populations occurring along persistent low latitude ranges (rear-edge) are expected to retain highand unique genetic diversity. In contrast, currently less favourable environmental conditions limiting population size atsuch range-edges may have caused genetic erosion that prevails over past historical effects, with potentialconsequences on reducing future adaptive capacity. The present study provides an empirical test of whetherpopulation declines towards a peripheral range might be reflected on decreasing diversity and increasing populationisolation and differentiation. We compare population genetic differentiation and diversity with trends in abundancealong a latitudinal gradient towards the peripheral distribution range of Saccorhiza polyschides, a large brownseaweed that is the main structural species of kelp forests in SW Europe. Signatures of recent bottleneck eventswere also evaluated to determine whether the recently recorded distributional shifts had a negative influence oneffective population size. Our findings show decreasing population density and increasing spatial fragmentation andlocal extinctions towards the southern edge. Genetic data revealed two well supported groups with a central contactzone. As predicted, higher differentiation and signs of bottlenecks were found at the southern edge region. However,a decrease in genetic diversity associated with this pattern was not verified. Surprisingly, genetic diversity increasedtowards the edge despite bottlenecks and much lower densities, suggesting that extinctions and recolonizations havenot strongly reduced diversity or that diversity might have been even higher there in the past, a process of shiftinggenetic baselines.
Citation: Assis J, Castilho Coelho N, Alberto F, Valero M, Raimondi P, et al. (2013) High and Distinct Range-Edge Genetic Diversity despite LocalBottlenecks. PLoS ONE 8(7): e68646. doi:10.1371/journal.pone.0068646
Editor: Sharyn Jane Goldstien, University of Canterbury, New Zealand
Received March 28, 2013; Accepted May 30, 2013; Published July 10, 2013
Copyright: © 2013 Assis et al. This is an open-access article distributed under the terms of the Creative Commons Attribution License, which permitsunrestricted use, distribution, and reproduction in any medium, provided the original author and source are credited.
Funding: This study was supported by the FCT - Portuguese Science Foundation (project PTDC/AAC-CLI/109108/2008 (EDGES), project EXCL/AAG-GLO/0661/2012 (EXTANT) and PhD fellowship ref. SFRH / BD / 65702 / 2009). The funders had no role in study design, data collection and analysis,decision to publish, or preparation of the manuscript.
Competing interests: The authors have declared that no competing interests exist.
* E-mail: [email protected]
Introduction
Understanding the processes shaping genetic diversity ofrange-edge populations is an important current challenge,particularly where rich former glacial refugia populations withhigh conservation value have become isolated in decreasingsuitable habitat islands [1]. Accordingly, empirical data forpopulations at distributional edges do not all support the samegeneral geographic pattern. These can vary from diversepersistent populations where habitat has remained favourableover the long term [2] to margins with small and low densitypopulations where genetic diversity may be lower and clonalreproduction and inbreeding may prevail [3,4]. Such
populations might represent the last refugia of threateneddistinct genetic diversity [5,6].
The genetic diversity of a population reflects both current andpast events. The prediction of lower genetic diversity as aresponse to reductions in effective population size and geneflow towards edges [7,8] assumes a current trend inabundance, from abundant central regions of distributiontowards small and less dense populations; an assumption thathas rarely been confirmed empirically. Many studies failed tofind evidence for larger abundances at the centre of speciesdistributions [9] and the few that supported the hypothesis werelimited to a small number of species [10] and sites [11,12]. Yet,in most studies considering genetic diversity, a decrease inwithin population diversity and an increase in genetic
PLOS ONE | www.plosone.org 1 July 2013 | Volume 8 | Issue 7 | e68646
differentiation between populations were observed towards theperipheral range [8]. The prevalence of effects of currentpopulation abundance patterns over past history in determiningcurrent genetic diversity might reflect the fact that extinction isforever, even when caused by unsuitable conditions that aretemporary. Once lost, unique alleles occurring at range edgescannot reappear no matter how favourable the habitatbecomes. The loss of adaptive variation towards range edgesmay compromise a population’s ability to evolve [13,14],thereby increasing the threat of extinction [15–17]. This mightbe accentuated in isolated populations of annual species,which are naturally more prone to local bottlenecks andextinctions [18]. Thus, areas where past history created highergenetic diversity due to long term persistence of populationsexposed to climatic refugia, or gene flow from differentiatedpopulations [7,19,20] are expected to be lost by currentbottlenecks, although regional diversity might retain a diversesignature [5].
The relationship between the geographic distributions ofabundance and genetic diversity now appear more complexand interesting than previously assumed. This complexitystrongly alters simplistic biogeographic predictions aboutpopulation dynamics [11], genetic structure of populations, andspecies responses to climate change [21]. To move beyondsimplistic assumptions it is necessary to integrate moresources of data (e.g., population demography and geneticstructure) to narrow the range of viable hypotheses that explainthe ecological and evolutionary mechanisms underlyingspecies distribution [22]. Moreover, studies frequently comparesamples from sites with high abundances of focal species withvery few in the peripheral range, assuming less abundance andhigher levels of isolation without an empirical verification ofdemographic variables [23,24]. This approach is unlikely todistinguish whether geographic variation in genetic structurecovaries with contemporary population abundance andperipheral isolation, or is the result of historical processes [7].
An interesting model to study the genetic implications ofdistributional ranges from an abundant to a peripheral region isthe Portuguese coast along western Iberia. This is a regionwith a biogeographical interface where a wide range of marinespecies show latitudinal clines in abundance, along a narrowstrip of shoreline habitat essentially in one dimension, fromNorth to South [25,26]. One such species is the annual kelpSaccorhiza polyschides, which is the main canopy speciesforming kelp forests in this region. This species sharplydeclines from being a highly abundant dominant species in thenorth to being rare near its distributional limit in the south. Sucha spatially unidimensional model has previously proveneffective in testing phylogeographic hypotheses in marinespecies [9,27].
This study addresses the genetic consequences of a sharpdecline in abundance at the distributional margin of S.polyschides. This was achieved by quantifying the latitudinalgradient in population density towards the southern edge ofdistribution, and assessing whether it was related to decreasinggenetic diversity and increasing differentiation. We used thisinformation to test whether populations closer to the rangeboundary show no change in (1) relative densities, (2)
fragmentation (3), genetic differentiation (4), genetic diversityand (5) signatures of recent bottleneck events (i.e. populationturnover)
Methods
Ethics StatementNo specific permits were required for the sampling as the
sites were not privately-owned or protected in any way, and thefield studies did not involve endangered or protected species.
Focal species, study area and sample collectionThe annual kelp S. polyschides is an important ecosystem-
building species in European waters [28]. This short-livedpioneer species is distributed from the western coast ofNorway, extending southward to Scotland, Ireland, Wales,southwest England, Brittany, France and along the Spanishand Portuguese coasts, meeting its southern boundary inMorocco. It can also be found in few deep (~ 30m) isolatedsites of the Western Mediterranean Sea [29].
Sampling sites for S. polyschides covered the entire westcoast of Portugal, including searches in areas beyond thecurrent southern limit of the species in mainland. This region,which happens to coincide with the boundaries of a politicalcountry, is an excellent model coastline to study the geneticimplications of distributional ranges from an abundant to aperipheral region for 3 main reasons: 1) Gradual abundancegradient: It coincides perfectly with a sharp linear gradient fromabundant continuous populations in the North, to small patchyfragmented populations in the center-southwest, to completeabsence of the species along the southern coast. 2) Availabilityof long-term historical records of the species occurrence(particularly from Assis et al., 2009) showing recent rangeshifts along this coast. 3) Coastal southern limit: The southwestof Portugal is the southern range edge of the coastaldistribution of S. polyschides. Beyond this region there are only2 areas that support S. polyschides. Both are separated byhundreds to thousands of km in opposite directions(southwards, eastwards and westwards), are not part of thecoastal distribution and thus are not useful to address thequestion of this paper. These two isolated areas are a) thestrong upwelling points of Alboran (East) and Morocco (South),and b) the very deep offshore banks (e.g. Gorringe andMessina) where oceanic waters are so transparent that theyallow the species to occur at depth ranges of about 40-80 m,much beyond the coastal depth ranges. Species distributionsare not always linear with latitude and pockets or islands canoccur beyond the limits of the linear latitudinal distribution, dueto particular unique combinations of habitat conditions [6,30].
Along this sampled area populations recruit in spring andreach their highest abundance during summer. Adultindividuals (sporophytes) die in the autumn and are absentduring the winter, starting to recruit again in spring [31].
The Portuguese coastline was divided into 25 juxtaposedcells of 25 km from 42,0° N to 37,0° N, and for better resolutionin North–South comparisons, the sampling effort wasintensified at the 3 northernmost and 3 southernmost cells bydividing the 25 km cells into 5 sub-cells of 5 km (Figure 1).
High Genetic Diversity despite Local Bottlenecks
PLOS ONE | www.plosone.org 2 July 2013 | Volume 8 | Issue 7 | e68646
Forests of S. polyschides were sampled at the centroid sites ofeach cell, during the summers of 2008 and 2010, by means ofSCUBA diving and snorkelling. If no kelp was found, at leasttwo more randomly chosen sites in the same cell weresurveyed with the same objective.
All sampling was conducted at comparable depths, shallowerthan 8 m, in order to avoid confounding latitude with the effectsof depth, since the abundance of S. polyschides varies withdepth [32]. Species distribution was assessed in 2008 and2010, by collecting presence and absence records at eachsampling site. In the summer of 2010, the density of S.polyschides was also sampled and tissue was collected forgenetic analysis. For density estimates, four quadrats (0.5 m x0.5 m) were placed along three 20 m long transectshaphazardly laid in an extant kelp forest, at 5, 10, 15 and 20 m(totalling 12 quadrats). In each quadrat all S. polyschidesindividuals were counted. For genetic analyses, 30 individualswere sampled along transects by removing a piece of the bladeabove the meristem. These were preserved in silica dryingcrystals until DNA extraction.
Population distribution and spatial heterogeneityTo evaluate inter-annual variability in the distribution and
abundance of S. polyschides, the presence and absencerecords were plotted for both sampling years, together with anextensive list of historical geo-referenced occurrences gatheredfrom literature (dataset and references can be obtained fromthe authors upon request). Furthermore, mean density of S.polyschides per site (expressed as individuals per m2) wascalculated with the quadrat counts for 2010 samples. To inferthe fragmentation level of kelp per site, the coefficient ofvariation among all quadrat counts was determined as a
measure of dispersion that represents within site landscapespatial heterogeneity [33] independently of the mean density.To test whether S. polyschides was less dense or moreheterogeneous at sites towards the distributional edge, linearregression models were fitted between latitude and density,and between latitude and the coefficient of variation of density.Predictors were transformed if needed (log), homogeneity ofvariances and normality of models were assessed by graphicalinspection of the residuals versus fitted values [34] and byperforming the Shapiro-Wilk test [35] with H0: the residualswere normally distributed.
Microsatellite amplification, scoring and correctionGenomic DNA was isolated from 5 to 10 mg of dried tissue
using a CTAB method and Filter Plates (MSFBN6B10,Milllipore) as described in [36]. A total of seven microsatelliteloci (2F7, 1A1(2), 1E10, 3A10, 2A4, 3D12 and 2B3 [37]) wereamplified for all sampling units. PCR reactions in 15 µlcontained ±20 ng of DNA, 0.16 µM of forward 5’ fluorochromelabeled primer and 0.33 µM of reverse primer, 0.8 mM ofdNTPs (Bioline), 2.0 or 2.5 mM of MgCl2, 3.0 µl of 5x PCRBuffer and 0.4 U of GoTaq Polymerase (Promega, Madison,WI). Cycling conditions consisted of an initial denaturing step of5 min at 95°C, followed by 35 cycles of 30 s at 95°C, 30 s atannealing temperature, 45 s at 72°C, and a final elongationstep at 72°C for 20 minutes. All PCR reactions were performedon a GeneAmp 9700 thermocycler (PE Applied Biosystems,Foster City, California, USA). Fragment length was analyzedon an ABI PRISM 3130xl DNA analyzer (Applied Biosystems)using the GeneScan 500 LIZ standard.
Raw allele sizes were scored using the software STRand[38] and binned into allele classes using the MsatAllele
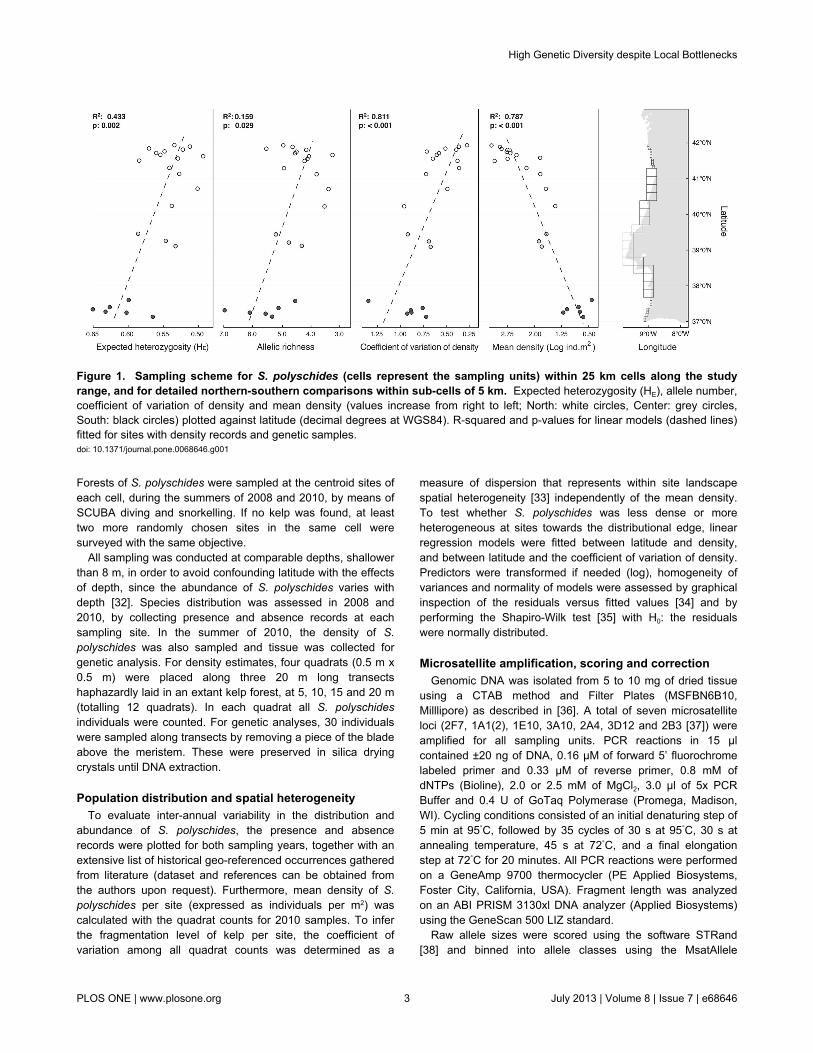
Figure 1. Sampling scheme for S. polyschides (cells represent the sampling units) within 25 km cells along the studyrange, and for detailed northern-southern comparisons within sub-cells of 5 km. Expected heterozygosity (HE), allele number,coefficient of variation of density and mean density (values increase from right to left; North: white circles, Center: grey circles,South: black circles) plotted against latitude (decimal degrees at WGS84). R-squared and p-values for linear models (dashed lines)fitted for sites with density records and genetic samples.doi: 10.1371/journal.pone.0068646.g001
High Genetic Diversity despite Local Bottlenecks
PLOS ONE | www.plosone.org 3 July 2013 | Volume 8 | Issue 7 | e68646
package [39] in the R software [40]. Loci were tested for nullalleles and scoring errors using the software Microchecker [41].Deviations from Hardy–Weinberg equilibrium and for linkagedisequilibrium between pairs of loci were computed withFSTAT [42].
Estimates of genetic diversityGenetic diversity, as allelic richness (A) and Nei’s gene
diversity (expected heterozygosity; HE), were determined perlocus and per site for all loci, using FSTAT. To test whethergenetic diversity decreased towards the edge, a linearregression model was fitted between latitude and geneticdiversity per site (A and HE). Homogeneity and normality ofboth models was assessed. Allelic richness was also computedfor each genetic cluster (see below), standardised to thenumber of individuals and coastal distance range of thesmallest cluster, using StandArich [43]. The number of uniquealleles per genetic cluster was also determined.
Population genetic structureThe number of distinct genetic clusters (K) present in the
studied region was inferred by running software Structure [44]with a burning time of 2x10⁵ repetitions and 1x10⁶ iterationsexploring K from 1 to 8, with admixture allowed and without anya priori population assignments. The estimation of the likelynumber of clusters used the log probability of data Pr(X/K) [44]for each value of K and the DK criteria of [45]. For the mostlikely K, population assignment was graphically displayed withDistruct [46]. The patterns of genetic differentiation wereillustrated through a Factorial Correspondence Analysis (FCA)of population multiscores computed using GENETIX 4.05 [47].Moreover, the association between the mean genetic similaritycalculated over all loci and the geographic regions was shownby a consensus neighbour-joining (NJ) network based onCavalli-Sforza & Edwards [48] genetic distances among allsites, computed using the software Populations [49] with 1x10⁵
bootstrap resamplings.Levels of differentiation between sites were inferred using
the FST estimator computed over loci, and within genetic groupsusing both FST and Jost’s D [50]. Hierarchical analysis ofmolecular variance (AMOVA) was computed using Genodive[51], based on allele frequency information under 999permutations [52]. Variance components were extracted for 3hierarchical levels (1) among individuals within sites (2), amongsites within genetic groups and (3) among genetic groups.Genetic groups were partitioned following the outcomes of theFCA and the Bayesian clustering analysis.
Isolation by distance (IBD) was evaluated within groups,using pairwise estimates of mean genetic distance (FST ⁄ (1 -FST)) between sites, against pairwise minimum marinedistances. Marine distances were computed with packagegdistance for R [40] with least-cost distance between sitesusing land mass as an infinite resistance surface. The nullhypothesis of no correlation between pairwise geographicdistance and genetic distance matrices [53,54] was testedusing Mantel non-parametric test [55] based on 1x10⁵
permutations as implemented in Genodive.
Inference of population bottleneckFor each sampling site, evidence for recent bottleneck
events was tested using two methods: (1) heterozygosityexcess [56] and (2) M-ratios [57].
Populations that have experienced a recent bottleneck arepredicted to temporarily lose allelic diversity at a significantlyfaster rate than heterozygosity [56]. This excess inheterozygosity was tested with software Bottleneck [58] using9999 simulations. The Two-Phase Model (TPM) was usedsince it’s more appropriate and realistic for microsatellites[56,58]. The frequency of step mutations was set to 0.9 (ps)and the variance of mutations to 12 (generic values, typical formany microsatellite markers [58,59];. Based on the number ofloci in our dataset (less than 20), the Wilcoxon test wasperformed for the statistical analysis with the null hypothesis ofno significant heterozygosity excess (on average) across loci[56,60].
The M-ratio test was performed with the software M_P_VAL[57]. This method is based on the premise that during abottleneck, rare alleles are most likely to be lost, and thenumber of observed allelic states (k) reduces faster than therange of allele size (r), which results in a reduced M-ratio (M =k/r). Critical significance values (Mc), the lower boundary of theone-sided 95% confidence interval, were calculated using thesoftware Critical_M [57] with 10,000 randomizations [61].These calculations were made using ps, Dg (the size of nonone-step changes) and Theta = 4Neµ, three parameters knownto influence the Mc results [59]. Since there is no informationon these parameters for the S. polyschides sampled sites, andto minimise type I errors, the Mc value for each site wascalculated with the mean size of non-stepwise mutations = 3.5and a highly conservative Theta = 10 (which assumes largerNe and lower µ). The proportion of mutations was set to 0.9 asrecommended by Garza & Williamson [57]. Observed M-ratiosbelow Mc indicate a bottleneck.
Results
Sample collection and microsatellite amplificationAlong the Portuguese coast, presence-absence records of S.
polyschides were performed on 48 visited cells (Table S1). At23 of these cells, populations were sampled for density andgenetic attributes. At one particular site (#8) only 16 individualswere found, precluding accurate density estimates withinquadrats although samples could still be taken for geneticanalysis.
All seven loci were polymorphic across all sites (see TableS2 for the details of gene diversity, allele richness and FIS
values for each site and each locus). A total of 96 alleles wereobtained from 676 genotyped individuals, ranging from 7 to 20alleles per locus (mean = 13.71, SD = 4.39), and on a singlesite from 23 to 41 alleles (mean = 35.52, SD = 5.18).Significant FIS values were obtained, particularly in southernsites (#15, 17, 19, 20, 21, 22 and 23). No linkage disequilibriumwas detected between all pairs of loci (Table S2). Microcheckeranalyses indicated no signs of stuttering error, but with theexception of one locus (3D12), all showed evidence of nullalleles, particularly 2A4 (with 0.135 ± 0.078 null alleles on
High Genetic Diversity despite Local Bottlenecks
PLOS ONE | www.plosone.org 4 July 2013 | Volume 8 | Issue 7 | e68646

average, resulting in higher Fis values compared to other loci,Table S2). Yet, null alleles were uncommon to rare across loci(null alleles per locus < 0.2 [62]), and had no consistencyamong sites. To account for possible null allele effects, allanalyses of inter-population structure and bottleneck were runwith and without locus 2A4, and its exclusion did not changethe results. Hence, we did not exclude this locus from ouranalyses.
Population abundance and spatial heterogeneityS. polyschides was well established in the North of Portugal.
North of 39° N, populations were present where there wassuitable habitat and records were systematic throughoutsampling years and literature references (Figure 2).Conversely, south of this latitude, a large decline of S.polyschides was identified in recent years. Populations of S.polyschides at most southern sites where it was known to bepresent were extinct in 2008 and 2010, and the few extentpopulations were small and variable. Remarkably, at thesouthern range, some sites that were extinct in 2008 wererecolonized from 2008 to 2010.
The density of kelp per sampling site varied between ca. 2and 26 individuals·m2 (Figure 1). The highest densities wereregistered in the northern sites and a decline was foundtowards the South (R2 = 0.787, p < 0.001). Below the densenorthern kelp forests, two sharp declines in density wereobserved along the coast, the first below latitude 41° N (mean
density < 10 individuals/m2) followed by an even sparser regionin the south (mean density < 5 individuals/m2), below latitude38° N. The among site variation in kelp density, quantified bythe coefficient of variation of the densities, was lowest in thenorth, increasing significantly towards the south (Figure 1; R2 =0.811, p < 0.001).
Population genetic structureThe Structure analyses, based on both the Evanno [45] and
the Pritchard [44] criteria, revealed 3 groups (K=3), separatingthe northern and the southern sites, plus a central region(Figure 2 Figure S1). When we analysed K=2 (data not shown),the distinct group in the central region appeared as an admixedzone, where alleles from the south and north appearedtogether (Figure S2). Based on these results, we distinguisheda central group and conducted analyses separately for 3groups, hereafter designated North, Centre and South groups,composed by 14, 3 and 6 sites, respectively.
The genetic differentiation illustrated by the FCA and by theNJ network also revealed differentiation of 3 well supportedclusters (Figure S3) corresponding to the same groupsdetermined by the Structure analysis. Moreover, both FCA andNJ network revealed higher genetic distance between siteswithin the Centre and South than within the North.
Pairwise mean FST and Jost’s D levels of differentiation werehigher between the southern sites than between the central ornorthern sites (Figure 2). These values were significant among
Figure 2. Historical distribution of S. polyschides based on surveys (2008 and 2010) and literature records (onlycomparable sites are shown; Open circle: presence, Black circle: absence). Habitat availability shown in black (Rocky reef;data from Portuguese sedimentary charts [70]) along the coast for depths above 20 m (the observed depth distribution of S.polyschides [92]). Genetic subdivision of S. polyschides based on STRUCTURE. The proportions of individual multilocus genotypesassigned to K=3 virtual clusters are indicated by the colours. Standardized allele richness (Std A), Mean FST, Mean Jost’s D andnumber of unique alleles per genetic group.doi: 10.1371/journal.pone.0068646.g002
High Genetic Diversity despite Local Bottlenecks
PLOS ONE | www.plosone.org 5 July 2013 | Volume 8 | Issue 7 | e68646
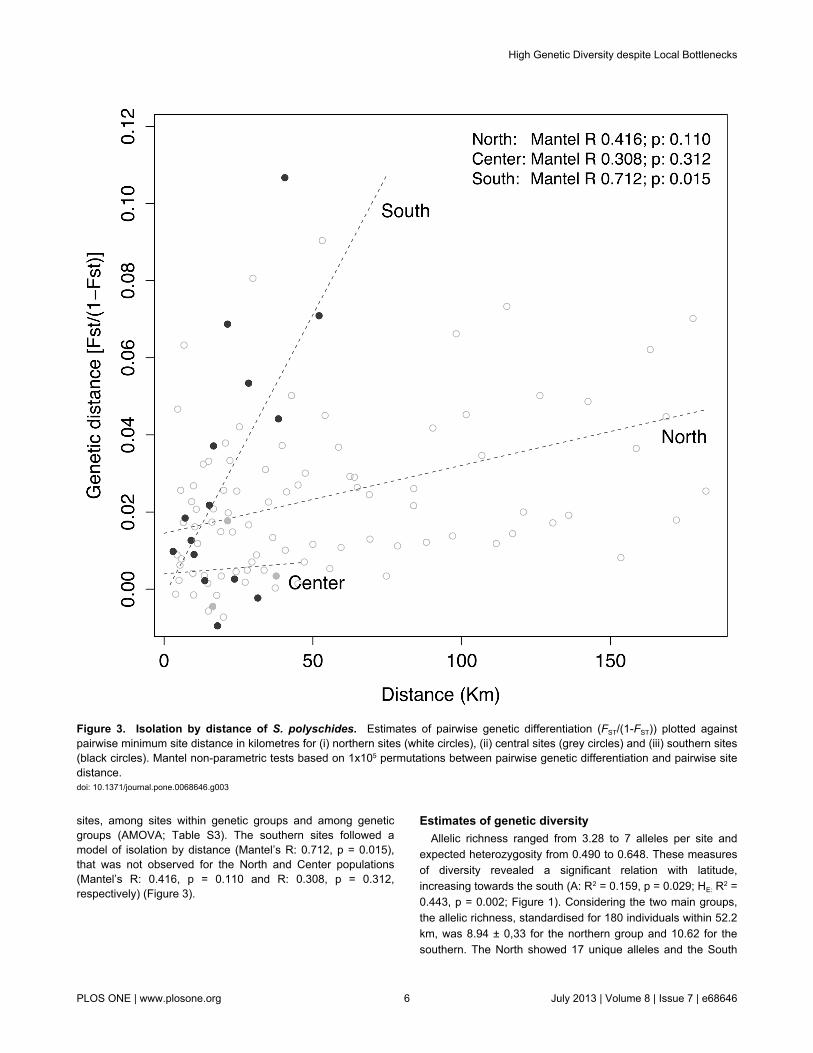
sites, among sites within genetic groups and among geneticgroups (AMOVA; Table S3). The southern sites followed amodel of isolation by distance (Mantel’s R: 0.712, p = 0.015),that was not observed for the North and Center populations(Mantel’s R: 0.416, p = 0.110 and R: 0.308, p = 0.312,respectively) (Figure 3).
Estimates of genetic diversityAllelic richness ranged from 3.28 to 7 alleles per site and
expected heterozygosity from 0.490 to 0.648. These measuresof diversity revealed a significant relation with latitude,increasing towards the south (A: R2 = 0.159, p = 0.029; HE: R2 =0.443, p = 0.002; Figure 1). Considering the two main groups,the allelic richness, standardised for 180 individuals within 52.2km, was 8.94 ± 0,33 for the northern group and 10.62 for thesouthern. The North showed 17 unique alleles and the South
Figure 3. Isolation by distance of S. polyschides. Estimates of pairwise genetic differentiation (FST/(1-FST)) plotted againstpairwise minimum site distance in kilometres for (i) northern sites (white circles), (ii) central sites (grey circles) and (iii) southern sites(black circles). Mantel non-parametric tests based on 1x10⁵ permutations between pairwise genetic differentiation and pairwise sitedistance.doi: 10.1371/journal.pone.0068646.g003
High Genetic Diversity despite Local Bottlenecks
PLOS ONE | www.plosone.org 6 July 2013 | Volume 8 | Issue 7 | e68646
showed 14 unique alleles. When the central admixture zoneincluded, the within group allelic richness, standardised for 90individuals within 37.6 km was 7.24 ± 0.38 for the North, 7.14for the Center and 8.94 ± 0.41 for the South. The number ofunique alleles was 15 in the North, 2 in the Center, and 14 inthe South (Figure 2).
Inference of population bottleneckThe Wilcoxon test for the null hypothesis of no significant
heterozygosity excess across loci showed no signs ofbottleneck (Table S4). On the other hand, the M-ratio testretrieved bottleneck signs for three sites located in theSouthern region (sites #19, 21 and 23; Figure 2 Table S4). Oursurvey data show that the forests at sites #19 and #23 werelocally extinct in 2008, but recolonized in 2010, the year whenour genetic sampling took place.
Discussion
Our results show persistence of high unique genetic diversityat a species range edge, despite evidence for strongdemographic regressions, local extinctions, and extinctionsfollowed by recolonizations. Although we found a decrease indensity and an increase in fragmentation with latitude towardsthe distributional edge of S. polyschides, the hypothesis of adecrease in genetic diversity with decreasing density was notverified, contradicting expectations. Contrary to density andpersistence data, allelic richness and heterozygosity increasedtowards the more sparsely populated southern range edge.Conversely, marginal southern sites were strongly geneticallydifferentiated, inbreeding coefficients were higher and signs ofrecent genetic bottlenecks were detected, fitting expectationsfor small isolated populations undergoing distributionalregression. These results raise the question as to why geneticdiversity was higher at a low latitude edge despite lowpopulation density, fragmentation, genetic isolation, bottlenecksand inbreeding. Below we discuss several potential hypothesesthat may explain this pattern.
Peripheral population declineA north to south decline in density was evident as a set of
latitudinal clines, decreasing density and increasingfragmentation (spatial heterogeneity of the population density).A considerable number of marine species also exhibitlatitudinal abundance declines along this coast towards theirdistributional limits [25]. Southern limits of some cold-waterspecies have shifted north, possibly associated to recentwarming associated with the sharp sea surface temperaturegradient along this coast [6,63]. However, in the case of S.polyschides, the decline in density towards the south has beenmagnified in recent decades, when local populations havebeen sharply reduced or even disappeared temporally orpermanently. As a result, the genetic diversity of southernpopulations might thus be critically endangered.
Peripheral population fragmentationSignificant and strong isolation by distance (IBD) was only
present at the southern edge region, a likely consequence of
habitat fragmentation as seen in other studies [5,63,64].Moreover, the levels of genetic differentiation between siteswere higher and most were significant at the edge. Theseresults show that the northern and central populations arehighly connected within the region, whereas those towards thesouthern periphery of the range have lower gene flow betweenthem, likely due to their occurrence as discrete, geographicallyisolated patches [16,65]. The observed patterns of abundancecan explain this result: S. polyschides tends to be less denseand more isolated towards the South, sharply increasinggenetic distances and consequently IBD in this marginal zone.Such low densities may also increase the variation in matingsuccess, which in turn explains the higher inbreeding values ofthe southern sites. Low sporophyte densities might be reflectedin variable and patchy gametophyte densities, decreasingeffective population size as only the spores that happen tosettle in close proximity to others (within microscopic scales)will form gametophytes close enough to achieve reproductivesuccess [66,67].
Phylogeographic influences on diversityAlong the studied range of western Iberia, our results reveal
two major genetic groups, North and South, with an admixtureregion in the Centre. Their high genetic diversity and highnumber of unique alleles indicate that both regions representpopulations that have been large, stable and persistent for longenough to accumulate unique mutations and maintain allelicdiversity. They might thus represent genetic groups that wereseparated at distinct glacial refugia, a role that is alsosupported by their degree of differentiation from otherpopulations from central Europe (Lamy et al, unpublisheddata), similarly to other marine species for which the IberianPeninsula was a glacial refugium [2,5,6,68]. Such reservoirs ofunique genetic variation have high conservation value [1,69].The admixed genotypes in the central region and the rarity ofunique alleles there, relative to the northern and southernregions, indicate that this is not an anciently diverged group butrather a more recent contact zone.
The geographical areas between the northern, central andsouthern forests were sampled and the absence of kelp forestsreflected the paucity of suitable rocky habitat. Rocky reefsoccur throughout the sampling region, but extensive sandyareas separate these kelp groups (Figure 2 [25,70]). Habitatdiscontinuity was associated with increased geneticdifferentiation between patches of the giant kelp Macrocystispyrifera in southern California [71] and Laminaria digitata in theEnglish Channel [72], which is to be expected given the limitsof spore dispersal of such species [72–74]. Such limitations ondispersal are insufficient to assure regular connectivity betweenthe spatially disconnected areas from our study. Yet, despitethe breaks in suitable habitat between the genetic groups,some degree of north–south connectivity would be expectedfrom the predominant spring wind and oceanographiccirculation along the Portuguese coast [75]. Surface currentscould carry floating rafts of S. polyschides, with high dispersalpotential in areas with strong unidirectional currents [76,77].Such occasional large scale dispersal across km scales mustbe possible, as it certainly occurred in the past during the
High Genetic Diversity despite Local Bottlenecks
PLOS ONE | www.plosone.org 7 July 2013 | Volume 8 | Issue 7 | e68646
colonization of distant available habitat. However, there isstrong support for the idea that genetic groups have remaineddistinct over considerable time, as evidenced by theabundance of alleles unique to the north and south sites. Suchgenetic boundaries might also be explained by prioritycolonization effects, which block the spread of later colonizers,as recently proposed for other brown algae [2,78,79].
Persistence of diversity despite bottlenecksHigh genetic diversity is expected where populations have
been large and persisted for long periods, without significanteffects of drift, local extinctions and bottlenecks. Despite apossible glacial refugial origin of the ancient high and uniquesouthern genetic diversity of S. polyschides, its recent historyof regression and local extinctions recorded along this areawas predicted to reflect lower diversity relative to northernIberia. Conversely, recent bottlenecks and small populationsize with its associated drift effects, did not noticeably affectdiversity patterns along this distributional edge.
How can genetic diversity survive over drastic populationsize reductions? We hypothesize possible non-exclusivemechanisms that could halt the loss of diversity of suchmarginal populations. One hypothesis is the occurrence ofmicroscopic stages (such as gametophytes and very youngsporophytes) able to persist over unfavourable periods. Thesecould maintain genetic diversity in cryptic stages despiteapparent temporary local extinctions and bottlenecks.Experiments on other kelp species, demonstrated thatmicroscopic gametophytes can be maintained in culture forover 7 years [80] and that when growth conditions becomefavourable, these produce adults faster and more reliably thangametophytes that had never been subject to developmentaldelay [81,82]. If such long developmental delays also occur innatural field conditions, then even at low densities of adultsporophytes, this delaying strategy may increase effectivepopulation size [83], by playing a role analogous to seed banksin plants, allowing temporal persistence of multiple cohorts ofpotential recruits that store genetic diversity and resumedevelopment in favourable years. This hypothesis is howevernot supported by the evidence from field studies, whichidentified arrested development stages only on the order ofmonths, not years (e.g., Barradas [84] on this same coast, seealso reviews by [81,85,86]). Moreover, a temporal populationgenetic survey (covering 7–9 years) revealed that a localgametophyte “bank” might not be sufficient to prevent geneticinstability of small and isolated populations of the Europeankelp Laminaria digitata [87]. Furthermore, our findings ofhighest inbreeding coefficients in southern locations do notsupport the hypothesis of large effective population sizeshidden in cryptic stages.
An alternative hypothesis is the persistence of suitablehabitat refugia at southern locations, namely deeper offshorehabitats, where light penetration might still be sufficient for kelppersistence, as theoretically predicted for clearer offshorewaters [88]. Given the recent increase in sea temperaturedocumented for this transitional zone, hypothetical deepoffshore banks functioning as cold water refugia, would providebetter niche conditions than shallower warmer coastal sites
[88]. Such banks of high evolutionary significance [89]connected to coastal sites [90] could contribute with allelesperiodically, thereby halting declines in genetic diversity.Although such deep offshore kelp forests with S. polyschidesexist on underwater mounts (at ca. 40-80 m depths), these arelocated a few hundred km offshore of the southerndistributional edge (Ormonde and Gettysburg Bank [91,92]),and are genetically differentiated from these continental sites(Assis et al. unpublished data), rendering those unlikely to befrequent source populations for this annual species along itscontinental edge. Moreover, given the strong IBD found in thesouth, only a network of seamounts could explain the rescuingof diversity of such differentiated and isolated sites.
Local bottlenecks could also be rescued by connectivity fromjust the few neighbouring remaining patches in the area. Yet,once more, the higher levels of differentiation found betweenthese patches do not support the idea that migration from localremaining sites would be a frequent process. Still, thishypothesis cannot be ruled out since it’s difficult to survey thebottom of the ocean fully and extant populations might occur inareas that we are not aware of. In such a scenario, foundereffects could lead to rapid differentiation of patches putativelyrecolonized by very few occasional migrants from otherpatches. Yet, this would have been associated with a strongreduction in diversity in such recolonized patches, which is notsupported by the presence of many alleles and of alleles thatare absent in their neighbours (Figure S2).
A last, but not the least likely hypothesis, is that of shiftinggenetic baselines, whereby information about the past is lostwith increasing extinctions, a problem already reported forother species along this coastline [5,6]. The higher southerndiversity does not rule out that strong genetic diversity loss hasoccurred there. Our bottleneck results are congruent with thehypothesis that, although still richer in genetic diversity thandenser northern populations, these southern patches could bethe remnants of populations that once had greater geneticdiversity.
Extinction of genetic variants is likely to happen frequentlywithout it having been recorded to have ever existed before.This problem calls for studies of the potentially rich and uniquegenetic diversity that might still exist at pocket range edges.Rear edges below postglacial expansion zones are likelyfrequent along northern Atlantic shores, and in cases ofexpansion from introgressed genomes at contact zones, therear edges may even represent the only surviving populationswith the native genomes for the species, as has been reportedfor other brown algae [93,94]. Marginal populations with suchancient private diversity raise concerns for future climatechange predictions, particularly at the warmer edges of thedistribution. Besides reporting unique allelic diversity, there isstrong need to understand whether local adaptations exist insuch endangered populations, increasing their conservationvalue. Although local adaptations are expected under highselective pressures in genetically distinct populations, theiradaptive potential could be constrained in cases where nativegenetic diversity might have become limiting for their adaptivepotential [14].
High Genetic Diversity despite Local Bottlenecks
PLOS ONE | www.plosone.org 8 July 2013 | Volume 8 | Issue 7 | e68646
Our results have clear implications for the conservation of S.polyschides in particular, in a context of future climate changewhere bottleneck events may prevail as a result of increasingenvironmental pressures [95]. In addition to the highconservation value of its genetically diverse and uniqueperipheral populations, which serve to halt local extinctions [96]and preserve the evolutionary potential of S. polyschides[14,97], the possible disappearance of these southernpopulations will also have direct ecological consequences. Thiskelp species functions as the most important ecosystemengineer of rocky shores along its southern distributionalrange, forming kelp forests that support a rich community. Thusthe loss of kelp forest habitat caused by local extinctions of S.polyschides negatively affects the diversity and abundance ofmany associated species.
Supporting Information
Figure S1. Estimation of the most probable number ofgroups (K) based on Bayesian clustering for K = 1 to 8 and25 runs each (STRUCTURE [43]). (A) Mean log-likelihood ofthe data per K, i e. standard output from Structure. (B) Meanabsolute difference of the second order rate of change withrespect to K [44].(PDF)
Figure S2. Allele frequencies for each locus representedby dots of varying diameter. Allele sizes are indicated on thex axis and sites on the y axis. Presence (+) and absence (-) ofS. polyschides per site for the 2008 and 2010 surveys.(PDF)
Figure S3. Genetic differentiation of S. polyschidesillustrated by a (A) neighbour-joining network ofgenotypes using Cavalli-Sforza & Edwards [47] pairwisedistances. Numbers above the branches are Bayesianposterior probabilities (> 0.50). Inferred groups are divided bydotted lines; and by (B) a Factorial Correspondence Analysis ofpopulation multiscores.
(PDF)
Table S1. Number, name, latitude (LAT) and longitude(LON) of site. Records of presence and absence of S.polyschides for sampling years 2008 and 2010. Mean densityrecords for the 2010 survey.(XLS)
Table S2. Genetic diversity as allelic richness (A) andNei’s gene diversity (HE), per site and loci. Inbreedingcoefficients (FIS) per site and per loci and deviations fromHardy–Weinberg equilibrium and for linkage disequilibriumbetween pairs of loci.(XLS)
Table S3. Pairwise FST between sites. Hierarchical analysisof molecular variance (AMOVA) under 999 permutations with 3hierarchical levels.(XLS)
Table S4. Inference of bottleneck for each sampling siteusing the Wilcoxon test for heterozygosity excess over allloci and M-ratio method. Site number, number of samplesper site (n), Wilcoxon test probability (one tail; Wp), Critical MCvalue, M-ratio (M) and the probability of a smaller M Ratiounder equilibrium (Mp).(XLS)
Acknowledgements
We are grateful to Liliana Paulos who helped throughout thefield campaigns.
Author Contributions
Conceived and designed the experiments: JA FA EAS .Performed the experiments: JA NC. Analyzed the data: JA FAPR DR MV EAS. Contributed reagents/materials/analysis tools:JA NC. Wrote the manuscript: JA EAS MV PR DR.
References
1. Hampe A, Petit RJ (2005) Conserving biodiversity under climatechange: the rear edge matters. Ecol Lett 8: 461-467. doi:10.1111/j.1461-0248.2005.00739.x. PubMed: 21352449.
2. Neiva J, Pearson GA, Valero M, Serrao EA (2012) Drifting fronds anddrifting alleles: range dynamics, local dispersal and habitat isolationshape the population structure of the estuarine seaweed Fucusceranoides L. J Biogeogr 39: 1167-1178. doi:10.1111/j.1365-2699.2011.02670.x.
3. Billingham M, Reusch TB, Alberto F, Serrão EA (2003) Is asexualreproduction more important at geographical limits? A genetic test ofthe seagrass Zostera marina in the Ria Formosa, Portugal. Mar EcolProg Ser 265: 77-83. doi:10.3354/meps265077.
4. Arnaud-Haond S, Teixeira S, Massa SI, Billot C, Saenger P et al.(2006) Genetic structure at range-edge: low diversity and highinbreeding in SE Asia mangrove (Avicennia marina) populations. MolEcol 15: 3515-3525. doi:10.1111/j.1365-294X.2006.02997.x. PubMed:17032254.
5. Diekmann OE, Serrão EA (2012) Range-edge genetic diversity: locallypoor extant southern patches maintain a regionally diverse hotspot inthe seagrass Zostera marina. Mol Ecol, 21: 1647-1657. PubMed:22369278.
6. Nicastro KR, Gerardo IZ, Teixeira S, Neiva J, Serrão EA et al. (2013)Shift happens: trailing edge contraction associated with recent warmingtrends threatens a distinct genetic lineage in the marine macroalgaFucus vesiculosus. BMC Biol, 11: 6. doi:10.1186/1741-7007-11-6.PubMed: 23342999.
7. Vucetich JA, Waite TA (2003) Spatial patterns of demography andgenetic processes across the species’ range: Null hypotheses forlandscape Conserv Genet 4: 639-645
8. Eckert CG, Samis KE, Lougheed SC (2008) Genetic variation acrossspecies’ geographical ranges: the central-marginal hypothesis andbeyond. Mol Ecol 17: 1170-1188. doi:10.1111/j.1365-294X.2007.03659.x. PubMed: 18302683.
9. Sagarin RD, Gaines SD (2002) The “abundant centre” distribution: towhat extent is it a biogeographical rule? Ecol Lett 5: 137-147. doi:10.1046/j.1461-0248.2002.00297.x.
10. Jump AS, Woodward FI (2003) Seed production and population densitydecline approaching the range-edge of Cirsium species. New Phytol160: 349-358. doi:10.1046/j.1469-8137.2003.00873.x.
11. Williams CK, Ives AR, Applegate RD (2003) Population dynamicsacross geographical ranges: time-series analyses of three small gamespecies. Ecology 84: 2654-2667. doi:10.1890/03-0038.
High Genetic Diversity despite Local Bottlenecks
PLOS ONE | www.plosone.org 9 July 2013 | Volume 8 | Issue 7 | e68646
12. Sorte C, Hofmann G (2004) Changes in latitudes, changes in aptitudes:Nucella canaliculata (Mollusca: Gastropoda) is more stressed at itsrange edge. Mar Ecol Prog Ser, 274: 263-268. doi:10.3354/meps274263.
13. Pujol B, Pannell JR (2008) Reduced responses to selection afterspecies range expansion. Science 321: 96. doi:10.1126/science.1157570. PubMed: 18599779.
14. Pearson GA, Lago-Leston A, Mota C (2009) Frayed at the edges:selective pressure and adaptive response to abiotic stressors aremismatched in low diversity edge populations. J Ecol 97: 450-462. doi:10.1111/j.1365-2745.2009.01481.x.
15. Hoffmann AA, Blows MW (1994) Species borders: ecological andevolutionary perspectives. Trends Ecol Evol 9: 223-227. doi:10.1016/0169-5347(94)90248-8. PubMed: 21236827.
16. Young A, Boyle T, Brown T (1996) The population geneticconsequences of habitat fragmentation for plants. Trends Ecol Evol 11:413-418. doi:10.1016/0169-5347(96)10045-8. PubMed: 21237900.
17. Keller L, Waller D (2010) Inbreeding effects in wild populations. TrendsEcol Evol 17: 230-241.
18. Newman D, Pilson D (1997) Increased probability of extinction due todecreased genetic effective population size: Experimental populationsof Clarkia pulchella. Evolution 51:2: 354-362. doi:10.2307/2411107.
19. Garcia-Ramos G, Kirkpatrick M (1997) Genetic models of adaptationand gene flow in peripheral populations. Evolution 51: 21-28. doi:10.2307/2410956.
20. Neiva J, Pearson GA, Valero M, Serrão EA (2012) Fine-scale geneticbreaks driven by historical range dynamics and ongoing density-barriereffects in the estuarine seaweed Fucus ceranoides L. BMC Evol Biol12: 78. doi:10.1186/1471-2148-12-78. PubMed: 22672720.
21. Helmuth B, Kingsolver JG, Carrington E (2005) Biophysics,physiological ecology, and climate change: does mechanism matter?Annu Rev Physiol 67: 177-201. doi:10.1146/annurev.physiol.67.040403.105027. PubMed: 15709956.
22. Sagarin RD, Gaines SD, Gaylord B (2006) Moving beyond assumptionsto understand abundance distributions across the ranges of species.Trends Ecol Evol 21: 524-530. doi:10.1016/j.tree.2006.06.008.PubMed: 16815588.
23. Yakimowski SB, Eckert CG (2008) Populations do not become lessgenetically diverse or more differentiated towards the northern limit ofthe geographical range in clonal Vaccinium stamineum (Ericaceae).New Phytol 180: 534-544. doi:10.1111/j.1469-8137.2008.02582.x.PubMed: 18694448.
24. Walser B, Haag CR (2012) Strong intraspecific variation in geneticdiversity and genetic differentiation in Daphnia magna: the effects ofpopulation turnover and population size. Mol Ecol 21: 851-861. doi:10.1111/j.1365-294X.2011.05416.x. PubMed: 22221402.
25. Boaventura D, Re P, Cancela Da Fonseca L, Hawkins SJ (2002)Intertidal Rocky Shore Communities of the Continental PortugueseCoast: Analysis of Distribution Patterns D Boaventura. Mar Ecol 23:69-90.
26. Pereira SG, Lima FP, Queiroz NC, Ribeiro PA, Santos AM (2006)Biogeographic Patterns of Intertidal Macroinvertebrates and theirAssociation with Macroalgae Distribution along the Portuguese Coast.Hydrobiologia 555: 185-192. doi:10.1007/s10750-005-1115-3.
27. Tellier F, Meynard AP, Correa JA, Faugeron S, Valero M (2009)Phylogeographic analyses of the 30 degrees S south-east Pacificbiogeographic transition zone establish the occurrence of a sharpgenetic discontinuity in the kelp Lessonia nigrescens: vicariance orparapatry? Mol Phylogenet Evol 53: 679-693. doi:10.1016/j.ympev.2009.07.030. PubMed: 19647087.
28. Coleman FC, Williams SL (2002) Overexploiting marine ecosystemengineers: potential consequences for biodiversity. Trends Ecol Evol17: 40-44. doi:10.1016/S0169-5347(01)02330-8.
29. Norton TA (1977) Experiments on the Factors Influencing theGeographical Distributions of Saccorhiza polyschides and Saccorhizadermatodea. New Phytol 78:3: 625-635. doi:10.1111/j.1469-8137.1977.tb02167.x.
30. Helmuth B, Harley CDG, Halpin PM, O’Donnell M, Hofmann GE et al.(2002) Climate change and latitudinal patterns of intertidal thermalstress. Science 298: 1015-1017. doi:10.1126/science.1076814.PubMed: 12411702.
31. Pereira TR, Engelen AH, Pearson GA, Serrão EA, Destombe D et al.(2011) Temperature effects on the microscopic haploid stagedevelopment of Laminaria ochroleuca and Sacchoriza polyschides,kelps with contrasting life histories. Cah Biol Mar 52: 395-403.
32. Santos R (1993) A multivariate study of biotic and abiotic relationshipsin a subtidal algal stand. Mar Ecol Prog Ser 94: 181-190. doi:10.3354/meps094181.
33. Palmer MA, Hakenkamp CC, Nelson-Baker K (1997) EcologicalHeterogeneity in Streams : Why Variance Matters Ecologicalheterogeneity in streams : why variance matters. J N Am Benthol Soc16: 189-202. doi:10.2307/1468251.
34. Zuur A, Elena N, Walker N, Saveiliev A, Smith G (2009) Mixed EffectsModels and Extensions in Ecology with R. New York: Springer Verlag.
35. Royston P (1995) Remark AS R94: A remark on Algorithm AS 181: TheW test for normality. Appl Statist 44: 547-551. doi:10.2307/2986146.
36. Hoarau G, Coyer JA, Stam WT, Olsen JL (2006) A fast andinexpensive DNA extraction/purification protocol for brown macroalgae.Mol Ecol Notes 7: 191-193. doi:10.1111/j.1471-8286.2006.01587.x.
37. Engel CR, Guillemin ML, Jacob AM, Valero M, Viard F (2008) Isolationof microsatellite loci from the kelp, Saccorhiza polyschides(Heterokontophyta, incertae sedis). Mol Ecol Resour 8: 406–408. doi:10.1111/j.1471-8286.2007.01972.x. PubMed: 21585804.
38. Toonen RJ, Hughes S (2001) Increased Throughput for FragmentAnalysis on ABI Prism 377 Automated Sequencer Using a MembraneComb and STRand Software. BioTechniques 31: 1320-1324. PubMed:11768661.
39. Alberto F (2009) MsatAllele_1.0: An R package to visualize the binningof microsatellite alleles. J Hered, 100: 394-397. doi:10.1093/jhered/esn110. PubMed: 19126639.
40. R Development Core Team (2005) R Development Core Team. R: ALanguage and Environment for Statistical Computing. Vienna, Austria:R Foundation for Statistical Computing.
41. van Oosterhout C, Hutchinson WF, Wills DPM, Shipley P (2004) Micro-Checker: Software for Identifying and Correcting Genotyping Errors inMicrosatellite Data. Mol Ecol Notes 4: 535-538. doi:10.1111/j.1471-8286.2004.00684.x.
42. Goudet J (2001) FSTAT, a program to estimate and test genediversities and fixation indices (version 2.9.3). Available: http://www.unilch/izea/softwares/fstat.html. Accessed: 2012 December 10.
43. Alberto F, Arnaud-Haond S, Duarte CM, Serrão EA (2006) Geneticdiversity of a clonal angiosperm near its range limit: the case ofCymodocea nodosa at the Canary Islands. Mar Ecol Prog Ser 309:117-129. doi:10.3354/meps309117.
44. Pritchard JK, Stephens M, Donnelly P (2000) Inference of populationstructure using multilocus genotype data. Genetics, 155: 945-959.PubMed: 10835412.
45. Evanno G, Regnaut S, Goudet J (2005) Detecting the number ofclusters of individuals using the software STRUCTURE: a simulationstudy. Mol Ecol 14: 2611-2620. doi:10.1111/j.1365-294X.2005.02553.x.PubMed: 15969739.
46. Rosenberg NA (2004) Distract: a program for the graphical display ofpopulation structure. Molec-ular Ecology Notes 4: 137-138
47. Belkhir K, Borsa P, Chikhi L, Raufaste N, Bonhomme F (2004)GENETIX. Populations Genet Software Windows TM Univ Montp 4. 05:II. Montpellier
48. Cavalli-Sforza LL, Edwards AWF (1967) Phylogenetic analysis. Modelsand estimation procedures. Am J Hum Genet 19: 233-257. PubMed:6026583.
49. Langella O (1999) POPULATIONS 1.2.30 Population genetic software.Available: /http://bioinformatics.org/*tryphon/populations/. Accessed2012 Dec 10.
50. Weir B, Cockerham C (1984) Estimating F statistics for the analysis ofpopulation structure. Evolution 38:6: 1358-1370. doi:10.2307/2408641.
51. Meirmans PG, Van Tienderen PH (2004) Genotype and Genodive: TwoPrograms for the Analysis of Genetic Diversity of Asexual Organisms.Mol Ecol Notes 4: 792-794. doi:10.1111/j.1471-8286.2004.00770.x.
52. Excoffier L, Smouse E, Quattro JM (1992) Analyses of molecularvariance inferred from metric distance among DNA haplotypes:application to human mitochondrial DNA restriction data. Genetics 131:479-491. PubMed: 1644282.
53. Rousset F (1997) Genetic differentiation and estimation of gene flowfrom F-statistics under isolation by distance. Genetics 145: 1219-1228.PubMed: 9093870.
54. Rousset F (2000) Genetic differentiation between individuals. JEvolution Biol 13: 58-62. doi:10.1046/j.1420-9101.2000.00137.x.
55. Mantel N (1967) The detection of disease clustering and a generalizedregression approach. Cancer Res 27: 209-220. PubMed: 6018555.
56. Luikart G, Cornuet JM (1998) Empirical evaluation of a test foridentifying recently bottlenecked populations from allele frequency data.Conserv Biol 12: 228-237. doi:10.1046/j.1523-1739.1998.96388.x.
57. Garza JC, Williamson EG (2001) Detection of reduction in populationsize using data from microsatellite loci. Mol Ecol 10: 305-318. doi:10.1046/j.1365-294x.2001.01190.x. PubMed: 11298947.
58. Piry S, Luikart G, Cornuet JM (1999) Bottleneck: a computer programfor detecting recent reductions in the effective population size using
High Genetic Diversity despite Local Bottlenecks
PLOS ONE | www.plosone.org 10 July 2013 | Volume 8 | Issue 7 | e68646
allele frequency data. J Hered, 90: 502-503. doi:10.1093/jhered/90.4.502.
59. Busch JD, Waser PM, Dewoody JA (2007) Recent demographicbottlenecks are not accompanied by a genetic signature in banner-tailed kangaroo rats (Dipodomys spectabilis). Mol Ecol 16: 2450-2462.doi:10.1111/j.1365-294X.2007.03283.x. PubMed: 17561905.
60. Cornuet JM, Luikart G (1996) Description and power analysis of twotests for detecting recent population bottlenecks from allele frequencydata. Genetics 144: 2001-2014. PubMed: 8978083.
61. Garza JC (2006) Critical M. Available: http://swfsc.noaa.gov/textblock.aspx?Division=FED&id=3298. Accessed: January 2013.
62. Dakin EE, Avise JC (2004) Microsatellite null alleles in parentageanalysis. Heredity 93: 504-509. doi:10.1038/sj.hdy.6800545. PubMed:15292911.
63. Lima FP, Ribeiro PA, Queiroz N, Hawkins SJ, Santos AM (2007) Dodistributional shifts of northern and southern species of algae match thewarming pattern? Glob Change Biol 13: 2592-2604. doi:10.1111/j.1365-2486.2007.01451.x.
64. Mandák B, Bímová K, Pyšek P, Štěpánek J, Plačková I (2005)Isoenzyme diversity in Reynoutria (Polygonaceae) taxa: escape fromsterility by hybridization. Plant Syst Evol 253: 219-230. doi:10.1007/s00606-005-0316-6.
65. Lawton JH (1993) Range, population abundance and conservation.Trends Ecol Evol 8: 409-413. doi:10.1016/0169-5347(93)90043-O.PubMed: 21236213.
66. Reed DC (1990) The effects of variable settlement and earlycompetition on patterns of kelp recruitment. Ecology 71: 776-787. doi:10.2307/1940329.
67. Muth AF (2012) Effects of Zoospore Aggregation and SubstrateRugosity on Kelp Recruitment Success. J Phycol 48: 1374-1379. doi:10.1111/j.1529-8817.2012.01211.x.
68. Coyer JA, Peters AF, Stam WT, Olsen JL (2003) Post-ice agerecolonization and differentiation of Fucus serratus L. (Phaeophyceae;Fucaceae) populations in Northern Europe. Mol Ecol 12: 1817-1829.doi:10.1046/j.1365-294X.2003.01850.x. PubMed: 12803634.
69. Lesica P, Allendorf FW (1995) When Are Peripheral PopulationsValuable for Conservation? Conserv Biol 9: 753-760. doi:10.1046/j.1523-1739.1995.09040753.x.
70. Carvalho D (1992) Carta geológica de Portugal 1. Lisbon: DirectorateGeneral for Fisheries. p. 500000.
71. Alberto F, Raimondi PT, Reed DC, Coelho NC, Leblois R et al. (2010)Habitat continuity and geographic distance predict population geneticdifferentiation in giant kelp. Ecology 91: 49-56. doi:10.1890/09-0050.1.PubMed: 20380195.
72. Billot C, Engel CR, Rousvoal S, Kloareg B, Valero M (2003) Currentpatterns, habitat discontinuities and population genetic structure: thecase of the kelp Laminaria digitata in the English Channel. Mar EcolProg Ser 253: 111-121. doi:10.3354/meps253111.
73. Gaylord B, Reed DC, Raimondi PT, Washburn L (2006) Macroalgalspore dispersal in coastal environments: mechanistic insights revealedby theory and experiment. Ecol Monogr 76: 481-502. doi:10.1890/0012-9615(2006)076[0481:MSDICE]2.0.CO;2.
74. Reed DC, Kinlan BP, Raimondi PT, Washburn L, Gaylord B et al.(2006) A metapopulation perspective on patch dynamics andconnectivity of giant kelp In Kritzer JP, PF Sale. MarineMetapopulations. San Diego: Academic Press. pp. 352-386.
75. Oliveira PB, Nolasco R, Dubert J, Moita T, Peliz A (2009) Surfacetemperature, chlorophyll and advection patterns during a summerupwelling event off central Portugal. Cont Shelf Res 29: 759-774. doi:10.1016/j.csr.2008.08.004.
76. Helmuth B, Veit RR, Holberton R (1994) Long-distance dispersal of asubantarctic brooding bivalve (Gaimardia trapensina) by kelp-rafting.Mar Biol 120: 421-426. doi:10.1007/BF00680216.
77. Fraser CI, Nikula R, Waters JM (2010) Oceanic rafting by a coastalcommunity. Proc R Soc Lond B 278: 649-655. PubMed: 20843850.
78. Fraser CI, Hay CH, Spencer HG, Waters JM (2009) Genetic andmorphological analyses of the southern bull kelp Durvillaea antarctica(Phaeophyceae: Durvillaeales) in New Zealand reveal cryptic species.J Phycol 45: 436-443. doi:10.1111/j.1529-8817.2009.00658.x.
79. Tellier F, Tapia J, Faugeron S, Destombe C, Valero M (2011) TheLessonia nigrescens species complex (Laminariales, Phaeophyceae)
shows strict parapatry and complete reproductive isolation in asecondary contact zone. J Phycol 47: 894-903. doi:10.1111/j.1529-8817.2011.01019.x.
80. Neushul M (1983) An overview of basic research on kelp and the kelpforest ecosystem IN: W Bascom. The Effects of Waste Disposal onKelp Communities. San Diego: Univ Calif Inst Mar Res. pp. 282-300p.
81. Carney LT, Edwards MS (2010) Role of nutrient fluctuations anddelayed development in gametophyte reproduction by macrocystispyrifera (phaeophyceae) in southern California. J Phycol 46: 987-996.doi:10.1111/j.1529-8817.2010.00882.x.
82. Carney LT (2011) A multispecies laboratory assessment of rapidsporophyte recruitment from delayed kelp gametophytes. J Phycol47:2: 244-251. doi:10.1111/j.1529-8817.2011.00957.x.
83. Hock Z, Szövényi P, Schneller JJ, Tóth Z, Urmi E (2008) Bryophytediaspore bank: a genetic memory? Genetic structure and geneticdiversity of surface populations and diaspore bank in the liverwortMannia fragrans (Aytoniaceae). Am J Bot 95: 542-548. doi:10.3732/ajb.2007283. PubMed: 21632380.
84. Barradas A, Alberto F, Engelen AH, Serrão EA (2011) Fast sporophytereplacement after removal suggests banks of latent microscopic stagesof Laminaria ochroleuca (Phaeophyceae) in tide pools in northernPortugal. Cah Biol Mar 52: 435-439.
85. Hoffmann AJ, Santelices B (1991) Banks of algal microscopic forms:hypotheses on their functioning and comparisons with seed banks. MarEcol Prog Ser 79: 185-194. doi:10.3354/meps079185.
86. Schiel DR, Foster MS (2006) The population biology of large brownseaweeds: ecological consequences of multi-phase life histories indynamic coastal environments. Annu Rev Ecol Syst 37: 343-372. doi:10.1146/annurev.ecolsys.37.091305.110251.
87. Valero M, Destombe C, Mauger S, Ribout S, Engel CR et al. (2011)Using genetic tools for sustainable management of kelps: a literaturereview and the example of Laminaria digitata. Cah Biol Mar 52:467-483.
88. Graham MH, Kinlan BP, Druehl LD, Garske LE, Banks S (2007) Deep-water kelp refugia as potential hotspots of tropical marine diversity andproductivity. PNAS 104: 16576-16580. doi:10.1073/pnas.0704778104.PubMed: 17913882.
89. Riegl B, Piller WE (2003) Possible refugia for reefs in times ofenvironmental stress. Int J Earth Sci 92: 520-531. doi:10.1007/s00531-003-0328-9.
90. Glynn PW (1996) Coral reef bleaching: facts, hypotheses andimplications. Glob Change Biol 2: 495-509. doi:10.1111/j.1365-2486.1996.tb00063.x.
91. Gonçalves JM, Bispo J, Silva JA (2004) Underwater Surv ofIchthyofauna of East Atlantic Seamounts: Gettysburg and Ormond(Gorringe Bank). Arch Fish Mar Res 51: 233-240
92. Assis J, Tavares D, Tavares J, Cunha A, Alberto F et al. (2009)Findkelp, a GIS-Based Community Participation Project to AssesPortuguese Kelp Conservation Status. J Coast Res 3: 1469-1473.
93. Coyer JA, Hoarau G, Pearson G, Mota C, Jüterbock A et al. (2011)Genomic scans detect signatures of selection along a salinity gradientin populations of the intertidal seaweed Fucus serratus on a 12kmscale. Mar Genomics, 4: 1 41-49.
94. Neiva J, Pearson GA, Valero M, Serrão EA (2010) Surfing the wave ona borrowed board: range expansion and spread of introgressedorganellar genomes in the seaweed Fucus ceranoides L. Mol Ecol19:21: 4812-4822. doi:10.1111/j.1365-294X.2010.04853.x. PubMed:20958817.
95. Parmesan C, Yohe G (2003) A globally coherent fingerprint of climatechange impacts across natural systems. Nature 421: 37-42. doi:10.1038/nature01286. PubMed: 12511946.
96. Rogell B, Thörngren H, Laurila A, Höglund J (2010) Fitness costsassociated with low genetic variation are reduced in a harsherenvironment in amphibian island populations. Conserv Genet 11:489-496. doi:10.1007/s10592-009-0039-2.
97. Pujol B, Pannell JR (2008) Reduced responses to selection afterspecies range expansion. Science 321: 96. doi:10.1126/science.1157570. PubMed: 18599779.
High Genetic Diversity despite Local Bottlenecks
PLOS ONE | www.plosone.org 11 July 2013 | Volume 8 | Issue 7 | e68646