The Role of Outlier Analysis in Reducing Purposeful Sampling ...
Upload
independentCategory
view
0download
0
Addressing the current bottlenecks of metabolomics: IsotopicRatio Outlier Analysis™, an isotopic-labeling technique foraccurate biochemical profiling
Felice A de Jong* and Chris BeecherNextGen Metabolomics, Inc., Ann Arbor, MI 48105, USA
AbstractMetabolomics or biochemical profiling is a fast emerging science; however, there are still manyassociated bottlenecks to overcome before measurements will be considered robust. Advances inMS resolution and sensitivity, ultra pressure LC MS, ESI, and isotopic approaches such as fluxanalysis and stable-isotope dilution, have made it easier to quantitate biochemicals. Thedigitization of mass spectrometers has simplified informatic aspects. However, issues of analyticalvariability, ion suppression and metabolite identification still plague metabolomics investigators.These hurdles need to be overcome for accurate metabolite quantitation not only for in vitrosystems, but for complex matrices such as biofluids and tissues, before it is possible to routinelyidentify biomarkers that are associated with the early prediction and diagnosis of diseases. In thisreport, we describe a novel isotopic-labeling method that uses the creation of distinct biochemicalsignatures to eliminate current bottlenecks and enable accurate metabolic profiling.
Metabolite profiling & stable isotopesStandardization of current practices in MS-based metabolic profiling is required to ensurelaboratory-to-laboratory comparative analysis for the development of precise discriminatorydiagnostic tests and therapeutic treatments. In order to accurately compare data and ratios ofindividual metabolite concentrations, several analytical challenges must be overcome. Theability to measure inherent biological variation is directly compromised by the introductionof variability through sample handling, extraction, ionization efficiency (includingsuppression), or variation of analytical parameters (including instrumentation conditions).Standardization techniques to remove introduced variability in the determination ofbiological information have historically been addressed either through the use of multipleinternal standard compounds to normalized data [1] or through stable-isotope-assistedmethods [2,3].
When employing multiple internal standards as a means to standardize, the choice of whichstandard to apply to a particular metabolite is difficult. The retention time and mass-to-charge ratio of a metabolite compound is dependent on its chemical properties, and the use
© 2012 Future Science Ltd*Author for correspondence: Tel.: +1 734 265 0884, Fax: +1 978 779 2947, [email protected].
For reprint orders, please contact [email protected]
Financial & competing interests disclosureThe authors are principals in NextGen Metabolomics, Inc., a Michigan business entity that holds an exclusive license to the IsotopicRatio Outlier Analysis™ technology. The authors have no other relevant affiliations or financial involvement with any organization orentity with a financial interest in or financial conflict with the subject matter or materials discussed in the manuscript apart from thosedisclosed.No writing assistance was utilized in the production of this manuscript.
NIH Public AccessAuthor ManuscriptBioanalysis. Author manuscript; available in PMC 2013 July 01.
Published in final edited form as:Bioanalysis. 2012 September ; 4(18): 2303–2314. doi:10.4155/bio.12.202.
NIH
-PA Author Manuscript
NIH
-PA Author Manuscript
NIH
-PA Author Manuscript
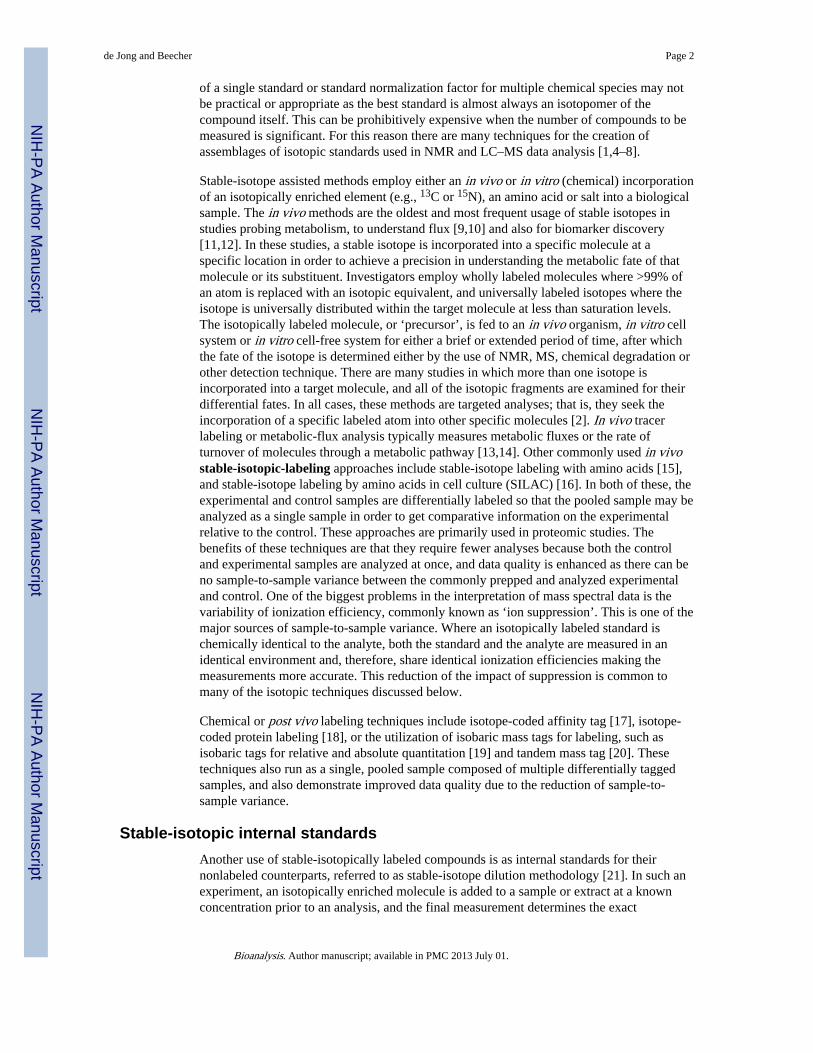
of a single standard or standard normalization factor for multiple chemical species may notbe practical or appropriate as the best standard is almost always an isotopomer of thecompound itself. This can be prohibitively expensive when the number of compounds to bemeasured is significant. For this reason there are many techniques for the creation ofassemblages of isotopic standards used in NMR and LC–MS data analysis [1,4–8].
Stable-isotope assisted methods employ either an in vivo or in vitro (chemical) incorporationof an isotopically enriched element (e.g., 13C or 15N), an amino acid or salt into a biologicalsample. The in vivo methods are the oldest and most frequent usage of stable isotopes instudies probing metabolism, to understand flux [9,10] and also for biomarker discovery[11,12]. In these studies, a stable isotope is incorporated into a specific molecule at aspecific location in order to achieve a precision in understanding the metabolic fate of thatmolecule or its substituent. Investigators employ wholly labeled molecules where >99% ofan atom is replaced with an isotopic equivalent, and universally labeled isotopes where theisotope is universally distributed within the target molecule at less than saturation levels.The isotopically labeled molecule, or ‘precursor’, is fed to an in vivo organism, in vitro cellsystem or in vitro cell-free system for either a brief or extended period of time, after whichthe fate of the isotope is determined either by the use of NMR, MS, chemical degradation orother detection technique. There are many studies in which more than one isotope isincorporated into a target molecule, and all of the isotopic fragments are examined for theirdifferential fates. In all cases, these methods are targeted analyses; that is, they seek theincorporation of a specific labeled atom into other specific molecules [2]. In vivo tracerlabeling or metabolic-flux analysis typically measures metabolic fluxes or the rate ofturnover of molecules through a metabolic pathway [13,14]. Other commonly used in vivostable-isotopic-labeling approaches include stable-isotope labeling with amino acids [15],and stable-isotope labeling by amino acids in cell culture (SILAC) [16]. In both of these, theexperimental and control samples are differentially labeled so that the pooled sample may beanalyzed as a single sample in order to get comparative information on the experimentalrelative to the control. These approaches are primarily used in proteomic studies. Thebenefits of these techniques are that they require fewer analyses because both the controland experimental samples are analyzed at once, and data quality is enhanced as there can beno sample-to-sample variance between the commonly prepped and analyzed experimentaland control. One of the biggest problems in the interpretation of mass spectral data is thevariability of ionization efficiency, commonly known as ‘ion suppression’. This is one of themajor sources of sample-to-sample variance. Where an isotopically labeled standard ischemically identical to the analyte, both the standard and the analyte are measured in anidentical environment and, therefore, share identical ionization efficiencies making themeasurements more accurate. This reduction of the impact of suppression is common tomany of the isotopic techniques discussed below.
Chemical or post vivo labeling techniques include isotope-coded affinity tag [17], isotope-coded protein labeling [18], or the utilization of isobaric mass tags for labeling, such asisobaric tags for relative and absolute quantitation [19] and tandem mass tag [20]. Thesetechniques also run as a single, pooled sample composed of multiple differentially taggedsamples, and also demonstrate improved data quality due to the reduction of sample-to-sample variance.
Stable-isotopic internal standardsAnother use of stable-isotopically labeled compounds is as internal standards for theirnonlabeled counterparts, referred to as stable-isotope dilution methodology [21]. In such anexperiment, an isotopically enriched molecule is added to a sample or extract at a knownconcentration prior to an analysis, and the final measurement determines the exact
de Jong and Beecher Page 2
Bioanalysis. Author manuscript; available in PMC 2013 July 01.
NIH
-PA Author Manuscript
NIH
-PA Author Manuscript
NIH
-PA Author Manuscript

concentration of the nonlabeled material by comparison. In this type of study, it is notuncommon for a researcher to add more than one isotopically-distinct standard if more thanone molecule is to be quantified. In this situation, the same standard is introduced into allsamples, but there is no information carried by the standard other than for purposes ofrelative quantitation; that is, the standard has no relation to the experiment at hand.
More recently, there have been a number of variants of the above whereby an organism isgrown on an isotopically defined feedstock, such that the entire organism is heavily, if notentirely, composed of molecules consisting of only one or two isotopes [22,23]. Historically,such standards are carefully constructed to differ from any other analyte by a specific massdifference. For example, by labeling one cell population with a cell-culture component orcomponents containing isotopically light atoms, for example 12C, and another cellpopulation with isotopically heavy atoms, for example 13C. Once a stressor is applied to theexperimental group – for example, drug or chemical treatment – equal amounts of bothpopulations are combined and analyzed by LC–MS. Again, the composite sample is mass-spectroscopically analyzed for analyte peaks, with a reduction of sample-to-sample variance.The ratio of the first to second isotope (isotopic ratio) for each compound is determined.While the practice of isotopic-labeling standardization to introduce a specific stable-isotope-labeled compound for each metabolite has provided a means to effectively reduce variabilityintroduced during analysis and sample processing, the fact that the peaks carry no inherentmeans of identification, artifactual confounding peaks and metabolite misidentificationremain unsolved sources of error.
Metabolomics & stable-isotope labelingThe diverse chemical nature of the metabolome makes the comprehensive chemical taggingmethods unfeasible. Until recently, other than metabolic-flux analysis and simple targetedanalyses, very few additional methods that employ stable isotopes were used for the fullquantitation of biochemical metabolites. In 2004, Mashego et al. reported the use of stable-isotope dilution for the metabolome characterization of Saccharomyces cerevisiae, termed‘Mass Isotopomer Ratio Analysis of U-13C-Labeled Extracts’ (MIRACLE), in whichmetabolites were quantitated relative to their U-13C-labeled equivalents [24]. Using thesame isotope ratio-based quantitation approach, both Birkemeyer et al. [23] and Bennett etal. [25,26] describe the quantitation of microbial metabolites using uniformly labeled U-13Ccarbon sources. Others have also utilized this approach for specific classes of metabolites,including nitrogen-containing metabolites [27] and microbial folates [28]. Other uniquemetabolite labeling approaches have been described by Nagai et al., namely, an isotopictracing method for the metabolic assessment of lipogenesis, lipolysis and glucose uptake inadipocytes using LC–MS through the absorption of 13C-labeled compounds [29], whileHuang and Regnier differentially derivatized control and experimental samples withisotopically light and heavy (D6) forms of the silylation reagent N-methyl-N-(tert-butyldimethylsilyl)trifluoroacetamide, which were then mixed and analyzed using 2D GC–MS (GC × GC–MS) [30]. These methods are useful for the simultaneous analysis ofmultiple compounds, as metabolites are quantitated relative to their U-13C-labeledequivalents. They are targeted methods, either to specific classes of compounds orindividual metabolites and their pathways; however, if a new pathway is triggered andmetabolites synthesized in the unlabeled samples, then these compounds will not beidentified by the mass ratio-based analysis of the type described here, since the U-13Cequivalents will be absent.
de Jong and Beecher Page 3
Bioanalysis. Author manuscript; available in PMC 2013 July 01.
NIH
-PA Author Manuscript
NIH
-PA Author Manuscript
NIH
-PA Author Manuscript
Isotopic Ratio Outlier Analysis™ as a protocol for metabolic profiling:quantitation & identification
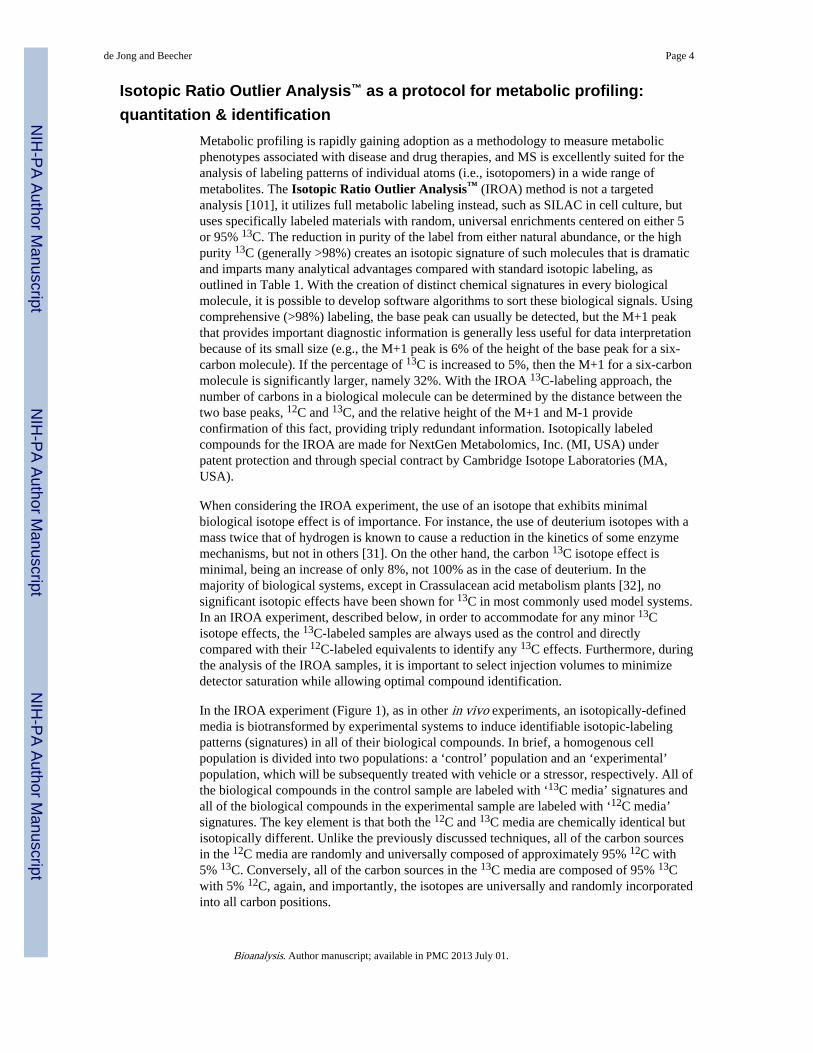
Metabolic profiling is rapidly gaining adoption as a methodology to measure metabolicphenotypes associated with disease and drug therapies, and MS is excellently suited for theanalysis of labeling patterns of individual atoms (i.e., isotopomers) in a wide range ofmetabolites. The Isotopic Ratio Outlier Analysis™ (IROA) method is not a targetedanalysis [101], it utilizes full metabolic labeling instead, such as SILAC in cell culture, butuses specifically labeled materials with random, universal enrichments centered on either 5or 95% 13C. The reduction in purity of the label from either natural abundance, or the highpurity 13C (generally >98%) creates an isotopic signature of such molecules that is dramaticand imparts many analytical advantages compared with standard isotopic labeling, asoutlined in Table 1. With the creation of distinct chemical signatures in every biologicalmolecule, it is possible to develop software algorithms to sort these biological signals. Usingcomprehensive (>98%) labeling, the base peak can usually be detected, but the M+1 peakthat provides important diagnostic information is generally less useful for data interpretationbecause of its small size (e.g., the M+1 peak is 6% of the height of the base peak for a six-carbon molecule). If the percentage of 13C is increased to 5%, then the M+1 for a six-carbonmolecule is significantly larger, namely 32%. With the IROA 13C-labeling approach, thenumber of carbons in a biological molecule can be determined by the distance between thetwo base peaks, 12C and 13C, and the relative height of the M+1 and M-1 provideconfirmation of this fact, providing triply redundant information. Isotopically labeledcompounds for the IROA are made for NextGen Metabolomics, Inc. (MI, USA) underpatent protection and through special contract by Cambridge Isotope Laboratories (MA,USA).
When considering the IROA experiment, the use of an isotope that exhibits minimalbiological isotope effect is of importance. For instance, the use of deuterium isotopes with amass twice that of hydrogen is known to cause a reduction in the kinetics of some enzymemechanisms, but not in others [31]. On the other hand, the carbon 13C isotope effect isminimal, being an increase of only 8%, not 100% as in the case of deuterium. In themajority of biological systems, except in Crassulacean acid metabolism plants [32], nosignificant isotopic effects have been shown for 13C in most commonly used model systems.In an IROA experiment, described below, in order to accommodate for any minor 13Cisotope effects, the 13C-labeled samples are always used as the control and directlycompared with their 12C-labeled equivalents to identify any 13C effects. Furthermore, duringthe analysis of the IROA samples, it is important to select injection volumes to minimizedetector saturation while allowing optimal compound identification.
In the IROA experiment (Figure 1), as in other in vivo experiments, an isotopically-definedmedia is biotransformed by experimental systems to induce identifiable isotopic-labelingpatterns (signatures) in all of their biological compounds. In brief, a homogenous cellpopulation is divided into two populations: a ‘control’ population and an ‘experimental’population, which will be subsequently treated with vehicle or a stressor, respectively. All ofthe biological compounds in the control sample are labeled with ‘13C media’ signatures andall of the biological compounds in the experimental sample are labeled with ‘12C media’signatures. The key element is that both the 12C and 13C media are chemically identical butisotopically different. Unlike the previously discussed techniques, all of the carbon sourcesin the 12C media are randomly and universally composed of approximately 95% 12C with5% 13C. Conversely, all of the carbon sources in the 13C media are composed of 95% 13Cwith 5% 12C, again, and importantly, the isotopes are universally and randomly incorporatedinto all carbon positions.
de Jong and Beecher Page 4
Bioanalysis. Author manuscript; available in PMC 2013 July 01.
NIH
-PA Author Manuscript
NIH
-PA Author Manuscript
NIH
-PA Author Manuscript

If both the control and the experimental cell samples are grown in the IROA isotopically-defined media for a sufficient time to replace their original natural-abundance carbon, thenall of their contents will demonstrate distinctive isotopic patterns (orange box, Figure 1).Once labeled, the experimental sample is treated with a stressing regimen and the controlsample is treated with only the vehicle for the same period of time. The stressing agent maybe chemical, genetic, environmental, or any element or combination of elements that inducephysiological alteration. At the conclusion of the experiment, the experimental sample ismixed with a control sample and the pooled sample prepped and analyzed in a singleanalysis. This has the effect of, as noted above, reducing sample-to-sample variance andincreasing data quality.
In natural abundance, biochemicals or metabolites, the M+1 secondary peak is quite small.In the IROA experiment, all biologically derived molecules may be easily distinguishedfrom artifacts (which are present at only natural abundance), and each peak carries a readyidentifier of its origin, a diagnostically enhanced M+1 for the 12C-derived sample and anidentical diagnostically enhanced M-1 for the 13C-derived sample. The compoundsassociated with the IROA 13C control and IROA 12C experimental samples are bothdifferentiatable (see the IROA peaks, Figure 2) and carry a tremendous amount of additionalinformation; namely, the height of the M-1 relative to the 13C-base peak is a clear stepfunction indicating the number of carbons in the molecule; unlike the 12C-base peaks, onlythe noncarbon components contribute to the M+1 and M+2 of the 13C-base peak, and maybe examined without interference from carbon; and the exact mass of the 13C-base peak maybe used to calculate the probable formula of the molecule. When armed with the number ofcarbons in the molecule, the ability to closely examine the remaining elements is generallyquite discriminatory, and not only affords correct molecular formulae with a great deal ofassurance, but allows the prediction of the characteristics of the 12C-based isotopomer of thesame compound. Once labeled with the 12C and 13C media, all of the biological componentsin the control sample and experiment sample will carry unique signatures, and this meansthat the control sample can be directly embedded into and prepared simultaneously with anexperimental sample and analyzed as a composite (green box, Figure 1). As notedpreviously, this not only reduces the number of samples to be analyzed by half, but alsoremoves the sample-to-sample variance (or noise) that will normally be present in mostmetabolomics experiments, with not only no loss of information, but actually improvedinformation content. IROA also fully removes the problem of ion suppression because acompound’s ability to ionize is a function of its structure and is not significantly altered byits isotopic distribution, similar to the technique noted above.
Another advantage of the IROA patterning is that the M+1 and M-1 peak height, relative tothe base peak of each molecule, generally indicates the number of carbons in the molecule.Since the height of the peaks of an isotopically defined compound may be effectivelycalculated (this is technically a polynomial expansion in which the dominance of carbonmakes the remaining terms less important) by the binomial expansion of the expression:(12C% + 13C%)N where N equals the number of carbons and 12C% and 13C% equals therelative isotopic abundances [33]. This is not sufficiently accurate when all atoms arepresent at their natural abundance, but at 5% the M+1 is diagnostic. For the 12C (5% 13C)peaks, if there are: seven carbons the M+1 will be approximately 36.8%; six carbons the M+1 will be approximately 31.6%; five carbons the M+1 will be approximately 26.3%; fourcarbons the M+1 will be approximately 21.1%; three carbons the M+1 will beapproximately 15.8% and so on. This calculation indicates exactly where the 13C-pairedmate will be located. Together with accurate mass, the identification of metabolite entities inthe sample is made possible.
de Jong and Beecher Page 5
Bioanalysis. Author manuscript; available in PMC 2013 July 01.
NIH
-PA Author Manuscript
NIH
-PA Author Manuscript
NIH
-PA Author Manuscript

The distinctive patterns are important in the interpretation of the resulting composite spectraand because it is possible to discriminate 12C-derived molecules, 13C-derived molecules,artifacts and derivatives of exogenously applied compounds, and the origin of every peak inthe composite (see the IROA peaks, Figure 2).
The IROA peaks are all mathematically calculable and each set (12C and 13C) of carbonisotopomers will reliably and accurately account for the other set providing a redundant QCcheck point. As such, it is possible to interpret the analytical results of the composite sampleto an even greater extent through the creation of IROA software algorithms that achieve datareduction of complex raw data, to concise, high-value information, as follows:
• Characterize all peaks according to source (artifact, experimental [12C], control[13C], or standard);
• Remove all artifacts;
• Align and pair all remaining peaks across all scans;
• Normalize and identify all pairs;
• Determine the relative 12C/13C ratios of analytes in each sample;
• Determine the statistical variance of the sample ratios.
Any experimental analyte compound that has a ratio that is a significant deviation (two ormore standard deviations) from the average ratio will indicate a point where thebiochemistry was altered. For instance, if the average ratio for all of the analytes is 1(1:1 12C/13C ratio), but some analytes have ratios of 10 (10:1) or 0.1 (1:10) then the analytesthat are outliers to the general population are those most strongly affected by the stressor.
A software package named ClusterFinder™ has been written in Java (JRE 1.7). To achievestep 1, ClusterFinder does a scan-by-scan analysis of the complete dataset and identifies allIROA peaks based on their extended isotopic envelopes. The removal of all non-IROApeaks follows logically upon the conclusion of step 1, and results in a significantlysimplified dataset that may then be aligned based on mass across adjacent scans. Themirrored symmetry of the 12C and 13C halves of each IROA cluster allow the isotopic peaksto be correctly associated with their appropriate 12C- or 13C-base peak. As the isotopicdilution distributes molecules over a number of masses, the sum of the base peaks and theirassociated isotopic peaks must be used to calculate their respective areas accurately. Oncethe summed areas are available their ratio is simply calculated. On the whole, because theisotopic patterns carry so much information, the tasks the software performs are well definedbut not overly difficult. The software has two modes of use; where both the 12C and 13Cmedia are utilized, the software can find all IROA peaks regardless of their source. Thisrepresents a fully unbiased analysis as compounds of biological origin present or absent ineither samples (control or experimental) will be identified by the software and artifacts willbe simultaneously identified and removed from the dataset. The software will also find allIROA-labeled compounds where the IROA peak is present in one sample but not the other.This allows for targeted analysis whereby the control may contain 13C IROA peaks that maybe used to identify their associated natural abundance peaks. This mode of analysis has beencalled the ‘phenotypic mode’ (see section titled ‘The use of IROA phenotyping applicationfor the metabolic profiling of tissues or biofluids’ later in this article).
Normalization of IROA datasetsVarious normalization techniques to account for matrix and analytical variances intranscriptomics, proteomics and metabolomics have been explored extensively. Methodsthat account for dilution or cell number have included total ion count (TIC), a standard
de Jong and Beecher Page 6
Bioanalysis. Author manuscript; available in PMC 2013 July 01.
NIH
-PA Author Manuscript
NIH
-PA Author Manuscript
NIH
-PA Author Manuscript
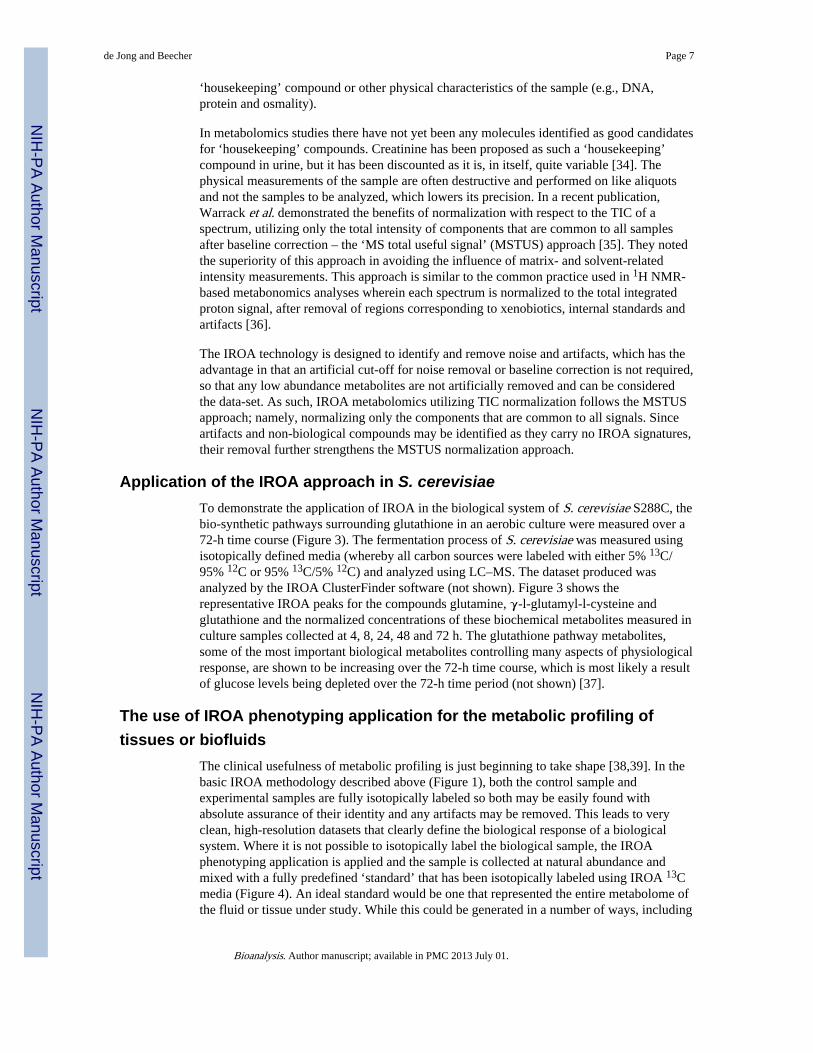
‘housekeeping’ compound or other physical characteristics of the sample (e.g., DNA,protein and osmality).
In metabolomics studies there have not yet been any molecules identified as good candidatesfor ‘housekeeping’ compounds. Creatinine has been proposed as such a ‘housekeeping’compound in urine, but it has been discounted as it is, in itself, quite variable [34]. Thephysical measurements of the sample are often destructive and performed on like aliquotsand not the samples to be analyzed, which lowers its precision. In a recent publication,Warrack et al. demonstrated the benefits of normalization with respect to the TIC of aspectrum, utilizing only the total intensity of components that are common to all samplesafter baseline correction – the ‘MS total useful signal’ (MSTUS) approach [35]. They notedthe superiority of this approach in avoiding the influence of matrix- and solvent-relatedintensity measurements. This approach is similar to the common practice used in 1H NMR-based metabonomics analyses wherein each spectrum is normalized to the total integratedproton signal, after removal of regions corresponding to xenobiotics, internal standards andartifacts [36].
The IROA technology is designed to identify and remove noise and artifacts, which has theadvantage in that an artificial cut-off for noise removal or baseline correction is not required,so that any low abundance metabolites are not artificially removed and can be consideredthe data-set. As such, IROA metabolomics utilizing TIC normalization follows the MSTUSapproach; namely, normalizing only the components that are common to all signals. Sinceartifacts and non-biological compounds may be identified as they carry no IROA signatures,their removal further strengthens the MSTUS normalization approach.
Application of the IROA approach in S. cerevisiaeTo demonstrate the application of IROA in the biological system of S. cerevisiae S288C, thebio-synthetic pathways surrounding glutathione in an aerobic culture were measured over a72-h time course (Figure 3). The fermentation process of S. cerevisiae was measured usingisotopically defined media (whereby all carbon sources were labeled with either 5% 13C/95% 12C or 95% 13C/5% 12C) and analyzed using LC–MS. The dataset produced wasanalyzed by the IROA ClusterFinder software (not shown). Figure 3 shows therepresentative IROA peaks for the compounds glutamine, γ-l-glutamyl-l-cysteine andglutathione and the normalized concentrations of these biochemical metabolites measured inculture samples collected at 4, 8, 24, 48 and 72 h. The glutathione pathway metabolites,some of the most important biological metabolites controlling many aspects of physiologicalresponse, are shown to be increasing over the 72-h time course, which is most likely a resultof glucose levels being depleted over the 72-h time period (not shown) [37].
The use of IROA phenotyping application for the metabolic profiling oftissues or biofluids
The clinical usefulness of metabolic profiling is just beginning to take shape [38,39]. In thebasic IROA methodology described above (Figure 1), both the control sample andexperimental samples are fully isotopically labeled so both may be easily found withabsolute assurance of their identity and any artifacts may be removed. This leads to veryclean, high-resolution datasets that clearly define the biological response of a biologicalsystem. Where it is not possible to isotopically label the biological sample, the IROAphenotyping application is applied and the sample is collected at natural abundance andmixed with a fully predefined ‘standard’ that has been isotopically labeled using IROA 13Cmedia (Figure 4). An ideal standard would be one that represented the entire metabolome ofthe fluid or tissue under study. While this could be generated in a number of ways, including
de Jong and Beecher Page 7
Bioanalysis. Author manuscript; available in PMC 2013 July 01.
NIH
-PA Author Manuscript
NIH
-PA Author Manuscript
NIH
-PA Author Manuscript

the use of IROA grown cells lines (the IROA standard) to achieve accurate quantification,this aspect of the application will not be considered here.
Using an IROA-labeled standard, all of the peaks may be easily identified according to thepresence of their characteristic M-1 peak. The natural abundance peaks corresponding toeach standard peak may be readily identified because, although they do not carry anyisotopic labeling, their exact mass and position are established relative to the standard. If thepooled standard is well characterized and the compounds that are present in it have alreadybeen identified, then it can be used as a point of comparison for all of its containedcompounds. Artifacts will have no match in the standard and, thus, need not be consideredin a final dataset. Whereas, in a basic IROA dataset the ratio of the peak areas represents therelative deviation of the metabolic pool sizes brought about by the experimental condition,in a phenotyping experiment the overall pattern of deviations from the standard will definephenotype by difference from the standard. It is possible to consider the phenotypingexperiment a complex targeted analysis relative to the unbiased analysis of the full IROAexperiment.
Conclusion & future perspectiveIsotopic techniques have proven valuable in improving the quality of data for manyexperimental systems. In general, where a standard can be embedded into an experimentalsample, the measurements of the experimental analytes are greatly improved. Inmetabolomics, there have been many uses of isotopic standards for understanding flux andbiomarker discovery. The use of high purity isotopic labels has been a common technique inmany other omics sciences and has just recently been used in metabolomics [24–30,40]. TheIROA technique has advanced this by using specific isotopic balances to create definablepatterns in metabolites. This makes the mass-spectral signals complex but increases theinformation content that can be extracted from these signals. It is clear that metabolomicshas just begun to explore the potential of using isotopic labels to further its effectiveness.
Key Terms
Metabolicprofiling
Quantitative analysis of metabolites, generally performed by eitherNMR or MS, to measure a change of the metabolome in response toa stressor
Stable-isotopiclabeling
A technique that incorporates a stable (nonradioactive) isotope into amolecule creating a higher molecular weight compound
Isotopic RatioOutlierAnalysis™
MS method of metabolic profiling that utilizes stable isotopes tocreate distinct molecular signatures in biological compounds
ReferencesPapers of special note have been highlighted as:
▪ of interest
1. Sysi-Aho M, Katajamaa M, Yetukuri L, Orešič M. Normalization method for metabolomics datausing optimal selection of multiple internal standards. BMC Bioinformatics. 2007; 8(93):1–17.[PubMed: 17199892]
2. Hellerstein MK. New stable isotope-mass spectrometric techniques for measuring fluxes throughintact metabolic pathways in mammalian systems: introduction of moving pictures into functionalgenomics and biochemical phenotyping. Metab Eng. 2004; 6(1):85–100. [PubMed: 14734258]
de Jong and Beecher Page 8
Bioanalysis. Author manuscript; available in PMC 2013 July 01.
NIH
-PA Author Manuscript
NIH
-PA Author Manuscript
NIH
-PA Author Manuscript

3. Hiller K, Metallo C, Stephanopoulos G. Elucidation of cellular metabolism via metabolomics andstable-isotope assisted metabolomics. Curr Pharm Biotechnol. 2011; 12(7):105–1086.
4. Kwok WH, Leung DKK, Leung GNW, et al. Unusual observations during steroid analysis. RapidCommun Mass Spectrom. 2008; 22:682–686. [PubMed: 18247405]
5. Mandal R, Guo AC, Chaudhary KK, et al. Multi-platform characterization of the humancerebrospinal fluid metabolome: a comprehensive and quantitative update. Genome Med. 2012;4:38. [PubMed: 22546835]
6. Zhang Y, Tobias HJ, Brenna JT. Steroid isotopic standards for gas chromatography–combustionisotope ratio mass spectrometry (GCC–IRMS). Steroids. 2009; 74(3):369–378. [PubMed:18992268]
7. Stokvis E, Rosing H, Beijnen JH. Stable isotopically labeled internal standards in quantitativebioanalysis using liquid chromatography/mass spectrometry: necessity or not? Rapid CommunMass Spectrom. 2005; 19(3):401–407. [PubMed: 15645520]
8. Lewis IA, Karsten RH, Norton ME, Tonelli M, Westler WM, Markley JL. NMR methods formeasuring carbon-13 isotopic enrichment of metabolites in complex solutions. Anal Chem. 2010;82(11):4558–4563. [PubMed: 20459129]
9. Hellerstein MK, Neese RA, Linfoot P, Christiansen M, Turner S, Letscher A. Hepaticgluconeogenic fluxes and glycogen turnover during fasting in humans. Clin Invest. 1997; 100:1305–1319.
10. Schwender J, Ohlrogge JB. Probing in vivo metabolism by stable isotope labeling of storage lipiidsand proteins in developing Brassica napus embryos. Plant Physiol. 2002; 130(1):347–361.[PubMed: 12226514]
11. Boros LG, Brackett DJ, Harrigan GG. Metabolic biomarker and kinase drug target discovery incancer using stable isotope-based dynamic metabolic profiling (SIDMAP). Curr Cancer DrugTargets. 2003; 3:447–455.
12. Hood BL, Lucas DA, Kim G, et al. Quantitative analysis of the low molecular weight serumproteome using 18O stable isotope labeling in a lung tumor xenograft mouse model. Am Soc MassSpectrom. 2005; 16:1221–1230.
13. Sonko BJ, Schmitt TC, Guo L, et al. Assessment of usnic acid toxicity in rat primary hepatocytesusing 13C isotopomer distribution analysis of lactate, glutamate and glucose. Food Chem Toxicol.2011; 49(11):2968–2974. [PubMed: 21802472]
14. Schwender J. Metabolic flux analysis as a tool in metabolic engineering of plants. Curr OpinBiotechnol. 2008; 19(2):131–137. [PubMed: 18378441]
15. Beynon, RJ. Stable isotope labeling with amino acids (SILAA) as an aid to protein identification inpeptide mass fingerprinting. In: Conn, PM., editor. Proteomics Methods and Reviews. HumanaPress; NJ, USA: 2003. p. 129-143.
16▪. Ong SE, Blagoev B, Kratchmarova I, et al. Stable isotope labeling by amino acids in cell culture,SILAC, as a simple and accurate approach to expression proteomics. Mol Cell Proteomics. 2002;1:376–386. Description of the stable-isotope labeling with amino acids methodology as aquantitative proteomic approach. [PubMed: 12118079]
17. Gygi SP, Rist B, Gerber SA, Turecek F, Gelb MH, Aebersold R. Quantitative analysis of complexprotein mixtures using isotope-coded affinity tags. Nat Biotechnol. 1999; 17(10):994–999.[PubMed: 10504701]
18. Schmidt A, Kellermann J, Lottspeich F. A novel strategy for quantitative proteomics using isotope-coded protein labels. Proteomics. 2005; 5:4–15. [PubMed: 15602776]
19. Ross PL, Huang YN, Marchese JN, et al. Multiplexed protein quantitation in Saccharomycescerevisiae using amine-reactive isobaric tagging reagents. Mol Cell Proteomics. 2004; 3(12):1154–1169. [PubMed: 15385600]
20. Thompson A, Schäfer J, Kuhn K, et al. Tandem mass tags: a novel quantification strategy forcomparative analysis of complex protein mixtures by MS/MS. Anal Chem. 2003; 75(8):1895–1904. [PubMed: 12713048]
21. Ciccimaro E, Blair IA. Stable isotope dilution LC–MS for quantitative biomarker analysis.Bioanalysis. 2010; 2(2):311–341. [PubMed: 20352077]
de Jong and Beecher Page 9
Bioanalysis. Author manuscript; available in PMC 2013 July 01.
NIH
-PA Author Manuscript
NIH
-PA Author Manuscript
NIH
-PA Author Manuscript

22. Beynon RJ, Pratt JM. Metabolic labeling of proteins for proteomics. Mol Cell Proteomics. 2005;4:857–872. [PubMed: 15849272]
23. Birkemeyer C, Luedemann A, Wagner C, Erban A, Kopka J. Metabolome analysis: the potential ofin vivo labeling with stable isotopes for metabolite profiling. Trends in Biotech. 2005; 23(1):28–33.
24▪. Mashego MR, Wu L, Van Dam JC, et al. MIRACLE: Mass Isotopomer Ratio Analysis of U-13C-Labeled Extracts. A new method for accurate quantification of changes in concentrations ofintracellular metabolites. Biotechnol Bioeng. 2004; 85(6):620–628. Quantitation of metaboliteconcentrations utilizing internal standards of U-13C-labeled metabolite extracts. [PubMed:14966803]
25. Bennett BD, Yuan J, Kimball EH, Rabinowitz JD. Absolute quantitation of intracellual metaboliteconcentrations by an isotope ratio-based approach. Nat Protoc. 2008; 3(8):1299–1311. [PubMed:18714298]
26. Bennett BD, Kimball EH, Gao M, Osterhout R, Van Dien SJ, Rabinowitz JD. Absolute metaboliteconcentrations and implied enzyme active site occupancy in Escherichia coli. Nat Chem Biol.2009; 5(8):593–599. [PubMed: 19561621]
27. Lu W, Kimball E, Rabinowitz JD. A high-performance liquid chromatography-tandem massspectrometry method for quantitation of nitrogen-containing intracellular metabolites. J Am SocMass Spectrom. 2006; 17(1):37–50. [PubMed: 16352439]
28. Lu W, Kwon YK, Rabinowitz JD. Isotope ratio-based profiling of microbial folates. J Am SocMass Spectrom. 2007; 18(5):898–909. [PubMed: 17360194]
29. Nagai H, Goto T, Takahashi N. A method for the simultaneous determination of 3T3-L1 adipocytemetabolites by liquid chromatography/mass spectrometry using [13C]-stable isotopes. BiosciBiotechnol Biochem. 2011; 75(8):1485–1489. [PubMed: 21821950]
30. Huang X, Regnier FE. Differential metabolomics using stable isotope labeling and two-dimensional gas chromatography with time-of-flight mass spectrometry. Anal Chem. 2008; 80 (1):107–114. [PubMed: 18052339]
31. Cook PF, Yoon M-Y, Hara S, McClure GD. Product dependence of deuterium isotope effects inenzyme-catalyzed reactions. Biochemistry. 1993; 32:1795–1802. [PubMed: 8439540]
32. Bender MM, Rouhani I, Vines HM, Black CC Jr. 13C/12C ratio changes in Crassulacean acidmetabolism plants. Plant Physiol. 1973; 52:427–430. [PubMed: 16658576]
33. Claesen J, Dittwald P, Burzykowski T, Valenborg D. An efficient method to calculate theaggregated isotopic distribution and exact center-masses. Am Soc Mass Spectrom. 2012; 23:753–763.
34. Miller RC, Brindle E, Holman DJ. Comparison of specific gravity and creatinine for normalizingurinary reproductive hormone concentrations. Clin Chem. 2004; 50(5):924–932. [PubMed:15105350]
35▪. Warrack BM, Hnatyshyn S, Ott KH, et al. Normalization strategies for metabonomic analysis ofurine samples. J Chromatogr B Analyt Technol Biomed Life Sci. 2009; 877:547–552.Comparison and recommendations for normalization strategies in metabonomics relative to thetotal amount of all endogenous species.
36. Craig A, Cloarec O, Holmes E, Nicholson JK, Lindon JC. Scaling and normalization effects inNMR spectroscopic metabonomic data sets. Anal Chem. 2006; 78:2262–2267. [PubMed:16579606]
37. Liu Y, Song XD, Liu W, Zhang TY, Zuo J. Glucose deprivation induces mitochondrial dysfunctionand oxidative stress in PC12 cell line. J Cell Mol Med. 2003; 7(1):49–56. [PubMed: 12767261]
38. Serkova NJ, Standiford TJ, Stringer KA. The emerging field of quantitative blood metabolomicsfor biomarker discovery in critical illnesses. Am J Respir Crit Care Med. 2011; 184(6):647–655.[PubMed: 21680948]
39. McKillop AM, Flatt PR. Emerging applications of metabolomic and genomic profiling in diabeticclinical medicine. Diabetes Care. 2011; 34(12):2624–2630. [PubMed: 22110171]
40. Huege, J.; Goetze, J.; Dethloff, F.; Junker, B.; Kopka, J. Quantification of Stable Isotope Label inMetabolites Via Mass Spectrometry. Humana Press Inc; NJ, USA: 2012.
de Jong and Beecher Page 10
Bioanalysis. Author manuscript; available in PMC 2013 July 01.
NIH
-PA Author Manuscript
NIH
-PA Author Manuscript
NIH
-PA Author Manuscript

Patent101. Metabolic Analyses Inc. US7820963. 2010.
de Jong and Beecher Page 11
Bioanalysis. Author manuscript; available in PMC 2013 July 01.
NIH
-PA Author Manuscript
NIH
-PA Author Manuscript
NIH
-PA Author Manuscript

Executive summary
Metabolite profiling & stable isotopes
• Standardization techniques through the use of multiple internal standardcompounds and stable-isotope-assisted methods have been historicallyemployed to overcome analytical challenges in metabolite profiling.
• These analytical challenges include ion suppression, sample-to-samplevariability, noise and artifactual confounding peaks and metaboliteidentification.
• Several approaches go a long way in rectifying most of these issues, but they allemploy targeted methods and fall short of solving all analytical problems.
• The use of an internal standard for each metabolite measured is optimal;however, for broad metabolic profiling when using multiple internal standardsto normalize, the choice of which standard to apply to a particular metabolitecan be problematic.
• In vivo stable-isotope-assisted methods include flux analysis, stable-isotopelabeling with amino acids and stable-isotope labeling by amino acids in cellculture. Stable-isotope labeling with amino acids, stable-isotope labeling byamino acids in cell culture and various chemical labeling techniques improvedata quality by removing ion suppression and sample-to-sample variability, andalso provide the benefit of requiring fewer analyses (as the control andexperimental samples are analyzed simultaneously).
Stable-isotopic internal standards
• Rather than the use of natural abundance isotopic standards, stable isotopes canalso be applied as internal standards through the use of stable-isotope dilutionmethodology.
• While this method also utilizes a composite sample for analysis resulting in theremoval of ion suppression and sample-to-sample variability, the problem ofconfounding artifactual peaks and metabolite misidentification remains.
Metabolomics & stable-isotope labeling
• Stable-isotope dilution labeling was initially applied to proteomics and was laterintroduced to metabolomics through the use of ‘Mass Isotopomer Ratio Analysisof U-13C-Labeled Extracts’, an isotope ratio-based quantitation approach.
• While many researchers have applied this protocol to quantitate specific classesof metabolites, the protocol does not eliminate issues of metaboliteidentification and confounding artifactual peaks.
Isotopic Ratio Outlier Analysis™ as a protocol for metabolic profiling, quantitation& identification
• Similar to other stable isotope approaches, the same cell pool can be used tocreate both control and experimental samples using Isotopic Ratio OutlierAnalysis™ (IROA) technology, so that variability is removed, fewer samples arerequired and ion suppression is reduced.
• Artifacts and noise are removed using the IROA protocol. Since all materialfrom either biological system (experimental or control) has a unique isotopicsignature, all unsigned molecules may be discarded or considered separately.
de Jong and Beecher Page 12
Bioanalysis. Author manuscript; available in PMC 2013 July 01.
NIH
-PA Author Manuscript
NIH
-PA Author Manuscript
NIH
-PA Author Manuscript
This means all artifactual signals can be removed from the dataset (usually thelargest portion of the dataset), which is not possible in current metabolomicsdatasets where the high number of ‘observations’ increases the false discoveryrate. IROA ClusterFinder™ software algorithms sort through the dataset,removing irrelevant noise and artifacts, allowing for a very dramatic reductionin data size.
• When employing IROA, because samples are isotopically labeled, the numberof carbons for each biochemical compound can be calculated from its massspectra and the compound readily identified. The IROA technology uses acentral point of reference (biochemical) embedded in every sample, therebyenabling measurements of samples with quantitative exactness.
Normalization of IROA datasets
• Since the IROA technology is designed to identify artifacts and nonbiologicalpeaks, normalization can be achieved using ‘MS total useful signal’normalization using only the components that are common to all signals,following the removal of xenobiotics, noise and artifacts.
Application of the IROA approach in Saccharomyces cerevisiae
• To illustrate the IROA methodology, the metabolite profiles of the biosyntheticcompounds surrounding glutathione during the fermentation process ofSaccharomyces cerevisiae were measured using isotopically defined media(whereby all carbon sources were labeled with either 5%13C/95%12C or95%13C/5%12C) and LC–MS analysis.
The use of IROA phenotyping application for the metabolic profiling of tissues orbiofluids
• Where it is not possible to isotopically label experimental samples, such asbiopsies or biological fluids, a ‘phenotypic’ approach to the IROA technique canbe applied. Here, a complex internal standard that represents the metabolome ofthe fluid or tissue under study is isotopically labeled using IROA 13C media andthen spiked into the experimental sample prior to analysis.
• While this is a targeted approach, all labeled metabolites will have acharacteristic M-1 peak and the experimental natural abundance equivalents canbe identified relative to the labeled standards and artifactual peaks can beremoved as they will have no match.
Conclusion & future perspective
• The IROA technology has analytical advantages over existing isotopicmetabolite profiling methods. However, the application of these methods formetabolomics is still in its infancy.
de Jong and Beecher Page 13
Bioanalysis. Author manuscript; available in PMC 2013 July 01.
NIH
-PA Author Manuscript
NIH
-PA Author Manuscript
NIH
-PA Author Manuscript
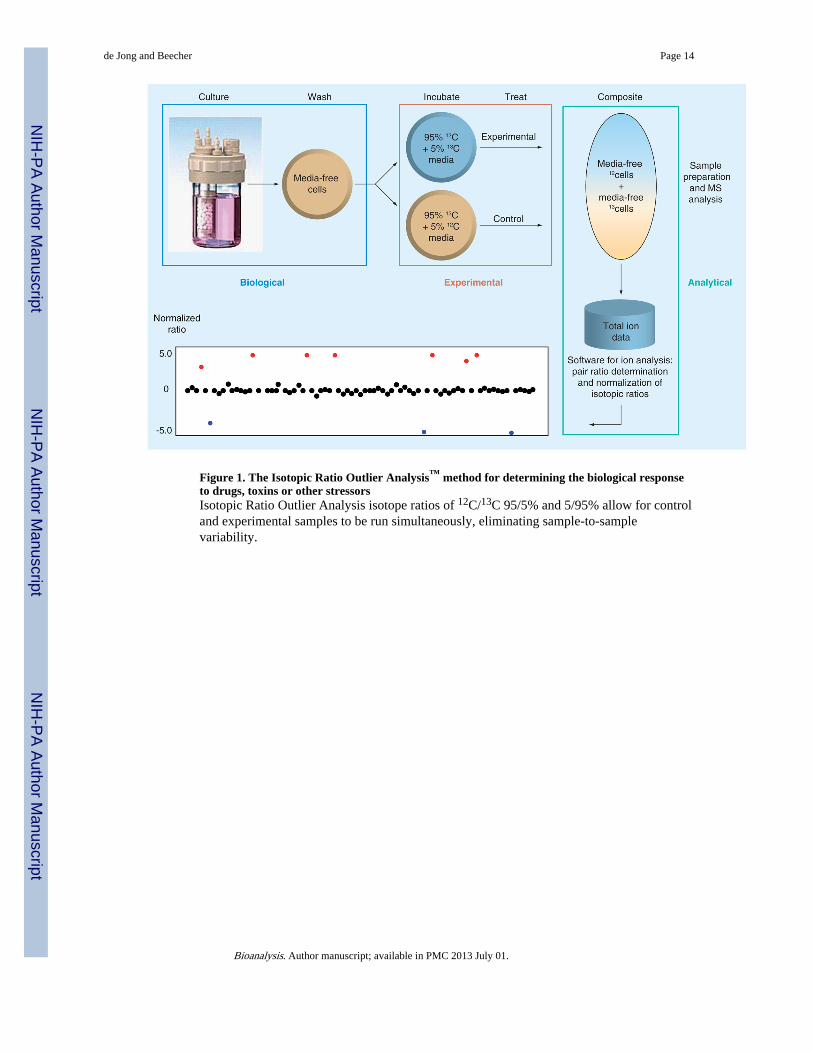
Figure 1. The Isotopic Ratio Outlier Analysis™ method for determining the biological responseto drugs, toxins or other stressorsIsotopic Ratio Outlier Analysis isotope ratios of 12C/13C 95/5% and 5/95% allow for controland experimental samples to be run simultaneously, eliminating sample-to-samplevariability.
de Jong and Beecher Page 14
Bioanalysis. Author manuscript; available in PMC 2013 July 01.
NIH
-PA Author Manuscript
NIH
-PA Author Manuscript
NIH
-PA Author Manuscript
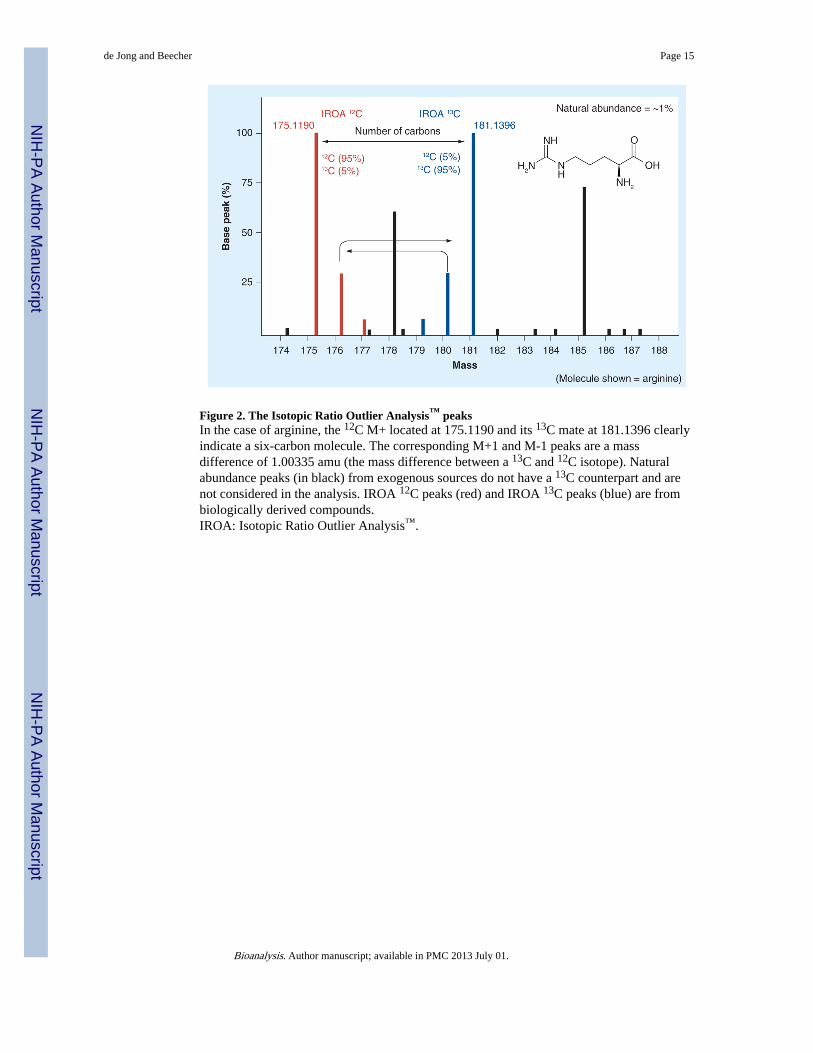
Figure 2. The Isotopic Ratio Outlier Analysis™ peaksIn the case of arginine, the 12C M+ located at 175.1190 and its 13C mate at 181.1396 clearlyindicate a six-carbon molecule. The corresponding M+1 and M-1 peaks are a massdifference of 1.00335 amu (the mass difference between a 13C and 12C isotope). Naturalabundance peaks (in black) from exogenous sources do not have a 13C counterpart and arenot considered in the analysis. IROA 12C peaks (red) and IROA 13C peaks (blue) are frombiologically derived compounds.IROA: Isotopic Ratio Outlier Analysis™.
de Jong and Beecher Page 15
Bioanalysis. Author manuscript; available in PMC 2013 July 01.
NIH
-PA Author Manuscript
NIH
-PA Author Manuscript
NIH
-PA Author Manuscript

Figure 3. The biosynthetic pathways surrounding glutathione in Saccharomyces cerevisiae duringa 72-h time course(A) IROA peaks, (B) Biological compounds and (C) Isotopic Ratio Outlier Analysis ratios.IROA: Isotopic Ratio Outlier Analysis™.
de Jong and Beecher Page 16
Bioanalysis. Author manuscript; available in PMC 2013 July 01.
NIH
-PA Author Manuscript
NIH
-PA Author Manuscript
NIH
-PA Author Manuscript

Figure 4. The Isotopic Ratio Outlier Analysis™ phenotyping applicationThe material to be phenotyped is mixed with 13C (Isotopic Ratio Outlier Analysis) cells and/or standard compounds that allow one to find and pair all peaks. The deviation from thestandard is diagnostic of the sample’s biochemical phenotype.
de Jong and Beecher Page 17
Bioanalysis. Author manuscript; available in PMC 2013 July 01.
NIH
-PA Author Manuscript
NIH
-PA Author Manuscript
NIH
-PA Author Manuscript

NIH
-PA Author Manuscript
NIH
-PA Author Manuscript
NIH
-PA Author Manuscript
de Jong and Beecher Page 18
Table 1
Features of standard isotopic labeling using U-13C versus Isotopic Ratio Outlier Analysis™.
Feature U-13C (99 atom %) IROA
Sample throughput High to medium High to medium
Removal of sample-to-sample variance Yes – control and experimental samples areprepped and analyzed together, removingvariability
Yes – control and experimental samples are preppedand analyzed together, removing variability
Removal of ion suppression Yes – ionization is similar for isotopomers Yes – ionization is similar for isotopomers
Reduction of the number of samples tobe analyzed
Yes – control and experimental samplespooled and run as a single sample, reducingthe number of samples to be analyzed byhalf
Yes – control and experimental samples pooled andrun as a single sample, reducing the number ofsamples to be analyzed by half
Distinguishes artifacts and noise No Yes – allows classification of all peaks ascompounds or artifacts
Metabolite coverage Targeted Global
Metabolite Identification No Number of carbon atoms and residual mass defined
IROA: Isotopic Ratio Outlier Analysis™.
Bioanalysis. Author manuscript; available in PMC 2013 July 01.
Copyright © 2022 FDOKUMEN