Outlier detection algorithms and their performance in GOCE gravity field processing

Outlier Detection Using Replicator NeuralNetworks
Simon Hawkins, Hongxing He, Graham Williams and Rohan Baxter
CSIRO Mathematical and Information SciencesGPO Box 664, Canberra ACT 2601, Australia
Abstract. We consider the problem of finding outliers in large multi-variate databases. Outlier detection can be applied during the data cleans-ing process of data mining to identify problems with the data itself, andto fraud detection where groups of outliers are often of particular inter-est. We use replicator neural networks (RNNs) to provide a measure ofthe outlyingness of data records. The performance of the RNNs is as-sessed using a ranked score measure. The effectiveness of the RNNs foroutlier detection is demonstrated on two publicly available databases.
1 Introduction
Outlier detection algorithms have application in several tasks within data min-ing. Data cleansing requires that aberrant data items be identified and dealtwith appropriately. For example, outliers are removed or considered separatelyin regression modelling to improve accuracy. Detected outliers are candidatesfor aberrant data. In many applications outliers are more interesting than in-liers. Fraud detection is a classic example where attention focuses on the outliersbecause these are more likely to represent cases of fraud. Fraud detection in in-surance, banking and telecommunications are major application areas for datamining. Detected outliers can indicate individuals or groups of customers thathave behaviour outside the range of what is considered ‘normal’ [8, 6, 21].
Studies from the field of statistics have typically considered outliers to beresiduals or deviations from a regression or density model of the data:
An outlier is an observation that deviates so much from other observa-tions as to arouse suspicion that it was generated by a different mecha-nism [9].
In this paper we employ multi-layer perceptron neural networks with threehidden layers, and the same number of output neurons and input neurons, tomodel the data. These neural networks are known as replicator neural networks(RNNs). In the RNN model the input variables are also the output variables sothat the RNN forms an implicit, compressed model of the data during training.A measure of outlyingness of individuals is then developed as the reconstruc-tion error of individual data points. The RNN approach has linear analogues inPrincipal Components Analysis [10].

The insight exploited in this paper is that the trained neural network willreconstruct some small number of individuals poorly and these can be consideredas outliers. We measure outlyingness by ranking data according to the magnitudeof the reconstruction error. This compares to SmartSifter [22] which similarlybuilds models to identify outliers but scores the individuals depending on thedegree to which they perturb the model.
Following [22], [4] and [17] when dealing with large databases, we considerit more meaningful to assign each datum an outlyingness score. The continuousscore reflects the fuzzy nature of outlyingness and also allows the investigationof outliers to be automatically prioritised for analysis.
2 Related Work
We classify outlier detection methods as either distribution-based or distance-based. However, a probabilistic interpretation can often be placed on the distance-based approaches and so the two categories can overlap. Other classifications ofoutlier detection methods are based on whether the method provides an out-lyingness score or a binary predicate (which may also be based on a score), orwhether the method measures outlyingness from the bulk (i.e., a convex hull)of the data, or from a regression surface. Distribution-based methods includemixture models such as SmartSifter [22]. Individuals are scored according tothe degree to which they perturb the currently learnt model. Distance-basedmethods use distance metrics such as Mahalanobis distance [2, 15] or Euclideandistance [11, 13, 12]. A prominent and useful technique for detecting outliersis to use a clustering algorithm, such as CURE or BIRCH, and then designatedata occurring in very small clusters, or data distant from existing clusters asoutliers [16, 21, 7, 23, 14]. Visualisation methods [3], based on grand tour projec-tions, can also be considered distance-based since the distance between points isprojected onto a 2-dimensional plane. Visualisations using immersive virtual en-vironments [20] similarly explore the space for outliers allowing users to identifyand view outliers in multiple dimensions. Despite the obvious issues of subjec-tiveness and scaling, visualisation techniques are very useful in outlier detection.Readily available visualisation tools such as xgobi [18] provide an effective, ef-ficient, and interactive initial exploration of outliers in data (or necessarily asample of the data). We are aware of only one other previous neural networkmethod approach to detecting outliers [19]. Sykacek’s neural network approachis to use a multi-layer perceptron (MLP) as a regression model and to then treatoutliers as data with residuals outside the error bars.
3 Replicator Neural Network Outlier Detection
Although several applications in image and speech processing have used theReplicator Neural Network for its data compression capabilities [1, 10], we believethe current study is the first to propose its use as a outlier detection tool.

As mentioned in Section 1, the RNN is a variation on the usual regressionmodel. Normally, input vectors are mapped to desired output vectors in multi-layer perceptron neural networks. For the RNN, however, the input vectors arealso used as the output vectors; the RNN attempts to reproduce the input pat-terns in the output. During training, the weights of the RNN are adjusted tominimise the mean square error (or mean reconstruction error) for all trainingpatterns. As a consequence, common patterns are more likely to be well repro-duced by the trained RNN so that those patterns representing outliers will be lesswell reproduced by a trained RNN and will have a higher reconstruction error.The reconstruction error is used as the measure of outlyingness of a datum.
3.1 RNN
The RNN we use is a feed-forward multi-layer perceptron with three hiddenlayers sandwiched between an input layer and an output layer. The function ofthe RNN is to reproduce the input data pattern at the output layer with errorminimised through training. Both input and output layers have n units, corre-sponding to the n features of the training data. The number of units in the threehidden layers are chosen experimentally to minimise the average reconstructionerror across all training patterns. Heuristics for making this choice are discussedlater in this section. Figure 1 shows a schematic view of the fully connectedReplicator Neural Network. The output of unit i of layer k is calculated by the
V1
V
V
2
n
V
.
.
.
i
V
V
V
1
2
n
TargetInput
.
.
.
V3...
.
.
.
Layer 1 2 3 4 5
Fig. 1. A schematic view of a fully connected Replicator Neural Network.
activation function Sk(Iki), where Iki, denoted generically as θ, is the weightedsum of the inputs to the unit and defined as:
θ = Iki =Lk−1∑j=0
wkijZ(k−1)j (1)
Zkj is the output from the jth unit of the kth layer. Lk is the number of unitsin the kth layer.
The activation function for the two outer hidden layers (k = 2, 4) is then:
Sk(θ) = tanh(akθ) k = 2, 4 (2)
where ak is a tuning parameter which is set to 1 for our experiments. For themiddle hidden layer (k = 3), the activation function is staircase like with pa-rameter N as the number of steps or activation levels and a3 controlling the

transition rate from one level to the next:
S3(θ) =12
+1
2(k − 1)
N−1∑j=1
tanh[a3(θ −j
N)] (3)
With a3 set to a large value (we use a3 = 100 throughout this work) and N = 4the resulting activation function is shown in Figure 2. The activation levels ofthe hidden units are thus quantised into N discrete values: 0, 1
N−1 , 2N−1 , . . . 1.
The step-wise activation function used for the middle hidden layer divides the
(θ )S3
θ
Fig. 2. Activation function of the units in the middle hidden layer.
continuously distributed data points into a number of discrete valued vectors.Through this mechanism data compression is achieved. The same architecture isadopted in this work for outlier detection. The mapping to the discrete categoriesin the middle hidden layer naturally places the data points into a number ofclusters. The outliers identified by the RNN can be analysed further to identifyindividual outliers and small clusters. We discuss this further in later sections.
Training the RNN. We choose one of two candidate functions as the activationfunction for the output layer. The first is linear and is the weighted sum of theinputs using the formula in Equation 1, so that S5(θ) = θ. The second is theSigmoid function:
S5(θ) =1
1 + e−a5θ(4)
We use an adaptive learning rate for training the neural network at each iterationlevel, l . The weights in the neural network are updated using:
wl+1ij = wl
ij + αl+1∆wl+1ij (5)
The new learning rate at iteration l + 1, αl+1 is given by:
αl+1 =
βr ∗ αl if el+1 > 1.01 ∗ el (undo weight update)βe ∗ αl if el+1 < el and αl < αmax
αl otherwise(6)

Where el in equation 6 refers to the mean square error.
el =1
mn
M∑i=1
n∑j=1
(xij − olij)
2 (7)
In Equation 7, m is the number of records in the training set, n is the numberof features, and xij is the input value and is also the targeted output value(i = 1, 2, . . . ,m, j = 1, 2, . . . , n) and ol
ij is the value of the output from the RNNfor the lth iteration. The Initial Learning Rate, α0, the Maximum LearningRate, αmax, the Learning Rate Enlargement Factor, βe, and the Learning RateReduction Factor, βr, are adjustable parameters.
In our experiment of Section 4, we use the fixed settings shown in Table 1.. For convergence some data sets require adjustment to the training parameters
α0 Initial Learning Rate 0.0001αmax Maximum Learning Rate 0.02βe Learning Rate Enlargement Factor 1.005βr Learning Rate Reduction Factor 0.98
Table 1. Parameter values used for updating the learning rate.
and the number of units in the RNN architecture. Furthermore, in the experi-ments to be discussed in Section 4 we use different numbers of hidden units fordifferent data sets, ranging over 15, 35, 40, and 45. Increasing the number of hid-den units increases training time but convergence is more likely. The success oftraining is evaluated by the average reconstruction error. It is not very sensitiveto most parameters, a few experiment may be needed in choosing the values ofa couple of parameters to guarantee the convergence of the error.
3.2 Methodology for applying RNN to Outlier Detection
We now describe the measure of outlyingness, the treatment of categorical vari-ables, and the sampling scheme for large data sets.
Outlier Factor (OF ) We define the Outlier Factor of the ith data record OFi asour measure of outlyingness. OFi is defined by the average reconstruction errorover all features (variables)
OFi =1n
n∑j=1
(xij − oij)2 (8)
where n is the number of features. The OF is evaluated for all data records usingthe trained RNN.
Categorical Variables For datasets with categorical variables, we split the datasetinto a number of subsets, each corresponding to a set of particular values of thecategorical variables. For example, if we have two categorical variables each withtwo categories, we split the data set into four disjoint subsets each corresponding

to the unique combination of values of the two categorical variables. We thentrain an RNN for each subset individually. This is not an optimal way of treatingcategorical variables and a better method is being developed.
Sampling and Training For each subset Ci, we sample a portion of data eitherrandomly or by selecting every nth record to train the RNN.
Applying the Trained RNN The trained RNN is used to calculate OFi for alldata points.
4 Experimental Results
We demonstrate the effectiveness of the RNN as an outlier detector on threedata sets.
4.1 Network Intrusion Detection
We apply the RNN approach to the 1999 KDD Cup network intrusion detec-tion data set [5]. Each event in the original data set of nearly 5 million eventsis labelled as an intrusion or not an intrusion. This class label is not includedwhen training the RNN but is used to assess the RNN’s performance in iden-tifying intrusions. In summary we show that RNN outlier detection over thenetwork intrusion data effectively identifies those events that are intrusions. Wefollow the experimental technique employed in [22]. There are 41 attributes inthe 1999 KDD Cup data set. There are 34 numerical variables and 7 categor-ical variables. The categorical variable attack originally had 22 distinct values(normal, back, buffer overflow etc.). We map these 22 distinct values to a binarycategorical variable by mapping all values, except normal, to attack. We usefour of the 41 original attributes (service, duration, src bytes, dst bytes) becausethese attributes are thought to be the most important features [22]. Service isa categorical feature while the other three are continuous features. There are41 original categories of service which are mapped into five categorical values:http, smtp, ftp, ftp data, and others. Since the continuous features were concen-trated around 0, we transformed each continuous feature by the log-transformy = log(x+1.0) for some subset. The original data set contained 4,898,431 datarecords, including 3,925,651 attacks (80.1%). This high rate is too large for at-tacks to be considered outliers. Therefore, following [22] we produced a subsetconsisting of 703,066 data records including 3,377 attacks (0.48%). The subsetconsists of those records with logged in being positive. Attacks that successfullylogged in are called intrusions.
Sampling The data set is then divided into five subsets according to the fivevalues of service. The aim is to identify intrusions within each of the categoriesby identifying outliers using the RNN approach. For the smaller of the resultingsubsets (other contained 5858 events and ftp contained 4091 events) all of the
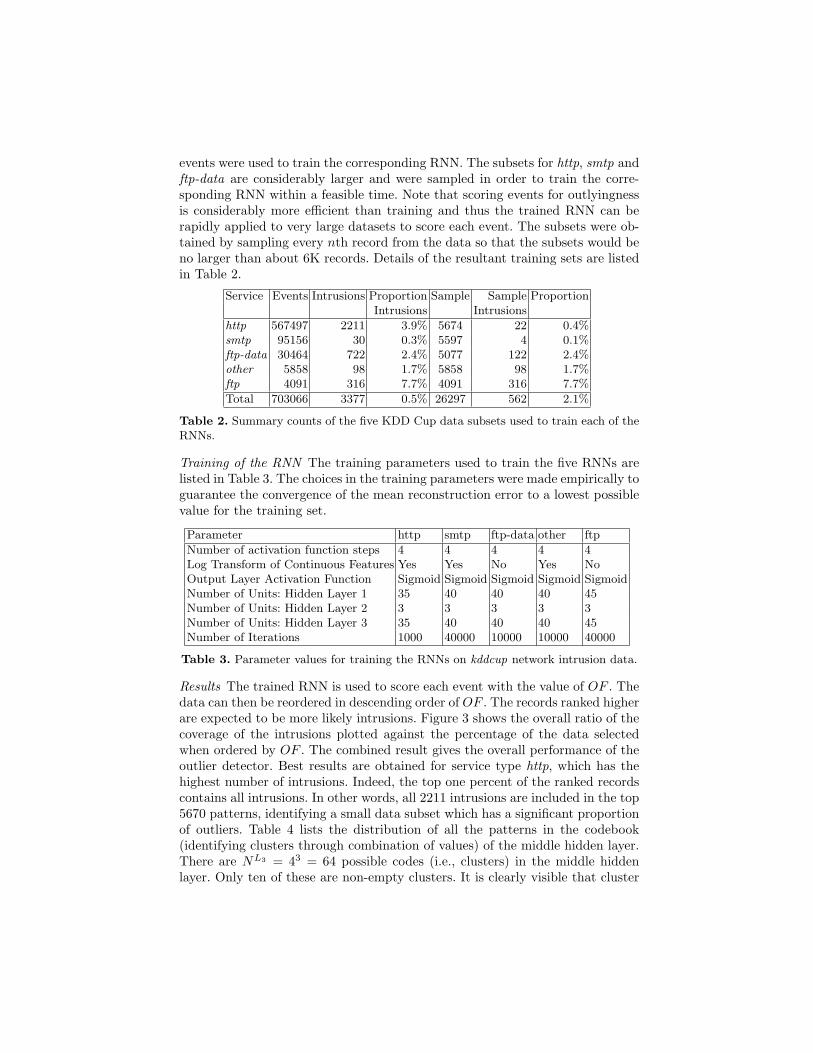
events were used to train the corresponding RNN. The subsets for http, smtp andftp-data are considerably larger and were sampled in order to train the corre-sponding RNN within a feasible time. Note that scoring events for outlyingnessis considerably more efficient than training and thus the trained RNN can berapidly applied to very large datasets to score each event. The subsets were ob-tained by sampling every nth record from the data so that the subsets would beno larger than about 6K records. Details of the resultant training sets are listedin Table 2.
Service Events Intrusions Proportion Sample Sample ProportionIntrusions Intrusions
http 567497 2211 3.9% 5674 22 0.4%smtp 95156 30 0.3% 5597 4 0.1%ftp-data 30464 722 2.4% 5077 122 2.4%other 5858 98 1.7% 5858 98 1.7%ftp 4091 316 7.7% 4091 316 7.7%
Total 703066 3377 0.5% 26297 562 2.1%
Table 2. Summary counts of the five KDD Cup data subsets used to train each of theRNNs.
Training of the RNN The training parameters used to train the five RNNs arelisted in Table 3. The choices in the training parameters were made empirically toguarantee the convergence of the mean reconstruction error to a lowest possiblevalue for the training set.
Parameter http smtp ftp-data other ftp
Number of activation function steps 4 4 4 4 4Log Transform of Continuous Features Yes Yes No Yes NoOutput Layer Activation Function Sigmoid Sigmoid Sigmoid Sigmoid SigmoidNumber of Units: Hidden Layer 1 35 40 40 40 45Number of Units: Hidden Layer 2 3 3 3 3 3Number of Units: Hidden Layer 3 35 40 40 40 45Number of Iterations 1000 40000 10000 10000 40000
Table 3. Parameter values for training the RNNs on kddcup network intrusion data.
Results The trained RNN is used to score each event with the value of OF . Thedata can then be reordered in descending order of OF . The records ranked higherare expected to be more likely intrusions. Figure 3 shows the overall ratio of thecoverage of the intrusions plotted against the percentage of the data selectedwhen ordered by OF . The combined result gives the overall performance of theoutlier detector. Best results are obtained for service type http, which has thehighest number of intrusions. Indeed, the top one percent of the ranked recordscontains all intrusions. In other words, all 2211 intrusions are included in the top5670 patterns, identifying a small data subset which has a significant proportionof outliers. Table 4 lists the distribution of all the patterns in the codebook(identifying clusters through combination of values) of the middle hidden layer.There are NL3 = 43 = 64 possible codes (i.e., clusters) in the middle hiddenlayer. Only ten of these are non-empty clusters. It is clearly visible that cluster

0 20 40 60 80 100
020
4060
8010
0
Top % of observations
% in
tru
sio
ns
cove
red
httpsmtpftpftp_dataothertotal
Fig. 3. Ratio of detected intrusions found by the RNN method
48 has 2202 (99.6%) intrusion cases and only 31 normal cases. All other clustershave only normal cases (except cluster 51, which has only one intrusion cases).
Cluster Middle hidden layer output Total normal attackIndex Neuron 1 Neuron 2 Neuron 3 Records Records Records
0 0 0 0 21137 21131 61 0 0 1 103 102 12 0 0 2 409 408 1
16 1 0 0 539448 539448 017 1 0 1 50 50 018 1 0 2 2 2 032 2 0 0 4105 4105 048 3 0 0 2233 31 220249 3 0 1 9 9 051 3 0 3 1 0 1
Table 4. Results for http, according to middle hidden layer output
4.2 Wisconsin Breast Cancer Dataset
The Wisconsin breast cancer data set is found in the UCI machine learningrepository[5]. The dataset contains nine continuous attributes. Each record islabelled as benign (458 or 65.5%) or malignant (241 or 34.5%). We removedsome of the malignant records to form a very unbalanced distribution for testingthe RNN outlier detection method. When one in every six malignant recordswas chosen, the resultant data set had 39 (8%) malignant records and 444 (92%)benign records. The results are shown in Table 5. Within the top 40 ranked cases(ranked according to the Outlier Factor), 30 of the malignant cases (the outliers),comprising 77% of all malignant cases, were identified. There are 25 non-emptyclusters out of 64 possible codes. Among the non-empty clusters eleven of them(0-15) form a super cluster. The common characteristic of this super cluster isthat the output from the first neuron is 0. There are 53 records in this cluster and36 of them are malignant cases (outliers). We can categorise this super clusteras an outlier cluster with 68% (36/53) confidence. On the other hand, the otherthree super clusters (where output from the first neuron of the middle hiddenlayer is 1, 2, and 3 respectively) contains mostly inliers.

Top % Number of Number of % of Top % Number of Number of % ofof record malignant record malignant of record malignant record malignant
0 0 0 0.00 12 35 48 89.741 3 4 7.69 14 36 56 92.312 6 8 15.38 16 36 64 92.314 11 16 28.21 18 38 72 97.446 18 24 46.15 20 38 80 97.448 25 32 64.10 25 38 100 97.4410 30 40 76.92 28 39 112 100.00
Table 5. Results for Wisconsin breast cancer data according to outlier factor
5 Discussion and Conclusions
We have presented an outlier detection approach based on Replicator NeuralNetworks (RNN). An RNN is trained from a sampled data set to build a modelthat predicts the given data. We use this model to develop a score for outlying-ness (called the Outlier Factor) where the trained RNN is applied to the wholedata set to give a quantitative measure of the outlyingness based on the recon-struction error. Our approach takes the view of letting the data speak for itselfwithout relying on too many assumptions. SmartSifter, for example, assumes amixed Gaussian distribution for inliers. Distance-based outlier methods use achosen distance metric to measure the distances between the data points withthe number of clusters and the distance metric preset. The RNN approach alsoidentifies cluster labels for each data record. The cluster label can often helpto interpret the resulting outliers. For example, outliers are sometimes found tobe concentrated in a single cluster (as in service type http of the KDD99 in-trusion data) or in a group of clusters with common characteristics (as in theWisconsin breast cancer data). The cluster label not only enables the individualsto be identified as outliers but also groups to identified as being outliers, as in[21]. We have demonstrated the method on two publicly available data sets. Totest the accuracy of the method datasets with unbalanced distributions two ormore classes were selected. The RNN was able to identify outliers (small classes)without using the class labels with high accuracy in both datasets. A papercomparing the RNN with other outlier detection methods is in preparation.
References
[1] D. H. Ackley, G. E. Hinton, and T. J. Sejinowski. A learning algorithm forboltzmann machines. Cognit. Sci., 9:147–169, 1985.
[2] A. C. Atkinson. Fast very robust methods for the detection of multiple outliers.Journal of the American Statistical Association, 89:1329–1339, 1994.
[3] A. Bartkowiak and A. Szustalewicz. Detecting multivariate outliers by a grandtour. Machine Graphics and Vision, 6(4):487–505, 1997.
[4] M. Breunig, H. Kriegel, R. Ng, and J. Sander. Lof: Identifying density-based localoutliers. In Proc. ACM SIGMOD, Int. Conf. on Management of Data, 2000.
[5] 1999 KDD Cup competition. http://kdd.ics.uci.edu/databases/kddcup99/kddcup99.html.

[6] W. DuMouchel and M. Schonlau. A fast computer intrusion detection algorithmbased on hypothesis testing of command transition probabilities. In Proc. 4th Int.Conf. on Knowledge Discovery and Data Mining, pages 189–193, 1998.
[7] M. Ester, H. P. Kriegel, J. Sander, and X. Xu. A density-based algorithm fordiscovering clusters in large spatial databases with noise. In Proc. KDD, pages226–231, 1999.
[8] T. Fawcett and F. Provost. Adaptive fraud detection. Data Mining and KnowledgeDiscovery Journal, 1(3):291–316, 1997.
[9] D. M. Hawkins. Identification of outliers. Chapman and Hall, London, 1980.[10] R. Hecht-Nielsen. Replicator neural networks for universal optimal source coding.
Science, 269(1860-1863), 1995.[11] E. Knorr and R. Ng. A unified approach for mining outliers. In Proc. KDD, pages
219–222, 1997.[12] E. Knorr and R. Ng. Algorithms for mining distance-based outliers in large
datasets. In Proc. 24th Int. Conf. Very Large Data Bases, VLDB, pages 392–403, 24–27 1998.
[13] E. Knorr., R. Ng, and V. Tucakov. Distance-based outliers: Algorithms and ap-plications. VLDB Journal: Very Large Data Bases, 8(3–4):237–253, 2000.
[14] George Kollios, Dimitrios Gunopoulos, Nick Koudas, and Stefan Berchtold. Anefficient approximation scheme for data mining tasks. In ICDE, 2001.
[15] A. S. Kosinksi. A procedure for the detection of multivariate outliers. Computa-tional Statistics and Data Analysis, 29, 1999.
[16] R. Ng and J. Han. Efficient and effective clustering methods for spatial datamining. In Proc. 20th VLDB, pages 144–155, 1994.
[17] S. Ramaswamy, R. Rastogi, and K. Shim. Efficient algorithms for mining outliersfrom large data sets. In Proceedings of International Conference on Managementof Data, ACM-SIGMOD, Dallas, 2000.
[18] D. F. Swayne, D. Cook, and A. Buja. XGobi: interactive dynamic graphics in theX window system with a link to S. In Proceedings of the ASA Section on StatisticalGraphics, pages 1–8, Alexandria, VA, 1991. American Statistical Association.
[19] P. Sykacek. Equivalent error bars for neural network classifiers trained by bayesianinference. In Proc. ESANN, 1997.
[20] G. Williams, I. Altas, S. Bakin, Peter Christen, Markus Hegland, Alonso Marquez,Peter Milne, Rajehndra Nagappan, and Stephen Roberts. The integrated deliveryof large-scale data mining: The ACSys data mining project. In Mohammed J. Zakiand Ching-Tien Ho, editors, Large-Scale Parallel Data Mining, LNAI State-of-the-Art Survey, pages 24–54. Springer-Verlag, 2000.
[21] G. Williams and Z. Huang. Mining the knowledge mine: The hot spots method-ology for mining large real world databases. In Abdul Sattar, editor, AdvancedTopics in Artificial Intelligence, volume 1342 of Lecture Notes in Artificial Intel-ligenvce, pages 340–348. Springer, 1997.
[22] K. Yamanishi, J. Takeuchi, G. Williams, and P. Milne. On-line unsupervisedoutlier detection using finite mixtures with discounting learning algorithm. InProceedings of KDD2000, pages 320–324, 2000.
[23] T. Zhang, R. Ramakrishnan, and M. Livny. An efficient data clustering methodfor very large databases. In Proc. ACM SIGMOD, pages 103–114, 1996.
Copyright © 2022 FDOKUMEN