The Role of Outlier Analysis in Reducing Purposeful Sampling ...
14
Paper ID #13427 The Role of Outlier Analysis in Reducing Purposeful Sampling Bias: A Se- quential Mixed-Method Approach Mariana Tafur, Purdue University, West Lafayette Mariana Tafur is a Ph.D. candidate and a graduate assistant in the School of Engineering Education at Purdue University. She has a M.S., in Education at Los Andes University, Bogota, Colombia; and a B.S., in Electrical Engineering at Los Andes University, Bogota, Colombia. She is a 2010 Fulbright Fellow. Her research interests include engineering skills development, STEM for non-engineers adults, motivation in STEM to close the technology literacy gap, STEM formative assessment, and Mixed-Methods design. Dr. Senay Purzer, Purdue University, West Lafayette enay Purzer is an Assistant Professor in the School of Engineering Education. She is the recipient of a 2012 NSF CAREER award, which examines how engineering students approach innovation. She serves on the editorial boards of Science Education and the Journal of Pre-College Engineering Educa- tion (JPEER). She received a B.S.E with distinction in Engineering in 2009 and a B.S. degree in Physics Education in 1999. Her M.A. and Ph.D. degrees are in Science Education from Arizona State University earned in 2002 and 2008, respectively. c American Society for Engineering Education, 2015 Page 26.1570.1
-
Upload
khangminh22 -
Category
Documents
-
view
3 -
download
0
Transcript of The Role of Outlier Analysis in Reducing Purposeful Sampling ...
Paper ID #13427
The Role of Outlier Analysis in Reducing Purposeful Sampling Bias: A Se-quential Mixed-Method Approach
Mariana Tafur, Purdue University, West Lafayette
Mariana Tafur is a Ph.D. candidate and a graduate assistant in the School of Engineering Education atPurdue University. She has a M.S., in Education at Los Andes University, Bogota, Colombia; and a B.S.,in Electrical Engineering at Los Andes University, Bogota, Colombia. She is a 2010 Fulbright Fellow. Herresearch interests include engineering skills development, STEM for non-engineers adults, motivation inSTEM to close the technology literacy gap, STEM formative assessment, and Mixed-Methods design.
Dr. Senay Purzer, Purdue University, West Lafayette
enay Purzer is an Assistant Professor in the School of Engineering Education. She is the recipientof a 2012 NSF CAREER award, which examines how engineering students approach innovation. Sheserves on the editorial boards of Science Education and the Journal of Pre-College Engineering Educa-tion (JPEER). She received a B.S.E with distinction in Engineering in 2009 and a B.S. degree in PhysicsEducation in 1999. Her M.A. and Ph.D. degrees are in Science Education from Arizona State Universityearned in 2002 and 2008, respectively.
c©American Society for Engineering Education, 2015
Page 26.1570.1
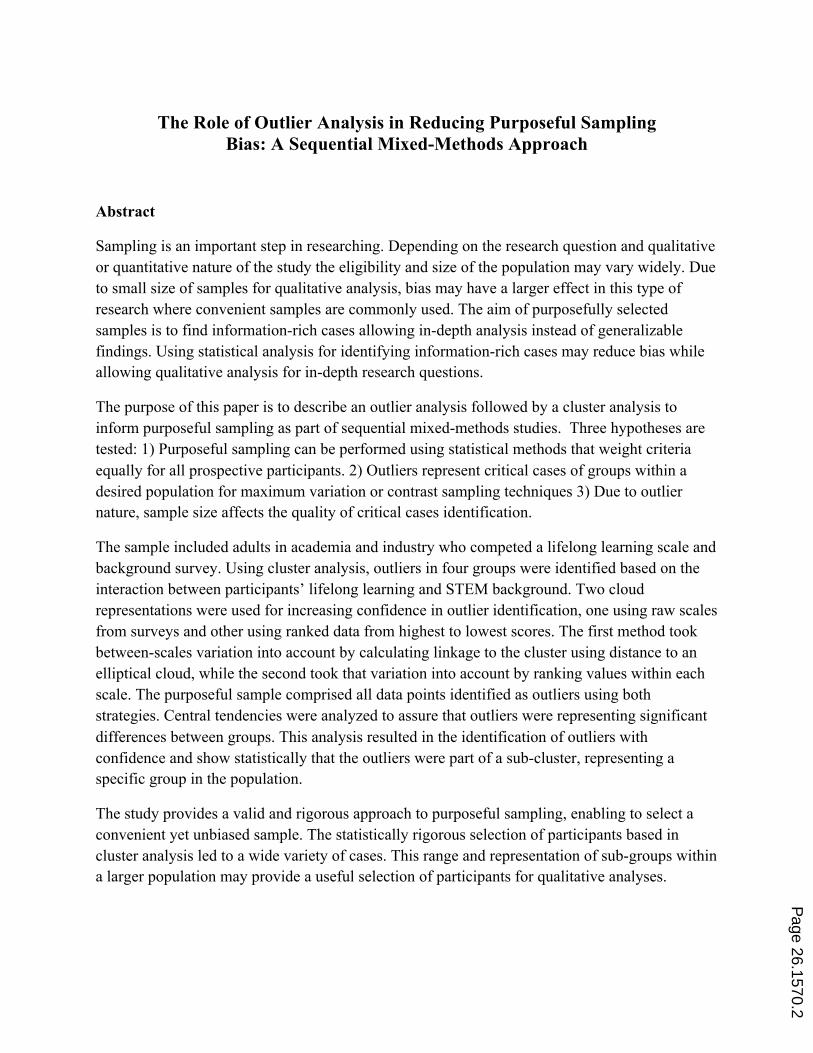
The Role of Outlier Analysis in Reducing Purposeful Sampling Bias: A Sequential Mixed-Methods Approach
Abstract
Sampling is an important step in researching. Depending on the research question and qualitative or quantitative nature of the study the eligibility and size of the population may vary widely. Due to small size of samples for qualitative analysis, bias may have a larger effect in this type of research where convenient samples are commonly used. The aim of purposefully selected samples is to find information-rich cases allowing in-depth analysis instead of generalizable findings. Using statistical analysis for identifying information-rich cases may reduce bias while allowing qualitative analysis for in-depth research questions.
The purpose of this paper is to describe an outlier analysis followed by a cluster analysis to inform purposeful sampling as part of sequential mixed-methods studies. Three hypotheses are tested: 1) Purposeful sampling can be performed using statistical methods that weight criteria equally for all prospective participants. 2) Outliers represent critical cases of groups within a desired population for maximum variation or contrast sampling techniques 3) Due to outlier nature, sample size affects the quality of critical cases identification.
The sample included adults in academia and industry who competed a lifelong learning scale and background survey. Using cluster analysis, outliers in four groups were identified based on the interaction between participants’ lifelong learning and STEM background. Two cloud representations were used for increasing confidence in outlier identification, one using raw scales from surveys and other using ranked data from highest to lowest scores. The first method took between-scales variation into account by calculating linkage to the cluster using distance to an elliptical cloud, while the second took that variation into account by ranking values within each scale. The purposeful sample comprised all data points identified as outliers using both strategies. Central tendencies were analyzed to assure that outliers were representing significant differences between groups. This analysis resulted in the identification of outliers with confidence and show statistically that the outliers were part of a sub-cluster, representing a specific group in the population.
The study provides a valid and rigorous approach to purposeful sampling, enabling to select a convenient yet unbiased sample. The statistically rigorous selection of participants based in cluster analysis led to a wide variety of cases. This range and representation of sub-groups within a larger population may provide a useful selection of participants for qualitative analyses.
Page 26.1570.2
Background
Sample size in research designs ranges from one (usually an individual) to millions of data points. Engineering education research has to constantly deal with this dualism between small and large samples, non-human and human-based research, quantitative and qualitative designs, and other research elements. At the heart of these trade-offs is sampling.
Literature Review
Sampling in Quantitative Studies
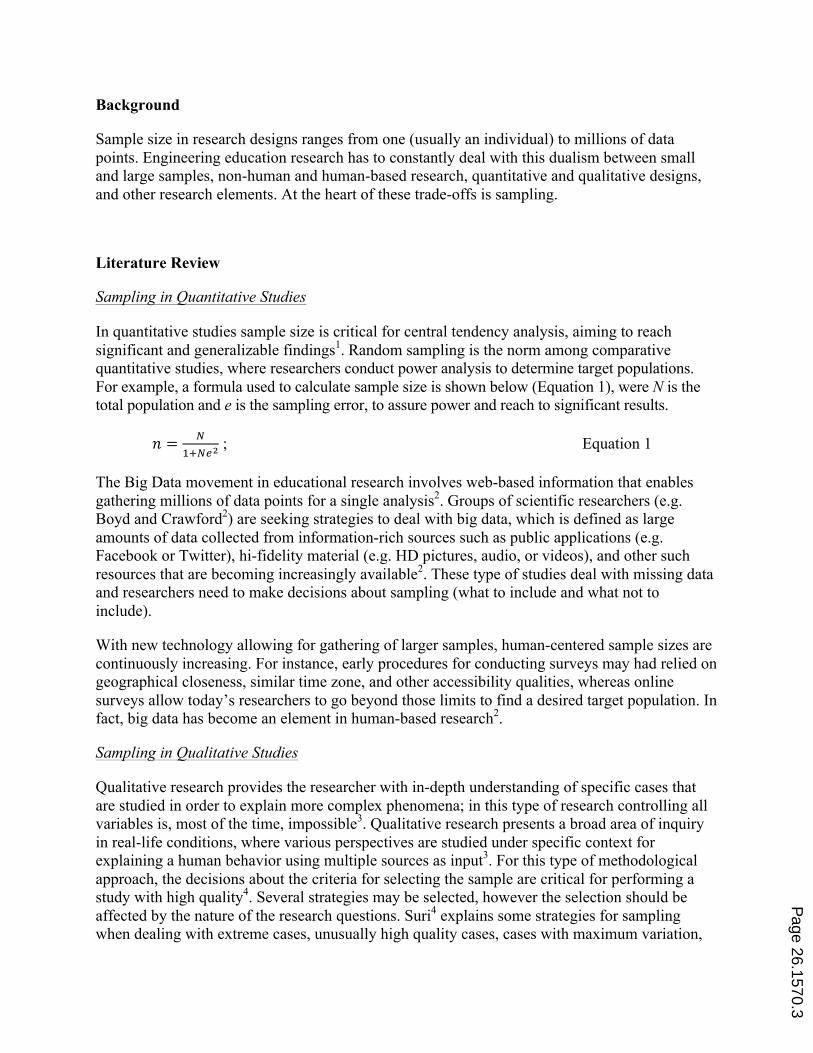
In quantitative studies sample size is critical for central tendency analysis, aiming to reach significant and generalizable findings1. Random sampling is the norm among comparative quantitative studies, where researchers conduct power analysis to determine target populations. For example, a formula used to calculate sample size is shown below (Equation 1), were N is the total population and e is the sampling error, to assure power and reach to significant results.
𝑛 = !!!!!!
; Equation 1
The Big Data movement in educational research involves web-based information that enables gathering millions of data points for a single analysis2. Groups of scientific researchers (e.g. Boyd and Crawford2) are seeking strategies to deal with big data, which is defined as large amounts of data collected from information-rich sources such as public applications (e.g. Facebook or Twitter), hi-fidelity material (e.g. HD pictures, audio, or videos), and other such resources that are becoming increasingly available2. These type of studies deal with missing data and researchers need to make decisions about sampling (what to include and what not to include).
With new technology allowing for gathering of larger samples, human-centered sample sizes are continuously increasing. For instance, early procedures for conducting surveys may had relied on geographical closeness, similar time zone, and other accessibility qualities, whereas online surveys allow today’s researchers to go beyond those limits to find a desired target population. In fact, big data has become an element in human-based research2.
Sampling in Qualitative Studies
Qualitative research provides the researcher with in-depth understanding of specific cases that are studied in order to explain more complex phenomena; in this type of research controlling all variables is, most of the time, impossible3. Qualitative research presents a broad area of inquiry in real-life conditions, where various perspectives are studied under specific context for explaining a human behavior using multiple sources as input3. For this type of methodological approach, the decisions about the criteria for selecting the sample are critical for performing a study with high quality4. Several strategies may be selected, however the selection should be affected by the nature of the research questions. Suri4 explains some strategies for sampling when dealing with extreme cases, unusually high quality cases, cases with maximum variation,
Page 26.1570.3

and cases with minimum variation, among others. Although those strategies are clearly defined, sometimes the bias of the recruiter may lead to validity issues in the research.
Managing Sampling Bias
The use of a sequential mixed-methods approach can help reduce sampling bias. Purposeful sampling commonly uses smaller sizes were participants are directly selected by researchers; this situation increases the risk of having a bias based on recruiters’ decisions of who meets criteria for eligibility. Conversely, random sampling techniques use larger sizes, where researchers directly decide the criteria for eligibility; however, subjects are indirectly selected based on quantitative analysis that uses that pre-defined criteria instead of recruiters. Larger samples tend to minimize bias; sample means reaches normality when size increases (see Central Limit Theorem). In qualitatively selected purposeful samples, the limited access to recruiting lead to limited range of new knowledge generalization; but now that tools for reaching a larger community are available, why maintaining the bias that existed when communication technologies were limited?
Qualitative and quantitative combinations for identifying participants may provide a better selection of a wide variation of cases than a purpose or random sampling alone, as suggested by Creswell and Plano Clark5. In fact, using sampling methods that combine techniques may led to statistical inferences, at the same time that richer and in-depth analysis is performed, as Sandelowski6 has stated.
Cluster Analysis
One known quantitative method used for identifying meaningful groups within the population under study is called cluster analysis. This strategy is commonly used for creating taxonomies and categorizations, finding patterns among portions of information, or retrieving similar information among billions of data points7. The latter is connected with the purpose of this paper, to retrieve specific information (outliers from four categories) among a large amount of data points. Quantitative methods may handle complex data features; in the case of cluster analysis, some elements such as variation in cluster shape, size, density, and others features may lead to a compound and laborious qualitative analysis but a feasible quantitative one.
In particular, cluster analysis presents a strategy for outlier identification, which may be approached using distance-based analysis, distribution-based analysis, and density-based analysis8. Some authors researching outlier identification often refer to outliers as data points that create noise when analyzing variable relationships (e.g. Cherednichenko8); however, some authors consider outlier identification to be an opportunity to study critical cases (e.g. He, Xu, and Deng9, or Gremler10). In fact, critical incidents method is commonly used for qualitative methods in cases where these incidents are expected to be rare but worth studying10-12.
Although the purpose of qualitative research sampling is to find rich-cases of elements desired to study, the selection of those specific cases may be some times biased due to the context of the researcher, or his or her accessibility to certain subjects. However, quantitative approaches provide a more inclusive and general access to prospective participants. This larger accessibility
Page 26.1570.4

may sacrifice the richness needed in qualitative studies, yet conducting a quantitative analysis such as cluster analysis may allow identification of those rich-cases from a larger sample8.
Research Purpose
The purpose of this paper is to describe an outlier analysis followed by a cluster analysis to inform purposeful sampling as the first part of sequential mixed-methods studies. A research case using lifelong learning and career background is used to illustrate the design. Three hypotheses are tested: 1) Purposeful sampling can be performed using statistical methods that weight criteria equally for all prospective participants. 2) Outliers represent critical cases of groups within a desired population for maximum variation or contrast sampling techniques 3) Due to outlier nature, sample size affects the quality of critical cases identification.
Method
The methodological design proposed in this paper is framed under a pragmatic approach 5,13, aiming to provide a valuable tool for sampling techniques, linking qualitative and quantitative approaches and therefore combining their strengths. Under this approach, a naturalistic environment is preferred for eliciting participants’ everyday experiences, relevant to them14. A skeptical attitude is used while searching patterns, leading to generalizable findings5.
In this study a quantitative design is performed in order to select an information-rich subsample for further in-depth qualitative analysis. The qualitative strand will be performed as a second stage of the study, which is out of the scope of this paper. A large sample of randomly selected participants was scored based on their lifelong learning (LLL) skills and science, technology, engineering, and math (STEM) background. These two variables were identified as potential elements to find critical cases for understanding how adults approach technological challenges in their everyday life. In order to test effectiveness of this statistical approach for purposeful samples, four cases of outliers were defined: low levels of lifelong learning for STEM and non-STEM backgrounds and high levels of lifelong learning for STEM and non-STEM backgrounds. Once outliers were identified, a cluster analysis was performed in order to guarantee that those outliers were part of the critical cases purposefully selected by the researchers. At least three outliers per group were aimed to be selected for within variability, leading to a final subsample of twelve outliers. A fixed factor of 10% was assumed for outliers’ definition within the total population, which resulted in a desired sample of 120 participants.
Participants
The target population for this study was adults with at least two years of study or experience in the same field. The boundary set for the target population included only those individuals that have a fairly stable career path15, 16 and could be divided into STEM and non-STEM trained categories. People from one academic institution and one company, both located in Midwest, were invited to participate in the study. Emails were sent to employees in the company using
Page 26.1570.5
staff list-servers, and flyers were published across the academic campus and through the staff news webpage. The online link for the consent of participation and survey were published and it was left available for four months. 180 consented surveys were submitted, but only 146 were complete.
Data Collection
The online link comprised three stages of the data gathering. The first part of the survey was the consent form in which all participants had to include an electronic signature. The second part was available once the permission was granted and consisted in the Characteristics of Lifelong Learning in the Professions (CLLP), an instrument developed in 198617 to predict time spent in learning activities. Educability and future orientation were identified as predictors for lifelong learning during researchers’ first approach. The instrument consists in a 36-item Likert scale with seven possible levels, from “strongly disagree” to “strongly agree”, and presented an internal reliability of .9117. The third and final part was a 27-item survey in which demographic, academic and professional background, and contact questions were included. Demographic information was not included in the scores, but was used for profile representativeness analysis. Academic and professional backgrounds, which included open ended and multiple selection questions, were used to score STEM background. Contact information was not taken into account for this study; this information was intended to be collected for a second stage of the research project, and therefore was outside the scope of this paper.
Method of Analysis
Cluster analysis was used for outlier and critical-groups identification. In addition, central tendencies were studied in order to assure that outliers were representative of critical-groups.
Cluster Analysis for Outliers identification
For this purpose, we used a common method called distance-based outliers, which is part of cluster analysis18. According to this approach, an outlier is identified if d(oi,c)>dmin, where oi is the ith outlier, c is the mean of the cluster, and dmin is the threshold-value for the cluster. Although this is considered a simplistic procedure for identifying clusters18, since this approach uses only one-cluster, it is sufficient for this case. In addition, the variation within each scale was taken into account, aligned with the Hybrid-random algorithm8. Two cluster analyses were used for increasing confidence in outlier identification, one using raw scales from surveys and other using ranked data from highest to lowest scores. The first method took between-scales variation into account by calculating linkage to the cluster using distance to an elliptical cloud, while the second took that variation into account by ranking values within each scale.
For the purpose of this study, one cluster centered in the dataset mean was assumed for the first stage of the analysis, and a k-means cluster analysis was performed to identify statistically different desired sub-groups within the sample. Outliers were defined using the distance-based theory for an optimized dmin where the set of outliers O is defined as {o1,o2,…,o12 | ∀ oi ∈ O, d(oi, c) > dmin}. For the first method, d(oi, c) was calculated based in elliptical distance (ox-cx)2/a2+(oy-cy)2/b2, while for the second method d(oi, c) was calculated based in the circular distance (ox-cx)2 +(oy-cy)2. The average distance between the smallest and largest data points for
Page 26.1570.6

each score was taken as initial distances to the ellipse vertexes, or circle radius, in order to calculate dmin. The ratio between vertexes was fixed and, for both strategies, the value of dmin was adjusted until the desired number of outliers per sub-group was reached. The purposeful sample comprised all data points identified as outliers using both strategies. As a result, profiles for each group of outliers were created.
Sub-groups and Outlier comparison
In this second stage of analysis, a k-means cluster analysis was performed in order to identify those data points belonging to a desired sub-group. Four groups were set as target sub-populations eligible for the study: high lifelong learning and STEM background (HLE), high lifelong learning and non-STEM background (HLnE), low lifelong learning and STEM background (LLE), and low lifelong learning and non-STEM background (LLnE). Due to the design of the study, participants in the center of the cloud were not eligible for outlier identification. Once the groups and outliers were identified, a statistical comparison between groups was performed using ANOVA after normality was tested. Those variables were found to be statistically different between groups, and were compared to the profile created for each critical group to assess accuracy in the selection.
Results
Scoring the Data
146 out of 180 total participants completed the CLLP and the technological background surveys. Both variables, lifelong learning and technological background, were scored in order to build a two-dimensional cloud for outlier identification.
For scoring lifelong learning, seven factors identified by the instrument’s author17 were scored. In addition, six items from the background test were included in the lifelong learning total score, due to the link found by CLLP’s author17. The total lifelong learning score resulted from the combined score from both calculations. Possible scores range was 0 to 39; however, data ranged from 17 to 33, which is higher than scale middle point.
Technological background was scored using four main elements: undergraduate and graduate studies, professional field, STEM experience, and daily time used for STEM-related activities. The scale was defined, using any engineering field as maximum score, followed by technology, math, and sciences (indication of STEM background with engineering emphasis); the lowest scored were given to arts, followed by human sciences (indicating a non-STEM field); finally, middle scores were given to business, economy, and related fields (indicating that the participant was not an outlier). This scale ranges from -18 to 18; however, data ranged from -12 to 16.
Evaluation of the Normality Assumption
Lifelong learning scores met normality tests (Skewness=-0.215, SE=0.201; Kurtosis=-0.675, SE=0.399, see Figure 1). For the second variable, although the test of normality indicated a concentration of scores divided into STEM and non-STEM with not normal distribution
Page 26.1570.7
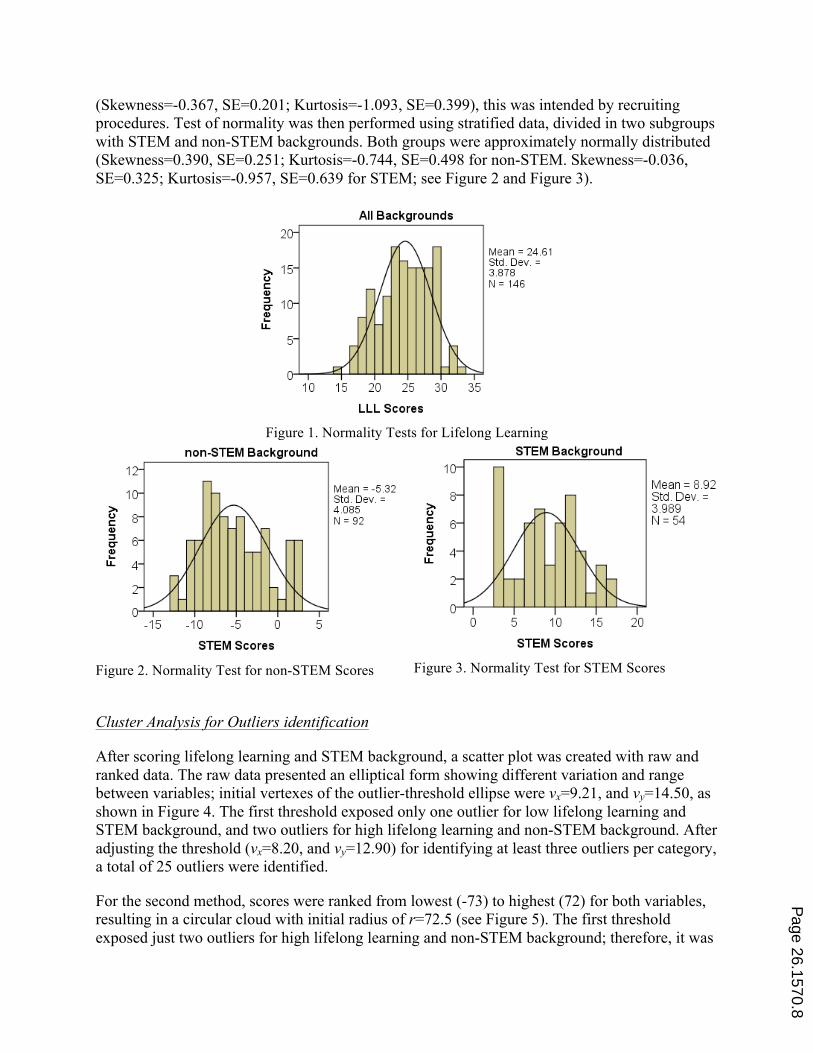
(Skewness=-0.367, SE=0.201; Kurtosis=-1.093, SE=0.399), this was intended by recruiting procedures. Test of normality was then performed using stratified data, divided in two subgroups with STEM and non-STEM backgrounds. Both groups were approximately normally distributed (Skewness=0.390, SE=0.251; Kurtosis=-0.744, SE=0.498 for non-STEM. Skewness=-0.036, SE=0.325; Kurtosis=-0.957, SE=0.639 for STEM; see Figure 2 and Figure 3).
Figure 1. Normality Tests for Lifelong Learning
Figure 2. Normality Test for non-STEM Scores
Figure 3. Normality Test for STEM Scores
Cluster Analysis for Outliers identification
After scoring lifelong learning and STEM background, a scatter plot was created with raw and ranked data. The raw data presented an elliptical form showing different variation and range between variables; initial vertexes of the outlier-threshold ellipse were vx=9.21, and vy=14.50, as shown in Figure 4. The first threshold exposed only one outlier for low lifelong learning and STEM background, and two outliers for high lifelong learning and non-STEM background. After adjusting the threshold (vx=8.20, and vy=12.90) for identifying at least three outliers per category, a total of 25 outliers were identified.
For the second method, scores were ranked from lowest (-73) to highest (72) for both variables, resulting in a circular cloud with initial radius of r=72.5 (see Figure 5). The first threshold exposed just two outliers for high lifelong learning and non-STEM background; therefore, it was
Page 26.1570.8
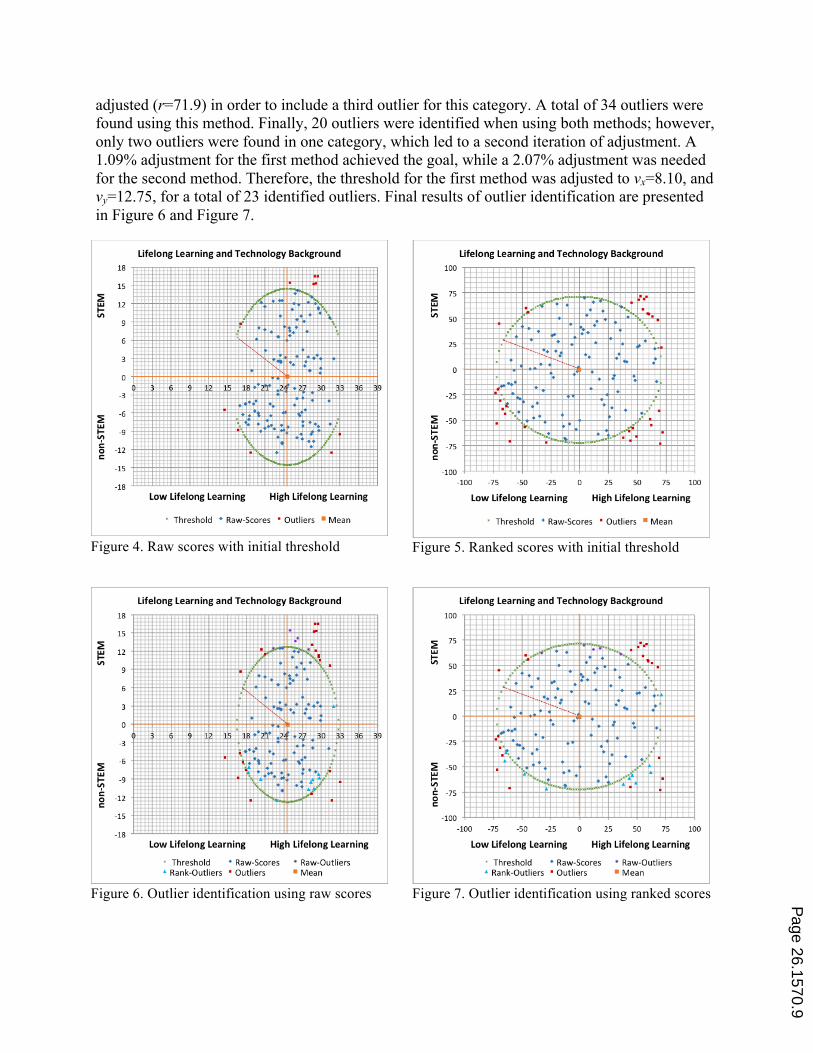
adjusted (r=71.9) in order to include a third outlier for this category. A total of 34 outliers were found using this method. Finally, 20 outliers were identified when using both methods; however, only two outliers were found in one category, which led to a second iteration of adjustment. A 1.09% adjustment for the first method achieved the goal, while a 2.07% adjustment was needed for the second method. Therefore, the threshold for the first method was adjusted to vx=8.10, and vy=12.75, for a total of 23 identified outliers. Final results of outlier identification are presented in Figure 6 and Figure 7.
Figure 4. Raw scores with initial threshold
Figure 5. Ranked scores with initial threshold
Figure 6. Outlier identification using raw scores
Figure 7. Outlier identification using ranked scores
Page 26.1570.9

Sub-groups and Outlier comparison
In order to compare outliers’ profile with the category they represented, two k-mean cluster analyses were performed. The first calculation fixed the number of clusters to four, while the second calculation fixed it to five.
For the first iteration the number of groups was set to four, acknowledging the existence the four categories. The first cluster comprised 37 cases and its center indicated a lifelong learning score of LLL=26.94, and a STEM background score of STEM=-8.17; 42 data points were members of the second cluster, with center located at LLL =25.43, STEM =10.51; the third cluster included 35 cases and its center showed scores of LLL =19.77, STEM =-5.6; finally, 32 data points formed the fourth cluster, centered at LLL =26.14, STEM =1.54. The analysis indicated that cluster 1 represented high levels of lifelong learning and non-STEM background, cluster 2 denoted levels of lifelong learning around the mean for participants with STEM background, cluster 3 represented low levels of lifelong learning and non-STEM background; however, cluster 4 denoted high levels of lifelong learning for those participants with a background neither in STEM, nor in non-STEM fields (see Figure 8). Because participants near the mean of the cloud were grouped, a second cluster analysis was performed adding one more group, considering a middle group of backgrounds such as health, economy, or others fields related in some extent to both STEM and non-STEM categories.
Figure 8. 4-Means Cluster Analysis
Figure 9. 5-Means Cluster Analysis
For this second cluster analysis, the first cluster comprised 24 cases and its center indicated a lifelong learning score of LLL=27.49, and a STEM background score of STEM=12.19; 19 data points were members of the second cluster, with center located at LLL =22.59, STEM =8.06; the third cluster remained the same as cluster 3 of previous analysis; the fourth cluster included 31 cases and its center showed scores of LLL =26.3, STEM =1.45; finally, the fifth cluster remained the same as cluster 1 of previous analysis. This second iteration showed that cluster 1 represented high levels of lifelong learning and STEM background, cluster 2 denoted low levels of lifelong learning and STEM background, cluster 3 represented low levels of lifelong learning and non-STEM background, cluster 4 denoted high levels of lifelong learning for those participants with a
Page 26.1570.10
background neither in STEM nor in non-STEM fields, and cluster 5 represented high levels of lifelong learning and non-STEM background (see Figure 9).
Outliers’ Profiles
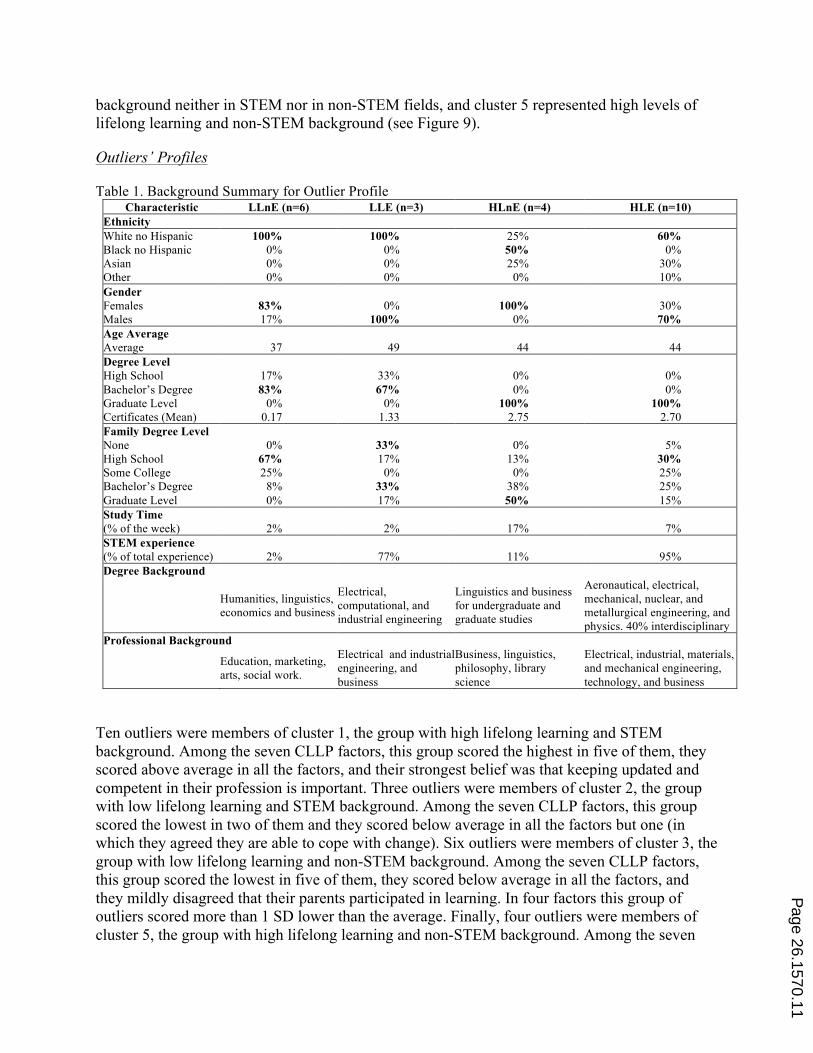
Table 1. Background Summary for Outlier Profile Characteristic LLnE (n=6) LLE (n=3) HLnE (n=4) HLE (n=10)
Ethnicity White no Hispanic 100% 100% 25% 60% Black no Hispanic 0% 0% 50% 0% Asian 0% 0% 25% 30% Other 0% 0% 0% 10% Gender Females 83% 0% 100% 30% Males 17% 100% 0% 70% Age Average Average 37 49 44 44 Degree Level High School 17% 33% 0% 0% Bachelor’s Degree 83% 67% 0% 0% Graduate Level 0% 0% 100% 100% Certificates (Mean) 0.17 1.33 2.75 2.70 Family Degree Level None 0% 33% 0% 5% High School 67% 17% 13% 30% Some College 25% 0% 0% 25% Bachelor’s Degree 8% 33% 38% 25% Graduate Level 0% 17% 50% 15% Study Time (% of the week) 2% 2% 17% 7% STEM experience (% of total experience) 2% 77% 11% 95% Degree Background
Humanities, linguistics, economics and business
Electrical, computational, and industrial engineering
Linguistics and business for undergraduate and graduate studies
Aeronautical, electrical, mechanical, nuclear, and metallurgical engineering, and physics. 40% interdisciplinary
Professional Background
Education, marketing, arts, social work.
Electrical and industrial engineering, and business
Business, linguistics, philosophy, library science
Electrical, industrial, materials, and mechanical engineering, technology, and business
Ten outliers were members of cluster 1, the group with high lifelong learning and STEM background. Among the seven CLLP factors, this group scored the highest in five of them, they scored above average in all the factors, and their strongest belief was that keeping updated and competent in their profession is important. Three outliers were members of cluster 2, the group with low lifelong learning and STEM background. Among the seven CLLP factors, this group scored the lowest in two of them and they scored below average in all the factors but one (in which they agreed they are able to cope with change). Six outliers were members of cluster 3, the group with low lifelong learning and non-STEM background. Among the seven CLLP factors, this group scored the lowest in five of them, they scored below average in all the factors, and they mildly disagreed that their parents participated in learning. In four factors this group of outliers scored more than 1 SD lower than the average. Finally, four outliers were members of cluster 5, the group with high lifelong learning and non-STEM background. Among the seven
Page 26.1570.11
CLLP factors, this group scored the highest in two of them and they scored above average in all the factors. Their two strongest beliefs were that first, keeping updated and competent in their profession is important, and second, that they have an interest in reading. In this second belief this group of outliers scored more than 1 SD higher than the average.
The majority of non-STEM outliers were females, while the majority of STEM ones were males. The age average of high lifelong learners were the same for both groups of backgrounds; however, low lifelong learners average age for non-STEM was lower and for STEM higher than those with high lifelong learning. All high lifelong learners had graduate education, while low lifelong learners majority had bachelor’s degrees; yet, only non-STEM low lifelong learners had parents with no graduate studies. Conversely, the majority of parents of non-STEM high lifelong learners had graduate studies, but this was only true for this group. As expected, STEM group reported higher levels of technology usage and development (creating or adapting technology) and had their background in engineering fields, with electrical, industrial and mechanical engineering being the most common. In contrast, non-STEM outliers reported backgrounds such as linguistics, business, and humanities.
Discussion
Identification of outliers was possible using cluster analysis. In this proposed method, the distances for threshold were initially calculated from the maximum values, but later adjusted in order to achieve the criteria set for the research design, as proposed by Breunig and colleagues18. In this particular case there was a minimum of three outliers per category, however the distance for threshold may be adjusted further for a more inclusive selection. This flexibility makes this a convenient process for purposefully selected samples that follows two or more criteria; in this example the variables taken into account were lifelong learning and STEM background. Although the visual representation of an analysis with more than three criteria may be complex, it is possible to perform this process using a higher-dimension cluster in which the threshold depends on the number of variables.
Having two approaches for finding outliers, one using raw data and other using ranked data, allows a more robust selection of eligible data points. This verification is also possible for other data sets and measurable variables, due to the nature of the process. Further, the threshold curve may have different shapes, depending on researcher criteria such as avoiding middle scores in one of the variables (e.g. a diamond or rectangle shape).
Regarding to the number of data points needed for the analysis, this criteria was also defined by the researcher and depended on the percentage of cases targeted among the total population. In this particular case the percentage was set on 10%, acknowledging that 1 of 10 people participating in the study was considered an eligible subject for qualitative analysis. In general, the number of participants should be N=oc/p, where o is the desired number of outliers, c the expected number of categories, and p the percentage of outliers compared to the total sample size. P
age 26.1570.12
For reliability verifications, those data points identified as outliers were further studied, comparing an outlier profile with the cluster to which they represented. The five-cluster division represented the four desired sub-groups, and a middle cluster comprised by those data points representing non-eligible participants. Sub-groups with the highest scores, between outliers and clusters, coincided for four out of seven factors that form lifelong learning measurement; however, differences in mean values between switched groups were not significant between clusters. Sub-groups with the lowest scores coincided for all factors, and 80% of values outside one standard deviation where coincident between outliers and clusters. Similarly, for reliability verification in background score, technology experience and usage was compared showing similar order for outliers and clusters, although outliers were more extreme. Finally, undergraduate, graduate, and professional fields of study/work were verified for outliers in order to assure that the sub-sample met the criteria of selection.
This process of selecting rich-cases for purposefully selected samples allow for identification of special cases that assure qualitative research quality as required by researchers (e.g. see Suri4), while providing a rigorous procedure of selection allowing for statistical inferences6.
Conclusion
This paper provides a valid and rigorous approach to purposeful sampling, strategy commonly used in engineering education qualitative research, enabling for the selection of a convenient yet unbiased sample. The statistically rigorous selection of participants based in cluster analysis led to a wide variety of cases. This process is flexible and easily adjustable to criteria defined by researchers for their purposefully selected sample. For instance, threshold distance can be adjusted for reaching the desired sample size. Similarly, the shape of the threshold can also be changed to avoid middle points or certain characteristics in one dimension of the cluster formed by the target population. This range and representation of sub-groups within a larger population may provide a useful selection for rich-cases of participants for qualitative analyses.
Bibliographic Information
1. Israel, G. D. (1992). Determining sample size. University of Florida Cooperative Extension Service, Institute of Food and Agriculture Sciences, EDIS.
2. Boyd, D., & Crawford, K. (2012). Critical questions for big data: Provocations for a cultural, technological, and scholarly phenomenon. Information, communication & society, 15(5), 662-679.
3. Yin, R. K. (2010). Qualitative research from start to finish. Guilford Press.
4. Suri, H. (2011). Purposeful sampling in qualitative research synthesis. Qualitative Research Journal, 11(2), 63-75.
5. Creswell, J. W., and Plano Clark, V. L. (2011). Designing and conducting mixed methods research.
Page 26.1570.13

6. Sandelowski, M. (1995). Focus on Qualitative Methods Sample Size in Qualitative Research. Research in Nursing & Health, 18, 179-183.
7. Tan, P. N., Steinbach, K., & Kumar, V. (2006). Data Mining Cluster Analysis: Basic Concepts and Algorithms.
8. Cherednichenko, S. (2005). Outlier detection in clustering. Master's Thesis, University of Joensuu, Department of Computer Science.
9. He, Z., Xu, X., and Deng, S. (2003) “Discovering Cluster-based Local Outliers”. Pattern Recognition Letters, Volume 24, Issue 9-10, pages 1641 – 1650, June 2003.
10. Gremler, D. D. (2004). The critical incident technique in service research. Journal of service research, 7(1), 65-89.
11. Chell, E., & Pittaway, L. (1998). A study of entrepreneurship in the restaurant and café industry: exploratory work using the critical incident technique as a methodology: Prize-winning Paper from the IAHMS Conference at Sheffield Hallam University, England. International Journal of Hospitality Management, 17(1), 23-32.
12. Phelan, L. (2012). Interrogating students’ perceptions of their online learning experiences with Brookfield’s critical incident questionnaire. Distance Education, 33(1), 31-44.
13. Morgan, D. L. (2007). Paradigms lost and pragmatism regained methodological implications of combining qualitative and quantitative methods. Journal of mixed methods research, 1(1), 48-76.
14. Arthur, N. (2001). Using critical incidents to investigate cross-cultural transitions. International Journal of Intercultural Relations, 25(1), 41-53.
15. Ishitani, T. T., & DesJardins, S. L. (2002). A longitudinal investigation of dropout from college in the United States. Journal of College Student Retention: Research, Theory and Practice, 4(2), 173-201.
16. Min, Y., Zhang, G., Long, R. A., Anderson, T. J., & Ohland, M. W. (2011). Nonparametric survival analysis of the loss rate of undergraduate engineering students. Journal of Engineering Education, 100(2), 349-373.
17. Livneh, C. L. (1986). Characteristics Of Lifelong Learners In The Human Service Professions. 8606855 Educat.D., Boston University, Ann Arbor. ProQuest Dissertations & Theses A&I; ProQuest Dissertations & Theses Full Text database.
18. Breunig, M. M., Kriegel, H. P., Ng, R. T., & Sander, J. (2000, May). LOF: identifying density-based local outliers. In ACM sigmod record (Vol. 29, No. 2, pp. 93-104). ACM.
Page 26.1570.14