Geochemical inverse modeling of chemical and isotopic data ...
37
Geochemical inverse modeling of chemical and isotopic data from 1 groundwaters in Sahara (Ouargla basin, Algeria) 2 R. Slimani a , A. Guendouz b , F. Trolard c , A.S. Moulla d , B. Hamdi-Aïssa a , G. Bourrié c 3 a Ouargla University, Fac. des Sciences de la Nature et de la Vie, Lab. Biochimie des Milieux Désertiques, Ouargla 4 30000, Algeria 5 b Blida University, Science and Engineering Faculty, P.O.Box 270 Soumaa, Blida, Algeria 6 c INRA, UMR 1114 Emmah, Avignon, France 7 d Algiers Nuclear Research Centre, P.O. Box, 399 Alger-RP, 16000 Algiers, Algeria 8 Abstract 9 Unpublished chemical and isotopic data taken in November 1992 from the three major Saha- ran aquifers namely, the “Continental Intercalaire” (CI), the “Complexe Terminal” (CT) and the Phreatic aquifer (Phr) were integrated with original samples in order to chemically and isotopi- cally characterize a Saharan aquifer system and investigate the processes through which ground- waters acquire their mineralization. Instead of classical Debye-Hückel extended law, Specific Interaction Theory (SIT) model, recently incorporated in Phreeqc 3.0 was used. Inverse model- ing of hydrochemical data constrained by isotopic data was used here to quantitatively assess the influence of geochemical processes: at depth, the dissolution of salts from the geological forma- tions during upward leakage without evaporation explains the transitions from CI to CT and to a first end member, cluster of Phr (cluster I); near the surface, the dissolution of salts from sebkhas by rainwater explains another cluster of Phr (cluster II). In every case, secondary precipitation of calcite occurs during dissolution. All Phr waters result from the mixing of these two clusters to- gether with calcite precipitation and ion exchange processes. These processes are quantitatively assessed by Phreeqc model. Globally, gypsum dissolution and calcite precipitation were found to act as a carbon sink. Keywords: hydrochemistry, stable isotopes, Sahara, Algeria 10 1. INTRODUCTION 11 A scientific study published in 2008 (OECD, 2008) showed that 85% of the world population 12 lives in the driest half of the Earth. More than 1 billion people residing in arid and semi-arid areas 13 of the world have only access to little or no renewable water resources. In many arid regions such 14 as Sahara, groundwater is the only source of water supply for domestic, agricultural or industrial 15 purposes, often causing overuse and / or degradation of water quality. 16 The groundwater resources of Ouargla basin (Lower-Sahara, Algerian) (Fig. 1) are contained 17 in three main reservoirs (UNESCO, 1972; Eckstein and Eckstein, 2003; OSS, 2003, 2008): 18 Email address: [email protected] (R. Slimani) Preprint submitted to Hydrology and Earth System Sciences (HESS) July 30, 2016
-
Upload
khangminh22 -
Category
Documents
-
view
5 -
download
0
Transcript of Geochemical inverse modeling of chemical and isotopic data ...

Geochemical inverse modeling of chemical and isotopic data from1
groundwaters in Sahara (Ouargla basin, Algeria)2
R. Slimania, A. Guendouzb, F. Trolardc, A.S. Moullad, B. Hamdi-Aïssaa, G. Bourriéc3
aOuargla University, Fac. des Sciences de la Nature et de la Vie, Lab. Biochimie des Milieux Désertiques, Ouargla4
30000, Algeria5bBlida University, Science and Engineering Faculty, P.O.Box 270 Soumaa, Blida, Algeria6
cINRA, UMR 1114 Emmah, Avignon, France7dAlgiers Nuclear Research Centre, P.O. Box, 399 Alger-RP, 16000 Algiers, Algeria8
Abstract9
Unpublished chemical and isotopic data taken in November 1992 from the three major Saha-ran aquifers namely, the “Continental Intercalaire” (CI), the “Complexe Terminal” (CT) and thePhreatic aquifer (Phr) were integrated with original samples in order to chemically and isotopi-cally characterize a Saharan aquifer system and investigate the processes through which ground-waters acquire their mineralization. Instead of classical Debye-Hückel extended law, SpecificInteraction Theory (SIT) model, recently incorporated in Phreeqc 3.0 was used. Inverse model-ing of hydrochemical data constrained by isotopic data was used here to quantitatively assess theinfluence of geochemical processes: at depth, the dissolution of salts from the geological forma-tions during upward leakage without evaporation explains the transitions from CI to CT and to afirst end member, cluster of Phr (cluster I); near the surface, the dissolution of salts from sebkhasby rainwater explains another cluster of Phr (cluster II). In every case, secondary precipitation ofcalcite occurs during dissolution. All Phr waters result from the mixing of these two clusters to-gether with calcite precipitation and ion exchange processes. These processes are quantitativelyassessed by Phreeqc model. Globally, gypsum dissolution and calcite precipitation were foundto act as a carbon sink.
Keywords: hydrochemistry, stable isotopes, Sahara, Algeria10
1. INTRODUCTION11
A scientific study published in 2008 (OECD, 2008) showed that 85% of the world population12
lives in the driest half of the Earth. More than 1 billion people residing in arid and semi-arid areas13
of the world have only access to little or no renewable water resources. In many arid regions such14
as Sahara, groundwater is the only source of water supply for domestic, agricultural or industrial15
purposes, often causing overuse and / or degradation of water quality.16
The groundwater resources of Ouargla basin (Lower-Sahara, Algerian) (Fig. 1) are contained17
in three main reservoirs (UNESCO, 1972; Eckstein and Eckstein, 2003; OSS, 2003, 2008):18
Email address: [email protected] (R. Slimani)
Preprint submitted to Hydrology and Earth System Sciences (HESS) July 30, 2016
admin
Sottolineato
Modify, possibly as Identification of dominant hydrogeochemical processes for groundwaters in Algerian Sahara supported from inverse modeling of chemical and isotocpic data

• at the top, the phreatic aquifer (Phr), located in sandy gypsum permeable formations of19
Quaternary, is almost unexploited, due to its salinity (50 g/L);20
• in the middle, the “Complexe Terminal” (CT) (Cornet and Gouscov, 1952; UNESCO,21
1972) is the most exploited and includes several aquifers in different geological forma-22
tions. Groundwater circulates in one or two lithostratigraphic formations of the Eocene23
and Senonian carbonates or Mio-pliocene sands;24
• at the bottom, the “Continental Intercalaire” (CI), hosted in the lower Cretaceous continen-25
tal formations (Barremian and Albian), mainly composed of sandstones, sands and clays.26
It is only partially exploited because of its significant depth.27
After use, waters are discharged in a closed system (endorheic basin) and constitute a po-28
tential hazard to the environment, to public health and may jeopardize the sustainability of agri-29
culture, due to rising of the phreatic aquifer watertable, extension of soil salinization and so30
on (Hamdi-Aïssa et al., 2004; Slimani, 2006). Several studies (Guendouz, 1985; Fontes et al.,31
1986; Guendouz and Moulla, 1996; Edmunds et al., 2003; Guendouz et al., 2003; Hamdi-Aïssa32
et al., 2004; Foster et al., 2006; OSS, 2008; Al-Gamal, 2011) started from chemical and isotopic33
information (2H, 18O, 234U, 238U, 36Cl) to characterize the relationships between aquifers. In34
particular, such studies focused on the recharge of the deep CI aquifer system. These investi-35
gations dealt particularly with water chemical facies, mapped isocontents of various parameters,36
and reported typical geochemical ratios ([SO42–]/[Cl–], [Mg2+]/[Ca2+]) as well as other correla-37
tions. Minerals / solutions equilibria were checked by computing saturation indices with respect38
to calcite, gypsum, anhydrite and halite, but processes were only qualitatively assessed.39
The present study aims at applying for the first time ever in Algeria, a new methodology40
(inverse modeling) to an extreme environment where lack of data on a scarce natural resource41
(groundwater) is observed. New data were hence collected in order to characterize the hydro-42
chemical and the isotopic composition of the major aquifers in the Saharan region of Ouargla.43
New possibilities offered by progress in geochemical modeling were used. The objective was44
also to identify the origin of the mineralization and the water-rock interactions that occur along45
the flow. More specifically, inverse modeling of chemical reactions allows one to select the best46
conceptual model for the interpretation of the geochemical evolution of Ouargla aquifer system.47
The stepwise inversion strategy involves designing a list of scenarios (hypotheses) that take into48
consideration the most plausible combinations of geochemical processes that may occur within49
the studied medium. After resolving the scenarios in a stepwise manner, the one that provides50
the best conceptual geochemical model is then selected (Dai et al., 2006). Inverse modeling51
with Phreeqc 3.0 was used to quantitatively assess the influence of the processes that explain52
the acquisition of solutes for the different aquifers: dissolution, precipitation, mixing and ion53
exchange. This results in constraints on mass balances as well as on the exchange of matter54
between aquifers.55
2. METHODOLOGY56
2.1. Presentation of the study area57
The study area is located in the northeastern desert of Algeria “Lower-Sahara” (Le Houérou,58
2009) near the city of Ouargla (Fig. 1), 31◦54′ to 32◦1′ N and 5◦15′ to 5◦27′ E, with a mean ele-59
vation of 134 (m.a.s.l.). It is located in the quaternary valley of Oued Mya basin. Present climate60
2
admin
Sottolineato
admin
Barra
admin
Barra
admin
Barra
admin
Barra
admin
Barra
admin
Testo inserito
, characterized by a
admin
Barra
admin
Sottolineato
Make reference to Dai et al (2006) from the very beginning of this description of the inverse modeling.
belongs to the arid Mediterranean-type (Dubief, 1963; Le Houérou, 2009; ONM, 1975/2013), as61
it is characterized by a mean annual temperature of 22.5 ◦C, a yearly rainfall of 43.6 mm/yr and62
a very high evaporation rate of 2,138 mm/yr.63
64
Ouargla’s region and the entire Lower Sahara has experienced during its long geological65
history alternating marine and continental sedimentation phases. During Secondary era, vertical66
movements affected the Precambrian basement causing in particular collapse of its central part,67
along an axis passing approximately through the Oued Righ valley and the upper portion of the68
valley oued Mya. According to Furon (1960), a epicontinental sea spread to the Lower Eocene of69
northern Sahara. After the Oligocene, the sea gradually withdrew. It is estimated at present that70
this sea did not reach Ouargla and transgression stopped at the edge of the bowl (Furon, 1960;71
Lelièvre, 1969). The basin is carved into Mio-pliocene (MP) deposits, which alternate with red72
sands, clays and sometimes marls; gypsum is not abundant and dated from Pontian (MP) (Cornet73
and Gouscov, 1952; Dubief, 1953; Ould Baba Sy and Besbes, 2006). The continental Pliocene74
consists of a local limestone crust with puddingstone or lacustrine limestone (Fig. 2), shaped75
by eolian erosion into flat areas (regs). The Quaternary formations are lithologically composed76
of alternating layers of permeable sand and relatively impermeable marl (Aumassip et al., 1972;77
Chellat et al., 2014).78
The exploitation of Mio-pliocene aquifer is ancient and at the origin of the creation of the79
oasis (Lelièvre, 1969; Moulias, 1927). The piezometric level was higher (145 m a.s.l.) but over-80
exploitation at the end of the XIXth century led to a catastrophic decrease of the resource, with81
presently more than 900 boreholes (ANRH, 2011).82
The exploitation of Senonian aquifer dates back to 1953 at a depth 140 m to 200 m depth,83
with a small initial rate ca. 9 L s−1; two boreholes have been exploited since 1965 and 1969, with84
a total flowrate ca. 42 L s−1, for drinking water and irrigation.85
The exploitation of Albian aquifer dates back to 1956, presently, two boreholes are exploited:86
• El Hedeb I, 1,335 m deep, with a flowrate 141 L s−1;87
• El Hedeb II, 1,400 m deep, with a flowrate 68 L s−1.88
2.2. Sampling and analytical methods89
The sampling programme consisted of collecting samples along transects corresponding to90
directions of flow for both Phr and CT aquifers while it was possible to collect only eight samples91
from the CI. A total of (n = 107) samples were collected during a field campaign in 2013, along92
the main flowpath of Oued Mya. 67 of them were from piezometers tapping the phreatic aquifer,93
32 from CT wells and the last 8 from boreholes tapping the CI aquifer (Fig. 3). Analyses of94
Na+, K+, Ca2+, Mg2+, Cl–, SO42– and HCO3
– were performed by ion chromatography at Algiers95
Nuclear Research Center (CRNA). Previous and yet unpublished data (Guendouz and Moulla,96
1996) sampled in 1992 are used here too: 59 samples for Phr aquifer, 15 samples for CT aquifer97
and 3 samples for the CI aquifer for chemical analyses, data 18O and 3H (Guendouz and Moulla,98
1996).99
2.3. Geochemical method100
Phreeqc was used to check minerals / solution equilibria using the specific interaction the-101
ory (SIT), i.e. the extension of Debye-Hückel law by Scatchard and Guggenheim incorporated102
recently in Phreeqc 3.0 (Parkhurst and Appelo, 2013). Inverse modeling was used to calculate103
3
admin
Barra
admin
Barra
admin
Barra
admin
Barra
admin
Sottolineato
please, rephrase

the number of minerals and gases’ moles that must respectively dissolve or precipitate/degas to104
account for the difference in composition between initial and final water end members (Plum-105
mer and Back, 1980; Kenoyer and Bowser, 1992; Deutsch, 1997; Plummer and Sprinckle, 2001;106
Güler and Thyne, 2004; Parkhurst and Appelo, 2013). This mass balance technique has been107
used to quantify reactions controlling water chemistry along flow paths (Thomas et al., 1989).108
It is also used to quantify the mixing proportions of end-member components in a flow system109
(Kuells et al., 2000; Belkhiri et al., 2010, 2012).110
Inverse modeling involves designing a list of scenarios (modelling setups) that take into ac-111
count the most plausible combinations of geochemical processes that are likely to occur in our112
system. For example, the way to identify whether calcite dissolution/precipitation is relevant or113
not consists of solving the inverse problem under two alternate scenarios: (1) considering a geo-114
chemical system in which calcite is present, and (2) considering a geochemical system without115
calcite. After simulating the two scenarios, it is usually possible to select the setup that gives the116
best results as the solution to the inverse modeling according to the fit between the modeled and117
observed values. Then one can conclude whether calcite dissolution/precipitation is relevant or118
not. This stepwise strategy allows us to identify the relevance of a given chemical process by119
inversely solving the problem through alternate scenarios in which the process is either partici-120
pating or not.121
3. RESULTS AND DISCUSSION122
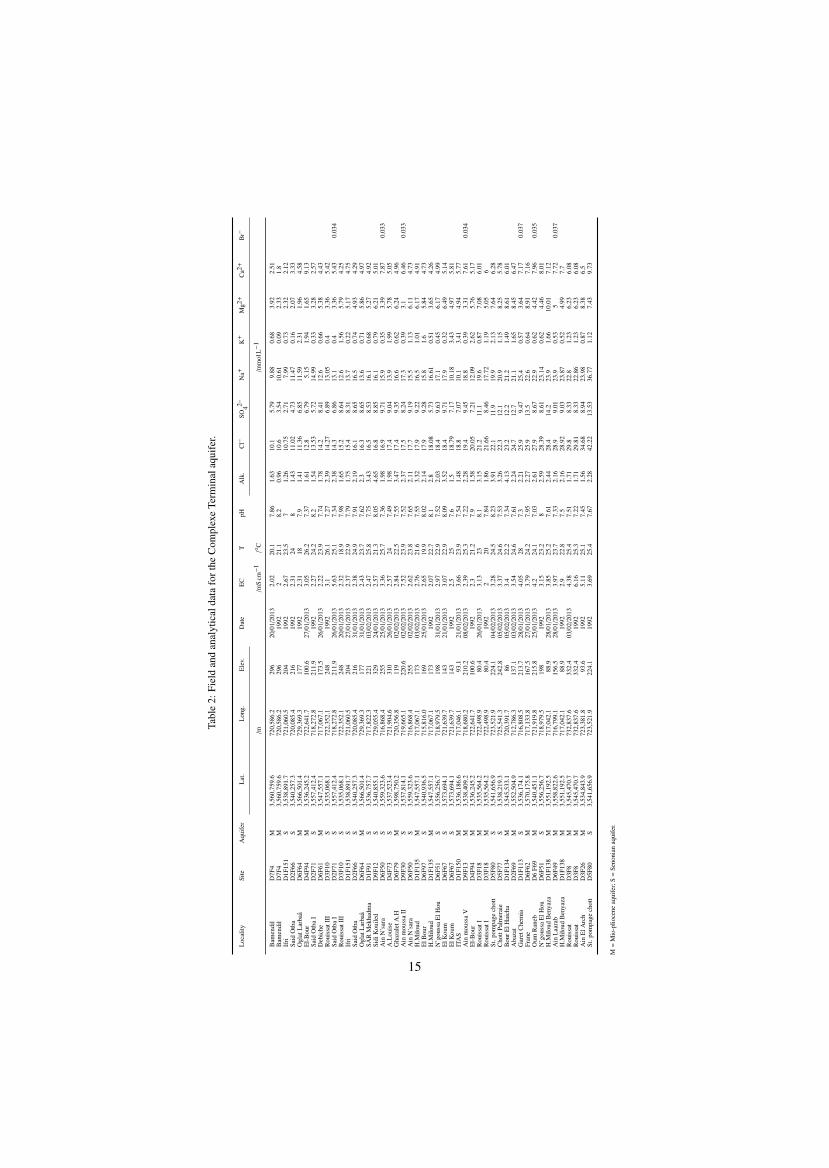
Tables 1 to 5 illustrate the results of the chemical and the isotopic analyses. Samples are123
ordered according to an increasing electric conductivity (EC), and this is assumed to provide124
an ordering for increasing salt content. In both phreatic and CT aquifers, temperature is close to125
25 ◦C, while for CI aquifer, temperature is close to 50 ◦C. The values presented in tables 1 to 5 are126
raw analytical data that were corrected for defects of charge balance before computing activities127
with Phreeqc. As analytical errors could not be ascribed to a specific analyte, the correction was128
made proportionally. The corrections do not affect the anions to anions mole ratios such as for129
[HCO3−]/([Cl−] + 2[SO4
2−]) or [SO42−]/[Cl−], whereas they affect the cation to anion ratio such130
as for [Na+]/[Cl−].131
3.1. Characterization of chemical facies of the groundwater132
Piper diagrams drawn for the studied groundwaters (Fig. 4) broadly show a scatter plot dom-133
inated by a Chloride-Sodium facies. However, when going into small details, the widespread134
chemical facies of the Phr aquifer is closer to the NaCl cluster than those of CI and CT aquifers.135
Respectively, CaSO4, Na2SO4, MgSO4 and NaCl are the most dominant chemical species (min-136
erals) that are present in the phreatic waters. This sequential order of solutes is comparable to137
that of other groundwater occurring in North Africa, and especially in the neighboring area of138
the chotts (depressions where salts concentrate by evaporation) Merouane and Melrhir (Vallès139
et al., 1997; Hamdi-Aïssa et al., 2004).140
3.2. Spatial distribution of the mineralization141
The salinity of the phreatic aquifer varies considerably depending on the location (namely,142
the distance from wells or drains) and time (due to the influence of irrigation) (Fig. 5a).143
Its salinity is low around irrigated and fairly well-drained areas, such as the palm groves of144
Hassi Miloud, just north of Ouargla (Fig. 3) that benefit from freshwater and are drained to the145
4
sebkha Oum el Raneb. However, the three lowest salinity values are observed in the wells of146
Ouargla palm-grove itself, where the Phr aquifer watertable is deeper than 2 m.147
Conversely, the highest salinity waters are found in wells drilled in the chotts and sebkhas (a148
sebkha is the central part of a chott where salinity is the largest) (Safioune and Oum er Raneb)149
where the aquifer is often shallower than 50 cm.150
The salinity of the CT (Mio-pliocene) aquifer (Fig. 5b) is much lower than that of the Phr151
aquifer, and ranges from 1 to 2 g/L; however, its hardness is larger and it contains more sulfate,152
chloride and sodium than the waters of the Senonian formations and those of the CI aquifer. The153
salinity of the Senonian aquifer ranges from 1.1 to 1.7 g/L , while the average salinity of the CI154
aquifer is 0.7 g/L (Fig. 5c).155
A likely contamination of the Mio-pliocene aquifer by phreatic groundwaters through casing156
leakage in an area where water is heavily loaded with salt and therefore particularly aggressive157
cannot be excluded.158
3.3. Saturation Indices159
The calculated saturation indices (SI) reveal that waters from CI at 50 ◦C are close to equi-160
librium with respect to calcite, except for 3 samples that are slightly oversaturated. They are161
however all undersaturated with respect to gypsum (Fig. 6 ).162
Moreover, they are oversaturated with respect to dolomite and undersaturated with respect to163
anhydrite and halite (Fig. 7).164
Waters from CT and phreatic aquifers show the same pattern, but some of them are more165
largely oversaturated with respect to calcite, at 25 ◦C.166
However, several phreatic waters (P031, P566, PLX4, PL18, P002, P023, P116, P066, P162167
and P036) that are located in the sebkhas of Sefioune, Oum-er-Raneb, Bamendil and Ain el168
Beida’s chott are saturated with gypsum and anhydrite. This is in accordance with highly evapo-169
rative environments found elsewhere (UNESCO, 1972; Hamdi-Aïssa et al., 2004; Slimani, 2006).170
No significant trend of SI from south to north upstream and downstream of Oued Mya (Fig. 7)171
is observed. This suggests that the acquisition of mineralization is due to geochemical processes172
that have already reached equilibrium or steady state in the upstream areas of Ouargla.173
3.4. Change of facies from the carbonated cluster to the evaporites’ cluster174
The facies shifts progressively from the carbonated (CI and CT aquifers) to the evaporites’175
one (Phr aquifer) with an increase in sulfates and chlorides at the expense of carbonates (SI of176
gypsum, anhydrite and halite). This is illustrated by a decrease of: [HCO3–]/ ([Cl–] + 2[SO4
2–])177
(Fig. 8) from 0.2 to 0 and of [SO42–]/[Cl–] from 0.8 to values ranging from 0.3 and 0 (Fig. 9)178
while salinity increases. Carbonate concentrations tend towards very small values, while it is not179
the case for sulfates. This is due to both gypsum dissolution and calcite precipitation.180
Chlorides in groundwater may come from three different sources: (i) ancient sea water en-181
trapped in sediments; (ii) dissolution of halite and related minerals that are present in evaporite182
deposits and (iii) dissolution of dry fallout from the atmosphere, particularly in these arid regions183
(Matiatos et al., 2014; Hadj-Ammar et al., 2014).184
[Na+]/[Cl–] ratio is from 0.85 to 1.26 for CI aquifer, from 0.40 to 1.02 for the CT aquifer185
and from 0.13 to 2.15 for the Phr aquifer. All the measured points from the three considered186
aquifers are more or less linearly scattered around the unity slope straight line that stands for187
halite dissolution (Fig. 10). The latter appears as the most dominant reaction occurring in the188
5
admin
Barra
admin
Testo inserito
the
admin
Testo inserito
ratio
admin
Testo inserito
the
admin
Testo inserito
ratio
admin
Barra
admin
Testo inserito
smaller than
admin
Barra
admin
Barra
admin
Testo inserito
varies between
admin
Barra
admin
Testo inserito
and
admin
Barra
admin
Testo inserito
between
admin
Barra
admin
Testo inserito
and
admin
Testo inserito
,
admin
Barra
admin
Testo inserito
between
admin
Barra
admin
Testo inserito
and
admin
Testo inserito
T
admin
Barra
admin
Barra
admin
Testo inserito
with good approximation

medium. However, at very high salinity, Na+ seems to swerve from the straight line, towards189
smaller values.190
A further scrutiny of Fig. 10 shows that CI waters are very close to the 1:1 line. CT waters191
are enriched in both Na+ and Cl– but slightly lower than the 1:1 line while phreatic waters are192
largely enriched and much more scattered. CT waters are closer to the seawater mole ratio193
(0.858), but some lower values imply a contribution from another source of chloride than halite194
or from entrapped seawater. Conversely, a [Na+]/[Cl–] ratio larger than 1 is observed for phreatic195
waters, which implies the contribution of another source of sodium, most likely sodium sulfate,196
that is present as mirabilite or thenardite in the chotts and the sebkhas areas.197
[Br–]/[Cl–] ratio ranges from 2 × 10⁻³ to 3 × 10⁻³. The value of this molar ratio for halite is198
around 2.5 × 10⁻³, which matches the aforementioned range and confirms that halite dissolution199
is the most dominant reaction taking place in the studied medium.200
In the CI, CT and Phr aquifers, calcium originates both from carbonate and sulfate (Fig. 11201
and 12). Three samples from CI aquifer are close to the [Ca2+]/[HCO3–] 1:2 line, while calcium202
sulfate dissolution explains the excess of calcium. However, nine samples from phreatic aquifer203
are depleted in calcium, and plot under the [Ca2+]/[HCO3–] 1:2 line. This cannot be explained204
by precipitation of calcite, as some are undersaturated with respect to that mineral, while others205
are oversaturated.206
In this case, a cation exchange process seems to occur and lead to a preferential adsorption207
of divalent cations, with a release of Na+. This is confirmed by the inverse modeling that is208
developed below and which implies Mg2+ fixation and Na+ and K+ releases.209
Larger sulfate values observed in the phreatic aquifer (Fig. 12) with [Ca2+]/[SO42–] < 1 can210
be attributed to a Na-Mg sulfate dissolution from a mineral bearing such elements. This is for211
instance the case of bloedite.212
213
3.5. Isotope geochemistry214
CT and CI aquifer exhibit depleted and homogeneous 18O contents, ranging from −8.32 h215
to −7.85 h. This was already previously reported by many authors (Edmunds et al., 2003;216
Guendouz et al., 2003; Moulla et al., 2012). On the other hand, 18O values for the phreatic217
aquifer are widely dispersed and vary between −8.84 h to 3.42 h (Table 6). Waters located218
north of the virtual line connecting approximately Hassi-Miloud to sebkhet Safioune, are found219
more enriched in heavy isotopes and are thus more evaporated. In that area, water table is close to220
the surface and mixing of both CI and CT groundwaters with phreatic ones through irrigation is221
nonexistent. Conversely, waters located south of Hassi Miloud up to Ouargla city show depleted222
values. This is the clear fingerprint of a contribution to the Phr waters from the underlying CI223
and CT aquifers (Gonfiantini et al., 1975; Guendouz, 1985; Fontes et al., 1986; Guendouz and224
Moulla, 1996).225
Phreatic waters result from a mixing of two end-members. An evidence for this is given by226
considering the ([Cl–], 18O) relationship (Fig. 13). The two clusters are: i) a first cluster of 18O227
depleted groundwater (Fig. 14), and ii) another cluster of 18O enriched groundwater with positive228
values and a high salinity. The latter is composed of phreatic waters occurring in the northern229
part of the study region.230
Cluster I represents the waters from CI and CT whose isotopic composition is depleted231
in 18O (average value around -8.2h) (Fig. 13). They correspond to an old water recharge232
(palæorecharge); whose age estimated by means of 14C, exceeds 15.000 years BP (Guendouz,233
6
admin
Barra
admin
Testo inserito
Phr

1985; Guendouz and Michelot, 2006). So, it is not a water body that is recharged by recent234
precipitation. It consists of CI and CT groundwaters and partly of phreatic waters, and can be235
ascribed to an upward leakage favored by the extension of faults near Amguid El-Biod dorsal.236
Cluster II, observed in Sebkhet Safioune, can be ascribed to the direct dissolution of surficial237
evaporitic deposits conveyed by evaporated rainwater.238
Evaporation alone cannot explain the distribution of data that is observed (Fig. 13). An239
evidence for this is given in a semi-logarithmic plot (Fig. 14), as classically obtained according240
to the simple approximation of Rayleigh equation (cf. Appendix):241
δ18O ≈ 1000 × (1 − α) log[Cl−] + k, (1)≈ −ε log[Cl−] + k, (2)
where α is the fractionation factor during evaporation, ε ≡ −1000× (1−α) is the enrichment242
factor and K is a constant (Ma et al., 2010; Chkir et al., 2009).243
CI and CT waters are better separated in the semi-logarithmic plot because they are differen-244
tiated by their chloride content. According to equation (1), simple evaporation gives a straight245
line (solid line in Fig. 14). The value of ε used is the value at 25 ◦C, which is equal to −73.5.246
P115 is the only sample that appears on the straight evaporation line (Fig. 14). It should be247
considered as an outlier since the rest of the samples are all well aligned on the logarithmic fit248
derived from the mixing line of Figure 13.249
The phreatic waters that are close to cluster I (Fig. 13) correspond to groundwaters oc-250
curring in the edges of the basin (Hassi Miloud, piezometer P433) (Fig. 14). They are low-251
mineralized and acquire their salinity via two processes, namely: dissolution of evaporites along252
their underground transit up to Sebkhet Safioune and dilution through upward leakage by the253
less-mineralized waters of CI and CT aquifers (for example Hedeb I for CI and D7F4 for CT)254
(Fig. 14) (Guendouz, 1985; Guendouz and Moulla, 1996).255
The rates of the mixing that are due to upward leakage from CI to CT towards the phreatic256
aquifer can be calculated by means of a mass balance equation. It only requires knowing the δ257
values of each fraction that is involved in the mixing process.258
The δ value of the mixture is given by:259
δmix = f × δ1 + (1 − f ) × δ2 (3)
where f is the fraction of CI aquifer, 1− f the fraction of the CT and δ1, δ2 are the respective260
isotope contents.261
Average values of mixing fractions from each aquifer to the phreatic waters computed by262
means of equation (3) gave the rates of 65 % for CI aquifer and 35% for CT aquifer.263
A mixture of a phreatic water component that is close to cluster I (i.e. P433) with another264
component which is rather close to cluster II (i.e. P039) (Fig. 13 and 14), for an intermediate265
water with a δ18O signature ranging from −5 h to −2 h gives mixture fraction values of 52 %266
for cluster I and 48 % for cluster II. Isotope results will be used to independently cross-check the267
validity of the mixing fractions derived from an inverse modeling involving chemical data (cf.268
infra. 3.6.).269
Turonian evaporites are found to lie in between CI deep aquifer and the Senonian and Miocene270
formations bearing CT aquifer. CT waters can thus simply originate from ascending CI waters271
that dissolve Turonian evaporites, a process which does not involve any change in 18O content.272
Conversely, phreatic waters result to a minor degree from evaporation and mostly from dissolu-273
tion of sebkhas evaporites by 18O enriched rainwater and mixing with CI-CT waters.274
7
admin
Barra
admin
Testo inserito
k
admin
Barra
admin
Barra
admin
Testo inserito
see section

3.5.1. Tritium content of water275
Tritium contents of Phr aquifer are relatively small (Table 6), they vary between 0 and 8 TU.276
Piezometers PZ12, P036 and P068 show values close to 8 TU, piezometers P018, P019, P416,277
P034, P042 and P093 exhibit values ranging between 5 and 6 TU, and the rest of the samples’278
concentrations are lower than 2 TU.279
These values are dated back to November 1992 so they are old values and they are considered280
high comparatively to what is expected to be found nowadays. In fact, at present times, tritium281
figures have fallen lower than 5 TU in precipitation measured in the northern part of the country.282
Tritium content of precipitation was measured as 16 TU in 1992 on a single sample that was283
collected from the National Agency for Water Resources station in Ouargla. A major part of284
this raifall evaporates back into the atmosphere that is unsaturated in moisture. Consequently,285
enrichment in tritium happens as water evaporates back. The lightest fractions (isotopes) are286
the ones that escape first causing enriching the remaining fraction in tritium. The 16 TU value287
would thus correspond to a rainy event that had happened during the field campaign (5, 6 Nov.288
1992). It is the most representative value for that region and for that time. Unfortunately, all the289
other stations (Algiers, Ankara, and Tenerife) (Martinelli et al., 2014) are subject to a completely290
different climatic regime and besides the fact that they have more recent values, can absolutely291
not be used for our case. Therefore all the assumptions based on recent tritium rain values do not292
apply to this study.293
Depleted contents in 18O and low tritium concentrations for phreatic waters fit well the mix-294
ing scheme and confirm the contribution from the older and deeper CI/CT groundwaters. The295
affected areas were clearly identified in the field and correspond to locations that are subject to296
a recycling and a return of irrigation waters whose origin are CI/CT boreholes. Moreover, the297
mixing that is clearly brought to light by the Cl– vs. 18O diagrams (Fig. 13 and 14) could partly298
derive from an ascending drainage from the deep and confined CI aquifer (exhibiting depleted ho-299
mogenous 18O contents and very low tritium), a vertical leakage that is favoured by the Amguid300
El-biod highly faulted area (Guendouz and Moulla, 1996; Edmunds et al., 2003; Guendouz et al.,301
2003; Moulla et al., 2012).302
3.6. Inverse modeling303
We assume that the relationship between 18O and Cl– data obtained in 1992 is stable with304
time, which is a logical assumption as times of transfer from CI to both CT and Phr are very long.305
Considering both 18O and Cl– data, CI, CT and Phr data populations can be categorized. The CI306
and CT do not show appreciable 18O variations, and can be considered as a single population. The307
Phr samples consist however of different populations: cluster I, with δ18O values close to -8, and308
small Cl– concentrations, more specifically less than 35 mmol L−1; cluster II, with δ18O values309
larger than 3, and very large Cl– concentrations, more specifically larger than 4,000 mmol L−1310
(Table 7); intermediate Phr samples result from mixing between clusters I and II (mixing line in311
Fig. 13, mixing curve in Fig. 14) and from evaporation of cluster I (evaporation line in Fig. 14).312
The mass-balance modeling has shown that relatively few phases are required to derive ob-313
served changes in water chemistry and to account for the hydrochemical evolution in Ouargla’s314
region. The mineral phases’ selection is based upon geological descriptions and analysis of rocks315
and sediments from the area (OSS, 2003; Hamdi-Aïssa et al., 2004).316
The inverse model was constrained so that mineral phases from evaporites including gypsum,317
halite, mirabilite, glauberite, sylvite and bloedite were set to dissolve until they reach saturation,318
and calcite, dolomite were set to precipitate once they reached saturation. Cation exchange reac-319
tions of Ca2+, Mg2+, K+ and Na+ on exchange sites were included in the model to check which320
8
admin
Testo inserito
n

cations are adsorbed or desorbed during the process. Dissolution and desorption contribute as321
positive terms in the mass balance, as elements are released in solution. On the other hand,322
precipitation and adsorption contribute as negative terms, while elements removed from the so-323
lution. CO2(g) dissolution is considered by Phreeqc as a dissolution of a mineral, whereas CO2(g)324
degassing is dealt with as if it were a mineral precipitation.325
Inverse modelling leads to a quantitative assessment of the different solutes’ acquisition pro-326
cesses and a mass balance for the salts that are dissolved or precipitated from CI, CT and Phr327
groundwaters (Fig. 14, Table 8), as follows:328
• transition from CI to CT involves gypsum, halite and sylvite dissolution, and some ion329
exchange namely calcium and potassium fixation on exchange sites against magnesium330
release, with a very small and quite negligible amount of CO2(g) degassing. The maximum331
elemental concentration fractional error equals 1%. The model consists of a minimum332
number of phases (i.e. 6 solid phases and CO2(g)); Another model implies as well dolomite333
precipitation with the same fractional error;334
• transition from CT to an average water component of cluster I involves dissolution of335
halite, sylvite, and bloedite from Turonian evaporites, with a very tiny calcite precipitation.336
The maximum fractional error in elemental concentration is 4%. Another model implies337
CO2(g) escape from the solution, with the same fractional error. Large amounts of Mg2+338
and SO42– are released within the solution (Sharif et al., 2008; Li et al., 2010; Carucci339
et al., 2012);340
• the formation of Phr cluster II can be modeled as being a direct dissolution of salts from the341
sebkha by rainwater with positive δ18O; the most concentrated water (P036 from Sebkhet342
Safioune) is taken here for cluster II, and pure water as rainwater. In a descending order343
of amount, halite, sylvite, gypsum and huntite are the minerals that are the most involved344
in the dissolution process. A small amount of calcite precipitates while some Mg2+ are345
released versus K+ fixation on exchange sites. The maximum elemental fractional error in346
the concentration is equal to 0.004%. Another model implies dolomite precipitation with347
some more huntite dissolving, instead of calcite precipitation, but salt dissolution and ion348
exchange are the same. Huntite, dolomite and calcite stoichiometries are linearly related,349
so both models can fit field data, but calcite precipitation is preferred compared to dolomite350
precipitation at low temperature;351
• the origin of all phreatic waters can be explained by a mixing in variable proportions352
of cluster I and cluster II. For instance, waters from cluster I and cluster II can easily be353
separated by their δ18O respectively close to −8 h and 3.5 h (Fig. 13 and 14). Mixing the354
two clusters is of course not an inert reaction, but rather results in the dissolution and the355
precipitation of minerals. Inverse modeling is then used to compute both mixing rates and356
the extent of matter exchange between soil and solution. For example, a phreatic water357
(piezometer P068) with intermediate values (δ18O = −3 and [Cl−] ' 2 M) is explained358
by the mixing of 58% water from cluster I and 42% from cluster II. In addition, calcite359
precipitates, Mg2+ fixes on exchange sites, against Na+ and K+, gypsum dissolves as well360
as a minor amount of huntite (Table 8). The maximum elemental concentration fractional361
error is 2.5% and the mixing fractions’ weighted the δ18O is −3.17 h, which is is very362
close to the measured value (−3.04 h). All the other models, making use of a minimum363
number of phases, and not taking into consideration ion exchange reactions are not found364
9
compatible with isotope data. Mixing rates obtained with such models are for example365
98% of cluster I and 0.9% of cluster II, which leads to a δ18O = (−7.80 h) which is quite366
far for the real measured value (−3.04 h).367
The main types of groundwaters occurring in Ouargla basin are thus explained and could368
quantitatively be reconstructed. An exception is however sample P115, which is located exactly369
on the evaporation line of Phr cluster I. Despite numerous attempts, it could not be quantitatively370
rebuilt. Its 3H value (6.8) indicates that it is derived from a more or less recent water component371
with very small salt content, most possibly affected by rainwater and some preferential flow372
within the piezometer. As this is the only sample on this evaporation line, there remains a doubt373
on its significance.374
Globally, the summary of mass transfer reactions occurring in the studied system (Table 8)375
shows that gypsum dissolution results in calcite precipitation and CO2(g) dissolution, thus acting376
as an inorganic carbon sink.377
4. CONCLUSIONS378
Groundwater hydrochemistry is a good record indicator for the water-rock interactions that379
occur along the groundwater flowpath. The mineral load reflects well the complex processes380
taking place while water circulates underground since its point of infiltration.381
The hydrochemical study of the aquifer system occurring in Ouargla’s basin allowed us to382
identify the origin of its mineralization. Waters exhibit two different facies: sodium chloride and383
sodium sulfate for the phreatic aquifer (Phr), sodium sulfate for the Complexe Terminal (CT)384
aquifer and sodium chloride for the Continental Intercalaire (CI) aquifer. Calcium carbonate385
precipitation and evaporite dissolution explain the facies change from carbonate to sodium chlo-386
ride or sodium sulfate. However reactions imply many minerals with common ions, deep reac-387
tions without evaporation as well as shallow processes affected by both evaporation and mixing.388
Those processes are separated by considering both chemical and isotopic data, and quantitatively389
explained making use of an inverse geochemical modeling. The main result is that Phr waters390
do not originate simply from infiltration of rainwater and dissolution of salts from the sebkhas.391
Conversely, Phr waters are largely influenced by the upwardly mobile deep CT and CI groundwa-392
ters, fractions of the latter interacting with evaporites from Turonian formations. Phreatic waters393
occurrence is explained as a mixing of two end-member components: cluster I, which is very394
close to CI and CT, and cluster II, which is highly mineralized and results from the dissolution395
by rainwater of salts from the sebkhas.396
At depth, CI leaks upwardly and dissolves gypsum, halite and sylvite, with some ion ex-397
change, to give waters of CT aquifer composition.398
CT transformation into Phr cluster I waters involves the dissolution of Turonian evaporites399
(halite, sylvite and bloedite) with minor calcite precipitation.400
At the surface, direct dissolution by rainwater of salts from sebkhas (halite, sylvite, gypsum401
and some huntite) with precipitation of calcite and Mg2+/K+ ion exchange results in cluster II402
Phr composition.403
All phreatic groundwaters result from a mixing of cluster I and cluster II water that is accom-404
panied by calcite precipitation, fixation of Mg2+ on ion exchange sites against the release of K+405
and Na+.406
Moreover, some CO2(g) escapes from the solution at depth, but dissolves much more at the407
surface. The most complex phenomena occur during the dissolution of Turonian evaporites while408
10

CI leaks upwardly towards CT, and from Phr I to Phr II, while the transition from CT to Phr I409
implies a very limited number of phases. Globally, gypsum dissolution and calcite precipitation410
processes both act as an inorganic carbon sink.411
ACKNOWLEDGEMENTS412
The authors wish to thank the staff members of the National Agency for Water Resources413
in Ouargla (ANRH) and the Laboratory of Algerian Waters (ADE) for the support provided to414
the Technical Cooperation programme within which this work was carried out. Analyses of415
18O were funded by the project CDTN / DDHI (Guendouz and Moulla, 1996). The supports of416
University of Ouargla and of INRA for travel grants of R. Slimani and G. Bourrié are gratefully417
acknowledged too.418
APPENDIX419
According to a simple Rayleigh equation, the evolution of the heavy isotope ratio in the420
remaining liquid Rl is given by:421
Rl ≈ Rl,0 × f α−1l , (4)
where fl is the fraction remaining liquid and α the fractionation factor.422
The fraction remaining liquid is derived from chloride concentration, as chloride can be con-423
sidered as conservative during evaporation: all phreatic waters are undersaturated with respect to424
halite, that precipitates only in the last stage. Hence, the following equation holds:425
fl ≡nw,1
nw,0=
[Cl−]0
[Cl−]1. (5)
By taking natural logarithms, one obtains:426
ln Rl ≈ (1 − α) × ln[Cl−] + cte, (6)
As, by definition,427
Rl ≡ Rstd. × (1 +δ18O1000
), (7)
one has:428
ln Rl ≡ ln Rstd. + ln(1 +δ18O1000
), (8)
≈ ln Rstd. +δ18O1000
, (9)
hence, with base 10 logarithms:429
δ18O ≈ 1000(1 − α) log[Cl−] + cte, (10)≈ −ε log[Cl−] + cte, (11)
where as classically defined ε = 100(α − 1) is the enrichment factor.430
11
admin
Barra
admin
Testo inserito
k
admin
Barra
admin
Testo inserito
constant
admin
Testo inserito
0
admin
Barra
admin
Testo inserito
constant

References431
Al-Gamal, S.A., 2011. An assessment of recharge possibility to North-Western Sahara Aquifer System (NWSAS) using432
environmental isotopes. Journal of Hydrology 398, 184 – 190.433
ANRH, 2011. Inventaire des forages de la Wilaya de Ouargla. Rapport technique. Agence Nationale des Ressources434
Hydrauliques.435
Aumassip, G., Dagorne, A., Estorges, P., Lefèvre-Witier, P., Mahrour, F., Nesson, C., Rouvillois-Brigol, M., Trecolle, G.,436
1972. Aperçus sur l’évolution du paysage quaternaire et le peuplement de la région de Ouargla. Libyca , 205–257.437
Belkhiri, L., Boudoukha, A., Mouni, L., Baouz, T., 2010. Application of multivariate statistical methods and inverse438
geochemical modeling for characterization of groundwater — A case study: Ain Azel plain (Algeria). Geoderma439
159, 390 – 398.440
Belkhiri, L., Mouni, L., Boudoukha, A., 2012. Geochemical evolution of groundwater in an alluvial aquifer: Case of El441
Eulma aquifer, East Algeria. Journal of African Earth Sciences 66–67, 46 – 55.442
Carucci, V., Petitta, M., Aravena, R., 2012. Interaction between shallow and deep aquifers in the Tivoli Plain (Central443
Italy) enhanced by groundwater extraction: A multi-isotope approach and geochemical modeling. Applied Geochem-444
istry 27, 266 – 280. URL: http://www.sciencedirect.com/science/article/pii/S0883292711004628,445
doi:http://dx.doi.org/10.1016/j.apgeochem.2011.11.007.446
Chellat, S., Bourefis, A., Hamdi-Aïss, a.B., Djerrab, A., 2014. Paleoenvironemental reconstitution of Mio-pliocenes447
sandstones of the lower-Sahara at the base of exoscopic and sequential analysis. Pensee Journal 76, 34 – 51.448
Chkir, N., Guendouz, A., Zouari, K., Hadj Ammar, F., Moulla, A., 2009. Uranium isotopes in groundwater from the449
continental intercalaire aquifer in Algerian Tunisian Sahara (Northern Africa). Journal of Environmental Radioac-450
tivity 100, 649 – 656. URL: http://www.sciencedirect.com/science/article/pii/S0265931X09001143,451
doi:http://dx.doi.org/10.1016/j.jenvrad.2009.05.009.452
Cornet, A., Gouscov, N., 1952. Les eaux du Crétacé inférieur continental dans le Sahara algérien: nappe dite "Albien",453
in: Congrès géologique international, Alger. p. 30.454
Dai, Z., Samper, J., Ritzi, R., 2006. Identifying geochemical processes by inverse modeling of multicomponent reactive455
transport in the aquia aquifer. Geosphere 2, 210–219.456
Deutsch, W., 1997. Groundwater Chemistry-Fundamentals and Applications to Contamination. New York.457
Dubief, J., 1953. Essai sur l’hydrologie superficielle au Sahara. Direction du service de la colonisation et de458
l’hydraulique, Service des études scientifiques.459
Dubief, J., 1963. Le climat du Sahara. Hors-série, Institut de recherches sahariennes.460
Eckstein, G., Eckstein, Y., 2003. A hydrogeological approach to transboundary ground water resources and international461
law. American University International Law Review 19, 201–258.462
Edmunds, W., Guendouz, A., Mamou, A., Moulla, A., Shand, P., Zouari, K., 2003. Groundwater evolution in the463
continental intercalaire aquifer of southern Algeria and Tunisia: trace element and isotopic indicators. Applied464
Geochemistry 18, 805–822.465
Fontes, J., Yousfi, M., Allison, G., 1986. Estimation of long-term, diffuse groundwater discharge in the northern sahara466
using stable isotope profiles in soil water. Journal of Hydrology 86, 315 – 327.467
Foster, S., Margat, J., Droubi, A., 2006. Concept and importance of nonrenewable resources. Number 10 in IHP-VI468
Series on Groundwater, UNESCO.469
Furon, R., 1960. Géologie de l’Afrique. 2eme édition, Payot.470
Güler, C., Thyne, G., 2004. Hydrologic and geologic factors controlling surface and groundwater chemistry in Indian471
wells–Owens valley area, southeastern California, USA. Journal of Hydrology 285, 177–198.472
Gonfiantini, R., Conrad, G., Fontes, J.C., Sauzay, G., Payne, B., 1975. Étude isotopique de la nappe du Continental473
Intercalaire et de ses relations avec les autres nappes du Sahara septentrional. Isotope Techniques in Groundwater474
Hydrology 1, 227–241.475
Guendouz, A., 1985. Contribution à l’étude hydrochimique et isotopique des nappes profondes du Sahara nord-est476
septentrional, Algérie. Phd thesis. Université d’Orsay, France.477
Guendouz, A., Michelot, J., 2006. Chlorine-36 dating of deep groundwater from northern Sahara. Journal of Hydrology478
328, 572–580.479
Guendouz, A., Moulla, A., 1996. Étude hydrochimique et isotopique des eaux souterraines de la cuvette de Ouargla,480
Algérie. Rapport technique. CDTN/DDHI.481
Guendouz, A., Moulla, A., Edmunds, W., Zouari, K., Shands, P., Mamou, A., 2003. Hydrogeochemical and isotopic482
evolution of water in the complex terminal aquifer in Algerian Sahara. Hydrogeology Journal 11, 483–495.483
Hadj-Ammar, F., Chkir, N., Zouari, K., Hamelin, B., Deschamps, P., Aigoun, A., 2014. Hydro-484
geochemical processes in the Complexe Terminal aquifer of southern Tunisia: An integrated investi-485
gation based on geochemical and multivariate statistical methods. Journal of African Earth Sciences486
100, 81 – 95. URL: http://www.sciencedirect.com/science/article/pii/S1464343X14001940,487
doi:http://dx.doi.org/10.1016/j.jafrearsci.2014.06.015.488
12

Hamdi-Aïssa, B., Vallès, V., Aventurier, A., Ribolzi, O., 2004. Soils and brines geochemistry and mineralogy of hyper489
arid desert playa, Ouargla basin, Algerian Sahara. Arid Land Research and Management 18, 103–126.490
Kenoyer, G., Bowser, C., 1992. Groundwater chemical evolution in a sandy aquifer in northern Wisconsin. Water491
Resources Research 28, 591–600.492
Kuells, C., Adar, E., Udluft, P., 2000. Resolving patterns of ground water flow by inverse hydrochemical modeling in a493
semiarid Kalahari basin. Tracers and Modelling in Hydrogeology 262, 447–451.494
Le Houérou, H., 2009. Bioclimatology and biogeography of Africa. Springer Verlag.495
Lelièvre, R., 1969. Assainissement de la cuvette de Ouargla. rapports Géohydraulique no 2. Ministère des Travaux496
Publique et de la construction.497
Li, P., Qian, H., Wu, J., Ding, J., 2010. Geochemical modeling of groundwater in southern plain area of Pengyang498
County, Ningxia, China. Water Science and Engineering 3, 282–291.499
Ma, J., Pan, F., Chen, L., Edmunds, W., Ding, Z., Zhou, K., He, J., Zhoua, K., Huang, T., 2010. Isotopic and geochemical500
evidence of recharge sources and water quality in the Quaternary aquifer beneath Jinchang city, NW China. Applied501
Geochemistry 25, 996–1007.502
Martinelli, G., Chahoud, A., Dadomo, A., Fava, A., 2014. Isotopic features of emilia-romagna region503
(north italy) groundwaters: Environmental and climatological implications. Journal of Hydrology 519, Part504
B, 1928 – 1938. URL: http://www.sciencedirect.com/science/article/pii/S0022169414007690,505
doi:http://dx.doi.org/10.1016/j.jhydrol.2014.09.077.506
Matiatos, I., Alexopoulos, A., Godelitsas, A., 2014. Multivariate statistical analysis of the hydrogeochemical and isotopic507
composition of the groundwater resources in northeastern Peloponnesus (Greece). Science of The Total Environment508
476–477, 577 – 590. URL: http://www.sciencedirect.com/science/article/pii/S0048969714000515,509
doi:http://dx.doi.org/10.1016/j.scitotenv.2014.01.042.510
Moulias, D., 1927. L’eau dans les oasis sahariennes, organisation hydraulique, régime juridique. Phd thesis. Alger.511
Moulla, A., Guendouz, A., Cherchali, M.H., Chaid, Z., Ouarezki, S., 2012. Updated geochemical and isotopic data512
from the Continental Intercalaire aquifer in the Great Occidental Erg sub-basin (south-western Algeria). Quaternary513
International 257, 64–73.514
OECD, 2008. OECD Environmental Outlook to 2030. Technical Report 1. Organisation for Economic Cooperation and515
Development.516
ONM, 1975/2013. Bulletins mensuels de relevé des paramètres climatologiques en Algérie. Office national517
météorologique.518
OSS, 2003. Système aquifère du Sahara septentrional. Technical Report. Observatoire du Sahara et du Sahel.519
OSS, 2008. Système aquifère du Sahara septentrional (Algérie, Tunisie, Libye): gestion concertée d’un bassin trans-520
frontalier. Technical Report 1. Observatoire du Sahara et du Sahel.521
Ould Baba Sy, M., Besbes, M., 2006. Holocene recharge and present recharge of the Saharan aquifers — a study by522
numerical modeling, in: International symposium - Management of major aquifers.523
Parkhurst, D., Appelo, C., 2013. Description of Input and Examples for PHREEQC (Version 3) — A computer program524
for speciation, batch-reaction, one-dimensional transport, and inverse geochemical calculations. Technical Report 6.525
U.S. Department of the Interior, U.S. Geological Survey. URL: http://pubs.usgs.gov./tm/06/a43.526
Plummer, L., Back, M., 1980. The mass balance approach: application to interpreting the chemical evolution of hydro-527
logical systems. American Journal of Science 280, 130–142.528
Plummer, L., Sprinckle, C., 2001. Radiocarbon dating of dissolved inorganic carbon in groundwater from confined parts529
of the upper Floridan aquifer, Florida, USA. Journal of Hydrology 9, 127–150.530
Sharif, M., Davis, R., Steele, K., Kim, B., Kresse, T., Fazio, J., 2008. Inverse geochemical modeling of groundwater531
evolution with emphasis on arsenic in the Mississippi River Valley alluvial aquifer, Arkansas (USA). Journal of Hy-532
drology 350, 41 – 55. URL: http://www.sciencedirect.com/science/article/pii/S0022169407007093,533
doi:http://dx.doi.org/10.1016/j.jhydrol.2007.11.027.534
Slimani, R., 2006. Contribution à l’évaluation d’indicateurs de pollution environnementaux dans la région de Ouargla:535
cas des eaux de rejets agricoles et urbaines. Master’s thesis. Université de Ouargla.536
Stumm, W., Morgan, J., 1999. Aquatic Chemistry: Chemical Equilibria and Rates in Natural Waters. John Wiley and537
Sons.538
Thomas, J., Welch, A., Preissler, A., 1989. Geochemical evolution of ground water in smith creek valley - a hydrologi-539
cally closed basin in central Nevada, USA. Applied Geochemistry 4, 493–510.540
UNESCO, 1972. Projet ERESS, Étude des ressources en eau du Sahara septentrional. Technical Report 10. UNESCO.541
Vallès, V., Rezagui, M., Auque, L., Semadi, A., Roger, L., Zouggari, H., 1997. Geochemistry of saline soils in two arid542
zones of the Mediterranean basin. I. Geochemistry of the Chott Melghir-Mehrouane watershed in Algeria. Arid Soil543
Research and Rehabilitation 11, 71–84.544
13

Table1:Field
andanalyticaldata
fortheC
ontinentalIntercalaireaquifer.
Locality
Lat.
Long.
Elev.
Date
EC
TpH
Alk.
Cl –
SO4 2–
Na +
K+
Mg 2
+C
a 2+
Br –
/m/m
Scm−
1/ ◦C
/mm
olL−
1
Hedeb
I3,534
,750723
,986134
.809
/11/2012
2.01
46.5
7.65
3.5
5.8
6.79
10.7
0.63
2.49
3.3
0.034
Hedeb
I3,534
,750723
,986134
.81992
1.9
49.3
7.35
0.42
5.81
1.07
5.71
0.18
0.77
0.48
Hadeb
II3,534
,310724
,290146
.21992
2.02
47.4
7.64
0.58
6.19
1.22
5.06
0.2
1.28
0.82
AouinetM
oussa3,548
,896721
,076132
.61992
2.2
48.9
7.55
1.28
6.49
1.28
5.65
0.16
1.14
1.17
AouinetM
oussa3,548
,896721
,076132
.622
/02/2013
2.2
48.9
7.55
3.19
9.8
3.89
6.3
0.69
5.71
1.27
Hedeb
I3,534
,750723
,986134
.811
/12/2010
2.19
49.3
7.35
1.91
12.4
4.58
10.7
0.7
3.77
2.35
Hadeb
II3,534
,310724
,290146
.211
/12/2010
2.26
47.4
7.64
2.11
13.1
5.46
13.9
0.53
4.53
1.41
HassiK
hfif3,591
,659721
,636110
24/02
/20132.43
50.5
6.83
2.98
14.3
5.24
10.8
0.84
3.44
4.63
0.033
Hedeb
I3,534
,750723
,986134
.827
/02/2013
2.01
46.5
7.65
3.46
15.1
7.67
11.8
0.51
5.57
5.16
HassiK
hfif3,591
,659721
,636110
09/11
/20122
50.1
7.56
3.31
15.3
7.77
12.2
0.59
5.77
4.95
El-B
our3,560
,264720
,366160
22/02
/20132.96
54.5
7.34
2.58
18.6
6.21
20.6
0.66
4.79
1.38
14
Tabl
e2:
Fiel
dan
dan
alyt
ical
data
fort
heC
ompl
exe
Term
inal
aqui
fer.
Loc
ality
Site
Aqu
ifer
Lat
.L
ong.
Ele
v.D
ate
EC
TpH
Alk
.C
l–SO
42–N
a+K
+M
g2+
Ca2
+B
r–
/m/m
Scm−
1/◦
C/m
mol
L−
1
Bam
endi
lD
7F4
M3,
560,
759.
672
0,58
6.2
296
20/0
1/20
132.
0220.1
7.86
1.63
10.1
5.79
9.88
0.68
3.92
2.51
Bam
endi
lD
7F4
M3,
560,
759.
672
0,58
6.2
296
1992
221.1
8.2
0.96
10.6
3.54
10.6
10.
092.
331.
8If
riD
1F15
1S
3,53
8,89
1.7
721,
060.
520
419
922.
6723.5
71.
2610.7
52.
717.
990.
732.
322.
12Sa
idO
tba
D2F
66S
3,54
0,25
7.3
720,
085.
421
619
922.
3124
81.
4311.0
24.
7311.4
70.
162.
073.
33O
glat
Lar
baâ
D6F
64M
3,56
6,50
1.4
729,
369.
317
719
922.
3118
7.9
1.41
11.3
66.
8511.5
92.
311.
964.
58E
l-B
our
D4F
94M
3,53
6,24
5.2
722,
641.
710
0.6
27/0
1/20
133.
0526.2
7.37
1.61
12.8
6.79
5.15
1.94
1.65
9.13
Said
Otb
aI
D2F
71S
3,55
7,41
2.4
718,
272.
821
1.9
1992
2.27
24.2
8.2
1.54
13.5
35.
7214.9
90.
333.
282.
57D
ebic
heD
6F61
M3,
547,
557.
171
7,06
7.1
173.
526
/01/
2013
2.22
23.9
7.74
1.78
14.2
8.41
12.6
0.66
5.38
4.43
Rou
issa
tIII
D3F
10S
3,53
5,06
8.1
722,
352.
124
819
923.
126.1
7.27
2.39
14.2
76.
8913.0
50.
43.
365.
42Sa
idO
tba
ID
2F71
S3,
557,
412.
471
8,27
2.8
211.
926
/01/
2013
5.63
25.1
7.34
2.38
14.3
6.86
13.1
0.4
3.36
5.43
0.03
4R
ouis
satI
IID
3F10
S3,
535,
068.
172
2,35
2.1
248
20/0
1/20
132.
3218.9
7.98
1.65
15.2
8.64
12.6
1.56
5.79
4.25
Ifri
D1F
151
S3,
538,
891.
772
1,06
0.5
204
27/0
1/20
132.
3722.9
7.79
1.75
15.4
8.31
13.7
0.22
5.17
4.75
Said
Otb
aD
2F66
S3,
540,
257.
372
0,08
5.4
216
31/0
1/20
132.
3824.9
7.91
2.19
16.1
8.65
16.5
0.74
4.93
4.29
Ogl
atL
arba
âD
6F64
M3,
566,
501.
472
9,36
9.3
177
31/0
1/20
132.
4323.7
7.62
2.3
16.3
8.65
13.6
0.71
5.86
4.97
SAR
Mek
hadm
aD
1F91
S3,
536,
757.
771
7,82
2.3
221
03/0
2/20
132.
4725.8
7.75
3.43
16.5
8.53
16.1
0.68
5.27
4.92
Sidi
Kou
iled
D9F
12S
3,54
0,85
5.1
729,
055.
432
924
/01/
2013
2.57
21.3
8.05
4.65
16.8
8.85
16.1
0.79
6.21
5.01
Ain
N’s
ara
D6F
50S
3,55
9,32
3.6
716,
868.
425
525
/01/
2013
3.36
25.7
7.36
1.98
16.9
9.71
15.9
0.35
3.39
7.87
0.03
3A
.Lou
ise
D4F
73S
3,53
7,52
3.4
721,
904.
631
026
/01/
2013
2.57
247.
491.
9817.4
9.04
13.9
1.99
5.78
5.05
Gha
zale
tA.H
D6F
79M
3,59
8,75
0.2
720,
356.
811
902
/02/
2013
2.84
22.5
7.55
3.47
17.4
9.35
16.6
0.62
6.24
4.96
Ain
mou
ssa
IID
9F30
S3,
537,
814.
171
9,66
5.1
220.
602
/02/
2013
7.52
23.9
7.52
2.37
17.5
8.24
17.3
0.39
3.1
6.46
0.03
3A
inN
’sar
aD
6F50
S3,
559,
323.
671
6,86
8.4
255
02/0
2/20
132.
6223.8
7.65
2.11
17.7
9.19
15.5
1.13
6.11
4.73
H.M
iloud
D1F
135
M3,
547,
557.
171
7,06
7.1
173
03/0
2/20
132.
7621.6
7.55
3.32
17.9
9.22
16.5
1.01
6.17
4.91
ElB
our
D6F
97S
3,54
0,93
6.5
715,
816.
016
925
/01/
2013
2.65
19.9
8.02
2.14
17.9
9.28
15.8
1.6
5.84
4.73
H.M
iloud
D1F
135
M3,
547,
557.
171
7,06
7.1
173
1992
2.07
22.7
8.1
2.8
18.0
85.
7316.6
10.
513.
654.
26N
’gou
ssa
ElH
ouD
6F51
S3,
556,
256.
771
8,97
9.5
198
31/0
1/20
132.
9722.9
7.52
2.03
18.4
9.63
17.1
0.45
6.17
4.99
ElK
oum
D6F
67S
3,57
3,69
4.1
721,
639.
714
321
/01/
2013
3.07
22.9
8.09
3.52
18.4
9.71
17.9
0.32
6.49
5.14
ElK
oum
D6F
67S
3,57
3,69
4.1
721,
639.
714
319
922.
525
7.6
1.5
18.7
97.
1710.1
83.
434.
975.
81IT
AS
D1F
150
M3,
536,
186.
671
7,04
6.1
93.1
21/0
1/20
133.
6623.9
7.54
1.48
18.8
7.07
10.1
3.41
4.94
5.77
Ain
mou
ssa
VD
9F13
M3,
538,
409.
271
8,68
0.2
210.
208
/02/
2013
2.39
25.3
7.22
2.28
19.4
9.45
18.8
0.39
3.31
7.61
0.03
4E
l-B
our
D4F
94M
3,53
6,24
5.2
722,
641.
710
0.6
1992
2.3
21.2
7.9
1.58
20.0
57.
2112.0
92.
625.
765.
17R
ouis
satI
D3F
18M
3,53
5,56
4.2
722,
498.
980.4
26/0
1/20
133.
1323
8.1
3.15
21.2
11.1
19.6
0.87
7.08
6.01
Rou
issa
tID
3F18
M3,
535,
564.
272
2,49
8.9
80.4
1992
220
7.84
1.86
21.6
68.
4617.7
21.
195.
056
St.p
ompa
gech
ott
D5F
80S
3,54
1,65
6.9
723,
521.
922
4.1
04/0
2/20
133.
2824.5
8.23
3.91
22.1
11.9
19.9
2.13
7.64
6.28
Cho
ttPa
lmer
aie
D5F
77S
3,53
8,21
9.3
725,
541.
324
2.8
05/0
2/20
133.
3724.6
7.53
3.26
22.3
12.1
20.9
1.15
8.25
5.78
Bou
rElH
aich
aD
1F13
4M
3,54
5,53
3.1
720,
391.
786
05/0
2/20
133.
422.2
7.34
4.13
23.2
12.2
21.2
1.49
8.61
6.01
Aba
zat
D2F
69M
3,55
2,50
4.9
712,
786.
313
7.1
03/0
2/20
133.
5424.6
7.61
2.24
24.7
12.7
21.1
1.65
8.45
6.47
Gar
etC
hem
iaD
1F11
3S
3,53
6,17
4.1
716,
808.
521
3.7
28/0
1/20
134.
0528
7.3
2.21
25.9
9.47
25.4
0.57
3.64
7.17
0.03
7Fr
ane
D6F
62M
3,57
0,17
5.8
717,
133.
816
7.5
27/0
1/20
133.
7924.2
7.95
2.27
25.9
13.5
22.6
0.64
8.91
7.16
Oum
Ran
ebD
6F6
9M
3,54
0,45
1.1
721,
919.
821
5.8
25/0
1/20
134.
224.1
7.03
2.61
27.9
8.67
22.9
0.62
4.42
7.96
0.03
5N
’gou
ssa
ElH
ouD
6F51
S3,
556,
256.
771
8,97
9.5
198
1992
3.15
23.2
82.
5928.3
98.
6123.1
40.
624.
468.
01H
.Milo
udB
enya
zaD
1F13
8M
3,55
1,19
2.5
717,
042.
188.9
28/0
1/20
133.
8525.2
7.61
2.44
28.4
14.2
23.9
1.66
10.0
17.
12A
inL
aara
bD
6F49
M3,
558,
822.
671
6,79
9.1
156.
528
/01/
2013
3.97
23.7
7.33
2.16
28.9
9.01
23.9
0.53
57.
720.
037
H.M
iloud
Ben
yaza
D1F
138
M3,
551,
192.
571
7,04
2.1
88.9
1992
2.9
22.8
7.5
2.16
28.9
29.
0323.8
70.
524.
997.
7R
ouis
sat
D3F
8M
3,54
5,47
0.7
732,
837.
633
2.4
03/0
2/20
134.
3825.4
7.51
1.71
29.8
8.33
22.8
1.23
6.23
6.08
Rou
issa
tD
3F8
M3,
545,
470.
773
2,83
7.6
332.
419
926.
1625.3
7.22
1.71
29.8
18.
3322.8
61.
236.
236.
08A
inE
lArc
hD
3F26
M3,
534,
843.
972
3,38
1.8
93.6
1992
5.11
25.1
7.45
1.56
34.6
88.
9423.9
80.
878.
386.
5St
.pom
page
chot
tD
5F80
S3,
541,
656.
972
3,52
1.9
224.
119
923.
6925.4
7.67
2.28
42.2
213.5
336.7
71.
127.
439.
73
M=
Mio
-plio
cene
aqui
fer;
S=
Seno
nian
aqui
fer.
15
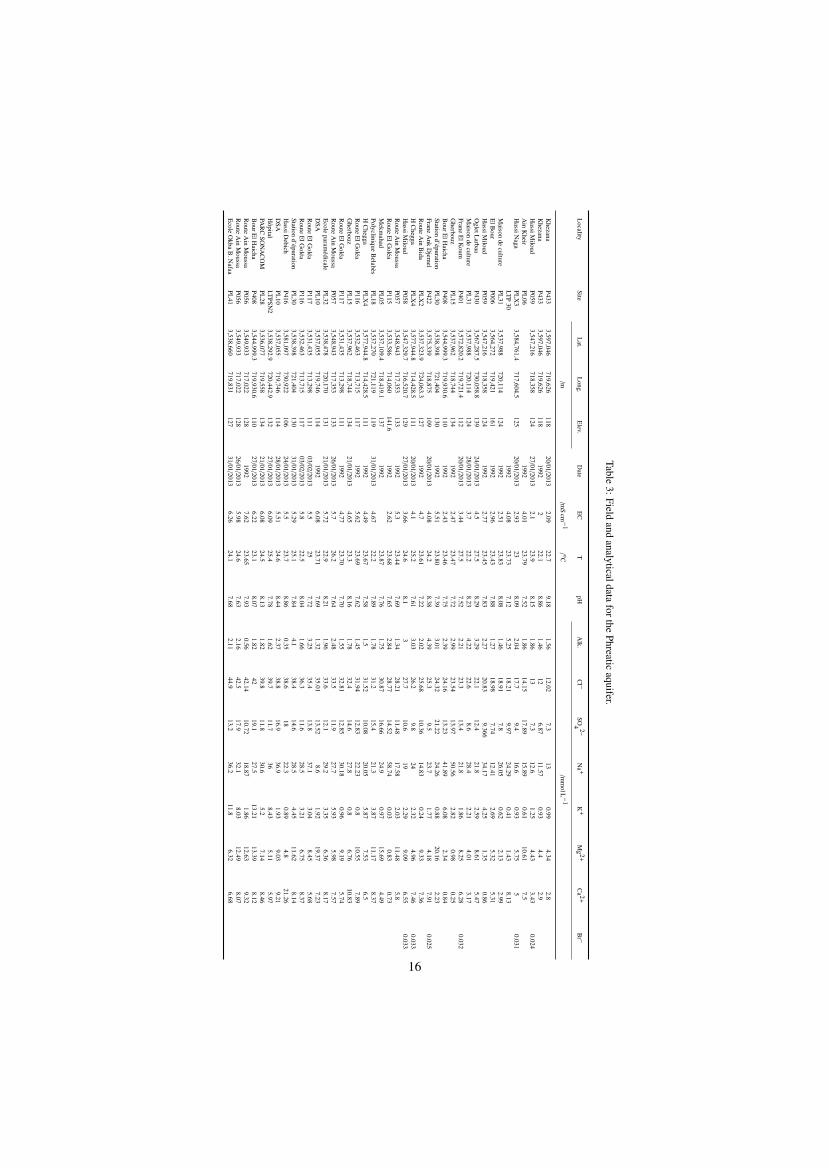
Table3:Field
andanalyticaldata
forthePhreatic
aquifer.
Locality
SiteL
at.L
ong.E
lev.D
ateE
CT
pHA
lk.C
l –SO
4 2–N
a +K
+M
g 2+
Ca 2
+B
r –
/m/m
Scm−
1/ ◦C
/mm
olL−
1
Khezana
P4333,597
,046719
,626118
20/01
/20132.09
22.7
9.18
1.56
12.02
7.3
130.99
4.34
2.8
Khezana
P4333,597
,046719
,626118
19922
22.1
8.86
1.46
126.87
11.57
0.93
4.4
2.9
HassiM
iloudP059
3,547
,216718
,358124
27/01
/20132.1
23.9
8.15
1.86
137.3
12.6
1.25
4.43
3.43
0.024
Ain
Kheir
PL06
19924.01
23.79
7.52
1.86
14.15
17.89
15.89
0.61
10.61
7.5
HassiN
agaPL
X3
3,584
,761.4
717,604
.5125
20/01
/20132.93
238.09
2.04
17.7
9.4
16.6
0.93
5.75
50.031
LTP
301992
4.08
23.73
7.12
5.25
18.21
9.97
24.29
0.41
1.43
8.13
Maison
deculture
PL31
3,537
,988720
,114124
19922.51
23.83
8.08
1.46
18.91
7.8
26.05
0.62
2.13
2.99
ElB
ourP006
3,564
,272719
,421161
19922.96
23.43
7.88
1.27
18.98
7.74
12.41
2.69
5.32
5.31
HassiM
iloudP059
3,547
,216718
,358124
19922.77
23.45
7.83
2.27
20.83
9.366
34.17
4.25
1.35
0.86
OgletL
arbaaP430
3,567
,287.5
730,058
.8139
24/01
/20134.5
27.5
8.29
3.29
22.1
12.4
21.8
2.59
8.61
5.47
Maison
deculture
PL31
3,537
,988720
,114124
28/01
/20133.7
22.2
8.23
4.22
22.6
8.6
28.4
2.21
4.01
3.17
FraneE
lKoum
P4013,572
,820.2
719,721
.4112
20/01
/20133.44
27.5
7.52
2.21
23.3
13.4
21.8
1.86
8.25
6.28
0.032
Gherbouz
PL15
3,537
,962718
,744134
19922.47
23.47
7.72
2.99
23.54
13.97
50.56
2.82
0.98
0.25
BourE
lHaicha
P4083,544
,999.3
719,930
.6110
19922.43
23.46
7.75
2.39
24.16
13.23
41.89
6.08
2.34
0.84
Stationd’épuration
PL30
3,538
,398721
,404130
19925.51
23.80
7.39
3.01
24.32
21.22
24.26
0.88
20.16
2.23
FraneA
nkD
jemel
P4223,575
,339718
,875109
20/01
/20134.08
24.2
8.38
4.39
25.3
9.5
23.7
1.77
4.18
7.91
0.025
Route
Ain
Bida
PLX
23,537
,323.9
724,063
.3127
19924.7
23.61
7.22
2.02
25.68
10.36
14.83
0.24
9.33
7.36
HC
heggaPL
X4
3,577
,944.8
714,428
.5111
20/01
/20134.1
25.2
7.61
3.03
26.2
9.8
242.32
4.96
7.46
0.033
HassiM
iloudP058
3,547
,329.7
716,520
.7129
27/01
/20133.66
24.6
8.1
327.7
10.6
192.29
9.09
6.55
0.033
Route
Ain
Moussa
P0573,548
,943717
,353133
19925.3
23.44
7.69
1.34
28.21
11.48
17.58
2.03
11.48
5.8
Route
ElG
oléaP115
3,533
,586714
,060141
.61992
2.62
23.68
7.65
2.84
28.77
14.52
58.74
0.03
0.83
0.73
Mekm
ahadPL
053,537
,109.4
718,419
.1137
199223.87
7.76
1.75
30.87
16.66
24.9
0.97
15.69
4.49
PolycliniqueB
elabèsPL
183,537
,270721
,119119
31/01
/20134.67
22.2
7.89
1.78
31.2
15.4
21.3
3.87
11.17
8.37
HC
heggaPL
X4
3,577
,944.8
714,428
.5111
19924.49
23.67
7.58
1.5
31.52
10.08
20.05
5.87
7.53
6.5
Route
ElG
oléaP116
3,532
,463713
,715117
19925.62
23.69
7.62
1.45
31.94
12.83
22.23
0.8
10.55
7.89
Gherbouz
PL15
3,537
,962718
,744134
21/01
/20134.65
23.3
8.16
1.78
32.4
14.6
27.8
0.8
6.76
10.83
Route
ElG
oléaP117
3,531
,435713
,298111
19924.77
23.70
7.70
1.55
32.81
12.85
30.18
0.96
9.19
5.74
Route
Ain
Moussa
P0573,548
,943717
,353133
26/01
/20135.7
26.2
7.64
2.48
33.5
11.9
27.7
5.93
5.98
7.57
Ecole
paramédicale
PL32
3,538
,478720
,170131
21/01
/20135.72
22.9
8.21
1.96
33.6
12.1
29.2
3.35
6.36
8.17
DSA
PL10
3,537
,055719
,746114
19926.08
23.71
7.69
1.32
35.01
13.52
8.6
1.92
19.37
7.23
Route
ElG
oléaP117
3,531
,435713
,298111
03/02
/20135.5
257.72
3.25
35.4
13.8
37.1
3.04
8.45
5.68
Route
ElG
oléaP116
3,532
,463713
,715117
03/02
/20135.8
22.5
8.04
1.66
36.3
11.6
28.5
3.21
6.75
8.37
Stationd’épuration
PL30
3,538
,398721
,404130
31/01
/20135.29
25.1
7.84
4.1
38.4
14.6
28.5
4.45
11.62
8.14
HassiD
ebichP416
3,581
,097730
,922106
24/01
/20135.5
23.7
8.86
0.35
38.6
1822.3
0.89
4.8
21.26
DSA
PL10
3,537
,055719
,746114
28/01
/20135.51
24.6
8.44
2.37
38.8
16.9
36.9
1.93
9.03
9.21
Hôpital
LTPSN
23,538
,292.9
720,442
.9132
27/01
/20136.09
25.4
7.78
1.62
39.7
11.7
368.43
5.11
5.97
PAR
CSO
NA
CO
MPL
283,536
,077719
,558134
21/01
/20136.08
24.5
8.13
1.82
39.8
11.8
30.6
5.2
7.14
8.46
BourE
lHaicha
P4083,544
,999.3
719,930
.6110
27/01
/20136.22
23.1
8.07
1.82
4219.1
27.5
13.21
13.39
8.12
Route
Ain
Moussa
P0563,549
,933717
,022128
19927.62
23.65
7.93
0.56
42.14
10.72
18.87
1.86
12.63
9.32
Route
Ain
Moussa
P0563,549
,933717
,022128
26/01
/20135.98
24.6
7.63
2.16
42.5
17.9
32.1
8.03
12.49
8.07
Ecole
Okba
B.N
afaaPL
413,538
,660719
,831127
31/01
/20136.26
24.1
7.68
2.11
44.9
13.2
36.2
11.8
6.32
6.68
16

Tabl
e4:
Fiel
dan
dan
alyt
ical
data
fort
hePh
reat
icaq
uife
r(co
ntin
ued)
.
Loc
ality
Site
Lat
.L
ong.
Ele
v.D
ate
EC
TpH
Alk
.C
l–SO
42–N
a+K
+M
g2+
Ca2
+
/m/m
Scm−
1/◦
C/m
mol
L−
1
PAR
CH
YD
RA
UL
IQU
EP4
193,
539,
494
725,
605
132
31/0
1/20
137.
0326.4
7.84
2.05
45.1
14.4
41.4
10.7
85.
956.
91Pa
rchy
drau
lique
PL13
3,53
6,55
072
0,20
012
321
/01/
2013
7.22
24.5
7.51
3.24
47.8
14.5
44.4
10.5
56.
356.
59M
ekha
dma
PL25
3,53
6,23
071
8,70
812
921
/01/
2013
7.64
27.1
7.94
1.78
4814.5
42.9
6.56
7.4
7.61
Said
Otb
aP5
063,
535,
528.
172
5,07
5.1
126
04/0
2/20
138.
3224.3
8.12
1.71
52.6
14.6
42.8
10.9
77.
517.
83Sa
idO
tba
P506
3,53
5,52
8.1
725,
075.
112
619
926.
723.2
87.
461.
854.3
917.5
833.3
24.
1122.1
65.
17M
ekha
dma
P566
3,54
0,43
3.1
719,
661.
311
527
/01/
2013
924.6
7.64
1.72
62.5
15.2
71.6
3.03
4.61
6.06
Mek
hadm
aPL
173,
536,
908
718,
511
130
21/0
1/20
139.
424.5
8.06
3.39
63.2
15.6
77.2
2.51
4.08
5.11
Palm
.Gar
aK
rim
aP4
133,
530,
116.
272
2,77
5.1
130
04/0
2/20
1310.0
930.2
7.91
1.63
63.6
21.5
88.3
4.08
4.21
4.65
Mek
hadm
aPL
253,
536,
230
718,
708
129
1992
9.5
23.7
27.
960.
6375.5
710.6
210.2
22.
6432.9
49.
54Sa
idO
tba
(Bab
sbaa
)P0
663,
542,
636.
571
8,95
7.4
126
1992
7.75
23.4
87.
621.
5180.2
312.4
545.8
72.
4623.5
95.
91C
EM
Mal
ekB
.Nab
iPL
033,
540,
010.
972
5,73
8.1
130
1992
7.34
23.8
67.
603.
0484.1
430.5
810
8.55
2.23
10.1
78.
99E
NT
VPL
213,
536,
074
721,
268
128
1992
9.73
23.8
27.
254.
4684.2
623.6
861.6
23.
7533.5
31.
88H
ôtel
Tran
sat
PL23
3,53
8,41
972
0,95
012
628
/01/
2013
1524.2
8.2
4.53
86.6
16.7
79.9
3.21
14.5
46.
85E
NT
VPL
213,
536,
074
721,
268
128
28/0
1/20
1316.4
125.7
7.45
1.97
99.9
17.4
85.5
5.7
15.6
67.
6M
ekm
ahad
PL05
3,53
7,10
9.4
718,
419.
113
721
/01/
2013
16.8
24.8
7.64
2.02
101.
317.7
85.9
5.85
16.6
97.
59B
eniT
hour
PL44
3,53
6,03
9.3
721,
673.
913
419
924.
6823.8
57.
192.
7410
9.75
67.2
113
4.67
5.71
42.0
28.
77Ta
zegr
art
PLSN
13,
537,
675
719,
416
125
22/0
1/20
1317.0
824.9
83.
4111
4.2
18.1
92.9
12.8
16.8
57.
81C
EM
Mal
ekB
.Nab
iPL
033,
540,
010.
972
5,73
8.1
130
27/0
1/20
1310.8
423.1
7.54
3.29
117.
314.7
116.
42.
068.
997.
24E
lBou
rP0
063,
564,
272
719,
421
161
03/0
2/20
1318.3
123.6
7.76
6.26
131.
918.1
96.3
8.61
27.1
17.
99A
inM
ouss
aP0
153,
551,
711
720,
591
103
1992
12.4
223.6
27.
712.
3813
4.68
28.2
72.9
83.
152.4
46.
25St
atio
nde
pom
page
PL04
3,54
1,41
0.1
723,
501.
113
827
/01/
2013
19.0
126.4
7.85
4.03
138
16.7
108.
813.0
619.5
18.
72D
rain
Cho
ttO
uarg
laD
.Ch
1992
23.8
87.
672.
6814
2.22
24.5
96.3
13.
1644.2
23.
02B
eniT
hour
PL44
3,53
6,03
9.3
721,
673.
913
428
/01/
2013
20.1
825.8
7.8
4.96
153
17.7
125.
96.
2922.8
38.
08C
NM
CPL
273,
535,
474
718,
407
126
21/0
1/20
1321.2
324.8
8.11
1.7
169.
418.4
130.
34.
8927.8
18.
63B
amen
dil
P076
3,54
0,13
771
6,72
111
826
/01/
2013
22.3
127.2
7.57
4.33
171.
517.1
130.
86.
3228.0
18.
83N
’Gou
ssa
P041
3,55
9,56
371
6,54
313
526
/01/
2013
25.9
424.5
8.18
7.95
208.
613.4
198.
93.
6111.8
18.
75N
’Gou
ssa
P009
3,55
9,38
871
7,70
712
326
/01/
2013
27.5
128.4
8.39
11.4
520
8.8
15.8
195.
12.
6518.7
9.01
LTP1
619
9211.5
323.7
87.
483.
8421
3.35
48.6
314
7.9
7.46
75.3
14.
25P1
0019
9217.1
823.6
47.
593.
3723
5.01
46.4
426
4.84
4.74
25.5
75.
56C
hott
Adj
adja
Ave
nPL
X1
3,54
0,75
8.8
726,
115.
613
228
/01/
2013
32.9
323.4
7.95
4.44
245.
620.9
141.
426.8
844.5
617.6
6R
oute
Fran
eP0
033,
569,
043
721,
496
134
02/0
2/20
1331.0
323.5
8.01
6.91
252.
717.9
208.
29.
4129.9
910.0
3E
lBou
r-N
’gou
caP0
073,
562,
236
718,
651
129
26/0
1/20
1330.0
728.4
7.76
5.42
254.
715.5
209.
210.4
328.8
27.
51R
oute
Ain
Bid
aPL
X2
3,53
7,32
3.9
724,
063.
312
721
/01/
2013
43.2
525.7
8.07
5.15
262.
293
270.
415.5
62.7
721.4
6A
inM
ouss
aP0
153,
551,
711
720,
591
103
25/0
1/20
1332.0
222.7
8.03
2.95
263
15.4
206.
96.
5632.1
29.
95A
inM
ouss
aP4
023,
549,
503
721,
514
138
25/0
1/20
1360
28.7
8.6
7.69
313.
293.9
442.
823.2
612.5
610.1
7R
oute
Fran
eP0
013,
572,
148
722,
366
127
1992
23.6
38.
374
323.
6258.1
333
1.43
5.01
49.7
73.
97A
inM
ouss
aP0
143,
551,
466
719,
339
131
1992
23.4
07.
313.
9833
6.96
64.2
932
8.67
5.53
62.3
75.
45N
’Gou
ssa
P019
3,56
2,96
071
7,71
911
302
/02/
2013
60.5
827.8
7.65
6.02
356.
296
432.
529.7
721.0
226.2
3N
’Gou
ssa
P018
3,56
2,12
271
6,59
011
026
/01/
2013
61.0
626.2
8.42
6.46
372.
482.3
347.
122.6
460.7
126.6
3A
inM
ouss
aP0
143,
551,
466
719,
339
131
25/0
1/20
1349.0
425.2
7.89
1.8
399.
721.1
389.
32.
4118.9
77.
39R
oute
Sedr
ata
P113
3,53
5,58
671
4,57
610
503
/02/
2013
62.2
424.8
8.2
5.96
414.
883.8
362.
733.3
470.2
326.5
1N
’Gou
ssa
P009
3,55
9,38
871
7,70
712
319
9223.2
77.
842.
442
6.85
57.8
139
3.83
9.13
59.1
312.0
2
17

Table5:Field
andanalyticaldata
forthePhreatic
aquifer(continued).
Locality
SiteL
at.L
ong.E
lev.D
ateE
CT
pHA
lk.C
l –SO
4 2–N
a +K
+M
g 2+
Ca 2
+
/m/m
Scm−
1/ ◦C
/mm
ol/L
Route
FraneP001
3,572
,148722
,366127
02/02
/201366.16
28.3
7.24
6.49
468.7
101.5
350.3
25.96
116.21
35.31
SebkhetSafiouneP031
3,577
,804720
,172120
199223.75
7.31
6.32
481.83
43.35
326.82
12.61
94.15
23.56
SebkhetSafiouneP031
3,577
,804720
,172120
02/02
/201375.96
27.9
8.06
5.85
500.3
110.3
470.5
28.67
79.12
35.47
Route
FraneP002
3,570
,523722
,028108
199223.81
7.76
6.29
522.39
182.95
653.78
9.97
104.7
10.99
SebkhetSafiouneP030
3,577
,253721
,936130
199223.52
7.72
4.43
527.7
123.48
533.79
11.59
106.21
10.65
Oum
Raneb
P0123,554
,089718
,612114
25/01
/201364.05
30.3
7.83
7.77
534.3
20.9
529.6
6.41
19.73
4.73
Oum
Raneb
P0123,554
,089718
,612114
199223.41
7.46
2.72
539.35
60.64
413.55
5.55
112.77
9.42
AN
KD
jemel
P4233,540
,881723
,178102
31/01
/201390.8
23.5
7.48
6.19
636.5
101.3
495.5
38.31
125.81
30.32
SaidO
tba-Chott
P0963,540
,265724
,729111
199223.59
7.71
3.69
645.07
78.46
357.28
5.89
208.4
12.86
SebkhetSafiouneP030
3,577
,253721
,936130
03/02
/201364.66
23.1
7.83
3.71
671.8
90.3
742.9
15.97
41.46
7.65
N’G
oussaP017
3,560
,256715
,781130
26/01
/2013100
.131
7.13
3.78
679.3
114.1
597.8
10.71
125.85
26.29
AN
KD
jemel
P0213,573
,943723
,161105
199223.55
7.43
4.24
700.77
154.45
605.68
53.6
163.08
14.24
Stationde
pompage
PL04
3,541
,410.1
723,501
.1138
199223.57
7.42
2.37
716.27
34.75
560.07
7.04
99.58
11.04
Route
FraneP002
3,570
,523722
,028108
02/02
/201362.82
26.9
7.57
1.65
748.5
62.6
651.5
14.72
77.72
27.29
SaidO
tba-Chott
P0963,540
,265724
,729111
03/02
/201368.31
25.9
8.7
1.24
77153.1
615.9
23.46
69.64
50.39
N’G
oussaP019
3,562
,960717
,719113
199223.30
7.72
2.42
779.13
77.13
711.46
9.23
95.59
12.05
SaidO
tba(Bab
sbaa)P066
3,542
,636.5
718,957
.4126
03/02
/2013150
.626.2
7.18
12.29
799.1
2831,249
.718.95
37.63
18.06
AN
KD
jemel
P0213,573
,943723
,161105
24/01
/201382.28
29.6
7.64
2.35
800.4
94.4
82410.99
53.35
25.39
N’G
oussaP018
3,562
,122716
,590110
199223.29
7.46
1.24
818.67
81244
.2149.54
319.35
24.76
Oum
Raneb
P1623,546
,133725
,12998
25/01
/2013160
30.7
7.15
2.43
842.8
289.9
1,309
.913.3
33.47
17.74
Route
SedrataP113
3,535
,586714
,576105
199223.66
7.70
2.81
954.89
124.85
997.52
13.3
86.69
11.67
Oum
Raneb
PZ12
3,547
,234722
,931110
05/02
/2013114
.927.4
7.44
2.88
980.1
15.5
930.8
7.53
23.9
14.24
HôtelTransat
PL23
3,538
,419720
,950126
199223.49
7.37
31,103
.3194.49
707.81
19.14
270.91
13.3
SebkhetSafiouneP023
3,577
,198725
,72699
199223.32
7.42
2.25
1,176
.9991.14
1,058
.2111.72
133.47
12.41
SebkhetSafiouneP034
3,579
,698725
,63397
05/02
/2013130
34.9
8.08
1.76
1,189
.114.7
1,055
.118.27
56.37
17.38
SebkhetSafiouneP023
3,577
,198725
,72699
05/02
/2013117
.929.4
8.19
1.85
1,209
.315.6
1,129
.48.38
42.85
10.15
ChottA
djadjaPL
X1
3,540
,758.8
726,115
.6132
199223.60
8.02
3.82
1,296
.65134
.011,458
.735.24
47.98
4.34
SebkhetSafiouneP063
3,545
,586.8
725,667
.499
199223.50
7.46
1.94
1,379
.35139
.611,257
.4218.6
182.26
10.03
LTP06
199223.77
7.64
7.84
1,638
.66712
.092,621
.6141.55
190.51
13.34
Bam
endilP076
3,540
,137716
,721118
199223.53
7.71
5.72
1,743
.55143
.361,321
.8726.85
331.38
12.26
ElB
our-N’gouca
P0073,562
,236718
,651129
199223.26
7.67
1.41
1,860
.5391.55
1,434
.7326.2
278.77
13.25
SebkhetSafiouneP063
3,545
,586.8
725,667
.499
05/02
/2013178
.926.7
7.67
1.43
1,887
.992.9
1,455
.826.66
282.88
13.44
P0441992
23.39
7.79
4.53
2,106
.0718.27
1,765
.4727.33
171.23
6.54
P0931992
23.58
7.49
1.49
2,198
.58182
.081,957
.5329.49
278.18
10.44
P0421992
23.42
7.59
1.1
2,330
.85101
.221,963
.7152.19
248.1
11.24
P0681992
23.51
7.54
3.35
2,335
.67222
.082,302
.2526.84
219.9
7.19
Oum
Raneb
PZ12
3,547
,234722
,931110
199223.31
7.59
2.21
2,405
.55109
.922,178
.5525.23
199.35
12.65
HassiD
ebichP416
3,581
,097730
,922106
199223.33
7.84
4.33
2,433
.73178
.872,361
.0924.34
196.07
9.2
N’G
oussaP041
3,559
,563716
,543135
199223.38
7.94
2.13
2,599
.74324
.582,878
.9944.57
152.83
10.97
SebkhetSafiouneP034
3,579
,698725
,63397
199223.34
7.85
1.95
2,752
134.14
2,616
.7724.42
180.14
10.48
P0391992
23.37
6.87
1.94
4,189
.51201
.444,042
.6217.9
257.81
9.23
SebkhetSafiouneP074
199223.54
6.47
4.17
4,356
.48180
.882,759
.957.4
930.06
22.63
SebkhetSafiouneP037
199223.36
6.92
1.52
4,953
.84184
.544,611
.062.9
347.57
7.86
SebkhetSafiouneP036
199223.35
7.54
1.4
4,972
.75108
.124,692
.2336.84
221.13
9.63
Forlongitudeand
latitude,thereference
isU
TM
31projection
forNorth
Sahara1959
(CL
AR
KE
1880ellipsoid).
18
admin
Nota
Erase decimals from latitude and longitude values
admin
Nota
These values of concentration of chemical substances are given with an excessive number of significat digits. The number of significant digits could be chosen in coherence with the results listed in Table 7.
admin
Nota
Use the same values of significant digits for all the data or explain why different data correspond to different resolution. This applies both to EC and to T data.

Table 6: Isotopic data 18O and 3H and chloride concentration in Continental Intercalaire, Complexe Terminal and Phreaticaquifers (sampling campaign in 1992).
Phreatic aquifer
Piezometer Cl– δ18O 3H Piezometer Cl– δ18O 3H Piezometer Cl– δ18O 3H/mmol L−1 /h /UT /mmol L−1 /h /UT /mmol L−1 /h /UT
P007 1,860.5 −2.49 0 PL15 23.54 −7.85 0.6(1) P074 4,356.4 3.42 6.8(8)P009 426.85 −6.6 1.2(3) P066 80.23 −8.14 0.8(1) PL06 14.15 −8.13 1.0(2)P506 54.39 −6.83 1.6(3) PL23 1,103.32 −6.1 0 PL30 24.32 −7.48 2.4(4)P018 818.67 −2.95 6.2(11) P063 1,379.3 −3.4 8.7(15) P002 522.39 −5.71 0.6(1)P019 779.13 −4.67 5.6(9) P068 2,335.6 −3.04 8.8(14) PL21 84.26 −7.65 1.2(2)PZ12 2,405.5 −2.31 8.1(13) P030 527.7 −6.57 2.4(4) PL31 18.91 −7.38 1.6(3)P023 1,176.9 −2.62 0.2(1) P076 1,743.5 −5.56 2.8(5) P433 12 −8.84 0P416 2,433.7 −7.88 5.9(9) P021 700.7 −5.16 2.6(4) PL03 84.14 −7.35 1.7(3)P034 2,752 −1.77 5.7(9) PL04 716.27 −2.89 PL44 109.75 −8.82 1.0(2)P036 4,972.7 3.33 2.1(4) P093 2,198.5 −2.64 5.1(8) PL05 30.87 −7.44 1.9(3)P037 4,953.8 3.12 1.8(3) P096 645.07 −6.13 4.8(8) P408 24.16 −7.92 0P039 4,189.5 0.97 2.2(4) PLX1 1,296.6 −5.6 1.1(2) P116 31.94 −7.18 1.1(2)P041 2,599.7 −0.58 7.3(13) PLX2 25.68 −7.6 1.3(2) LTP 16 213.35 −7.48 1.6(3)P044 2,106.1 −4.46 2.7(5) P015 134.68 −6.77 3.0(5) P117 32.81 −6.92 0.1P014 336.96 −6.9 2.8(5) P001 323.62 −4.66 2.5(4) PL10 35.01 −7.31 0.2(1)P012 539.3 −6.41 2.2(4) P100 235.01 −5.81 0 PL25 75.57 −7.41 0.9(2)P042 2,330.8 2.05 6.0(10) P056 42.14 −7.03 2.9(5) LTP30 18.21 −7.5 1.1(2)P006 18.98 −6.64 0.5(1) P113 954.89 −4.75 0.8(2) LTP06 1,638.6 −1.97 2.8(5)P057 28.21 −7.33 1.1(2) PLX4 31.52 −7.1 0.3(1) P031 481.83 −6.06 3.0(5)P059 20.83 −7.81 0 P115 28.77 −2.54 6.8(12)
Complexe Terminal aquifer
Borehole Cl– δ18O 3H Borehole Cl– δ18O 3H Borehole Cl– δ18O 3H/mmol L−1 /h /UT /mmol L−1 /h /UT /mmol L−1 /h /UT
D5F80 42.22 −7.85 D1F138 28.92 −8.13 0.7(1) D2F71 13.53 −8.23 0.6(1)D3F8 29.81 −8.14 1.4(2) D3F18 21.66 −8.23 0.2(1) D7F4 10.6 −8.27 0.1(1)D3F26 34.68 −7.97 0.8(1) D3F10 14.27 −7.88 1.5(2) D2F66 11.02 −8.3D4F94 20.05 −8.18 0.6(1) D6F51 28.39 −7.9 0.7(1) D1F151 10.75 −8.32 0.4(1)D6F67 18.79 −8.23 3.7(6) D1F135 18.08 −7.97 1.1(2) D6F64 11.36 −8.28 4.3(7)
Continental Intercalaire aquifer
Borehole Cl– δ18O 3H Borehole Cl– δ18O 3H Borehole Cl– δ18O 3H/mmol L−1 /h /UT /mmol L−1 /h /UT /mmol L−1 /h /UT
Hadeb I 5.8 −8.02 0 Hadeb II 6.19 −7.93 0.1(1) Aouinet Moussa 6.49 −7.88 1.1(2)
Table 7: Statistical parameters for Continental Intercalaire (CI), Complexe Terminal (CT) and Phreatic (Phr) aquiferssamples selected on the basis of δ18O and Cl– data (see text).
Aquifer Size Parameter EC T pH Alk. Cl– SO42– Na+ K+ Mg2+ Ca2+
/mS cm−1 /◦C /mmol/L
CI 11 Average 2.2 49.0 7.5 2.3 11.0 4.7 10.3 0.51 3.6 2.4CI 11 Stdd. dev. 0.3 2.0 0.2 1.0 4.6 2.5 4.6 0.23 2.0 1.8
CT 50 Average 3.2 23.0 7.8 2.3 20.0 8.9 17.0 1.0 5.5 5.6CT 50 Stdd. dev. 1.1 2.4 0.4 0.8 7.0 2.6 6.0 0.8 2.2 1.7
Phr cluster I 30 Average 3.9 24.0 7.9 2.3 24.7 11.8 24.2 2.1 7.2 5.3Phr cluster I 30 Stdd. dev. 1.3 1.3 0.4 1.0 6.9 3.4 11.0 1.7 5.0 2.7
Phr cluster II 3 Average 23.4 7.0 2.4 4,761.0 158.0 4,021.0 32.4 500.0 13.0Phr cluster II 3 Stdd. dev. 0.1 0.5 1.6 350.0 43.0 1,093.0 28.0 378.0 8.0
19
admin
Nota
Same comment as for previous table.
admin
Barra
admin
Barra
admin
Barra
admin
Barra
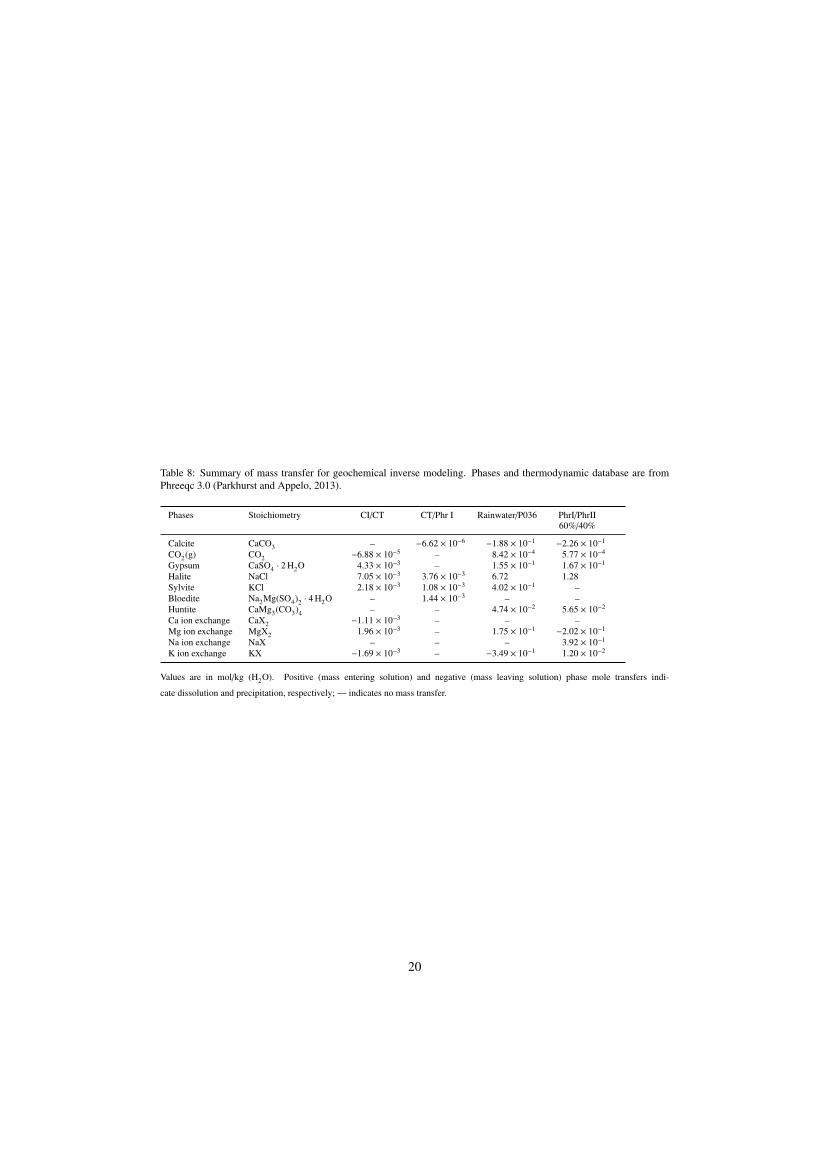
Table 8: Summary of mass transfer for geochemical inverse modeling. Phases and thermodynamic database are fromPhreeqc 3.0 (Parkhurst and Appelo, 2013).
Phases Stoichiometry CI/CT CT/Phr I Rainwater/P036 PhrI/PhrII60%/40%
Calcite CaCO3 – −6.62 × 10⁻⁶ −1.88 × 10⁻¹ −2.26 × 10⁻¹
CO2(g) CO2 −6.88 × 10⁻⁵ – 8.42 × 10⁻⁴ 5.77 × 10⁻⁴
Gypsum CaSO4 · 2 H2O 4.33 × 10⁻³ – 1.55 × 10⁻¹ 1.67 × 10⁻¹
Halite NaCl 7.05 × 10⁻³ 3.76 × 10⁻³ 6.72 1.28Sylvite KCl 2.18 × 10⁻³ 1.08 × 10⁻³ 4.02 × 10⁻¹ –Bloedite Na2Mg(SO4)2 · 4 H2O – 1.44 × 10⁻³ – –Huntite CaMg3(CO3)4 – – 4.74 × 10⁻² 5.65 × 10⁻²
Ca ion exchange CaX2 −1.11 × 10⁻³ – – –Mg ion exchange MgX2 1.96 × 10⁻³ – 1.75 × 10⁻¹ −2.02 × 10⁻¹
Na ion exchange NaX – – – 3.92 × 10⁻¹
K ion exchange KX −1.69 × 10⁻³ – −3.49 × 10⁻¹ 1.20 × 10⁻²
Values are in mol/kg (H2O). Positive (mass entering solution) and negative (mass leaving solution) phase mole transfers indi-
cate dissolution and precipitation, respectively; — indicates no mass transfer.
20

Figure 1: Localisation and schematic relations of aquifers in Ouargla.Blue lines represent limits between aquifers, and the names of aquifers are given in bold letters; as the limit betweenSenonian and Mio-pliocene aquifers is not well defined, a dashed blue line is used. Names of villages and cities are givenin roman (Bamendil, Ouargla, Sidi Khouiled), while geological/geomorphological features are in italic (Glacis, Sebkha,Chott, Dunes). Depths are relative to the ground surface. Letters a and b refer to the cross section (fig. 2) and to thelocalisation map (fig. 3).
21

Figure 2: Geologic cross section in the region of Ouargla.The blue pattern used for Chott and Sebkha correspond to the limit of the saturated zone.
22

Figure 3: Localisation map of sampling point
23

Figure 4: Piper diagram for Continental Intercalaire (filled squares), Complexe Terminal (open circles) and Phreaticaquifer (open triangles).
24

Figure 5: Contour maps of the salinity (expressed as global mineralization) in the aquifer system, (a) Phreatic aquifer; (b)and (c) Complexe Terminal [(b) Mio-pliocene and (c) Senonian]; figures are isovalues of global mineralization (valuesin g/L).
25
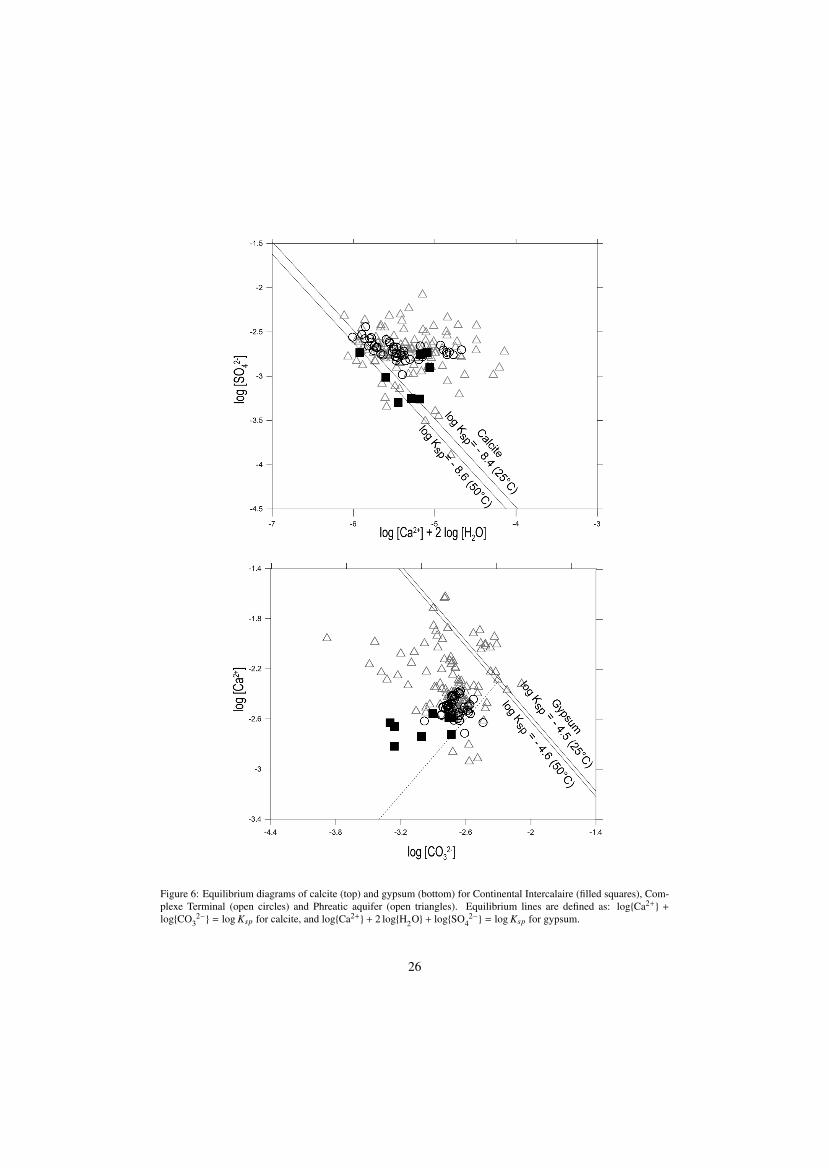
Figure 6: Equilibrium diagrams of calcite (top) and gypsum (bottom) for Continental Intercalaire (filled squares), Com-plexe Terminal (open circles) and Phreatic aquifer (open triangles). Equilibrium lines are defined as: log{Ca2+} +
log{CO32−} = log Ksp for calcite, and log{Ca2+} + 2 log{H2O} + log{SO4
2−} = log Ksp for gypsum.
26

Figure 7: Variation of saturation indices with distance from south to north in the region of Ouargla.
27

Figure 8: Change from carbonate facies to evaporite from Continental Intercalaire (filled squares), Complexe Terminal(open circles) and Phreatic aquifer (open triangles).
Figure 9: Change from sulfate facies to chloride from Continental Intercalaire (filled squares), Complexe Terminal (opencircles) and Phreatic aquifer (open triangles).
28
admin
Nota
I wonder whether this figure could be improved by using log-log axes... I expect problems with zero values along the y axis.
admin
Nota
same comment as for previous figure

Figure 10: Correlation between Na+ and Cl– concentrations in Continental Intercalaire (filled squares), Complexe Ter-minal (open circles) and Phreatic aquifer (open triangles). Seawater composition (star) is [Na+] = 459.3 mmol L−1 and[Cl–] = 535.3 mmol L−1 (Stumm and Morgan, 1999, p.899).
29

Figure 11: Calcium vs. HCO3– diagram in Continental Intercalaire (filled squares), Complexe Terminal (open cir-
cles), Phreatic aquifer (open triangles) and Seawater composition (star) is [Ca2+] = 10.2 mmol L−1 and [HCO3–] =
2.38 mmol L−1 (Stumm and Morgan, 1999, p.899).
30
admin
Sottolineato
I cannot see this point in the plot.
admin
Sottolineato
Is the square at the origin of the axes corresponding to a sample belonging to CI?

Figure 12: Calcium vs. SO42– diagram in Continental Intercalaire (filled squares), Complexe Terminal (open cir-
cles), Phreatic aquifer (open triangles) and Seawater composition (star) is [Ca2+] = 10.2 mmol L−1 and [SO42–] =
28.2 mmol L−1 (Stumm and Morgan, 1999, p.899).
Figure 13: Chloride concentration versus δ18O in Continental Intercalaire (filled squares), Complexe Terminal (opencircles) and Phreatic aquifer (open triangles) from Ouargla.
31
admin
Sottolineato
Same comment as for figure 11.
admin
Nota
In the revised text "pole" was substituted with "cluster".
admin
Nota
In the revised text "pole" was substituted with "cluster".

Figure 14: Log [Cl–] concentration versus δ18O in Continental Intercalaire (filled squares), Complexe Terminal (opencircles) and Phreatic aquifer (open triangles) from Ouargla.
32

Dear editor, The following modifications have been made: 1- The address has been modified Line 4 : aUniv Ouargla, Fac. des sciences…. aOuargla University, Fac. des Sciences de la Nature et de la Vie, Lab. Biochimie des
Milieux Désertiques, Ouargla 30000, Algeria. 2- The address has been modified Line 8 : dNuclear Research Centre…. dAlgiers Nuclear Research Centre, P.O. Box, 399 Alger-RP, 16000 Algiers, Algeria. 3- The abstract has been modified accordingly Line 10 : New samples…. Unpublished chemical and isotopic data taken in November 1992 from the three major
Saharan aquifers namely, the Continental Intercalaire (CI), the Complexe Terminal (CT) and the Phreatic aquifer (Phr) were integrated with original samples in order to chemically and isotopically characterize a Saharan aquifer system and investigate the processes through which groundwaters acquire their mineralization.
4- What do you mean pole? Line 17 : …a first pole of Phr…. The pole mean «end member, clustere» 5- The Reference added Line 25 : A scientific study… A scientific study published in 2008 (OECD, 2008). 6- It has been replaced Line 29 : …causing most of the time overuse… often causing overuse. 7- It has been replaced Line 33 : … is almost unexploited (only north of Ouargla) due… is almost unexploited, due to its salinity (50 g/L); 8- It has been deleted Line 34 : … “Complexe Terminal” (CT) aquifer,… in the middle, the “Complexe Terminal” (CT) 9- It has been deleted Line 35 : …which is the most exploited, and includes… is the most exploited and includes 10- It has been replaced Line 37 : …Miopliocene…

Mio-pliocene 11- It has been replaced Line 37 : …“Continental Intercalaire” (CI) aquifer, where water is contained in… at the bottom, the “Continental Intercalaire” (CI), hosted in the lower Cretaceous 12- it has been rephrased Line 46 : tried, starting from …………Continental Intercalaire recharge. started from chemical and isotopic information (2H, 18O, 234U, 238U, 36Cl) to characterize the
relationships between aquifers. In particular, such studies focused on the recharge of the deep CI aquifer system.
13- Stress the scientific novelty of this paper. From this descriptio it seems that nothing really new is proposed from the scientific point of view, but one of the referees stressed the importance of reducing the lack of data for african regions. I think you can reinforce both the methodlogical aspects (which is the open scientific question? How is it faced in this work?) and the "geographical" application.
Line 53 : In the present study… The present study aims at applying for the first time ever in Algeria, a new methodology
(inverse modeling) to an extreme environment where lack of data on a scarce natural resource (groundwater) is observed. New data were hence collected in order to characterize the hydro chemical and the isotopic composition of the major aquifers in the Saharan region of Ouargla.
14- The word has been replaced Line 56 : …simulations… …modeling… 15- it is now explained Line 60 : The stepwise… The stepwise inversion strategy involves designing a list of the scenarios that includes the
most plausible combinations of geochemical processes, solving scenarios in a stepwise manner, and selecting the scenario that provides the best conceptual geochemical model.
16- It has been deleted Line 69 : the quaternary fossil valley of OuedMya basin It is located in the quaternary valley of Oued Mya basin. 17-The sentences have been modified and completed Line 75 : During Secondary era… During Secondary era, vertical movements a_ected the Precambrian basement causing in
particular collapse of its central part, along an axis passing approximately through the Oued Righ valley and the upper portion of the valley ouedMya. According to Furon (1960), a epicontinental sea spread to the Lower Eocene of northern Sahara. After the Oligocene, the sea gradually withdrew.

18- It has been rephrased Line 100 : The sampling scheme… The sampling scheme complies with the flow directions of the two formations (Phr and CT
aquifers); for the CI aquifer only five points are available, so it is impossible to choose a transect (Fig. 3). Groundwater samples (n = 107) were collected during a field campaign in 2013, along the main flow line of Oued Mya, 67 piezometers tap the phreatic aquifer, 32 wells tap the CT aquifer and 8 boreholes tap the CI aquifer (Fig. 3).
19- The Reference added Line 112 : Scatchard and Guggenheim…. Phreeqc was used to check minerals / solution equilibria using the specific interaction
theory (SIT), i.e. the extension of Debye-Hückel law by Scatchard and Guggenheim incorporated recently in Phreeqc 3.0 (Parkhurst and Appelo, 2013).
20- The whole paragraph has been modified Line 119 : The Inverse modeling…… Inverse modeling involves designing a list of scenarios (modelling setups) that take into
account the most plausible combinations of geochemical processes that are likely to occur in our system. For example, the way to identify whether calcite dissolution/precipitation is relevant or not consists of solving the inverse problem under two alternate scenarios: (1) considering a geochemical system in which calcite is present, and (2) considering a geochemical system without calcite. After simulating the two scenarios, it is usually possible to select the setup that gives the best results as the solution to the inverse modeling according to the fit between the modeled and observed values.
21- It has been rephrased Line 129 : Samples are… Samples are ordered according to an increasing electric conductivity (EC), and this is
assumed to provide an ordering for increasing salt content. In both phreatic and CT aquifers, temperature is close to 25 °C, while for CI aquifer, temperature is close to 50 °C. The values presented in tables 1 to 5 are raw analytical data that were corrected for defects of charge balance before computing activities with Phreeqc.
22- It has been rephrased Line 141 : The facies of the Phreatic aquifer … Respectively, CaSO4, Na2SO4, MgSO4 and NaCl are the most dominant chemical species
(minerals) that are present in the phreatic waters. This sequential order of solutes is comparable to that of other groundwater occurring in North Africa, and especially in the neighboring area of the chotts (depressions where salts concentrate by evaporation) Merouane and Melrhir.
23- It has been replaced Line 148 : The salinity of the phreatic aquifer...

The salinity of the phreatic aquifer varies considerably depending on the location (namely, the distance from wells or drains) and time (due to the influence of irrigation) (Fig. 5a).
24- It has been rephrased Line 157 : The salinity of the Complexe Terminal… The salinity of the CT (Mio-pliocene) aquifer (Fig. 5b) is much lower than that of the Phr
aquifer, and ranges from 1 to 2 g/L; 25- It has been rephrased Line 177 : No significant… No significant saturation indices’ evolution from the south to the north upstream and
downstream of Oued Mya. 26- It has been rephrased Line 193 : For most of the sampled… [Na+]/[Cl-] ratio is from 0:85 to 1:26 for CI aquifer, from 0:40 to 1:02 for the CT aquifer and
from 0:13 to 2:15 for the Phr aquifer. 27- I wonder whether it could be useful to add this line to the plots of figure 10 Line 202 :…the seawater mole ratio (0,858), … There is a star * in the plot, and the values are given in the caption of figure 10, but the
values are very close to the 1:1 line and masked by samples. 28- It has been rephrased Line 209 : In these aquifers,… In the CI, CT and Phr aquifers, calcium originates both from carbonate and sulfate (Fig. 11
and 12). Three samples from CI aquifer are close to the [Ca2+]/[HCO3–] 1:2 line, while calcium sulfate dissolution explains the excess of calcium. However, nine samples from phreatic aquifer are depleted in calcium, and plot under the [Ca2+]/[HCO3–] 1:2 line.
29- Recall whether this linement has a geological or hydrogeological importance. Line 227 : Waters located north of the Hassi Miloud to Sebkhet Safioune axis are more
enriched in heavy isotopes and therefore more evaporated. This is not a linement of hydrogeological importance, but results from anthropogenic
influence by irrigation. Far from Ouargla, there is no irrigation, while in the vicinity of Ouargla, irrigation waters are directly pumped in the CI and mostly CT aquifers, so these irrigation waters both evaporate and mix with Phr waters.
30- Symbol changed to constant Line 249 : Equation 1 31- It has been rephrased and the order of sentences modified Line 254 : There is only one sample… P115 is the only sample that appears on the straight evaporation line (Fig. 14). It should be considered as an outlier since the rest of the samples are all well alined on the logarithmic fit derived from the mixing line of Figure 13.

32- Equation 3 has been changed Line 266 : δmix = f1 × δ1 + f2 × δ2 δmix = f1 × δ1 + (f1 -1)× δ2 33- It has been rephrased
Line 296 : This values are dated… These values are dated back to November 1992 so they are old values and they are
considered high comparatively to what is expected to be found nowadays. 34- It has been rephrased. Line 290 : The comparison of these… These values are dated back to November 1992 so they are old values and they are
considered high comparatively to what is expected to be found nowadays. 35- The whole paragraph has been modified Line 292 : This value seems… Tritium content of precipitation was measured as 16 TU in 1992 on a single sample that
was collected from the National Agency for Water Resources station in Ouargla. A major part of this raifall evaporates back into the atmosphere that is unsaturated in moisture. Consequently, enrichment in tritium happens as water evaporates back.
36- It has been rephrased. Line 354 : In a decreasing order ... In a descending order of amount, halite, sylvite, gypsum and huntite are the minerals that
are the most involved in the dissolution process. 37- Reference added in the tables Tableau : In these tables, provide information about the reference system for Latitude and
Longitude. Moreover, some data are given with decimal digits. Is this physically significant?
The reference is UTM 31 projection for North Sahara 1959 (CLARKE 1880 ellipsoid). The decimal digits are not physically significant, and simply indicative to locate sampling sites.
Best regards Slimani Rabia