Genetic Deletion of Transglutaminase 2 Does Not Rescue the Phenotypic Deficits Observed in R6/2 and...
18
Genetic Deletion of Transglutaminase 2 Does Not Rescue the Phenotypic Deficits Observed in R6/2 and zQ175 Mouse Models of Huntington’s Disease Liliana B. Menalled 1 , Andrea E. Kudwa 1 , Steve Oakeshott 1 , Andrew Farrar 1 , Neil Paterson 1 , Igor Filippov 1 , Sam Miller 1 , Mei Kwan 1 , Michael Olsen 1 , Jose Beltran 1 , Justin Torello 1 , Jon Fitzpatrick 1 , Richard Mushlin 1 , Kimberly Cox 1 , Kristi McConnell 1 , Matthew Mazzella 1 , Dansha He 1 , Georgina F. Osborne 2 , Rand Al-Nackkash 2 , Gill P. Bates 2 , Pasi Tuunanen 3 , Kimmo Lehtimaki 3 , Dani Brunner 1 , Afshin Ghavami 1 , Sylvie Ramboz 1 , Larry Park 4 , Douglas Macdonald 4 , Ignacio Munoz-Sanjuan 4 , David Howland 4 * 1 PsychoGenics Inc., Tarrytown, New York, United States of America, 2 Department of Medical and Molecular Genetics, King’s College London, London, United Kingdom, 3 Charles River Discovery Research Services, Kuopio, Finland, 4 CHDI Management/CHDI Foundation, Princeton, New Jersey, United States of America Abstract Huntington’s disease (HD) is an autosomal dominant, progressive neurodegenerative disorder caused by expansion of CAG repeats in the huntingtin gene. Tissue transglutaminase 2 (TG2), a multi-functional enzyme, was found to be increased both in HD patients and in mouse models of the disease. Furthermore, beneficial effects have been reported from the genetic ablation of TG2 in R6/2 and R6/1 mouse lines. To further evaluate the validity of this target for the treatment of HD, we examined the effects of TG2 deletion in two genetic mouse models of HD: R6/2 CAG 240 and zQ175 knock in (KI). Contrary to previous reports, under rigorous experimental conditions we found that TG2 ablation had no effect on either motor or cognitive deficits, or on the weight loss. In addition, under optimal husbandry conditions, TG2 ablation did not extend R6/2 lifespan. Moreover, TG2 deletion did not change the huntingtin aggregate load in cortex or striatum and did not decrease the brain atrophy observed in either mouse line. Finally, no amelioration of the dysregulation of striatal and cortical gene markers was detected. We conclude that TG2 is not a valid therapeutic target for the treatment of HD. Citation: Menalled LB, Kudwa AE, Oakeshott S, Farrar A, Paterson N, et al. (2014) Genetic Deletion of Transglutaminase 2 Does Not Rescue the Phenotypic Deficits Observed in R6/2 and zQ175 Mouse Models of Huntington’s Disease. PLoS ONE 9(6): e99520. doi:10.1371/journal.pone.0099520 Editor: David R. Borchelt, University of Florida, United States of America Received March 26, 2014; Accepted May 13, 2014; Published June 23, 2014 Copyright: ß 2014 Menalled et al. This is an open-access article distributed under the terms of the Creative Commons Attribution License, which permits unrestricted use, distribution, and reproduction in any medium, provided the original author and source are credited. Data Availability: The authors confirm that all data underlying the findings are fully available without restriction. All data are included within the paper and its Supporting Information files. Funding: CHDI Foundation is a privately-funded not-for-profit biomedical research organization exclusively dedicated to discovering and developing therapeutics that slow the progression of Huntington’s disease. CHDI Foundation conducts research in a number of different ways; for the purposes of this manuscript, research was conducted at the contract research organizations PsychoGenics, Inc. and Charles River Discovery Research Services under a fee-for- service agreement, and at Kings College London under a sponsored research agreement. The authors listed all contributed to the conception, planning, and direction of the research; the specific roles of each author is outlined in the ‘author contributions’ section. Competing Interests: The authors have declared that no competing interests exist. DH, IMS, LP and DM are employed by CHDI Management, Inc., as advisors to CHDI Foundation, Inc. LM, AK, SO, AF, NP, IF, SM, MK, MO, JB, JT, JF, RM, KC, KMC, MM, DH, DB and SR are employed by PsychoGenics, Inc. PT and KL are employed by Charles River Research Services. There are no patents, products in development or marketed products to declare. This declaration does not alter the authors’ adherence to all PLoS ONE policies regarding sharing data and materials. * Email: [email protected] Introduction Tissue transglutaminase 2 (TG2; TGM2; human Gene ID# 7052) is a multi-functional enzyme primarily known for its calcium-dependent intra- and intermolecular cross-linking activity via isopeptide bond formation between glutamine and lysine residues [1]. TG2 has also been shown to have other enzymatic activities, such as GTPase [2], ATPase [3]and isomerase [4] activities. Genetic deletion of TG2 in mice has suggested a role for TG2 activity in mitochondrial energy function [5]. Additionally, TG2 over-activity has been associated with inflammatory diseases such as celiac disease, infectious diseases, cancer, and neurode- generative diseases such as Huntington’s disease (HD) [6–9]. HD is a genetic, autosomal dominant, progressive neurodegen- erative disorder caused by the expansion of the CAG trinucleotide repeat found in the huntingtin gene; when the repeat number exceeds 39, individuals will develop HD within an normal lifespan [10]. Clinically, the disorder is characterized by motor and cognitive deficits as well as, psychiatric problems. Histopatholog- ically, the disorder is characterized by striatal and cortical atrophy, formation of intracellular huntingtin aggregates, and gene expression changes [10]. TG2 expression and transglutaminase activity have both been demonstrated to be increased in HD patients [11–13] and in HD mouse models [14,15], which suggests a correlation with HD pathology. Additionally, genetic deletion of TG2 in two mouse models of HD, R6/1 and R6/2, resulted in improved phenotypes PLOS ONE | www.plosone.org 1 June 2014 | Volume 9 | Issue 6 | e99520
-
Upload
independent -
Category
Documents
-
view
3 -
download
0
Transcript of Genetic Deletion of Transglutaminase 2 Does Not Rescue the Phenotypic Deficits Observed in R6/2 and...

Genetic Deletion of Transglutaminase 2 Does Not Rescuethe Phenotypic Deficits Observed in R6/2 and zQ175Mouse Models of Huntington’s DiseaseLiliana B. Menalled1, Andrea E. Kudwa1, Steve Oakeshott1, Andrew Farrar1, Neil Paterson1,
Igor Filippov1, Sam Miller1, Mei Kwan1, Michael Olsen1, Jose Beltran1, Justin Torello1, Jon Fitzpatrick1,
Richard Mushlin1, Kimberly Cox1, Kristi McConnell1, Matthew Mazzella1, Dansha He1,
Georgina F. Osborne2, Rand Al-Nackkash2, Gill P. Bates2, Pasi Tuunanen3, Kimmo Lehtimaki3,
Dani Brunner1, Afshin Ghavami1, Sylvie Ramboz1, Larry Park4, Douglas Macdonald4,
Ignacio Munoz-Sanjuan4, David Howland4*
1 PsychoGenics Inc., Tarrytown, New York, United States of America, 2 Department of Medical and Molecular Genetics, King’s College London, London, United Kingdom,
3 Charles River Discovery Research Services, Kuopio, Finland, 4 CHDI Management/CHDI Foundation, Princeton, New Jersey, United States of America
Abstract
Huntington’s disease (HD) is an autosomal dominant, progressive neurodegenerative disorder caused by expansion of CAGrepeats in the huntingtin gene. Tissue transglutaminase 2 (TG2), a multi-functional enzyme, was found to be increased bothin HD patients and in mouse models of the disease. Furthermore, beneficial effects have been reported from the geneticablation of TG2 in R6/2 and R6/1 mouse lines. To further evaluate the validity of this target for the treatment of HD, weexamined the effects of TG2 deletion in two genetic mouse models of HD: R6/2 CAG 240 and zQ175 knock in (KI). Contraryto previous reports, under rigorous experimental conditions we found that TG2 ablation had no effect on either motor orcognitive deficits, or on the weight loss. In addition, under optimal husbandry conditions, TG2 ablation did not extend R6/2lifespan. Moreover, TG2 deletion did not change the huntingtin aggregate load in cortex or striatum and did not decreasethe brain atrophy observed in either mouse line. Finally, no amelioration of the dysregulation of striatal and cortical genemarkers was detected. We conclude that TG2 is not a valid therapeutic target for the treatment of HD.
Citation: Menalled LB, Kudwa AE, Oakeshott S, Farrar A, Paterson N, et al. (2014) Genetic Deletion of Transglutaminase 2 Does Not Rescue the Phenotypic DeficitsObserved in R6/2 and zQ175 Mouse Models of Huntington’s Disease. PLoS ONE 9(6): e99520. doi:10.1371/journal.pone.0099520
Editor: David R. Borchelt, University of Florida, United States of America
Received March 26, 2014; Accepted May 13, 2014; Published June 23, 2014
Copyright: � 2014 Menalled et al. This is an open-access article distributed under the terms of the Creative Commons Attribution License, which permitsunrestricted use, distribution, and reproduction in any medium, provided the original author and source are credited.
Data Availability: The authors confirm that all data underlying the findings are fully available without restriction. All data are included within the paper and itsSupporting Information files.
Funding: CHDI Foundation is a privately-funded not-for-profit biomedical research organization exclusively dedicated to discovering and developingtherapeutics that slow the progression of Huntington’s disease. CHDI Foundation conducts research in a number of different ways; for the purposes of thismanuscript, research was conducted at the contract research organizations PsychoGenics, Inc. and Charles River Discovery Research Services under a fee-for-service agreement, and at Kings College London under a sponsored research agreement. The authors listed all contributed to the conception, planning, anddirection of the research; the specific roles of each author is outlined in the ‘author contributions’ section.
Competing Interests: The authors have declared that no competing interests exist. DH, IMS, LP and DM are employed by CHDI Management, Inc., as advisors toCHDI Foundation, Inc. LM, AK, SO, AF, NP, IF, SM, MK, MO, JB, JT, JF, RM, KC, KMC, MM, DH, DB and SR are employed by PsychoGenics, Inc. PT and KL are employedby Charles River Research Services. There are no patents, products in development or marketed products to declare. This declaration does not alter the authors’adherence to all PLoS ONE policies regarding sharing data and materials.
* Email: [email protected]
Introduction
Tissue transglutaminase 2 (TG2; TGM2; human Gene ID#7052) is a multi-functional enzyme primarily known for its
calcium-dependent intra- and intermolecular cross-linking activity
via isopeptide bond formation between glutamine and lysine
residues [1]. TG2 has also been shown to have other enzymatic
activities, such as GTPase [2], ATPase [3]and isomerase [4]
activities. Genetic deletion of TG2 in mice has suggested a role for
TG2 activity in mitochondrial energy function [5]. Additionally,
TG2 over-activity has been associated with inflammatory diseases
such as celiac disease, infectious diseases, cancer, and neurode-
generative diseases such as Huntington’s disease (HD) [6–9].
HD is a genetic, autosomal dominant, progressive neurodegen-
erative disorder caused by the expansion of the CAG trinucleotide
repeat found in the huntingtin gene; when the repeat number
exceeds 39, individuals will develop HD within an normal lifespan
[10]. Clinically, the disorder is characterized by motor and
cognitive deficits as well as, psychiatric problems. Histopatholog-
ically, the disorder is characterized by striatal and cortical atrophy,
formation of intracellular huntingtin aggregates, and gene
expression changes [10].
TG2 expression and transglutaminase activity have both been
demonstrated to be increased in HD patients [11–13] and in HD
mouse models [14,15], which suggests a correlation with HD
pathology. Additionally, genetic deletion of TG2 in two mouse
models of HD, R6/1 and R6/2, resulted in improved phenotypes
PLOS ONE | www.plosone.org 1 June 2014 | Volume 9 | Issue 6 | e99520

including reduced neuronal cell death, improved motor perfor-
mance, and prolonged survival [16,17]. These reports led us to
initiate a medicinal chemistry program targeting the transgluta-
minase activity of TG2 as a potential therapeutic strategy for the
treatment of HD [18,19]. This program was recently terminated
due to the lack of tractability of our TG2 inhibitors to
pharmacologically modulate this enzyme in the brain. However,
given the existing data derived from the genetic studies, we wanted
to extend the validation of this target for the treatment of HD. We
therefore repeated this study design with the R6/2 mouse model
[20] as well as the zQ175 KI mouse model [21,22] to investigate
the molecular, behavioral and pathophysiological association
between TG2 and HD by crossing these two lines with a TG2
knockout (KO) mouse [23]. These KO mice are viable, fertile and
do not present any abnormal phenotypes [23]. The behavioural
effect of genetic depletion of TG2 was examined using the
PhenoCube system, the procedural water T-maze test and a Go/
No-go paradigm. In addition, body weight and survival were
examined. We also used molecular and imaging techniques to
further characterize the phenotypes of the double mutants.
In contrast to previously published findings [16,17], we report
here that the genetic deletion of TG2 in either the R6/2
transgenic or zQ175 KI mice did not improve motor, cognitive,
molecular, histological, or lifespan phenotypes, indicating that
TG2 expression is not a determinant of disease progression in
these models of HD.
Materials and Methods
1. AnimalsAnimals were bred in the CHDI colonies at the Jackson
laboratories. Experimental mice were generated after two succes-
sive matings. The R6/2 CAG 2406TG2 KO line (CHDI-
80000024-1) was generated by crossing R6/2 CAG 240 (CHDI-
80000004-1, R6/2, C57Bl/6J) ovarian-transplanted females with
TG2/2 (CHDI-80000013-1, C57Bl/6J; [23]) male mice. Dr
Graham kindly provided us with the TG2 (+/2) animals to
generate the crosses. The R6/2 TG2+/2 males offspring
generated from that cross were then bred with TG2+/2 female
mice. From this second cross, we were able to generate littermates
of all genotype combinations, namely: R6/2, R6/2 TG2+/2,
R6/2 TG22/2, WT (wild type), TG2+/2 (heterozygous TG2
knockout) and TG22/2 (homozygous TG2 knockout). To
generate the zQ1756TG2 KO line (CHDI-80000025-1), zQ175
HET (HET, CHDI-80000015-1, C57Bl/6J) females were bred
with TG22/2 male mice (CHDI-80000013-1). zQ175 HET
TG2+/2 females and males generated from that cross were then
crossed which allowed the generation of littermates of all genotype
combinations, namely: HOM (zQ175 HOM), HOM TG2+/2,
HOM TG22/2, HET (zQ175 HET), HET TG2+/2, HET
TG22/2, WT, TG2+/2 and TG22/2). At 3 weeks of age,
animals were weaned by sex and litter, ear tagged for identification
and tail samples were collected for genotyping. At 4 weeks of age,
animals were pooled into larger groups by sex and genotype.
Genotypes were determined by polymerase chain reaction (PCR).
CAG repeat lengths were measured by Laragen (Los Angeles, CA,
USA) using standard protocols and Genemapper software as
previously described [24]. The average CAG repeat length in the
R6/2 mice included in the behavioral cohort from the R6/
26TG2 KO line was 247.83 (S.D. = 10.54). The average CAG
repeat length of the zQ175 HOM and HET mice from the
zQ1756TG2 KO line included in the behavioral cohort was
187.58 (S.D. = 6.05).
2. Ethics statementThis study was carried out in strict accordance with the
recommendations in the Guide for the Care and Use of
Laboratory Animals, NRC (2010). The protocols were approved
by the Institutional Animal Care and Use Committee of
PsychoGenics, Inc., an AAALAC International accredited institu-
tion (Unit #001213).
3. HusbandryAt Jackson laboratories, animals were housed in ventilated
caging (Thoren Caging System, Inc.) with shaving bedding in
14:10 light-dark cycle.
R6/26TG2 KO line: animals arrived at PsychoGenics Inc
(Tarrytown, NY) at around 4 weeks of age. Mice were transferred
from the shipping crates to opti-RAT cages (cage square inches:
144; Animal Care Systems) in the same housing groups as at the
Jackson laboratories (6–8 genetically homogenous animals per
cage).
zQ1756TG2 KO line: animals arrived at PsychoGenics at
around 24/25 weeks of age. Mice assigned to behavioral
experiments were transferred from the shipping crates to opti-
RAT cages (Animal Care Systems) in the same housing groups as
at the Jackson laboratories (4–6 genetically homogenous animals
per cage). Animals assigned to molecular experiment were
transferred from shipping crates to opti-MICE cages (cage square
inches: 75; Animals Care Systems).In all cases, a scope of bedding
from the crate was transfer into the opti cage upon arrival. To
provide a moderate level of environmental enrichment, opti-Rat
contained Enviro-dri bedding, two tunnels and 2 nylon bones
while opti-Mice cages contained also Enviro-dri bedding, a tunnel
and a nylon bone. Animals had free access to food (Purina 5001)
and water unless otherwise specified. Animals were housed under
controlled temperature (20u–24uC), humidity (30–70%) and
lighting conditions (12:12 light-dark cycle). Animals from the
R6/26TG2 KO line also received supplemental wet feed from 16
weeks of age onwards.
4. Body weightMice from the R6/26TG2 KO line and from the zQ1756TG2
KO line were weighed weekly from 4 weeks of age until death and
from 24 to 52 weeks of age, respectively.
5. SurvivalMice were monitored upon arrival at PsychoGenics routinely,
with a minimum of 2 health checks per day. Data were collected
for survival analysis which included only animals either found
dead or euthanized due to clear morbidity (failure to right
themselves after 30 s). Once all the R6/2 mice were deceased (at
26 weeks), all of the remaining WT mice were sacrificed. Animals
were euthanized either by decapitation or CO2 exposure,
following the AVMA Guidelines for Euthanasia for Animals:
2007 Edition.
6. Behavioral evaluationExperimenters conducting behavioral experiments were blind to
the genotype. A longitudinal design was used to evaluate the mice
from the R6/26TG2 KO line in the PhenoCube system at
around 8, 12 and 16 weeks of age. At 14 weeks of age, mice were
evaluated in the procedural water T-maze test. Survival was
evaluated in this cohort during the course of the behavioral
evaluation. Sample sizes are presented in Table 1.
Animals from the zQ1756TG2 KO line were examined in the
PhenoCube system at around 27–28 weeks of age. After testing
Transglutaminase 2 and Huntington’s Disease
PLOS ONE | www.plosone.org 2 June 2014 | Volume 9 | Issue 6 | e99520

Ta
ble
1.
Sum
mar
yo
fR
6/26
TG
2co
ho
rts.
Ge
no
typ
eW
TT
G2
+/2
TG
22
/2R
6/2
R6
/2T
G2
+/2
R6
/2T
G2
2/2
Se
xM
FM
FM
FM
FM
FM
F
Co
ho
rt1
:P
he
no
Cu
be
/Tm
az
e,
Su
rviv
al
16
16
16
15
16
14
14
13
16
16
15
16
Co
ho
rt2
:q
PC
Ra
na
lysi
s-
ag
gre
ga
tio
na
ssa
y*
56
(3)
6(4
)6
(4)
7(4
)5
(4)
66
6(5
)6
(5)
66
Co
ho
rt3
:M
RI
vo
lum
etr
icst
ud
y6
66
66
66
66
66
6
*H
alf
of
the
cort
ex
and
the
stri
atal
tiss
ue
sco
llect
ed
fro
me
ach
anim
alw
ere
use
dfo
rre
alti
me
qP
CR
anal
ysis
.T
he
oth
er
hal
fco
rte
xw
asu
sed
inth
eag
gre
gat
ion
assa
y.T
he
nu
mb
ers
inb
rack
ets
ind
icat
eth
esa
mp
lesi
zeu
sed
for
inth
eag
gre
gat
ion
assa
yw
he
nit
was
dif
fere
nt
fro
mth
eo
ne
use
din
qP
CR
stu
die
s.d
oi:1
0.1
37
1/j
ou
rnal
.po
ne
.00
99
52
0.t
00
1
Ta
ble
2.
Sum
mar
yo
fzQ
17
56T
G2
coh
ort
s.
Ge
no
typ
eW
TT
G2
+/2
TG
22
/2H
ET
HE
TT
G2
+/2
HE
TT
G2
2/2
HO
MH
OM
TG
2+/
2H
OM
TG
22
/2
Se
xM
FM
FM
FM
FM
FM
FM
FM
FM
F
Co
ho
rt1
:P
he
no
Cu
be
12
12
00
61
21
21
20
01
21
89
12
00
57
Su
bse
tA
fro
mco
ho
rt1
:Tm
az
ea
nd
MR
Iv
olu
me
tric
stu
dy
66
00
66
66
00
66
66
00
56
Su
bse
tB
fro
mco
ho
rt1
:G
o/n
og
o6
60
00
66
60
06
60
00
00
0
Co
ho
rt2
:q
PC
Ra
na
lysi
s-
ag
gre
ga
tio
na
ssa
y*
3(2
)4
(3)
6(3
)6
(3)
6(3
)6
(3)
6(3
)6
(3)
6(3
)6
(3)
6(3
)6
(3)
00
00
00
*H
alf
of
the
cort
ex
and
the
stri
atal
tiss
ue
sco
llect
ed
fro
me
ach
anim
alw
ere
use
dfo
rre
alti
me
qP
CR
anal
ysis
.T
he
oth
er
hal
fst
riat
um
and
cort
ex
we
reu
sed
inth
eag
gre
gat
ion
assa
y.T
he
nu
mb
er
inb
rack
ets
ind
icat
es
the
sam
ple
size
use
dfo
rin
the
agg
reg
atio
nas
say
wh
en
itw
asd
iffe
ren
tfr
om
the
on
eu
sed
inq
PC
Rst
ud
ies.
HO
M;z
Q1
75
HO
Mm
ice
,H
ET:
zQ1
75
HET
.d
oi:1
0.1
37
1/j
ou
rnal
.po
ne
.00
99
52
0.t
00
2
Transglutaminase 2 and Huntington’s Disease
PLOS ONE | www.plosone.org 3 June 2014 | Volume 9 | Issue 6 | e99520

was complete, animals were split in 2 cohorts, one tested on the
procedural water T-maze test (28–29 weeks of age) and the other
on the Go/No-go operant paradigm from 32 to 34 weeks of age
(sample size presented in Table 2).
One-two weeks after animals’ arrival to PGI, animals were
injected with sterile transponders (T-IS 8010 FDX-B, Datamars
SA) under 2% isoflurane inhalation anesthesia.
6.1 PhenoCube System. PhenoCube experiments were
conducted using modified IntelliCage units (New Behavior AG),
each with a camera mounted on top of the cage allowing for
computer vision analysis. Each cage consisted of 4 corners with an
area separated from the main arena, containing nosepokes with
respective water bottles. In the central area, there were three types
of climbing structures (two rods, a cubic central object and a three
step staircase) providing enriched topography all within a
rectangular housing unit. The corners were freely accessible
through tunnels, which also serve as radio frequency identification
(RFID) chip readers. Within each corner were two small recessed
openings which allowed access to two water bottles situated in
each corner. Access to the bottles was controlled by retractable
doors controlled by a computer. Infra-red sensors detected
nosepokes. While water was only available within the corners
(with free or conditional access depending on the experimental
protocol), food (14 mg dustless precision pellets, BioServ, NJ) was
provided ad libitum on the cage floor. Mice were maintained on a
12:12 light/dark cycle, with red light during the dark cycle,
allowing video capture (sample size provided in Table 1 and
Table 2). The light intensity under red light was recorded at 7 lux
using a photographic bandpass filter (LDP LLC, NJ) that
eliminates long wavelength light frequencies not visible to mice
[25]. Computer Vision analysis of the videos taken during the
testing sessions tracked the movement and location of the mice in
each cage generating data which included total distance travelled
by the mice, total time immobile, locomotion, clustering, as well as
rearing and climbing.
Following a period of water deprivation (16 hrs), mice were
tested in the PhenoCube for 72 hrs sessions, initially under the
Habituation protocol (6 hrs) and the remaining time under the
Alternation protocol. Mice were removed from the experiment if
the mouse did not lick and data from these mice were excluded
from analysis. All R6/2 mice and corresponding control mice
received supplemental HydroGel(ClearH20, ME) during the
testing sessions at 16 weeks of age to ensure proper hydration.
Habituation: In this phase water was freely available in all four
corners (Figure S1).
Alternation: During this phase subjects were required to
alternate visits between two of the four corners (active corners)
in order to gain access to water. Each mouse was assigned two
adjacent active corners at random. Only one of the two nosepokes
was activated in each corner, such that mice had to nosepoke on
the left side in order to gain access to water in the right corner, or
nosepoke to the right in the left corner (see Figure S1). After a
correct alternation, a nosepoke in the correct recess resulted in the
door opening and allowing access to the water bottle on that side.
After 8 seconds, the door gently closed, preventing further access
to water within a given visit. No penalty was imposed for initially
nosepoking on the incorrect side.
6.2 Procedural water T-maze test. Mice were tested in T-
mazes constructed of black Plexiglas (locally constructed at
PsychoGenics, Inc, sample size presented in Table 1 and
Table 2). Arms were 33 cm high and 10 cm wide, each arm was
49 cm long. Testing was performed in a dimly-lit (approximately
15 lux) room equipped with a video camera (mounted above the
T-maze) and a computer and monitor. The monitor screen was
covered with red transparent film to minimize light emission. The
T-maze was filled with water at 2561uC, rendered opaque with
Tempura non-toxic white paint. At one end of the cross-piece of
the ‘T’, a platform was located approximately 0.5 cm below the
level of the water.
In acquisition training, mice were placed in the stem of the
maze and allowed to make a choice to swim into either the right or
left arm to reach the escape platform, with the platform location
held constant for each mouse during acquisition. A choice was
defined as entry into either the left or right arm, without
necessarily reaching the escape platform. Failure to leave the
stem of the T-maze was defined as ‘no-choice’. Any mouse that
failed to reach the platform within the maximum trial duration
(60 s) was placed directly onto the platform. Once an animal
reached or was placed on the platform, the animal was allowed to
remain there for 30 s. Animals received 8 trials per day, for a
maximum of 12 days, with an inter-trial interval of approximately
15 min. The performance criterion was set at achieving 6 or more
correct trials per day for 2 consecutive days. Up to 10 days of
training were provided to achieve criterion. Once criterion was
achieved animals progressed to reversal testing on an individual
basis. In this phase the platform was placed in the opposite choice
arm. Reversal performance was assessed for 6 days. Mice were
monitored at all times when in the maze.
6.3 Go/No-go. Mice were tested in mouse operant chambers
(Med Associates, VT) measuring 22 cm long 618 cm wide, with
13 cm high walls (sample size presented in Table 2). Each
chamber was equipped with a nosepoke recess, which could be
illuminated by a small embedded light-emitting diode (LED),
located centrally on the wall opposite the food magazine.
Reinforcement was provided by time-limited access to a dipper
containing evaporated milk (Carnation, OH). The hardware was
controlled and all events were recorded by the Med-PC IV
software package.
Prior to training, mice were food restricted and individually
maintained at 85% of their free feeding body weights by providing
them with pre-weighed rations of rodent chow on a daily basis.
Initial training. Following food restriction and two days of
magazine training, all animals were trained to nosepoke via a
simple free operant procedure, in which nosepoking was
reinforced with 4 s access to an evaporated milk reinforcer on a
response-initiated fixed-interval 20 s (FI20) schedule. The illumi-
nation of the nosepoke recess and houselight (light or dark) was
counterbalanced across animals in each genotype, with the lights
either on or off throughout the 40 min session. No reinforcement
was delivered without a nosepoke. Animals were trained to a
criterion, requiring them to obtain 40 reinforcers across two
consecutive sessions, after which mice received one additional
session of FI20 training.
Discrimination training. Discrimination training sessions fol-
lowed completion of initial instrumental training. Discrimination
sessions were also 40 min in duration, presenting the animals with
both potentially reinforced and unreinforced periods, indicated by
the illumination state of the nosepoke recess (the houselight was
not used during this phase). The light condition presented in initial
training indicated the reinforced state, such that animals were
required to learn to avoid responding in the novel, unreinforced
stimulus condition. No other source of illumination was utilized
during discrimination training. Discrimination sessions consisted
of 30 min of potentially reinforced time presented pseudoran-
domly in blocks of 30, 60, 90, 120 or 150 s, interspersed with
10 min of unreinforced time presented pseudorandomly in blocks
of 10, 20, 30 or 60 s. Nosepoking was reinforced during the
potentially reinforced periods on a response-initiated VI5 schedule
Transglutaminase 2 and Huntington’s Disease
PLOS ONE | www.plosone.org 4 June 2014 | Volume 9 | Issue 6 | e99520

with 3 s of access to the milk reinforcer, whereas nosepoking
during the unreinforced period had no programmed consequence.
Discrimination performance was indexed by a discrimination
ratio calculated by dividing the response rate in the reinforced
condition by the sum of the response rates in the reinforced and
the unreinforced conditions for each mouse for each session.
7. Tissue collectionCortical and striatal tissues were dissected from naı̈ve animals
from the R6/26TG2 KO line (n = 5–7 per genotype per sex, 12
weeks of age) and from the zQ1756TG2 KO line (n = 3–6 per
genotype per sex, 52 weeks of age zQ175_HOM animals were not
included). Tissues were kept frozen until processing. Half of the
cortex and the striatal tissues were used for real time qPCR
analysis. The other half cortex from the R6/26TG2 KO line and
the cortex and striatum from the zQ1756TG2 KO line were used
in the aggregation assay. For ex-vivo MRI studies, a second cohort
of naı̈ve mice from the R6/26TG2 line and the mice from
zQ1756TG2 KO line tested in the procedural water T-maze test
were perfused at 16 and 52 weeks of age respectively (Table 1 and
Table 2). In brief, mice were killed by deep anesthesia with
pentobarbital and transcardially perfused with 80 ml of heparin-
ized (2.5 units/ml) saline followed by 80 ml of ice-cold 4% PFA in
0.1M PBS. Brains within skull were postfixed in the same fixative
overnight and stored in solution of 0.01% sodium azide in 0.1M
PBs at 4uC. Before the ex-vivo T2-MRI analysis of the brains,
brains were rinsed with saline and embedded in perfluoropo-
lyether (FOMBLIN).
8. Quantification of transcriptsQuantification of transcripts was performed as described
previously by Menalled et al, [21]. The sample size used for each
cross is presented in Table 1 and Table 2. A summary of the steps
followed is described below.
Total RNA Extraction. Total mRNA was extracted using
RNeasy 96 Universal Tissue Kit for RNA isolation (Cat # 74881,
Qiagen, Valencia, CA). Total RNA bound to column membranes
was then treated with RNase-Free DNase set (Cat # 79254,
Qiagen, Valencia, CA), followed by washing steps with RW1 and
RPE buffers (provided with RNeasy 96 Universal Tissue Kit).
RNA was eluted with RNase-Free water.
Total RNA Quantification and Reverse
Transcription. To investigate the integrity of the RNA, 2 mL
of total RNA was run in 1% agarose gel. RNA was quantified
using Quan-iT RiboGreen RNA Kit (Cat # R11490, Invitrogen,
Carlsbad, CA) and analyzed with the SpectraMax Gemini XPS
fluorescent plate reader (Molecular Devices, Sunnyvale, CA).
Following the protocol previously described [21], one microgram
of total RNA was reverse transcribed into cDNA.
Quantitative PCR (qPCR). Five microliters of the diluted
cDNA were amplified with 12.5 mL 26FastStart Universal Probe
Master Rox (Cat # 04914058001, Roche Applied Science,
Indianapolis, IN), 0.5 mL Universal Probe Library Probe (Roche
Applied Science, Indianapolis, IN), 200 nM of gene specific
primer- HPLC purified (Sigma-Aldrich, St. Louis, MO) in 25 mL
reaction volume. The reactions were run on the ABI 7900HT
Sequence Detection System (Applied Biosystems, Foster City, CA).
qCPR conditions were 95uC for 10 min for activation of FastStart
Taq DNA Polymerase followed by 40 cycles of 95uC for
15 seconds and 60uC for 1 minute. For primers and Universal
Probe Library used for qPCR refer to Table 3).
qPCR Data Analysis. cDNAs from multiple reverse tran-
scription reactions were pooled together and used to create qPCR
standard curves and also served as a calibrator to normalize plate
to plate variations. To generate the standard curve, pooled cDNA
was serially diluted from 1:5 to 1:1000 in RNase-free water and
assayed in triplicate in each qPCR assay. The Ct values, number
of cycles required for the PCR amplicon detection to reach
threshold, were plotted against the logarithm value of dilution
samples and a linear trend line was obtained for each gene. Each
sample cDNA (diluted 1:10) was assayed in triplicates and the Ct
values averaged. Values which lie greater than 0.5 standard
deviation of the average were discarded. Relative quantity of the
PCR product (relative to the calibrator), the geometric means for
the 3 housekeeping genes and the relative levels of the target genes
were calculated as previously described [21]. Atp5b, Eif4a2 and Ubc
were used as housekeeping genes for the striatal analysis in the
R6/26TG2 KO study. Atp5b, Eif4a2 and Gadph were used in the
cortical analysis in the R6/2 CAG6TG2 KO study and in the
striatal analysis of the zQ1756TG2 KO study. The relative level
of the target gene was then normalized to age- and sex-matched
wild type control animals.
9. Tissue preparation and quantitative western blottingFrozen tissues were homogenized in ice cold modified RIPA
buffer (50 mM Tris HCl, pH 7.5, 1% IGEPAL CA630, 0.25%
SDS, 150 mM NaCl, 1 mM EDTA, 1 mM NaF, 100 mM
activated Na2VO3 and Roche Applied Science’s Complete
Protease Inhibitor cocktail) using 500 mL per 100 mg of tissue
with TissueLyser (Qiagen, Valencia, CA) and 5 mm stainless steel
beads (Cat # 69989, Qiagen, Valencia, CA). Once tissues were
disrupted, samples were allowed to incubate on ice for 30 min.
The homogenates were then centrifuged at 10,000RPM (Eppen-
dorf 5417R centrifuge) for 30 min at 4uC. The protein content
was determined using BioRad’s DC Assay Kit (Cat # 5000111,
Bio-Rad, Hercules, CA).
Protein samples were denatured in Laemmli buffer (Cat #1610737, Bio-Rad, Hercules, CA)/2-Mercapthoethanol (Cat #M3148, Sigma-Aldrich, St. Louis, MO) for 5 min at 95uC for TG2
and housekeeping proteins. Ten micrograms of denatured protein
samples were separated by 4–20% SDS-PAGE Criterion Gels (Cat
# 3450034, Bio-Rad, Hercules, CA). After electrophoresis,
proteins were transferred from gel to Hybond-LFP PVDF
membranes (Cat # RPN303LFP, GE Healthcare Bioscience,
Piscataway, NJ) by electroblotting. The protein-PVDF membranes
were rinsed briefly in 16Tris-buffered saline with 0.1% Tween 20
(TBST). Non-specific binding was blocked with 5% dried milk in
TBST for 1 hr. After a brief rinse in TBST, the blots were probed
with primary antibody prepared with 1% dried milk in TBST for
1 h at RT. Protein-PVDF blots were washed 1615 min followed
by 365 min washes with TBST. Protein-PVDF blots were then
incubated with secondary antibody prepared with 1% dried milk
in TBST (see Table 4 for dilution) for 1 h at RT. Protein-PVDF
blots were washed 1615 min followed by 165 min.
Antibody binding was detected using ECL Plus Western
Detection Kit (Cat # RPN2133, GE Healthcare Bioscience,
Piscataway, NJ) with a Typhoon 9410 scanner (GE Healthcare
Bioscience, Piscataway, NJ) using 457 nm blue laser for excitation
and 520 nm emission filter at 400 V.
qWestern data analysis. Total protein from whole brain of
C57BL6 mice was isolated and denatured at specific concentra-
tions as described above. These denatured protein aliquots (of the
same protein amount as target protein) served as calibrator to
normalized the gel to gel variations.
The scanned images from the Typhoon were analyzed with
ImageQuantTL software version 7.0 (GE Healthcare Bioscience,
Piscataway, NJ), band intensities were determined using the rolling
ball methods, file with band intensities was exported to EXCEL
Transglutaminase 2 and Huntington’s Disease
PLOS ONE | www.plosone.org 5 June 2014 | Volume 9 | Issue 6 | e99520

for further analysis. Within each image all the raw data values of
the band intensities were corrected with band intensity from
calibrator, this value was referred as corrected relative quantity,
calculation as follows:
Corrected Relative Quantity of Target Protein~
Raw Data ValueTarget� ��
Raw Data Valuecalibrator� �
Corrected Relative Quantity of Housekeeping Protein 1~
Raw Data Valuehousekeeping1� ��
Raw Data Valuecalibrator� �
Corrected Relative Quantity of Housekeeping Protein 2~
Raw Data Valuehousekeeping2� ��
Raw Data Valuecalibrator� �
Corrected Relative Quantity of Housekeeping Protein 3~
Raw Data Valuehousekeeping3� ��
Raw Data Valuecalibrator� �
Geometric mean for the three housekeeping protein was
calculated as follows:
Geometric mean~ relative quantity of housekeeping protein 1�ð
relative quantity of housekeeping protein 2�
relative quantity of housekeeping protein 3Þ 1=3ð Þ
Relative level of target protein (TG2 and endogenous HTT) was
calculated as follows:
Relative Level of Target Protein~Corrected Relative Quantity
of Target Protein=Geometric mean of housekeeping Proteins
Relative level of target gene was then normalized to that of wild
type (gender combined).
10. Measurement of polyQ aggregates by Seprion ligandELISA
A 2.5% lysate was prepared with the dissected cerebral cortex
from 12 week-old R6/26TG2 KO and 52- week-old
zQ1756TG2 KO (Table 1 and Table 2) in ice-cold RIPA buffer
by ribolysing in lysis matrix tubes 2630 sec at RT (Lysing matrix
D; MP Biomedicals, Solon, OH) and transferring to ice for 3–
Table 3. Quantitative Polymerase Chain Reaction (qPCR) information.
Mouse GeneID 59 Primer Sequence 39 Primer Sequence
Universal ProbeLibrary #
Bdnf II CCGGAGAGCAGAGTCCATT CTACCACCTCGGACAAATCC 21
Bdnf IV GCTGCCTTGATGTTTACTTTGA AAGGATGGTCATCACTCTTCTCA 31
Bdnf IX GCCTTTGGAGCCTCCTCTAC GCGGCATCCAGGTAATTTT 67
Cnr1 GGGCAAATTTCCTTGTAGCA GGCTCAACGTGACTGAGAAA 79
Drd1a AGGTTGAGCAGGACATACGC TGGCTACGGGGATGTAAAAG 88
Drd2 TGAACAGGCGGAGAATGG CTGGTGCTTGACAGCATCTC 17
Darpp32 CCACCCAAAGTCGAAGAGAC GCTAATGGTCTGCAGGTGCT 98
Pde10A GAAGGCTGACCGAGTGTTTC GGGATGGAGAGAAAGATAGGC 45
Glt1 GGTCATCTTGGATGGAGGTC ATACTGGCTGCACCAATGC 83
Htt TCTCATCAACCACACTGACCA GGGGGTTAAGTGCTTCGTG 77
Atp5b GGCACAATGCAGGAAAGG TCAGCAGGCACATAGATAGCC 77
Gadph CAATGTGTCCGTCGTGGATCT GTCCTCAGTGTAGCCCAAGATG N/A
Eif4A2 GCCAGGGACTTCACAGTTTC TTCCCTCATGATGACATCTCTTT 93
Ubc GACCAGCAGAGGCTGATCTT CCTCTGAGGCAGAAGGACTAA 11
doi:10.1371/journal.pone.0099520.t003
Table 4. Quantitative Western Blots Antibody information.
Mouse Gene ID Vendor Catalog # Host Antibody Dilution
TG2 Cell Signaling Technology 3557S rabbit 1:500
ATP5B Abcam ab14730 mouse 1:10000
EIF4A2 Abcam ab31218 rabbit 1:10000
GAPDH Cell Signaling Technology 2118 rabbit 1:10000
Anti-Rabbit IgG conjugated to HRP Cell Signaling Technology 7074 Goat 1:1000
Anti-Mouse IgG conjugated to HRP Cell Signaling Technology 7076 Goat 1:1000
doi:10.1371/journal.pone.0099520.t004
Transglutaminase 2 and Huntington’s Disease
PLOS ONE | www.plosone.org 6 June 2014 | Volume 9 | Issue 6 | e99520

5 min to cool before the last 30 sec ribolysing. Lysates were
centrifuged at 13,000 rpm for 2 min in a microfuge before they
were transferred to a fresh tube on ice. Samples either used
immediately or frozen on dry ice and stored at 280uC and used
within 24 h.
Homogenate (15 ml) was mixed with 3 ml 10% SDS followed by
62 ml water and made up to 100 ml with 20 ml of 56capture buffer
(Microsens Biotechnologies, UK). This was transferred to the well
of a Seprion ligand-coated ELISA plate (SEP1-96-01) and
incubated for 1 h at 23uC. The lysate was removed and the well
was washed 56 in PBS-T (PBS; 0.1% Tween) and 100 ml S830
primary antibody (diluted 1:2000 in conjugate buffer (150 mM
NaCl; 4% BSA (98% electrophoretic grade); 1% dried milk; 0.1%
Tween 20 in PBS) was added and incubated with shaking for 1 h
at 23uC. The washing step was repeated and 100 ml horse radish
peroxidase (HRP)-conjugated rabbit anti-goat secondary antibody
(DAKO, Denmark) (1:2000 in conjugation buffer) was added and
incubated for 45 min at 23uC. The washing step was repeated and
100 ml of TMB substrate (SerTec) (warmed to 23uC) was added
and incubated in the dark at RT for 30 min. Reactions were
terminated by the addition of 100 ml 0.5 M HCl and the
absorption at 450 nm was measured using a plate reader (Biorad,
UK).
11. Ex vivo T2-MRIMRI acquisitions from the brains collected from animals from
the R6/26TG2 KO cross (Table 1) were performed using a
horizontal 7 T magnet with bore size 200 mm (Bruker Biospin
GmbH, Karlsruhe, Germany) equipped with Bruker BGS12-S
gradient set (max. gradient strength 760 mT/m, bore 120 mm)
interfaced to a Bruker PharmaScan console (Bruker Biospin
GmbH, Karlsruhe, Germany) using a volume coil for transmission
and surface coil for receiving (Bruker Biospin GmbH, Karlsruhe,
Germany). T2-weighted MRI acquisitions from the brains
collected from the animals from the zQ1756TG2 KO cross
(Table 2), were performed with the use of a horizontal 7 T magnet
with inner bore diameter of 160 mm (Magnex Scientific Ltd.,
Oxford, UK) equipped with actively shielded Magnex gradient set
(max. gradient strength 400 mT/m, bore 100 mm) interfaced to a
Varian DirectDrive console. Linear RF volume-coil was used for
transmission and surface phased array coil for receiving (Rapid
Biomedical GmbH, Rimpar, Germany).
In all cases, for ex vivo determination of total brain, striatal and
cortical volumes, T2-weighted continuous multi-slice images
covering the whole brain (number of slices, 21) were acquired
using fast spin-echo sequence with TR = 4500 ms, echo train
length ETL = 4, effective TE = 37.7 ms, matrix size of 5126256
(zeropadded to 5126512), FOV of 30*30 mm2, and a slice
thickness of 0.6 mm, 4 averages. The acquired coronal images
were analyzed for total brain, striatal and cortical volumes using
an analysis program ran under MatLab [22].
12. Statistical analysisBody weight, PhenoCube and Go/No go test data were
evaluated using repeated measures analysis carried out with SAS
(SAS Institute Inc.) using Mixed Effect Models, based on the
likelihood estimation. The models were fitted using the procedure
PROC MIXED [26]. Main effects of HD Genotype, TG2
Genotype, sex as well as age, day/night cycle, light/dark training
condition, testing day (as appropriate) were evaluated and their
interactions were considered in all the models. Significant
interactions followed up with simple main effects.
In Go/No go the mean number of days to reach criterion in
initial training, as well as the mean of the response rates from the
final four discrimination sessions were similarly analyzed, but
without the repeated measure of test day.
T-maze test. Data for acquisition were analyzed using Statview
software (SAS Institute Inc.) with two-way ANOVA with the
factors HD Genotype and TG2 Genotype. In addition, the
proportion of mice acquiring the task each day was analyzed via
Kaplan-Meier analysis. For reversal testing, data were analyzed
via mixed two-way repeated-measures ANOVA with the between-
subject factors HD Genotype and TG2 Genotype and Days as
repeated measure.
Survival data was statistically analyzed via Kaplan-Meier
analysis.
Protein expression, gene expression, and ex vivo T2-MRI data
were evaluated using SAS Proc Mixed with no repeated statement
and significant interactions followed up with simple main effects.
In all cases an effect was considered significant if p,0.05.
All graphs, but body weight, represent data from male and
female animals combined. Data are expressed as mean 6 S.E.M.
Results
1. Characterization of transglutaminase 2 protein levels inR6/26TG2 knockout line
In order to confirm that the TG2 expression levels were reduced
both in the heterozygous (TG2+/2) and knockout (TG22/2)
mice, we performed western blotting on striatal lysates of 12-week-
old mice from these crosses (Figure 1). No significant differences in
the TG2 protein levels were detected between the WT and R6/2
mice. In the heterozygous TG2 animals, the protein level was
approximately 50% of the wild type level, with a slightly lower
protein level observed in the WTs compared to R6/2 mice (HD
Genotype6TG2 Genotype interaction: F(2,59) = 8.51, p,0.001,
simple main effects and post-hoc tests ps,0.05). As expected no
expression of TG2 protein was detected in the knockout animals
(simple main effects and post hocs, ps,0.0001).
2. TG2 depletion does not alter the body weight lossphenotype of R6/2 and zQ175 KI mice
R6/26TG2 KO line. From the various sublines of R6/2
mice, we selected the R6/2 CAG 240 which while presenting
robust deficits, offers a wider therapeutic window of intervention
compared to the R6/2 CAG 110 or R6/2 CAG 160 lines [27–29]
(manuscript in preparation). As expected from previous findings
obtained from R6/2 animals carrying approximately 240 CAGs
(manuscript in preparation, [27,28]), R6/2 mice were progres-
sively lighter than WT controls from 6 and 7 weeks of age, for
males and females respectively, although the effect was more
pronounced in the males (Figure 2A–B; HD Genotype6Sex6Age
interaction: F(15, 2173) = 11.02, p,0.0001; simple main effects: ps,
0.05). Total absence of TG2 protein resulted in a reduction in
body weight, independent of R6/2 genotype or sex, which reached
significance at 10, 11, 14–16 and 18–20 weeks of age, (TG2
Genotype6Age interaction: F(15,2173) = 98.52, p,0.0001; simple
main effects and post hocs for ages: ps,0.05).
zQ1756TG2 KO line. Consistent with the results in the R6/
2 transgenic line, the zQ175 HET and, particularly, the zQ175
HOM were progressively lighter than the corresponding WT
controls, with the effect being more pronounced in the males
(Figure 2C–D, males and females, respectively). The effect in the
males also reached significance at younger ages (29 and 26 weeks
of age, for HET and HOM mice, respectively) than in the females
(48 and 34 weeks of age, for zQ175 HET and HOM mice,
respectively;; HD Genotype6Sex6Age: F(50,1475) = 2.24, p,
0.0001; simple main effects: p,0.05). The TG2 KO male mice
Transglutaminase 2 and Huntington’s Disease
PLOS ONE | www.plosone.org 7 June 2014 | Volume 9 | Issue 6 | e99520

presented a significantly increased body weight when compared to
WT animals from 44 weeks of age (HD Genotype6TG2
Genotype6Sex6Age interaction: F(50,1475) = 3.28, p,0.0001; sim-
ple main effects and post-hocs, ps,0.05).
3. TG2 depletion does not impact the survival of HDmodel mice
R6/26TG2 KO line. WT mice had a normal life span during
the period examined, regardless of the level of TG2 protein. The
reduced lifespan characteristic of the R6/2 was not improved by
the TG2 protein level (Mean survival 6 S.E.M.: 18.8560.43
weeks, 18.9360.40 weeks and 17.4260.45 weeks for the R6/2,
R6/2 TG2+/2: and R6/2 TG22/2 respectively; Median
survival: 17.71, 19.26 and 16.86 weeks for the R6/2, R6/2
TG2+/2 and R6/2 TG22/2 respectively; HD Genotype log-
rank test, p,0.0001; TG2 Genotype log-rank test, p.0.8).
zQ1756TG2 KO line. HOM and HET animals from the
zQ1756TG2 cross displayed equivalent lifespan to the controls
during the period examined (data not shown).
4. TG2 depletion does not improve the deficits detectedin the R6/2 and zQ175 KI mice in PhenoCube System
R6/26TG2 KO line. Overall visit frequency: R6/2 showed a
progressive age-related decrease in activity when compared to
WTs in all the phases of the diurnal cycle with the exception of 8
week old mice during the light phase (Figure 3A; HD
Genotype6Cycle6Age interaction: F(2,319) = 16.50, p,0.0001;
simple main effects and post hocs, ps,0.05). Both partial or
complete reduction of the TG2 protein expression produced a
decrease in overall visit frequency during the dark phase regardless
of the status of the R6/2 transgene, mainly driven by male mice at
8 and 12 weeks of age (not shown, TG2 Genotype6Cycle
interaction: F(2, 177) = 4.24, p,0.05, simple main effect and post
hocs, ps,0.05; TG2 Genotype6Age6Sex interaction:
F(4,301) = 3.3, p,0.05; simple main effects and post hocs, ps,
0.05). As expected, mice displayed a marked increase in corner
visit frequency during the dark versus light periods of the diurnal
cycle irrespectively of the genotype (Cycle main effect:
F(1,133) = 433.07, p,0.0001).
Mean path length: As previously observed [24], a progressive
decrease in locomotion activity in the R6/2 mice was detected
when compared to the WT animals (Figure 3B; HD Genotype6Age interaction: F(2,36) = 24.13, p,0.0001; simple main effect and
post hocs, ps,0.05). While all animals presented the expected
higher levels of locomotion during the dark phase than light phase
of the diurnal cycle, this was not observed in the R6/2 mice at 16
weeks of age (HD Genotype6Cycle6Age interaction:
F(2,36) = 31.03, p,0.0001; simple main effect and post hocs, ps,
Figure 1. Transglutaminase 2 protein levels in R6/26TG2 KO line. A. TG2 expression levels in the striatum of 12 week old animals from theR6/26TG2 KO line (n = 11–12 per genotype). *p,0.05,***p,0.0001. See materials and methods’ section for details regarding the calculation of TG2protein expression levels. B. Westen blotting examples of striatal lysates of animals from the R6/26TG2 KO line probed with antibodies that recognizeTG2 and the housekeeping proteins.doi:10.1371/journal.pone.0099520.g001
Transglutaminase 2 and Huntington’s Disease
PLOS ONE | www.plosone.org 8 June 2014 | Volume 9 | Issue 6 | e99520

0.05). The partial or complete depletion of TG2 did not impact
the animals’ performance.
Percent alternations: R6/2 mice presented a decreased percent
alternations between corners where water could be obtained
(active corners) when compared to WT animals. This was
observed both during the light and dark phases of the diurnal
cycle, at 8 and 12 weeks of age, irrespectively of the TG2
expression level (Figure 3C; HD Genotype6Age6Cycle interac-
tion: F(1,141) = 34.36, p,0.0001; simple main effects and post hocs,
ps,0.05). As expected, during the light phase WT mice presented
a higher percentage of alternations than during the dark phase,
regardless of the age (simple main effects and post hocs, ps,0.05).
R6/2 mice, however, presented no differences in alternations
during the light phase at 8 weeks of age (simple main effects and
post hocs, ps,0.05). Interestingly, the percent alternations
displayed by R6/2 at 12 weeks of age were below chance during
the light phase. This is in alignment with an increased overall
repeat visits observed in R6/2 animals in the same cycle period
and age (data not shown). Surprisingly, the partial, but not the
total, depletion of the TG2 protein increased alternations in R6/2
mice at 12 weeks of age, mainly in the male mice (HD
Genotype6TG2 Genotype6Age interaction: F(2,132) = 3.34, p,
0.05; TG2 Genotype6Sex interaction: F(1,165) = 3.25, p,0.05;
simple main effects and post hocs, ps,0.05). Data for this measure
were not collected at 16 weeks of age since the alternation protocol
was not used for R6/2 mice at this age, due to their reduced
licking.
5. zQ1756TG2 KO lineOverall visit frequency: Both zQ175 HOM and HET mice
showed a significantly decreased visit frequency when compared to
the WT mice (Figure 4; HD Genotype main effect: F(2,110) = 6.72,
p,0.005). The absence of the TG2 protein produced a small but
significant increase of activity in HOM male mice, in the dark
phase of the cycle. In both female and male WT mice, the effect
was, instead, a significant decrease, observed during both phases in
females but only in the dark phase in males (HD Genotype6TG2
Genotype6Sex6Cycle interaction: F(2,16) = 4.11, p,0.05; simple
main effects and post hocs, ps,0.05). As expected, a marked
increase in corner visit frequency during the dark versus the light
Figure 2. Body weight curves. A–B. Mean body weights of mice from the R6/26TG2 KO line. A. Male mice (n = 14–16 per genotype). B. Femalemice (n = 13–16 per genotype). C–D Mean body weights of mice from the zQ1756TG2 KO line. A. Male mice (n = 5–6 per genotype). B. Female mice(n = 6–7 per genotype). *Significant differences R6/2 vs WT,*1significant differences HOM vs WT, *2significant differences HET vs. WT, #significant TG2genotype differences. WT: wild-type, TG2+/2: heterozygous TG2 knockout, TG22/2: homozygous TG2 knockout, HET: zQ175 HET HOM: zQ175 HOM.doi:10.1371/journal.pone.0099520.g002
Transglutaminase 2 and Huntington’s Disease
PLOS ONE | www.plosone.org 9 June 2014 | Volume 9 | Issue 6 | e99520

Figure 3. Behavioral data captured in the PhenoCube system as a function of genotype, age and light cycle phase in animals fromthe R6/26TG2 KO line. A. Overall visit frequency. B. Mean path length. C. Percent alternations (Data for this measure were not collected at 16weeks of age since R6/2 mice were not tested in this protocol due to reduced licking). *Significant HD genotype differences within each light phase,at each age; #: significant differences due to light phase in the diurnal cycle in the WT mice; ##significant differences due to light phase in the cycle
Transglutaminase 2 and Huntington’s Disease
PLOS ONE | www.plosone.org 10 June 2014 | Volume 9 | Issue 6 | e99520

periods was observed in all mice regardless of the genotype and sex
(Cycle main effect: F(1,110) = 802.22, p,0.0001).
6. TG2 depletion does not improve the cognitive deficitsof R6/2 and zQ175 KI mice
Procedural water T-maze test: R6/26TG2 KO and
zQ1756TG2 KO lines. The procedural water T-maze test
allows the evaluation of cognitive abilities of animals. Mice were
trained to find a submerged escape platform located in one of the
arms of the T-maze without the aid of visual/light cues.
Performance on this task is attributed primarily to striatal function.
R6/26TG2 KO line: 14 weeks of age. Acquisition phase.
R6/2 mice were impaired in the acquisition of the task relative to
WT animals. A significantly lower proportion of R6/2 mice
reached the acquisition performance criterion with successive days
of training compared to WT mice (Figure 5A; Log Rank test, p,
0.05). Consequently, R6/2 required a significantly higher average
number of days to reach the performance criterion relative to WT
mice (Figure 5B; HD Genotype main effect: F(1,123) = 25.74, p,
0.0001). The partial or complete depletion of TG2 protein had no
impact on these features.
Reversal phase. Animals progressed to reversal testing on an
individual basis once criterion was achieved in the acquisition
phase. From the R6/2 TG2+/2 mice, 2 mice did not reach
criterion even after 10 days of training and therefore were not
evaluated under the reversal conditions. Two out of 21 R6/2
TG2+/2 mice and 3 out of 23 R6/2 TG22/2 mice that
achieved criterion failed to complete 6 days of reversal testing due
to requiring more than 6 days to meet criterion in the acquisition
phase; consequently, their data were excluded from the reversal
phase. Performance in the reversal task phase improved over days
of testing regardless of genotype although, as expected, R6/2 mice
exhibited lower accuracy relative to WT mice as testing
progressed, with R6/2 mice performing worse on each day of
testing (Figure 6; HD Genotype6Session interaction:
F(5,590) = 8.12, p,0.0001). Notably, the complete absence of
TG2 protein further impaired the performance of the R6/2
female mice (HD Genotype xTG2 Genotype6Sex interaction:
F(2,118) = 4.90, p,0.05: simple main effects and post hocs, p,
0.05). No effect of the partial or complete depletion of the TG2
protein was detected in the male group.
zQ1756TG2 KO line: 28–29 weeks of age. Acquisition
phase. Although the zQ175 HOM required more days to reach
criterion when compared to WT, this difference did not reach
significance (Figure 7A–B). Consistent with the results in R6/2
mice, the complete ablation of TG2 did not impact the
performance of the animals in this phase.
Reversal phase. Similar to R6/2 mice, zQ175 HOM mice
exhibited impaired accuracy relative to WT, with WT mice
improving in performance at a higher rate than zQ175 HOM
mice (Figure 8, HD Genotype6Session interaction: F(10,292) = 3.36,
p,0.0001; simple main effects and post hocs, p,0.05). No deficits
were detected in the performance of the HET mice. In agreement
with our results in the R6/26TG2 KO line, TG2 deletion
significantly impaired performance on accuracy during reversal
learning, in this line however, this effect was observed regardless of
the zQ175 zygosity (TG2 Genotype main effect: F(1,59) = 4.29, p,
0.05).
Go/No go discrimination task – zQ1756TG2 KO
line. Since no cognitive deficits were detected in the zQ175
HET mice in the procedural water T-maze test, we extensively
evaluated the HET mice in other assays focusing on executive
function. Using a Go/No go discrimination task, we were able to
uncover important cognitive deficits in discrimination learning and
response inhibition in zQ175 HET mice (manuscript in prepara-
tion). For that reason we selected this assay to evaluate if TG2
ablation was able to modify the deficits observed in the zQ175
HET mice from 32 to 34 weeks of age.
Initial training. zQ175 HET mice required significantly more
training sessions in order to achieve the response acquisition
criterion of 40 reinforcers across two consecutive sessions (Figure 9;
HD Genotype main effect: F(1,31) = 13.40, p,0.001). The deletion
of TG2 had no significant effect on this measure.
Discrimination ratio. zQ175 HET mice exhibited an impair-
ment in discrimination performance relative to WT (Figure 10A;
HD Genotype main effect: F(1,31) = 127.07, p,0.0001). Moreover,
WT, but not zQ175 HET, mice significantly improved in their
discrimination performance over days of testing (HD Genotype6Session interaction: F(17,515) = 2.03, p,0.005; simple main effect,
ps,0.05). Deficits in discrimination performance in the HET mice
were detected from session 4 onward (simple main effect, ps,
0.05). Interestingly, knockout TG2 mice performed better than
TG2 wild type mice, regardless of zQ175 genotype (TG2 genotype
main effect, (1,32) = 6.00, p,0.05). There was also a significant
interaction between light/dark condition and session, with mice
trained with the stimulus light off for the reinforced condition
performing better in the first session (Stimulus6Session interac-
tion: F(17,515) = 1.95, p,0.05; data not shown).
for each age independently of genotype; ###significant differences due to light phase in the diurnal cycle in the R6/2 mice; ‘significant TG2genotype differences. WT: wild-type, TG2+/2: heterozygous TG2 knockout, TG22/2: homozygous TG2 knockout.doi:10.1371/journal.pone.0099520.g003
Figure 4. Overall visit frequency detected in the PhenoCubesystem as a function of genotype, age and light cycle phase inanimals from the zQ1756TG2 KO line. *Significant HD genotypedifferences regardless of the light phase (in the mean path length thedifferences were detected between HET and WT animals);##significant differences due to light phase in the cycle independentlyof genotype; ‘significant TG2 genotype differences (see results methodfor details). WT: wild-type, TG22/2: homozygous TG2 knockout, HET:zQ175 HET, HOM: zQ175 HOM.doi:10.1371/journal.pone.0099520.g004
Transglutaminase 2 and Huntington’s Disease
PLOS ONE | www.plosone.org 11 June 2014 | Volume 9 | Issue 6 | e99520

Response per minute. WT mice preferentially responded at a
higher rate to the reinforced stimulus, whereas zQ175 HET mice
did not exhibit differential responses rates to the reinforced and
unreinforced stimulus conditions (Figure 10B; HD Genotype6R-
einforcement Condition interaction: F(1,30) = 47.88, p,0.0001;
simple main effects, ps,0.05). Accordingly, while zQ175 HET
mice responded at a lower rate than WT mice during the
reinforced condition, their response rate exceeded that of the WT
mice in the unreinforced condition (simple main effects, ps,0.05).
TG2 ablation did not affect any of these deficits observed in the
HET mice.
7. TG2 depletion does not modify the expression levels ofdysregulated transcripts in brains of R6/2 and zQ175 KImice
We examined whether the ablation of TG2 was able to
ameliorate the dysregulation of genes that express key striatal
neurotransmitter receptors and intracellular signalling molecules
which have been found to be affected both in patients and in HD
animal models (for a review see [30]). In addition, we examined
whether the ablation of TG2 was able to ameliorate the decreased
expression of brain-derived neurotrophic factor (Bdnf) which has
also been found to be decreased in numerous HD mice and in
human post-mortem tissue (for a review see [31]).
R6/26TG2 KO line. Striatal markers. qPCR analysis
revealed decreased expression of Drd2, Darpp32, Pde10a, Cnr1
and Glt1 mRNAs in the striatum of 12-week-old R6/2 mice when
compared to age matched WT animals (Figure 11, left panels; HD
Genotype main effects: Fs(1,60).500.34, ps,0.0001). The partial
or complete absence of TG2 protein did not impact the deficits in
the expression levels of those striatal markers in the R6/2 mice.
However, in the WT mice, the knockout of TG2 produced a small
but significant increase of Darpp32, Pde10a and Glt1 mRNA
levels when compared to the heterozygous and wild type TG2
animals (HD Genotype6TG2 Genotype interaction: Fs(2,60).
3.605, p,0.05; simple main effects and post hocs, ps,0.05).
Cortical markers. Cortical levels of the Bdnf isoforms examined,
namely isoform II, IV and IX, were found to be significantly
reduced in the R6/2 mice when compared to WT animals,
irrespective of the TG2 protein level (Figure 11, right panels; HD
Genotype main effect: Fs(1,59).60.861, ps,0.0001). Cortical
mRNA levels of endogenous huntingtin (Htt) were also found to
be decreased in R6/2 mice compared to WT animals (HD
Genotype main effect, Fs(1,59).6.825, ps,0.05). The partial or
total ablation of TG2 did not impact the deficits detected in the
R6/2 animals in the cortical markers measured.
zQ1756TG2 KO line. Striatal markers. As expected [21],
52-week-old zQ175 HET mice presented a significant downreg-
ulation of Drd2, Darpp32, Pde10a, Cnr1 and Drd1a striatal
mRNAs when compared to age matched WT animals (Figure 12;
Figure 5. Acquisition of the procedural T-maze task (n = 20–24 per genotype). A. Proportion of mice acquiring the task on each test day. B.Average (6SEM) number of days to acquire the task (only animals that fulfill the acquisition criterion within 10 training days were included).*Significant HD genotype effect. WT: wild-type, TG2+/2: heterozygous TG2 knockout, TG22/2: homozygous TG2 knockout.doi:10.1371/journal.pone.0099520.g005
Figure 6. Reversal phase of the procedural T–maze task(platform location switched; n = 19–24 per genotype). The graphshows the mean (6SEM) percent correct for each group, on each testday. WT: wild-type, TG2+/2: heterozygous TG2 knockout, TG22/2:homozygous TG2 knockout.doi:10.1371/journal.pone.0099520.g006
Transglutaminase 2 and Huntington’s Disease
PLOS ONE | www.plosone.org 12 June 2014 | Volume 9 | Issue 6 | e99520

HD Genotype main effect: Fs(1,55).144.62, ps,0.0001). The
partial or complete depletion of TG2 protein did not impact the
decreased expression of those transcripts.
8. TG2 depletion does not reduce aggregate load orattenuate brain atrophy in R6/2 and zQ175 KI mice
Using the Seprion ligand ELISA [32], we quantified the
polyglutamine aggregate load in the cortex of 12-week-old animals
from the R6/26TG2 KO line and in cortex and striatum of 12-
month-old heterozygous mice from the zQ1756TG2 KO line.
The aggregate levels detected in the R6/2 were not impacted by
the partial or total absence of TG2 protein (Figure 13A). In the
zQ175 HET mice, we were unable to detect an aggregate signal in
cortex at 12 months of age. The signal in striatum was
comparatively low, but similar to the R6/2 results, the aggregate
levels detected in the zQ175 HET were not impacted by the
partial or total depletion of TG2 protein (Figure 13B).
Using ex vivo T2-MRI analysis, we measured whole brain,
striatal and cortical volumes in 16-week-old R6/26TG2 KO
animals and 52-week-old zQ1756TG2 KO animals (Figure 14).
Total brain, striatal and cortical volumes in R6/2 mice were
significantly reduced when compared to the WTs, regardless of the
TG2 protein level (Figure 14, top panels; HD Genotype main
effect: Fs(1,60).90.578, ps,0.0001). Similarly, zQ175 HOM and
HET mice presented significantly reduced brain volumes when
compared to the WTs, regardless of the TG2 protein level
(Figure 14, bottom panels; HD Genotype main effect: Fs(2,60).
61.13, ps,0.0001; post hocs, ps,0.0001). Also, in the zQ175
HOM mice those volumes were also significantly reduced when
compared to the zQ175 HET mice (post hocs, ps,0.0001). Whole
brain and cortical volumes of females were significantly larger than
those of males (not shown, Sex main effect: F(1,60).12.61, ps,
0.001).
Figure 7. Acquisition of the procedural T-maze task in the zQ1756TG2 KO animals (n = 11–12, per genotype). A. Proportion of miceacquiring the task on each test day. B. Average (6SEM) number of days to acquire the task. WT: wild-type, TG2+/2: heterozygous TG2 knockout,TG22/2: homozygous TG2 knockout, HET: zQ175 HET, HOM: zQ175 HOM.doi:10.1371/journal.pone.0099520.g007
Figure 8. Reversal phase of the procedural T–maze task(platform location switched; n = 11–12 per genotype). WT:wild-type, TG22/2: homozygous TG2 knockout, HET: zQ175 HET,HOM: zQ175 HOM.doi:10.1371/journal.pone.0099520.g008
Figure 9. Mean number of days required to obtain 40reinforcers across two consecutive sessions during the trainingphase (n = 6–12 per genotype). *Significant HD genotype effect. WT:wild-type, TG22/2: homozygous TG2 knockout, HET: zQ175 HET.doi:10.1371/journal.pone.0099520.g009
Transglutaminase 2 and Huntington’s Disease
PLOS ONE | www.plosone.org 13 June 2014 | Volume 9 | Issue 6 | e99520
Discussion
We employed a genetic deletion approach to further examine
the possible role that TG2 plays in HD. A TG2 knockout line was
crossed with both a transgenic and a knock-in mouse model of
HD, the R6/2 and the zQ175 lines, respectively. We evaluated the
resulting crosses using a behavioral testing battery under
moderated level of environmental enrichment. In addition, we
further examined the effect of the TG2 ablation using molecular
and imaging techniques.
Surprisingly, we did not replicate the positive results previously
reported by Bailey and Johnson using the R6/2 HD model [17];
they observed that the TG2 ablation extended the lifespan of R6/
2 animals carrying 155–175 CAG repeats in a mixed background
Figure 10. Discrimination performance (n = 6–12 per genotype). A. Discrimination ratio across the training period. B. Response rate for thereinforced (S+ RPM) and unreinforced (S- RPM) conditions averaged across the final four sessions for the zQ1756TG2 KO line. *Significant HDgenotype effect. WT: wild-type, TG22/2: homozygous TG2 knockout, HET: zQ175 HET.doi:10.1371/journal.pone.0099520.g010
Figure 11. The relative striatal (left panels) and cortical (right panels) mRNA expression level of mice examined from the R6/26TG2KO line at 12 weeks of age (n = 12 per genotype). Relative mRNA levels are normalized to WT controls. For normalization, the geometric meansof Ubc, Eif4a2 an Atp5b were used. *Significant HD Genotype effect; #significant TG2 Genotype effect. WT: wild-type, TG2+/2: heterozygous TG2knockout, TG22/2: homozygous TG2 knockout.doi:10.1371/journal.pone.0099520.g011
Transglutaminase 2 and Huntington’s Disease
PLOS ONE | www.plosone.org 14 June 2014 | Volume 9 | Issue 6 | e99520
strain [17,33], similar to results obtained with an R6/1 line [16]
(see table S1 for a comparison of present results to the ones
previously described). However, we were unable to replicate the
increased lifespan when using R6/2 mice carrying 232–272 CAG
repeats in a congenic C57BL/6J strain. It is well established that
R6/2 mice carrying approximately 240 CAG repeats have a
longer life span than those carrying approximately 150 CAG
repeats [28,29]. It is possible that the previous report of increased
survival in R6/2 mice after TG2 ablation could be modulated by
the CAG repeat of the model studied. Another possible
explanation as to why we did not see difference in R6/2 survival
after TG2 ablation may be because of the housing conditions
utilized in our study, which have been shown previously to
improve survival [34,35]. Since our goal is to uncover robust
targets for HD, we provided the animals with a moderate enriched
environment (namely: group housing, a range of bedding, plastic
bones and tunnels) as well as easy access to food and water. These
husbandry conditions produce survival data that more accurately
reflects mortality due to the mutation rather than malnourishment
or dehydration consequence of the motor deterioration [34].
When husbandry conditions are optimized, disease pathology is
better isolated allowing more stringent evaluation of potential
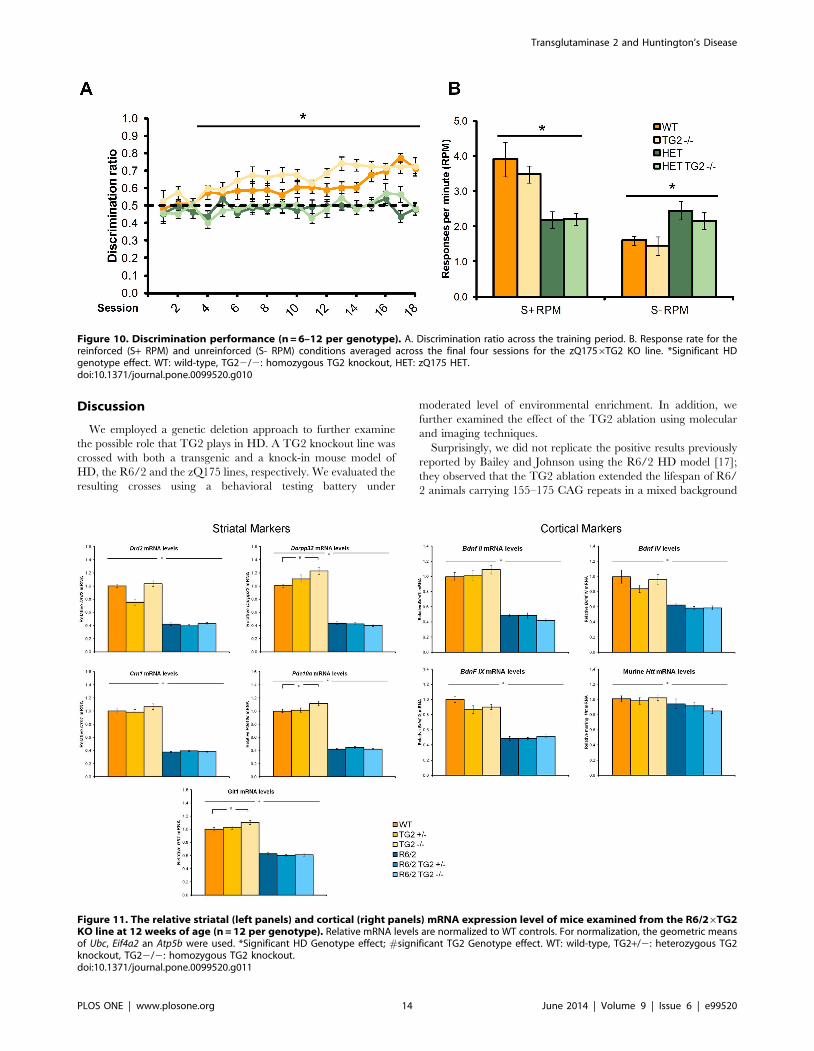
Figure 12. The relative striatal mRNA expression level of mice examined from the zQ1756TG2 KO line at 12 months of age (n = 7–12per genotype). Relative mRNA levels are normalized to zQ175_WT TG2_WT controls. For normalization, the geometric means of Ubc, Eif4a2 anAtp5b were used. *Significant HD Genotype effect. WT: wild-type, TG2+/2: heterozygous TG2 knockout, TG22/2: homozygous TG2 knockout, HET:zQ175 HET.doi:10.1371/journal.pone.0099520.g012
Transglutaminase 2 and Huntington’s Disease
PLOS ONE | www.plosone.org 15 June 2014 | Volume 9 | Issue 6 | e99520

therapies. It is under these husbandry conditions that the ablation
of TG2 failed to improve the survival of R6/2 animals. Survival
analysis was not performed on the TG26zQ175 cross since the
results obtained did not warrant this long term study [21].
In our hands, TG2 ablation also did not to delay the onset of, or
otherwise ameliorate, the robust locomotor deficits detected by the
PhenoCube system, an automated and high throughput platform
that allows unbiased evaluation of animal behavior [36]. Using a
constant speed rotarod protocol, Bailey and Johnson observed a
Figure 13. Seprion ligand quantification of aggregate load. A. Aggregate load in cortical tissues from 12-week-old R6/26TG2 KO mice. Thebackground readings obtained from the WT animals (n = 3 per group) were averaged and subtracted from the readings obtained from the R6/2animals in order to remove the baseline reading. B. Aggregate load in striatal tissues from 52-week-old zQ1756TG2 KO mice. The readings obtainedfrom the zQ175_WT animals (n = 5–7 per group) were averaged and subtracted from the readings obtained from the zQ175_HET animals in order toremove the baseline reading. WT: wild-type, TG2+/2: heterozygous TG2 knockout, TG22/2: homozygous TG2 knockout, HET: zQ175 HET.doi:10.1371/journal.pone.0099520.g013
Figure 14. Whole brain, striatal and cortical volumes of 16-week-old R6/26TG2 KO mice (top panels, n = 6 per genotype per sex)and of 52-weeks-old zQ1756TG2 KO mice (bottom panels, n = 6 per genotype per sex). *Significant differences compared to WT animals,#significant differences compared to HET mice. WT: wild-type, TG2+/2: heterozygous TG2 knockout, TG22/2: homozygous TG2 knockout, HET:zQ175 HET, HOM; zQ175HOM.doi:10.1371/journal.pone.0099520.g014
Transglutaminase 2 and Huntington’s Disease
PLOS ONE | www.plosone.org 16 June 2014 | Volume 9 | Issue 6 | e99520

delay in the onset of motor dysfunction produced after TG2
ablation, an improvement that did not translate to their
ambulatory observations [17], in agreement with our results.
Given the burden of cognitive decline for HD patients and their
caregivers, a long term goal has been to utilize robust cognitive
tests (especially those focusing on cognitive flexibility) that could be
used to evaluate the effectiveness of therapies or validity of targets
in mouse models. We therefore examined the ability of TG2
ablation to reverse the deficits detected in the procedural T-maze
in R6/2 and zQ175 homozygous mice, as well as in the Go/No-go
discrimination/response inhibition assay in zQ175 heterozygous
mice, but we did not see beneficial effects. Different tests are
required due to milder cognitive deficits observed in the HET
mice in the T-maze at 28–29 weeks of age.
Interestingly, the TG2 ablation in R6/2 and R6/1 mice was
reported to increase the number of HTT aggregates or neurons
presenting aggregates, respectively [16,17]. While this was
originally unexpected, in vitro studies have suggested that
aggregates can be formed independently of TG2 through polar
zippers [37,38]. Furthermore, TG2 knockout mice present
impaired autophagy and an accumulation of ubiquitinated protein
aggregates [39]. We did not detect an increase in aggregate load in
either of the mouse models examined after TG2 ablation. TG2 has
been associated with the presence of nuclear actin-cofilin stress
rods in cells expressing mutant huntingtin [40]. While we did not
monitor for these ‘cofilin rods’ in the brains of the TG2 KO
crosses, the lack of amelioration of any disease phenotype in these
animals suggests that TG2 activity is either not required for the
formation of these rods in a physiological context, or that these
rods are not relevant to disease progression in the R6/2 and
zQ175 HD models. It is possible that the huntingtin aggregate
burden in 12 week-old R6/2 and 52 week-old zQ175 mice
prevented the detection of a minor aggregate load differences due
to a ceiling effect. This seems less likely for the zQ175 mice as the
Seprion signal is still relatively low at this age in the tissues
examined. Alternatively, the differences with the some of the
previously published studies regarding the aggregate levels may be
related to the antibodies used. In the Seprion ligand-ELISA assay
we used antibodies recognizing the N-terminal portion of human
huntingtin protein that have been previously shown to stain HTT
inclusion bodies in mouse brain tissue as well as detect oligomeric,
proto-fibrillar and fibrillar aggregates using electron microscopy,
atomic force microscopy (AFM) and sodium dodecyl sulphate–
polyacrylamide gel electrophoresis [32,41]. Future studies will
examine the role of TG2 in regulating autophagic responses in
HD by investigating levels of autophagy markers such as p62 and
autophagosomes as well as specifically tracking ubiquinated forms
of HTT and other proteins that are predicted to accumulate in
TG2 KO mice [39].
TG2 inhibition by a novel peptide, ZDON, has been shown to
normalize around 40% of the genes dysregulated in HdhQ111
immortalized striatal neurons [42]. Our data showed that TG2
ablation in the HD mouse models examined had no effect on the
downregulation of expression of the group of genes examined. In
agreement with Bailey and Johnson [17], we also found that TG2
ablation did not affect the histopathological endpoints examined,
namely striatal, cortical and whole brain volumes.
In summary, under rigorous experimental conditions we found
that the genetic ablation of TG2 does not ameliorate the disease
phenotype, including physiological, molecular, neuropathological
and behavioral markers in two different HD mouse models.
Supporting our results, the overexpression of TG2 in R6/2 mice
also did not modify the disease phenotype [43], raising additional
questions about the role of TG2 activity in HD. The results of our
genetic target validation work with a transglutaminase 2 null gene
on the background of 2 different mouse models of HD do not
support a therapeutic path aimed at TG2 inhibition for the
treatment of HD.
Supporting Information
Figure S1 Graphical depiction of cage plan and water access
protocol during Habituation and Alternation phases. Shaded
circles signal the armed receptacles (NP: Nosepoke).
(TIF)
Table S1 Effect of TG2 deletion on HD mouse models:
comparison of present results to previously published ones.
(DOCX)
Acknowledgments
We wish to thank Dr Graham (Victor Chang Cardiac Research Institute,
Australia) for providing the TG2 knockout animals; Brenda Lager and
Simon Noble (CHDI Foundation) for the support in the generation of the
experimental animals and for helpful comments on manuscript draft,
respectively.
Author Contributions
Conceived and designed the experiments: DM IMS D. Howland SR LP
DB AG GB AK SO LM NP. Performed the experiments: PT KL SM MK
MO JB JT JF KC KM MM D. He GO RAN. Analyzed the data: RM AK
LM AF GB SO IF NP PT KL. Wrote the paper: LM D. Howland DM
IMS.
References
1. Greenberg CS, Birckbichler PJ, Rice RH (1991) Transglutaminases: multifunc-
tional cross-linking enzymes that stabilize tissues. FASEB J 5: 3071–3077.
2. Im MJ, Riek RP, Graham RM (1990) A novel guanine nucleotide-binding
protein coupled to the alpha 1-adrenergic receptor. II. Purification, character-
ization, and reconstitution. J Biol Chem 265: 18952–18960.
3. Lai TS, Slaughter TF, Peoples KA, Hettasch JM, Greenberg CS (1998)
Regulation of human tissue transglutaminase function by magnesium-nucleotide
complexes. Identification of distinct binding sites for Mg-GTP and Mg-ATP.
J Biol Chem 273: 1776–1781.
4. Hasegawa G, Suwa M, Ichikawa Y, Ohtsuka T, Kumagai S, et al. (2003) A
novel function of tissue-type transglutaminase: protein disulphide isomerase.
Biochem J 373: 793–803.
5. Mastroberardino PG, Farrace MG, Viti I, Pavone F, Fimia GM, et al. (2006)
‘‘Tissue’’ transglutaminase contributes to the formation of disulphide bridges in
proteins of mitochondrial respiratory complexes. Biochim Biophys Acta 1757:
1357–1365.
6. Molberg O, McAdam S, Sollid L (2000) Role of tissue transglutaminase in celiac
disease. Journal of Pediatric Gastroenterology & Nutrition 30: 232–240.
7. Mangala L, Mehta K (2005) Tissue Transglutaminase (TG2) in Cancer Biology.
In: Mehta K, Eckert R, editors. Transglutaminases: the family of enzymes with
diverse functions Basel: Karger. pp. 125–138.
8. Siegel M, Khosla C (2007) Transglutaminase 2 inhibitors and their therapeutic
role in disease states. Pharmacol Ther 115: 232–245.
9. Tahri-Joutei A, Pointis G (1989) Developmental changes in arginine vasopressin
receptors and testosterone stimulation in Leydig cells. Endocrinology 125: 605–
611.
10. Bates GP, Jones L (2002) Huntington’s disease Oxford: Oxford Universtity Press.
11. Lesort M, Chun W, Johnson GV, Ferrante RJ (1999) Tissue transglutaminase is
increased in Huntington’s disease brain. J Neurochem 73: 2018–2027.
12. Jeitner TM, Matson WR, Folk JE, Blass JP, Cooper AJ (2008) Increased levels of
gamma-glutamylamines in Huntington disease CSF. J Neurochem 106: 37–44.
13. Karpuj MV, Garren H, Slunt H, Price DL, Gusella J, et al. (1999)
Transglutaminase aggregates huntingtin into nonamyloidogenic polymers, and
its enzymatic activity increases in Huntington’s disease brain nuclei. Proc Natl
Acad Sci U S A 96: 7388–7393.
Transglutaminase 2 and Huntington’s Disease
PLOS ONE | www.plosone.org 17 June 2014 | Volume 9 | Issue 6 | e99520

14. Dedeoglu A, Kubilus JK, Jeitner TM, Matson SA, Bogdanov M, et al. (2002)
Therapeutic effects of cystamine in a murine model of Huntington’s disease.J Neurosci 22: 8942–8950.
15. Karpuj MV, Becher MW, Springer JE, Chabas D, Youssef S, et al. (2002)
Prolonged survival and decreased abnormal movements in transgenic model ofHuntington disease, with administration of the transglutaminase inhibitor
cystamine. Nat Med 8: 143–149.16. Mastroberardino PG, Iannicola C, Nardacci R, Bernassola F, De Laurenzi V, et
al. (2002) ‘Tissue’ transglutaminase ablation reduces neuronal death and
prolongs survival in a mouse model of Huntington’s disease. Cell Death Differ 9:873–880.
17. Bailey CD, Johnson GV (2004) Tissue transglutaminase contributes to diseaseprogression in the R6/2 Huntington’s disease mouse model via aggregate-
independent mechanisms. J Neurochem 92: 83–92.18. Prime ME, Andersen OA, Barker JJ, Brooks MA, Cheng RK, et al. (2012)
Discovery and structure-activity relationship of potent and selective covalent
inhibitors of transglutaminase 2 for Huntington’s disease. J Med Chem 55:1021–1046.
19. Schaertl S, Prime M, Wityak J, Dominguez C, Munoz-Sanjuan I, et al. (2010) Aprofiling platform for the characterization of transglutaminase 2 (TG2)
inhibitors. J Biomol Screen 15: 478–487.
20. Mangiarini L, Sathasivam K, Seller M, Cozens B, Harper A, et al. (1996) Exon 1of the HD gene with an expanded CAG repeat is sufficient to cause a progressive
neurological phenotype in transgenic mice. Cell 87: 493–506.21. Menalled LB, Kudwa AE, Miller S, Fitzpatrick J, Watson-Johnson J, et al. (2012)
Comprehensive behavioral and molecular characterization of a new knock-inmouse model of Huntington’s disease: zQ175. PLoS One 7: e49838.
22. Heikkinen T, Lehtimaki K, Vartiainen N, Puolivali J, Hendricks SJ, et al. (2012)
Characterization of neurophysiological and behavioral changes, MRI brainvolumetry and 1H MRS in zQ175 knock-in mouse model of Huntington’s
disease. PLoS One 7: e50717.23. Nanda N, Iismaa SE, Owens WA, Husain A, Mackay F, et al. (2001) Targeted
inactivation of Gh/tissue transglutaminase II. J Biol Chem 276: 20673–20678.
24. Menalled L, El-Khodor BF, Patry M, Suarez-Farinas M, Orenstein SJ, et al.(2009) Systematic behavioral evaluation of Huntington’s disease transgenic and
knock-in mouse models. Neurobiol Dis 35: 319–336.25. Jacobs GH, Fenwick JC, Calderone JB, Deeb SS (1999) Human cone pigment
expressed in transgenic mice yields altered vision. J Neurosci 19: 3258–3265.26. Singer J (1998) Using SAS PROC MIXED to fit multilevel models,hierarchical
models, and individuals growth models. Journal of Educational and Behavioral
Statistics 24: 323–355.27. Cowin RM, Roscic A, Bui N, Graham D, Paganetti P, et al. (2012) Neuronal
aggregates are associated with phenotypic onset in the R6/2 Huntington’sdisease transgenic mouse. Behav Brain Res 229: 308–319.
28. Morton AJ, Glynn D, Leavens W, Zheng Z, Faull RL, et al. (2009) Paradoxical
delay in the onset of disease caused by super-long CAG repeat expansions inR6/2 mice. Neurobiol Dis 33: 331–341.
29. Dragatsis I, Goldowitz D, Del Mar N, Deng YP, Meade CA, et al. (2009) CAG
repeat lengths . or = 335 attenuate the phenotype in the R6/2 Huntington’s
disease transgenic mouse. Neurobiol Dis 33: 315–330.
30. Cha JH (2007) Transcriptional signatures in Huntington’s disease. Prog
Neurobiol 83: 228–248.
31. Zuccato C, Cattaneo E (2009) Brain-derived neurotrophic factor in neurode-
generative diseases. Nat Rev Neurol 5: 311–322.
32. Sathasivam K, Lane A, Legleiter J, Warley A, Woodman B, et al. (2010)
Identical oligomeric and fibrillar structures captured from the brains of R6/2
and knock-in mouse models of Huntington’s disease. Hum Mol Genet 19: 65–
78.
33. Bailey CD, Johnson GV (2006) The protective effects of cystamine in the R6/2
Huntington’s disease mouse involve mechanisms other than the inhibition of
tissue transglutaminase. Neurobiol Aging 27: 871–879.
34. Carter RJ, Hunt MJ, Morton AJ (2000) Environmental stimulation increases
survival in mice transgenic for exon 1 of the Huntington’s disease gene. Mov
Disord 15: 925–937.
35. Wood NI, Carta V, Milde S, Skillings EA, McAllister CJ, et al. (2010) Responses
to environmental enrichment differ with sex and genotype in a transgenic mouse
model of Huntington’s disease. PLoS One 5: e9077.
36. Balci F, Oakeshott S, Shamy JL, El-Khodor BF, Filippov I, et al. (2013) High-
Throughput Automated Phenotyping of Two Genetic Mouse Models of
Huntington’s Disease. PLoS Curr 5.
37. Chun W, Lesort M, Tucholski J, Ross CA, Johnson GV (2001) Tissue
transglutaminase does not contribute to the formation of mutant huntingtin
aggregates. J Cell Biol 153: 25–34.
38. Perutz MF, Johnson T, Suzuki M, Finch JT (1994) Glutamine repeats as polar
zippers: their possible role in inherited neurodegenerative diseases. Proc Natl
Acad Sci U S A 91: 5355–5358.
39. D’Eletto M, Farrace MG, Rossin F, Strappazzon F, Giacomo GD, et al. (2012)
Type 2 transglutaminase is involved in the autophagy-dependent clearance of
ubiquitinated proteins. Cell Death Differ 19: 1228–1238.
40. Munsie L, Caron N, Atwal RS, Marsden I, Wild EJ, et al. (2011) Mutant
huntingtin causes defective actin remodeling during stress: defining a new role
for transglutaminase 2 in neurodegenerative disease. Hum Mol Genet 20: 1937–
1951.
41. Sathasivam K, Woodman B, Mahal A, Bertaux F, Wanker EE, et al. (2001)
Centrosome disorganization in fibroblast cultures derived from R6/2 Hunting-
ton’s disease (HD) transgenic mice and HD patients. Hum Mol Genet 10: 2425–
2435.
42. McConoughey SJ, Basso M, Niatsetskaya ZV, Sleiman SF, Smirnova NA, et al.
(2010) Inhibition of transglutaminase 2 mitigates transcriptional dysregulation in
models of Huntington disease. EMBO Mol Med 2: 349–370.
43. Kumar A, Kneynsberg A, Tucholski J, Perry G, van Groen T, et al. (2012)
Tissue transglutaminase overexpression does not modify the disease phenotype
of the R6/2 mouse model of Huntington’s disease. Exp Neurol 237: 78–89.
Transglutaminase 2 and Huntington’s Disease
PLOS ONE | www.plosone.org 18 June 2014 | Volume 9 | Issue 6 | e99520