Generation of heat flow map over a part of the Cambay Basin, India using NOAA-AVHRR data
14
This article was downloaded by:[Majumdar, T. J.] On: 3 December 2007 Access Details: [subscription number 787033638] Publisher: Taylor & Francis Informa Ltd Registered in England and Wales Registered Number: 1072954 Registered office: Mortimer House, 37-41 Mortimer Street, London W1T 3JH, UK Geocarto International Publication details, including instructions for authors and subscription information: http://www-intra.informaworld.com/smpp/title~content=t759156373 Generation of heat flow map over a part of the Cambay Basin, India using NOAA-AVHRR data T. J. Majumdar a ; P. Nasipuri a a Earth Sciences and Hydrology Division, Marine and Earth Sciences Group, Remote Sensing Applications and Image Processing Area, Space Applications Centre (ISRO), Ahmedabad, India First Published on: 07 September 2007 To cite this Article: Majumdar, T. J. and Nasipuri, P. (2007) 'Generation of heat flow map over a part of the Cambay Basin, India using NOAA-AVHRR data', Geocarto International, 1 - 13 To link to this article: DOI: 10.1080/10106040701337584 URL: http://dx.doi.org/10.1080/10106040701337584 PLEASE SCROLL DOWN FOR ARTICLE Full terms and conditions of use: http://www-intra.informaworld.com/terms-and-conditions-of-access.pdf This article maybe used for research, teaching and private study purposes. Any substantial or systematic reproduction, re-distribution, re-selling, loan or sub-licensing, systematic supply or distribution in any form to anyone is expressly forbidden. The publisher does not give any warranty express or implied or make any representation that the contents will be complete or accurate or up to date. The accuracy of any instructions, formulae and drug doses should be independently verified with primary sources. The publisher shall not be liable for any loss, actions, claims, proceedings, demand or costs or damages whatsoever or howsoever caused arising directly or indirectly in connection with or arising out of the use of this material.
Transcript of Generation of heat flow map over a part of the Cambay Basin, India using NOAA-AVHRR data

This article was downloaded by:[Majumdar, T. J.]On: 3 December 2007Access Details: [subscription number 787033638]Publisher: Taylor & FrancisInforma Ltd Registered in England and Wales Registered Number: 1072954Registered office: Mortimer House, 37-41 Mortimer Street, London W1T 3JH, UK
Geocarto InternationalPublication details, including instructions for authors and subscription information:http://www-intra.informaworld.com/smpp/title~content=t759156373
Generation of heat flow map over a part of the CambayBasin, India using NOAA-AVHRR dataT. J. Majumdar a; P. Nasipuri aa Earth Sciences and Hydrology Division, Marine and Earth Sciences Group,Remote Sensing Applications and Image Processing Area, Space ApplicationsCentre (ISRO), Ahmedabad, India
First Published on: 07 September 2007To cite this Article: Majumdar, T. J. and Nasipuri, P. (2007) 'Generation of heat flowmap over a part of the Cambay Basin, India using NOAA-AVHRR data', GeocartoInternational, 1 - 13To link to this article: DOI: 10.1080/10106040701337584URL: http://dx.doi.org/10.1080/10106040701337584
PLEASE SCROLL DOWN FOR ARTICLE
Full terms and conditions of use: http://www-intra.informaworld.com/terms-and-conditions-of-access.pdf
This article maybe used for research, teaching and private study purposes. Any substantial or systematic reproduction,re-distribution, re-selling, loan or sub-licensing, systematic supply or distribution in any form to anyone is expresslyforbidden.
The publisher does not give any warranty express or implied or make any representation that the contents will becomplete or accurate or up to date. The accuracy of any instructions, formulae and drug doses should beindependently verified with primary sources. The publisher shall not be liable for any loss, actions, claims, proceedings,demand or costs or damages whatsoever or howsoever caused arising directly or indirectly in connection with orarising out of the use of this material.

Dow
nloa
ded
By:
[Maj
umda
r, T.
J.]
At:
11:1
5 3
Dec
embe
r 200
7
Generation of heat flow map over a part of the Cambay Basin,
India using NOAA-AVHRR data
T. J. MAJUMDAR* and P. NASIPURI
Earth Sciences and Hydrology Division, Marine and Earth Sciences Group,
Remote Sensing Applications and Image Processing Area, Space Applications
Centre (ISRO), Ahmedabad 380 015, India
(Received 12 July 2006; in final form 14 March 2007)
Heat flow measurements carried out in the Cambay Basin, India indicate high heatflow values (1.8–2.2 mcal cm72 s71/77–92 mW m72) compared to the normal heat
flow values of approximately (1.4 mcal cm72 s71/58.6 mW m72) for stablecontinental shield areas. This makes the region interesting from a tectonic as wellas a geothermic point of view. The surface heat flow can be computed bymultiplying the geothermal gradient by the rock conductivity. The paper develops a
methodology to determine heat flow using a remote sensing technique. The same isthen measured at a few points in-situ for validation and the methodology is thenextended to a larger (potential oil basin) area using NOAA thermal infrared (IR)
data. The comparison shows encouraging results at match points that may be usefulfor prospective hydrocarbon resources. The heat flow estimation technique usingthe remote sensing approach is, therefore, highly important and can be utilized as
an alternative to conventional heat-flow estimation.
Keywords: Heat flow; Thermal conductivity; Surface temperature; Intrusion;Gravity anomaly; NOAA-AVHRR
1. Introduction
Infrared remote sensing imagery records the surface radiance emitted from theEarth. If instrument calibration, atmospheric and topographic corrections are made,the resulting product represents the surface temperature (Sabins 1997, Majumdarand Mohanty 1998). Surface temperature is the most variable heat source thattransfers heat across the Earth–atmosphere interface. This includes solar radiation(S), surface thermal radiation (R), sensible heat transfer between the ground and theatmosphere (H), surface heat flux (G), and latent heat transfer (L) (Kahle 1977,Majumdar et al. 1983, Majumdar 2003). In a geothermally active region, thecontribution due to terrestrial heat flow from depth plays a major role, and if thecontribution due to other sources could be eliminated, the terrestrial heat flow fromdepth will contribute, in a major way, to the surface temperature.Surface heat flow can be computed by multiplying the geothermal gradient with
rock thermal conductivity. The downward continuation of surface heat flow data to
*Corresponding author. Email: [email protected]
Geocarto International2007, 1–13, iFirst article
Geocarto InternationalISSN 1010-6049 print/ISSN 1752-0762 online ª 2007 Taylor & Francis
http://www.tandf.co.uk/journalsDOI: 10.1080/10106040701337584

Dow
nloa
ded
By:
[Maj
umda
r, T.
J.]
At:
11:1
5 3
Dec
embe
r 200
7
determine subsurface temperature distributions is a useful method for exploring thesubsurface structures in geothermal areas (Verma and Gupta 1975, Gupta 1981,1982). The calculation of heat flow by conventional methods is laborious and timeconsuming. The Geological Survey of India has drilled a good number of boreholesfor geothermal exploration and the data have been utilized for the computation ofadditional heat flow values (Ravi Shankar 1988).The utilization of thermal IR data for geothermal zoning for regional and
petroleum geology on the basis of satellite IR-thermal survey and for studiesof seismoactive regions has been discussed in detail elsewhere (Gorny et al.1996, Tronin 1996, Nasipuri et al. 2006). Cracknell and Xue (1996) have usedNational Oceanic and Atmospheric Administration (NOAA) Advanced Very HighResolution Radiometer (AVHRR) data and an advanced thermal inertia model forestimation of ground heat flux over an area in France. An attempt was made tocorrelate the silica content in ground water as well as the heat flow to increasethe density of observation and the reliability of a database (Swanberg andMorgan 1978).Estimation of heat flow was attempted using aerial thermal infrared (IR) data by
Majumdar et al. (1983). A calibrated thermal IR image over a part of the CambayBasin has been utilized to determine surface temperature and thereby to detect theheat flow using an empirical approach. Applying the conductive heat flowcontinuation technique, 3-dimensional configuration of the hydrocarbon-bearingreservoir at Shobhasan (Cambay Basin) could be delineated. The heat flowestimation technique using a remote sensing approach is, therefore, highly importantand can be utilized as an alternative to conventional heat-flow estimation.
2. Objectives
The objectives of this study are:
(i) to develop a methodology to determine heat-flow using NOAA thermal IRdata after using a model for surface temperature estimation;
(ii) to apply the heat-flow continuation model to subsurface temperatureestimation over the study area;
(iii) to validate the results with the available in situ and borehole measurements.
3. Data sources and area of study
NOAA-14 (date of pass: 14 January 2001) passes at around 1400 hours, ISTlocal time. NOAA AVHRR data have been widely used for environmental researchat regional and global scales. NOAA AVHRR Local Area Coverage (LAC) datawith a spatial resolution of 1.1 km at nadir and a radiometric of 10 bits have beenutilized to generate heat flow images over the Cambay Basin. The level lb datacontain raw AVHRR spectral data as well as calibration coefficients, solar zenithangles, earth location, and other auxiliary data (Di and Rundquist 1994, NOAA1990).The Cambay Basin, Gujarat, India (22–248 N, 72.5–73.258 E) is an ideal site for
this study. Besides being geothermally active, it contains several oilfields. The sensorcalibration curve is utilized to obtain the surface temperature. The surface andsubsurface temperatures were measured at limited ground control points and a few
2 T. J. Majumdar and P. Nasipuri

Dow
nloa
ded
By:
[Maj
umda
r, T.
J.]
At:
11:1
5 3
Dec
embe
r 200
7
bore holes respectively (subsurface temperature data over boreholes received fromOil and Natural Gas Corporation, Dehradun). The value of rock thermalconductivity is assumed to be 0.005 cal cm71 s71 8C71 (2.09 W m71 K71). Over5 km thick tertiary sediments (clay stone, sandy siltstone and shale) are mainlypresent in this area (Cambay Basin). Accordingly, a generalized value of0.005 cal cm71 s71 8C71 (2.09 W m71 K71) has been chosen as per availablelithologs in the area (Sabins 1997).
3.1 Geology of Gujarat
Geologically, Gujarat represents a wide spectrum of rock types of different ages. Thegeology of Gujarat consists of three distinct physiographic units (Merh 1995,Nasipuri et al. 2005). The various maps used for this study include geological/tectonic maps over the study area.
3.1.1 Mainland Gujarat. The geological evolution of the northern and eastern partsof Gujarat has been controlled by the Pre-Cambrian orogenies. A major part of themainland falls within the Cambay and Narmada graben and eastern and northernPre-Cambrian rock marks the boundary. The rock of the mainland shows an agerange from Proterozoic to recent. A striking feature of mainland stratigraphy is thetotal absence of Paleozoic rock and the development of Mesozoic rock only. Thetopmost deposit is continental sediments deposited in fluvio-marine, fluvial andaeolian environments.
3.1.2 Saurashtra peninsula. The peninsula of Saurashtra is a horst bordered byfractures related to three intersecting rift trends, viz. the Delhi trend (NE-SW), theNarmada trend (ENE-WSW) and the Dharwar trend (NNW-SSE) (Biswas 1987).The Saurashtra region contains only Mesozoic and Cenozoic rocks and stratigra-phically the sequence begins with the Cretaceous, followed upwards by DeccanVolcanics, Tertiary and Quaternary deposits.
3.1.3 Kutch Region. This is an important site of Mesozoic and Cenozoicsedimentation. Unbroken rich fossiliferous sequences from Jurassic upwards arevery well preserved.
3.2 Geology of the Cambay Basin
The Cambay Basin is a marginal aulacogen basin situated in the western part ofIndia. It is an intracratonic graben covered by alluvium. A thick sequence of tertiarysediments occurs beneath the alluvial cover over the basement of the Deccan trapbasalt. The basin extends offshore to the south as a narrow graben parallel with thecoast between Bombay High and the mainland (Raju 1968, Biswas 1987). Besidesbeing geothermally active, this is a proven petroliferous basin covering an area ofabout 53,500 km2. More than 90 oil and gas fields have been discovered, with twofields, Ankleshwar and Gandhar, which are of giant size. Over 5 km thick tertiarysediments (clay stone, sandy siltstone and shale) are present. The total predictedhydrocarbon resources are of the order of 2050 MMt and established in-placereserves are of the order of 1188 MMt. Structural, tilted fault closure and strati-structural playas in tertiary sediments are the main exploration targets (figure 1).
Heat flow map generation 3

Dow
nloa
ded
By:
[Maj
umda
r, T.
J.]
At:
11:1
5 3
Dec
embe
r 200
7
The Cambay Basin is composite and developed sequentially from north to southduring India’s northwards drifting after the break up of Gondwanaland. Thedevelopment of three major rift basins in the western margin, namely Kutch,Cambay and Narmada rift basins, seems to be related to the evolution of the westernmargin of India in three stages. The stages are (1) separation of Africa from India inearly Jurassic (Besse and Courtillot 1988), (2) separation of Madagascar from Indiacaused by Marion hot spot during middle Cretaceous (Morgan 1981), (3) break up ofthe Seychelles from India caused by the Reunion hot spot during late Cretaceous,which gave rise to Deccan Trap basalts (McKenzie and Slater 1971).The deepest part of the basin is recorded between the Narmada and Mahisagar
rivers, where more than 5000 m of sediments have been deposited. Initially it wasbelieved that the basin was being divided into two parts by an east–west-trending
Figure 1. Location of the Cambay Basin, Gujarat, India.
4 T. J. Majumdar and P. Nasipuri

Dow
nloa
ded
By:
[Maj
umda
r, T.
J.]
At:
11:1
5 3
Dec
embe
r 200
7
fault along the Narmada River. However, recent data indicate that apart from thatfault, there are other faults in that basin which have divided the basin into variousblocks (Mitra et al. 1984).
4. Methodology
4.1 Calibration of AVHRR data
AVHRR thermal data (channels 3, 4 and 5) may be converted to temperature andthe visible and near infrared data (channels 1 and 2) may be converted to reflectancebased on the look-up table (LUT) given in the NOAA-AVHRR CD. Accordingly,channel 4 and 5 data were converted to temperatures using those LUTs.
4.2 Retrieval of brightness temperature
The retrieval of brightness temperature from the thermal bands 4 and 5 of NOAA 14AVHRR images was done by using inverse Planck’s equation, which is as follows(Saraf et al. 1995):
T ¼ c2= l ln 1þ elc1l�5=EðlÞ
� �� �� �ð1Þ
where T is the temperature (K) for the energy value E (l), c1 and c2 are constants,E (l) is the radiance energy value in the thermal IR band, e is the emissivity.
4.3 Retrieval of land surface temperature
Terrestrial surface temperature measurements by sensors are attenuated by theEarth’s atmosphere by decreasing the observed brightness temperature (due to watervapour) as received by the sensor. In a non-cloudy region of interest, the majorperturbation factor is due to the existence of atmospheric water vapour and differenttechniques exist for its evaluation (Price 1984, Becker 1987, Zhirong and McDonnell1988, Majumdar and Bhattacharya 1988, Kealy and Hook 1993, Prata et al. 1995).Among the existing techniques, the split-window channel method is the mostpopular for calculating the surface temperature over oceans, as the case is simplifieddue to the homogeneity of a pixel (Prabhakara et al. 1974, Singh 1984). However, thesituation becomes complex over land due to the following reasons (i) land surfacetemperature is generally not homogeneous within a pixel as in the case of the ocean,(ii) the difference between land surface temperature and air temperature near thesurface is larger for land surfaces than for the sea, and (iii) land surface emissivitiesmay be quite different from unity and spectrally variable, which is not the case forsea (Becker 1987, Cooper and Asrar 1988, Vidal 1991, Coll et al. 1994, Majumdarand Mohanty 1998).AVHRR channels 4 and 5 are designed to exploit an atmospheric window in the
thermal region of the electromagnetic spectrum, where attenuation is relativelysmall, which, however, introduces significant error in AVHRR-sensed surfacetemperature. To eliminate the atmospheric effects due to water vapour, Price’s model(Price 1984, Cooper and Asrar 1988) has been used:
Tc ¼ ðch 4Þ þ 3:33 ðch4� ch5ÞðKÞ ð2Þ
Heat flow map generation 5

Dow
nloa
ded
By:
[Maj
umda
r, T.
J.]
At:
11:1
5 3
Dec
embe
r 200
7
where Tc is the atmosphere corrected surface temperature, ch4 is the calibratedsurface temperature from channel 4, ch5 is the calibrated surface temperature fromchannel 5. For the 10–12 mm spectral region spectral emissivity (e) values areassumed to be varying within 0.95–0.99, which is the case for most of the land classes(Taylor 1979, Price 1983, Majumdar and Bhattacharya 1988).
4.4 Calculation of subsurface temperature and heat flow
The major problem in the calculation of subsurface temperature distribution is thespatial diffusion of heat. Since the flow of heat is not restricted to vertical directiononly, the estimation of subsurface temperature by extrapolation of the surfacegeothermal gradient is erroneous. The correct solution of this problem is downwardsor source-wards continuation of heat, which accounts for the spreading of heat inall directions. Such a heat flow continuation technique has been developed byCarslaw and Jaeger (1959), Brott et al. (1981) and others. The general approach to theproblem, as described by Brott et al. (1981) and used in the present text is given below.To obtain a uniform surface temperature image, sources must be considered. The
heat flow (Qij) of a point (i,j) on a plane is represented as
Qij ¼ GijK0 ð3Þ
Where Gij is the geothermal gradient at that point and K is the rock thermalconductivity. The strength (Sij) of a continuous and constant heat generation pointsource in a homogenous isotropic medium, in which no heat is generated between thesource and the surface and the heat transfer mechanism is by conduction alone, canbe calculated by
Sij ¼ Qij=4pK0 ð4Þ
Where K0 ¼ (K/rC) is the diffusivity, r is the density of the material and C the specificheat.Once the source term is calculated, the subsurface temperature Tij at the point Pij
at a vertical depth Z can be expressed as (Brott et al. 1981)
Tij ¼Xn
k¼1
Xm
l¼1Sijkl ðDijkl �D0ijklÞ þ TSij þ ðGijZÞ ð5Þ
where D and D0 are the steady state distance terms, which are expressed as
D ¼ 1=R and D0 ¼ 1=R0 ð6Þ
where R is the distance from the source to the field point and R0 is the distance fromthe image to the field point. TSij is the surface temperature at the point (i, j).Considering a constant temperature for a particular layer e.g. a hydrocarbon-bearingreservoir, the depth to the formation can be computed with the help of equation (5).The Cambay basin is an ideal area for this study. Besides being geothermally
active, it contains several active oil fields. It is expected that the hydrocarbon-bearingreservoir will maintain two different isothermal patterns, both on the top andbottom of the structure, which may influence the heat flow patterns in the region
6 T. J. Majumdar and P. Nasipuri

Dow
nloa
ded
By:
[Maj
umda
r, T.
J.]
At:
11:1
5 3
Dec
embe
r 200
7
(Majumdar et al. 1983). A test site around Shobhasan covering an area of 40 km2
was selected for this study. The aerial thermal IR (8.5–12.5 mm) data were acquired.The sensor calibration curve is utilized to obtain the surface temperatures. Thesurface and subsurface temperatures were measured at limited ground control pointsand from a few drill wells, respectively. The test area is divided into grids, each0.25 km2 in size. Thus the heat flow data comprise a set of spatially distributed fieldstrength values on the surface generated by an array of point sources representingeach grid. The value of rock thermal conductivity (K) and diffusivity (K0 ¼K/rC)(r is the density and C is the specific heat of the material) are assumed to be 0.005 calcm71 8C s (2.09 W m71 K71) and 0.01 cm2 s71 (100 m2 s71), respectively on thebasis of available lithologs of the area (Sabins 1997). From the available temperaturelogs, a calibration curve was made for surface temperature as a function ofgeothermal gradient (figure 2) (Majumdar et al. 1983).Initially a set of points for which bore hole data were available were chosen to
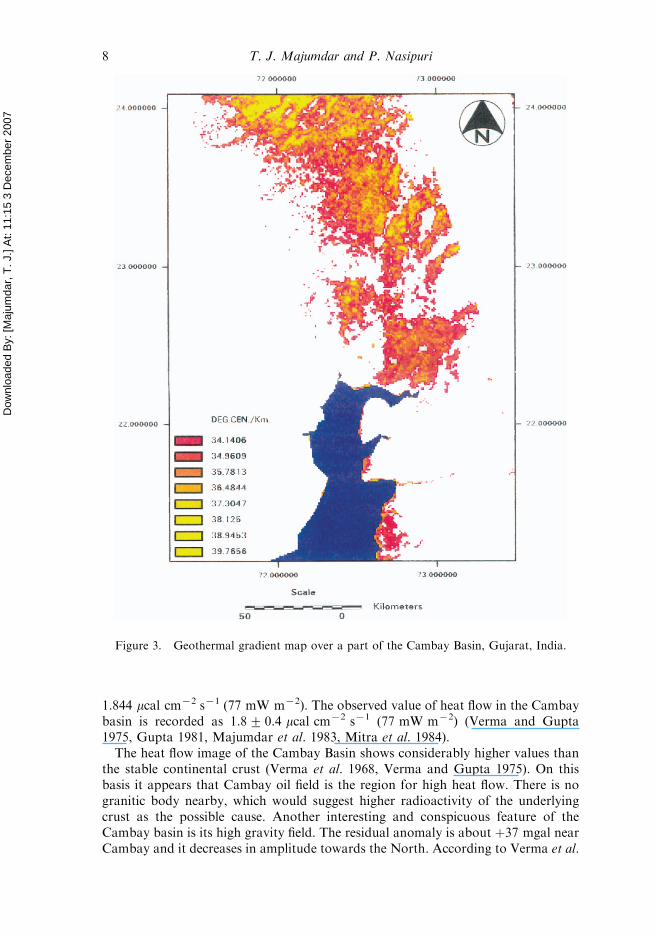
make a calibration curve with the corresponding surface temperatures and thegeothermal gradients. Later, a model using the heat flow continuation technique(Brott et al. 1981) was used to validate the subsurface temperatures using the avai-lable lithologs, which showed satisfactory results (Majumdar et al. 1983). The geo-thermal gradient image of Cambay Basin (figure 3) was then generated using thecalibration curve shown in figure 2.
5. Results and discussion
The overall geothermal gradient values over the Cambay Basin vary from 308Ckm71 to 408C km71. Assuming the rock conductivity 0.005 cal cm71 8C71 s71
(2.09 W m71 K71) based on the lithology of the area concerned, the heat flow map(figure 4) of the area is generated using equation (3). The heat flow varies from1.7 mcal cm72 s71 to 1.99 mcal cm72 s71 (75–93 mW m72) with a mean value of
Figure 2. Calibration curve of geothermal gradient and surface temperature.
Heat flow map generation 7
Dow
nloa
ded
By:
[Maj
umda
r, T.
J.]
At:
11:1
5 3
Dec
embe
r 200
7
1.844 mcal cm72 s71 (77 mW m72). The observed value of heat flow in the Cambaybasin is recorded as 1.8+ 0.4 mcal cm72 s71 (77 mW m72) (Verma and Gupta1975, Gupta 1981, Majumdar et al. 1983, Mitra et al. 1984).The heat flow image of the Cambay Basin shows considerably higher values than
the stable continental crust (Verma et al. 1968, Verma and Gupta 1975). On thisbasis it appears that Cambay oil field is the region for high heat flow. There is nogranitic body nearby, which would suggest higher radioactivity of the underlyingcrust as the possible cause. Another interesting and conspicuous feature of theCambay basin is its high gravity field. The residual anomaly is about þ37 mgal nearCambay and it decreases in amplitude towards the North. According to Verma et al.
Figure 3. Geothermal gradient map over a part of the Cambay Basin, Gujarat, India.
8 T. J. Majumdar and P. Nasipuri

Dow
nloa
ded
By:
[Maj
umda
r, T.
J.]
At:
11:1
5 3
Dec
embe
r 200
7
(1968) and Gupta (1981) this gravity high is due to the presence of an intrusive bodyin the Earth’s crust at a depth of about 10 km. The presence of such an intrusivebody can explain the high heat flow as well as gravity high in the basin, which mighthave been caused by the frictional heating of the intrusive body.The study of the hydrocarbon accumulation indicates that the light oil is found in
Shobhasan, Ankleshwar, Broach areas, whereas in those areas where the heat flow iscomparatively high, the percentage of gas gradually increased (The Cambay GasField) (Verma and Gupta 1975, Majumdar et al. 1983, Mitra et al. 1984, RaviShankar 1988). In this way, the heat flow map has been prepared from thermal IRimages after making the necessary corrections and the obtained heat flow valuescorrespond well with the ‘Field Estimated Heat Flow’ (Ravi Shankar 1988). A
Figure 4. Heat flow map over a part of the Cambay Basin, Gujarat, India.
Heat flow map generation 9
Dow
nloa
ded
By:
[Maj
umda
r, T.
J.]
At:
11:1
5 3
Dec
embe
r 200
7
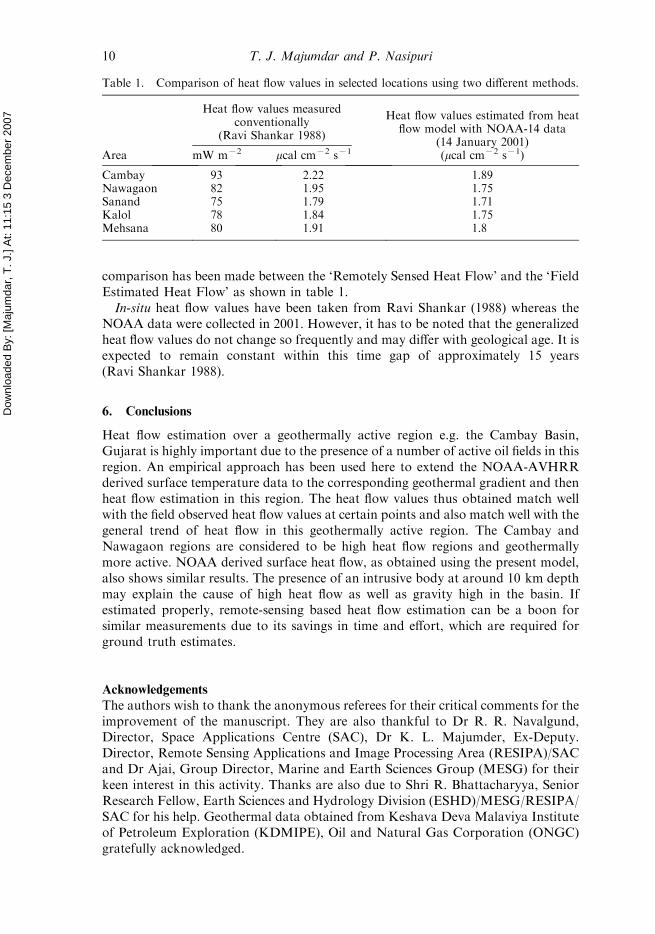
comparison has been made between the ‘Remotely Sensed Heat Flow’ and the ‘FieldEstimated Heat Flow’ as shown in table 1.In-situ heat flow values have been taken from Ravi Shankar (1988) whereas the
NOAA data were collected in 2001. However, it has to be noted that the generalizedheat flow values do not change so frequently and may differ with geological age. It isexpected to remain constant within this time gap of approximately 15 years(Ravi Shankar 1988).
6. Conclusions
Heat flow estimation over a geothermally active region e.g. the Cambay Basin,Gujarat is highly important due to the presence of a number of active oil fields in thisregion. An empirical approach has been used here to extend the NOAA-AVHRRderived surface temperature data to the corresponding geothermal gradient and thenheat flow estimation in this region. The heat flow values thus obtained match wellwith the field observed heat flow values at certain points and also match well with thegeneral trend of heat flow in this geothermally active region. The Cambay andNawagaon regions are considered to be high heat flow regions and geothermallymore active. NOAA derived surface heat flow, as obtained using the present model,also shows similar results. The presence of an intrusive body at around 10 km depthmay explain the cause of high heat flow as well as gravity high in the basin. Ifestimated properly, remote-sensing based heat flow estimation can be a boon forsimilar measurements due to its savings in time and effort, which are required forground truth estimates.
Acknowledgements
The authors wish to thank the anonymous referees for their critical comments for theimprovement of the manuscript. They are also thankful to Dr R. R. Navalgund,Director, Space Applications Centre (SAC), Dr K. L. Majumder, Ex-Deputy.Director, Remote Sensing Applications and Image Processing Area (RESIPA)/SACand Dr Ajai, Group Director, Marine and Earth Sciences Group (MESG) for theirkeen interest in this activity. Thanks are also due to Shri R. Bhattacharyya, SeniorResearch Fellow, Earth Sciences and Hydrology Division (ESHD)/MESG/RESIPA/SAC for his help. Geothermal data obtained from Keshava Deva Malaviya Instituteof Petroleum Exploration (KDMIPE), Oil and Natural Gas Corporation (ONGC)gratefully acknowledged.
Table 1. Comparison of heat flow values in selected locations using two different methods.
Heat flow values measuredconventionally
(Ravi Shankar 1988)
Heat flow values estimated from heatflow model with NOAA-14 data
(14 January 2001)Area mW m72 mcal cm72 s71 (mcal cm72 s71)
Cambay 93 2.22 1.89Nawagaon 82 1.95 1.75Sanand 75 1.79 1.71Kalol 78 1.84 1.75Mehsana 80 1.91 1.8
10 T. J. Majumdar and P. Nasipuri

Dow
nloa
ded
By:
[Maj
umda
r, T.
J.]
At:
11:1
5 3
Dec
embe
r 200
7
References
BECKER, F., 1987, The impact of spectral emissivity on the measurement of land surfacetemperature from a satellite. International Journal of Remote Sensing, 8, 1509–1522.
BESSE, J. and COURTILLOT, V., 1988, Paleogeographic maps of the continents bordering theIndian ocean since the early Jurassic. Journal of Geophysical Research, 93, 11791–11808.
BISWAS, S.K., 1987, Regional tectonic framework, structure and evolution of the Westernmarginal basins of India. Tectonophysics, 135, 307–327.
BROTT, C.A., BLACKWELL, D.D. and MORGAN, P., 1981, Continuation of heat flow data:
a method to construct isotherms in geothermal areas. Geophysics, 46, 1732–1744.CARSLAW, H.S. and JAEGER, J.C., 1959, Conduction of Heat in Solids, 2nd edn
(Oxford: Claredon Press).COLL, C., CASELLES, V., SOBRINO, J.A. and VALOR, E., 1994, On the atmospheric dependence
of the split-window equation for land surface temperatures. International Journal ofRemote Sensing, 15, 105–122.
COOPER, D.I. and ASRAR, G., 1988, Evaluating atmospheric correction models for retrieving
surface temperature from AVHRR over a tallgrass Prairie. Remote Sensing ofEnvironment, 27, 93–102.
CRACKNELL, A.P. and XUE, Y., 1996, Estimation of ground heat flux using AVHRR data and
an advanced thermal inertia model (SoA-TI) model). International Journal of RemoteSensing, 17, 637–642.
DI, L. and RUNDQUIST, D.C., 1994, A one-step algorithm for correction and calibration ofAVHRR level lb data. Photogrammetric Engineering and Remote Sensing, 60, 165–171.
GORNY, V.I., KRITSUK, S.G., LATIPOV, I.SH. and TRONIN, A.A., 1996, Terrestrial heat fluxmeasuring and geothermal zoning for regional and petroleum geology on the base ofsatellite IR-Thermal Survey (STS). Proceedings of the Eleventh Thematic Conference
on Geologic Remote Sensing, V. 1, 27–29 February 1996, Las Vegas, Nevada, USA(Ann Arbor, MI: Environmental Research Institute of Michigan (ERIM)), 594–605.
GUPTA, M.L., 1981, Surface heat flow and igneous intrusion in Cambay basin, India. Journal
of Volcanology and Geothermal Research, 10, 279–292.GUPTA, M.L., 1982, Heat flow in Indian peninsula: its geological and geophysical
implications. Tectonophysics, 83, 71–90.
KAHLE, A.B., 1977, A simple thermal model for earth’s surface for geologic mapping byremote sensing. Journal of Geophysical Research, 82, 1673–1680.
KEALY, P.S. and HOOK, S.J., 1993, Separating temperature and emissivity in thermal infraredmultispectral scanner data: implications for recovering land surface temperatures.
IEEE Transactions on Geoscience and Remote Sensing, 31, 1155–1164.MCKENZIE, D.P. and SLATER, J.G., 1971, The evolution of the Indian Ocean since the late
Cretaceous. Geophysical Journal of Royal Astrological Society, 25, 437–528.
MAJUMDAR, T.J., 2003, Regional thermal inertia mapping over the Indian subcontinent usingINSAT-1D VHRR data and its possible geological applications. International Journalof Remote Sensing, 24, 2207–2220.
MAJUMDAR, T.J. and BHATTACHARYA, B.B., 1988, Derivation of surface temperatures on landafter correction due to atmospheric water vapour—a case study with INSAT VHRRdata. Remote Sensing of Environment, 26, 185–191.
MAJUMDAR, T.J. and MOHANTY, K.K., 1998, Derivation of land surface temperatures from
MOS-1 VTIR data using split-window channel computation technique. InternationalJournal of Remote Sensing, 19, 287–294.
MAJUMDAR, T.J., KAMAT, D.S., MITRA, D.S. and VARADARAJAN, K., 1983, Construction of
subsurface structural isotherms from thermal IR imagery by heat flow continuationtechnique—an aid to hydrocarbon exploration. ISRO-ONGC Report Keshava DevaMalaviya Institute of Petroleum Exploration, Dehradun, March 1983, p 15.
Heat flow map generation 11

Dow
nloa
ded
By:
[Maj
umda
r, T.
J.]
At:
11:1
5 3
Dec
embe
r 200
7
MERH, S.S., 1995, The Geology of Gujarat (Bangalore: Geological Society of India).MITRA, D.S., DOTIWALA, F., VARADARAJAN, K., MAJUMDAR, T.J. and KAMAT, D.S., 1984,
Correlation of Landsat data with surface and subsurface information—a synergistic,quantitative approach to oil exploration in Gujarat, India. Proceedings Seminar onRemote Sensing in Petroleum Exploration, KDMIPE, Dehradun, 4 December 1984,Space Applications Centre (SAC), Ahmedabad, pp. 2–1 to 2–12.
MORGAN, W.J., 1981, Hotspot tracks and the opening of the Atlantic and Indian oceans. InThe Sea, V. 7, The Oceanic Lithosphere, C. Emiliani (Ed.), pp. 443–487 (New Work:John Wiley).
NASIPURI, P., MITRA, D.S. and MAJUMDAR, T.J., 2005, Generation of thermal inertia imageover a part of Gujarat: a new tool for geological mapping. International Journal ofApplied Earth Observation and Geoinformation, 7, 129–139.
NASIPURI, P., MAJUMDAR, T.J. andMITRA, D.S., 2006, Study of high resolution thermal inertiaover western India oil fields using ASTER data. Acta Astronautica, 58, 270–278.
NOAA 1990, NOAA Polar Orbiter Data User’s Guide. US Department of Commerce, NOAA,
NESDI, NCDC and the Satellite Data Service Division, Washington, DC, USA.PRABHAKARA, C., DALU, G. and KUNDE, V.G., 1974, Estimation of sea surface temperature
from remote sensing in the 11 and 13 mm window regions. Journal of GeophysicalResearch, 79, 5039–5044.
PRATA, A.J., CASELLES, V., COLL, C., SOBRINO, J.A. and OTTLE, C., 1995, Thermal remotesensing of land surface temperature from satellites: current status and future prospects.Remote Sensing Reviews, 12, 173–234.
PRICE, J.C., 1983, Estimating surface temperatures from satellite thermal infrared data—asimple formulation for the atmospheric effect. Remote Sensing of Environment, 13,353–361.
PRICE, J.C., 1984, Land surface temperature measurements from the split window channels ofthe NOAA 7 Advanced Very High Resolution Radiometer. Journal of GeophysicalResearch, 89, 7231–7237.
RAJU, A.T.R., 1968, Geological evolution of Assam and Cambay Tertiary Basins of India.American Association for Petroleum Geologists Bulletin (AAPG), 52, 1136–1150.
RAVI SHANKAR, 1988, Heat flow map of India and discussion on its geologic and economicsignificance. Indian Minerals, 42, 89–110.
SABINS, F.F. (JR), 1997, Remote Sensing: Principles and interpretation (New York: W. H.Freeman & Co.).
SARAF, A.K., PRAKASH, A., SENGUPTA, S. and GUPTA, R.P., 1995, Landsat-TM data for
estimating ground temperature and depth of subsurface coal fire in the Jhariacoalfield, India. International Journal of Remote Sensing, 16, 2111–2124.
SINGH, S.M., 1984, Removal of atmospheric effects on a pixel by pixel basis from the
thermal infrared data from instruments on satellites. The Advanced Very HighResolution Radiometer (AVHRR), India. International Journal of Remote Sensing, 5,161–183.
SWANBERG, C.A. and MORGAN, P., 1978, The linear relation between temperature based on
the silica content of ground water and regional heat flow: a new heat flow map ofUnited States. Pure and Applied Geophysics, 117, 2675–2700.
TAYLOR, S.E., 1979, Measuring emissivity of soils in the southeast United States. Remote
Sensing of Environment, 8, 359–364.TRONIN, A.A., 1996, Satellite thermal survey—a new tool for the studies of seismoactive
regions. International Journal of Remote Sensing, 17, 1439–1455.
VERMA, R.K. and GUPTA, M.L., 1975, Present status of heat flow studies in India. GeophysicalResearch Bulletin, 13, 247–255.
VERMA, R.K., GUPTA, M.L., HAMZA, V.M., RAO, G.V. and RAO, R.U.M., 1968, Heat flow
and crystal structure near Cambay, Gujarat, India. Bulletin NGRI (NationalGeophysical Research Institute), 6, 153–166.
12 T. J. Majumdar and P. Nasipuri

Dow
nloa
ded
By:
[Maj
umda
r, T.
J.]
At:
11:1
5 3
Dec
embe
r 200
7
VIDAL, A., 1991, Atmospheric and emissivity correction of land surface temperature measuredfrom satellites using ground measurements or satellite data. International Journal of
Remote Sensing, 12, 2449–2460.ZHIRONG, L. and MCDONNELL, M., 1988, Atmospheric correction of thermal infrared images.
International Journal of Remote Sensing, 9, 107–121.
Heat flow map generation 13