Categorization of cold period weather types in Greece on the basis of the photointerpretation of...
27
Categorization of cold period weather types in Greece on the basis of the photointerpretation of NOAA/AVHRR imagery C. CARTALIS University of Athens, Department of Applied Physics, Building PHYS-V, Athens, GR-15784 Greece N. CHRYSOULAKIS* Foundation for Research and Technology—Hellas, Institute of Applied and Computational Mathematics, Regional Analysis Division, P.O. Box 1527, Heraklion, Crete, GR-71110 Greece; e-mail: [email protected] H. FEIDAS University of the Aegean, Department of Geography, University Hill, Building of Geography, GR-81100 Mytilene, Greece and N. PITSITAKIS National Meteorological Service, Hellinikon, Athens, Greece (Received 9 July 2002; in final form 11 July 2003 ) Abstract. The Advanced Very High Resolution Radiometer (AVHRR) on board the National Oceanic and Atmospheric Administration (NOAA) satellites may be used to detect and monitor prevailing synoptic weather systems and to describe the state of the atmosphere with very good spatial and temporal resolution. In this study, the synoptic weather types which are responsible for severe cold and rainy weather conditions in Greece during the cold period of the year were examined with the use of NOAA/AVHRR satellite images in con- junction with weather charts. An attempt was made to develop a classification scheme for these synoptic weather types on the basis of their tracks and cloud patterns inferred by satellite images. Forty-two visible and thermal infrared AVHRR images were interpreted with emphasis on the analysis of cloud patterns formed in synoptic weather systems in order to relate cloud features in every image to physical processes. Synoptic maps (12:00 UTC) from the European Centre for Medium-Range Weather Forecasts (ECMWF) were used as auxiliary data. The final product was a categorization of the cloud features formed by each of the four prevailing weather types in the area of Greece for the winter rainy period (three Depressional Weather Types and one Mixed Weather Type). 1. Introduction The Mediterranean basin is well known as a region of frequent cyclone formation and is affected by moving depressions generated either in the Atlantic International Journal of Remote Sensing ISSN 0143-1161 print/ISSN 1366-5901 online # 2004 Taylor & Francis Ltd http://www.tandf.co.uk/journals DOI: 10.1080/01431160310001632684 *Corresponding author. INT. J. REMOTE SENSING, 10 AUGUST, 2004, VOL. 25, NO. 15, 2951–2977
Transcript of Categorization of cold period weather types in Greece on the basis of the photointerpretation of...
Categorization of cold period weather types in Greece on the basis ofthe photointerpretation of NOAA/AVHRR imagery
C. CARTALIS
University of Athens, Department of Applied Physics, Building PHYS-V,Athens, GR-15784 Greece
N. CHRYSOULAKIS*
Foundation for Research and Technology—Hellas, Institute of Applied andComputational Mathematics, Regional Analysis Division, P.O. Box 1527,Heraklion, Crete, GR-71110 Greece; e-mail: [email protected]
H. FEIDAS
University of the Aegean, Department of Geography, University Hill,Building of Geography, GR-81100 Mytilene, Greece
and N. PITSITAKIS
National Meteorological Service, Hellinikon, Athens, Greece
(Received 9 July 2002; in final form 11 July 2003 )
Abstract. The Advanced Very High Resolution Radiometer (AVHRR) onboard the National Oceanic and Atmospheric Administration (NOAA) satellitesmay be used to detect and monitor prevailing synoptic weather systems and todescribe the state of the atmosphere with very good spatial and temporalresolution. In this study, the synoptic weather types which are responsible forsevere cold and rainy weather conditions in Greece during the cold period of theyear were examined with the use of NOAA/AVHRR satellite images in con-junction with weather charts. An attempt was made to develop a classificationscheme for these synoptic weather types on the basis of their tracks and cloudpatterns inferred by satellite images. Forty-two visible and thermal infraredAVHRR images were interpreted with emphasis on the analysis of cloud patternsformed in synoptic weather systems in order to relate cloud features in everyimage to physical processes. Synoptic maps (12:00 UTC) from the EuropeanCentre for Medium-Range Weather Forecasts (ECMWF) were used as auxiliarydata. The final product was a categorization of the cloud features formed by eachof the four prevailing weather types in the area of Greece for the winter rainyperiod (three Depressional Weather Types and one Mixed Weather Type).
1. Introduction
The Mediterranean basin is well known as a region of frequent cyclone
formation and is affected by moving depressions generated either in the Atlantic
International Journal of Remote SensingISSN 0143-1161 print/ISSN 1366-5901 online # 2004 Taylor & Francis Ltd
http://www.tandf.co.uk/journalsDOI: 10.1080/01431160310001632684
*Corresponding author.
INT. J. REMOTE SENSING, 10 AUGUST, 2004,VOL. 25, NO. 15, 2951–2977
Ocean or in north-western Europe. Preferred regions for cyclogenesis in the
Mediterranean region were identified by Radinovic (1987). The depressions
occurring in specific areas of the Mediterranean region and the cyclonic tracks
have been the subject of extensive climatological research (e.g. Maheras 1979, 1983,
1988a, Katsoulis 1980, Prezerakos 1985, Flocas 1988, Kassomenos et al. 1998). In
these studies, the depressions were identified and classified manually on the basis of
synoptic charts. An automatic classification of circulation types in Greece has been
recently developed using spatial methods of topology and geometry by Maheras
et al. (2000, 2001).The central Mediterranean is affected by depressions in the westerly circulation
and at the same time is largely influenced by meridional circulations and depres-
sions formed over the western and central Mediterranean or over the Sahara
Desert. The meridional circulation is the main factor governing most of the pre-
cipitation over the whole of the Mediterranean basin (Maheras 1988a, b, Maheras
et al. 1992).
The cold period in Greece occurs between late October and early April. The
duration of the cold period is of significant importance to the country, because
during this period the largest amount of rain is accumulated. The main synoptic
weather types which affect the broader area of Greece in winter are classified by
Maheras (1979, 1983, 1988a) as follows:
. Anticyclonic Weather Type, in which an anticyclone is positioned peri-
pherally to or over Greece. This weather type favours fair and dry weather;
. Depressional Weather Type, in which a depression follows a zonal track from
west to east or a semi-meridional track from north-west to south-east. This
weather type favours cold and rainy weather with strong winds; and
. Mixed Weather Type, in which an anticyclone is combined with a depression
causing a tied pressure gradient over Greece. Mixed Weather Types cause
severe cold weather, with rainfall and snowfall mainly over central and
northern Greece, with very low temperatures and very strong north-easterly
winds.
Despite the considerable research on the climatology of Mediterranean cyclones,
there is still a need to correlate depressional weather types with cloud types and
patterns developed over an area with various terrain features like Greece. In this
study, weather types which are responsible for severe cold and rainy weather
conditions in Greece during the cold period are identified on the basis of their
tracks and cloud patterns inferred by satellite images in conjunction with weather
charts. Afterwards, the interpretation of a large number of related satellite images
was carried out, in order to categorize the cloud features in the area of Greece
formed by each prevailing weather type.
2. Data and methodology
For the purposes of this study, high spatial resolution Advanced Very High
Resolution Radiometer (AVHRR) images (Local Area Coverage) were used as
acquired from the National Oceanic and Atmospheric Administration (NOAA)
ground receiving station of the National Meteorological Service. AVHRR has a
spatial resolution of 1.1 km at the nadir and a swath coverage of 2700 km. AVHRR
records incoming radiation using five spectral channels: channel 1, 0.58–0.68 mm
(visible); channel 2, 0.72–1.10 mm (near-infrared); channel 3, 3.55–3.93 mm (mid-
infrared); channel 4, 10.5–11.3 mm (thermal infrared) and channel 5, 11.5–12.5 mm
2952 C. Cartalis et al.
(thermal infrared). In this study, only channels 1 and 4 were used for the photo-
interpretation. The spatial resolution of AVHRR data (1.1 km) enables the
identification of cloud patterns linked with small-scale physical processes and
permits a more detailed cloud analysis in comparison to the coarse spatial
resolution of the geostationary data (6.5–7.5 in the area of Greece).
Forty-two cases were selected for days when well-developed low-pressure
systems were located over the broader area of Greece (table 1). Fifty-nine AVHRR
images (one to two images per day) were used, depending on the passage of NOAA-
14, NOAA-12 and NOAA-9 over the area of east Mediterranean, during the
periods January to April and October to December 1995. At least one image per day
was daytime (reception times close to 12:00 UTC), therefore the best distinctness
was achieved for the visible channel.
Synoptic analysis maps (12:00 UTC) from the European Centre for Medium-
Range Weather Forecasts (ECMWF) have also been used. These maps presented
graphically the horizontal distribution (over Europe and the Mediterranean Sea) of
the following parameters:
. 500 hPa contour lines;
. 500 hPa isotherms;
. 500 hPa isotachs of vertical velocity;
. surface isobars; and
. 850 hPa isotherms.
Synoptic analysis maps were used as auxiliary data for the photointerpretation.
The analysis of cloud patterns was used to estimate the synoptic system types as
well as their location. The type and the location of the synoptic systems were
verified using the respective synoptic analysis maps. The analysis of cloud patterns
on satellite images was also related to physical processes. This relation was also
verified using the synoptic analysis maps, e.g. the detection of cumulonimbus clouds
on the satellite image was verified using the 500 hPa isotachs map of vertical motion
in which convective motion areas can be located.
The combination of visible with thermal infrared imagery photointerpretation
was necessary to define the atmospheric mechanisms. Clouds and cloud system
identification on satellite images were based on shape, texture and pattern recogni-
tion relating to the spatial arrangement of cloud elements, on indications of height
revealed directly in the infrared imagery and deducible in visible imagery, and the
relation to local topography. Clouds viewed in satellite imagery were classified into
three general categories based on appearance: cumuliform, stratiform and cirriform.
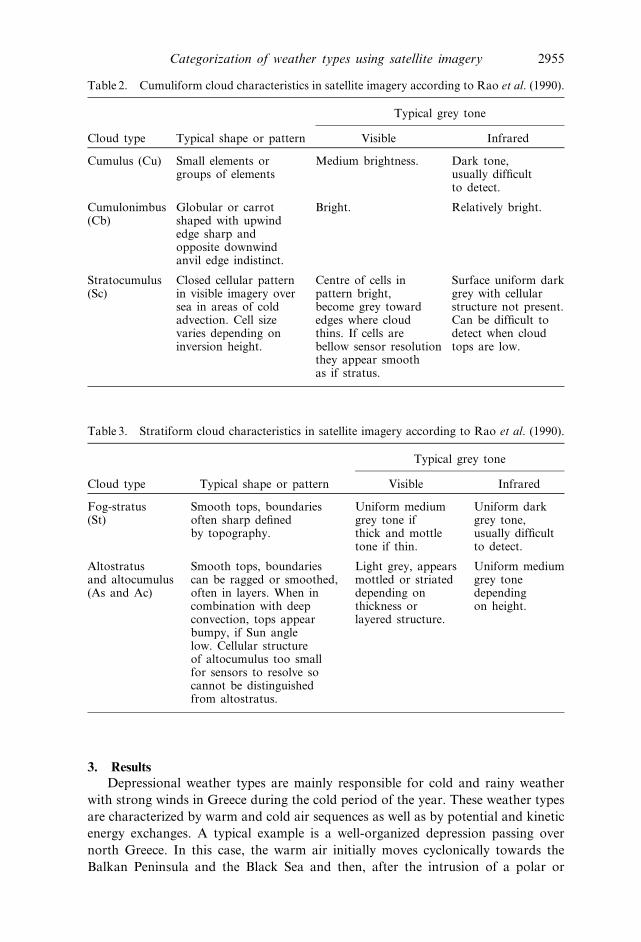
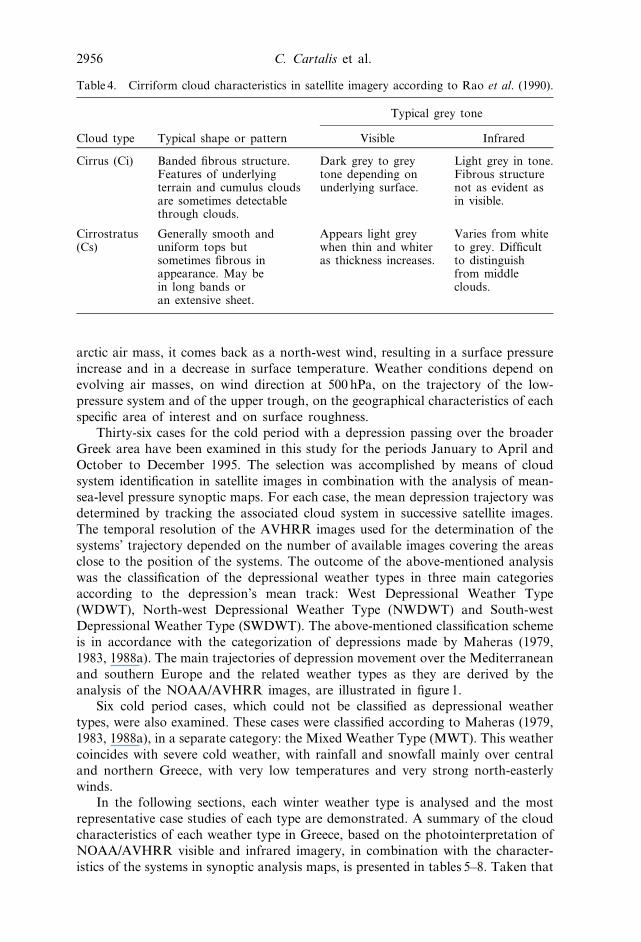
The characteristics of the individual cloud types which form the cumuliform,
stratiform and cirriform categories are summarized in tables 2, 3 and 4 (Rao et al.
1990). Detection of fronts has been accomplished using the basic principles of
identification of weather systems on satellite imagery (Rao et al. 1990, Bader et al.
1995). Briefly, a classical cold frontal cloud band is defined as continuous, relatively
broad cloud formation with mostly cold tops, bright in the visible images, char-
acterized by a distinct long axis with or without curvature. It has a sharp rear edge
and sometimes a distinct forward edge where the surface front is located. The wide
zone of overcast cloudiness is on the cold side of the surface frontal position.
Concerning warm frontal bands, if there is little or no high cloud in the warm
sector, the warm frontal position may be well defined by a band of cold clouds in
the infrared image. However, high cloud in the warm sector may merge with the
Categorization of weather types using satellite imagery 2953
frontal band, making the warm front difficult to locate. In this case, the distance
between the cold clouds’ edge and surface front for an active system is typically
about 500 km but this will depend, for instance, on the slope of the front.
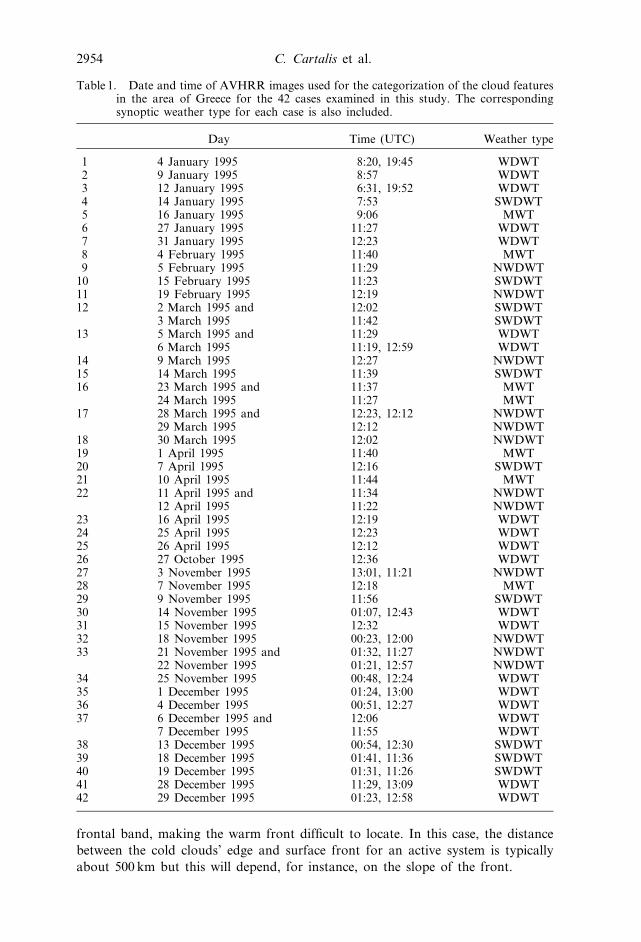
Table 1. Date and time of AVHRR images used for the categorization of the cloud featuresin the area of Greece for the 42 cases examined in this study. The correspondingsynoptic weather type for each case is also included.
Day Time (UTC) Weather type
1 4 January 1995 8:20, 19:45 WDWT2 9 January 1995 8:57 WDWT3 12 January 1995 6:31, 19:52 WDWT4 14 January 1995 7:53 SWDWT5 16 January 1995 9:06 MWT6 27 January 1995 11:27 WDWT7 31 January 1995 12:23 WDWT8 4 February 1995 11:40 MWT9 5 February 1995 11:29 NWDWT
10 15 February 1995 11:23 SWDWT11 19 February 1995 12:19 NWDWT12 2 March 1995 and 12:02 SWDWT
3 March 1995 11:42 SWDWT13 5 March 1995 and 11:29 WDWT
6 March 1995 11:19, 12:59 WDWT14 9 March 1995 12:27 NWDWT15 14 March 1995 11:39 SWDWT16 23 March 1995 and 11:37 MWT
24 March 1995 11:27 MWT17 28 March 1995 and 12:23, 12:12 NWDWT
29 March 1995 12:12 NWDWT18 30 March 1995 12:02 NWDWT19 1 April 1995 11:40 MWT20 7 April 1995 12:16 SWDWT21 10 April 1995 11:44 MWT22 11 April 1995 and 11:34 NWDWT
12 April 1995 11:22 NWDWT23 16 April 1995 12:19 WDWT24 25 April 1995 12:23 WDWT25 26 April 1995 12:12 WDWT26 27 October 1995 12:36 WDWT27 3 November 1995 13:01, 11:21 NWDWT28 7 November 1995 12:18 MWT29 9 November 1995 11:56 SWDWT30 14 November 1995 01:07, 12:43 WDWT31 15 November 1995 12:32 WDWT32 18 November 1995 00:23, 12:00 NWDWT33 21 November 1995 and 01:32, 11:27 NWDWT
22 November 1995 01:21, 12:57 NWDWT34 25 November 1995 00:48, 12:24 WDWT35 1 December 1995 01:24, 13:00 WDWT36 4 December 1995 00:51, 12:27 WDWT37 6 December 1995 and 12:06 WDWT
7 December 1995 11:55 WDWT38 13 December 1995 00:54, 12:30 SWDWT39 18 December 1995 01:41, 11:36 SWDWT40 19 December 1995 01:31, 11:26 SWDWT41 28 December 1995 11:29, 13:09 WDWT42 29 December 1995 01:23, 12:58 WDWT
2954 C. Cartalis et al.
3. Results
Depressional weather types are mainly responsible for cold and rainy weather
with strong winds in Greece during the cold period of the year. These weather types
are characterized by warm and cold air sequences as well as by potential and kinetic
energy exchanges. A typical example is a well-organized depression passing over
north Greece. In this case, the warm air initially moves cyclonically towards the
Balkan Peninsula and the Black Sea and then, after the intrusion of a polar or
Table 2. Cumuliform cloud characteristics in satellite imagery according to Rao et al. (1990).
Cloud type Typical shape or pattern
Typical grey tone
Visible Infrared
Cumulus (Cu) Small elements orgroups of elements
Medium brightness. Dark tone,usually difficultto detect.
Cumulonimbus(Cb)
Globular or carrotshaped with upwindedge sharp andopposite downwindanvil edge indistinct.
Bright. Relatively bright.
Stratocumulus(Sc)
Closed cellular patternin visible imagery oversea in areas of coldadvection. Cell sizevaries depending oninversion height.
Centre of cells inpattern bright,become grey towardedges where cloudthins. If cells arebellow sensor resolutionthey appear smoothas if stratus.
Surface uniform darkgrey with cellularstructure not present.Can be difficult todetect when cloudtops are low.
Table 3. Stratiform cloud characteristics in satellite imagery according to Rao et al. (1990).
Cloud type Typical shape or pattern
Typical grey tone
Visible Infrared
Fog-stratus(St)
Smooth tops, boundariesoften sharp definedby topography.
Uniform mediumgrey tone ifthick and mottletone if thin.
Uniform darkgrey tone,usually difficultto detect.
Altostratusand altocumulus(As and Ac)
Smooth tops, boundariescan be ragged or smoothed,often in layers. When incombination with deepconvection, tops appearbumpy, if Sun anglelow. Cellular structureof altocumulus too smallfor sensors to resolve socannot be distinguishedfrom altostratus.
Light grey, appearsmottled or striateddepending onthickness orlayered structure.
Uniform mediumgrey tonedependingon height.
Categorization of weather types using satellite imagery 2955
arctic air mass, it comes back as a north-west wind, resulting in a surface pressure
increase and in a decrease in surface temperature. Weather conditions depend on
evolving air masses, on wind direction at 500 hPa, on the trajectory of the low-
pressure system and of the upper trough, on the geographical characteristics of each
specific area of interest and on surface roughness.
Thirty-six cases for the cold period with a depression passing over the broader
Greek area have been examined in this study for the periods January to April and
October to December 1995. The selection was accomplished by means of cloud
system identification in satellite images in combination with the analysis of mean-
sea-level pressure synoptic maps. For each case, the mean depression trajectory was
determined by tracking the associated cloud system in successive satellite images.
The temporal resolution of the AVHRR images used for the determination of the
systems’ trajectory depended on the number of available images covering the areas
close to the position of the systems. The outcome of the above-mentioned analysis
was the classification of the depressional weather types in three main categories
according to the depression’s mean track: West Depressional Weather Type
(WDWT), North-west Depressional Weather Type (NWDWT) and South-west
Depressional Weather Type (SWDWT). The above-mentioned classification scheme
is in accordance with the categorization of depressions made by Maheras (1979,
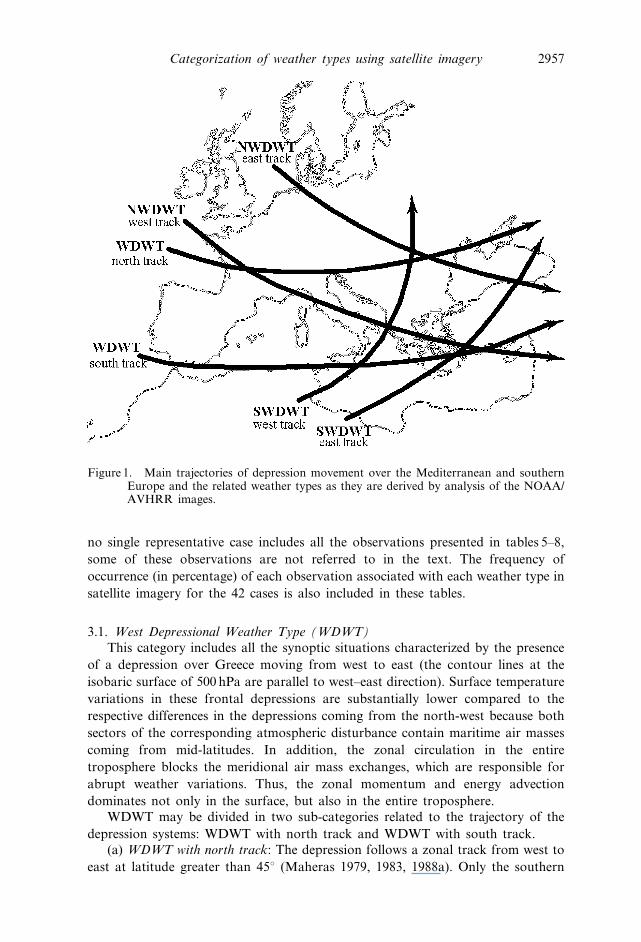
1983, 1988a). The main trajectories of depression movement over the Mediterranean
and southern Europe and the related weather types as they are derived by the
analysis of the NOAA/AVHRR images, are illustrated in figure 1.
Six cold period cases, which could not be classified as depressional weather
types, were also examined. These cases were classified according to Maheras (1979,
1983, 1988a), in a separate category: the Mixed Weather Type (MWT). This weather
coincides with severe cold weather, with rainfall and snowfall mainly over central
and northern Greece, with very low temperatures and very strong north-easterly
winds.
In the following sections, each winter weather type is analysed and the most
representative case studies of each type are demonstrated. A summary of the cloud
characteristics of each weather type in Greece, based on the photointerpretation of
NOAA/AVHRR visible and infrared imagery, in combination with the character-
istics of the systems in synoptic analysis maps, is presented in tables 5–8. Taken that
Table 4. Cirriform cloud characteristics in satellite imagery according to Rao et al. (1990).
Cloud type Typical shape or pattern
Typical grey tone
Visible Infrared
Cirrus (Ci) Banded fibrous structure.Features of underlyingterrain and cumulus cloudsare sometimes detectablethrough clouds.
Dark grey to greytone depending onunderlying surface.
Light grey in tone.Fibrous structurenot as evident asin visible.
Cirrostratus(Cs)
Generally smooth anduniform tops butsometimes fibrous inappearance. May bein long bands oran extensive sheet.
Appears light greywhen thin and whiteras thickness increases.
Varies from whiteto grey. Difficultto distinguishfrom middleclouds.
2956 C. Cartalis et al.
no single representative case includes all the observations presented in tables 5–8,
some of these observations are not referred to in the text. The frequency of
occurrence (in percentage) of each observation associated with each weather type in
satellite imagery for the 42 cases is also included in these tables.
3.1. West Depressional Weather Type (WDWT)
This category includes all the synoptic situations characterized by the presence
of a depression over Greece moving from west to east (the contour lines at the
isobaric surface of 500 hPa are parallel to west–east direction). Surface temperature
variations in these frontal depressions are substantially lower compared to the
respective differences in the depressions coming from the north-west because both
sectors of the corresponding atmospheric disturbance contain maritime air masses
coming from mid-latitudes. In addition, the zonal circulation in the entire
troposphere blocks the meridional air mass exchanges, which are responsible for
abrupt weather variations. Thus, the zonal momentum and energy advection
dominates not only in the surface, but also in the entire troposphere.
WDWT may be divided in two sub-categories related to the trajectory of the
depression systems: WDWT with north track and WDWT with south track.
(a) WDWT with north track: The depression follows a zonal track from west to
east at latitude greater than 45‡ (Maheras 1979, 1983, 1988a). Only the southern
Figure 1. Main trajectories of depression movement over the Mediterranean and southernEurope and the related weather types as they are derived by analysis of the NOAA/AVHRR images.
Categorization of weather types using satellite imagery 2957
edge of such depression systems affects Greece. The weather is clement, with south
winds, variable clouds and very little rainfall.
(b) WDWT with south track: This weather type is generated by depressions with
Atlantic or Mediterranean origin moving on a zonal track but at a latitude lower
than 45‡. This weather type brings cold weather with rain all over Greece; it is a
weather type typical of the winter period (Maheras 1979, 1983, 1988a). In the first
case, the depressions with Atlantic origin are attenuated when reaching Greece due
to their long path over the Atlantic, west and central Mediterranean; therefore they
are associated with occluded fronts. In the second case, the depressions are formed
over west or central Mediterranean in association with a south-west extension of
the Siberian cold anticyclone, which interrupts the zonal circulation (blocking
situation).A summary of the cloud characteristics of WDWT in Greece, based on
photointerpretation of NOAA/AVHRR visible and infrared imagery, in combina-
tion with the characteristics of the systems in synoptic analysis maps, is presented in
table 5. In the following sections, two representative case studies of WDWT are
demonstrated.
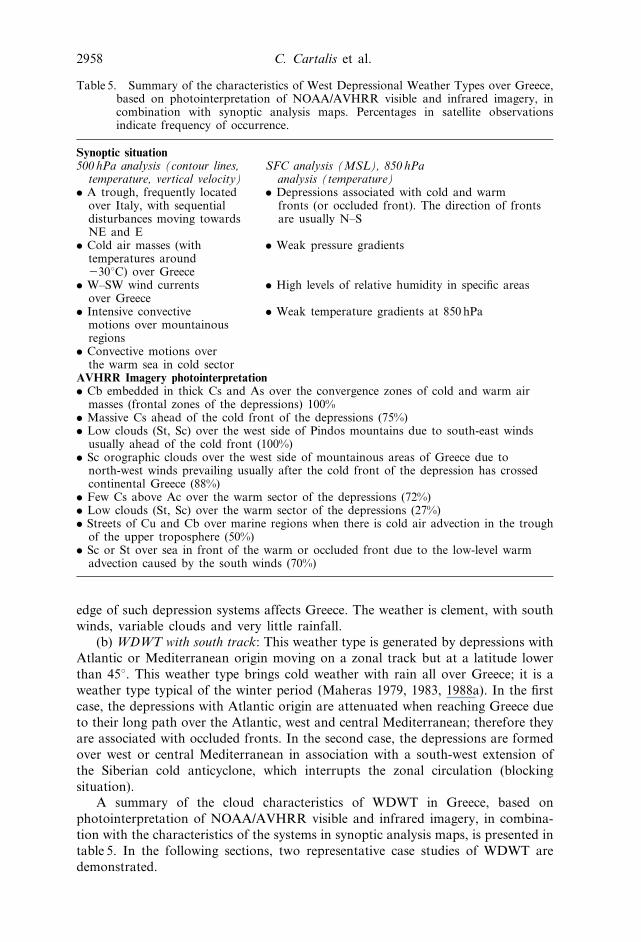
Table 5. Summary of the characteristics of West Depressional Weather Types over Greece,based on photointerpretation of NOAA/AVHRR visible and infrared imagery, incombination with synoptic analysis maps. Percentages in satellite observationsindicate frequency of occurrence.
Synoptic situation500 hPa analysis (contour lines,
temperature, vertical velocity)SFC analysis (MSL), 850 hPa
analysis (temperature). A trough, frequently located
over Italy, with sequentialdisturbances moving towardsNE and E
. Depressions associated with cold and warmfronts (or occluded front). The direction of frontsare usually N–S
. Cold air masses (withtemperatures around230‡C) over Greece
. Weak pressure gradients
. W–SW wind currentsover Greece
. High levels of relative humidity in specific areas
. Intensive convectivemotions over mountainousregions
. Weak temperature gradients at 850 hPa
. Convective motions overthe warm sea in cold sector
AVHRR Imagery photointerpretation. Cb embedded in thick Cs and As over the convergence zones of cold and warm air
masses (frontal zones of the depressions) 100%. Massive Cs ahead of the cold front of the depressions (75%). Low clouds (St, Sc) over the west side of Pindos mountains due to south-east winds
usually ahead of the cold front (100%). Sc orographic clouds over the west side of mountainous areas of Greece due to
north-west winds prevailing usually after the cold front of the depression has crossedcontinental Greece (88%)
. Few Cs above Ac over the warm sector of the depressions (72%)
. Low clouds (St, Sc) over the warm sector of the depressions (27%)
. Streets of Cu and Cb over marine regions when there is cold air advection in the troughof the upper troposphere (50%)
. Sc or St over sea in front of the warm or occluded front due to the low-level warmadvection caused by the south winds (70%)
2958 C. Cartalis et al.
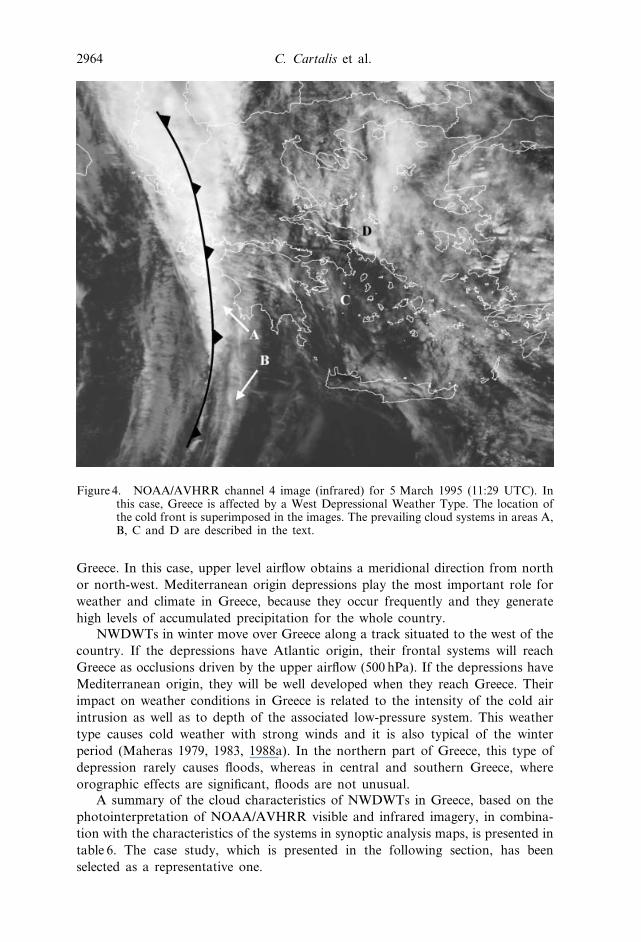
3.1.1. Case study 1: 5 March 1995
The synoptic situation is presented in figure 2. The 500 hPa height analysis
shows that there is a cut-off-low associated with a trough over Italy containing a
very cold air mass (230‡C). The trough is affecting west Greece while moving
towards the east-north-east. The combination of the surface analysis and 850 hPa
temperature analysis shows that there is a depression (not very well developed) over
the same area associated with a cold front along the western coastline of Greece.
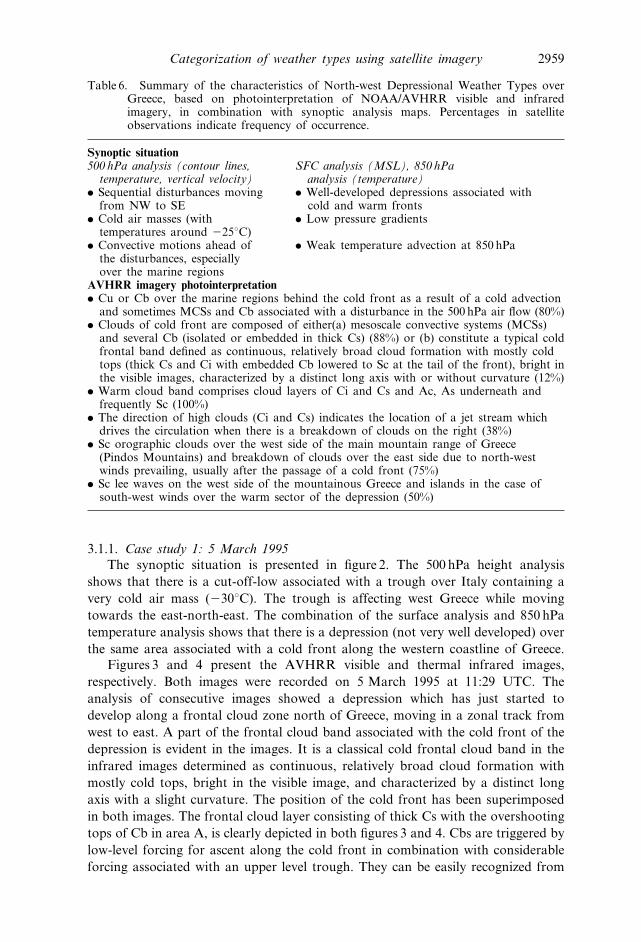
Figures 3 and 4 present the AVHRR visible and thermal infrared images,
respectively. Both images were recorded on 5 March 1995 at 11:29 UTC. The
analysis of consecutive images showed a depression which has just started to
develop along a frontal cloud zone north of Greece, moving in a zonal track from
west to east. A part of the frontal cloud band associated with the cold front of the
depression is evident in the images. It is a classical cold frontal cloud band in the
infrared images determined as continuous, relatively broad cloud formation with
mostly cold tops, bright in the visible image, and characterized by a distinct long
axis with a slight curvature. The position of the cold front has been superimposed
in both images. The frontal cloud layer consisting of thick Cs with the overshooting
tops of Cb in area A, is clearly depicted in both figures 3 and 4. Cbs are triggered by
low-level forcing for ascent along the cold front in combination with considerable
forcing associated with an upper level trough. They can be easily recognized from
Table 6. Summary of the characteristics of North-west Depressional Weather Types overGreece, based on photointerpretation of NOAA/AVHRR visible and infraredimagery, in combination with synoptic analysis maps. Percentages in satelliteobservations indicate frequency of occurrence.
Synoptic situation500 hPa analysis (contour lines,
temperature, vertical velocity)SFC analysis (MSL), 850 hPa
analysis (temperature). Sequential disturbances moving
from NW to SE. Well-developed depressions associated with
cold and warm fronts. Cold air masses (with
temperatures around 225‡C). Low pressure gradients
. Convective motions ahead ofthe disturbances, especiallyover the marine regions
. Weak temperature advection at 850 hPa
AVHRR imagery photointerpretation. Cu or Cb over the marine regions behind the cold front as a result of a cold advection
and sometimes MCSs and Cb associated with a disturbance in the 500 hPa air flow (80%). Clouds of cold front are composed of either(a) mesoscale convective systems (MCSs)
and several Cb (isolated or embedded in thick Cs) (88%) or (b) constitute a typical coldfrontal band defined as continuous, relatively broad cloud formation with mostly coldtops (thick Cs and Ci with embedded Cb lowered to Sc at the tail of the front), bright inthe visible images, characterized by a distinct long axis with or without curvature (12%)
. Warm cloud band comprises cloud layers of Ci and Cs and Ac, As underneath andfrequently Sc (100%)
. The direction of high clouds (Ci and Cs) indicates the location of a jet stream whichdrives the circulation when there is a breakdown of clouds on the right (38%)
. Sc orographic clouds over the west side of the main mountain range of Greece(Pindos Mountains) and breakdown of clouds over the east side due to north-westwinds prevailing, usually after the passage of a cold front (75%)
. Sc lee waves on the west side of the mountainous Greece and islands in the case ofsouth-west winds over the warm sector of the depression (50%)
Categorization of weather types using satellite imagery 2959
the shadow of overshooting tops on the underlying Cs layer in the visible image, as
well as from the high brightness values (very low cloud top temperatures) of their
tops in the thermal infrared image. There are also Ac and As in the area A, as well
as lower clouds as Sc or St. The formation of low clouds is favoured along the west
coastline of Greece because the south-easterly winds, which are blown in front of
the cold front, transfer warm and wet air masses over this area. The adiabatic
cooling of these air masses, as they rise over the Pindos mountains (a mountain
chain along the west coastline of Greece), is the main reason for the low clouds’
formation in the area A. Cs are located in the area B, ahead of the cold front. These
clouds are transparent in the visible (figure 3). The areas C and D correspond to
thin Ci and Cs, which are characteristic cloud types of the warm section of the
depression (Bader et al. 1995). The fibrous nature of Ci can be seen more clearly in
figure 3. The very low top temperatures of Ci are obvious in figure 4 (very bright
tones).
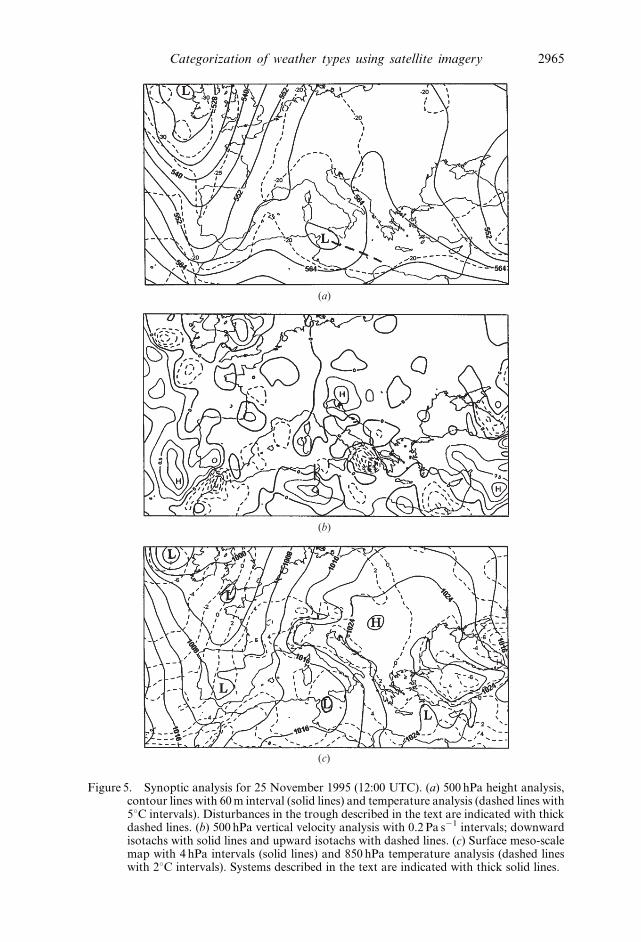
3.1.2. Case study 2: 25 November 1995
The synoptic situation is presented in figure 5. The 500 hPa analysis shows that
there is a deep (5580 m) low near Sicily associated with a trough over the Ionian
Table 7. Summary of the characteristics of South-west Depressional Weather Types overGreece, based on photointerpretation of NOAA/AVHRR visible and infraredimagery, in combination with synoptic analysis maps. Percentages in satelliteobservations indicate frequency of occurrence.
Synoptic situation500 hPa analysis (contour lines,
temperature, vertical velocity)SFC analysis (MSL), 850 hPa
analysis (temperature). A trough is located over
central or eastern Mediterranean,frequently with sequentialdisturbances moving from SWto E–NE
. Well-developed depressions locatedSW of Greece moving towards E–NE
. Intensive upward motionsextending from SW and SGreece to west coastlineof Turkey
. The depressions are associated withcold and warm fronts or, frequently,with occluded fronts
. SW winds, frequently verystrong
. High temperature gradients at 850 hPa
. High pressure gradients, resulting in verystrong winds (frequently stronger than8 Beaufort over the Aegean)
AVHRR imagery photointerpretation. The appearance of Ac at the downwind sides of the mountains (perpendicular to the
south winds), indicates the development of lee waves (85%). Massive cloud layers of Sc, As, Ac and Cs are usually observed over the Aegean Sea
along a warm front moving to the north (100%). Cb embedded in a thick Cs layer over the cold front, especially when the depressions
pass over marine regions (60%). Cu or Cb behind the cold front, especially when the depressions pass over marine
regions (100%). Sc formation over the east side of the main mountain range of Greece (Pindos
Mountains), in cases in which the depressions are located at the southern Aegean Sea(75%)
. The appearance of Cs indicates the presence of strong winds in the higher levels oftroposphere (location of the jet stream) (60%)
2960 C. Cartalis et al.
Sea. The presence of a depression at the surface in the same area generates strong
south winds over the west coastline of Greece.
Figures 6 and 7 present the AVHRR visible and thermal infrared images,
respectively. Both images were recorded on 25 November 1995 at 12:14 UTC. The
exact locations of possible cold and warm fronts are very difficult to determine in
this case. In area A, there is a Cs cloud layer above Ac, As and, probably, Sc layers.
The stratiform nature of the above-mentioned cloud layers implies that there is
synoptic scale air mass convergence without any convective activity in the area A.
An inspection of the isotherms (dashed lines at 850 hPa temperature analysis) shows
a cold intrusion in the Aegean Sea and a warm advection in the Ionian Sea,
consistent with the warm air rising over the cold air in the area A. There is no
evidence, however, to indicate that this convergence is associated with an occlusion,
warm front or stationary front. The 500 hPa analysis shows that there are
descending air mass movements associated with a ridge at mid-tropospheric heights.
In area B, there is an extensive opaque cloud layer with very low top tem-
peratures as can be seen in figure 7 (very bright tones). Rough cloud tops in the
visible image (figure 6) indicate also convective activity. These vertical motions can
be easily explained by the existence of the trough at 500 hPa located over Italy
(figure 5(a)) in combination with the low-layer advection of warm air masses
(850 hPa temperature analysis, figure 5(c)). This combination is responsible for the
high atmospheric instability in area B.
Table 8. Summary of the characteristics of Mixed Weather Types over Greece, based onphotointerpretation of NOAA/AVHRR visible and infrared imagery, in combinationwith synoptic analysis maps. Percentages in satellite observations indicate frequencyof occurrence.
Synoptic situation500 hPa analysis (contour lines,
temperature, vertical velocity)SFC analysis (MSL), 850 hPa analysis temperature)
. Low geopotential heights basinover Greece, with perturbationsmoving from N–NW to S–SE
. Extended anticyclone covers the BalkanPeninsula, whilst low-pressure systemsare located at its south-east edge
. Cold air temperatures overGreece (air masses withtemperatures around 235‡C)
. The combination of the high-pressureanticyclone with the low-pressure systems,which are located S–SE, generates stormN–NE winds over the Aegean
. Upward motions over marineregions, especially over thelocation of the depressions
. Low temperatures at 850 hPa due to theprevailing N winds over the Aegean
. A blocking ridge is situatedover west Europe
. The perturbations at 500 hPa enforce thesurface winds
. The depressions are associated withcold and warm fronts which are movingover the Southern part of Greece
AVHRR imagery photointerpretation. Streets of Cu, Cb embedded in As layers and Sc, windward over the Aegean islands,
as well as along the east coastline of continental Greece (75%). The appearance of orographic Ac and Sc clouds at the downwind sides of the
mountains (perpendicular to the north winds) (50%). Isolated Cu or Cb behind the cold fronts, especially over marine regions (100%). Cu or Cb development over marine regions indicating the locations of 500 hPa
perturbations over these areas (100%)
Categorization of weather types using satellite imagery 2961

(a)
(b)
(c)
Figure 2. Synoptic analysis for 5 March 1995 (12:00 UTC). (a) 500 hPa height analysis,contour lines with 60 m interval (solid lines) and temperature analysis (dashed lines with5‡C intervals). Disturbances in the trough described in the text are indicated with thickdashed lines. (b) 500 hPa vertical velocity analysis with 0.2 Pa s21 intervals; downwardisotachs with solid lines and upward isotachs with dashed lines. (c) Surface meso-scalemap with 4 hPa intervals (solid lines) and 850 hPa temperature analysis (dashed lineswith 2‡C intervals). Systems described in the text are indicated with thick solid lines.
2962 C. Cartalis et al.
In the area C, there is a compact low-level St and Sc layer, probably fog,
associated with the cold air intrusion over the Aegean Sea and Greece (figure 5(c)).
These low-level clouds or fog are the result of the mixing of this cold air with the
warm surface layer over the Mediterranean.
3.2. North-west Depressional Weather Type (NWDWT)
This category comprises all the synoptic situations characterized by the presence
of a depression over Greece moving on a semi-meridional track from north-west to
south-east. This weather type is generated by depressions with Atlantic or
Mediterranean origin.
Depressions originating from the Atlantic Ocean may reach Greece when the
polar front obtains meridional (or semi-meridional) direction over central Europe.
Actually, this refers to a secondary branch of the polar front, which is developed
when the track of the depressions coming from the Atlantic is oriented in a south-
east direction due to the presence of the Atlantic anticyclone. This type of depres-
sion is infrequent in Greece, affecting mainly the west Mediterranean or west
Europe.
Depressions originating from the Mediterranean travel over the central
Mediterranean and Italy, moving from north-west to south-east before reaching
Figure 3. NOAA/AVHRR channel 1 image (visible) for 5 March 1995 (11:29 UTC). In thiscase, Greece is affected by a West Depressional Weather Type. The location of thecold front is superimposed in the images. The prevailing cloud systems in areas A, B,C and D are described in the text.
Categorization of weather types using satellite imagery 2963
Greece. In this case, upper level airflow obtains a meridional direction from north
or north-west. Mediterranean origin depressions play the most important role for
weather and climate in Greece, because they occur frequently and they generate
high levels of accumulated precipitation for the whole country.
NWDWTs in winter move over Greece along a track situated to the west of the
country. If the depressions have Atlantic origin, their frontal systems will reach
Greece as occlusions driven by the upper airflow (500 hPa). If the depressions have
Mediterranean origin, they will be well developed when they reach Greece. Their
impact on weather conditions in Greece is related to the intensity of the cold air
intrusion as well as to depth of the associated low-pressure system. This weather
type causes cold weather with strong winds and it is also typical of the winter
period (Maheras 1979, 1983, 1988a). In the northern part of Greece, this type of
depression rarely causes floods, whereas in central and southern Greece, where
orographic effects are significant, floods are not unusual.
A summary of the cloud characteristics of NWDWTs in Greece, based on the
photointerpretation of NOAA/AVHRR visible and infrared imagery, in combina-
tion with the characteristics of the systems in synoptic analysis maps, is presented in
table 6. The case study, which is presented in the following section, has been
selected as a representative one.
Figure 4. NOAA/AVHRR channel 4 image (infrared) for 5 March 1995 (11:29 UTC). Inthis case, Greece is affected by a West Depressional Weather Type. The location ofthe cold front is superimposed in the images. The prevailing cloud systems in areas A,B, C and D are described in the text.
2964 C. Cartalis et al.
(a)
(b)
(c)
Figure 5. Synoptic analysis for 25 November 1995 (12:00 UTC). (a) 500 hPa height analysis,contour lines with 60 m interval (solid lines) and temperature analysis (dashed lines with5‡C intervals). Disturbances in the trough described in the text are indicated with thickdashed lines. (b) 500 hPa vertical velocity analysis with 0.2 Pa s21 intervals; downwardisotachs with solid lines and upward isotachs with dashed lines. (c) Surface meso-scalemap with 4 hPa intervals (solid lines) and 850 hPa temperature analysis (dashed lineswith 2‡C intervals). Systems described in the text are indicated with thick solid lines.
Categorization of weather types using satellite imagery 2965
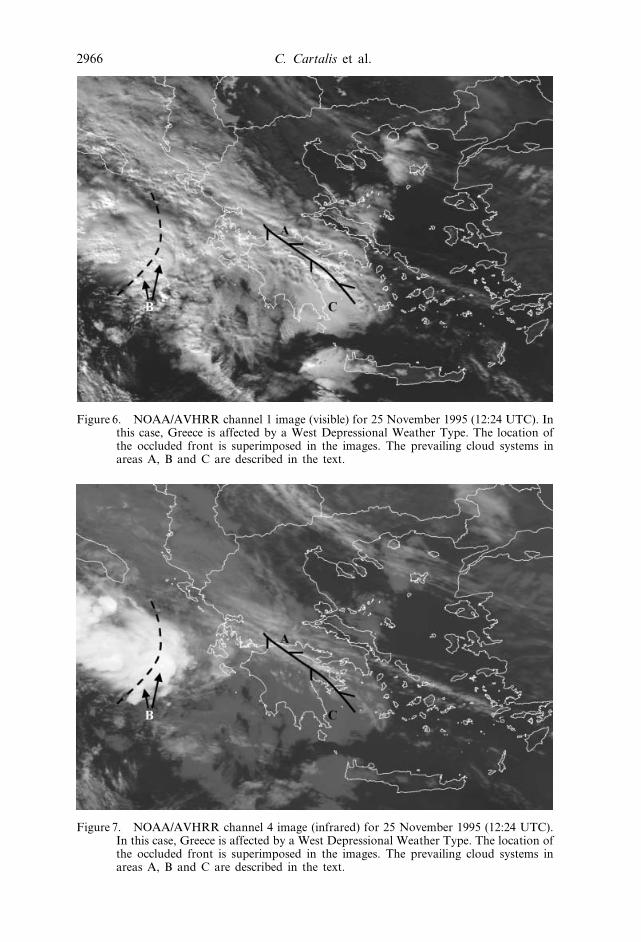
Figure 6. NOAA/AVHRR channel 1 image (visible) for 25 November 1995 (12:24 UTC). Inthis case, Greece is affected by a West Depressional Weather Type. The location ofthe occluded front is superimposed in the images. The prevailing cloud systems inareas A, B and C are described in the text.
Figure 7. NOAA/AVHRR channel 4 image (infrared) for 25 November 1995 (12:24 UTC).In this case, Greece is affected by a West Depressional Weather Type. The location ofthe occluded front is superimposed in the images. The prevailing cloud systems inareas A, B and C are described in the text.
2966 C. Cartalis et al.
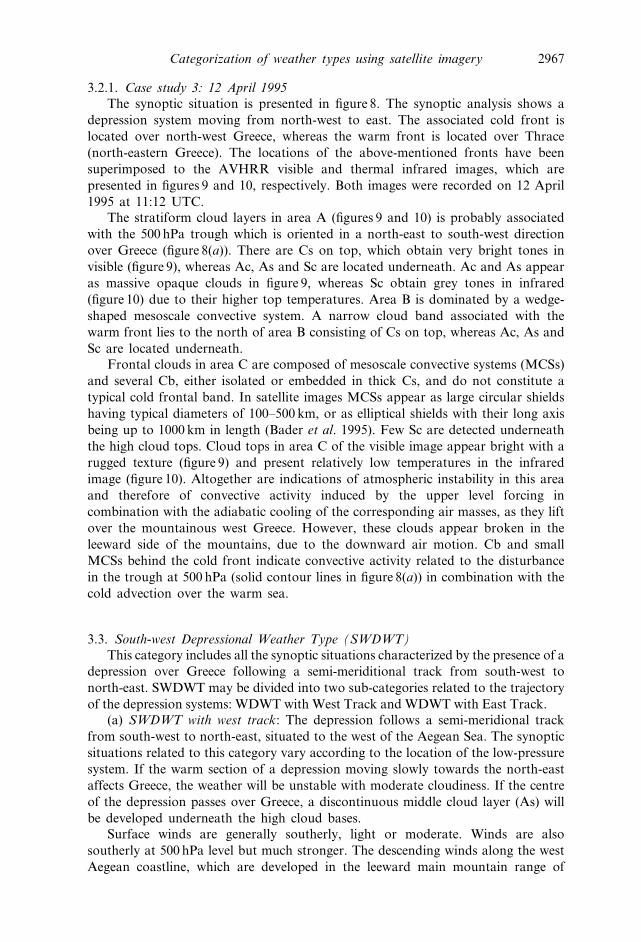
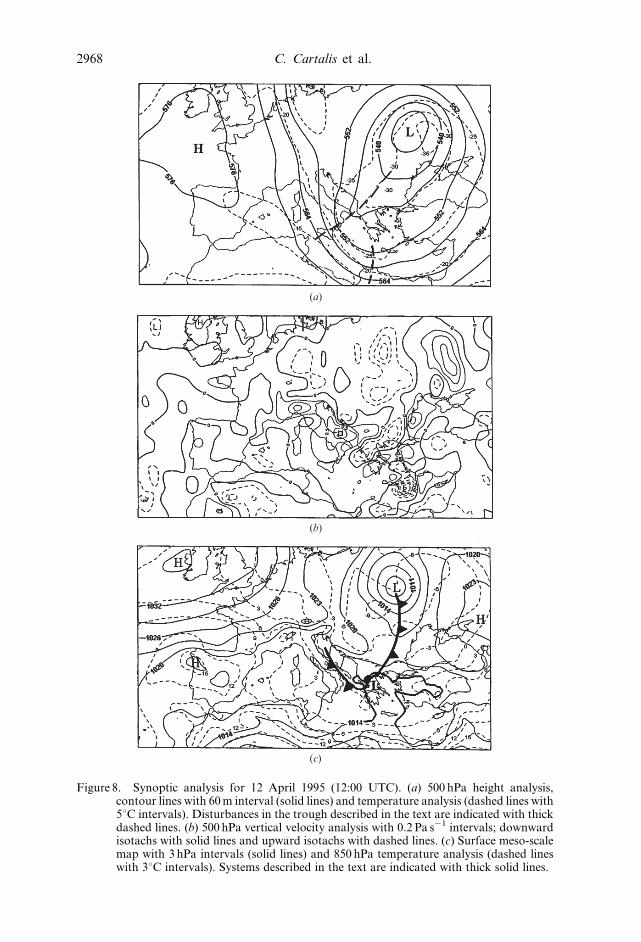
3.2.1. Case study 3: 12 April 1995
The synoptic situation is presented in figure 8. The synoptic analysis shows a
depression system moving from north-west to east. The associated cold front is
located over north-west Greece, whereas the warm front is located over Thrace
(north-eastern Greece). The locations of the above-mentioned fronts have been
superimposed to the AVHRR visible and thermal infrared images, which are
presented in figures 9 and 10, respectively. Both images were recorded on 12 April
1995 at 11:12 UTC.The stratiform cloud layers in area A (figures 9 and 10) is probably associated
with the 500 hPa trough which is oriented in a north-east to south-west direction
over Greece (figure 8(a)). There are Cs on top, which obtain very bright tones in
visible (figure 9), whereas Ac, As and Sc are located underneath. Ac and As appear
as massive opaque clouds in figure 9, whereas Sc obtain grey tones in infrared
(figure 10) due to their higher top temperatures. Area B is dominated by a wedge-
shaped mesoscale convective system. A narrow cloud band associated with the
warm front lies to the north of area B consisting of Cs on top, whereas Ac, As and
Sc are located underneath.
Frontal clouds in area C are composed of mesoscale convective systems (MCSs)
and several Cb, either isolated or embedded in thick Cs, and do not constitute a
typical cold frontal band. In satellite images MCSs appear as large circular shields
having typical diameters of 100–500 km, or as elliptical shields with their long axis
being up to 1000 km in length (Bader et al. 1995). Few Sc are detected underneath
the high cloud tops. Cloud tops in area C of the visible image appear bright with a
rugged texture (figure 9) and present relatively low temperatures in the infrared
image (figure 10). Altogether are indications of atmospheric instability in this area
and therefore of convective activity induced by the upper level forcing in
combination with the adiabatic cooling of the corresponding air masses, as they lift
over the mountainous west Greece. However, these clouds appear broken in the
leeward side of the mountains, due to the downward air motion. Cb and small
MCSs behind the cold front indicate convective activity related to the disturbance
in the trough at 500 hPa (solid contour lines in figure 8(a)) in combination with the
cold advection over the warm sea.
3.3. South-west Depressional Weather Type (SWDWT)
This category includes all the synoptic situations characterized by the presence of a
depression over Greece following a semi-meriditional track from south-west to
north-east. SWDWT may be divided into two sub-categories related to the trajectory
of the depression systems: WDWT with West Track and WDWT with East Track.
(a) SWDWT with west track: The depression follows a semi-meridional track
from south-west to north-east, situated to the west of the Aegean Sea. The synoptic
situations related to this category vary according to the location of the low-pressure
system. If the warm section of a depression moving slowly towards the north-east
affects Greece, the weather will be unstable with moderate cloudiness. If the centre
of the depression passes over Greece, a discontinuous middle cloud layer (As) will
be developed underneath the high cloud bases.
Surface winds are generally southerly, light or moderate. Winds are also
southerly at 500 hPa level but much stronger. The descending winds along the west
Aegean coastline, which are developed in the leeward main mountain range of
Categorization of weather types using satellite imagery 2967
(a)
(b)
(c)
Figure 8. Synoptic analysis for 12 April 1995 (12:00 UTC). (a) 500 hPa height analysis,contour lines with 60 m interval (solid lines) and temperature analysis (dashed lines with5‡C intervals). Disturbances in the trough described in the text are indicated with thickdashed lines. (b) 500 hPa vertical velocity analysis with 0.2 Pa s21 intervals; downwardisotachs with solid lines and upward isotachs with dashed lines. (c) Surface meso-scalemap with 3 hPa intervals (solid lines) and 850 hPa temperature analysis (dashed lineswith 3‡C intervals). Systems described in the text are indicated with thick solid lines.
2968 C. Cartalis et al.

Greece, contribute to the reduction of relative humidity and of atmospheric instabi-
lity into the lower atmospheric levels.
It has to be mentioned that the cold front associated with the depression reaches
Greece from the south. The intrusion of the cold air masses behind the cold front
favours the atmospheric instability and the formation of convective clouds over the
Aegean Sea.
(b) SWDWT with east track: The depression follows a semi-meridional track
from south-west to north-east, situated to the east of mainland Greece across the
Aegean Sea. This weather type is associated with low temperatures and widespread
rainfall with snow in winter (Maheras 1988a).
A summary of the cloud characteristics of SWDWT in Greece, is presented
in table 7. In the following section a representative case study of SWDWT is
demonstrated.
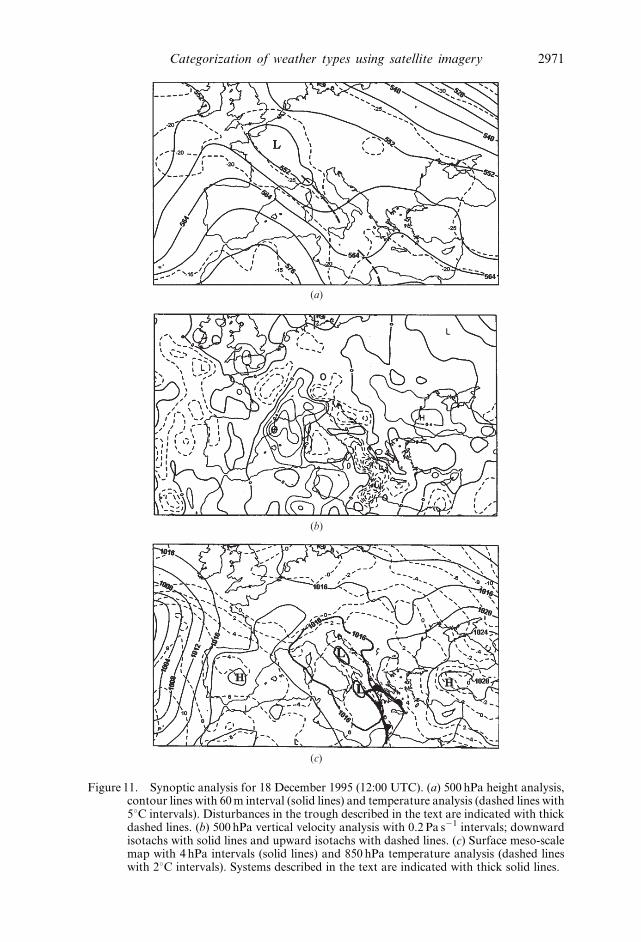
3.3.1. Case study 4: 18 December 1995
The synoptic situation is presented in figure 11. The surface analysis shows that
two low-pressure systems are located north-west and west of Greece, respectively
(figure 11(c)). The two surface lows are combined with two troughs at 500 hPa,
located in different latitudes (figure 11(a)).
Figures 12 and 13 present the AVHRR visible and thermal infrared images,
respectively. Both images were recorded on 18 December 1995 at 11:26 UTC. Five
specific areas (A, B, C, D and E) are marked in both images.
Figure 9. NOAA/AVHRR channel 1 image (visible) for 12 April 1995 (11:22 UTC). In thiscase, Greece is affected by a North-west Depressional Weather Type. The locationsof the cold and warm fronts of the depressions are superimposed in the images. Theprevailing cloud systems in areas A, B and C are described in the text.
Categorization of weather types using satellite imagery 2969
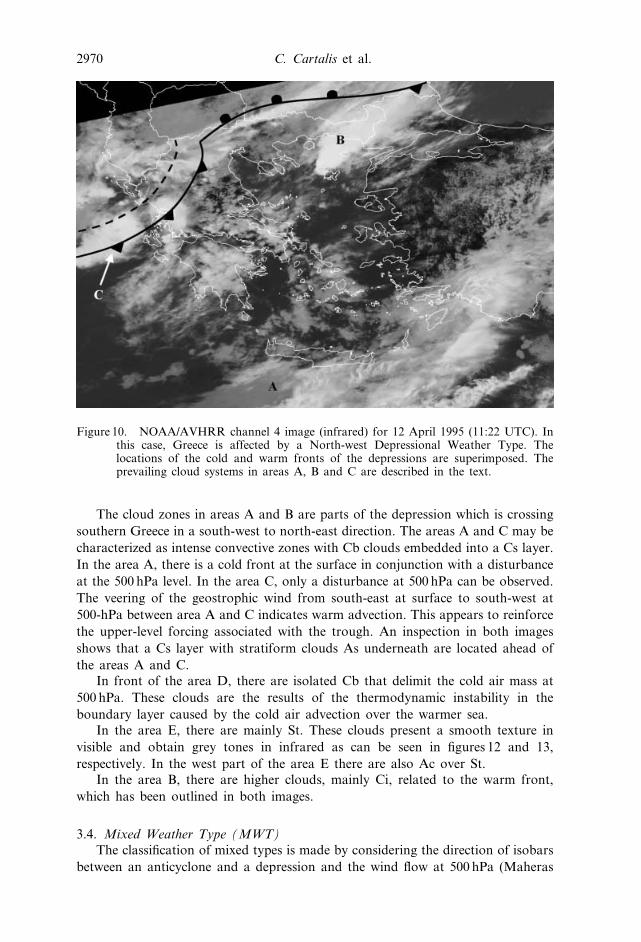
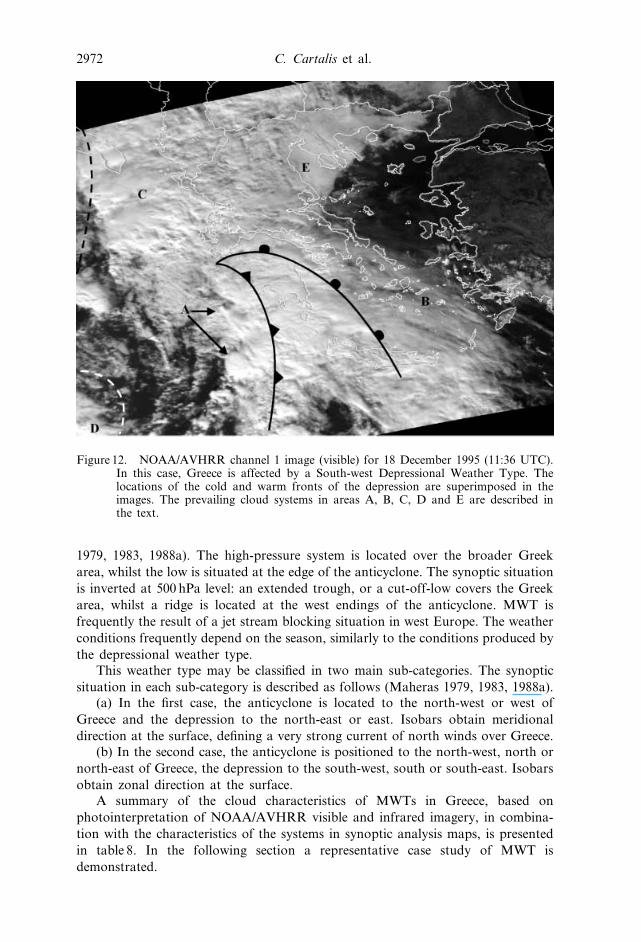
The cloud zones in areas A and B are parts of the depression which is crossing
southern Greece in a south-west to north-east direction. The areas A and C may be
characterized as intense convective zones with Cb clouds embedded into a Cs layer.
In the area A, there is a cold front at the surface in conjunction with a disturbance
at the 500 hPa level. In the area C, only a disturbance at 500 hPa can be observed.
The veering of the geostrophic wind from south-east at surface to south-west at
500-hPa between area A and C indicates warm advection. This appears to reinforce
the upper-level forcing associated with the trough. An inspection in both images
shows that a Cs layer with stratiform clouds As underneath are located ahead of
the areas A and C.In front of the area D, there are isolated Cb that delimit the cold air mass at
500 hPa. These clouds are the results of the thermodynamic instability in the
boundary layer caused by the cold air advection over the warmer sea.
In the area E, there are mainly St. These clouds present a smooth texture in
visible and obtain grey tones in infrared as can be seen in figures 12 and 13,
respectively. In the west part of the area E there are also Ac over St.
In the area B, there are higher clouds, mainly Ci, related to the warm front,
which has been outlined in both images.
3.4. Mixed Weather Type (MWT)
The classification of mixed types is made by considering the direction of isobars
between an anticyclone and a depression and the wind flow at 500 hPa (Maheras
Figure 10. NOAA/AVHRR channel 4 image (infrared) for 12 April 1995 (11:22 UTC). Inthis case, Greece is affected by a North-west Depressional Weather Type. Thelocations of the cold and warm fronts of the depressions are superimposed. Theprevailing cloud systems in areas A, B and C are described in the text.
2970 C. Cartalis et al.
(a)
(b)
(c)
Figure 11. Synoptic analysis for 18 December 1995 (12:00 UTC). (a) 500 hPa height analysis,contour lines with 60 m interval (solid lines) and temperature analysis (dashed lines with5‡C intervals). Disturbances in the trough described in the text are indicated with thickdashed lines. (b) 500 hPa vertical velocity analysis with 0.2 Pa s21 intervals; downwardisotachs with solid lines and upward isotachs with dashed lines. (c) Surface meso-scalemap with 4 hPa intervals (solid lines) and 850 hPa temperature analysis (dashed lineswith 2‡C intervals). Systems described in the text are indicated with thick solid lines.
Categorization of weather types using satellite imagery 2971
1979, 1983, 1988a). The high-pressure system is located over the broader Greek
area, whilst the low is situated at the edge of the anticyclone. The synoptic situation
is inverted at 500 hPa level: an extended trough, or a cut-off-low covers the Greek
area, whilst a ridge is located at the west endings of the anticyclone. MWT is
frequently the result of a jet stream blocking situation in west Europe. The weather
conditions frequently depend on the season, similarly to the conditions produced by
the depressional weather type.
This weather type may be classified in two main sub-categories. The synoptic
situation in each sub-category is described as follows (Maheras 1979, 1983, 1988a).(a) In the first case, the anticyclone is located to the north-west or west of
Greece and the depression to the north-east or east. Isobars obtain meridional
direction at the surface, defining a very strong current of north winds over Greece.
(b) In the second case, the anticyclone is positioned to the north-west, north or
north-east of Greece, the depression to the south-west, south or south-east. Isobars
obtain zonal direction at the surface.
A summary of the cloud characteristics of MWTs in Greece, based on
photointerpretation of NOAA/AVHRR visible and infrared imagery, in combina-
tion with the characteristics of the systems in synoptic analysis maps, is presented
in table 8. In the following section a representative case study of MWT is
demonstrated.
Figure 12. NOAA/AVHRR channel 1 image (visible) for 18 December 1995 (11:36 UTC).In this case, Greece is affected by a South-west Depressional Weather Type. Thelocations of the cold and warm fronts of the depression are superimposed in theimages. The prevailing cloud systems in areas A, B, C, D and E are described inthe text.
2972 C. Cartalis et al.
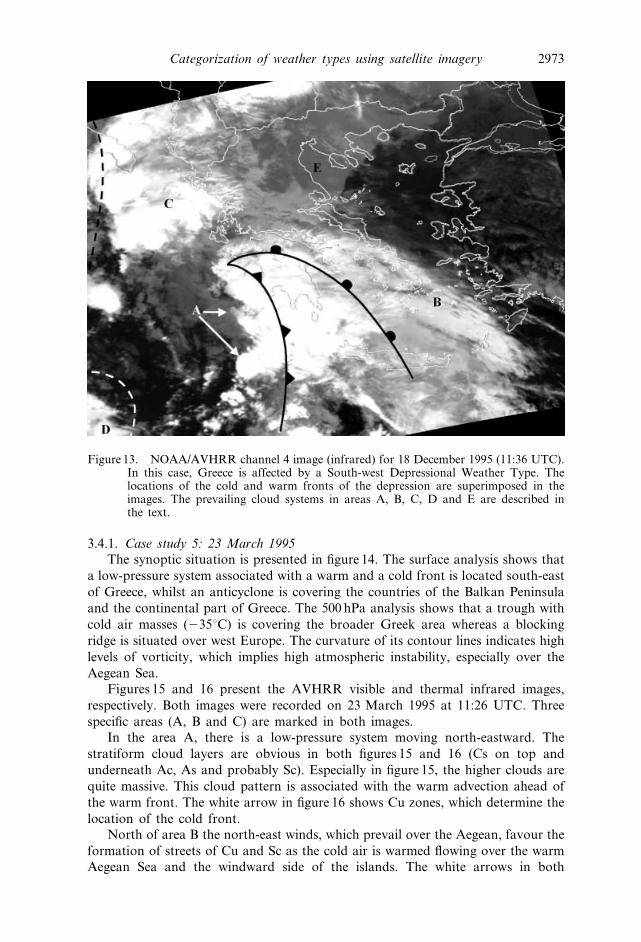
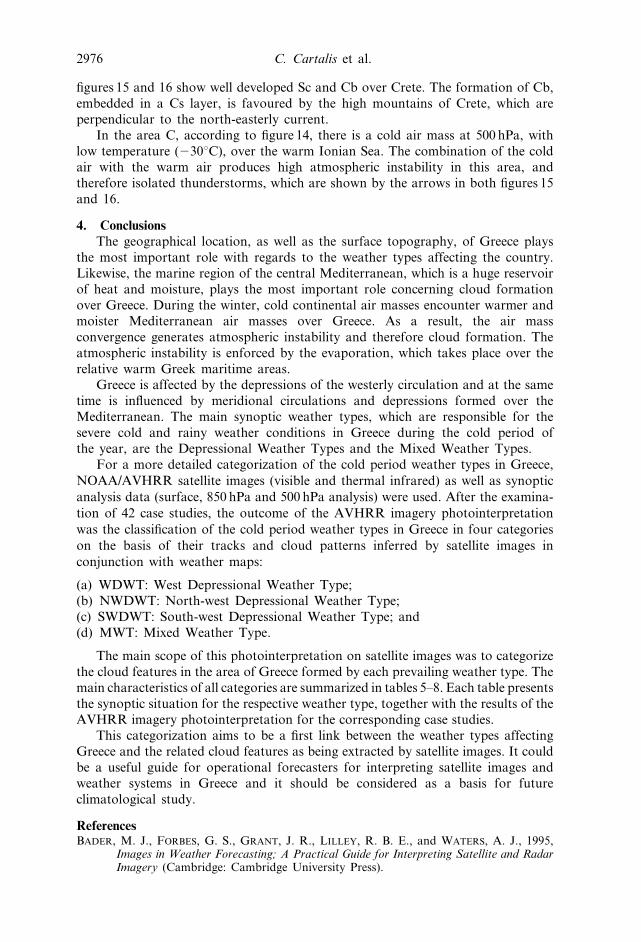
3.4.1. Case study 5: 23 March 1995
The synoptic situation is presented in figure 14. The surface analysis shows that
a low-pressure system associated with a warm and a cold front is located south-east
of Greece, whilst an anticyclone is covering the countries of the Balkan Peninsula
and the continental part of Greece. The 500 hPa analysis shows that a trough with
cold air masses (235‡C) is covering the broader Greek area whereas a blocking
ridge is situated over west Europe. The curvature of its contour lines indicates high
levels of vorticity, which implies high atmospheric instability, especially over the
Aegean Sea.
Figures 15 and 16 present the AVHRR visible and thermal infrared images,
respectively. Both images were recorded on 23 March 1995 at 11:26 UTC. Three
specific areas (A, B and C) are marked in both images.
In the area A, there is a low-pressure system moving north-eastward. The
stratiform cloud layers are obvious in both figures 15 and 16 (Cs on top and
underneath Ac, As and probably Sc). Especially in figure 15, the higher clouds are
quite massive. This cloud pattern is associated with the warm advection ahead of
the warm front. The white arrow in figure 16 shows Cu zones, which determine the
location of the cold front.North of area B the north-east winds, which prevail over the Aegean, favour the
formation of streets of Cu and Sc as the cold air is warmed flowing over the warm
Aegean Sea and the windward side of the islands. The white arrows in both
Figure 13. NOAA/AVHRR channel 4 image (infrared) for 18 December 1995 (11:36 UTC).In this case, Greece is affected by a South-west Depressional Weather Type. Thelocations of the cold and warm fronts of the depression are superimposed in theimages. The prevailing cloud systems in areas A, B, C, D and E are described inthe text.
Categorization of weather types using satellite imagery 2973
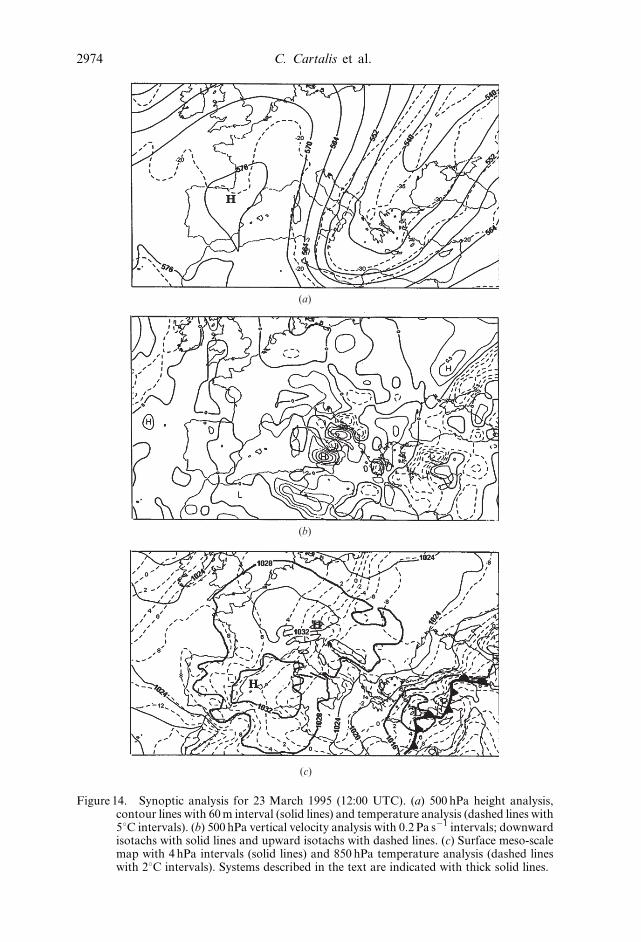
(a)
(b)
(c)
Figure 14. Synoptic analysis for 23 March 1995 (12:00 UTC). (a) 500 hPa height analysis,contour lines with 60 m interval (solid lines) and temperature analysis (dashed lines with5‡C intervals). (b) 500 hPa vertical velocity analysis with 0.2 Pa s21 intervals; downwardisotachs with solid lines and upward isotachs with dashed lines. (c) Surface meso-scalemap with 4 hPa intervals (solid lines) and 850 hPa temperature analysis (dashed lineswith 2‡C intervals). Systems described in the text are indicated with thick solid lines.
2974 C. Cartalis et al.
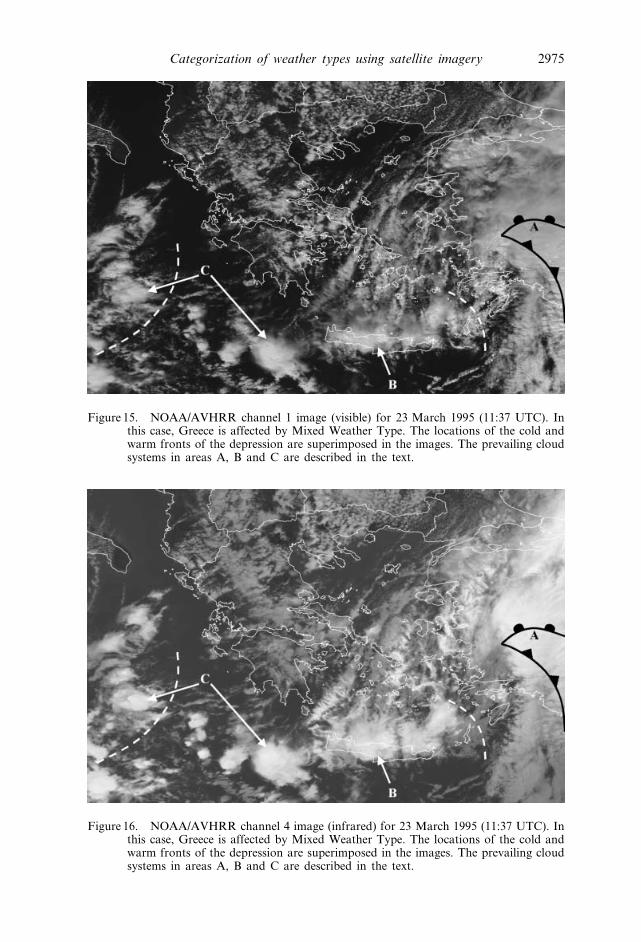
Figure 15. NOAA/AVHRR channel 1 image (visible) for 23 March 1995 (11:37 UTC). Inthis case, Greece is affected by Mixed Weather Type. The locations of the cold andwarm fronts of the depression are superimposed in the images. The prevailing cloudsystems in areas A, B and C are described in the text.
Figure 16. NOAA/AVHRR channel 4 image (infrared) for 23 March 1995 (11:37 UTC). Inthis case, Greece is affected by Mixed Weather Type. The locations of the cold andwarm fronts of the depression are superimposed in the images. The prevailing cloudsystems in areas A, B and C are described in the text.
Categorization of weather types using satellite imagery 2975
figures 15 and 16 show well developed Sc and Cb over Crete. The formation of Cb,
embedded in a Cs layer, is favoured by the high mountains of Crete, which are
perpendicular to the north-easterly current.
In the area C, according to figure 14, there is a cold air mass at 500 hPa, with
low temperature (230‡C), over the warm Ionian Sea. The combination of the cold
air with the warm air produces high atmospheric instability in this area, and
therefore isolated thunderstorms, which are shown by the arrows in both figures 15
and 16.
4. Conclusions
The geographical location, as well as the surface topography, of Greece plays
the most important role with regards to the weather types affecting the country.
Likewise, the marine region of the central Mediterranean, which is a huge reservoir
of heat and moisture, plays the most important role concerning cloud formation
over Greece. During the winter, cold continental air masses encounter warmer and
moister Mediterranean air masses over Greece. As a result, the air mass
convergence generates atmospheric instability and therefore cloud formation. The
atmospheric instability is enforced by the evaporation, which takes place over the
relative warm Greek maritime areas.Greece is affected by the depressions of the westerly circulation and at the same
time is influenced by meridional circulations and depressions formed over the
Mediterranean. The main synoptic weather types, which are responsible for the
severe cold and rainy weather conditions in Greece during the cold period of
the year, are the Depressional Weather Types and the Mixed Weather Types.
For a more detailed categorization of the cold period weather types in Greece,
NOAA/AVHRR satellite images (visible and thermal infrared) as well as synoptic
analysis data (surface, 850 hPa and 500 hPa analysis) were used. After the examina-
tion of 42 case studies, the outcome of the AVHRR imagery photointerpretation
was the classification of the cold period weather types in Greece in four categories
on the basis of their tracks and cloud patterns inferred by satellite images in
conjunction with weather maps:
(a) WDWT: West Depressional Weather Type;
(b) NWDWT: North-west Depressional Weather Type;
(c) SWDWT: South-west Depressional Weather Type; and
(d) MWT: Mixed Weather Type.
The main scope of this photointerpretation on satellite images was to categorize
the cloud features in the area of Greece formed by each prevailing weather type. The
main characteristics of all categories are summarized in tables 5–8. Each table presents
the synoptic situation for the respective weather type, together with the results of the
AVHRR imagery photointerpretation for the corresponding case studies.
This categorization aims to be a first link between the weather types affecting
Greece and the related cloud features as being extracted by satellite images. It could
be a useful guide for operational forecasters for interpreting satellite images and
weather systems in Greece and it should be considered as a basis for future
climatological study.
ReferencesBADER, M. J., FORBES, G. S., GRANT, J. R., LILLEY, R. B. E., and WATERS, A. J., 1995,
Images in Weather Forecasting; A Practical Guide for Interpreting Satellite and RadarImagery (Cambridge: Cambridge University Press).
2976 C. Cartalis et al.
FLOCAS, A. A., 1988, Frontal depressions over the Mediterranean Sea and central southernEurope. Mediterranee, 4, 43–52.
KASSOMENOS, P., FLOCAS, H., LYKOUDIS, S., and PETRAKIS, M., 1998, Analysis ofmesoscale patterns in relation to synoptic conditions over an urban Mediterraneanbasin. Theoretical and Applied Climatology, 59, 215–229.
KATSOULIS, B. D., 1980, Climatic and synoptic considerations of the Mediterraneandepressions developing and passing over or near the Balkan Peninsula. Proceedings ofthe 1st Hellenic–British Climatological Congress, Athens, 1980 (Athens: HellenicMeteorological Society), pp. 73–84.
MAHERAS, P., 1979, Climatologie de la mer Egee et de ses marges continentales. Thesed’Etat, Universite de Dijon.
MAHERAS, P., 1983, Les types de temps depressionaire pertubes au-dessus de la mer Egee.Rivista di Meteorologia Aeronautica, 43, 13–22.
MAHERAS, P., 1988a, The synoptic weather types and objective delimitation of the winterperiod in Greece. Weather, 43, 40–45.
MAHERAS, P., 1988b, Changes in precipitation conditions in the Western Mediterranean overthe last century. Journal of Climatology, 8, 179–189.
MAHERAS, P., BALAFOUTIS, CH., and VAFIADIS, M., 1992, Precipitation in the centralMediterranean during the last century. Theoretical and Applied Climatology, 45,209–216.
MAHERAS, P., PATRIKAS, I., KARACOSTAS, TH., and ANAGNOSTOPOULOU, CH., 2000,Automatic classification of circulation types in Greece: methodology, description,frequency, variability and trend analysis. Theoretical and Applied Climatology, 67,205–223.
MAHERAS, P., FLOCAS, H. A., PATRIKAS, I., and ANAGNOSTOPOULOU, CH., 2001, A 40 yearobjective climatology of surface cyclones in the Mediterranean region: spatial andtemporal distribution. International Journal of Climatology, 21, 109–130.
PREZERAKOS, N. G., 1985, The northwest African depressions affecting the south Balkans.Journal of Climatology, 5, 643–654.
RADINOVIC, D., 1987, Mediterranean cyclones and their influence on the weather andclimate. Programme on Short and Medium Range Weather Prediction Research(PSMP), World Meteorological Office, Sofia 24.
RAO, P. K., HOLMS, S. J., ANDERSON, R. K., WINSTON, J. S., and LEHR, P. E., 1990,Weather Satellites: Systems Data and Environmental Applications (Boston: AmericanMeteorological Society).
Categorization of weather types using satellite imagery 2977