Biological Opinion on Navy NWTT - the NOAA Institutional ...
721
NATIONAL MARINE FISHERIES SERVICE ENDANGERED SPECIES ACT SECTION 7 BIOLOGICAL AND CONFERENCE OPINION Title: Biological and Conference Opinion on U.S. Navy Northwest Training and Testing Activities and Associated NMFS Regulations and Letters of Authorization Consultation Conducted By: Endangered Species Act Interagency Cooperation Division, Office of Protected Resources, National Marine Fisheries Service, National Oceanic and Atmospheric Administration, U.S. Department of Commerce Action Agencies: U.S. Navy and Office of Protected Resources, National Marine Fisheries Service, National Oceanic and Atmospheric Administration, U.S. Department of Commerce Publisher: Office of Protected Resources, National Marine Fisheries Service, National Oceanic and Atmospheric Administration, U.S. Department of Commerce Consultation Tracking number: FPR-2015-9110 Digital Object Identifier (DOI): https://doi.org/10.7289/V5NG4NTZ
-
Upload
khangminh22 -
Category
Documents
-
view
0 -
download
0
Transcript of Biological Opinion on Navy NWTT - the NOAA Institutional ...
NATIONAL MARINE FISHERIES SERVICE
ENDANGERED SPECIES ACT SECTION 7
BIOLOGICAL AND CONFERENCE
OPINION
Title: Biological and Conference Opinion on U.S. Navy
Northwest Training and Testing Activities and Associated NMFS Regulations and Letters of Authorization
Consultation Conducted By: Endangered Species Act Interagency Cooperation
Division, Office of Protected Resources, National
Marine Fisheries Service, National Oceanic and
Atmospheric Administration, U.S. Department of
Commerce
Action Agencies: U.S. Navy and Office of Protected Resources, National
Marine Fisheries Service, National Oceanic and
Atmospheric Administration, U.S. Department of
Commerce
Publisher: Office of Protected Resources, National Marine Fisheries
Service, National Oceanic and Atmospheric
Administration, U.S. Department of Commerce
Consultation Tracking number: FPR-2015-9110
Digital Object Identifier (DOI): https://doi.org/10.7289/V5NG4NTZ
NATIONAL MARINE FISHERIES SERVICE
ENDANGERED SPECIES ACT SECTION 7 BIOLOGICAL OPINION AND CONFERENCE
REPORT
Action Agencies:
Activity Considered:
Consultation Conducted By:
Approved:
Date:
Public Consultation Tracking System (PCTS) number:
The United States Navy (Navy) and NOAA's National Marine
Fisheries Service, Office of Protected Resources' Permits and
Conservation Di vision
(1) The Navy's Northwest Training and Testing (NWTT) activities
(2) National Marine Fisheries Services' promulgation of regulations
pursuant to the Marine Mammal Protection Act for the Navy to "take"
marine mammals incidental to NWTT activities from November 2015 through November 2020
(3) National Marine Fisheries Services' issuance of two Letters of
Authorization to the Navy pursuant to regulations under the Marine
Mammal Protection Act to "take" marine mammals incidental to
NWTT activities from November 2015 through November 2020
Endangered Species Act Interagency Cooperation Division, Office of
Protected Resources, National Marine Fisheries Service
b~Jdi · Donna S. Wieting ,. --'::J Director, Office of Protected Resources
NOV - 9 2015
FPR-2015-9110
Biological Opinion and Conference Report on Navy NWTT Activities and NMFS’ MMPA Incidental Take Authorization PCTS FPR-2015-9110
TABLE OF CONTENTS
Page
1 Introduction........................................................................................................................... 1 1.1 Background ...................................................................................................................... 2 1.2 Consultation History ........................................................................................................ 2
2 Description of the Proposed Action..................................................................................... 3 2.1 Navy Proposed Training Activities .................................................................................. 5
2.1.1 Training Activity Levels ........................................................................................... 8 2.2 Navy Testing Activities.................................................................................................. 11
2.2.1 Naval Sea Systems Command Testing Activities................................................... 12 2.2.2 Naval Air Systems Command Testing Activities ................................................... 17 2.2.3 Testing Activity Levels........................................................................................... 18
2.3 Navy Mitigation Measures to Minimize or Avoid Exposure to Stressors ..................... 22 2.3.1 Lookout Procedural Measures ................................................................................ 22 2.3.2 Mitigation Zone Procedural Measures.................................................................... 26 2.3.3 Other Procedural Measures in the NWTT Study Area ........................................... 30
2.4 NMFS’ Promulgation of Regulations Pursuant to the Marine Mammal Protection Act ........................................................................................................................... 31
2.4.1 Taking and Importing Marine Mammals; U.S. Navy’s Northwest Training and Testing (NWTT) Study Area.......................................................................................... 32
2.5 Action Area .................................................................................................................... 55 2.5.1 Offshore Area of the Action Area........................................................................... 55 2.5.2 Inland Waters of the Action Area ........................................................................... 59 2.5.3 Southeast Alaska Acoustic Measurement Facility – Western Behm Canal, Alaska 61
2.6 Interrelated and Interdependent Actions ........................................................................ 65
3 Overview of NMFS’ Assessment Framework .................................................................. 65 3.1 Evidence Available for the Consultation ....................................................................... 67
3.1.1 Consideration of new literature and pending Acoustic Guidance on the Effects of Anthropogenic Sound on Marine Mammals ........................................................ 67 3.1.2 The Navy’s Exposure Estimates ............................................................................. 71 3.1.3 Criteria for Assessing Effects to Fish from Sonar .................................................. 76 3.1.4 Criteria for Assessing Effects to Fish from Explosives .......................................... 81 3.1.5 Discussion of Finneran and Schlundt 2010 and 2011 Dolphin Studies in the Context of Phase II Modeling ............................................................................................... 86 3.1.6 Post Processing. Avoidance Behavior and Mitigation Measures as Applied to Sonar and Active Acoustic Sources.................................................................................. 87
3.2 Treatment of “Cumulative Impacts” (in the sense of NEPA) ........................................ 90
i
Biological Opinion and Conference Report on Navy NWTT Activities and NMFS’ MMPA Incidental Take Authorization PCTS FPR-2015-9110
3.3 Defining “Significance” ................................................................................................. 91
4 Status of Listed Resources.................................................................................................. 93 4.1 Species and Critical Habitat Not Considered Further in this Opinion ........................... 97
4.1.1 North Pacific Right Whale...................................................................................... 97 4.1.2 Western North Pacific Gray Whale ........................................................................ 99 4.1.3 Green Sea Turtle ................................................................................................... 103 4.1.4 Loggerhead Sea Turtle .......................................................................................... 104 4.1.5 Olive Ridley Sea Turtle ........................................................................................ 104 4.1.6 Ozette Lake Sockeye Salmon ............................................................................... 104 4.1.7 Southern California Steelhead .............................................................................. 107 4.1.8 Southern DPS of Green Sturgeon ......................................................................... 108 4.1.9 Critical Habitat for the Southern DPS of Green Sturgeon.................................... 114 4.1.10 Critical Habitat for ESA-listed Rockfish .............................................................. 116 4.1.11 Critical Habitat for Pacific Eulachon.................................................................... 118 4.1.12 Critical Habitat for Puget Sound Chinook Salmon............................................... 119 4.1.13 Critical Habitat for Puget Sound Steelhead (Proposed)........................................ 121 4.1.14 Critical Habitat for Hood Canal Summer Run Chum Salmon.............................. 121
4.2 Species Considered Further in this Biological Opinion ............................................... 123 4.2.1 Blue Whale............................................................................................................ 125 4.2.2 Fin Whale.............................................................................................................. 136 4.2.3 Humpback Whale.................................................................................................. 144 4.2.4 Sei Whale .............................................................................................................. 157 4.2.5 Sperm Whale......................................................................................................... 164 4.2.6 Southern Resident Killer Whale ........................................................................... 173 4.2.7 Guadalupe Fur Seal............................................................................................... 182 4.2.8 Leatherback Sea Turtle ......................................................................................... 184 4.2.9 Puget Sound/Georgia Basin Canary Rockfish ...................................................... 193 4.2.10 Puget Sound/Georgia Basin Yelloweye Rockfish ................................................ 197 4.2.11 Puget Sound/Georgia Basin Bocaccio .................................................................. 201 4.2.12 Southern DPS of Pacific Eulachon ....................................................................... 205 4.2.13 Chinook Salmon.................................................................................................... 208 4.2.14 Chum Salmon........................................................................................................ 238 4.2.15 Coho Salmon......................................................................................................... 247 4.2.16 Sockeye Salmon.................................................................................................... 259 4.2.17 Steelhead ............................................................................................................... 264
4.3 Summary of NMFS’ Final Effects Determinations for ESA-listed Species and Designated Critical Habitat..................................................................................................... 293
5 Environmental Baseline.................................................................................................... 297 5.1 Climate Change ............................................................................................................ 297 5.2 Whaling ........................................................................................................................ 306
ii
Biological Opinion and Conference Report on Navy NWTT Activities and NMFS’ MMPA Incidental Take Authorization PCTS FPR-2015-9110
5.3 Fisheries ....................................................................................................................... 306 5.4 Vessel Strike................................................................................................................. 308 5.5 Water Quality Degradation .......................................................................................... 310 5.6 Ocean Noise ................................................................................................................. 312 5.7 Commercial and Private Marine Mammal Watching .................................................. 318 5.8 Navy Training and Testing Activities in the Action Area ........................................... 319
5.8.1 Summary of Activities Under Previous LOAs and Biological Opinions ............. 320 5.9 Scientific Research and Permits................................................................................... 328 5.10 The Impact of the Baseline on Listed Resources ......................................................... 329
6 Effects of the Action on ESA-Listed Species and Critical Habitat............................... 331 6.1 Stressors Associated with the Proposed Action ........................................................... 332
6.1.1 Level of Annual Activities Introducing Stressors into the NWTT Action Area 337 6.1.2 Summary of Effect Determinations By Stressor................................................... 339
6.2 Stressors Not Likely to Adversely Affect ESA-listed Species .................................... 343 6.2.1 Vessel Strike ......................................................................................................... 343 6.2.2 Effects of Weapons Firing, Launch and Impact Noise ......................................... 345 6.2.3 Effects of Aircraft Noise ....................................................................................... 345 6.2.4 Effects of Vessel Noise ......................................................................................... 349 6.2.5 Effects of Fiber Optic Cables, Guidance Wires, and Decelerators/Parachutes from Entanglement ...................................................................... 357 6.2.6 Effects of Munitions and Other Military Expended Materials from Ingestion..... 359 6.2.7 Effects of Electromagnetic Devices...................................................................... 360 6.2.8 Effects of In-water Devices and expended material from direct physical strikes 362 6.2.9 Secondary Stressors .............................................................................................. 362 6.2.10 Indirect Effects of Injury and Mortality of Chinook Salmon from Explosions on Southern Resident Killer Whales ................................................................ 364
6.3 Risk Assessment Framework – Marine Mammals....................................................... 365 6.3.1 Direct Injury of Marine Mammals From Acoustic Stressors................................ 365 6.3.2 Primary Blast Injury and Barotrauma ................................................................... 366 6.3.3 Auditory Trauma................................................................................................... 367 6.3.4 Acoustic Resonance .............................................................................................. 367 6.3.5 Bubble Formation (Acoustically Induced)............................................................ 367 6.3.6 Nitrogen Decompression ...................................................................................... 369 6.3.7 Hearing Loss ......................................................................................................... 370 6.3.8 Auditory Masking ................................................................................................. 373 6.3.9 Physiological Stress .............................................................................................. 375 6.3.10 Behavioral Reactions ............................................................................................ 377 6.3.11 Repeated Exposures of Marine Mammals ............................................................ 387
iii
Biological Opinion and Conference Report on Navy NWTT Activities and NMFS’ MMPA Incidental Take Authorization PCTS FPR-2015-9110
6.3.12 Stranding ............................................................................................................... 390 6.3.13 Long-term Consequences to the Individual and the Population ........................... 395 6.3.14 Criteria for Predicting Acoustic and Explosive Impacts – Marine Mammals ...... 398
6.4 Risk Assessment Framework - Sea Turtles.................................................................. 416 6.4.1 Primary Blast Injury and Barotrauma ................................................................... 416 6.4.2 Auditory Trauma................................................................................................... 417 6.4.3 Hearing Loss ......................................................................................................... 417 6.4.4 Auditory Masking ................................................................................................. 418 6.4.5 Physiological Stress .............................................................................................. 419 6.4.6 Behavioral Reactions ............................................................................................ 419 6.4.7 Repeated Exposures of Sea Turtles....................................................................... 421 6.4.8 Criteria for Predicting Acoustic and Explosive Impacts – Sea Turtles ................ 423
6.5 Risk Assessment Framework – Fish ............................................................................ 432 6.5.1 Direct Injury of Fish from Non-Impulsive Acoustic Stressors............................. 432 6.5.2 Primary Blast Injury and Barotrauma ................................................................... 434 6.5.3 Hearing Loss ......................................................................................................... 436 6.5.4 Auditory Masking ................................................................................................. 440 6.5.5 Physiological Stress .............................................................................................. 442 6.5.6 Behavioral Reactions ............................................................................................ 443 6.5.7 Repeated Exposures of Fish.................................................................................. 446 6.5.8 Criteria for Predicting Acoustic and Explosive Impacts - Fish ............................ 448
6.6 Density Estimate Use in Exposure Estimates .............................................................. 454 6.6.1 Marine Mammals .................................................................................................. 454 6.6.2 Leatherback Sea Turtle ......................................................................................... 456 6.6.3 Fish........................................................................................................................ 456
6.7 Exposure and Response – Non-Impulsive Acoustic Stressors - Training.................... 456 6.7.1 Exposure and Response of Marine Mammals to Non-Impulsive Acoustic Stressors – Training Activities............................................................................................ 456 6.7.2 Summary of Predicted Effects to Marine Mammals............................................. 476 6.7.3 Exposure and Response of Leatherback Sea Turtles to Non-Impulsive Acoustic Stressors – Training Activities............................................................................. 477 6.7.4 Exposure and Response of Fish to Non-Impulsive Acoustic Stressors –Training Activities .............................................................................................................. 479
6.8 Exposure and Response – Non-Impulsive Acoustic Stressors - Testing ..................... 481 6.8.1 Exposure and Response of Marine Mammals to Non-Impulsive Acoustic Stressors – Testing Activities.............................................................................................. 481 6.8.2 Summary of Predicted Effects to Marine Mammals............................................. 490 6.8.3 Exposure and Response of Leatherback Sea Turtles to Non-Impulsive Acoustic Stressors – Testing Activities .............................................................................. 491
iv
Biological Opinion and Conference Report on Navy NWTT Activities and NMFS’ MMPA Incidental Take
Authorization PCTS FPR-2015-9110
6.8.4 Exposure and Response of Fish to Non-Impulsive Acoustic Stressors –Testing Activities ................................................................................................................ 493
6.9 Exposure and Response – Impulsive Stressors - Training ........................................... 493 6.9.1 Exposure and Response of Marine Mammals to Impulsive Acoustic
Stressors – Training Activities............................................................................................ 494 6.9.2 Exposure and Response of Leatherback Sea Turtles to Impulsive Stressors –Training Activities .............................................................................................................. 499
6.10 Exposure and Response – Impulsive Stressors - Testing............................................. 502 6.10.1 Exposure and Response of Marine Mammals to Impulsive Acoustic
Stressors – Testing Activities.............................................................................................. 502 6.10.2 Summary of Predicted Effects to Marine Mammals............................................. 507 6.10.3 Exposure and Response of Leatherback Sea Turtles to Impulsive Acoustic
Stressors – Testing Activities.............................................................................................. 508 6.11 Exposure and Response of Fish to Impulsive Acoustic Stressors – Training and
Testing Activities.................................................................................................................... 509 6.12 Cumulative Effects ....................................................................................................... 552
7 Integration and Synthesis................................................................................................. 552 7.1 Blue Whale................................................................................................................... 555 7.2 Fin Whale ..................................................................................................................... 558 7.3 Humpback Whale......................................................................................................... 560 7.4 Sei Whale ..................................................................................................................... 562 7.5 Sperm Whale ................................................................................................................ 564 7.6 Southern Resident Killer Whale................................................................................... 566 7.7 Guadalupe Fur Seal ...................................................................................................... 567 7.8 Leatherback Sea Turtles ............................................................................................... 569 7.9 Threatened and Endangered Fishes.............................................................................. 571
8 Conclusion ......................................................................................................................... 573
9 Incidental Take Statement ............................................................................................... 574 9.1 Amount or Extent of Take............................................................................................ 575
9.1.1 Activity Levels as Indicators of Take ................................................................... 584 9.2 Effects of the Take ....................................................................................................... 585 9.3 Reasonable and Prudent Measures ............................................................................... 585 9.4 Terms and Conditions .................................................................................................. 586
10 Conservation Recommendations ..................................................................................... 588
11 Reinitiation of Consultation ............................................................................................. 589
12 Information Quality Act................................................................................................... 589
13 References .......................................................................................................................... 590
v

Biological Opinion and Conference Report on Navy NWTT Activities and NMFS’ MMPA Incidental Take
Authorization PCTS FPR-2015-9110
vi
Biological Opinion and Conference Report on Navy NWTT Activities and NMFS’ MMPA Incidental Take
Authorization PCTS FPR-2015-9110
List of Tables Page
Table 1. Representative Training Activities Occurring in the NWTT Study Area ........................ 6
Table 5. Naval Sea Systems Command Testing Activities in the NWTT Study
Table 7. Summary of Navy Mitigation Measures for Training and Testing
Table 8. The range to effects for activities using sonar and other active acoustic
Table 9. Available underwater marine mammal threshold shift peer reviewed
Table 12. Popper et al. 2014 Explosive Thresholds for Mortality/Mortal Injury
Table 15. Species listed under the Federal Endangered Species Act (ESA) under
Table 16. Five-year geometric means for adult natural-origin and hatchery-origin spawners for the LO sockeye salmon ESU (unpublished data, Norma Jean Sands,
Table 17. Physical or biological features of critical habitat designated for southern
Table 2. Proposed Training Activity Levels ................................................................................... 9
Table 3. Representative Naval Sea Systems Command Testing Activities.................................. 15
Table 4. Representative Naval Air Systems Command Testing Activities .................................. 18
Area............................................................................................................................................... 19
Table 6. Naval Air Systems Command Testing Activity Levels.................................................. 22
Activities ....................................................................................................................................... 24
sources used in the Inland ............................................................................................................. 28
studies (since 2011)....................................................................................................................... 70
Table 10. Sound Exposure Criteria for Fishes Exposed to Navy Sonar ....................................... 77
Table 11. NMFS Dual Interim Impact Pile Driving Injury Thresholds........................................ 82
(highlighted).................................................................................................................................. 83
Table 13. Thresholds for Assessing Effects of Explosives on Fish.............................................. 86
Table 14. Post Model Acoustic Impact Analysis Process............................................................. 88
NMFS jurisdiction that may occur in the NWTT Action Area. ................................................... 94
NWFSC, Apr. 10, 2012; as cited in NMFS 2015). ..................................................................... 105
green sturgeon and corresponding species life history events. ................................................... 115
vii
Biological Opinion and Conference Report on Navy NWTT Activities and NMFS’ MMPA Incidental Take
Authorization PCTS FPR-2015-9110
Table 18. Physical or biological features of critical habitats designated for eulachon and corresponding species life history events. ............................................................ 118
Table 19. Abundance–five-year geometric means for adult (age 3+) natural (natural and hatchery origin) and natural origin only spawners for the ESU with ranges and medians given for the populations (Ford 2011b)...................................................... 215
Table 20. Average abundance estimates for PS Chinook salmon natural- and hatchery-origin spawners 2008-2012 (unpublished data, Mindy Rowse, NWFSC, Jan. 28, 2015; as cited in NMFS 2015)....................................................................................... 216
Table 21. Abundance estimates for LCR Chinook salmon populations (ODFW 2014a; WDFW 2014).................................................................................................................. 220
Table 22. Average estimated outmigration for ESA-listed LCR Chinook salmon (2010-2014)................................................................................................................................. 221
Table 23. Abundance Geometric Means for Adult CC Chinook Salmon Natural-origin Spawners. ......................................................................................................................... 223
Table 24. Recent five-year average projected outmigrations for UCR Chinook (Dey 2012; Ferguson 2010; Zabel 2014a; Zabel 2014b). ........................................................... 226
Table 25. Adult UWR spring Chinook escapement to the Clackamas River and Willamette Falls fish ladder (ODFW 2014a; ODFW and WDFW 2013; ODFW and WDFW 2014b) (ODFW and WDFW 2011; ODFW and WDFW 2012)............................. 227
Table 26. Average estimated outmigration for ESA-listed UWR Chinook salmon (2010-2014)................................................................................................................................. 228
Table 27. Average CVS Chinook salmon smolt release 2009-2013 (Regional Mark Processing Center 2014).................................................................................................... 229
Table 28. CVS Chinook salmon population estimates from (CDFW 2013) with corresponding cohort replacement rates for years since 1986. ................................................... 229
Table 29. Estimated numbers of adult SR spring/summer Chinook salmon (ODFW and WDFW 2014a). ...................................................................................................... 233
Table 30. Recent five-year average projected outmigrations for SR spring/summer Chinook salmon (Dey 2012; Ferguson 2010; Zabel 2014a; Zabel 2014b)................................. 233
Table 31. Estimated numbers of adult SR fall Chinook salmon (NWFSC 2015). ..................... 235
viii
Biological Opinion and Conference Report on Navy NWTT Activities and NMFS’ MMPA Incidental Take
Authorization PCTS FPR-2015-9110
Table 32. Recent five-year average projected outmigrations for SR fall Chinook salmon (Dey 2012; Ferguson 2010; Zabel 2014a; Zabel 2014b). .............................................. 235
Table 33. Average abundance estimates for SRW Chinook salmon natural- and hatchery-origin spawners 2001-2011 (Killam 2012; O’Farrell et al. 2012). .............................. 237
Table 34. Average estimated outmigration for ESA-listed CR chum salmon (2010-2014)................................................................................................................................. 243
Table 35. Abundance of natural-origin and hatchery-origin HCS chum salmon spawners in escapements 2009-2013 (unpublished data, Mindy Rowse, NWFSC, Nov. 25, 2014; as cited in NMFS 2015). .................................................................................... 246
Table 36. Estimated abundance of adult LCR coho (ODFW and WDFW 2010; Yakima/Klickitat Fisheries Project 2014)). ................................................................................ 251
Table 37. Average estimated outmigration for ESA-listed LCR coho salmon (2010-2014)................................................................................................................................. 252
Table 38. SONCC coho salmon ESA-listed hatchery stock annual juvenile production goals (California Hatchery Scientific Review Group 2012; ODFW 2011)). ......................................................................................................................................... 254
Table 39. Estimates of the natural and hatchery adult SONCC coho salmon returns (Chesney and Knechtle 2011; Knechtle and Chesney 2011; ODFW 2014c; Sinnen et al. 2011). ..................................................................................................................... 256
Table 40. Geometric mean abundances of CCC coho salmon spawners in 2006
2012 escapements by population. ............................................................................................... 258
Table 41. Recent five-year average projected outmigrations for SR sockeye (Dey 2012; Ferguson 2010; Zabel 2014a; Zabel 2014b). .................................................................... 263
Table 42. Abundance estimates for LCR steelhead populations (NWFSC 2015; ODFW 2010b; Streamnet 2014; WDFW 2010a; WDFW 2010b; WDFW 2011). ..................... 270
Table 43. Average estimated outmigration for ESA-listed LCR steelhead (2010
2014). .......................................................................................................................................... 271
Table 44. Annual escapement estimates of adult MCR steelhead for the years 2009-2012 (NWFSC 2015)......................................................................................................... 273
ix
Biological Opinion and Conference Report on Navy NWTT Activities and NMFS’ MMPA Incidental Take Authorization PCTS FPR-2015-9110
Table 45. Recent five-year average projected outmigrations for MCR steelhead (Dey 2012; Ferguson 2010; Zabel 2014a; Zabel 2014b). ........................................................... 273
Table 47. Recent five-year average projected outmigrations for UCR steelhead
Table 49. Estimated numbers of adult Snake River steelhead (ODFW/WDFW
Table 50. Recent five-year average projected outmigrations for SR steelhead (Dey
Table 51. Abundance of PS steelhead spawner escapements (natural-origin and
Table 52. Geometric mean abundances of NC steelhead spawners from 2006
Table 53. Approximate annual releases of hatchery CCC steelhead (J. Jahn, pers.
Table 54. Geometric mean abundances of CCC steelhead spawners from 2006
Table 55. Expected annual CCV steelhead hatchery releases (California Hatchery
Table 56. Abundance geometric means (2002-2010) for adult CCV steelhead
Table 57. Geometric mean abundances of SCCC steelhead spawners from 2001
Table 58. Summary of Species Effect Determinations for Training and Testing
Table 59. Summary of Critical Habitat Effect Determinations for Training and
Table 46. Average numbers of adult UCR steelhead (NWFSC 2015). ...................................... 275
(Dey 2012; Ferguson 2010; Zabel 2014a; Zabel 2014b). ........................................................... 275
Table 48. Upper Willamette winter-run steelhead abundance (ODFW 2014b). ........................ 277
2014). .......................................................................................................................................... 279
2012; Ferguson 2010; Zabel 2014a; Zabel 2014b). .................................................................... 279
hatchery production combined) from 2009-2013. ...................................................................... 281
2012 escapements by population. ............................................................................................... 284
comm., July 2, 2013; cited in NMFS 2015)................................................................................ 286
2012 escapements by population. ............................................................................................... 287
Scientific Review Group 2012). ................................................................................................. 289
natural- and hatchery-origin spawners........................................................................................ 290
2012 escapements by population. ............................................................................................... 292
Activities in the Action Area ...................................................................................................... 294
Testing Activities in the Action Area ......................................................................................... 296
x
Biological Opinion and Conference Report on Navy NWTT Activities and NMFS’ MMPA Incidental Take
Authorization PCTS FPR-2015-9110
Table 60. Phenomena associated with projections of global climate change including levels of confidence associated with projections (adapted from (IPCC 2001) and (Patz et al. 2008))....................................................................................................... 301
Table 61. Navy Post-calculation Annual Potential Exposures from November 2010 through May 2014 and Cumulative Totals ........................................................................ 323
Table 62. Monitoring Plan Metrics Accomplished in the NWTRC through May 2014............................................................................................................................................. 326
Table 63. Navy NWTRC Compliance Monitoring For Year 5 Compared To Preceding Effort. ......................................................................................................................... 327
Table 64. Authorized permitted takes of listed whales, pinnipeds, and sea turtles in the Pacific Ocean under the Endangered Species Act and the Marine Mammal
Protection Act. ............................................................................................................................ 329
Table 65. Navy Stressor Categories Analyzed in This Opinion ................................................. 333
Table 66. Overview of Training and Testing Activity Levels by Stressor ................................. 338
Table 67. Summary of NMFS’ Effect Determinations by Stressor - Training Activities ..................................................................................................................................... 340
Table 68. Summary of NMFS’ Effect Determinations by Stressor - Testing Activities ..................................................................................................................................... 341
Table 69. The percent of ESA-listed adult Puget Sound Chinook salmon that
would be affected (injured or killed) by Navy detonations. ....................................................... 365
Table 70. Acoustic Criteria and Thresholds for Predicting Physiological Effects to
Marine Mammals Underwater from Sonar and Other Active Acoustic Sources........................ 402
Table 71. Approximate Maximum Ranges to the Onset of Temporary Threshold
Shift for Four Representative Sonar Over a Representative Range of Ocean Environments .............................................................................................................................. 404
Table 72. Approximate Ranges to Permanent Threshold Shift Criteria for Each
Functional Hearing Group for a Single Ping from Three of the Most Powerful Sonar Systems within Representative Ocean Acoustic Environments ....................................... 406
Table 73. Criteria and Thresholds for Predicting Physiological Effects to Marine Mammals Underwater for Explosives ........................................................................................ 407
xi
Biological Opinion and Conference Report on Navy NWTT Activities and NMFS’ MMPA Incidental Take
Authorization PCTS FPR-2015-9110
Table 74. Range to Received Sound Pressure Level (SPL) in 6-dB Increments and Percentage of Behavioral Harassments for Low-Frequency Cetaceans under the Mysticete Behavioral Response Function for Four Representative Source Bins for the Action Area ........................................................................................................................... 413
Table 75. Range to Received Sound Pressure Level (SPL) in 6-dB Increments and Percentage of Behavioral Harassments for Mid-Frequency and High Frequency Cetaceans under the Odontocete Response Function for Four Representative Source Bins ................................................................................................................................. 414
Table 76. Summary of behavioral response thresholds for marine mammals. ........................... 415
Table 77. Sea Turtle Impact Threshold Criteria for Impulsive Sources ..................................... 425
Table 78. Sea Turtle Impact Threshold Criteria Used in Acoustic Modeling for Non-Impulse Sources.................................................................................................................. 425
Table 79. Range to impacts from In-Water Explosives on Sea Turtles from Representative Sources ............................................................................................................... 426
Table 80. Species-Specific Sea Turtle Masses for Determining Onset of Extensive and Slight Lung Injury Thresholds ............................................................................................. 430
Table 81. Thresholds for Assessing Effects to Fish from Sonar. All values are SEL (dB re 1 µPa
2-s) .................................................................................................................. 449
Table 82. Predicted Range to Effect for Sonar Source bins used in NWTT. (Range
is maximum expected range.) All distances are in meters. A value of “0” indicates
that the source level is below the criteria threshold even after accumulation of multiple pings.............................................................................................................................. 450
Table 83. Ranges to Effects to Fish from Explosives. Ranges to effects are presented in meters. .................................................................................................................... 452
Table 84. Summary of Predicted Exposure of Blue Whales to Non-impulsive Sources during Training.............................................................................................................. 458
Table 85. Summary of Predicted Exposure of Fin Whales to Non-impulsive Sources during Training.............................................................................................................. 465
Table 86. Summary of Predicted Exposure of Humpback Whales to Non-impulsive Sources during Training............................................................................................. 467
xii
Biological Opinion and Conference Report on Navy NWTT Activities and NMFS’ MMPA Incidental Take
Authorization PCTS FPR-2015-9110
Table 87. Summary of Predicted Exposure of Sei Whales to Non-impulsive Sources during Training.............................................................................................................. 470
Table 88. Summary of Predicted Exposure of Sperm Whales to Non-impulsive Sources during Training.............................................................................................................. 472
Table 89. Summary of Predicted Exposure of Southern Resident Killer Whales to Non-impulsive Sources during Training..................................................................................... 475
Table 90. Summary of Effects on Marine Mammals from Non-impulsive Acoustic Stressors During Training ........................................................................................................... 476
Table 91. Summary of Predicted Exposure of Leatherback Sea Turtles to Non-impulsive Sources during Training............................................................................................. 478
Table 92. Summary of Predicted Exposure of Blue Whales to Non-impulsive Sources during Testing ............................................................................................................... 482
Table 93. Summary of Predicted Exposure of Fin Whales to Non-impulsive Sources during Testing ............................................................................................................... 484
Table 94. Summary of Predicted Exposure of Humpback Whales to Non-impulsive Sources during Testing............................................................................................... 486
Table 95. Summary of Predicted Exposure of Sei Whales to Non-impulsive Sources during Testing ............................................................................................................... 487
Table 96. Summary of Predicted Exposure of Sperm Whales to Non-impulsive Sources during Testing ............................................................................................................... 488
Table 97. Summary of Predicted Exposure of Southern Resident Killer Whales to Non-impulsive Sources during Testing ...................................................................................... 489
Table 98. Summary of Effects on Marine Mammals from Non-impulsive Acoustic Stressors During Testing............................................................................................................. 491
Table 99. Summary of Predicted Exposure of Leatherback Sea Turtles to Non-impulsive Sources during Testing............................................................................................... 493
Table 100. Summary of Predicted Exposure of Blue Whales to Impulsive Sources during Training ........................................................................................................................... 495
Table 101. Summary of Predicted Exposure of Fin Whales to Impulsive Sources during Training ........................................................................................................................... 496
xiii
Biological Opinion and Conference Report on Navy NWTT Activities and NMFS’ MMPA Incidental Take
Authorization PCTS FPR-2015-9110
Table 102. Summary of Predicted Exposure of Humpback Whales to Impulsive Sources during Training.............................................................................................................. 496
Table 103. Summary of Predicted Exposure of Sei Whales to Impulsive Sources during Training ........................................................................................................................... 497
Table 104. Summary of Predicted Exposure of Sperm Whales to Impulsive Sources during Training.............................................................................................................. 498
Table 105. Summary of Predicted Exposure of Southern Resident Killer Whales to Impulsive Sources during Training......................................................................................... 498
Table 106. Summary of Predicted Exposure of Leatherback Sea Turtles to Impulsive Sources during Training............................................................................................. 499
Table 107. Summary of Predicted Exposure of Blue Whales to Impulsive Sources during Testing ............................................................................................................................. 503
Table 108. Summary of Predicted Exposure of Fin Whales to Impulsive Sources during Testing ............................................................................................................................. 504
Table 109. Summary of Predicted Exposure of Humpback Whales to Impulsive Sources during Testing ............................................................................................................... 505
Table 110. Summary of Predicted Exposure of Sei Whales to Impulsive Sources during Testing ............................................................................................................................. 506
Table 111. Summary of Predicted Exposure of Sperm Whales to Impulsive Sources during Testing ............................................................................................................... 507
Table 112. Summary of Effects on Marine Mammals from Impulsive Acoustic Stressors During Testing............................................................................................................. 508
Table 113. Summary of Predicted Exposure of Leatherback Sea Turtles to Impulsive Sources during Testing .............................................................................................. 509
Table 114. Explosive ordnances used during Navy training and testing activities in the NWTT Action Area that are likely to adversely affect fish.............................................. 510
Table 115. Expected co-occurrence of ESA-listed fish species with Navy explosive ordnance activity in the offshore Action Area. Unless otherwise noted, species is expected to co-occur with all ordnances from the specified explosive bin. .............................................................................................................................................. 517
xiv
Biological Opinion and Conference Report on Navy NWTT Activities and NMFS’ MMPA Incidental Take
Authorization PCTS FPR-2015-9110
Table 116. Summary of estimated annual abundance of salmonids (NMFS 2015). Abundance estimates for each ESU and DPS are divided into natural, listed hatchery intact adipose, and listed hatchery adipose clip. .......................................................... 519
Table 117. Habitat area (distribution) used for each ESU/DPS (km2) in the
offshore marine environment. ..................................................................................................... 523
Table 118. Estimated annual number of ESA-listed salmonids (hatchery fish w/adipose fin intact) that would die or be injured by explosive activities in the offshore environment. ................................................................................................................. 524
Table 119. Estimated annual number of ESA-listed salmonids (hatchery fish w/adipose clip) that would die or be injured by explosive activities in the offshore environment. ............................................................................................................................... 526
Table 120. Estimated annual number of ESA-listed salmonids (natural fish) that would die or be injured by explosive activities in the offshore environment. ............................ 528
Table 121. Estimated annual number of ESA-listed eulachon from the Southern DPS that would die or be injured by explosive activities in the offshore environment. ............................................................................................................................... 530
Table 122. Estimated annual number of ESA-listed salmonids that would die or be injured by explosive activities in Puget Sound. ..................................................................... 539
Table 123. Percent of each ESA-listed fish ESU/DPS (hatchery produced with adipose fin-clip) that would be killed or injured in the offshore portion of the NWTT Action Area over a 10-year period. --Indicates there are no fish from this ESU/DPS released from hatcheries with an adipose fin-clip that would be affected........................................................................................................................................ 544
Table 124. Percent of each ESA-listed fish ESU/DPS (hatchery produced with intact adipose) that would be killed or injured in the offshore portion of the NWTT Action Area over a 10-year period. --Indicates there are no fish from this ESU/DPS released from hatcheries with an intact adipose fin that would be affected........................................................................................................................................ 546
Table 125. Percent of each ESA-listed fish ESU/DPS (naturally produced) that would be killed or injured in the offshore portion of the NWTT Action Area over a 10-year period. --Indicates there are no naturally produced fish from this ESU/DPS that would be affected. ............................................................................................... 548
xv
Biological Opinion and Conference Report on Navy NWTT Activities and NMFS’ MMPA Incidental Take
Authorization PCTS FPR-2015-9110
Table 126. Percent of each ESA-listed Puget Sound salmonid ESU/DPS that
would be killed or injured during Navy training activities in the inland portion of
the NWTT Action Area over a 10-year period. --Indicates there are no fish from
this ESU/DPS that are either naturally producing, from a hatchery with an intact
adipose fin, or from a hatchery with an adipose clip that would be affected. ............................ 550
Table 127. The number of threatened or endangered marine mammals and sea
turtles that are likely to be “taken” as a result of their exposure to Navy Training
activities conducted on in the NWTT Action Area on an Annual Basis. ................................... 576
Table 128. The number of threatened or endangered marine mammals and sea
turtles that are likely to be “taken” as a result of their exposure to Navy Testing
Activities conducted on in the NWTT Action Area on an Annual Basis. .................................. 577
Table 129. The number of threatened or endangered fish (hatchery fish with
adipose fin-clip) that are likely to be killed or injured as a result of their exposure
to Navy Training and Testing Activities conducted in the offshore portion of the
NWTT Action Area over a 10-year period. Also presented is the percent of the
corresponding ESU/DPS that would be injured and/or killed. ................................................... 578
Table 130. The number of threatened or endangered fish (hatchery fish with intact
adipose) that are likely to be killed or injured as a result of their exposure to Navy
Training and Testing Activities conducted in the offshore portion of the NWTT
Action Area over a 10-year period. Also presented is the percent of the
corresponding ESU/DPS that would be injured and/or killed. ................................................... 580
Table 131. The number of threatened or endangered fish (naturally produced) that
are likely to be killed or injured as a result of their exposure to Navy Training and
Testing Activities conducted in the offshore portion of the NWTT Action Area
over a 10-year period. Also presented is the percent of the corresponding
ESU/DPS that would be injured and/or killed. ........................................................................... 582
Table 132. The number, or percent of ESU/DPS affected, of threatened or
endangered salmonids that are likely to be killed or injured as a result of their
exposure to Navy Training Activities conducted in the inland portion of the
NWTT Action Area over a 10-year period. Also presented is the percent of the
corresponding ESU/DPS that would be injured and/or killed. ................................................... 584
Table 133. The proportion of threatened or endangered rockfish that are likely to
be killed or injured as a result of their exposure to Navy Training Activities
conducted in the inland portion of the NWTT Action Area over a 10-year period.................... 584
xvi
Biological Opinion and Conference Report on Navy NWTT Activities and NMFS’ MMPA Incidental Take Authorization PCTS FPR-2015-9110
List of Figures Page
Figure 1. Northwest Training and Testing Action Area ............................................................... 57
Figure 2. Action Area – Northwest Training Range Complex – Offshore Portion ...................... 58
Figure 3. Action Area – Northwest Training Range Complex – Inshore Portion ........................ 63
Figure 4. Action Area – Western Behm Canal, Alaska and the Southeast Alaska Acoustic Measurement Facility .................................................................................................... 64
Figure 5. Results from Yelverton et al. (1975) (caption from Hastings and Popper (2005))........................................................................................................................................... 84
Figure 6. Average impulse values from Govoni et al. (2003, 2007; vertical aqua bars with black squares indicating total injury dose (TID50) recommended by Govoni et al. 2007) compared with results of Yelverton et al. (1975) from Hasting 2007. Distance from the explosive source is indicated by the color of the line: blue – 3.6 m; red – 7.5 m; and yellow – 17 m. ...................................................................... 85
Figure 7. Commercial Ship Automated Identification System Position Data for Washington State (January 2009) ............................................................................................... 308
Figure 8. Two Hypothetical Threshold Shifts, Temporary and Permanent ................................ 371
Figure 9. Type I Auditory Weighting Functions Modified from the Southall et al. (2007) M-Weighting Functions .................................................................................................. 399
Figure 10. Type II Weighting Functions for Low-, Mid-, and High-Frequency Cetaceans .................................................................................................................................... 401
Figure 11. Behavioral response function applied to mysticetes. ................................................ 411
Figure 12. Behavioral response function applied to odontocetes and pinnipeds. ....................... 412
xvii
Biological Opinion and Conference Report on Navy NWTT Activities and NMFS’ MMPA Incidental Take
Authorization PCTS FPR-2015-9110
1 INTRODUCTION
Section 7 (a)(2) of the ESA requires Federal agencies to insure that their actions are not likely to
jeopardize the continued existence of endangered or threatened species or adversely modify or
destroy their designated critical habitat. When a Federal agency’s action “may affect” a protected
species, that agency is required to consult formally with NOAA’s National Marine Fisheries
Service (NMFS) or the US Fish and Wildlife Service (USFWS), depending upon the endangered
species, threatened species, or designated critical habitat that may be affected by the action (50
CFR §402.14(a)). Federal agencies are exempt from this general requirement if they have
concluded that an action “may affect, but is not likely to adversely affect” endangered species,
threatened species, or designated critical habitat and NMFS or the USFWS concurs with that
conclusion (50 CFR §402.14(b)).
Section 7 (b)(3) of the ESA requires that at the conclusion of consultation, NMFS and/or
USFWS provide an opinion stating how the Federal agencies’ actions will affect ESA-listed
species and their critical habitat under their jurisdiction. If an incidental take is expected, section
7 (b)(4) requires the consulting agency to provide an incidental take statement that specifies the
impact of any incidental taking and includes reasonable and prudent measures to minimize such
impacts.
For the actions described in this document, the action agencies are the United States Navy
(Navy), which proposes to continue military training exercises and testing activities, and NMFS
Office of Protected Resources - Permits and Conservation Division (Permits Division), which
proposes to promulgate regulations pursuant to the Marine Mammal Protection Act of 1972, as
amended (MMPA 16 U.S.C. 1361 et seq.), related to the Navy’s activities in the Northwest
Training and Testing (NWTT) Study Area that may affect several ESA-listed species. The
regulations propose to authorize the issuance of two Letters of Authorization (LOAs) that will
allow the Navy to “take” marine mammals incidental to its proposed action. The Federal action
of issuing LOAs to the Navy is also considered in this biological opinion (Opinion). The
consulting agency for these proposals is NMFS Office of Protected Resources - Endangered
Species Act Interagency Cooperation Division.
The Opinion and incidental take statement were prepared by NMFS Endangered Species Act
Interagency Cooperation Division in accordance with section 7(b) of the ESA and implementing
regulations at 50 CFR §402. This document represents NMFS’ Opinion on the effects of these
actions on endangered and threatened species and critical habitat that has been designated for
those species. A complete record of this consultation is on file at NMFS Office of Protected
Resources in Silver Spring, Maryland.
1
Biological Opinion and Conference Report on Navy NWTT Activities and NMFS’ MMPA Incidental Take
Authorization PCTS FPR-2015-9110
1.1 Background
This Opinion is based on information provided during pre-consultation and in the U.S. Navy’s
(Navy) January 9, 2015 request for ESA consultation package, including a draft EIS/OEIS, a
supplement to the draft EIS/OEIS, and supplemental information provided throughout the
consultation period. This Opinion also considers information provided by NMFS’ Permits
Division, including its request for Section 7 consultation under the ESA, which included the
proposed Federal regulations under the MMPA specific to the proposed activities (80 FR 31737)
and draft letters of authorization. Also considered were draft or final recovery plans for the
endangered or threatened species that are considered in this document, and publications that we
identified, gathered, and examined from the public scientific literature, including new
information that has become available since the issuance of the previous biological opinions
including Northwest Training Range Complex (NWTRC) and Keyport biological opinions.
1.2 Consultation History
On January 24, 2014, the Navy provided NMFS with the Draft EIS/OEIS for NWTT.
On October 8, 2014, the Navy provided NMFS an updated timeline for the EIS/OEIS, NMFS’
issuance of an incidental take authorization pursuant to the MMPA, and the ESA section 7
consultation schedule for NMFS review and concurrence.
On November 11, 2014, the Navy provided NMFS with the Navy’s analysis of proposed
biologically important areas (pursuant to the MMPA incidental take authorization) overlapping
with the NWTT Study Area.
On December 12, 2014, the Navy withdrew the request for mortality in the MMPA incidental
take authorization.
On January 9, 2015, NMFS received the Navy’s biological evaluation and a request for formal
consultation for proposed Navy NWTT activities.
On March 18, 2015, NMFS met with the Navy to review comments received on the Draft NWTT
EIS/OEIS pursuant to the Cooperating Agency agreement as relevant to the pending MMPA
incidental take authorization and ESA section 7 consultation.
On April 8, 2015, following initial review of the Navy’s request for formal consultation, NMFS
determined that there was sufficient information to initiate formal consultation.
Also on April 8, 2015, NMFS requested that the Navy agree to extend the consultation timeline
beyond the statutory timeline (135 days) and to complete a biological opinion on or before
September 21, 2015 (approximately 160 days).
2
Biological Opinion and Conference Report on Navy NWTT Activities and NMFS’ MMPA Incidental Take
Authorization PCTS FPR-2015-9110
On April 10, 2015, NMFS received the Navy’s concurrence to extend the consultation beyond
135 days and to complete the biological opinion on or before September 21, 2015.
On May 28, 2015, NMFS received information from the USFWS on the NWTT description of
the action and exposure profiles to ensure consistency between the Services’ respective ESA
section 7 consultations on the Navy’s NWTT activities.
On July 7, 2015, NMFS’ ESA Interagency Cooperation Division initiated intra-agency
coordination on the NWTT biological opinion with NMFS’ West Coast Regional Office to
ensure the use of the use the best scientific and commercial data available.
On July 22, 2015, the Navy provided NMFS and the USFWS its proposed acoustic criteria for
effects to fish species.
On July 30, 2015 NMFS and the USFWS met to discuss the Navy’s proposed acoustic criteria
for fish species. On July 31, 2015, NMFS provided the Navy comments on the proposed criteria.
Receipt of this new information necessitated additional time to complete the biological opinion
beyond the formerly agreed upon date of September 21, 2015. NMFS and the Navy agreed to
extend the consultation to October 26 2015.
On September 15, 2015 the Navy provided NMFS final range to effects values for fish with
swim bladders from underwater detonations.
On September 18, 2015 NMFS provided the Navy the draft biological opinion for NWTT
activities.
On October 5, 2015, NMFS received comments from the Navy on the draft biological opinion.
Between October 5 and November 2, 2015, the NMFS and Navy communicated via email and
telephone to resolve comments and remaining issues on the draft biological opinion.
On November 2, 2015, the Navy provided NMFS with supplemental information on the range to
effects for fish without swim bladders from underwater detonations.
2 DESCRIPTION OF THE PROPOSED ACTION
“Action” means all activities or programs of any kind authorized, funded, or carried out, in
whole or in part, by federal agencies. Interrelated actions are those that are part of a larger action
and depend on that action for their justification. Interdependent actions are those that do not have
independent use, apart from the action under consideration.
This opinion addresses three interdependent actions: (1) the Navy’s military training and testing
activities conducted in the NWTT Study Area; (2) the regulations proposed by NMFS’s Permits
3
Biological Opinion and Conference Report on Navy NWTT Activities and NMFS’ MMPA Incidental Take
Authorization PCTS FPR-2015-9110
Division pursuant to the MMPA governing the Navy’s “take” of marine mammals incidental to
the Navy’s military readiness activities from November 2015 through November 2020; and (3)
NMFS Permits Division’s proposed issuance of LOAs pursuant to the proposed regulations that
will authorize the Navy to “take” marine mammals incidental to military readiness activities in
the NWTT Study Area through November 2020. This Opinion supersedes the reinitiated
biological opinion for the Northwest Training Range Complex (NWTRC) issued on August 1,
2014, and all previous biological opinions on the Keyport Range Complex and Southeast Alaska
Acoustic Measurement Facility (SEAFAC).
The purpose of the activities the Navy conducts in the NWTT Study Area is to meet the
requirements of the Navy’s Fleet Response Training Plan and allow Navy personnel to remain
proficient in anti-submarine warfare and mine warfare skills (i.e., military readiness activities).
The purpose of the MMPA regulations and the Permits and Conservation Division’s LOAs is to
allow the Navy to “take” marine mammals incidental to military readiness activities in the
NWTT Study Area conducted through November 2020 in a manner that is consistent with the
requirements of the MMPA and implementing regulations.
NMFS recognizes that while Navy training and testing requirements change over time in
response to global or geopolitical events and other factors, the general types of activities
addressed by this consultation are expected to continue into the reasonably foreseeable future,
along with the associated impacts. Therefore, as part of our effects analysis, we assumed that the
training and testing activities proposed by the Navy during the period of NMFS’ proposed
incidental take authorization pursuant to the MMPA (November 2015 through 2020) would
continue into the reasonably foreseeable future at levels similar to that assessed in this Opinion
and described in the NWTT DEIS/OEIS.
The tempo of training within the NWTT Study Area is subject to variation within the scope of
the activities described in the Navy’s NWTT Draft EIS/OEIS and this Opinion. Annual variation
in the number of training events and quantities of authorized sonar systems and explosive
training could occur based on:
• Frequency of out-of-area training deployments to other Navy range complexes;
• Overseas deployments of ships and aircraft to the western Pacific and Middle East;
• Within-area maintenance and repair work that precludes completing some training
within the NWTT; and
• Certification and training needs for a given ship, submarine, or aircraft crew (e.g.,
some units could require a certain amount of one kind of training versus another).
Given the inherent uncertainty and potential variation within the training spectrum due to
unforeseen world events, the Navy stated that it cannot predict exact annual system use for the
period.
4
Biological Opinion and Conference Report on Navy NWTT Activities and NMFS’ MMPA Incidental Take
Authorization PCTS FPR-2015-9110
The Navy categorizes training and testing activities into functional warfare areas called primary
mission areas. Most training and testing activities analyzed in the NWTT EIS/OEIS fall into the
following six primary mission areas:
• Anti-Air Warfare
• Anti-Surface Warfare
• Anti-Submarine Warfare (ASW)
• Electronic Warfare
• Mine Warfare (MIW)
• Naval Special Warfare
The research and acquisition community (i.e., testing community) also conducts testing activities
which do not readily fit into the primary mission areas. These additional testing activity
categories are listed in this document as follows:
• Naval Undersea Warfare Center Division, Keyport (NUWC Keyport)Testing
activities
• Naval Surface Warfare Center, Carderock Division (NSWCCD) Detachment Puget
Sound activities
• NSWCCD, Southeast Alaska Acoustic Measurement Facility activities
• Life Cycle Activities
• Shipboard Protection Systems and Swimmer Defense Testing
• Unmanned Vehicle Testing
• New Ship Construction
Additionally, some miscellaneous activities are grouped under “Other Activities.”
2.1 Navy Proposed Training Activities
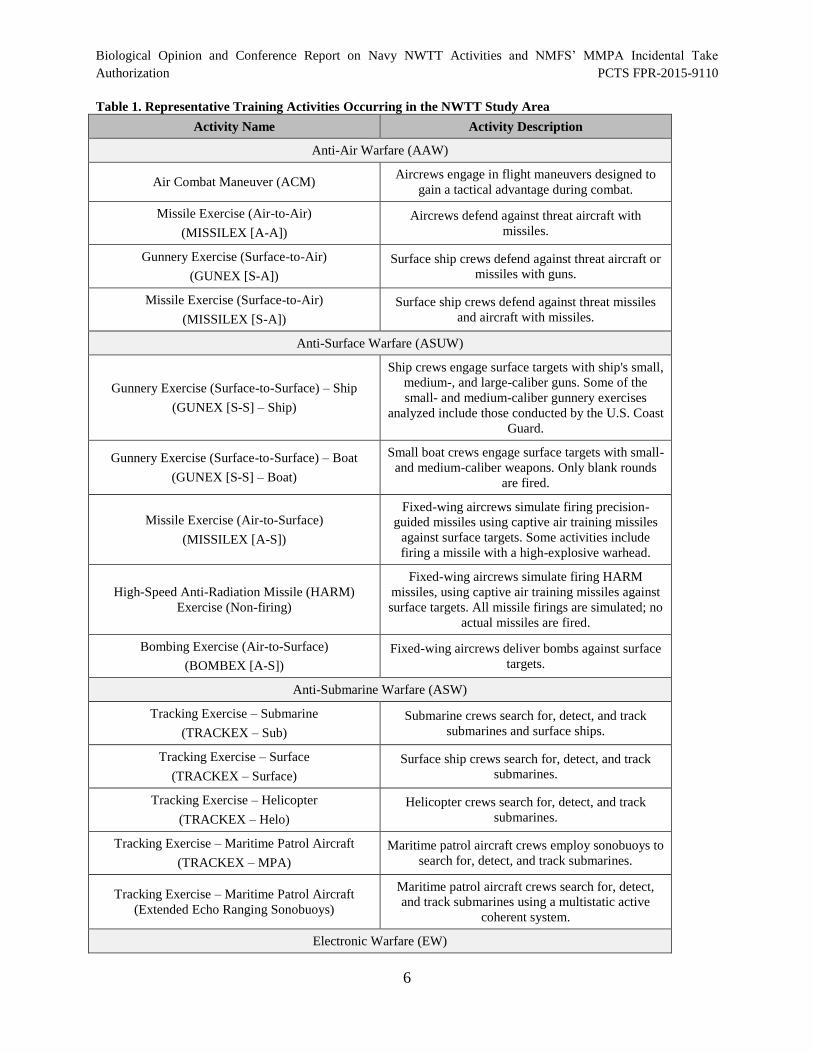
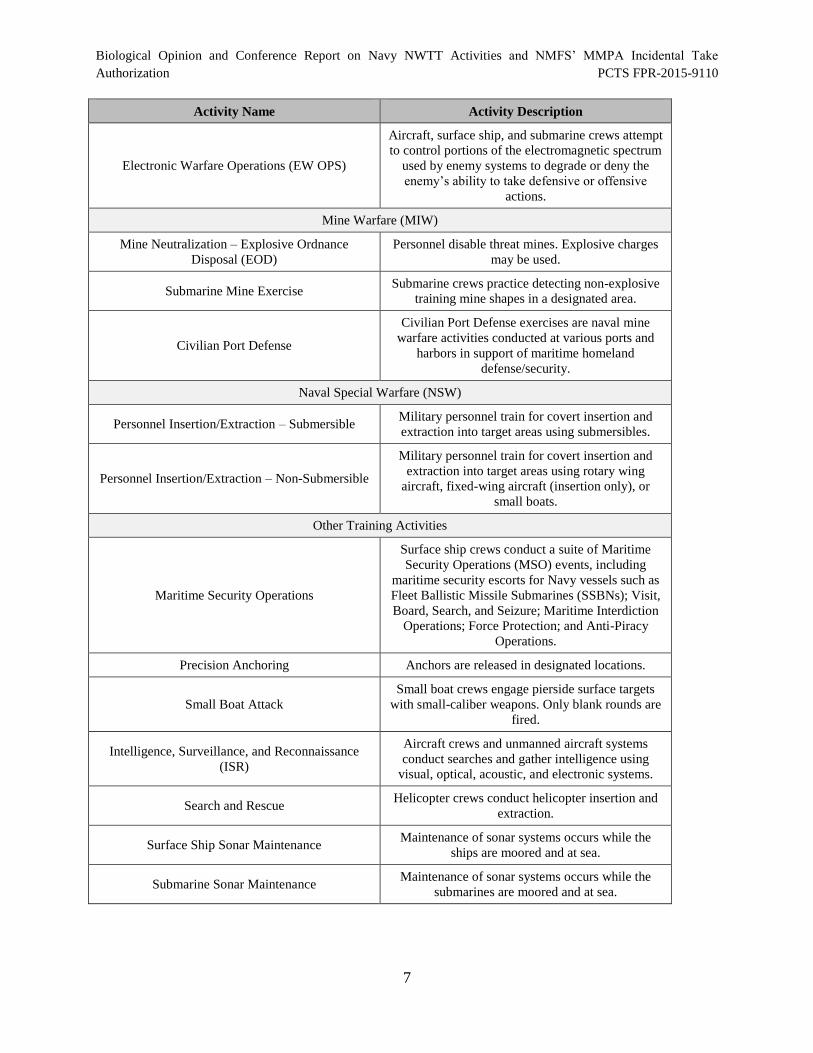
The Navy’s proposed training activities are briefly described in Table 1. The table is organized
according to primary mission areas and includes the activity name and a short description. Appendix A
(Navy Activities Descriptions) in the NWTT EIS/OEIS has more detailed descriptions of the
training activities.
5
Biological Opinion and Conference Report on Navy NWTT Activities and NMFS’ MMPA Incidental Take Authorization PCTS FPR-2015-9110
Table 1. Representative Training Activities Occurring in the NWTT Study Area
Activity Name Activity Description
Anti-Air Warfare (AAW)
Air Combat Maneuver (ACM) Aircrews engage in flight maneuvers designed to
gain a tactical advantage during combat.
Missile Exercise (Air-to-Air)
(MISSILEX [A-A])
Aircrews defend against threat aircraft with
missiles.
Gunnery Exercise (Surface-to-Air)
(GUNEX [S-A])
Surface ship crews defend against threat aircraft or
missiles with guns.
Missile Exercise (Surface-to-Air)
(MISSILEX [S-A])
Surface ship crews defend against threat missiles
and aircraft with missiles.
Anti-Surface Warfare (ASUW)
Gunnery Exercise (Surface-to-Surface) – Ship
(GUNEX [S-S] – Ship)
Ship crews engage surface targets with ship's small,
medium-, and large-caliber guns. Some of the
small- and medium-caliber gunnery exercises
analyzed include those conducted by the U.S. Coast
Guard.
Gunnery Exercise (Surface-to-Surface) – Boat
(GUNEX [S-S] – Boat)
Small boat crews engage surface targets with small-
and medium-caliber weapons. Only blank rounds
are fired.
Missile Exercise (Air-to-Surface)
(MISSILEX [A-S])
Fixed-wing aircrews simulate firing precision-
guided missiles using captive air training missiles
against surface targets. Some activities include
firing a missile with a high-explosive warhead.
High-Speed Anti-Radiation Missile (HARM)
Exercise (Non-firing)
Fixed-wing aircrews simulate firing HARM
missiles, using captive air training missiles against
surface targets. All missile firings are simulated; no
actual missiles are fired.
Bombing Exercise (Air-to-Surface)
(BOMBEX [A-S])
Fixed-wing aircrews deliver bombs against surface
targets.
Anti-Submarine Warfare (ASW)
Tracking Exercise – Submarine
(TRACKEX – Sub)
Submarine crews search for, detect, and track
submarines and surface ships.
Tracking Exercise – Surface
(TRACKEX – Surface)
Surface ship crews search for, detect, and track
submarines.
Tracking Exercise – Helicopter
(TRACKEX – Helo)
Helicopter crews search for, detect, and track
submarines.
Tracking Exercise – Maritime Patrol Aircraft
(TRACKEX – MPA)
Maritime patrol aircraft crews employ sonobuoys to
search for, detect, and track submarines.
Tracking Exercise – Maritime Patrol Aircraft
(Extended Echo Ranging Sonobuoys)
Maritime patrol aircraft crews search for, detect,
and track submarines using a multistatic active
coherent system.
Electronic Warfare (EW)
6
Biological Opinion and Conference Report on Navy NWTT Activities and NMFS’ MMPA Incidental Take Authorization PCTS FPR-2015-9110
Activity Name Activity Description
Electronic Warfare Operations (EW OPS)
Aircraft, surface ship, and submarine crews attempt
to control portions of the electromagnetic spectrum
used by enemy systems to degrade or deny the
enemy’s ability to take defensive or offensive
actions.
Mine Warfare (MIW)
Mine Neutralization – Explosive Ordnance
Disposal (EOD)
Personnel disable threat mines. Explosive charges
may be used.
Submarine Mine Exercise Submarine crews practice detecting non-explosive
training mine shapes in a designated area.
Civilian Port Defense
Civilian Port Defense exercises are naval mine
warfare activities conducted at various ports and
harbors in support of maritime homeland
defense/security.
Naval Special Warfare (NSW)
Personnel Insertion/Extraction – Submersible Military personnel train for covert insertion and
extraction into target areas using submersibles.
Personnel Insertion/Extraction – Non-Submersible
Military personnel train for covert insertion and
extraction into target areas using rotary wing
aircraft, fixed-wing aircraft (insertion only), or
small boats.
Other Training Activities
Maritime Security Operations
Surface ship crews conduct a suite of Maritime
Security Operations (MSO) events, including
maritime security escorts for Navy vessels such as
Fleet Ballistic Missile Submarines (SSBNs); Visit,
Board, Search, and Seizure; Maritime Interdiction
Operations; Force Protection; and Anti-Piracy
Operations.
Precision Anchoring Anchors are released in designated locations.
Small Boat Attack
Small boat crews engage pierside surface targets
with small-caliber weapons. Only blank rounds are
fired.
Intelligence, Surveillance, and Reconnaissance
(ISR)
Aircraft crews and unmanned aircraft systems
conduct searches and gather intelligence using
visual, optical, acoustic, and electronic systems.
Search and Rescue Helicopter crews conduct helicopter insertion and
extraction.
Surface Ship Sonar Maintenance Maintenance of sonar systems occurs while the
ships are moored and at sea.
Submarine Sonar Maintenance Maintenance of sonar systems occurs while the
submarines are moored and at sea.
7
Biological Opinion and Conference Report on Navy NWTT Activities and NMFS’ MMPA Incidental Take
Authorization PCTS FPR-2015-9110
2.1.1 Training Activity Levels
Table 2 provides a summary of training activities (as described in the previous Section) including
tempo and quantities of inert and live munitions that the Navy plans to expend during training
that were analyzed by the Navy. Munitions that contain high explosives (highlighted in gray)
have greater potential for impact to listed species.
8
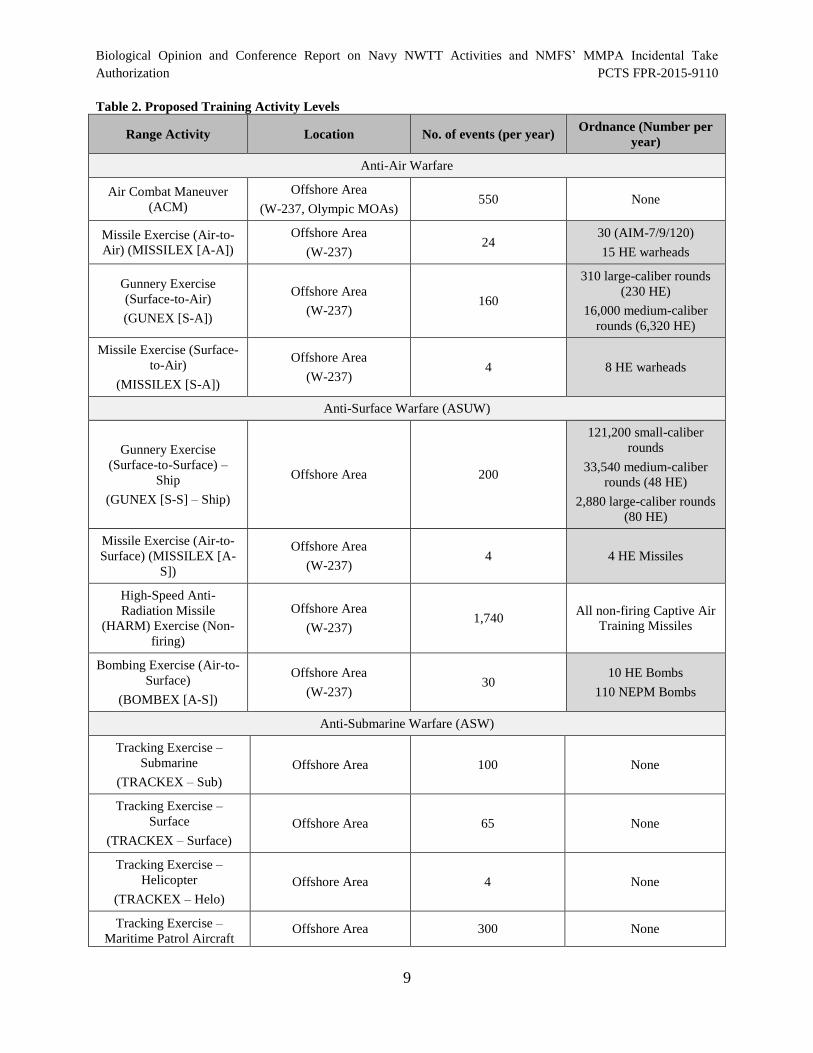
Biological Opinion and Conference Report on Navy NWTT Activities and NMFS’ MMPA Incidental Take Authorization PCTS FPR-2015-9110
Table 2. Proposed Training Activity Levels
Range Activity Location No. of events (per year) Ordnance (Number per
year)
Anti-Air Warfare
Air Combat Maneuver
(ACM)
Offshore Area
(W-237, Olympic MOAs) 550 None
Missile Exercise (Air-to-
Air) (MISSILEX [A-A])
Offshore Area
(W-237) 24
30 (AIM-7/9/120)
15 HE warheads
Gunnery Exercise
(Surface-to-Air)
(GUNEX [S-A])
Offshore Area
(W-237) 160
310 large-caliber rounds
(230 HE)
16,000 medium-caliber
rounds (6,320 HE)
Missile Exercise (Surface
to-Air)
(MISSILEX [S-A])
Offshore Area
(W-237) 4 8 HE warheads
Anti-Surface Warfare (ASUW)
Gunnery Exercise
(Surface-to-Surface) –
Ship
(GUNEX [S-S] – Ship)
Offshore Area 200
121,200 small-caliber
rounds
33,540 medium-caliber
rounds (48 HE)
2,880 large-caliber rounds
(80 HE)
Missile Exercise (Air-to-
Surface) (MISSILEX [A
S])
Offshore Area
(W-237) 4 4 HE Missiles
High-Speed Anti-
Radiation Missile
(HARM) Exercise (Non
firing)
Offshore Area
(W-237) 1,740
All non-firing Captive Air
Training Missiles
Bombing Exercise (Air-to-
Surface)
(BOMBEX [A-S])
Offshore Area
(W-237) 30
10 HE Bombs
110 NEPM Bombs
Anti-Submarine Warfare (ASW)
Tracking Exercise –
Submarine
(TRACKEX – Sub)
Offshore Area 100 None
Tracking Exercise –
Surface
(TRACKEX – Surface)
Offshore Area 65 None
Tracking Exercise –
Helicopter
(TRACKEX – Helo)
Offshore Area 4 None
Tracking Exercise –
Maritime Patrol Aircraft Offshore Area 300 None
9
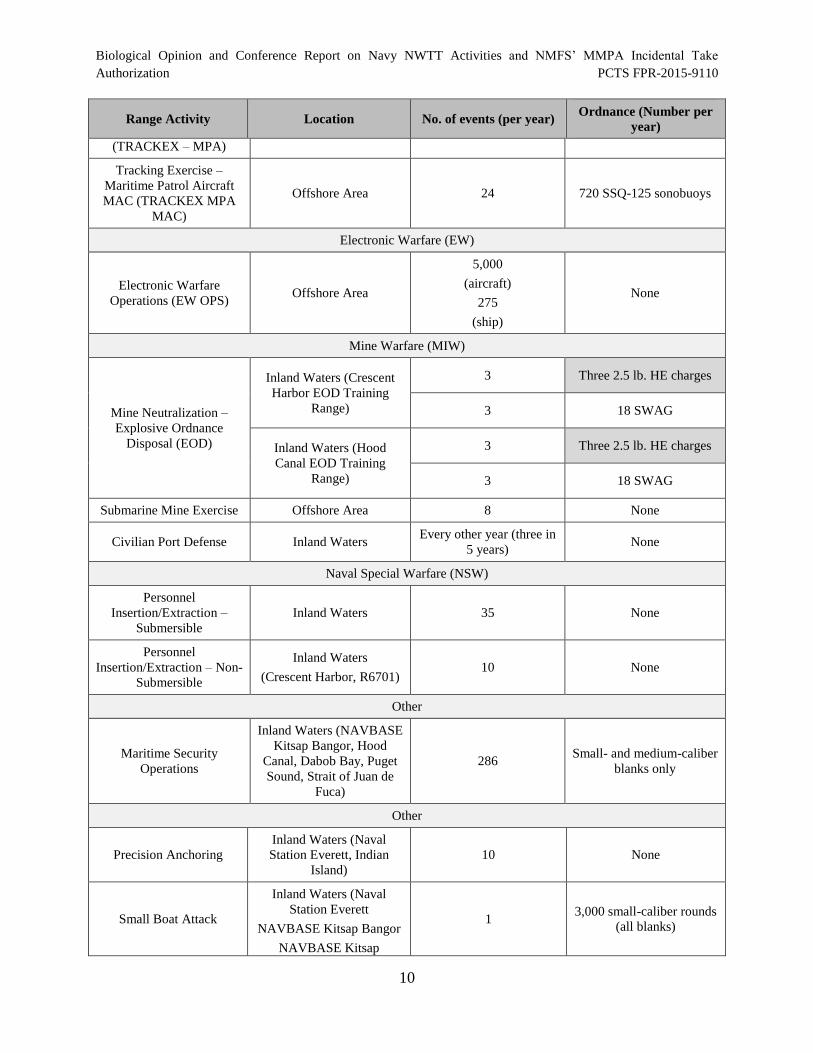
Biological Opinion and Conference Report on Navy NWTT Activities and NMFS’ MMPA Incidental Take Authorization PCTS FPR-2015-9110
Range Activity Location No. of events (per year) Ordnance (Number per
year)
(TRACKEX – MPA)
Tracking Exercise –
Maritime Patrol Aircraft
MAC (TRACKEX MPA
MAC)
Offshore Area 24 720 SSQ-125 sonobuoys
Electronic Warfare (EW)
Electronic Warfare
Operations (EW OPS) Offshore Area
5,000
(aircraft)
275
(ship)
None
Mine Warfare (MIW)
Mine Neutralization –
Explosive Ordnance
Disposal (EOD)
Inland Waters (Crescent
Harbor EOD Training
Range)
3 Three 2.5 lb. HE charges
3 18 SWAG
Inland Waters (Hood
Canal EOD Training
Range)
3 Three 2.5 lb. HE charges
3 18 SWAG
Submarine Mine Exercise Offshore Area 8 None
Civilian Port Defense Inland Waters Every other year (three in
5 years) None
Naval Special Warfare (NSW)
Personnel
Insertion/Extraction –
Submersible
Inland Waters 35 None
Personnel
Insertion/Extraction – Non-
Submersible
Inland Waters
(Crescent Harbor, R6701) 10 None
Other
Maritime Security
Operations
Inland Waters (NAVBASE
Kitsap Bangor, Hood
Canal, Dabob Bay, Puget
Sound, Strait of Juan de
Fuca)
286 Small- and medium-caliber
blanks only
Other
Precision Anchoring
Inland Waters (Naval
Station Everett, Indian
Island)
10 None
Small Boat Attack
Inland Waters (Naval
Station Everett
NAVBASE Kitsap Bangor
NAVBASE Kitsap
1 3,000 small-caliber rounds
(all blanks)
10
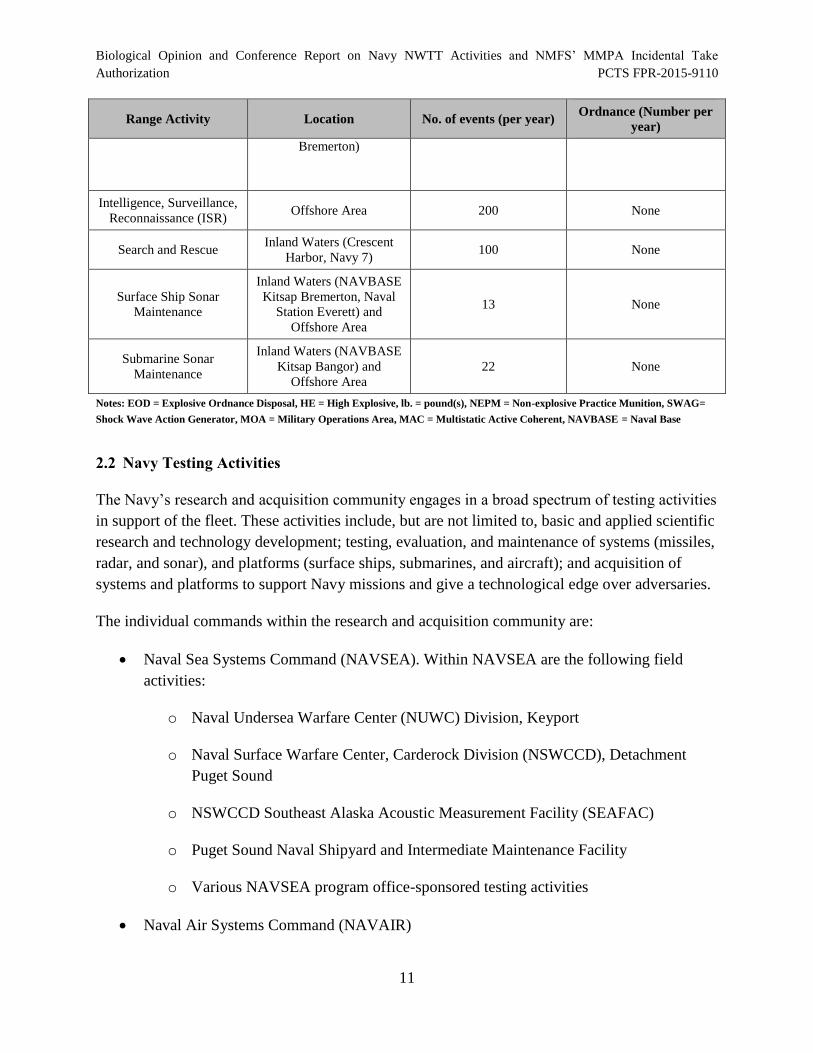
Biological Opinion and Conference Report on Navy NWTT Activities and NMFS’ MMPA Incidental Take Authorization PCTS FPR-2015-9110
Range Activity Location No. of events (per year) Ordnance (Number per
year)
Bremerton)
Intelligence, Surveillance,
Reconnaissance (ISR) Offshore Area 200 None
Search and Rescue Inland Waters (Crescent
Harbor, Navy 7) 100 None
Surface Ship Sonar
Maintenance
Inland Waters (NAVBASE
Kitsap Bremerton, Naval
Station Everett) and
Offshore Area
13 None
Submarine Sonar
Maintenance
Inland Waters (NAVBASE
Kitsap Bangor) and
Offshore Area
22 None
Notes: EOD = Explosive Ordnance Disposal, HE = High Explosive, lb. = pound(s), NEPM = Non-explosive Practice Munition, SWAG=
Shock Wave Action Generator, MOA = Military Operations Area, MAC = Multistatic Active Coherent, NAVBASE = Naval Base
2.2 Navy Testing Activities
The Navy’s research and acquisition community engages in a broad spectrum of testing activities
in support of the fleet. These activities include, but are not limited to, basic and applied scientific
research and technology development; testing, evaluation, and maintenance of systems (missiles,
radar, and sonar), and platforms (surface ships, submarines, and aircraft); and acquisition of
systems and platforms to support Navy missions and give a technological edge over adversaries.
The individual commands within the research and acquisition community are:
Naval Sea Systems Command (NAVSEA). Within NAVSEA are the following field
activities:
o Naval Undersea Warfare Center (NUWC) Division, Keyport
o Naval Surface Warfare Center, Carderock Division (NSWCCD), Detachment
Puget Sound
o NSWCCD Southeast Alaska Acoustic Measurement Facility (SEAFAC)
o Puget Sound Naval Shipyard and Intermediate Maintenance Facility
o Various NAVSEA program office-sponsored testing activities
Naval Air Systems Command (NAVAIR)
11
Biological Opinion and Conference Report on Navy NWTT Activities and NMFS’ MMPA Incidental Take
Authorization PCTS FPR-2015-9110
The Navy operates in an ever-changing strategic, tactical, funding, and time-constrained
environment. Testing activities occur in response to emerging science or fleet operational needs.
Following identification of future needs, new systems are developed or existing systems are
modified. These systems—whether new or modifications of existing systems—must be tested in
the field to ensure they meet fleet needs and requirements.
Some testing activities are similar to training activities conducted by the fleet. For example, both
the fleet and the research and acquisition community fire “test” torpedoes. While the firing of a
torpedo might look identical to an observer, the difference is in the purpose of the firing. The
fleet might fire the torpedo to practice the procedures for such a firing, whereas the research and
acquisition community might be assessing a new torpedo guidance technology or ensuring that
the torpedo meets performance specifications and operational requirements.
2.2.1 Naval Sea Systems Command Testing Activities
NAVSEA is responsible for engineering, building, buying, and maintaining the Navy's ships and
submarines and associated combat systems. NAVSEA provides technical experts at field
activities operated by the undersea and surface warfare centers (NUWC and NSWC) to support
various aspects of RDT&E, and at shipyards to support lifecycle maintenance. NAVSEA has
several field activities operating out of NAVBASE Kitsap, including NUWC Division, Keyport,
NSWC Carderock Division, Detachment Puget Sound, and Puget Sound Naval Shipyard and
Intermediate Maintenance Facility.
Each major category of NAVSEA activities in the Study Area is described below. NUWC
Division Keyport and NSWC Carderock Division Detachment Puget Sound activities are
grouped together in the discussion below to simplify review due to the diversity of activity types
and locations they work in. Puget Sound Naval Shipyard and Intermediate Facility activities are
grouped with the general activities conducted by NAVSEA. Numerous test activities and
technical evaluations, in support of NAVSEA’s systems development mission, often occur in
conjunction with fleet activities within the NWTT Study Area.
2.2.1.1 Naval Undersea Warfare Center Division, Keyport Testing Activities
NUWC Division, Keyport’s mission is to provide advanced technical capabilities for test and
evaluation, in-service engineering, maintenance and industrial base support, fleet material
readiness, and obsolescence management for undersea warfare. Naval Undersea Warfare Center
Division, Keyport has historically provided facilities and capabilities to support testing of
torpedoes, other unmanned vehicles, submarine readiness, diver training, and similar activities
that are critical to the success of undersea warfare. Range support requirements for such
activities include testing, training, and evaluation of system capabilities such as guidance,
control, and sensor accuracy in multiple marine environments (e.g., differing depths, salinity
levels, sea states) and in surrogate and simulated war-fighting environments. Technological
12

Biological Opinion and Conference Report on Navy NWTT Activities and NMFS’ MMPA Incidental Take
Authorization PCTS FPR-2015-9110
advancements in the materials, instrumentation, guidance systems, and tactical capabilities of
manned and unmanned vehicles continue to evolve in parallel with emerging national security
priorities and threat assessments. However, NUWC Division, Keyport does not utilize explosives
in any testing scenarios.
NUWC, Division Keyport operates the Keyport Range Complex, which includes the Keyport
Range Site and the Dabob Bay Range Complex in the Inland Waters portion of the Study Area,
and the Quinault Range Site including a small surf zone at Pacific Beach in the Offshore Area
portion of the Study Area.
2.2.1.2 Naval Surface Warfare Center, Carderock Division, Detachment Puget Sound Testing
Activities
The NSWCCD Detachment Puget Sound provides research, development, test and evaluation
(RDT&E), analysis, acquisition support, in-service engineering, logistics and integration of
surface and undersea vehicles and associated systems; develops and applies science and
technology associated with naval architecture and marine engineering; and provides support to
the maritime industry (e.g., NAVSEA, Research Laboratories, and other commercial, academic,
and private research entities). Activities and support include engineering, technical, operations,
diving, and logistics required for the RDT&E associated with:
Advanced Technology Concepts, Engineering, and Proofing
Experimental Underwater Vehicles, Systems, Subsystems, and Components
Specialized Underwater Systems, Equipment, Tools, and Hardware
Acoustic Data Acquisition, Analysis, and Measurement Systems (required to measure
Navy Acoustic Signatures)
These activities can be categorized as two major types: System, Subsystem, and Component
Acoustic Testing; and Proof-of-Concept Testing. System, Subsystem, and Component Acoustic
Testing would occur in inland waters and at-sea environments to obtain static and short-distance
operational performance and acoustic measurements. Development testing and training would
also be exercised under this test category to validate equipment development and to provide
operator training. Typical activity descriptions for each major category are provided below.
NSWCCD, Detachment Puget Sound operates the testing pier at NAVBASE Kitsap Bangor,
conducts testing in the Inland Waters portion of the Study Area (Hood Canal, Dabob Bay and
Carr Inlet, primarily), and operates the Southeast Alaska Measurement Facility (SEAFAC) in
Ketchikan, Alaska.
2.2.1.3 Naval Surface Warfare Center, Carderock Division, Southeast Alaska Acoustic
13
Biological Opinion and Conference Report on Navy NWTT Activities and NMFS’ MMPA Incidental Take Authorization PCTS FPR-2015-9110
Measurement Facility Testing Activities
Naval Surface Warfare Center, Carderock Division, SEAFAC conducts high-fidelity passive
acoustic signature measurements of submarines and ships. The SEAFAC site includes
hydrophone arrays and data collection and processing systems for real-time data analysis and
signature evaluation.
As the Navy's primary acoustic engineering measurement facility in the Pacific, SEAFAC
provides the capability to perform RDT&E analyses to determine the sources of radiated acoustic
noise, to assess vulnerability, and to develop quieting measures.
2.2.1.4 Naval Sea Systems Command Program Office Sponsored Testing Activities
Naval Sea Systems Command also conducts tests that are not associated with NUWC Keyport or
NSWCCD. Some of these activities are conducted in conjunction with fleet activities in the
Offshore Area off the coast of Washington, Oregon, and northern California, and some occur at
Navy piers at NAVBASE Kitsap Bremerton, NAVBASE Kitsap Bangor, and Naval Station
Everett. Tests within this category include, but are not limited to, anti-surface warfare, anti
submarine warfare, mine warfare, and force protection (maintaining security of Navy facilities,
ships, submarines, and aircraft).
Table 3 provides descriptions of the NAVSEA activities included in the Action Area.
14
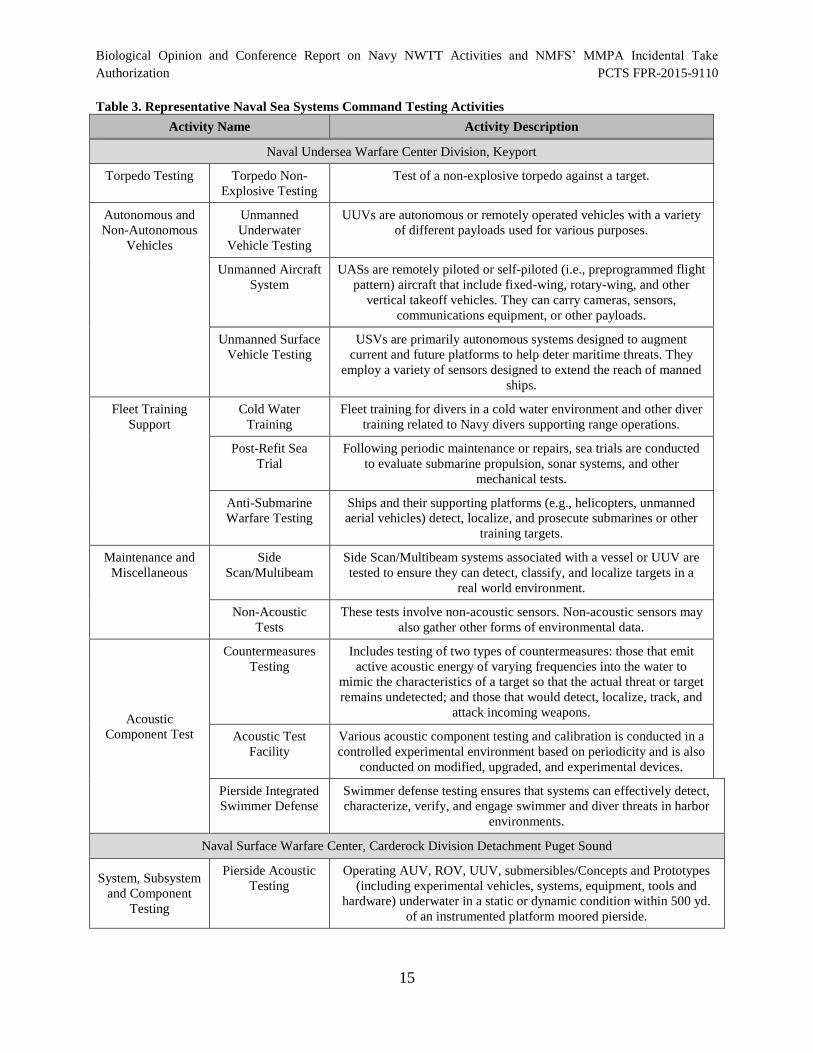
Biological Opinion and Conference Report on Navy NWTT Activities and NMFS’ MMPA Incidental Take Authorization PCTS FPR-2015-9110
Table 3. Representative Naval Sea Systems Command Testing Activities
Activity Name Activity Description
Naval Undersea Warfare Center Division, Keyport
Torpedo Testing Torpedo Non-
Explosive Testing
Test of a non-explosive torpedo against a target.
Autonomous and
Non-Autonomous
Vehicles
Unmanned
Underwater
Vehicle Testing
UUVs are autonomous or remotely operated vehicles with a variety
of different payloads used for various purposes.
Unmanned Aircraft
System
UASs are remotely piloted or self-piloted (i.e., preprogrammed flight
pattern) aircraft that include fixed-wing, rotary-wing, and other
vertical takeoff vehicles. They can carry cameras, sensors,
communications equipment, or other payloads.
Unmanned Surface
Vehicle Testing
USVs are primarily autonomous systems designed to augment
current and future platforms to help deter maritime threats. They
employ a variety of sensors designed to extend the reach of manned
ships.
Fleet Training
Support
Cold Water
Training
Fleet training for divers in a cold water environment and other diver
training related to Navy divers supporting range operations.
Post-Refit Sea
Trial
Following periodic maintenance or repairs, sea trials are conducted
to evaluate submarine propulsion, sonar systems, and other
mechanical tests.
Anti-Submarine
Warfare Testing
Ships and their supporting platforms (e.g., helicopters, unmanned
aerial vehicles) detect, localize, and prosecute submarines or other
training targets.
Maintenance and
Miscellaneous
Side
Scan/Multibeam
Side Scan/Multibeam systems associated with a vessel or UUV are
tested to ensure they can detect, classify, and localize targets in a
real world environment.
Non-Acoustic
Tests
These tests involve non-acoustic sensors. Non-acoustic sensors may
also gather other forms of environmental data.
Acoustic
Component Test
Countermeasures
Testing
Includes testing of two types of countermeasures: those that emit
active acoustic energy of varying frequencies into the water to
mimic the characteristics of a target so that the actual threat or target
remains undetected; and those that would detect, localize, track, and
attack incoming weapons.
Acoustic Test
Facility
Various acoustic component testing and calibration is conducted in a
controlled experimental environment based on periodicity and is also
conducted on modified, upgraded, and experimental devices.
Pierside Integrated
Swimmer Defense
Swimmer defense testing ensures that systems can effectively detect,
characterize, verify, and engage swimmer and diver threats in harbor
environments.
Naval Surface Warfare Center, Carderock Division Detachment Puget Sound
System, Subsystem
and Component
Testing
Pierside Acoustic
Testing
Operating AUV, ROV, UUV, submersibles/Concepts and Prototypes
(including experimental vehicles, systems, equipment, tools and
hardware) underwater in a static or dynamic condition within 500 yd.
of an instrumented platform moored pierside.
15

Biological Opinion and Conference Report on Navy NWTT Activities and NMFS’ MMPA Incidental Take Authorization PCTS FPR-2015-9110
Activity Name Activity Description
Performance
Testing At-Sea
Operating AUV, ROV, UUV, submersibles/Concepts and Prototypes
underwater at sea. Systems will be exercised to obtain operational
performance measurements of all subsystems and components used for
navigation and mission objectives.
Development
Training and
Testing
Operating AUV, ROV, UUV, submersibles/Concepts and Prototypes
underwater at Sea. Systems will be exercised to validate development
and to provide operator familiarization and training with all
subsystems and components used for navigation and mission
objectives.
Proof of Concept Testing Design, fabrication and installation of unique hardware and towing
configurations in support of various surface and underwater
demonstrations as proof-of-concept.
Naval Surface Warfare Center, Carderock Division, Southeast Alaska Acoustic Measurement Facility
Surface Vessel Acoustic Measurement Conduct acoustic trial measurements of surface vessels
Underwater Vessel Acoustic
Measurement
Conduct acoustic trial measurements of underwater vessels
Underwater Vessel Hydrodynamic
Performance Measurement
Conduct hydrodynamic performance trial measurements
Cold-water Training Involves Navy personnel conducting insertion training in cold-water
conditions. The training may include ingress and egress from
subsurface vessels and small surface craft.
Component System Testing Conduct testing on individual components of new defense acquisition
systems
Countermeasures Testing Conduct engineering and acceptance testing of countermeasures
Electromagnetic Measurement Conduct new construction, post-PSA, and life cycle electromagnetic
measurements
Measurement System Repair &
Replacement
Conduct repairs, replacements and calibration of acoustic measurement
systems
Project Operations (POPS) Support testing of fleet assets
Target Strength Trial Asset moored to static site. Acoustic projectors and receive arrays will
be rotated around asset. Broadband waveforms will be transmitted.
Underwater tracking system would be utilized to monitor relative
positions.
Additional Naval Sea Systems Command Testing Activities
Life Cycle Activities Pierside Sonar
Testing
Pierside testing of submarine and surface ship sonar systems occurs
periodically following major maintenance periods and for routine
maintenance.
Shipboard Protection
Systems and
Swimmer Defense
Testing
Pierside
Integrated
Swimmer
Defense
Swimmer defense testing ensures that systems can effectively detect,
characterize, verify, and engage swimmer and diver threats in harbor
environments.
16
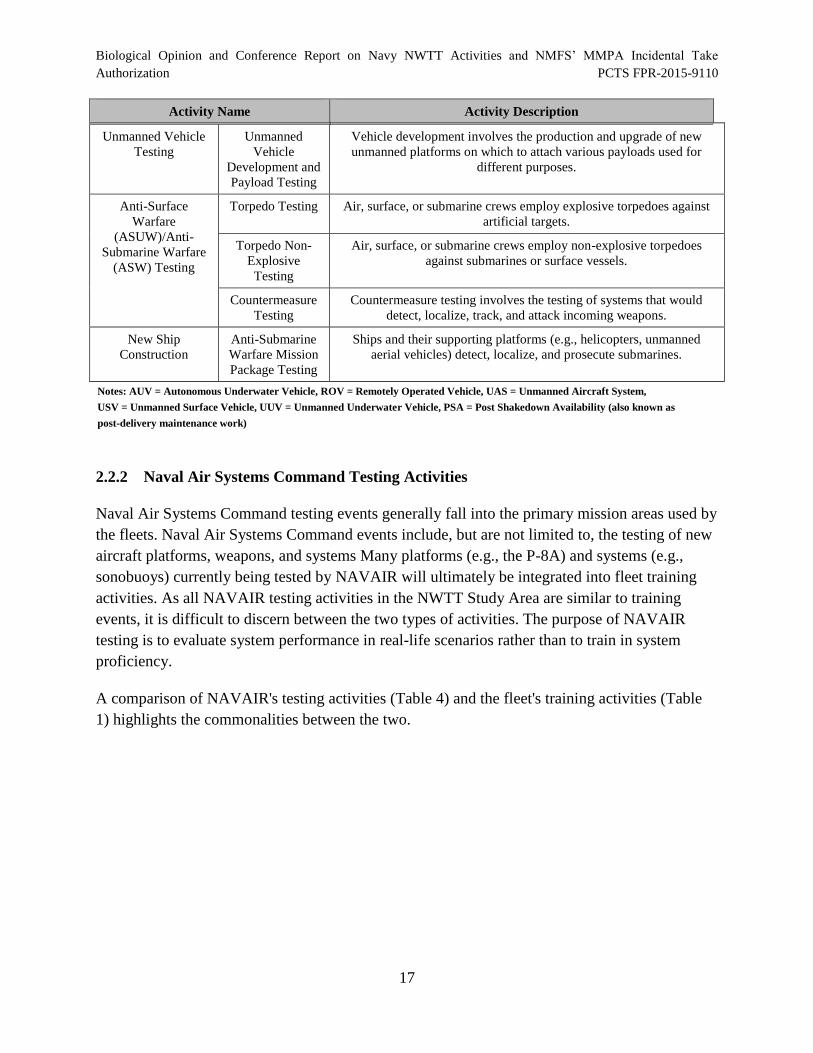
Biological Opinion and Conference Report on Navy NWTT Activities and NMFS’ MMPA Incidental Take Authorization PCTS FPR-2015-9110
Activity Name Activity Description
Unmanned Vehicle
Testing
Unmanned
Vehicle
Development and
Payload Testing
Vehicle development involves the production and upgrade of new
unmanned platforms on which to attach various payloads used for
different purposes.
Anti-Surface
Warfare
(ASUW)/Anti-
Submarine Warfare
(ASW) Testing
Torpedo Testing Air, surface, or submarine crews employ explosive torpedoes against
artificial targets.
Torpedo Non-
Explosive
Testing
Air, surface, or submarine crews employ non-explosive torpedoes
against submarines or surface vessels.
Countermeasure
Testing
Countermeasure testing involves the testing of systems that would
detect, localize, track, and attack incoming weapons.
New Ship
Construction
Anti-Submarine
Warfare Mission
Package Testing
Ships and their supporting platforms (e.g., helicopters, unmanned
aerial vehicles) detect, localize, and prosecute submarines.
Notes: AUV = Autonomous Underwater Vehicle, ROV = Remotely Operated Vehicle, UAS = Unmanned Aircraft System,
USV = Unmanned Surface Vehicle, UUV = Unmanned Underwater Vehicle, PSA = Post Shakedown Availability (also known as
post-delivery maintenance work)
2.2.2 Naval Air Systems Command Testing Activities
Naval Air Systems Command testing events generally fall into the primary mission areas used by
the fleets. Naval Air Systems Command events include, but are not limited to, the testing of new
aircraft platforms, weapons, and systems Many platforms (e.g., the P-8A) and systems (e.g.,
sonobuoys) currently being tested by NAVAIR will ultimately be integrated into fleet training
activities. As all NAVAIR testing activities in the NWTT Study Area are similar to training
events, it is difficult to discern between the two types of activities. The purpose of NAVAIR
testing is to evaluate system performance in real-life scenarios rather than to train in system
proficiency.
A comparison of NAVAIR's testing activities (Table 4) and the fleet's training activities (Table
1) highlights the commonalities between the two.
17
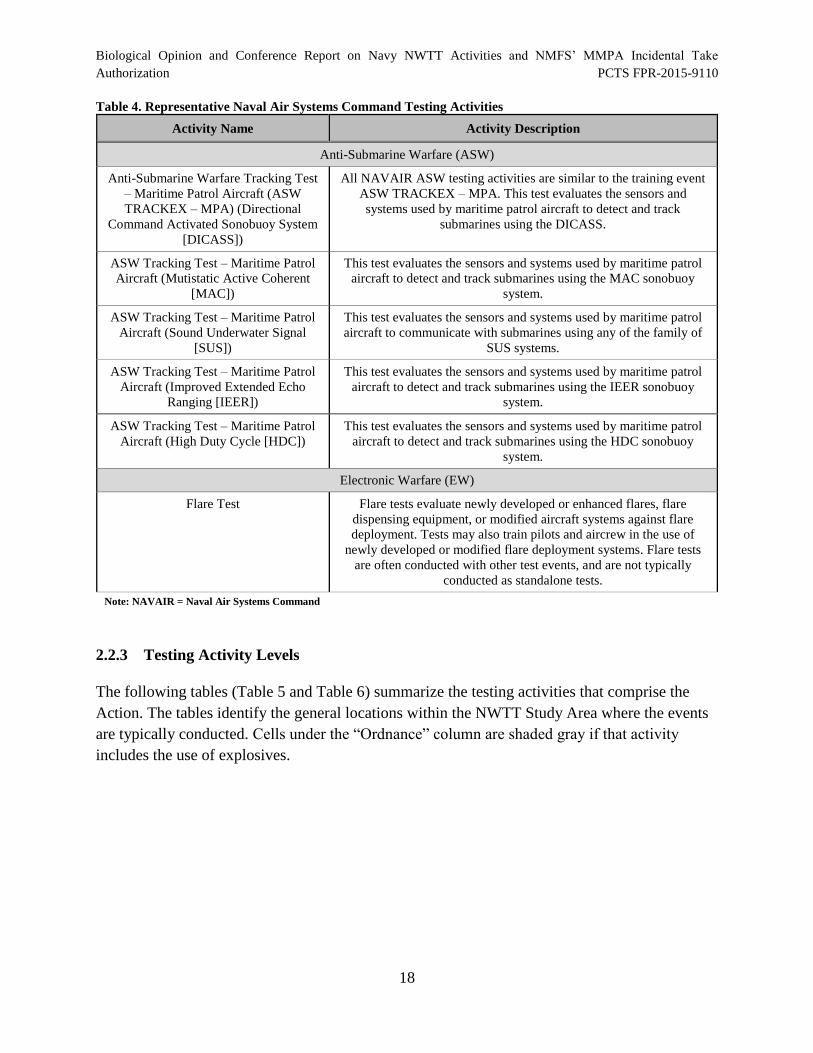
Biological Opinion and Conference Report on Navy NWTT Activities and NMFS’ MMPA Incidental Take Authorization PCTS FPR-2015-9110
Table 4. Representative Naval Air Systems Command Testing Activities
Activity Name Activity Description
Anti-Submarine Warfare (ASW)
Anti-Submarine Warfare Tracking Test
– Maritime Patrol Aircraft (ASW
TRACKEX – MPA) (Directional
Command Activated Sonobuoy System
[DICASS])
All NAVAIR ASW testing activities are similar to the training event
ASW TRACKEX – MPA. This test evaluates the sensors and
systems used by maritime patrol aircraft to detect and track
submarines using the DICASS.
ASW Tracking Test – Maritime Patrol
Aircraft (Mutistatic Active Coherent
[MAC])
This test evaluates the sensors and systems used by maritime patrol
aircraft to detect and track submarines using the MAC sonobuoy
system.
ASW Tracking Test – Maritime Patrol
Aircraft (Sound Underwater Signal
[SUS])
This test evaluates the sensors and systems used by maritime patrol
aircraft to communicate with submarines using any of the family of
SUS systems.
ASW Tracking Test – Maritime Patrol
Aircraft (Improved Extended Echo
Ranging [IEER])
This test evaluates the sensors and systems used by maritime patrol
aircraft to detect and track submarines using the IEER sonobuoy
system.
ASW Tracking Test – Maritime Patrol
Aircraft (High Duty Cycle [HDC])
This test evaluates the sensors and systems used by maritime patrol
aircraft to detect and track submarines using the HDC sonobuoy
system.
Electronic Warfare (EW)
Flare Test Flare tests evaluate newly developed or enhanced flares, flare
dispensing equipment, or modified aircraft systems against flare
deployment. Tests may also train pilots and aircrew in the use of
newly developed or modified flare deployment systems. Flare tests
are often conducted with other test events, and are not typically
conducted as standalone tests.
Note: NAVAIR = Naval Air Systems Command
2.2.3 Testing Activity Levels
The following tables (Table 5 and Table 6) summarize the testing activities that comprise the
Action. The tables identify the general locations within the NWTT Study Area where the events
are typically conducted. Cells under the “Ordnance” column are shaded gray if that activity
includes the use of explosives.
18
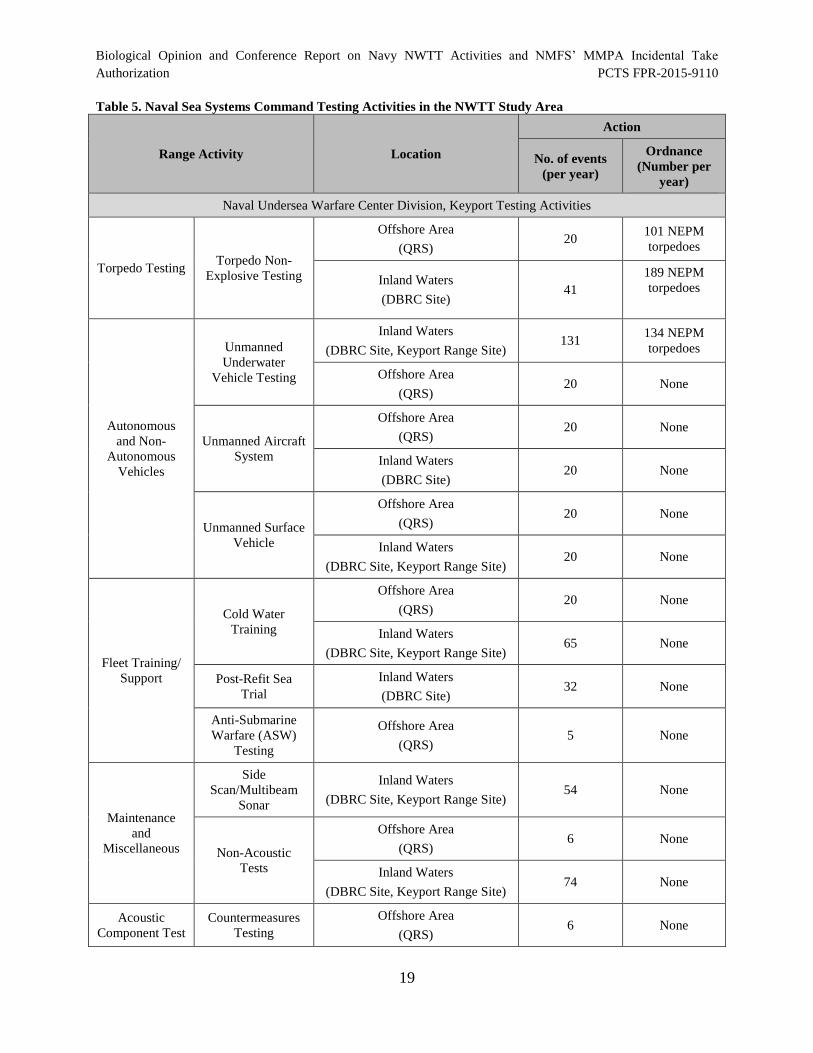
Biological Opinion and Conference Report on Navy NWTT Activities and NMFS’ MMPA Incidental Take Authorization PCTS FPR-2015-9110
Table 5. Naval Sea Systems Command Testing Activities in the NWTT Study Area
Range Activity Location
Action
No. of events
(per year)
Ordnance
(Number per
year)
Naval Undersea Warfare Center Division, Keyport Testing Activities
Torpedo Testing Torpedo Non-
Explosive Testing
Offshore Area
(QRS) 20
101 NEPM
torpedoes
Inland Waters
(DBRC Site) 41
189 NEPM
torpedoes
Autonomous
and Non-
Autonomous
Vehicles
Unmanned
Underwater
Vehicle Testing
Inland Waters
(DBRC Site, Keyport Range Site) 131
134 NEPM
torpedoes
Offshore Area
(QRS) 20 None
Unmanned Aircraft
System
Offshore Area
(QRS) 20 None
Inland Waters
(DBRC Site) 20 None
Unmanned Surface
Vehicle
Offshore Area
(QRS) 20 None
Inland Waters
(DBRC Site, Keyport Range Site) 20 None
Fleet Training/
Support
Cold Water
Training
Offshore Area
(QRS) 20 None
Inland Waters
(DBRC Site, Keyport Range Site) 65 None
Post-Refit Sea
Trial
Inland Waters
(DBRC Site) 32 None
Anti-Submarine
Warfare (ASW)
Testing
Offshore Area
(QRS) 5 None
Maintenance
and
Miscellaneous
Side
Scan/Multibeam
Sonar
Inland Waters
(DBRC Site, Keyport Range Site) 54 None
Non-Acoustic
Tests
Offshore Area
(QRS) 6 None
Inland Waters
(DBRC Site, Keyport Range Site) 74 None
Acoustic
Component Test
Countermeasures
Testing
Offshore Area
(QRS) 6 None
19
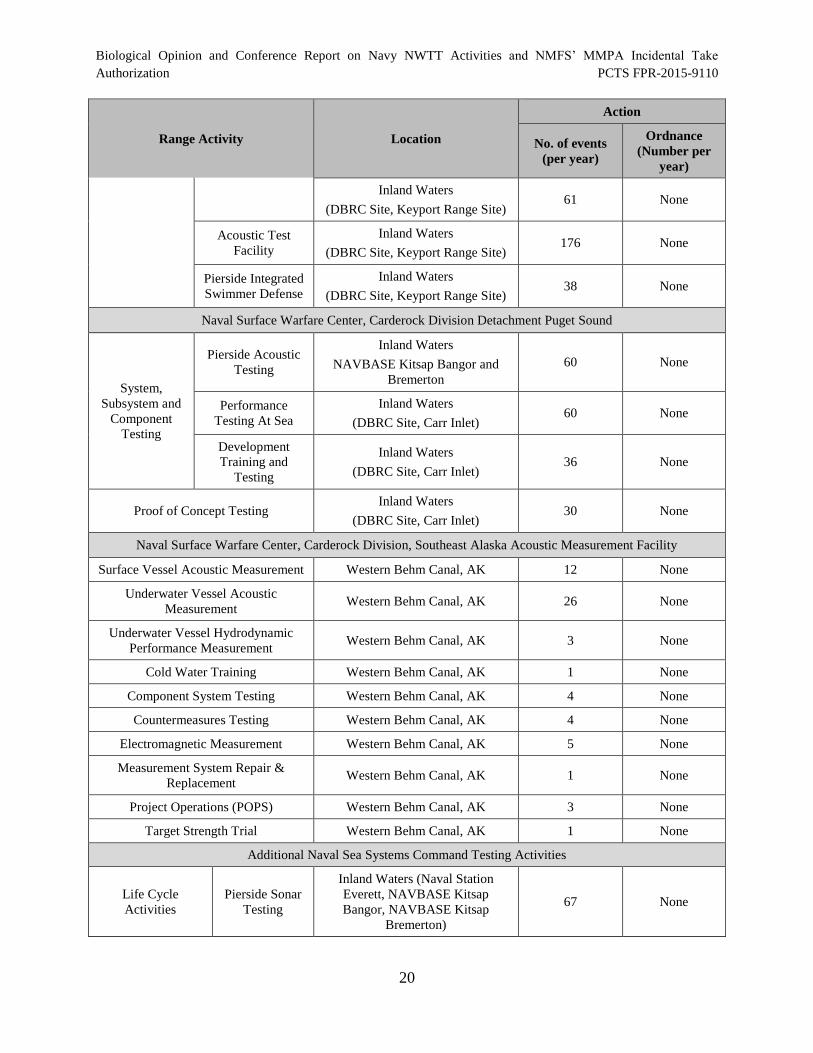
Biological Opinion and Conference Report on Navy NWTT Activities and NMFS’ MMPA Incidental Take
Authorization PCTS FPR-2015-9110
Action
Ordnance Range Activity Location No. of events (Number per
(per year) year)
Inland Waters 61 None
(DBRC Site, Keyport Range Site)
Acoustic Test Inland Waters 176 None
Facility (DBRC Site, Keyport Range Site)
Pierside Integrated Inland Waters 38 None
Swimmer Defense (DBRC Site, Keyport Range Site)
Naval Surface Warfare Center, Carderock Division Detachment Puget Sound
Inland Waters Pierside Acoustic
60 None NAVBASE Kitsap Bangor and Testing Bremerton
System,
Subsystem and Inland Waters Performance 60 None Component Testing At Sea (DBRC Site, Carr Inlet)
Testing Development Inland Waters Training and 36 None
(DBRC Site, Carr Inlet) Testing
Inland Waters Proof of Concept Testing 30 None
(DBRC Site, Carr Inlet)
Naval Surface Warfare Center, Carderock Division, Southeast Alaska Acoustic Measurement Facility
Surface Vessel Acoustic Measurement Western Behm Canal, AK 12 None
Underwater Vessel Acoustic Western Behm Canal, AK 26 None
Measurement
Underwater Vessel Hydrodynamic Western Behm Canal, AK 3 None
Performance Measurement
Cold Water Training Western Behm Canal, AK 1 None
Component System Testing Western Behm Canal, AK 4 None
Countermeasures Testing Western Behm Canal, AK 4 None
Electromagnetic Measurement Western Behm Canal, AK 5 None
Measurement System Repair & Western Behm Canal, AK 1 None
Replacement
Project Operations (POPS) Western Behm Canal, AK 3 None
Target Strength Trial Western Behm Canal, AK 1 None
Additional Naval Sea Systems Command Testing Activities
Inland Waters (Naval Station
Life Cycle Pierside Sonar Everett, NAVBASE Kitsap 67 None
Activities Testing Bangor, NAVBASE Kitsap
Bremerton)
20
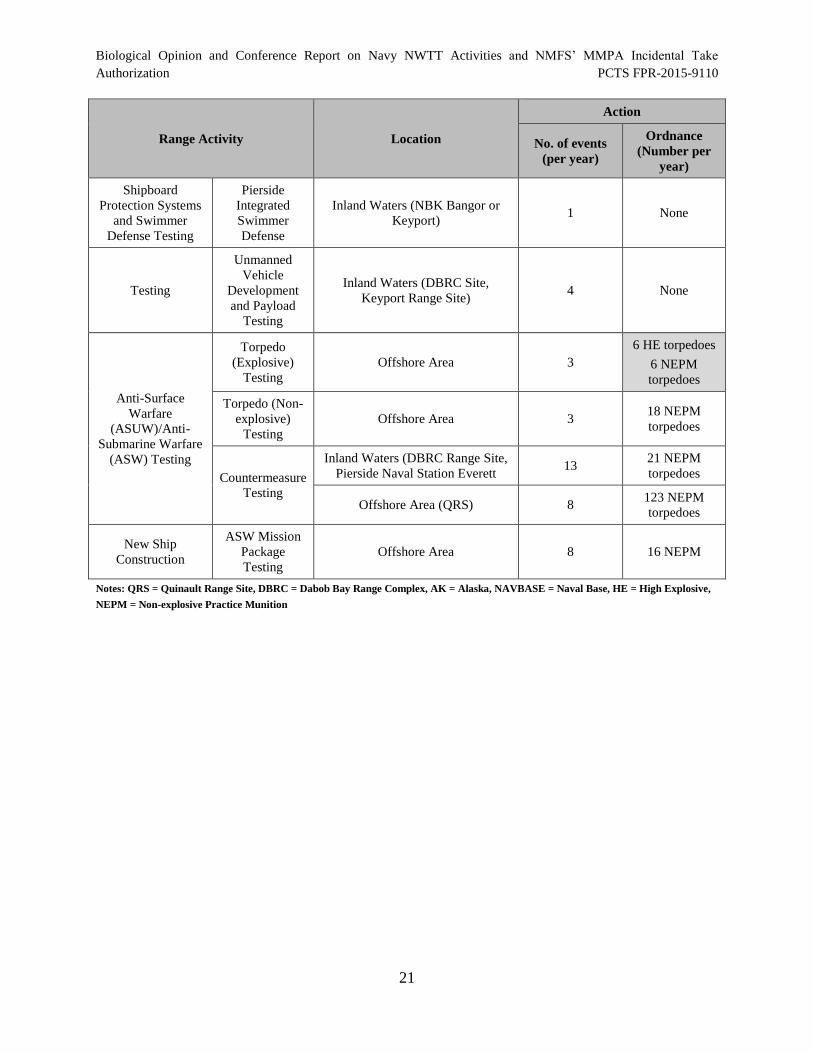
Biological Opinion and Conference Report on Navy NWTT Activities and NMFS’ MMPA Incidental Take Authorization PCTS FPR-2015-9110
Range Activity Location
Action
No. of events
(per year)
Ordnance
(Number per
year)
Shipboard
Protection Systems
and Swimmer
Defense Testing
Pierside
Integrated
Swimmer
Defense
Inland Waters (NBK Bangor or
Keyport) 1 None
Testing
Unmanned
Vehicle
Development
and Payload
Testing
Inland Waters (DBRC Site,
Keyport Range Site) 4 None
Anti-Surface
Warfare
(ASUW)/Anti-
Submarine Warfare
(ASW) Testing
Torpedo
(Explosive)
Testing
Offshore Area 3
6 HE torpedoes
6 NEPM
torpedoes
Torpedo (Non
explosive)
Testing
Offshore Area 3 18 NEPM
torpedoes
Countermeasure
Inland Waters (DBRC Range Site,
Pierside Naval Station Everett 13
21 NEPM
torpedoes
Testing Offshore Area (QRS) 8
123 NEPM
torpedoes
New Ship
Construction
ASW Mission
Package
Testing
Offshore Area 8 16 NEPM
Notes: QRS = Quinault Range Site, DBRC = Dabob Bay Range Complex, AK = Alaska, NAVBASE = Naval Base, HE = High Explosive,
NEPM = Non-explosive Practice Munition
21

Biological Opinion and Conference Report on Navy NWTT Activities and NMFS’ MMPA Incidental Take Authorization PCTS FPR-2015-9110
Table 6. Naval Air Systems Command Testing Activity Levels
Range Activity Location
Action
No. of events (per year) Ordnance (Number per
year)
Anti-Submarine Warfare (ASW)
Anti-Submarine Warfare
Tracking Test – Maritime
Patrol Aircraft (DICASS)
Offshore Area 28 170 DICASS sonobuoys
Anti-Submarine Warfare
Tracking Test – Maritime
Patrol Aircraft (MAC)
Offshore Area 14 170 MAC sonobuoys
Anti-Submarine Warfare
Tracking Test – Maritime
Patrol Aircraft (SUS)
Offshore Area 5
72 Impulsive SUS buoys
(e.g., MK-61, MK-64,
MK-82)
12 Non-impulsive SUS
buoys (e.g., MK-84)
Anti-Submarine Warfare
Tracking Test – Maritime
Patrol Aircraft (IEER)
Offshore Area 6 70 IEER sonobuoys
Anti-Submarine Warfare
Tracking Test – Maritime
Patrol Aircraft (HDC)
Offshore Area 1 (16 HDC sonobuoys)
Electronic Warfare (EW)
Flare Test Offshore Area 10 600 flares
Notes: All of the following are types of sonobuoys to be tested: DICASS = Directional Command Activated Sonobuoy System;
2.3 Navy Mitigation Measures to Minimize or Avoid Exposure to Stressors
Proposed Navy mitigation measures are presented in a summary table below. These measures are
discussed in detail in Chapter 5 (Standard Operating Procedures, Mitigation, and Monitoring) of
the NWTT EIS/OEIS. The mitigation measures can be grouped into two categories: Lookout
Procedural Measures and Mitigation Zone Procedural Measures and are considered as part of the
proposed training and testing actions.
2.3.1 Lookout Procedural Measures
The use of Lookouts is a critical component of Navy procedural measures and implementation of
mitigation zones. Lookouts are highly qualified and experienced observers of the marine
environment. Their duties require that they report all objects sighted in the water (e.g., trash, a
periscope, marine mammals, sea turtles) to the Officer of the Deck and all disturbances (e.g.,
surface disturbance, discoloration) that may be indicative of a threat to the vessel and its crew.
There are personnel standing watch on station at all times (day and night) when a ship or
surfaced submarine is moving through the water. Ships have personnel assigned to stand watch
at all times while underway. Watch personnel may perform watch duties in conjunction with job
22
Biological Opinion and Conference Report on Navy NWTT Activities and NMFS’ MMPA Incidental Take
Authorization PCTS FPR-2015-9110
responsibilities that extend beyond looking at the water or air (such as supervision of other
personnel). This section will introduce Lookouts who perform similar duties to watch personnel
and whose duties satisfy safety of navigation and mitigation requirements.
The Navy will have two types of Lookouts for the purposes of conducting visual observations:
those positioned on ships; and those positioned ashore, in aircraft, or on small boats. Lookouts
positioned on ships will diligently observe the air and surface of the water. They will have
multiple observation objectives, which include but are not limited to detecting the presence of
biological resources and recreational or fishing boats, observing the mitigation zones described
in, and monitoring for vessel and personnel safety concerns.
Due to manning and space restrictions on aircraft, small boats, and some Navy ships, Lookouts
for these platforms may be supplemented by the aircraft crew or pilot, boat crew, range site
personnel, or shore- side personnel. Lookouts positioned in minimally manned platforms may be
responsible for tasks in addition to observing the air or surface of the water (e.g., navigation of a
helicopter or small boat).
However, all Lookouts will, considering personnel safety, practicality of implementation, and
impact on the effectiveness of the activity, comply with the observation objectives described
above for Lookouts positioned on ships.
Some testing activities are conducted close enough to shore that observers located at shore sites
have a clear view of the activities as they are conducted, and benefit from advanced systems
(improved optics, acoustic detection) available for detection of animals. The procedural
measures described below in Table 7 primarily consist of having Lookouts during specific
training and testing activities.
23
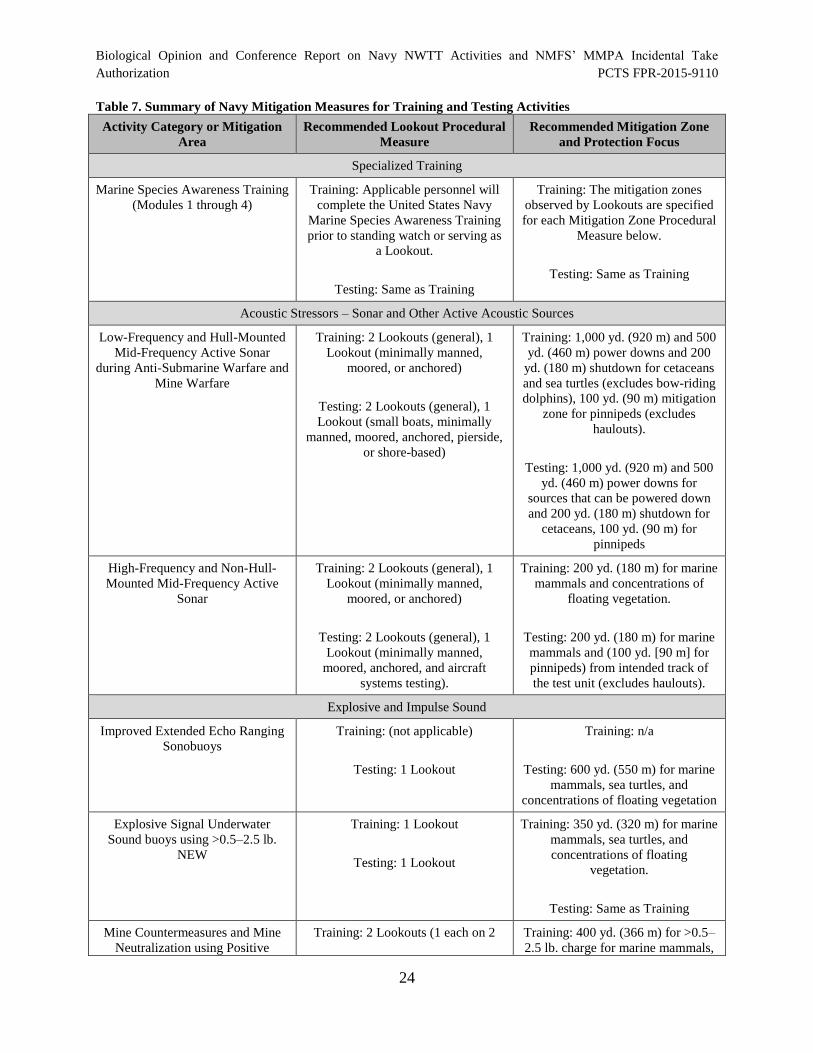
Biological Opinion and Conference Report on Navy NWTT Activities and NMFS’ MMPA Incidental Take Authorization PCTS FPR-2015-9110
Table 7. Summary of Navy Mitigation Measures for Training and Testing Activities
Activity Category or Mitigation
Area
Recommended Lookout Procedural
Measure
Recommended Mitigation Zone
and Protection Focus
Specialized Training
Marine Species Awareness Training
(Modules 1 through 4)
Training: Applicable personnel will
complete the United States Navy
Marine Species Awareness Training
prior to standing watch or serving as
a Lookout.
Testing: Same as Training
Training: The mitigation zones
observed by Lookouts are specified
for each Mitigation Zone Procedural
Measure below.
Testing: Same as Training
Acoustic Stressors – Sonar and Other Active Acoustic Sources
Low-Frequency and Hull-Mounted
Mid-Frequency Active Sonar
during Anti-Submarine Warfare and
Mine Warfare
Training: 2 Lookouts (general), 1
Lookout (minimally manned,
moored, or anchored)
Testing: 2 Lookouts (general), 1
Lookout (small boats, minimally
manned, moored, anchored, pierside,
or shore-based)
Training: 1,000 yd. (920 m) and 500
yd. (460 m) power downs and 200
yd. (180 m) shutdown for cetaceans
and sea turtles (excludes bow-riding
dolphins), 100 yd. (90 m) mitigation
zone for pinnipeds (excludes
haulouts).
Testing: 1,000 yd. (920 m) and 500
yd. (460 m) power downs for
sources that can be powered down
and 200 yd. (180 m) shutdown for
cetaceans, 100 yd. (90 m) for
pinnipeds
High-Frequency and Non-Hull-
Mounted Mid-Frequency Active
Sonar
Training: 2 Lookouts (general), 1
Lookout (minimally manned,
moored, or anchored)
Testing: 2 Lookouts (general), 1
Lookout (minimally manned,
moored, anchored, and aircraft
systems testing).
Training: 200 yd. (180 m) for marine
mammals and concentrations of
floating vegetation.
Testing: 200 yd. (180 m) for marine
mammals and (100 yd. [90 m] for
pinnipeds) from intended track of
the test unit (excludes haulouts).
Explosive and Impulse Sound
Improved Extended Echo Ranging
Sonobuoys
Training: (not applicable)
Testing: 1 Lookout
Training: n/a
Testing: 600 yd. (550 m) for marine
mammals, sea turtles, and
concentrations of floating vegetation
Explosive Signal Underwater
Sound buoys using >0.5–2.5 lb.
NEW
Training: 1 Lookout Training: 350 yd. (320 m) for marine
mammals, sea turtles, and
concentrations of floating Testing: 1 Lookout
vegetation.
Testing: Same as Training
Mine Countermeasures and Mine
Neutralization using Positive
Training: 2 Lookouts (1 each on 2 Training: 400 yd. (366 m) for >0.5–
2.5 lb. charge for marine mammals,
24
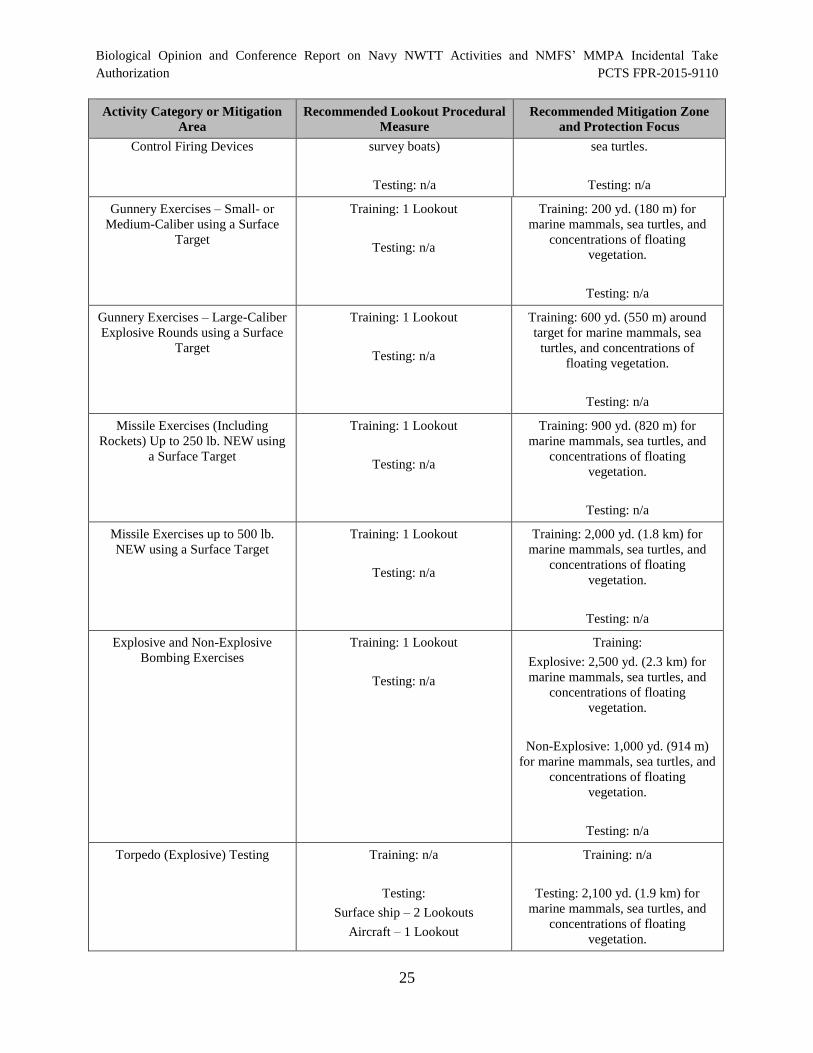
Biological Opinion and Conference Report on Navy NWTT Activities and NMFS’ MMPA Incidental Take Authorization PCTS FPR-2015-9110
Activity Category or Mitigation
Area
Control Firing Devices
Recommended Lookout Procedural
Measure
survey boats)
Recommended Mitigation Zone
and Protection Focus
sea turtles.
Testing: n/a Testing: n/a
Gunnery Exercises – Small- or
Medium-Caliber using a Surface
Target
Training: 1 Lookout
Testing: n/a
Training: 200 yd. (180 m) for
marine mammals, sea turtles, and
concentrations of floating
vegetation.
Testing: n/a
Gunnery Exercises – Large-Caliber Explosive Rounds using a Surface
Target
Missile Exercises (Including
Rockets) Up to 250 lb. NEW using
a Surface Target
Training: 1 Lookout
Testing: n/a
Training: 1 Lookout
Testing: n/a
Missile Exercises up to 500 lb. Training: 1 Lookout
NEW using a Surface Target
Testing: n/a
Explosive and Non-Explosive Training: 1 Lookout
Bombing Exercises
Testing: n/a
Training: 600 yd. (550 m) around
target for marine mammals, sea
turtles, and concentrations of
floating vegetation.
Testing: n/a
Training: 900 yd. (820 m) for
marine mammals, sea turtles, and
concentrations of floating
vegetation.
Testing: n/a
Training: 2,000 yd. (1.8 km) for
marine mammals, sea turtles, and
concentrations of floating
vegetation.
Testing: n/a
Training:
Explosive: 2,500 yd. (2.3 km) for marine mammals, sea turtles, and
concentrations of floating vegetation.
Non-Explosive: 1,000 yd. (914 m) for marine mammals, sea turtles, and
concentrations of floating vegetation.
Testing: n/a
Torpedo (Explosive) Testing Training: n/a Training: n/a
Testing: Testing: 2,100 yd. (1.9 km) for
Surface ship – 2 Lookouts marine mammals, sea turtles, and
concentrations of floating Aircraft – 1 Lookout
vegetation.
25
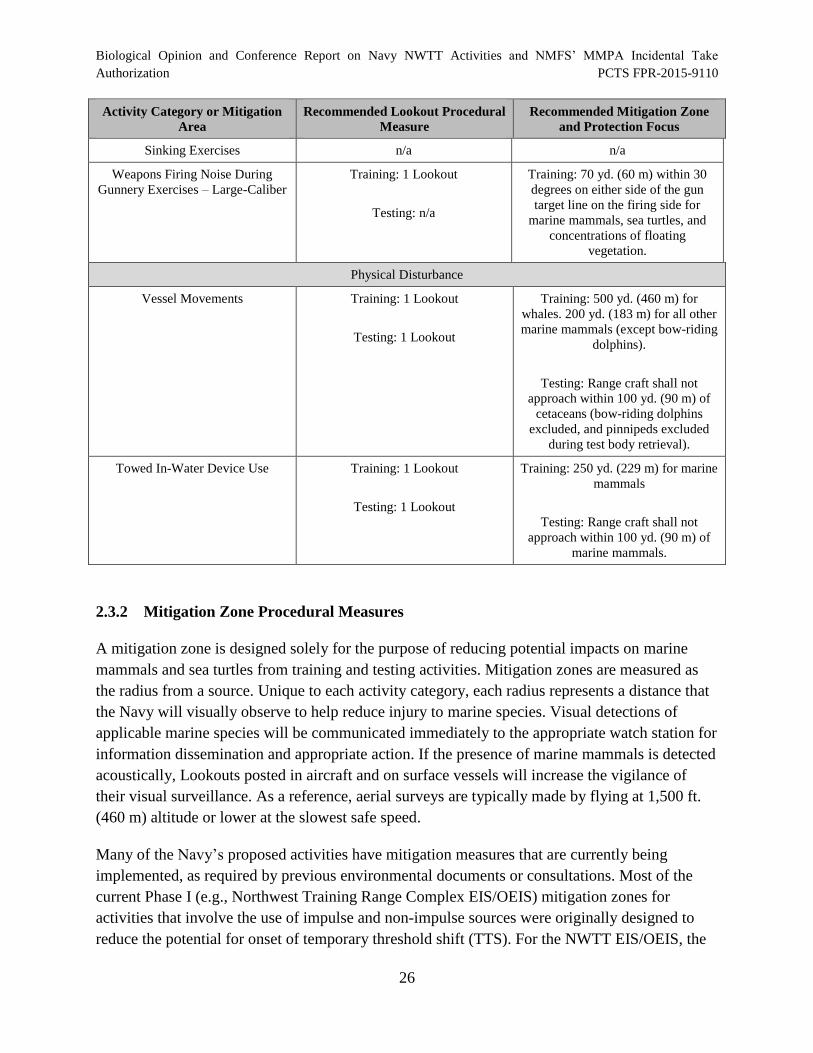
Biological Opinion and Conference Report on Navy NWTT Activities and NMFS’ MMPA Incidental Take Authorization PCTS FPR-2015-9110
Activity Category or Mitigation
Area
Recommended Lookout Procedural
Measure
Sinking Exercises n/a
Weapons Firing Noise During
Gunnery Exercises – Large-Caliber
Training: 1 Lookout
Testing: n/a
Physical Disturbance
Vessel Movements Training: 1 Lookout
Testing: 1 Lookout
Towed In-Water Device Use Training: 1 Lookout
Testing: 1 Lookout
Recommended Mitigation Zone
and Protection Focus
n/a
Training: 70 yd. (60 m) within 30
degrees on either side of the gun
target line on the firing side for
marine mammals, sea turtles, and
concentrations of floating
vegetation.
Training: 500 yd. (460 m) for
whales. 200 yd. (183 m) for all other
marine mammals (except bow-riding
dolphins).
Testing: Range craft shall not
approach within 100 yd. (90 m) of
cetaceans (bow-riding dolphins
excluded, and pinnipeds excluded
during test body retrieval).
Training: 250 yd. (229 m) for marine
mammals
Testing: Range craft shall not
approach within 100 yd. (90 m) of
marine mammals.
2.3.2 Mitigation Zone Procedural Measures
A mitigation zone is designed solely for the purpose of reducing potential impacts on marine
mammals and sea turtles from training and testing activities. Mitigation zones are measured as
the radius from a source. Unique to each activity category, each radius represents a distance that
the Navy will visually observe to help reduce injury to marine species. Visual detections of
applicable marine species will be communicated immediately to the appropriate watch station for
information dissemination and appropriate action. If the presence of marine mammals is detected
acoustically, Lookouts posted in aircraft and on surface vessels will increase the vigilance of
their visual surveillance. As a reference, aerial surveys are typically made by flying at 1,500 ft.
(460 m) altitude or lower at the slowest safe speed.
Many of the Navy’s proposed activities have mitigation measures that are currently being
implemented, as required by previous environmental documents or consultations. Most of the
current Phase I (e.g., Northwest Training Range Complex EIS/OEIS) mitigation zones for
activities that involve the use of impulse and non-impulse sources were originally designed to
reduce the potential for onset of temporary threshold shift (TTS). For the NWTT EIS/OEIS, the
26
Biological Opinion and Conference Report on Navy NWTT Activities and NMFS’ MMPA Incidental Take
Authorization PCTS FPR-2015-9110
Navy updated the acoustic propagation modeling to incorporate updated hearing threshold
metrics (i.e., upper and lower frequency limits), updated density data for marine mammals, and
factors such as an animal’s likely presence at various depths. An explanation of the acoustic
propagation modeling process can be found in the Determination of Acoustic Effects on Marine
Mammals and Sea Turtles for the Northwest Training and Testing Environmental Impact
Statement/Overseas Environmental Impact Statement technical report (Marine Species Modeling
Team 2014).
As a result of the updates to the acoustic propagation modeling, in some cases the ranges to onset
of TTS effects are much larger than those output by previous Phase I models. Due to the
ineffectiveness and unacceptable operational impacts associated with mitigating these large
areas, the Navy is unable to mitigate for onset of TTS for every activity. The Navy developed
each recommended mitigation zone to avoid or reduce the potential for onset of the lowest level
of injury, permanent threshold shift (PTS), out to the predicted maximum range. In some cases
where the ranges to effects are smaller than previous models estimated, the mitigation zones
were adjusted accordingly to provide consistency across the measures. Mitigating to the
predicted maximum range to PTS consequently also mitigates to the predicted maximum range
to onset mortality (1 percent mortality), onset slight lung injury, and onset slight gastrointestinal
tract injury, since the maximum range to effects for these criteria are shorter than for PTS.
Furthermore, in most cases, the predicted maximum range to PTS also consequently covers the
predicted average range to TTS.
Table 8 summarizes the predicted average range to TTS, average range to PTS, maximum range
to PTS, and recommended mitigation zone for each activity category, based on the Navy’s
acoustic propagation modeling results. The predicted ranges are based on local environmental
conditions and are unique to the NWTT Action Area.
27

Biological Opinion and Conference Report on Navy NWTT Activities and NMFS’ MMPA Incidental Take
Authorization PCTS FPR-2015-9110
Table 8. The range to effects for activities using sonar and other active acoustic sources used in the
Inland
Activity
Category
Representative
Source (Bin)
Predicted
Average Range
to TTS
Predicted
Average Range
to PTS
Predicted
Maximum
Range to PTS
Recommended
Mitigation
Zone
Sonar and Other Active Acoustic Sources
Low-Frequency SQS-53 ASW 4,251 yd. (3,887 281 yd. < 292 yd. Training: 1,000
and Hull hull-mounted m) (257 m) (< 267 m) yd. (920 m) and
Mounted Mid- sonar (MF1) 500 yd. (460 m)
Frequency power downs
Active Sonar and 200 yd. (180
m) shutdown for
cetaceans and
sea turtles, 100
yd. (90 m)
mitigation zone
for pinnipeds
Testing: 1,000
yd. (920 m) and
500 yd. (460 m)
power downs for
sources that can
be powered
down and 200
yd. (180 m)
shutdown for
cetaceans, 100
yd. (90 m) for
pinnipeds
High-Frequency AQS-22 ASW 226 yd. < 55 yd. < 55 yd. Training: 200
and Non-Hull dipping sonar (207 m) (< 50 m) (< 50 m) yd. (180 m)
Mounted Mid (MF4) Testing: 200 yd. Frequency (180 m) for
Active Sonar2 cetaceans, 100
yd. (90 m) for
pinnipeds
Explosive and Impulse Sound
Improved Explosive 237 yd. 133 yd. 235 yd. Training: n/a
Extended Echo sonobuoy (E4) (217 m) (122 m) (215 m) Testing: 600 yd. Ranging (550 m)
Sonobuoys
Signal Explosive 178 yd. 92 yd. 214 yd. Training: 350
Underwater sonobuoy (E3) (163 m) (84 m) (196 m) yd. (320 m)
Sound (SUS) Testing: 350 yd. buoys using
>0.5–2.5 lb.
NEW
(320 m)
Mine 2.5 lb NEW (E3) 495 yd. 145 yd. 373 yd. Training: 400
Countermeasure
and
Neutralization
(453 m) (133 m) (341 m) yd. (366 m)
Testing: n/a
28

Biological Opinion and Conference Report on Navy NWTT Activities and NMFS’ MMPA Incidental Take Authorization PCTS FPR-2015-9110
Activity
Category
Representative
Source (Bin)
Predicted
Average Range
to TTS
Predicted
Average Range
to PTS
Predicted
Maximum
Range to PTS
Recommended
Mitigation
Zone
Activities
(positive
control)
Gunnery 25 mm projectile 72 yd. 48 yd. 73 yd. Training: 200
Exercises –
Small- and
Medium-Caliber
(Surface Target)
(E1) (66 m) (44 m) (67 m) yd. (180 m)
Testing: n/a
Gunnery 5 in. projectiles 210 yd. 110 yd. 177 yd. Training: 600
Exercises – (E5 at the (192 m) (101 m) (162 m) yd. (550 m)
Large-Caliber surface)3 Testing: n/a (Surface Target)
Missile Harpoon missile 1,164 yd. (1,065 502 yd. 955 yd. Training: 2,000
Exercises up to
500 lb. NEW
(Surface Target)
(E10) m) (459 m) (873 m) yd. (1.8 km)
Testing: n/a
Bombing
Exercises
MK-84 2,000 lb.
bomb (E12)
1,374 yd. (1,256
m)
591 yd.
(540 m)
1,368 yd.
(1,251 m)
Training: 2,500
yd. (2.3 km)
Testing: n/a
Lightweight MK-46 torpedo 497 yd. 245 yd. 465 yd. Training: n/a
Torpedo (E8) (454 m) (224 m) (425 m) Testing: 2,100 (Explosive) yd. (1.9 km)
Testing
Heavyweight MK-48 torpedo 1,012 yd. 472 yd. 885 yd. Training: n/a
Torpedo
(Explosive)
Testing
(E11) (926 m) (432 m) (809 m) Testing: 2,100
yd. (1.9 km)
For pierside maintenance and testing of hull-mounted mid-frequency sources in the Inland
Waters, modeling provides an overestimate of the range to effects because it cannot adequately
account for the complex interactions of the sound energy into very shallow water and associated
shorelines, the loss into dampening structures (i.e., such as adjacent pilings, jetties, or seawalls),
or occasions when a ship or submarine is moored bow in so that the sonar is transmitted toward
the nearby shoreline. Therefore, the ranges in Table 8 are even more protective for activities in
the Inland Waters.
For some activities, Lookouts may be required to observe for concentrations of detached floating
vegetation (kelp paddies), which are indicators of potential marine mammal and sea turtle
presence within the mitigation zone. Those specified activities will not commence if floating
vegetation (kelp paddies) is observed within the mitigation zone prior to the initial start of the
activity. If floating vegetation is observed prior to the initial start of the activity, the activity will
be relocated to an area where no floating vegetation is observed. Training and testing will not
29
Biological Opinion and Conference Report on Navy NWTT Activities and NMFS’ MMPA Incidental Take
Authorization PCTS FPR-2015-9110
cease as a result of indicators entering the mitigation zone after activities have commenced. This
measure is intended only for floating vegetation detached from the seafloor.
The activity-specific mitigation zones are based on the longest range for all the functional
hearing groups (based on the hearing threshold metrics described in Section 3.4, Marine
Mammals, and Section 3.5, Sea Turtles, in the NWTT EIS/OEIS). The mitigation zone for a
majority of activities is driven by either the high-frequency cetaceans or the sea turtles functional
hearing groups. Therefore, the mitigation zones are even more protective for the remaining
functional hearing groups (i.e., low-frequency cetaceans, mid-frequency cetaceans, and
pinnipeds), and likely cover a larger portion of the potential range to onset of TTS.
2.3.3 Other Procedural Measures in the NWTT Study Area
The Navy has considered whether additional mitigation measures are warranted for certain
activities or in certain locations in the NWTT Study Area. The following are particular additional
mitigation measures the Navy intends to apply. These are further explained in the Navy’s NWTT
EIS/OEIS.
The Navy conducts pre-event planning and training to ensure environmental awareness of all
exercise participants prior to Maritime Homeland Defense/Security Mine Countermeasure
Integrated Exercises. When an event is proposed to be conducted in Puget Sound, Navy event
planners will consult with Navy biologists who will contact NMFS during the planning process.
NMFS and the Navy biologist will determine likelihood of gray whale or southern resident killer
whale presence in the proposed exercise area. The Navy biologist will convey that information to
event planners as planners consider specific details (timing, location, duration) of the event.
The Navy conducts pre-event planning and training to ensure environmental awareness of all
exercise participants prior to Small Boat Attack Gunnery exercises. When an event is proposed
to be conducted in and around Naval Station Everett, Naval Base Kitsap Bangor, or Naval Base
Kitsap Bremerton in Puget Sound, Navy event planners will consult with Navy biologists who
will contact NMFS early in the planning process. NMFS and the Navy biologist will determine
the extent marine mammals may be present in the immediate vicinity of proposed exercise area.
The Navy biologist will convey that information to event planners as planners consider the
specific details (timing, location, duration) of the event.
The Navy will conduct Missile Exercises and Bombing Exercises using high explosives 50 nm or
further from of the shore in the NWTRC Offshore Area.
The Navy will conduct Bombing Exercises (non-explosive practice munitions) greater than 20
nm from shore and not within the Olympic Coast National Marine Sanctuary.
30
Biological Opinion and Conference Report on Navy NWTT Activities and NMFS’ MMPA Incidental Take
Authorization PCTS FPR-2015-9110
The Navy will continue to require units to obtain approval from U.S. Third Fleet prior to any
training or testing mine countermeasure and neutralization underwater detonations at Hood
Canal or Crescent Harbor.
The Navy will continue to require units to obtain approval from U.S. Pacific Fleet’s designated
authority prior to use of hull-mounted mid-frequency active sonar during training while
underway in Puget Sound and Strait of Juan de Fuca.
The Navy will continue to require units to obtain approval from U.S. Pacific Fleet's designated
authority or Systems Command designated authority, as applicable, prior to conducting ship and
submarine active sonar pierside maintenance/testing in Puget Sound or the Strait of Juan de
Fuca.
NMFS is aware of and has considered additional mitigation measures the Navy intends to
comply with as a result of ESA and other consultations as well. These include:
During February, March, and April (the juvenile migration period for Hood Canal summer-run
chum), the Navy will not conduct any of the planned larger size (>0.5-2.5 lb) detonations in
Hood Canal. During this time period the unit will only conduct training with the SWAG charges,
which are 1 ounce or less in net explosive weight.
During August, September, and October (adult migration period for Hood Canal summer-run
chum and Puget Sound Chinook), the Navy will also avoid to the maximum extent practicable
(unless necessitated by readiness requirements), the use of the larger size charges (>0.5-2.5 lb)
and only conduct training with 1 ounce or less charges.
2.4 NMFS’ Promulgation of Regulations Pursuant to the Marine Mammal Protection Act
Under the MMPA, the Navy may obtain authorization to “take” marine mammals only if the
“take” occurs incidental to testing and training activities within the NWTT Study Area. Several
factors are considered under MMPA authorizations including: (1) specific activity and
geographical region where “take” make occur, (2) dates when “take” may occur, (3) permissible
methods of taking, (4) prohibitions on taking of marine mammals, (5) mitigation required, (6)
monitoring and reporting requirements, (7) how LOAs may be applied for, (8) specifics of
LOAs, and (9) renewals and modifications of LOAs and adaptive management processes.
In order to promulgate the Final Rule, NMFS must determine that the incidental taking of marine
mammals will have a negligible impact on the species or stock(s) and will not have an
unmitigable adverse impact on the availability of the species or stock(s) for subsistence uses
(where relevant). NMFS has defined negligible impact in 50 CFR 216.103 as “an impact
resulting from the specified activity that cannot be reasonably expected to, and is not reasonably
31
Biological Opinion and Conference Report on Navy NWTT Activities and NMFS’ MMPA Incidental Take
Authorization PCTS FPR-2015-9110
likely to, adversely affect the species or stock through effects on annual rates of recruitment or
survival.”
NMFS Permits Division determined that the Navy’s proposed action (summarized above) would
result in the take of ESA-listed species and that such take would be in the form of exposure to
sound or pressure waves in the water. The specific activity and geographic region where take
may occur, the dates when take may occur, and permissible method of taking that are set by the
proposed regulations are all consistent with the Navy’s action described previously in this
Opinion so they will not be reiterated here.
2.4.1 Taking and Importing Marine Mammals; U.S. Navy’s Northwest Training and
Testing (NWTT) Study Area
The take of ESA-listed species by harassment incidental to the Navy’s training and testing
activities in the NWTT Study Area authorized pursuant to NMFS Permit Division’s proposed
MMPA rule is presented the following sections.
2.4.1.1 § 218.140 Specified activity and specified geographical region.
(a) Regulations in this subpart apply only to the U.S. Navy for the taking of marine
mammals that occurs in the area outlined in paragraph (b) of this section and that occurs
incidental to the activities described in paragraph (c) of this section.
(b) The taking of marine mammals by the Navy is only authorized if it occurs within the
NWTT Study Area, which is composed of established maritime operating and warning areas in
the eastern North Pacific Ocean region, including areas of the Strait of Juan de Fuca, Puget
Sound, and Western Behm Canal in southeastern Alaska. The Study Area includes air and water
space within and outside Washington state waters, and outside state waters of Oregon and
Northern California. The Study Area includes four existing range complexes and facilities: the
Northwest Training Range Complex (NWTRC), the Keyport Range Complex, Carr Inlet
Operations Area, and SEAFAC. In addition to these range complexes, the Study Area also
includes Navy pierside locations where sonar maintenance and testing occurs as part of overhaul,
modernization, maintenance and repair activities at NAVBASE Kitsap, Bremerton; NAVBASE
Kitsap, Bangor; and Naval Station Everett.
(c) The taking of marine mammals by the Navy is only authorized if it occurs incidental
to the following activities within the designated amounts of use:
(1) Sonar and other Active Sources Used During Training:
(i) Mid-frequency (MF) Source Classes:
(A) MF1 – an average of 166 hours per year.
32
Biological Opinion and Conference Report on Navy NWTT Activities and NMFS’ MMPA Incidental Take Authorization PCTS FPR-2015-9110
(B) MF3 – an average of 70 hours per year.
(C) MF4 – an average of 4 hours per year.
(D) MF5 – an average of 896 items per year.
(E) MF11 – an average of 16 hours per year.
(ii) High-frequency (HF) Source Classes:
(A) HF1 – an average of 48 hours per year.
(B) HF4 – an average of 384 hours per year.
(C) HF6 – an average of 192 hours per year
(iii) Anti-Submarine Warfare (ASW) Source Classes:
(A) ASW2 – an average of 720 items per year per year.
(B) ASW3 – an average of 78 hours per year.
(2) Sonar and other Active Sources Used During Testing:
(i) Low-frequency (LF) Source Classes:
(A) LF4 – an average of 110 hours per year.
(B) LF5 – an average of 71 hours per year.
(ii) Mid-frequency (MF):
(A) MF1 – an average of 32 hours per year
(B) MF3 – an average of 145 hours per year.
(C) MF4 – an average of 10 hours per year.
(D) MF5 – an average of 273 items per year.
(E) MF6 – an average of 12 items per year.
(F) MF8 – an average of 40 hours per year.
(G) MF9 – an average of 1,183 hours per year.
33
Biological Opinion and Conference Report on Navy NWTT Activities and NMFS’ MMPA Incidental Take Authorization PCTS FPR-2015-9110
(H) MF10 – an average of 1,156 hours per year.
(I) MF11 – an average of 34 hours per year.
(J) MF12 – an average of 24 hours per year.
(iii) High-frequency (HF) and Very High-frequency (VHF):
(A) HF1 – an average of 161 hours per year.
(B) HF3 – an average of 145 hours per year.
(C) HF5 – an average of 360 hours per year.
(D) HF6 – an average of 2,099 hours per year.
(iv) VHF:
(A) VHF2 - an average of 35 hours per year.
(v) ASW:
(A) ASW1 – an average of 16 hours per year.
(B) ASW2 – an average of 64 hours per year.
(C) ASW2 – an average of 170 items per year.
(D) ASW3 – an average of 444 hours per year.
(E) ASW4 – an average of 1,182 items per year.
(vi) Acoustic Modems (M):
(A) M3 - an average of 1,519 hours per year.
(vii) Torpedoes (TORP):
(A) TORP1 – an average of 315 items per year.
(B) TORP2 – an average of 299 items per year.
(viii) Swimmer Detection Sonar (SD):
(A) SD1 – an average of 757 hours per year.
34
Biological Opinion and Conference Report on Navy NWTT Activities and NMFS’ MMPA Incidental Take Authorization PCTS FPR-2015-9110
(ix) Synthetic Aperture Sonar (SAS):
(A) SAS2 – an average of 798 hours per year.
(3) Impulsive Source Detonations During Training:
(i) Explosive Classes:
(A) E1 (0.1 to 0.25 pound [lb] NEW) – an average of 48 detonations per year.
(B) E3 (>0.5 to 2.5 lb NEW) – an average of 6 detonations per year.
(C) E5 (>5 to 10 lb NEW) – an average of 80 detonations per year.
(D) E10 (>250 to 500 lb NEW) – an average of 4 detonations per year.
(E) E12 (>650 to 1,000 lb NEW) – an average of 10 detonations per year.
(ii) [Reserved]
(4) Impulsive Source Detonations During Testing:
(i) Explosive Classes:
(A) E3 (>0.5 to 2.5 lb NEW) – an average of 72 detonations per year.
(B) E4 (>2.5 to 5 lb NEW) – an average of 140 detonations (70 sonobuoys) per year.
(C) E8 (>60 to 100 lb NEW) – an average of 3 detonations per year.
(D) E11 (>500 to 650 lb NEW) – an average of 3 detonations per year.
(ii) [Reserved]
2.4.1.2 § 218.141 Effective dates
Regulations in this subpart are effective November 9, 2015 through November 8, 2020.
2.4.1.3 § 218.142 Permissible methods of taking.
(a) Under Letters of Authorization (LOAs) issued pursuant to § 218.147, the Holder of,
and those operating under, the LOA may incidentally, but not intentionally, take marine
mammals within the area described in § 218.140, provided the activity is in compliance with all
terms, conditions, and requirements of these regulations and the appropriate LOA.
35
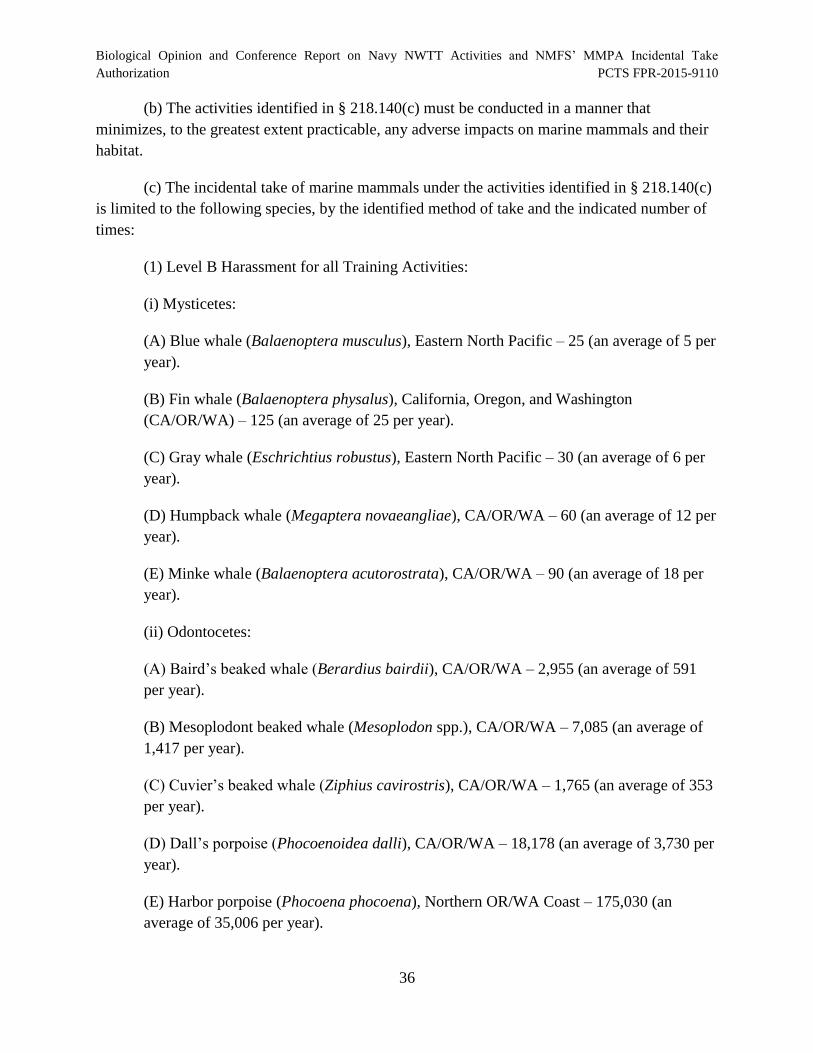
Biological Opinion and Conference Report on Navy NWTT Activities and NMFS’ MMPA Incidental Take Authorization PCTS FPR-2015-9110
(b) The activities identified in § 218.140(c) must be conducted in a manner that
minimizes, to the greatest extent practicable, any adverse impacts on marine mammals and their
habitat.
(c) The incidental take of marine mammals under the activities identified in § 218.140(c)
is limited to the following species, by the identified method of take and the indicated number of
times:
(1) Level B Harassment for all Training Activities:
(i) Mysticetes:
(A) Blue whale (Balaenoptera musculus), Eastern North Pacific – 25 (an average of 5 per
year).
(B) Fin whale (Balaenoptera physalus), California, Oregon, and Washington
(CA/OR/WA) – 125 (an average of 25 per year).
(C) Gray whale (Eschrichtius robustus), Eastern North Pacific – 30 (an average of 6 per
year).
(D) Humpback whale (Megaptera novaeangliae), CA/OR/WA – 60 (an average of 12 per
year).
(E) Minke whale (Balaenoptera acutorostrata), CA/OR/WA – 90 (an average of 18 per
year).
(ii) Odontocetes:
(A) Baird’s beaked whale (Berardius bairdii), CA/OR/WA – 2,955 (an average of 591
per year).
(B) Mesoplodont beaked whale (Mesoplodon spp.), CA/OR/WA – 7,085 (an average of
1,417 per year).
(C) Cuvier’s beaked whale (Ziphius cavirostris), CA/OR/WA – 1,765 (an average of 353
per year).
(D) Dall’s porpoise (Phocoenoidea dalli), CA/OR/WA – 18,178 (an average of 3,730 per
year).
(E) Harbor porpoise (Phocoena phocoena), Northern OR/WA Coast – 175,030 (an
average of 35,006 per year).
36
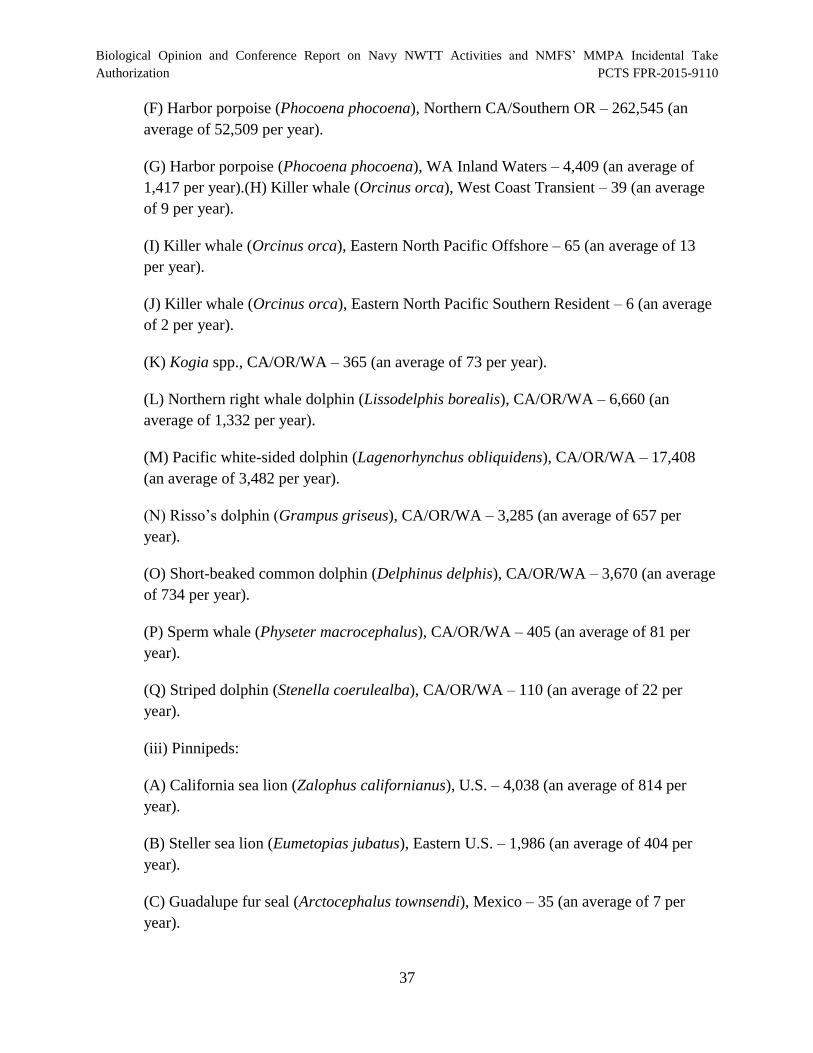
Biological Opinion and Conference Report on Navy NWTT Activities and NMFS’ MMPA Incidental Take Authorization PCTS FPR-2015-9110
(F) Harbor porpoise (Phocoena phocoena), Northern CA/Southern OR – 262,545 (an
average of 52,509 per year).
(G) Harbor porpoise (Phocoena phocoena), WA Inland Waters – 4,409 (an average of
1,417 per year).(H) Killer whale (Orcinus orca), West Coast Transient – 39 (an average
of 9 per year).
(I) Killer whale (Orcinus orca), Eastern North Pacific Offshore – 65 (an average of 13
per year).
(J) Killer whale (Orcinus orca), Eastern North Pacific Southern Resident – 6 (an average
of 2 per year).
(K) Kogia spp., CA/OR/WA – 365 (an average of 73 per year).
(L) Northern right whale dolphin (Lissodelphis borealis), CA/OR/WA – 6,660 (an
average of 1,332 per year).
(M) Pacific white-sided dolphin (Lagenorhynchus obliquidens), CA/OR/WA – 17,408
(an average of 3,482 per year).
(N) Risso’s dolphin (Grampus griseus), CA/OR/WA – 3,285 (an average of 657 per
year).
(O) Short-beaked common dolphin (Delphinus delphis), CA/OR/WA – 3,670 (an average
of 734 per year).
(P) Sperm whale (Physeter macrocephalus), CA/OR/WA – 405 (an average of 81 per
year).
(Q) Striped dolphin (Stenella coerulealba), CA/OR/WA – 110 (an average of 22 per
year).
(iii) Pinnipeds:
(A) California sea lion (Zalophus californianus), U.S. – 4,038 (an average of 814 per
year).
(B) Steller sea lion (Eumetopias jubatus), Eastern U.S. – 1,986 (an average of 404 per
year).
(C) Guadalupe fur seal (Arctocephalus townsendi), Mexico – 35 (an average of 7 per
year).
37
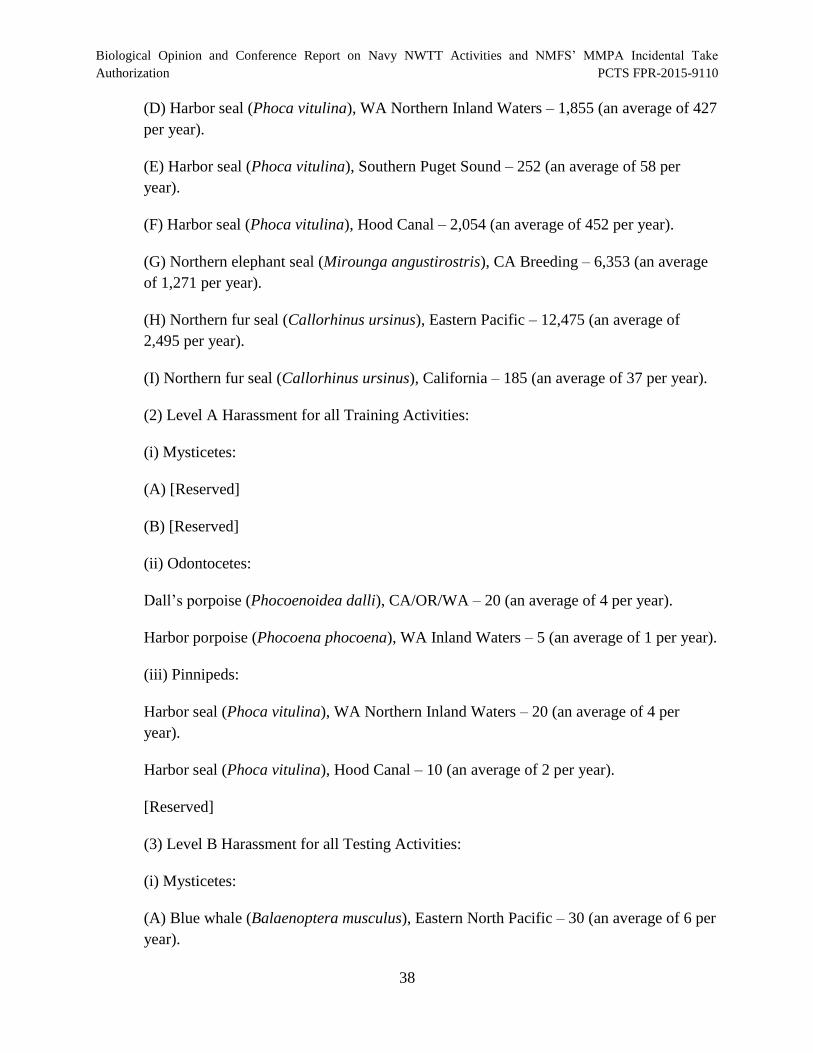
Biological Opinion and Conference Report on Navy NWTT Activities and NMFS’ MMPA Incidental Take Authorization PCTS FPR-2015-9110
(D) Harbor seal (Phoca vitulina), WA Northern Inland Waters – 1,855 (an average of 427
per year).
(E) Harbor seal (Phoca vitulina), Southern Puget Sound – 252 (an average of 58 per
year).
(F) Harbor seal (Phoca vitulina), Hood Canal – 2,054 (an average of 452 per year).
(G) Northern elephant seal (Mirounga angustirostris), CA Breeding – 6,353 (an average
of 1,271 per year).
(H) Northern fur seal (Callorhinus ursinus), Eastern Pacific – 12,475 (an average of
2,495 per year).
(I) Northern fur seal (Callorhinus ursinus), California – 185 (an average of 37 per year).
(2) Level A Harassment for all Training Activities:
(i) Mysticetes:
(A) [Reserved]
(B) [Reserved]
(ii) Odontocetes:
Dall’s porpoise (Phocoenoidea dalli), CA/OR/WA – 20 (an average of 4 per year).
Harbor porpoise (Phocoena phocoena), WA Inland Waters – 5 (an average of 1 per year).
(iii) Pinnipeds:
Harbor seal (Phoca vitulina), WA Northern Inland Waters – 20 (an average of 4 per year).
Harbor seal (Phoca vitulina), Hood Canal – 10 (an average of 2 per year).
[Reserved]
(3) Level B Harassment for all Testing Activities:
(i) Mysticetes:
(A) Blue whale (Balaenoptera musculus), Eastern North Pacific – 30 (an average of 6 per
year).
38
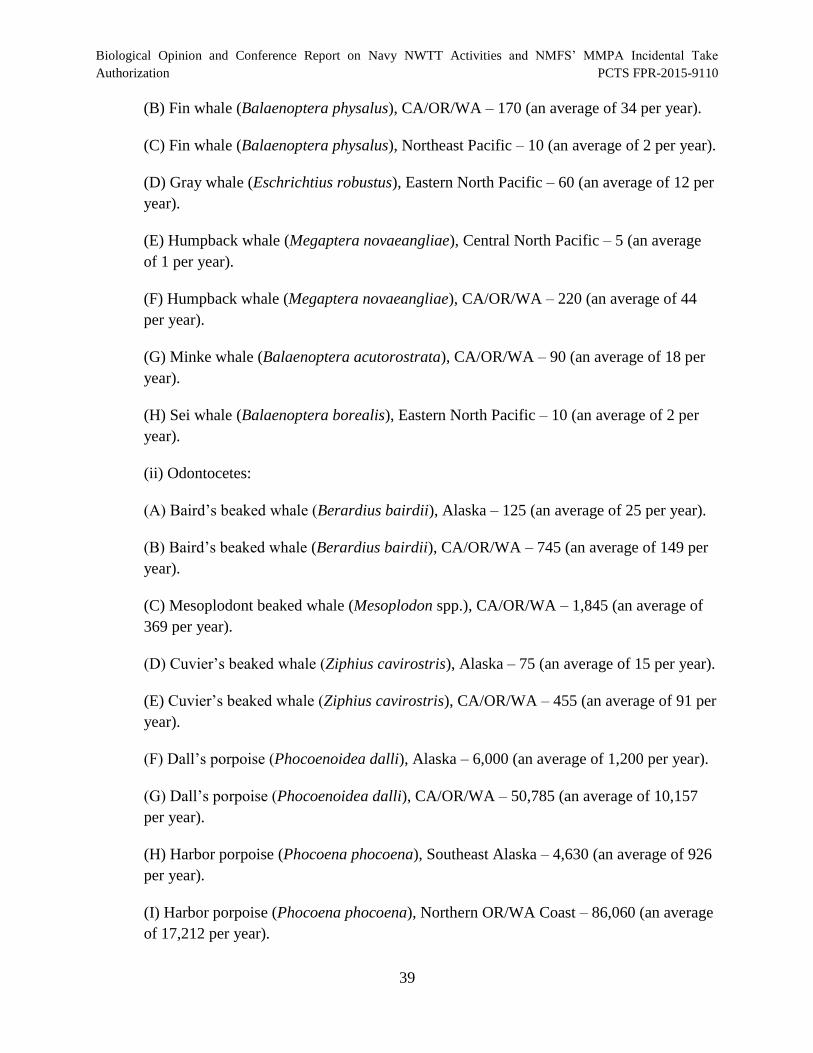
Biological Opinion and Conference Report on Navy NWTT Activities and NMFS’ MMPA Incidental Take
Authorization PCTS FPR-2015-9110
(B) Fin whale (Balaenoptera physalus), CA/OR/WA – 170 (an average of 34 per year).
(C) Fin whale (Balaenoptera physalus), Northeast Pacific – 10 (an average of 2 per year).
(D) Gray whale (Eschrichtius robustus), Eastern North Pacific – 60 (an average of 12 per
year).
(E) Humpback whale (Megaptera novaeangliae), Central North Pacific – 5 (an average
of 1 per year).
(F) Humpback whale (Megaptera novaeangliae), CA/OR/WA – 220 (an average of 44
per year).
(G) Minke whale (Balaenoptera acutorostrata), CA/OR/WA – 90 (an average of 18 per
year).
(H) Sei whale (Balaenoptera borealis), Eastern North Pacific – 10 (an average of 2 per
year).
(ii) Odontocetes:
(A) Baird’s beaked whale (Berardius bairdii), Alaska – 125 (an average of 25 per year).
(B) Baird’s beaked whale (Berardius bairdii), CA/OR/WA – 745 (an average of 149 per
year).
(C) Mesoplodont beaked whale (Mesoplodon spp.), CA/OR/WA – 1,845 (an average of
369 per year).
(D) Cuvier’s beaked whale (Ziphius cavirostris), Alaska – 75 (an average of 15 per year).
(E) Cuvier’s beaked whale (Ziphius cavirostris), CA/OR/WA – 455 (an average of 91 per
year).
(F) Dall’s porpoise (Phocoenoidea dalli), Alaska – 6,000 (an average of 1,200 per year).
(G) Dall’s porpoise (Phocoenoidea dalli), CA/OR/WA – 50,785 (an average of 10,157
per year).
(H) Harbor porpoise (Phocoena phocoena), Southeast Alaska – 4,630 (an average of 926
per year).
(I) Harbor porpoise (Phocoena phocoena), Northern OR/WA Coast – 86,060 (an average
of 17,212 per year).
39
Biological Opinion and Conference Report on Navy NWTT Activities and NMFS’ MMPA Incidental Take Authorization PCTS FPR-2015-9110
(J) Harbor porpoise (Phocoena phocoena), Northern CA/Southern OR – 129,095 (an
average of 25,819 per year).
(K) Harbor porpoise (Phocoena phocoena), WA Inland Waters – 27,045 (an average of
5,409 per year).
(L) Killer whale (Orcinus orca), Alaska Resident – 10 (an average of 2 per year).
(M) Killer whale (Orcinus orca), West Coast Transient – 1,035 (an average of 207 per
year).
(N) Killer whale (Orcinus orca), Eastern North Pacific Offshore – 110 (an average of 22
per year).
(O) Kogia spp., CA/OR/WA – 530 (an average of 106 per year).
(P) Northern right whale dolphin (Lissodelphis borealis), CA/OR/WA – 10,190 (an
average of 2,038 per year).
(Q) Pacific white-sided dolphin (Lagenorhynchus obliquidens), North Pacific – 15 (an
average of 3 per year).
(R) Pacific white-sided dolphin (Lagenorhynchus obliquidens), CA/OR/WA – 24,345 (an
average of 4,869 per year).
(S) Risso’s dolphin (Grampus griseus), CA/OR/WA – 5,770 (an average of 1,154 per
year).
(T) Short-beaked common dolphin (Delphinus delphis), CA/OR/WA – 8,140 (an average
of 1,628 per year).
(U) Sperm whale (Physeter macrocephalus), CA/OR/WA – 390 (an average of 78 per
year).
(V) Striped dolphin (Stenella coerulealba), CA/OR/WA – 70 (an average of 14 per year).
(iii) Pinnipeds:
(A) California sea lion (Zalophus californianus), U.S. – 10,730 (an average of 2,146 per
year).
(B) Steller sea lion (Eumetopias jubatus), Eastern U.S. – 2,605 (an average of 521 per
year).
40
Biological Opinion and Conference Report on Navy NWTT Activities and NMFS’ MMPA Incidental Take Authorization PCTS FPR-2015-9110
(C) Guadalupe fur seal (Arctocephalus townsendi), Mexico – 15 (an average of 3 per
year).
(D) Harbor seal (Phoca vitulina), Southeast Alaska (Clarence Sound) – 110 (an average
of 22 per year).
(E) Harbor seal (Phoca vitulina), OR/WA Coast – 8,275 (an average of 1,655 per year).
(F) Harbor seal (Phoca vitulina), WA Northern Inland Waters – 9,115 (an average of
1,823 per year).
(G) Harbor seal (Phoca vitulina), Southern Puget Sound – 980 (an average of 196 per
year).
(H) Harbor seal (Phoca vitulina), Hood Canal – 296,085 (an average of 59,217 per year).
(I) Northern elephant seal (Mirounga angustirostris), CA Breeding – 6,625 (an average
of 1,325 per year).
(J) Northern fur seal (Callorhinus ursinus), Eastern Pacific – 9,150 (an average of 1,830
per year).
(K) Northern fur seal (Callorhinus ursinus), California – 135 (an average of 27 per year).
(4) Level A Harassment for all Testing Activities:
(i) Mysticetes:
(A) Gray whale (Eschrichtius robustus), Eastern North Pacific – 5 (an average of 1 per
year).
(B) [Reserved]
(ii) Odontocetes:
(A) Kogia spp., CA/OR/WA – 5 (an average of 1 per year).
(B) Dall’ porpoise (Phocoenoidea dalli), CA/OR/WA – 215 (an average of 43 per year).
(C) Harbor porpoise (Phocoena phocoena), Northern OR/WA Coast – 75 (an average of
15 per year).
(D) Harbor porpoise (Phocoena phocoena), Northern CA/Southern OR – 115 (an average
of 23 per year).
41
Biological Opinion and Conference Report on Navy NWTT Activities and NMFS’ MMPA Incidental Take Authorization PCTS FPR-2015-9110
(E) Harbor porpoise (Phocoena phocoena), WA Inland Waters – 30 (an average of 6 per
year).
(iii) Pinnipeds:
(A) Harbor seal (Phoca vitulina), OR/WA Coast – 20 (an average of 4 per year).
(B) Harbor seal (Phoca vitulina), WA Northern Inland Waters – 110 (an average of 22
per year).
(C) Harbor seal (Phoca vitulina), Southern Puget Sound – 5 (an average of 1 per year).
(D) Harbor seal (Phoca vitulina), Hood Canal – 335 (an average of 67 per year).
(E) Northern elephant seal (Mirounga angustirostris), CA Breeding – 10 (an average of 2
per year).
(F) [Reserved]
2.4.1.4 § 218.143 Prohibitions.
Notwithstanding takings contemplated in § 218.142 and authorized by an LOA issued
under §§ 216.106 and 218.147 of this chapter, no person in connection with the activities
described in § 218.140 may:
(a) Take any marine mammal not specified in § 218.142(c);
(b) Take any marine mammal specified in § 218.142(c) other than by incidental take as
specified in § 218.142(c);
(c) Take a marine mammal specified in § 218.142(c) if such taking results in more than a
negligible impact on the species or stocks of such marine mammal; or
(d) Violate, or fail to comply with, the terms, conditions, and requirements of these
regulations or an LOA issued under §§ 216.106 and 218.147.
2.4.1.5 § 218.144 Mitigation.
(a) When conducting training and testing activities, as identified in § 218.140, the
mitigation measures contained in the LOA issued under §§ 216.106 and 218.147 of this chapter
must be implemented. These mitigation measures include, but are not limited to:
(1) Lookouts – The following are protective measures concerning the use of Lookouts.
42
Biological Opinion and Conference Report on Navy NWTT Activities and NMFS’ MMPA Incidental Take Authorization PCTS FPR-2015-9110
(i) Lookouts positioned on surface ships will be dedicated solely to diligent observation
of the air and surface of the water. Their observation objectives will include, but are not limited
to, detecting the presence of biological resources and recreational or fishing boats, observing
mitigation zones, and monitoring for vessel and personnel safety concerns.
(ii) Lookouts positioned ashore, in aircraft or on boats will, to the maximum extent
practicable and consistent with aircraft and boat safety and training and testing requirements,
comply with the observation objectives described in paragraph (a)(1)(i) of this section.
(iii) Lookout measures for non-impulsive sound:
(A) With the exception of vessels less than 65 ft (20 m) in length or minimally manned
vessels, ships using low-frequency or hull-mounted mid-frequency active sonar sources
associated with anti-submarine warfare and mine warfare activities at sea will have two
Lookouts at the forward position of the vessel. For the purposes of this rule, low-frequency
active sonar does not include surface towed array surveillance system low-frequency active
sonar.
(B) While using low-frequency or hull-mounted mid-frequency active sonar sources
associated with anti-submarine warfare and mine warfare activities at sea, vessels less than 65 ft
(20 m) in length or minimally manned vessels will have one Lookout at the forward position of
the vessel due to space and manning restrictions.
(C) Ships conducting active sonar activities while moored or at anchor (including pierside
or shore-based testing or maintenance) will maintain one Lookout.
(D) Minimally manned vessels conducting hull-mounted mid-frequency testing will
employ one Lookout.
(E) Ships, small boats, range craft, or aircraft conducting non-hull-mounted mid-
frequency active sonar, such as helicopter dipping sonar systems, will maintain one Lookout.
(F) Surface ships or aircraft conducting high-frequency or non-hull-mounted mid-
frequency active sonar activities associated with anti-submarine warfare and mine warfare
activities at sea will have one Lookout.
(iv) Lookout measures for impulsive sound (e.g., explosives):
(A) Aircraft conducting improved extended echo ranging sonobuoy activities will have
one Lookout.
(B) Aircraft conducting explosive sonobuoy activities using >0.5 to 2.5-lb net explosive
weight (NEW) will have one Lookout.
43
Biological Opinion and Conference Report on Navy NWTT Activities and NMFS’ MMPA Incidental Take Authorization PCTS FPR-2015-9110
(C) General mine countermeasure and neutralization activities involving positive control
diver placed charges using >0.5 to 2.5 lb NEW will have a total of two Lookouts (one Lookout
positioned in each of the two support vessels). All divers placing the charges on mines will
support the Lookouts while performing their regular duties. The divers and Lookouts will report
all marine mammal sightings to their dive support vessel.
(D) Surface vessels or aircraft conducting small-,medium-, and large-caliber gunnery
exercises will have one Lookout. Towing vessels, if applicable, will also maintain one Lookout.
(E) Aircraft conducting missile exercises against a surface target will have one Lookout.
(F) Aircraft conducting explosive bombing exercises will have one Lookout and any
surface vessels involved will have trained Lookouts.
(G) During explosive torpedo testing from aircraft one Lookout will be used and
positioned in an aircraft. During explosive torpedo testing from a surface ship the Lookout
procedures implemented for hull-mounted mid-frequency active sonar activities will be used.
(H) To mitigate effects from weapon firing noise, ships conducting explosive and non
explosive large-caliber gunnery exercises will have one Lookout. This may be the same Lookout
used for small, medium, and large-caliber gunnery exercises using a surface target when that
activity is conducted from a ship against a surface target.
(v) Lookout measures for physical strike and disturbance:
(A) While underway, surface ships and range craft will have at least one Lookout.
(B) During activities using towed in-water devices towed from a manned platform, one
Lookout will be used. During activities in which in-water devices are towed by unmanned
platforms, a manned escort vessel will be included and one Lookout will be employed.
(C) Activities involving non-explosive practice munitions (e.g., small-, medium-, and
large-caliber gunnery exercises) using a surface target will have one Lookout.
(D) During non-explosive bombing exercises one Lookout will be positioned in an
aircraft and trained Lookouts will be positioned in any surface vessels involved.
(2) Mitigation zones – The following are protective measures concerning the
implementation of mitigation zones.
(i) Mitigation zones will be measured as the radius from a source and represent a distance
to be monitored.
44
Biological Opinion and Conference Report on Navy NWTT Activities and NMFS’ MMPA Incidental Take Authorization PCTS FPR-2015-9110
(ii) Visual detections of marine mammals (or sea turtles) within a mitigation zone will be
communicated immediately to a watch station for information dissemination and appropriate
action.
(iii) Mitigation zones for non-impulsive sound:
(A) The Navy shall ensure that hull-mounted mid-frequency active sonar transmission
levels are limited to at least 6 dB below normal operating levels if any detected marine mammals
(or sea turtles) are within 1,000 yd. (914 m) of the sonar dome (the bow).
(B) The Navy shall ensure that hull-mounted mid-frequency active sonar transmissions
are limited to at least 10 dB below the equipment’s normal operating level if any detected marine
mammals (or sea turtles) are within 500 yd. (457 m) of the sonar dome.
(C) The Navy shall ensure that hull-mounted mid-frequency active sonar transmissions
are ceased if any detected cetaceans (or sea turtles) are within 200 yd. (183 m) and pinnipeds are
within 100 yd. (91 m) of the sonar dome. Transmissions will not resume until the marine
mammal has been observed exiting the mitigation zone, is thought to have exited the mitigation
zone based on its course and speed, has not been detected for 30 minutes, the vessel has transited
more than 2,000 yd. beyond the location of the last detection, or the Lookout concludes that
dolphins are deliberately closing in on the ship to ride the ship’s bow wave (and there are no
other marine mammal sightings within the mitigation zone). Active transmission may resume
when dolphins are bow riding because they are out of the main transmission axis of the active
sonar while in the shallow-wave area of the ship bow. The pinniped mitigation zone does not
apply to pierside sonar in the vicinity of pinnipeds hauled out on or in the water near man-made
structures and vessels.
(D) The Navy shall ensure that low-frequency active sonar transmission levels are ceased
if any detected cetaceans (or sea turtles) are within 200 yd. (183 m) and pinnipeds are within 100
yd. (91 m) of the source. Transmissions will not resume until the marine mammal has been
observed exiting the mitigation zone, is thought to have exited the mitigation zone based on its
course and speed, has not been detected for 30 minutes, or the vessel has transited more than
2,000 yd. beyond the location of the last detection. The pinniped mitigation zone does not apply
for pierside sonar testing in the vicinity of pinnipeds hauled out on or in the water near man-
made structures and vessels.
(E) For training, the Navy shall ensure that high-frequency and non-hull-mounted mid-
frequency active sonar transmission levels are ceased if any detected marine mammals are within
200 yd. (183 m) of the source. For testing, the Navy shall ensure that high-frequency and non
hull-mounted mid-frequency active sonar transmission levels are ceased if any detected
cetaceans are within 200 yd. (183 m) and pinnipeds are within 100 yd. (91 m) of the source.
Transmissions will not resume until the marine mammal has been observed exiting the
45
Biological Opinion and Conference Report on Navy NWTT Activities and NMFS’ MMPA Incidental Take
Authorization PCTS FPR-2015-9110
mitigation zone, is thought to have exited the mitigation zone based on its course and speed, the
mitigation zone has been clear from any additional sightings for a period of 10 minutes for an
aircraft-deployed source, the mitigation zone has been clear from any additional sightings for a
period of 30 minutes for a vessel-deployed source, the vessel or aircraft has repositioned itself
more than 400 yd. (370 m) away from the location of the last sighting, or the vessel concludes
that dolphins are deliberately closing in to ride the vessel’s bow wave (and there are no other
marine mammal sightings within the mitigation zone). The pinniped mitigation zone does not
apply for pierside or shore-based testing in the vicinity of pinnipeds hauled out on or in the water
near man-made structures and vessels.
(iv) Mitigation zones and procedures for explosive and impulsive sound:
(A) For activities using IEER sonobuoys, mitigation will include pre-exercise aerial
observation and passive acoustic monitoring, which will begin 30 minutes before the first
source/receiver pair detonation and continue throughout the duration of the exercise. IEER
sonobuoys will not be deployed if concentrations of floating vegetation (kelp paddies) are
observed in the mitigation zone around the intended deployment location. Explosive detonations
will cease if a marine mammal, sea turtle, or concentrations of floating vegetation are sighted
within a 600-yd. (549 m) mitigation zone. Detonations will recommence if the animal is
observed exiting the mitigation zone, the animal is thought to have exited the mitigation zone
based on its course and speed, or the mitigation zone has been clear from any additional
sightings for a period of 30 minutes.
(B) A mitigation zone with a radius of 350 yd. (320 m) shall be established for explosive
signal underwater sonobuoys using >0.5 to 2.5 lb net explosive weight. Mitigation will include
pre-exercise aerial monitoring of the mitigation zone during deployment. Explosive SUS buoys
will not be deployed if concentrations of floating vegetation (kelp paddies) are observed within
the mitigation zone around the intended deployment location. A SUS detonation will cease if a
marine mammal or sea turtle is sighted within the mitigation zone. Detonations will recommence
if the animal is observed exiting the mitigation zone, the animal is thought to have exited the
mitigation zone based on its course and speed, or the mitigation zone has been clear from any
additional sightings for a period of 10 minutes.
(C) A mitigation zone with a radius of 400 yd. (366 m) shall be established for mine
countermeasures and neutralization activities using positive control firing devices. For
Demolition and Mine Countermeasures Operations, pre-exercise surveys shall be conducted
within 30 minutes prior to the commencement of the scheduled explosive event. The survey may
be conducted from the surface, by divers, or from the air, and personnel shall be alert to the
presence of any marine mammal or sea turtle. Should a marine mammal or sea turtle be present
within the survey area, the explosive event shall not be started until the animal voluntarily leaves
the area. The Navy will ensure the area is clear of marine mammals for a full 30 minutes prior to
46
Biological Opinion and Conference Report on Navy NWTT Activities and NMFS’ MMPA Incidental Take
Authorization PCTS FPR-2015-9110
initiating the explosive event. Explosive detonations will cease if a marine mammal is sighted in
the water portion of the mitigation zone (i.e., not on shore). Detonations will recommence if the
animal is observed exiting the mitigation zone, the animal is thought to have exited the
mitigation zone based on its course and speed, or the mitigation zone has been clear from any
additional sightings for a period of 30 minutes.
(D) A mitigation zone with a radius of 200 yd. (183 m) shall be established for small- and
medium-caliber gunnery exercises with a surface target. Vessels will observe the mitigation zone
from the firing position. When aircraft are firing, the aircrew will maintain visual watch of the
mitigation zone during the activity. The exercise will not commence if concentrations of floating
vegetation (kelp paddies) are observed within the mitigation zone. Firing will cease if a marine
mammal or sea turtle is sighted within the mitigation zone. Firing will recommence if the animal
is observed exiting the mitigation zone, the animal is thought to have exited the mitigation zone
based on its course and speed, the mitigation zone has been clear from any additional sightings
for a period of 10 minutes for a firing aircraft, the mitigation zone has been clear from any
additional sightings for a period of 30 minutes for a firing ship, or the intended target location
has been repositioned more than 400 yd. (370 m) away from the location of the last sighting.
(E) A mitigation zone with a radius of 600 yd. (549 m) shall be established for large-
caliber gunnery exercises with a surface target. Ships will observe the mitigation zone from the
firing position. The exercise will not commence if concentrations of floating vegetation (kelp
paddies) are observed in the mitigation zone. Firing will cease if a marine mammal or sea turtle
is sighted within the mitigation zone. Firing will recommence if the animal is observed exiting
the mitigation zone, the animal is thought to have exited the mitigation zone based on its course
and speed, or the mitigation zone has been clear from any additional sightings for a period of 30
minutes.
(F) A mitigation zone with a radius of 2,000 yd. (1.8 km) shall be established for missile
exercises up to 500 lb NEW using a surface target. When aircraft are involved in the missile
firing, mitigation will include visual observation by the aircrew prior to commencement of the
activity within a mitigation zone of 2,000 yd. (1.8 km) around the intended impact location. The
exercise will not commence if concentrations of floating vegetation (kelp paddies) are observed
in the mitigation zone. Firing will not commence or will cease if a marine mammal or sea turtle
is sighted within the mitigation zone. Firing will recommence if the animal is observed exiting
the mitigation zone, the animal is thought to have exited the mitigation zone based on its course
and speed, or the mitigation zone has been clear from any additional sightings for a period of 10
minutes or 30 minutes (depending on aircraft type).
(G) A mitigation zone with a radius of 2,500 yd. (2.3 km) for explosive bombs and a
mitigation zone of 1,000 yd (914 m) for non-explosive bombs around the intended impact
location shall be established for bombing exercises. Aircraft shall visually survey the target and
47
Biological Opinion and Conference Report on Navy NWTT Activities and NMFS’ MMPA Incidental Take
Authorization PCTS FPR-2015-9110
buffer zone for marine mammals prior to and during the exercise. The exercise will not
commence if concentrations of floating vegetation (kelp paddies) are observed in the mitigation
zone. Bombing will not commence or will cease if a marine mammal or sea turtle is sighted
within the mitigation zone. Bombing will recommence if the animal is observed exiting the
mitigation zone, the animal is thought to have exited the mitigation zone based on its course and
speed, or the mitigation zone has been clear from any additional sightings for a period of 10
minutes.
(H) A mitigation zone with a radius of 2,100 yd. (1.9 km) shall be established for torpedo
(explosive) testing. Mitigation will include visual observation by aircraft immediately before,
during, and after the event of the mitigation zone. The exercise will not commence if
concentrations of floating vegetation (kelp paddies) are sighted within the mitigation zone. Firing
will not commence or will cease if a marine mammal, sea turtle, or aggregation of jellyfish is
sighted within the mitigation zone. Firing will recommence if the animal is observed exiting the
mitigation zone, the animal is thought to have exited the mitigation zone based on its course and
speed, or the mitigation zone has been clear from any additional sightings for a period of 10
minutes or 30 minutes (depending on aircraft type). In addition to visual observation, passive
acoustic monitoring shall be conducted by Navy assets, such as passive ship sonar systems or
sonobuoys already participating in the activity. These assets would only detect vocalizing marine
mammals within the frequency band monitored by Navy personnel. Passive acoustic detections
would not provide range or bearing to detected animals, and therefore cannot provide locations
of these animals. Passive acoustic detections shall be reported to the Lookout posted in the
aircraft in order to increase vigilance of the visual surveillance, and to the person in control of
the activity for their consideration in determining when the mitigation zone is determined free of
visible marine mammals.
(I) A mitigation zone with a radius of 70 yd. (46 m) within 30 degrees on either side of
the gun target line on the firing side shall be established for weapons firing noise during large-
caliber gunnery exercises. Mitigation shall include visual observation immediately before and
during the exercise. The exercise will not commence if concentrations of floating vegetation
(kelp paddies) are observed in the mitigation zone. Firing will cease if a marine mammal or sea
turtle is sighted within the mitigation zone. Firing will recommence if the animal is observed
exiting the mitigation zone, the animal is thought to have exited the mitigation zone based on its
course and speed, the mitigation zone has been clear from any additional sightings for a period of
30 minutes, or the vessel has repositioned itself more than 140 yd. (128 m) away from the
location of the last sighting.
(v) Mitigation zones for vessels and in-water devices:
(A) For all training activities and for testing activities involving surface ships, vessels
shall avoid approaching marine mammals head on and shall maneuver to keep at least 500 yd.
48
Biological Opinion and Conference Report on Navy NWTT Activities and NMFS’ MMPA Incidental Take
Authorization PCTS FPR-2015-9110
(457 m) away from observed whales and 200 yd (183 m) away from all other marine mammals
(except bow riding dolphins, and pinnipeds hauled out on man-made navigational and port
structures and vessels) during vessel movements. These requirements shall not apply if a vessel’s
safety is threatened and to the extent that vessels are restricted in their ability to maneuver.
Restricted maneuverability includes, but is not limited to, situations when vessels are engaged in
dredging, submerged activities, launching and recovering aircraft or landing craft, minesweeping
activities, replenishment while underway and towing activities that severely restrict a vessel's
ability to deviate course.
(B) For testing activities not involving surface ships (e.g. range craft) vessels shall
maneuver to keep at least 100 yd. (91 m) away from marine mammals (except bow-riding
dolphins, pinnipeds hauled out on man-made navigational and port structures and vessels, and
pinnipeds during test body retrieval) during vessel movements. This requirement shall not apply
if a vessel’s safety is threatened and to the extent that vessels are restricted in their ability to
maneuver. Restricted maneuverability includes, but is not limited to, situations when vessels are
engaged in dredging, submerged activities, launching and recovering aircraft or landing craft,
minesweeping activities, replenishment while underway and towing activities that severely
restrict a vessel's ability to deviate course.
(C) The Navy shall ensure that towed in-water devices being towed from manned
platforms avoid coming within a mitigation zone of 250 yd. (230 m) for all training events and
testing activities involving surface ships, and a mitigation zone of 100 yd (91 m) for testing
activities not involving surface ships (e.g. range craft) around any observed marine mammal,
providing it is safe to do so.
(vi) Mitigation zones for non-explosive practice munitions:
(A) A mitigation zone of 200 yd. (183 m) shall be established for small-, medium-, and
large-caliber gunnery exercises using a surface target. Mitigation will include visual observation
from a vessel or aircraft immediately before and during the exercise within the mitigation zone
of the intended impact location. The exercise will not commence if concentrations of floating
vegetation (kelp paddies) are observed in the mitigation zone. Firing will cease if a marine
mammal is sighted within the mitigation zone. Firing will recommence if the animal is observed
exiting the mitigation zone, the animal is thought to have exited the mitigation zone based on its
course and speed, the mitigation zone has been clear from any additional sightings for a period of
10 minutes for a firing aircraft, the mitigation zone has been clear from any additional sightings
for a period of 30 minutes for a firing ship, or the intended target location has been repositioned
more than 400 yd. (370 m) away from the location of the last sighting.
(B) A mitigation zone of 1,000 yd. (914 m) shall be established for non-explosive
bombing exercises. Mitigation shall include visual observation from the aircraft immediately
before the exercise and during target approach within the mitigation zone around the intended
49
Biological Opinion and Conference Report on Navy NWTT Activities and NMFS’ MMPA Incidental Take
Authorization PCTS FPR-2015-9110
impact location. The exercise will not commence if concentrations of floating vegetation (kelp
paddies) are observed within the mitigation zone. Bombing will not commence or will cease if a
marine mammal is sighted within the mitigation zone. Bombing will recommence if the animal is
observed exiting the mitigation zone, the animal is thought to have exited the mitigation zone
based on its course and speed, or the mitigation zone has been clear from any additional
sightings for a period of 10 minutes.
(3) NWTT-Specific Mitigation – The following are additional measures the Navy shall
comply with when conducting training or testing activities in the NWTT Study Area:
(i) Maritime Homeland Defense/Security Mine Countermeasure Integrated Exercises –
The Navy shall conduct pre-event planning and training to ensure environmental awareness of all
exercise participants. When this event is proposed to be conducted in Puget Sound, Navy event
planners shall consult with Navy biologists who shall contact NMFS during the planning process
in order to determine likelihood of gray whale or southern resident killer whale presence in the
proposed exercise area as planners consider specifics of the event.
(ii) Small Boat Attack Gunnery Exercises - The Navy shall conduct pre-event planning
and training to ensure environmental awareness of all exercise participants. When this event is
proposed to be conducted in and around Naval Station Everett, Naval Base Kitsap Bangor, or
Naval Base Kitsap Bremerton in Puget Sound, Navy event planners shall consult with Navy
biologists who shall contact NMFS early in the planning process in order to determine the extent
marine mammals may be present in the immediate vicinity of the proposed exercise area as
planners consider the specifics of the event.
(iii) Missile Exercise - The Navy shall conduct Missile Exercises using high explosives at
least 50 nm from shore in the NWTT Offshore Area.
(iv) BOMBEX – The Navy shall conduct BOMBEX (high explosive munitions) greater
than 50 nm from shore.
(v) BOMBEX (non-explosive practice munitions) - The Navy shall conduct BOMBEX
(non-explosive practice munitions) events at least 20 nm from shore and shall not conduct
BOMBEX events within the Olympic Coast National Marine Sanctuary.
(vi) Mine Countermeasure and Neutralization Underwater Detonations – The Navy shall
require approval from U.S. Third Fleet prior to conducting mine countermeasure and
neutralization underwater detonations at Hood Canal or Crescent Harbor.
(vii) Hull Mounted Mid-Frequency Active Sonar Training - The Navy shall require
approval from U.S. Pacific Fleet’s designated authority prior to conducting hull-mounted mid
50
Biological Opinion and Conference Report on Navy NWTT Activities and NMFS’ MMPA Incidental Take
Authorization PCTS FPR-2015-9110
frequency active sonar on vessels while training underway in Puget Sound and the Strait of Juan
de Fuca.
(viii) Pierside Maintenance or Testing of Sonar Systems – The Navy shall require
approval from U.S. Pacific Fleet's designated authority or Systems Command designated
authority (as applicable to ship and submarine active sonar use) prior to conducting pierside
maintenance or testing in Puget Sound or the Strait of Juan de Fuca.
2.4.1.6 § 218.145 Requirements for monitoring and reporting.
(a) The Navy is required to cooperate with the NMFS, and any other Federal, state or
local agency monitoring the impacts of the activity on marine mammals.
(b) General Notification of Injured or Dead Marine Mammals - Navy personnel shall
ensure that NMFS is notified immediately (or as soon as clearance procedures allow) if an
injured, stranded, or dead marine mammal is found during or shortly after, and in the vicinity of,
any Navy training exercise utilizing MFAS, HFAS, or underwater explosive detonations. The
Navy will provide NMFS with species or description of the animal (s), the condition of the
animal(s) (including carcass condition if the animal is dead), location, time of first discovery,
observed behaviors (if alive), and photo or video (if available). In the event that an injured,
stranded, or dead marine mammal is found by the Navy that is not in the vicinity of, or during or
shortly after, MFAS, HFAS, or underwater explosive detonations, the Navy will report the same
information as listed above as soon as operationally feasible and clearance procedures allow.
(c) General Notification of Ship Strike - In the event of a ship strike by any Navy vessel,
at any time or place, the Navy shall do the following:
(1) Immediately report to NMFS the species identification (if known), location (lat/long)
of the animal (or the strike if the animal has disappeared), and whether the animal is alive or
dead (or unknown)
(2) Report to NMFS as soon as operationally feasible the size and length of animal, an
estimate of the injury status (ex., dead, injured but alive, injured and moving, unknown, etc.),
vessel class/type and operational status.
(3) Report to NMFS the vessel length, speed, and heading as soon as feasible.
(4) Provide NMFS a photo or video, if equipment is available
(d) Event Communication Plan - The Navy shall develop a communication plan that will
include all of the communication protocols (phone trees, etc.) and associated contact information
required for NMFS and the Navy to carry out the necessary expeditious communication required
51
Biological Opinion and Conference Report on Navy NWTT Activities and NMFS’ MMPA Incidental Take
Authorization PCTS FPR-2015-9110
in the event of a stranding or ship strike, including as described in the proposed notification
measures above.
(e) The Navy must conduct all monitoring and/or research required under the Letter of
Authorization including abiding by the NWTT monitoring plan.
(http://www.nmfs.noaa.gov/pr/permits/incidental/military.htm).
(f) Annual NWTT Monitoring Report - The Navy shall submit an annual report of the
NWTT monitoring describing the implementation and results of the NWTT monitoring efforts
from the previous calendar year. Data collection methods will be standardized across range
complexes and study areas to allow for comparison in different geographic locations. Although
additional information will be gathered, the protected species observers collecting marine
mammal data pursuant to the NWTT monitoring plan shall, at a minimum, provide the same
marine mammal observation data required in § 218.145. The report shall be submitted either 90
days after the calendar year, or 90 days after the conclusion of the monitoring year to be
determined by the Adaptive Management process.
The NWTT Monitoring Report may be provided to NMFS within a larger report that
includes the required Monitoring Plan reports from multiple range complexes and study areas
(the multi-Range Complex Annual Monitoring Report). Such a report would describe progress of
knowledge made with respect to monitoring plan study questions across all Navy ranges
associated with the Integrated Comprehensive Monitoring Program. Similar study questions shall
be treated together so that progress on each topic shall be summarized across all Navy ranges.
The report need not include analyses and content that does not provide direct assessment of
cumulative progress on the monitoring plan study questions.
(g) Annual NWTT Exercise and Testing Reports - The Navy shall submit preliminary
reports detailing the status of authorized sound sources within 21 days after the anniversary of
the date of issuance of the LOA. The Navy shall submit detailed reports 3 months after the
annual anniversary of the date of issuance of the LOA. The detailed annual reports shall describe
the level of training and testing conducted during the reporting period, and a summary of sound
sources used (total annual hours or quantity [per the LOA] of each bin of sonar or other non-
impulsive source; total annual number of each type of explosive exercises; total annual
expended/detonated rounds [missiles, bombs, etc.] for each explosive bin; and improved
Extended Echo-Ranging System (IEER)/sonobuoy summary, including total number of IEER
events conducted in the Study Area, total expended/detonated rounds (buoys), and total number
of self-scuttled IEER rounds. The analysis in the detailed reports will be based on the
accumulation of data from the current year’s report and data collected from previous reports.
The annual classified exercise reports will also include the amount of hull-mounted mid-
frequency and high frequency active sonar use during training and testing activities in the months
specified for the following three feeding areas, (to the extent that active sonar training or testing
52
Biological Opinion and Conference Report on Navy NWTT Activities and NMFS’ MMPA Incidental Take
Authorization PCTS FPR-2015-9110
does occur in these feeding areas): the Humpback Whale Northern Washington feeding area
(May through November); the Stonewall and Heceta Bank feeding area (May through
November) and the Gray Whale Northern Puget Sound Feeding Area (March through May).
(h) 5-year Close-out Exercise and Testing Report—This report will be included as part of
the 2020 annual exercise or testing report. This report will provide the annual totals for each
sound source bin with a comparison to the annual allowance and the 5-year total for each sound
source bin with a comparison to the 5-year allowance. Additionally, if there were any changes to
the sound source allowance, this report will include a discussion of why the change was made
and include the analysis to support how the change did or did not result in a change in the SEIS
and final rule determinations. The report will be submitted 3 months after the expiration of the
rule. NMFS will submit comments on the draft close-out report, if any, within 3 months of
receipt. The report will be considered final after the Navy has addressed NMFS’ comments, or 3
months after the submittal of the draft if NMFS does not provide comments.
2.4.1.7 § 218.146 Applications for Letters of Authorization.
To incidentally take marine mammals pursuant to the regulations in this subpart, the U.S.
citizen (as defined by § 216.106) conducting the activity identified in § 218.140(c) (the U.S.
Navy) must apply for and obtain either an initial LOA in accordance with § 218.147 or a renewal
under § 218.148.
2.4.1.8 § 218.147 Letters of Authorization.
(a) An LOA, unless suspended or revoked, will be valid for a period of time not to exceed
the period of validity of this subpart.
(b) Each LOA will set forth:
(1) Permissible methods of incidental taking;
(2) Means of effecting the least practicable adverse impact on the species, its habitat, and
on the availability of the species for subsistence uses (i.e., mitigation); and
(3) Requirements for mitigation, monitoring and reporting.
(c) Issuance, modification, or renewals of LOAs will be based on a determination that the
total number of marine mammals taken by the activity as a whole will have no more than a
negligible impact on the affected species or stock of marine mammal(s).
53
Biological Opinion and Conference Report on Navy NWTT Activities and NMFS’ MMPA Incidental Take
Authorization PCTS FPR-2015-9110
2.4.1.9 § 218.148 Renewals and Modifications of Letters of Authorization and Adaptive
Management.
(a) A Letter of Authorization issued under §§ 216.106 and 218.147 of this chapter for the
activity identified in § 218.140(c) will be renewed or modified upon request of the applicant,
provided that:
(1) The proposed specified activity and mitigation, monitoring, and reporting measures,
as well as the anticipated impacts, are the same as those described and analyzed for these
regulations (excluding changes made pursuant to the adaptive management provision of this
chapter), and;
(2) NMFS determines that the mitigation, monitoring, and reporting measures required by
the previous LOA under these regulations were adequately implemented.
(b) For LOA modification or renewal requests by the applicant that include changes to
the activity or the mitigation, monitoring, or reporting (excluding changes made pursuant to the
adaptive management provision of this chapter) that do not change the findings made for the
regulations or result in no more than a minor change in the total estimated number of takes (or
distribution by species or years), NMFS may publish a notice of proposed LOA in the Federal
Register, including the associated analysis illustrating the change, and solicit public comment
before issuing the LOA.
(c) An LOA issued under § 216.106 and § 218.147 of this chapter for the activity
identified in § 218.144 of this chapter may be modified by NMFS under the following
circumstances:
(1) Adaptive Management – NMFS may modify (including add to, change, or remove)
the existing mitigation, monitoring, or reporting measures (after consulting with the Navy
regarding the practicability of the modifications) if doing so creates a reasonable likelihood of
more effectively accomplishing the goals of the mitigation and monitoring set forth in the
preamble for these regulations.
(i) Possible sources of data that could contribute to the decision to modify the mitigation,
monitoring, and reporting measures in an LOA include (but are not limited to):
(A) Results from Navy’s monitoring from the previous year(s);
(B) Results from other marine mammal and/or sound research or studies; or
(C) Any information that reveals marine mammals may have been taken in a manner,
extent, or number not authorized by these regulations or subsequent LOAs.
54
Biological Opinion and Conference Report on Navy NWTT Activities and NMFS’ MMPA Incidental Take Authorization PCTS FPR-2015-9110
(ii) If, through adaptive management, the modifications to the mitigation, monitoring, or
reporting measures are substantial, NMFS would publish a notice of proposed LOA in the
Federal Register and solicit public comment.
(2) Emergencies – If NMFS determines that an emergency exists that poses a significant risk
to the well-being of the species or stocks of marine mammals specified in § 218.142(c), an LOA
may be modified without prior notification and an opportunity for public comment. Notification
would be published in the Federal Register within 30 days of the action.
2.5 Action Area
Action Area means all areas affected directly, or indirectly, by the Federal action, and not just the
immediate area involved in the action (50 CFR 402.02). The Action Area encompasses the
NWTT Study Area, transit corridor, and the area outside of the Study Area where direct and
effects of stressors from Navy training and testing activities could be experienced. Figure 1
provides an overview of the NWTT Action Area which includes the inshore and offshore
portions of the Northwest Training Range Complex (NWTRC) in Northern California, Oregon,
and Washington State, the Naval Undersea Warfare Center (NUWC) Keyport Range Complex in
and around Puget Sound, and the Southeast Alaska Acoustic Measurement Facility (SEAFAC) in
the Western Behm Canal, Alaska. Figure 2, Figure 3, and Figure 4 illustrates the offshore portion
of the NWTRC, the inshore portion of the NWTRC (Keyport Range Complex), and SEAFAC in
greater detail.
2.5.1 Offshore Area of the Action Area
The offshore component of the Action Area includes air, surface, and subsurface operating areas
extending generally west from the coastline of Washington, Oregon, and Northern California for
a distance of approximately 250 nm into international waters. The eastern boundary of the
Offshore Area lays 12 nm off the coastline for most of the Action Area, including southern
Washington, Oregon, and Northern California. The Offshore Area includes the ocean all the way
to the coastline only along the Washington coast beneath the airspace of W-237 and the Olympic
MOA and the Washington coastline north of the Olympic MOA. The Offshore Area also
includes approximately 1 mile of beach area located at Pacific Beach.
Commander Submarine Force, U.S. Pacific Fleet Pearl Harbor uses the water space of the
Offshore Area as transit lanes for U.S. submarines. The sea space is ample for all levels of Navy
training, and its location is ideal for ships, submarines, and aircraft based in the Pacific
Northwest. The size of the area and its extension south off the coast of Northern California
provides valuable training and testing space for ships and submarines transiting between the
Pacific Northwest and Southern California.
55
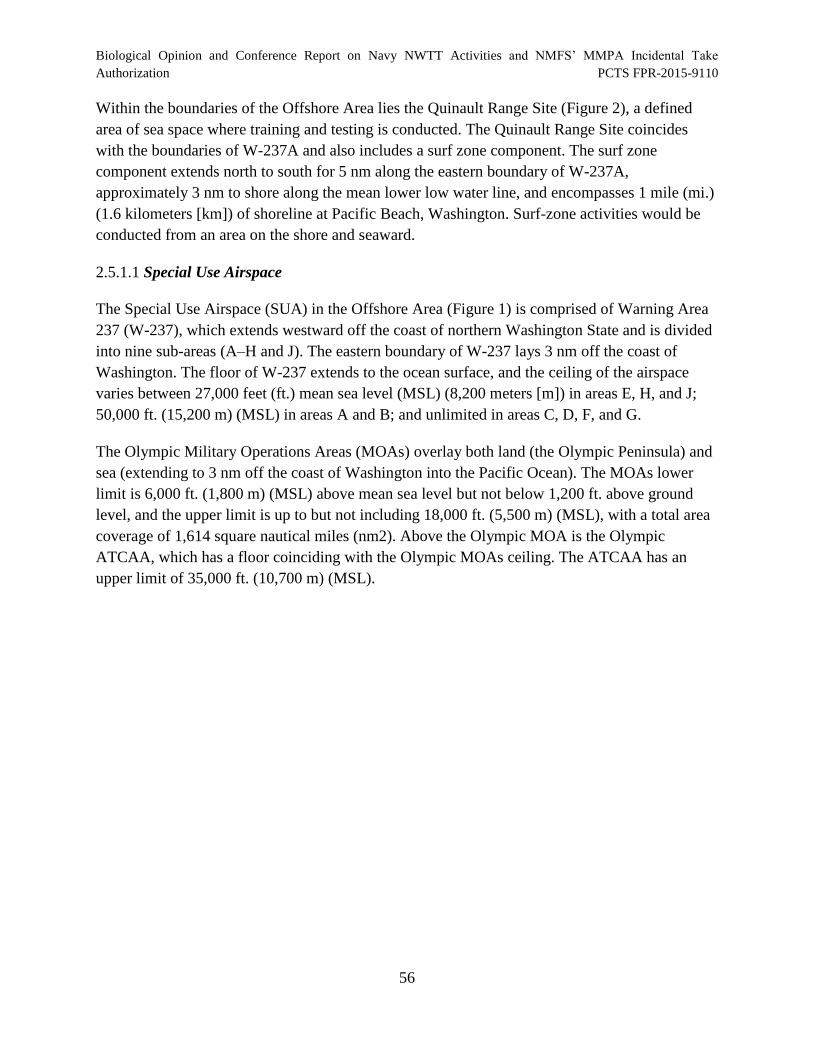
Biological Opinion and Conference Report on Navy NWTT Activities and NMFS’ MMPA Incidental Take
Authorization PCTS FPR-2015-9110
Within the boundaries of the Offshore Area lies the Quinault Range Site (Figure 2), a defined
area of sea space where training and testing is conducted. The Quinault Range Site coincides
with the boundaries of W-237A and also includes a surf zone component. The surf zone
component extends north to south for 5 nm along the eastern boundary of W-237A,
approximately 3 nm to shore along the mean lower low water line, and encompasses 1 mile (mi.)
(1.6 kilometers [km]) of shoreline at Pacific Beach, Washington. Surf-zone activities would be
conducted from an area on the shore and seaward.
2.5.1.1 Special Use Airspace
The Special Use Airspace (SUA) in the Offshore Area (Figure 1) is comprised of Warning Area
237 (W-237), which extends westward off the coast of northern Washington State and is divided
into nine sub-areas (A–H and J). The eastern boundary of W-237 lays 3 nm off the coast of
Washington. The floor of W-237 extends to the ocean surface, and the ceiling of the airspace
varies between 27,000 feet (ft.) mean sea level (MSL) (8,200 meters [m]) in areas E, H, and J;
50,000 ft. (15,200 m) (MSL) in areas A and B; and unlimited in areas C, D, F, and G.
The Olympic Military Operations Areas (MOAs) overlay both land (the Olympic Peninsula) and
sea (extending to 3 nm off the coast of Washington into the Pacific Ocean). The MOAs lower
limit is 6,000 ft. (1,800 m) (MSL) above mean sea level but not below 1,200 ft. above ground
level, and the upper limit is up to but not including 18,000 ft. (5,500 m) (MSL), with a total area
coverage of 1,614 square nautical miles (nm2). Above the Olympic MOA is the Olympic
ATCAA, which has a floor coinciding with the Olympic MOAs ceiling. The ATCAA has an
upper limit of 35,000 ft. (10,700 m) (MSL).
56
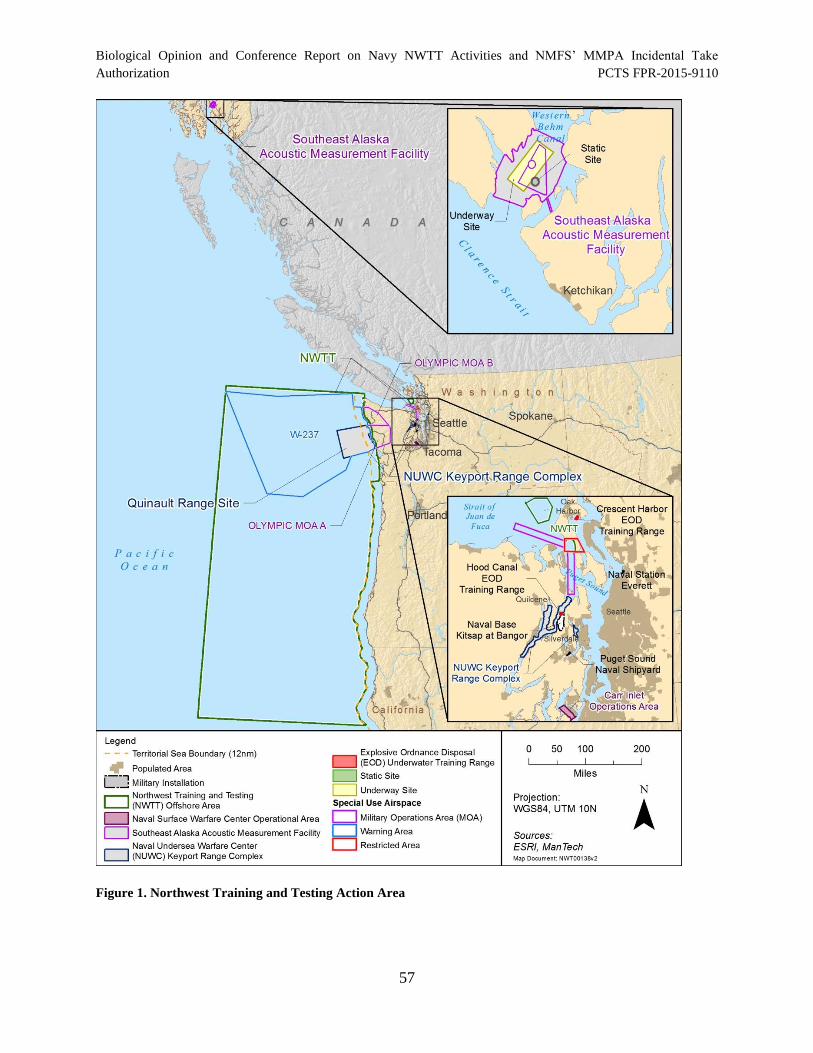
Biological Opinion and Conference Report on Navy NWTT Activities and NMFS’ MMPA Incidental Take Authorization PCTS FPR-2015-9110
Figure 1. Northwest Training and Testing Action Area
57
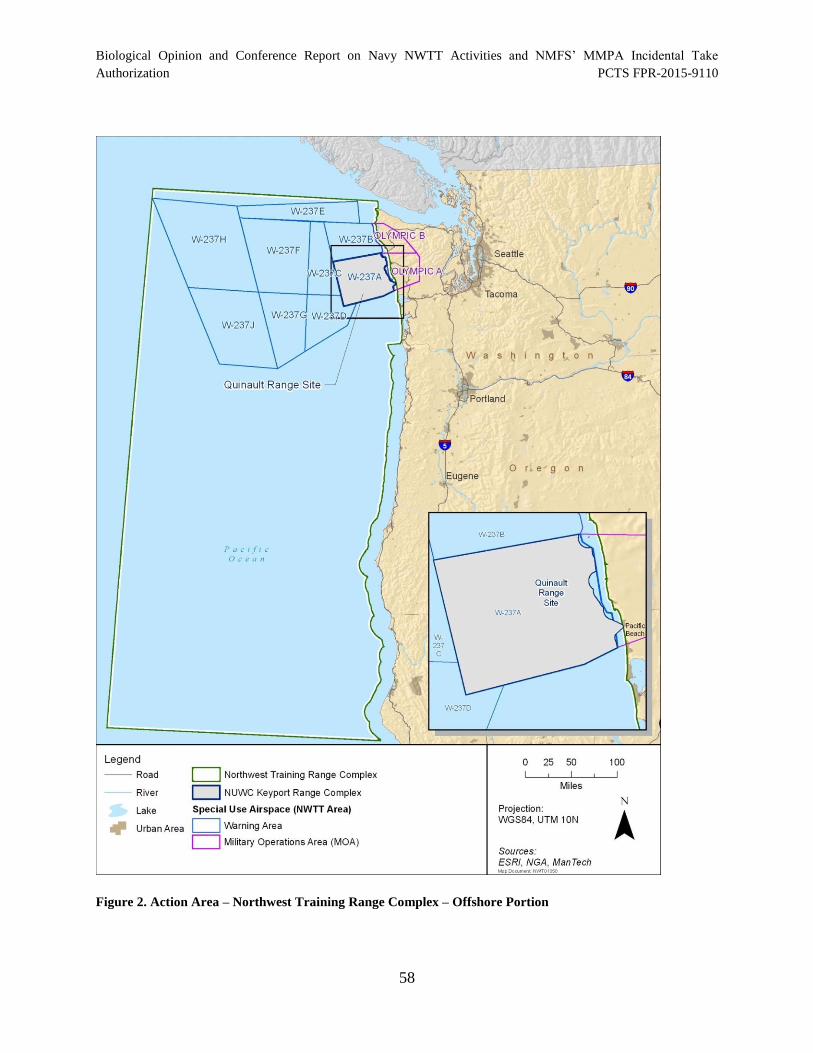
Biological Opinion and Conference Report on Navy NWTT Activities and NMFS’ MMPA Incidental Take Authorization PCTS FPR-2015-9110
Figure 2. Action Area – Northwest Training Range Complex – Offshore Portion
58
Biological Opinion and Conference Report on Navy NWTT Activities and NMFS’ MMPA Incidental Take
Authorization PCTS FPR-2015-9110
2.5.1.2 Sea and Undersea Space
The Offshore Area includes sea and undersea space approximately 510 nm in length from the
northern boundary at the mouth of the Strait of Juan de Fuca to the southern boundary at 40
degrees (°) north (N) latitude, and 250 nm in length from the coastline to the western boundary at
130° west (W) longitude. The southern boundary of 40° N latitude corresponds to the northern
boundary of Mendocino County in Northern California. Total surface area of the Offshore Area
is approximately 121,000 nm2. The Offshore Area extends to the shoreline only along the
northern portion of the Washington coast, and is 12 nm from the coastline from the southern
boundary of the Olympic MOA to Northern California, including the entire coastline of Oregon
and Northern California.
2.5.2 Inland Waters of the Action Area
The Inland Waters component of the Action Area includes air, sea, and undersea space inland of
the Pacific coastline, from buoy "J" at 48° 29.6‘ N, 125° W, eastward to include all waters of the
Strait of Juan de Fuca and the Puget Sound. None of this area extends into Oregon, California, or
Alaska. Within the Inland Waters are specific geographic components in which training and
testing occur. The Inland Waters and its component areas are described below and depicted in
Figure 3.
2.5.2.1 Air Space
Restricted Area 6701 (R-6701, Admiralty Bay) is a Restricted Area over Admiralty Bay,
Washington, with a lower limit at the ocean surface and an upper limit of 5,000 ft. This airspace
covers a total area of 56 nm2. Chinook A and B MOAs are 56 nm
2 of airspace south and west of
Admiralty Bay. The Chinook MOAs extend from 300 ft. to 5,000 ft. above the ocean surface.
2.5.2.2 Sea and Undersea Space – Explosive Ordnance Disposal Ranges
Two active EOD ranges, also used for swimmer training in Mine Countermeasures, are located
in the Inland Waters at the following locations, as depicted by Figure 3:
• NAVBASE Kitsap Bangor – Hood Canal EOD Range
• Naval Air Station (NAS) Whidbey Island (NASWI) – Crescent Harbor EOD Range
2.5.2.3 Sea and Undersea Space - Surface and Subsurface Testing Sites
There are three geographically distinct range sites in the Inland Waters where the Navy conducts
surface and subsurface testing and some limited training. The Keyport Range Site is located in
Kitsap County and includes portions of Liberty Bay and Port Orchard Reach (also known as Port
59
Biological Opinion and Conference Report on Navy NWTT Activities and NMFS’ MMPA Incidental Take
Authorization PCTS FPR-2015-9110
Orchard Narrows). The Dabob Bay Range Complex (DBRC) Site is located in Hood Canal, in
Jefferson, Kitsap, and Mason counties. The Carr Inlet OPAREA is located in southern Puget
Sound.
The Keyport Range Site is located adjacent to NAVBASE Kitsap, providing approximately 3.2
nm2
for underwater testing, including in-shore shallow water sites and a shallow lagoon to
support integrated undersea warfare systems and vehicle maintenance and engineering activities.
Water depth at the Keyport Range Site is less than 100 ft. (30 m).
Underwater tracking of test activities can be accomplished by using temporary or portable range
equipment. The Navy has conducted underwater testing at the Keyport Range Site since 1914.
The DBRC Site includes Dabob Bay and Hood Canal from 1 mi. (1.6 km) south of the Hood
Canal Bridge to the Hamma Hamma River, a total area of approximately 45.7 nm2. The Navy
has conducted underwater testing at the DBRC Site since 1956, beginning with a control center
at Whitney Point. The control center was subsequently moved to Zelatched Point.
Dabob Bay is a deep-water area in Jefferson County approximately 14.5 nm2
in size, which
contains an underwater acoustic tracking range. The acoustic tracking space within the range is
approximately 7.3 nm by 1.3 nm (9 nm2) with a maximum depth of 600 ft. (182.9 m). The Dabob
Bay tracking range, the only component of the DBRC Site with extensive acoustic monitoring
instrumentation installed on the seafloor, provides for object tracking, communications, passive
sensing, and target simulation. Many activities conducted within Dabob Bay are supported by
land-based facilities at Zelatched Point.
The Carr Inlet OPAREA is a quiet, deep-water inland range approximately 12 nm2
in size. It is
located in an arm of water between Key Peninsula and Gig Harbor Peninsula. Its southern end is
connected to the southern basin of Puget Sound. Northward, Carr Inlet OPAREA separates
McNeil Island and Fox Island as well as the Key and Gig Harbor peninsulas. The acoustic
tracking space within the range is approximately 6 nm by 2 nm with a maximum depth of 545 ft.
(166 m). The Navy previously performed underwater acoustic testing at Carr Inlet from the
1950s through 2009, at which time activities were relocated to NAVBASE Kitsap Bangor. While
no permanently installed structures are present in the Carr Inlet OPAREA, the waterway remains
a Naval Restricted Area (33 C.F.R. § 334.1250).
2.5.2.4 Sea and Undersea Space - Pierside Testing Facilities
Most of the NWTT training and testing activities occur in established training and testing ranges;
however, the Navy conducts some testing at or near Navy piers. Most pierside testing is sonar
maintenance or other type of testing conducted while ships are in port for maintenance or system
re-fitting. The Navy piers within the Action Area are all within Puget Sound and include
60

Biological Opinion and Conference Report on Navy NWTT Activities and NMFS’ MMPA Incidental Take Authorization PCTS FPR-2015-9110
NAVBASE Kitsap Bremerton in Sinclair Inlet, NAVBASE Kitsap Bangor Waterfront in Hood
Canal, and NAVSTA Everett.
2.5.2.5 Sea and Undersea Space - Navy Surface Operations Areas
In addition to the areas described above, there are two surface and subsurface operations areas
used for Navy training and testing within the Inland Waters. Navy 3 OPAREA is a surface and
subsurface area off the west coast of northern Whidbey Island. Navy 7 OPAREA is the surface
and subsurface area that lies beneath R-6701. This area covers a total area of 56 nm2.
2.5.3 Southeast Alaska Acoustic Measurement Facility – Western Behm Canal, Alaska
The Western Behm Canal is located in Southeast Alaska, near the city of Ketchikan, Alaska.
Southeast Alaska Acoustic Measurement Facility (SEAFAC) is located in the Western Behm
Canal and covers an area of 48 nm2
(Figure 4). The Navy has been conducting testing activities
at SEAFAC since 1992. The facility replaced the Santa Cruz Acoustic Range Facility in
Southern California and is now the location for some acoustic testing previously conducted at the
NSWC Carr Inlet Acoustic Range in Washington State.
SEAFAC is comprised of land-based facilities and in-water assets. The land-based facilities
located within 5.5 acres on Back Island are not a part of the Action Area, and Navy activities
occurring in this location will be or have been addressed under separate regulatory
documentation.
The in-water assets include two sites: the underway site and the static site. Bottom-moored
acoustic measurement arrays are located in the middle of the site. These instrumented arrays are
established for measuring vessel signatures when a vessel is underway (underway site) and is at
rest and moored (static site). Active acoustic sources are used for communications, range
calibration, and to provide position information for units operating submerged on the range.
The SEAFAC at-sea areas are:
• Restricted Areas 1 through 5. The five restricted areas are located within Western Behm
Canal. The main purposes of the restricted areas are to provide for vessel and public
safety, lessen acoustic encroachment from non-participating vessels, and prohibit certain
activities that could damage SEAFAC’s sensitive in-water acoustic instruments and
associated cables. Area 5 encompasses the entire SEAFAC operations area.
• Underway Measurement Site. The underway measurement site is in the center of Western
Behm Canal and is 5,000 yards (yd.) (4,572 m) wide and 12,000 yd. (10,973 m) long.
The acoustic arrays are located at the center of this area (Area 1).
61
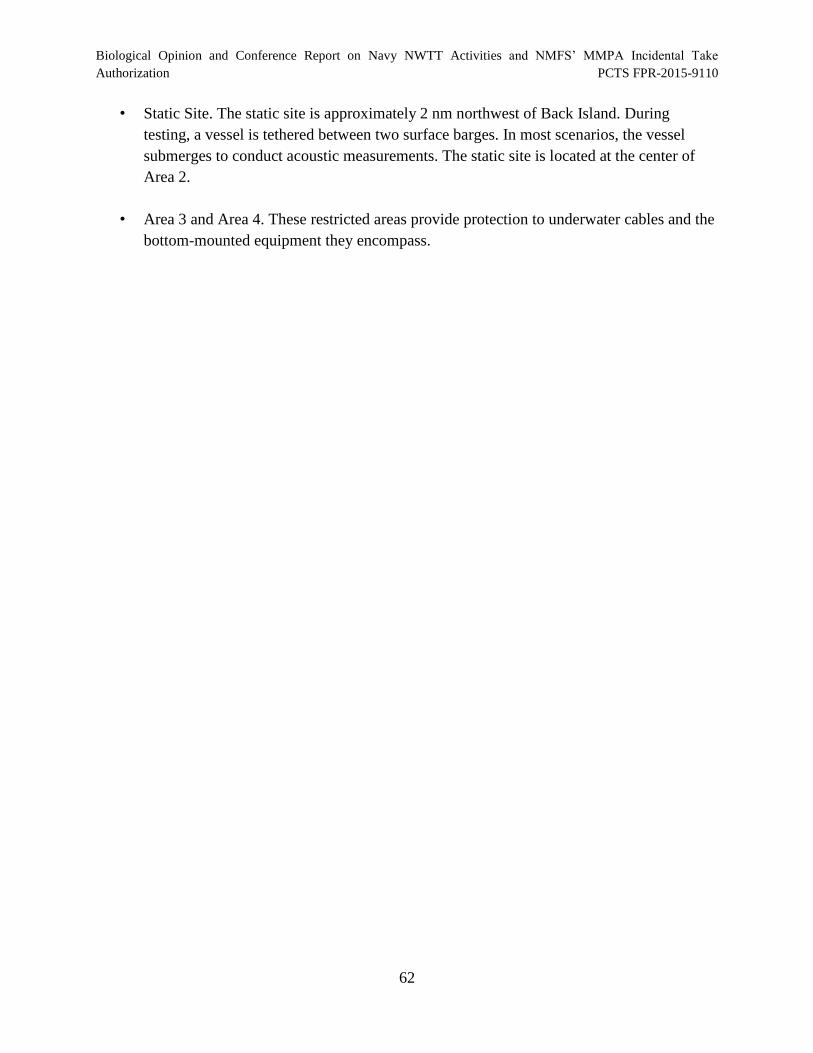
Biological Opinion and Conference Report on Navy NWTT Activities and NMFS’ MMPA Incidental Take Authorization PCTS FPR-2015-9110
• Static Site. The static site is approximately 2 nm northwest of Back Island. During
testing, a vessel is tethered between two surface barges. In most scenarios, the vessel
submerges to conduct acoustic measurements. The static site is located at the center of
Area 2.
• Area 3 and Area 4. These restricted areas provide protection to underwater cables and the
bottom-mounted equipment they encompass.
62
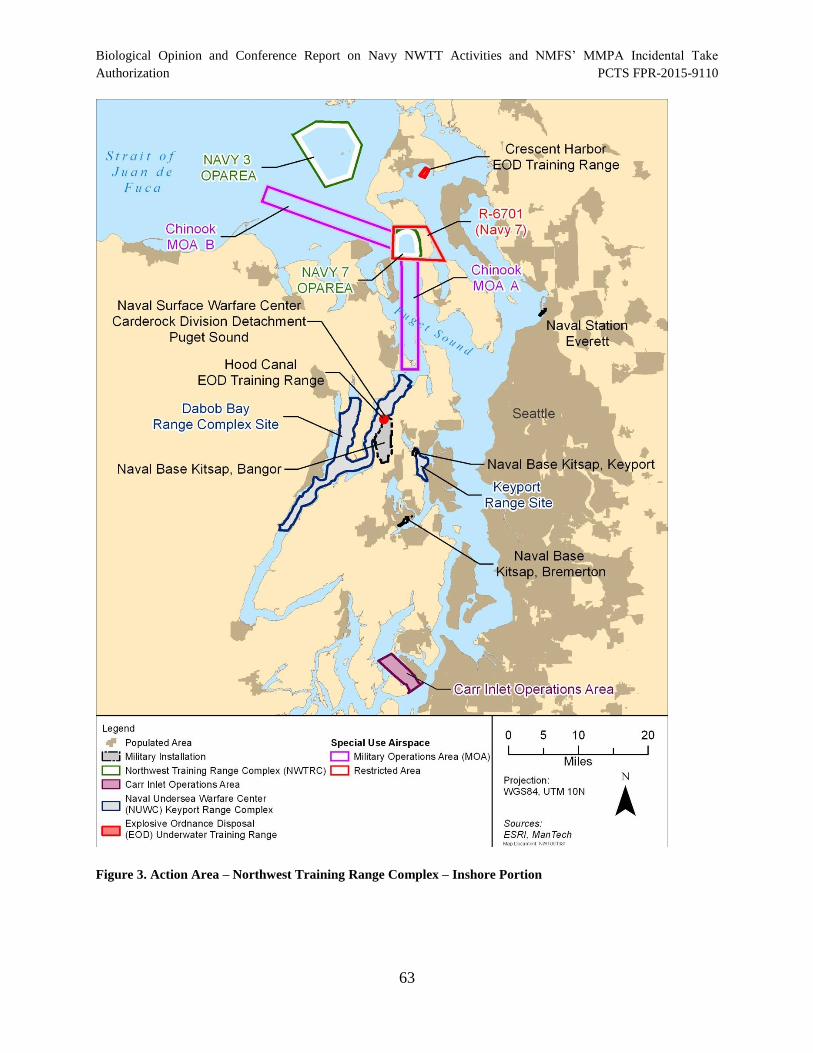
Biological Opinion and Conference Report on Navy NWTT Activities and NMFS’ MMPA Incidental Take Authorization PCTS FPR-2015-9110
Figure 3. Action Area – Northwest Training Range Complex – Inshore Portion
63
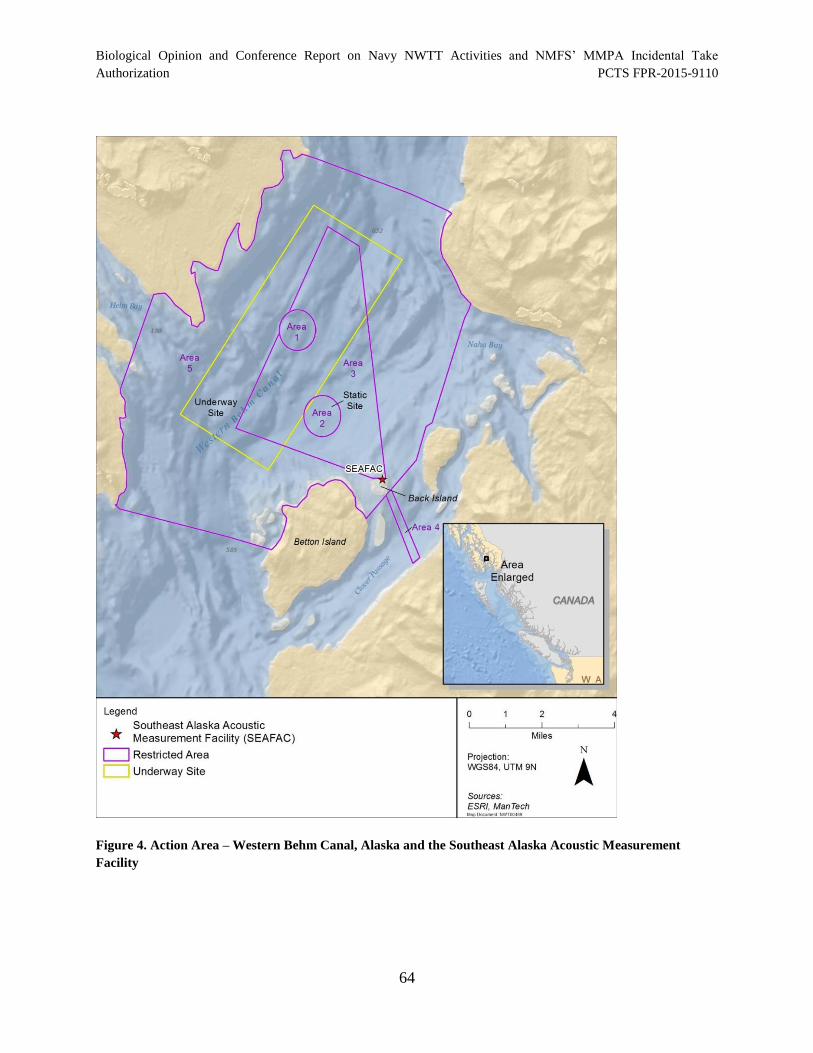
Biological Opinion and Conference Report on Navy NWTT Activities and NMFS’ MMPA Incidental Take Authorization PCTS FPR-2015-9110
Figure 4. Action Area – Western Behm Canal, Alaska and the Southeast Alaska Acoustic Measurement
Facility
64
Biological Opinion and Conference Report on Navy NWTT Activities and NMFS’ MMPA Incidental Take
Authorization PCTS FPR-2015-9110
2.6 Interrelated and Interdependent Actions
Interrelated actions are those that are part of a larger action and depend on that action for their
justification. Interdependent actions are those that do not have independent use, apart from the
action under consideration. NMFS determined that there are no interrelated actions outside the
scope of Navy training and testing activities and NMFS’ issuance of incidental take
authorizations pursuant to the MMPA as analyzed in this Opinion.
3 OVERVIEW OF NMFS’ ASSESSMENT FRAMEWORK
Section 7 (a)(2) of the ESA requires Federal agencies, in consultation with NMFS, to insure that
their actions either are not likely to jeopardize the continued existence of endangered or
threatened species; or adversely modify or destroy their designated critical habitat.
“To jeopardize the continued existence of an ESA-listed species” means to engage in an action
that reasonably would be expected, directly or indirectly, to reduce appreciably the likelihood of
both the survival and recovery of an ESA-listed species in the wild by reducing the reproduction,
numbers, or distribution of that species (50 CFR §402.02). The jeopardy analysis considers both
survival and recovery of the species.
Section 7 assessment involves the following steps:
1) We identify the proposed action and those aspects (or stressors) of the proposed action that
are likely to have direct or indirect effects on the physical, chemical, and biotic environment
within the Action Area, including the spatial and temporal extent of those stressors.
2) We identify the ESA-listed species and designated critical habitat that are likely to co-occur
with those stressors in space and time.
3) We describe the environmental baseline in the Action Area including: past and present
impacts of Federal, state, or private actions and other human activities in the Action Area;
anticipated impacts of proposed Federal projects that have already undergone formal or early
section 7 consultation, impacts of state or private actions that are contemporaneous with the
consultation in process.
4) We identify the number, age (or life stage), and gender of ESA-listed individuals that are
likely to be exposed to the stressors and the populations or subpopulations to which those
individuals belong. This is our exposure analysis.
5) We evaluate the available evidence to determine how those ESA-listed species are likely to
respond given their probable exposure. This is our response analyses.
65
Biological Opinion and Conference Report on Navy NWTT Activities and NMFS’ MMPA Incidental Take
Authorization PCTS FPR-2015-9110
6) We assess the consequences of these responses to the individuals that have been exposed, the
populations those individuals represent, and the species those populations comprise. This is
our risk analysis.
7) The adverse modification analysis considers the impacts of the proposed action on the critical
habitat features and conservation value of designated critical habitat. This opinion does not
rely on the regulatory definition of “destruction or adverse modification” of critical habitat at
50 C.F.R. 402.02. Instead, we have relied upon the statutory provisions of the ESA to complete the following analysis with respect to critical habitat.1
8) We describe any cumulative effects of the proposed action in the Action Area.
Cumulative effects, as defined in our implementing regulations (50 CFR §402.02), are the
effects of future state or private activities, not involving Federal activities, that are reasonably
certain to occur within the Action Area. Future Federal actions that are unrelated to the
proposed action are not considered because they require separate section 7 consultation.
9) We integrate and synthesize the above factors by considering the effects of the action to the
environmental baseline and the cumulative effects to determine whether the action could
reasonably be expected to:
a) Reduce appreciably the likelihood of both survival and recovery of the ESA-listed species in the wild by reducing its numbers, reproduction, or distribution; or
b) Reduce the conservation value of designated or proposed critical habitat. These
assessments are made in full consideration of the status of the species and critical habitat.
10) We state our conclusions regarding jeopardy and the destruction or adverse modification of
critical habitat.
If, in completing the last step in the analysis, we determine that the action under consultation is
likely to jeopardize the continued existence of ESA-listed species or destroy or adversely modify
designated critical habitat, we must identify a reasonable and prudent alternative (RPA) to the
action. The RPA must not be likely to jeopardize the continued existence of ESA-listed species
nor adversely modify their designated critical habitat and it must meet other regulatory
requirements.
1 Memorandum from William T. Hogarth to Regional Administrators, Office of Protected Resources, NMFS
(Application of the “Destruction or Adverse Modification” Standard Under Section 7(a)(2) of the Endangered
Species Act) (November 7, 2005).
66
Biological Opinion and Conference Report on Navy NWTT Activities and NMFS’ MMPA Incidental Take
Authorization PCTS FPR-2015-9110
3.1 Evidence Available for the Consultation
To conduct these analyses, we considered all lines of evidence available through published and
unpublished sources that represent evidence of adverse consequences or the absence of such
consequences. A considerable body of scientific information on anthropogenic sounds and their
effect on marine mammals and other marine life has become available. NMFS’ status reviews for
listed species also provide information on the status of the species including their resiliency,
population trends, and specific threats to recovery that contributes to our Status of Listed
Resources, Environmental Baseline, and Risk Analyses.
To comply with our obligation to use the best scientific and commercial data available, we
conducted electronic literature searches throughout the consultation, including within NMFS
Office of Protected Resources’ electronic library (using EndNote ® software). We examined the
literature that was cited in the submittal documents and any articles we collected through our
electronic searches. The Navy provided NMFS with a draft and final EIS/OEIS on training and
testing activities that are proposed in the Action Area. We also evaluated the Navy’s annual and
comprehensive monitoring reports required by the existing MMPA rule and LOAs and the
previous biological opinion to assess the effectiveness of mitigation and actual take incidental to
training and testing activity levels where feasible. In addition, we engage regularly with the Navy
to discuss new science and technical issues as part of the ongoing adaptive management program
for Navy training and testing.
Considering the information that was available, this consultation and our Opinion includes
uncertainty about the basic hearing capabilities of some marine mammals, sea turtles, and fishes;
how these taxa use sounds as environmental cues; how they perceive acoustic features of their
environment; the importance of sound to the normal behavioral and social ecology of species; the
mechanisms by which human-generated sounds affect the behavior and physiology (including
the non-auditory physiology) of exposed individuals; and the circumstances that are likely to
produce outcomes that have adverse consequences for individuals and populations of exposed
species.
3.1.1 Consideration of new literature and pending Acoustic Guidance on the Effects of
Anthropogenic Sound on Marine Mammals
NOAA is currently in the process of developing Acoustic Guidance on thresholds for onset of
auditory impacts from exposure to sound, which will be used to support assessments of the
effects of anthropogenic sound on marine mammals. To develop this Guidance, NOAA is
compiling, interpreting, and synthesizing the best information currently available on the effects
of anthropogenic sound on marine mammals, and is committed to finalizing the Guidance
through a systematic, transparent process that involves internal review, external peer review, and
public comment.
67
Biological Opinion and Conference Report on Navy NWTT Activities and NMFS’ MMPA Incidental Take
Authorization PCTS FPR-2015-9110
In December 2013, NOAA released for public comment a “Draft Guidance for Assessing the
Effects of Anthropogenic Sound on Marine Mammals: Acoustic Threshold Levels for Onset of
Permanent and Temporary Threshold Shifts” (National Oceanic and Atmospheric Administration
2013c; 78 Federal Register [FR] 78822). The Draft Guidance was generally consistent with the
Navy’s PTS/TTS criteria used in the NWTT EIS/OEIS and detailed within Finneran and Jenkins
(2012). Prior to the finalization of this guidance by NOAA, the Navy suggested revisions to the
criteria (e.g., auditory weighting functions and PTS/TTS thresholds) based on a number of newly
available studies. In January 2015, the Navy submitted a draft proposal (Finneran 2015) to
NOAA staff for their consideration.
Finneran (2015) proposed new weighting functions and thresholds for predicting PTS/TTS in
marine mammals. The methodologies presented within this paper build upon the methodologies
used to develop the criteria used within the Navy’s EIS/OEIS (Finneran and Jenkins 2012) and
incorporate relevant auditory research made available since 2012. While Finneran and Jenkins
(2012) presented a conservative approach to development of auditory weighting functions where
data was limited, Finneran (2015) synthesizes a wide range of auditory data, including newly
available studies, to predict refined auditory weighting functions and corresponding TTS
thresholds across the complete hearing ranges of functional hearing groups. Finneran (2015) also
developed updated threshold shift growth functions to facilitate the development of new PTS
thresholds.
During the development process of NOAA’s Draft Guidance, NOAA chose to incorporate
Finneran (2015) into its Draft Guidance prior to its finalization. As a result, the Navy’s proposal
(Finneran 2015) was submitted for peer review by external subject matter experts, in accordance
with the process previously conducted for NOAA’s Draft Guidance. Peer review comments were
received by NOAA in April 2015. NOAA subsequently developed a Peer Review Report, which
was published on its website on 31 July 2015. The published report documents the Navy’s
proposal (Finneran 2015) that underwent peer review, the peer-review comments, and NOAA’s
responses to those comments. NOAA then incorporated this information into revised Draft
Guidance which was recently published in the Federal Register for public review and comment
(80 FR 45642). The auditory weighting functions and PTS/TTS thresholds provided in that
revised Draft Guidance will not be adopted by NOAA or applied to applicants until the revised
Draft Guidance is issued as final guidance. At the time of this consultation, a second public
comment period has closed, though final guidance has not been issued. Therefore, the Navy has
not adopted these proposed criteria in its Final EIS/OEIS. However, the underlying science
contained within Finneran (2015) has been addressed qualitatively within the applicable sections
of the Final EIS/OEIS and this Opinion.
If the proposed criteria in Finneran (2015) were adopted by NOAA, incorporated into its Final
Guidance, and applied to the Navy in the future, predicted numbers of PTS/TTS would change
for most functional hearing groups. However, because Finneran (2015) relies on much of the
68
Biological Opinion and Conference Report on Navy NWTT Activities and NMFS’ MMPA Incidental Take
Authorization PCTS FPR-2015-9110
same data as the auditory criteria presented in the Navy’s NWTT EIS/OEIS, these changes
would not be substantial, and in most cases would result in a reduction in the predicted impacts.
Predicted PTS/TTS would be reduced over much to all of their hearing range for low-frequency
cetaceans and phocids. Predicted PTS/TTS for mid-frequency and high-frequency cetaceans
would be reduced for sources with frequencies below about 3.5 kHz and remain relatively
unchanged for sounds above this frequency. Predicted auditory effects on otariids would increase
for frequencies between about 1 kHz and 20 kHz and decrease for frequencies above and below
these points, although otariids remain the marine mammals with the least sensitivity to potential
PTS/TTS. Overall, predicted auditory effects within this Opinion would not change significantly.
In summary, NOAA’s continued evaluation of all available science for the Acoustic Guidance
could result in changes to the acoustic criteria used to model the Navy’s activities for this
consultation, and, consequently, the enumerations of “take” estimates. However, consideration of
the revised Draft Guidance and information contained in Finneran (2015) does not alter our
assessment of the likely responses of affected ESA-listed species to acoustic sources employed
by Navy in the NWTT Action Area, or the likely fitness consequences of those responses.
Since the Navy’s Phase 2 modeling (the NAEMO model considered in this Opinion), there have
been several studies on marine mammal TTS (e.g., (Finneran et al. 2005a; Finneran et al. 2010;
Finneran and Schlundt 2013; Kastelein et al. 2012a; Kastelein et al. 2012d; Kastelein et al.
2014a; Kastelein et al. 2014d; Popov et al. 2013a; Popov et al. 2011)) (Table 9).
3.1.1.1 Mid-frequency Cetaceans
The results from Finneran and Schlundt (2013) demonstrate there are frequency-specific
differences by species in TTS onset and growth, and suggest increased susceptibility to auditory
fatigue for frequencies between approximately 10 kHz and 30 kHz. This study supports the
importance of using auditory weighting functions (i.e., functional hearing groups are more
susceptible to noise-induced hearing loss at certain frequencies), but is not expected to change
any of the thresholds to onset TTS between those the Navy used in this consultation and the
pending Acoustic Guidance (A. Scholik-Schlomer, personal communication, March 26, 2015).
Popov et al. (2013a) and Popov et al. (2014) examined the impacts of half-octave band noise on
hearing in two belugas. In their 2013 study, levels beyond TTS onset were induced (i.e.,
threshold shifts ranged from 7.5 to 62.5 dB) with recovery occurring within 24 h. In their 2014
study, TTS onset was identical to that of a beluga from another study (i.e., NOC from Schlundt
et al. (2000a); i.e., these studies are not expected to result in any changes to the thresholds).
3.1.1.2 High-frequency Cetaceans
All the recent TTS studies on harbor porpoises were completed by Kastelein using the same
individual exposed to either octave band noise (Kastelein et al. 2012a), tones (Kastelein et al.
69
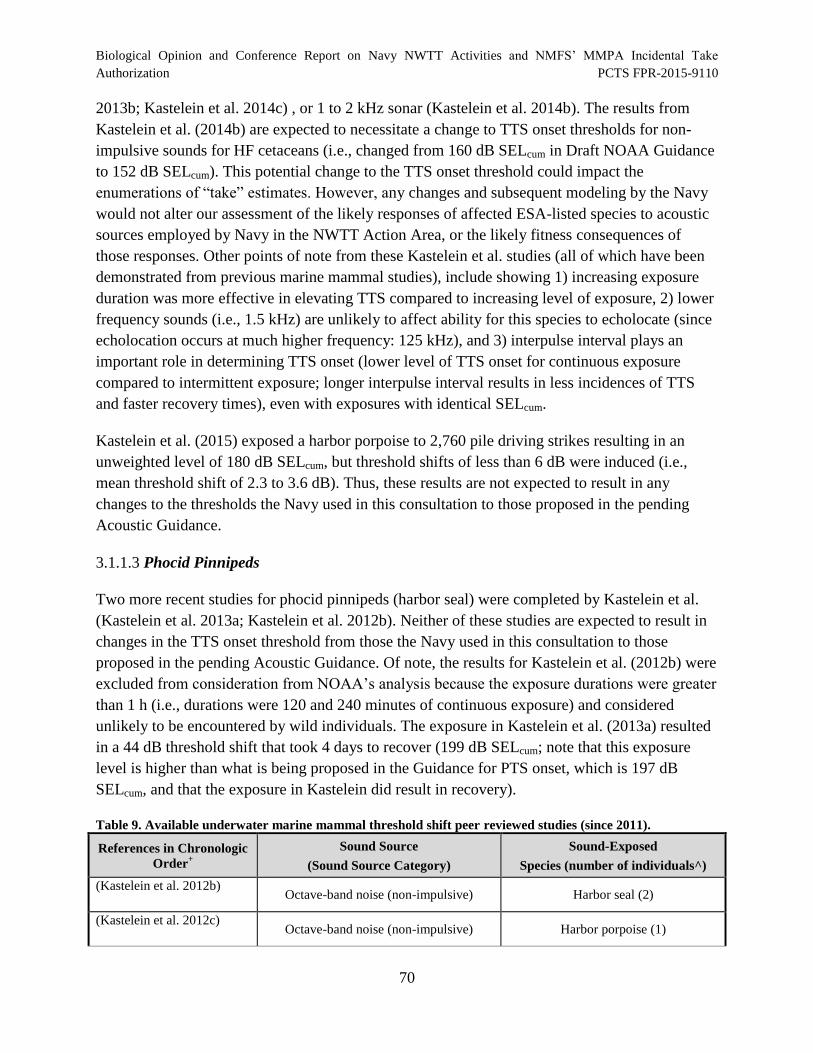
Biological Opinion and Conference Report on Navy NWTT Activities and NMFS’ MMPA Incidental Take
Authorization PCTS FPR-2015-9110
2013b; Kastelein et al. 2014c) , or 1 to 2 kHz sonar (Kastelein et al. 2014b). The results from
Kastelein et al. (2014b) are expected to necessitate a change to TTS onset thresholds for non-
impulsive sounds for HF cetaceans (i.e., changed from 160 dB SELcum in Draft NOAA Guidance
to 152 dB SELcum). This potential change to the TTS onset threshold could impact the
enumerations of “take” estimates. However, any changes and subsequent modeling by the Navy
would not alter our assessment of the likely responses of affected ESA-listed species to acoustic
sources employed by Navy in the NWTT Action Area, or the likely fitness consequences of
those responses. Other points of note from these Kastelein et al. studies (all of which have been
demonstrated from previous marine mammal studies), include showing 1) increasing exposure
duration was more effective in elevating TTS compared to increasing level of exposure, 2) lower
frequency sounds (i.e., 1.5 kHz) are unlikely to affect ability for this species to echolocate (since
echolocation occurs at much higher frequency: 125 kHz), and 3) interpulse interval plays an
important role in determining TTS onset (lower level of TTS onset for continuous exposure
compared to intermittent exposure; longer interpulse interval results in less incidences of TTS
and faster recovery times), even with exposures with identical SELcum.
Kastelein et al. (2015) exposed a harbor porpoise to 2,760 pile driving strikes resulting in an
unweighted level of 180 dB SELcum, but threshold shifts of less than 6 dB were induced (i.e.,
mean threshold shift of 2.3 to 3.6 dB). Thus, these results are not expected to result in any
changes to the thresholds the Navy used in this consultation to those proposed in the pending
Acoustic Guidance.
3.1.1.3 Phocid Pinnipeds
Two more recent studies for phocid pinnipeds (harbor seal) were completed by Kastelein et al.
(Kastelein et al. 2013a; Kastelein et al. 2012b). Neither of these studies are expected to result in
changes in the TTS onset threshold from those the Navy used in this consultation to those
proposed in the pending Acoustic Guidance. Of note, the results for Kastelein et al. (2012b) were
excluded from consideration from NOAA’s analysis because the exposure durations were greater
than 1 h (i.e., durations were 120 and 240 minutes of continuous exposure) and considered
unlikely to be encountered by wild individuals. The exposure in Kastelein et al. (2013a) resulted
in a 44 dB threshold shift that took 4 days to recover (199 dB SELcum; note that this exposure
level is higher than what is being proposed in the Guidance for PTS onset, which is 197 dB
SELcum, and that the exposure in Kastelein did result in recovery).
Table 9. Available underwater marine mammal threshold shift peer reviewed studies (since 2011).
References in Chronologic
Order+
Sound Source
(Sound Source Category)
Sound-Exposed
Species (number of individuals^)
(Kastelein et al. 2012b) Octave-band noise (non-impulsive) Harbor seal (2)
(Kastelein et al. 2012c) Octave-band noise (non-impulsive) Harbor porpoise (1)
70

Biological Opinion and Conference Report on Navy NWTT Activities and NMFS’ MMPA Incidental Take Authorization PCTS FPR-2015-9110
References in Chronologic
Order+
Sound Source
(Sound Source Category)
Sound-Exposed
Species (number of individuals^)
(Finneran and Schlundt
2013) Tones (non-impulsive) Bottlenose dolphin (2)
(Popov et al. 2013b) Half-octave band noise (non-impulsive) Beluga (2)
(Kastelein et al. 2013a) Octave-band noise (non-impulsive) Harbor seal (1)
(Kastelein et al. 2013b) Tone (non-impulsive) Harbor porpoise (1)
(Popov et al. 2014) Half-octave band noise (non-impulsive) Beluga (2)
(Kastelein et al. 2014b) 1-2 kHz sonar (non-impulsive) Harbor porpoise (1)
(Kastelein et al. 2014c) 6.5 kHz tone (non-impulsive) Harbor porpoise (1)
(Kastelein et al. 2015) Impact pile driving (impulsive) Harbor porpoise (1)
Kastelein et al. unpublished+
Impact pile driving (impulsive) Harbor seal (2)
Finneran et al. in press+
Multiple airgun shots (impulsive) Bottlenose dolphin (3)
+Peer reviewed studies available and evaluated as of 4 April 2015. Note: Two papers expected to publish in the near future. However, for
all these studies, a TS could not be induced. Thus, neither study affects the acoustic threshold levels and are instead included for
completeness.
^Note: Some individuals have been used in multiple studies.
3.1.2 The Navy’s Exposure Estimates
To estimate exposure of marine mammal and sea turtle to acoustic sounds, the Navy uses
acoustic modeling and marine mammal and sea turtle density information developed by the Navy
in cooperation with NMFS. A subsequent review on behalf of NMFS by the Center for
Independent Experts analyzed the various approaches the Navy used for acoustic effects
analyses, leading to the refinement of the previous methodologies for determining acoustic
effects. The result was the development of a standard Navy model for acoustic effects, the Navy
Acoustic Effects Model (NAEMO).
This Opinion analyzes the environmental consequences based on marine mammal density data,
and acoustic modeling methodology that employs acoustic criteria, and new scientific
information as summarized below.
3.1.2.1 The Navy Acoustic Effects Model (NAEMO)
Since 1997, the Navy has modeled the potential acoustic effects on marine mammals and sea
turtles from Navy training and testing activities. Various models used “area density” approaches
71
Biological Opinion and Conference Report on Navy NWTT Activities and NMFS’ MMPA Incidental Take
Authorization PCTS FPR-2015-9110
in which acoustic footprints were computed and then multiplied by animal densities to calculate
effects. As a result of a review conducted by the Center for Independent Experts, the Navy
refined its process. The current model—the Navy Acoustic Effects Model (NAEMO)—is the
model used by the Navy to estimate the potential acoustic effects of proposed Navy training and
testing activities on marine mammals and sea turtles. We have verified methodology and data
used in NAEMO and accept the modeling conclusions on exposure of marine species. A detailed
discussion of the NAEMO is contained in chapter 3.4.3.1.6 of the EIS/OEIS, which is
incorporated by reference. A full description of NAEMO can be accessed in the Naval Undersea
Warfare Center Newport Technical Report 12,071a, August 23, 2013 (updated from March 12,
2012).
3.1.2.1.1 Overview
NAEMO is comprised of seven modules: Scenario Builder, Environment Builder, Acoustic
Builder, Marine Species Distribution Builder, Scenario Simulator, Post Processor, and Report
Generator. Scenario Builder defines where an activity would occur, the duration of the activity, a
description of the activity, and what platforms would be participating. Once a platform is
identified, all the sound sources typically associated with that platform are displayed, thus
providing standardization and repeatability when different analysts are entering data. Individual
sources can be turned on or off according to the requirements of the scenario. Platforms are
either stationary or can be moved through the Action Area in either a defined track or random
straight-line movement.
Environment Builder extracts all of the oceanographic and environmental data required for a
scenario simulation. When an area is selected, information on bathymetry, sound speed profiles,
wind speeds, and bottom properties are extracted from an array of points across the region.
Acoustic Builder generates acoustic propagation data. It reads the Scenario Builder file, allows
the user to define analysis points for propagation software, and creates the propagation model
inputs. Depending on the source characteristics, the propagation models utilized are
Comprehensive Acoustic Simulation System/Gaussian Ray Bundle , Range-Dependent Acoustic
Model , or Reflection and Refraction Multilayered Ocean/Ocean Bottoms with Shear Wave
Effects (REFMS).
Marine Species Distribution Builder allows the user to distribute marine species within the
modeling environment in accordance with the bathymetry and relevant descriptive data. Marine
species density data, which include seasonal information when available, are obtained from the
Navy Marine Species Density Database (NMSDD); the sizes of cells and density of marine
species within each cell vary by species and location.
Scenario Simulator executes the simulation and records the sound received by each marine
mammal and sea turtle in the area. It incorporates the scenario definition, sound propagation
72
Biological Opinion and Conference Report on Navy NWTT Activities and NMFS’ MMPA Incidental Take
Authorization PCTS FPR-2015-9110
data, and marine species distribution data and ultimately provides raw data output for each
simulation. Most scenarios are run in 4- to 12-hour segments based on representative training
and testing activities. Some scenarios are evaluated by platform and single locations, while
others are evaluated in multiple locations within a single range complex or testing range. Within
each scenario, multiple ship track iterations are run to provide a set of raw data results.
Post Processor provides the computation of estimated effects that exceed defined threshold
criteria from each of the raw data files produced by Scenario Simulator. The post-processed
computations determine harassment and mortality as defined by the MMPA for military
readiness activities. It also tabulates and graphs the output data for review.
Report Generator assembles a series of simulation results from multiple post-processing runs and
produces a combined result. Multipliers can be applied to each scenario to compute the effects of
conducting them multiple times. Results can also be exported via Microsoft Excel files for
further analysis and reporting.
Modeled effects from NAEMO were used to support the Navy’s analyses in the NWTT
EIS/OEIS, mitigation strategies, Biological Evaluations, and MMPA incidental take
authorization applications. We have verified methodology and data used in NAEMO and accept
the modeling conclusions on exposure of marine species. A full description of NAEMO can be
accessed in the Naval Undersea Warfare Center Newport Technical Report 12,071a, August 23,
2013 (updated from March 12, 2012). The following paragraphs provide an overview of the
NAEMO process and its more critical data inputs.
The NAEMO improves upon previous modeling efforts in several ways. First, unlike earlier
methods that modeled acoustic sources individually, the NAEMO has the capability to run all
sources within a scenario simultaneously, providing a more realistic depiction of the potential
effects of an activity. Second, previous models calculated sound received levels within set
volumes of water and spread animals uniformly across the volumes; in the NAEMO, animats
(virtual animals) are distributed non-uniformly based on higher resolution species-specific
density, depth distribution, and group size, and animats serve as dosimeters, recording energy
received at their location in the water column. Third, a fully three-dimensional environment is
used for calculating sound propagation and animat exposure in the NAEMO, rather than a two-
dimensional environment where the worst case sound pressure level across the water column is
always encountered. Additionally, NAEMO expands upon previous modelling efforts by
incorporating Type II frequency weighting functions, incorporating a behavioral response
function, and developing estimates from a new density function (NMSDD). Finally, current
efforts incorporate site-specific bathymetry, sound speed profiles, wind speed, and bottom
properties into the propagation modeling process rather than the flat-bottomed provinces used
during earlier modeling (NUWC 2012).
73

Biological Opinion and Conference Report on Navy NWTT Activities and NMFS’ MMPA Incidental Take
Authorization PCTS FPR-2015-9110
Using data from the NMSDD, the NAEMO derives an abundance (total number of individuals
(i.e., animats)) for the modeled area. The NAEMO then distributes the animats into an area
bounded by the maximum distance acoustic energy propagates out to a threshold value (energy
footprint). For example, for non-impulsive sources, animats that could receive sound pressure
levels greater than or equal to 120 dB are distributed. Animats are distributed based on density
differences across the area, the group (pod) size, and known depth distributions (dive profiles)
(see Marine Species Modeling Team (2013) for a discussion of animal dive profiles in detail).
Animats change depths every 4 minutes but do not otherwise mimic actual animal behaviors,
such as avoidance or attraction to a stimulus (horizontal movement), or foraging, social, or
traveling behaviors.
Schecklman et al. (2011) argue static distributions underestimate acoustic exposure compared to
models with three-dimensionally moving animals. Their static method is different from the
NAEMO in several ways. First, they distribute the entire population at a depth -typical for that
species and those animats remain static at that position throughout the entire simulation. In the
NAEMO, animats are placed horizontally dependent on non-uniform density information, and
then move vertically over time based on species-specific diving behavior. Second, the static
method calculates acoustic received level for designated volumes of the ocean and then sums the
animats that occur within that volume, rather than using the animats themselves as dosimeters, as
in the NAEMO. Third, Schecklman et al. (2011) ran 50 iterations of the moving distribution to
arrive at an average number of exposures, but because they rely on uniform horizontal density
(and static depth density) only a single iteration of the static distribution is realized. In addition
to moving the animats vertically, the NAEMO overpopulates the animats over a non-uniform
density and then resamples the population a number of times to arrive at an average number of
exposures. Tests comparing fully moving animats and horizontally static animats with vertical
mobility were compared during development of the NAEMO. For vertical position updates
occurring more frequently than every 5 minutes, the number of estimated exposures was similar
between the NAEMO and the fully moving distribution; however, computational time was much
longer for the fully moving distribution.
The NAEMO calculates the likely propagation for various levels of energy (sound or pressure)
resulting from each non-impulse or impulse source used during a training or testing event. These
calculations account for bathymetric relief and bottom types (e.g., reflective), estimated sound
speeds, and sea surface roughness. Platforms (such as a ship using one or more sound sources)
are modeled moving across an area representative of what would normally occur during a
training or testing scenario. The model uses typical platform speeds and event durations. Moving
source platforms either travel along a predefined track or move in straight lines from a random
initial starting point, reflecting at the edges of a predefined boundary. Static sound sources are
stationary in a fixed location for the duration of a scenario. Modeling locations were chosen
based on historical data where activities have been ongoing and to include environmental
variation within the Study.
74
Biological Opinion and Conference Report on Navy NWTT Activities and NMFS’ MMPA Incidental Take
Authorization PCTS FPR-2015-9110
The NAEMO records the energy received by each animat within the energy footprint of the
event and calculates the number of animats having received levels of energy exposures that fall
within defined impact thresholds.
Predicted effects on the animats are tallied and the most severe effect (e.g., PTS over TTS)
predicted for a given animat is assumed. Each scenario, or each 24-hour period for scenarios
lasting greater than 24 hours, is independent of all others. Therefore, the same individual could
be impacted during each independent scenario or 24-hour period. In few instances, although the
activities themselves all occur within the NWTT Study Area, sound may propagate beyond the
boundary of the Study Area. Any exposures occurring outside the boundary of the Study Area
are counted as if they occurred within the Study Area boundary or within the Action Area for
this Opinion.
3.1.2.1.2 Model Assumptions
There are limitations to the data used in the NAEMO, and the results must be interpreted within
these context. While the most accurate data and input assumptions have been used, when there is
a lack of definitive data to support an aspect of the modeling, assumptions assumed to
overestimate exposures have been chosen:
Animats are modeled as being underwater, stationary, and facing the source and therefore always
predicted to receive the maximum sound level (i.e., no porpoising or pinnipeds’ heads above
water). Some odontocetes have been shown to have directional hearing, with best hearing
sensitivity facing a sound source and higher hearing thresholds for sounds propagating towards
the rear or side of an animal (Mooney et al. 2008) (Popov and Supin 2009) (Kastelein et al.
2009)
Animats do not move horizontally (but change their position vertically within the water
column), which may overestimate physiological effects such as hearing loss, especially
for slow moving or stationary sound sources in the model.
Animats are stationary horizontally and therefore do not avoid the sound source, unlike in
the wild where animals would most often avoid exposures at higher sound levels,
especially those exposures that may result in PTS.
Animats are assumed to receive the full impulse of the initial positive pressure wave of
an explosion, although the impulse-based thresholds (onset mortality and onset slight
lung injury) assume an impulse delivery time adjusted for animal size and depth.
Therefore, these impacts are overestimated at farther distances and increased depths.
Multiple exposures within any 24-hour period are considered one continuous exposure
for the purposes of calculating the temporary or permanent hearing loss, because there are
75
Biological Opinion and Conference Report on Navy NWTT Activities and NMFS’ MMPA Incidental Take Authorization PCTS FPR-2015-9110
not sufficient data to estimate a hearing recovery function for the time between
exposures.
Mitigation measures implemented during training and testing activities were not considered in the model. In reality, sound-producing activities would be reduced, stopped, or delayed if marine mammals are detected within the mitigation zones.
3.1.3 Criteria for Assessing Effects to Fish from Sonar
This section details sound exposure criteria for fishes from sonar that were proposed by the Navy
and agreed to by NMFS for this consultation. These criteria were largely derived from the
extensive review provided in Popper et al. (2014) “Sound Exposure Guidelines for Fishes and
Sea Turtles”. Thresholds within that technical report are generally presented at the lowest level at
which the effect occurred. In some cases the thresholds presented in Popper et al. (2014) did not
show any effect but are the only data available for that stressor. Therefore, these guidelines may
be overly conservative. A description of each cell is presented below to explain the derivation of
the threshold value proposed. For additional information on the methodology used to develop
these criteria, see Renken (2015).
Thresholds for TTS are typically reported in cumulative sound exposure level (SELcum) so as to
account for the duration of the exposure and therefore are presented in terms of SELcum metric.
Acoustic Units
SELcum ‐ Cumulative sound exposure level (dB re 1 µPa2∙s)
SPLrms ‐ Root mean square sound pressure level (dB re 1 µPa)
SPLpeak ‐ Peak (0 – peak) sound pressure level (dB re 1 µPa)
Acoustic Calculations (see Richardson 1995)
SELcum = SPLrms + 10 log t
Where t = duration of exposure in seconds
76
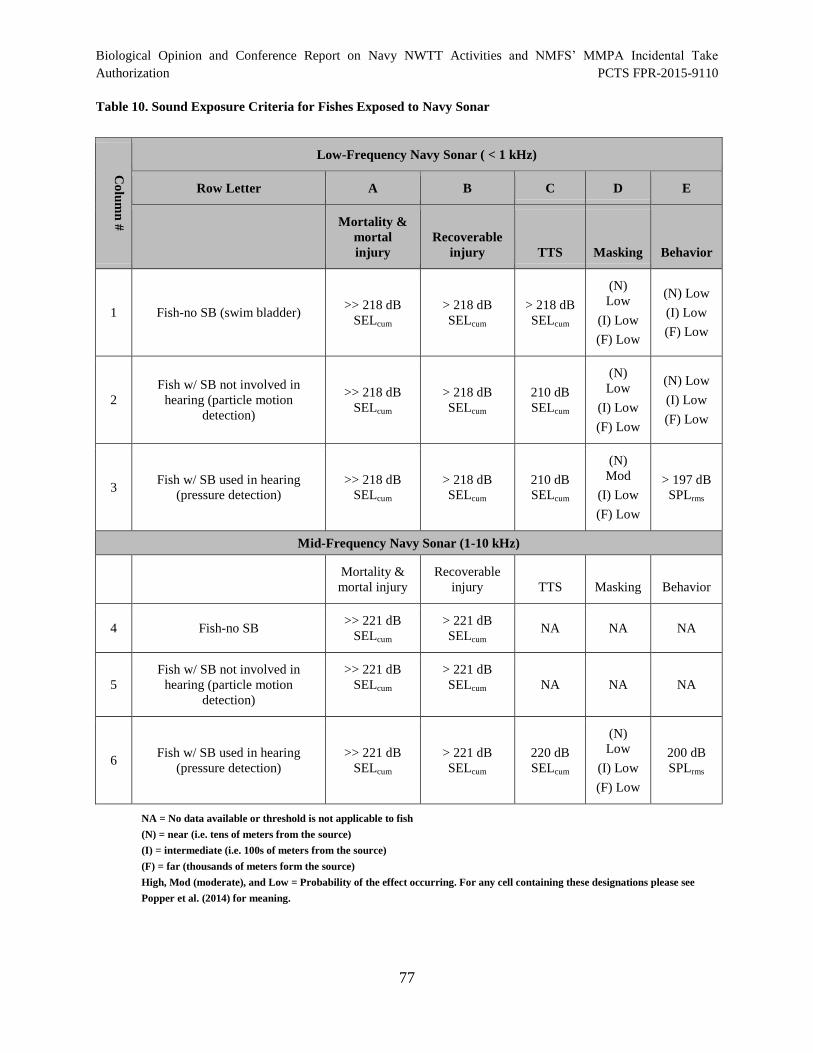
Biological Opinion and Conference Report on Navy NWTT Activities and NMFS’ MMPA Incidental Take Authorization PCTS FPR-2015-9110
Table 10. Sound Exposure Criteria for Fishes Exposed to Navy Sonar
Co
lum
n #
Low-Frequency Navy Sonar ( < 1 kHz)
Row Letter A B C D E
Mortality &
mortal
injury
Recoverable
injury TTS Masking Behavior
1 Fish-no SB (swim bladder) >> 218 dB
SELcum
> 218 dB
SELcum
> 218 dB
SELcum
(N)
Low
(I) Low
(F) Low
(N) Low
(I) Low
(F) Low
2
Fish w/ SB not involved in
hearing (particle motion
detection)
>> 218 dB
SELcum
> 218 dB
SELcum
210 dB
SELcum
(N)
Low
(I) Low
(F) Low
(N) Low
(I) Low
(F) Low
3 Fish w/ SB used in hearing
(pressure detection)
>> 218 dB
SELcum
> 218 dB
SELcum
210 dB
SELcum
(N)
Mod
(I) Low
(F) Low
> 197 dB
SPLrms
Mid-Frequency Navy Sonar (1-10 kHz)
Mortality &
mortal injury
Recoverable
injury TTS Masking Behavior
4 Fish-no SB >> 221 dB
SELcum
> 221 dB
SELcum NA NA NA
5
Fish w/ SB not involved in
hearing (particle motion
detection)
>> 221 dB
SELcum
> 221 dB
SELcum NA NA NA
6 Fish w/ SB used in hearing
(pressure detection)
>> 221 dB
SELcum
> 221 dB
SELcum
220 dB
SELcum
(N)
Low
(I) Low
(F) Low
200 dB
SPLrms
NA = No data available or threshold is not applicable to fish
(N) = near (i.e. tens of meters from the source)
(I) = intermediate (i.e. 100s of meters from the source)
(F) = far (thousands of meters form the source)
High, Mod (moderate), and Low = Probability of the effect occurring. For any cell containing these designations please see
Popper et al. (2014) for meaning.
77
Biological Opinion and Conference Report on Navy NWTT Activities and NMFS’ MMPA Incidental Take
Authorization PCTS FPR-2015-9110
3.1.3.1 Low‐Frequency NavySonar
3.1.3.1.1 Mortality, Mortal Injury, and Recoverable Injury All Fish = > 218 dB SELcum (cells
A1, A2, A3, B1, B2 & B3 in Table 10 above)
Sonar has not been known to cause mortality, mortal injury, or recoverable injury to fish in the
wild due to lack of fast rise times, lack of high peak pressures, and lack of high acoustic impulse
associated with some impulsive sounds (e.g., explosives). Long duration exposures (up to 2
hours) of sonar to fish in laboratory settings has caused stunning and mortality in some cases but
these exposures were much longer than any exposure a fish would normally encounter in the
wild due to NWTT proposed activities. In addition, the subjects exposed in the lab were held in a
cage for the duration of the exposure, unable to avoid the source (Hastings 1991; Hastings
1995a). Exposure to low‐frequency sonar has been tested at levels up to 193 dB SPL (rms) for
324 seconds (218 dB SELcum) and has not been shown to cause mortality or any injury in fish
with swim bladders (Kane et al. 2010; Popper et al. 2007). Lesser potential for injurious effects
would be expected for fish without air cavities (i.e., swim bladders). Therefore the recommended
threshold would be >> 218 dB SELcum for mortality and > 218 dB SELcum for recoverable
injury.
3.1.3.1.2 Temporary Threshold Shift, Fish‐no SB = > 218 dB SELcum (cell C1 in Table 10
above)
Exposure to low‐frequency sonar has not been shown to induce TTS in fish species without swim
bladders (Popper et al. 2014).
3.1.3.1.3 Temporary Threshold Shift, Fish w/ SB = 210 dB SELcum (cells C2 & C3 in Table
10 above)
Exposure to sonar above 1 kHz has been known to induce TTS in some fish species with swim
bladders (Halvorsen et al. 2012; Popper et al. 2007). Subjects from Popper et al. (2007) may
have undergone varying husbandry treatments or possessed different genetics which may have
resulted in higher than normal shifts. Criteria provided in Popper (2014) were reported in dB
SPLrms. This criteria was converted to SEL based on the signal durations reported in Popper et
al. (2007) and Halvorsen et al. (2012) and was rounded down from the lowest sound exposure
level as a conservative measure.
193dB SPLrms + 10log(324 sec) = 218 dB SELcum (Popper et al. 2007)
78
Biological Opinion and Conference Report on Navy NWTT Activities and NMFS’ MMPA Incidental Take
Authorization PCTS FPR-2015-9110
3.1.3.1.4 Masking, Fish w/out SB and Fish w/ SB not involved in hearing = (N)Low, (I)Low,
(F)Low (cells D1 &, D2 in Table 10 above)
No data are available on masking by sonar but it is unlikely that sonar would mask important
sounds for fish. Risk of significant masking occurring within any distance from the source is low
(Popper et al. 2014). The narrow bandwidth of most sonar would result in only a limited range of
frequencies being masked (Popper et al. 2014). Furthermore most sonars are intermittent (i.e.,
low duty cycle) which further lowers the probability of any masking effects.
3.1.3.1.5 Masking, Fish w/ SB involved in hearing = (N)Mod, (I)Low, (F)Low (cell D3 in
Table 10 above)
No data are available on masking by sonar but it is unlikely that sonar would mask important
sounds for fish. The risk of masking occurring is moderate near the source and low at
intermediate and far distances from the source (Popper et al. 2014); however, the narrow
bandwidth of most sonar would result in only a limited range of frequencies being masked
(Popper et al. 2014). Furthermore most sonars are intermittent (i.e., low duty cycle) which further
lowers the probability of any masking effects.
3.1.3.1.6 Behavior, Fish no SB and Fish w/ SB not involved in hearing = (N)Low, (I)Low,
(F)Low (cells E1 & E2 in Table 10 above)
No data are available on behavioral reactions to low‐frequency sonar. Fish without a mechanism
to sense pressure are unlikely to sense sound beyond the near-field. The risk that sonar would
result in a behavioral response within near, intermediate or far distances from sonar is low
(Popper et al. 2014).
3.1.3.1.7 Behavior: Fish w/ SB involved in hearing = > 197 dB SPLrms (cell E3 in Table 10
above)
No reactions were seen in fish exposed to 1 to 2 kHz sonar which is categorized as mid‐
frequency sonar, not low‐frequency sonar. Therefore criteria used for behavioral reactions to
sonar was taken from Popper et al. (2014), >197 dB SPLrms (Doksaeter et al. 2009; Doksaeter et
al. 2012).
3.1.3.2 Mid‐Frequency NavySonar
3.1.3.2.1 Mortality, Mortal Injury & Recoverable Injury: >> 221 dB SELcum (cells A4, A5,
A6, B4, B5, & B6 in Table 10 above)
Sonar is not anticipated to cause mortality, mortal injury, or recoverable injury due to lack of fast
rise times, lack of high peak pressures, and lack of high acoustic impulse associated with some
79
Biological Opinion and Conference Report on Navy NWTT Activities and NMFS’ MMPA Incidental Take
Authorization PCTS FPR-2015-9110
impulsive sounds (e.g., explosives). Exposure to mid‐frequency sonar has been tested and has not
been shown to cause mortality or any injury in fish with swim bladders (Kane et al. 2010; Popper
et al. 2007). Lesser potential for injurious effects would be expected for fish without air cavities
(i.e., swim bladders). Therefore the recommended threshold would be >>221 dB SELcum for
mortality and >221 dB SELcum for recoverable injury.
3.1.3.2.2 TTS: Fish‐no SB and Fish w/SB not involved in hearing = NA (cells C4 & C5 in
Table 10 above)
Exposure to mid‐frequency sonar has not been known to induce TTS in fish species without swim
bladders or in fish with swim bladders that are not involved in hearing (Halvorsen et al. 2012). In
addition, fish without swim bladders involved in hearing (i.e. close connections to the inner ear)
do not sense pressure well and cannot hear at frequencies above 1 kHz.
3.1.3.2.3 TTS: Fish w/ SB used in hearing = 220 dB SELcum (cell C6 in Table 10 above)
Exposure to mid‐frequency sonar has been known to induce TTS in some fish species with swim
bladders and better hearing capabilities (Halvorsen et al. 2012). Criteria from Popper et al. (2014)
was originally listed as >210 dB SPLrms. As previously stated, TTS criteria reported as
cumulative sound exposure level (SELcum) accounts for the duration of the exposure as well.
Therefore, the criteria originally presented in the technical report was converted to this metric
using the duration of the signal reported from the experiments and was rounded down as a
conservative measure (Halvorsen et al. 2012).
210 dB SPLrms + 10log(15 sec) = 221 dB SELcum
3.1.3.2.4 Masking: NA (cells D4, D5, & D6 in Table 10 above)
No data are available on masking by sonar but it is unlikely that sonar would mask important
sounds for fish. The narrow bandwidth of most sonar would result in only a limited range of
frequencies being masked (Popper et al. 2014). Furthermore most sonars are intermittent (i.e.,
low duty cycle) which further lowers the probability of any masking effects. Most mid‐frequency sonars are above the hearing range of most fish species and almost all marine fish
species (including salmonids).
3.1.3.2.5 Behavior: Fish no SB and Fish w/ SB not involved in hearing = NA (cells E4 & E5
in Table 10 above)
Fish without swim bladders or without swim bladders involved in hearing would not be able to
hear mid‐frequency sonar; therefore, behavioral reactions would not occur.
3.1.3.2.6 Behavior: Fish w/ SB involved in hearing = 200 dB SPLrms (cell E6 in Table 10
80
Biological Opinion and Conference Report on Navy NWTT Activities and NMFS’ MMPA Incidental Take Authorization PCTS FPR-2015-9110
above)
No reactions were seen in herring exposed to 1 to 2 and 6 to 7 kHz sonar (Doksaeter et al. 2009;
Doksaeter et al. 2012). Therefore it is recommended that this criterion be 200 dB SPLrms as a
conservative measure. This criterion only applies to mid‐frequency sonars up to 2.5 kHz since
even fish with swim bladders with connections to the inner ear cannot hear above these
frequencies with the exception of the taxa Alosa spp. (e.g., herring). While improbable
(Doksaeter et al. 2009; Doksaeter et al. 2012), Alosa spp. could have behavioral reactions over
the full bandwidth of mid‐frequency sonar (1 to 10 kHz).
3.1.4 Criteria for Assessing Effects to Fish from Explosives
During this consultation, NMFS needed to assess the effects of impulsive stressors (explosions)
on ESA-listed salmonids, eulachon, and rock fish. The most appropriate thresholds to assess are
the onset of physical injury (including auditory injury from permanent threshold shift) and onset
of mortality from impulsive stressors. These thresholds must be based on the best scientific and
commercial data2
pursuant to section 7 of the ESA.
3.1.4.1 Datasets/Thresholds Evaluated for Effects from Explosives
The following thresholds were assessed by NMFS to establish suitable criteria for the ESA risk
analysis. For additional information on the methodology used to develop these criteria, see
Renken (2015).
3.1.4.1.1 NMFS West Coast Region’s Interim Impact Pile Driving Thresholds
In 2008, NMFS’ West Coast Region established interim dual thresholds for the onset of physical
injury from impact pile driving activities (Table 11) via participation in the Fisheries
Hydroacoustic Working Group (FHWG 2008). The NMFS dual interim thresholds are expressed
as peak pressure (dBpeak) and cumulative sound exposure level (SELcum) and account for
vulnerability depending on fish size.
2 Best available scientific and commercial data - to assure the quality of the biological, ecological, and other
information used in the implementation of the Act, it is the policy of the Services to: (1) evaluate all scientific and
other information used to ensure that it is reliable, credible, and represents the best scientific and commercial data
available; (2) gather and impartially evaluate biological, ecological, and other information disputing official
positions, decisions, and actions proposed or taken by the Services; (3) document their evaluation of comprehensive,
technical information regarding the status and habitat requirements for a species throughout its range, whether it
supports or does not support a position being proposed as an official agency position; (4) use primary and original
sources of information as the basis for recommendations; (5) retain these sources referenced in the official document
as part of the administrative record supporting an action; (6) collect, evaluate, and complete all reviews of
biological, ecological, and other relevant information within the schedules established by the Act, appropriate
regulations, and applicable policies; and (7) require management-level review of documents developed and drafted
by Service biologists to verify and assure the quality of the science used to establish official positions, decisions, and
actions taken by the Services during their implementation of the Act. [59 FR 34271 (July 1, 1994)]
81
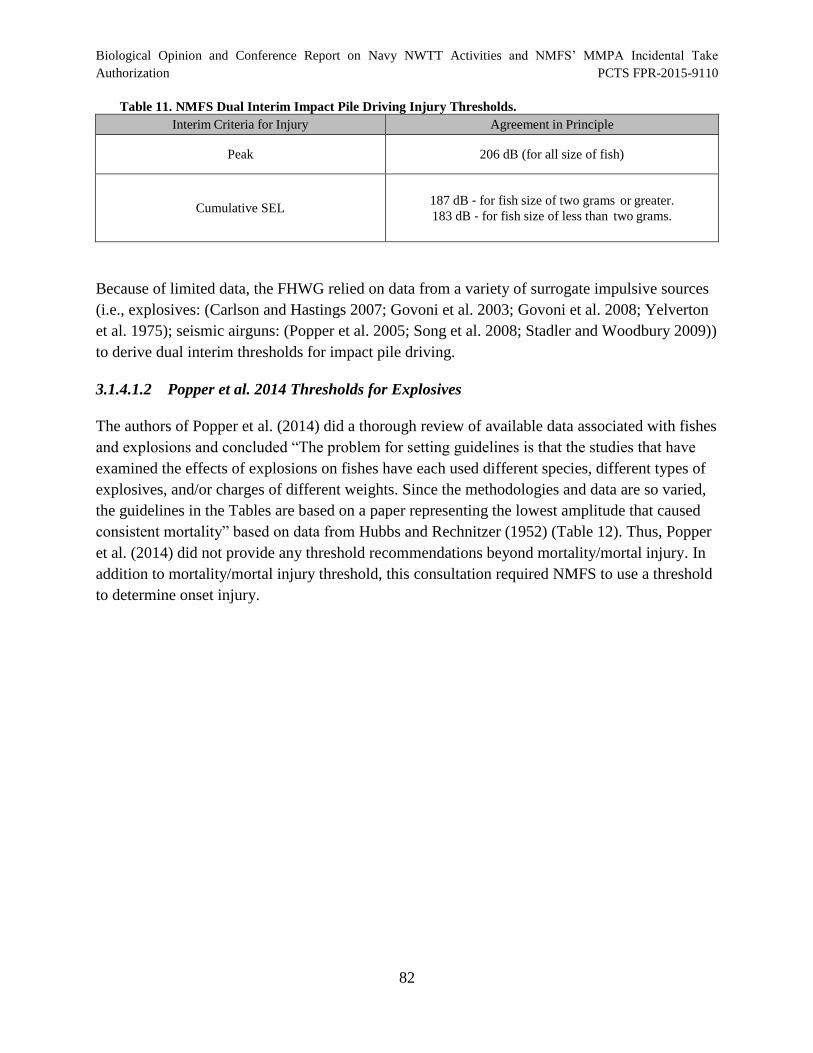
Biological Opinion and Conference Report on Navy NWTT Activities and NMFS’ MMPA Incidental Take Authorization PCTS FPR-2015-9110
Table 11. NMFS Dual Interim Impact Pile Driving Injury Thresholds.
Interim Criteria for Injury Agreement in Principle
Peak 206 dB (for all size of fish)
Cumulative SEL 187 dB ‐ for fish size of two grams or greater.
183 dB ‐ for fish size of less than two grams.
Because of limited data, the FHWG relied on data from a variety of surrogate impulsive sources
(i.e., explosives: (Carlson and Hastings 2007; Govoni et al. 2003; Govoni et al. 2008; Yelverton
et al. 1975); seismic airguns: (Popper et al. 2005; Song et al. 2008; Stadler and Woodbury 2009))
to derive dual interim thresholds for impact pile driving.
3.1.4.1.2 Popper et al. 2014 Thresholds for Explosives
The authors of Popper et al. (2014) did a thorough review of available data associated with fishes
and explosions and concluded “The problem for setting guidelines is that the studies that have
examined the effects of explosions on fishes have each used different species, different types of
explosives, and/or charges of different weights. Since the methodologies and data are so varied,
the guidelines in the Tables are based on a paper representing the lowest amplitude that caused
consistent mortality” based on data from Hubbs and Rechnitzer (1952) (Table 12). Thus, Popper
et al. (2014) did not provide any threshold recommendations beyond mortality/mortal injury. In
addition to mortality/mortal injury threshold, this consultation required NMFS to use a threshold
to determine onset injury.
82
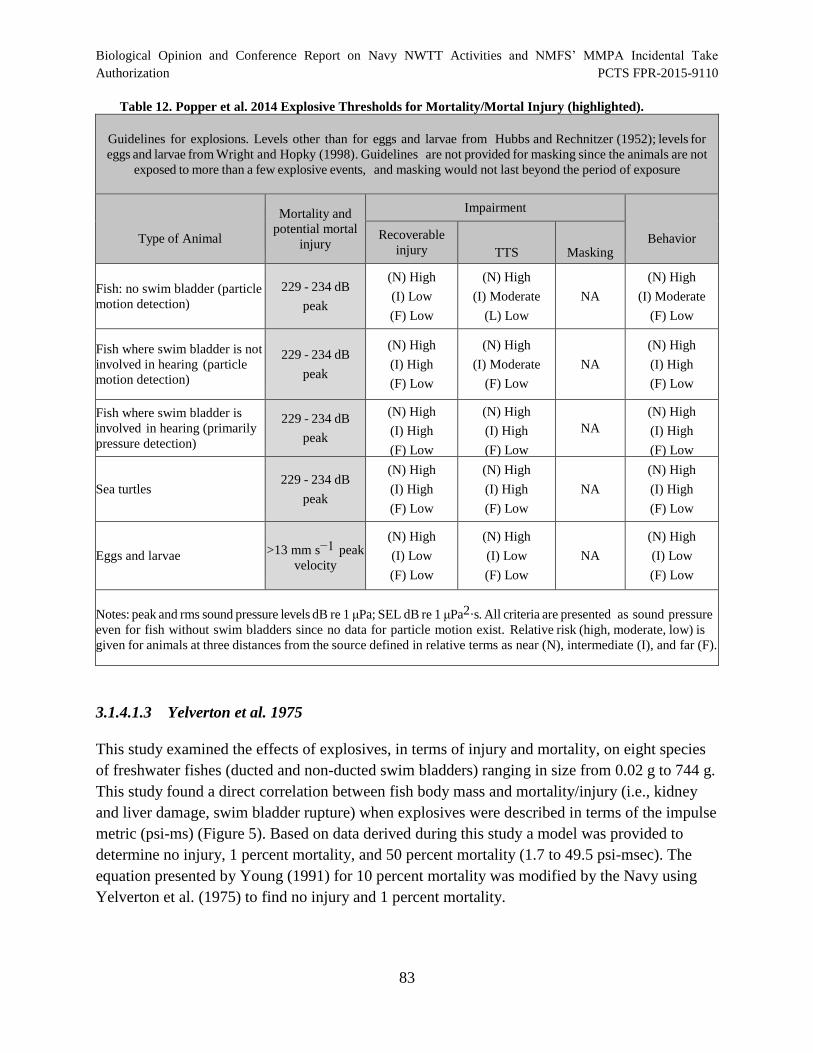
Biological Opinion and Conference Report on Navy NWTT Activities and NMFS’ MMPA Incidental Take Authorization PCTS FPR-2015-9110
Table 12. Popper et al. 2014 Explosive Thresholds for Mortality/Mortal Injury (highlighted).
Guidelines for explosions. Levels other than for eggs and larvae from Hubbs and Rechnitzer (1952); levels for
eggs and larvae from Wright and Hopky (1998). Guidelines are not provided for masking since the animals are not
exposed to more than a few explosive events, and masking would not last beyond the period of exposure
Type of Animal
Mortality and
potential mortal
injury
Impairment
Behavior Recoverable
injury TTS Masking
Fish: no swim bladder (particle
motion detection)
229 - 234 dB
peak
(N) High
(I) Low
(F) Low
(N) High
(I) Moderate
(L) Low
NA
(N) High
(I) Moderate
(F) Low
Fish where swim bladder is not
involved in hearing (particle
motion detection)
229 - 234 dB
peak
(N) High
(I) High
(F) Low
(N) High
(I) Moderate
(F) Low
NA
(N) High
(I) High
(F) Low
Fish where swim bladder is
involved in hearing (primarily
pressure detection)
229 - 234 dB
peak
(N) High
(I) High
(F) Low
(N) High
(I) High
(F) Low
NA
(N) High
(I) High
(F) Low
Sea turtles 229 - 234 dB
peak
(N) High
(I) High
(F) Low
(N) High
(I) High
(F) Low
NA
(N) High
(I) High
(F) Low
Eggs and larvae >13 mm s−1 peak
velocity
(N) High
(I) Low
(F) Low
(N) High
(I) Low
(F) Low
NA
(N) High
(I) Low
(F) Low
Notes: peak and rms sound pressure levels dB re 1 μPa; SEL dB re 1 μPa2·s. All criteria are presented as sound pressure
even for fish without swim bladders since no data for particle motion exist. Relative risk (high, moderate, low) is
given for animals at three distances from the source defined in relative terms as near (N), intermediate (I), and far (F).
3.1.4.1.3 Yelverton et al. 1975
This study examined the effects of explosives, in terms of injury and mortality, on eight species
of freshwater fishes (ducted and non-ducted swim bladders) ranging in size from 0.02 g to 744 g.
This study found a direct correlation between fish body mass and mortality/injury (i.e., kidney
and liver damage, swim bladder rupture) when explosives were described in terms of the impulse
metric (psi-ms) (Figure 5). Based on data derived during this study a model was provided to
determine no injury, 1 percent mortality, and 50 percent mortality (1.7 to 49.5 psi-msec). The
equation presented by Young (1991) for 10 percent mortality was modified by the Navy using
Yelverton et al. (1975) to find no injury and 1 percent mortality.
83
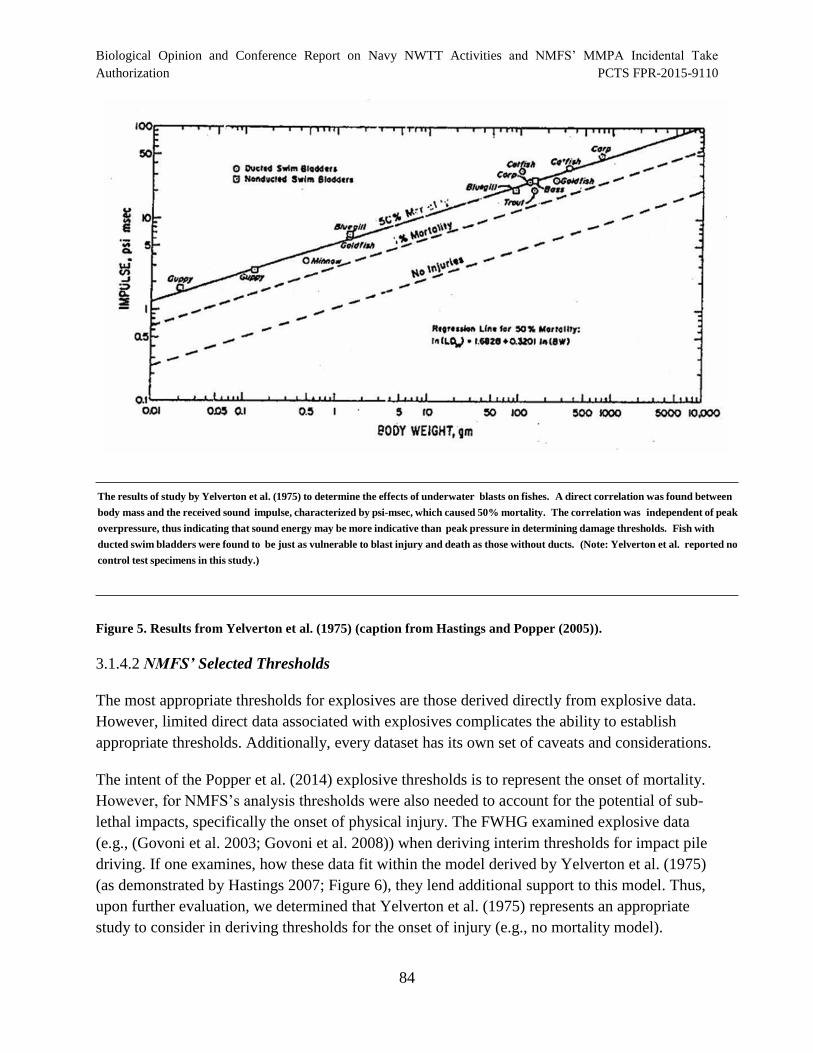
Biological Opinion and Conference Report on Navy NWTT Activities and NMFS’ MMPA Incidental Take Authorization PCTS FPR-2015-9110
The results of study by Yelverton et al. (1975) to determine the effects of underwater blasts on fishes. A direct correlation was found between
body mass and the received sound impulse, characterized by psi-msec, which caused 50% mortality. The correlation was independent of peak
overpressure, thus indicating that sound energy may be more indicative than peak pressure in determining damage thresholds. Fish with
ducted swim bladders were found to be just as vulnerable to blast injury and death as those without ducts. (Note: Yelverton et al. reported no
control test specimens in this study.)
Figure 5. Results from Yelverton et al. (1975) (caption from Hastings and Popper (2005)).
3.1.4.2 NMFS’ Selected Thresholds
The most appropriate thresholds for explosives are those derived directly from explosive data.
However, limited direct data associated with explosives complicates the ability to establish
appropriate thresholds. Additionally, every dataset has its own set of caveats and considerations.
The intent of the Popper et al. (2014) explosive thresholds is to represent the onset of mortality.
However, for NMFS’s analysis thresholds were also needed to account for the potential of sub-
lethal impacts, specifically the onset of physical injury. The FWHG examined explosive data
(e.g., (Govoni et al. 2003; Govoni et al. 2008)) when deriving interim thresholds for impact pile
driving. If one examines, how these data fit within the model derived by Yelverton et al. (1975)
(as demonstrated by Hastings 2007; Figure 6), they lend additional support to this model. Thus,
upon further evaluation, we determined that Yelverton et al. (1975) represents an appropriate
study to consider in deriving thresholds for the onset of injury (e.g., no mortality model).
84
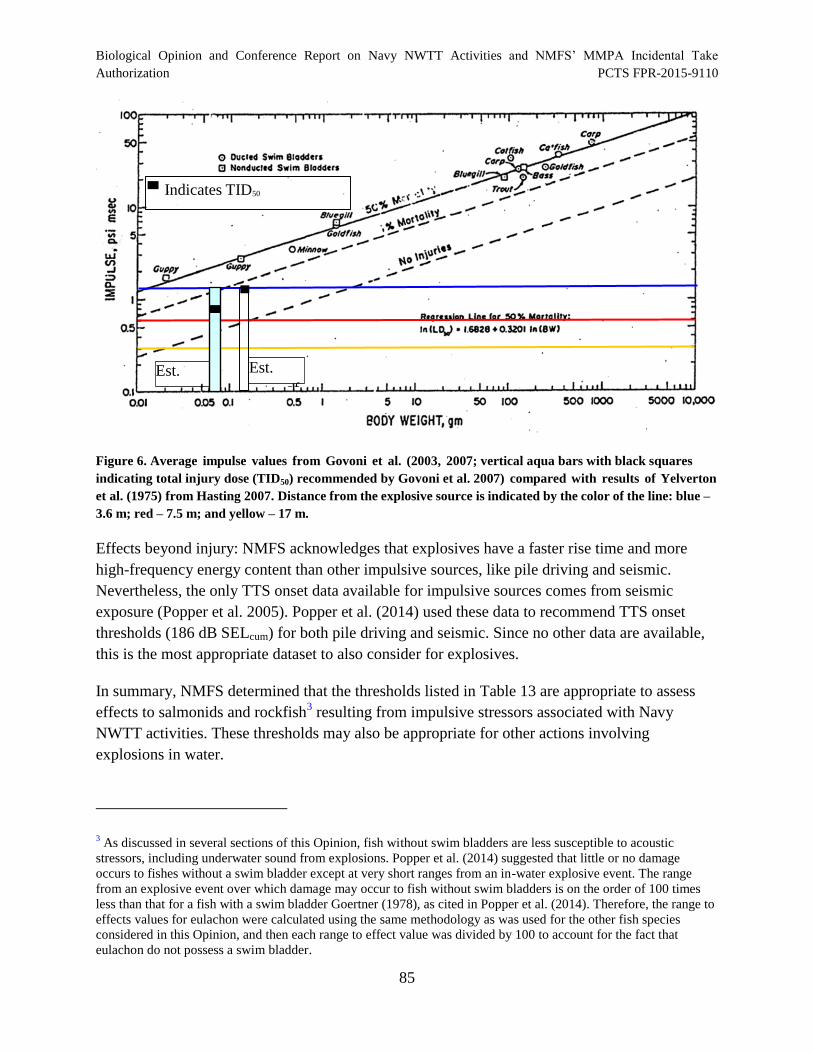
mass of mass
recommendation
Biological Opinion and Conference Report on Navy NWTT Activities and NMFS’ MMPA Incidental Take Authorization PCTS FPR-2015-9110
Est. Est.
of
Indicates TID50
Figure 6. Average impulse values from Govoni et al. (2003, 2007; vertical aqua bars with black squares
indicating total injury dose (TID50) recommended by Govoni et al. 2007) compared with results of Yelverton
et al. (1975) from Hasting 2007. Distance from the explosive source is indicated by the color of the line: blue –
3.6 m; red – 7.5 m; and yellow – 17 m.
Effects beyond injury: NMFS acknowledges that explosives have a faster rise time and more
high-frequency energy content than other impulsive sources, like pile driving and seismic.
Nevertheless, the only TTS onset data available for impulsive sources comes from seismic
exposure (Popper et al. 2005). Popper et al. (2014) used these data to recommend TTS onset
thresholds (186 dB SELcum) for both pile driving and seismic. Since no other data are available,
this is the most appropriate dataset to also consider for explosives.
In summary, NMFS determined that the thresholds listed in Table 13 are appropriate to assess
effects to salmonids and rockfish3
resulting from impulsive stressors associated with Navy
NWTT activities. These thresholds may also be appropriate for other actions involving
explosions in water.
3 As discussed in several sections of this Opinion, fish without swim bladders are less susceptible to acoustic
stressors, including underwater sound from explosions. Popper et al. (2014) suggested that little or no damage
occurs to fishes without a swim bladder except at very short ranges from an in-water explosive event. The range
from an explosive event over which damage may occur to fish without swim bladders is on the order of 100 times
less than that for a fish with a swim bladder Goertner (1978), as cited in Popper et al. (2014). Therefore, the range to
effects values for eulachon were calculated using the same methodology as was used for the other fish species
considered in this Opinion, and then each range to effect value was divided by 100 to account for the fact that
eulachon do not possess a swim bladder.
85
Biological Opinion and Conference Report on Navy NWTT Activities and NMFS’ MMPA Incidental Take Authorization PCTS FPR-2015-9110
Table 13. Thresholds for Assessing Effects of Explosives on Fish
Potential Effect Threshold Reference
Mortality/Mortal Injury* 229 dBpeak Hubbs and Rechnitzer (1952)
Onset of Injury TBD psi-msec (based on representative
weight of fish species and age class)
Yelverton et al. (1975), Young
(1991)
TTS 186 dB SELcum Popper et al. (2005)
* Yelverton et al. (1975) could possibly be used to establish dual thresholds using the impulse (psi-msec) metric (e.g., 1 percent mortality
model)
3.1.5 Discussion of Finneran and Schlundt 2010 and 2011 Dolphin Studies in the Context
of Phase II Modeling
The Navy incorporated the data from two Finneran studies (2010 and 2011), in coordination with
other scientific literature, to develop auditory weighting functions and “weighted” thresholds for
auditory criteria. A summary of the findings from the two papers is provided below.
Finneran and Schlundt (2010)
Finneran and Schlundt (Finneran and Schlundt 2010) measured temporary threshold shift (TTS)
in a single female bottlenose dolphin (Tursiops truncatus) after exposure to tones at 3 and 20
kHz in order to examine the effects of exposure frequency on the onset and growth of TTS. The
preliminary data provide evidence of frequency specific differences in TTS onset and growth
between the 3 kHz and 20 kHz exposures. At 20 kHz, where bottlenose dolphin hearing
sensitivity is better, TTS not only began at a lower exposure level compared to the 3 kHz
exposures, but also grew at a faster rate. This demonstrated that damage risk criteria for dolphins
exposed to underwater sound should account for the exposure frequency and that criteria
developed for lower frequencies (e.g. 3 kHz) may underestimate the amount of TTS if applied to
higher frequencies (e.g. 20 kHz), where hearing sensitivity is better. This research suggests the
need for analogous data across the entire audible range so that potential effects of various
frequency tones can be properly assessed.
Finneran and Schlundt (2011)
For humans, acoustic damage-risk criteria rely on numeric thresholds based on “weighted” noise
levels. Weighted noise levels are calculated by applying a frequency-dependent filter, or
“weighting function” to the measured sound pressure before calculation of the overall sound
pressure level (SPL). The weighting functions are designed to emphasize frequencies where
sensitivity to sound is high and to de-emphasize frequencies where sensitivity is low. This
technique allows for a single, weighted damage-risk criterion, regardless of the sound frequency.
Weighting functions for humans are derived from equal loudness contours—graphs representing
the SPLs that led to a sensation of equal loudness magnitude in the listener as a function of sound
frequency (Suzuki and Takeshima 2004). Equal loudness contours are derived from loudness
86
Biological Opinion and Conference Report on Navy NWTT Activities and NMFS’ MMPA Incidental Take
Authorization PCTS FPR-2015-9110
experiments where the listener is asked to judge the relative loudness of two tones with different
frequencies. Prior to Finneran and Schlundt (2011a) there were no direct measurements of
subjective loudness in non-human animals from which to develop equal loudness contours.
Finneran and Schlundt (2011a)trained a bottlenose dolphin to perform a loudness comparison
test, where the listener indicated which of two sequential tones was louder. This study
demonstrated that a non-human animal could be conditioned for subjective loudness testing and
therefore, it was possible to directly measure loudness levels in some species. Additional data is
required to more accurately predict the relationship below 2.5 kHz. The weighting function
derived here is substantially different than the “M-weighting function” proposed for mid-
frequency cetaceans in Southall et al. (Southall et al. 2007b), which is nearly flat over the range
of ~1 to 30 kHz and thus does not mirror the change in equal loudness contours observed over
that frequency range. Nor does the M-weighting function capture the difference in TTS onset and
growth reported for a single bottlenose dolphin tested at 3 and 20 kHz in Finneran and Schlundt
(2010).
3.1.6 Post Processing. Avoidance Behavior and Mitigation Measures as Applied to Sonar
and Active Acoustic Sources
As described in the NWTT DEIS/OEIS, the NAEMO model accounts for an animat’s position
vertically in the water column by taking into account species-specific dive profiles; however, it
does not account for an animat’s horizontal movement, so the model assumes that an animal
would remain stationary and tolerate repeated intense sound exposures at very close distances.
This assumption is invalid because animals are likely to leave the area to avoid intense sound
exposure that could cause injury. Similarly, the modeling assumes that certain species known to
avoid areas of high anthropogenic activity would remain in the very close vicinity of all Navy
training and testing activities, regardless of how many vessels or low-flying aircraft (i.e.,
helicopters) are involved. The outputs of the model, therefore, present an unrealistically high
estimate of acoustic impacts in close proximity to certain Navy training and testing activities.
Additionally, the modeling currently does not account for implementation of mitigation designed
to avoid or reduce marine mammal and sea turtle exposures to explosives and high intensity
sound, nor does it account for standard operating procedures (procedures designed for the safety
of personnel and equipment) implemented to ensure safety and mission success, but which may
have incidental environmental benefits. That is, the modeling assumes that any mitigations
measures, such as sonar power-down or delay of a detonation, would not be implemented even if
an animal could be sighted within the mitigation zone. The Navy’s proposed mitigations were
developed in cooperation with NMFS and are designed to reduce environmental impacts while
being operationally feasible. It is difficult to assess the effectiveness of mitigation measures;
however, NMFS assesses annual exercise reports and comprehensive summary reports to assess
general trends in implementation and any observed responses to mitigation. The outputs of the
87
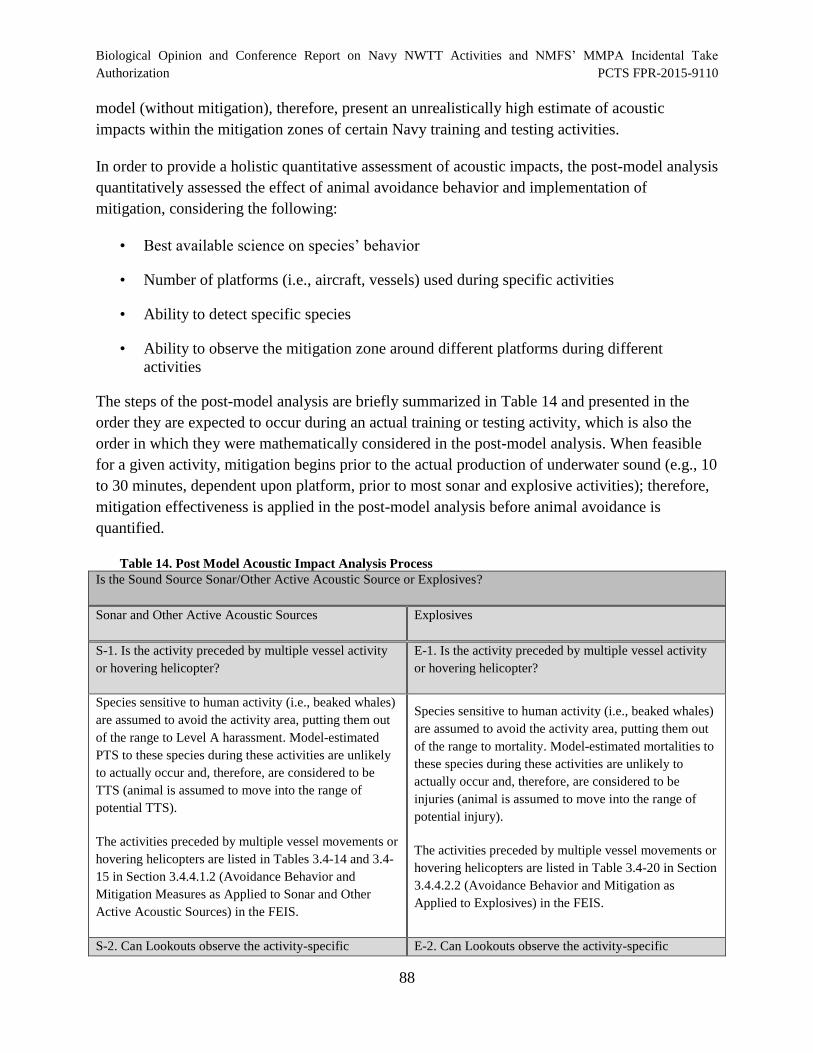
Biological Opinion and Conference Report on Navy NWTT Activities and NMFS’ MMPA Incidental Take
Authorization PCTS FPR-2015-9110
model (without mitigation), therefore, present an unrealistically high estimate of acoustic
impacts within the mitigation zones of certain Navy training and testing activities.
In order to provide a holistic quantitative assessment of acoustic impacts, the post-model analysis
quantitatively assessed the effect of animal avoidance behavior and implementation of
mitigation, considering the following:
¨ Best available science on species’ behavior
¨ Number of platforms (i.e., aircraft, vessels) used during specific activities
¨ Ability to detect specific species
¨ Ability to observe the mitigation zone around different platforms during different activities
The steps of the post-model analysis are briefly summarized in Table 14 and presented in the
order they are expected to occur during an actual training or testing activity, which is also the
order in which they were mathematically considered in the post-model analysis. When feasible
for a given activity, mitigation begins prior to the actual production of underwater sound (e.g., 10
to 30 minutes, dependent upon platform, prior to most sonar and explosive activities); therefore,
mitigation effectiveness is applied in the post-model analysis before animal avoidance is
quantified.
Table 14. Post Model Acoustic Impact Analysis Process
Is the Sound Source Sonar/Other Active Acoustic Source or Explosives?
Sonar and Other Active Acoustic Sources Explosives
S-1. Is the activity preceded by multiple vessel activity
or hovering helicopter?
E-1. Is the activity preceded by multiple vessel activity
or hovering helicopter?
Species sensitive to human activity (i.e., beaked whales)
are assumed to avoid the activity area, putting them out
of the range to Level A harassment. Model-estimated
PTS to these species during these activities are unlikely
to actually occur and, therefore, are considered to be
TTS (animal is assumed to move into the range of
potential TTS).
Species sensitive to human activity (i.e., beaked whales)
are assumed to avoid the activity area, putting them out
of the range to mortality. Model-estimated mortalities to
these species during these activities are unlikely to
actually occur and, therefore, are considered to be
injuries (animal is assumed to move into the range of
potential injury).
The activities preceded by multiple vessel movements or
hovering helicopters are listed in Tables 3.4-14 and 3.4
15 in Section 3.4.4.1.2 (Avoidance Behavior and
Mitigation Measures as Applied to Sonar and Other
Active Acoustic Sources) in the FEIS.
The activities preceded by multiple vessel movements or
hovering helicopters are listed in Table 3.4-20 in Section
3.4.4.2.2 (Avoidance Behavior and Mitigation as
Applied to Explosives) in the FEIS.
S-2. Can Lookouts observe the activity-specific E-2. Can Lookouts observe the activity-specific
88
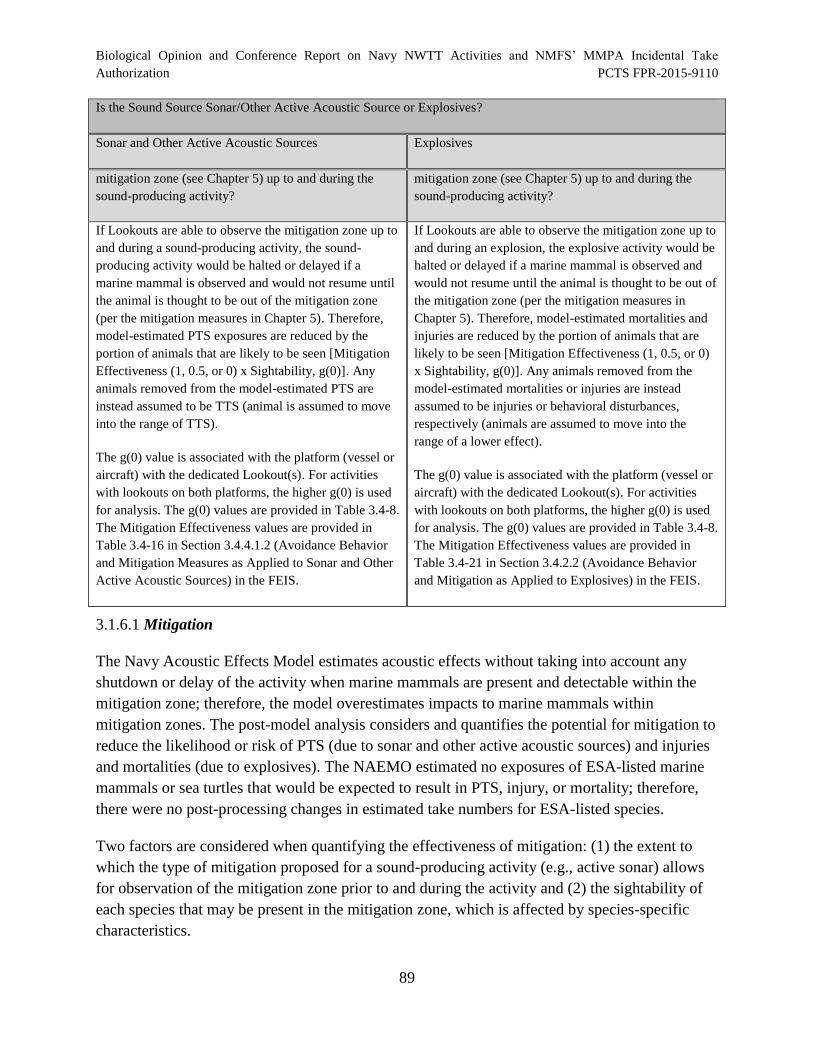
Biological Opinion and Conference Report on Navy NWTT Activities and NMFS’ MMPA Incidental Take Authorization PCTS FPR-2015-9110
Is the Sound Source Sonar/Other Active Acoustic Source or Explosives?
Sonar and Other Active Acoustic Sources Explosives
mitigation zone (see Chapter 5) up to and during the
sound-producing activity?
mitigation zone (see Chapter 5) up to and during the
sound-producing activity?
If Lookouts are able to observe the mitigation zone up to If Lookouts are able to observe the mitigation zone up to
and during a sound-producing activity, the sound- and during an explosion, the explosive activity would be
producing activity would be halted or delayed if a halted or delayed if a marine mammal is observed and
marine mammal is observed and would not resume until would not resume until the animal is thought to be out of
the animal is thought to be out of the mitigation zone the mitigation zone (per the mitigation measures in
(per the mitigation measures in Chapter 5). Therefore, Chapter 5). Therefore, model-estimated mortalities and
model-estimated PTS exposures are reduced by the injuries are reduced by the portion of animals that are
portion of animals that are likely to be seen [Mitigation likely to be seen [Mitigation Effectiveness (1, 0.5, or 0)
Effectiveness (1, 0.5, or 0) x Sightability, g(0)]. Any x Sightability, g(0)]. Any animals removed from the
animals removed from the model-estimated PTS are model-estimated mortalities or injuries are instead
instead assumed to be TTS (animal is assumed to move assumed to be injuries or behavioral disturbances,
into the range of TTS). respectively (animals are assumed to move into the
range of a lower effect).
The g(0) value is associated with the platform (vessel or
aircraft) with the dedicated Lookout(s). For activities The g(0) value is associated with the platform (vessel or
with lookouts on both platforms, the higher g(0) is used aircraft) with the dedicated Lookout(s). For activities
for analysis. The g(0) values are provided in Table 3.4-8. with lookouts on both platforms, the higher g(0) is used
The Mitigation Effectiveness values are provided in for analysis. The g(0) values are provided in Table 3.4-8.
Table 3.4-16 in Section 3.4.4.1.2 (Avoidance Behavior The Mitigation Effectiveness values are provided in
and Mitigation Measures as Applied to Sonar and Other Table 3.4-21 in Section 3.4.2.2 (Avoidance Behavior
Active Acoustic Sources) in the FEIS. and Mitigation as Applied to Explosives) in the FEIS.
3.1.6.1 Mitigation
The Navy Acoustic Effects Model estimates acoustic effects without taking into account any
shutdown or delay of the activity when marine mammals are present and detectable within the
mitigation zone; therefore, the model overestimates impacts to marine mammals within
mitigation zones. The post-model analysis considers and quantifies the potential for mitigation to
reduce the likelihood or risk of PTS (due to sonar and other active acoustic sources) and injuries
and mortalities (due to explosives). The NAEMO estimated no exposures of ESA-listed marine
mammals or sea turtles that would be expected to result in PTS, injury, or mortality; therefore,
there were no post-processing changes in estimated take numbers for ESA-listed species.
Two factors are considered when quantifying the effectiveness of mitigation: (1) the extent to
which the type of mitigation proposed for a sound-producing activity (e.g., active sonar) allows
for observation of the mitigation zone prior to and during the activity and (2) the sightability of
each species that may be present in the mitigation zone, which is affected by species-specific
characteristics.
89
Biological Opinion and Conference Report on Navy NWTT Activities and NMFS’ MMPA Incidental Take
Authorization PCTS FPR-2015-9110
3.1.6.2 Avoidance
At close ranges and high sound levels approaching those that could cause PTS, avoidance of the
area immediately around the sound source is the assumed behavioral response for most cases.
Because the Navy Acoustic Effects Model does not consider horizontal movement of animats,
including avoidance of high-intensity sound exposures, it over-estimates the number of marine
mammals and sea turtles that would be exposed to sound sources that could cause injury. In other
words, the model estimates PTS impacts as though an animal would tolerate an injurious sound
exposure without moving away from the sound source. Therefore, the potential for avoidance is
considered in the Navy’s post-model analysis. The NAEMO estimated no exposures of ESA-
listed marine mammals or sea turtles that would be expected to result in PTS, injury, or
mortality; therefore, there were no post-processing changes in estimated take numbers for ESA-
listed species.
3.2 Treatment of “Cumulative Impacts” (in the sense of NEPA)
The U.S. Council on Environmental Quality defined “cumulative effects” (which we refer to as
“cumulative impacts” to distinguish between NEPA and ESA uses of the same term) as “the
impact on the environment which results from the incremental impact of the action when added
to other past, present, and reasonably foreseeable future actions regardless of what agency
(Federal or non-Federal) or person undertakes such other actions” (40 CFR §1508.7). The effects
analyses of biological opinions considered the “impacts” on listed species and designated critical
habitat that result from the incremental impact of an action by identifying natural and
anthropogenic stressors that affect endangered and threatened species throughout their range (the
Status of Listed Resources) and within an Action Area (the Environmental Baseline, which
articulate the pre-existing impacts of activities that occur in an Action Area, including the past,
contemporaneous, and future impacts of those activities). We assess the effects of a proposed
action by adding its direct and indirect effects to the impacts of the activities we identify in an
Environmental Baseline (50 CFR §402.02), in light of the impacts of the status of the listed
species and designated critical habitat throughout their range; therefore, the results of our effects
analyses are equivalent to those contained in the “cumulative impact” sections of NEPA
documents.
We considered cumulative impacts as part of our consultation. Specifically, we considered (1)
stressors that accumulate in the environment, and (2) effects that represent either the response of
individuals, populations, or species to that accumulation of stressors. Further, we considered the
likely impacts of these accumulative phenomena on an annual basis, over the duration of the
five-year MMPA regulations, and under the assumption that these activities would continue into
the reasonably foreseeable future. Given the ongoing nature of the proposed activities, we
assume that the type, amount, and extent of training and testing do not exceed maximum levels
assessed in the action.
90
Biological Opinion and Conference Report on Navy NWTT Activities and NMFS’ MMPA Incidental Take
Authorization PCTS FPR-2015-9110
In the sense of Item 1, which captures the normal usage of “cumulative impacts,” we concluded
that phenomena like sound and ship strike do not accumulate in the environment (sound energy
rapidly transforms into other forms of energy and ship strikes are independent events), although
phenomena like the acreage of habitat destroyed and concentrations of toxic chemicals,
sediment, and other pollutants accumulate.
In the sense of Item 2, we considered phenomena that accumulate in individuals and individually
contribute or collectively determine the probable fitness of the individuals that comprise a
population. These include, the passage of time and its corollary, the passage or loss of time
(specifically, the loss of time to reproduce, to forage, and to migrate, etc.); reproductive success;
longevity; energy debt, including allostatic loading; body burdens of toxic chemicals; the fitness
costs of behavioral decisions (canonical costs); injuries and tissue damage; and overstimulation
of sensory organs (which would include noise-induced losses of hearing sensitivity).
At the level of populations, phenomena that “accumulate” include population abundance; the
number or percent of individuals in a population with lifetime reproductive success greater than
2.0 (successful offspring produced); the number or percent of individuals in a population with
lifetime reproductive success equal to 2.0; the number or percent of individuals in a population
with lifetime reproductive success less than 2.0; the number or percent of individuals that
emigrate from a population per unit time; the number or percent of individuals that immigrate
into a population per unit time; mortality within a particular age or stage over generation time;
and the reservoir of juveniles in a population that have a high probability of surviving to the age
of reproduction (population momentum or its absence).
At the species level, when feasible, we accumulate those phenomena that allow us to estimate the
extinction risks facing a species. These include increases or decreases in the number of
occurrences or populations; the extinction probability of particular occurrences; variance in the
rates of population growth or decline; and demographic stochasticity.
Cumulative effects also include effects of future State, tribal, local, or private actions that are
reasonably certain to occur in the Action Area considered in this biological opinion. Future
Federal actions that are unrelated to the action are not considered in this section because they
require separate consultation pursuant to Section 7 of the ESA.
3.3 Defining “Significance”
In this biological opinion, we focused on the potential physical, chemical, or biotic stressors that
are “significant” in the sense of being distinct from ambient or background. We then asked if
a. exposing individuals to those potential stressors is likely to represent a “significant”
negative experience in the life history of individuals that have been exposed; and if
91
Biological Opinion and Conference Report on Navy NWTT Activities and NMFS’ MMPA Incidental Take Authorization PCTS FPR-2015-9110
b. exposing individuals to those potential stressors is likely to cause the individuals to
experience “significant” physical, chemical, or biotic responses; and if
c. any “significant” physical, chemical, or biotic response are likely to have “significant”
consequence for the fitness of the individual animal; and if
d. exposing the physical, chemical, or biotic phenomena that we identified as constituent
elements in a critical habitat designation or, in the case of critical habitat designations
that do not identify constituent elements, those physical, chemical or biotic phenomena
that give designated critical habitat value for the conservation of endangered or
threatened species is likely to represent a “significant” change in the quantity, quality, or
availability of the physical, chemical, or biotic resource; and if
e. any “significant” change in the quantity, quality, or availability of a physical, chemical,
or biotic resource is likely to “significantly” reduce the conservation value of the
designated critical habitat.
In all of these cases, the term “significant” means “clinically or biotically significant” rather than
statistically significant because the presence or absence of statistical significance do not imply
the presence or absence of clinical significance (Achinstein 2001; Royall 2004).
For populations (or sub-populations, demes, etc.), we are concerned about whether the number of
individuals that are likely to experience “significant” reductions in fitness and the nature of any
fitness reductions are likely to have a “significant” consequence for the viability (= probability of
demographic, ecological, or genetic extinction) of the population(s) those individuals represent.
Here “significant” also means “clinically or biotically significant” rather than statistically
significant.
For “species” (the entity that has been listed as endangered or threatened, not the biological
species concept), we are concerned about whether the number of populations that are likely to
experience “significant” reductions in viability (= increases in their extinction probabilities) and
the nature of any reductions in viability are likely to have “significant” consequence for the
viability (= probability of demographic, ecological, or genetic extinction) of the “species” those
populations comprise. Here, again, “significant” also means “clinically or biotically significant”
rather than statistically significant.
For designated critical habitat, we are concerned about whether the area that has been designated
is likely to experience “significant” reductions in the quantity, quality, or availability of physical,
chemical, or biotic resources that are likely to result in “significant” reductions in the
92
Biological Opinion and Conference Report on Navy NWTT Activities and NMFS’ MMPA Incidental Take
Authorization PCTS FPR-2015-9110
conservation value (usually measured using the concept of “carrying capacity4”) of the entire
area contained in the designation.
4 STATUS OF LISTED RESOURCES
This section identifies the ESA-listed species that occur within the Action Area that may be
affected by Navy NWTT activities in the Action Area. It then summarizes the biology and
ecology of those species and what is known about their life histories in the Action Area. The
listed species including distinct population segments (DPS) or evolutionarily significant units
(ESU) occurring within the Action Area that may be affected by the Action are listed in Table
15, along with their ESA listing status.
4 I.e., the maximum number of individuals of a particular species that a given environment (habitat) can support
without detrimental effects to the environment.
93
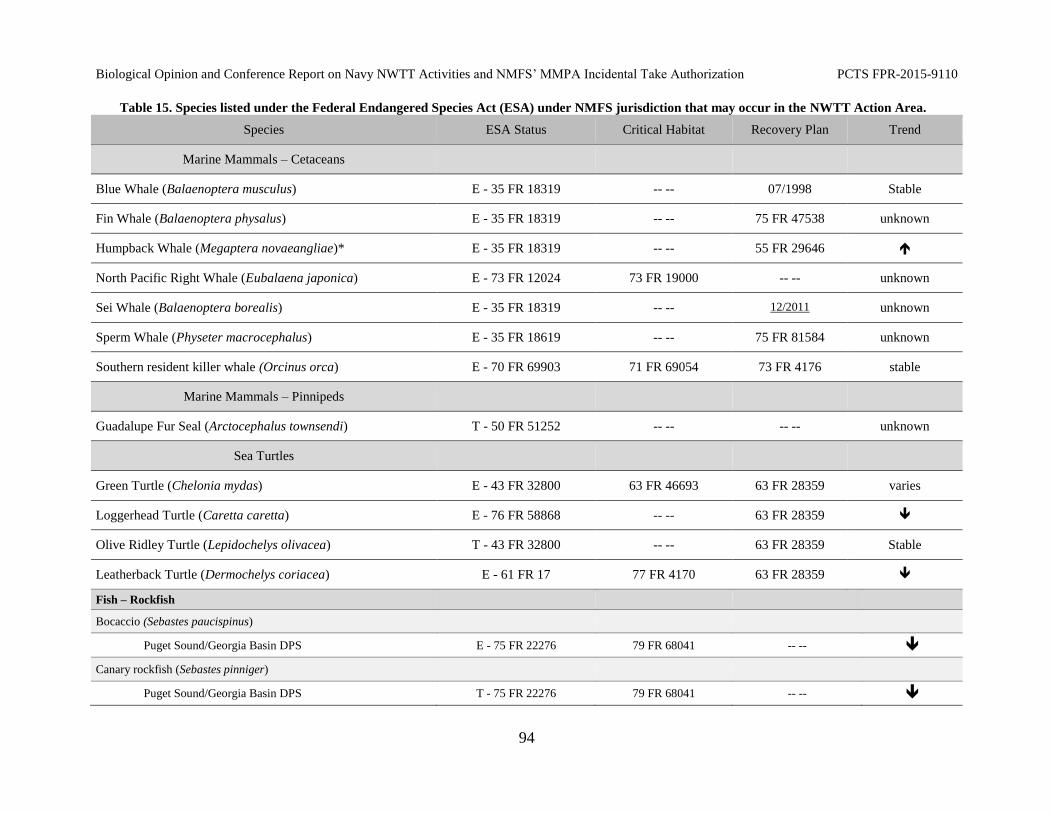
Biological Opinion and Conference Report on Navy NWTT Activities and NMFS’ MMPA Incidental Take Authorization PCTS FPR-2015-9110
Table 15. Species listed under the Federal Endangered Species Act (ESA) under NMFS jurisdiction that may occur in the NWTT Action Area.
Species ESA Status Critical Habitat Recovery Plan Trend
Marine Mammals – Cetaceans
Blue Whale (Balaenoptera musculus) E - 35 FR 18319 -- - 07/1998 Stable
Fin Whale (Balaenoptera physalus) E - 35 FR 18319 -- - 75 FR 47538 unknown
Humpback Whale (Megaptera novaeangliae)* E - 35 FR 18319 -- - 55 FR 29646
North Pacific Right Whale (Eubalaena japonica) E - 73 FR 12024 73 FR 19000 -- - unknown
Sei Whale (Balaenoptera borealis) E - 35 FR 18319 -- - 12/2011 unknown
Sperm Whale (Physeter macrocephalus) E - 35 FR 18619 -- - 75 FR 81584 unknown
Southern resident killer whale (Orcinus orca) E - 70 FR 69903 71 FR 69054 73 FR 4176 stable
Marine Mammals – Pinnipeds
Guadalupe Fur Seal (Arctocephalus townsendi) T - 50 FR 51252 -- -- -- -- unknown
Sea Turtles
Green Turtle (Chelonia mydas) E - 43 FR 32800 63 FR 46693 63 FR 28359 varies
Loggerhead Turtle (Caretta caretta) E - 76 FR 58868 -- - 63 FR 28359
Olive Ridley Turtle (Lepidochelys olivacea) T - 43 FR 32800 -- - 63 FR 28359 Stable
Leatherback Turtle (Dermochelys coriacea) E - 61 FR 17 77 FR 4170 63 FR 28359
Fish – Rockfish
Bocaccio (Sebastes paucispinus)
Puget Sound/Georgia Basin DPS E - 75 FR 22276 79 FR 68041 -- -
Canary rockfish (Sebastes pinniger)
Puget Sound/Georgia Basin DPS T - 75 FR 22276 79 FR 68041 -- -
94
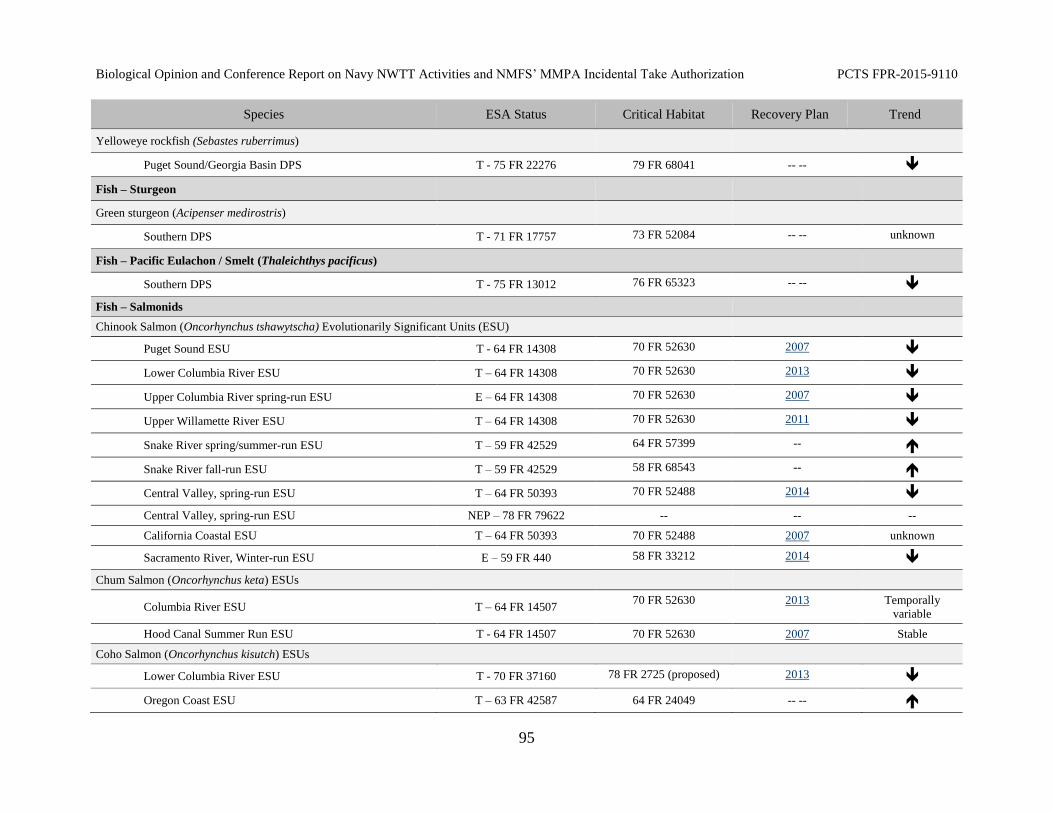
Biological Opinion and Conference Report on Navy NWTT Activities and NMFS’ MMPA Incidental Take Authorization PCTS FPR-2015-9110
Species ESA Status Critical Habitat Recovery Plan Trend
Yelloweye rockfish (Sebastes ruberrimus)
Puget Sound/Georgia Basin DPS T - 75 FR 22276 79 FR 68041 -- --
Fish – Sturgeon
Green sturgeon (Acipenser medirostris)
73 FR 52084 -- -- unknown Southern DPS T - 71 FR 17757
Fish – Pacific Eulachon / Smelt (Thaleichthys pacificus)
Southern DPS T - 75 FR 13012 76 FR 65323 -- --
Fish – Salmonids
Chinook Salmon (Oncorhynchus tshawytscha) Evolutionarily Significant Units (ESU)
Puget Sound ESU T - 64 FR 14308 70 FR 52630 2007
Lower Columbia River ESU T – 64 FR 14308 70 FR 52630 2013
Upper Columbia River spring-run ESU E – 64 FR 14308 70 FR 52630 2007
Upper Willamette River ESU T – 64 FR 14308 70 FR 52630 2011
Snake River spring/summer-run ESU T – 59 FR 42529 64 FR 57399 -
Snake River fall-run ESU T – 59 FR 42529 58 FR 68543 -
Central Valley, spring-run ESU T – 64 FR 50393 70 FR 52488 2014
Central Valley, spring-run ESU NEP – 78 FR 79622 - - -
California Coastal ESU T – 64 FR 50393 70 FR 52488 2007 unknown
Sacramento River, Winter-run ESU E – 59 FR 440 58 FR 33212 2014
Chum Salmon (Oncorhynchus keta) ESUs
Columbia River ESU T – 64 FR 14507 70 FR 52630 2013 Temporally
variable
Hood Canal Summer Run ESU T - 64 FR 14507 70 FR 52630 2007 Stable
Coho Salmon (Oncorhynchus kisutch) ESUs
Lower Columbia River ESU T - 70 FR 37160 78 FR 2725 (proposed) 2013
Oregon Coast ESU T – 63 FR 42587 64 FR 24049 -- -
95
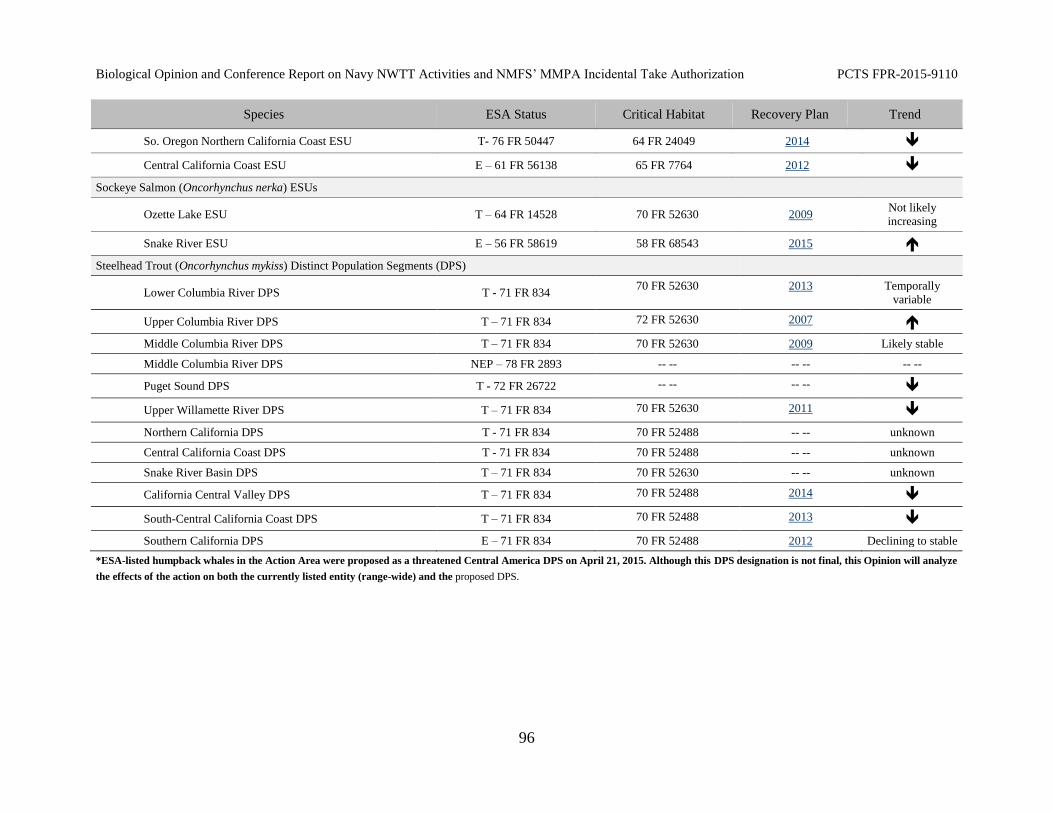
Biological Opinion and Conference Report on Navy NWTT Activities and NMFS’ MMPA Incidental Take Authorization PCTS FPR-2015-9110
Species ESA Status Critical Habitat Recovery Plan Trend
So. Oregon Northern California Coast ESU T- 76 FR 50447 64 FR 24049 2014
Central California Coast ESU E – 61 FR 56138 65 FR 7764 2012
Sockeye Salmon (Oncorhynchus nerka) ESUs
Ozette Lake ESU T – 64 FR 14528 70 FR 52630 2009 Not likely
increasing
Snake River ESU E – 56 FR 58619 58 FR 68543 2015
Steelhead Trout (Oncorhynchus mykiss) Distinct Population Segments (DPS)
Lower Columbia River DPS T - 71 FR 834 70 FR 52630 2013 Temporally
variable
Upper Columbia River DPS T – 71 FR 834 72 FR 52630 2007
Middle Columbia River DPS T – 71 FR 834 70 FR 52630 2009 Likely stable
Middle Columbia River DPS NEP – 78 FR 2893 -- - -- - -- -
Puget Sound DPS T - 72 FR 26722 -- - -- -
Upper Willamette River DPS T – 71 FR 834 70 FR 52630 2011
Northern California DPS T - 71 FR 834 70 FR 52488 -- - unknown
Central California Coast DPS T - 71 FR 834 70 FR 52488 -- - unknown
Snake River Basin DPS T – 71 FR 834 70 FR 52630 -- - unknown
California Central Valley DPS T – 71 FR 834 70 FR 52488 2014
South-Central California Coast DPS T – 71 FR 834 70 FR 52488 2013
Southern California DPS E – 71 FR 834 70 FR 52488 2012 Declining to stable
*ESA-listed humpback whales in the Action Area were proposed as a threatened Central America DPS on April 21, 2015. Although this DPS designation is not final, this Opinion will analyze
the effects of the action on both the currently listed entity (range-wide) and the proposed DPS.
96
Biological Opinion and Conference Report on Navy NWTT Activities and NMFS’ MMPA Incidental Take
Authorization PCTS FPR-2015-9110
4.1 Species and Critical Habitat Not Considered Further in this Opinion
As described in the Approach to the Assessment, NMFS uses two criteria to identify those
endangered or threatened species or critical habitat that are not likely to be adversely affected by
the various activities. The first criterion is exposure or some reasonable expectation of a co-
occurrence between one or more potential stressors associated with the Navy’s activities and a
particular listed species or designated critical habitat: if we conclude that a listed species or
designated critical habitat is not likely to be exposed to the activities, we must also conclude that
the species or critical habitat is not likely to be adversely affected by those activities. The second
criterion is the probability of a response given exposure, which considers susceptibility: species
that may be exposed to sound transmissions from active sonar, for example, but are likely to be
unaffected by the sonar (at sound pressure levels they are likely to be exposed to) are also not
likely to be adversely affected by the sonar. We applied these criteria to the species listed at the
beginning of this section; this subsection summarizes the results of those evaluations.
4.1.1 North Pacific Right Whale
North Pacific right whale remains one of the most endangered whale species in the world, likely
numbering fewer than 1,000 individuals between the eastern and western populations.
Historically, the endangered North Pacific right whale occurred in waters off the coast of British
Columbia and the States of Washington, Oregon, and California (Clapham et al. 2004b; Scarff
1986b). Right whales occur in subpolar to temperate waters. They are generally migratory, with
at least a portion of the population moving between summer feeding grounds in temperate or
high latitudes and winter calving areas in warmer waters (Kraus et al. 1986); (Clapham et al.
2004a). Historical whaling records provide virtually the only information on North Pacific right
whale distribution (Gregr 2011). This species historically occurred across the Pacific Ocean
north of 35°N, with concentrations in the Gulf of Alaska, eastern Aleutian Islands, south-central
Bering Sea, Okhotsk Sea, and the Sea of Japan (Omura et al. 1969); (Scarff 1986a); (Clapham et
al. 2004a); (Shelden et al. 2005); (Gregr 2011); (Ivashchenko et al. 2013). Right whales were
probably never common along the west coast of North America (Scarff 1986a); (Brownell Jr. et
al. 2001). The rarity of reports for right whales in more southern coastal areas in winter in either
historical or recent times suggests that their breeding grounds may have been offshore (Clapham
et al. 2004a). Presently, sightings are extremely rare, occurring primarily in the Okhotsk Sea and
the eastern Bering Sea (Brownell Jr. et al. 2001); (Shelden et al. 2005); Shelden and Clapham
2006; (Wade et al. 2006); (Zerbini et al. 2010). There are far fewer sightings of North Pacific
right whales in the Gulf of Alaska than the Bering Sea (Brownell Jr. et al. 2001); (Wade et al.
2011a); (Zerbini et al. 2010). In addition to sighting data, (Wade et al. 2011b), (Wade et al.
2011a), (Matsuoka et al. 2013a), passive acoustic data have indicated the presence of North
Pacific right whales in the Gulf of Alaska (Mellinger et al. 2004b; Sirovic et al. 2015). No right
whales were detected from more than 5,324 hours of passive acoustic data obtained from Navy
97
Biological Opinion and Conference Report on Navy NWTT Activities and NMFS’ MMPA Incidental Take
Authorization PCTS FPR-2015-9110
funded monitoring devices in the north-central Gulf of Alaska (Baumann-Pickering et al. 2012;
Debich et al. 2013), but calls were detected in 2013 during two days (21 June and 3 August)
from a device located at Quinn Seamount (Sirovic et al. 2015).
4.1.1.1 Occurrence in the Offshore Portion of the NWTT Action Area
Various sightings of North Pacific right whales in the general vicinity of the Action Area have
occurred on an irregular basis. Two right whales were sighted in 1983 on Swiftsure Bank at the
entrance to the Strait of Juan de Fuca (Osborne et al. 1988b). In May 1992 there was a sighting
of a single of North Pacific right whale over Quinault Canyon in the NWTT Action Area (Green
et al. 1992a); (Rowlett et al. 1994). There were no sightings of North Pacific right whales during
six ship surveys conducted in summer and fall off California, Oregon, and Washington from
1991 through 2008 (Barlow 2010b). Recently, two sightings and an acoustic detection of a North
Pacific right whale have occurred in the vicinity of or in the Action Area. On June 20, 2013, a
newspaper reported that a single right whale was sighted in waters off Haida Gwaii, British
Colombia (located approximately 200 nautical miles (nm; 370 km) north of the Action Area;
Hume (2013)). Right whales had not been detected by two bottom deployed passive acoustic
monitoring devices in the offshore waters of Washington State from 2011 through 2012, but on
June 29, 2013 (9 days after the sighting to the north), a Navy-funded passive acoustic monitoring
device at Quinault Canyon (in the Action Area) detected two right whale calls within a two-hour
period (Sirovic et al. 2015). Approximately 4 months later (October 2013) another (different)
right whale was sighted in a group of humpback whales off the entrance to the Strait of Juan de
Fuca and moving south (DoN 2015b; Pynn 2013). Because of the low population numbers
(likely less than 1,000) in the North Pacific and the few individuals that have been observed
(Brownell Jr. et al. 2001); (Wade et al. 2006), 2011b), even given these recent
sightings/detections, this species is considered extremely rare in the Action Area. Based on this
information, there is a very low probability of encountering this species anywhere in the coastal
and offshore waters in the Action Area and their occurrence is therefore considered discountable
and thus not considered further in this Opinion.
4.1.1.2 Occurrence in Inland Waters of the NWTT Action Area
As noted above, the rarity of coastal records suggests right whales would not be present in more
inland areas. The occurrence of a North Pacific right whale within the Inland Waters is
considered extralimital and thus not considered further in this Opinion.
4.1.1.3 Occurrence in the Western Behm Canal, Alaska
North Pacific right whales were not observed during the Alaska Fisheries Science Center’s
National Marine Mammal Laboratory 1991 through 2007 surveys of the inland waters of
southeast Alaska (Dahlheim et al. 2009). Given their small population size (likely less than
98
Biological Opinion and Conference Report on Navy NWTT Activities and NMFS’ MMPA Incidental Take
Authorization PCTS FPR-2015-9110
1,000) and lack of sightings in southeast Alaska as noted above, North Pacific right whales are
considered extralimital within the Behm Canal portion of the NWTT Action Area and therefore
are not considered further in this Opinion.
4.1.1.4 Critical Habitat
In April 2008 (73 FR 19000), NMFS clarified that two areas previously designated as critical
habitat for right whales in the North Pacific (71 FR 38277) also applied to the listed North
Pacific right whale. The areas encompass about 36,750 square miles of marine habitat, which
include feeding areas within the Gulf of Alaska and the Bering Sea that support the species.
The Navy’s training and testing activities would not occur in the designated critical habitat nor
would the activities be expected to have any impacts to the critical habitat or the primary
constituent elements. Therefore, Navy NWTT activities in the Action Area are not likely to
adversely affect the designated critical habitat for North Pacific right whales. As a result, we will
not consider this critical habitat in greater detail in the remainder of this Opinion.
4.1.1.5 Conclusion
The extremely low population numbers of this species in the North Pacific Ocean over the past
five decades and the rarity of reports from these waters suggests that these whales are not
reasonably likely to be exposed to the activities considered in this consultation. As a result, this
species will not be considered in the remainder of this Opinion. Due to the North Pacific right
whale’s discountable likelihood of exposure to NWTT training and testing activities, and the lack
of designated critical habitat for this species in the Action Area, we have determined the North
Pacific right whale is not likely to be adversely affected by NWTT activities and will not be
considered further in this Opinion.
4.1.2 Western North Pacific Gray Whale
Gray whales (Eschrichtius robustus) are mysticetes, or baleen whales. Gray whales are the only
species in the family Eschrichtiidae. These large whales can grow to about 50 ft (15 m) long, and
weigh approximately 80,000 lb (35,000 kg). Females are slightly larger than males. They have a
mottled gray body, with small eyes located just above the corners of the mouth. Their "pectoral
fins" (flippers) are broad, paddle-shaped, and pointed at the tips. Lacking a dorsal fin, they
instead have a "dorsal hump" located about two-thirds of the way back on the body, and a series
of 8 to 14 small bumps, known as "knuckles," between the dorsal hump and the tail flukes. The
tail flukes are more than 15 ft (3 m) wide, have S-shaped trailing edges, and a deep median
notch.
99
Biological Opinion and Conference Report on Navy NWTT Activities and NMFS’ MMPA Incidental Take
Authorization PCTS FPR-2015-9110
Gray whales are frequently observed traveling alone or in small, unstable groups, although large
aggregations may be seen on feeding and breeding grounds. Similar to other baleen whales, long
term bonds between individuals are rare. Gray whales are bottom feeders, and suck sediment and
the "benthic" amphipods that are their prey from the sea floor. To do this, they roll on their sides
and swim slowly along, filtering their food through coarse baleen plates, of which they have 130
to 180 on each side of the upper jaw. In doing so, they often leave long trails of mud behind
them, and "feeding pits" in the sea floor.
Gray whales occur in two genetically distinct populations on the eastern and western sides of the
North Pacific Ocean (Brownell Jr. et al. 2009; Burdin et al. 2011; Kanda et al. 2010; Lang et al.
2004; Lang et al. 2005; Lang et al. 2010; Leduc et al. 2002; Swartz et al. 2006; Weller et al.
2007; Weller et al. 2004; Weller et al. 2006).
Western North Pacific gray whales migrate annually along Asia during autumn, although
migration routes are poorly known. Migration from summer foraging areas off the northeastern
coasts of Sakhalin Island and south-eastern Kamchatka along the Japanese coasts to the South
China Sea is suspected (Commission 2004; IWC 2003; Omura 1988; Tsidulko et al. 2005;
Weller et al. 2008; Weller et al. 2012b).
Eastern and western North Pacific gray whales were once considered geographically separated
along either side of the ocean basin, but recent photoidentification, genetic, and satellite tracking
data refute this. Two western North Pacific gray whales have been satellite tracked from Russian
foraging areas east along the Aleutian Islands, through the Gulf of Alaska, and south to the
Washington State and Oregonian coasts in one case (Mate et al. 2011) and to the southern tip of
Baja California and back to Sakhalin Island in another (IWC 2012). Comparisons of eastern and
western North Pacific gray whale catalogs have thus far identified 23 western gray whales
occurring on the eastern side of the basin during winter and spring (Weller et al. 2013). Burdin et
al. (2011) found an additional individual. During one field season off Vancouver Island, western
gray whales were found to constitute 6 of 74 (8.1 percent) of photoidentifications (Weller et al.
2012a). In addition, two genetic matches of western gray whales off Santa Barbara, California
have been made (Lang et al. 2011). Individuals have also been observed migrating as far as
Central Baja Mexico (Weller et al. 2012b).
Group sizes vary, but are roughly 2 (range 1 to 14) for non-calf groups and slightly larger for
groups containing calves (Weller et al. 2007; Weller et al. 2004; Weller et al. 2006; Weller et al.
1999; Yakovlev and Tyurneva 2004).
4.1.2.1 Distribution
Western North Pacific gray whales exhibit extensive plasticity in their occurrence, shifting use
areas within and between years, as well as over longer time frames, such as in response to
100
Biological Opinion and Conference Report on Navy NWTT Activities and NMFS’ MMPA Incidental Take
Authorization PCTS FPR-2015-9110
oceanic climate cycles (e.g., El Nino-Southern Oscillation, Pacific Decadal Oscillation, and
Arctic Oscillation) (Gardner and Chavez-Rosales 2000; Meier et al. 2007; Tyurneva et al. 2009;
Vladimirov et al. 2006a; Vladimirov et al. 2006b; Vladimirov et al. 2005; Vladimirov et al.
2008; Vladimirov et al. 2009; Vladimirov et al. 2010; Weller et al. 2012b; Yablokov and
Bogoslovskaya 1984; Yakovlev and Tyurneva 2005). Species distribution extends south along
Japan, the Koreas, and China from the Kamchatka Peninsula (IWC 2003; Kato and Kasuya.
2002; Omura 1988; Reeves et al. 2008; Weller et al. 2003). Other possible range states include
Vietnam, the Philippines, and Taiwan, although only historical whaling records support
occurrence in these areas (Henderson 1990; Ilyashenko 2009). Range has likely contracted from
the Koreas and other southern portions of the range versus pre-whaling periods. Prey availability
and, to a lesser extent, sea ice extent, are probably strong influences on the habitats used by
western North Pacific gray whales (Clarke and Moore 2002; Moore 2000).
4.1.2.1.1 Occurrence in the Offshore Portion of the NWTT Action Area
During visual surveys off the Washington coast from August 2004 through September 2008,
there were a total of 55 gray whale sightings of 116 individuals (Oleson et al. 2009). Clear
seasonal differences in gray whale distribution were noted based on three distinct time periods:
(1) winter (December through January), corresponding to the timing of their southbound
migration; (2) spring (February through April), corresponding to the timing of their northbound
migration; and (3) summer/fall (May through October), a time when any gray whales present are
primarily members of the Pacific Coast Feeding Group. Oleson et al. (2009) found significant
differences in the sighting distributions between these three time periods, based on an analysis of
distance from shore, distance from the shelf break, and water depth. During the winter
southbound migration, gray whales were sighted mainly offshore, with an average distance of 18
mi. (29 km) from the coast. This compared to the spring northbound migration when the average
distance was 6.2 mi. (10 km) from shore. During summer and fall, gray whale sightings were
clustered in two areas, in and around the entrance to Grays Harbor, Washington and in an
offshore area approximately 12 to 15 mi. (20 to 25 km) from shore (Oleson et al. 2009). These
offshore sightings were unusual given that in the Pacific Northwest the Pacific Coast Feeding
Group is typically close to shore (Calambokidis et al. 2002).
The occurrence of Eastern North Pacific gray whales and members of the Pacific Coast Feeding
Group in the Action Area is considered to be seasonal and to most likely occur in the offshore
portion of the Action Area during migrations between summer feeding grounds and winter
breeding grounds (Carretta et al. 2013a). Given their small population size and limited number of
sightings off the U.S. west coast, the occurrence of Western North Pacific gray whales in the
offshore portion of the Action Area is rare and not considered further in this Opinion.
101

Biological Opinion and Conference Report on Navy NWTT Activities and NMFS’ MMPA Incidental Take
Authorization PCTS FPR-2015-9110
4.1.2.1.2 Occurrence in Inland Waters of the NWTT Action Area
As the majority of gray whales migrate past the Strait of Juan de Fuca en route to or from their
feeding or breeding grounds, a few of them enter the inland waters to feed. Gray whales are
observed in Washington inland waters in all months of the year (Calambokidis et al. 2010;
Washington State Department of Fish and Wildlife 2012), with peak numbers from March
through June (Calambokidis et al. 2010). Typically fewer than 20 gray whales have been
documented annually in the inland waters of Washington and British Columbia based on a
review of Orca Network (Washington State Department of Fish and Wildlife 2012).
Calambokidis et al. (2009a) reported that Puget Sound (mudflats near the Whidbey Island and
Camano Island area) is used as a springtime feeding area for a small, regularly occurring group
of gray whales. Observed feeding areas are located in Saratoga Passage between Whidbey and
Camano Islands including Crescent Harbor, and in Port Susan Bay located between Camano
Island and the mainland in Possession Sound. These areas are between NASWI (Crescent
Harbor) and NAVSTA Everett.
In the Rich Passage to Agate Passage area in the vicinity of NAVBASE Kitsap Bremerton and
Keyport, 11 opportunistic sightings of gray whales were reported to Orca Network between
January 2003 and July 2012. One stranding, unassociated with Navy activities, occurred at
NAVBASE Kitsap Bremerton in January 2013. There are typically anywhere from 2 to 10
stranded gray whales per year in Washington (Cascadia Research 2012). Gray whales have been
sighted in Hood Canal south of the Hood Canal Bridge on six occasions since 1999, including a
stranded whale at Belfair State Park. The most recent report in Hood Canal was of characteristic
“blows” (air exhaled through the whale’s blowhole) in the waters near Lilliwaup in November
2010.
4.1.2.1.3 Occurrence in the Western Behm Canal, Alaska – NWTT Action Area
Gray whales were not observed during 1991 through 2007 surveys of the inland waters of
southeast Alaska (Dahlheim et al. 2009), and they are considered extralimital in this region of the
NWTT Action Area and therefore not considered further in this Opinion.
4.1.2.2 Critical Habitat
NMFS has not designated critical habitat for Western North Pacific gray whale.
4.1.2.3 Conclusion
Western North Pacific gray whales may be exposed to sonar and other active acoustic sources
associated with training activities in the Offshore Area of the Action Area; however, there are no
predicted effects resulting from the Navy’s modeling efforts and our analysis. Predicted
102
Biological Opinion and Conference Report on Navy NWTT Activities and NMFS’ MMPA Incidental Take
Authorization PCTS FPR-2015-9110
exposures to acoustic stressors would not exceed the current effects thresholds and thus would
not rise to the level of “take” pursuant to the ESA.
Gray whales may also be exposed to sonar or other active acoustic stressors when their presence
coincides with testing activities in the NWTT Action Area. Acoustic modeling predicts that the
Western North Pacific stock of gray whales may be exposed to sonar and other active acoustic
sources associated with testing activities in the Offshore Area; however, as with training, there
are no predicted effects from these testing activities that rise to the level of “take.”
Therefore, we conclude that stressors from training and testing activities may affect Western
North Pacific gray whales, but those effects are expected to be minor and would not rise to the
level of “take” as defined by the ESA and therefore would not adversely affect this species.
4.1.3 Green Sea Turtle
Four of the seven living species of sea turtles including leatherback (Dermochelys coriacea),
loggerhead (Caretta caretta), olive ridley (Lepidochelys olivacea), and green (Chelonia mydas)
have the potential to be found in the NWTT Action Area. The three hard-shell turtles of the
Cheloniidae family (loggerhead, olive ridley, and green) are considered tropical, subtropical, and
warm temperate species that rarely stray into cold waters (Eckert 1993b). Most hard-shell turtles
seek optimal seawater temperatures near 65 degrees Fahrenheit (°F) (18.3 degrees Celsius [°C])
and are cold-stressed at seawater temperatures below 50°F (10°C) (Mrosovsky 1980; Schwartz
1978). Under certain oceanographic conditions (e.g., warmer currents), all four species could
occur off the Washington and Oregon coasts (and occasionally in Alaska waters). However, the
cold waters off Washington and Oregon are above the typical northern limits for the three hard
shell turtles; therefore, these species are considered rare in the NWTT Action Area. In contrast,
leatherback sea turtles regularly occur in cold temperate waters characteristic of higher latitudes
(Eckert et al. 1989a; Pritchard 1982b).
Green sea turtles occur along the coasts of British Columbia and the States of Washington,
Oregon, and northernmost California (Bowlby et al. 1994), but those occurrences are usually
associated with mild or strong El Nino currents that push warmer water masses northward. When
those water masses dissipate, as has happened at least twice over the past two years, green sea
turtles become hypothermic in the colder, ambient temperatures. Because the NWTT Action
Area occurs at the thermal limits of green sea turtles (primarily because of low sea surface
temperatures), the probability of green sea turtles occurring in the Action Area is sufficiently
small for us to conclude that green sea turtles are not likely to be exposed to the activities
considered in this consultation. As a result, this species will not be considered in greater detail in
the remainder of this Opinion.
103
Biological Opinion and Conference Report on Navy NWTT Activities and NMFS’ MMPA Incidental Take
Authorization PCTS FPR-2015-9110
Critical habitat was designated in 1998. There is no designated green sea turtle critical habitat
within the Action Area. Therefore, Navy NWTT activities in the Action Area will not affect the
designated critical habitat for green sea turtles. As a result, we will not consider this critical
habitat further in the remainder of this Opinion.
4.1.4 Loggerhead Sea Turtle
Loggerhead sea turtles occur along the coasts of British Columbia and the States of Washington,
Oregon, and northernmost California, but those occurrences are usually associated with mild or
strong El Nino currents that push warmer water masses northward. When those water masses
dissipate, as has happened at least twice over the past two years, loggerhead sea turtles become
hypothermic in the colder, ambient temperatures. Because the Action Area occurs at the thermal
limits of loggerhead sea turtles (primarily because of low sea surface temperatures), the
probability of loggerhead sea turtles occurring in the Action Area is sufficiently small for us to
conclude that loggerhead sea turtles are not likely to be exposed to the activities considered in
this consultation. As a result, this species will not be considered in greater detail in the remainder
of this Opinion.
4.1.5 Olive Ridley Sea Turtle
Like green sea turtles, olive ridley sea turtles also occur along the coasts of British Columbia and
the States of Washington, Oregon, and northernmost California, but those occurrences are
usually associated with mild or strong El Nino currents that push warmer water masses
northward. When those water masses dissipate, as has happened at least twice over the past two
years, olive ridley sea turtles become hypothermic in the colder, ambient temperatures. Because
the Action Area occurs at the thermal limits of olive ridley sea turtles (primarily because of low
sea surface temperatures), the probability of olive ridley sea turtles occurring in the Action Area
is sufficiently small for us to conclude that olive ridley sea turtles are not likely to be exposed to
the activities considered in this consultation. As a result, this species will not be considered in
greater detail in the remainder of this Opinion.
4.1.6 Ozette Lake Sockeye Salmon
The NMFS originally listed Ozette Lake sockeye salmon ESU as a threatened species in 1999
(64 FR 14528). This classification was retained on June 28, 2005 (70 FR 37160). For additional
detail on the life history of steelhead, please refer to section 4.2.16.
Spatial Structure and Diversity: This species includes all naturally spawned populations of
sockeye salmon in Ozette Lake and streams and tributaries flowing into Ozette Lake,
Washington, and progeny of two artificial propagation programs. The Lake Ozette (LO)
Technical Recovery Team concluded that five extant spawning aggregations in Ozette Lake are
104
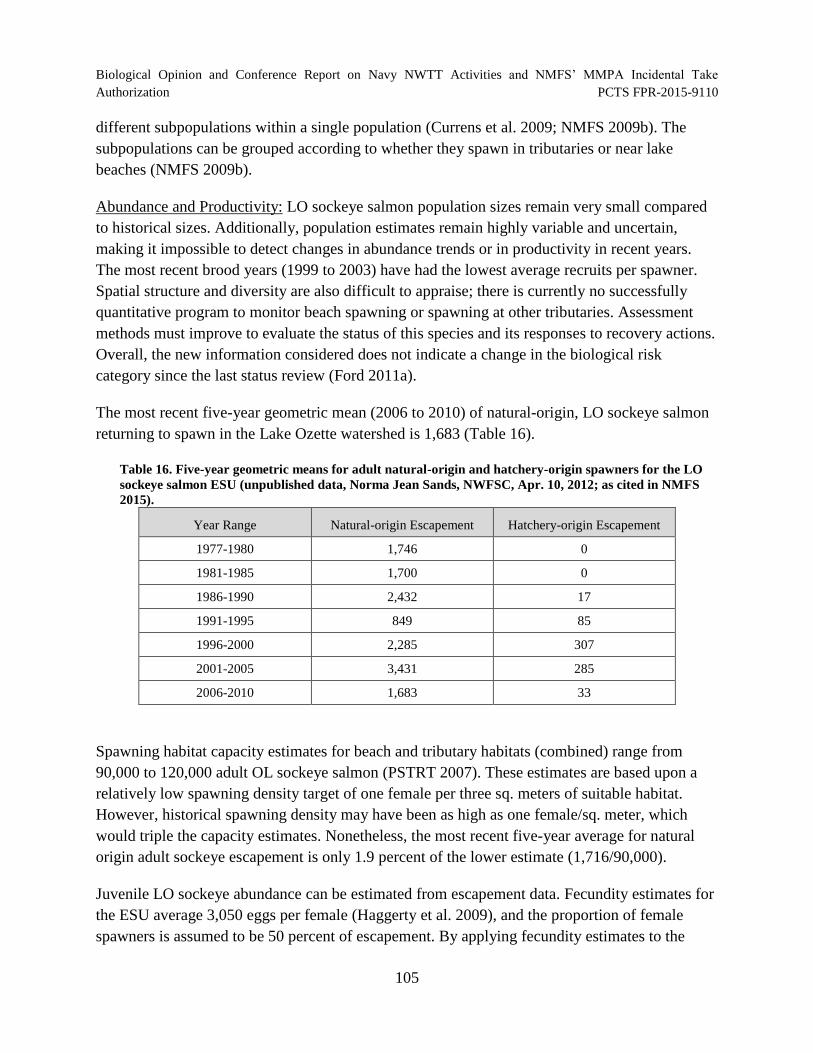
Biological Opinion and Conference Report on Navy NWTT Activities and NMFS’ MMPA Incidental Take
Authorization PCTS FPR-2015-9110
different subpopulations within a single population (Currens et al. 2009; NMFS 2009b). The
subpopulations can be grouped according to whether they spawn in tributaries or near lake
beaches (NMFS 2009b).
Abundance and Productivity: LO sockeye salmon population sizes remain very small compared
to historical sizes. Additionally, population estimates remain highly variable and uncertain,
making it impossible to detect changes in abundance trends or in productivity in recent years.
The most recent brood years (1999 to 2003) have had the lowest average recruits per spawner.
Spatial structure and diversity are also difficult to appraise; there is currently no successfully
quantitative program to monitor beach spawning or spawning at other tributaries. Assessment
methods must improve to evaluate the status of this species and its responses to recovery actions.
Overall, the new information considered does not indicate a change in the biological risk
category since the last status review (Ford 2011a).
The most recent five-year geometric mean (2006 to 2010) of natural-origin, LO sockeye salmon
returning to spawn in the Lake Ozette watershed is 1,683 (Table 16).
Table 16. Five-year geometric means for adult natural-origin and hatchery-origin spawners for the LO
sockeye salmon ESU (unpublished data, Norma Jean Sands, NWFSC, Apr. 10, 2012; as cited in NMFS
2015).
Year Range Natural-origin Escapement Hatchery-origin Escapement
1977-1980 1,746 0
1981-1985 1,700 0
1986-1990 2,432 17
1991-1995 849 85
1996-2000 2,285 307
2001-2005 3,431 285
2006-2010 1,683 33
Spawning habitat capacity estimates for beach and tributary habitats (combined) range from
90,000 to 120,000 adult OL sockeye salmon (PSTRT 2007). These estimates are based upon a
relatively low spawning density target of one female per three sq. meters of suitable habitat.
However, historical spawning density may have been as high as one female/sq. meter, which
would triple the capacity estimates. Nonetheless, the most recent five-year average for natural
origin adult sockeye escapement is only 1.9 percent of the lower estimate (1,716/90,000).
Juvenile LO sockeye abundance can be estimated from escapement data. Fecundity estimates for
the ESU average 3,050 eggs per female (Haggerty et al. 2009), and the proportion of female
spawners is assumed to be 50 percent of escapement. By applying fecundity estimates to the
105
Biological Opinion and Conference Report on Navy NWTT Activities and NMFS’ MMPA Incidental Take
Authorization PCTS FPR-2015-9110
expected escapement of females (both natural-origin and hatchery-origin spawners – 858
females), the ESU is estimated to produce approximately 2.62 million eggs annually. Analyzing
data from1991 to 2007 for the Lake Washington sub-basin, (McPherson and Woodey 2009)
found an average egg-to-fry survival rate of 13.5 percent (range 1.9 to 32.0 percent). Assuming a
similar 13.5 percent egg-to-fry survival for Lake Ozette, the ESU should produce roughly
353,282 natural outmigrants annually.
Limiting factors include (NMFS 2009b; NOAA Fisheries 2011; USDC 2009a):
Degraded freshwater habitat: Floodplain connectivity and function, channel structure and
complexity, riparian areas and large wood supply, lake beach spawning habitat, and stream
substrate have been degraded as a result of cumulative impacts of forest practices, agriculture,
and development.
Predation: Harbor seals and river otters, and predaceous non-native and native fish species, are
reducing the abundance of adult fish that successfully spawn, and the abundance of sockeye
smolts escaping seaward from the watershed each year.
4.1.6.1 Conclusion
As stated in the Effects of the Proposed Action section of this Opinion, it is thought that sockeye
follow a similar migration pattern as chum once they enter the ocean, moving north and west
along the coast, and have moved offshore by the end of their first ocean year (Byron and Burke
2014; Quinn 2005). Previously, French et al. (1976a) summarized the general migration pattern
of sockeye salmon originating in the various tributaries of the northeastern Pacific Ocean from
the Alaska Peninsula to the Columbia River. Tag recovery data indicated a general mixing of
these stocks during their residence in the northeastern Pacific Ocean. These fish primarily occur
east of 160oW and north of 48
oN (north of the NWTT Action Area). Pearcy and Fisher (1990)
observed the highest CPUE of juvenile sockeye inshore of 37 km, though some were caught over
55 km offshore. They noted that, similar to juvenile chum salmon, juvenile sockeye salmon were
less abundant than either coho or salmon off the Oregon and Washington coast.
As described in the Effects of the Proposed Action section of this Opinion, the only stressor we
determined was likely to adversely affect ESA-listed salmonids was explosive detonation. Since
the Navy will not conduct explosive activities in the Olympic Coast National Marine Sanctuary
and considering the oceanic migration path described above, Lake Ozette sockeye would be
expected to be north of the Action Area before they would be far enough offshore to co-occur
with Navy explosive activities. Therefore, the likelihood of affecting Ozette Lake sockeye
salmon is so low as to be discountable.
106
Biological Opinion and Conference Report on Navy NWTT Activities and NMFS’ MMPA Incidental Take
Authorization PCTS FPR-2015-9110
4.1.7 Southern California Steelhead
Southern California steelhead were listed as endangered in 1997 (62 FR 43937), when their
status was reviewed on January 5, 2006 they retained that classification (71 FR 834). For
additional detail on the life history of steelhead, please refer to section 4.2.17.
Spatial Structure and Diversity: The geographic range of this DPS extends from the Santa Maria
River, near Santa Maria, to the California-Mexico border, which represents the known southern
geographic extent of the anadromous form of O. mykiss. NMFS described historical and recent
steelhead abundance and distribution for the southern California coast through a population
characterization (Boughton et al. 2006). Surveys in Boughton et al. (2005) indicate between 58
percent and 65 percent of the historical steelhead basins currently harbor O. mykiss populations
at sites with connectivity to the ocean. Most of the apparent losses of steelhead were noted in the
south, including Orange and San Diego counties (Boughton et al. 2005).
Abundance and Productivity: While 46 drainages support this DPS (Boughton et al. 2005), only
10 population units possess a high and biologically plausible likelihood of being viable and
independent5
(Boughton et al. 2006). Very little data regarding abundances of Southern
California Coast steelhead are available, but the picture emerging from available data suggest
very small (<10 fish) but surprisingly consistent annual runs of anadromous fish across the
diverse set of basins that are currently being monitored (Williams et al. 2011). The most
significant population that has been recently monitored is in Topanga Creek, where mark-
recapture studies were done in 2007 and 2008. According to the authors (Bell et al. 2011), that
data indicated a population of resident fish whose abundance is on the order of 500 individuals,
including all size and age classes in Topanga Creek. It is believed that population abundance
trends can significantly vary based on yearly rainfall and storm events within the range of the
Southern California Coast DPS (Williams et al. 2011). A relatively large number of adult
steelhead were observed in 2008, two years after an extended wet spring that presumably gave
smolts ample opportunity to migrate to the ocean. Some of the strength of the 2008 season may
also be an artifact of conditions that year. Low rainfall appears to have caused many spawners to
get trapped in freshwater, where they were observed during the summer; in addition, low rainfall
probably improved conditions for viewing fish during snorkel surveys, and for trapping fish in
weirs (Williams et al. 2011). There is little new evidence to suggest that the status of the
Southern California DPS has changed appreciably in either direction since publication of the
most recent collections of status reviews (Good et al. 2005a; NMFS 2011d; Williams et al.
2011).
5 Independent population: a collection of one or more local breeding units whose population dynamics or extinction
risk over a 100-year time period is not substantially altered by exchanges of individuals with other populations
(Boughton et al. 2006).
107
Biological Opinion and Conference Report on Navy NWTT Activities and NMFS’ MMPA Incidental Take
Authorization PCTS FPR-2015-9110
Limiting Factors: The majority of lost populations (68 percent) in this DPS have been associated
with anthropogenic barriers to steelhead migration (e.g., dams, flood-control structures, culverts,
etc.). Additionally, investigators have found that barrier exclusions are statistically associated
with highly-developed watersheds. This DPS experiences a high magnitude of threat to a small
number of extant populations vulnerable to extirpation due to loss of accessibility to freshwater
spawning and rearing habitat, low abundance, degraded estuarine habitats and watershed
processes essential to maintain freshwater habitats (NMFS 2011d). The recovery potential is low
to moderate due to the lack of additional populations, lack of available/suitable freshwater
habitat, steelhead passage barriers, and inadequate instream flow.
4.1.7.1 Conclusion
Given the extremely low abundance of ESA-listed Southern California steelhead in general and
within the Action Area and the limited likelihood of co-occurrence with training and testing
stressors, the likelihood of affecting Southern California steelhead is so low as to be
discountable.
4.1.8 Southern DPS of Green Sturgeon
Green sturgeon are long-lived, slow-growing fish and the most marine-oriented of the sturgeon
species. Mature males range from 4.5 to 6.5 feet (1.4 to 2 m) in "fork length" and do not mature
until they are at least 15 years old, while mature females range from 5 to 7 feet (1.6 to 2.2 m)
fork length and do not mature until they are at least 17 years old. Maximum ages of adult green
sturgeon are likely to range from 60 to 70 years (Moyle 2002b). This species is found along the
west coast of Mexico, the United States, and Canada.
Although they are members of the class of bony fishes, the skeleton of sturgeons is composed
mostly of cartilage. Sturgeon lack scales; however, they have five rows of characteristic bony
plates on their body called "scutes". The backbone of the sturgeon curves upward into the caudal
fin, forming their shark-like tail. On the ventral, or underside, of their flattened snouts are
sensory barbels and a siphon-shaped, protrusible, toothless mouth. Recent genetic information
suggests that green sturgeon in North America are taxonomically distinct from morphologically
similar forms in Asia.
4.1.8.1 Populations
Two DPSs have been defined for green sturgeon (Acipenser medirostris), a northern DPS
(spawning populations in the Klamath and Rogue rivers) and a southern DPS (spawners in the
Sacramento River). Southern green sturgeon includes all naturally-spawned populations of green
sturgeon that occur south of the Eel River in Humboldt County, California. Only the Southern
DPS of green sturgeon is listed under the ESA.
108
Biological Opinion and Conference Report on Navy NWTT Activities and NMFS’ MMPA Incidental Take
Authorization PCTS FPR-2015-9110
4.1.8.2 Distribution
Green sturgeon occur along the west coast of North America from Mexico to the Bering Sea
(Adams et al. 2002; Colway and Stevenson 2007; Moyle 2002a), as well in freshwater rivers and
estuaries in between. Both northern DPS and southern DPS green sturgeon occupy coastal
estuaries and nearshore marine waters from southern California to Alaska, including Humboldt
Bay, the lower Columbia River estuary, Willapa Bay, Grays Harbor and southeast Alaska. In
general, green sturgeon are more common north of Point Conception, California. This DPS
occupies a limited number of river systems, primarily the main stems and tributaries of the
Sacramento, Feather, and San Joaquin rivers, all of which drain to San Francisco Bay (Israel et
al. 2009). The Sacramento River is the only known spawning habitat for the Southern green
sturgeon DPS (CDFG 2002; Moyle et al. 1992b). Spawning in the San Joaquin River does not
presently occur, likely as a result of damming and irrigation development. Adult and juvenile
green sturgeon occur throughout the Sacramento River. Although Southern DPS individuals in
freshwater occur primarily in the aforementioned waterways, some have been captured in rivers
of the Northern DPS, including the Klamath, Rogue, and Columbia rivers of northern California
and Oregon. Individuals have also rarely been captured in Southern California waters, but their
abundance increases north of Point Conception.
4.1.8.3 Habitat and movement
Green sturgeon are believed to spend the majority of their lives in nearshore oceanic waters,
bays, and estuaries. Early life-history stages reside in fresh water, with adults returning to
freshwater to spawn when they are more than 15 years of age and more than 4 feet (1.3 m) in
size. Spawning is believed to occur every 2 to 5 years (Moyle 2002b). Adults typically migrate
into fresh water beginning in late February; spawning occurs from March through July, with
peak activity from April through June (Moyle et al. 1995b). Females produce 60,000 to 140,000
eggs (Moyle et al. 1992a). Juvenile green sturgeon spend 1 to 4 years in fresh and estuarine
waters before dispersal to saltwater (Beamesderfer and Webb 2002a). Upon outmigration from
fresh water, subadult green sturgeon disperse widely along through continental shelf waters of
the west coast within the 110 meter contour (BRT 2005; Erickson and Hightower 2007; Moyle et
al. 1992b). It appears that Southern DPS green sturgeon preferentially distribute north of their
natal river during fall and move into bays and estuaries during summer and fall (Israel et al.
2009; Moser and Lindley 2007). Spawning individuals move south during spring to natal
freshwater habitat (Lindley et al. 2008).
Green sturgeon appear to prefer marine areas with high seafloor complexity and boulder
presence (Huff et al. 2011). Preferred areas also include depths of 20 to 60 m, with temperatures
of 9.5 to 16° C (Huff et al. 2011). In the San Joaquin River, green sturgeon appear to prefer
slopes or shoulders of navigational channels, not shallower shoals of less than 7 m (Peterson et
al. 2011). Channel centers are also frequently utilized (Peterson et al. 2011).
109
Biological Opinion and Conference Report on Navy NWTT Activities and NMFS’ MMPA Incidental Take
Authorization PCTS FPR-2015-9110
4.1.8.4 Reproduction
Adults infrequently occupy freshwater reaches primarily to spawn and spend the majority of
their lives in estuaries and coastal marine waters (Wilson and McKinley 2004). Sturgeon, like
salmon, possess strong site fidelity and will return to their natal streams to spawn (Bemis and
Canard 1997). This occurs between late February and July, with a peak in mid-April to mid-June,
hold in deep pools and return to salt water in the fall early, often with the first increases in fall
flows, although Northern DPS individuals in the Rogue River seek out slow-flow and off-
channel coves (Erickson et al. 2001; Erickson and Webb 2007a; Heublein et al. 2009; Moyle et
al. 1992b; Moyle et al. 1995a; Rien et al. 2001). Fish then tend to aggregate in deep pools, where
they will over-summer before outmigrating in the fall, although some fish have been observed
outmigrating relatively soon after presumed spawning events (Heublein et al. 2009). However,
multiple spawning events may occur annually, unlike annual spawning of salmonids (Heublein et
al. 2009). Adults may spend over 6 months in freshwater until water temperatures drop below
50º F in fall or winter or when a significant flow even occurs, although temperature or flow cues
are not always needed to initiate downstream migration (Erickson and Webb 2007a; Heublein et
al. 2009). In the Sacramento River adult green sturgeon spawn in late spring and early summer
above Hamilton City, above Red Bluff Diversion Dam, and possibly as far upstream as Keswick
Dam (CDFG 2002; Heublein et al. 2009). It appears that specific habitat for spawning includes
large cobblestones (where eggs can settle between), although spawning is known to occur over
clean sand or bedrock.
Adults likely return on a 2 to 5 year basis for spawning starting at 15 to 30 years of age for males
and 17 to 40 for females (Adams et al. 2002; Moyle 2002a; Van Eenennaam et al. 2006). Most
male spawners are young (17 to 18 years) while females on the spawning grounds are often older
(27 to 28 years). Females produce roughly 60,000 to 140,000 eggs per spawning event (Moyle et
al. 1992b; Scott and Crossman 1973). Each egg is large by sturgeon standards so as to contain
greater nourishment for embryos (Cech Jr. et al. 2000). Temperature may trigger spawning
behavior, with ranges of 48º to 62º F being influential (Moyle et al. 1995a). Water temperature is
also critical for egg survival with temperatures above 68º F being fatal to developing embryos
(Cech Jr. et al. 2000).
4.1.8.5 Growth
Green sturgeon spend their first 1 to 4 years in their natal streams and rivers (Beamesderfer and
Webb 2002b; Nakamoto et al. 1995), although they are believed to be physiologically adapted to
sea water survival at 6 months of age (Allen and Cech 2007; Allen et al. 2009; Allen and J.J.
Cech 2007). Larvae are active at night, a behavior that likely reduces predation and avoids being
moved downstream more than necessary (Cech Jr. et al. 2000). Green sturgeon larvae grow very
rapidly, reaching about 300 mm by age one (Deng 2000). Growth of the larval stage is ideal at
59º F, reduced below 52º F and above 66º F, and highly reduced above 75º F (Cech Jr. et al.
110
Biological Opinion and Conference Report on Navy NWTT Activities and NMFS’ MMPA Incidental Take
Authorization PCTS FPR-2015-9110
2000). Juvenile green sturgeon of the Northern DPS (Rogue River) have been captured in the
Rogue River estuary from April until the end of November (Rien et al. 2001). Green sturgeon are
a long-lived fish, and likely live for 60 to 70 years (Moyle 2002a).
4.1.8.6 Feeding
While in fresh water, juveniles feed on a variety of fishes and invertebrates (Moyle et al. 1992b).
One juvenile from the Sacramento-San Joaquin estuary was found to have preyed most
commonly upon opisthobranch mollusks (Philline sp.), with bay shrimp (Crangon sp.) and
overbite clams (Potamocorbula amurensis) as secondary prey. Other juveniles in the Sacramento
River delta feed on opossum shrimp (Neomysis mercedis) and Corophium amphipods (Radtke
1966).
The limited feeding data available for adult green sturgeon show that they consume benthic
invertebrates including shrimp, clams, chironomids, copepods, mollusks, amphipods, and small
fish (Dumbauld et al. 2008; Houston 1988; Moyle et al. 1992b; Wilson and McKinley 2004).
Starting as larvae, sturgeon use electroreception to identify prey. Olfaction and taste may also be
important to foraging, while vision is thought play a minor role in prey capture (Miller 2004).
4.1.8.7 Hearing and vocalization
We do not have specific information on hearing in green sturgeon. However, Meyer and Popper
(Meyer and Popper 2002) recorded auditory evoked potentials to pure tone stimuli of varying
frequency and intensity in lake sturgeon and reported that lake sturgeon detect pure tones from
100 to 2000 Hz, with best sensitivity from 100 to 400 Hz. They also compared these sturgeon
data with comparable data for oscar (Astronotus ocellatus) and goldfish (Carassius auratus) and
reported that the auditory brainstem responses for the lake sturgeon are more similar to the
goldfish (which is considered a hearing specialist that can hear up to 5,000 Hz) than to the oscar
(which is a non-specialist that can only detect sound up to 400 Hz); these authors, however, felt
additional data were necessary before lake sturgeon could be considered specialized for hearing.
Lovell et al. (2005) also studied sound reception in and the hearing abilities of paddlefish
(Polyodon spathula) and lake sturgeon (Acipenser fulvescens). They concluded that both species
were responsive to sounds ranging in frequency from 100 to 500 Hz with lowest hearing
thresholds from frequencies in bandwidths between 200 and 300 Hz and higher thresholds at 100
and 500 Hz. We assume that the hearing sensitivities reported for these other species of sturgeon
are representative of the hearing sensitivities of southern green sturgeon.
4.1.8.8 Status and trends
NMFS listed the southern population of the North American green sturgeon as threatened on
April 7, 2006 (71 FR 17757). Trend data for green sturgeon is severely limited. Available
111
Biological Opinion and Conference Report on Navy NWTT Activities and NMFS’ MMPA Incidental Take
Authorization PCTS FPR-2015-9110
information comes from two predominant sources, fisheries and tagging. Only three data sets
were considered useful for the population time series analyses by NMFS’ biological review
team: the Klamath Yurok Tribal fishery catch, a San Pablo sport fishery tag returns, and
Columbia River commercial landings (BRT 2005). Using San Pablo sport fishery tag recovery
data, the California Department of Fish and Game produced a population time series estimate for
the southern DPS. San Pablo data suggest that green sturgeon abundance may be increasing, but
the data showed no significant trend. The data set is not particularly convincing, however, as it
suffers from inconsistent effort and since it is unclear whether summer concentrations of green
sturgeon provide a strong indicator of population performance (BRT 2005). Although there is not
sufficient information available to estimate the current population size of southern green
sturgeon, catch of juveniles during state and federal salvage operations in the Sacramento delta
are low in comparison to catch levels before the mid-1980s.
4.1.8.9 Natural threats
Green sturgeon eggs and larvae are likely preyed upon by a variety of larger fish and animals,
while sub-adult and adult sturgeon may occasionally be preyed upon by shark, sea lions, or other
large body predators. Physical barriers, changes in water flow and temperatures may also affect
fresh water survival.
4.1.8.10 Anthropogenic threats
The principle threat to southern green sturgeon comes from a drastic reduction in available
spawning area from impassible barriers (e.g., Oroville, Shasta and Keswick dams). Other threats
include potentially lethal temperature limits, harvest, entrainment by water projects and toxins
and invasive species (Adams et al. 2007; Erickson and Webb 2007b; Lackey 2009). Since this
DPS is composed of a single spawning population within the Sacramento River, stochastic
variation in environmental conditions and significant fluctuations in demographic rates increases
the risk of extinction for this DPS.
Climate change has the potential to affect sturgeon in similar, if not more significant ways it
affects salmonids. Elevated air temperatures could lead to precipitation falling as rain instead of
snow. Additionally, snow would likely melt sooner and more rapidly, potentially leading to
greater flooding during melting and lower water levels at other times, as well as warmer river
temperatures. Although sturgeon can spawn over varied benthic habitat, they prefer localized
depressions in riverbeds (Moyle et al. 1992a; Moyle et al. 1995b). Increased extremes in river
flow (i.e., periods of flooding and low flow) can alternatively disrupt and fill in spawning habitat
that sturgeon rely upon (ISAB 2007). If water flow is low during migration events, it is likely
that new obstacles can impede or block sturgeon movement. As with other anadromous fishes,
sturgeon are uniquely evolved to the environments that they live in. Because of this specificity,
broad scale changes in environment can be difficult to adapt to, including changes in water
112
Biological Opinion and Conference Report on Navy NWTT Activities and NMFS’ MMPA Incidental Take
Authorization PCTS FPR-2015-9110
temperature. Sturgeon are also sensitive to elevated water temperatures. Temperature triggers
spawning behavior. Warmer water temperatures can initial spawning earlier in a season for
salmon and the same can be true for sturgeon (ISAB 2007). If river and lake temperatures
become anomalously warm, juvenile sturgeon may experience elevated mortality due to lack of
cooler water refuges in freshwater habitats. Apart from direct changes to sturgeon survival,
altered water temperatures may disrupt habitat, including the availability of prey (ISAB 2007).
Warmer temperatures may also have the effect of increasing water use in agriculture, both for
existing fields and the establishment of new ones in once unprofitable areas (ISAB 2007). This
means that streams, rivers, and lakes will experience additional withdrawal of water for irrigation
and increasing contaminant loads from returning effluent. Overall, it is likely that global
warming will increase pressures on sturgeon survival and recovery.
Poaching also poses an unknown but potentially serious threat because of high demand for
sturgeon caviar. Retention of green sturgeon in both recreational and commercial fisheries is now
prohibited within the western states, but the effect of capture/release in these fisheries is
unknown. There is evidence of fish being retained illegally, although the magnitude of this
activity likely is small (NOAA Fisheries 2011).
Studies from other sturgeon species indicate that sturgeon readily bioaccumulate contaminants.
White sturgeon from the Kootenai River have been found to contain aluminum, arsenic,
cadmium, chromium, cobalt, copper, iron, lead, manganese, mercury, nickel, selenium, zinc,
DDE, DDT, PCBs, and other organochlorines (Kruse and Scarnecchia 2001). Mercury has also
been identified from white sturgeon of the lower Columbia River (Webb et al. 2006). Numerous
organochlorines, including DDT, DDD, DDE, chlordane, and dieldrin have also been identified
in these fish (Foster et al. 2001). Observed concentrations are likely sufficient to influence
reproductive physiology.
4.1.8.11 Conclusion
The offshore Action Area overlaps with the marine distribution of green sturgeon off the coast of
Oregon, Washington, and California. As stated in the Status of Listed Resources section of this
Opinion, green sturgeon prefer marine areas with high seafloor complexity and boulder presence
at depths of 20 to 60 m, with temperatures of 9.5 to 16° C (Huff et al. 2011). The limited feeding
data available for adult green sturgeon show that they consume benthic invertebrates including
shrimp, clams, chironomids, copepods, mollusks, amphipods, and small fish (Dumbauld et al.
2008; Houston 1988; Moyle et al. 1992b; Wilson and McKinley 2004).
Information regarding their preference for areas of high seafloor complexity and prey selection
in coastal waters (benthic prey) indicate green sturgeon reside and migrate along the seafloor
while in coastal waters. Additionally, Huff et al. (2011) suggest that green sturgeon occur at low
densities in the coastal marine environment. Given the infrequent nature of underwater
113
Biological Opinion and Conference Report on Navy NWTT Activities and NMFS’ MMPA Incidental Take
Authorization PCTS FPR-2015-9110
explosions in the offshore environment, the low density of green sturgeon in the offshore
environment, the species’ preference for benthic habitat when in marine waters, the likelihood of
a green sturgeon encountering an explosive activity taking place anywhere in the offshore is
remote. Therefore, explosions in the offshore Action Area are not likely to adversely affect green
sturgeon.
Green sturgeon are not known to spawn in any rivers in Puget Sound. Additionally, very few
green sturgeon have been found in Puget Sound, with only two confirmed observations in 2006
(NMFS 2012b). Given the infrequent nature of underwater explosions in inland waters of the
Action Area and the low documented abundance of green sturgeon in Puget Sound, we believe
the likelihood of these species encountering elevated underwater noise from an explosion to be
remote. Because of this, green sturgeon are not likely to be adversely affected by underwater
explosions in inland waters.
The southern DPS of green sturgeon disperse from their Californian natal rivers and move
northward along the continental shelf as adults. During this time they typically remain in the
nearshore environment within the range of the 110 m depth contour and remain along the bottom
of the seafloor. As such, they have a limited likelihood of exposure to non-impulsive acoustic
stressors such as sonar at levels capable of eliciting a response.
Given the low abundance of ESA-listed green sturgeon within the Action Area and the limited
likelihood of co-occurrence with other training and testing stressors, the likelihood of affecting
green sturgeon is so low as to be discountable.
4.1.9 Critical Habitat for the Southern DPS of Green Sturgeon
On October 9, 2009, NMFS designated critical habitat for the Southern DPS of green sturgeon
(74 FR 52300).
Critical habitat is designated in coastal U.S. marine waters within 60 fathoms depth from
Monterey Bay, California (including Monterey Bay), north to Cape Flattery, Washington,
including the Strait of Juan de Fuca, Washington, to its United States boundary; the Sacramento
River, lower Feather River, and lower Yuba River in California; the Sacramento-San Joaquin
Delta and Suisun, San Pablo, and San Francisco bays in California; the lower Columbia River
estuary; and certain coastal bays and estuaries in California (Humboldt Bay), Oregon (Coos Bay,
Winchester Bay, Yaquina Bay, and Nehalem Bay), and Washington (Willapa Bay and Grays
Harbor) and freshwater (USDC 2009b). For freshwater rivers north of and including the Eel
River, the areas upstream of the head of the tide were not considered part of the geographical
area occupied by the southern DPS.
Table 17 below delineates physical and biological features for southern green sturgeon.
114
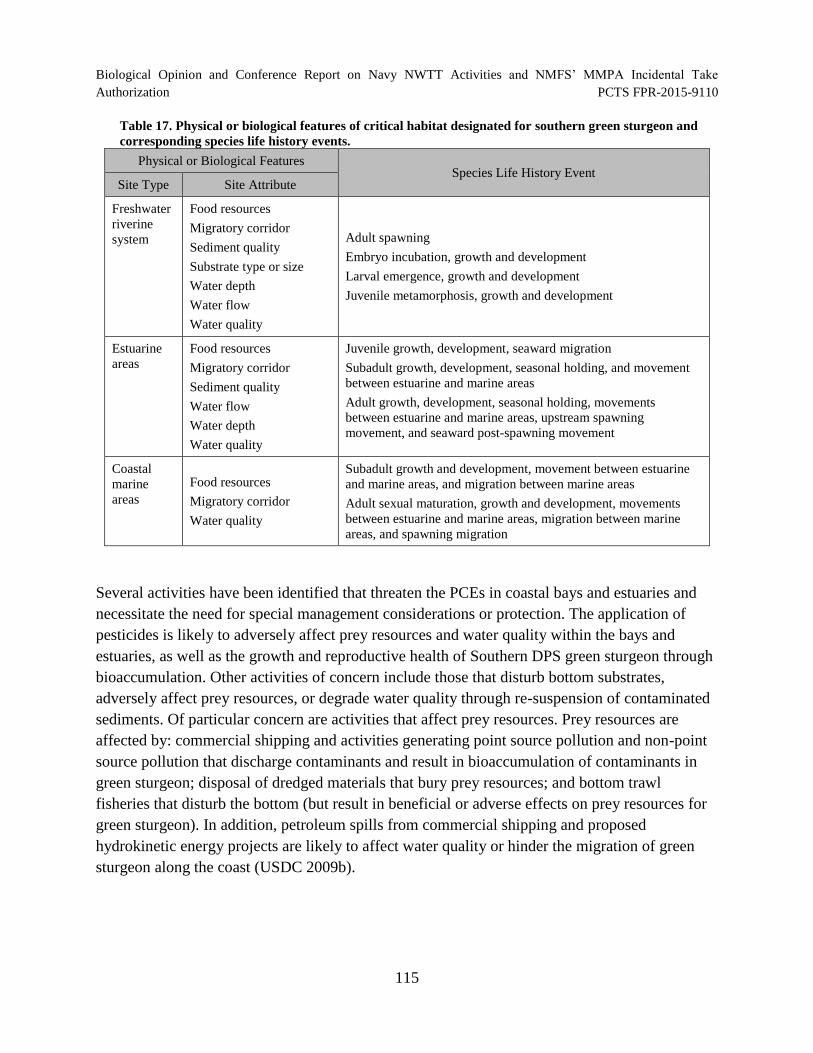
Biological Opinion and Conference Report on Navy NWTT Activities and NMFS’ MMPA Incidental Take
Authorization PCTS FPR-2015-9110
Table 17. Physical or biological features of critical habitat designated for southern green sturgeon and
corresponding species life history events.
Physical or Biological Features Species Life History Event
Site Type Site Attribute
Freshwater
riverine
system
Food resources
Migratory corridor
Sediment quality
Substrate type or size
Water depth
Water flow
Water quality
Adult spawning
Embryo incubation, growth and development
Larval emergence, growth and development
Juvenile metamorphosis, growth and development
Estuarine
areas
Food resources
Migratory corridor
Sediment quality
Water flow
Water depth
Water quality
Juvenile growth, development, seaward migration
Subadult growth, development, seasonal holding, and movement
between estuarine and marine areas
Adult growth, development, seasonal holding, movements
between estuarine and marine areas, upstream spawning
movement, and seaward post-spawning movement
Coastal Subadult growth and development, movement between estuarine
marine Food resources and marine areas, and migration between marine areas
areas Migratory corridor
Water quality
Adult sexual maturation, growth and development, movements
between estuarine and marine areas, migration between marine
areas, and spawning migration
Several activities have been identified that threaten the PCEs in coastal bays and estuaries and
necessitate the need for special management considerations or protection. The application of
pesticides is likely to adversely affect prey resources and water quality within the bays and
estuaries, as well as the growth and reproductive health of Southern DPS green sturgeon through
bioaccumulation. Other activities of concern include those that disturb bottom substrates,
adversely affect prey resources, or degrade water quality through re-suspension of contaminated
sediments. Of particular concern are activities that affect prey resources. Prey resources are
affected by: commercial shipping and activities generating point source pollution and non-point
source pollution that discharge contaminants and result in bioaccumulation of contaminants in
green sturgeon; disposal of dredged materials that bury prey resources; and bottom trawl
fisheries that disturb the bottom (but result in beneficial or adverse effects on prey resources for
green sturgeon). In addition, petroleum spills from commercial shipping and proposed
hydrokinetic energy projects are likely to affect water quality or hinder the migration of green
sturgeon along the coast (USDC 2009b).
115
Biological Opinion and Conference Report on Navy NWTT Activities and NMFS’ MMPA Incidental Take
Authorization PCTS FPR-2015-9110
4.1.9.1 Conclusion
Training and testing activities do not occur in freshwater habitats and will not affect critical
habitat designated in these areas. Offshore areas of critical habitat and those at the mouth of
Puget Sound co-occur with portions of the NWTT Action Area. The critical habitat’s biological
feature important to the life stages of green sturgeon that could be affected by NWTT activities
are food resources. No changes in water quality, depth, flow, sediment quality, or impediment of
migration corridors would be expected to occur. In the event acoustic stressors (or any other
stressors) affect forage species, the impact is anticipated to be temporary and of short duration
(only occurring during ensonification or activity duration) and of negligible magnitude (in terms
of area size and proportion of available forage). Therefore, NWTT activities are not likely to
adversely affect green sturgeon critical habitat.
4.1.10 Critical Habitat for ESA-listed Rockfish
On February 11, 2015, NMFS designated critical habitat for the threatened DPS of yelloweye
rockfish (Sebastes ruberrimus), the threatened DPS of canary rockfish (S. pinniger), and the
endangered DPS of bocaccio (S. paucispinus) (79 FR 68041). The specific areas in the final
designation include 590.4 square miles (1,529 square km) of nearshore habitat in Puget
Sound/Georgia Basin, Washington for canary rockfish and bocaccio, and 414.1 square miles
(1,072.5 square km) of deepwater habitat in Puget Sound/Georgia Basin for yelloweye rockfish,
canary rockfish and bocaccio.
Benthic habitats or sites deeper than 30 m (98ft) that possess or are adjacent to areas of complex
bathymetry consisting of rock and or highly rugose habitat are essential to conservation because
these features support growth, survival, reproduction, and feeding opportunities by providing the
structure for rockfishes to avoid predation, seek food and persist for decades. Several attributes
of these sites determine the quality of the habitat. Physical or biological features essential to the
conservation of adult canary rockfish and bocaccio, and adult and juvenile yelloweye rockfish
include the following: 1) Quantity, quality, and availability of prey species to support individual
growth, survival, reproduction, and feeding opportunities, 2) water quality and sufficient levels
of dissolved oxygen to support growth, survival, reproduction, and feeding opportunities, and 3)
the type and amount of structure and rugosity that supports feeding opportunities and predator
avoidance (79 FR 68041).
Juvenile settlement habitats located in the nearshore with substrates such as sand, rock and/or
cobble compositions that also support kelp (families Chordaceae, Alariaceae, Lessoniacea,
Costariaceae, and Laminaricea) are essential for conservation because these features enable
forage opportunities and refuge from predators and enable behavioral and physiological changes
needed for juveniles to occupy deeper adult habitats. Several attributes of these sites determine
the quality of the area. The physical or biological features essential to the conservation of
116

Biological Opinion and Conference Report on Navy NWTT Activities and NMFS’ MMPA Incidental Take
Authorization PCTS FPR-2015-9110
juvenile canary rockfish and bocaccio include the following: 1) Quantity, quality, and
availability of prey species to support individual growth, survival, reproduction, and feeding
opportunities; and 2) water quality and sufficient levels of dissolved oxygen to support growth,
survival, reproduction, and feeding opportunities (79 FR 68041).
Many forms of human activities have the potential to affect the essential features of listed
rockfish species: (1) Nearshore development and in-water construction (e.g., beach armoring,
pier construction, jetty or harbor construction, pile driving construction, residential and
commercial construction); (2) dredging and disposal of dredged material; (3) pollution and
runoff; (4) underwater construction and operation of alternative energy hydrokinetic projects
(tidal or wave energy projects) and cable laying; (5) kelp harvest; (6) fisheries; (7) non-
indigenous species introduction and management; (8) artificial habitats; (9) research activities;
(10) aquaculture, and; (11) activities that lead to global climate change and ocean acidification.
All of these activities may have an effect on one or more physical or biological features via their
potential alteration of one or more of the following: adult habitats, food resources, juvenile
settlement habitat, and water quality (79 FR 68041).
Section 4(a)(3) of the ESA precludes the Secretary from designating military lands as critical
habitat if those lands are subject to an Integrated Natural Resource Management Plan (INRMP)
under the Sikes Act that the Secretary certifies in writing benefits the listed species. NMFS
consulted with the DOD and determined that there are several installations with INRMPs which
overlap with marine habitats occupied by listed rockfish: (1) Joint base Lewis-McCord: (2)
Manchester Fuel Department, (3) Naval Air Station Whidbey Island, (4) Naval Station Everett,
and (5) Naval Station Kitsap. The final rule designating critical habitat for rockfish in Puget
Sound/Georgia Basin excluded areas identified within INRMPs from critical habitat designation
(79 FR 68041).
4.1.10.1 Conclusion
Few training and testing activities occur in Puget Sound (primarily acoustic stressors) and would
co-occur with portions of rockfish critical habitat. The critical habitat’s biological feature
important to the life stages of rockfish that could be affected by NWTT activities are food
resources. No changes in water quality would be expected to occur. In the event acoustic
stressors (or any other stressors) affect forage species, the impact is anticipated to be temporary
and of short duration (only occurring during ensonification or activity duration) and of negligible
magnitude (in terms of area size and proportion of available forage). Therefore, NWTT activities
are not likely to adversely affect rockfish critical habitat.
117
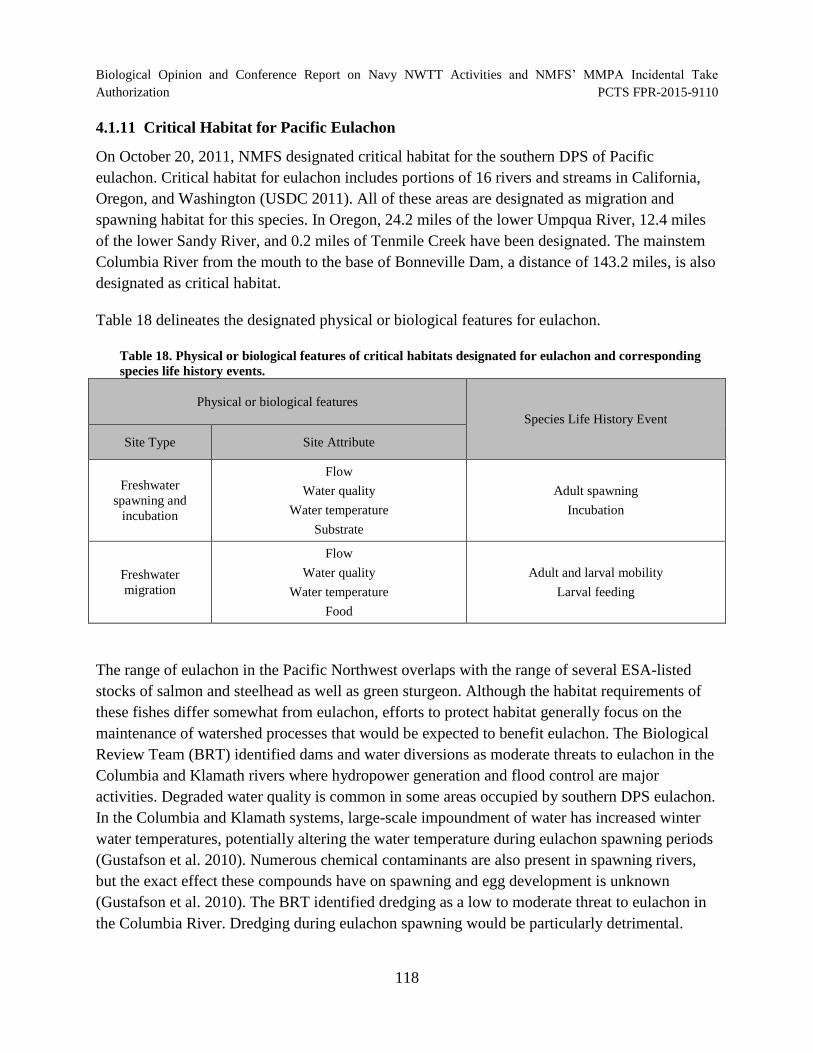
Biological Opinion and Conference Report on Navy NWTT Activities and NMFS’ MMPA Incidental Take
Authorization PCTS FPR-2015-9110
4.1.11 Critical Habitat for Pacific Eulachon
On October 20, 2011, NMFS designated critical habitat for the southern DPS of Pacific
eulachon. Critical habitat for eulachon includes portions of 16 rivers and streams in California,
Oregon, and Washington (USDC 2011). All of these areas are designated as migration and
spawning habitat for this species. In Oregon, 24.2 miles of the lower Umpqua River, 12.4 miles
of the lower Sandy River, and 0.2 miles of Tenmile Creek have been designated. The mainstem
Columbia River from the mouth to the base of Bonneville Dam, a distance of 143.2 miles, is also
designated as critical habitat.
Table 18 delineates the designated physical or biological features for eulachon.
Table 18. Physical or biological features of critical habitats designated for eulachon and corresponding
species life history events.
Physical or biological features
Species Life History Event
Site Type Site Attribute
Freshwater
spawning and
incubation
Flow
Water quality
Water temperature
Substrate
Adult spawning
Incubation
Freshwater
migration
Flow
Water quality
Water temperature
Food
Adult and larval mobility
Larval feeding
The range of eulachon in the Pacific Northwest overlaps with the range of several ESA-listed
stocks of salmon and steelhead as well as green sturgeon. Although the habitat requirements of
these fishes differ somewhat from eulachon, efforts to protect habitat generally focus on the
maintenance of watershed processes that would be expected to benefit eulachon. The Biological
Review Team (BRT) identified dams and water diversions as moderate threats to eulachon in the
Columbia and Klamath rivers where hydropower generation and flood control are major
activities. Degraded water quality is common in some areas occupied by southern DPS eulachon.
In the Columbia and Klamath systems, large-scale impoundment of water has increased winter
water temperatures, potentially altering the water temperature during eulachon spawning periods
(Gustafson et al. 2010). Numerous chemical contaminants are also present in spawning rivers,
but the exact effect these compounds have on spawning and egg development is unknown
(Gustafson et al. 2010). The BRT identified dredging as a low to moderate threat to eulachon in
the Columbia River. Dredging during eulachon spawning would be particularly detrimental.
118
Biological Opinion and Conference Report on Navy NWTT Activities and NMFS’ MMPA Incidental Take
Authorization PCTS FPR-2015-9110
The lower Columbia River mainstem provides spawning and incubation sites, and a large
migratory corridor to spawning areas in the tributaries. Prior to the construction of Bonneville
Dam, eulachon ascended the Columbia River as far as Hood River, Oregon. Major tributaries
that support spawning runs include the Grays, Skamokawa, Elochoman, Kalama, Lewis and
Sandy rivers.
4.1.11.1 Conclusion
None of the NWTT activities occur in freshwater environments; therefore, no Eulachon critical
habitat will be affected.
4.1.12 Critical Habitat for Puget Sound Chinook Salmon
The NMFS designated critical habitat for Puget Sound Chinook salmon on September 2, 2005
(70 FR 52630). The specific geographic area includes portions of the Nooksack River, Skagit
River, Sauk River, Stillaguamish River, Skykomish River, Snoqualmie River, Lake Washington,
Green River, Puyallup River, White River, Nisqually River, Hamma Hamma River and other
Hood Canal watersheds, the Dungeness/Elwha Watersheds, and nearshore marine areas of the
Strait of Georgia, Puget Sound, Hood Canal, and the Strait of Juan de Fuca. This designation
includes the stream channels within the designated stream reaches, and includes a lateral extent
as defined by the ordinary high water line. In areas where the ordinary high water line is not
defined the lateral extent is defined as the bank full elevation.
The designation for this ESU includes sites necessary to support one or more life stages. These
areas are important for the species’ overall conservation by protecting quality growth,
reproduction, and feeding. The PCEs of PS Chinook salmon critical habitat are:
Freshwater spawning sites with water quantity and quality conditions and substrate that
support spawning, incubation, and larval development;
Freshwater rearing sites with (1) water quantity and floodplain connectivity to form and
maintain physical habitat conditions and support juvenile growth and mobility, (2) water
quality and forage that support juvenile development, and (3) natural cover such as shade,
submerged and overhanging large wood, logjams and beaver dams, aquatic vegetation,
large rocks and boulders, side channels, and undercut banks;
Freshwater migration corridors free of obstruction and excessive predation with water
quantity and quality conditions and natural cover such as submerged and overhanging
large wood, aquatic vegetation, large rocks and boulders, side channels, and undercut
banks that support juvenile and adult mobility and survival;
119
Biological Opinion and Conference Report on Navy NWTT Activities and NMFS’ MMPA Incidental Take Authorization PCTS FPR-2015-9110
Estuarine areas free of obstruction and excessive predation with water quality, water
quantity, and salinity conditions supporting juvenile and adult physiological transitions
between fresh- and saltwater; natural cover such as submerged and overhanging large
wood, aquatic vegetation, large rocks and boulders, side channels; and juvenile and adult
forage, including aquatic invertebrates and fishes, supporting growth and maturation;
Nearshore marine areas free of obstruction and excessive predation with water quality
and quantity conditions and forage, including aquatic invertebrates and fishes, supporting
growth and maturation; and natural cover such as submerged and overhanging large
wood, aquatic vegetation, large rocks and boulders, and side channels; and
Offshore marine areas with water quality conditions and forage, including aquatic invertebrates and fishes, supporting growth and maturation.
Of 49 subbasins reviewed in NMFS' assessment of critical habitat for the Puget Sound ESUs,
nine subbasins were rated as having a medium conservation value, 12 were rated as low, and the
remaining subbasins (40), where the bulk of Federal lands occur for this ESU, were rated as
having a high conservation value to Puget Sound Chinook salmon. Factors contributing to the
downward trends in this ESU are hydromorphological changes (such as diking, revetments, loss
of secondary channels in floodplains, widespread blockages of streams, and changes in peak
flows), degraded freshwater and marine habitat affected by agricultural activities and
urbanization, and upper river tributaries widely affected by poor forest practices. Changes in
habitat quantity, availability, diversity, flow, temperature, sediment load, and channel stability
are common limiting factors in areas of critical habitat. Floodplain connectivity and function,
channel structure and complexity, riparian areas and large wood supply, stream substrate, and
water quality have also been degraded for adult spawning, embryo incubation, and rearing as a
result of cumulative impacts of agriculture, forestry, and development.
Residential and commercial development has reduced the amount of functioning nearshore and
estuarine habitat available for salmon rearing and migration (NMFS 2011b; SSPS 2007b). The
nearshore marine habitat has been extensively altered and armored by industrial and residential
development near the mouths of many of Puget Sound’s tributaries. A railroad runs along large
portions of the eastern shoreline of Puget Sound, eliminating natural cover along the shore and
natural recruitment of beach sand (SSPS 2007b). The loss of mudflats, eelgrass meadows, and
macroalgae further limits salmon foraging and rearing opportunities in nearshore and estuarine
areas.
4.1.12.1 Conclusion
Training and testing activities do not occur in freshwater habitats and will not affect critical
habitat designated in these areas. Critical habitat in offshore areas and estuarine areas may co
120
Biological Opinion and Conference Report on Navy NWTT Activities and NMFS’ MMPA Incidental Take
Authorization PCTS FPR-2015-9110
occur with portions of the NWTT Action Area. The critical habitat’s biological feature important
to the life stages of chinook salmon that could be affected by NWTT activities are forage
resources. No changes in water quality, quantity, or natural cover would be expected to occur. In
the event acoustic stressors (or any other stressors) affect forage species, the impact is
anticipated to be temporary and of short duration (only occurring during ensonification or
activity duration) and of negligible magnitude (in terms of area size and proportion of available
forage). Therefore, NWTT activities are not likely to adversely affect chinook salmon critical
habitat.
4.1.13 Critical Habitat for Puget Sound Steelhead (Proposed)
Proposed critical habitat for PS steelhead (78 FR 2726, NMFS 2013) is almost identical to that
for PS Chinook salmon, including habitat areas suitable for spawning, rearing, and unobstructed
migration corridors to and from spawning and rearing habitats.
4.1.13.1 Conclusion
Training and testing activities do not occur in freshwater habitats and will not affect critical
habitat designated in these areas. Critical habitat in offshore areas and estuarine areas may co-
occur with portions of the NWTT Action Area. The critical habitat’s biological feature important
to the life stages of steelhead that could be affected by NWTT activities are forage resources. No
changes in water quality, quantity, or natural cover would be expected to occur. In the event
acoustic stressors (or any other stressors) affect forage species, the impact is anticipated to be
temporary and of short duration (only occurring during ensonification or activity duration) and of
negligible magnitude (in terms of area size and proportion of available forage). Therefore,
NWTT activities are not likely to adversely affect steelhead critical habitat.
4.1.14 Critical Habitat for Hood Canal Summer Run Chum Salmon
NMFS designated critical habitat for Hood Canal summer-run chum salmon on September 2,
2005 (70 FR 52630). The specific geographic area includes the Skokomish River, Hood Canal
subbasin, which includes the Hamma Hamma and Dosewallips rivers and others, the Puget
Sound subbasin, Dungeness/Elwha subbasin, and nearshore marine areas of Hood Canal and the
Strait of Juan de Fuca from the line of extreme high tide to a depth of 30 meters. This includes a
narrow nearshore zone from the extreme high-tide to mean lower low tide within several Navy
security/restricted zones. Additionally, about 8 miles of habitat was unoccupied at the time it was
designated, including Finch, Anderson and Chimacum Creeks (69 FR 74572; 70 FR 52630), but
has recently been re-seeded. The designation for Hood Canal summer-run chum, like others
made at this time, includes the stream channels within the designated stream reaches, and
includes a lateral extent as defined by the ordinary high water line. In areas where the ordinary
high-water line is not defined the lateral extent is defined as the bank full elevation.
121
Biological Opinion and Conference Report on Navy NWTT Activities and NMFS’ MMPA Incidental Take
Authorization PCTS FPR-2015-9110
The designation for this ESU includes sites necessary to support one or more life stages. These
areas are important for the species’ overall conservation by protecting quality growth,
reproduction, and feeding. The PCEs of Hood Canal summer run chum salmon critical habitat
are:
Freshwater spawning sites with water quantity and quality conditions and substrate that
support spawning, incubation, and larval development;
Freshwater rearing sites with (1) water quantity and floodplain connectivity to form and
maintain physical habitat conditions and support juvenile growth and mobility, (2) water
quality and forage that support juvenile development, and (3) natural cover such as shade,
submerged and overhanging large wood, logjams and beaver dams, aquatic vegetation,
large rocks and boulders, side channels, and undercut banks;
Freshwater migration corridors free of obstruction and excessive predation with water
quantity and quality conditions and natural cover such as submerged and overhanging
large wood, aquatic vegetation, large rocks and boulders, side channels, and undercut
banks that support juvenile and adult mobility and survival;
Estuarine areas free of obstruction and excessive predation with water quality, water
quantity, and salinity conditions supporting juvenile and adult physiological transitions
between fresh- and saltwater; natural cover such as submerged and overhanging large
wood, aquatic vegetation, large rocks and boulders, side channels; and juvenile and adult
forage, including aquatic invertebrates and fishes, supporting growth and maturation;
Nearshore marine areas free of obstruction and excessive predation with water quality
and quantity conditions and forage, including aquatic invertebrates and fishes, supporting
growth and maturation; and natural cover such as submerged and overhanging large
wood, aquatic vegetation, large rocks and boulders, and side channels; and
Offshore marine areas with water quality conditions and forage, including aquatic invertebrates and fishes, supporting growth and maturation.
Of 17 subbasins reviewed in NMFS’s assessment of critical habitat for the Hood Canal chum
salmon, 14 subbasins were rated as having a high conservation value, while only three were rated
as having a medium value to the conservation. These areas are important for the species’ overall
conservation by protecting quality growth, reproduction, and feeding. Limiting factors identified
for this species include degraded floodplain and mainstem river channel structure, degraded
estuarine conditions and loss of estuarine habitat, riparian area degradation and loss of in-river
wood in mainstem, excessive sediment in spawning gravels, and reduced stream flow in
migration areas.
122
Biological Opinion and Conference Report on Navy NWTT Activities and NMFS’ MMPA Incidental Take
Authorization PCTS FPR-2015-9110
4.1.14.1 Conclusion
Training and testing activities do not occur in freshwater habitats and will not affect critical
habitat designated in these areas. Critical habitat in offshore areas and estuarine areas may co-
occur with portions of the NWTT Action Area. The critical habitat’s biological feature important
to the life stages of chum salmon that could be affected by NWTT activities are forage resources.
No changes in water quality, quantity, or natural cover would be expected to occur. In the event
acoustic stressors (or any other stressors) affect forage species, the impact is anticipated to be
temporary and of short duration (only occurring during ensonification or activity duration) and of
negligible magnitude (in terms of area size and proportion of available forage). Therefore,
NWTT activities are not likely to adversely affect chum critical habitat.
4.2 Species Considered Further in this Biological Opinion
The rest of this section of our Opinion consists of narratives for each of the threatened and
endangered species that occur in the NWTT Action Area and that may be adversely affected by
the readiness activities the Navy conducts. In each narrative, we present a summary of
information on the distribution and population structure of each species to provide a foundation
for the exposure analyses that appear later in this Opinion. Then we summarize information on
the threats to the species and the species’ status given those threats to provide points of reference
for the jeopardy determinations we make later in this Opinion.
After the Status subsection of each narrative, we present information on the diving and social
behavior of the different species because that behavior helps determine whether aerial and ship
board surveys are likely to detect each species. We also summarize information on the vocaliza
tions and hearing of the different species because that background information lays the founda
tion for our assessment of how the different species are likely to respond to sounds produced by
sonar and detonations.
More detailed background information on the status of these species and critical habitat can be
found in a number of published documents including status reviews, recovery plans for the blue
whale (NMFS 1998b), fin whales (NMFS 2010b), fin and sei whale (NMFS 1998a), humpback
whale (NMFS 1991), sperm whale (NMFS 2010c), a status report on large whales prepared by
Perry et al. (1999a) and the status review and recovery plan for the leatherback sea turtle (NMFS
and USFWS 1998a; NMFS and USFWS 2007b). Richardson et al. (1995d) and Tyack (2000)
provide detailed analyses of the functional aspects of cetacean communication and their
responses to active sonar. Finally, Croll et al. (1999), NRC (2005; 2000; 2003b), Martin et al.
(2015b), Supin et al. (2011), Tyack (2010), Filadelfo et al. (2009), and Richardson and Wursig
(1995) provide information on the potential and probable effects of active sonar on the marine
animals considered in this Opinion.
123
Biological Opinion and Conference Report on Navy NWTT Activities and NMFS’ MMPA Incidental Take
Authorization PCTS FPR-2015-9110
For Pacific salmon, steelhead, and other relevant species, NMFS commonly uses four parameters
to assess the viability of the populations that, together, constitute the species: spatial structure,
diversity, abundance, and productivity (McElhany et al. 2000b). These “viable salmonid
population” (VSP) criteria therefore encompass the species’ “reproduction, numbers, or
distribution” as described in 50 CFR 402.02. When these parameters are collectively at
appropriate levels, they maintain a population’s capacity to adapt to various environmental
conditions and allow it to sustain itself in the natural environment. These attributes are
influenced by survival, behavior, and experiences throughout a species’ entire life cycle, and
these characteristics, in turn, are influenced by habitat and other environmental conditions.
“Spatial structure” refers both to the spatial distributions of individuals in the population and the
processes that generate that distribution. A population’s spatial structure depends fundamentally
on habitat quality and spatial configuration and the dynamics and dispersal characteristics of
individuals in the population. “Diversity” refers to the distribution of traits within and among
populations. These range in scale from DNA sequence variation at single genes to complex life
history traits (McElhany et al. 2000b). “Abundance” generally refers to the number of naturally-
produced adults (i.e., the progeny of naturally-spawning parents) in the natural environment
(e.g., on spawning grounds). “Productivity,” as applied to viability factors, refers to the entire life
cycle; i.e., the number of naturally-spawning adults produced per parent. When progeny replace
or exceed the number of parents, a population is stable or increasing. When progeny fail to
replace the number of parents, the population is declining. McElhany et al. (2000b) use the terms
“population growth rate” and “productivity” interchangeably when referring to production over
the entire life cycle. They also refer to “trend in abundance,” which is the manifestation of long
term population growth rate.
Many of the salmonid ESUs and DPSs include fish from artificial propagation programs
(hatcheries). Hatchery fish are generally considered to be of less conservation value than
individuals from the natural population (NMFS 2015). ESA take prohibitions do not apply to
hatchery fish with clipped adipose fins from threatened ESUs/DPSs.
For species with multiple populations, once the biological status of a species’ populations has
been determined, NMFS assesses the status of the entire species using criteria for groups of
populations, as described in recovery plans and guidance documents from technical recovery
teams. Considerations for species viability include having multiple populations that are viable,
ensuring that populations with unique life histories and phenotypes are viable, and that some
viable populations are both widespread to avoid concurrent extinctions from mass catastrophes
and spatially close to allow functioning as metapopulations (McElhany et al. 2000b).
124
Biological Opinion and Conference Report on Navy NWTT Activities and NMFS’ MMPA Incidental Take
Authorization PCTS FPR-2015-9110
4.2.1 Blue Whale
The blue whale, Balaenoptera musculus (Linnæus 1758), is a cosmopolitan species of baleen
whale. It is the largest animal ever known to have lived on Earth: adults in the Antarctic have
reached a maximum body length of about 33 m and can weigh more than 150,000 kg. The largest
blue whales reported from the North Pacific are a female that measured 26.8 m (88 ft) taken at
Port Hobron in 1932 (Reeves et al. 1985) and a 27.1 m (89 ft) female taken by Japanese pelagic
whaling operations in 1959 (NMFS 1998b).
As is true of other baleen whale species, female blue whales are somewhat larger than males.
Blue whales are identified by the following characteristics: a long-body and comparatively
slender shape; a broad, flat "rostrum" when viewed from above; a proportionately smaller dorsal
fin than other baleen whales; and a mottled gray color pattern that appears light blue when seen
through the water.
4.2.1.1 Distribution
Blue whales are found along the coastal shelves of North America and South America (Clarke
1980; Donovan 1984; Rice 1998). In the western North Atlantic Ocean, blue whales are found
from the Arctic to at least the mid-latitude waters of the North Atlantic (CETAP 1982; Gagnon
and Clark 1993; Wenzel et al. 1988; Yochem and Leatherwood 1985).
Blue whales in the eastern Pacific winter from California south; in the western Pacific, they
winter from the Sea of Japan, the East China and Yellow Seas, and the Philippine Sea. Blue
whales occur in summer foraging areas in the Chukchi Sea, the Sea of Okhotsk, around the
Aleutian Islands, and the Gulf of Alaska. Nishiwaki (1966) reported that blue whales occur in the
Aleutian Islands and in the Gulf of Alaska. An array of hydrophones, deployed in October 1999,
detected two blue whale call types in the Gulf of Alaska (Stafford 2003b). Fifteen blue whale
sightings off British Columbia and in the Gulf of Alaska have been made since 1997
(Calambokidis et al. 2009b). Three of these photographically verified sightings were in the
northern Gulf of Alaska within 71 nm of each other and were less than 100 nm offshore
(Calambokidis et al. 2009b).
Blue whales appear to migrate to waters offshore of Washington, Oregon, and northern
California to forage. Thus far, blue whales are associated with deeper, pelagic waters in the
Action Area; they have not been reported to occur proximate to the coast or in Puget Sound
itself. Širović et al. (Širović et al. 2012; Širović et al. 2011) reported detection of blue whale
vocalizations in the offshore waters of Washington from late fall through February. Oleson and
Hildebrand (2011) also reported visual blue whale sightings in these areas. Although a resident
population of blue whales might occur off the coast of Vancouver Island throughout the year
(Burtenshaw et al. 2004a), most blue whales that occur in the Action Area for this consultation
125
Biological Opinion and Conference Report on Navy NWTT Activities and NMFS’ MMPA Incidental Take
Authorization PCTS FPR-2015-9110
appear to migrate between summer, foraging areas and winter rearing areas along the Pacific
Coast of the United States. That seasonal migration brings them to waters off the NWTRC (with
some individuals continuing north to the Gulf of Alaska) during the warm, summer season with a
southward migration to waters off California, south to Central America, during the winter season
(Calambokidis et al. 2009b; Gregr et al. 2000; Mate et al. 1998).
4.2.1.1.1 Occurrence in the Offshore Portion of the NWTT Action Area
The U.S. west coast is known to be a feeding area for blue whales during summer and fall
(Bailey et al. 2010; Calambokidis et al. 2009a), although primary occurrence for this species is
south of 44° N (Forney et al. 2012; Hamilton et al. 2009; Sirovic et al. 2015). Blue whales feed
in the area as late as October, although fewer individuals are seen because the majority of the
population migrates south. Acoustic data collected by Sound Surveillance System hydrophones
reveal that males call during the fall in this area (Stafford et al. 2001a). More recently, Navy-
funded acoustic monitoring studies have detected blue whales along the Washington coast
between August and February, with peak calling from October to December, and no detections
between April and July (Širović et al. 2012; Širović et al. 2011). An individual blue whale was
also sighted off Washington in January 2009, in waters approximately 3,281 ft. (1,000 m) deep
(Oleson et al. 2012).
A recent study (Mate et al. 2015) was completed to determine movement patterns, occurrence,
and residence times of blue and fin whales within Navy training and testing areas along the U.S.
West Coast. Tagging occurred off the coast of southern California in August and September
2014. The study concluded that there was a great deal of individual variation in the tracks of both
blue and fin whales, with blue whale locations extending from the northern tip of Vancouver
Island in British Columbia to the Costa Rica Dome area off Central America, and those of fin
whales extending from southern Oregon to central Baja California. The area of highest use for
blue whales was between Point Dume and Mugu Canyon off southern California, out to
approximately 30 kilometers (km) from shore. For fin whales, areas of highest use occurred
south of San Miguel Island, approximately 100 km offshore, and approximately 70 to 80 km
offshore along the south-central California coast between Arroyo Grande and Big Sur.
Mate et al. (2015) indicated that both blue and fin whales were tracked in the NWTRC and the
Southern California Training Range Complex (SOCAL), but neither species traveled into the
Gulf of Alaska Temporary Maritime Activities Area. Only one blue whale had locations within
area W237 within the NWTRC area (in August, September, and October). Blue whale presence
was observed in both SOCAL and NWTRC in August, September, October, and November. Fin
whale locations occurred in SOCAL in all 5 months in which they were tracked (August,
September, October, November, and December), but in only 2 months in NWTRC (August and
September). Eighteen blue whales spent 1 to 48 percent (37 to 414 hours [h]) of their tracking
126
Biological Opinion and Conference Report on Navy NWTT Activities and NMFS’ MMPA Incidental Take
Authorization PCTS FPR-2015-9110
periods within the SOCAL, while four blue whales spent 3 to 45 percent (15 to 1,249 h) of their
tracking periods within the NWTRC. Finally, Mate et al. (2015) concluded that four fin whales
spent from less than 1 to 39 percent (1 to 956 h) of their total tracking periods in SOCAL, and
one fin whale spent 51 percent (811 h) of its tracking period in NWTRC.
4.2.1.1.2 Occurrence in the Inland Waters of the NWTT Action Area
Blue whales are not expected to occur within the Inland Waters region of the Action Area since
it is well inland of the areas normally inhabited by blue whales.
4.2.1.1.3 Occurrence in the Western Behm Canal, Alaska - NWTT Action Area
Blue whales are not expected to occur within the SEAFAC region of the Action Area since it is
well inland of the areas normally inhabited by blue whales.
4.2.1.2 Population Structure
For this and all subsequent species, the term “population” refers to groups of individuals whose
patterns of increase or decrease in abundance over time are determined by internal dynamics
(births resulting from sexual interactions between individuals in the group and deaths of those
individuals) rather than external dynamics (immigration or emigration). This definition is a
reformulation of definitions articulated by Futuymda (1986) and Wells and Richmond (1995)
and is more restrictive than those uses of ‘population’ that refer to groups of individuals that co-
occur in space and time but do not have internal dynamics that determine whether the size of the
group increases or decreases over time (see review by Wells and Richmond 1995). The
definition we apply is important to section 7 consultations because such concepts as ‘population
decline,’ ‘population collapse,’ ‘population extinction,’ and ‘population recovery’ apply to the
restrictive definition of ‘population’ but do not explicitly apply to alternative definitions. As a
result, we do not treat the different whale “stocks” recognized by the International Whaling
Commission or other authorities as populations unless those distinctions were clearly based on
demographic criteria. We do, however, acknowledge those “stock” distinctions in these
narratives.
At least three subspecies of blue whales have been identified based on body size and geographic
distribution (B. musculus intermedia, which occurs in the higher latitudes of the Southern
Oceans, B. m. musculus, which occurs in the Northern Hemisphere, and B. m. brevicauda which
occurs in the mid-latitude waters of the southern Indian Ocean and north of the Antarctic
convergence), but this consultation will treat them as a single entity. Readers who are interested
in these subspecies will find more information in Gilpatrick et al. (1997), Kato et al. (1995),
Omura et al. (1970), and Ichihara (1966).
127
Biological Opinion and Conference Report on Navy NWTT Activities and NMFS’ MMPA Incidental Take
Authorization PCTS FPR-2015-9110
In addition to these subspecies, the International Whaling Commission’s Scientific Committee
has formally recognized one blue whale population in the North Pacific (Donovan 1991),
although there is increasing evidence that there may be more than one blue whale population in
the Pacific Ocean (Gilpatrick et al. (1997), Barlow et al. (1995), Mizroch et al. (1984), Ohsumi
and Wada (1972)). For example, studies of the blue whales that winter off Baja California and in
the Gulf of California suggest that these whales are morphologically distinct from blue whales of
the western and central North Pacific (Gilpatrick et al. 1997), although these differences might
result from differences in the productivity of their foraging areas more than genetic differences
(Barlow et al. 1997; Calambokidis et al. 1990; Sears 1987). A population of blue whales that has
distinct vocalizations inhabits the northeast Pacific from the Gulf of Alaska to waters off Central
America (Gregr et al. 2000; Mate et al. 1998; Stafford 2003b). We assume that this population is
the one affected by the activities considered in this Opinion.
Blue whales from both the eastern and western North Pacific have been heard, tracked, or
harvested in waters off Kodiak Island; acoustic detections are made in the Gulf of Alaska from
mid-July to mid-December and a peak from August through November (COSEWIC 2002;
Ivashin and Rovnin. 1967; Moore et al. 2006; Stafford 2003a; Stafford et al. 2007; Yochem and
Leatherwood 1985). Although acoustic detections in the Gulf of Alaska were absent since the
late 1960s, recordings have increased during 1999 to 2002 and a few sightings have been made
in the northern Gulf of Alaska (Calambokidis et al. 2009a; Moore et al. 2006; NOAA 2004;
Stafford 2003a; Stafford et al. 2007; Stafford and Moore 2005a). However, surveys in the
western Gulf of Alaska and east of Kodiak Island have not found blue whales (Rone et al. 2010b;
Zerbini et al. 2006b). Blue whales are rarely observed in nearshore Alaskan waters, but seem to
prefer continental shelf edge waters; such areas in the Gulf of Alaska were formerly feeding
grounds for blue whales prior to severe depletion (Rice and Wolman. 1982). Call detections of
blue whales from the western North Pacific indicate a greater likelihood of these individual
occurring southwest of Kodiak Island (Stafford 2003a). A population of blue whales that has
distinct vocalizations inhabits the northeast Pacific from the Gulf of Alaska to waters off Central
America (Gregr et al. 2000; Mate et al. 1998; Stafford 2003b). We assume that this population is
the one affected by the activities considered in this Opinion.
4.2.1.3 Abundance Estimate
Widespread whaling over the last century is believed to have decreased the blue whale
population to approximately 1 percent of its pre-whaling population size (Sirovic et al. 2004);
(Branch et al. 2007). The current best available abundance estimate for the eastern North Pacific
population of blue whales that occur off California, Oregon, and Washington is 2,138 (95
percent CI: 1,774 to 2,584 (Monnahan et al. 2014b). Based on ship surveys conducted in the
summer and fall from 1991 to 2008, it is estimated that 58 blue whales (CV = 0.41) occur in
waters off Washington and Oregon (Barlow 2010a). There was a documented increase in the
128
Biological Opinion and Conference Report on Navy NWTT Activities and NMFS’ MMPA Incidental Take
Authorization PCTS FPR-2015-9110
blue whale population size between 1979 and 80 and 1991 (Barlow 1994) and between 1991 and
1996 (Barlow 1997), but there has not been evidence to suggest an increase in the population of
the eastern North Pacific stock since then (Barlow and Taylor 2001a; Carretta et al. 2012). Based
on line-transect surveys conducted off California between 1991 and 2005, the abundance
estimates of blue whales declined in these waters over the survey period (Barlow and Forney
2007). However, this apparent decline was likely due to variability in the distribution patterns of
blue whales off the coast of North America rather than a true population decline (Calambokidis
et al. 2009a). Calambokidis et al. (2009a) suggested that when feeding conditions off California
are not optimal, blue whales may move to other regions to feed, including waters further north. A
comparison of survey data from the 1990s to 2008 indicates that there has been a northward shift
in blue whale distribution within waters off California, Oregon, and Washington (Barlow 2010a).
Subsequent mark-recapture estimates “indicated a significant upward trend in abundance of blue
whales” at a rate of increase just under 3 percent per year for the U.S. west coast blue whale
population in the Pacific (Calambokidis et al. 2009c). Consistent with the earlier suggested
variability in the distribution patterns, Carretta et al. (2013b) reported that blue whales from the
U.S. west coast have been increasingly found feeding to the north and south of the U.S. west
coast during summer and fall. Although there has not been evidence to suggest an increase in the
eastern North Pacific blue whale population, data provided by Monnahan et al. (2014b) indicate
that population may have recovered near to its estimated pre-whaling size.
4.2.1.4 Natural Threats
Natural causes of mortality in blue whales are largely unknown, but probably include predation
and disease (not necessarily in their order of importance). Blue whales are known to become
infected with the nematode Carricauda boopis (Baylis 1928), which are believed to have caused
fin whales to die as a result of renal failure (Lambertsen 1986); see additional discussion under
Fin whales). Killer whales and sharks are also known to attack, injure, and kill very young or
sick fin and humpback whales and likely hunt blue whales as well (Perry et al. 1999a) (Ford and
Reeves 2008).
4.2.1.5 Anthropogenic Threats
Two human activities are known to threaten blue whales; whaling and shipping. Historically,
whaling represented the greatest threat to every population of blue whales and was ultimately
responsible for listing blue whales as an endangered species. As early as the mid-seventeenth
century, the Japanese were capturing blue, fin, and other large whales using a fairly primitive
open-water netting technique (Tonnessen and Johnsen 1982). In 1864, explosive harpoons and
steam-powered catcher boats were introduced in Norway, allowing the large-scale exploitation of
previously unobtainable whale species.
129
Biological Opinion and Conference Report on Navy NWTT Activities and NMFS’ MMPA Incidental Take
Authorization PCTS FPR-2015-9110
From 1889 to 1965, whalers killed about 5,761 blue whales in the North Pacific Ocean (Hill et
al. 1999). From 1915 to 1965, the number of blue whales captured declined continuously
(Mizroch et al. 1984). Evidence of a population decline was seen in the catch data from Japan. In
1912, whalers captured 236 blue whales; in 1913, 58 blue whales; in 194, 123 blue whales; from
1915 to 1965, the number of blue whales captured declined continuously (Mizroch et al. 1984).
In the eastern North Pacific, whalers killed 239 blue whales off the California coast in 1926.
And, in the late 1950s and early 1960s, Japanese whalers killed 70 blue whales per year off the
Aleutian Islands (Mizroch et al. 1984).
Although the International Whaling Commission banned commercial whaling in the North
Pacific in 1966, Soviet whaling fleets continued to hunt blue whales in the North Pacific for
several years after the ban. Surveys conducted in these former-whaling areas in the 1980s and
1990s failed to find any blue whales (Forney and Brownell Jr. 1996). By 1967, Soviet scientists
wrote that blue whales in the North Pacific Ocean (including the eastern Bering Sea and Prince
William Sound) had been so overharvested by Soviet whaling fleets that some scientists
concluded that any additional harvests were certain to cause the species to become extinct in the
North Pacific (Latishev 2007). As its legacy, whaling has reduced blue whales to a fraction of
their historic population size and, as a result, makes it easier for other human activities to push
blue whales closer to extinction. Otherwise, whaling currently does not threaten blue whale
populations.
In 1980, 1986, 1987, and 1993, ship strikes have been implicated in the deaths of blue whales off
California (Barlow 1997). More recently, Berman-Kowalewski et al. (2010) reported that
between 1988 and 2007, 21 blue whale deaths were reported along the California coast, typically
one or two cases annually. In addition, several photo-identified blue whales from California
waters were observed with large scars on their dorsal areas that may have been caused by ship
strikes. Studies have shown that blue whales respond to approaching ships in a variety of ways,
depending on the behavior of the animals at the time of approach, and speed and direction of the
approaching vessel. While feeding, blue whales react less rapidly and with less obvious
avoidance behavior than whales that are not feeding (Sears 1983). Within the St. Lawrence
Estuary, blue whales are believed to be affected by large amounts of recreational and commercial
vessel traffic. Blue whales in the St. Lawrence appeared more likely to react to these vessels
when boats made fast, erratic approaches or sudden changes in direction or speed (Edds and
Macfarlane 1987).
Increasing oceanic noise may impair blue whale behavior. Although available data do not
presently support traumatic injury from sonar, the general trend in increasing ambient low-
frequency noise in the deep oceans of the world, primarily from ship engines, could impair the
ability of blue whales to communicate or navigate through these vast expanses (Aburto et al.
1997c; Clark 2006). Blue whales off California altered call levels and rates in association with
130
Biological Opinion and Conference Report on Navy NWTT Activities and NMFS’ MMPA Incidental Take
Authorization PCTS FPR-2015-9110
changes in local vessel traffic (Mckenna 2011). There is a paucity of contaminant data regarding
blue whales. Available information indicates that organochlorines, including dichloro-diphenyl
trichloroethane (DDT), polychlorinated biphenyls (PCB), benzene hexachloride (HCH),
hexachlorobenzene (HCB), chlordane, dieldrin, methoxychlor, and mirex have been isolated
from blue whale blubber and liver samples (Gauthier et al. 1997; Metcalfe et al. 2004).
Contaminant transfer between mother and calf occurs, meaning that young often start life with
concentrations of contaminants equal to their mothers, before accumulating additional
contaminant loads during life and passing higher loads to the next generation (Gauthier et al.
1997; Metcalfe et al. 2004). This is supported by ear plug data showing maternal transfer of
pesticides and flame retardants in the first year of life (Trumble et al. 2013). These data also
support pulses of mercury in body tissues of the male studied (Trumble et al. 2013).
4.2.1.6 Status and Trends
Blue whales (including all subspecies) were originally listed as endangered in 1970 (35 FR
18319), and this status continues since the inception of the ESA in 1973. Blue whales are listed
as endangered on the IUCN Red List of Threatened Animals (IUCN 2010). They are also
protected by the Convention on International Trade in Endangered Species of wild flora and
fauna and the MMPA. Critical habitat has not been designated for blue whales.
It is difficult to assess the current status of blue whales globally because (1) there is no general
agreement on the size of the blue whale population prior to whaling and (2) estimates of the
current size of the different blue whale populations vary widely. We may never know the size of
the blue whale population in the North Pacific prior to whaling, although some authors have
concluded that their population numbers about 200,000 animals before whaling. Similarly,
estimates of the global abundance of blue whales are uncertain. Since the cessation of whaling,
the global population of blue whales has been estimated to range from 11,200 to 13,000 animals
(Maser et al. 1981). These estimates, however, are more than 20 years old.
The current best available abundance estimate for the eastern North Pacific population of blue
whales that occur off California, Oregon, and Washington is 2,138 (95 percent CI: 1,774 to 2,584
(Monnahan et al. 2014b). There was a documented increase in the blue whale population size
between 1979 and 1994, but there has not been evidence to suggest an increase in the population
since then (Barlow 1994; Barlow and Taylor 2001a; Carretta et al. 2010b) . In 2008, Cascadia
Research conducted photographic identification surveys to make abundance estimates of blue
whales along the U.S. West Coast. The results reflect an upward trend in abundance of blue
whales along the U.S. West Coast, although their numbers are highly variable off California,
most likely due to the variability of its use as a feeding area (Calambokidis et al. 2009d).
The information available on the status and trend of blue whales do not allow us to reach any
conclusions about the extinction risks facing blue whales as a species, or particular populations
131
Biological Opinion and Conference Report on Navy NWTT Activities and NMFS’ MMPA Incidental Take
Authorization PCTS FPR-2015-9110
of blue whales. The possible exception is the eastern North Pacific blue whale population which
many not have been subject to as much commercial whaling as other blue whale populations and
which may be recovering to a stable population level since the cessation of commercial whaling
in 1971 (Campbell et al. 2015; Monnahan et al. 2014a; Monnahan et al. 2014b). With the limited
data available on blue whales, we do not know whether these whales exist at population sizes
large enough to avoid demographic phenomena that are known to increase the extinction
probability of species that exist as “small” populations (that is, “small” populations experience
phenomena such as demographic stochasticity, inbreeding depression, and Allee effects, among
others, that cause their population size to become a threat in and of itself) or if blue whales are
threatened more by exogenous threats such as anthropogenic activities (primarily whaling and
ship strikes) or natural phenomena (such as disease, predation, or changes in the distribution and
abundance of their prey in response to changing climate).
4.2.1.7 Diving and Social Behavior
Blue whales spend more than 94 percent of their time underwater (Lagerquist et al. 2000).
Generally, blue whales dive 5 to 20 times at 12 to 20 sec intervals before a deep dive of 3 to 30
min (Croll et al. 1999a; Leatherwood et al. 1976; Maser et al. 1981; Yochem and Leatherwood
1985). Average foraging dives are 140 m deep and last for 7.8 min (Croll et al. 2001a). Non-
foraging dives are shallower and shorter, averaging 68 m and 4.9 min (Croll et al. 2001a).
However, dives of up to 300 m are known (Calambokidis et al. 2003). Nighttime dives are
generally shallower (50 m).
Blue whales occur singly or in groups of two or three (Aguayo 1974; Mackintosh 1965; Nemoto
1964; Pike and Macaskie 1969; Ruud 1956; Slijper 1962). However, larger foraging
aggregations, even with other species such as fin whales, are regularly reported (Fiedler et al.
1998; Schoenherr 1991). Little is known of the mating behavior of blue whales.
4.2.1.8 Vocalization and Hearing
Blue whales produce prolonged low-frequency vocalizations that include moans in the range
from 12.5 to 400 Hz, with dominant frequencies from 16 to 25 Hz, and songs that span
frequencies from 16 to 60 Hz that last up to 36 seconds repeated every 1 to 2 minutes (see
McDonald et al. 1995). Berchok et al. (2006b) examined vocalizations of St. Lawrence blue
whales and found mean peak frequencies ranging from 17.0 to 78.7 Hz. Reported source levels
are 180 to 188 dB re 1μPa, but may reach 195 dB re 1μPa (Aburto et al. 1997b; Clark and
Gagnon 2004; Ketten 1998; McDonald et al. 2001a). Samaran et al. (2010) estimated Antarctic
blue whale calls in the Indian Ocean at 179 ± 5 dB re 1 µParms -1 m in the 17 to 30 Hz range and
pygmy blue whale calls at 175± 1 dB re 1 µParms -1 m in the 17 to 50 Hz range.
132
Biological Opinion and Conference Report on Navy NWTT Activities and NMFS’ MMPA Incidental Take
Authorization PCTS FPR-2015-9110
As with other baleen whale vocalizations, blue whale vocalization function is unknown, although
numerous hypotheses exist (maintaining spacing between individuals, recognition, socialization,
navigation, contextual information transmission, and location of prey resources) (Edds-Walton
1997; Payne and Webb. 1971; Thompson et al. 1992). Intense bouts of long, patterned sounds
are common from fall through spring in low latitudes, but these also occur less frequently while
in summer high-latitude feeding areas. Short, rapid sequences of 30 to 90 Hz calls are associated
with socialization and may be displays by males based upon call seasonality and structure. The
low-frequency sounds produced by blue whales can, in theory, travel long distances, and it is
possible that such long-distance communication occurs (Edds-Walton 1997; Payne and Webb.
1971). The long-range sounds may also be used for echolocation in orientation or navigation
(Tyack 1999).
Cetaceans have an auditory anatomy that follows the basic mammalian pattern, with some
modifications to adapt to the demands of hearing in the sea. The typical mammalian ear is
divided into the outer ear, middle ear, and inner ear. The outer ear is separated from the inner ear
by the tympanic membrane, or eardrum. In terrestrial mammals, the outer ear, eardrum, and
middle ear function to transmit airborne sound to the inner ear, where the sound is detected in a
fluid. Since cetaceans already live in a fluid medium, they do not require this matching, and thus
do not have an air-filled external ear canal. The inner ear is where sound energy is converted into
neural signals that are transmitted to the central nervous system via the auditory nerve. Acoustic
energy causes the basilar membrane in the cochlea to vibrate. Sensory cells at different positions
along the basilar membrane are excited by different frequencies of sound (Tyack 1999). Baleen
whales have inner ears that appear to be specialized for low-frequency hearing. In a study of the
morphology of the mysticete auditory apparatus, Ketten (1997a) hypothesized that large
mysticetes have acute infrasonic hearing.
Blue whale vocalizations tend to be long (>20 s), low-frequency (<100 Hz) signals (Thomson
and Richardson 1995), with a range of 12 to 400 Hz and dominant energy in the infrasonic range
of 12 to 25 Hz (Ketten 1998; McDonald et al. 2001b; Mellinger and Clark 2003). Vocalizations
are predominantly songs and calls. Blue whale calls have high acoustic energy, with reports of
186 to 188 dB re 1 μPa-m (Cummings and Thompson 1971; McDonald et al. 2001b) and 195 dB
re 1 μPa-m (Aburto et al. 1997a) source levels. Calls are short-duration sounds (2 to 5 s) that are
transient and frequency-modulated, having a higher frequency range and shorter duration than
song units and often sweeping down in frequency (80 to 30Hz), with seasonally variable
occurrence.
Blue whale songs consist of repetitively patterned sounds produced over time spans of minutes to
hours, or even days (Cummings and Thompson 1971; McDonald et al. 2001b). The songs are
divided into pulsed/tonal units, which are continuous segments of sound, and phrases, which are
repeated combinations of 1 to 5 units (Mellinger and Clark 2003; Payne and McVay 1971). A
133
Biological Opinion and Conference Report on Navy NWTT Activities and NMFS’ MMPA Incidental Take
Authorization PCTS FPR-2015-9110
song is composed of many repeated phrases. Songs can be detected for hundreds, and even
thousands of kilometers (Stafford et al. 1998), and have only been attributed to males (McDonald
et al. 2001b; Oleson et al. 2007a). Worldwide, songs are showing a downward shift in frequency
(Mcdonald et al. 2009). For example, a comparison of recordings from November 2003 and
November 1964 and 1965 reveals a long-term shift in the frequency of blue whale calling near
San Nicolas Island. In 2003, the spectral energy peak was 16 Hz compared to ~22.5 Hz in 1964
and 1965, illustrating a more than 30 percent shift in call frequency over four decades
(McDonald et al. 2006b). McDonald et al. (2009) observed a 31 percent downward frequency
shift in blue whale calls off the coast of California, and also noted lower frequencies in 7 of the
world’s 10 known blue whale songs originating in the Atlantic, Pacific, Southern, and Indian
Oceans. Many possible explanations for the shifts exist, but none have emerged as the probable
cause.
Although general characteristics of blue whale calls are shared in distinct regions (McDonald et
al. 2001b; Mellinger and Clark 2003; Rankin et al. 2005; Thompson et al. 1996), some
variability appears to exist among different geographic areas (Rivers 1997). Sounds in the North
Atlantic have been confirmed to have different characteristics (i.e., frequency, duration, and
repetition) than those recorded in other parts of the world (Berchok et al. 2006a; Mellinger and
Clark 2003). Clear differences in call structure suggestive of separate populations for the western
and eastern regions of the North Pacific have also been reported (Stafford et al. 2001b); however,
some overlap in calls from these geographically distinct regions have been observed, indicating
that the whales may have the ability to mimic calls (Stafford and Moore 2005b).
In Southern California, blues whales produce two predominant call types: Type B and D. B-calls
are stereotypic of the blue whale population found in the eastern North Pacific (McDonald et al.
2006b) and are produced exclusively by males and associated with mating behavior (Oleson et
al. 2007a). These calls have long durations (20 sec) and low frequencies (10 to 100 Hz); they are
produced either as repetitive sequences (song) or as singular calls. The B call has a set of
harmonic tonals, and may be paired with a pulsed type A call. Blue whale D calls are down-
swept in frequency (100 to 40 Hz) with duration of several seconds. These calls are similar
worldwide and are associated with feeding animals; they may be produced as call- counter call
between multiple animals (Oleson et al. 2007c). In the SOCAL Range Complex region, D calls
are produced in highest numbers during the late spring and early summer, and in diminished
numbers during the fall, when A-B song dominates blue whale calling (Hildebrand et al. 2011;
Hildebrand et al. 2012; Oleson et al. 2007d).
Calling rates of blue whales tend to vary based on feeding behavior. Stafford et al. (2005b)
recorded the highest calling rates when blue whale prey was closest to the surface during its
vertical migration. Wiggins et al. (2005) reported the same trend of reduced vocalization during
daytime foraging followed by an increase at dusk as prey moved up into the water column and
134
Biological Opinion and Conference Report on Navy NWTT Activities and NMFS’ MMPA Incidental Take
Authorization PCTS FPR-2015-9110
dispersed. Blue whales make seasonal migrations to areas of high productivity to feed, and
vocalize less at the feeding grounds than during migration (Burtenshaw et al. 2004b). Oleson et
al. (2007d) reported higher calling rates in shallow diving (<100 ft) whales, while deeper diving
whales (>165 ft) were likely feeding and calling less.
Direct studies of blue whale hearing have not been conducted, but it is assumed that blue whales
can hear the same frequencies that they produce (low-frequency) and are likely most sensitive to
this frequency range (Ketten 1997b; Richardson et al. 1995d). Based on vocalizations and
anatomy, blue whales are assumed to predominantly hear low-frequency sounds below 400 Hz
(Croll et al. 2001b) (Croll et al. 2001c; Oleson et al. 2007d; Stafford and Moore 2005b). In terms
of functional hearing capability, blue whales belong to the low-frequency group, which have a
hearing range of 7 Hz to 22 kHz (Southall et al. 2007b).
Nevertheless, recent studies indicate that blue whales can hear and respond to sounds in the mid-
frequency range. Nineteen controlled exposure experiments were conducted on blue whales
during the Southern California-10 behavorial response study (Southall et al. 2011a) and 13 in the
Southern California-11 behavorial response study (Southall et al. 2012a). Both controlled
exposure experiments simulated exposure to Navy MFA sonar. Behavioral response was
observed in some blue whales and consisted primarily of small changes in dive behavior and
general avoidance of the sound source. Preliminary assessments showed behavior appearing to
return to baseline shortly after the transmissions ended, however, it is possible that the changes
observed were a direct response to the transmission or some other unknown or un-analyzed
factors (Southall et al. 2012a). During other controlled exposure experiments, blue whales
responded to a mid-frequency sound source, with a source level between 160 to 210 dB re 1 µPa
at 1 m and a received sound level up to 160 dB re 1 µPa, by exhibiting generalized avoidance
responses and changes to dive behavior (Goldbogen et al. 2013). However, reactions were
temporary and were not consistent across individuals based on received sound levels alone.
Results were likely the result of a complex interaction between sound exposure factors such as
proximity to sound source and sound type (mid-frequency sonar simulation vs. pseudo-random
noise), environmental conditions, and behavioral state. Surface feeding whales did not show a
change in behavior during controlled exposure experiments, but deep feeding and non-feeding
whales showed temporary reactions that often quickly abated after sound exposure. Distances of
the sound source from the whales during controlled exposure experiments were sometimes less
than a mile. Melcon et al. (2012) tested whether MFA sonar and other anthropogenic noises in
the mid-frequency band affected the “D-calls” produced by blue whales in the Southern
California Bight. The likelihood of an animal calling decreased with the increased received level
of mid-frequency sonar, beginning at a sound pressure level of approximately 110 to 120 dB re 1
µPa. It is not known whether the lower rates of calling actually indicated a reduction in feeding
behavior or social contact since the study used data from remotely deployed, passive acoustic
monitoring buoys.
135
Biological Opinion and Conference Report on Navy NWTT Activities and NMFS’ MMPA Incidental Take
Authorization PCTS FPR-2015-9110
4.2.1.9 Critical Habitat
NMFS has not designated critical habitat for blue whales.
4.2.2 Fin Whale
The fin whale, Balaenoptera physalus (Linnæus 1758), is a well-defined, cosmopolitan species
of baleen whale (Gambell 1985a). Fin whales are the second-largest whale species by length. Fin
whales are long-bodied and slender, with a prominent dorsal fin set about two-thirds of the way
back on the body. The streamlined appearance can change during feeding when the pleated
throat and chest area becomes distended by the influx of prey and seawater, giving the animal a
tadpole-like appearance. The basic body color of the fin whale is dark gray dorsally and white
ventrally, but the pigmentation pattern is complex. The lower jaw is gray or black on the left side
and creamy white on the right side. This asymmetrical coloration extends to the baleen plates as
well, and is reversed on the tongue. Individually distinctive features of pigmentation, along with
dorsal fin shapes and body scars, have been used in photo-identification studies (Agler et al.
1990). Fin whales live 70 to 80 years (Kjeld 1982).
4.2.2.1 Distribution
Fin whales are distributed widely in every ocean except the Arctic Ocean. In the North Pacific
Ocean, fin whales occur in summer foraging areas in the Chukchi Sea, the Sea of Okhotsk,
around the Aleutian Islands, and the Gulf of Alaska; in the eastern Pacific, they occur south to
California; in the western Pacific, they occur south to Japan. Fin whales in the eastern Pacific
winter from California south; in the western Pacific, they winter from the Sea of Japan, the East
China and Yellow Seas, and the Philippine Sea (Gambell 1985a). The overall distribution may be
based on prey availability. Fin whales are larger and faster than humpback and right whales and
are less concentrated in nearshore environments.
4.2.2.1.1 Occurrence in the Offshore Portion of the NWTT Action Area
This species has been documented from 60° N to 23° N, and they have frequently been recorded
in waters offshore Oregon and Washington (Barlow and Forney 2007). Based on predictive
habitat models derived from line-transect survey data collected between 1991 and 2008 off the
U.S. west coast, relatively high densities of fin whales are predicted off Washington during the
summer and fall (Barlow et al. 2009a); (Becker et al. 2012b); (Forney et al. 2012). During visual
surveys conducted from August 2004 to September 2008, there was a single sighting of two fin
whales off the Washington coast in December 2005, in waters approximately 3,281 ft. (1,000 m)
deep (Oleson et al. 2009).
136
Biological Opinion and Conference Report on Navy NWTT Activities and NMFS’ MMPA Incidental Take
Authorization PCTS FPR-2015-9110
Navy-funded offshore passive acoustic monitoring off Washington from 2004 to 2013 has
reported fin whales as the most commonly detected baleen whale call type detected with peak
calling in winter and spring, and low calling in summer (Kerosky et al. 2013); (Sirovic et al.
2012); U.S. Department of the Navy 2013a). Fin whale calls were detected on more than 90
percent of the days during the months of October, December, January, and February, but were
not detected in either May or June (Sirovic et al. 2012). Between May 2010 and May 2013, 11
fin whales were tagged with satellite tracking tags off of Washington. In general, fin whales were
most commonly using waters associated with the outer shelf edge (median distance to shore: 72
kilometers [km]) (DoN 2013c; Schorr et al. 2013).
4.2.2.1.2 Occurrence in the Inland Waters of the NWTT Action Area
Fin whales are extremely rare within the Inland Waters. Strandings reported within Puget Sound
have all been individuals struck by non-Navy ships, and they presumably were carried on the
bow into the sound (Norman et al. 2004a).
4.2.2.1.3 Occurrence in the Western Behm Canal, Alaska - NWTT Action Area
Fin whales were observed seven times in the summer during surveys of the inland waters of
southeast Alaska from 1991 to 2007 (Dahlheim et al. 2009). Given the limited number of
sightings in inland waters and their more pelagic nature, fin whales are considered rare in the
SEAFAC region of the Action Area.
4.2.2.2 Population Structure
Fin whales have two recognized subspecies: Balaenoptera physalus physalus occurs in the North
Atlantic Ocean while B. p. quoyi (Fischer 1829) occurs in the Southern Ocean. Globally, fin
whales are sub-divided into three major groups: Atlantic, Pacific, and Antarctic. Within these
major areas, different organizations use different population structure.
In the North Pacific Ocean, the International Whaling Commission recognizes two “stocks”: (1)
East China Sea and (2) rest of the North Pacific (Donovan 1991). However, Mizroch et al.
(1984) concluded that there were five possible “stocks” of fin whales within the North Pacific
based on histological analyses and tagging experiments: (1) East and West Pacific that
intermingle around the Aleutian Islands; (2) East China Sea; (3) British Columbia; (4) Southern-
Central California to Gulf of Alaska; and (5) Gulf of California. Based on genetic analyses,
Berube et al. (1998) concluded that fin whales in the Sea of Cortez represent an isolated popula
tion that has very little genetic exchange with other populations in the North Pacific Ocean
(although the geographic distribution of this population and other populations can overlap
seasonally). They also concluded that fin whales in the Gulf of St. Lawrence and Gulf of Maine
are distinct from fin whales found off Spain and in the Mediterranean Sea.
137
Biological Opinion and Conference Report on Navy NWTT Activities and NMFS’ MMPA Incidental Take
Authorization PCTS FPR-2015-9110
Regardless of how different authors structure the fin whale population, mark-recapture studies
have demonstrated that individual fin whales migrate between management units (Mitchell 1974;
Sigurjonsson et al. 1989), which suggests that these management units are not geographically
isolated populations.
Mizroch et al. (1984) identified five fin whale “feeding aggregations” in the Pacific Ocean: (1)
an eastern group that move along the Aleutians, (2) a western group that move along the
Aleutians (Berzin and Rovnin 1966; Nasu 1974); (3) an East China Sea group; (4) a group that
moves north and south along the west coast of North America between California and the Gulf of
Alaska (Rice 1974); and (5) a group centered in the Sea of Cortez (Gulf of California).
Hatch (2004) reported that fin whale vocalizations among five regions of the eastern North
Pacific were heterogeneous: the Gulf of Alaska, the northeast North Pacific (Washington and
British Columbia), the southeast North Pacific (California and northern Baja California), the
Gulf of California, and the eastern tropical Pacific.
Sighting data show no evidence of migration between the Sea of Cortez and adjacent areas in the
Pacific, but seasonal changes in abundance in the Sea of Cortez suggests that these fin whales
might not be isolated (Tershy et al. 1993). Nevertheless, Bérubé et al. (2002) concluded that the
Sea of Cortez fin whale population is genetically distinct from the oceanic population and have
lower genetic diversity, which suggests that these fin whales might represent an isolated
population.
Fin whales also appear to migrate to waters offshore of Washington, Oregon, and northern
California to forage. Most fin whales that occur in the Action Area for this consultation appear to
migrate between summer, foraging areas and winter rearing areas along the Pacific Coast of the
United States. Širović et al. (Širović et al. 2012; Širović et al. 2011) reported fin whale
vocalizations off Washington from July through April with calls not detected from May to July.
Moore et al. (1998) recorded fin whale vocalizations in waters off Washington and Oregon
throughout the year, with concentrations between September and February, which demonstrates
that fin whales are likely to occur in the Action Area throughout the year.
4.2.2.3 Abundance Estimate
Currently there are no reliable population estimates for the Alaska/Northeast Pacific stock of fin
whales. A minimum estimate for the stock is 1,214, based on surveys west of the Kenai
Peninsula which covered only a portion of the stock’s range (Allen and Angliss 2014). Zerbini et
al. (2006a) have provided evidence of an increasing abundance trend for fin whales in Alaskan
waters.
138
Biological Opinion and Conference Report on Navy NWTT Activities and NMFS’ MMPA Incidental Take
Authorization PCTS FPR-2015-9110
The current best available abundance estimate of fin whales in California, Oregon, and
Washington waters is 3,051 (CV = 0.18) (Carretta et al. 2014). Based on ship surveys conducted
in the summer and fall from 1991 to 2008, it is estimated that 416 fin whales (CV = 0.28) occur
in waters off Washington and Oregon (Barlow 2010a). A recent study indicates that the
abundance of fin whales in waters off the U.S. west coast has increased during the 1991 to 2008
survey period, most likely from in situ population growth combined with distribution shifts
(Moore and Barlow 2011). Sirovic et al. (2015) used passive acoustic monitoring of fin whale
calls to estimate the spatial and seasonal distribution of fin whales in the Southern California
Bight. An increase in the number of calls detected between 2006 and 2012 suggest that the
population of fin whales off the U.S. west coast may be increasing.
4.2.2.4 Natural Threats
Natural sources and rates of mortality are largely unknown, but Aguilar and Lockyer (1987)
suggested annual natural mortality rates might range from 0.04 to 0.06 for northeast Atlantic fin
whales. The occurrence of the nematode Crassicauda boopis appears to increase the potential for
kidney failure and may be preventing some fin whale populations from recovering (Lambertsen
1983). Adult fin whales engage in flight responses (up to 40 km/h) to evade killer whales, which
involves high energetic output, but show little resistance if overtaken (Ford and Reeves 2008).
Killer whale or shark attacks may also result in serious injury or death in very young and sick
individuals (Perry et al. 1999a).
4.2.2.5 Anthropogenic Threats
Fin whales have undergone significant exploitation, but are currently protected under the IWC.
Fin whales are still hunted in subsistence fisheries off West Greenland. In 2004, five males and
six females were killed, and two other fin whales were struck and lost. In 2003, two males and
four females were landed and two others were struck and lost (IWC 2005). Between 2003 and
2007, the IWC set a catch limit of up to 19 fin whales in this subsistence fishery. However, the
scientific recommendation was to limit the number killed to four individuals until accurate
populations could be produced (IWC 2005).
Fin whales experience significant injury and mortality from fishing gear and ship strikes
(Carretta et al. 2007; Douglas et al. 2008c; Lien 1994; Perkins and Beamish 1979; Waring et al.
2007). Between 1969 and 1990, 14 fin whales were captured in coastal fisheries off
Newfoundland and Labrador; of these seven are known to have died because of capture (Lien
1994; Perkins and Beamish 1979). In 1999, one fin whale was reported killed in the Gulf of
Alaska pollock trawl fishery and one was killed the same year in the offshore drift gillnet fishery
(Angliss and Outlaw 2005; Carretta and Chivers. 2004). According to Waring et al. (2007), four
fin whales in the western North Atlantic died or were seriously injured in fishing gear, while
139
Biological Opinion and Conference Report on Navy NWTT Activities and NMFS’ MMPA Incidental Take
Authorization PCTS FPR-2015-9110
another five were killed or injured as a result of ship strikes between January 2000 and
December 2004.
Jensen and Silber (2004) review of the NMFS’s ship strike database revealed fin whales as the
most frequently confirmed victims of ship strikes (26 percent of the recorded ship strikes [n =
75/292 records]), with most collisions occurring off the east coast, followed by the west coast of
the U.S. and Alaska/Hawai′i. Between 1999 to 2005, there were 15 reports of fin whales strikes
by vessels along the U.S. and Canadian Atlantic coasts (Cole et al. 2005; Nelson et al. 2007). Of
these, 13 were confirmed, resulting in the deaths of 11 individuals. Five of seven fin whales
stranded along Washington State and Oregon showed evidence of ship strike with incidence
increasing since 2002 (Douglas et al. 2008c). Similarly, 2.4 percent of living fin whales from the
Mediterranean show ship strike injury and 16 percent of stranded individuals were killed by
vessel collision (Panigada et al. 2006). There are also numerous reports of ship strikes off the
Atlantic coasts of France and England (Jensen and Silber 2004a).
Management measures aimed at reducing the risk of ships hitting right whales should also reduce
the risk of collisions with fin whales. In the Bay of Fundy, recommendations for slower vessel
speeds to avoid right whale ship strike appear to be largely ignored (Vanderlaan et al. 2008).
However, new rules for seasonal (June through December) slowing of vessel traffic to 10 knots
and changing shipping lanes by less than one nautical mile to avoid the greatest concentrations of
right whales are predicted to be capable of reducing ship strike mortality by 27 percent in the
Bay of Fundy region.
The organochlorines DDE, DDT, and PCBs have been identified from fin whale blubber, but
levels are lower than in toothed whales due to the lower level in the food chain that fin whales
feed at (Aguilar and Borrell 1988; Borrell 1993; Borrell and Aguilar 1987; Henry and Best 1983;
Marsili and Focardi 1996). Females contained lower burdens than males, likely due to
mobilization of contaminants during pregnancy and lactation (Aguilar and Borrell 1988;
Gauthier et al. 1997). Contaminant levels increase steadily with age until sexual maturity, at
which time levels begin to drop in females and continue to increase in males (Aguilar and Borrell
1988).
Climate change also presents a potential threat to fin whales, particularly in the Mediterranean
Sea, where fin whales appear to rely exclusively upon northern krill as a prey source. These krill
occupy the southern extent of their range and increases in water temperature could result in their
decline and that of fin whales in the Mediterranean Sea (Gambaiani et al. 2009).
4.2.2.6 Status and Trends
Fin whales were originally listed as endangered in 1970 (35 FR 18319), and this status continues
since the inception of the ESA in 1973. Although fin whale population structure remains unclear,
140
Biological Opinion and Conference Report on Navy NWTT Activities and NMFS’ MMPA Incidental Take
Authorization PCTS FPR-2015-9110
various abundance estimates are available. Pre-exploitation fin whale abundance is estimated at
464,000 individuals worldwide; the estimate for 1991 was roughly 25 percent of this (Braham
1991). Historically, worldwide populations were severely depleted by commercial whaling, with
more than 700,000 whales harvested in the twentieth century (Cherfas 1989). The most recent
abundance estimates for fin whales that we are aware of are 16,625 individuals in the North
Pacific Ocean and 119,000 individuals worldwide (Braham 1991). Fin whales of the north
Pacific appear to be increasing in abundance although the trend is unclear or declining
throughout the rest of their range (NMFS 2011i).
The status and trend of fin whale populations is largely unknown. Over 26,000 fin whales were
harvested between 1914 and 1975 (Braham 1991 as cited in Perry et al. 1999a). NMFS estimates
roughly 3,000 individuals occur off California, Oregon, and Washington based on ship surveys
in summer/autumn of 1996, 2001, and 2005, of which estimates of 283 and 380 have been made
for Oregon and Washington alone (Barlow 2003b; Barlow and Taylor 2001b; Forney 2007).
Barlow (2003b) noted densities of up to 0.0012 individuals/km2
off Oregon and Washington and
up to 0.004 individuals/km2
off California.
Fin whales were extensively hunted in coastal waters of Alaska as they congregated at feeding
areas in the spring and summer (Mizroch et al. 2009). There has been little effort in the Gulf of
Alaska since the cessation of whaling activities to assess abundance of large whale stocks. Fin
whale calls have been recorded year-round in the Gulf of Alaska, but are most prevalent from
August-February (Moore et al. 1998; Moore et al. 2006).
Regardless of which of these estimates, if any, have the closest correspondence to the actual size
and trend of the fin whale population, all of these estimates suggest that the global population of
fin whales consists of tens of thousands of individuals.
The current best available abundance estimate for the Hawaiian stock of fin whales is 174
(coefficient of variation = 0.72) (Barlow 2003a). The current best available abundance estimate
of fin whales in California, Oregon, and Washington waters is 3,051 (CV = 0.18) (Carretta et al.
2014). Survey estimate numbers for both stocks are considered to be an underestimate because
large whales that could not be identified in the field (due to distance, bad sighting conditions,
etc.) were recorded in these and other surveys as “unidentified rorqual” or “unidentified large
whale” (Carretta et al. 2010a). A recent study indicates that the abundance of fin whales in
waters off the U.S. west coast has increased during the 1991 to 2008 survey period, most likely
from in situ population growth combined with distribution shifts (Moore and Barlow 2011).
Based on ecological theory and demographic patterns derived from several hundred imperiled
species and populations, fin whales appear to exist at population sizes that are large enough to
avoid demographic phenomena that are known to increase the extinction probability of species
that exist as “small” populations (that is, “small” populations experience phenomena such as
141
Biological Opinion and Conference Report on Navy NWTT Activities and NMFS’ MMPA Incidental Take
Authorization PCTS FPR-2015-9110
demographic stochasticity, inbreeding depression, and Allee effects, among others, that cause
their population size to become a threat in and of itself). As a result, we assume that fin whales
are likely to be threatened more by exogenous threats such as anthropogenic activities (primarily
whaling, entanglement, and ship strikes) or natural phenomena (such as disease, predation, or
changes in the distribution and abundance of their prey in response to changing climate) than
endogenous threats caused by the small size of their population.
Nevertheless, based on the evidence available, the number of fin whales that are recorded to have
been killed or injured in the past 20 years by human activities or natural phenomena, does not
appear to be increasing the extinction probability of fin whales, although it may slow the rate at
which they recover from population declines that were caused by commercial whaling.
4.2.2.7 Diving and Social Behavior
The amount of time fin whales spend at the surface varies. Some authors have reported that fin
whales make 5 to 20 shallow dives, each of 13 to 20 s duration, followed by a deep dive of 1.5 to
15 min (Gambell 1985a; Lafortuna et al. 2003; Stone et al. 1992). Other authors have reported
that the fin whale’s most common dives last 2 to 6 min (Hain et al. 1992; Watkins 1981c). The
most recent data support average dives of 98 m and 6.3 min for foraging fin whales, while non-
foraging dives are 59 m and 4.2 min (Croll et al. 2001a). However, Lafortuna et al. (1999) found
that foraging fin whales have a higher blow rate than when traveling. Foraging dives in excess of
150 m are known (Panigada et al. 1999). In waters off the U.S. Atlantic Coast, individuals or
duos represented about 75 percent of sightings during the Cetacean and Turtle Assessment
Program (Hain et al. 1992).
Individuals or groups of less than five individuals represented about 90 percent of the
observations. Barlow (2003b) reported mean group sizes of 1.1 to 4.0 during surveys off
California, Oregon, and Washington.
4.2.2.8 Vocalization and Hearing
Fin whales produce a variety of low-frequency sounds in the 10 Hz to 200 Hz range (Edds 1988;
Thompson et al. 1992; Watkins 1981b; Watkins et al. 1987). Typical vocalizations are long,
patterned pulses of short duration (0.5 to 2 s) in the 18 Hz to 35 Hz range, but only males are
known to produce these (Clark et al. 2002; Patterson and Hamilton 1964). Richardson et al.
(1995d) reported the most common sound as a 1 second vocalization of about 20 Hz, occurring
in short series during spring, summer, and fall, and in repeated stereotyped patterns in winter. Au
(Au and Green 2000b) reported moans of 14 Hz to 118 Hz, with a dominant frequency of 20 Hz,
tonal vocalizations of 34 Hz 150 Hz, and songs of 17 Hz to 25 Hz (Cummings and Thompson
1994; Edds 1988; Watkins 1981b). Source levels for fin whale vocalizations are 140 to 200 dB re
142
Biological Opinion and Conference Report on Navy NWTT Activities and NMFS’ MMPA Incidental Take
Authorization PCTS FPR-2015-9110
1μPa-m (see also Clark and Gagnon 2004; as compiled by Erbe 2002b). The source depth of
calling fin whales has been reported to be about 50 m (Watkins et al. 1987).
Although their function is still in doubt, low-frequency fin whale vocalizations travel over long
distances and may aid in long-distance communication (Edds-Walton 1997; Payne and Webb.
1971). During the breeding season, fin whales produce pulses in a regular repeating pattern,
which have been proposed to be mating displays similar to those of humpbacks (Croll et al.
2002). These vocal bouts last for a day or longer (Tyack 1999).
The inner ear is where sound energy is converted into neural signals that are transmitted to the
central nervous system via the auditory nerve. Acoustic energy causes the basilar membrane in
the cochlea to vibrate. Sensory cells at different positions along the basilar membrane are excited
by different frequencies of sound (Tyack 1999). Baleen whales have inner ears that appear to be
specialized for low-frequency hearing. In a study of the morphology of the mysticete auditory
apparatus, Ketten (1997a) hypothesized that large mysticetes have acute infrasonic hearing. In a
study using computer tomography scans of a calf fin whale skull, Cranford and Krysl (2015)
found sensitivity to a broad range of frequencies between 10 Hz and 12 kHz and a maximum
sensitivity to sounds in the 1 kHz to 2 kHz range.
Direct studies of fin whale hearing have not been conducted, but it is assumed that fin whales can
hear the same frequencies that they produce (low) and are likely most sensitive to this frequency
range (Ketten 1997b; Richardson et al. 1995d).
Fin whales produce a variety of low frequency (< 1 kHz) sounds, but the most typically recorded
is a 20 Hz pulse lasting about 1 second, and reaching source levels of 189 ± 4 dB re 1 μPam
(Charif et al. 2002; Clark et al. 2002; Edds 1988; Richardson et al. 1995d; Sirovic et al. 2007;
Watkins 1981b; Watkins et al. 1987). These pulses frequently occur in long sequenced patterns,
are down swept (e.g., 23 to 18 Hz), and can be repeated over the course of many hours (Watkins
et al. 1987). In temperate waters, intense bouts of these patterned sounds are very common from
fall through spring, but also occur to a lesser extent during the summer in high latitude feeding
areas (Clarke and Charif 1998). The seasonality and stereotypic nature of these vocal sequences
suggest that they are male reproductive displays (Watkins 1981b; Watkins et al. 1987); a notion
further supported by recent data linking these vocalizations to male fin whales only (Croll et al.
2002). In Southern California, the 20 Hz pulses are the dominant fin whale call type associated
both with call-counter-call between multiple animals and with singing (Navy 2010; Navy
2012b). An additional fin whale sound, the 40 Hz call described by Watkins (1981b), was also
frequently recorded, although these calls are not as common as the 20 Hz fin whale pulses.
Seasonality of the 40 Hz calls differed from the 20 Hz calls, since 40 Hz calls were more
prominent in the spring, as observed at other sites across the northeast Pacific (Sirovic et al.
2012). Source levels of Eastern Pacific fin whale 20-Hz calls has been reported as 189 +/- 5.8 dB
143
Biological Opinion and Conference Report on Navy NWTT Activities and NMFS’ MMPA Incidental Take
Authorization PCTS FPR-2015-9110
re 1uPa at 1m (Weirathmueller et al. 2013). Although acoustic recordings of fin whales from
many diverse regions show close adherence to the typical 20 Hz bandwidth and sequencing when
performing these vocalizations, there have been slight differences in the pulse patterns, indicative
of some geographic variation (Thompson et al. 1992; Watkins et al. 1987).
Responses to conspecific sounds have been demonstrated in a number of mysticetes, and there is
no reason to believe that fin whales do not communicate similarly (Edds-Walton 1997). The low-
frequency sounds produced by fin whales have the potential to travel over long distances, and it
is possible that long-distance communication occurs in fin whales (Edds-Walton 1997; Payne
and Webb. 1971). Also, there is speculation that the sounds may function for long range
echolocation of large-scale geographic targets such as seamounts, which might be used
for orientation and navigation (Tyack 1999).
Although no studies have directly measured the sound sensitivity of fin whales, experts assume
that fin whales are able to receive sound signals in roughly the same frequencies as the signals
they produce. This suggests fin whales, like other baleen whales, are more likely to have their
best hearing capacities at low frequencies, including frequencies lower than those of normal
human hearing, rather than at mid- to high-frequencies (Ketten 1997b). Several fin whales were
tagged during the Southern California-10 BRS and no obvious responses to a mid-frequency
sound source were detected by the visual observers or in the initial tag analysis (Southall et al.
2011a). Results of studies on blue whales (Goldbogen et al. 2013) (Southall et al. 2011a), which
have similar auditory physiology compared to fin whales, indicate that some individuals hear
some sounds in the mid-frequency range and exhibit behavioral responses to sounds in this range
depending on received level and context. In terms of functional hearing capability fin whales
belong to the low-frequency group, which have a hearing range of 7 Hz to 22 kHz (Southall et al.
2007b).
4.2.2.9 Critical Habitat
NMFS has not designated critical habitat for fin whales.
4.2.3 Humpback Whale
Humpback whales (Megaptera novaeangliae) are distinguished from other whales in the same
Family (Balaenopteridae) by extraordinarily long flippers (up to 5 m or about 1/3 total body
length), a more robust body, fewer throat grooves (14 to 35), more variable dorsal fin, and
utilization of very long (up to 30 min.), complex, repetitive vocalizations (songs) (Payne and
McVay 1971) during courtship. Their grayish-black baleen plates, approximately 270 to 440 on
each side of the jaw, are intermediate in length (6,570 cm) to those of other baleen whales.
Humpbacks in different geographical areas vary somewhat in body length, but maximum
recorded size is 18 m (Winn and Reichley 1985).
144
Biological Opinion and Conference Report on Navy NWTT Activities and NMFS’ MMPA Incidental Take
Authorization PCTS FPR-2015-9110
The whales are generally dark on the back, but the flippers, sides and ventral surface of the body
and flukes may have substantial areas of natural white pigmentation plus acquired scars (white or
black). Researchers distinguish individual humpbacks by the apparently unique black and white
patterns on the underside of the flukes as well as other individually variable features (Glockner
and Venus 1983; Katona and Whitehead 1981; Kaufman and Osmond 1987). On April 21, 2015,
NMFS proposed to divide the globally listed endangered humpback whale population into 14
DPSs (80 FR 22304).
4.2.3.1 Distribution
Humpback whales are a cosmopolitan species that occur in the Atlantic, Indian, Pacific, and
Southern oceans. Humpback whales migrate seasonally between warmer, tropical or sub-tropical
waters in winter months (where they breed and give birth to calves, although feeding
occasionally occurs) and cooler, temperate or sub-Arctic waters in summer months (where they
feed). In both regions, humpback whales tend to occupy shallow, coastal waters. However,
migrations are undertaken through deep, pelagic waters (Winn and Reichley 1985).
In the North Pacific Ocean, the summer range of humpback whales includes coastal and inland
waters from Point Conception, California, north to the Gulf of Alaska and the Bering Sea, and
west along the Aleutian Islands to the Kamchatka Peninsula and into the Sea of Okhotsk (Tomlin
1967, Nemoto 1957, Johnson and Wolman 1984 as cited in NMFS 1991). These whales migrate
to Hawaii, southern Japan, the Mariana Islands, and Mexico during the winter.
4.2.3.1.1 Occurrence in the Offshore Portion of the NWTT Action Area
The California, Oregon, and Washington stock of humpback whales uses the waters off the west
coast of the United States as a summer feeding ground. They are present off the northern
California coast mainly between April and December and off the Oregon and Washington coasts
mainly from May through November (Dohl et al. 1983); (Green et al. 1992a); (Forney and
Barlow 1998); (Calambokidis et al. 2004a); (2010). Visual surveys and acoustic monitoring
studies have detected humpbacks along the Washington coast year-round, with peak occurrence
during the summer and fall (Oleson et al. 2009). Consistent with previous recordings from two
Navy-funded offshore passive acoustic monitoring devices (Kerosky et al. 2013; Oleson and
Hildebrand 2012), humpback whales were most commonly detected in acoustic recordings
between September and December, which is also the peak time for humpback whale singing
(Kerosky et al. 2013). Lower levels of humpback whale calling were also detected from February
through May (Kerosky et al. 2013; Oleson and Hildebrand 2012; Oleson et al. 2009). Visual and
acoustic detections of humpback whales in this area do not fully overlap, as most visual sightings
occur during the summer and early fall (Oleson et al. 2009), which is likely the result of the
strong seasonal variation in humpback whale singing and other vocal behavior (Kerosky et al.
2013; Oleson and Hildebrand 2012). Photo-identification studies suggest that whales feeding in
145
Biological Opinion and Conference Report on Navy NWTT Activities and NMFS’ MMPA Incidental Take
Authorization PCTS FPR-2015-9110
this region are part of a small sub-population that primarily feeds from central Washington to
southern Vancouver Island (Calambokidis et al. 2004a); (Calambokidis et al. 2008b). Whales
appear to range broadly throughout the continental shelf waters, with significant seasonal trends
in distribution; however, detailed knowledge of habitat use and individual residency patterns
while in this feeding area cannot be determined easily through visual surveys alone (Schorr et al.
2013). In winter and spring (roughly January through March), most whales are south on their
breeding grounds and are likely not as abundant in this region of the Action Area during these
times.
Off the U.S. west coast, humpback whales are more abundant in shelf and slope waters (< 6,562
ft. [2,000 m] deep) and are often associated with areas of high productivity (Becker et al. 2012b;
Becker et al. 2010; Forney et al. 2012). Humpback whales primarily feed along the shelf break
and continental slope (Green et al. 1992a; Tynan et al. 2005a). Off Washington, higher
concentrations have been reported between Juan de Fuca Canyon and the outer edge of the shelf
break in a region called “the Prairie,” near Barkley and Nitnat Canyons, and near Swiftsure Bank
(Calambokidis et al. 2004a). Five humpback whales were satellite tagged off Washington
between May 2010 and May 2013. Although tag durations were short with a median duration of
7 days, tag tracks showed all five whales using both shelf and slope waters as well as some
underwater canyons such as the Juan de Fuca Canyon (one of five whales) (DoN 2013c; Schorr
et al. 2013).
Humpback whales feeding off the coast of the west coast of the United States are likely to belong
to either the proposed Mexico DPS or the Central America DPS.
4.2.3.1.2 Occurrence in the Inland Waters of the NWTT Action Area
Although humpback whales were common in inland Washington waters prior to the whaling
period, few sightings had been reported in this area until the last 10 years (Calambokidis and
Steiger 1990; Pinnell and Sandilands 2004; Scheffer and Slipp 1948b). More recently, with the
creation (in 2011) of the Orca Network online forum to compile whale sighting reports, and
increased public interest in reporting whale sightings, the number of humpback whale sightings
in inland waters has increased. Inland water opportunistic sightings primarily occur from April
through July, but sightings are reported in every month of the year. Most sightings occur in the
Strait of Juan de Fuca and in the San Juan Island area, with only occasional sightings in Puget
Sound.
In Puget Sound (defined as south of Admiralty Inlet), Calambokidis et al. (2002) recorded only
six individuals between 1996 and 2001. However, from January 2003 through July 2012 there
were over 60 sightings of humpback whales reported to Orca Network, some of which could be
the same individuals (Orca Network 2012). A review of the reported sightings in Puget Sound
indicates that humpback whales usually occur as individuals or in pairs (Orca Network 2012).
146
Biological Opinion and Conference Report on Navy NWTT Activities and NMFS’ MMPA Incidental Take
Authorization PCTS FPR-2015-9110
Sightings of humpback whales in Puget Sound vary by location but are infrequent. From the
Rich Passage to Agate Passage area in the vicinity of (NAVBASE Kitsap Bremerton and
Keyport, only one unverified sighting of a humpback whale was reported to Orca Network (Orca
Network 2012) from January 2003 through July 2012. In Hood Canal and Dabob Bay (where
NAVBASE Kitsap Bangor and the Dabob Bay Range Complex [DBRC] are located,
respectively), one humpback whale was observed for several weeks in January and February
2012. Prior to this sighting, there were no confirmed reports of humpback whales entering Hood
Canal or Dabob Bay. In the Saratoga Passage area (between NAVSTA Everett and NASWI), one
humpback whale was reported in Penn Cove south of Crescent Harbor in July 2008. This is the
only humpback report from January 2003 through September 2012 that was considered a likely
positive identification (Orca Network 2012). There have been no verified humpback sightings in
the Carr Inlet area between January 2003 and July 2012. Two unverified sightings were reported
to Orca Network to the north of Carr Inlet, near Point Defiance, Tacoma, over the same time
period. The last verified sighting was in June and July of 1988 when two individually identified
juvenile humpback whales were observed traveling throughout the waters of southern Puget
Sound for several weeks (Calambokidis and Steiger 1990).
Given their general migration patterns, this species is rare in the inland waters, but is expected to
be more likely to occur in the warmer months (May through November). However, it is not
expected to be present in all areas, nor remain for long time periods.
4.2.3.1.3 Occurrence in the Western Behm Canal, Alaska - NWTT Action Area
In summer, relatively high densities of humpback whales occur throughout much of southeast
Alaska (Allen and Angliss 2012). Because this species makes extensive use of inland coastal
waters, it is the large whale species most likely to be found in the Southeast Alaska area.
Humpback whales are commonly sighted in Ernest Sound (north of the SEAFAC) and near the
mouth of Boca de Quadra (south of SEAFAC), but specific data are lacking (DoN 1991).
Although specific data are lacking, it is likely that humpback whales occasionally use the Behm
Canal heading to Gedney Pass (DoN 1991). Humpback whales were observed frequently during
the 1991 to 2007 surveys (spring through fall) of the inland waters of southeast Alaska
(Dahlheim et al. 2009). Although surveys were not conducted in the winter months in southeast
Alaska, observations have been made of humpback whales that have not migrated south, but
remained in Alaskan waters to feed (Moran et al. 2009).
Humpback whales feeding in the Western Behm Canal belong to the proposed Hawaii DPS6.
6 Humpback whales were originally listed as endangered in 1970 (35 FR 18319), and this status
remains under the ESA. On April 21, 2015, NMFS proposed to divide the globally listed
147
Biological Opinion and Conference Report on Navy NWTT Activities and NMFS’ MMPA Incidental Take
Authorization PCTS FPR-2015-9110
4.2.3.2 Population Structure
Descriptions of the population structure of humpback whales differ depending on whether an
author focuses on where humpback whales winter or where they feed. During winter months in
northern or southern hemispheres, adult humpback whales migrate to specific areas in warmer,
tropical waters to reproduce and give birth to calves. During summer months, humpback whales
migrate to specific areas in northern temperate or sub-arctic waters to forage. In summer months,
humpback whales from different “reproductive areas” will congregate to feed; in the winter
months, whales will migrate from different foraging areas to a single wintering area. In either
case, humpback whales appear to form “open” populations; that is, populations that are
connected through the movement of individual animals.
Based on genetic and photo-identification studies, the NMFS currently recognizes four stocks,
likely corresponding to populations, of humpback whales in the North Pacific Ocean: two in the
eastern North Pacific, one in the central North Pacific, and one in the western Pacific (Hill and
DeMaster 1998). However, gene flow between them may exist. Humpback whales summer in
coastal and inland waters from Point Conception, California, north to the Gulf of Alaska and the
Bering Sea, and west along the Aleutian Islands to the Kamchatka Peninsula and into the Sea of
Okhotsk (Johnson and Wolman 1984; Nemoto 1957; Tomilin 1967). These whales migrate to
Hawai′i, southern Japan, the Mariana Islands, and Mexico during winter. However, more
northerly penetrations in Arctic waters occur on occasion (Hashagen et al. 2009). The central
North Pacific population winters in the waters around Hawai′i while the eastern North Pacific
population (also called the California-Oregon-Washington-Mexico stock) winters along Central
America and Mexico. However, Calambokidis et al. (1997) identified individuals from several
populations wintering (and potentially breeding) in the areas of other populations, highlighting
the potential fluidity of population structure. Herman (1979) presented extensive evidence that
humpback whales associated with the main Hawaiian Islands immigrated there only in the past
200 years. Winn and Reichley (1985) identified genetic exchange between the humpback whales
that winter off Hawaii and Mexico (with further mixing on feeding areas in Alaska) and
suggested that humpback whales that winter in Hawai′i may have emigrated from Mexican
wintering areas. A “population” of humpback whales winters in the South China Sea east
through the Philippines, Ryukyu Retto, Ogasawara Gunto, Mariana Islands, and Marshall
Islands, with occurrence in the Mariana Islands, at Guam, Rota, and Saipan from January to
endangered humpback whale population into 14 DPSs (80 FR 22304). The humpback whales in
the Action Area potentially belong to one of three proposed DPSs: the non-ESA-listed Hawaii
DPS, the non-ESA-listed Mexico DPS, or the threatened Central America DPS. All three of
these DPSs may feed seasonally in the Action Area.
148
Biological Opinion and Conference Report on Navy NWTT Activities and NMFS’ MMPA Incidental Take
Authorization PCTS FPR-2015-9110
March (Darling and Cerchio 1993; Eldredge 1991; Eldredge 2003; Rice 1998). During summer,
whales from this population migrate to the Kuril Islands, Bering Sea, Aleutian Islands, Kodiak,
Southeast Alaska, and British Columbia to feed (Angliss and Outlaw 2008; Calambokidis 1997;
Calambokidis et al. 2001).
Separate feeding groups of humpback whales are thought to inhabit western U.S. and Canadian
waters, with the boundary between them located roughly at the U.S./Canadian border. The
southern feeding ground ranges between 32° to 48°N, with limited interchange with areas north
of Washington State (Calambokidis et al. 2004b; Calambokidis et al. 1996). Humpback whales
feed along the coasts of Oregon and Washington from May-November, with peak numbers
reported May-September, when they are the most commonly reported large cetacean in the
region (Calambokidis and Chandler. 2000; Calambokidis et al. 2004b; Dohl 1983; Green et al.
1992b). Off Washington State, humpback whales concentrate between Juan de Fuca Canyon and
the outer edge of the shelf break in a region called “the Prairie,” near Barkley and Nitnat
canyons, in the Blanco upwelling zone, and near Swiftsure Bank (Calambokidis et al. 2004b).
Humpback whales also tend to congregate near Heceta Bank off the coast of Oregon (Green et
al. 1992b). Additional data suggest that further subdivisions in feeding groups may exist, with up
to six feeding groups present between Kamchatka and southern California (Witteveen et al.
2009).
Humpback whales primarily feed along the shelf break and continental slope (Green et al. 1992b;
Tynan et al. 2005b). Although humpback whales were common in inland Washington State
waters in the early 1900s, severe hunting throughout the eastern North Pacific has diminished
their numbers and few recent inshore sightings have been made (Calambokidis et al. 1990;
Scheffer and Slipp 1948a).
Historically, humpback whales occurred in Puget Sound. Since the 1970s, however, humpback
whales have become rare within Puget Sound, although at least five humpback whales have been
observed in Puget Sound since 1976 (Calambokidis et al. 1990; Calambokidis et al. 2004b;
Osborne et al. 1988a). Because of their contemporary rarity in Puget Sound, we assume that
humpback whales would not be exposed to Navy training activities within the Sound itself, but
would be exposed in waters offshore of Washington.
Although humpback whales no longer appear to occur regularly in Puget Sound, they have
consistently been more common than any other large cetacean observed off the coast of
Washington State for more than a decade (Calambokidis et al. 2009b; Calambokidis et al. 2004b;
Forney 2007). Humpback whales occur in those waters seasonally from May through November,
becoming fairly common beginning in July, and reaching peak densities from August to
September with density declining substantially from September onward (Calambokidis 1997;
Calambokidis and Chandler. 2000; Calambokidis et al. 2001; Calambokidis et al. 1997; Green et
149
Biological Opinion and Conference Report on Navy NWTT Activities and NMFS’ MMPA Incidental Take
Authorization PCTS FPR-2015-9110
al. 1992b). During that time interval, humpback whales have been reported in coastal waters, on
the continental shelf, and the continental slope, with concentrations occurring in steep slope
water near Grays, Astoria, and Nitinat canyons (Forney 2007; Green et al. 1992b).
Several authors have reported that humpback whales do not occur off the coasts of Washington
and Oregon in the winter (Green et al. 1992b). However, Shelden et al. (Shelden et al. 2000)
reported observations of humpback whales north and south of Juan de Fuca canyon (off northern
Washington) in late December. These authors also reported that humpback whales were common
in Georgia Strait during the winter in the early 1900s and they suggested that, as their population
increases, humpback whales might be re-occupying areas they had previously abandoned after
their populations were decimated by whalers; these authors also allowed that humpback whales
might remain in waters off Washington when their prey is abundant late in the year.
4.2.3.3 Abundance Estimate
A large-scale photo-identification sampling study of humpback whales was conducted from 2004
to 2006 throughout the North Pacific (Barlow et al. 2011; Calambokidis et al. 2008b). Known as
the SPLASH (Structure of Populations, Levels of Abundance, and Status of Humpbacks) Project,
the study was designed to sample all known North Pacific feeding and breeding populations.
Overall humpback whale abundance in the North Pacific based on the SPLASH Project was
estimated at 21,808 individuals (CV = 0.04), confirming that this population of humpback
whales has continued to increase and is now greater than some pre-whaling abundance estimates
(Barlow et al. 2011). Data indicate that the North Pacific population has been increasing at a rate
of between 5.5 percent and 6.0 percent per year, approximately doubling every 10 years
(Calambokidis et al. 2008b). Baker et al. (2013) commented that humpback whales display a
complex population structure based on DNA samples taken from 10 humpback whale feeding
and eight breeding regions within the Pacific.
The Central North Pacific stock has been estimated at 10,103 individuals based on data from
their wintering grounds throughout the main Hawaiian Islands (Allen and Angliss 2014). In
summer, the majority of humpback whales from the Central North Pacific stock are found in the
Aleutian Islands, Bering Sea, Gulf of Alaska, and southeast Alaska/northern British Columbia,
where relatively high densities of whales occur (Allen and Angliss 2012). There is a high rate of
interchange between whales found in southeast Alaska and northern British Columbia, and based
on data from both inshore and offshore waters in these regions, abundance estimates range from
2,883 to 6,414 animals (Calambokidis et al. 2008b).
The current best estimate for the California, Oregon, and Washington stock is 1,918 (CV = 0.03)
(Carretta et al. 2014). Based on ship surveys conducted in the summer and fall from 1991 to
2008, it is estimated that 260 humpback whales (CV = 0.32) occur in waters off Washington and
Oregon (Barlow 2010b). Abundance estimates derived from finer scale ship survey data
150
Biological Opinion and Conference Report on Navy NWTT Activities and NMFS’ MMPA Incidental Take
Authorization PCTS FPR-2015-9110
collected off the northern Washington coast between 1995 and 2002 yielded line-transect
estimates that ranged from 85 to 562 animals (CV = 0.21 to 0.33) and capture-recapture
estimates that ranged from 89 to 343 animals (CV = 0.19 to 0.36) (Calambokidis et al. 2004a).
Both of the high estimates were for 2002 when sighting rates and corresponding abundance
estimates increased dramatically. Without the 2002 data, estimates ranged from 85 to 125 and 80
to 230 animals based on line-transect and capture-recapture methods, respectively. Carretta et al.
(2014) estimate the Northern Washington/Southern British Columbia stock at 189 individuals.
The current best estimated abundance of the proposed DPSs are 12,000 for the Hawaii DPS;
6,000 to 7,000 for the Mexico DPS; and 600 for the Central America DPS (80 CFR 22303).
4.2.3.4 Natural Threats
Natural sources and rates of mortality of humpback whales are not well known. Based upon
prevalence of tooth marks, attacks by killer whales appear to be highest among humpback
whales migrating between Mexico and California, although populations throughout the Pacific
Ocean appear to be targeted to some degree (Steiger et al. 2008). Juveniles appear to be the
primary age group targeted. Humpback whales engage in grouping behavior, flailing tails, and
rolling extensively to fight off attacks. Calves remain protected near mothers or within a group
and lone calves have been known to be protected by presumably unrelated adults when
confronted with attack (Ford and Reeves 2008).
Parasites and biotoxins from red-tide blooms are other potential causes of mortality (Perry et al.
1999a). The occurrence of the nematode Crassicauda boopis appears to increase the potential for
kidney failure in humpback whales and may be preventing some populations from recovering
(Lambertsen 1992). Studies of 14 humpback whales that stranded along Cape Cod between
November 1987 and January 1988 indicate they apparently died from a toxin produced by
dinoflagellates during this period.
4.2.3.5 Anthropogenic Threats
Three human activities are known to threaten humpback whales: whaling, commercial fishing,
and shipping. Historically, whaling represented the greatest threat to every population of whales
and was ultimately responsible for listing several species as endangered.
Humpback whales are also killed or injured during interactions with commercial fishing gear.
Like fin whales, humpback whales have been entangled by fishing gear off Newfoundland and
Labrador, Canada. A total of 595 humpback whales were reported captured in coastal fisheries in
those two provinces between 1969 and 1990, of which 94 died (Lien 1994; Perkins and Beamish
1979). Along the Atlantic coast of the U.S. and the Maritime Provinces of Canada, there were
160 reports of humpback whales being entangled in fishing gear between 1999 and 2005 (Cole et
151
Biological Opinion and Conference Report on Navy NWTT Activities and NMFS’ MMPA Incidental Take
Authorization PCTS FPR-2015-9110
al. 2005; Nelson et al. 2007). Of these, 95 entangled humpback whales were confirmed, with 11
whales sustaining injuries and nine dying of their wounds. NMFS estimates that between 2002
and 2006, there were incidental serious injuries to 0.2 humpback annually in the Bering
Sea/Aleutian Islands sablefish longline fishery. However, NMFS does not consider this
estimation reliable because observers have not been assigned to a number of fisheries known to
interact with the Central and Western North Pacific stocks of humpback whale. In addition, the
Canadian observation program is also limited and uncertain (Angliss and Allen 2009).
More humpback whales are killed in collisions with ships than any other whale species except
fin whales (Jensen and Silber 2003). Along the Pacific coast, a humpback whale is known to be
killed about every other year by ship strikes (Barlow et al. 1997). Of 123 humpback whales that
stranded along the Atlantic coast of the U.S. between 1975 and 1996, 10 (8.1 percent) showed
evidence of collisions with ships (Laist et al. 2001). Between 1999 and 2005, there were 18
reports of humpback whales being struck by vessels along the Atlantic coast of the U.S. and the
Maritime Provinces of Canada (Cole et al. 2005; Nelson et al. 2007). Of these reports, 13 were
confirmed as ship strikes and in seven cases, ship strike was determined to be the cause of death.
In the Bay of Fundy, recommendations for slower vessel speeds to avoid right whale ship strike
appear to be largely ignored (Vanderlaan et al. 2008). However, new rules for seasonal (June
through December) slowing of vessel traffic to 10 knots and changing shipping lanes by less than
one nautical mile to avoid the greatest concentrations of right whales are expected to reduce the
chance of humpback whales being hit by ships by 9 percent.
Organochlorines, including PCB and DDT, have been identified from humpback whale blubber
(Gauthier et al. 1997). Higher PCB levels have been observed in Atlantic waters versus Pacific
waters along the United States and levels tend to increase with individual age (Elfes et al. 2010).
Although humpback whales in the Gulf of Maine and off Southern California tend to have the
highest PCB concentrations, overall levels are on par with other baleen whales, which are
generally lower than odontocete cetaceans (Elfes et al. 2010). As with blue whales, these
contaminants are transferred to young through the placenta, leaving newborns with contaminant
loads equal to that of mothers before bioaccumulating additional contaminants during life and
passing the additional burden to the next generation (Metcalfe et al. 2004). Contaminant levels
are relatively high in humpback whales as compared to blue whales. Humpback whales feed
higher on the food chain, where prey carry higher contaminant loads than the krill that blue
whales feed on.
4.2.3.6 Status and Trends
Humpback whales were originally listed as endangered in 1970 (35 FR 18319), and this status
remains under the ESA. On April 21, 2015, NMFS proposed to divide the globally listed
endangered humpback whale population into 14 DPSs (80 FR 22304). The humpback whales in
152
Biological Opinion and Conference Report on Navy NWTT Activities and NMFS’ MMPA Incidental Take
Authorization PCTS FPR-2015-9110
the Action Area potentially belong to one of three proposed DPSs: the non-ESA-listed Hawaii
DPS, the non-ESA-listed Mexico DPS, or the threatened Central America DPS. All three of
these DPSs may feed seasonally in the Action Area.
In the North Pacific the pre-exploitation population size may have been as many as 15,000
humpback whales, and current estimates are 6,000 to 8,000 whales (Calambokidis et al. 2009b;
Rice 1978). It is estimated that 15,000 humpback whales resided in the North Pacific in 1905
(Rice 1978). However, from 1905 to 1965, nearly 28,000 humpback whales were harvested in
whaling operations, reducing the number of all North Pacific humpback whale to roughly 1,000
(Perry et al. 1999a). Population estimates have risen over time from 1,407 to 2,100 in the 1980s
to 6,010 in 1997 (Baker 1985; Baker and Herman 1987; Calambokidis et al. 1997; Darling and
Morowitz 1986). Based on surveys between 2004 and 2006, Calambokidis et al. (2008a)
estimated that the number of humpback whales in the North Pacific consisted of about 18,300
whales, not counting calves. Because estimates vary by methodology, they are not directly
comparable and it is not clear which of these estimates is more accurate or if the change from
1,407 to 18,300 is the result of a real increase or an artifact of model assumptions. Tentative
estimates of the eastern North Pacific stock suggest an increase of 6 to 7 percent annually, but
fluctuations have included negative growth in the recent past (Angliss and Outlaw 2005).
4.2.3.7 Diving
Maximum diving depths are approximately 170 m, with a very deep dive (240 m) recorded off
Bermuda (Hamilton et al. 1997). Dives can last for up to 21 min, although feeding dives ranged
from 2.1 to 5.1 min in the north Atlantic (Dolphin 1987). In southeast Alaska, average dive times
were 2.8 min for feeding whales, 3.0 min for non-feeding whales, and 4.3 min for resting whales
(Dolphin 1987). Because most humpback prey is likely found within 300 m of the surface, most
humpback dives are probably relatively shallow. In Alaska, capelin are the primary prey of
humpback and are found primarily between 92 and 120 m; depths to which humpbacks
apparently dive for foraging (Witteveen et al. 2008).
4.2.3.8 Social Behavior
During the feeding season, humpback whales form small groups that occasionally aggregate on
concentrations of food that may be stable for long-periods of times. Humpbacks use a wide
variety of behaviors to feed on various small, schooling prey including krill and fish (Hain et al.
1982; Hain et al. 1995; Jurasz and Jurasz 1979; Weinrich et al. 1992). There is good evidence of
some territoriality on feeding and calving areas (Clapham 1994; Clapham 1996; Tyack 1981).
Humpback whales are generally believed to fast while migrating and on breeding grounds, but
some individuals apparently feed while in low-latitude waters normally believed to be used
exclusively for reproduction and calf-rearing (Danilewicz et al. 2009; Pinto De Sa Alves et al.
153

Biological Opinion and Conference Report on Navy NWTT Activities and NMFS’ MMPA Incidental Take
Authorization PCTS FPR-2015-9110
2009). Some individuals, such as juveniles, may not undertake migrations at all (Findlay and
Best. 1995).
Humpback whales feed on pelagic schooling euphausiids and small fish including capelin,
herring and mackerel. Like other large mysticetes, they are a “lunge feeder” taking advantage of
dense prey patches and engulfing as much food as possible in a single gulp. They also blow nets,
or curtains, of bubbles around or below prey patches to concentrate the prey in one area, then
lunge with open mouths through the middle. Dives appear to be closely correlated with the
depths of prey patches, which vary from location to location. In the north Pacific (southeast
Alaska), most dives were of fairly short duration (<4 min) with the deepest dive to 148 m
(Dolphin 1987), while whales observed feeding on Stellwagen Bank in the North Atlantic dove
to <40 m (Hain et al. 1995). Hamilton et al. (1997) tracked one possibly feeding whale near
Bermuda to 240 m depth.
4.2.3.9 Vocalization and Hearing
Humpback whale vocalization is much better understood than is hearing. Different sounds are
produced that correspond to different functions: feeding, breeding, and other social calls (Dunlop
et al. 2008). Males sing complex sounds while in low-latitude breeding areas in a frequency
range of 20 Hz to 4 kHz with estimated source levels from 144 to 174 dB (Au et al. 2006b; Au et
al. 2000b; Frazer and Mercado III 2000; Richardson et al. 1995d; Winn et al. 1970). Males also
produce sounds associated with aggression, which are generally characterized as frequencies
between 50 Hz to 10 kHz and having most energy below 3 kHz (Silber 1986; Tyack 1983). Such
sounds can be heard up to 9 km away (Tyack 1983). Other social sounds from 50 Hz to 10 kHz
(most energy below 3 kHz) are also produced in breeding areas (Richardson et al. 1995d; Tyack
1983). While in northern feeding areas, both sexes vocalize in grunts (25 Hz to 1.9 kHz), pulses
(25 to 89 Hz), and songs (ranging from 30 Hz to 8 kHz but dominant frequencies of 120 Hz to 4
kHz) which can be very loud (175 to 192 dB re 1 Pa at 1 m) (Au et al. 2000b; Erbe 2002a;
Payne 1985; Richardson et al. 1995d; Thompson et al. 1986b). However, humpbacks tend to be
less vocal in northern feeding areas than in southern breeding areas (Richardson et al. 1995d).
Humpback whales are known to produce three classes of vocalizations: (1) “songs” in the late
fall, winter, and spring by solitary males; (2) social sounds made by calves (Zoidis et al. 2008) or
within groups on the wintering (calving) grounds; and (3) social sounds made on the feeding
grounds (Thomson and Richardson 1995). The best-known types of sounds produced by
humpback whales are songs, which are thought to be reproductive displays used on breeding
grounds only by adult males (Clark and Clapham 2004; Gabriele and Frankel. 2002; Helweg et
al. 1992; Schevill et al. 1964; Smith et al. 2008). Singing is most common on breeding grounds
during the winter and spring months, but is occasionally heard in other regions and
seasons (Clark and Clapham 2004; Gabriele and Frankel. 2002; McSweeney et al. 1989). Au et
154
Biological Opinion and Conference Report on Navy NWTT Activities and NMFS’ MMPA Incidental Take
Authorization PCTS FPR-2015-9110
al. (2000a) noted that humpbacks off Hawaii tended to sing louder at night compared to the day.
There is geographical variation in humpback whale song, with different populations singing a
basic form of a song that is unique to their own group. However, the song evolves over the
course of a breeding season, but remains nearly unchanged from the end of one season to the
start of the next (Payne et al. 1983). The song is an elaborate series of patterned vocalizations
that are hierarchical in nature, with a series of songs (‘song sessions’) sometimes lasting for
hours (Payne and McVay 1971). Components of the song range from below 20 Hz up to 4 kHz,
with source levels measured between 151 and 189 dB re 1 μPa-m and high-frequency harmonics
extending beyond 24 kHz (Au et al. 2006b; Winn et al. 1970).
Social calls range from 20 Hz to 10 kHz, with dominant frequencies below 3 kHz (D'Vincent et
al. 1985b; Dunlop et al. 2008; Silber 1986; Simao and Moreira 2005). Female vocalizations
appear to be simple; Simao and Moreira (2005) noted little complexity.
“Feeding” calls, unlike song and social sounds are a highly stereotyped series of narrow-band
trumpeting calls. These calls are 20 Hz to 2 kHz, less than 1 second in duration, and have source
levels of 162 to 192 dB re 1 μPa-m (D'Vincent et al. 1985b; Thompson et al. 1986b). The
fundamental frequency of feeding calls is approximately 500 Hz (D'Vincent et al. 1985a;
Thompson et al. 1986a). The acoustics and dive profiles associated with humpback whale
feeding behavior in the northwest Atlantic has been documented with Digital Acoustic
Recording Tags (DTAGs7) (Stimpert et al. 2007). Underwater lunge behavior was associated
with nocturnal feeding at depth and with multiple bouts of broadband click trains that were
acoustically different from toothed whale echolocation: Stimpert et al. (Stimpert et al. 2007)
termed these sounds “mega-clicks” which showed relatively low received levels at the DTAGs
(143 to 154 dB re 1 μPa), with the majority of acoustic energy below 2 kHz.
Humpback whale audiograms using a mathematical model based on the internal structure of the
ear estimate sensitivity is from 700 Hz to 10 kHz, with maximum relative sensitivity between 2
kHz and 6 kHz (Ketten and Mountain 2014). Previously mentioned research by Au et al. (2001)
and Au et al. (2006a) off Hawaii indicated the presence of high-frequency harmonics in
vocalizations up to and beyond 24 kHz. While recognizing this was the upper limit of the
recording equipment, it does not demonstrate that humpbacks can actually hear those harmonics,
which may simply be correlated harmonics of the frequency fundamental in the humpback whale
song. The ability of humpbacks to hear frequencies around 3 kHz may have been demonstrated
in a playback study. Maybaum (1990) reported that humpback whales showed a mild response to
7 DTAG is a novel archival tag, developed to monitor the behavior of marine mammals, and their response to sound, continuously
throughout the dive cycle. The tag contains a large array of solid-state memory and records continuously from a built-in hydrophone and suite of sensors. The sensors sample the orientation of the animal in three dimensions with sufficient speed and resolution to capture individual fluke strokes. Audio and sensor recording is synchronous so the relative timing of sounds and motion can be determined precisely Johnson, M. P., and P. L. Tyack. 2003. A digital acoustic recording tag for measuring the response of wild marine mammals to sound. IEEE Journal of Oceanic Engineering 28(1):3-12.
155
Biological Opinion and Conference Report on Navy NWTT Activities and NMFS’ MMPA Incidental Take
Authorization PCTS FPR-2015-9110
a handheld sonar marine mammal detection and location device with frequency of 3.3 kHz at 219
dB re 1μPa-m or frequency sweep of 3.1 kHz to 3.6 kHz (although it should be noted that this
system is significantly different from the Navy’s hull mounted sonar). In addition, the system
had some low frequency components (below 1 kHz) which may have been an artifact of the
acoustic equipment. This possible artifact may have affected the response of the whales to both
the control and sonar playback conditions.
Results of studies on blue whales (Goldbogen et al. 2013; Southall et al. 2011a), which have
similar auditory physiology compared to humpback whales, indicate that some individuals hear
some sounds in the mid-frequency range and exhibit behavioral responses to sounds in this range
depending on received level and context. In terms of functional hearing capability humpback
whales belong to low-frequency cetaceans which have a hearing range of 7 Hz to 22 kHz
(Southall et al. 2007b).
Humpback whales are the most abundant ESA-listed species observed during Navy visual
surveys in the winter months. To date, humpback whales have been documented as the species
which has received the highest sound pressure levels from US Navy mid-frequency active sonar
(MFAS) training (i.e. at least 183 dB re 1microPa) based upon an analysis which utilized
shipboard Marine Mammal Observer sightings on February 18, 2011 (Farak et al. 2011),
combined with PMRF range hydrophone data (Martin and Manzano-Roth 2012). Analysis of
PMRF range hydrophone data for purpose of estimating received levels on marine mammals has
also been done in conjunction with satellite tagged animals (Baird et al. 2014) and aerial focal
follows (Mobley Jr. and Pacini 2013). Passive acoustic monitoring (PAM) of PMRF
hydrophones during Navy training for the month of Feb from 2011 to 2013 has shown that
acoustically localized minke whales are reduced during periods involving MFAS training
activity when compared to other periods of time (Martin et al. 2014) . PAM monitoring for
beaked whale foraging dives at PMRF has also shown reduced foraging dive rates during periods
of MFAS training with estimated receive levels on the group dive members (mean levels of 109
dB re 1 microPa) in February of 2012 (Manzano-Roth et al. 2013a). Acoustic analysis has also
shown that marine mammals near the sea surface can be exposed to higher estimated receive
levels due to ducted propagation, that typically exists at PMRF. Analysis of behaviors observed
during one focal follow taken during aerial surveys, in conjunction with estimated received
levels using PMRF passive acoustic data products, are reported as a case study of a single focal
follow on a humpback whale in the vicinity of MFAS (Mobley Jr. and Pacini 2013).
4.2.3.10 Critical Habitat
NMFS has not designated critical habitat for humpback whales.
156
Biological Opinion and Conference Report on Navy NWTT Activities and NMFS’ MMPA Incidental Take
Authorization PCTS FPR-2015-9110
4.2.4 Sei Whale
Sei whales (pronounced "say" or "sigh"; Balaenoptera borealis) are members of the baleen
whale family and are considered one of the "great whales" or rorquals. Two subspecies of sei
whales are recognized, B. b. borealis in the Northern Hemisphere and B. b. schlegellii in the
Southern Hemisphere.
These large animals can reach lengths of about 40 to 60 ft (12-18 m) and weigh 100,000 lbs
(45,000 kg). Females may be slightly longer than males. Sei whales have a long, sleek body that
is dark bluish-gray to black in color and pale underneath. The body is often covered in oval-
shaped scars (probably caused from cookie-cutter shark and lamprey bites) and sometimes has
subtle "mottling". This species has an erect "falcate", "dorsal" fin located far down (about two-
thirds) the animals back. They often look similar in appearance to Bryde's whales, but can be
distinguished by the presence of a single ridge located on the animal's "rostrum". Bryde's whales,
unlike other rorquals, have three distinct prominent longitudinal ridges on their rostrum. Sei
whales have 219 to 410 baleen plates that are dark in color with gray/white fine inner fringes in
their enormous mouths. They also have 30 to 65 relatively short ventral pleats that extend from
below the mouth to the naval area. The number of throat grooves and baleen plates may differ
depending on geographic population.
The Sei is regarded as the fastest swimmer among the great whales, reaching bursts of speed in
excess of 20 knots. When a sei whale begins a dive it usually submerges by sinking quietly
below the surface, often remaining only a few meters deep, leaving a series of swirls or tracks as
it move its flukes. When at the water's surface, sei whales can be sighted by a columnar or bushy
blow that is about 10 to 13 feet (3 to 4 m) in height. The dorsal fin usually appears at the same
time as the blowhole, when the animal surfaces to breathe. This species usually does not arch its
back or raise its flukes when diving. Sei whales have an estimated lifespan of 50 to 70 years.
4.2.4.1 Distribution
The sei whale occurs in all oceans of the world except the Arctic. The migratory pattern of this
species is thought to encompass long distances from high-latitude feeding areas in summer to
low-latitude breeding areas in winter; however, the location of winter areas remains largely
unknown (Perry et al. 1999a). Sei whales are often associated with deeper waters and areas along
continental shelf edges (Hain et al. 1985). This general offshore pattern is disrupted during
occasional incursions into shallower inshore waters (Waring et al. 2004). The species appears to
lack a well-defined social structure and individuals are usually found alone or in small groups of
up to six whales (Perry et al. 1999a). When on feeding grounds, larger groupings have been
observed (Gambell 1985b).
157
Biological Opinion and Conference Report on Navy NWTT Activities and NMFS’ MMPA Incidental Take
Authorization PCTS FPR-2015-9110
In the western Atlantic Ocean, sei whales occur from Nova Scotia and Labrador in the summer
months and migrate south to Florida, the Gulf of Mexico, and the northern Caribbean (Gambell
1985b). In the eastern Atlantic Ocean, sei whales occur in the Norwegian Sea (as far north as
Finnmark in northeastern Norway), occasionally occurring as far north as Spitsbergen Island, and
migrate south to Spain, Portugal, and northwest Africa (Gambell 1985b).
In the North Pacific Ocean, sei whales occur from the Bering Sea south to California (on the
east) and the coasts of Japan and Korea (on the west). During the winter, sei whales are found
from 20° to 23° N (Gambell 1985b; Masaki 1977).
Sei whales occur throughout the Southern Ocean during the summer months, although they do
not migrate as far south to feed as blue or fin whales. During the austral winter, sei whales occur
off Brazil and the western and eastern coasts of Southern Africa and Australia. During the
winter, sei whales are found from 20° to 23°N (Gambell 1985b; Masaki 1977). Sasaki et al.
(2013) demonstrated that sei whale in the North Pacific are strongly correlated with sea surface
temperatures between 13.1 and 16.8 degrees C.
4.2.4.1.1 Occurrence in the Offshore Portion of the NWTT Action Area
Sei whales are distributed offshore in waters off the U.S. west coast (Carretta et al. 2012). They
are generally found feeding along the California Current, preferring deep water habitat along the
continental shelf break (Perry et al. 1999a). During six systematic ship surveys conducted
between 1991 and 2008 in waters off the U.S. west coast to approximately 300 nm offshore,
there were a total of 10 sei whale sightings, four of which were in waters off Oregon and
Washington (Barlow 2010b). There were no sei whale sightings during more coastal (out to
about the 660 ft. [200 m] isobath) ship surveys off the northern Washington coast between 1995
and 2002 (Calambokidis et al. 2004a). Sei whales migrate into the Action area in summer and
fall and are found farther south in winter (Matsuoka et al. 2013b; Perry et al. 1999b).
4.2.4.1.2 Occurrence in the Inland Waters of the NWTT Action Area
Sei whales are considered rare in the Inland Waters including Puget Sound. A sei whale washed
ashore west of Port Angeles in the Strait of Juan de Fuca during September 2003 (Preston 2003),
but this is considered an unusual event.
4.2.4.1.3 Occurrence in the Western Behm Canal, Alaska - NWTT Action Area
Sei whales are not expected to occur within the SEAFAC region of the Action Area since it is
well inland of the areas normally inhabited by sei whales.
158
Biological Opinion and Conference Report on Navy NWTT Activities and NMFS’ MMPA Incidental Take
Authorization PCTS FPR-2015-9110
4.2.4.2 Population Structure
The population structure of sei whales is not well defined, but presumed to be discrete by ocean
basin (north and south), except for sei whales in the Southern Ocean, which may form a
ubiquitous population or several discrete ones.
Some mark-recapture, catch distribution, and morphological research indicate more than one
population may exist in the North Pacific Ocean—one between 155° and 175° W, and another
east of 155° W (Masaki 1976; Masaki 1977). Sei whales have been reported primarily south of
the Aleutian Islands, in Shelikof Strait and waters surrounding Kodiak Island, in the Gulf of
Alaska, and inside waters of southeast Alaska and south to California to the east and Japan and
Korea to the west (Leatherwood et al. 1982b; Nasu 1974). Sightings have also occurred in
Hawaiian waters (Smultea et al. 2010). Sei whales have been occasionally reported from the
Bering Sea and in low numbers on the central Bering Sea shelf (Hill and DeMaster 1998).
Whaling data suggest that sei whales do not venture north of about 55° N (Gregr et al. 2000).
Masaki (1977) reported sei whales concentrating in the northern and western Bering Sea from
July to September, although other researchers question these observations because no other
surveys have reported sei whales in the northern and western Bering Sea. Harwood (1987)
evaluated Japanese sighting data and concluded that sei whales rarely occur in the Bering Sea.
Harwood (1987) reported that 75 to 85 percent of the North Pacific population resides east of
180°. During winter, sei whales are found from 20° to 23° N (Gambell 1985b; Masaki 1977).
Considering the many British Columbia whaling catches in the early to mid-1900s, sei whales
have clearly utilized this area in the past (Gregr et al. 2000; Pike and Macaskie 1969).
Sei whales appear to prefer to forage in regions of steep bathymetric relief, such as continental
shelf breaks, canyons, or basins situated between banks and ledges (Best and Lockyer 2002;
Gregr and Trites 2001; Kenney and Winn 1987), where local hydrographic features appear to
help concentrate zooplankton, especially copepods. In their foraging areas, sei whales appear to
associate with oceanic frontal systems (Horwood 1987). In the north Pacific, sei whales are
found feeding particularly along the cold eastern currents (Perry et al. 1999a).
In the early to mid-1900s, sei whales were hunted off the coast of British Columbia (Gregr et al.
2000; Pike and Macaskie 1969). Masaki (1977) presented sightings data on sei whales in the
North Pacific from the mid-1960s to the early 1970s. Over that time interval sei whales did not
appear to occur in waters of Washington State and southern British Columbia in May or June,
their densities increased in those waters in July and August (1.9 to 2.4 and 0.7 to 0.9 whales per
100 miles of distance for July and August, respectively), then declined again in September. More
recently, sei whales have become known for an irruptive migratory habit in which they appear in
an area then disappear for time periods that can extend to decades. Based on a sei whale that
stranded near Port Angeles and the sei whales observed by Forney and her co-workers (Forney
159
Biological Opinion and Conference Report on Navy NWTT Activities and NMFS’ MMPA Incidental Take
Authorization PCTS FPR-2015-9110
2007), we know that these whales still occur in waters off Washington, Oregon, and northern
California.
4.2.4.3 Abundance Estimate
In the North Pacific, the pre-exploitation sei whale population was estimated at 42,000 whales
(Tillman 1977a). The most current population estimate for sei whales in the entire north Pacific
is 9,110 (Calambokidis et al. 2008a) and 25,000 individuals worldwide (Braham 1991). The best
current estimate of abundance for the Eastern North Pacific stock of sei whales that occur off
California, Oregon, and Washington waters out to 300 nm is 126 animals (CV = 0.53) Carretta et
al. (2014). Based on ship surveys conducted in the summer and fall from 1991 to 2008, it is
estimated that 52 sei whales (CV = 0.62) occur in waters off Washington and Oregon (Barlow
2010b). No data on the current population trend are available; however, the population in the
North Pacific is expected to have increased since sei whales began receiving protection in 1976
(Carretta et al. 2013a).
4.2.4.4 Natural Threats
Andrews (1916) suggested that killer whales attacked sei whales less frequently than fin and blue
whales in the same areas. Sei whales engage in a flight responses to evade killer whales, which
involves high energetic output, but show little resistance if overtaken (Ford and Reeves 2008).
Endoparasitic helminths (worms) are commonly found in sei whales and can result in pathogenic
effects when infestations occur in the liver and kidneys (Rice 1977).
4.2.4.5 Anthropogenic Threats
Human activities known to threaten sei whales include whaling, commercial fishing, and
maritime vessel traffic. Historically, whaling represented the greatest threat to every population
of sei whales and was ultimately responsible for listing sei whales as an endangered species. Sei
whales are thought to not be widely hunted, although harvest for scientific whaling or illegal
harvesting may occur in some areas.
Sei whales, because of their offshore distribution and relative scarcity in U.S. Atlantic and
Pacific waters, probably have a lower incidence of entrapment and entanglement than fin whales.
Data on entanglement and entrapment in non-U.S. waters are not reported systematically.
Heyning and Lewis (1990) made a crude estimate of about 73 rorquals killed/year in the southern
California offshore drift gillnet fishery during the 1980s. Some of these may have been fin
whales instead of sei whales. Some balaenopterids, particularly fin whales, may also be taken in
the drift gillnet fisheries for sharks and swordfish along the Pacific coast of Baja California,
Mexico (Barlow et al. 1997). Heyning and Lewis (1990) suggested that most whales killed by
offshore fishing gear do not drift far enough to strand on beaches or to be detected floating in the
160
Biological Opinion and Conference Report on Navy NWTT Activities and NMFS’ MMPA Incidental Take
Authorization PCTS FPR-2015-9110
nearshore corridor where most whale-watching and other types of boat traffic occur. Thus, the
small amount of documentation may not mean that entanglement in fishing gear is an
insignificant cause of mortality. Observer coverage in the Pacific offshore fisheries has been too
low for any confident assessment of species-specific entanglement rates (Barlow et al. 1997).
The offshore drift gillnet fishery is the only fishery that is likely to “take” sei whales from this
stock, but no fishery mortalities or serious injuries to sei whales have been observed. Sei whales,
like other large whales, may break through or carry away fishing gear. Whales carrying gear may
die later, become debilitated or seriously injured, or have normal functions impaired, but with no
evidence recorded.
Sei whales are occasionally killed in collisions with vessels. Of three sei whales that stranded
along the U.S. Atlantic coast between 1975 and 1996, two showed evidence of collisions (Laist
et al. 2001). Between 1999 and 2005, there were three reports of sei whales being struck by
vessels along the U.S. Atlantic coast and Canada’s Maritime Provinces (Cole et al. 2005; Nelson
et al. 2007). Two of these ship strikes were reported as having resulted in death. One sei whale
was killed in a collision with a vessel off the coast of Washington in 2003 (Waring et al. 2009).
New rules for seasonal (June through December) slowing of vessel traffic in the Bay of Fundy to
10 knots and changing shipping lanes by less than one nautical mile to avoid the greatest
concentrations of right whales are predicted to reduce sei whale ship strike mortality by 17
percent.
Sei whales are known to accumulate DDT, DDE, and PCBs (Borrell 1993; Borrell and Aguilar
1987; Henry and Best 1983). Males carry larger burdens than females, as gestation and lactation
transfer these toxins from mother to offspring.
4.2.4.6 Status and Trends
The sei whale was originally listed as endangered in 1970 (35 FR 18319), and this status
remained since the inception of the ESA in 1973.
Ohsumi and Fukuda (1975) estimated that sei whales in the North Pacific numbered about
49,000 whales in 1963, had been reduced to 37,000 to 38,000 whales by 1967, and reduced again
to 20,600 to 23,700 whales by 1973. From 1910 to 1975, approximately 74,215 sei whales were
caught in the entire North Pacific Ocean (Harwood and Hembree. 1987; Perry et al. 1999a).
From the early 1900s, Japanese whaling operations consisted of a large proportion of sei whales:
300 to 600 sei whales were killed per year from 1911 to 1955. The sei whale catch peaked in
1959, when 1,340 sei whales were killed. In 1971, after a decade of high sei whale catch
numbers, sei whales were scarce in Japanese waters. Japanese and Soviet catches of sei whales in
the North Pacific and Bering Sea increased from 260 whales in 1962 to over 4,500 in 1968 to
1969, after which the sei whale population declined rapidly (Mizroch et al. 1984). When
commercial whaling for sei whales ended in 1974, the population in the North Pacific had been
161
Biological Opinion and Conference Report on Navy NWTT Activities and NMFS’ MMPA Incidental Take
Authorization PCTS FPR-2015-9110
reduced to 7,260 to 12,620 animals (Tillman 1977b). There have been no direct estimates of sei
whale populations for the eastern Pacific Ocean (or the entire Pacific). Between 1991 and 2001,
during aerial surveys, there were two confirmed sightings of sei whales along the U.S. Pacific
coast.
Sei whales are known to occur in the Gulf of Alaska and as far north as the Bering Sea in the
north Pacific. However, their distribution is poorly understood. The only stock estimate for U.S.
waters is for the eastern north Pacific stock offshore California, Oregon and Washington
(Carretta et al. 2009); abundance in Alaskan waters is unknown and they have not been sighted
during recent surveys (Rone et al. 2010a; Waite et al. 2003).
4.2.4.7 Diving
Generally, sei whales make 5 to 20 shallow dives of 20 to 30 sec duration followed by a deep
dive of up to 15 min (Gambell 1985b). The depths of sei whale dives have not been studied;
however the composition of their diet suggests that they do not perform dives in excess of 300
meters. Sei whales are usually found in small groups of up to 6 individuals, but they commonly
form larger groupings when they are on feeding grounds (Gambell 1985b).
4.2.4.8 Social Behavior
Sei whales are primarily planktivorous, feeding mainly on euphausiids and copepods, although
they are also known to consume fish (Waring et al. 2007). In the Northern Hemisphere, sei
whales consume small schooling fish such as anchovies, sardines, and mackerel when locally
abundant (Mizroch et al. 1984; Rice 1977). Sei whales in the North Pacific feed on euphausiids
and copepods, which make up about 95 percent of their diets (Calkins 1986). The dominant food
for sei whales off California during June-August is northern anchovy, while in September-
October whales feed primarily on krill (Rice 1977). The balance of their diet consists of squid
and schooling fish, including smelt, sand lance, Arctic cod, rockfish, pollack, capelin, and Atka
mackerel (Nemoto and Kawamura 1977). In the Southern Ocean, analysis of stomach contents
indicates sei whales consume Calanus spp. and small-sized euphasiids with prey composition
showing latitudinal trends (Kawamura 1974). Evidence indicates that sei whales in the Southern
Hemisphere reduce direct interspecific competition with blue and fin whales by consuming a
wider variety of prey and by arriving later to feeding grounds (Kirkwood 1992). Rice (1977)
suggested that the diverse diet of sei whales may allow them greater opportunity to take
advantage of variable prey resources, but may also increase their potential for competition with
commercial fisheries.
Little is known about the actual social system of these animals. Groups of 2 to 5 individuals are
typically observed, but sometimes thousands may gather if food is abundant. However, these
large aggregations may not be dependent on food supply alone, as they often occur during times
162
Biological Opinion and Conference Report on Navy NWTT Activities and NMFS’ MMPA Incidental Take
Authorization PCTS FPR-2015-9110
of migration. Norwegian workers call the times of great sei whale abundance "invasion years."
During mating season, males and females may form a social unit, but strong data on this issue
are lacking.
4.2.4.9 Vocalization and Hearing
Data on sei whale vocal behavior is limited, but includes records off the Antarctic Peninsula of
broadband sounds in the 100 Hz to 600 Hz range with 1.5 s duration and tonal and upsweep calls
in the 200 Hz to 600 Hz range of 1 to 3 s durations (McDonald et al. 2005). Differences may
exist in vocalizations between ocean basins (Rankin et al. 2009). Vocalizations from the North
Atlantic consisted of paired sequences (0.5 to 0.8 sec, separated by 0.4 to 1.0 sec) of 10 to 20
short (4 msec) FM sweeps between 1.5 to 3.5 kHz (Richardson et al. 1995d).
Recordings made in the presence of sei whales have shown that they produce sounds ranging
from short, mid-frequency pulse sequences (Knowlton et al. 1991; Thompson et al. 1979) to low
frequency broadband calls characteristic of mysticetes (Baumgartner et al. 2008; McDonald et al.
2005; Rankin and Barlow 2007). Off the coast of Nova Scotia, Canada, Knowlton et al. (1991)
recorded two-phased calls lasting about 0.5 to 0.8 s and ranging in frequency from 1.5 kHz to 3.5
kHz in the presence of sei whales—data similar to that reported by Thompson et al. (1979).
These mid-frequency calls are distinctly different from low-frequency tonal and frequency swept
calls recorded in later studies. For example, calls recorded in the Antarctic averaged 0.45 ± 0.3 s
in duration at 433 ± 192 Hz, with a maximum source level of 156 ± 3.6 dB re 1 μPa-m
(McDonald et al. 2005). During winter months off Hawaii, (Rankin and Barlow 2007)recorded
down swept calls by sei whales that exhibited two distinct low frequency ranges of 100 Hz to 44
Hz and 39 Hz to 21 Hz, with the former range usually shorter in duration. Similar sei whale calls
were also found near the Gulf of Maine in the northwest Atlantic, ranging from 82.3 Hz to 34.0
Hz and averaging 1.38 s in duration (Baumgartner et al. 2008). These calls were primarily single
occurrences, but some double or triple calls were noted as well. It is thought that the difference
in call frequency may be functional, with the mid-frequency type serving a reproductive purpose
and the low frequency calls aiding in feeding/social communication (McDonald et al. 2005). Sei
whales have also been shown to reduce their calling rates near the Gulf of Maine at night,
presumably when feeding, and increase them during the day, likely for social activity
(Baumgartner and Fratantoni 2008). Off the Mariana Islands, 32 sei whale calls were recorded,
25 of which were backed up by sightings (Norris et al. 2012). The peak mean frequency of these
calls ranged from 890.6 Hz to 1,046.9 Hz with a mean duration of 3.5 to 0.2 seconds. Norris et
al. (2012) reported that simultaneous acoustic detections of called were made from the towed
array during three visual sightings. The encounters occurred primarily in the central and southern
region of the study area, ranging from the island of Tinian to the southeast corner of the study
area. A higher concentration was found in the southeast corner and along the Mariana Trench
(Norris et al. 2012).
163
Biological Opinion and Conference Report on Navy NWTT Activities and NMFS’ MMPA Incidental Take
Authorization PCTS FPR-2015-9110
While no data on hearing ability for this species are available, Ketten (1997a) hypothesized that
mysticetes have acute infrasonic hearing. Results of studies on blue whales (Goldbogen et al.
2013) (Southall et al. 2011a), which have similar auditory physiology compared to sei whales,
indicate that some individuals hear some sounds in the mid-frequency range and exhibit
behavioral responses to sounds in this range depending on received level and context. In terms of
functional hearing capability, sei whales belong to low-frequency cetaceans which have a
hearing range of 7 Hz to 22 kHz (Southall et al. 2007b). There are no tests or modeling estimates
of specific sei whale hearing ranges.
4.2.4.10 Critical Habitat
The NMFS has not designated critical habitat for sei whales.
4.2.5 Sperm Whale
Sperm whales (Physeter macrocephalus) are the largest of the odontocetes (toothed whales) and
the most sexually dimorphic cetaceans, with males considerably larger than females. Adult
females may grow to lengths of 36 feet (11 m) and weigh 15 tons (13,607 kg). Adult males,
however, reach about 52 feet (16 m) and may weigh as much as 45 tons (40,823 kg).
The sperm whale is distinguished by its extremely large head, which takes up to 25 to 35 percent
of its total body length. It is the only living cetacean that has a single blowhole asymmetrically
situated on the left side of the head near the tip. Sperm whales have the largest brain of any
animal (on average 17 pounds (7.8 kg) in mature males), however, compared to their large body
size, the brain is not exceptional in size.
There are between 20 to 26 large conical teeth in each side of the lower jaw. The teeth in the
upper jaw rarely erupt and are often considered to be vestigial. It appears that teeth may not be
necessary for feeding, since they do not break through the gums until puberty, if at all, and
healthy sperm whales have been caught that have no teeth.
Sperm whales are mostly dark gray, but oftentimes the interior of the mouth is bright white, and
some whales have white patches on the belly. Their flippers are paddle-shaped and small
compared to the size of the body, and their flukes are very triangular in shape. They have small
dorsal fins that are low, thick, and usually rounded.
4.2.5.1 Distribution
Sperm whales are distributed in all of the world’s oceans, from equatorial to polar waters, and
are highly migratory. Mature males range between 70º N in the North Atlantic and 70º S in the
Southern Ocean (Perry et al. 1999a; Reeves and Whitehead 1997), whereas mature females and
immature individuals of both sexes are seldom found higher than 50º N or S (Reeves and
164
Biological Opinion and Conference Report on Navy NWTT Activities and NMFS’ MMPA Incidental Take
Authorization PCTS FPR-2015-9110
Whitehead 1997). In winter, sperm whales migrate closer to equatorial waters (Kasuya and
Miyashita 1988; Waring 1993) where adult males join them to breed.
4.2.5.1.1 Occurrence in the Offshore Portion of the NWTT Action Area
Sperm whales were seen in every season except winter (December through February) during
systematic surveys off Washington and Oregon from 1989 to 1990 (Green et al. 1992a). More
recently, sperm whales were detected acoustically year-round at offshore sites monitored from
2004 to 2008 off the Washington coast, with a peak occurrence from April to August, and at an
inshore recording station over the continental shelf they were detected from April to November
(Oleson et al. 2009). Acoustic detections of sperm whale were also reported at the inshore
monitoring site every month from June through January in 2009; there was an absence of
detections between February and May 2009 (Oleson and Hildebrand 2012).
Two noteworthy sperm whale stranding events occurred in this region of the Action Area.
During November 1970, there was an incident that was well-publicized by the media of attempts
to dispose of a decomposed sperm whale carcass on an Oregon beach by using explosives. A
mass stranding of 47 sperm whales occurred in Oregon during June 1979 (Norman et al. 2004a;
Rice 1986).
4.2.5.1.2 Occurrence in the Inland Waters of the NWTT Action Area
Given their documented preference for deep offshore waters, sperm whales are unlikely to occur
within the Inland Waters region of the Action Area.
4.2.5.1.3 Occurrence in the Western Behm Canal, Alaska - NWTT Action Area
Given their documented preference for deep offshore waters, sperm whales are unlikely to occur
within the SEAFAC region of the Action Area since it is characterized by coastal waters
removed from the continental shelf break.
4.2.5.2 Population Structure
There is no clear understanding of the global population structure of sperm whales (Dufault et al.
1999). Recent ocean-wide genetic studies indicate low, but statistically significant, genetic
diversity and no clear geographic structure, but strong differentiation between social groups
(Lyrholm and Gyllensten 1998; Lyrholm et al. 1996; Lyrholm et al. 1999). The IWC currently
recognizes four sperm whale stocks: North Atlantic, North Pacific, northern Indian Ocean, and
Southern Hemisphere (Dufault et al. 1999; Reeves and Whitehead 1997). The NMFS recognizes
six stocks under the MMPA- three in the Atlantic/Gulf of Mexico and three in the Pacific
(Alaska, California-Oregon-Washington, and Hawaii; (Perry et al. 1999c; Waring et al. 2004).
Genetic studies indicate that movements of both sexes through expanses of ocean basins are
165

Biological Opinion and Conference Report on Navy NWTT Activities and NMFS’ MMPA Incidental Take
Authorization PCTS FPR-2015-9110
common, and that males, but not females, often breed in different ocean basins than the ones in
which they were born (Whitehead 2003a). Sperm whale populations appear to be structured
socially, at the level of the clan, rather than geographically (Whitehead 2003a; Whitehead 2008).
Sperm whales are found throughout the North Pacific and are distributed broadly in tropical and
temperate waters to the Bering Sea as far north as Cape Navarin in summer, and occur south of
40o N in winter (Gosho et al. 1984; Miyashita et al. 1995 as cited in Carretta et al. 2005; Rice
1974). Sperm whales are found year-round in Californian and Hawaiian waters (Barlow 1995;
Dohl 1983; Forney et al. 1995; Shallenberger 1981). They are seen in every season except winter
(December through February) in Washington and Oregon (Green et al. 1992b).
Sperm whales are seasonal migrants to waters off the coast of Washington and Oregon where
their densities are highest during spring and summer; they do not appear to occur in these waters
during the winter. Sperm whales also tend to occur in the deeper water at the western edge of the
Action Area. In surveys of waters off Oregon and Washington conducted by Green et al.
(1992b), no sperm whales were encountered in waters less than 200 meters deep, 12 percent of
the sperm whales were encountered in waters 200 to 2,000 meters deep (the continental slope),
and the remaining 88 percent of the sperm whales were encountered in waters greater than 2,000
meters deep. In surveys conducted by Forney and her co-workers (Forney 2007), sperm whales
were reported from the Olympic Coast Slope transects (west of the Olympic Coast National
Marine Sanctuary), but not from surveys conducted over the National Marine Sanctuary or the
area immediately west of Cape Flattery.
In the Gulf of Alaska, sperm whales have been sighted along the Aleutian Trench as well as over
deeper waters and have been detected acoustically throughout the year (Forney and Brownell Jr.
1996; Mellinger et al. 2004a). Occurrence is higher from July through September than January
through March (Mellinger et al. 2004a; Moore et al. 2006). The vast majority of individuals in
the region are likely male based upon whaling records and genetic studies; the area is a summer
foraging area for these individuals (Allen and Angliss 2010b; Reeves et al. 1985; Straley and
O'Connell 2005; Straley et al. 2005). Mean group size has been reported to be 1.2 individuals
(Wade et al. 2003; Waite 2003). However, female groups may rarely occur at least up to the
central Aleutian Islands (Fearnbach et al. 2012).
4.2.5.3 Abundance Estimate
It is estimated that there are between 200,000 and 1,500,000 sperm whales worldwide (NMFS
2009c). Currently there is no reliable abundance estimate for the Alaska/North Pacific stock of
sperm whales (Allen and Angliss 2013). The number of sperm whales within the eastern
temperate North Pacific (between 20° N and 45° N) was estimated at 26,300 (CV = 0.81) from
visual surveys and 32,100 (CV = 0.36) from acoustic detections (Barlow and Taylor 2005). The
current best available estimate of abundance for the California, Oregon, and Washington stock is
166
Biological Opinion and Conference Report on Navy NWTT Activities and NMFS’ MMPA Incidental Take
Authorization PCTS FPR-2015-9110
971 (CV = 0.31) (Carretta et al. 2014). Based on ship surveys conducted in the summer and fall
from 1991 to 2008, it is estimated that 329 sperm whales (CV = 0.45) occur in waters off
Washington and Oregon (Barlow 2010a). The Barlow (2010b) sperm whale density estimate for
waters off Washington and Oregon (1.0 animals per 386 square miles [mi.2] [1,000 square
kilometers (Acevedo-Gutierrez et al.)]) is similar to the worldwide global average for this species
(1.4 animals per 386 mi.2 [1,000 km2]; (Whitehead 2003b).
4.2.5.4 Natural Threats
Sperm whales are known to be occasionally predated upon by killer whales (Jefferson et al.
1991; Pitman et al. 2001) by pilot whales (Arnbom et al. 1987; Palacios and Mate 1996; Rice
1989; Weller et al. 1996; Whitehead et al. 1997) and large sharks (Best et al. 1984) and harassed
by pilot whales (Arnbom et al. 1987; Palacios and Mate 1996; Rice 1989; Weller et al. 1996;
Whitehead et al. 1997). Strandings are also relatively common events, with one to dozens of
individuals generally beaching themselves and dying during any single event. Although several
hypotheses, such as navigation errors, illness, and anthropogenic stressors, have been proposed
(Goold et al. 2002; Wright 2005), direct widespread causes remain unclear. Calcivirus and
papillomavirus are known pathogens of this species (Lambertsen et al. 1987; Smith and Latham
1978).
4.2.5.5 Anthropogenic Threats
Sperm whales historically faced severe depletion from commercial whaling operations. From
1800 to 1900, the IWC estimated that nearly 250,000 sperm whales were killed by whalers, with
another 700,000 from 1910 to 1982 (IWC Statistics 1959 to 1983). However, other estimates
have included 436,000 individuals killed between 1800 and 1987 (Carretta et al. 2005).
However, all of these estimates are likely underestimates due to illegal killings and inaccurate
reporting by Soviet whaling fleets between 1947 and 1973. In the Southern Hemisphere, these
whalers killed an estimated 100,000 whales that they did not report to the IWC (Yablokov et al.
1998), with smaller harvests in the Northern Hemisphere, primarily the North Pacific, that
extirpated sperm whales from large areas (Yablokov 2000). Additionally, Soviet whalers
disproportionately killed adult females in any reproductive condition (pregnant or lactating) as
well as immature sperm whales of either gender.
Following a moratorium on whaling by the IWC, significant whaling pressures on sperm whales
were eliminated. However, sperm whales are known to have become entangled in commercial
fishing gear and 17 individuals are known to have been struck by vessels (Jensen and Silber
2004a). Whale-watching vessels are known to influence sperm whale behavior (Richter et al.
2006).
167
Biological Opinion and Conference Report on Navy NWTT Activities and NMFS’ MMPA Incidental Take
Authorization PCTS FPR-2015-9110
In U.S. waters in the Pacific, sperm whales have been incidentally taken only in drift gillnet
operations, which killed or seriously injured an average of nine sperm whales per year from 1991
to 1995 (Barlow et al. 1997).
Interactions between sperm whales and longline fisheries in the Gulf of Alaska have been
reported since 1995 and are increasing in frequency (Hill and DeMaster 1998; Hill et al. 1999;
Rice 1989). Between 2002 and 2006, there were three observed serious injuries (considered
mortalities) to sperm whales in the Gulf of Alaska from the sablefish longline fishery (Angliss
and Outlaw 2008). Sperm whales have also been observed in Gulf of Alaska feeding off longline
gear (for sablefish and halibut) at 38 of the surveyed stations (Angliss and Outlaw 2008). Recent
findings suggest sperm whales in Alaska may have learned that fishing vessel propeller
cavitation (as gear is retrieved) are an indicator that longline gear with fish is present as a
predation opportunity (Thode et al. 2007).
Contaminants have been identified in sperm whales, but vary widely in concentration based upon
life history and geographic location, with northern hemisphere individuals generally carrying
higher burdens (Evans et al. 2004). Contaminants include dieldrin, chlordane, DDT, DDE, PCBs,
HCB and HCHs in a variety of body tissues (Aguilar 1983; Evans et al. 2004), as well as several
heavy metals (Law et al. 1996). However, unlike other marine mammals, females appear to
bioaccumulate toxins at greater levels than males, which may be related to possible dietary
differences between females who remain at relatively low latitudes compared to more migratory
males (Aguilar 1983; Wise et al. 2009). Chromium levels from sperm whales skin samples
worldwide have varied from undetectable to 122.6 μg Cr/g tissue, with the mean (8.8 μg Cr/g
tissue) resembling levels found in human lung tissue with chromium-induced cancer (Wise et al.
2009). Older or larger individuals did not appear to accumulate chromium at higher levels.
4.2.5.6 Status and Trends
Sperm whales were originally listed as endangered in 1970 (35 FR 18319), and this status
remained with the inception of the ESA in 1973. Although population structure of sperm whales
is unknown, several studies and estimates of abundance are available. Sperm whale populations
probably are undergoing the dynamics of small population sizes, which is a threat in and of itself.
In particular, the loss of sperm whales to directed Soviet whaling likely inhibits recovery due to
the loss of adult females and their calves, leaving sizeable gaps in demographic and age
structuring (Whitehead and Mesnick 2003).
There are approximately 76,803 sperm whales in the eastern tropical Pacific, eastern North
Pacific, Hawaii, and western North Pacific (Whitehead 2002a). Minimum estimates in the
eastern North Pacific are 1,719 individuals and 5,531 in the Hawaiian Islands (Carretta et al.
2007). The tropical Pacific is home to approximately 26,053 sperm whales and the western North
Pacific has approximately 29,674 (Whitehead 2002a). There was a dramatic decline in the
168
Biological Opinion and Conference Report on Navy NWTT Activities and NMFS’ MMPA Incidental Take
Authorization PCTS FPR-2015-9110
number of females around the Galapagos Islands during 1985 to 1999 versus 1978 to 1992
levels, likely due to migration to nearshore waters of South and Central America (Whitehead and
Mesnick 2003).
Hill and DeMaster (1999) concluded that about 258,000 sperm whales were harvested in the
North Pacific between 1947 and 1987. Although the IWC protected sperm whales from
commercial harvest in 1981, Japanese whalers continued to hunt sperm whales in the North
Pacific until 1988 (Reeves and Whitehead 1997). In 2000, the Japanese Whaling Association
announced plans to kill 10 sperm whales in the Pacific Ocean for research. Although
consequences of these deaths are unclear, the paucity of population data, uncertainty regarding
recovery from whaling, and re-establishment of active programs for whale harvesting pose risks
for the recovery and survival of this species. Sperm whales are also hunted for subsistence
purposes by whalers from Lamalera, Indonesia, where a traditional whaling industry has been
reported to kill up to 56 sperm whales per year.
4.2.5.7 Diving
Sperm whales are probably the deepest and longest diving mammalian species, with dives to
3 km down and durations in excess of 2 hours (Clarke 1976; Watkins 1985; Watkins et al. 1993).
However, dives are generally shorter (25 to 45 min) and shallower (400 to 1,000 m). Dives are
separated by 8 to 11 min rests at the surface (Gordon 1987; Watwood et al. 2006) (Jochens et al.
2006; Papastavrou et al. 1989). Sperm whales typically travel ~3 km horizontally and 0.5 km
vertically during a foraging dive (Whitehead 2003a). Differences in night and day diving patterns
are not known for this species, but, like most diving air-breathers for which there are data
(rorquals, fur seals, and chinstrap penguins), sperm whales probably make relatively shallow
dives at night when prey are closer to the surface.
Unlike other cetaceans, there is a preponderance of dive information for this species, most likely
because it is the deepest diver of all cetacean species so generates a lot of interest. Sperm whales
feed on large and medium-sized squid, octopus, rays and sharks, on or near the ocean floor
(Clarke 1986; Whitehead 2002b). Some evidence suggests that they do not always dive to the
bottom of the sea floor (likely if food is elsewhere in the water column), but that they do
generally feed at the bottom of the dive. Davis et al. (2007) report that dive-depths (100 to 500
m) of sperm whales in the Gulf of California overlapped with depth distributions (200 to 400 m)
of jumbo squid, based on data from satellite-linked dive recorders placed on both species,
particularly during daytime hours. Their research also showed that sperm whales foraged
throughout a 24-hour period, and that they rarely dove to the sea floor bottom (>1000 m). The
most consistent sperm whale dive type is U-shaped, during which the whale makes a rapid
descent to the bottom of the dive, forages at various velocities while at depth (likely while
chasing prey) and then ascends rapidly to the surface. There is some evidence that male sperm
169
Biological Opinion and Conference Report on Navy NWTT Activities and NMFS’ MMPA Incidental Take
Authorization PCTS FPR-2015-9110
whales, feeding at higher latitudes during summer months, may forage at several depths
including <200 m, and utilize different strategies depending on position in the water column
(Teloni et al. 2007).
4.2.5.8 Social Behavior
Movement patterns of Pacific female and immature male groups appear to follow prey
distribution and, although not random, movements are difficult to anticipate and are likely
associated with feeding success, perception of the environment, and memory of optimal foraging
areas (Whitehead 2008). However, no sperm whale in the Pacific has been known to travel to
points over 5,000 km apart and only rarely have been known to move over 4,000 km within a
time frame of several years. This means that although sperm whales do not appear to cross from
eastern to western sides of the Pacific (or vice-versa), significant mixing occurs that can maintain
genetic exchange. Movements of several hundred miles are common, (i.e. between the
Galapagos Islands and the Pacific coastal Americas). Movements appear to be group or clan
specific, with some groups traveling straighter courses than others over the course of several
days. However, general transit speed averages about 4 km/h. Sperm whales in the Caribbean
region appear to be much more restricted in their movements, with individuals repeatedly sighted
within less than 160 km of previous sightings.
Gaskin (1973) proposed a northward population shift of sperm whales off New Zealand in the
austral autumn based on reduction of available food species and probable temperature tolerances
of calves.
Sperm whales have a strong preference for waters deeper than 1,000 m (Reeves and Whitehead
1997; Watkins and Schevill 1977), although Berzin (1971) reported that they are restricted to
waters deeper than 300 m. While deep water is their typical habitat, sperm whales are rarely
found in waters less than 300 m in depth (Clarke 1956a; Rice 1989). Sperm whales have been
observed near Long Island, New York, in water between 40 and 55 m deep (Scott and Sadove
1997). When they are found relatively close to shore, sperm whales are usually associated with
sharp increases in topography where upwelling occurs and biological production is high,
implying the presence of a good food supply (Clarke 1956a). Such areas include oceanic islands
and along the outer continental shelf.
Sperm whales are frequently found in locations of high productivity due to upwelling or steep
underwater topography, such as continental slopes, seamounts, or canyon features (Jaquet 1996;
Jaquet and Whitehead 1996). Cold-core eddy features are also attractive to sperm whales in the
Gulf of Mexico, likely because of the large numbers of squid that are drawn to the high
concentrations of plankton associated with these features (Biggs et al. 2000; Davis et al. 2000;
Davis et al. 2002). Surface waters with sharp horizontal thermal gradients, such as along the Gulf
Stream in the Atlantic, may also be temporary feeding areas for sperm whales (Griffin 1999;
170
Biological Opinion and Conference Report on Navy NWTT Activities and NMFS’ MMPA Incidental Take
Authorization PCTS FPR-2015-9110
Jaquet and Whitehead 1996; Waring et al. 1993). Sperm whales over George’s Bank were
associated with surface temperatures of 23.2 to 24.9°C (Waring et al. 2004).
Local information is inconsistent regarding sperm whale tendencies. Gregr and Trites (2001)
reported that female sperm whales off British Columbia were relatively unaffected by the
surrounding oceanography. However, Tynan et al. (2005b) reported increased sperm whales
densities with strong turbulence associated topographic features along the continental slope near
Heceta Bank. Two noteworthy strandings in the region include an infamous incident (well
publicized by the media) of attempts to dispose of a decomposed sperm whale carcass on an
Oregon beach by using explosives. In addition, a mass stranding of 47 individuals in Oregon
occurred during June 1979 (Norman et al. 2004a; Rice et al. 1986).
Stable, long-term associations among females form the core of sperm whale societies (Christal et
al. 1998). Up to about a dozen females usually live in such groups, accompanied by their female
and young male offspring. Young individuals are subject to alloparental care by members of
either sex and may be suckled by non-maternal individuals (Gero et al. 2009). Group sizes may
be smaller overall in the Caribbean Sea (6 to 12 individuals) versus the Pacific (25 to 30
individuals) (Jaquet and Gendron 2009). Males start leaving these family groups at about 6 years
of age, after which they live in “bachelor schools,” but this may occur more than a decade later
(Pinela et al. 2009). The cohesion among males within a bachelor school declines with age.
During their breeding prime and old age, male sperm whales are essentially solitary (Christal and
Whitehead 1997).
4.2.5.9 Vocalization and Hearing
Sound production and reception by sperm whales are better understood than in most cetaceans.
Sperm whales produce broad-band clicks in the frequency range of 100 Hz to 20 kHz that can be
extremely loud for a biological source (200 to 236 dB re 1μPa), although lower source level
energy has been suggested at around 171 dB re 1 Pa (Goold and Jones 1995; Møhl et al. 2003;
Weilgart and Whitehead 1993a; Weilgart and Whitehead 1997b). Most of the energy in sperm
whale clicks is concentrated at around 2 kHz to 4 kHz and 10 kHz to 16 kHz (Goold and Jones
1995; NMFS 2006d; Weilgart and Whitehead 1993a). The highly asymmetric head anatomy of
sperm whales is likely an adaptation to produce the unique clicks recorded from these animals
(Cranford 1992; Norris and Harvey 1972; Norris and Harvey. 1972). Long, repeated clicks are
associated with feeding and echolocation (Goold and Jones 1995; Weilgart and Whitehead
1993a; Weilgart and Whitehead 1997b). However, clicks are also used in short patterns (codas)
during social behavior and intragroup interactions (Weilgart and Whitehead 1993a). They may
also aid in intra-specific communication. Another class of sound, “squeals”, are produced with
frequencies of 100 Hz to 20 kHz (e.g., Weir et al. 2007).
171
Biological Opinion and Conference Report on Navy NWTT Activities and NMFS’ MMPA Incidental Take Authorization PCTS FPR-2015-9110
Our understanding of sperm whale hearing stems largely from the sounds they produce. The only
direct measurement of hearing was from a young stranded individual from which auditory
evoked potentials were recorded (Carder and Ridgway 1990). From this whale, responses
support a hearing range of 2.5 kHz to 60 kHz. However, behavioral responses of adult, free-
ranging individuals also provide insight into hearing range; sperm whales have been observed to
frequently stop echolocating in the presence of underwater pulses made by echosounders and
submarine sonar (Watkins et al. 1985a; Watkins and Schevill 1975b). They also stop vocalizing
for brief periods when codas are being produced by other individuals, perhaps because they can
hear better when not vocalizing themselves (Goold and Jones 1995). Because they spend large
amounts of time at depth and use low-frequency sound, sperm whales are likely to be susceptible
to low frequency sound in the ocean (Croll et al. 1999c).
Recordings of sperm whale vocalizations reveal that they produce a variety of sounds, such as
clicks, gunshots, chirrups, creaks, short trumpets, pips, squeals and clangs (Goold 1999b). Sperm
whales typically produce short-duration repetitive broadband clicks with frequencies below 100
Hz to >30 kHz (Watkins 1977) and dominant frequencies between 1 kHz to 6 kHz and 10 kHz to
16 kHz. The source levels can reach 236 dB re 1 μPa-m (Mohl et al. 2003). The clicks of neonate
sperm whales are very different from typical clicks of adults in that they are of low
directionality, long duration, and low-frequency (between 300 Hz and 1.7 kHz) with estimated
source levels between 140 to 162 dB re 1 μPa-m (Madsen et al. 2003). Clicks are heard most
frequently when sperm whales are engaged in diving and foraging behavior (Miller et al. 2004;
Whitehead and Weilgart 1991). Creaks (rapid sets of clicks) are heard most frequently when
sperm whales are foraging and engaged in the deepest portion of their dives, with inter-click
intervals and source levels being altered during these behaviors (Laplanche et al. 2005; Miller et
al. 2004).
When sperm whales are socializing, they tend to repeat series of group-distinctive clicks (codas),
which follow a precise rhythm and may last for hours (Watkins and Schevill 1977). Codas are
shared between individuals in a social unit and are considered to be primarily for intragroup
communication (Rendell and Whitehead 2004; Weilgart and Whitehead 1997a). Recent research
in the South Pacific suggests that in breeding areas the majority of codas are produced by mature
females (Marcoux et al. 2006). Coda repertoires have also been found to vary geographically and
are categorized as dialects, similar to those of killer whales (Pavan et al. 2000; Weilgart and
Whitehead 1997a). For example, significant differences in coda repertoire have been observed
between sperm whales in the Caribbean and those in the Pacific (Weilgart and Whitehead
1997a). Three coda types used by male sperm whales have recently been described from data
collected over multiple years: these include codas associated with dive cycles, socializing, and
alarm (Frantzis and Alexiadou 2008).
172
Biological Opinion and Conference Report on Navy NWTT Activities and NMFS’ MMPA Incidental Take
Authorization PCTS FPR-2015-9110
Direct measures of sperm whale hearing have been conducted on a stranded neonate using the
auditory brainstem response technique: the whale showed responses to pulses ranging from
2.5 kHz to 60 kHz and highest sensitivity to frequencies between 5 kHz to 20 kHz (Ridgway and
Carder 2001). Other hearing information consists of indirect data. For example, the anatomy of
the sperm whale’s inner and middle ear indicates an ability to best hear high-frequency to
ultrasonic hearing (Ketten 1992). The sperm whale may also possess better low-frequency
hearing than other odontocetes, although not as low as many baleen whales (Ketten 1992).
Reactions to anthropogenic sounds can provide indirect evidence of hearing capability, and
several studies have made note of changes seen in sperm whale behavior in conjunction with
these sounds. For example, sperm whales have been observed to frequently stop echolocating in
the presence of underwater pulses made by echo-sounders and submarine sonar (Watkins et al.
1985b; Watkins and Schevill 1975a). In the Caribbean, Watkins et al. (1985b) observed
that sperm whales exposed to 3.25 kHz to 8.4 kHz pulses (presumed to be from submarine sonar)
interrupted their activities and left the area. Similar reactions were observed from artificial noise
generated by banging on a boat hull (Watkins et al. 1985b). André et al. (1997) reported that
foraging whales exposed to a 10 kHz pulsed signal did not ultimately exhibit any general
avoidance reactions: when resting at the surface in a compact group, sperm whales initially
reacted strongly, and then ignored the signal completely (André et al. 1997). Thode et al. (2007)
observed that the acoustic signal from the cavitation of a fishing vessel’s propeller (110 dB re 1
µPa2
between 250 Hz and 1.0 kHz) interrupted sperm whale acoustic activity and resulted in the
animals converging on the vessel. The full range of functional hearing for the sperm whale is
estimated to occur between approximately 150 Hz and 160 kHz, placing them among the group
of cetaceans that can hear mid-frequency sounds (Southall et al. 2007c).
Sperm whales have been observed by marine mammal observers aboard Navy surface ships
during training events and detected on the PMRF range hydrophones; however, MFAS was not
active so no behavioral response data exists during naval training events. However, a sperm
whale was tagged for a controlled exposure experiment during BRS-10. The sperm whale did not
appear to demonstrate obvious behavioral changes in dive pattern or production of clicks (Miller
et al. 2012; Sivle et al. 2012; Southall et al. 2011b).
4.2.5.10 Critical Habitat
NMFS has not designated critical habitat for sperm whales.
4.2.6 Southern Resident Killer Whale
Killer whales (Orcinus orca) are the most widely distributed cetacean (e.g., whales, dolphins,
and porpoises) species in the world and likely represent the most widely distributed mammal
species in the world. Killer whales have a distinctive color pattern, with black dorsal and white
173
Biological Opinion and Conference Report on Navy NWTT Activities and NMFS’ MMPA Incidental Take
Authorization PCTS FPR-2015-9110
ventral portions. They also have a conspicuous white patch above and behind the eye and a
highly variable gray or white saddle behind the dorsal fin.
The species shows considerable size "dimorphism". Adult males develop larger pectoral flippers,
dorsal fins, tail flukes, and girths than females. Male adult killer whales can reach up to 32 feet
(9.8 m) in length and can weigh nearly 22,000 pounds (10,000 kg); females can reach 28 feet
(8.5 m) in length and can weigh up to 16,500 pounds (7,500 kg).
Most information on killer whale life history and biology is from long-term studies of several
populations in the eastern North Pacific. Sexual maturity of female killer whales is achieved
when the whales reach lengths of approximately 15 to 18 feet (4.6 to 5.4 m), depending on
geographic region. The gestation period for killer whales varies from 15 to 18 months, and birth
may take place in any month. Calves are nursed for at least 1 year, and may be weaned between
1 and 2 years of age. The birth rate for killer whales is not well understood, but, in some
populations, is estimated as every 5 years for an average period of 25 years.
Life expectancy for wild female killer whales is approximately 50 years, with maximum
longevity estimated at 80 to 90 years. Male killer whales typically live for about 30 years, with
maximum longevity estimated at 50 to 60 years.
4.2.6.1 Distribution
Three kinds of killer whales occur along the Pacific Coast of the United States: Eastern North
Pacific (ENP) southern resident killer whales, ENP offshore killer whales, and ENP transient
killer whales. Of these only the southern resident killer whales are listed as endangered or
threatened under the ESA. Southern resident killer whales primarily occur in the inland waters of
Washington State and southern Vancouver Island, although individuals from this population
have been observed off the Queen Charlotte Islands (north of their traditional range) and off
coastal California in Monterey Bay, near the Farallon Islands, and off Point Reyes (NMFS
2005b).
Southern Resident killer whales spend a significant portion of the year in the inland waterways
of the Strait of Georgia, Strait of Juan de Fuca, and Puget Sound, particularly during the spring,
summer, and fall, when all three pods regularly occur in the Georgia Strait, San Juan Islands, and
Strait of Juan de Fuca (Felleman et al. 1991; Heimlich-Boran 1988; Olson 1998; Osborne 1999).
The K and L pods typically arrive in May or June and remain in this core area until October or
November, although both pods make frequent trips lasting a few days to the outer coasts of
Washington and southern Vancouver Island (Ford et al. 2000). The J pod will occur
intermittently in the Georgia Basin and Puget Sound during late fall, winter and early spring.
During the warmer months, all of the pods concentrate their activities in Haro Strait, Boundary
Passage, the southern Gulf Islands, the eastern end of the Strait of Juan de Fuca, and several
174
Biological Opinion and Conference Report on Navy NWTT Activities and NMFS’ MMPA Incidental Take
Authorization PCTS FPR-2015-9110
localities in the southern Georgia Strait (Felleman et al. 1991; Ford et al. 2000; Heimlich-Boran
1988; Olson 1998).
The local movement of southern resident killer whales usually follows the distribution of salmon,
which are their preferred prey (Heimlich-Boran 1988; Heimlich-Boran 1986; Nichol and
Shackleton 1996). Areas that are major corridors for migrating salmon, and therefore, for
southern resident killer whales, include Haro Strait and Boundary Passage, the southern tip of
Vancouver Island, Swanson Channel off North Pender Island, and the mouth of the Fraser River
delta, which is visited by all three pods in September and October (Felleman et al. 1991; Ford et
al. 2000).
4.2.6.1.1 Occurrence in the Offshore Portion of the NWTT Action Area
Three stocks of killer whale may occur and the U.S. Pacific coast: the West Coast Transient
stock, the Offshore stock, and the Southern Resident stock (Carretta et al. 2012), although
Northern Resident killer whales may be found infrequently in waters off Washington (Allen and
Angliss 2012). Killer whales tend to show up along the Oregon coast during late April and May
and may target gray whale females and calves migrating north. Based on food type, these
probably are transients. As noted above, when observed offshore it is difficult to determine if a
particular whale is a transient, offshore, or a resident ecotype.
Southern Resident killer whales regularly visit coastal sites off Washington State and Vancouver
Island (Ford et al. 1994a) and in the winter are known to travel as far south as Monterey off
central California (Black 2011).
4.2.6.1.2 Occurrence in the Inland Waters of the NWTT Action Area
The Southern Resident stock is most likely to occur in the Inland Waters region of the Action
Area. The Southern Resident stock is a trans-boundary stock including killer whales in inland
Washington and southern British Columbia waters.
In spring and summer months, the Southern Resident stock is most frequently seen in the San
Juan Islands region with intermittent sightings in Puget Sound (Whale Museum 2012). In the fall
and early winter months, the Southern Residents are seen more frequently in Puget Sound, where
returning chum and Chinook salmon are concentrated (Osborne et al. 1988b). By winter, they
spend progressively less time in the inland marine waters and more time off the coast of
Washington, Oregon, and California (Black 2011).
While both Southern Resident killer whales and transient killer whales are frequently sighted in
the main basin of Puget Sound, their presence near Navy installations varies from not present at
all to infrequent sightings, depending on the season (Orca Network 2012; Whale Museum 2012).
175
Biological Opinion and Conference Report on Navy NWTT Activities and NMFS’ MMPA Incidental Take
Authorization PCTS FPR-2015-9110
Southern Resident killer whales have not been reported in Hood Canal or Dabob Bay since 1995
(NMFS 2008e). Southern resident killer whales (J pod) were historically documented in Hood
Canal by sound recordings in 1958 (Ford 1991), a photograph from 1973, and also anecdotal
accounts of historical use, but these latter sightings may be transient whales (NMFS 2008e).
Near NAVBASE Kitsap Bremerton and Keyport, the Southern Resident killer whale is rare, with
the last confirmed sighting in Dyes Inlet in 1997. There was a more recent confirmed Southern
Resident occurrence along the Washington State Ferries route between Bremerton and Seattle in
December 2007, but the exact location of the sighting is not known (Orca Network 2012). Both
Southern resident killer whales and transients have been observed in Saratoga Passage and
Possession Sound near NASWI and NAVSTA Everett respectively. Transients and Southern
Resident killer whales have also been observed in southern Puget Sound in the Carr Inlet area.
4.2.6.1.3 Occurrence in the Western Behm Canal, Alaska - NWTT Action Area
Individuals belonging to the Alaska Resident stock are the killer whales most likely to occur in
the SEAFAC region of the Action Area, and are more likely from spring through fall (Dahlheim
et al. 2009). Southern Resident killer whales (L pod, 30 individuals) were photographically
identified in Chatham Strait, Southeast Alaska (northwest of Behm Canal), in June 2007.
Southern Residents were previously thought to only range as far north as the Queen Charlotte
Islands, B. C.; however, this sighting extends their known range about 200 mi. to the north
(Barre 2012). However, Alaska Resident stock of killer whales are more likely to be encountered
in and around the Behm Canal than Southern Resident killer whales. We would expect
encounters with Southern Resident killer whales near SEAFAC to be very rare and therefore
discountable.
4.2.6.2 Population Structure
Southern resident killer whales are the only marine mammal that begin and end their lives almost
entirely within the Action Area. Southern resident killer whales consist of three pods, or stable
familial groups: the J pod, K pod, and L pod. The J pod is seen most frequently along the western
shore of San Juan Island and is the only pod observed regularly in Puget Sound throughout
winter (Heimlich-Boran 1988; Osborne 1999). The K pod is most frequently observed during
May and June when they occur along the western shore of San Juan Island while searching for
salmon. The L pod is the largest of the three pods (Ford et al. 1994b) and frequently breaks off
into separate subgroups. During the months of July, August, and September, all three pods of
southern resident killer whales remain in the inland waterways of Puget Sound, Strait of Juan de
Fuca, and southern Georgia Strait. Since the late 1970s, K and L pods typically arrived in this
area in May or June and remained there until October or November and appeared to have left
these waters by December (Osborne 1999). Since the late 1990s, however, all three pods have
tended to remain in this area through December and K and L pods have remained in inland
176
Biological Opinion and Conference Report on Navy NWTT Activities and NMFS’ MMPA Incidental Take
Authorization PCTS FPR-2015-9110
waters until January or February for several years (NMFS 2008d). While they tend to spend most
of their time in inland waters, both of these pods would periodically frequent the outer coasts of
Washington and southern Vancouver Island (Ford et al. 2000).
Less is known about the distribution and movements of southern resident killer whales from late
fall, through winter, and into early spring. Over this time interval, the J pod has been observed
periodically in the Georgia Basin and Puget Sound, but its movement at other times is uncertain
(Osborne 1999); although this pod was sighted once off Cape Flattery, Washington, in March
2004 (NMFS 2008d). The K and L pods have been sighted as they passed through the Strait of
Juan de Fuca in late fall, which led Krahn et al. (Krahn et al. 2002) to conclude that these pods
might travel to the outer coasts of Vancouver Island and Washington, although they may
continue to other areas from there. Based on sighting information and stranding data collected
from 1975 through 2007, southern resident killer whales travel to Vancouver Island and the
Queen Charlotte Islands, coastal Washington, coastal Oregon, and California (NMFS 2008d).
4.2.6.3 Abundance Estimate
Photo-identification of individual whales through the years has resulted in a substantial
understanding of this stock’s structure, behaviors, and movements in inland waters. The current
abundance estimate for this stock is 85 whales (Carretta et al. 2013a).
In the forty-year history of ORCA SURVEY, a long-term photo-identification study of this
whale population, the greatest number of calves born in a year was 9 in 1977, and there were
none born that survived in 2013 or 2014. However, since December 2014, five calves have been
observed which could represent a turnaround in what has been a negative population trend in
recent years.
4.2.6.4 Natural Threats
Southern resident killer whales, like many wild animal populations, experience highest mortality
in the first year age class (Krahn et al. 2002; Olesiuk et al. 1990), although the reasons for these
mortalities are still uncertain. The causes could include poor mothering, infectious or non
infectious diseases, and infanticide (Gaydos et al. 2004).
Gaydos et al. (2004) identified 16 infectious agents in free-ranging and captive southern resident
killer whales, but concluded that none of these pathogens were known to have high potential to
cause epizootics. They did, however, identify pathogens in sympatric odontocete species that
could threaten the long-term viability of the small southern resident population.
177

Biological Opinion and Conference Report on Navy NWTT Activities and NMFS’ MMPA Incidental Take
Authorization PCTS FPR-2015-9110
4.2.6.5 Anthropogenic Threats
Several human activities appeared to contribute to the decline of southern resident killer whales.
Southern resident killer whales were once shot deliberately in Washington and British Columbia
(Baird 2001; Olesiuk et al. 1990). However, between 1967 and 1973, 43 to 47 killer whales were
removed from the population for displays in oceanaria; because of those removals, the southern
resident killer whale population declined by about 30 percent. By 1971, the population had
declined to about 67 individuals. Since then, the population has fluctuated between highs of
about 90 individuals and lows of about 75 individuals.
Over the same time interval, southern resident killer whales have been exposed to changes in the
distribution and abundance of their prey base (primarily Pacific salmon) which has reduced their
potential forage base, potential competition with salmon fisheries, which reduces their realized
forage base, disturbance from vessels, and persistent toxic chemicals in their environment.
Salmon, which are the primary prey species for southern resident killer whales, have declined
because of land alteration throughout the Pacific Northwest associated with agriculture, timber
harvest practices, the construction of dams, and urbanization, fishery harvest practices, and
hatchery operations. Many of the salmon populations that were once abundant historically have
declined to the point where they have been listed as endangered or threatened with extinction.
Since the late 1800s, salmon populations throughout the Columbia River basin have declined
(Krahn et al. 2002). Two recent studies have examined the relationships between salmon
abundance and population dynamics of resident killer whales and support the belief that Chinook
and chum salmon are most important to the Southern Residents. Both studies, however, are
limited by incomplete data on salmon occurrence and year-round range use by the whales
(NMFS 2008d).
Since the 1970s commercial shipping, whale watching, ferry operations, and recreational boat
traffic have increased in Puget Sound and the coastal islands of southern British Columbia. This
traffic exposes southern resident killer whales to several threats that have consequences for the
species’ likelihood of avoiding extinction and recovering if it manages to avoid extinction. First,
these vessels increase the risks of southern resident killer whales being struck, injured, or killed
by ships. In 2005, a southern resident killer whale was injured in a collision with a commercial
whale watch vessel although the whale subsequently recovered from those injuries. However, in
2006, an adult male southern resident killer whale, L98, was killed in a collision with a tug boat;
given the gender imbalances in the southern resident killer whale population, we assume that the
death of this adult male would have reduced the demographic health of this population.
Second, the number and proximity of vessels, particularly whale-watch vessels in the areas
occupied by southern resident killer whales, represents a source of chronic disturbance for this
population. Numerous studies of interactions between surface vessels and marine mammals have
178
Biological Opinion and Conference Report on Navy NWTT Activities and NMFS’ MMPA Incidental Take
Authorization PCTS FPR-2015-9110
demonstrated that free-ranging marine mammals engage in avoidance behavior when surface
vessels move toward them. It is not clear whether these responses are caused by the physical
presence of a surface vessel, the underwater noise generated by the vessel, or an interaction
between the two (Goodwin and Cotton 2004; Lusseau 2006). However, several authors suggest
that the noise generated during motion is probably an important factor (Evans et al. 1992; Evans
et al. 1994). These studies suggest that the behavioral responses of marine mammals to surface
vessels are similar to their behavioral responses to predators.
Several investigators have studied the effects of whale watch vessels on marine mammals
(Amaral and Carlson 2005a; Au and Green 2000a; Corkeron 1995; Erbe 2002b; Felix 2001;
Magalhaes et al. 2002; Richter et al. 2006; Scheidat et al. 2004; Simmonds 2005a; Watkins 1986;
Williams et al. 2002a). The whale’s behavioral responses to whale watching vessels depended on
the distance of the vessel from the whale, vessel speed, vessel direction, vessel noise, and the
number of vessels. The whales’ responses changed with these different variables and, in some
circumstances, the whales did not respond to the vessels. In other circumstances, whales changed
their vocalizations, surface time, swimming speed, swimming angle or direction, respiration
rates, dive times, feeding behavior, and social interactions.
In addition to the disturbance associated with the presence of vessel, the vessel traffic affects the
acoustic ecology of southern resident killer whales, which would affect their social ecology.
Foote et al. (2004) compared recordings of southern resident killer whales that were made in the
presence or absence of boat noise in Puget Sound during three time periods between 1977 and
2003. They concluded that the duration of primary calls in the presence of boats increased by
about 15 percent during the last of the three time periods (2001 to 2003). At the same time, Holt
et al. (2009a) reported that southern resident killer whales in Haro Strait off the San Juan Islands
in Puget Sound, Washington, increased the amplitude of their social calls in the face of increased
sounds levels of background noise. Although the costs of these vocal adjustments remains
unknown, Foote et al. (2004) suggested that the amount of boat noise may have reached a
threshold above which the killer whales need to increase the duration of their vocalization to
avoid masking by the boat noise.
Exposure to contaminants may also harm southern resident killer whales. The presence of high
levels of persistent organic pollutants, such as PCB, DDT, and flame-retardants has been
documented in southern resident killer whales (Krahn et al. 2007; Ross et al. 2000). Although the
consequences of these pollutants on the fitness of individual killer whales and the population
itself remain unknown, in other species these pollutants have been reported to suppress immune
responses (Wright et al. 2007), impair reproduction, and exacerbate the energetic consequences
of physiological stress responses when they interact with other compounds in an animal’s tissues
(Martineau 2007). Because of their long life span, position at the top of the food chain, and their
179
Biological Opinion and Conference Report on Navy NWTT Activities and NMFS’ MMPA Incidental Take
Authorization PCTS FPR-2015-9110
blubber stores, killer whales would be capable of accumulating high concentrations of
contaminants.
4.2.6.6 Status and Trends
Southern resident killer whales were listed as endangered under the ESA in 2005 (70 FR 69903).
In the mid- to late-1800s, southern resident killer whales were estimated to have numbered
around 200 individuals. By the mid-1960s, they had declined to about 100 individuals. As
discussed in the preceding section, between 1967 and 1973, 43 to 47 killer whales were removed
from the population to provide animals for displays in oceanaria and the population declined by
about 30 percent as a result of those removals. By 1971, the population had declined to about 67
individuals. Since then, the population has fluctuated between highs of about 90 individuals and
lows of about 75 individuals.
At population sizes between 75 and 90 individuals, we would expect southern resident killer
whales to have higher probabilities of becoming extinct because of demographic stochasticity,
demographic heterogeneity (Coulson et al. 2006; Fox 2007) —including stochastic sex
determination (Lande et al. 2003)—and the effects of these phenomena interacting with
environmental variability. Demographic stochasticity refers to the randomness in the birth or
death of an individual in a population, which results in random variation on how many young
that individuals produce during their lifetime and when they die. Demographic heterogeneity
refers to variation in lifetime reproductive success of individuals in a population (generally, the
number of reproductive adults an individual produces over their reproductive lifespan), such that
the deaths of different individuals have different effects on the growth or decline of a population
(Coulson et al. 2006). Stochastic sex determination refers to the randomness in the sex of
offspring such that sexual ratios in population fluctuate over time (Melbourne and Hastings
2008). For example, the small number of adult male southern resident killer whales might
represent a stable condition for this species or it might reflect the effects of stochastic sex
determination. Regardless, a high mortality rates among adult males in a population with a
smaller percentage of males would increase the imbalance of male-to-female gender ratios in this
population and increase the importance of the few adult males that remain.
At these population sizes, populations experience higher extinction probabilities because
stochastic sexual determination leaves them with harmful imbalances between the number of
male or female animals in the population (which occurred to the heath hen and dusky seaside
sparrow just before they became extinct), or because the loss of individuals with high
reproductive success has a disproportionate effect on the rate at which the population declines
(Coulson et al. 2006). In general, an individual’s contribution to the growth (or decline) of the
population it represents depends, in part, on the number of individuals in the population: the
smaller the population, the more the performance of a single individual is likely to affect the
180

Biological Opinion and Conference Report on Navy NWTT Activities and NMFS’ MMPA Incidental Take
Authorization PCTS FPR-2015-9110
population’s growth or decline (Coulson et al. 2006). Given the small size of the southern
resident killer whale population, the performance (= “fitness,” measured as the longevity of
individuals and their reproductive success over their lifespan) of individual whales would be
expected to have appreciable consequences for the growth or decline of the southern resident
killer whale population.
These phenomena would increase the extinction probability of southern resident killer whales
and amplify the potential consequences of human-related activities on this species. Based on
their population size and population ecology (that is, slow-growing mammals that give birth to
single calves with several years between births), we assume that southern resident killer whales
would have elevated extinction probabilities because of exogenous threats caused by
anthropogenic activities that result in the death or injury of individual whales (for example, ship
strikes or entanglement) and natural phenomena (such as disease, predation, or changes in the
distribution and abundance of their prey in response to changing climate) as well as endogenous
threats resulting from the small size of their population. Based on the number of other species in
similar circumstances that have become extinct (and the small number of species that have
avoided extinction in similar circumstances), the longer southern resident killer whales remain in
these circumstances, the greater their extinction probability becomes.
4.2.6.7 Diving and Social Behavior
Killer whales are highly social animals that occur primarily in groups or pods of up to 40-50
animals (Baird 2000; Dahlheim and Heyning 1999). Larger aggregations of up to several
hundred individuals occasionally form, but are usually considered temporary groupings of
smaller social units that probably congregate near seasonal concentrations of prey, for social
interaction, or breeding (Baird 2000; Dahlheim and Heyning 1999; Ford et al. 2000). The basic
social units are matrilines, which usually consist of an adult female, her sons and daughters, the
offspring of her daughters, and might extend to include 3 to five generations of killer whales
(Baird 2000; Ford 2002; Ford et al. 2000). The members of matrilines maintain such strong
social connections that individuals rarely separate from these groups for more than a few hours.
Groups of related matrilines are known as pods—for example, L Pod of southern resident killer
whales consists of 12 matrilines—which are less cohesive than matrilines (matrilines within a
pod might travel separately for weeks or months). Clans are the next level of social structure in
resident killer whales and consist of pods with similar vocal dialects and common, but older,
maternal heritage.
In terms of gender and age composition, southern and northern resident killer whales social
groups consisted of 19 percent adult males, 31 percent adult females, and 50 percent immature
whales of either sex in 1987 (Olesiuk et al. 1990). This composition is comparable with the
181
Biological Opinion and Conference Report on Navy NWTT Activities and NMFS’ MMPA Incidental Take
Authorization PCTS FPR-2015-9110
composition of southern Alaska resident killer whales and killer whale populations in the
Southern Ocean (Matkin et al. 2003; Miyazaki 1989).
4.2.6.8 Vocalizations and Hearing
Killer whales produce a wide variety of clicks, whistles, and pulsed calls (Ford 1989; Schevill
and Watkins 1966; Thomsen et al. 2001). Their clicks are relatively broadband, short (0.1 to 25
milliseconds), and range in frequency from 8 to 80 kHz with an average center frequency of 50
kHz and an average bandwidth of 40 kHz (Au et al. 2004). Killer whales apparently use these
signals to sense objects in their environment, such as prey; whales foraging on salmon produce
these signals at peak-to-peak source levels ranging from 195 to 225 dB re 1 µPa at 1 m (Au et al.
2004).
Killer whale whistles are tonal signals that have longer duration (0.06 to 18 seconds) and
frequencies ranging from 0.5 to 10.2 kHz (Thomsen et al. 2001). Killer whales are reported to
whistle most often while they have been engaged in social interactions rather than during
foraging and traveling (Thomsen et al. 2002). Northern resident killer whales whistles have
source levels ranging from 133 to 147 dB re 1 µPa at 1 m (Miller 2006).
Killer whale pulsed calls are the most commonly observed type of signal associated with killer
whales (Ford 1989). With both northern and southern resident killer whales, these signals are
relatively long (600 to 2,000 ms) and range in frequency between 1 and 10 kHz; but may contain
harmonics up to 30 kHz (Ford 1989). The variable calls of killer whales have source levels
ranging from 133 to 165 dB while stereotyped calls have source levels ranging from 135 to 168
dB re 1 µPa at 1 m (Miller 2006). Killer whales use these calls when foraging and traveling
(Ford 1989).
4.2.7 Guadalupe Fur Seal
Guadalupe fur seals are medium sized, sexually dimorphic otariids that are generally asocial with
their conspecifics and other species (Belcher and T.E. Lee 2002; Reeves et al. 2002). Except for
adult males, members of this species resemble California sea lions and northern fur seals.
Distinguishing characteristics of the Guadalupe fur seal include the digits on their hind flippers
(all of similar length), large, long foreflippers, unique vocalizations, and a characteristic behavior
of floating vertically with their heads down in the water and their hind flippers exposed for
cooling (Reeves et al. 2002).
Guadalupe fur seals’ historic range included the Gulf of Farallones, California to the
Revillagigedo Islands, Mexico (Belcher and T.E. Lee 2002; Rick et al. 2009b). Currently, they
breed mainly on Guadalupe Island, Mexico, 155 miles off of the Pacific Coast of Baja California.
182
Biological Opinion and Conference Report on Navy NWTT Activities and NMFS’ MMPA Incidental Take
Authorization PCTS FPR-2015-9110
A smaller breeding colony, discovered in 1997, appears to have been established at Isla Benito
del Este, Baja California, Mexico (Belcher and T.E. Lee 2002).
There are reports of individuals being sighted in the California Channel Islands, Farallone
Islands, Monterey Bay, and other areas of coastal California and Mexico (Belcher and T.E. Lee
2002; Carretta et al. 2002; Reeves et al. 2002). A single female gave birth to a pup on the
Channel Islands in 1997.
The Guadalupe fur seal population is slowly recovering from the brink of extinction. The current
population abundance is approximately 10,000 animals. Of all the fur seal species, this one is the
least studied due to their limited geographic locations. The Guadalupe fur seal population does
appear to be increasing annually.
Before intensive hunting decreased their numbers, Guadalupe fur seals ranged from Monterey
Bay, California, to the Revillagigedo Islands, Mexico (Aurioles-Gamboa and Camacho-Rios
2007), but have occasionally been identified from strandings (Northwest Region Stranding
Database; (Wilkinson 2013)) or in archaeological contexts as far north as northern California,
Oregon, and Washington (Etnier 2002; Rick et al. 2009a). Between 1989 and 2011, a total of 118
dead stranded animals were found along the Washington and Oregon coastline (Northwest
Region Stranding Database; (Wilkinson 2013)). Between June 20 and November 1, 2007, 19
Guadalupe fur seals stranded on the Washington and Oregon outer coasts, prompting NOAA to
declare an Unusual Mortality Event on October 19, 2007 (Lambourn et al. 2012). The Unusual
Mortality Event was officially closed on December 11, 2009. In 2012, approximately 58
Guadalupe fur seals stranded on the outer coasts of Washington and Oregon (Lambourn 2013
pers. comm.). This is three times the number of strandings that prompted the Unusual Mortality
Event in 2007. Of all the strandings reported off Washington and Oregon (1989 to 2012), most
occurred from mid-May through August with occasional reports between October and December
((Lambourn et al. 2012); Northwest Region Stranding Database; (Wilkinson 2013)).Sightings of
live animals off Washington and Oregon are more limited, although there is photo
documentation of apparently healthy Guadalupe fur seals in offshore waters of Washington and
British Columbia in recent years during summer and early autumn (Lambourn et al. 2012). Given
the increased number of strandings in the Pacific Northwest, coupled with their increasing
population, it is possible that Guadalupe fur seals are returning to their historic pelagic migration
range suggested by the archaeological findings (Etnier 2002; Lambourn et al. 2012; Rick et al.
2009a).
4.2.7.1 Occurrence in the Offshore Portion of the NWTT Action Area
Based on their rookeries occurring in Baja California, Mexico, the species is predominantly
distributed off Mexico, but with annual strandings in Oregon and Washington, Guadalupe fur
seals are considered “seasonal” migrants within the offshore portion of the NWTT Action Area.
183

Biological Opinion and Conference Report on Navy NWTT Activities and NMFS’ MMPA Incidental Take
Authorization PCTS FPR-2015-9110
Given the lack of at-sea sightings by NMFS and the documented coastal strandings (Lambourn et
al. 2012), Guadalupe fur seals are more likely to be coastally distributed given their extralimital
at-sea occurrence and associated stranding records (Lambourn et al. 2012).
Most Guadalupe fur seal strandings in the Pacific Northwest likely represent young individuals
at the extreme limits of their preferred geographic foraging range as indicated by the poor health
of examined carcasses to date. There is no current evidence to support normal population
expansion into the Pacific Northwest (e.g., lack of significant sightings of healthy individuals at-
sea, lack of sightings of healthy individuals hauled-out on shore, lack of healthy individuals in
the stranding record, etc.). There were only three at-sea sightings of Guadalupe fur seals made
less than 30 miles from shore (Lambourn et al. 2012).
4.2.7.2 Occurrence in the Inland Waters of the NWTT Action Area
Guadalupe fur seals are not expected to occur within the Inland Waters region of the Action
Area. Strandings from the offshore portion of the Action Area have been documented as noted
above, but they are considered extralimital in the inland waters.
4.2.7.3 Occurrence in the Western Behm Canal, Alaska
Guadalupe fur seals are not expected to occur in the SEAFAC portion of the Action Area.
4.2.7.4 Critical Habitat
NMFS has not designated critical habitat for Guadalupe fur seals.
4.2.8 Leatherback Sea Turtle
The leatherback sea turtle is the largest turtle and the largest living reptile in the world. Mature
turtles can be as long as six and a half feet (2 m) and weigh almost 2,000 lbs. (900 kg). The
leatherback is the only sea turtle that lacks a hard, bony shell. A leatherback's carapace is
approximately 1.5 inches (4 cm) thick and consists of leathery, oil saturated connective tissue
overlaying loosely interlocking dermal bones. The carapace has seven longitudinal ridges and
tapers to a blunt point. Adult leatherbacks are primarily black with a pinkish white mottled
ventral surface and pale white and pink spotting on the top of the head. The front flippers lack
claws and scales and are proportionally longer than in other sea turtles; back flippers are paddle-
shaped. The ridged carapace and large flippers are characteristics that make the leatherback
uniquely equipped for long distance foraging migrations.
Female leatherback sea turtles lay clutches of approximately 100 eggs on sandy, tropical
beaches. Females nest several times during a nesting season, typically at 8 to 12 day intervals.
After 60 to 65 days, leatherback hatchlings with white striping along the ridges of their backs
184
Biological Opinion and Conference Report on Navy NWTT Activities and NMFS’ MMPA Incidental Take
Authorization PCTS FPR-2015-9110
and on the margins of the flippers emerge from the nest. Leatherback hatchlings are
approximately 50 to 77 cm (2 to 3 inches) in length, with fore flippers as long as their bodies,
and weigh approximately 40 to 50 grams (1.4 to 1.8 ounces).
Leatherback sea turtles lack the crushing chewing plates characteristic of sea turtles that feed on
hard-bodied prey (Pritchard 1971). Instead, they have pointed tooth-like cusps and sharp edged
jaws that are perfectly adapted for a diet of soft-bodied pelagic (open ocean) prey, such as
jellyfish and salps. A leatherback's mouth and throat also have backward-pointing spines that
help retain such gelatinous prey.
4.2.8.1 Distribution
Leatherback sea turtles are widely distributed throughout the oceans of the world. The species is
found in four main regions of the world: the Pacific, Atlantic, and Indian Oceans, and the
Caribbean Sea. Leatherbacks also occur in the Mediterranean Sea, although they are not known
to nest there. The four main regional areas may further be divided into nesting aggregations.
Leatherback turtles are found on the western and eastern coasts of the Pacific Ocean, with
nesting aggregations in Mexico and Costa Rica (eastern Pacific) and Malaysia, Indonesia,
Australia, the Solomon Islands, Papua New Guinea, Thailand, and Fiji (western Pacific). In the
Atlantic Ocean, leatherback nesting aggregations have been documented in Gabon, Sao Tome
and Principe, French Guiana, Suriname, and Florida. In the Caribbean, leatherbacks nest in the
U.S. Virgin Islands and Puerto Rico. In the Indian Ocean, leatherback nesting aggregations are
reported in India and Sri Lanka and KwaZulu Natal, South Africa.
Leatherback sea turtles have been documented in Alaska waters as far north as approximately
60º latitude (approximately 50 miles north of the northern edge of the Temporary maritime
Activities Area) and as far west in the Gulf of Alaska as the Aleutian Islands (Eckert 1993a). In
contrast with other sea turtles, leatherback sea turtles have physiological traits that allow for the
conservation of body heat which enable them to maintain body core temperatures well above the
ambient water temperatures (Eckert 1993a; Greer et al. 1973; Pritchard 1971). Shells, or
carapaces, of adult leatherbacks are 4 cm (1.5 inches) thick on average, contributing to the
leatherback’s thermal tolerance that enables this species to forage in water temperatures far
lower than the leatherback’s core body temperature (Bostrom et al. 2010). In an analysis of
available sightings (Eckert 2002), researchers found that leatherback turtles with carapace
lengths smaller than 100 cm (39 inches) were sighted only in waters 79 ºF or warmer, while
adults were found in waters as cold as 32 ºF to 59 ºF off Newfoundland (Goff and Lien 1988).
As a result, they are more capable of surviving for extended periods of time in cooler waters than
the hard-shelled sea turtles (Bleakney 1965; Lazell Jr. 1980).
In the Pacific Ocean, leatherback turtles have the most extensive range of any living reptile and
have been reported in all pelagic waters of the Pacific between 71 N and 47 S latitude and in
185
Biological Opinion and Conference Report on Navy NWTT Activities and NMFS’ MMPA Incidental Take
Authorization PCTS FPR-2015-9110
all other major pelagic ocean habitats (NMFS and USFWS 1998a). Leatherback turtles lead a
completely pelagic existence, foraging widely in temperate waters except during the nesting
season, when gravid females return to tropical beaches to lay eggs. Few quantitative data are
available concerning the seasonality, abundance, or distribution of leatherbacks in the central
northern Pacific Ocean. Satellite tracking studies and occasional incidental captures of the
species in the Hawaii-based longline fishery indicate that deep ocean waters are the preferred
habitats of leatherback turtles in the central Pacific Ocean (NMFS and USFWS 2007a). The
primary migration corridors for leatherbacks are across the North Pacific Subtropical Gyre, with
the eastward migration route possibly to the north of the westward migration.
4.2.8.1.1 Occurrence in the Offshore Portion of the NWTT Action Area
Few quantitative data are available concerning the seasonality, abundance, or distribution of
leatherbacks in the central North Pacific Ocean. The movements of adult leatherback sea turtles
appear to be linked to the seasonal availability of their prey and the requirements of their
reproductive cycles (Collard 1990; Davenport and Balazs 1991). Leatherbacks prefer
convergence zones and upwelling areas in the open ocean, along continental margins, or near
large archipelagos. Leatherbacks from both eastern and western Pacific Ocean nesting
populations migrate to northern Pacific Ocean foraging grounds, where longline fisheries operate
(Dutton et al. 1998). Leatherbacks from nesting beaches in the Indo-Pacific region have been
tracked migrating thousands of kilometers from nesting areas to summer foraging grounds off
the coast of northern California (Benson et al. 2007), including a 6,385 mi. (10,276 km)
migration from a nesting beach in Papua New Guinea to foraging grounds off the coast of
Oregon (Benson et al. 2007). The waters off the Oregon and California coasts have been
repeatedly recognized by scientists and agencies as comprising one of the most important
leatherback foraging areas in the Pacific (NMFS and USFWS 1998b).
Leatherback turtles are regularly seen off the western coast of the United States. Off the
California coast, the highest densities of leatherback sea turtles were found off central California
(Benson et al. 2007). Telemetry studies have shown areas of concentration along the central
California coast and in the waters of Oregon and Washington (Benson et al. 2011). Stinson
(1984) concluded that the leatherback was the most common sea turtle in U.S. waters north of
Mexico. Aerial surveys off Washington, Oregon, and California indicate that most leatherbacks
occur in waters over the continental slope, with a few over the continental shelf (Eckert 1993b).
Green et al. (1992a) conducted a study between 1989 and 1990 to assess the presence and
abundance of federally listed species along the coasts of Washington and Oregon. During the
study, 16 sea turtles were observed; all sightings were of leatherback sea turtles and all occurred
between June and September, with most sightings (10) occurring in July (Green et al. 1992). The
data suggest that leatherback sea turtles are most likely to occur in the NWTT Action Area in
summer and early fall when water temperatures are warmer. Roe et al. (2014) produced some of
186
Biological Opinion and Conference Report on Navy NWTT Activities and NMFS’ MMPA Incidental Take
Authorization PCTS FPR-2015-9110
the first Pacific wide leatherback probabilities maps based on use distribution from 135 satellite-
tracked adult turtles.
4.2.8.1.2 Occurrence in the Inland Waters of the NWTT Action Area
Leatherback sea turtles are occasionally sighted within the Strait of Juan de Fuca, but are rare in
Puget Sound (NMFS and USFWS 1998b; NMFS and USFWS 2007a). While leatherback sea
turtles are capable of foraging in inland waters, their preferred foraging habitat is offshore.
Therefore, the leatherback sea turtle is not analyzed further for military activities occurring in the
inland waters portion of the NWTT Action Area.
4.2.8.1.3 Occurrence in the Western Behm Canal, Alaska - NWTT Action Area
Stinson’s (1984) archival search of 363 sea turtles sighted along the Pacific coast from Baja
California, Mexico to the Gulf of Alaska from 1917 to 1982 indicated that only 6 of the recorded
leatherback sightings occurred in Alaska waters. From 1960 to 1968, 19 sightings of leatherback
turtles in Alaska waters were recorded (11 were sightings, 3 were netted and released, 3 were
netted and killed, and 2 were carcasses) (Hodge and Wing 2000). While leatherback sea turtles
are physically capable of foraging in Alaska waters, they are rare in the area and prefer offshore
waters to the south. Therefore, the leatherback sea turtle is not analyzed further for activities
occurring in the Western Behm Canal portion of the Action Area.
4.2.8.2 Abundance Estimate
Most stocks in the Pacific Ocean are faring poorly, as nesting populations there have declined
more than 80 percent since 1982 (Sarti-Martinez 2000), while western Atlantic and South
African populations are generally stable or increasing (TEWG 2007). Worldwide, the largest
nesting populations now occur off of Gabon in equatorial West Africa (5,865 to 20,499 females
nesting per year (Witt et al. 2009), in the western Atlantic in French Guiana (4,500 to 7,500
females nesting per year (Dutton et al. 2007) and Trinidad (estimated 6,000 turtles nesting
annually (Eckert 2002), and in the western Pacific in West Papua (formerly Irian Jaya),
Indonesia (about 600 to 650 females nesting per year (Dutton et al. 2007). By 2004, 203 nesting
beaches from 46 countries around the world had been identified (Dutton 2006). Of these, 89 sites
(44 percent) have generated data from beach monitoring programs. Although these data are
beginning to form a global perspective, unidentified sites likely exist, and incomplete or no data
are available for many known sites. Genetic studies have been used to identify two discrete
leatherback populations in the Pacific Ocean (Dutton 2006): an eastern Pacific Ocean population,
which nests between Mexico and Ecuador; and a western Pacific Ocean population, which nests
in numerous countries, including Indonesia, Papua New Guinea, Solomon Islands, and Vanuatu.
187
Biological Opinion and Conference Report on Navy NWTT Activities and NMFS’ MMPA Incidental Take
Authorization PCTS FPR-2015-9110
There are no known nesting habitats for the leatherback sea turtle in the Action Area. The major
nesting populations of the eastern Pacific Ocean stock occur in Mexico, Costa Rica, Panama,
Colombia, Ecuador, and Nicaragua (Chaloupka et al. 2004; Dutton et al. 1999; Eckert and Sarti
1997; Márquez 1990; Sarti M. 1996; Spotila et al. 1996), with the largest ones in Mexico and
Costa Rica. There are 28 known nesting sites for the western Pacific Ocean stock, with an
estimated 5,000 to 9,100 leatherback nests annually across the western tropical Pacific Ocean,
from Australia and Melanesia (Papua New Guinea, Solomon Islands, Fiji, and Vanuatu) to
Indonesia, Thailand, and China (Chaloupka et al. 2004; Chua 1988; Dutton 2006; Hirth et al.
1993; Suarez et al. 2000).
Leatherbacks have been in decline in all major Pacific basin rookeries (nesting areas/groups)
(NMFS and USFWS 2007a; TEWG 2007) for at least the last two decades (Gilman 2008; Sarti
M. 1996; Spotila et al. 1996; Spotila et al. 2000). Causes for this decline include the nearly
complete harvest of eggs and high levels of mortality during the 1980s, primarily in the high seas
driftnet fishery, which is now banned (Chaloupka et al. 2004; Eckert and Sarti 1997; Sarti M.
1996). With only four major rookeries remaining in the western Pacific Ocean and two in the
eastern Pacific Ocean, the Pacific leatherback is at an extremely high risk of extinction.
4.2.8.3 Natural Threats
The various habitat types leatherback sea turtles occupy throughout their lives exposes these sea
turtles to a wide variety of natural threats. The beaches on which leatherback sea turtles nest and
the nests themselves are threatened by hurricanes and tropical storms as well as the storm surges,
sand accretion, and rainfall that are associated with hurricanes. Hatchlings are hunted by
predators like herons, gulls, dogfish, and sharks. Larger leatherback sea turtles, including adults,
are also killed by sharks and other large, marine predators.
4.2.8.4 Anthropomorphic Threats
Leatherback sea turtles are endangered by several human activities, including fisheries
interactions, entanglement in fishing gear (e.g., gillnets, longlines, lobster pots, weirs), direct
harvest, egg collection, the destruction and degradation of nesting and coastal habitat, boat
collisions, and ingestion of marine debris.
The foremost threat is the number of leatherback turtles killed or injured in fisheries. Spotila
(2004) concluded that a conservative estimate of annual leatherback fishery-related mortality
(from longlines, trawls and gillnets) in the Pacific Ocean during the 1990s is 1,500 animals. He
estimates that this represented about a 23 percent mortality rate (or 33 percent if most mortality
was focused on the East Pacific population). Spotila (2000) asserts that most of the mortality
associated with the Playa Grande nesting site was fishery related.
188
Biological Opinion and Conference Report on Navy NWTT Activities and NMFS’ MMPA Incidental Take
Authorization PCTS FPR-2015-9110
Leatherback sea turtles are exposed to commercial fisheries in many areas of the Atlantic Ocean.
For example, leatherback entanglements in fishing gear are common in Canadian waters where
Goff and Lien (Goff and Lien 1988) reported that 14 of 20 leatherbacks encountered off the coast
of Newfoundland and Labrador were entangled in fishing gear including salmon net, herring net,
gillnet, trawl line and crab pot line. Leatherbacks are reported taken by the many other nations
that participate in Atlantic pelagic longline fisheries (see NMFS 2001, for a complete description
of take records), including Taiwan, Brazil, Trinidad, Morocco, Cyprus, Venezuela, Korea,
Mexico, Cuba, U.K., Bermuda, People’s Republic of China, Grenada, Canada, Belize, France,
and Ireland.
In the Pacific Ocean, between 1,000 and 1,300 leatherback sea turtles are estimated to have been
captured and killed in longline fisheries in 2000 (Lewison et al. 2004). Shallow-set longline
fisheries based out of Hawai'i are estimated to have captured and killed several hundred
leatherback sea turtles before they were closed in 2001. When they were re-opened in 2004, with
substantial modifications to protect sea turtles, these fisheries were estimated to have captured
and killed about 1 or 2 leatherback sea turtles each year. Between 2004 and 2008, shallow-set
fisheries based out of Hawai'i are estimated to have captured about 19 leatherback sea turtles,
killing about 5 of these sea turtles. A recent biological opinion on these fisheries expected this
rate of interaction and deaths to continue into the foreseeable future. Leatherback sea turtles have
also been and are expected to continue to be captured and killed in the deep-set based longline
fisheries based out of Hawaii and American Samoa.
Shrimp trawls in the Gulf of Mexico capture the largest number of leatherback sea turtles: each
year, they have been estimated to capture about 3,000 leatherback sea turtles with 80 of those sea
turtles dying as a result. Along the Atlantic coast of the U.S., NMFS estimated that about 800
leatherback sea turtles are captured in pelagic longline fisheries, bottom longline and drift gillnet
fisheries for sharks as well as lobster, deep-sea red crab, Jonah crab, dolphin fish and wahoo, and
Pamlico Sound gillnet fisheries. Although most of these turtles are released alive, these fisheries
combine to kill about 300 leatherback sea turtles each year; the health effects of being captured
on the sea turtles that survive remain unknown.
Leatherback sea turtles are known to drown in fish nets set in coastal waters of Sao Tome, West
Africa (Tomás et al. 2000). Gillnets are one of the suspected causes for the decline in the
leatherback turtle population in French Guiana (Chevalier et al. 1999), and gillnets targeting
green and hawksbill turtles in the waters of coastal Nicaragua also incidentally catch leatherback
turtles (Lagueux 1998). Observers on shrimp trawlers operating in the northeastern region of
Venezuela documented the capture of six leatherbacks from 13,600 trawls (Marcano and Alió-M
2000). An estimated 1,000 mature female leatherback turtles are caught annually off of Trinidad
and Tobago with mortality estimated to be between 50 to 95 percent (Eckert et al. 2007).
However, many of the turtles do not die as a result of drowning, but rather because the fishermen
189
Biological Opinion and Conference Report on Navy NWTT Activities and NMFS’ MMPA Incidental Take
Authorization PCTS FPR-2015-9110
butcher them in order to get them out of their nets. There are known to be many sizeable
populations of leatherbacks nesting in West Africa, possibly as many as 20,000 females nesting
annually (Fretey 2001). In Ghana, nearly two thirds of the leatherback turtles that come up to
nest on the beach are killed by local fishermen.
On some beaches, nearly 100 percent of the eggs laid have been harvested. Spotila et al. (1996)
and Eckert et al. (2007) note that adult mortality has also increased significantly, particularly as a
result of driftnet and longline fisheries. Like green and hawksbill sea turtles, leatherback sea
turtles are threatened by domestic or domesticated animals that prey on their nests; artificial
lighting that disorients adult female and hatchling sea turtles, which can dramatically increase the
mortality rates of hatchling sea turtles; beach replenishment; ingestion and entanglement in
marine debris; and environmental contaminants.
Oil spills are a risk for all sea turtles. Several aspects of sea turtles life histories put them at risk,
including the lack of avoidance behavior of oiled waters and indiscriminate feeding in
convergence zones. Sea turtles are air breathers and all must come to the surface frequently to
take a breath of air. In a large oil spill, these animals may be exposed to volatile chemicals
during inhalation (NMFS 2010d).
Additionally, sea turtles may experience oiling impacts on nesting beaches when they come
ashore to lay their eggs, and their eggs may be exposed during incubation potentially resulting in
increased egg mortality and/or possibly developmental defects in hatchlings. Hatchlings
emerging from their nests may encounter oil on the beach and in the water as they begin their
lives at sea (NMFS 2010d).
External Effects: Oil and other chemicals on skin and body may result in skin and eye irritation,
burns to mucous membranes of eyes and mouth, and increased susceptibility to infection (NMFS
2010d).
Internal Effects: Inhalation of volatile organics from oil or dispersants may result in respiratory
irritation, tissue injury, and pneumonia. Ingestion of oil or dispersants may result in
gastrointestinal inflammation, ulcers, bleeding, diarrhea, and maldigestion. Absorption of inhaled
and ingested chemicals may damage organs such as the liver or kidney, result in anemia and
immune suppression, or lead to reproductive failure or death (NMFS 2010d).
4.2.8.5 Status and Trends
The leatherback turtle was listed under the Endangered Species Act as endangered throughout its
range in 1970. There is a recovery plan for this species (NMFS and USFWS 1998a).
190
Biological Opinion and Conference Report on Navy NWTT Activities and NMFS’ MMPA Incidental Take
Authorization PCTS FPR-2015-9110
Leatherback turtles are considered critically endangered by the International Union for
Conservation of Nature (IUCN) Red List of Threatened Species (IUCN 2010) and are protected
by the Convention on International Trade in Endangered Species (CITES).
The Pacific Ocean leatherback population is generally smaller in size than that in the Atlantic
Ocean. Because adult female leatherbacks frequently nest on different beaches, nesting
population estimates and trends are especially difficult to monitor. In the Pacific, the IUCN notes
that most leatherback nesting populations have declined more than 80 percent. In other areas of
the leatherback's range, observed declines in nesting populations are not as severe, and some
population trends are increasing or stable. In the Atlantic, available information indicates that the
largest leatherback nesting population occurs in French Guyana, but the trends are unclear. Some
Caribbean nesting populations appear to be increasing, but these populations are very small when
compared to those that nested in the Pacific less than 10 years ago. Nesting trends on U.S.
beaches have been increasing in recent years.
4.2.8.6 Diving
The leatherback sea turtle is one of the deepest divers in the ocean, with dives as deep as 3,937 ft
(1,200 m), although it spends most of its time feeding at a depth of less than 328 ft (100 m).
Leatherback turtles primarily feed on gelatinous zooplankton such as cnidarians (jellyfish and
siphonophores) and tunicates (salps and pyrosomas) (Bjorndal 1997; NMFS and USFWS 1998a).
The leatherback dives continually and spends short periods of time on the surface between dives
(Eckert et al. 1989b; Southwood et al. 1999). Typical dive durations averaged 6.9 to 14.5
minutes (min) per dive, with a maximum of 42 min (Eckert et al. 1996). Sea turtles typically
remain submerged for several minutes to several hours depending upon their activity state
(Standora et al. 1984). Long periods of submergence hamper detection and confound census
efforts. During migrations or long distance movements, leatherbacks maximize swimming
efficiency by traveling within 15 ft (5 m) of the surface (Eckert 2002).
4.2.8.7 Social Behavior
Male leatherbacks do not return to land after they hatch from their nests whereas mature females
return to land only to lay eggs (Spotila 2004). Aside from this brief terrestrial period, which lasts
approximately three months during egg incubation and hatching, leatherback turtles are rarely
encountered out of the water. Hatchling leatherbacks are pelagic, but nothing is known about
their distribution during the first 4 years of life (Musick and Limpus 1997).
The Pacific coast of Mexico is generally regarded as the most important leatherback breeding
ground in the world, although nesting on Pacific beaches under U.S. jurisdiction has always been
rare (NMFS and USFWS 1998a). Based on a single aerial survey in 1980 of Michoacán,
Guerrero, and Oaxaca, and on published and anecdotal data, Pritchard (Pritchard 1982a)
191
Biological Opinion and Conference Report on Navy NWTT Activities and NMFS’ MMPA Incidental Take
Authorization PCTS FPR-2015-9110
estimated that 30,000 females nested annually in these three Mexican states. Lower-density
nesting was (and still is) reported farther north in Jalisco (NMFS and USFWS 1998a) and in Baja
California, where the northernmost eastern Pacific nesting sites are found (Fritts et al. 1982).
Leatherbacks nest along the western coast of Mexico from November to February, although
some females arrive as early as August (NMFS and USFWS 1998a), and in Central America
from October to February (Lux et al. 2003). This species nests primarily on beaches with little
reef or rock offshore. On these types of beaches erosion reduces the probability of nest survival.
To compensate, leatherbacks scatter their nests over large geographic areas and lay on average
two times as many clutches as other species (Eckert 1987). Females may lay up to nine clutches
in a season (although six is more common), and the incubation period is 58–65 days. At Playa
Grande, Costa Rica, and in French Guiana, the mean inter-nesting period was 9 days (Lux et al.
2003). Post-nesting adults appear to migrate along bathymetric contours from 656 to 11,483 ft
(200 to 3,500 m) (Morreale et al. 1994), and most of the eastern Pacific nesting stocks migrate
south (NMFS and USFWS 1998a). Other principal nesting sites in the Pacific Ocean indicate
that gene flow between eastern and western Pacific nesting populations is restricted (Dutton et al.
2005; Dutton et al. 2006; Dutton et al. 1999; Dutton et al. 1996; Dutton et al. 2003).
4.2.8.8 Vocalization and Hearing
Sea turtles do not have an external ear pinnae or eardrum. Instead, they have a cutaneous layer
and underlying subcutaneous fatty layer that function as a tympanic membrane. The
subcutaneous fatty layer receives and transmits sounds to the middle ear and into the cavity of
the inner ear (Ridgway et al. 1969). Sound also arrives by bone conduction through the skull.
Sound arriving at the inner ear via the columella (homologous to the mammalian stapes or
stirrup) is transduced by the bones of the middle ear.
Sea turtle auditory sensitivity is not well studied, though a few preliminary investigations suggest
that it is limited to low frequency bandwidths, such as the sounds of waves breaking on a beach.
The role of underwater low-frequency hearing in sea turtles is unclear. It has been suggested that
sea turtles may use acoustic signals from their environment as guideposts during migration and
as a cue to identify their natal beaches (Lenhardt et al. 1983).
Lenhardt et al. (1983) applied audio frequency vibrations at 250 Hz and 500 Hz to the heads of
loggerheads and Kemp’s ridleys submerged in salt water to observe their behavior, measure the
attenuation of the vibrations, and assess any neural-evoked response. These stimuli (250 Hz, 500
Hz) were chosen as representative of the lowest sensitivity area of marine turtle hearing (Wever
and Vernon 1956). At the maximum upper limit of the vibratory delivery system, the sea turtles
exhibited abrupt movements, slight retraction of the head, and extension of the limbs in the
process of swimming. Lenhardt et al. (1983) concluded that bone-conducted hearing appears to
be a reception mechanism for at least some of the sea turtle species, with the skull and shell
192
Biological Opinion and Conference Report on Navy NWTT Activities and NMFS’ MMPA Incidental Take
Authorization PCTS FPR-2015-9110
acting as receiving surfaces. Finally, sensitivity even within the optimal hearing range was low
as threshold detection levels in water are relatively high at 160 to 200 decibels referenced to one
micro Pascal at a distance of one meter (dB re 1 μPa-m), which is the standard reference measure
for underwater sound energy in this regard (Lenhardt et al. 1994a).
Ridgway et al. (1969) used aerial and mechanical stimulation to measure the cochlea in three
specimens of green turtle, and concluded that they have a useful hearing span of perhaps 60 to
1,000 Hz, but hear best from about 200 Hz up to 700 Hz, with their sensitivity falling off
considerably below 200 Hz. The maximum sensitivity for one animal was at 300 Hz, and for
another was at 400 Hz. At the 400 Hz frequency, the green turtle’s hearing threshold was about
64 dB in air (approximately 126 dB in water). At 70 Hz, it was about 70 dB in air (approximately
132 dB in water). We may be able to extrapolate this data to pertain to all hard-shell sea turtles
(i.e., the olive ridley, green, loggerhead, and Kemp’s ridley turtles). No audiometric data are
available for the leatherback turtle, but based on other sea turtle hearing capabilities, they
probably also hear best in the low frequencies.
For exposures to impulsive sound, a recent study on the effects of air guns on sea turtle behavior
also suggests that sea turtles are most likely to respond to low-frequency sounds (McCauley et al.
2000). Loggerhead sea turtles will avoid air-gun arrays at 2 km and at 1 km, with received levels
of 166 dB re 1 μPa-m and 175 dB re 1 μPa, respectively (McCauley et al. 2000). The sea turtles’
response was consistent: above a level of about 166 dB re 1 μPa, the sea turtles noticeably
increased their swimming activity. Above 175 dB re 1 μPa, their behavior became more erratic,
possibly indicating that they were agitated (McCauley et al. 2000).
Currently it is believed that the range of maximum sensitivity for sea turtles is 200 to 800 Hz,
with an upper limit of about 2,000 Hz (Lenhardt 1994; Moein et al. 1994). Green turtles are most
sensitive to sounds between 200 and 700 Hz, with peak sensitivity at 300 to 400 Hz (Ridgway et
al. 1969). They possess an overall hearing range of approximately 60 to 1,000 Hz (Ridgway et al.
1969). Juvenile loggerhead turtles hear sounds between 250 and 1,000 Hz and, therefore, often
avoid low-frequency sounds (Bartol et al. 1999b). Finally, sensitivity even within the optimal
hearing range is apparently low—threshold detection levels in water are relatively high at 160 to
200 dB re 1 μPa-m (Lenhardt 1994). Given the lack of audiometric information for leatherback
turtles, the potential for TTS among leatherback turtles must be classified as unknown but would
likely follow those of other sea turtles. In terms of sound emission, nesting leatherback turtles
produce sounds in the 300 to 500 Hz range (Mrosovsky 1972).
4.2.9 Puget Sound/Georgia Basin Canary Rockfish
Canary rockfish are large rockfish that reach up to 2.5 feet (77 cm) in length and 10 pounds (4
kg) in weight. Adults have bright yellow to orange mottling over gray, 3 orange stripes across the
193
Biological Opinion and Conference Report on Navy NWTT Activities and NMFS’ MMPA Incidental Take
Authorization PCTS FPR-2015-9110
head, and orange fins. Animals less than 14 inches long have dark markings on the posterior part
of the spiny dorsal fin and gray along the lateral line.
4.2.9.1 Distribution
Canary rockfish are found from the northern Baja peninsula north to the western Gulf of Alaska,
and with the greatest abundance along British Columbia to central California (Cailliet et al.
2000; Hart 1973; Love et al. 2002; Miller and Lea 1972).
The Puget Sound/Georgia Basin DPS of canary rockfish occur throughout Puget Sound, which
encompasses all waters south of a line connecting Point Wilson on the Olympic Peninsula and
Partridge on Whidbey Island; West Point on Whidbey Island, Deception Island, and Rosario
Head on Fidalgo Island; and the southern end of Swinomish Channel between Fidalgo Island and
McGlinn Island and the Strait of Georgia, which encompasses the waters inland of Vancouver
Island, the Gulf Islands, and the mainland coast of British Columbia.
4.2.9.2 Habitat
Canary rockfish occupy a variety of habitats based upon their life stage. Larvae and younger
juveniles tend to occupy shallow waters at the beginning of their lives, but generally remain in
the upper 100 m of the water column (Love et al. 2002). Juveniles initially settle into tide pools
and rocky reefs (Cailliet et al. 2000; Love et al. 1991; Love et al. 2002; Miller and Geibel 1973).
Juveniles have also been observed in diurnal movements, occurring near sand-rock interfaces in
groups by day and moving over sandy areas at night (Love et al. 2002). After as much as 3 years,
juveniles move into deeper rocky reefs, forming loose schools, rarely on but generally near the
bottom (Boehlert 1980; Cailliet et al. 2000; Johnson et al. 2003; Lamb and Edgell 1986; Methot
and Stewart 2005; Phillips 1960; Rosenthal et al. 1998; Starr 1998; Tissot et al. 2007). Adults
may be found in waters of up to 400 m, but tend to be most common in the 80 to 200 m range, or
even shallower (Methot and Stewart 2005; Moser 1996b; Tissot et al. 2007). Mid shelf locations
seem to have the highest concentrations of canary rockfish off Washington and Oregon
(Weinberg 1994). Adults tend to occur in shallow areas in higher latitudes than their southern
counterparts, although adults do appear to move into progressively deeper waters as they age
(Methot and Stewart 2005; Vetter and Lynn 1997). It is believed that, within Puget Sound,
canary rockfish were most common in the 1960s and 1970s in Tacoma Narrows, Hood Canal,
San Juan Islands, Bellingham, and Appletree Cove (Delacy et al. 1972; Miller and Borton 1980).
A latitudinal gradient may be present by age class, with older and larger individuals preferably
occupying more northerly habitat (Dark et al. 1983).
4.2.9.3 Movement
Individual canary rockfish can range widely (up to 700 km over several years), although patterns
of residency have been observed (Casillas et al. 1998; DeMott 1983; Gascon and Miller 1981;
194
Biological Opinion and Conference Report on Navy NWTT Activities and NMFS’ MMPA Incidental Take
Authorization PCTS FPR-2015-9110
Lea et al. 1999; Love et al. 2002). In addition, seasonal movements have been found, with
individuals moving from 160 to 210 m depths in late winter to 100 to 170 m in late summer
(COSEWIC in press).
4.2.9.4 Reproduction
Canary rockfish develop their young internally before giving birth to live young as larvae.
During each annual spawning event, a female can produce 260,000 to 1.9 million eggs,
depending upon her size and age (Guillemot et al. 1985; NMFS 2008c). Unlike some other
rockfish, there does not appear to be a latitudinal or geographic gradient associated with number
of eggs produced (Gunderson et al. 1980; Love et al. 2002). Birth takes place in Oregon and
Washington waters between September through March, with a peak in December and January.
The peak in British Columbia waters is slightly later (February) (Barss 1989; Hart 1973;
Westrheim and Harling 1975; Wyllie Echeverria 1987).
4.2.9.5 Growth and Development
When born, larvae are 3.6 to 4.0 mm in length and take from 1 to 4 months to develop into
juveniles (Krigsman 2000; Love et al. 2002; Moser 1996a; Richardson and Laroche 1979; Stahl-
Johnson 1985; Waldron 1968). As with other rockfish, females seem grow more quickly than do
males, with females reaching sexual maturity at 7 to 9 years of age (35 to 45 cm in length) versus
males at 7 to 12 years (~41 cm in length) off Oregon (Boehlert and Kappenman 1980; Lenarz
and Echeverria 1991; STAT 1999; Westrheim and Harling 1975). Mean length at sexual maturity
off Vancouver Island is 41 cm for females and 48 cm for males (Westrheim and Harling 1975).
Canary rockfish are known to frequently reach 60 to 75 years of age and have been found to be
as old as 84 years (Andrews et al. 2007; Cailliet et al. 2001; Cailliet et al. 2000). Maximum
reported sizes are 76 cm and 4.5 kg (Boehlert 1980; IGFA 1991; Love et al. 2002; Methot and
Stewart 2005; Williams et al. 1999).
4.2.9.6 Foraging
Canary rockfish prey upon different species as they age. Larvae are planktivores, consuming
invertebrate eggs, copepods, and nauplii (Love et al. 2002; Moser and Boehlert 1991). Juveniles
feed upon zooplankton, including crustaceans, juvenile polychaetes barnacle cyprids, and
euphasiid eggs and larvae (Gaines and Roughgarden 1987; Love et al. 1991). However, adults
move into a carnivorous lifestyle as well as eating euphasiids and other crustaceans. Adults
consume other fishes such as shortbelly rockfish, mytophids and stomiatiods (Cailliet et al. 2000;
Love et al. 2002). However, oceanographic and climactic shifts can alter foraging such that
canary rockfish feed on other available species (Lee and Sampson 2009).
195
Biological Opinion and Conference Report on Navy NWTT Activities and NMFS’ MMPA Incidental Take
Authorization PCTS FPR-2015-9110
4.2.9.7 Vocalization and Hearing
The hearing sensitivities of Georgia Basin canary rockfish have not been studied. However, they
produce low frequency sounds (lower than 900 Hz) (Sirovic and Demer 2009) and are believed
to be low-frequency hearing generalists (Croll et al. 1999b).
4.2.9.8 Status and Trends
Canary rockfish were proposed for listing on April 23, 2009 (74 FR 18516). Canary rockfish
were once considered common in Puget Sound, but have declined at a faster rate than any other
rockfish species in the region (Holmberg et al. 1967; NMFS 2008c). Prior to World War II,
commercial landings of rockfish species generally remained under 20,000 lbs, but sky-rocketed
during the war to 375,000 lbs annually and fluctuated between 50,000 and 220,000 lbs until
1970, when landings increased linearly with fishing effort to a peak of 900,000 lbs by 1980
(Palsson et al. 2008). Levels fluctuated after this between 48,000 and 300,000 lbs for the next
decade and clearly crashed in the 1990s, with landings below 30,000 lbs annually. At the
cessation of commercial fishing in 2003, 2,600 lbs of rockfish were harvested. Canary rockfish
have been noted for being much less frequently caught in the Puget Sound and Georgia Basin
region since 1965 (NMFS 2008c). The rate of decline for rockfish in Puget Sound has been
estimated at ~3 percent annually for the period 1965 to 2007.
Because of a lack of systematic sampling targeting rare rockfish, absolute estimates of
population size cannot be generated with accuracy. A rough estimate of the order of magnitude
of population size for all rockfish is determined to be less than 10,000 in the Georgia Basin and
less than 1,000 in Puget Sound Proper (Main Basin, Whidbey Basin, SPS and Hood Canal) (74
FR 18516). Current trends and levels of abundance contribute significantly to short- and long
term risk of extinction. No core population or subpopulation is at normal levels of abundance.
The DPS is at all-time low levels of abundance for the past several years, exhibiting a disturbing
trend in abundance levels for the past several years. Recent 10-year abundance in the DPS is low
in all or nearly all spawning populations relative to earlier periods. Several historically large
populations have been lost, resulting in a patchy distribution of isolated populations. Surveys
indicate that by the 2000s, there were far fewer size classes represented and few older fish
remain in the population. No published studies have compared genetic characteristics of canary
rockfish from Puget Sound and outer coastal areas. Low abundance is likely resulting in reduced
productivity. The south Puget Sound populations are no longer viable. The loss of either the
north or south Puget Sound populations could result in a contraction of the range within the DPS.
Although adults are known to move into other areas, there does not appear to be a strong refugial
population anywhere in the DPS. The species is more mobile than many other rockfish species,
which may help preserve genetic diversity by increasing connectivity among breeding
populations.
196
Biological Opinion and Conference Report on Navy NWTT Activities and NMFS’ MMPA Incidental Take
Authorization PCTS FPR-2015-9110
4.2.9.9 Natural Threats
Predators of adult canary rockfish include yelloweye rockfish, lingcod, salmon, sharks, dolphins,
seals (Antonelis and Fiscus 1980; Merkel 1957; Morejohn et al. 1978; Rosenthal et al. 1982) and
possibly river otters (Stevens and Miller 1983). In addition, studies of the effect of climate
variability on rockfish are rare, but all the studies performed to date suggest that climate plays an
extremely important role in population dynamics (Drake and Griffen 2010). Although the
mechanism by which climate influences the population dynamics of rockfish remains unknown,
several authors have reported negative correlations between the warm water conditions
associated with El Nino and the population dynamics of rockfish (Moser et al. 2000b). Field and
Ralston (2005) reported that recruitment in all species of rockfish appeared to be correlated at
large scales and hypothesized that such synchrony was the result of large-scale climatic
phenomena. Tolimieri and Levin (2005) reported that bocaccio recruitment off of California is
correlated with specific sets of climate patterns. These phenomena are also believed to affect the
population dynamics of Georgia Basin canary rockfish and are assumed to have led to
recruitment failures in the early- to mid-1990s.
4.2.9.10 Anthropogenic Threats
Overharvesting the primary cause of canary rockfish declines, but habitat loss is also important.
Canary rockfish are considered overfished by the Pacific Fisheries Management Council and are
not presently harvested intentionally. However, bycatch is still considered to be a high impact
stressor to rockfish populations of Washington State waters (Palsson et al. 2008). Habitat loss is
also a factor in canary rockfish decline, with rocky habitats (reportedly, there are only 217 km2
in
Puget Sound) being threatened by construction of bridges, sewer lines, cable and pipeline
deployment, and dredge spoil (Palsson et al. 2008). Low oxygen levels as well as pollutant,
chemical, and nutrient loading are also considered significant threats to canary rockfish recovery
(NMFS 2008c).
4.2.10 Puget Sound/Georgia Basin Yelloweye Rockfish
Yelloweye rockfish are very large rockfish that reach up to 3.5 feet (~1 m) in length and about 40
pounds (18 kg) in weight. They are orange-red to orange-yellow in color and may have black on
their fin tips. Their eyes are bright yellow. Adults usually have a light to white stripe on the
lateral line; juveniles have 2 light stripes, one on the lateral line and a shorter one below the
lateral line.
4.2.10.1 Distribution
Yelloweye rockfish occur from Baja California to the Aleutian Islands, but are most common
from central California to Alaska (Love et al. 2002). Individuals from the Puget Sound/Georgia
Basin DPS occur throughout Puget Sound, which encompasses all waters south of a line
connecting Point Wilson on the Olympic Peninsula and Partridge on Whidbey Island; West Point
197
Biological Opinion and Conference Report on Navy NWTT Activities and NMFS’ MMPA Incidental Take
Authorization PCTS FPR-2015-9110
on Whidbey Island, Deception Island, and Rosario Head on Fidalgo Island; and the southern end
of Swinomish Channel between Fidalgo Island and McGlinn Island, and the Strait of Georgia,
which encompasses the waters inland of Vancouver Island, the Gulf Islands, and the mainland
coast of British Columbia.
4.2.10.2 Habitat
Yelloweye rockfish habitat varies based upon life stage. Larvae maintain a pelagic existence but
as juveniles, move into shallow high relief rocky or sponge garden habitats (Eschmeyer et al.
1983; Love et al. 1991; Richards et al. 1985). Juveniles may also associate with floating debris or
pilings (Lamb and Edgell 1986). As adults, yelloweye rockfish move in to deeper habitats.
Individuals have been found in waters as deep as 549 m, but are generally found in waters of less
than 180 m (Eschmeyer et al. 1983; Love et al. 2002). However, adults continue to associate with
rocky, high relief habitats, particularly with caves and crevices, pinnacles, and boulder fields
(Carlson and Straty 1981; Love et al. 1991; O'Connell and Carlisle 1993; Richards 1986;
Yoklavich et al. 2000). Yelloweyes generally occur as individuals, with loose, residential
aggregations infrequently found (Coombs 1979; DeMott 1983; Love et al. 2002). In the Puget
Sound region, sport catch records from the 1970’s indicate that Sucia Island and other islands of
the San Juans as well as Bellingham Bay had the highest concentrations of catches (Delacy et al.
1972; Miller and Borton 1980).
4.2.10.3 Reproduction
Yelloweye rockfish are live bearers with internal fertilization. Copulation occurs between
September and April, with fertilization taking place later as latitude increases (DeLacy et al.
1964; Hitz 1962; Lea et al. 1999; O'Connell 1987; Westrheim 1975; Wyllie Echeverria 1987).
Puget Sound yelloweyes mate between winter and summer, giving birth from spring to late
summer (Washington et al. 1978). Gestation lasts roughly 30 days (Eldridge et al. 2002).
Although yelloweye rockfish were once believed to reproduce annually, evidence exists that
indicate the potential for multiple births per year (MacGregor 1970; Washington et al. 1978).
Females produce more eggs as they grow older and larger, with each individual producing
roughly 300 eggs per year per gram of body weight (1.2 to 2.7 million eggs per year)(Hart 1973;
MacGregor 1970). In addition, older females of several rockfish species may be capable of
provisioning their offspring better than their younger counterparts, meaning that they may be
more a more influential component in a given year’s recruitment success (Sogard et al. 2008).
4.2.10.4 Growth and Development
Larvae are born at 4 to 5 mm in length and maintain a pelagic existence for the first 2 months of
life, before moving to nearshore habitats and settling into rocky reef habitat at about 25 mm in
length (DeLacy et al. 1964; Love et al. 2002; Matarese et al. 1989; Moser 1996a). Yelloweye
growth is thought to vary by latitudinal gradient, with individuals in more northerly regions
198
Biological Opinion and Conference Report on Navy NWTT Activities and NMFS’ MMPA Incidental Take
Authorization PCTS FPR-2015-9110
growing faster and larger. Year class strength appears to be most strongly linked to survival of
the larval stage (Laidig et al. 2007). In general, sexual maturity appears to be reached by 50
percent of individuals by 15 to 20 years of age and 40 to 50 cm in length (Yamanaka and
Kronlund 1997). As with other rockfish, yelloweyes can be long-lived (reported oldest age is 118
years)(Munk 2001). Maximum size has been reported as 910 cm, but asymptotic size in Alaskan
waters for both males and females was estimated to be 690 cm and 659 to 676 cm along British
Columbia (Clemens and Wilby 1961; Love et al. 2005; Rosenthal et al. 1982; Westrheim and
Harling 1975; Yamanaka et al. 2006).
4.2.10.5 Movement
Individuals shift to deeper habitats as they age. Juveniles tend to begin life in shallow rocky reefs
and graduate to deeper rocky habitats as adults. Once adult habitat is established, individuals
tend to remain at a particular site (Coombs 1979; DeMott 1983; Love 1978).
4.2.10.6 Foraging
As with other rockfish species, yelloweye rockfish prey upon different species and size classes
throughout their development. Larval and juvenile rockfish prey upon phyto- and zooplankton
(Lee and Sampson 2009). Adult yelloweyes eat other rockfish (including members of their own
species), sand lance, gadids, flatfishes, shrimp, crabs, and gastropods (Love et al. 2002;
Yamanaka et al. 2006).
4.2.10.7 Hearing and Vocalization
The hearing sensitivities of Georgia Basin yelloweye rockfish have not been studied. However,
they produce low frequency sounds (lower than 900 Hz ) (Sirovic and Demer 2009) and are
believed to be low-frequency hearing generalists (Croll et al. 1999b).
4.2.10.8 Status and Trends
Yelloweye rockfish were proposed for listing on April 23, 2009 (73 FR 18516). Yelloweye
rockfish abundance has been variable in the Puget Sound region over the past 60 years, ranging
from less than 1 percent to greater than 3 percent of samples, although Wallace (2001)
documented large historical population in the Strait of Georgia. The latest samples have been
historic lows in abundance. Perhaps more importantly, age classes appear to have been truncated
to younger, smaller fish, severely hampering the ability of the species to recover from its primary
cause of decline: overfishing (Berkeley et al. 2004).
Prior to World War II, commercial landings of rockfish species generally remained under 20,000
lbs, but sky-rocketed during the war to 375,000 lbs annually and fluctuated between 50,000 and
220,000 lbs until 1970, when landings increased linearly with fishing effort to a peak of 900,000
lbs by 1980 (Palsson et al. 2008). Levels fluctuated after this between 48,000 and 300,000 lbs for
199
Biological Opinion and Conference Report on Navy NWTT Activities and NMFS’ MMPA Incidental Take
Authorization PCTS FPR-2015-9110
the next decade and clearly crashed in the 1990’s, with landings below 30,000 lbs annually. At
the cessation of commercial fishing in 2003, 2,600 lbs of rockfish were harvested. Over the
period of 1965 to 2007, it is estimated that rockfish species has declined by 3 percent per year.
The most recent estimate of yelloweye rockfish abundance in the Puget Sound region was 3,000
individuals, with low abundance through spawning areas (Palsson et al. 2008). Long generation
times reflect intrinsic low productivity for this species. Productivity of the DPS is reduced
further by the decreased abundance in larger, older females which are the most productive. South
Puget Sound populations are no longer viable. The loss of these populations may eventually
result in a contraction of the DPS range. There is no evidence of spatially structured populations
in the DPS. Although larval dispersal through currents may increase connectivity, adult
movement is limited. The truncation of size and age structure may reduce the viability of
offspring.
4.2.10.9 Natural Threats
Interspecies competition, predators, and climactic regimes are the primary natural factors that
depress yelloweye rockfish numbers. Copper and quillback rockfish may compete with
yelloweye rockfish in Puget Sound for available resources (NMFS 2008c). Lingcod, killer
whales, and Steller sea lions are likely predators of yelloweye and other rockfish species
(Beaudreau and Essington 2007; Lance and Jeffries 2007; Love et al. 2002). Yelloweye and
other rockfish appear to be negatively influenced by El Niño conditions, possibly reducing
available prey supply (Black 2009; Harvey 2005; Moser et al. 2000a). Oceanographic conditions
(such as sea level anomalies and nearshore temperature conditions) appear to strongly influence
the strength of each year’s recruitment (Laidig et al. 2007). Rates of natural mortality have been
reported to range from 2 to 4.6 percent annually (Wallace 2007; Yamanaka and Kronlund 1997).
4.2.10.10 Anthropogenic Threats
Overfishing is considered the primary cause of yelloweye rockfish decline throughout their
range, including in Washington State and British Columbian waters (NMFS 2008c; Wallace
2007). Although commercial harvesting of the species has ended, bycatch is still considered to be
a high impact stressor to rockfish populations of Washington State waters (Palsson et al. 2008).
It has been estimated that yelloweye rockfish have fallen 30 percent in abundance within one-
third of a generation in the past few decades, an astonishing rate of decline.
Habitat loss is also a factor in yelloweye decline, with rocky habitats (reportedly, there are only
217 km2
in Puget Sound) being threatened by construction of bridges, sewer lines, cable and
pipeline deployment, and dredge spoil (Palsson et al. 2008). Anoxic conditions and chemical
contamination are also considered threats to yelloweye rockfish recovery (NMFS 2008c).
200
Biological Opinion and Conference Report on Navy NWTT Activities and NMFS’ MMPA Incidental Take
Authorization PCTS FPR-2015-9110
4.2.11 Puget Sound/Georgia Basin Bocaccio
Bocaccio were proposed for listing on April 23, 2009 (74 FR 18516). Among rockfish of the
Puget Sound, bocaccio appear to have undergone a particular decline (MacCall and He 2002b).
This is likely because of the removal of the largest, most fecund individuals of the population
due to overfishing and the frequent failure of recruitment classes, possibly because of
unfavorable climactic/oceanographic conditions (MacCall and He 2002b).
4.2.11.1 Distribution and Populations
The distribution of bocaccio includes Stepovac Bay on the Alaska Peninsula to Punta Blanca in
central Baja California (Love et al. 2002). The bocaccio that occur in Puget Sound/Georgia Basin
are listed as endangered (75 FR 22276). The listing includes bocaccio throughout Puget Sound,
which encompasses all waters south of a line connecting Point Wilson on the Olympic Peninsula
and Partridge on Whidbey Island; West Point on Whidbey Island, Deception Island, and Rosario
Head on Fidalgo Island; and the southern end of Swinomish Channel between Fidalgo Island and
McGlinn Island, and the Strait of Georgia, which encompasses the waters inland of Vancouver
Island, the Gulf Islands, and the mainland coast of British Columbia.
According to genetic analyses, there may be three general population regions of bocaccio along
the west coast: a Queen Charlotte Island population, one from Vancouver Island to Point
Conception (CA), and a third south of Point Conception. The Puget Sound/Georgia Basin DPS is
distinct from the southern and northern coastal DPSs. Relative to other rockfishes, bocaccio have
a greater potential to move long distances, suggesting the DPS for bocaccio could encompass a
greater area than a DPS for more sedentary species. It is likely that there is some regional overlap
between the DPSs, but the accepted western boundary is located at the Victoria sill because of
this oceanographic feature’s ability to restrict larval dispersal. The Puget Sound DPS can further
be divided into five Basins based on the distribution of each species, geographic conditions and
habitat features: (1) The San Juan/Strait of Juan de Fuca Basin, (2) Main Basin, (3) Whidbey
Basin, (4) South Puget Sound, and (5) Hood Canal. Prior to severe population reductions,
bocaccio appeared to frequent the Tacoma Narrows in Washington State (DeLacy et al. 1964;
Haw and Buckley 1971; Miller and Borton 1980).
4.2.11.2 Habitat and Movement
Preferred bocaccio habitat is largely dependent upon the life stage of an individual. Larvae and
young juveniles tend to be found in deeper offshore regions (1 to 148 km offshore), but
associated with the surface and occasionally with floating kelp mats (Emery et al. 2006;
Hartmann 1987; Love et al. 2002). As individuals mature into older juveniles and adults, they
transition into shallow waters and settle to the bottom, preferring algae-covered rocky, eelgrass,
or sand habitats and aggregating into schools (Eschmeyer et al. 1983; Love et al. 1991). After a
few weeks, fish move into slightly deeper waters of 18 to 30 m and occupy rocky reefs (Carr
201
Biological Opinion and Conference Report on Navy NWTT Activities and NMFS’ MMPA Incidental Take
Authorization PCTS FPR-2015-9110
1983; Eschmeyer et al. 1983; Feder et al. 1974; Johnson 2006; Love and Yoklavich 2008). As
adults, bocaccio may be found in depths of 12 to 478 m, but tend to remain in shallow waters on
the continental shelf (20 to 250 m), still associating mostly with reefs or other hard substrate, but
may move over mud flats (Feder et al. 1974; Kramer and O'Connell 1995; Love et al. 2005; Love
et al. 2006; Love et al. 2002; Love and York 2005). Artificial habitats, such as platform
structures, also appear to be suitable habitat for bocaccio (Love and York 2006). Adults may
occupy territories of 200 to 400 hectares, but can venture outside of this territory (Hartmann
1987). Adults are not as benthic as juveniles and may occur as much as 30 m above the bottom
and move 100 m vertically during the course of a day as they move between different areas
(Love et al. 2002; Starr et al. 2002).
4.2.11.3 Reproduction
Bocaccio are live-bearers with internal fertilization. Once females become mature (at 54 to 61
cm total length), they produce 20,000 to 2.3 million eggs annually, with the number increasing as
females age and grow larger (Echeverria 1987; Hart 1973; Love et al. 2002). However, either sex
has been known to attain sexual maturity as small as 35 cm or 3 years of age and, in recent years
as populations have declined, average age at sexual maturity may have declined as well
(Echeverria 1987; Hart 1973; Love et al. 2002; MacCall 2002). Mating occurs between August
and November, with larvae born between January and April (Love et al. 2002; Lyubimova 1965;
MacCall and He 2002b; Moser 1967; Westrheim 1975; Wyllie Echeverria 1987).
4.2.11.4 Growth
Upon birth, bocaccio larvae measure 4 to 5 mm in length. These larvae move into pelagic waters
as juveniles when they are 1.5 to 3 cm and remain in oceanic waters from 3.5 to 5.5 months after
birth (usually until early June), where they grow at ~0.5 to 1 mm per day (Love et al. 2002;
MacCall 2003; MacCall and He 2002b; Matarese et al. 1989; Moser 1967; Woodbury and
Ralston 1991). However, growth can vary from year-to-year (Woodbury and Ralston 1991).
Once individuals are 3 to 4 cm in length, they return to nearshore waters, where they settle into
bottom habitats. Females tend to grow faster than males, but fish may take 5 years to reach
sexual maturity (MacCall 2003). Individuals continue to grow until they reach maximum sizes of
91 cm, or 9.6 kg, at an estimated maximum age of 50 years (Andrews et al. 2005; Eschmeyer et
al. 1983; Halstead et al. 1990; Love et al. 2002; Piner et al. 2006; Ralston and Ianelli 1998).
However, individuals tend to grow larger in more northerly regions (Dark et al. 1983).
4.2.11.5 Foraging
Prey of bocaccio vary with fish age, with bocaccio larvae starting with larval krill, diatoms, and
dinoflagellates (Love et al. 2002). Pelagic juveniles consume fish larvae, copepods, and krill,
while older, nearshore juveniles and adults prey upon rockfishes, hake, sablefish, anchovies,
lanternfish, and squid (Love et al. 2002; Reilly et al. 1992).
202
Biological Opinion and Conference Report on Navy NWTT Activities and NMFS’ MMPA Incidental Take
Authorization PCTS FPR-2015-9110
4.2.11.6 Vocalizations and Hearing
The hearing sensitivities of Georgia Basin bocaccio have not been studied. However, they
produce low frequency sounds (lower than 900 Hz) (Sirovic and Demer 2009) and are believed
to be low-frequency hearing generalists (Croll et al. 1999b).
All fish have two sensory systems that are used to detect sound in the water including the inner
ear, which functions very much like the inner ear found in other vertebrates, and the lateral line,
which consists of a series of receptors along the body of the fish (Popper 2008c). The inner ear
generally detects higher frequency sounds while the lateral line detects water motion at low
frequencies (below a few hundred Hz) (Hastings et al. 1996b). A sound source produces both a
pressure wave and motion of the medium particles (water molecules in this case), both of which
may be important to fish. Fish detect particle motion with the inner ear. Pressure signals are
initially detected by the gas-filled swim bladder or other air pockets in the body, which then re-
radiate the signal to the inner ear (Popper 2008c). Because particle motion attenuates relatively
quickly, the pressure component of sound usually dominates as distance from the source
increases.
The lateral line system of a fish allows for sensitivity to sound (Hastings and Popper 2005). This
system is a series of receptors along the body of the fish that detects water motion relative to the
fish that arise from sources within a few body lengths of the animal. The sensitivity of the lateral
line system is generally from below 1 Hz to a few hundred Hz (Coombs and Montgomery 1999;
Popper and Schilt 2009). The only study on the effect of exposure to sound on the lateral line
system (conducted on one freshwater species) suggests no effect on these sensory cells by
intense pure tone signals (Hastings et al. 1996b).
While studies on the effect of sound on the lateral line are limited, the work of Hasting et al.
(1996b) showing limited sensitivity to within a few body lengths and to sounds below a few
hundred Hz, make the effect of the mid-frequency sonar of the action unlikely to affect a fish’s
lateral line system. Therefore, further discussion of the lateral line in this analysis in
unwarranted. Broadly, fish can be categorized as either hearing specialists or hearing generalists
(Scholik and Yan 2002a). Fish in the hearing specialist category have a broad frequency range
with a low auditory threshold due to a mechanical connection between an air filled cavity, such
as a swim bladder, and the inner ear.
Specialists detect both the particle motion and pressure components of sound and can hear at
levels above 1 kilohertz (kHz). Generalists are limited to detection of the particle motion
component of low-frequency sounds at relatively high sound intensities (Amoser and Ladich
2005). It is possible that a species will exhibit characteristics of generalists and specialists and
will sometimes be referred to as an “intermediate” hearing specialist. For example, most
damselfish are typically categorized as generalists, but because some larger damselfish have
203
Biological Opinion and Conference Report on Navy NWTT Activities and NMFS’ MMPA Incidental Take
Authorization PCTS FPR-2015-9110
demonstrated the ability to hear higher frequencies expected of specialists, they are sometimes
categorized as intermediate. Of the ESA-listed fish species with distributions occurring in the
NWTT Action Area for which hearing sensitivities are known, none are hearing specialists.
4.2.11.7 Status and Trends
Since the 1980s, bocaccio have declined precipitously. Prior to World War II, commercial
landings of rockfish species generally remained under 20,000 lbs, but sky-rocketed during the
war to 375,000 lbs annually and fluctuated between 50,000 and 220,000 lbs until 1970, when
landings increased linearly with fishing effort to a peak of 900,000 lbs by 1980 (Palsson et al.
2008). Levels fluctuated after this between 48,000 and 300,000 lbs for the next decade and
crashed in the 1990’s, with landings below 30,000 lbs annually. At the cessation of commercial
fishing in 2003, 2,600 lbs of rockfish were harvested. Similar trends are seen in recreational
landings from Puget Sound (WDF 1975-1986).
Bocaccio resistance to depletion and recovery is also hindered by demographic features (Love et
al. 1998a). Bocaccio are long-lived fishes, taking several years to reach sexual maturity and
becoming more fecund with age (Dorn 2002). As harvesting targeted the largest individuals
available, bocaccio have become less capable of recovering population numbers (Love et al.
1998b). At present, in the complete absence of directed or bycatch fishing pressure, it is
estimated that bocaccio populations would have to have frequent good recruitment to restrain
their present decline (Tolimieri and Levin 2005). In addition, bocaccio reproduction appears to
be characterized by frequent recruitment failures, punctuated by occasional high success years
(Love et al. 1998b; MacCall and He 2002b). Over the past 30 years, 1977, 1984, and 1988 are
the only years in which recruitment appears to have been significant successes (it should be
noted that 1999 and 2002 also appear to have been strong, but survivorship into maturity is still
pending).
Recruitment success appears to be linked to oceanographic/climactic patterns and may be related
to cyclic warm/cool ocean periods, with cool periods having greater success (Love et al. 1998b;
MacCall 1996; Moser et al. 2000b; Sakuma and Ralston 1995). Overall, bocaccio have the
highest variability of recruitment of any rockfish studied to date (MacCall and He 2002b;
Tolimieri and Levin 2005).
The rate of decline for rockfish in Puget Sound has been estimated at ~3 percent annually for the
period 1965 to 2007. Various rebuilding estimates for bocaccio populations have predicted
recovery, but require long periods (98 to 170 years) and assume no mortality from fishing
(intentional harvests are closed, but bycatch still occurs) (MacCall 2008; MacCall and He 2002a;
NMFS 2008c). Although a population increase has been detected more recently, it is likely that
this is due to a very strong recruitment event in 1999. Because of a lack of systematic sampling
targeting rare rockfish, absolute estimates of population size cannot be generated with accuracy.
204
Biological Opinion and Conference Report on Navy NWTT Activities and NMFS’ MMPA Incidental Take
Authorization PCTS FPR-2015-9110
A rough estimate of the order of magnitude of population size for all rockfish is determined to be
less than 10,000 in the Georgia Basin and less than 1,000 in Puget Sound Proper (Main Basin,
Whidbey Basin, SPS and Hood Canal) (74 FR 18516). Given the species composition data and
abundance estimates from other species (Palsson et al. 2009), it is estimated the Puget Sound
DPS of bocaccio may be as few as 45 individuals. Sporadic recruitment results in an inconsistent
growth trajectory. Even in absence of exploitation, bocaccio have a low intrinsic growth rate,
1.01 which suggests that populations of bocaccio are not capable of supporting continuous
harvest.
4.2.11.8 Natural Threats
Interspecies competition, predators, and climactic regimes are the primary natural factors that
depress bocaccio numbers. Copper and quillback rockfish may compete with bocaccio in Puget
Sound for available resources (NMFS 2008c). King salmon, lingcod, terns and other seabirds,
harbor seals, and Steller sea lions are known predators of bocaccio and other rockfish species
(Beaudreau and Essington 2007; Lance and Jeffries 2007; Love et al. 2002). Bocaccio and other
rockfish appear to be negatively influenced by El Niño conditions, possibly reducing available
prey supply (Harvey 2005; Moser et al. 2000a).
4.2.11.9 Anthropogenic Threats
Although overfishing is the primary reason for bocaccio being proposed as a listed species,
bycatch and habitat loss are also human-related factors that have likely led to bocaccio decline.
Although a frequent species captured in fisheries during the late 1970’s, bocaccio were not
recorded from any recreational surveys from 1996 to 2007 (Palsson et al. 2008; WDF 1975
1986). Apart from commercial fishing, recreational fishing (even catch-and-release) appears to
incur significant mortality on bocaccio and other rockfishes (Schroeder and Love 2002). The
species is considered overfished by the Pacific Fisheries Management Council and is not
presently harvested intentionally. However, bycatch is still considered to be a high impact
stressor to rockfish populations of Washington State waters (Palsson et al. 2008).
Habitat loss is also a factor in bocaccio decline, with rocky habitats (reportedly, there are only
217 km2
in Puget Sound) being threatened by construction of bridges, sewer lines, cable and
pipeline deployment, and dredge spoil (Palsson et al. 2008). Loss of kelp, which is valuable to
juvenile fish recruitment, as well as anoxic conditions, exacerbate habitat loss (NMFS 2008c).
4.2.12 Southern DPS of Pacific Eulachon
Eulachon, Thaleichthys pacificus, (commonly called smelt, candlefish, or hooligan) are a small,
anadromous fish from the eastern Pacific Ocean. The Southern DPS of eulachon was listed as
threatened on March 18, 2010 (75 FR 13012). They are distinguished by the large canine teeth
on the vomer, a bone in the roof of the mouth, and 18 to 23 rays in the anal fin. Like Pacific
205
Biological Opinion and Conference Report on Navy NWTT Activities and NMFS’ MMPA Incidental Take
Authorization PCTS FPR-2015-9110
salmon they have an adipose fin; it is sickle-shaped. The paired fins are longer in males than in
females. All fins have well-developed breeding tubercles (raised tissue "bumps") in ripe males,
but these are poorly developed or absent in females. Adult coloration is brown to blue on the
back and top of the head, lighter to silvery white on the sides, and white on the ventral surface;
speckling is fine, sparse, and restricted to the back. They feed on plankton but only while at sea.
Eulachon typically spend 3 to 5 years in saltwater before returning to freshwater to spawn from
late winter through mid-spring. During spawning, males have a distinctly raised ridge along the
middle of their bodies. Eggs are fertilized in the water column. After fertilization, the eggs sink
and adhere to the river bottom, typically in areas of gravel and coarse sand. Most eulachon adults
die after spawning. Eulachon eggs hatch in 20 to 40 days. The larvae are then carried
downstream and are dispersed by estuarine and ocean currents shortly after hatching. Juvenile
eulachon move from shallow nearshore areas to mid-depth areas. Within the Columbia River
Basin, the major and most consistent spawning runs occur in the mainstem of the Columbia
River as far upstream as the Bonneville Dam, and in the Cowlitz River.
4.2.12.1 Distribution
The Southern DPS of Pacific eulachon consists of populations spawning in rivers south of the
Nass River in British Columbia, Canada, to, and including, the Mad River in California (75 FR
13012). There are 10 subpopulations: Klamath River, Columbia River, Fraser River, Knight
Inlet, Kingcome Inlet, Rivers inlet, Dean Channel, Gardner Canal, Douglas Channel and Skeena
River.
Eulachon is an anadromous species that spawns in the lower portions of certain rivers draining
into the northeastern Pacific Ocean ranging from Northern California to the southeastern Bering
Sea in Bristol Bay, Alaska (NMFS 2010a; Schultz and DeLacy 1935). Eulachon have been
described as “common” in Grays Harbor and Willapa Bay on the Washington coast, “abundant”
in the Columbia River, “common” in Oregon’s Umpqua River, and “abundant” in the Klamath
River in northern California. They have been described as “rare” in Puget Sound and Skagit Bay
in Washington; Siuslaw River, Coos Bay, and Rogue River in Oregon; and Humboldt Bay in
California (Emmett et al. 1991a). However, Hay and McCarter (2000) and Hay (2002) identified
33 eulachon spawning rivers in British Columbia and 14 of these were classified as supporting
regular yearly spawning runs.
4.2.12.1.1 Distribution in the NWTT Action Area
The Southern DPS of Pacific eulachon may be present in the inland and offshore waters of the
NWTT Action Area.
206
Biological Opinion and Conference Report on Navy NWTT Activities and NMFS’ MMPA Incidental Take
Authorization PCTS FPR-2015-9110
4.2.12.2 Vocalizations and Hearing
We do not have specific information on hearing in eulachon, but we assume that they are hearing
generalists whose hearing sensitivities would be similar to salmon. Species in the family
Salmonidae have similar auditory systems and hearing sensitivities (Popper 1977; Popper et al.
2007; Wysocki et al. 2007). Most of the data available on this group resulted from studies of the
hearing capability of Atlantic salmon (Salmo salar), which is a “hearing generalist” with a
relatively poor sensitivity to sound (Hawkins and Johnstone 1978). Based on the information
available, we assume that the eulachon considered in this consultation have hearing sensitivities
ranging from less than 100 Hz to about 580 Hz (Hawkins and Johnstone 1978; Knudsen et al.
1992; Knudsen et al. 1994; Popper 2008c).
4.2.12.3 Status and trends
Spawning runs from California to southeastern Alaska have declined by 97.7 percent in the past
20 years relative to the prior period. The Columbia River population, historically the largest, has
experienced a severe decline in eulachon returns. A loss of the Columbia River eulachon
population and any dependent coastal spawning populations could represent the loss of the
species throughout its range in the United States, as well as the loss of substantial portion of its
historical range. The most recent estimates from the Columbia River (2014) indicate an increase
in eulachon spawning stock biomass from previous years (NMFS 2014). The populations in the
Klamath River, Mad River, Redwood Creek and the Sacramento River are likely extirpated or
nearly so.
4.2.12.4 Natural Threats
Eulachon have numerous avian predators including harlequin ducks, pigeon guillemots, common
murres, mergansers, cormorants, gulls, and eagles. Marine mammals such as humpback whales,
orcas, dolphins, Steller sea lions, California sea lions, northern fur seals, harbor seals, and beluga
whales are known to feed on eulachon. During spawning runs, bears and wolves have been
observed consuming eulachon. Fishes that prey on eulachon include white sturgeon, spiny
dogfish, sablefish, salmon sharks, arrowtooth flounder, salmon, Dolly Varden charr, Pacific
halibut, and Pacific cod. In particular, eulachon and their eggs seem to provide a significant food
source for white sturgeon in the Columbia and Fraser Rivers (75 FR 13012).
4.2.12.5 Anthropogenic Threats
Southern eulachon are primarily threatened by increasing temperatures in the marine, coastal,
estuarine, and freshwater environments of the Pacific Northwest that are at least causally related
to climate change; dams and water diversions, water quality degradation, dredging operations in
the Columbia and Fraser Rivers; commercial, recreational, and subsistence fisheries in Oregon
and Washington that target eulachon; and bycatch in commercial fisheries. The high lipid content
of eulachon suggests they are susceptible to absorption of lipophilic organic contaminants.
207
Biological Opinion and Conference Report on Navy NWTT Activities and NMFS’ MMPA Incidental Take
Authorization PCTS FPR-2015-9110
Contaminants considered of most concern include: 1) synthetic chlorinated organic chemicals,
such as hexachlorobenzene, DDTs, and the polychlorinated biphenyls (PCBs); 2) polycyclic
aromatic hydrocarbons (PAHs) from petroleum and creosoted pilings; 3) dioxins and a host of
other organic compounds; 4) metals such as mercury, arsenic, and lead; and 5) endocrine-
disrupting compounds and new toxics like PBDE.
Eulachon are particularly vulnerable to capture in shrimp fisheries in the United States and
Canada as the marine areas occupied by shrimp and eulachon often overlap. In Oregon, the
bycatch of various species of smelt (including eulachon) has been as high as 28 percent of the
total catch of shrimp by weight (Hannah and Jones 2007). There are directed fisheries in Alaska
state waters for eulachon in Upper Cook Inlet, the Copper River area, and in southeast Alaska.
There has been little commercial activity in recent years, due to either lack of interest or closures
resulting from concerns over diminished spawning runs, but there is potential for substantial
amounts of harvest (Ormseth and Vollenweider 2007).
4.2.13 Chinook Salmon
Chinook salmon are the largest of any salmon, with adults often exceeding 40 pounds (18 kg);
individuals over 120 pounds (54 kg) have been reported. Chinook mature at about 36 inches and
30 pounds. Chinook salmon are blue-green back with silver flanks at sea, with small black spots
on both lobes of the tail, and black pigment along the base of the teeth.
4.2.13.1 Species Distribution
The Chinook salmon’s historical range in North America extended from the Ventura River in
California to Point Hope, Alaska. The natural freshwater range for Chinook salmon extends
throughout the Pacific Rim of North America. This species has been identified from the San
Joaquin River in California to the Mackenzie River in northern Canada (Healey 1991). The
oceanic range encompasses Washington, Oregon, California, throughout the north Pacific Ocean,
and as far south as the U.S./Mexico border (PFMC 2000a). Because of similarities in the life
history and threats to the survival and recovery of the Chinook salmon “species” (as that term is
defined in section 3 of the ESA) or evolutionary significant units (ESUs) that are included in this
Opinion, we summarize the threats to Chinook salmon and their hearing sensitivity generally.
Then we separately discuss specific information on their listing status, population status and
trends, and impacts that are not shared for each of these species.
Chinook salmon distribute in the North Pacific Ocean north of about 40º North latitude where
they may remain for 1 to 6 years, although 2 to 4 years are more common. Although salmon
generally occur near the surface (within 8 to 10 meters of the surface), Chinook salmon have
been caught at depths up to 110 meters.
208

Biological Opinion and Conference Report on Navy NWTT Activities and NMFS’ MMPA Incidental Take
Authorization PCTS FPR-2015-9110
4.2.13.1.1 Occurrence in the NWTT Action Area
All Chinook salmon ESUs may occur in the Offshore portion of the NWTT Action Area.
Additionally, near shore critical habitat for the Puget Sound ESU is located in the Inland Waters
portion of the Action Area. The Puget Sound Chinook salmon is the only ESU occurring in both
the Inland Waters and Offshore portions of the Action Area. The remaining ESUs will only
occur in the Offshore Area. Chinook salmon may also migrate and enter Behm Canal.
4.2.13.2 Reproduction
The general Chinook salmon life cycle spans fresh and marine waters, with one reproductive
event per adult (Chinook salmon are semelparous and die after spawning). Spawning migrations
generally occur in the spring and fall, although the precise timing of spawning migrations and
spawning varies across populations and can vary within populations. Temperature and stream
flow can significantly influence the timing of upstream migrations and spawning, and the
selection of spawning habitat (Geist et al. 2009; Hatten and Tiffan 2009). For Klamath River
Chinook, temperatures above 21.9º C (mean average body temperature), 20.6º C (mean
minimum daily body temperature), or 23.1º C (mean maximum daily body temperature)
completely inhibited upstream spawning migration in rivers; these values are close to the upper
lethal limits for this and other salmonid species (Strange 2010). A general latitudinal cline is
apparent across the species range with spawning typically occurring earlier in the spring/summer
at northern latitudes and later in southern latitudes (Healey 1991).
On the spawning grounds, mate competition is intense with males competing to fertilize eggs and
females competing for optimal nest site selection. Once fertilization occurs, female Chinook
salmon bury the eggs in nests, termed “redds”, and guard the nests until their death, which
generally occurs a couple days later to a couple weeks after spawning. A female generally
deposits eggs in more than one depression within a redd, excavating stream rock as she moves
upstream, increasing the size of her redd until all eggs are deposited.
Size and age at maturity is partially under genetic control, but can be influenced by environment
and migration behavior (Roni and Quinn 1995). Generally, ocean-type salmon are at sea longer
than their stream-type counterparts and tend to be larger in size at spawning. Body size can be
important in determining reproductive success in terms of nest selection and mating competition
(Foote 1990). Chinook salmon age at maturity ranges from 1 to 7 years with most returning to
spawn between 3 and 4 years of age.
4.2.13.3 Habitat
The time necessary for egg incubation until emergence of alevins in freshwater varies among
basins and among years within a basin, and is closely correlated to water temperatures such that
low temperatures can prolong incubation. Incubation generally takes a couple of months or more.
209
Biological Opinion and Conference Report on Navy NWTT Activities and NMFS’ MMPA Incidental Take
Authorization PCTS FPR-2015-9110
Alevin (also called “yolk-sac” fry) remain buried until their yolk-sac is absorbed, at which time
they become free swimming fry. Egg to fry survival can also vary widely across basins, years,
and habitat conditions within a basin. In general, the survival of eggs and alevin, and the fitness
of emerging fry are affected by sediment loading, intergravel water flow and dissolved oxygen
levels, gravel composition, spawn timing, floods, redd and spawner density, and water
temperatures.
Once emerged, fry behavior varies among populations and among individuals within races. Some
juvenile Chinook salmon rear in freshwater for a few weeks to a few years, others move
immediately downstream to coastal waters where they rear in estuaries for a few weeks to
months, while others migrate directly to ocean waters. Stream-type Chinook salmon do not
migrate to sea until the spring following emergence, and ocean-type Chinook salmon migrate to
the ocean within their first year. Generally, most fry move at night probably to reduce detection
by predators, although some fish will move downstream during daylight. Not all movement is
volitional as stream flows often displace fry to downstream areas after emergence. Density-
dependent factors such as space, prey, or stream flows may influence the outmigration behavior
of individual juvenile Chinook salmon.
While in fresh water, juvenile Chinook salmon are often found in the lower reaches of a river
near its estuary, where they inhabit river margins in areas of shallow water, near woody debris,
or other areas of low water velocity. As juveniles grow in size, they tend to move away from the
shoreline to deeper waters where the velocity is higher (Healey 1991). The transformation from
the freshwater fry/parr juvenile stage to smolt involves multiple physiological changes including
increases in: body silvering, hypoosmotic regulatory capability, salinity tolerance and preference,
growth rate, oxygen consumption, ammonia production, endocrine activity (e.g., activation of
thyroid, interregnal and pituitary growth hormone cells), and gill Na+, K
+-ATPase activity.
Several factors can affect the smoltification process, not only at the interface between freshwater
and saltwater, but higher in the watershed as the process of transformation begins long before
fish enter saltwater, including exposure to heavy metals and elevated water temperatures
(Wedemeyer et al. 1980).
Life at sea varies according to population, race, and age-class. Chinook salmon tend to remain at
sea between 1 and 6 years, with most fish returning to freshwater after 2 to 4 years at sea.
Fishery catches indicate that ocean- and stream-type fish exhibit divergent migratory pathways
while in the ocean (Healey 1983; Healey 1991). Ocean-type Chinook salmon tend to be found
along the coastline, whereas stream-type Chinook salmon are found in the open ocean far from
the coast (Healey 1983; Healey 1991). Juvenile Chinook along the Pacific northwest, Canada,
and Alaska tend to remain within roughly 55 km (most within 28 km) of the coast (NPFMC
1990; PFMC 2000b). However, Chinook generally remain within 320 km of the coast (NPFMC
1990). Concentrations are known to occur around transient upwelling features (PFMC 2000b).
210
Biological Opinion and Conference Report on Navy NWTT Activities and NMFS’ MMPA Incidental Take
Authorization PCTS FPR-2015-9110
Individuals hatching in rivers south of Cape Blanco, Oregon tend to stay south of this point,
while those outmigrating north of this point tend to move north into the Gulf of Alaska through
coastal migratory corridors (PFMC 2000b).
Generally, Chinook salmon outmigrants (termed smolts) are about 5 to 13 cm long when they
enter saline (often brackish) waters. The process of smoltification is physiologically demanding,
involving osmoregulation—the maintenance of osmotic pressure as the fish enters waters of
increased salinity, which is necessary to maintain body fluid concentration and composition to
maintain homeostasis. Smaller fish tend to remain closer to shore, while larger fish will enter
marine waters. The distribution of fish in this stage does not appear to be correlated with
salinities, as most fish can survive immediate transfer from freshwater to saltwater (~30 ppm
salinity; (Healey 1991). Although temperature ranges vary from 1° to 15° C, few individuals are
found in waters below 5° C (MBC 1987; PFMC 2000b). Chinook salmon originating from the
same freshwater region have similar age-dependent marine distributions (even if associated with
different runs), which are distinct from the distributions of Chinook from other freshwater
regions (Weitkamp 2009). This distribution does not appear to be influenced by oceanographic
variability (Weitkamp 2009). Older individuals appear to disperse more broadly than their
younger counterparts (Weitkamp 2009). Adults do not appear to exhibit a preference in
substrates and may be found down to 250 m (Beauchamp et al. 1983).
4.2.13.4 Feeding
Chinook salmon feed on a variety of prey organisms depending upon life stage. Adult oceanic
Chinook salmon eat small fish, amphipods, and crab megalops (Brodeur et al. 2010; Healey
1991). Fish, in particular herring, make up the largest portion of an adult Chinook salmon’s diet.
In estuaries, Chinook salmon smolts tend to feed on the chironomid larvae and pupae Daphnia,
Eogammarus, Corphium and Neomysis, as well as juvenile herring, sticklebacks and other small
fish. In freshwater, Chinook salmon juveniles feed on adult and larval insects including
terrestrial and aquatic insects such as dipterans, beetles, stoneflies, chironomids, and
plecopterans (Healey 1991). During the first year of marine life, Puget Sound Chinook transition
from nearshore foraging on insects and amphipods during June to offshore foraging on crab
larvae and fish, such as herring during July through September (Duffy et al. 2010a).
4.2.13.5 Hearing
Based on the information available, we assume that the Chinook salmon considered in this
consultation have hearing sensitivities ranging from less than 100 Hz to about 580 Hz (Hawkins
and Johnstone 1978; Knudsen et al. 1992; Knudsen et al. 1994; Popper 2008c).
211
Biological Opinion and Conference Report on Navy NWTT Activities and NMFS’ MMPA Incidental Take
Authorization PCTS FPR-2015-9110
4.2.13.6 Natural Threats
Chinook salmon are exposed to high rates of natural predation during freshwater rearing and
migration stages, as well as during ocean migration. In general, Chinook salmon are prey for
pelagic fishes, birds, and marine mammals, including harbor seals, sea lions, and killer whales.
There have been recent concerns that the increasing size of tern, seal, and sea lion populations in
the Pacific Northwest may have reduced the survival of some salmon populations; 10 percent of
salmonid smolts are eaten by Caspian terns and double-crested cormorants annually in the
Columbia River estuary (NMFS 2011e). This estimate may be higher, with Sebring et al. (2013)
finding that more than eight million released fall-run Chinook salmon (up to 35 percent of
available salmon) are consumed by cormorants and terns. Invasive fishes also threaten the
survival and recovery of Pacific salmonids by competing directly for resources, altering food
webs and trophic structures, and altering evolutionary trajectories (NMFS 2011e).
4.2.13.7 Anthropogenic Threats
Chinook salmon have declined under the combined effects of fishery over-harvest; competition
from fish raised in hatcheries and native and non-native exotic species; dams that block their
migrations and alter river hydrology; gravel mining that impedes their migration and alters the
dynamics (hydrogeomorphology) of the rivers and streams that support juveniles; water
diversions that deplete water levels in rivers and streams; destruction or degradation of riparian
habitat that increase water temperatures in rivers and streams sufficient to reduce the survival of
juvenile Chinook salmon; and land use practices (logging, agriculture, urbanization) that destroy
wetland and riparian ecosystems while introducing sediment, nutrients, biocides, metals, and
other pollutants into surface and ground water and degrade water quality in the freshwater,
estuarine, and coastal ecosystems throughout the Pacific northwest (Buhle et al. 2009).
Population declines have resulted from several human-mediated causes, but the greatest negative
influence has likely been the establishment of waterway obstructions such as dams, power plants,
and sluiceways for hydropower, agriculture, flood control, and water storage. These structures
have blocked salmon migration to spawning habitat or resulted in direct mortality and have
eliminated entire salmon runs as a result. While some of these barriers remain, others have been
reengineered, renovated, or removed to allow for surviving runs to access former habitat, but
success has been limited. These types of barriers alter the natural hydrograph of basins, both
upstream and downstream of the structure, and significantly reduce the availability and quality of
spawning and rearing habitat (Hatten and Tiffan 2009). Many streams and rivers, particularly in
urban or suburban areas, suffer from streamside development, which contributes sediment,
chemical pollutants from pesticide applications and automobile or industrial activities, altered
stream flows, loss of streamside vegetation and allochthonous materials to name a few. These
factors can directly cause mortality, reduce reproductive success, or affect the health and fitness
of all salmon life stages.
212
Biological Opinion and Conference Report on Navy NWTT Activities and NMFS’ MMPA Incidental Take
Authorization PCTS FPR-2015-9110
Artificial propagation of hatchery fish has had profound consequences on the viability of some
natural salmon populations, but there are potential benefits to the artificial production of salmon
as well. Potential adverse effects of artificial propagation include: a decline in the natural
population from the taking of wild brood stock for artificial propagation, the genetic erosion of
populations (introgression, hybridization), an increase incidence of disease to and increased rates
of competition with and predation on naturally spawned salmon populations. Potential benefits to
artificial propagation include the bolstering of the numbers of naturally spawning fish, the
conservation of genetic resources, and guarding against the catastrophic loss of naturally
spawned populations at critically low abundance levels.
Fishing for salmon has also negatively impacted salmon populations. Fishing reduces the number
of individuals within a population and can lead to uneven exploitation of certain populations and
size classes (Mundy 1997; Reisenbichler 1997). Targeted fishing of larger individuals results in
excluding the most fecund individuals from spawning (Reisenbichler 1997). Genetic changes
that promote smaller body sizes have occurred in heavily exploited populations in response to
size-selective harvest pressures (Mundy 1997; Reisenbichler 1997; Swain et al. 2007). Age at
maturity can also be accelerated by fishing pressure (Reisenbichler 1997). Pacific salmon species
are exposed to a number of contaminants throughout their range and life history cycle.
Exposure to pollution is also of significant concern for all life stages, but is likely particularly
significant for freshwater life stages. Organic pollutants, especially PCBs, DDT and its
congeners, pesticides, and endocrine disruptors are particularly concerning. These chemicals can
inhibit smell, disrupt reproductive behavior and physiology, impair immune function, and lead to
mortality through impairment of water balance when traveling between fresh- and saltwater
systems (Varanasi et al. 1993a; Varanasi et al. 1993b). Diffuse and extensive population centers
contribute increase contaminant volumes and variety from such sources as wastewater treatment
plants and sprawling development. Urban runoff from impervious surfaces and roadways often
contains oil, copper, pesticides, PAHs, and other chemical pollutants and flow into surface
waters. Point and nonpoint pollution sources entering rivers and their tributaries affect water
quality in available spawning and rearing habitat for salmon. Juvenile salmonids that inhabit
urban watersheds often carry high contaminant burdens, which is partly attributable to the
biological transfer of contaminants through the food web (Brown et al. 1985; Stein et al. 1992;
Varanasi et al. 1993a).
4.2.13.8 Chinook Salmon ESUs
Each Chinook salmon ESU is treated as a separate species under the ESA (NMFS 2005c). Of
these listed Chinook salmon ESUs, two are endangered (Sacramento River winter-run and Upper
Columbia River spring-run) and seven are threatened (Snake River spring/summer-run, Snake
River fall-run, Central Valley spring-run, California coastal, Puget Sound, Lower Columbia
213
Biological Opinion and Conference Report on Navy NWTT Activities and NMFS’ MMPA Incidental Take
Authorization PCTS FPR-2015-9110
River, and Upper Willamette River) (70 FR 37160). The distribution, as well as the status and
trends, of the Chinook salmon ESUs considered in this Opinion are discussed below.
4.2.13.8.1 Puget Sound Chinook Salmon ESU
NMFS listed Puget Sound Chinook salmon as threatened in 1999 (64 FR 14308); that status was
reaffirmed on June 28, 2005 (70 FR 37160).
Spatial Structure and Diversity: Puget Sound (PS) Chinook includes all naturally spawned
populations of Chinook salmon from rivers and streams flowing into Puget Sound including the
Straits of Juan De Fuca from the Elwha River, eastward, including rivers and streams flowing
into Hood Canal, South Sound, North Sound and the Strait of Georgia in Washington, and
progeny of 26 artificial propagation programs. The PS-TRT identified 22 historical populations,
grouped into five major geographic regions, based on consideration of historical distribution,
geographic isolation, dispersal rates, genetic data, life history information, population dynamics,
and environmental and ecological diversity. The NMFS adopted the Shared Strategy for Puget
Sound locally-developed listed species recovery plan for PS Chinook salmon in 2007 (Shared
Strategy for Puget Sound 2007; SSPS 2007a).
Indices of spatial distribution and diversity have not been developed at the population level.
Based on a Shannon Diversity Index at the ESU level, diversity is declining (due primarily to the
increased abundance of returns to the Whidbey Basin region) for both distribution among
populations and among regions (Ford 2011b). Overall, the new information on abundance,
productivity, spatial structure and diversity since the 2005 status review does not indicate a
change in the biological risk category (Ford 2011b).
Abundance and Productivity: No trend was notable for the total ESU escapements; while trends
vary from decreasing to increasing among populations. Natural-origin pre-harvest recruit
escapements remained fairly constant from 1985 to 2009. Returns (pre-harvest run size) from the
natural spawners were highest in 1985, declined through 1994, remained low through 1999,
increased in 2000 and again in 2001, and have declined through 2009, with 2009 having the
lowest returns since 1997. Median recruits per spawner for the last 5-year period (brood years
2002 through 2006) is the lowest over any of the 5-year intervals. Many of the habitat and
hatchery actions identified in the PS Chinook salmon recovery plan are likely to take years or
decades to be implemented and to produce significant improvements in natural population
attributes, and these trends are consistent with these expectations (Ford 2011b).
NMFS concluded in 1998 (Meyers et al. 1998), 2005 (Good et al. 2005a), and 2011 (Ford 2011b)
that the PS Chinook ESU was likely to become endangered in the foreseeable future. In the first
status review, the PS Chinook BRT estimated the total PS Chinook salmon run size in the early
1990s to be approximately 240,000 Chinook, with the vast majority as hatchery-origin. Based on
214
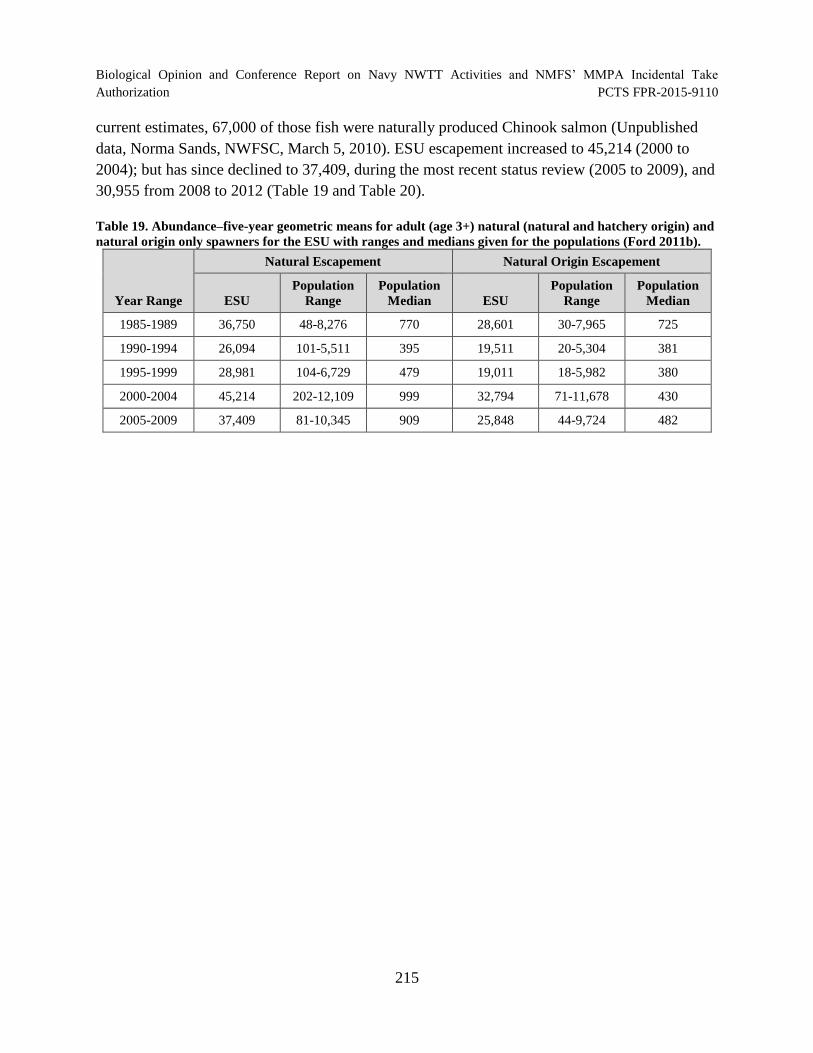
Biological Opinion and Conference Report on Navy NWTT Activities and NMFS’ MMPA Incidental Take
Authorization PCTS FPR-2015-9110
current estimates, 67,000 of those fish were naturally produced Chinook salmon (Unpublished
data, Norma Sands, NWFSC, March 5, 2010). ESU escapement increased to 45,214 (2000 to
2004); but has since declined to 37,409, during the most recent status review (2005 to 2009), and
30,955 from 2008 to 2012 (Table 19 and Table 20).
Table 19. Abundance–five-year geometric means for adult (age 3+) natural (natural and hatchery origin) and
natural origin only spawners for the ESU with ranges and medians given for the populations (Ford 2011b).
Year Range
Natural Escapement Natural Origin Escapement
ESU
Population
Range
Population
Median ESU
Population
Range
Population
Median
1985-1989 36,750 48-8,276 770 28,601 30-7,965 725
1990-1994 26,094 101-5,511 395 19,511 20-5,304 381
1995-1999 28,981 104-6,729 479 19,011 18-5,982 380
2000-2004 45,214 202-12,109 999 32,794 71-11,678 430
2005-2009 37,409 81-10,345 909 25,848 44-9,724 482
215
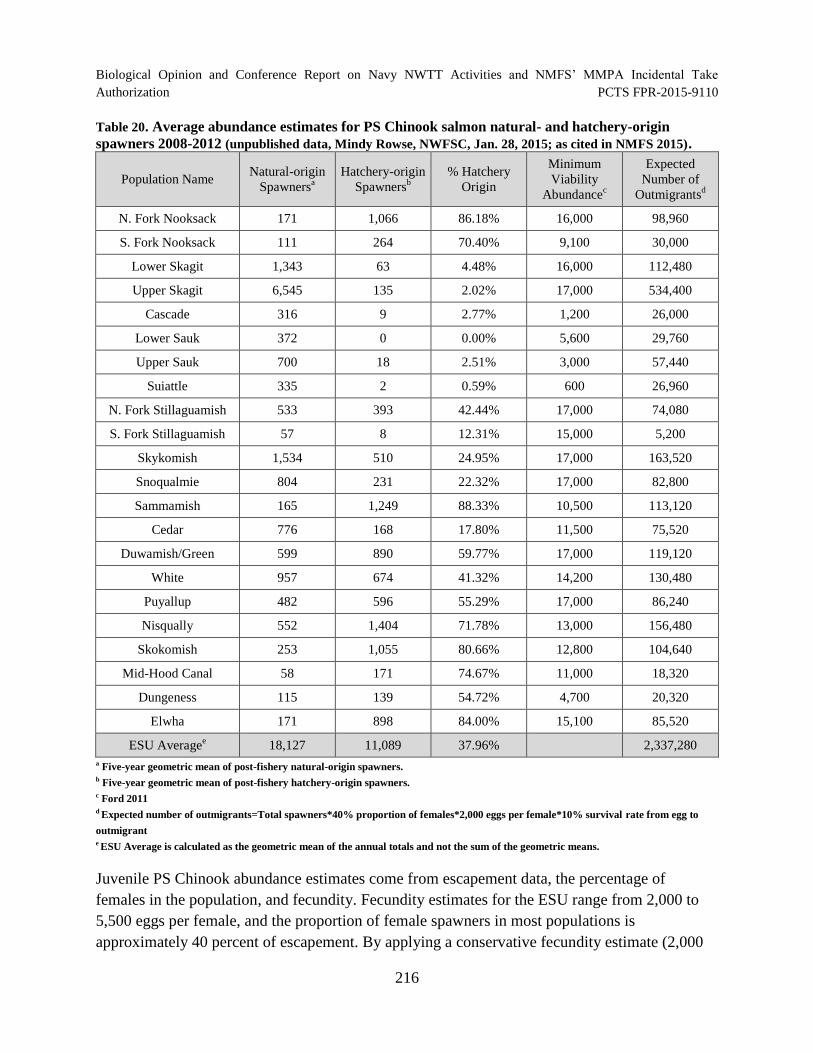
Biological Opinion and Conference Report on Navy NWTT Activities and NMFS’ MMPA Incidental Take
Authorization PCTS FPR-2015-9110
Table 20. Average abundance estimates for PS Chinook salmon natural- and hatchery-origin
spawners 2008-2012 (unpublished data, Mindy Rowse, NWFSC, Jan. 28, 2015; as cited in NMFS 2015).
Population Name Natural-origin
Spawnersa
Hatchery-origin
Spawnersb
% Hatchery
Origin
Minimum
Viability
Abundancec
Expected
Number of
Outmigrantsd
N. Fork Nooksack 171 1,066 86.18% 16,000 98,960
S. Fork Nooksack 111 264 70.40% 9,100 30,000
Lower Skagit 1,343 63 4.48% 16,000 112,480
Upper Skagit 6,545 135 2.02% 17,000 534,400
Cascade 316 9 2.77% 1,200 26,000
Lower Sauk 372 0 0.00% 5,600 29,760
Upper Sauk 700 18 2.51% 3,000 57,440
Suiattle 335 2 0.59% 600 26,960
N. Fork Stillaguamish 533 393 42.44% 17,000 74,080
S. Fork Stillaguamish 57 8 12.31% 15,000 5,200
Skykomish 1,534 510 24.95% 17,000 163,520
Snoqualmie 804 231 22.32% 17,000 82,800
Sammamish 165 1,249 88.33% 10,500 113,120
Cedar 776 168 17.80% 11,500 75,520
Duwamish/Green 599 890 59.77% 17,000 119,120
White 957 674 41.32% 14,200 130,480
Puyallup 482 596 55.29% 17,000 86,240
Nisqually 552 1,404 71.78% 13,000 156,480
Skokomish 253 1,055 80.66% 12,800 104,640
Mid-Hood Canal 58 171 74.67% 11,000 18,320
Dungeness 115 139 54.72% 4,700 20,320
Elwha 171 898 84.00% 15,100 85,520
ESU Averagee
18,127 11,089 37.96% 2,337,280
a Five-year geometric mean of post-fishery natural-origin spawners. b Five-year geometric mean of post-fishery hatchery-origin spawners. c Ford 2011 d Expected number of outmigrants=Total spawners*40% proportion of females*2,000 eggs per female*10% survival rate from egg to
outmigrant e ESU Average is calculated as the geometric mean of the annual totals and not the sum of the geometric means.
Juvenile PS Chinook abundance estimates come from escapement data, the percentage of
females in the population, and fecundity. Fecundity estimates for the ESU range from 2,000 to
5,500 eggs per female, and the proportion of female spawners in most populations is
approximately 40 percent of escapement. By applying a conservative fecundity estimate (2,000
216
Biological Opinion and Conference Report on Navy NWTT Activities and NMFS’ MMPA Incidental Take
Authorization PCTS FPR-2015-9110
eggs/female) to the expected female escapement (both natural-origin and hatchery-origin
spawners – 14,608 females), the ESU is estimated to produce approximately 23.4 million eggs
annually. Smolt trap studies have researched egg to migrant juvenile Chinook salmon survival
rates in the following Puget Sound tributaries: Skagit River, North Fork Stillaguamish River,
South Fork Stillaguamish River, Bear Creek, Cedar River, and Green (Beamer et al. 2000;
Griffith et al. 2004; Seiler et al. 2002; Seiler et al. 2004; Seiler et al. 2005; Volkhardt et al.
2005). The average survival rate in these studies was 10 percent, which corresponds with those
reported by Healey (1991). With an estimated survival rate of 10 percent, the ESU should
produce roughly 2.34 million natural outmigrants annually.
Limiting Factors include (NOAA Fisheries 2011; Shared Strategy for Puget Sound 2007):
Degraded nearshore and estuarine habitat: Residential and commercial development has
reduced the amount of functioning nearshore and estuarine habitat available for salmon
rearing and migration. The loss of mudflats, eelgrass meadows, and macroalgae further
limits salmon foraging and rearing opportunities in nearshore and estuarine areas.
Degraded freshwater habitat: Floodplain connectivity and function, channel structure and
complexity, riparian areas and large wood supply, stream substrate, and water quality
have been degraded for adult spawning, embryo incubation, and rearing as a result of
cumulative impacts of agriculture, forestry, and development.
Anadromous salmonid hatchery programs: Salmon and steelhead released from Puget
Sound hatcheries operated for harvest augmentation purposes pose ecological, genetic,
and demographic risks to natural-origin Chinook salmon populations.
Salmon harvest management: Total fishery exploitation rates have decreased 14 to 63
percent from rates in the 1980s, but weak natural-origin Chinook salmon populations in
Puget Sound still require enhanced protective measures to reduce the risk of overharvest
in Chinook salmon-directed fisheries.
4.2.13.8.2 Lower Columbia River Chinook Salmon ESU
Lower Columbia River Chinook salmon were listed as threatened on March 24, 1999 with the
threatened status reaffirmed on June 28, 2005.
Spatial Structure and Diversity: Lower Columbia River (LCR) Chinook includes all naturally-
spawned populations of Chinook salmon in the Columbia River and its tributaries from its mouth
at the Pacific Ocean upstream to a transitional point between Washington and Oregon east of the
Hood River and the White Salmon River; the Willamette River to Willamette Falls, Oregon,
exclusive of spring-run Chinook salmon in the Clackamas River; and progeny of seventeen
217
Biological Opinion and Conference Report on Navy NWTT Activities and NMFS’ MMPA Incidental Take
Authorization PCTS FPR-2015-9110
artificial propagation programs.8
LCR Chinook populations exhibit three different life history
types base on return timing and other features: fall-run (a.k.a. “tules”), late-fall-run (a.k.a.
“brights”), and spring-run. The Willamete/Lower Columbia Technical Recovery Team (WLC
TRT) identified 32 historical populations of LCR Chinook salmon— seven in the coastal
subregion, six in the Columbia Gorge, and 19 in the Cascade Range. Spatial structure has been
substantially reduced in several populations. Low abundance, past broodstock transfers and other
legacy hatchery effects, and ongoing hatchery straying may have reduced genetic diversity
within and among LCR Chinook salmon populations. Hatchery-origin fish spawning naturally
may also have reduced population productivity (Lower Columbia Fish Recovery Board 2010a;
NMFS 2013; ODFW 2010a). Out of the 32 populations that make up this ESU, only the two late-
fall runs, the North Fork Lewis and Sandy, are considered viable. Most populations (26 out of
32) have a very low probability of persistence over the next 100 years (and some are extirpated
or nearly so) (Ford 2011b; Lower Columbia Fish Recovery Board 2010a; NMFS 2013; ODFW
2010a). Five of the six strata fall significantly short of the WLC-TRT criteria for viability; one
stratum, Cascade late-fall, meets the WLC TRT criteria (NMFS 2013).
Abundance and Productivity: A&P ratings for LCR Chinook salmon populations are currently
“low” to “very low” for most populations, except for spring Chinook salmon in the Sandy River,
which are “moderate” and late-fall Chinook salmon in North Fork Lewis River and Sandy River,
which are “very high” (NMFS 2013). Low abundance of natural-origin spawners (100 fish or
fewer) has increased genetic and demographic risks. Other LCR Chinook salmon populations
have higher total abundance, but several of these also have high proportions of hatchery-origin
spawners. Particularly for tule fall Chinook salmon populations, poor data quality prevents
precise quantification of population abundance and productivity; data quality has been poor
because of inadequate spawning surveys and the presence of unmarked hatchery-origin spawners
(Ford 2011b).
In 1998, NMFS assessed the abundance in smaller tributary streams in the range of the species to
be in the hundreds of fish (Meyers et al. 1998). Larger tributaries (e.g., Cowlitz River basin)
contained natural runs of Chinook salmon ranging in size from 100 to almost 1,000 fish. In 2005,
NMFS calculated adult abundance using the geometric mean of natural-origin spawners in the
five years previous to 2003 (Good et al. 2005a). In 2005, NMFS estimated the LCR Chinook
salmon abundance at approximately 14,130 fish (Good et al. 2005a). Data that are more recent
In 2009, the Elochoman tule fall Chinook salmon program was discontinued and four new fall Chinook salmon
programs have been initiated. In 2011, NMFS recommended removing the Elochoman program from the ESU and
adding the new programs to the ESU NMFS. 2011a. 5-year review: summary and evaluation of Lower Columbia
River Chinook, Columbia River chum, Lower Columbia River coho, and Lower Columbia River steelhead. National
Marine Fisheries Service, editor, Portland, Oregon.
218
8
Biological Opinion and Conference Report on Navy NWTT Activities and NMFS’ MMPA Incidental Take
Authorization PCTS FPR-2015-9110
place the abundance of naturally produced LCR Chinook salmon at approximately 13,594
spawners (Table 21).
219
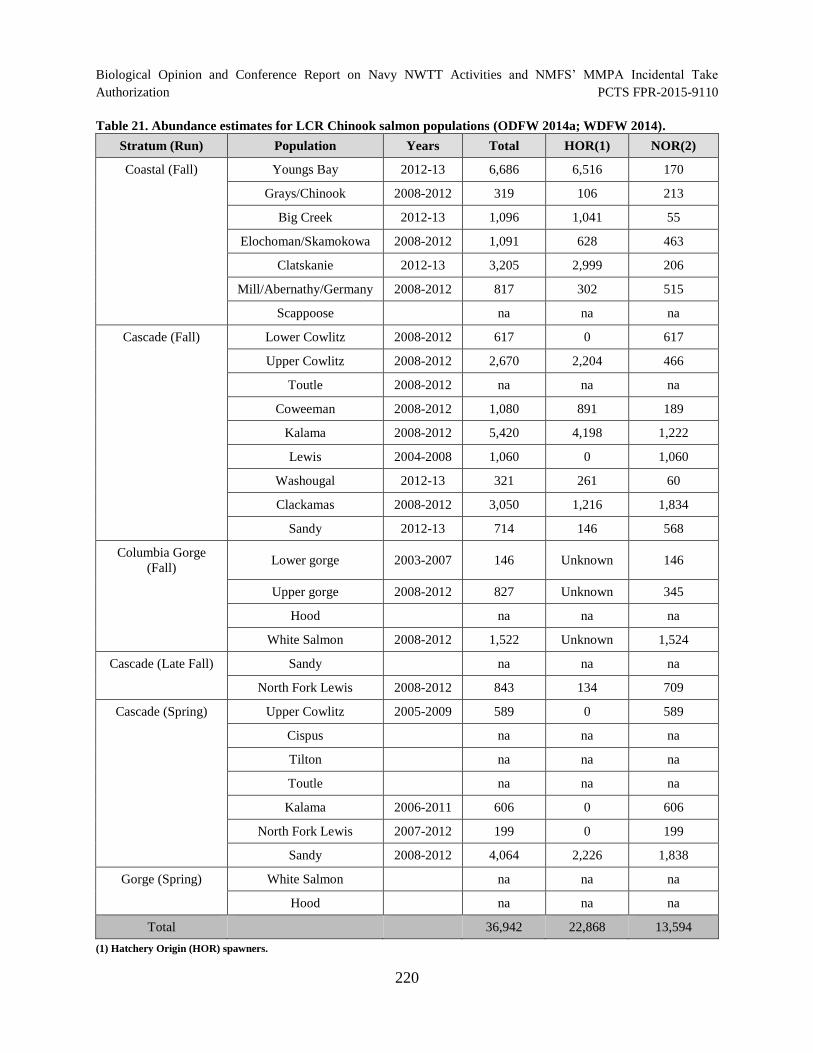
Biological Opinion and Conference Report on Navy NWTT Activities and NMFS’ MMPA Incidental Take Authorization PCTS FPR-2015-9110
Table 21. Abundance estimates for LCR Chinook salmon populations (ODFW 2014a; WDFW 2014).
Stratum (Run) Population Years Total HOR(1) NOR(2)
Coastal (Fall) Youngs Bay 2012-13 6,686 6,516 170
Grays/Chinook 2008-2012 319 106 213
Big Creek 2012-13 1,096 1,041 55
Elochoman/Skamokowa 2008-2012 1,091 628 463
Clatskanie 2012-13 3,205 2,999 206
Mill/Abernathy/Germany 2008-2012 817 302 515
Scappoose na na na
Cascade (Fall) Lower Cowlitz 2008-2012 617 0 617
Upper Cowlitz 2008-2012 2,670 2,204 466
Toutle 2008-2012 na na na
Coweeman 2008-2012 1,080 891 189
Kalama 2008-2012 5,420 4,198 1,222
Lewis 2004-2008 1,060 0 1,060
Washougal 2012-13 321 261 60
Clackamas 2008-2012 3,050 1,216 1,834
Sandy 2012-13 714 146 568
Columbia Gorge
(Fall) Lower gorge 2003-2007 146 Unknown 146
Upper gorge 2008-2012 827 Unknown 345
Hood na na na
White Salmon 2008-2012 1,522 Unknown 1,524
Cascade (Late Fall) Sandy na na na
North Fork Lewis 2008-2012 843 134 709
Cascade (Spring) Upper Cowlitz 2005-2009 589 0 589
Cispus na na na
Tilton na na na
Toutle na na na
Kalama 2006-2011 606 0 606
North Fork Lewis 2007-2012 199 0 199
Sandy 2008-2012 4,064 2,226 1,838
Gorge (Spring) White Salmon na na na
Hood na na na
Total 36,942 22,868 13,594
(1) Hatchery Origin (HOR) spawners.
220
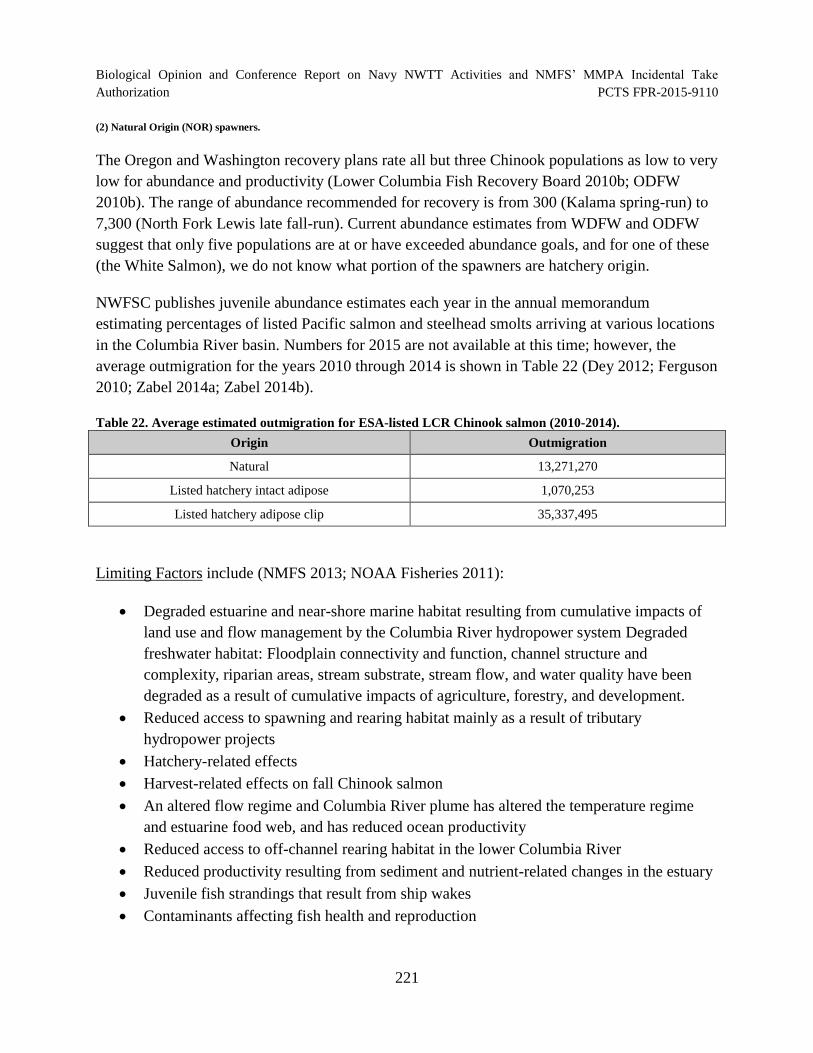
Biological Opinion and Conference Report on Navy NWTT Activities and NMFS’ MMPA Incidental Take
Authorization PCTS FPR-2015-9110
(2) Natural Origin (NOR) spawners.
The Oregon and Washington recovery plans rate all but three Chinook populations as low to very
low for abundance and productivity (Lower Columbia Fish Recovery Board 2010b; ODFW
2010b). The range of abundance recommended for recovery is from 300 (Kalama spring-run) to
7,300 (North Fork Lewis late fall-run). Current abundance estimates from WDFW and ODFW
suggest that only five populations are at or have exceeded abundance goals, and for one of these
(the White Salmon), we do not know what portion of the spawners are hatchery origin.
NWFSC publishes juvenile abundance estimates each year in the annual memorandum
estimating percentages of listed Pacific salmon and steelhead smolts arriving at various locations
in the Columbia River basin. Numbers for 2015 are not available at this time; however, the
average outmigration for the years 2010 through 2014 is shown in Table 22 (Dey 2012; Ferguson
2010; Zabel 2014a; Zabel 2014b).
Table 22. Average estimated outmigration for ESA-listed LCR Chinook salmon (2010-2014).
Origin Outmigration
Natural 13,271,270
Listed hatchery intact adipose 1,070,253
Listed hatchery adipose clip 35,337,495
Limiting Factors include (NMFS 2013; NOAA Fisheries 2011):
Degraded estuarine and near-shore marine habitat resulting from cumulative impacts of
land use and flow management by the Columbia River hydropower system Degraded
freshwater habitat: Floodplain connectivity and function, channel structure and
complexity, riparian areas, stream substrate, stream flow, and water quality have been
degraded as a result of cumulative impacts of agriculture, forestry, and development.
Reduced access to spawning and rearing habitat mainly as a result of tributary
hydropower projects
Hatchery-related effects
Harvest-related effects on fall Chinook salmon
An altered flow regime and Columbia River plume has altered the temperature regime
and estuarine food web, and has reduced ocean productivity
Reduced access to off-channel rearing habitat in the lower Columbia River
Reduced productivity resulting from sediment and nutrient-related changes in the estuary
Juvenile fish strandings that result from ship wakes
Contaminants affecting fish health and reproduction
221
Biological Opinion and Conference Report on Navy NWTT Activities and NMFS’ MMPA Incidental Take
Authorization PCTS FPR-2015-9110
4.2.13.8.3 California Coastal Chinook Salmon ESU
California Coastal Chinook salmon were listed as threatened on September 16, 1999 (64 FR
50393), and they retained their threatened status on June 28, 2005 (70 FR 37160).
Spatial Structure and Diversity: The California Coastal (CC) Chinook salmon ESU was
historically comprised approximately 38 Chinook salmon populations9
(Bjorkstedt et al. 2005;
Spence et al. 2008). Many of these populations (about 21) were independent or potentially
independent, meaning they had a high likelihood of surviving for 100 years absent anthropogenic
impacts. The remaining populations were likely more dependent upon immigration from nearby
independent populations (Bjorkstedt et al. 2005; Spence et al. 2008).
Abundance and Productivity: Data on CC Chinook abundance, both historical and current, are
sparse and of varying quality (Bjorkstedt et al. 2005). Estimates of absolute abundance are not
available for populations in this ESU (Meyers et al. 1998). In 1965, the California Department of
Fish and Game (CDFG)(CDFG 1965) estimated escapement for this ESU at over 76,000. Most
were in the Eel River (55,500), with smaller populations in Redwood Creek (5,000), Mad River
(5,000), Mattole River (5,000), Russian River (500) and several smaller streams in Humboldt
County (Meyers et al. 1998). Currently available data indicate abundance is far lower, suggesting
an inability to sustain production adequate to maintain the ESU populations. Recent growth rates
are fluctuating (depending upon the year) coastwide in California; for example, in 2007 to 2009,
dramatic declines in Chinook salmon returns occurred throughout California. More recently,
Chinook salmon counts in the Russian River have continually increased since record lows in
2008. The highest count recorded since monitoring began in 2000 was surpassed in November,
2012 (Sonoma County Water Agency 2012).
Although there are limited population-level estimates of abundance for CC Chinook salmon
populations, Table 23 summarizes the information that is available for the major watersheds in
the ESU. Based on this limited information, the current average run size for CC Chinook ESU is
7,144 adults. While we currently lack data on naturally-produced juvenile CC Chinook salmon
production, it is possible to make rough estimates of juvenile abundance from adult return data.
Juvenile CC Chinook salmon population abundance estimates come from escapement data, the
9 Population is defined by Bjorkstedt, E., and coauthors. 2005. An analysis of historical population structure for
evolutionarily signficant units of Chinook salmon, coho salmon, and steelhead in the north-Central California Coast
Recovery Domain, NOAA-TM-NMFS-SWFSC-382. and McElhany, P., M. H. Ruckelshaus, M. J. Ford, T. C.
Wainwright, and E. P. Bjorkstedt. 2000a. Viable salmonid populations and the recovery of evolutionarily significant
units. National Oceanic and Atmospheric Administration, National Marine Fisheries Service, Northwest Fisheries
Science Center. as, in brief summary, a group of fish of the same species that spawns in a particular locality at a
particular season and does not interbreed substantially with fish from any other group. Such fish groups may include
more than one stream. These authors use this definition as a starting point from which they define four types of
populations (not all of which are mentioned here).
222
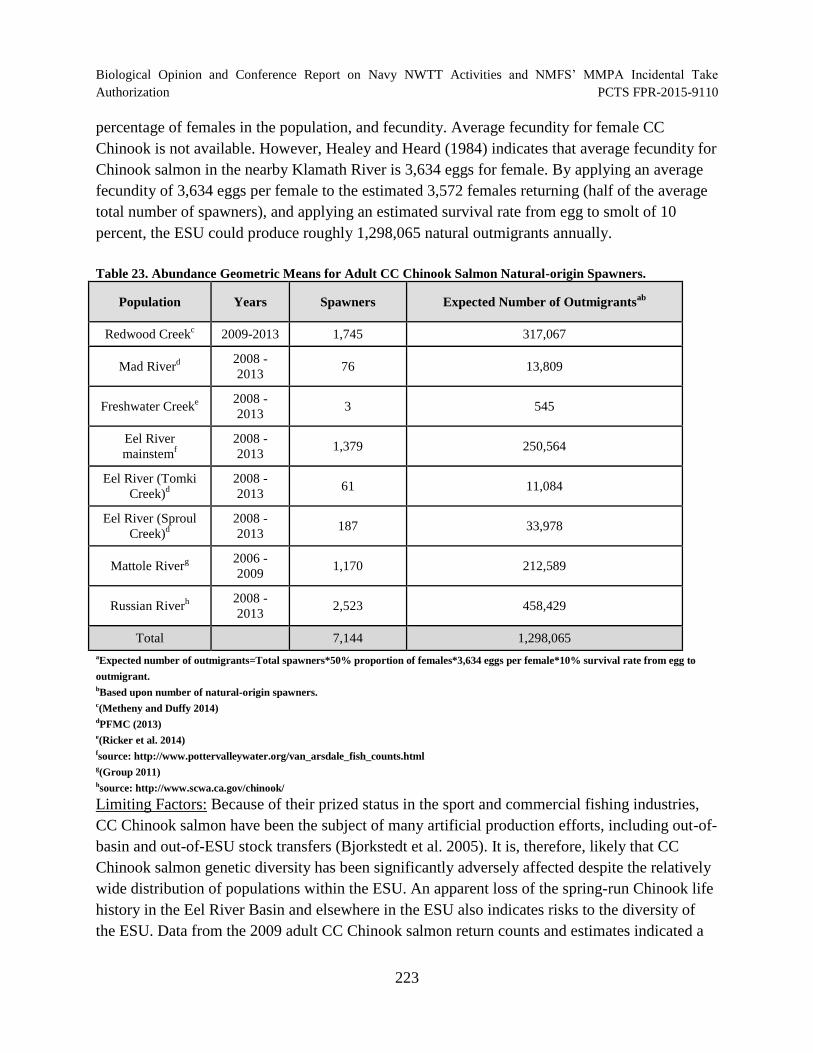
Biological Opinion and Conference Report on Navy NWTT Activities and NMFS’ MMPA Incidental Take
Authorization PCTS FPR-2015-9110
percentage of females in the population, and fecundity. Average fecundity for female CC
Chinook is not available. However, Healey and Heard (1984) indicates that average fecundity for
Chinook salmon in the nearby Klamath River is 3,634 eggs for female. By applying an average
fecundity of 3,634 eggs per female to the estimated 3,572 females returning (half of the average
total number of spawners), and applying an estimated survival rate from egg to smolt of 10
percent, the ESU could produce roughly 1,298,065 natural outmigrants annually.
Table 23. Abundance Geometric Means for Adult CC Chinook Salmon Natural-origin Spawners.
Population Years Spawners Expected Number of Outmigrantsab
Redwood Creekc
2009-2013 1,745 317,067
Mad Riverd 2008
2013 76 13,809
Freshwater Creeke 2008
2013 3 545
Eel River
mainstemf
2008
2013 1,379 250,564
Eel River (Tomki
Creek)d
2008
2013 61 11,084
Eel River (Sproul
Creek)d
2008
2013 187 33,978
Mattole Riverg 2006
2009 1,170 212,589
Russian Riverh 2008
2013 2,523 458,429
Total 7,144 1,298,065
aExpected number of outmigrants=Total spawners*50% proportion of females*3,634 eggs per female*10% survival rate from egg to
outmigrant. bBased upon number of natural-origin spawners. c(Metheny and Duffy 2014) dPFMC (2013) e(Ricker et al. 2014) fsource: http://www.pottervalleywater.org/van_arsdale_fish_counts.html g(Group 2011) hsource: http://www.scwa.ca.gov/chinook/
Limiting Factors: Because of their prized status in the sport and commercial fishing industries,
CC Chinook salmon have been the subject of many artificial production efforts, including out-of
basin and out-of-ESU stock transfers (Bjorkstedt et al. 2005). It is, therefore, likely that CC
Chinook salmon genetic diversity has been significantly adversely affected despite the relatively
wide distribution of populations within the ESU. An apparent loss of the spring-run Chinook life
history in the Eel River Basin and elsewhere in the ESU also indicates risks to the diversity of
the ESU. Data from the 2009 adult CC Chinook salmon return counts and estimates indicated a
223
Biological Opinion and Conference Report on Navy NWTT Activities and NMFS’ MMPA Incidental Take
Authorization PCTS FPR-2015-9110
further decline in returning adults across the range of CC Chinook salmon on the coast of
California (Jeffrey Jahn, NMFS, personal communication, 2010). Ocean conditions are suspected
as a primary short term cause because of the wide geographic range of declines (Lindley et al.
2009). However, the number of adult CC Chinook salmon returns in the Russian River
Watershed increased substantially in 2010/2011 compared to 2008/09 and 2009/10 returns.10
Increases in adult Chinook salmon returns during 2010/2011 have been observed in the Central
Valley populations as well. These numbers must be taken in context of the overall Chinook
salmon abundance in the ESU which has recently been reviewed by Williams et al. (2011), who
found no evidence of a substantial change in the status of the CC Chinook ESU since the last
status review by Good et al. (2005a). Based on this information, NMFS chose to maintain the
threatened listing of CC Chinook salmon (76 FR 50447).
4.2.13.8.4 Upper Columbia River Spring-run Chinook ESU
The Upper Columbia River Spring-run Chinook ESU was listed as endangered on June 28, 2005
(70 FR37160).
Spatial Structure and Diversity: Upper Columbia River (UCR) spring Chinook includes all
naturally-spawned populations of Chinook salmon in all river reaches accessible to Chinook
salmon in Columbia River tributaries upstream of the Rock Island Dam and downstream of Chief
Joseph Dam (excluding the Okanogan River), the Columbia River upstream to Chief Joseph
Dam, and progeny of six artificial propagation programs. The IC-TRT identified four
independent populations of UCR spring-run Chinook salmon in the upriver tributaries of
Wenatchee, Entiat, Methow, and Okanogan (extirpated), but no major groups due to the
relatively small geographic area affected (Ford 2011b; NMFS 2011g).
The composite SS/D risks for all three of the extant populations in this MPG are at “high” risk.
The spatial processes component of the SS/D risk is “low” for the Wenatchee River and Methow
River populations and “moderate” for the Entiat River (loss of production in lower section
increases effective distance to other populations). All three of the extant populations in this MPG
are at “high” risk for diversity, driven primarily by chronically high proportions of hatchery‐
origin spawners in natural spawning areas and lack of genetic diversity among the natural‐origin
spawners (Ford 2011b).
Increases in natural origin abundance relative to the extremely low spawning levels observed in
the mid-1990s are encouraging; however, average productivity levels remain extremely low.
Overall, the viability of UCR spring Chinook salmon ESU has likely improved somewhat since
10 http://www.scwa.ca.gov/chinook/
224
Biological Opinion and Conference Report on Navy NWTT Activities and NMFS’ MMPA Incidental Take
Authorization PCTS FPR-2015-9110
the last status review, but the ESU is still clearly at “moderate-to-high” risk of extinction (Ford
2011b).
Abundance and Productivity: UCR spring Chinook salmon is not currently meeting the viability
criteria (adapted from the IC-TRT) in the Upper Columbia Recovery Plan. A&P remains at
“high” risk for each of the three extant populations in this MPG/ESU. The 10‐year geometric
mean abundance of adult natural origin spawners increased for each population relative to the
levels for the 1981 to 2003 series, but the estimates remain below the corresponding IC-TRT
thresholds. Estimated productivity (spawner to spawner return rate at low to moderate
escapements) was on average lower over the years 1987 to 2009 than for the previous period.
The combinations of current abundance and productivity for each population result in a “high”
risk rating.
From the year 2006 through 2010, the five-year average return to the ESU—as measured
primarily by spawning surveys—was 3,900 (Salmonid Population Summary (SPS) query, April
201411
); of these, approximately 65 percent were of hatchery origin. Counts at Rock Island Dam
in 2008, 2010, and 2011 showed an average estimated 1,668 natural fish retuning to the ESU
which, given a 35 percent natural origin for the overall return, indicated that the total return was
on the order of 4,766 fish. These figures demonstrate that there is some degree of variability in
the various sources for returning adult numbers. As a result, it is sometimes difficult to take all
the various factors into account (survey types, data gaps, various dam counts, hatchery vs. wild
components, etc.) and clearly and accurately determine what the returns actually are.
Nonetheless, the figures we believe to be the most likely to represent the actual returns come
from the U.S. v. Oregon Technical Advisory Committee (TAC) numbers derived from dam
counts and complied by the WDFW (WDFW 2013). These numbers are widely used throughout
the region for management purposes (particularly in setting harvest quotas), and at this point
represent the very best available scientific and technical knowledge to which we have access.
The most recent year for which these numbers have been calculated and published is 2014 (via
the FCRPS Adaptive Management Implementation Plan). That year, the UCR spring Chinook
total return to Rock Island Dam was 3,986 natural adults. The most recent four-year average to
that date was 3,170 fish. Given that these fish comprise approximately 35 percent of the total
run, it signifies that the total return for 2014 was 11,388 fish and the most recent four year
average was 9,057 adults.
11 The data contained in the SPS database are primarily summary data, compiled at the population level. The
database also includes a limited number of series representing the aggregate returns to groups of populations (e.g.,
Lower Granite Dam counts) or counts of spawners within a subsection of a population where expansions to the
population level were not feasible.
225
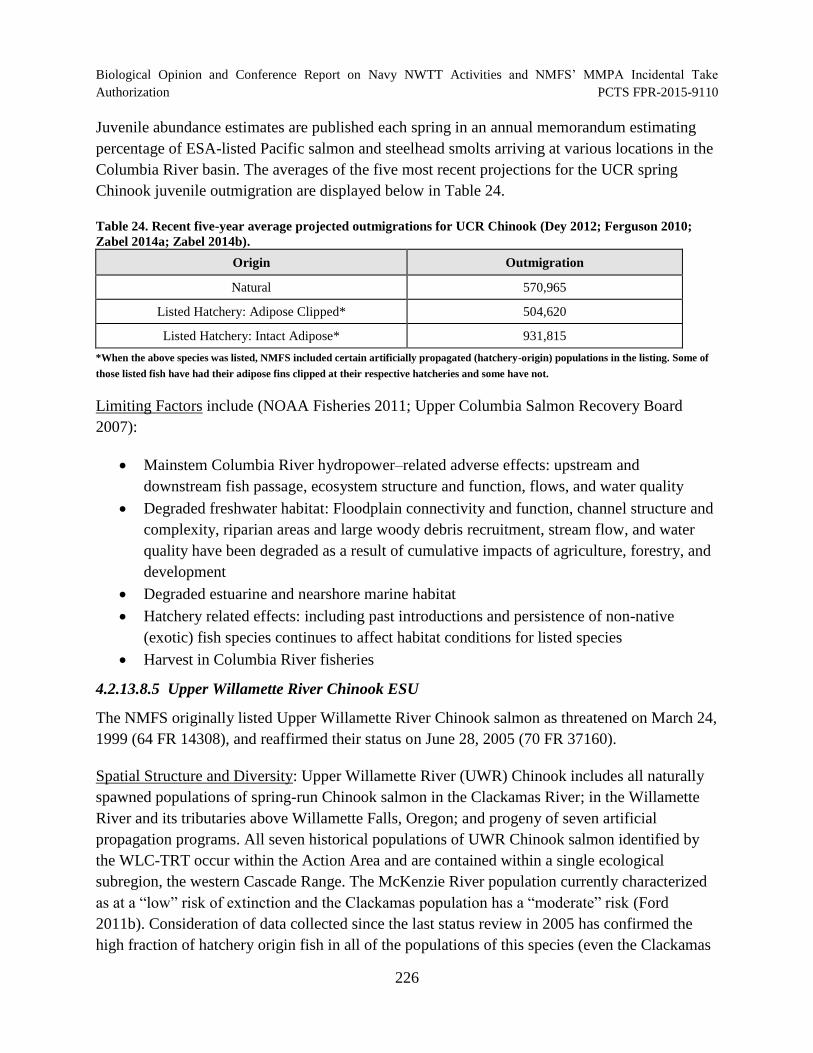
Biological Opinion and Conference Report on Navy NWTT Activities and NMFS’ MMPA Incidental Take
Authorization PCTS FPR-2015-9110
Juvenile abundance estimates are published each spring in an annual memorandum estimating
percentage of ESA-listed Pacific salmon and steelhead smolts arriving at various locations in the
Columbia River basin. The averages of the five most recent projections for the UCR spring
Chinook juvenile outmigration are displayed below in Table 24.
Table 24. Recent five-year average projected outmigrations for UCR Chinook (Dey 2012; Ferguson 2010;
Zabel 2014a; Zabel 2014b).
Origin Outmigration
Natural 570,965
Listed Hatchery: Adipose Clipped* 504,620
Listed Hatchery: Intact Adipose* 931,815
*When the above species was listed, NMFS included certain artificially propagated (hatchery-origin) populations in the listing. Some of
those listed fish have had their adipose fins clipped at their respective hatcheries and some have not.
Limiting Factors include (NOAA Fisheries 2011; Upper Columbia Salmon Recovery Board
2007):
Mainstem Columbia River hydropower–related adverse effects: upstream and
downstream fish passage, ecosystem structure and function, flows, and water quality
Degraded freshwater habitat: Floodplain connectivity and function, channel structure and
complexity, riparian areas and large woody debris recruitment, stream flow, and water
quality have been degraded as a result of cumulative impacts of agriculture, forestry, and
development
Degraded estuarine and nearshore marine habitat
Hatchery related effects: including past introductions and persistence of non-native
(exotic) fish species continues to affect habitat conditions for listed species
Harvest in Columbia River fisheries
4.2.13.8.5 Upper Willamette River Chinook ESU
The NMFS originally listed Upper Willamette River Chinook salmon as threatened on March 24,
1999 (64 FR 14308), and reaffirmed their status on June 28, 2005 (70 FR 37160).
Spatial Structure and Diversity: Upper Willamette River (UWR) Chinook includes all naturally
spawned populations of spring-run Chinook salmon in the Clackamas River; in the Willamette
River and its tributaries above Willamette Falls, Oregon; and progeny of seven artificial
propagation programs. All seven historical populations of UWR Chinook salmon identified by
the WLC-TRT occur within the Action Area and are contained within a single ecological
subregion, the western Cascade Range. The McKenzie River population currently characterized
as at a “low” risk of extinction and the Clackamas population has a “moderate” risk (Ford
2011b). Consideration of data collected since the last status review in 2005 has confirmed the
high fraction of hatchery origin fish in all of the populations of this species (even the Clackamas
226
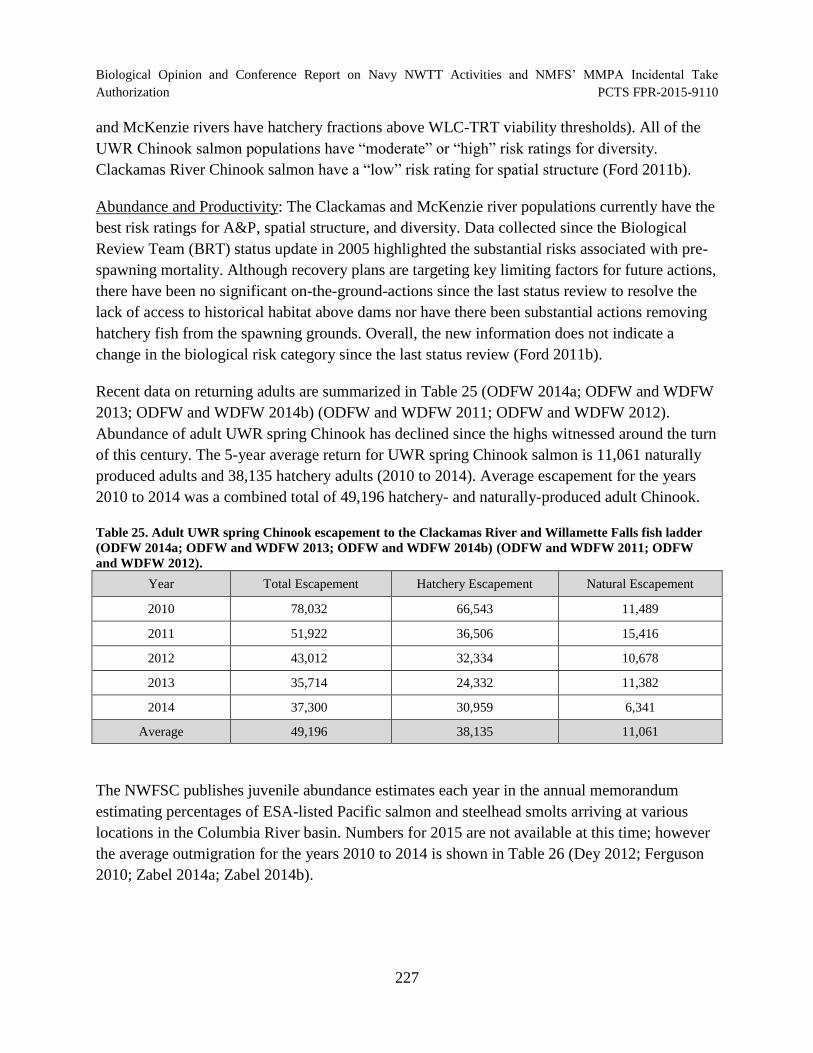
Biological Opinion and Conference Report on Navy NWTT Activities and NMFS’ MMPA Incidental Take
Authorization PCTS FPR-2015-9110
and McKenzie rivers have hatchery fractions above WLC-TRT viability thresholds). All of the
UWR Chinook salmon populations have “moderate” or “high” risk ratings for diversity.
Clackamas River Chinook salmon have a “low” risk rating for spatial structure (Ford 2011b).
Abundance and Productivity: The Clackamas and McKenzie river populations currently have the
best risk ratings for A&P, spatial structure, and diversity. Data collected since the Biological
Review Team (BRT) status update in 2005 highlighted the substantial risks associated with pre
spawning mortality. Although recovery plans are targeting key limiting factors for future actions,
there have been no significant on-the-ground-actions since the last status review to resolve the
lack of access to historical habitat above dams nor have there been substantial actions removing
hatchery fish from the spawning grounds. Overall, the new information does not indicate a
change in the biological risk category since the last status review (Ford 2011b).
Recent data on returning adults are summarized in Table 25 (ODFW 2014a; ODFW and WDFW
2013; ODFW and WDFW 2014b) (ODFW and WDFW 2011; ODFW and WDFW 2012).
Abundance of adult UWR spring Chinook has declined since the highs witnessed around the turn
of this century. The 5-year average return for UWR spring Chinook salmon is 11,061 naturally
produced adults and 38,135 hatchery adults (2010 to 2014). Average escapement for the years
2010 to 2014 was a combined total of 49,196 hatchery- and naturally-produced adult Chinook.
Table 25. Adult UWR spring Chinook escapement to the Clackamas River and Willamette Falls fish ladder
(ODFW 2014a; ODFW and WDFW 2013; ODFW and WDFW 2014b) (ODFW and WDFW 2011; ODFW
and WDFW 2012).
Year Total Escapement Hatchery Escapement Natural Escapement
2010 78,032 66,543 11,489
2011 51,922 36,506 15,416
2012 43,012 32,334 10,678
2013 35,714 24,332 11,382
2014 37,300 30,959 6,341
Average 49,196 38,135 11,061
The NWFSC publishes juvenile abundance estimates each year in the annual memorandum
estimating percentages of ESA-listed Pacific salmon and steelhead smolts arriving at various
locations in the Columbia River basin. Numbers for 2015 are not available at this time; however
the average outmigration for the years 2010 to 2014 is shown in Table 26 (Dey 2012; Ferguson
2010; Zabel 2014a; Zabel 2014b).
227
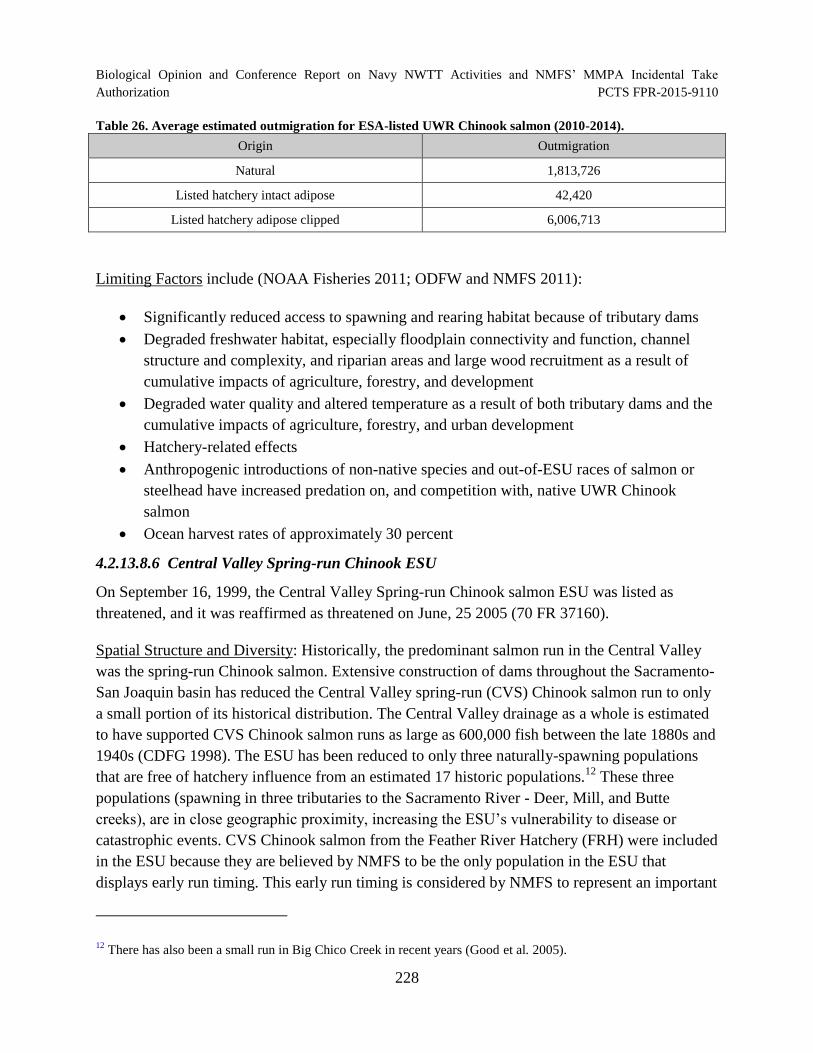
Biological Opinion and Conference Report on Navy NWTT Activities and NMFS’ MMPA Incidental Take Authorization PCTS FPR-2015-9110
Table 26. Average estimated outmigration for ESA-listed UWR Chinook salmon (2010-2014).
Origin Outmigration
Natural 1,813,726
Listed hatchery intact adipose 42,420
Listed hatchery adipose clipped 6,006,713
Limiting Factors include (NOAA Fisheries 2011; ODFW and NMFS 2011):
Significantly reduced access to spawning and rearing habitat because of tributary dams
Degraded freshwater habitat, especially floodplain connectivity and function, channel
structure and complexity, and riparian areas and large wood recruitment as a result of
cumulative impacts of agriculture, forestry, and development
Degraded water quality and altered temperature as a result of both tributary dams and the
cumulative impacts of agriculture, forestry, and urban development
Hatchery-related effects
Anthropogenic introductions of non-native species and out-of-ESU races of salmon or
steelhead have increased predation on, and competition with, native UWR Chinook
salmon
Ocean harvest rates of approximately 30 percent
4.2.13.8.6 Central Valley Spring-run Chinook ESU
On September 16, 1999, the Central Valley Spring-run Chinook salmon ESU was listed as
threatened, and it was reaffirmed as threatened on June, 25 2005 (70 FR 37160).
Spatial Structure and Diversity: Historically, the predominant salmon run in the Central Valley
was the spring-run Chinook salmon. Extensive construction of dams throughout the Sacramento-
San Joaquin basin has reduced the Central Valley spring-run (CVS) Chinook salmon run to only
a small portion of its historical distribution. The Central Valley drainage as a whole is estimated
to have supported CVS Chinook salmon runs as large as 600,000 fish between the late 1880s and
1940s (CDFG 1998). The ESU has been reduced to only three naturally-spawning populations
that are free of hatchery influence from an estimated 17 historic populations.12
These three
populations (spawning in three tributaries to the Sacramento River - Deer, Mill, and Butte
creeks), are in close geographic proximity, increasing the ESU’s vulnerability to disease or
catastrophic events. CVS Chinook salmon from the Feather River Hatchery (FRH) were included
in the ESU because they are believed by NMFS to be the only population in the ESU that
displays early run timing. This early run timing is considered by NMFS to represent an important
12 There has also been a small run in Big Chico Creek in recent years (Good et al. 2005).
228
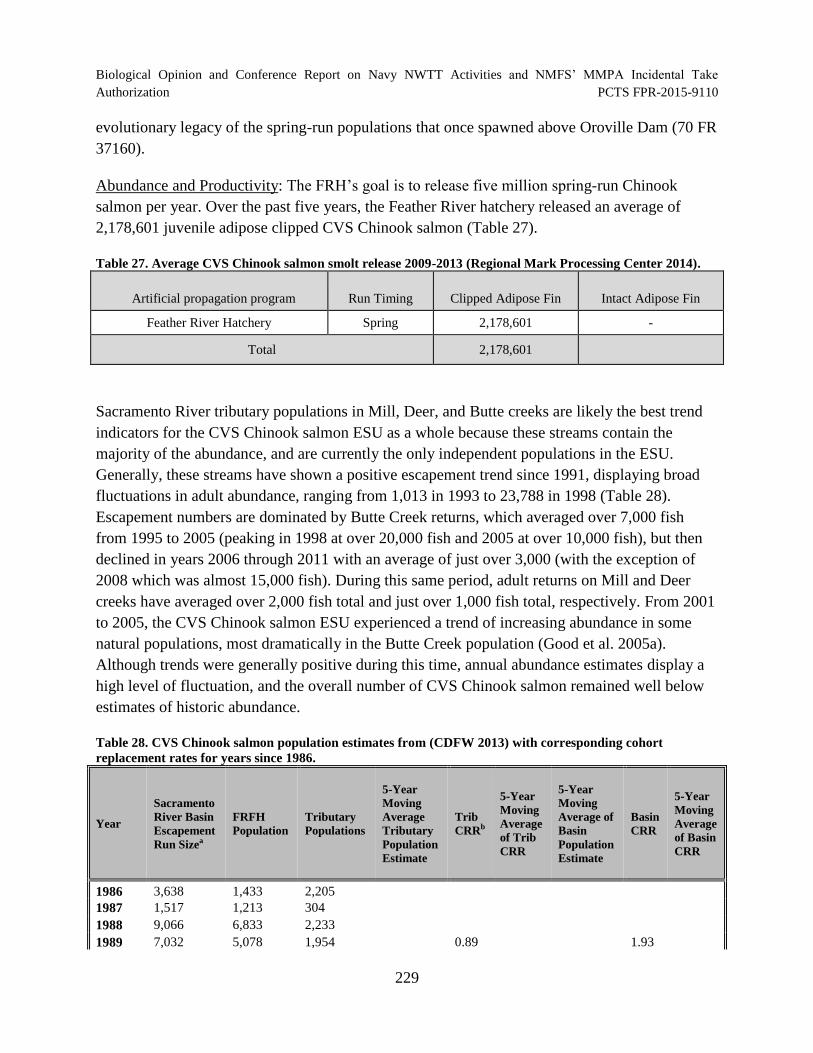
Biological Opinion and Conference Report on Navy NWTT Activities and NMFS’ MMPA Incidental Take
Authorization PCTS FPR-2015-9110
evolutionary legacy of the spring-run populations that once spawned above Oroville Dam (70 FR
37160).
Abundance and Productivity: The FRH’s goal is to release five million spring-run Chinook
salmon per year. Over the past five years, the Feather River hatchery released an average of
2,178,601 juvenile adipose clipped CVS Chinook salmon (Table 27).
Table 27. Average CVS Chinook salmon smolt release 2009-2013 (Regional Mark Processing Center 2014).
Artificial propagation program Run Timing Clipped Adipose Fin Intact Adipose Fin
Feather River Hatchery Spring 2,178,601 -
Total 2,178,601
Sacramento River tributary populations in Mill, Deer, and Butte creeks are likely the best trend
indicators for the CVS Chinook salmon ESU as a whole because these streams contain the
majority of the abundance, and are currently the only independent populations in the ESU.
Generally, these streams have shown a positive escapement trend since 1991, displaying broad
fluctuations in adult abundance, ranging from 1,013 in 1993 to 23,788 in 1998 (Table 28).
Escapement numbers are dominated by Butte Creek returns, which averaged over 7,000 fish
from 1995 to 2005 (peaking in 1998 at over 20,000 fish and 2005 at over 10,000 fish), but then
declined in years 2006 through 2011 with an average of just over 3,000 (with the exception of
2008 which was almost 15,000 fish). During this same period, adult returns on Mill and Deer
creeks have averaged over 2,000 fish total and just over 1,000 fish total, respectively. From 2001
to 2005, the CVS Chinook salmon ESU experienced a trend of increasing abundance in some
natural populations, most dramatically in the Butte Creek population (Good et al. 2005a).
Although trends were generally positive during this time, annual abundance estimates display a
high level of fluctuation, and the overall number of CVS Chinook salmon remained well below
estimates of historic abundance.
Table 28. CVS Chinook salmon population estimates from (CDFW 2013) with corresponding cohort
replacement rates for years since 1986.
Year
Sacramento
River Basin
Escapement
Run Sizea
FRFH
Population
Tributary
Populations
5-Year
Moving
Average
Tributary
Population
Estimate
Trib
CRRb
5-Year
Moving
Average
of Trib
CRR
5-Year
Moving
Average of
Basin
Population
Estimate
Basin
CRR
5-Year
Moving
Average
of Basin
CRR
1986
1987
3,638
1,517
1,433
1,213
2,205
304
1988 9,066 6,833 2,233
1989 7,032 5,078 1,954 0.89 1.93
229
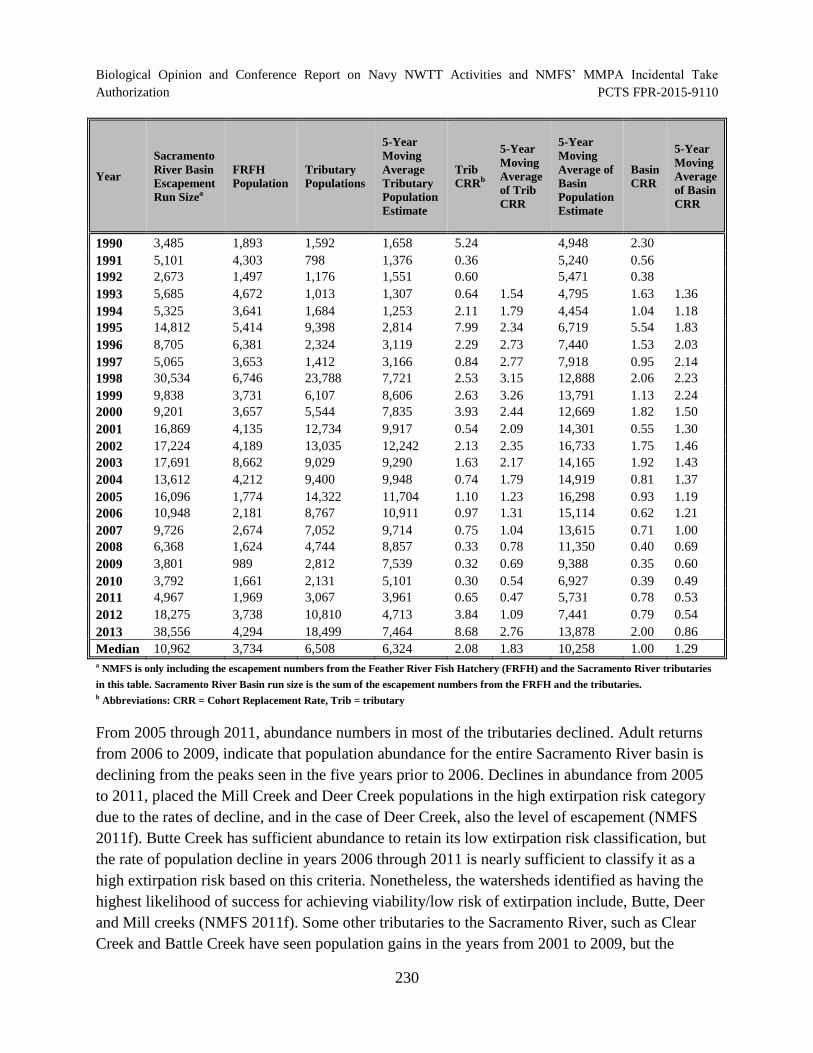
Biological Opinion and Conference Report on Navy NWTT Activities and NMFS’ MMPA Incidental Take Authorization PCTS FPR-2015-9110
Year
Sacramento
River Basin
Escapement
Run Sizea
FRFH
Population
Tributary
Populations
5-Year
Moving
Average
Tributary
Population
Estimate
Trib
CRRb
5-Year
Moving
Average
of Trib
CRR
5-Year
Moving
Average of
Basin
Population
Estimate
Basin
CRR
5-Year
Moving
Average
of Basin
CRR
1990
1991
1992
1993
1994
1995
1996
1997
1998
1999
2000
2001
2002
2003
2004
2005
2006
2007
2008
2009
2010
2011
2012
2013
3,485
5,101
2,673
5,685
5,325
14,812
8,705
5,065
30,534
9,838
9,201
16,869
17,224
17,691
13,612
16,096
10,948
9,726
6,368
3,801
3,792
4,967
18,275
38,556
1,893
4,303
1,497
4,672
3,641
5,414
6,381
3,653
6,746
3,731
3,657
4,135
4,189
8,662
4,212
1,774
2,181
2,674
1,624
989
1,661
1,969
3,738
4,294
1,592
798
1,176
1,013
1,684
9,398
2,324
1,412
23,788
6,107
5,544
12,734
13,035
9,029
9,400
14,322
8,767
7,052
4,744
2,812
2,131
3,067
10,810
18,499
1,658
1,376
1,551
1,307
1,253
2,814
3,119
3,166
7,721
8,606
7,835
9,917
12,242
9,290
9,948
11,704
10,911
9,714
8,857
7,539
5,101
3,961
4,713
7,464
5.24
0.36
0.60
0.64
2.11
7.99
2.29
0.84
2.53
2.63
3.93
0.54
2.13
1.63
0.74
1.10
0.97
0.75
0.33
0.32
0.30
0.65
3.84
8.68
1.54
1.79
2.34
2.73
2.77
3.15
3.26
2.44
2.09
2.35
2.17
1.79
1.23
1.31
1.04
0.78
0.69
0.54
0.47
1.09
2.76
4,948
5,240
5,471
4,795
4,454
6,719
7,440
7,918
12,888
13,791
12,669
14,301
16,733
14,165
14,919
16,298
15,114
13,615
11,350
9,388
6,927
5,731
7,441
13,878
2.30
0.56
0.38
1.63
1.04
5.54
1.53
0.95
2.06
1.13
1.82
0.55
1.75
1.92
0.81
0.93
0.62
0.71
0.40
0.35
0.39
0.78
0.79
2.00
1.36
1.18
1.83
2.03
2.14
2.23
2.24
1.50
1.30
1.46
1.43
1.37
1.19
1.21
1.00
0.69
0.60
0.49
0.53
0.54
0.86
Median 10,962 3,734 6,508 6,324 2.08 1.83 10,258 1.00 1.29 a NMFS is only including the escapement numbers from the Feather River Fish Hatchery (FRFH) and the Sacramento River tributaries
in this table. Sacramento River Basin run size is the sum of the escapement numbers from the FRFH and the tributaries. b Abbreviations: CRR = Cohort Replacement Rate, Trib = tributary
From 2005 through 2011, abundance numbers in most of the tributaries declined. Adult returns
from 2006 to 2009, indicate that population abundance for the entire Sacramento River basin is
declining from the peaks seen in the five years prior to 2006. Declines in abundance from 2005
to 2011, placed the Mill Creek and Deer Creek populations in the high extirpation risk category
due to the rates of decline, and in the case of Deer Creek, also the level of escapement (NMFS
2011f). Butte Creek has sufficient abundance to retain its low extirpation risk classification, but
the rate of population decline in years 2006 through 2011 is nearly sufficient to classify it as a
high extirpation risk based on this criteria. Nonetheless, the watersheds identified as having the
highest likelihood of success for achieving viability/low risk of extirpation include, Butte, Deer
and Mill creeks (NMFS 2011f). Some other tributaries to the Sacramento River, such as Clear
Creek and Battle Creek have seen population gains in the years from 2001 to 2009, but the
230
Biological Opinion and Conference Report on Navy NWTT Activities and NMFS’ MMPA Incidental Take
Authorization PCTS FPR-2015-9110
overall abundance numbers have remained low. Year 2012 appeared to be a good return year for
most of the tributaries with some, such as Battle Creek, having the highest return on record
(799). Additionally, 2013 escapement numbers combined for Butte, Mill and Deer creeks
increased (over 17,000), which resulted in the second highest number of spring-run Chinook
salmon returning to the tributaries since 1998. However, 2014 appears to be lower, just over
5,000 fish, which indicates a highly fluctuating and unstable ESU.
While we currently lack data on naturally-produced juvenile CVS Chinook salmon production, it
is possible to make rough estimates of juvenile abundance from adult return data. The CDFG
(1998) published estimates in which average fecundity of spring-run Chinook salmon is 4,161
eggs per female. By applying the average fecundity of 4,161 eggs per female to the estimated
3,732 females returning (half of the average total number of spawners), and applying an
estimated survival rate from egg to smolt of 10 percent, the ESU could produce roughly
1,552,885 natural outmigrants annually. In addition, hatchery managers could produce
approximately 2,000,000 listed hatchery juvenile CVS Chinook salmon each year (Table 9
above).
Limiting Factors: Several actions have been taken to improve habitat conditions for CVS
Chinook salmon, including: habitat restoration efforts in the Central Valley; and changes in
freshwater harvest management measures. Although protective measures likely have contributed
to recent increases in CVS Chinook salmon abundance, the ESU is still well below levels
observed from the 1960s. Threats from climatic variation, high temperatures, predation, and
water diversions still persist. Hatchery production can also pose a threat to salmonids. Potential
adverse effects from hatchery production include competition for food between naturally-
spawned and hatchery fish, run hybridization and genomic homogenization. Despite these
potential impacts from hatchery production, NMFS ultimately concluded the FRH stock should
be included in the CVS Chinook ESU because it still exhibited a spring-run migration timing and
was the best opportunity for restoring a more natural spring-run population in the Feather River.
In the most recent status review of this ESU, NMFS concluded that the FRH stock should be
considered part of the CVS Chinook ESU (Williams et al. 2011). Because wild CVS Chinook
salmon ESU populations are confined to relatively few remaining watersheds and continue to
display broad fluctuations in abundance, the BRT concluded that the ESU is likely to become
endangered within the foreseeable future. The most recent status review concludes the status of
CVS Chinook salmon ESU has probably deteriorated since the 2005 status review (Williams et
al. 2011).
4.2.13.8.7 Snake River Spring/Summer Run Chinook ESU
The NMFS originally listed Snake River spring/summer-run Chinook salmon as threatened on
April 22, 1992 (57 FR 14653), and reaffirmed their status as threatened on June 28, 2005 (70 FR
37160).
231
Biological Opinion and Conference Report on Navy NWTT Activities and NMFS’ MMPA Incidental Take
Authorization PCTS FPR-2015-9110
Spatial Structure and Diversity: This species includes all naturally-spawned populations of
spring/summer-run Chinook salmon in the mainstem Snake River and the Tucannon River,
Grande Ronde River, Imnaha River, and Salmon River subbasins; and progeny of fifteen
artificial propagation programs. The IC-TRT currently believes there are 27 extant and 4
extirpated populations of Snake River (SR) spring/summer-run Chinook salmon, and aggregated
these into major population groups (Ford 2011b; IC-TRT 2007). Each of these populations faces
a “high” risk of extinction (Ford 2011b).
Abundance and Productivity: Population level status ratings remain at “high” risk across all
MPGs within the ESU, although recent natural spawning abundance estimates have increased, all
populations remain below minimum natural origin abundance thresholds. Spawning escapements
in the most recent years in each series are generally well below the peak returns but above the
extreme low levels in the mid‐1990s. Relatively low natural production rates and spawning
levels below minimum abundance thresholds remain a major concern across the ESU.
The ability of SR spring/summer-run Chinook salmon populations to be self-sustaining through
normal periods of relatively low ocean survival remains uncertain. Factors cited by Good et al.
(2005d) remain as concerns or key uncertainties for several populations. Overall, the new
information considered does not indicate a change in the biological risk category since the last
status review (Ford 2011b).
The 1997 to 2001 geometric mean total return for spring/summer Chinook was slightly more
than 6,000 fish. This was a marked improvement over the previous ten years when the geometric
mean return was 3,076. That increase continued relatively steadily through 2004, when 97,946
adults returned (including jacks), but dropped off precipitously in 2005 when only 39,126 fish
(including jacks) returned above Ice Harbor Dam (Fish Passage Center 2005). The increases
from 2001 through 2004 are generally thought to have been a result of good ocean conditions for
rearing and good Columbia River flows for outmigration. But even with generally better trends
in recent years, no population of SR spring/summer Chinook is known to be meeting its interim
recovery goals (Ford 2011b). In fact, the most recent return numbers to individual populations
show most of the runs to be at less than half the desired levels (Ford 2011b). Overall, from the
year 2009 through the year 2013, the five-year average escapement of naturally produced SR
spring/summer Chinook was 20,422 naturally produced and 60,058 hatchery propagated fish
(Table 29).
232

Biological Opinion and Conference Report on Navy NWTT Activities and NMFS’ MMPA Incidental Take Authorization PCTS FPR-2015-9110
Table 29. Estimated numbers of adult SR spring/summer Chinook salmon (ODFW and WDFW 2014a).
Year Return to Columbia River
Hatchery Escapementa
Natural Escapementa
Hatchery Natural
2009 68,937 20,240 48,750 14,313
2010 130,976 34,764 94,984 25,211
2011 92,639 30,567 72,264 23,844
2012 75,656 33,856 55,482 24,828
2013 45,400 21,929 28,811 13,916
Average 82,722 28,271 60,058 20,422
a Lower Granite Dam passage plus Tucannon River escapement.
Juvenile abundance estimates are published each spring in an annual memorandum estimating
percentage of listed Pacific salmon and steelhead smolts arriving at various locations in the
Columbia River basin. The averages of the five most recent projections for the SR
spring/summer Chinook salmon juvenile outmigration are displayed below.
Table 30. Recent five-year average projected outmigrations for SR spring/summer Chinook salmon (Dey
2012; Ferguson 2010; Zabel 2014a; Zabel 2014b).
Origin Outmigration
Natural 1,454,727
Listed Hatchery: Adipose Clipped* 4,381,302
Listed Hatchery: Intact Adipose* 1,158,078
*When the above species was listed, NMFS included certain artificially propagated (hatchery-origin) populations in the listing. Some of
those listed fish have had their adipose fins clipped at their respective hatcheries and some have not.
Limiting Factors include (NOAA Fisheries 2011):
Degraded freshwater habitat: Floodplain connectivity and function, channel structure and
complexity, riparian areas and large wood supply, stream substrate, elevated water
temperature, stream flow, and water quality have been degraded as a result of cumulative
impacts of agriculture, forestry, and development
Mainstem Columbia River and Snake River hydropower impacts Harvest-related effects
Predation
4.2.13.8.8 Snake River Fall Run Chinook ESU
The NMFS originally listed Snake River fall-run Chinook salmon as endangered in 1992 (57 FR
14653) but reclassified their status as threatened on June 28, 2005 (70 FR 37160).
233
Biological Opinion and Conference Report on Navy NWTT Activities and NMFS’ MMPA Incidental Take
Authorization PCTS FPR-2015-9110
Spatial Structure and Diversity: Snake River (SR) fall Chinook includes all naturally-spawned
populations of fall-run Chinook salmon in the mainstem Snake River below Hells Canyon Dam,
and in the Tucannon River, Grande Ronde River, Imnaha River, Salmon River, and Clearwater
River, and progeny of four artificial propagation programs. The Interior Columbia Technical
Recovery Team (IC-TRT) identified three populations of this species, although only the lower
mainstem population exists at present, and it spawns in the lower main stem of the Clearwater,
Imnaha, Grande Ronde, Salmon and Tucannon rivers. The extant population of SR fall Chinook
salmon is the only remaining population from an historical ESU that also included large
mainstem populations upstream of the current location of the Hells Canyon Dam complex (Ford
2011b; NMFS 2011g). The population is at moderate risk for diversity and spatial structure.
Overall, the new information considered does not indicate a change in the biological risk
category since the last status review (Ford 2011b).
Abundance and Productivity: The recent increases in natural origin abundance are encouraging.
However, hatchery origin spawner proportions have increased dramatically in recent years – on
average, 78 percent of the estimated adult spawners have been hatchery origin over the most
recent brood cycle. The apparent leveling off of natural returns in spite of the increases in total
brood year spawners may indicate that density dependent habitat effects are influencing
production or that high hatchery proportions may be influencing natural production rates. The
A&P risk rating for the population is “moderate.” Given the combination of current A&P and
SS/D ratings summarized above, the overall viability rating for Lower SR fall Chinook salmon
would be rated as “maintained.”13
The 1999 NMFS Status Review Update noted increases in the Lower Granite Dam counts in the
mid-1990s, and the upward trend in returns—the 2001 count over Lower Granite Dam exceeded
8,700 adult fall Chinook—has largely continued. The largest increase in fall Chinook returns to
the Snake River spawning area was from the Lyons Ferry Snake River stock component. Returns
there increased from under 200 per year before to 1998 to over 1,200 and 5,300 adults in 2000
and 2001, respectively. The increase includes returns from the on-station release program as well
as returns from large supplementation releases above Lower Granite Dam. Moreover, from the
year 2003 through the year 2008, the five-year average return to the ESU was 11,321 adult fish
(Ford 2011b); of these, approximately 78 percent were of hatchery origin. Overall, from the year
2010 through the year 2014, the five-year average escapement of SR fall Chinook was 14,438
naturally produced adult fish and 30,475 hatchery propagated adult fish Table 31.
13 “Maintained” population status is for populations that do not meet the criteria for a viable population but do
support ecological functions and preserve options for ESU/DPS recovery.
234
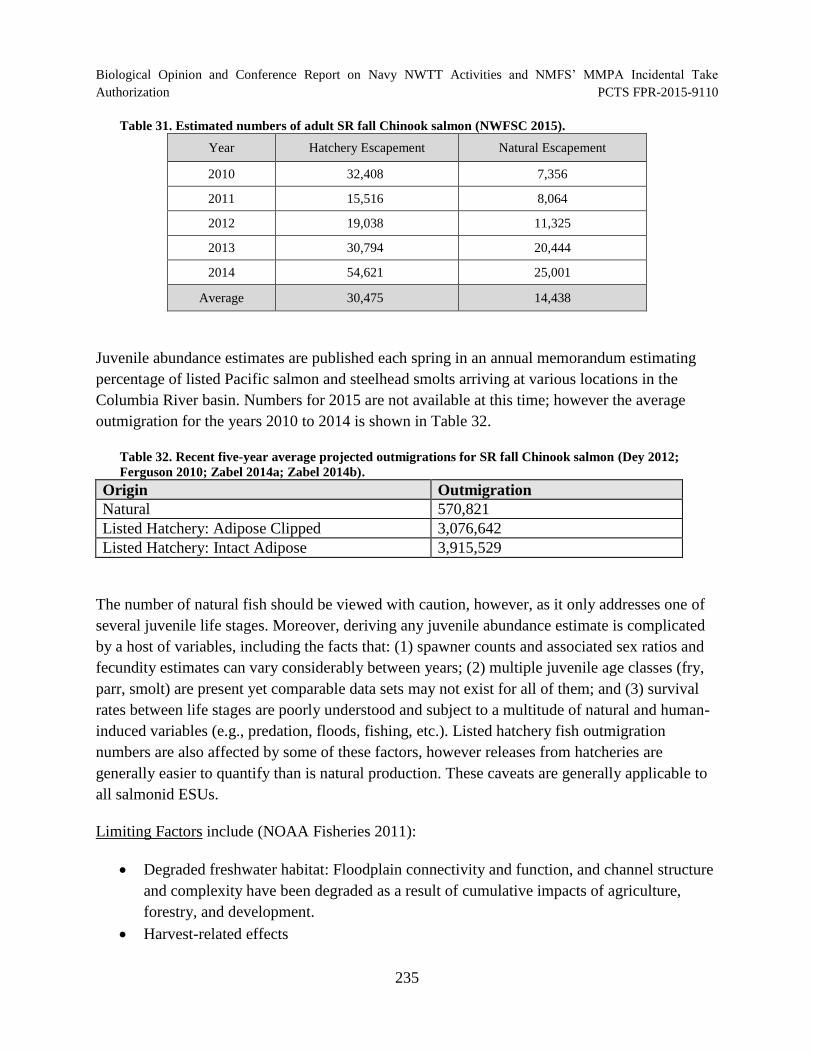
Biological Opinion and Conference Report on Navy NWTT Activities and NMFS’ MMPA Incidental Take Authorization PCTS FPR-2015-9110
Table 31. Estimated numbers of adult SR fall Chinook salmon (NWFSC 2015).
Year Hatchery Escapement Natural Escapement
2010 32,408 7,356
2011 15,516 8,064
2012 19,038 11,325
2013 30,794 20,444
2014 54,621 25,001
Average 30,475 14,438
Juvenile abundance estimates are published each spring in an annual memorandum estimating
percentage of listed Pacific salmon and steelhead smolts arriving at various locations in the
Columbia River basin. Numbers for 2015 are not available at this time; however the average
outmigration for the years 2010 to 2014 is shown in Table 32.
Table 32. Recent five-year average projected outmigrations for SR fall Chinook salmon (Dey 2012;
Ferguson 2010; Zabel 2014a; Zabel 2014b).
Origin Outmigration
Natural 570,821
Listed Hatchery: Adipose Clipped 3,076,642
Listed Hatchery: Intact Adipose 3,915,529
The number of natural fish should be viewed with caution, however, as it only addresses one of
several juvenile life stages. Moreover, deriving any juvenile abundance estimate is complicated
by a host of variables, including the facts that: (1) spawner counts and associated sex ratios and
fecundity estimates can vary considerably between years; (2) multiple juvenile age classes (fry,
parr, smolt) are present yet comparable data sets may not exist for all of them; and (3) survival
rates between life stages are poorly understood and subject to a multitude of natural and human-
induced variables (e.g., predation, floods, fishing, etc.). Listed hatchery fish outmigration
numbers are also affected by some of these factors, however releases from hatcheries are
generally easier to quantify than is natural production. These caveats are generally applicable to
all salmonid ESUs.
Limiting Factors include (NOAA Fisheries 2011):
Degraded freshwater habitat: Floodplain connectivity and function, and channel structure
and complexity have been degraded as a result of cumulative impacts of agriculture,
forestry, and development.
Harvest-related effects
235
Biological Opinion and Conference Report on Navy NWTT Activities and NMFS’ MMPA Incidental Take
Authorization PCTS FPR-2015-9110
Loss of access to historic habitat above Hells Canyon and other Snake River dams
Mainstem Columbia River and Snake River hydropower impacts
Hatchery-related effects
Degraded estuarine and nearshore habitat
4.2.13.8.9 Sacramento River Winter-run Chinook ESU
NMFS listed Sacramento River winter-run Chinook salmon as endangered on January 4, 1994
(59 FR 440), and reaffirmed their status as endangered on June 28, 2005 (70 FR 37160).
Spatial Structure and Diversity: The Sacramento River winter-run (SWR) Chinook salmon ESU
has been completely displaced from its historical spawning habitat by the construction of Shasta
and Keswick dams. Approximately, 300 miles of tributary spawning habitat in the upper
Sacramento River is now inaccessible to the ESU. Most components of the SWR Chinook
salmon life history (e.g., spawning, incubation, freshwater rearing) have been compromised by
the habitat blockage in the upper Sacramento River. The only remaining spawning habitat in the
upper Sacramento River is between Keswick Dam and Red Bluff Diversion Dam (RBDD). This
habitat is artificially maintained by cool water releases from Shasta and Keswick Dams, and the
spatial distribution of spawners in the upper Sacramento River is largely governed by the water
year type and the ability of the Central Valley Project to manage water temperatures in this area.
Abundance and Productivity: A captive broodstock artificial propagation program for SWR
Chinook salmon has operated since the early 1990s as part of recovery actions for this ESU. As
many as 150,000 juvenile salmon have been released in a single year by this program, but in
most cases the number of fish released was in the tens of thousands (Good et al. 2005a). NMFS
reviewed this hatchery program in 2004 and concluded that as much as 10 percent of the natural
spawners may be attributable to the program’s support of the population (69 FR 33102).
However, the naturally spawning component of this ESU has exhibited marked improvements in
abundance and productivity in the 2000s (CDFG 2008). These increases in abundance are
encouraging, relative to the years of critically low abundance of the 1980s and early 1990s;
however, returns of several West Coast Chinook salmon and coho salmon stocks were lower in
the 2000’s, and SWR Chinook returns dropped below 1,000 in 2011. Returns have been
increasing since that time and numbered approximately 6,000 in 2014 (PFMC 2014). This
population remains below established recovery goals and the naturally-spawned component of
the ESU is dependent on one extant population in the Sacramento River. There is particular
concern about risks to the ESU’s genetic diversity (genetic diversity is probably limited because
there is only one remaining population) life-history variability, local adaptation, and spatial
structure (Good et al. (2005a); 70 FR 37160).
Since 2000, the proportion of hatchery-origin, SRW Chinook spawning in the river has ranged
up to 10 percent (Table 8), which is below the low-risk threshold for hatchery influence
236
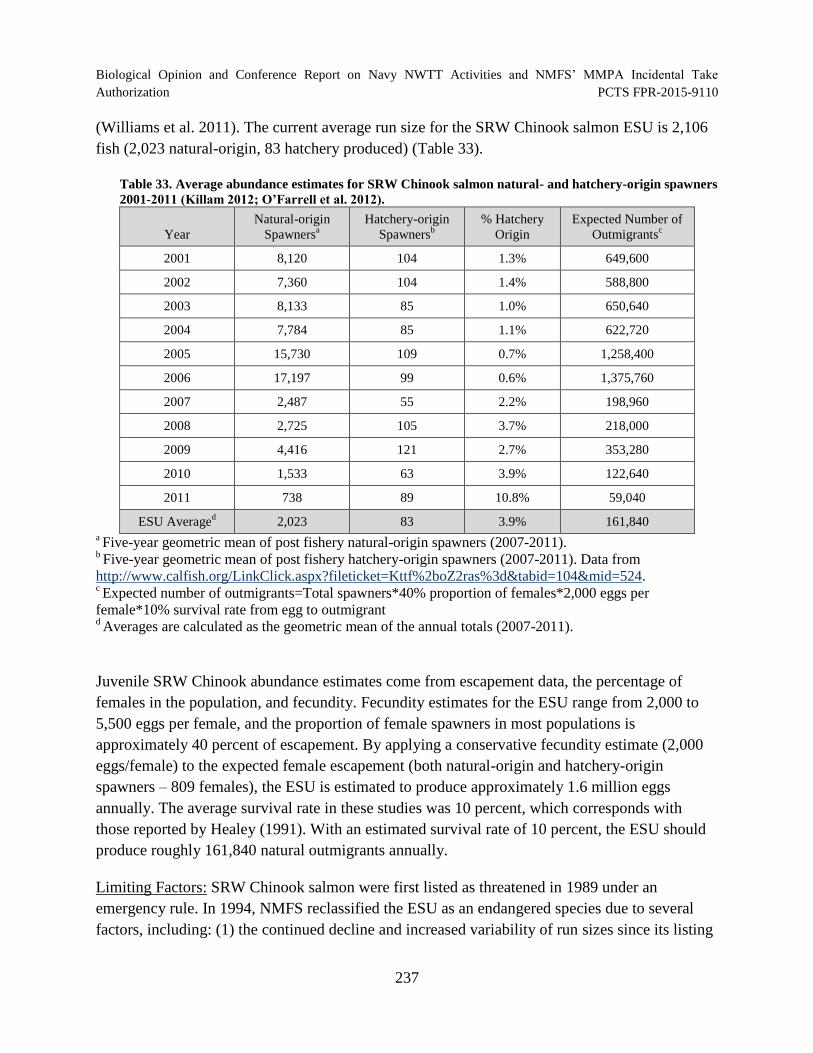
Biological Opinion and Conference Report on Navy NWTT Activities and NMFS’ MMPA Incidental Take
Authorization PCTS FPR-2015-9110
(Williams et al. 2011). The current average run size for the SRW Chinook salmon ESU is 2,106
fish (2,023 natural-origin, 83 hatchery produced) (Table 33).
Table 33. Average abundance estimates for SRW Chinook salmon natural- and hatchery-origin spawners
2001-2011 (Killam 2012; O’Farrell et al. 2012).
Year
Natural-origin
Spawnersa
Hatchery-origin
Spawnersb
% Hatchery
Origin
Expected Number of
Outmigrantsc
2001 8,120 104 1.3% 649,600
2002 7,360 104 1.4% 588,800
2003 8,133 85 1.0% 650,640
2004 7,784 85 1.1% 622,720
2005 15,730 109 0.7% 1,258,400
2006 17,197 99 0.6% 1,375,760
2007 2,487 55 2.2% 198,960
2008 2,725 105 3.7% 218,000
2009 4,416 121 2.7% 353,280
2010 1,533 63 3.9% 122,640
2011 738 89 10.8% 59,040
ESU Averaged
2,023 83 3.9% 161,840 a Five-year geometric mean of post fishery natural-origin spawners (2007-2011).
b Five-year geometric mean of post fishery hatchery-origin spawners (2007-2011). Data from
http://www.calfish.org/LinkClick.aspx?fileticket=Kttf%2boZ2ras%3d&tabid=104&mid=524. c Expected number of outmigrants=Total spawners*40% proportion of females*2,000 eggs per
female*10% survival rate from egg to outmigrant d Averages are calculated as the geometric mean of the annual totals (2007-2011).
Juvenile SRW Chinook abundance estimates come from escapement data, the percentage of
females in the population, and fecundity. Fecundity estimates for the ESU range from 2,000 to
5,500 eggs per female, and the proportion of female spawners in most populations is
approximately 40 percent of escapement. By applying a conservative fecundity estimate (2,000
eggs/female) to the expected female escapement (both natural-origin and hatchery-origin
spawners – 809 females), the ESU is estimated to produce approximately 1.6 million eggs
annually. The average survival rate in these studies was 10 percent, which corresponds with
those reported by Healey (1991). With an estimated survival rate of 10 percent, the ESU should
produce roughly 161,840 natural outmigrants annually.
Limiting Factors: SRW Chinook salmon were first listed as threatened in 1989 under an
emergency rule. In 1994, NMFS reclassified the ESU as an endangered species due to several
factors, including: (1) the continued decline and increased variability of run sizes since its listing
237
Biological Opinion and Conference Report on Navy NWTT Activities and NMFS’ MMPA Incidental Take
Authorization PCTS FPR-2015-9110
as a threatened species in 1989; (2) the expectation of weak returns in coming years as the result
of two small year classes (1991 and 1993); and (3) continuing threats to the species. NMFS
issued a final listing determination on June 28, 2005. Between the time Shasta Dam was built
and the SRW Chinook salmon were listed in 1989, major impacts to the population occurred
from warm water releases from Shasta Dam, juvenile and adult passage constraints at the RBDD,
water exports in the southern Delta, and entrainment at a large number of unscreened or poorly-
screened water diversions.
Designated critical habitat for SRW Chinook salmon has been degraded from conditions known
to support viable salmonid populations. It does not provide the full extent of conservation values
necessary for the recovery of the species. In particular, adequate river flows and water
temperatures have been impacted by human actions, substantially altering the historical river
characteristics in which the SRW Chinook salmon evolved. Depletion and storage of stream
flows behind large dams on the Sacramento River and other tributary streams have drastically
altered the natural hydrologic cycles of the Sacramento River and Delta. Alteration of flows
results in migration delays, loss of suitable habitat due to dewatering and blockage; stranding of
fish from rapid flow fluctuations; entrainment of juveniles into poorly screened or unscreened
diversions, and increased water temperatures harmful to salmonids. Other impacts of concern
include alteration of stream bank and channel morphology, loss of riparian vegetation, loss of
spawning and rearing habitat, fragmentation of habitat, loss of downstream recruitment of
spawning gravels, degradation of water quality, and loss of nutrient input.
4.2.14 Chum Salmon
Second only to Chinook salmon in adult size, chum salmon (Oncorhynchus keta) individuals
have been reported up to 3.6 feet (1.1 m) and 46 pounds (20.8 kg). However, average weight is
around 8 to 15 pounds (3.6 to 6.8 kg). Chum salmon are best known for the enormous canine-
like fangs and striking body color of spawning males (a calico pattern, with the front two-thirds
of the flank marked by a bold, jagged, reddish line and the posterior third by a jagged black line).
Females are less flamboyantly colored and lack the extreme dentition of the males. Ocean stage
chum salmon are metallic greenish-blue along the back with black speckles. They closely
resemble both sockeye and coho salmon at this stage. As chum salmon enter fresh water, their
color and appearance changes dramatically. Both sexes develop a "tiger stripe" pattern of bold
red and black stripes.
Unlike most species that rear extensively in fresh water, chum salmon form schools, presumably
to reduce predation.
Age at maturity appears to follow a latitudinal trend in which a greater number of fish mature at
a later age in the northern portion of the species' range.
238
Biological Opinion and Conference Report on Navy NWTT Activities and NMFS’ MMPA Incidental Take
Authorization PCTS FPR-2015-9110
4.2.14.1 Distribution
Chum salmon are more widely distributed than other salmon and may have at one time made up
nearly 50 percent of the Pacific salmon biomass in the Pacific Ocean (Salo 1991b). Historically,
chum salmon were distributed throughout the coastal regions of western Canada and the United
States, as far south as Monterey Bay, California, to the Arctic coast and east to the Mackenzie
River, in the Beaufort Sea. They also ranged in Asia from Korea to the Arctic coast of Russia
and west to the Lena River. Presently, major spawning populations on the west coast of the
United States are found only as far south as Tillamook Bay on the northern Oregon coast.
4.2.14.1.1 Occurrence in the NWTT Action Area
Chum salmon may occur in the Offshore Area portion of the NWTT Action Area, while the
Hood Canal summer-run ESU will occur in both Offshore Area and Inland Waters portions of
the Action Area. Additionally, nearshore critical habitat is located in the Inland Waters of the
Action Area. The Columbia River ESU will occur in the Offshore Area.
4.2.14.2 Reproduction
Spawning migrations generally occur in the summer and fall; the precise spawn timing and
migration varies across populations. Stream flows and water temperatures can influence stream
entry. Sexual differences in the timing of returns to spawning grounds are apparent, with males
generally arriving early and females later in the run. Once on the spawning grounds mate
competition is intense with males competing to fertilize eggs and females competing for optimal
nest site selection. Size and age at maturity is partially under genetic control, but can be
influenced by environment and migration behavior. Generally, spawning runs consist of fish
between 2 and 5 years of age, and like Chinook salmon, chum females will build large redds that
consist of four or five egg pockets laid in succession. Chum salmon fecundity is highly variable,
and is correlated with body size and region (latitudinal trends are evident with northern
population having lower absolute and relative fecundities)(Salo 1991b).
Size and age at maturity is partially under genetic control, but can be influenced by environment
and migration behavior. Generally, spawning runs consist of fish between 2 and 5 years of age,
and like Chinook salmon, chum females will build large redds that consist of 4 or 5 egg pockets
(Salo 1991b). Chum salmon fecundity is highly variable, and is correlated with body size and
region (latitudinal trends are evident with northern population having lower absolute and relative
fecundities) (Salo 1991b).
The time necessary for egg incubation until emergence of alevins in freshwater varies among
basins and among years within a basin, and is closely correlated to water temperatures such that
low temperatures prolong incubation. Egg and alevin survival, and the fitness of emerging fry are
239
Biological Opinion and Conference Report on Navy NWTT Activities and NMFS’ MMPA Incidental Take
Authorization PCTS FPR-2015-9110
affected by sediment loading, intergravel water flow and dissolved oxygen levels, gravel
composition, spawning time and density, and water temperatures.
Once they emerge from their gravel nests, chum salmon fry outmigrate to seawater almost
immediately (Salo 1991b).
4.2.14.3 Habitat
Chum salmon exhibit obligatory anadromy (there are no recorded landlocked or naturalized
freshwater populations), and like Chinook salmon, chum salmon are semelparous (die after one
spawning event). Chum salmon, like pink salmon, usually spawn in the lower reaches of rivers,
with redds usually dug in the mainstem or in side channels of rivers from just above tidal
influence to nearly 100 km from the sea. Juveniles outmigrate to seawater almost immediately
after emerging from the gravel that covers their redds (Salo 1991a). This ocean-type migratory
behavior contrasts with the stream-type behavior of some other species in the genus
Oncorhynchus (e.g., coastal cutthroat trout, steelhead, coho salmon, and most types of Chinook
and sockeye salmon), which usually migrate to sea at a larger size, after months or years of
freshwater rearing. This means that survival and growth in juvenile chum salmon depend less on
freshwater conditions (unlike stream-type salmonids which depend heavily on freshwater
habitats) than on favorable estuarine conditions.
Chum salmon spend two to five years in feeding areas in the northeast Pacific Ocean, which is a
greater proportion of their life history than other Pacific salmonids. Chum salmon distribute
throughout the North Pacific Ocean and Bering Sea, although North American chum salmon (as
opposed to chum salmon originating in Asia), rarely occur west of 175° E longitude (Johnson et
al. 1997). North American chum salmon migrate north along the coast in a narrow coastal band
that broadens in southeastern Alaska, although some data suggest that Puget Sound chum,
including Hood Canal summer run chum, may not make extended migrations into northern
British Columbian and Alaskan waters, but instead may travel directly offshore into the north
Pacific Ocean (Johnson et al. 1997).
Another behavioral difference between chum salmon and species that rear extensively in
freshwater is that chum salmon form schools, presumably to reduce predation (Pitcher 1986),
especially if their movements are synchronized to swamp predators (Miller and Brannon 1982).
Chum salmon are found in freshwater to euryhaline water at depths ranging from the surface to
250 m, although juveniles are primarily epipelagic and are found from the surface down to 95 m
and within 36 km of shore (Emmett et al. 1991b; Salo 1991b). The species is found at a wide
range of temperatures from 3° to 22° C but prefer temperatures from 8.3° to 15.6° C (Pauley et
al. 1988).
240
Biological Opinion and Conference Report on Navy NWTT Activities and NMFS’ MMPA Incidental Take
Authorization PCTS FPR-2015-9110
4.2.14.4 Feeding
Generally, chum fry emigrate to estuaries between March and May where they forage on
epibenthic and neritic food resources. As food resources decline and the fish grow, they move
further out to forage on pelagic and nektonic organisms (Salo 1991b; Simenstad and Salo 1982).
The timing of juvenile entry into seawater is commonly correlated with nearshore warming and
associated plankton blooms (Groot and Margolis 1991). General migratory studies indicate that
chum salmon in their first year of life will typically maintain a coastal migratory pattern although
the pattern is variable as they mature at sea. At sea, chum salmon feed on pteropods, euphausiids,
amphipods, fish, and squid larvae (Salo 1991b). Chum salmon spend two to five years in feeding
areas in the northeast Pacific Ocean, which is a greater proportion of their life history than other
Pacific salmonids.
4.2.14.5 Hearing
Although the data available on the hearing sensitivities of Pacific salmon is limited, that
information suggests that the species in the family Salmonidae have similar auditory systems and
hearing sensitivities (Popper 1977; Popper et al. 2007; Wysocki et al. 2007). Most of the data
available resulted from studies of the hearing capability of Atlantic salmon (Salmo salar), which
is a “hearing generalist” with a relatively poor sensitivity to sound (Hawkins and Johnstone
1978). Based on the information available, we assume that the chum salmon considered in this
consultation have hearing sensitivities ranging from less than 100 Hz to about 580 Hz (Hawkins
and Johnstone 1978; Knudsen et al. 1992; Knudsen et al. 1994; Popper 2008c).
4.2.14.6 Natural Threats
Chum salmon are exposed to high rates of natural predation at each life stage, particularly during
migration. Mortality at or prior to emergence is significant because eggs develop in the
interstitial spaces in the stream gravel; storm surges that redeposit gravel and wash out eggs or
introduce silt to the interstitial spaces can reduce egg survival. Other factors that reduce egg
survival and larvae development include low dissolved oxygen, poor percolation, and extreme
cold or warm temperatures. In freshwater, fry fall prey to older salmon and other trout, as well as
birds, sculpin, and various mammals; 10 percent of salmonid smolts are eaten by Caspian terns
and double-crested cormorants annually in the Columbia River estuary (NMFS 2011e).
4.2.14.7 Anthropogenic Threats
Chum salmon have declined under the combined effects of overharvests in fisheries; competition
from fish raised in hatcheries and native and non-native exotic species; dams that block their
migrations and alter river hydrology; gravel mining that impedes their migration and alters the
dynamics (hydrogeomorphology) of the rivers and streams that support juveniles; water
diversions that deplete water levels in rivers and streams; destruction or degradation of riparian
habitat that increase water temperatures in rivers and streams sufficient to reduce the survival of
241
Biological Opinion and Conference Report on Navy NWTT Activities and NMFS’ MMPA Incidental Take
Authorization PCTS FPR-2015-9110
juvenile chum salmon; and land use practices (logging, agriculture, urbanization) that destroy
wetland and riparian ecosystems while introducing sediment, nutrients, biocides, metals, and
other pollutants into surface and ground water and degrade water quality in the freshwater,
estuarine, and coastal ecosystems throughout the Pacific northwest.
Invasive fishes also threaten the survival and recovery of Pacific salmonids by competing
directly for resources, altering food webs and trophic structures, and altering evolutionary
trajectories (NMFS 2011e).
4.2.14.8 Chum Salmon ESUs
Each Chum salmon ESU is treated as a separate species under the ESA (NMFS 2005c). There
are currently four ESUs of chum, two of which (Columbia River and the Hood Canal Summer-
run) have been designated as threatened (70 FR 37161). The Puget Sound/Strait of Georgia and
Pacific Coast ESUs have not yet warranted a designation of threatened or endangered (NMFS
2005c). The distribution, as well as the status and trends, of the Chum salmon ESUs considered
in this Opinion are discussed below.
4.2.14.8.1 Columbia River Chum Salmon
The NMFS listed Columbia River chum salmon as threatened on March 25, 1999, and reaffirmed
their status on June 28, 2005 (71 FR 37160).
Spatial Structure and Diversity: Columbia River (CR) chum includes all naturally-spawned
populations of chum salmon in the Columbia River and its tributaries in Washington and
Oregon, and progeny of three artificial propagation programs. The WLC-TRT identified 17
historical populations of CR chum salmon and aggregated these into four strata (Myers et al.
2006). CR chum salmon spawning aggregations identified in the mainstem Columbia River were
included in the population associated with the nearest river basin.
The very low persistence probabilities or possible extirpations of most chum salmon populations
are due to low abundance, productivity, spatial structure, and diversity. Although, hatchery
production of chum salmon has been limited and hatchery effects on diversity are thought to
have been relatively small, diversity has been greatly reduced at the ESU level because of
presumed extirpations and the low abundance in the remaining populations (fewer than 100
spawners per year for most populations) (Lower Columbia Fish Recovery Board 2010a; NMFS
2013). The Lower Gorge population meets abundance and productivity criteria for very high
levels of viability, but the distribution of spawning habitat (i.e., spatial structure) for the
population has been significantly reduced (Lower Columbia Fish Recovery Board 2010a); spatial
structure may need to be improved, at least in part, through better performance from the Oregon
portion of the population (NMFS 2013).
242
Biological Opinion and Conference Report on Navy NWTT Activities and NMFS’ MMPA Incidental Take
Authorization PCTS FPR-2015-9110
Abundance and Productivity: Of the 17 populations that historically made up this ESU, 15 of
them (six in Oregon and nine in Washington) are so depleted that either their baseline probability
of persistence is very low or they are extirpated or nearly so (Ford 2011b; Lower Columbia Fish
Recovery Board 2010a; NMFS 2013; ODFW 2010a). All three strata in the ESU fall
significantly short of the WLC-TRT criteria for viability. Currently almost all natural production
occurs in just two populations: the Grays/Chinook and the Lower Gorge. The Grays/Chinook
population has a moderate persistence probability, and the Lower Gorge population has a high
probability of persistence (Lower Columbia Fish Recovery Board 2010a; NMFS 2013).
WDFW regularly monitors several natural “index” populations in the basin, in Grays River, two
in small streams near Bonneville Dam, and the mainstem area next to those two streams.
Average annual natural escapement to the index spawning areas was approximately 1,300 fish
from 1990 through 1998. The WDFW surveyed other (nonindex) areas in 1998 and found only
small numbers of chum salmon (typically less than 10 fish per stream) in Elochoman, Abernathy,
Germany, St. Cloud, and Tanner Creeks and in the North Fork Lewis and the Washougal Rivers.
Consistent with the BRT status review (Ford 2011a), the ODFW recovery plan concluded that
chum are extirpated or nearly so in all Oregon Columbia River populations (ODFW 2010a). A
few chum are occasionally encountered during surveys or return to hatchery collection facilities,
but these are likely either strays from one of the Washington populations or part of a few
extremely small and erratic remnant populations. Recent estimates for the lower Columbia Gorge
and Grays River chum salmon populations range from 10,000 to 20,000 adults. WDFW
spawning surveys in the Grays/Chinook, Washougal, Lower Gorge, and Upper Gorge
populations estimated an average of 8,508 adult chum for the years 2007 to 2011 (WDFW 2014).
We do not have recent adult abundance data for any of the other populations.
The NWFSC publishes juvenile abundance estimates each year in the annual memorandum
estimating percentages of listed Pacific salmon and steelhead smolts arriving at various locations
in the Columbia River basin. Numbers for 2015 are not available at this time; however the
average outmigration for the years 2010 to 2014 is shown in Table 34 (Dey 2012; Ferguson
2010; Zabel 2014a; Zabel 2014b).
Table 34. Average estimated outmigration for ESA-listed CR chum salmon (2010-2014).
Origin Outmigration
Natural 2,978,550
Listed hatchery intact adipose 391,973
Listed hatchery adipose clipped 0
Limiting Factors include (NMFS 2013; NOAA Fisheries 2011):
243
Biological Opinion and Conference Report on Navy NWTT Activities and NMFS’ MMPA Incidental Take
Authorization PCTS FPR-2015-9110
Degraded estuarine and nearshore marine habitat resulting from cumulative impacts of
land use and flow management by the Columbia River hydropower system
Degraded freshwater habitat, in particular of floodplain connectivity and function,
channel structure and complexity, stream substrate, and riparian areas and large wood
recruitment as a result of cumulative impacts of agriculture, forestry, and development
Degraded stream flow as a result of hydropower and water supply operations
Loss of access and loss of some habitat types as a result of passage barriers such as roads
and railroads
Reduced water quality
Current or potential predation from hatchery-origin salmonids, including coho salmon
An altered flow regime and Columbia River plume has altered the temperature regime
and estuarine food web, and has reduced ocean productivity
Reduced access to off-channel rearing habitat in the lower Columbia River
Reduced productivity resulting from sediment and nutrient-related changes in the estuary
Juvenile fish strandings that result from ship wakes
Contaminants affecting fish health and reproduction
4.2.14.8.2 Hood Canal Summer-run Chum Salmon
The NMFS listed Hood Canal summer-run chum salmon as threatened on March 25, 1999 (64
FR 14508), and reaffirmed this status on June 28, 2005 (70 FR 37160).
Spatial Structure and Diversity: Hood Canal summer (HCS) chum includes all naturally spawned
populations of summer-run chum salmon in Hood Canal and its tributaries; populations in
Olympic Peninsula rivers between Hood Canal and Dungeness Bay, Washington; and progeny of
eight artificial propagation programs. The Strait of Juan de Fuca population spawns in rivers and
streams entering the eastern Strait and Admiralty Inlet. The HCS chum population includes all
spawning aggregations within the Hood Canal area (Hood Canal Coordinating Council 2005;
NMFS 2007b). The Puget Sound Technical Recovery Team (PS-TRT) identified two
independent populations of HCS chum salmon (NMFS 2007a), which include 16 historical
stocks or spawning aggregations (including eight that are extant), based on consideration of
historical distribution, geographic isolation, dispersal rates, genetic data, life history information,
population dynamics, and environmental and ecological diversity. The historical populations
included at least those 16 spawning aggregation units and likely some additional undocumented
and less-persistent aggregations (NMFS 2007a). Programs are underway to reintroduce summer-
run chum salmon to several of the watersheds where stocks were lost.
Diversity is increasing from the low values seen in the 1990s, due both to the reintroduction of
spawning aggregates and the more uniform relative abundance between populations; this is a
good sign for viability in terms of spatial structure and diversity. Spawning survey data shows
that the spawning distribution within most streams has been extended farther upstream as
244
Biological Opinion and Conference Report on Navy NWTT Activities and NMFS’ MMPA Incidental Take
Authorization PCTS FPR-2015-9110
abundance has increased (WDFW and Point No Point Treaty Tribes 2007). Estimates of
population viability from three time periods (brood years 1971 to 2006, 1985 to 2006, and 1990
to 2006) all indicate that Hood Canal and Strait of Juan de Fuca populations of summer-run
chum salmon are not currently viable (Ford 2011b).
Abundance and Productivity: Overall, the new information considered does not indicate a change
in the biological risk category since the last status review in 2005 (Ford 2011b). The spawning
abundance of this species has clearly increased since the time of listing, although the recent
abundance is down from the previous 5 years. However, productivity in the last 5-year period
(2002 through 2006) has been very low, especially compared to the relatively high productivity
in the 5 to 10 previous years (WDFW and Point No Point Treaty Tribes 2007). This is a concern
for viability. Since abundance is increasing and productivity is decreasing, improvements in
habitat and ecosystem function likely are needed.
The current average run size of 21,008 HCS chum adult spawners (17,556 natural-origin and
3,452 hatchery origin spawners; Table 23) is largely the result of aggressive reintroduction and
supplementation programs throughout the ESU. In the Strait of Juan de Fuca population, the
annual natural-origin spawners returns for Jimmycomelately Creek dipped to a single fish in
1999 and again in 2002 (unpublished data, Mindy Rowse, NWFSC, Nov. 25, 2014; as cited in
NMFS 2015). From 2009 to 2013, Jimmycomelately Creek averaged 1,058 natural-origin
spawners. Salmon and Snow Creeks have improved substantially. Natural-origin spawner
abundance was 130 fish in 1999, whereas the average for Salmon and Snow creeks were 2,171
and 405, respectively, for the 2009 to 2013 period.
245
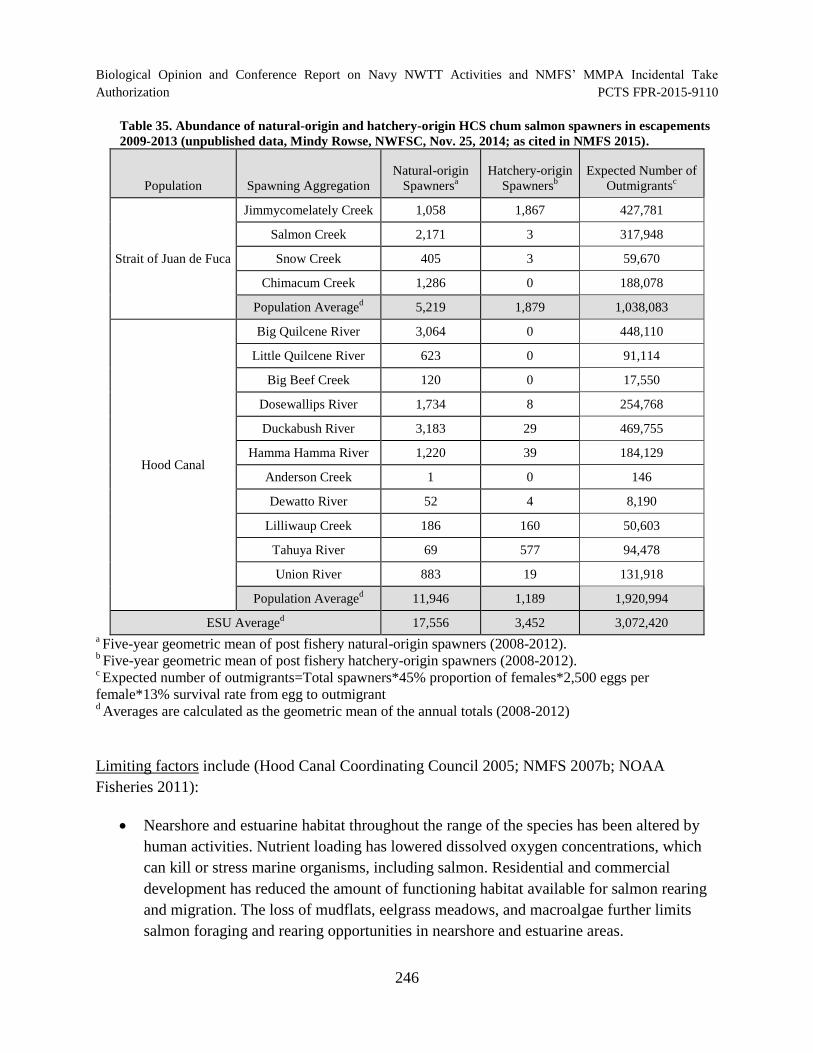
Biological Opinion and Conference Report on Navy NWTT Activities and NMFS’ MMPA Incidental Take
Authorization PCTS FPR-2015-9110
Table 35. Abundance of natural-origin and hatchery-origin HCS chum salmon spawners in escapements
2009-2013 (unpublished data, Mindy Rowse, NWFSC, Nov. 25, 2014; as cited in NMFS 2015).
Population Spawning Aggregation
Natural-origin
Spawnersa
Hatchery-origin
Spawnersb
Expected Number of
Outmigrantsc
Strait of Juan de Fuca
Jimmycomelately Creek 1,058 1,867 427,781
Salmon Creek 2,171 3 317,948
Snow Creek 405 3 59,670
Chimacum Creek 1,286 0 188,078
Population Averaged
5,219 1,879 1,038,083
Hood Canal
Big Quilcene River 3,064 0 448,110
Little Quilcene River 623 0 91,114
Big Beef Creek 120 0 17,550
Dosewallips River 1,734 8 254,768
Duckabush River 3,183 29 469,755
Hamma Hamma River 1,220 39 184,129
Anderson Creek 1 0 146
Dewatto River 52 4 8,190
Lilliwaup Creek 186 160 50,603
Tahuya River 69 577 94,478
Union River 883 19 131,918
Population Averaged
11,946 1,189 1,920,994
ESU Averaged
17,556 3,452 3,072,420 a Five-year geometric mean of post fishery natural-origin spawners (2008-2012).
b Five-year geometric mean of post fishery hatchery-origin spawners (2008-2012).
c Expected number of outmigrants=Total spawners*45% proportion of females*2,500 eggs per
female*13% survival rate from egg to outmigrant d Averages are calculated as the geometric mean of the annual totals (2008-2012)
Limiting factors include (Hood Canal Coordinating Council 2005; NMFS 2007b; NOAA
Fisheries 2011):
Nearshore and estuarine habitat throughout the range of the species has been altered by
human activities. Nutrient loading has lowered dissolved oxygen concentrations, which
can kill or stress marine organisms, including salmon. Residential and commercial
development has reduced the amount of functioning habitat available for salmon rearing
and migration. The loss of mudflats, eelgrass meadows, and macroalgae further limits
salmon foraging and rearing opportunities in nearshore and estuarine areas.
246
Biological Opinion and Conference Report on Navy NWTT Activities and NMFS’ MMPA Incidental Take
Authorization PCTS FPR-2015-9110
Degraded freshwater habitat: Floodplain connectivity and function, channel structure and
complexity, riparian areas and large wood supply, stream substrate, and stream flow have
been degraded as a result of cumulative impacts of agriculture, forestry, and
development.
4.2.15 Coho Salmon
Coho salmon (Oncorhynchus kisutch) have dark metallic blue or greenish backs with silver sides
and a light belly and there are small black spots on the back and upper lobe of the tail while in
the ocean. The gumline in the lower jaw has lighter pigment than does the Chinook salmon.
Spawning fish in inland rivers are dark with reddish-maroon coloration on the sides. Adult coho
salmon may measure more than 2 feet (61 cm) in length and can weigh up to 36 pounds (16 kg).
However, the average weight of adult coho is 8 pounds (3.6 kg).
4.2.15.1 Species Distribution
Coho salmon occur naturally in most major river basins around the North Pacific Ocean from
central California to northern Japan (Laufle et al. 1986).
4.2.15.1.1 Occurrence in the NWTT Action Area
All Coho salmon ESUs may occur in Offshore waters of the NWTT Action Area. Juvenile coho
salmon are found in high concentrations within 60 km of the Washington, Oregon, and
California coast, with a majority of those fish found within 37 km of the coast (Pearcy 1992;
Pearcy and Fisher 1990). Adults of the Lower Columbia, Oregon Coast, and Southern Oregon
and Northern California Coasts ESUs will occur in the Offshore Area.
4.2.15.2 Reproduction
Coho salmon adults migrate from a marine environment into freshwater streams and rivers of
their birth in order to mate (called anadromy). They spawn only once and then die (called
semelparity). Adults return to their stream of origin to spawn and die, usually at around three
years old. Some precocious males known as "jacks" return as two-year-old spawners. Typically
Coho salmon spawn from November to January, although there are many exceptions throughout
their range. Spawning duration usually spans about three months in most basins, with individual
fish actively spawning for several days to weeks. Spawning occurs in a few third-order streams,
but most spawning activity occurs in fourth- and fifth-order streams.
Spawning males develop a strongly hooked snout and large teeth. Females prepare several redds
(nests) where the eggs will remain for six to seven weeks until they hatch. As with other Pacific
salmon, Coho salmon fecundity varies with the size of the fish and latitudinally with Coho
salmon in northern climes generally exhibiting higher rates of fecundity (Sandercock 1991).
247
Biological Opinion and Conference Report on Navy NWTT Activities and NMFS’ MMPA Incidental Take
Authorization PCTS FPR-2015-9110
4.2.15.3 Habitat
The typical life history of Coho salmon is similar to most of the other large bodied Pacific
salmonids, in so much as adult fish spawn in the fall and winter, young emerge in the spring, rear
in freshwater and saltwater and return to spawn as adults. Sympatric in many river basins with
Chinook, chum, sockeye, and pink salmon, partitioning occurs through the species’ use of
different areas of a river for reproduction and rearing, and the length of time they spend in these
ecosystems. For instance, Chinook salmon spawn in fast flowing mainstem riverine reaches with
large substrate; sockeye salmon spawn in rivers and lakes, and chum salmon spawn in mid- to
lower reaches of rivers and have been observed spawning in areas of tidal influence. Coho
salmon characteristically spawn in tributaries and slow-flowing shallow creeks in tributaries with
gradients of 3 percent or less, which may be fed by cool groundwater sources, and are often
widely dispersed within watersheds. Adult Coho salmon may remain in freshwater three or more
months before spawning, with early migrants often moving farther upstream (Sandercock 1991).
Most Coho salmon enter rivers between September and February, but entry is influenced by
discharge and other factors. In many river systems, Coho salmon are unable to enter the rivers
until sufficiently strong flows open passages and provide sufficient depth. First fall freshets
combined with high tides trigger the upstream migration of Coho salmon in many basins. Until
then, if river flows are low or warm summer temperatures persist, fish may congregate in pools
near the mouth of the river or natal stream until conditions change.
Rates of incubation are largely temperature dependent: colder water temperatures will slow
development. Generally, in optimal temperatures eggs incubate for about 35 to 50 days, and fry
start emerging from the gravel two to three weeks after hatching. Incubation and emergence
success are also influenced by dissolved oxygen levels, sediment loading, and scouring high
flows. Following emergence, fry aggregate and move to shallow areas near the stream banks.
Most Coho salmon rear in freshwater for about 15 to 18 months. As fry grow, they disperse up-
and downstream to establish and defend territories. Juvenile rearing usually occurs in tributaries
with gradients of 3 percent or less, although they may move to streams with gradients of 4 to 5
percent. Juvenile Coho salmon are often found in small streams less than five feet wide, and may
migrate considerable distances to rear in lakes and off-channel ponds. During the summer, fry
prefer pools featuring adequate cover such as large woody debris, undercut banks, and
overhanging vegetation. Overwintering tends to occur in larger pools, backwater areas, and off
stream channels and ponds (e.g., wall-based channels that are groundwater fed).
At not quite 2 years of age, Coho salmon will migrate downstream where they undergo the
physiological transition to salt water. The outmigration of smolts begins as early as February and
may continue through the summer and fall, with peak outmigration often between March and
June, although this varies among basins and environmental conditions (Sandercock 1991).
Several weeks are spent in coastal waters prior to northward migration (PFMC 2000b). This is
248
Biological Opinion and Conference Report on Navy NWTT Activities and NMFS’ MMPA Incidental Take
Authorization PCTS FPR-2015-9110
particularly true for Coho originating from Oregonian streams, whose northward movement is
generally delayed by strong southerly currents which weaken in the winter months (PFMC
2000b). Once in the ocean, Coho salmon generally migrate north along the coast in a narrow
coastal band that broadens in southeastern Alaska. During this migration, juvenile Coho salmon
tend to occur in both coastal and offshore waters. During spring and summer, Coho salmon will
forage in waters between 46º N, the Gulf of Alaska, and along Alaska’s Aleutian Islands (PFMC
2000b). Coho salmon are found in depths ranging from the surface to 250 m, but individuals in
the open ocean generally stay within 30 m of the surface (Emmett et al. 1991b). Juveniles occur
at even shallower depths (<10 m)(PFMC 2000b). Juveniles are also found closer to shore;
generally within 74 km (NMFS-NWR 2005; PFMC 2000b). However, adults have been tracked
well beyond the EEZ off Oregon (PFMC 2000b). In years of weak upwelling, individuals tend to
concentrate over submarine canyons and areas of more permanent upwelling, while strong
upwelling years result in more dispersed stocks. Acceptable temperature regimes run from 4° to
15.2° C, but optimal range is between 8° and 12° C (Emmett et al. 1991b).
4.2.15.4 Feeding
Coho salmon are opportunistic feeders. While at sea, Coho salmon tend to eat fish, including
herring, sand lance, sticklebacks, sardines, shrimp and surf smelt (Emmett et al. 1991b). While in
estuaries and in freshwater Coho salmon are significant predators of Chinook, pink, and chum
salmon, as well as aquatic and terrestrial insects. Smaller fish, such as fry, eat chironomids,
plecopterans, and other larval insects, and typically use visual cues to find their prey. Juveniles
appear to prefer to feed in upwelled oceanic waters, although they are also present in eddy
systems (Pool et al. 2008). Oceanic juveniles commonly feed upon euphausiids, chaetognaths,
and decapod megalopae in these locations (Brodeur et al. 2010; Pool et al. 2008).
4.2.15.5 Hearing
Although the data available on the hearing sensitivities of Pacific salmon is limited, that
information suggests that the species in the family Salmonidae have similar auditory systems and
hearing sensitivities (Popper 1977; Popper et al. 2007; Wysocki et al. 2007). Most of the data
available resulted from studies of the hearing capability of Atlantic salmon (Salmo salar), which
is a “hearing generalist” with a relatively poor sensitivity to sound (Hawkins and Johnstone
1978). Based on the information available, we assume that the coho salmon considered in this
consultation have hearing sensitivities ranging from less than 100 Hz to about 580 Hz (Hawkins
and Johnstone 1978; Knudsen et al. 1992; Knudsen et al. 1994).
4.2.15.6 Natural Threats
Coho salmon, like other salmon, are exposed to high rates of natural predation at each life stage.
Winter mortality may be significant for Coho salmon because they overwinter in freshwater,
where they can be swept downstream from freshets or eaten by raccoon, cutthroat trout, or other
249
Biological Opinion and Conference Report on Navy NWTT Activities and NMFS’ MMPA Incidental Take
Authorization PCTS FPR-2015-9110
small animals. Once Coho reach the ocean, survival is high (Sandercock 1991). In freshwater, fry
fall prey to older steelhead and other trout, as well as birds, sculpin, and various mammals; 10
percent of salmonid smolts are eaten by Caspian terns and double-crested cormorants annually in
the Columbia River estuary (NMFS 2011e).
4.2.15.7 Anthropogenic Threats
Coho salmon have declined under the combined effects of overharvests in fisheries; competition
from fish raised in hatcheries and native and non-native exotic species; dams that block their
migrations and alter river hydrology; gravel mining that impedes their migration and alters the
dynamics (hydrogeomorphology) of the rivers and streams that support juveniles; water
diversions that deplete water levels in rivers and streams; destruction or degradation of riparian
habitat that increase water temperatures in rivers and streams sufficient to reduce the survival of
juvenile Coho salmon; and land use practices (logging, agriculture, urbanization) that destroy
wetland and riparian ecosystems while introducing sediment, nutrients, biocides, metals, and
other pollutants into surface and ground water and degrade water quality in the fresh water,
estuarine, and coastal ecosystems throughout the species range. Invasive fishes also threaten the
survival and recovery of Pacific salmonids by competing directly for resources, altering food
webs and trophic structures, and altering evolutionary trajectories (NMFS 2011e).
4.2.15.8 Coho Salmon ESUs
Each Coho salmon ESU is treated as a separate species under the ESA (NMFS 2005c). There are
currently seven ESUs of coho salmon in Washington, Oregon, and California (NMFS 2005c). Of
these ESUs, one is endangered (Central California Coast), and three are threatened (Northern
California-Southern Oregon Coasts, Lower Columbia River and Oregon Coast) (NMFS 2005c)
(70 FR 37160).
4.2.15.8.1 Lower Columbia River Coho Salmon
The NMFS listed Lower Columbia River Coho salmon as endangered on June 28, 2005 (70 FR
37160).
Spatial Structure and Diversity: Lower Columbia River (LCR) coho includes all naturally-
spawned populations of coho salmon in the Columbia River and its tributaries in Washington and
Oregon, from the mouth of the Columbia up to and including the Big White Salmon and Hood
rivers; in the Willamette River to Willamette Falls, Oregon; and progeny of 25 artificial
250
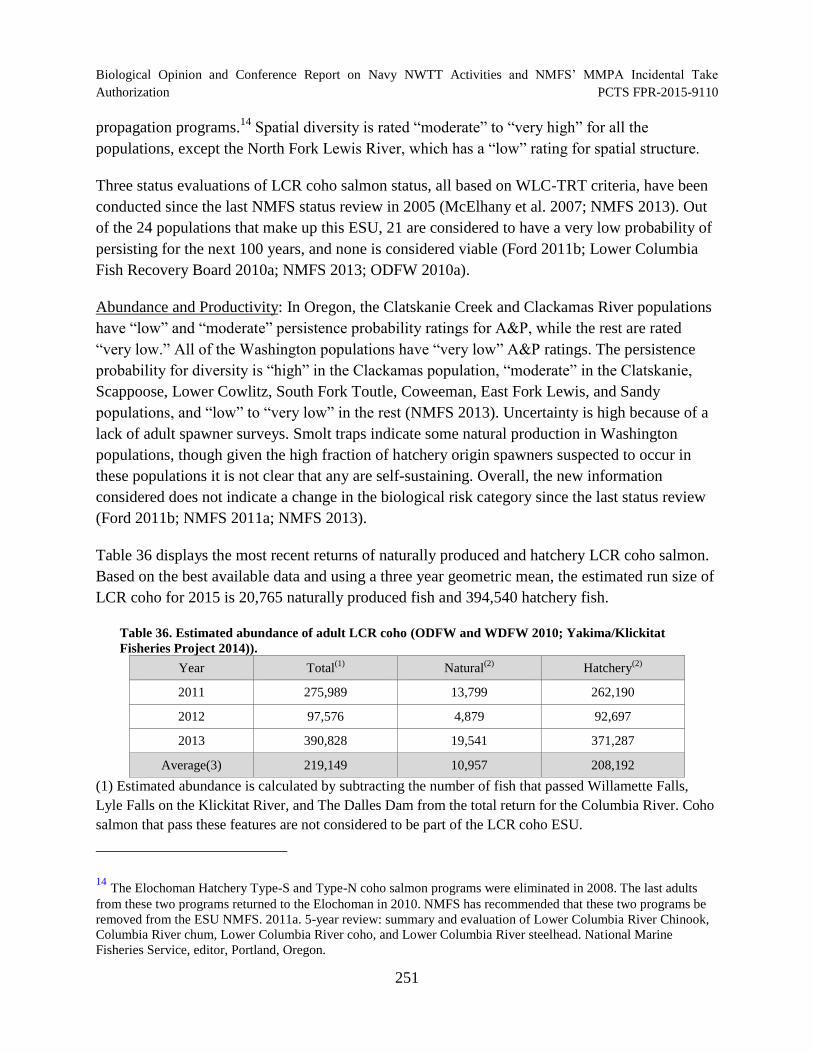
Biological Opinion and Conference Report on Navy NWTT Activities and NMFS’ MMPA Incidental Take
Authorization PCTS FPR-2015-9110
propagation programs.14
Spatial diversity is rated “moderate” to “very high” for all the
populations, except the North Fork Lewis River, which has a “low” rating for spatial structure.
Three status evaluations of LCR coho salmon status, all based on WLC-TRT criteria, have been
conducted since the last NMFS status review in 2005 (McElhany et al. 2007; NMFS 2013). Out
of the 24 populations that make up this ESU, 21 are considered to have a very low probability of
persisting for the next 100 years, and none is considered viable (Ford 2011b; Lower Columbia
Fish Recovery Board 2010a; NMFS 2013; ODFW 2010a).
Abundance and Productivity: In Oregon, the Clatskanie Creek and Clackamas River populations
have “low” and “moderate” persistence probability ratings for A&P, while the rest are rated
“very low.” All of the Washington populations have “very low” A&P ratings. The persistence
probability for diversity is “high” in the Clackamas population, “moderate” in the Clatskanie,
Scappoose, Lower Cowlitz, South Fork Toutle, Coweeman, East Fork Lewis, and Sandy
populations, and “low” to “very low” in the rest (NMFS 2013). Uncertainty is high because of a
lack of adult spawner surveys. Smolt traps indicate some natural production in Washington
populations, though given the high fraction of hatchery origin spawners suspected to occur in
these populations it is not clear that any are self-sustaining. Overall, the new information
considered does not indicate a change in the biological risk category since the last status review
(Ford 2011b; NMFS 2011a; NMFS 2013).
Table 36 displays the most recent returns of naturally produced and hatchery LCR coho salmon.
Based on the best available data and using a three year geometric mean, the estimated run size of
LCR coho for 2015 is 20,765 naturally produced fish and 394,540 hatchery fish.
Table 36. Estimated abundance of adult LCR coho (ODFW and WDFW 2010; Yakima/Klickitat
Fisheries Project 2014)).
Year Total(1)
Natural(2)
Hatchery(2)
2011 275,989 13,799 262,190
2012 97,576 4,879 92,697
2013 390,828 19,541 371,287
Average(3) 219,149 10,957 208,192
(1) Estimated abundance is calculated by subtracting the number of fish that passed Willamette Falls,
Lyle Falls on the Klickitat River, and The Dalles Dam from the total return for the Columbia River. Coho
salmon that pass these features are not considered to be part of the LCR coho ESU.
The Elochoman Hatchery Type-S and Type-N coho salmon programs were eliminated in 2008. The last adults
from these two programs returned to the Elochoman in 2010. NMFS has recommended that these two programs be
removed from the ESU NMFS. 2011a. 5-year review: summary and evaluation of Lower Columbia River Chinook,
Columbia River chum, Lower Columbia River coho, and Lower Columbia River steelhead. National Marine
Fisheries Service, editor, Portland, Oregon.
251
14
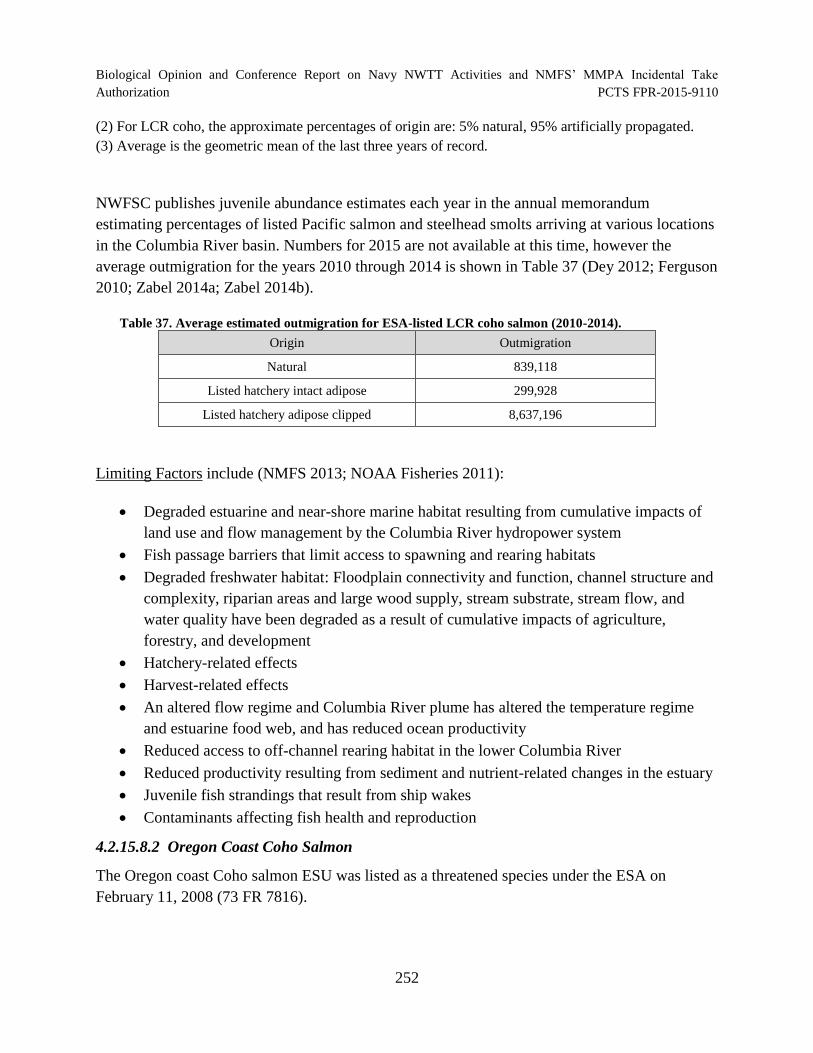
Biological Opinion and Conference Report on Navy NWTT Activities and NMFS’ MMPA Incidental Take
Authorization PCTS FPR-2015-9110
(2) For LCR coho, the approximate percentages of origin are: 5% natural, 95% artificially propagated.
(3) Average is the geometric mean of the last three years of record.
NWFSC publishes juvenile abundance estimates each year in the annual memorandum
estimating percentages of listed Pacific salmon and steelhead smolts arriving at various locations
in the Columbia River basin. Numbers for 2015 are not available at this time, however the
average outmigration for the years 2010 through 2014 is shown in Table 37 (Dey 2012; Ferguson
2010; Zabel 2014a; Zabel 2014b).
Table 37. Average estimated outmigration for ESA-listed LCR coho salmon (2010-2014).
Origin Outmigration
Natural 839,118
Listed hatchery intact adipose 299,928
Listed hatchery adipose clipped 8,637,196
Limiting Factors include (NMFS 2013; NOAA Fisheries 2011):
Degraded estuarine and near-shore marine habitat resulting from cumulative impacts of
land use and flow management by the Columbia River hydropower system
Fish passage barriers that limit access to spawning and rearing habitats
Degraded freshwater habitat: Floodplain connectivity and function, channel structure and
complexity, riparian areas and large wood supply, stream substrate, stream flow, and
water quality have been degraded as a result of cumulative impacts of agriculture,
forestry, and development
Hatchery-related effects
Harvest-related effects
An altered flow regime and Columbia River plume has altered the temperature regime
and estuarine food web, and has reduced ocean productivity
Reduced access to off-channel rearing habitat in the lower Columbia River
Reduced productivity resulting from sediment and nutrient-related changes in the estuary
Juvenile fish strandings that result from ship wakes
Contaminants affecting fish health and reproduction
4.2.15.8.2 Oregon Coast Coho Salmon
The Oregon coast Coho salmon ESU was listed as a threatened species under the ESA on
February 11, 2008 (73 FR 7816).
252
Biological Opinion and Conference Report on Navy NWTT Activities and NMFS’ MMPA Incidental Take
Authorization PCTS FPR-2015-9110
Spatial Structure and Diversity: Oregon coast (OC) coho includes populations of coho salmon in
Oregon coastal streams south of the Columbia River and north of Cape Blanco. The Cow Creek
stock (South Umpqua population) is included as part of the ESU because the original brood stock
was founded from the local, natural origin population and natural origin coho salmon have been
incorporated into the brood stock on a regular basis. The OC-TRT identified 56 populations; 21
independent and 35 dependent. The dependent populations were dependent on strays from other
populations to maintain them over long time periods. The TRT also identified 5 biogeographic
strata (Lawson et al. 2007).
A 2010 BRT noted significant improvements in hatchery and harvest practices have been made
(Stout et al. 2012). However, harvest and hatchery reductions have changed the population
dynamics of the ESU. Current concerns for spatial structure focus on the Umpqua River. Of the
four populations in the Umpqua stratum, the North Umpqua and South Umpqua were of
particular concern. The North Umpqua is controlled by Winchester Dam and has historically
been dominated by hatchery fish. Hatchery influence has recently been reduced, but the natural
productivity of this population remains to be demonstrated. The South Umpqua is a large, warm
system with degraded habitat. Spawner distribution appears to be seriously restricted in this
population, and it is probably the most vulnerable of any population in this ESU to increased
temperatures.
Current status of diversity shows improvement through the waning effects of hatchery fish on
populations of OC coho salmon. In addition, recent efforts in several coastal estuaries to restore
lost wetlands should be beneficial. However, diversity is lower than it was historically because of
the loss of both freshwater and tidal habitat loss coupled with the restriction of diversity from
very low returns over the past 20 years.
Abundance and Productivity: It has not been demonstrated that productivity during periods of
poor marine survival is now adequate to sustain the ESU. Recent increases in adult escapement
do not provide strong evidence that the century-long downward trend has changed. The ability of
the OC coho salmon ESU to survive another prolonged period of poor marine survival remains
in question. Wainwright (2008) determined that the weakest strata of OC coho salmon were in
the North Coast and Mid-Coast of Oregon, which had only “low” certainty of being persistent.
The strongest strata were the Lakes and Mid-South Coast, which had “high” certainty of being
persistent. To increase certainty that the ESU as a whole is persistent, they recommended that
restoration work should focus on those populations with low persistence, particularly those in the
North Coast, Mid-Coast, and Umpqua strata.
While we currently lack data on how many natural juvenile coho salmon this ESU produces, it is
possible to make rough estimates of juvenile abundance from adult return data. The three-year
average of natural origin spawners for the years 2010 to 2012 is estimated at 229,872 total
253
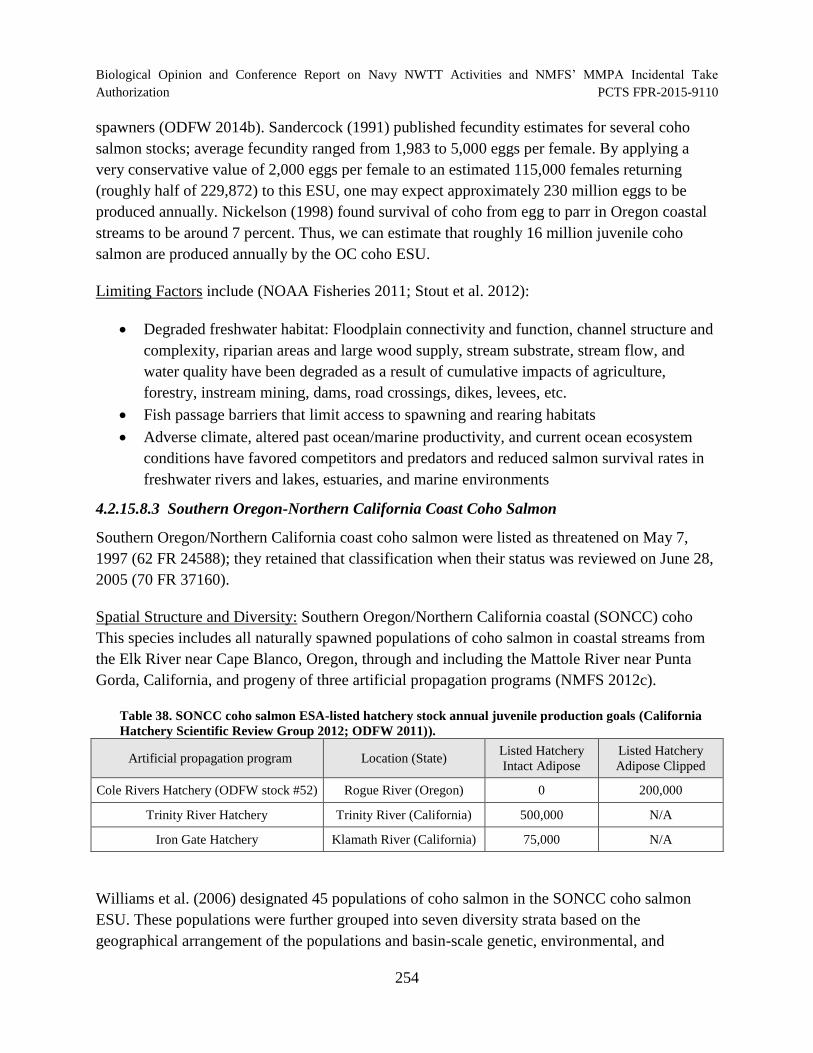
Biological Opinion and Conference Report on Navy NWTT Activities and NMFS’ MMPA Incidental Take
Authorization PCTS FPR-2015-9110
spawners (ODFW 2014b). Sandercock (1991) published fecundity estimates for several coho
salmon stocks; average fecundity ranged from 1,983 to 5,000 eggs per female. By applying a
very conservative value of 2,000 eggs per female to an estimated 115,000 females returning
(roughly half of 229,872) to this ESU, one may expect approximately 230 million eggs to be
produced annually. Nickelson (1998) found survival of coho from egg to parr in Oregon coastal
streams to be around 7 percent. Thus, we can estimate that roughly 16 million juvenile coho
salmon are produced annually by the OC coho ESU.
Limiting Factors include (NOAA Fisheries 2011; Stout et al. 2012):
Degraded freshwater habitat: Floodplain connectivity and function, channel structure and
complexity, riparian areas and large wood supply, stream substrate, stream flow, and
water quality have been degraded as a result of cumulative impacts of agriculture,
forestry, instream mining, dams, road crossings, dikes, levees, etc.
Fish passage barriers that limit access to spawning and rearing habitats
Adverse climate, altered past ocean/marine productivity, and current ocean ecosystem
conditions have favored competitors and predators and reduced salmon survival rates in
freshwater rivers and lakes, estuaries, and marine environments
4.2.15.8.3 Southern Oregon-Northern California Coast Coho Salmon
Southern Oregon/Northern California coast coho salmon were listed as threatened on May 7,
1997 (62 FR 24588); they retained that classification when their status was reviewed on June 28,
2005 (70 FR 37160).
Spatial Structure and Diversity: Southern Oregon/Northern California coastal (SONCC) coho
This species includes all naturally spawned populations of coho salmon in coastal streams from
the Elk River near Cape Blanco, Oregon, through and including the Mattole River near Punta
Gorda, California, and progeny of three artificial propagation programs (NMFS 2012c).
Table 38. SONCC coho salmon ESA-listed hatchery stock annual juvenile production goals (California
Hatchery Scientific Review Group 2012; ODFW 2011)).
Artificial propagation program Location (State) Listed Hatchery
Intact Adipose
Listed Hatchery
Adipose Clipped
Cole Rivers Hatchery (ODFW stock #52) Rogue River (Oregon) 0 200,000
Trinity River Hatchery Trinity River (California) 500,000 N/A
Iron Gate Hatchery Klamath River (California) 75,000 N/A
Williams et al. (2006) designated 45 populations of coho salmon in the SONCC coho salmon
ESU. These populations were further grouped into seven diversity strata based on the
geographical arrangement of the populations and basin-scale genetic, environmental, and
254
Biological Opinion and Conference Report on Navy NWTT Activities and NMFS’ MMPA Incidental Take
Authorization PCTS FPR-2015-9110
ecological characteristics. Across the coastal basins of the SONCC Coho Salmon ESU, there
existed sufficient geographical and environmental variability resulting in the TRT dividing the
coastal basins into three sub-strata. The northern sub-stratum includes basins from the Elk River
to the Winchuck River, including the lower portion of the Rogue River. The central substratum
includes coastal basins from the Smith River to the Mad River, including the lower portion of the
Klamath River. The southern stratum includes the Humboldt Bay tributaries south to the Mattole
River, including the lower Eel River and Van Duzen River.
Abundance and Productivity: Although long-term data on abundance of SONCC coho salmon
are scarce, available evidence from shorter-term research and monitoring efforts indicate that
conditions have worsened for populations since the last formal status review was published
(Williams et al. 2011). Because the extinction risk of an ESU depends upon the extinction risk of
its constituent independent populations and the population abundance of most independent
populations are below their depensation threshold, the SONCC coho salmon ESU is at high risk
of extinction and is not viable (Williams et al. 2011).
Recent returns of naturally-produced adults to the Rogue, Trinity, Shasta, and Scott rivers have
been highly variable. Wild coho salmon estimates derived from the beach seine surveys at
Huntley Park on the Rogue River ranged from 414 to 24,481 naturally produced adults between
2003 and 2012 (Table 39). Similar fluctuation are noted in the Trinity, Shasta, and Scott river
populations. Overall, the average annual abundance, for populations where we have abundance
data, of naturally produced fish is only 5,586. However, abundance data is lacking for the Eel,
Smith, and Chetco rivers, the other major populations in the ESU, as well as the numerous
smaller coastal populations. Actual abundance is therefore likely to be higher than this estimate.
255
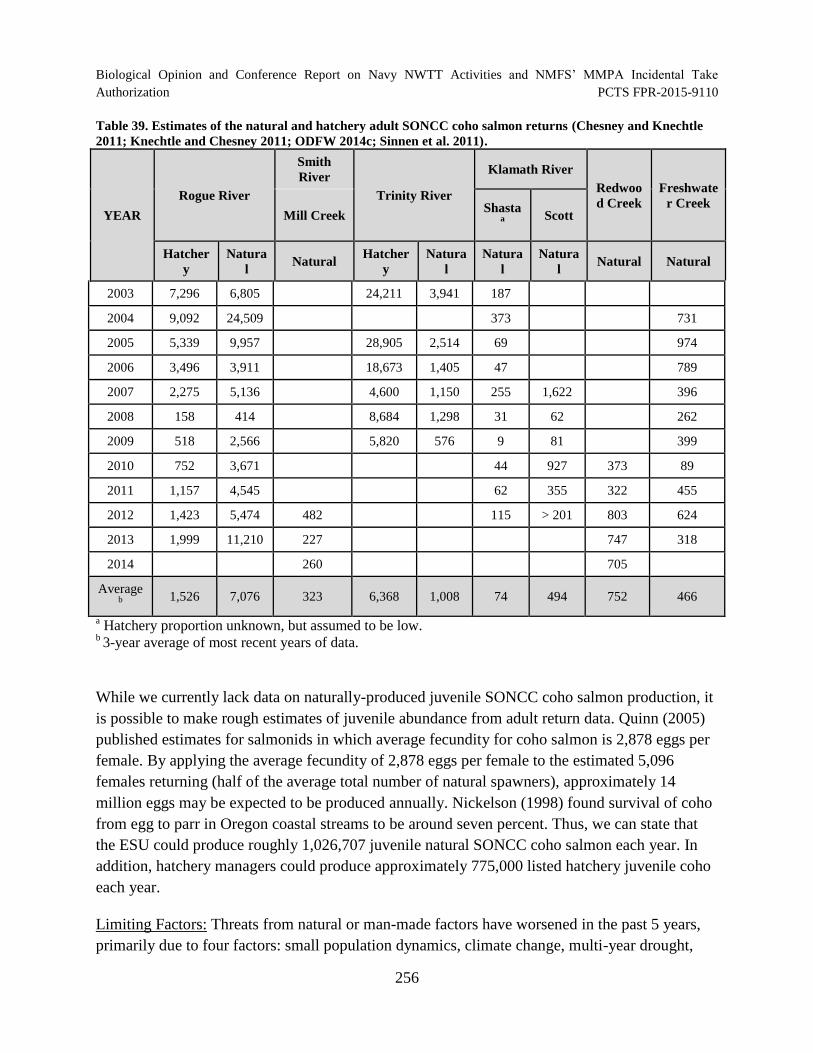
Biological Opinion and Conference Report on Navy NWTT Activities and NMFS’ MMPA Incidental Take
Authorization PCTS FPR-2015-9110
Table 39. Estimates of the natural and hatchery adult SONCC coho salmon returns (Chesney and Knechtle
2011; Knechtle and Chesney 2011; ODFW 2014c; Sinnen et al. 2011).
YEAR
Rogue River
Smith
River
Mill Creek
Trinity River
Klamath River
Redwoo
d Creek
Freshwate
r Creek Shasta a Scott
Hatcher
y
Natura
l Natural
Hatcher
y
Natura
l
Natura
l
Natura
l Natural Natural
2003 7,296 6,805 24,211 3,941 187
2004 9,092 24,509 373 731
2005 5,339 9,957 28,905 2,514 69 974
2006 3,496 3,911 18,673 1,405 47 789
2007 2,275 5,136 4,600 1,150 255 1,622 396
2008 158 414 8,684 1,298 31 62 262
2009 518 2,566 5,820 576 9 81 399
2010 752 3,671 44 927 373 89
2011 1,157 4,545 62 355 322 455
2012 1,423 5,474 482 115 > 201 803 624
2013 1,999 11,210 227 747 318
2014 260 705
Average b 1,526 7,076 323 6,368 1,008 74 494 752 466
a Hatchery proportion unknown, but assumed to be low.
b 3-year average of most recent years of data.
While we currently lack data on naturally-produced juvenile SONCC coho salmon production, it
is possible to make rough estimates of juvenile abundance from adult return data. Quinn (2005)
published estimates for salmonids in which average fecundity for coho salmon is 2,878 eggs per
female. By applying the average fecundity of 2,878 eggs per female to the estimated 5,096
females returning (half of the average total number of natural spawners), approximately 14
million eggs may be expected to be produced annually. Nickelson (1998) found survival of coho
from egg to parr in Oregon coastal streams to be around seven percent. Thus, we can state that
the ESU could produce roughly 1,026,707 juvenile natural SONCC coho salmon each year. In
addition, hatchery managers could produce approximately 775,000 listed hatchery juvenile coho
each year.
Limiting Factors: Threats from natural or man-made factors have worsened in the past 5 years,
primarily due to four factors: small population dynamics, climate change, multi-year drought,
256
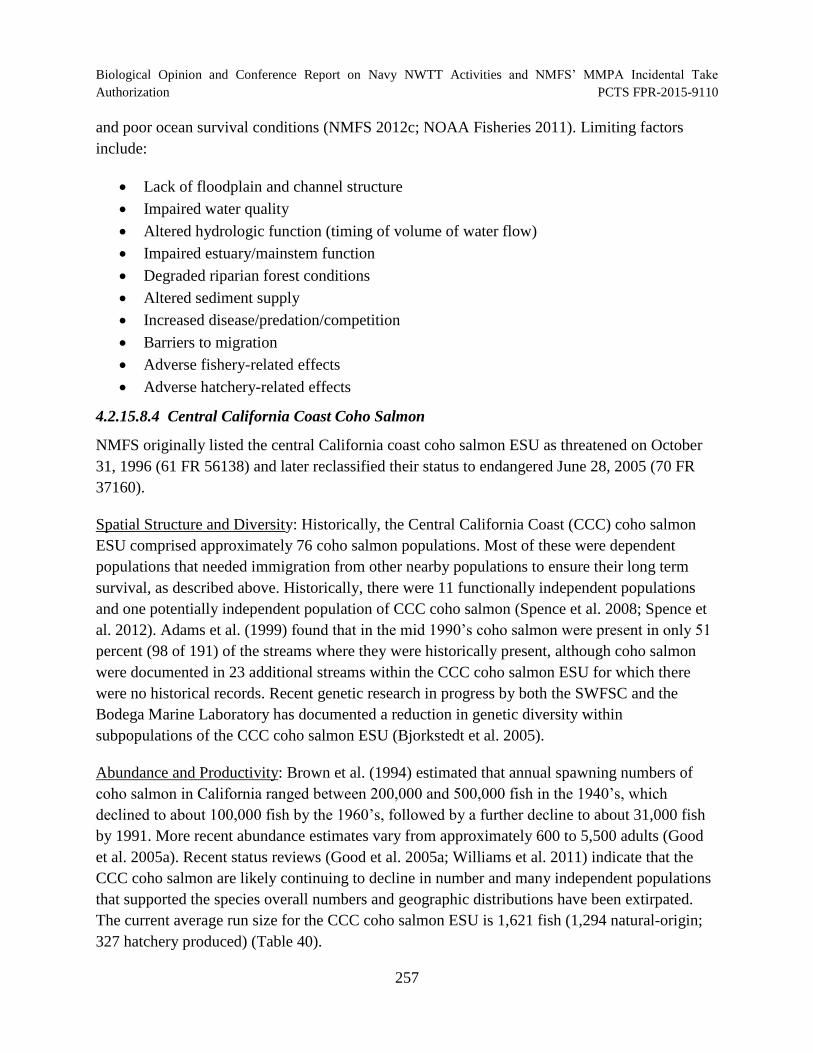
Biological Opinion and Conference Report on Navy NWTT Activities and NMFS’ MMPA Incidental Take
Authorization PCTS FPR-2015-9110
and poor ocean survival conditions (NMFS 2012c; NOAA Fisheries 2011). Limiting factors
include:
Lack of floodplain and channel structure
Impaired water quality
Altered hydrologic function (timing of volume of water flow)
Impaired estuary/mainstem function
Degraded riparian forest conditions
Altered sediment supply
Increased disease/predation/competition
Barriers to migration
Adverse fishery-related effects
Adverse hatchery-related effects
4.2.15.8.4 Central California Coast Coho Salmon
NMFS originally listed the central California coast coho salmon ESU as threatened on October
31, 1996 (61 FR 56138) and later reclassified their status to endangered June 28, 2005 (70 FR
37160).
Spatial Structure and Diversity: Historically, the Central California Coast (CCC) coho salmon
ESU comprised approximately 76 coho salmon populations. Most of these were dependent
populations that needed immigration from other nearby populations to ensure their long term
survival, as described above. Historically, there were 11 functionally independent populations
and one potentially independent population of CCC coho salmon (Spence et al. 2008; Spence et
al. 2012). Adams et al. (1999) found that in the mid 1990’s coho salmon were present in only 51
percent (98 of 191) of the streams where they were historically present, although coho salmon
were documented in 23 additional streams within the CCC coho salmon ESU for which there
were no historical records. Recent genetic research in progress by both the SWFSC and the
Bodega Marine Laboratory has documented a reduction in genetic diversity within
subpopulations of the CCC coho salmon ESU (Bjorkstedt et al. 2005).
Abundance and Productivity: Brown et al. (1994) estimated that annual spawning numbers of
coho salmon in California ranged between 200,000 and 500,000 fish in the 1940’s, which
declined to about 100,000 fish by the 1960’s, followed by a further decline to about 31,000 fish
by 1991. More recent abundance estimates vary from approximately 600 to 5,500 adults (Good
et al. 2005a). Recent status reviews (Good et al. 2005a; Williams et al. 2011) indicate that the
CCC coho salmon are likely continuing to decline in number and many independent populations
that supported the species overall numbers and geographic distributions have been extirpated.
The current average run size for the CCC coho salmon ESU is 1,621 fish (1,294 natural-origin;
327 hatchery produced) (Table 40).
257
Biological Opinion and Conference Report on Navy NWTT Activities and NMFS’ MMPA Incidental Take
Authorization PCTS FPR-2015-9110
Table 40. Geometric mean abundances of CCC coho salmon spawners in 2006-2012 escapements by
population.
Stratum Population Years
Spawners Expected
Number of
Outmigrants cd
Natural-origina
Hatchery-
originb
Lost Coast –
Navarro
Point
Ten Mile River
Usal Creek
2010
2011
2009
2011
237
5
-
-
16,940
Noyo River
Pudding Creek
Caspar Creek
2006
2010
2008
2012
2006
2010
398
116
31
-
-
-
38,150
Big River 2009
2011 116 - 8,120
Albion River 2009
2011 9 - 630
Navarro
Point –
Gualala Point
Navarro River 2009
2011 197 - 13,790
Garcia River 2009
2011 34 - 2,380
Gualala River - - - -
Coastal
Russian River
Salmon Creek
2008
2012
2008
20
9
323
-
2,030
Walker Creek 2006
2008 4 - 280
Lagunitas Creek
Redwood Creek
2007
2011
2007
2011
105
5
-
-
7,700
Santa Cruz
Mountains
Pescadero Creek - - - -
San Lorenzo River
Waddell Creek
Scott Creek
San Vicente Creek
Soquel Creek
-
2007
2008
2012
2007
2008
2007
-
2
3
1
2
-
-
4
-
-
560
ESU Average 1,294 327 90,580
a Source: http://swr.nmfs.noaa.gov/recovery/ccc_coho/
b J. Jahn, pers. comm., July 2, 2013 (cited in NMFS 2015)
c Expected number of outmigrants=Total spawners*50% proportion of females*3,500 eggs per female*6.5% survival rate from
egg to outmigrant
d Based upon natural-origin spawner numbers
258
Biological Opinion and Conference Report on Navy NWTT Activities and NMFS’ MMPA Incidental Take
Authorization PCTS FPR-2015-9110
While we currently lack data on how many natural juvenile coho salmon this ESU produces, it is
possible to make rough estimates of juvenile abundance from adult return data. Sandercock
(1991) published fecundity estimates for several coho salmon stocks; average fecundity ranged
from 1,983 to 5,000 eggs per female. By applying a very conservative value of 2,000 eggs per
female to an estimated 647 females returning (50 percent of the run) to this ESU, one may expect
approximately 1.3 million eggs to be produced annually. Nickelson (1998) found survival of
coho from egg to parr in Oregon coastal streams to be around 7 percent. Thus, we can estimate
that roughly 90,000 juvenile coho salmon are produced annually by the CCC coho ESU.
Limiting Factors: Most of the populations in the CCC coho salmon ESU are currently doing
poorly; low abundance, range constriction, fragmentation, and loss of genetic diversity is
documented. The near-term (10 to 20 years) viability of many of the extant independent CCC
coho salmon populations is of serious concern. These populations may not have enough fish to
survive additional natural and human caused environmental change. NMFS has determined that
currently depressed population conditions are, in part, the result of the following human-induced
factors affecting critical habitat15
: logging, agriculture, mining, urbanization, stream
channelization, dams, wetland loss, and water withdrawals (including unscreened diversions for
irrigation). Impacts of concern include altered stream bank and channel morphology, elevated
water temperature, lost spawning and rearing habitat, habitat fragmentation, impaired gravel and
wood recruitment from upstream sources, degraded water quality, lost riparian vegetation, and
increased erosion into streams from upland areas ((Busby et al. 1996c; Weitkamp et al. 1995); 64
FR 24049; 70 FR 37160; 70 FR 52488). Diversion and storage of river and stream flow has
dramatically altered the natural hydrologic cycle in many of the streams within the ESU.
4.2.16 Sockeye Salmon
Sockeye salmon (Oncorhynchus nerka) are the second most abundant of the seven Pacific
salmon species. They have silvery sides with a green or blue back and white tips on the ventral
and anal fins. Sockeye salmon have no large spots on back or tail, but some may have speckling
on the back. They have no silver pigment on the tail, and they have a prominent gold eye color.
15 Other factors, such as over fishing and artificial propagation have also contributed to the current population status
of these species. All these human induced factors have exacerbated the adverse effects of natural environmental
variability from such factors as drought and poor ocean conditions.
259
Biological Opinion and Conference Report on Navy NWTT Activities and NMFS’ MMPA Incidental Take
Authorization PCTS FPR-2015-9110
Sockeye salmon exhibit a very diverse life history, characteristically using both riverine and lake
habitat throughout its range, exhibiting both freshwater resident and anadromous forms. The vast
majority of sockeye salmon are anadromous fish that make use of lacustrine habitat for juvenile
rearing. These “lake-type” fish typically spawn in the outlet streams of lakes and occasionally in
the lakes themselves. Juvenile sockeye salmon will then use the lake environment for rearing for
up to 3 years before migrating to sea. After 1 to 4 years at sea, sockeye salmon will return to
their natal lake to spawn. Some sockeye, however, spawn in rivers without lake habitat for
juvenile rearing. Offspring of these riverine spawners tend to use the lower velocity sections of
rivers as the juvenile rearing environment for 1 to 2 years, or may migrate to sea in their first
year.
Sockeye salmon also have a wholly freshwater life history form, called kokanee (Burgner
1991a). In some cases a single population will give rise to both the anadromous and freshwater
life history form. While in fresh water juveniles of both life history types prey primarily upon
insects. The presence of both life history types may be related to the energetic costs of
outmigrating to sea, and the productivity of the lacustrine system they inhabit. In coastal lakes,
where the migration to sea is relatively short and energetic costs are minimal, kokanee
populations are rare.
4.2.16.1 Species Distribution
Sockeye salmon occur in the North Pacific and Arctic oceans and associated freshwater systems.
This species ranges south as far as the Sacramento River in California and northern Hokkaido in
Japan, to as far north as far as Bathurst Inlet in the Canadian Arctic and the Anadyr River in
Siberia (Burgner 1991a). The largest populations, and hence the most important commercial
populations, occur north of the Columbia River.
4.2.16.2 Occurrence in the NWTT Action Area
Adults of both the Snake River and the Ozette Lake ESUs will occur in the Offshore Area.
4.2.16.3 Reproduction
Spawning generally occurs in late summer and autumn, but the precise time can vary greatly
among populations. Age at maturity varies by region from 2 to 5 years, but is generally 2 to 4
years in Washington State (Burgner 1991b). Males often arrive earlier than females on the
spawning grounds, and will persist longer during the spawning period. Average fecundity ranges
from about 2,000 to 2,400 eggs per female up to 5,000 eggs, depending upon the population and
average age of the female. Fecundity in kokanee is much lower and may range from about 300 to
2,000 eggs. Larger females are more fecund and realize greater reproductive success
(Cunningham et al. 2013).
260
Biological Opinion and Conference Report on Navy NWTT Activities and NMFS’ MMPA Incidental Take
Authorization PCTS FPR-2015-9110
Incubation is a function of water temperatures, but generally lasts between 100 and 200 days
(Burgner 1991b). After emergence, fry move rapidly downstream or upstream along the banks to
the lake rearing area. Fry emerging from lakeshore or island spawning grounds may simply
move along the shoreline of the lake (Burgner 1991b).
4.2.16.4 Habitat
Once smolts enter the Pacific Ocean, they distribute widely across the North Pacific, generally
above 40º N, where a current boundary is located. Season, temperature, salinity, life stage, age,
size, availability of prey and population-of-origin are all factors that influence offshore
movements (Burgner 1991b). Sockeye tend to occupy the upper water column, within 30 m of
the surface and preferably within 15 m and tend to be closer to the surface at night versus
daytime (Burgner 1991b; French et al. 1976b; Manzer 1964; Pauley et al. 1989). Sockeye
migrate several thousand miles in search of prey and are considered to travel continuously
(Royce et al. 1968). Juveniles leaving freshwater move north along the Alaskan coastal belt
beginning in mid-May until early winter when they disperse into the Gulf of Alaska (Emmett et
al. 1991a; NMFS-AKR 2005).
Thermoclines may also influence vertical distribution, with fish only mingling between surface
and deeper waters when the boundary temperature difference is weak. Sockeye appear to prefer
cooler waters relative to other salmon species, but younger salmon may prefer warmer sea
surface temperatures (optimally 15° C) than larger, older fish (12° and 14° C), possibly an
artifact of older fish being distributed further north (Pauley et al. 1989). Adult upstream
migration may be blocked by temperatures above 21º C (McCullough 1999). However,
temperatures below 21º C can stress fish by increasing their susceptibility to disease and
elevating their metabolism (Brett 1979). Maturation and timing of return to spawn by sockeye
appears to be linked to water temperature, with gonad development increasing in late May
through early July (Nishiymama 1984).
4.2.16.5 Feeding
While in freshwater, juveniles prey primarily upon insects. While at sea, sockeye prey upon a
variety of organisms, including small fish (capelin, lantern fish, cod, sand lance, herring, and
pollock), squid, crustacean larvae, krill, and other invertebrates (Foerster 1968; French et al.
1976b; Wing 1977).
4.2.16.6 Natural Threats
In freshwater, fry fall prey to older salmon and other trout, as well as birds, sculpin, and various
mammals; 10 percent of salmonid smolts are eaten by Caspian terns and double-crested
cormorants annually in the Columbia River estuary (NMFS 2011e). In the ocean, marine
mammals and other fish prey on sockeye, but the extent of such predation is not well known.
261
Biological Opinion and Conference Report on Navy NWTT Activities and NMFS’ MMPA Incidental Take
Authorization PCTS FPR-2015-9110
4.2.16.7 Anthropogenic Threats
Similar to the other salmonid species considered in this Opinion, sockeye salmon are also
primarily threatened by direct and incidental harvest, hatcheries, lack of suitable habitat for some
life stages, and hydroelectric dams inhibiting access to spawning habitat. Invasive fishes also
threaten the survival and recovery of Pacific salmonids by competing directly for resources,
altering food webs and trophic structures, and altering evolutionary trajectories (NMFS 2011e).
4.2.16.8 Hearing
Although the data available on the hearing sensitivities of Pacific salmon is limited, that
information suggests that the species in the family Salmonidae have similar auditory systems and
hearing sensitivities (Popper 1977; Popper et al. 2007; Wysocki et al. 2007). Most of the data
available resulted from studies of the hearing capability of Atlantic salmon (Salmo salar), which
is a “hearing generalist” with a relatively poor sensitivity to sound (Hawkins and Johnstone
1978). Based on the information available, we assume that the sockeye salmon considered in this
consultation have hearing sensitivities ranging from less than 100 Hz to about 580 Hz (Hawkins
and Johnstone 1978) (Knudsen et al. 1992; Knudsen et al. 1994).
4.2.16.9 Sockeye Salmon ESUs
Each sockeye salmon ESU is treated as a separate species under the ESA (NMFS 2005c). There
are currently two ESA-listed ESUs of sockeye salmon, one of which is listed as threatened
(Ozette Lake) and one of which is listed as endangered (Snake River). The distribution, as well
as the status and trends, of the sockeye salmon ESUs considered in this Opinion are discussed
below. Ozette Lake sockeye salmon were considered in Section 4.1.6.
4.2.16.9.1 Snake River Sockeye Salmon
Snake River sockeye salmon were originally listed as endangered in 1991 and the NMFS
retained that classification when their status was reviewed on June 28, 2005 (70 FR 37160).
Spatial Structure and Diversity: Snake River (SR) sockeye includes all anadromous and residual
sockeye salmon from the Snake River basin, Idaho, and artificially-propagated sockeye salmon
from the Redfish Lake captive propagation program. The IC-TRT identified historical sockeye
salmon production in at least five Stanley Basin and Sawtooth Valley lakes and in lake systems
associated with Snake River tributaries currently cut off to anadromous access (e.g., Wallowa
and Payette Lakes), although current returns of SR sockeye salmon are extremely low and
limited to Redfish Lake (IC-TRT 2007).
Abundance and Productivity: This species is still at extremely high risk across all four basic risk
measures (abundance, productivity, spatial structure and diversity. Although the captive brood
program has been successful in providing substantial numbers of hatchery produced O. nerka for
262
Biological Opinion and Conference Report on Navy NWTT Activities and NMFS’ MMPA Incidental Take
Authorization PCTS FPR-2015-9110
use in supplementation efforts, substantial increases in survival rates across life history stages
must occur to re-establish sustainable natural production (Hebdon et al. 2004; Keefer et al.
2008). Overall, although the risk status of the SR sockeye appears to be on an improving trend,
the new information considered does not indicate a change in the biological risk category since
the last status review (Ford 2011b).
Between 1997 and 2005, approximately 400 hatchery sockeye returned to the Stanley basin,
total. Only 16 naturally produced adults returned to Redfish Lake between the time SR sockeye
was listed as an endangered species in 1991 and 2005. Since that time, there has been a
considerable improvement in the sockeye returns. From 2009 through 2012, an average of 1,348
adult sockeye (all from the broodstock program) passed Lower Granite Dam on their way to
Redfish Lake. The year 2012 saw the lowest numbers of that period—with only 470 fish being
counted at Lower Granite Dam. These numbers have been updated somewhat with the 2014
returns—which numbered 2,786 fish. The new four-year average return to Lower Granite Dam
(through 2014) is 1,373 (IDFG data).
Each spring, the NWFSC produces a memorandum estimating the number of ESA-listed Pacific
salmon and steelhead smolts expected to arrive at various locations in the Columbia River basin.
The averages of the five most recent projections for the SR sockeye salmon juvenile emigrants
are displayed below in Table 41.
Table 41. Recent five-year average projected outmigrations for SR sockeye (Dey 2012; Ferguson 2010; Zabel
2014a; Zabel 2014b).
Origin Outmigration
Natural 15,560
Listed Hatchery: Adipose Clipped 124,767
The BRT, reviewing the status of the species in 2010 (Ford 2011a), found that the recent increase
in returns of hatchery-reared SR sockeye has reduced the risk of immediate loss, but that levels
of naturally produced returns remain extremely low. Although the biological risk status of the
ESU appeared to be on an improving trend, the new information did not indicate a change in
category (extremely high risk) since the 2005 BRT status review.
Limiting Factors: The key factor limiting recovery of SR sockeye is survival outside of the
Stanley Basin. Portions of the migration corridor in the Salmon River are impeded by water
quality and temperature (Idaho Department of Environmental Quality 2011). Increased
temperatures likely reduce the survival of adult sockeye returning to the Stanley Basin. The
natural hydrological regime in the upper mainstem Salmon River Basin has been altered by water
withdrawals. In most years, sockeye adult returns to Lower Granite suffer catastrophic losses
(Reed et al. 2003) (e.g., > 50 percent mortality in one year) before reaching the Stanley Basin,
263
Biological Opinion and Conference Report on Navy NWTT Activities and NMFS’ MMPA Incidental Take
Authorization PCTS FPR-2015-9110
although the factors causing these losses have not been identified. In the Columbia and lower
Snake River migration corridor, predation rates on juvenile sockeye salmon are unknown, but
terns and cormorants consume 12 percent of all salmon smolts reaching the estuary, and
piscivorous fish consume an estimated 8 percent of migrating juvenile salmon (NOAA Fisheries
2011).
4.2.17 Steelhead
Steelhead trout (Oncorhynchus mykiss) are usually dark-olive in color, shading to silvery-white
on the underside with a heavily speckled body and a pink to red stripe running along their sides.
Steelhead trout can reach up to 55 pounds (25 kg) in weight and 45 inches (120 cm) in length,
though average size is much smaller. The life history of this species varies considerably
throughout its range. While all O. mykiss hatch in gravel-bottomed, fast-flowing, well-
oxygenated rivers and streams, some stay in fresh water all their lives. These fish are called
rainbow trout. The steelhead that migrate to the ocean develop a much more pointed head,
become more silvery in color, and typically grow much larger than the rainbow trout that remain
in fresh water. Maximum age is about 11 years. Males mature generally at two years and females
at three.
Generally, steelhead occur in two races: the stream-maturing type, summer steelhead, enters
freshwater in a sexually immature condition and requires several months in freshwater to mature
and spawn; and the ocean-maturing type, winter steelhead, enters freshwater with well-
developed gonads and spawns shortly after river entry. Variations in migration timing exist
between populations, and some river basins have both summer and winter steelhead, while others
only have one race.
Survival at smoltification is higher for larger fish than smaller ones; this is particularly true for
individuals that grew larger earlier in life (Beakes et al. 2010).
4.2.17.1 Species Distribution
Steelhead, the common name of the anadromous form of O. mykiss, are native to Pacific Coast
streams extending from Alaska south to northwestern Mexico (Good et al. 2005c; Good et al.
2005b; Moyle 1976; NMFS 1997b; Stolz and Schnell 1991).
4.2.17.1.1 Occurrence in the NWTT Action Area
All steelhead DPSs may occur in the Offshore Area portion of the Action Area. The Puget Sound
DPS will occur in both the Inland Waters and Offshore Area portions of the Action Area.
264
Biological Opinion and Conference Report on Navy NWTT Activities and NMFS’ MMPA Incidental Take
Authorization PCTS FPR-2015-9110
4.2.17.2 Reproduction
Adults migrate from a marine environment into the freshwater streams and rivers of their birth in
order to mate. Unlike other Pacific salmonids, they can spawn more than one time (called
iteroparity). Steelhead can be divided into two basic reproductive types, stream-maturing or
ocean-maturing, based on the state of sexual maturity at the time of river entry and duration of
spawning migration. The stream-maturing type (summer-run steelhead in the Pacific Northwest
and northern California) enters freshwater in a sexually immature condition between May and
October and requires several months to mature and spawn. The ocean-maturing type (winter-run
steelhead in the Pacific Northwest and northern California) enters freshwater between November
and April, with well-developed gonads, and spawns shortly thereafter. Coastal streams are
dominated by winter-run steelhead, whereas inland steelhead of the Columbia River basin are
almost exclusively summer-run steelhead.
Adult female steelhead will prepare a redd (or nest) in a stream area with suitable gravel type
composition, water depth, and velocity. The adult female may deposit eggs in 4 to 5 "nesting
pockets" within a single redd. The eggs hatch in 3 to 4 weeks. Steelhead mortality is high early
in life and decreases with age. For example, Puget Sound steelhead leaving freshwater and
estuarine habitats experience 55 to 86 percent survival to the point of reaching Hood Canal and 0
to 49 percent from Hood Canal to the Strait of Juan de Fuca, with survival increasing greatly
upon entering the Pacific Ocean (Moore et al. 2010a).
There is a high degree of overlap in spawning timing between populations regardless of run type
(Busby et al. 1996b). Difficult field conditions at that time of year and the remoteness of
spawning grounds contribute to the relative lack of specific information on steelhead spawning.
Unlike Pacific salmon, steelhead are iteroparous, or capable of spawning more than once before
death (Busby et al. 1996b; Nickelson et al. 1992). Second-time spawners often make up about 70
to 85 percent of repeat spawners, with third time spawners make up 10 to 25 percent of repeats
(Stolz and Schnell 1991). Iteroparity is more common among southern steelhead populations
than northern populations (Busby et al. 1996b).
4.2.17.3 Habitat
Steelhead spawn in cool, clear streams featuring suitable gravel size, depth, and current velocity.
Intermittent streams may also be used for spawning (Barnhart 1986a; Everest 1972). Summer
steelhead enter freshwater between May and October in the Pacific northwest (Busby et al.
1996b; Nickelson et al. 1992). They require cool, deep holding pools during summer and fall,
prior to spawning (Nickelson et al. 1992). Summer steelhead migrate inland toward spawning
areas, overwinter in the larger rivers, resume migration in early spring to natal streams, and then
spawn in January and February (Barnhart 1986b; Meehan and Bjornn 1991; Nickelson et al.
1992). Winter steelhead enter freshwater between November and April in the Pacific northwest
265
Biological Opinion and Conference Report on Navy NWTT Activities and NMFS’ MMPA Incidental Take
Authorization PCTS FPR-2015-9110
(Busby et al. 1996b; Nickelson et al. 1992), migrate to spawning areas, and then spawn,
generally in April and May (Barnhart 1986b). Some adults, however, do not enter some coastal
streams until spring, just before spawning (Meehan and Bjornn 1991).
As with other salmonids, the larger the fish, the more eggs produced. Egg and hatching success
are related to the conditions within the redd and time to hatching is temperature dependent.
Fertilization to hatching is generally less than a month, after which newly hatched fish will
remain in the redd for another 2 to 3 weeks. In late spring and following yolk sac absorption,
alevins emerge from the gravel and begin actively feeding. After emerging from the gravel, fry
usually inhabit shallow water along banks of perennial streams. Fry occupy stream margins
(Nickelson et al. 1992). Summer rearing takes place primarily in the faster parts of pools,
although young-of-the-year are abundant in glides and riffles. Winter rearing occurs more
uniformly at lower densities across a wide range of fast and slow habitat types. Some older
juveniles move downstream to rear in larger tributaries and mainstem rivers (Nickelson et al.
1992).
Juvenile steelhead migrate little during their first summer and occupy a range of habitats
featuring moderate to high water velocity and variable depths (Bisson et al. 1988). Steelhead
hold territories close to the substratum where flows are lower and sometimes counter to the main
stream; from these, they can make forays up into surface currents to take drifting food (Kalleberg
1958). Juveniles rear in freshwater from 1 to 4 years, then smolt and migrate to the ocean in
March and April (Barnhart 1986b). Winter steelhead juveniles generally smolt after 2 years in
freshwater (Busby et al. 1996b). Juvenile steelhead tend to migrate directly offshore during their
first summer from whatever point they enter the ocean rather than migrating along the coastal
belt as salmon do. Steelhead typically reside in marine waters for 2 or 3 years prior to returning
to their natal stream to spawn as 4- or 5-year olds (August 9, 1996, 61 FR 41542); fish in the
northern portion of the range may spend more time rearing in marine waters (Stolz and Schnell
1991). Populations in Oregon and California have higher frequencies of age-1-ocean steelhead
than populations to the north, but age-2-ocean steelhead generally remain dominant (Busby et al.
1996a).
In marine waters, steelhead reside from the surface down to 200 m in waters with temperatures
up to 24° C, although 10° C is optimum (Pauley et al. 1986b).
4.2.17.4 Feeding
Juveniles feed primarily on insects (chironomids, baetid mayflies, and hydropsychid caddisflies
(Merz 1994). Adults feed on aquatic and terrestrial insects, mollusks, crustaceans, fish eggs,
minnows, and other small fishes (including greenling and other trout; (Chapman and Bjornn
1969; Stolz and Schnell 1991)).
266
Biological Opinion and Conference Report on Navy NWTT Activities and NMFS’ MMPA Incidental Take
Authorization PCTS FPR-2015-9110
4.2.17.5 Hearing
Although the data available on the hearing sensitivities of Pacific salmon is limited, that
information suggests that the species in the family Salmonidae have similar auditory systems and
hearing sensitivities (Popper 1977; Popper et al. 2007; Wysocki et al. 2007). Most of the data
available resulted from studies of the hearing capability of Atlantic salmon (Salmo salar), which
is a “hearing generalist” with a relatively poor sensitivity to sound (Hawkins and Johnstone
1978). Based on the information available, we assume that the steelhead considered in this
consultation have hearing sensitivities ranging from less than 100 Hz to about 580 Hz (Hawkins
and Johnstone 1978; Knudsen et al. 1992; Knudsen et al. 1994).
4.2.17.6 Natural Threats
Steelhead are exposed to high rates of natural predation each life stage. The highest mortality
occurs between the egg stage and smolt outmigration, and is highest in the first few months
following emergence from the redd (Stolz and Schnell 1991). In freshwater, fry fall prey to older
steelhead and other trout, as well as birds, sculpin, and various mammals; 10 percent of salmonid
smolts are eaten by Caspian terns and double-crested cormorants annually in the Columbia River
estuary (NMFS 2011e). In the ocean, marine mammals and other fish prey on steelhead, but the
extent of such predation is not well known.
4.2.17.7 Anthropogenic Threats
Steelhead have declined under the combined effects of overharvests in fisheries; competition
from fish raised in hatcheries and native and non-native exotic species; dams that block their
migrations and alter river hydrology; gravel mining that impedes their migration and alters the
dynamics (hydrogeomorphology) of the rivers and streams that support juveniles; water
diversions that deplete water levels in rivers and streams; destruction or degradation of riparian
habitat that increase water temperatures in rivers and streams sufficient to reduce the survival of
juvenile steelhead; and land use practices (logging, agriculture, urbanization) that destroy
wetland and riparian ecosystems while introducing sediment, nutrients, biocides, metals, and
other pollutants into surface and ground water and degrade water quality in the fresh water,
estuarine, and coastal ecosystems throughout the species range.
Invasive fishes also threaten the survival and recovery of Pacific salmonids by competing
directly for resources, altering food webs and trophic structures, and altering evolutionary
trajectories (NMFS 2011e).
4.2.17.8 Steelhead DPSs
Each steelhead DPS is treated as a separate species under the ESA (NMFS 2005c). Of the eleven
listed steelhead DPSs, one is endangered (Southern California) and ten are threatened (Puget
Sound, Central California coast, Snake River basin, Upper Columbia River, Middle Columbia
267
Biological Opinion and Conference Report on Navy NWTT Activities and NMFS’ MMPA Incidental Take
Authorization PCTS FPR-2015-9110
River, Lower Columbia River, Upper Willamette River, Northern California, South-Central
California coast, California Central Valley). The distribution, as well as the status and trends, of
the steelhead DPSs considered in this Opinion are discussed below.
4.2.17.8.1 Lower Columbia River Steelhead
The NMFS listed Lower Columbia River steelhead as threatened on March 19, 1998 (63 FR
13347), and reaffirmed their status as threatened on January 5, 2006 (71 FR 834).
Spatial Structure and Diversity: Four strata and 23 historical populations of Lower Columbia
River (LCR) steelhead occur within the DPS: 17 winter-run populations and six summer-run
populations, within the Cascade and Gorge ecological subregions.16
The DPS also includes the
progeny of ten artificial propagation programs.17
Summer steelhead return to freshwater long
before spawning. Winter steelhead, in contrast, return from the ocean much closer to maturity
and spawn within a few weeks. Summer steelhead spawning areas in the Lower Columbia River
are found above waterfalls and other features that create seasonal barriers to migration. Where no
temporal barriers exist, the winter-run life history dominates.
It is likely that genetic and life history diversity has been reduced as a result of pervasive
hatchery effects and population bottlenecks. Spatial structure remains relatively high for most
populations. Out of the 23 populations, 16 are considered to have a “low” or “very low”
probability of persisting over the next 100 years, and six populations have a “moderate”
probability of persistence (Ford 2011b; Lower Columbia Fish Recovery Board 2010a; NMFS
2013; ODFW 2010a). All four strata in the DPS fall short of the WLC-TRT criteria for viability
(NMFS 2013).
Baseline persistence probabilities were estimated to be “low” or “very low” for three out of the
six summer steelhead populations that are part of the LCR steelhead DPS, moderate for two, and
high for one, the Wind, which is considered viable. Thirteen of the 17 LCR winter steelhead
populations have “low” or “very low” baseline probabilities of persistence, and the remaining
16 The White Salmon and Little White Salmon steelhead populations are part of the Middle Columbia steelhead DPS
and are addressed in a separate species-level recovery plan, the Middle Columbia River Steelhead Distinct
Population Segment ESA Recovery Plan NMFS. 2009a. Middle Columbia River steelhead distinct population
segment ESA recovery plan. November 30. 17
In 2007, the release of Cowlitz Hatchery winter steelhead into the Tilton River was discontinued; in 2009, the
Hood River winter steelhead program was discontinued; and in 2010, the release of hatchery winter steelhead into
the Upper Cowlitz and Cispus rivers was discontinued. In 2011, NMFS recommended removing these programs
from the DPS. A Lewis River winter steelhead program was initiated in 2009, and in 2011, NMFS proposed that it
be included in the DPS NMFS. 2011a. 5-year review: summary and evaluation of Lower Columbia River Chinook,
Columbia River chum, Lower Columbia River coho, and Lower Columbia River steelhead. National Marine
Fisheries Service, editor, Portland, Oregon.
268
Biological Opinion and Conference Report on Navy NWTT Activities and NMFS’ MMPA Incidental Take
Authorization PCTS FPR-2015-9110
four are at “moderate” probability of persistence (Lower Columbia Fish Recovery Board 2010a;
NMFS 2013; ODFW 2010a).
Abundance and Productivity: The “low” to “very low” baseline persistence probabilities of most
LCR steelhead populations reflects low abundance and productivity (NMFS 2013). All of the
populations increased in abundance during the early 2000s, generally peaking in 2004. Most
populations have since declined back to levels within one standard deviation of the long term
mean. Exceptions are the Washougal summer-run and North Fork Toutle winter-run, which are
still higher than the long term average, and the Sandy, which is lower. In general, the populations
do not show any sustained dramatic changes in abundance or fraction of hatchery origin
spawners since the 2005 status review (Ford 2011b). Although current LCR steelhead
populations are depressed compared to historical levels and long-term trends show declines,
many populations are substantially healthier than their salmon counterparts, typically because of
better habitat conditions in core steelhead production areas (Lower Columbia Fish Recovery
Board 2010a; NMFS 2013).
Since the last status evaluation, all populations increased in abundance during the early 2000s,
generally peaking in 2004. Abundance of most populations has since declined back to levels
close to the long-term mean. Exceptions are the Washougal summer and North Fork Toutle
winter populations, for which abundance is higher than the long-term average, and the Sandy, for
which abundance is below the long-term average. The North Fork Toutle winter steelhead
population appears to be experiencing an increasing trend dating back to 1990, which is likely
partially the result of recovery of habitat since the eruption of Mt. St. Helens in 1980. In general,
the LCR steelhead populations do not show any sustained, dramatic changes in abundance since
the previous status review (Ford 2011a).
269

Biological Opinion and Conference Report on Navy NWTT Activities and NMFS’ MMPA Incidental Take
Authorization PCTS FPR-2015-9110
Table 42. Abundance estimates for LCR steelhead populations (NWFSC 2015; ODFW 2010b; Streamnet
2014; WDFW 2010a; WDFW 2010b; WDFW 2011).
Stratum (Run) Population Years HOR(1) NOR(2) Recovery
Target(3)
Cascade (Winter) Upper Cowlitz and Cispus 2009-2013 614 535
Lower Cowlitz 2009 4559 400 500
Tilton 2009-2013 256 251 200
Coweeman 2009-2013 181 483 500
South Fork Toutle 2009-2013 5 466 600
North Fork Toutle 2009-2013 99 530 600
Kalama 2009-2013 433 900 600
North Fork Lewis 2009-2013 2,126 400
East Fork Lewis 2009-2013 0 418 500
Washougal 2009-2013 203 368 350
Clackamas 2004-2008 682 1,669 10,655
Sandy 2002-2006 0 769 1,510
Cascade (Summer) Kalama 2009-2013 334 518 500
North Fork Lewis 2009-2013 10,508
East Fork Lewis 2009-2013 114 916 500
Washougal 2009-2013 605 704 500
Gorge (Winter) Lower Gorge 1,104
Upper Gorge 2009-2013 41 322
Hood 2003-2007 380 438 1,633
Gorge (Summer) Wind 2009-2013 42 866 1,000
Hood 2003-2007 239 241 1,988
(1) Hatchery Origin (HOR) spawners.
(2) Natural Origin (NOR) spawners.
The Columbia River Compact, a joint effort between ODFW and WDFW, monitors salmon,
steelhead, and other species abundance and harvest limits in the Columbia River basin. The
Compact publishes Joint Staff Reports describing management guidelines for seasonal fisheries
in the mainstem Columbia River and expectations for annual salmon and summer steelhead
returns (http://wdfw.wa.gov/fishing/crc/). For the years 2009 through 2013, the average return of
wild winter steelhead to the Columbia River mouth was 15,931, of which 9,393 were LCR
steelhead DPS. Adding the estimated abundance of summer steelhead (Table 42) to this the
average we would expect an annual return of roughly 11,117 naturally produced adult LCR
270
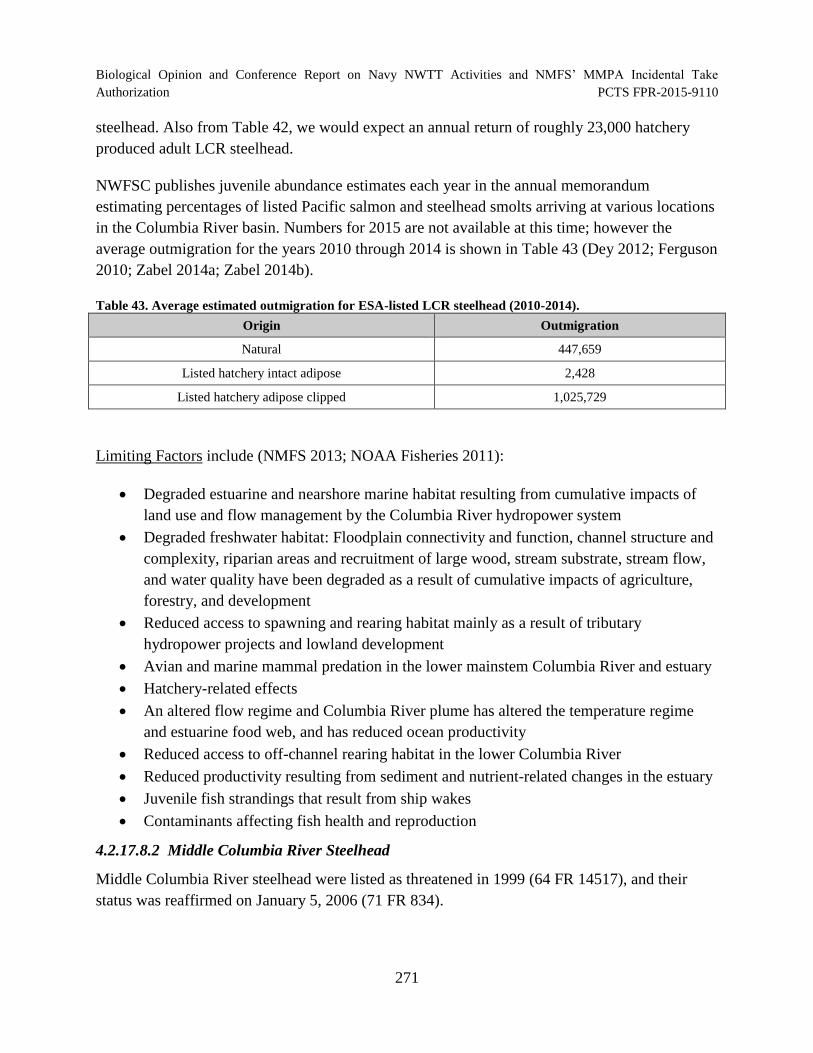
Biological Opinion and Conference Report on Navy NWTT Activities and NMFS’ MMPA Incidental Take
Authorization PCTS FPR-2015-9110
steelhead. Also from Table 42, we would expect an annual return of roughly 23,000 hatchery
produced adult LCR steelhead.
NWFSC publishes juvenile abundance estimates each year in the annual memorandum
estimating percentages of listed Pacific salmon and steelhead smolts arriving at various locations
in the Columbia River basin. Numbers for 2015 are not available at this time; however the
average outmigration for the years 2010 through 2014 is shown in Table 43 (Dey 2012; Ferguson
2010; Zabel 2014a; Zabel 2014b).
Table 43. Average estimated outmigration for ESA-listed LCR steelhead (2010-2014).
Origin Outmigration
Natural 447,659
Listed hatchery intact adipose 2,428
Listed hatchery adipose clipped 1,025,729
Limiting Factors include (NMFS 2013; NOAA Fisheries 2011):
Degraded estuarine and nearshore marine habitat resulting from cumulative impacts of
land use and flow management by the Columbia River hydropower system
Degraded freshwater habitat: Floodplain connectivity and function, channel structure and
complexity, riparian areas and recruitment of large wood, stream substrate, stream flow,
and water quality have been degraded as a result of cumulative impacts of agriculture,
forestry, and development
Reduced access to spawning and rearing habitat mainly as a result of tributary
hydropower projects and lowland development
Avian and marine mammal predation in the lower mainstem Columbia River and estuary
Hatchery-related effects
An altered flow regime and Columbia River plume has altered the temperature regime
and estuarine food web, and has reduced ocean productivity
Reduced access to off-channel rearing habitat in the lower Columbia River
Reduced productivity resulting from sediment and nutrient-related changes in the estuary
Juvenile fish strandings that result from ship wakes
Contaminants affecting fish health and reproduction
4.2.17.8.2 Middle Columbia River Steelhead
Middle Columbia River steelhead were listed as threatened in 1999 (64 FR 14517), and their
status was reaffirmed on January 5, 2006 (71 FR 834).
271
Biological Opinion and Conference Report on Navy NWTT Activities and NMFS’ MMPA Incidental Take
Authorization PCTS FPR-2015-9110
Spatial Structure and Diversity: Middle Columbia River (MCR) steelhead includes all naturally-
spawned steelhead populations below natural and artificial impassable barriers in streams from
above the Wind River, Washington, and the Hood River, Oregon (exclusive), upstream to, and
including, the Yakima River, Washington, excluding steelhead from the Snake River basin; and
progeny of seven artificial propagation programs. The IC-TRT identified 17 extant populations
in this DPS (NMFS 2011g). The populations fall into four major population groups: the Yakima
River Basin (four extant populations), the Umatilla/Walla‐Walla drainages (three extant and one
extirpated populations); the John Day River drainage (five extant populations) and the Eastern
Cascades group (five extant and two extirpated populations) (Ford 2011b; NMFS 2009a).
Abundance and Productivity: Returns to the Yakima River basin and to the Umatilla and Walla
Walla Rivers have been higher over the most recent brood cycle, while natural origin returns to
the John Day River have decreased. There have been improvements in the viability ratings for
some of the component populations, but the MCR steelhead DPS is not currently meeting the
viability criteria (adopted from the IC-TRT) in the MCR steelhead recovery plan (NMFS 2009a).
In addition, several of the factors cited by Good et al. (2005d) remain as concerns or key
uncertainties. Natural origin spawning estimates of populations have been highly variable with
respect to meeting minimum abundance thresholds. Overall, the new information considered
does not indicate a change in the biological risk category since the last status review (Ford
2011b).
The species’ populations are generally well below the ICTRT’s abundance thresholds for
viability. Only the Deschutes (Eastside), Fifteen Mile Creek, and the North Fork John Day
populations have recent 10-year averages that exceed the thresholds; the other 14 extant
populations are all below the thresholds (though some are not far below) and a few represent
only fractions of the numbers needed for viability (see Table 44). On a positive note, the most
recent 20-year productivity averages are showing greater-than-replacement levels in all
populations for which we have data. Moreover, from the year 2009 through the year 2013, the
five-year average return to the ESU was 26,851 adult fish (NWFSC 2015); of these,
approximately 9 percent were of hatchery origin.
272
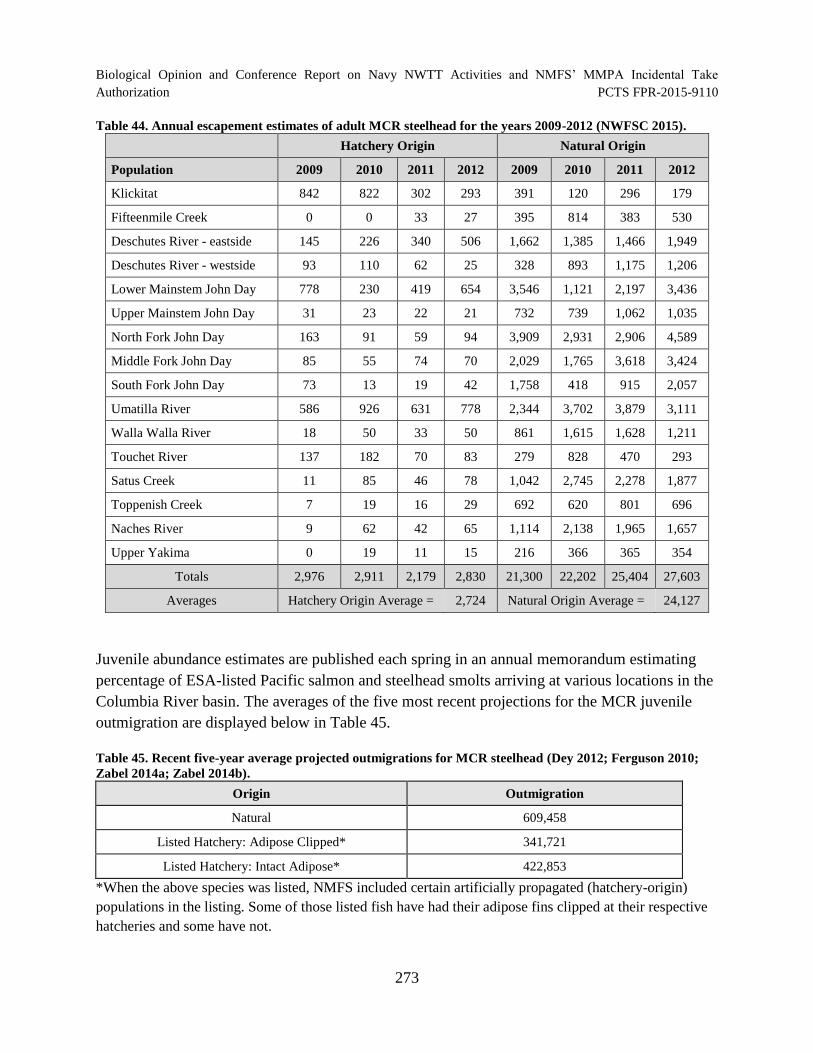
Biological Opinion and Conference Report on Navy NWTT Activities and NMFS’ MMPA Incidental Take Authorization PCTS FPR-2015-9110
Table 44. Annual escapement estimates of adult MCR steelhead for the years 2009-2012 (NWFSC 2015).
Hatchery Origin Natural Origin
Population 2009 2010 2011 2012 2009 2010 2011 2012
Klickitat 842 822 302 293 391 120 296 179
Fifteenmile Creek 0 0 33 27 395 814 383 530
Deschutes River - eastside 145 226 340 506 1,662 1,385 1,466 1,949
Deschutes River - westside 93 110 62 25 328 893 1,175 1,206
Lower Mainstem John Day 778 230 419 654 3,546 1,121 2,197 3,436
Upper Mainstem John Day 31 23 22 21 732 739 1,062 1,035
North Fork John Day 163 91 59 94 3,909 2,931 2,906 4,589
Middle Fork John Day 85 55 74 70 2,029 1,765 3,618 3,424
South Fork John Day 73 13 19 42 1,758 418 915 2,057
Umatilla River 586 926 631 778 2,344 3,702 3,879 3,111
Walla Walla River 18 50 33 50 861 1,615 1,628 1,211
Touchet River 137 182 70 83 279 828 470 293
Satus Creek 11 85 46 78 1,042 2,745 2,278 1,877
Toppenish Creek 7 19 16 29 692 620 801 696
Naches River 9 62 42 65 1,114 2,138 1,965 1,657
Upper Yakima 0 19 11 15 216 366 365 354
Totals 2,976 2,911 2,179 2,830 21,300 22,202 25,404 27,603
Averages Hatchery Origin Average = 2,724 Natural Origin Average = 24,127
Juvenile abundance estimates are published each spring in an annual memorandum estimating
percentage of ESA-listed Pacific salmon and steelhead smolts arriving at various locations in the
Columbia River basin. The averages of the five most recent projections for the MCR juvenile
outmigration are displayed below in Table 45.
Table 45. Recent five-year average projected outmigrations for MCR steelhead (Dey 2012; Ferguson 2010;
Zabel 2014a; Zabel 2014b).
Origin Outmigration
Natural 609,458
Listed Hatchery: Adipose Clipped* 341,721
Listed Hatchery: Intact Adipose* 422,853
*When the above species was listed, NMFS included certain artificially propagated (hatchery-origin)
populations in the listing. Some of those listed fish have had their adipose fins clipped at their respective
hatcheries and some have not.
273
Biological Opinion and Conference Report on Navy NWTT Activities and NMFS’ MMPA Incidental Take
Authorization PCTS FPR-2015-9110
Limiting Factors include (NMFS 2009a; NOAA Fisheries 2011):
Degraded freshwater habitat: Floodplain connectivity and function, channel structure and
complexity, riparian areas, fish passage, stream substrate, stream flow, and water quality
have been degraded as a result of cumulative impacts of agriculture, forestry, tributary
hydro system activities, and development
Mainstem Columbia River hydropower–related impacts
Degraded estuarine and nearshore marine habitat
Hatchery-related effects
Harvest-related effects
Effects of predation, competition, and disease
4.2.17.8.3 Upper Columbia River Steelhead
Upper Columbia River steelhead were originally listed as endangered in 1997 (62 FR 43937),
after their status was reviewed, they were reclassified to threatened on January 5, 2006 and then
reinstated to endangered status per U.S. District Court decision in June 2007 (62 FR 43937).
Spatial Structure and Diversity: Upper Columbia River (UCR) steelhead includes all naturally-
spawned steelhead populations below natural and manmade impassable barriers in streams in the
Columbia River Basin upstream from the Yakima River, Washington, to the U.S.-Canada border,
and progeny of six artificial propagation programs. Four independent populations of UCR
steelhead were identified by the IC-TRT in the same upriver tributaries as for UC spring-run
Chinook salmon (i.e., Wenatchee, Entiat, Methow, and Okanogan) and, similarly, no major
population groupings were identified due to the relatively small geographic area involve (Ford
2011b; NMFS 2011g). All extant populations are considered to be at high risk of extinction
(Ford 2011b). With the exception of the Okanogan population, the Upper Columbia populations
rated as “low” risk for spatial structure. The “high” risk ratings for SS/D are largely driven by
chronic high levels of hatchery spawners within natural spawning areas and lack of genetic
diversity among the populations. The proportions of hatchery origin returns in natural spawning
areas remain extremely high across the DPS, especially in the Methow and Okanogan River
populations. Overall, the new information considered does not indicate a change in the biological
risk category since the last status review (Ford 2011b).
Abundance and Productivity: UCR steelhead populations have increased in natural origin
abundance in recent years, but productivity levels remain low. The modest improvements in
natural returns in recent years are probably primarily the result of several years of relatively good
natural survival in the ocean and tributary habitats.
A review of data from the past several years indicates that natural steelhead abundance has
declined or remained low in the major river basins occupied by this species since the early
274
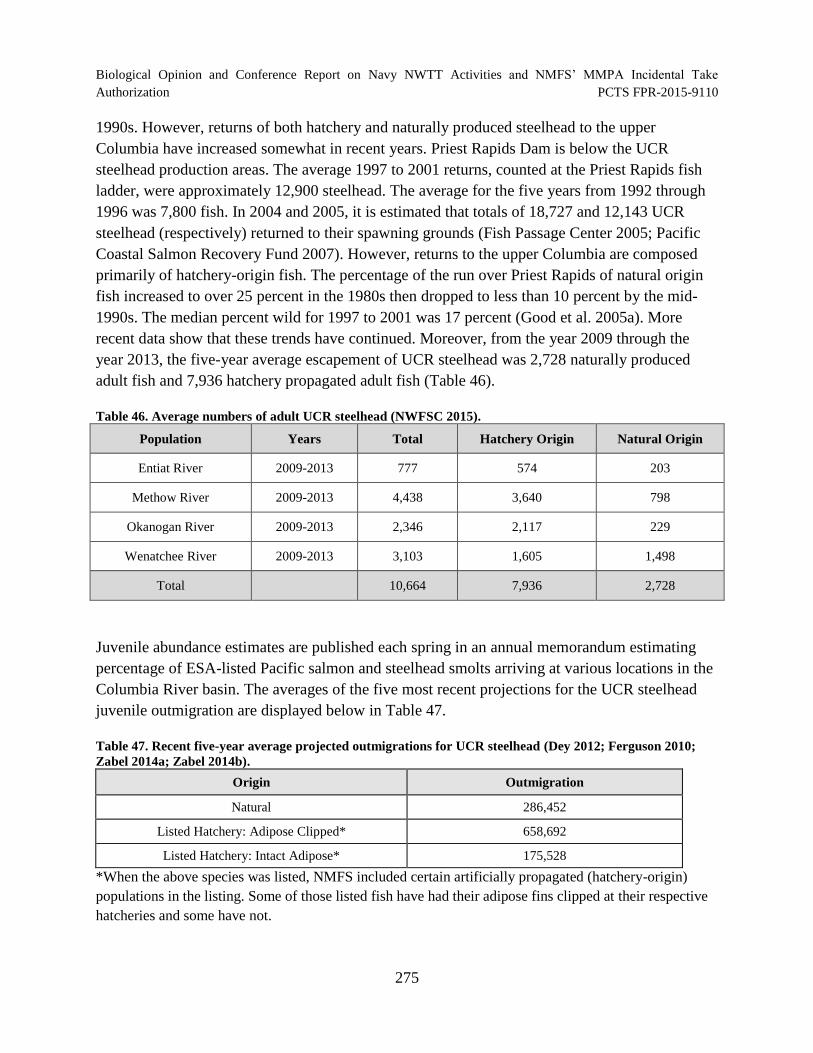
Biological Opinion and Conference Report on Navy NWTT Activities and NMFS’ MMPA Incidental Take
Authorization PCTS FPR-2015-9110
1990s. However, returns of both hatchery and naturally produced steelhead to the upper
Columbia have increased somewhat in recent years. Priest Rapids Dam is below the UCR
steelhead production areas. The average 1997 to 2001 returns, counted at the Priest Rapids fish
ladder, were approximately 12,900 steelhead. The average for the five years from 1992 through
1996 was 7,800 fish. In 2004 and 2005, it is estimated that totals of 18,727 and 12,143 UCR
steelhead (respectively) returned to their spawning grounds (Fish Passage Center 2005; Pacific
Coastal Salmon Recovery Fund 2007). However, returns to the upper Columbia are composed
primarily of hatchery-origin fish. The percentage of the run over Priest Rapids of natural origin
fish increased to over 25 percent in the 1980s then dropped to less than 10 percent by the mid
1990s. The median percent wild for 1997 to 2001 was 17 percent (Good et al. 2005a). More
recent data show that these trends have continued. Moreover, from the year 2009 through the
year 2013, the five-year average escapement of UCR steelhead was 2,728 naturally produced
adult fish and 7,936 hatchery propagated adult fish (Table 46).
Table 46. Average numbers of adult UCR steelhead (NWFSC 2015).
Population Years Total Hatchery Origin Natural Origin
Entiat River 2009-2013 777 574 203
Methow River 2009-2013 4,438 3,640 798
Okanogan River 2009-2013 2,346 2,117 229
Wenatchee River 2009-2013 3,103 1,605 1,498
Total 10,664 7,936 2,728
Juvenile abundance estimates are published each spring in an annual memorandum estimating
percentage of ESA-listed Pacific salmon and steelhead smolts arriving at various locations in the
Columbia River basin. The averages of the five most recent projections for the UCR steelhead
juvenile outmigration are displayed below in Table 47.
Table 47. Recent five-year average projected outmigrations for UCR steelhead (Dey 2012; Ferguson 2010;
Zabel 2014a; Zabel 2014b).
Origin Outmigration
Natural 286,452
Listed Hatchery: Adipose Clipped* 658,692
Listed Hatchery: Intact Adipose* 175,528
*When the above species was listed, NMFS included certain artificially propagated (hatchery-origin)
populations in the listing. Some of those listed fish have had their adipose fins clipped at their respective
hatcheries and some have not.
275

Biological Opinion and Conference Report on Navy NWTT Activities and NMFS’ MMPA Incidental Take
Authorization PCTS FPR-2015-9110
Limiting Factors include (NOAA Fisheries 2011; Upper Columbia Salmon Recovery Board
2007):
Mainstem Columbia River hydropower–related adverse effects
Impaired tributary fish passage
Degraded freshwater habitat: Floodplain connectivity and function, channel structure and
complexity, riparian areas and large woody debris recruitment, stream flow, and water
quality have been degraded as a result of cumulative impacts of agriculture, forestry, and
development.
Effects of predation, competition, and disease mortality: Fish management, including past
introductions and persistence of non-native (exotic) fish species continues to affect
habitat conditions for listed species.
Hatchery-related effects
Harvest-related effects
4.2.17.8.4 Upper Willamette River Steelhead
Upper Willamette River steelhead were listed as threatened in 1999 (64 FR 14517) and when
their status was reviewed on January 5, 2006 they retained that classification (71 FR 834).
Spatial Structure and Diversity: Upper Willamette River (UWR) steelhead includes all naturally-
spawned steelhead populations below natural and manmade impassable barriers in the
Willamette River, Oregon, and its tributaries upstream from Willamette Falls to the Calapooia
River. One stratum and four extant populations of UWR steelhead occur within the DPS.
Historical observations, hatchery records, and genetics suggest that the presence of UWR
steelhead in many tributaries on the west side of the upper basin is the result of recent
introductions. Nevertheless, the WLC-TRT recognized that although west side UWR steelhead
does not represent a historical population, those tributaries may provide juvenile rearing habitat
or may be temporarily (for one or more generations) colonized during periods of high
abundance. Hatchery summer-run steelhead that are released in the subbasins are from an out-of
basin stock, not part of the DPS. Additionally, stocked summer steelhead that have become
established in the McKenzie River were not considered in the identification of historical
populations (ODFW and NMFS 2011).
Abundance and Productivity: Since the last status review in 2005, UWR steelhead initially
increased in abundance but subsequently declines and current abundance is at the levels observed
in the mid-1990s when the DPS was first listed. The DPS appears to be at lower risk than the
UWR Chinook salmon ESU, but continues to demonstrate the overall low abundance pattern that
was of concern during the last status review. The elimination of winter-run hatchery release in
the basin reduces hatchery threats, but non-native summer steelhead hatchery releases are still a
276
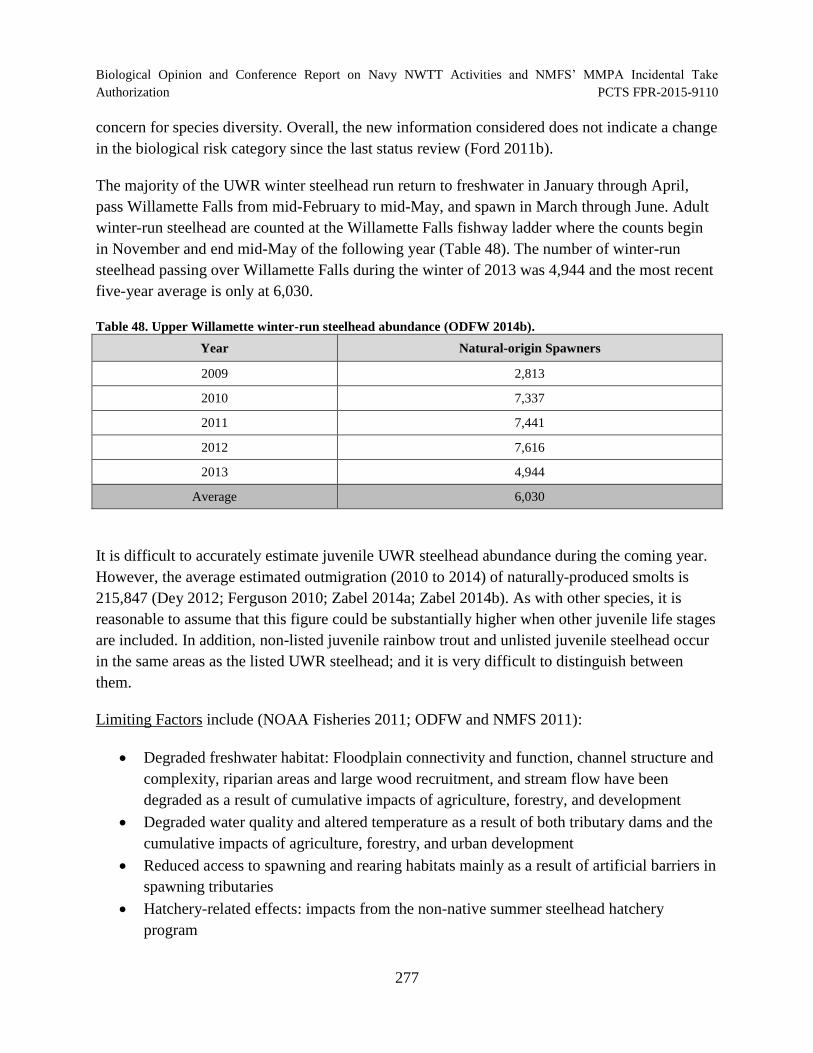
Biological Opinion and Conference Report on Navy NWTT Activities and NMFS’ MMPA Incidental Take
Authorization PCTS FPR-2015-9110
concern for species diversity. Overall, the new information considered does not indicate a change
in the biological risk category since the last status review (Ford 2011b).
The majority of the UWR winter steelhead run return to freshwater in January through April,
pass Willamette Falls from mid-February to mid-May, and spawn in March through June. Adult
winter-run steelhead are counted at the Willamette Falls fishway ladder where the counts begin
in November and end mid-May of the following year (Table 48). The number of winter-run
steelhead passing over Willamette Falls during the winter of 2013 was 4,944 and the most recent
five-year average is only at 6,030.
Table 48. Upper Willamette winter-run steelhead abundance (ODFW 2014b).
Year Natural-origin Spawners
2009 2,813
2010 7,337
2011 7,441
2012 7,616
2013 4,944
Average 6,030
It is difficult to accurately estimate juvenile UWR steelhead abundance during the coming year.
However, the average estimated outmigration (2010 to 2014) of naturally-produced smolts is
215,847 (Dey 2012; Ferguson 2010; Zabel 2014a; Zabel 2014b). As with other species, it is
reasonable to assume that this figure could be substantially higher when other juvenile life stages
are included. In addition, non-listed juvenile rainbow trout and unlisted juvenile steelhead occur
in the same areas as the listed UWR steelhead; and it is very difficult to distinguish between
them.
Limiting Factors include (NOAA Fisheries 2011; ODFW and NMFS 2011):
Degraded freshwater habitat: Floodplain connectivity and function, channel structure and
complexity, riparian areas and large wood recruitment, and stream flow have been
degraded as a result of cumulative impacts of agriculture, forestry, and development
Degraded water quality and altered temperature as a result of both tributary dams and the
cumulative impacts of agriculture, forestry, and urban development
Reduced access to spawning and rearing habitats mainly as a result of artificial barriers in
spawning tributaries
Hatchery-related effects: impacts from the non-native summer steelhead hatchery
program
277
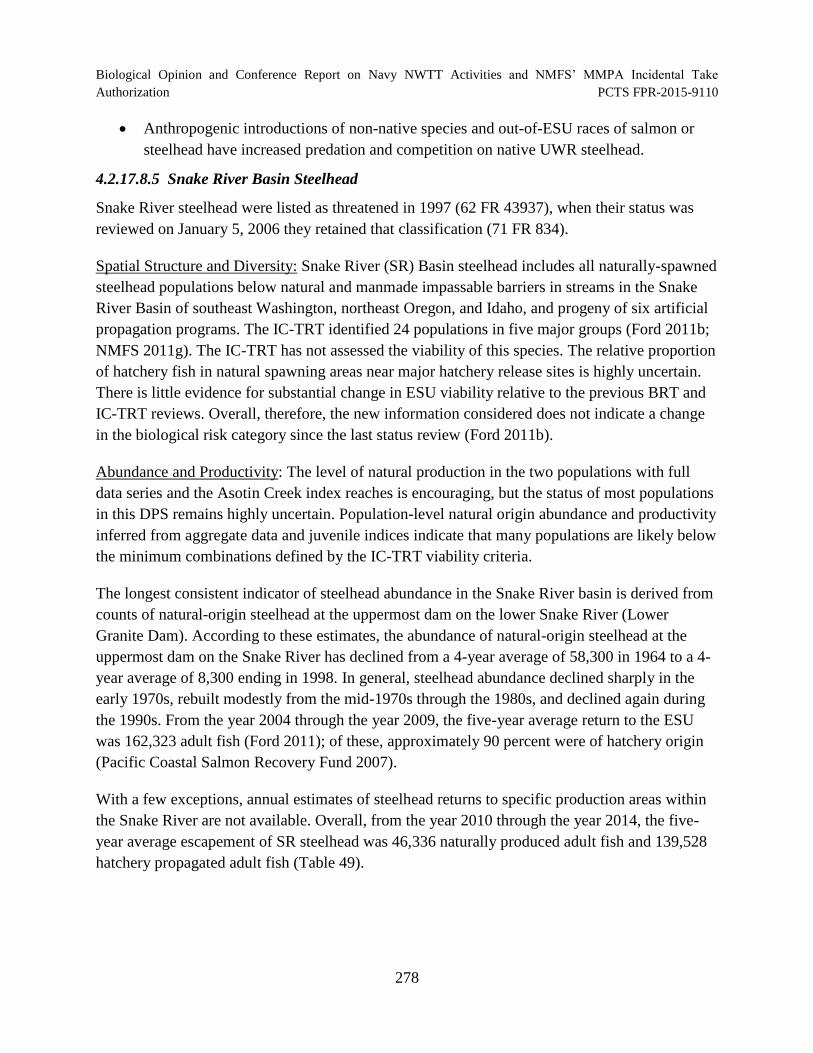
Biological Opinion and Conference Report on Navy NWTT Activities and NMFS’ MMPA Incidental Take
Authorization PCTS FPR-2015-9110
Anthropogenic introductions of non-native species and out-of-ESU races of salmon or
steelhead have increased predation and competition on native UWR steelhead.
4.2.17.8.5 Snake River Basin Steelhead
Snake River steelhead were listed as threatened in 1997 (62 FR 43937), when their status was
reviewed on January 5, 2006 they retained that classification (71 FR 834).
Spatial Structure and Diversity: Snake River (SR) Basin steelhead includes all naturally-spawned
steelhead populations below natural and manmade impassable barriers in streams in the Snake
River Basin of southeast Washington, northeast Oregon, and Idaho, and progeny of six artificial
propagation programs. The IC-TRT identified 24 populations in five major groups (Ford 2011b;
NMFS 2011g). The IC-TRT has not assessed the viability of this species. The relative proportion
of hatchery fish in natural spawning areas near major hatchery release sites is highly uncertain.
There is little evidence for substantial change in ESU viability relative to the previous BRT and
IC-TRT reviews. Overall, therefore, the new information considered does not indicate a change
in the biological risk category since the last status review (Ford 2011b).
Abundance and Productivity: The level of natural production in the two populations with full
data series and the Asotin Creek index reaches is encouraging, but the status of most populations
in this DPS remains highly uncertain. Population-level natural origin abundance and productivity
inferred from aggregate data and juvenile indices indicate that many populations are likely below
the minimum combinations defined by the IC-TRT viability criteria.
The longest consistent indicator of steelhead abundance in the Snake River basin is derived from
counts of natural-origin steelhead at the uppermost dam on the lower Snake River (Lower
Granite Dam). According to these estimates, the abundance of natural-origin steelhead at the
uppermost dam on the Snake River has declined from a 4-year average of 58,300 in 1964 to a 4
year average of 8,300 ending in 1998. In general, steelhead abundance declined sharply in the
early 1970s, rebuilt modestly from the mid-1970s through the 1980s, and declined again during
the 1990s. From the year 2004 through the year 2009, the five-year average return to the ESU
was 162,323 adult fish (Ford 2011); of these, approximately 90 percent were of hatchery origin
(Pacific Coastal Salmon Recovery Fund 2007).
With a few exceptions, annual estimates of steelhead returns to specific production areas within
the Snake River are not available. Overall, from the year 2010 through the year 2014, the five-
year average escapement of SR steelhead was 46,336 naturally produced adult fish and 139,528
hatchery propagated adult fish (Table 49).
278
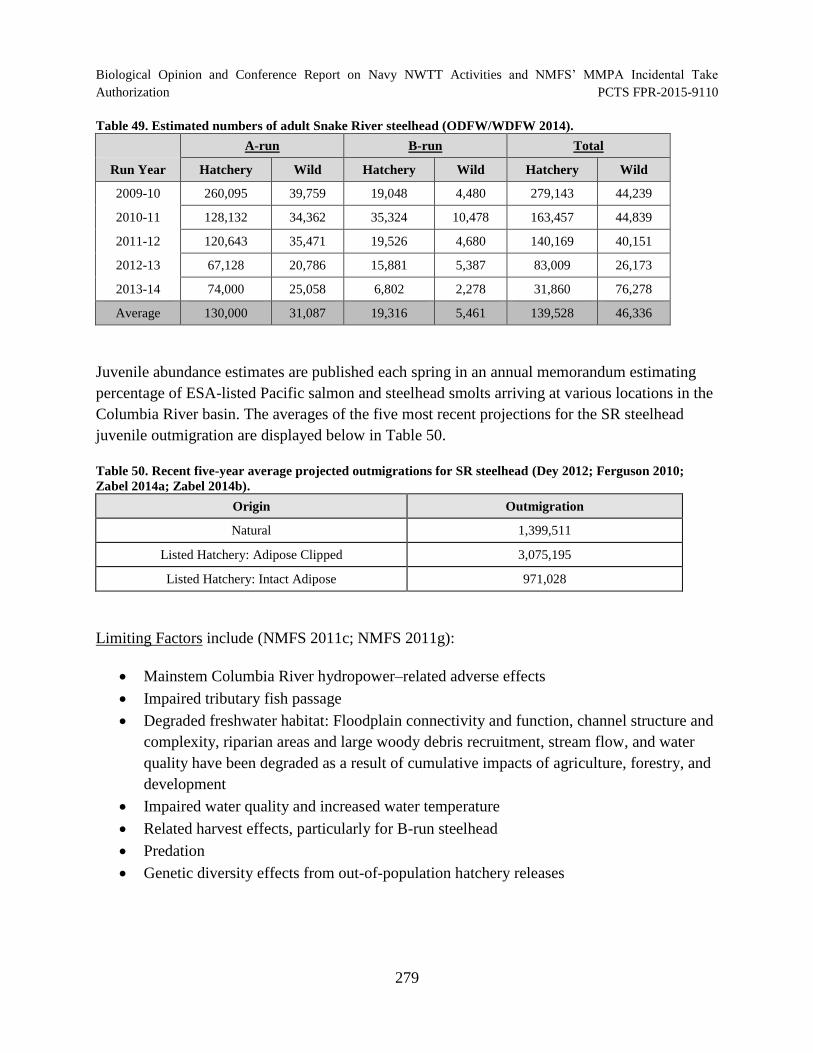
Biological Opinion and Conference Report on Navy NWTT Activities and NMFS’ MMPA Incidental Take Authorization PCTS FPR-2015-9110
Table 49. Estimated numbers of adult Snake River steelhead (ODFW/WDFW 2014).
Run Year
A-run B-run Total
Hatchery Wild Hatchery Wild Hatchery Wild
2009-10
2010-11
2011-12
2012-13
2013-14
260,095 39,759 19,048 4,480 279,143 44,239
128,132 34,362 35,324 10,478 163,457 44,839
120,643 35,471 19,526 4,680 140,169 40,151
67,128 20,786 15,881 5,387 83,009 26,173
74,000 25,058 6,802 2,278 31,860 76,278
Average 130,000 31,087 19,316 5,461 139,528 46,336
Juvenile abundance estimates are published each spring in an annual memorandum estimating
percentage of ESA-listed Pacific salmon and steelhead smolts arriving at various locations in the
Columbia River basin. The averages of the five most recent projections for the SR steelhead
juvenile outmigration are displayed below in Table 50.
Table 50. Recent five-year average projected outmigrations for SR steelhead (Dey 2012; Ferguson 2010;
Zabel 2014a; Zabel 2014b).
Origin Outmigration
Natural 1,399,511
Listed Hatchery: Adipose Clipped 3,075,195
Listed Hatchery: Intact Adipose 971,028
Limiting Factors include (NMFS 2011c; NMFS 2011g):
Mainstem Columbia River hydropower–related adverse effects
Impaired tributary fish passage
Degraded freshwater habitat: Floodplain connectivity and function, channel structure and
complexity, riparian areas and large woody debris recruitment, stream flow, and water
quality have been degraded as a result of cumulative impacts of agriculture, forestry, and
development
Impaired water quality and increased water temperature
Related harvest effects, particularly for B-run steelhead Predation Genetic diversity effects from out-of-population hatchery releases
279
Biological Opinion and Conference Report on Navy NWTT Activities and NMFS’ MMPA Incidental Take
Authorization PCTS FPR-2015-9110
4.2.17.8.6 Puget Sound Steelhead
Puget Sound steelhead were listed as threatened under the ESA on May 11, 2007 (72 FR 26722)
and affirmed as threatened on August 15, 2011 (76 FR 50448).
Spatial Structure and Diversity: Steelhead populations can be divided into two basic reproductive
ecotypes, based on the state of sexual maturity at the time of river entry (summer or winter) and
duration of spawning migration (Burgner et al. 1992)). The Puget Sound (PS) DPS includes all
naturally spawned anadromous winter-run and summer-run steelhead populations in streams in
the river basins of the Strait of Juan de Fuca, Puget Sound, and Hood Canal, Washington,
bounded to the west by the Elwha River (inclusive) and to the north by the Nooksack River and
Dakota Creek (inclusive), as well as the Green River natural and Hamma Hamma winter-run
steelhead hatchery stocks. Non-anadromous ‘‘resident’’ O. mykiss occur within the range of PS
steelhead but are not part of the DPS due to marked differences in physical, physiological,
The PS Steelhead TRT has completed a set of simple population viability analyses (PVAs) for
these draft populations and MPGs within the DPS. No new estimates of productivity, spatial
structure and diversity of PS steelhead have been made available since the 2007 review, when
the BRT concluded that low and declining abundance and low and declining productivity were
substantial risk factors for the species (USDC 2007). Loss of diversity and spatial structure were
judged to be “moderate” risk factors. Since the listing of this species, this threat has not changed
appreciably (Ford 2011b).
Abundance and Productivity: The BRT considered the major risk factors facing PS steelhead to
be: widespread declines in abundance and productivity for most natural steelhead populations in
the ESU, including those in Skagit and Snohomish rivers (previously considered to be
strongholds); the low abundance of several summer-run populations; and the sharply diminishing
abundance of some steelhead populations, especially in south Puget Sound, Hood Canal, and the
Strait of Juan de Fuca (Hard et al. 2007). For all but a few putative PS steelhead populations,
estimates of mean population growth rates obtained from observed spawner or redd counts are
declining—typically 3 to 10 percent annually—and extinction risk within 100 years for most
populations in the DPS is estimated to be moderate to high, especially for draft populations in the
putative South Sound and Olympic MPGs. Most populations within the DPS continue downward
trends in estimated abundance, a few sharply so. Extinction risk within 100 years for most
populations in the DPS is estimated to be moderate to high, especially for populations in the
South Sound and Olympic MPGs.
For the most recent 5-year period of escapement estimates (2009 through 2013), run size is
14,615 spawners (Table 51).
280
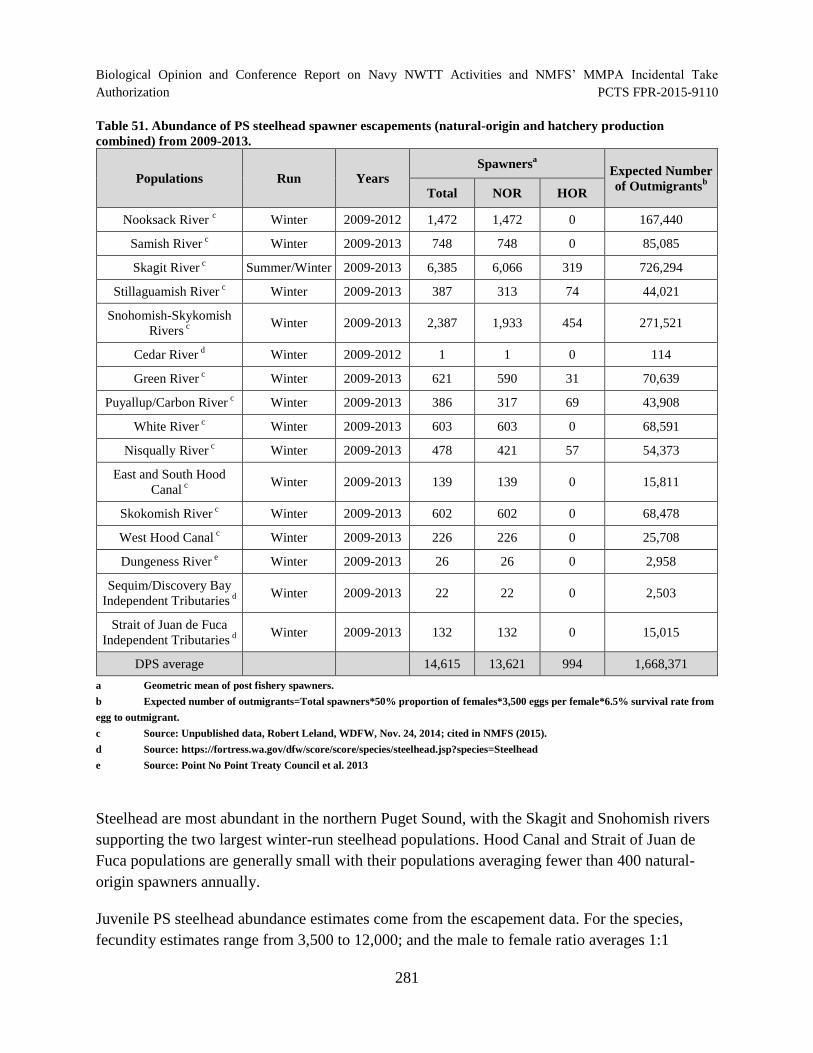
Biological Opinion and Conference Report on Navy NWTT Activities and NMFS’ MMPA Incidental Take
Authorization PCTS FPR-2015-9110
Table 51. Abundance of PS steelhead spawner escapements (natural-origin and hatchery production
combined) from 2009-2013.
Populations Run Years Spawners
a
Expected Number
of Outmigrantsb
Total NOR HOR
Nooksack River c
Winter 2009-2012 1,472 1,472 0 167,440
Samish River c
Winter 2009-2013 748 748 0 85,085
Skagit River c
Summer/Winter 2009-2013 6,385 6,066 319 726,294
Stillaguamish River c
Winter 2009-2013 387 313 74 44,021
Snohomish-Skykomish
Rivers c Winter 2009-2013 2,387 1,933 454 271,521
Cedar River d
Winter 2009-2012 1 1 0 114
Green River c
Winter 2009-2013 621 590 31 70,639
Puyallup/Carbon River c
Winter 2009-2013 386 317 69 43,908
White River c
Winter 2009-2013 603 603 0 68,591
Nisqually River c
Winter 2009-2013 478 421 57 54,373
East and South Hood
Canal c Winter 2009-2013 139 139 0 15,811
Skokomish River c
Winter 2009-2013 602 602 0 68,478
West Hood Canal c
Winter 2009-2013 226 226 0 25,708
Dungeness River e
Winter 2009-2013 26 26 0 2,958
Sequim/Discovery Bay
Independent Tributaries d Winter 2009-2013 22 22 0 2,503
Strait of Juan de Fuca
Independent Tributaries d Winter 2009-2013 132 132 0 15,015
DPS average 14,615 13,621 994 1,668,371
a Geometric mean of post fishery spawners.
b Expected number of outmigrants=Total spawners*50% proportion of females*3,500 eggs per female*6.5% survival rate from
egg to outmigrant.
c Source: Unpublished data, Robert Leland, WDFW, Nov. 24, 2014; cited in NMFS (2015).
d Source: https://fortress.wa.gov/dfw/score/score/species/steelhead.jsp?species=Steelhead
e Source: Point No Point Treaty Council et al. 2013
Steelhead are most abundant in the northern Puget Sound, with the Skagit and Snohomish rivers
supporting the two largest winter-run steelhead populations. Hood Canal and Strait of Juan de
Fuca populations are generally small with their populations averaging fewer than 400 natural-
origin spawners annually.
Juvenile PS steelhead abundance estimates come from the escapement data. For the species,
fecundity estimates range from 3,500 to 12,000; and the male to female ratio averages 1:1
281
Biological Opinion and Conference Report on Navy NWTT Activities and NMFS’ MMPA Incidental Take
Authorization PCTS FPR-2015-9110
(Pauley et al. 1986a). By applying a conservative fecundity estimate of 3,500 eggs to the
expected escapement of females (half of the escapement of both natural-origin and hatchery-
origin spawners – 7,308 females), 25.58 million eggs are expected to be produced annually. With
an estimated survival rate of 6.5 percent (Ward and Slaney 1993), the DPS should produce
roughly 1.7 million natural outmigrants annually.
Limiting factors include (NOAA Fisheries 2011):
Widespread declines in adult abundance (total run size), despite significant reductions in
harvest in recent years.
Threats to diversity posed by use of two hatchery steelhead stocks (Chambers Creek and
Skamania) inconsistent with wild stock diversity throughout the DPS.
Declining diversity in the DPS, including the uncertain but weak status of summer-run
fish in the DPS. A reduction in spatial structure for steelhead in the DPS. Reduced habitat quality through changes in river hydrology, temperature profile,
downstream gravel recruitment, and reduced movement of large woody debris.
Increased flood frequency and peak flows during storms, reduced groundwater-driven
summer flows in the lower reaches of many rivers and their tributaries in Puget Sound
where urban development has occurred, has resulted in gravel scour, bank erosion, and
sediment deposition.
Dikes, hardening of banks with riprap, and channelization, which have reduced river
braiding and sinuosity, have increased the likelihood of gravel scour and dislocation of
rearing juveniles.
4.2.17.8.7 Northern California Steelhead
Northern California steelhead were listed as threatened on June 7, 2000 (65 FR 36074), and
when their status was reviewed on January 5, 2006 they retained that classification (71 FR 834).
Spatial Structure and Diversity: The range of Northern California (NC) steelhead DPS is defined
to include all naturally spawned populations of steelhead in California coastal basins from
Redwood Creek in Humboldt county southward to, but not including the Russian River (71 FR
834-862). It includes the basins of all the rivers and streams tributary to the Pacific Ocean
between these two streams, including those in Humboldt, Trinity, Mendocino, Sonoma, Lake,
Glenn, Colusa, and Tehama counties. Comprehensive geographic distribution information of
areas currently occupied is not available for this DPS, but NC steelhead remain widely
distributed (Williams et al. 2011).
Abundance and Productivity: NMFS has recognized the decline of NC steelhead populations for
more than a dozen years, with available historical NC steelhead abundance data summarized and
282

Biological Opinion and Conference Report on Navy NWTT Activities and NMFS’ MMPA Incidental Take
Authorization PCTS FPR-2015-9110
published in the NMFS west coast steelhead status review by Busby et al. (1996c). Prior to 1960,
estimates of abundance specific to this ESU were available from dam counts in the upper Eel
River (Cape Horn Dam–annual average of 4,400 adult steelhead in the 1930s), the South Fork
Eel River (Benbow Dam–annual average of 19,000 adult steelhead in the 1940s), and the Mad
River (Sweasey Dam–annual average of 3,800 adult steelhead in the 1940s). In the mid-1960s,
estimates of steelhead spawning populations for many rivers in this ESU totaled 198,000. By the
mid 1990’s, the only available estimates for this area were counts at Cape Horn Dam on the Eel
River where an average of 115 total and 30 wild adults were reported (Busby et al. 1996c). The
most recent status review update by Williams et al. (2011) reports a mixture of patterns in
population trend information, with more populations showing declines than increases. However,
given the preponderance of significant negative trends in the available data, there is concern that
steelhead populations in this ESU may not be self-sustaining.
NC steelhead abundance and productivity has only recently been monitored. In 2009, CDFW
began studies to determine population-level abundance estimates of NC steelhead. Three
streams/rivers have fish counting facilities: Caspar Creek (weir), Pudding Creek (fish ladder),
and South Fork Noyo River (dam). From these studies, we estimate that the NC steelhead DPS
has an annual abundance of 3,607 adults (Table 52).
283
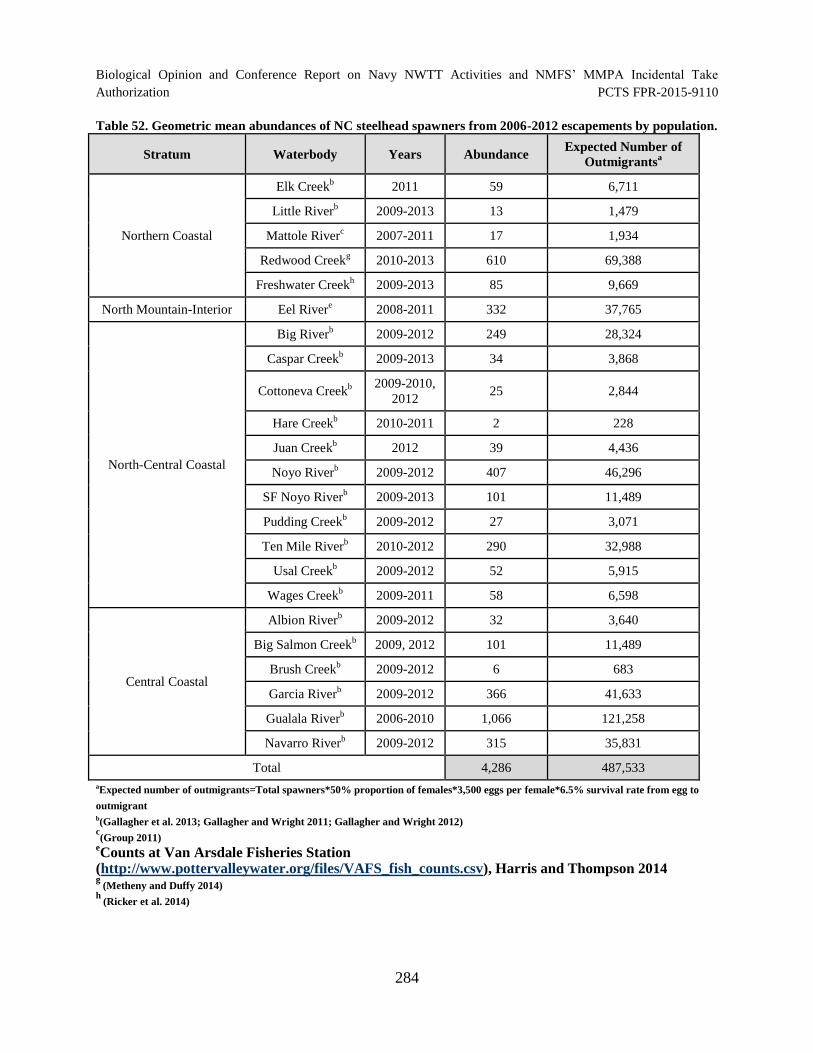
Biological Opinion and Conference Report on Navy NWTT Activities and NMFS’ MMPA Incidental Take Authorization PCTS FPR-2015-9110
Table 52. Geometric mean abundances of NC steelhead spawners from 2006-2012 escapements by population.
Stratum Waterbody Years Abundance Expected Number of
Outmigrantsa
Northern Coastal
Elk Creekb
2011 59 6,711
Little Riverb
2009-2013 13 1,479
Mattole Riverc
2007-2011 17 1,934
Redwood Creekg
2010-2013 610 69,388
Freshwater Creekh
2009-2013 85 9,669
North Mountain-Interior Eel Rivere
2008-2011 332 37,765
North-Central Coastal
Big Riverb
2009-2012 249 28,324
Caspar Creekb
2009-2013 34 3,868
Cottoneva Creekb 2009-2010,
2012 25 2,844
Hare Creekb
2010-2011 2 228
Juan Creekb
2012 39 4,436
Noyo Riverb
2009-2012 407 46,296
SF Noyo Riverb
2009-2013 101 11,489
Pudding Creekb
2009-2012 27 3,071
Ten Mile Riverb
2010-2012 290 32,988
Usal Creekb
2009-2012 52 5,915
Wages Creekb
2009-2011 58 6,598
Central Coastal
Albion Riverb
2009-2012 32 3,640
Big Salmon Creekb
2009, 2012 101 11,489
Brush Creekb
2009-2012 6 683
Garcia Riverb
2009-2012 366 41,633
Gualala Riverb
2006-2010 1,066 121,258
Navarro Riverb
2009-2012 315 35,831
Total 4,286 487,533
aExpected number of outmigrants=Total spawners*50% proportion of females*3,500 eggs per female*6.5% survival rate from egg to
outmigrant b(Gallagher et al. 2013; Gallagher and Wright 2011; Gallagher and Wright 2012)
(Group 2011) eCounts at Van Arsdale Fisheries Station
(http://www.pottervalleywater.org/files/VAFS_fish_counts.csv), Harris and Thompson 2014 g
(Metheny and Duffy 2014) h
(Ricker et al. 2014)
284
c

Biological Opinion and Conference Report on Navy NWTT Activities and NMFS’ MMPA Incidental Take
Authorization PCTS FPR-2015-9110
Both adult and juvenile abundance data is limited for this DPS. While we currently lack data on
naturally-produced juvenile NC steelhead, it is possible to make rough estimates of juvenile
abundance from the available adult return data. Juvenile NC steelhead abundance estimates come
from the escapement data. For the species, fecundity estimates range from 3,500 to 12,000; and
the male to female ratio averages 1:1 (Pauley et al. 1986a). By applying a conservative fecundity
estimate of 3,500 eggs to the expected escapement of females (half of the escapement of
spawners – 2,143 females), 7.5 million eggs are expected to be produced annually. With an
estimated survival rate of 6.5 percent (Ward and Slaney 1993), the DPS should produce roughly
487,533 natural outmigrants annually (Table 52).
Limiting Factors: Land management activities such as timber harvest, agriculture, and mining
have resulted in significant instream habitat degradation for NC steelhead, and continue to
contribute to poor habitat conditions (65 FR 36074). It is known that dams on the Mad River and
Eel River block large amounts of habitat historically used by NC steelhead (Busby et al. 1996c;
Spence et al. 2008). Also, the proportion of hatchery returns compared to wild stocks in recent
returns to the Mad and Eel river basins have exposed their respective wild population to genetic
introgression and the potential for deleterious interactions between native stock and introduced
steelhead (Williams et al. 2011). Historical hatchery practices at the Mad River hatchery are of
particular concern, and included out-planting of non-native Mad River hatchery fish to other
streams in the DPS and the production of non-native summer steelhead (65 FR 36074). The
conclusion of the 2005 status review (Good et al. 2005a) echoes that of previous reviews.
Abundance and productivity in this DPS are of most concern, relative to NC steelhead spatial
structure (distribution on the landscape) and diversity (level of genetic introgression). The lack of
data available also remains a risk because of uncertainty regarding the condition of some stream
populations.
4.2.17.8.8 Central California Coast Steelhead
The Central California Coast steelhead DPS was listed as a threatened species on August 18,
1997 (62 FR 43937) and was reaffirmed on January 5, 2006 (71 FR 834).
Spatial Structure and Diversity: On August 18, 1997, NMFS listed Central California Coast
(CCC) steelhead—both natural and some artificially-propagated fish—as a threatened species
(62 FR 43937). NMFS promulgated updated 4(d) protective regulations for CCC steelhead on
January 5, 2006 (71 FR 834). The section 4(d) protections (and limits on them) apply to natural
and hatchery CCC steelhead with an intact adipose fin, but not to listed hatchery fish that have
had their adipose fin removed.
The CCC steelhead DPS includes winter-run steelhead populations from the Russian River
(Sonoma County) south to Aptos Creek (Santa Cruz County) inclusive and eastward to Chipps
Island (confluence of the Sacramento and San Joaquin rivers) and including all drainages of San
285
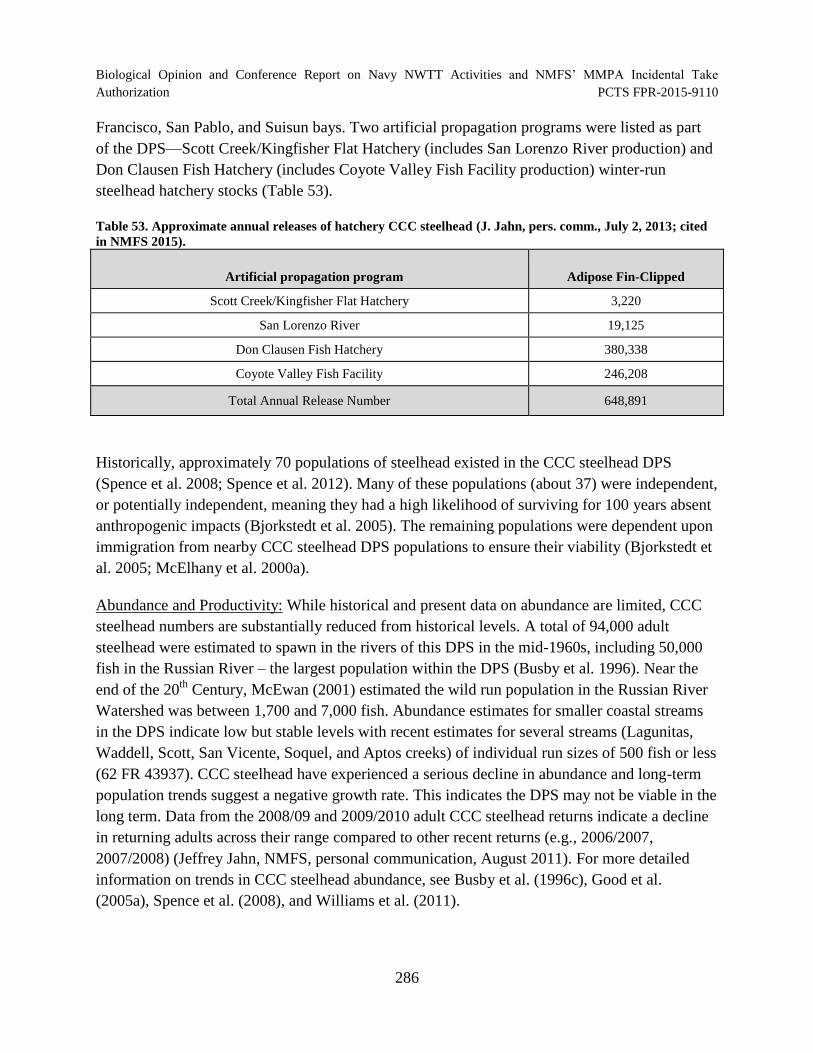
Biological Opinion and Conference Report on Navy NWTT Activities and NMFS’ MMPA Incidental Take
Authorization PCTS FPR-2015-9110
Francisco, San Pablo, and Suisun bays. Two artificial propagation programs were listed as part
of the DPS—Scott Creek/Kingfisher Flat Hatchery (includes San Lorenzo River production) and
Don Clausen Fish Hatchery (includes Coyote Valley Fish Facility production) winter-run
steelhead hatchery stocks (Table 53).
Table 53. Approximate annual releases of hatchery CCC steelhead (J. Jahn, pers. comm., July 2, 2013; cited
in NMFS 2015).
Artificial propagation program Adipose Fin-Clipped
Scott Creek/Kingfisher Flat Hatchery 3,220
San Lorenzo River 19,125
Don Clausen Fish Hatchery 380,338
Coyote Valley Fish Facility 246,208
Total Annual Release Number 648,891
Historically, approximately 70 populations of steelhead existed in the CCC steelhead DPS
(Spence et al. 2008; Spence et al. 2012). Many of these populations (about 37) were independent,
or potentially independent, meaning they had a high likelihood of surviving for 100 years absent
anthropogenic impacts (Bjorkstedt et al. 2005). The remaining populations were dependent upon
immigration from nearby CCC steelhead DPS populations to ensure their viability (Bjorkstedt et
al. 2005; McElhany et al. 2000a).
Abundance and Productivity: While historical and present data on abundance are limited, CCC
steelhead numbers are substantially reduced from historical levels. A total of 94,000 adult
steelhead were estimated to spawn in the rivers of this DPS in the mid-1960s, including 50,000
fish in the Russian River – the largest population within the DPS (Busby et al. 1996). Near the
end of the 20th
Century, McEwan (2001) estimated the wild run population in the Russian River
Watershed was between 1,700 and 7,000 fish. Abundance estimates for smaller coastal streams
in the DPS indicate low but stable levels with recent estimates for several streams (Lagunitas,
Waddell, Scott, San Vicente, Soquel, and Aptos creeks) of individual run sizes of 500 fish or less
(62 FR 43937). CCC steelhead have experienced a serious decline in abundance and long-term
population trends suggest a negative growth rate. This indicates the DPS may not be viable in the
long term. Data from the 2008/09 and 2009/2010 adult CCC steelhead returns indicate a decline
in returning adults across their range compared to other recent returns (e.g., 2006/2007,
2007/2008) (Jeffrey Jahn, NMFS, personal communication, August 2011). For more detailed
information on trends in CCC steelhead abundance, see Busby et al. (1996c), Good et al.
(2005a), Spence et al. (2008), and Williams et al. (2011).
286

Biological Opinion and Conference Report on Navy NWTT Activities and NMFS’ MMPA Incidental Take
Authorization PCTS FPR-2015-9110
Both adult and juvenile abundance data is limited for this DPS. While we currently lack data on
naturally-produced juvenile CCC steelhead, it is possible to make rough estimates of juvenile
abundance from the available adult return data. Juvenile CCC steelhead abundance estimates
come from the escapement data. All returnees to the hatcheries do not contribute to the natural
population and are not used in this calculation. For the species, fecundity estimates range from
3,500 to 12,000; and the male to female ratio averages 1:1 (Pauley et al. 1986a). By applying a
conservative fecundity estimate of 3,500 eggs to the expected escapement of females (half of the
escapement of natural-origin spawners – 715 females), 2.5 million eggs are expected to be
produced annually. With an estimated survival rate of 6.5 percent (Ward and Slaney 1993), the
DPS should produce roughly 162,549 natural outmigrants annually (Table 54).
Table 54. Geometric mean abundances of CCC steelhead spawners from 2006-2012 escapements by
population.
Stratum Waterbody Years Abundance Expected Number of
Outmigrantsab
Natural Hatchery
Northern
Coastal
Austin Creekc
2010-2012 63 - 7,166
Lagunitas Creekd
2009-2013 71 - 8,076
Walker Creeke
2007-2010 29 - 3,299
Interior Dry Creek
c 2011-2012 33 - 3,754
Russian Riverf
2008-2012 230 3,451 26,163
Santa Cruz
Mountains
Aptos Creekg
2007-2011 249 - 28,324
San Gregario Creekh
2006-2007 23 - 2,616
San Lorenzo Creekg
2007-2011 310 319 35,263
Scott Creeki
- 179 96 20,361
Soquel Creekg
2007-2011 230 - 26,163
Central
Coastal Napa River
j 2009-2012 12 - 1,365
Total 1,429 3,866 162,549
aExpected number of outmigrants=Total spawners*50% proportion of females*3,500 eggs per female*6.5% survival rate from egg to
outmigrant bBased upon natural-origin spawner numbers cSource: http://www.scwa.ca.gov/fisheries-monitoring/ d(Ettlinger et al. 2012; Jankovitz 2013) eSource: http://marinwater.org/documents/1_WalkerCreekReportandRefs_March2010.pdf fNatural abundance: (Manning and Martini-Lamb 2012);
Hatchery abundance source:
https://nrm.dfg.ca.gov/FileHandler.ashx?DocumentID=44269&inline=true gSource: http://scceh.com/LinkClick.aspx?fileticket=dRW_AUu1EoU%3D&tabid=1772 h(Atkinson 2010)
287
Biological Opinion and Conference Report on Navy NWTT Activities and NMFS’ MMPA Incidental Take
Authorization PCTS FPR-2015-9110
iWilliams et al. (2011) j(Koehler and Blank 2012)
Limiting factors: Some loss of genetic diversity has been documented and attributed to previous
among-basin transfers of stock and local hatchery production in interior populations in the
Russian River (Bjorkstedt et al. 2005). Reduced population sizes and fragmentation of habitat in
San Francisco streams has likely also led to loss of genetic diversity in these populations. DPS
populations that historically provided enough steelhead immigrants to support dependent
populations may no longer be able to do so, placing dependent populations at increased risk of
extirpation. However, because CCC steelhead have maintained a wide distribution throughout
the DPS, roughly approximating the known historical distribution, CCC steelhead likely possess
a resilience that could slow their decline relative to other salmonid DPSs or ESUs in worse
condition. The most recent status update concludes that steelhead in the CCC steelhead DPS
remain “likely to become endangered in the foreseeable future” Williams et al. (2011), as new
and additional information available since the previous status review (Good et al. 2005a) does
not appear to suggest a change in extinction risk. On August 15, 2011, NMFS chose to maintain
the threatened status of the CCC steelhead DPS (76 FR 50447).
4.2.17.8.9 California Central Valley Steelhead
The NMFS originally listed California Central Valley steelhead as threatened in 1998; this status
was reviewed and retained on January 5, 2006 (71 FR 834).
Spatial Structure and Diversity: On March 19, 1998, NMFS listed California Central Valley
(CCV) steelhead—both natural and some artificially-propagated fish—as a threatened species
(63 FR 13347). On January 5, 2006, NMFS reaffirmed the threatened status of the CCV
steelhead and applied the DPS policy to the species because the resident and anadromous life
forms of O. mykiss remain “markedly separated” as a consequence of physical, ecological and
behavioral factors, and therefore warranted delineation as a separate DPS and promulgated 4(d)
protective regulations for CCV steelhead (71 FR 834). The section 4(d) protections (and limits
on them) apply to natural and hatchery CCV steelhead with an intact adipose fin, but not to listed
hatchery fish that have had their adipose fin removed. On August 15, 2011, NMFS completed
another 5-year status review of CCV steelhead and recommended that the CCV steelhead DPS
remain classified as a threatened species (NMFS 2011l).
The CCV steelhead DPS includes steelhead populations spawning in the Sacramento and San
Joaquin rivers and their tributaries. Two artificial propagation programs were listed as part of the
DPS—Coleman National Fish Hatchery and Feather River Hatchery winter-run steelhead
hatchery stocks (Table 55).
288
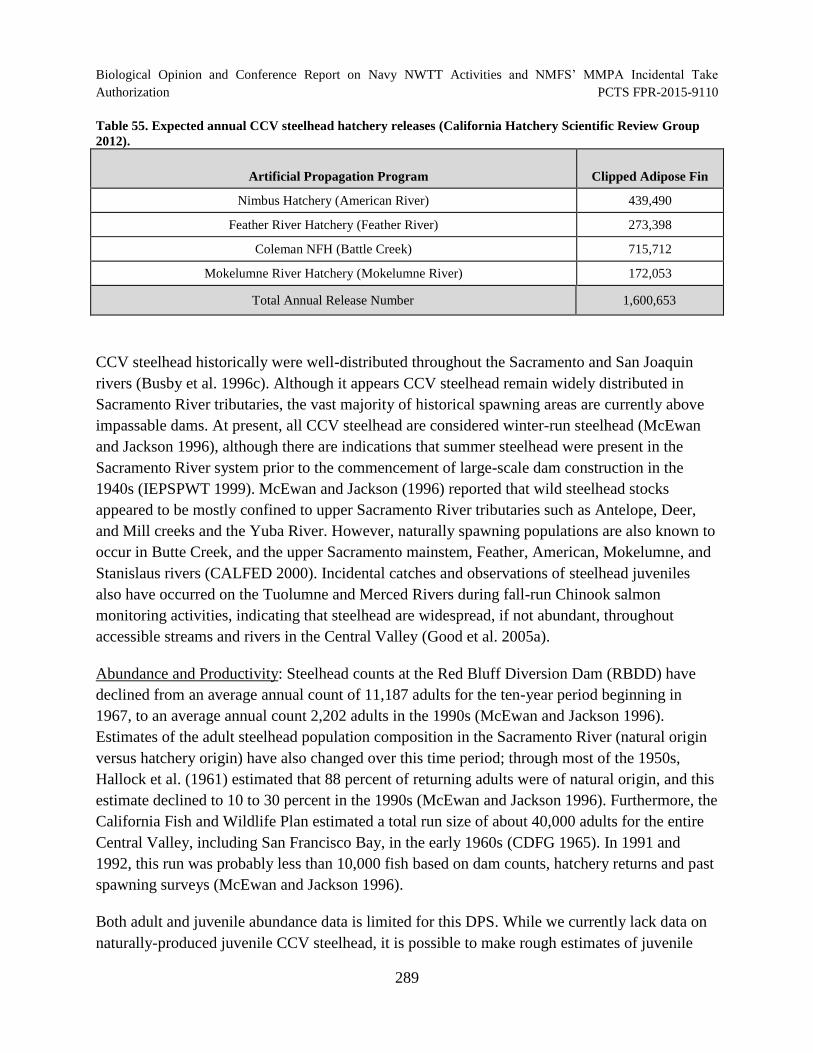
Biological Opinion and Conference Report on Navy NWTT Activities and NMFS’ MMPA Incidental Take
Authorization PCTS FPR-2015-9110
Table 55. Expected annual CCV steelhead hatchery releases (California Hatchery Scientific Review Group
2012).
Artificial Propagation Program Clipped Adipose Fin
Nimbus Hatchery (American River) 439,490
Feather River Hatchery (Feather River) 273,398
Coleman NFH (Battle Creek) 715,712
Mokelumne River Hatchery (Mokelumne River) 172,053
Total Annual Release Number 1,600,653
CCV steelhead historically were well-distributed throughout the Sacramento and San Joaquin
rivers (Busby et al. 1996c). Although it appears CCV steelhead remain widely distributed in
Sacramento River tributaries, the vast majority of historical spawning areas are currently above
impassable dams. At present, all CCV steelhead are considered winter-run steelhead (McEwan
and Jackson 1996), although there are indications that summer steelhead were present in the
Sacramento River system prior to the commencement of large-scale dam construction in the
1940s (IEPSPWT 1999). McEwan and Jackson (1996) reported that wild steelhead stocks
appeared to be mostly confined to upper Sacramento River tributaries such as Antelope, Deer,
and Mill creeks and the Yuba River. However, naturally spawning populations are also known to
occur in Butte Creek, and the upper Sacramento mainstem, Feather, American, Mokelumne, and
Stanislaus rivers (CALFED 2000). Incidental catches and observations of steelhead juveniles
also have occurred on the Tuolumne and Merced Rivers during fall-run Chinook salmon
monitoring activities, indicating that steelhead are widespread, if not abundant, throughout
accessible streams and rivers in the Central Valley (Good et al. 2005a).
Abundance and Productivity: Steelhead counts at the Red Bluff Diversion Dam (RBDD) have
declined from an average annual count of 11,187 adults for the ten-year period beginning in
1967, to an average annual count 2,202 adults in the 1990s (McEwan and Jackson 1996).
Estimates of the adult steelhead population composition in the Sacramento River (natural origin
versus hatchery origin) have also changed over this time period; through most of the 1950s,
Hallock et al. (1961) estimated that 88 percent of returning adults were of natural origin, and this
estimate declined to 10 to 30 percent in the 1990s (McEwan and Jackson 1996). Furthermore, the
California Fish and Wildlife Plan estimated a total run size of about 40,000 adults for the entire
Central Valley, including San Francisco Bay, in the early 1960s (CDFG 1965). In 1991 and
1992, this run was probably less than 10,000 fish based on dam counts, hatchery returns and past
spawning surveys (McEwan and Jackson 1996).
Both adult and juvenile abundance data is limited for this DPS. While we currently lack data on
naturally-produced juvenile CCV steelhead, it is possible to make rough estimates of juvenile
289
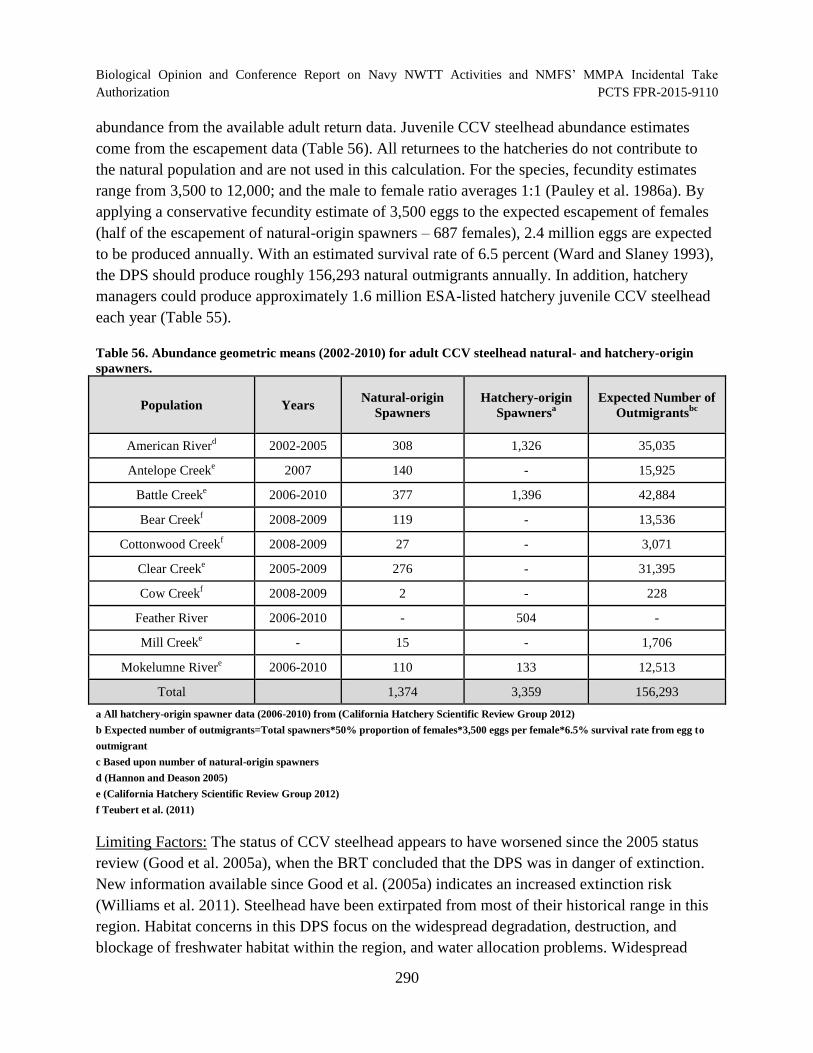
Biological Opinion and Conference Report on Navy NWTT Activities and NMFS’ MMPA Incidental Take
Authorization PCTS FPR-2015-9110
abundance from the available adult return data. Juvenile CCV steelhead abundance estimates
come from the escapement data (Table 56). All returnees to the hatcheries do not contribute to
the natural population and are not used in this calculation. For the species, fecundity estimates
range from 3,500 to 12,000; and the male to female ratio averages 1:1 (Pauley et al. 1986a). By
applying a conservative fecundity estimate of 3,500 eggs to the expected escapement of females
(half of the escapement of natural-origin spawners – 687 females), 2.4 million eggs are expected
to be produced annually. With an estimated survival rate of 6.5 percent (Ward and Slaney 1993),
the DPS should produce roughly 156,293 natural outmigrants annually. In addition, hatchery
managers could produce approximately 1.6 million ESA-listed hatchery juvenile CCV steelhead
each year (Table 55).
Table 56. Abundance geometric means (2002-2010) for adult CCV steelhead natural- and hatchery-origin
spawners.
Population Years Natural-origin
Spawners
Hatchery-origin
Spawnersa
Expected Number of
Outmigrantsbc
American Riverd
2002-2005 308 1,326 35,035
Antelope Creeke
2007 140 - 15,925
Battle Creeke
2006-2010 377 1,396 42,884
Bear Creekf
2008-2009 119 - 13,536
Cottonwood Creekf
2008-2009 27 - 3,071
Clear Creeke
2005-2009 276 - 31,395
Cow Creekf
2008-2009 2 - 228
Feather River 2006-2010 - 504 -
Mill Creeke
- 15 - 1,706
Mokelumne Rivere
2006-2010 110 133 12,513
Total 1,374 3,359 156,293
a All hatchery-origin spawner data (2006-2010) from (California Hatchery Scientific Review Group 2012)
b Expected number of outmigrants=Total spawners*50% proportion of females*3,500 eggs per female*6.5% survival rate from egg to
outmigrant
c Based upon number of natural-origin spawners
d (Hannon and Deason 2005)
e (California Hatchery Scientific Review Group 2012)
f Teubert et al. (2011)
Limiting Factors: The status of CCV steelhead appears to have worsened since the 2005 status
review (Good et al. 2005a), when the BRT concluded that the DPS was in danger of extinction.
New information available since Good et al. (2005a) indicates an increased extinction risk
(Williams et al. 2011). Steelhead have been extirpated from most of their historical range in this
region. Habitat concerns in this DPS focus on the widespread degradation, destruction, and
blockage of freshwater habitat within the region, and water allocation problems. Widespread
290
Biological Opinion and Conference Report on Navy NWTT Activities and NMFS’ MMPA Incidental Take
Authorization PCTS FPR-2015-9110
hatchery production of introduced steelhead within this DPS also raises concerns about the
potential ecological interactions between introduced and native stocks. Because the CCV
steelhead population has been fragmented into smaller isolated tributaries without any large
source population, and the remaining habitat continues to be degraded by water diversions, the
population remains at an elevated risk for future population declines.
4.2.17.8.10 South-Central California Coast Steelhead
South-Central California Coast steelhead were listed as threatened in 1997, when their status was
reviewed on January 5, 2006 they retained that classification (71 FR 834).
Spatial Structure and Diversity: On August 18, 1997, NMFS listed South-Central California
Coast (SCCC) steelhead—only natural-origin fish—as a threatened species (62 FR 43937). The
BRT evaluated the viability and extinction risk of naturally spawning populations and found high
risks to abundance, productivity, and the diversity of the SCCC DPS and expressed particular
concern for this DPS’s connectivity and spatial structure. NMFS promulgated 4(d) protective
regulations for SCCC steelhead on January 5, 2006 (71 FR 834). The section 4(d) protections
(and limits on them) apply to natural and hatchery SCCC steelhead with an intact adipose fin, but
not to listed hatchery fish that have had their adipose fin removed.
SCCC steelhead occupy rivers from the Pajaro River (Santa Cruz County, California), inclusive,
south to, but not including, the Santa Maria River (San Luis Obispo County, California). Most
rivers in this DPS drain from the San Lucia Mountain range, the southernmost section of the
California Coast Ranges. Many stream and rive mouths in this area are seasonally closed by sand
berms that form during the low water flows of summer.
Abundance and Productivity: In the mid-1960s the California Department of Fish and Wildlife
estimated an annual run size of 17,750 adult steelhead spawning in this coastal DPS. The CDFG
estimate, however, is just a midpoint number in the SCCC steelhead’s abundance decline—at the
point the estimate was made, there had already been a century of commercial harvest and coastal
development. Current SCCC steelhead abundance is still not well known. Multiple short-term
studies using different methodologies have occurred over the past decade.
291
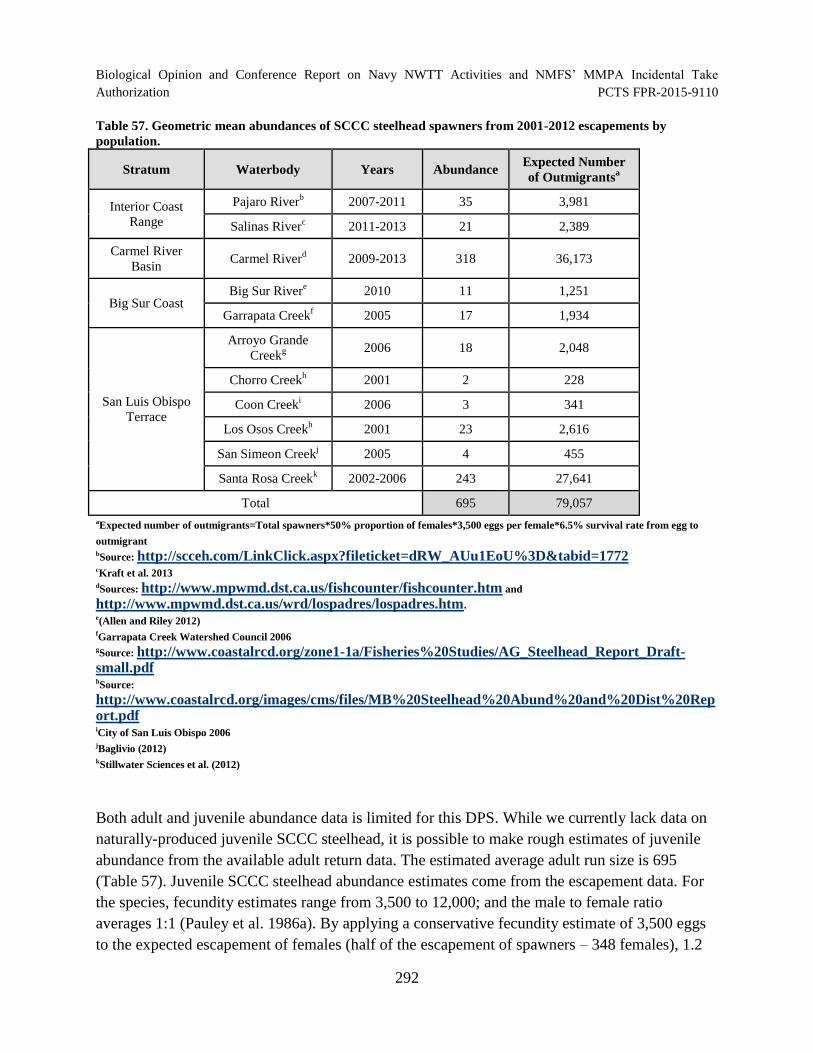
Biological Opinion and Conference Report on Navy NWTT Activities and NMFS’ MMPA Incidental Take
Authorization PCTS FPR-2015-9110
Table 57. Geometric mean abundances of SCCC steelhead spawners from 2001-2012 escapements by
population.
Stratum Waterbody Years Abundance Expected Number
of Outmigrantsa
Interior Coast
Range
Pajaro Riverb
2007-2011 35 3,981
Salinas Riverc
2011-2013 21 2,389
Carmel River
Basin Carmel River
d 2009-2013 318 36,173
Big Sur Coast Big Sur River
e 2010 11 1,251
Garrapata Creekf
2005 17 1,934
San Luis Obispo
Terrace
Arroyo Grande
Creekg 2006 18 2,048
Chorro Creekh
2001 2 228
Coon Creeki
2006 3 341
Los Osos Creekh
2001 23 2,616
San Simeon Creekj
2005 4 455
Santa Rosa Creekk
2002-2006 243 27,641
Total 695 79,057
aExpected number of outmigrants=Total spawners*50% proportion of females*3,500 eggs per female*6.5% survival rate from egg to
outmigrant bSource: http://scceh.com/LinkClick.aspx?fileticket=dRW_AUu1EoU%3D&tabid=1772 cKraft et al. 2013 dSources: http://www.mpwmd.dst.ca.us/fishcounter/fishcounter.htm and
http://www.mpwmd.dst.ca.us/wrd/lospadres/lospadres.htm. e(Allen and Riley 2012) fGarrapata Creek Watershed Council 2006 gSource: http://www.coastalrcd.org/zone1-1a/Fisheries%20Studies/AG_Steelhead_Report_Draftsmall.pdf hSource:
http://www.coastalrcd.org/images/cms/files/MB%20Steelhead%20Abund%20and%20Dist%20Rep ort.pdf iCity of San Luis Obispo 2006 jBaglivio (2012) kStillwater Sciences et al. (2012)
Both adult and juvenile abundance data is limited for this DPS. While we currently lack data on
naturally-produced juvenile SCCC steelhead, it is possible to make rough estimates of juvenile
abundance from the available adult return data. The estimated average adult run size is 695
(Table 57). Juvenile SCCC steelhead abundance estimates come from the escapement data. For
the species, fecundity estimates range from 3,500 to 12,000; and the male to female ratio
averages 1:1 (Pauley et al. 1986a). By applying a conservative fecundity estimate of 3,500 eggs
to the expected escapement of females (half of the escapement of spawners – 348 females), 1.2
292
Biological Opinion and Conference Report on Navy NWTT Activities and NMFS’ MMPA Incidental Take
Authorization PCTS FPR-2015-9110
million eggs are expected to be produced annually. With an estimated survival rate of 6.5 percent
(Ward and Slaney 1993), the DPS should produce roughly 79,057 natural outmigrants annually.
Limiting Factors: NMFS’ most recent status reviews for SCCC steelhead (NMFS 2011l;
Williams et al. 2011) identified habitat destruction and degradation as serious ongoing risk
factors for this DPS. Urban development, flood control, water development, and other
anthropogenic factors have adversely affected the proper functioning and condition of some
spawning, rearing, and migratory habitats in streams designated as critical habitat. Urbanization
has resulted in some permanent impacts to steelhead critical habitat due to stream channelization,
increased bank erosion, riparian damage, migration barriers, and pollution (Good et al. 2005a).
Many streams within the DPS have dams and reservoirs that mute flushing stream flows,
withhold or reduce water levels suitable for fish passage and rearing, physically block upstream
fish passage, and retain valuable coarse sediments for spawning and rearing. In addition, some
stream reaches within the DPS’ designated critical habitat may be vulnerable to further
perturbation resulting from poor land use and management decisions.
4.3 Summary of NMFS’ Final Effects Determinations for ESA-listed Species and
Designated Critical Habitat
This section provides a summary of NMFS’s final determinations on effects to ESA-listed
species, species proposed for listing as threatened or endangered, and designated and proposed
critical habitat as assessed in this biological opinion and conference report.
293

Biological Opinion and Conference Report on Navy NWTT Activities and NMFS’ MMPA Incidental Take
Authorization PCTS FPR-2015-9110
Table 58. Summary of Species Effect Determinations for Training and Testing Activities in the Action Area
Species Effect Determinations
Species/DPS/ESU Training Testing NMFS Final
(Navy) (Navy) Determination
MARINE MAMMALS
North Pacific right whale NLAA NLAA NLAA
Humpback whale LAA LAA LAA
Blue whale LAA LAA LAA
Fin whale LAA LAA LAA
Sei whale NLAA LAA LAA
Western North Pacific gray whale NLAA NLAA NLAA
Sperm whale LAA LAA LAA
Southern Resident killer whale LAA NLAA LAA
Guadalupe fur seal LAA LAA LAA
SEA TURTLES
Green sea turtle NLAA NLAA NLAA
Loggerhead sea turtle NLAA NLAA NLAA
Olive Ridley sea turtle NLAA NLAA NLAA
Leatherback sea turtle LAA LAA LAA
FISH
Puget Sound ESU LAA NLAA LAA
Upper Columbia River spring-run ESU LAA LAA LAA
Lower Columbia River ESU LAA LAA LAA
UpperWillamette River ESU LAA LAA LAA
Chinook
Salmon Snake River spring/summer-run ESU LAA LAA LAA
Snake River fall-run ESU LAA LAA LAA
California Coastal ESU LAA LAA LAA
Central Valley spring-run ESU LAA LAA LAA
Sacramento River winter-run LAA LAA LAA
Lower Columbia ESU LAA LAA LAA
Coho Oregon coast ESU LAA LAA LAA
Salmon Southern Oregon/Northern California coast ESU LAA LAA LAA
Central California Coast LAA LAA LAA
Chum Hood Canal summer-run ESU LAA NLAA LAA
Salmon Columbia River ESU LAA LAA LAA
294
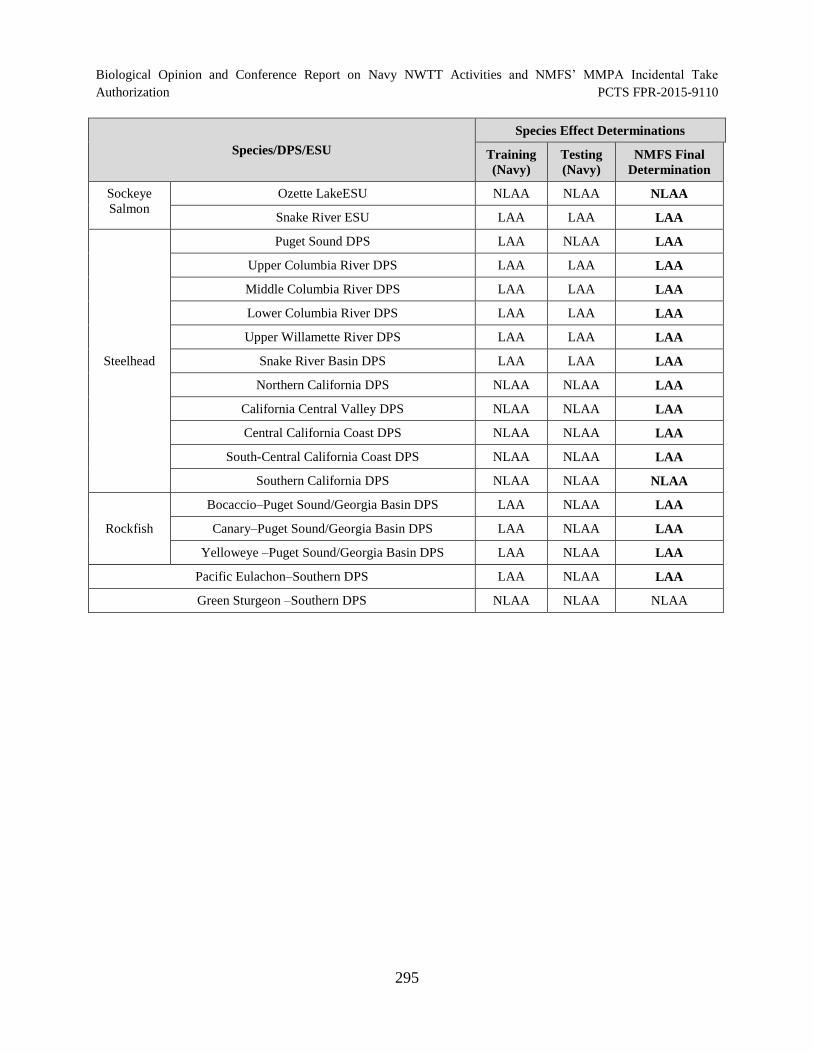
Biological Opinion and Conference Report on Navy NWTT Activities and NMFS’ MMPA Incidental Take
Authorization PCTS FPR-2015-9110
Species/DPS/ESU
Species Effect Determinations
Training
(Navy)
Testing
(Navy)
NMFS Final
Determination
Sockeye
Salmon
Ozette LakeESU NLAA NLAA NLAA
Snake River ESU LAA LAA LAA
Steelhead
Puget Sound DPS LAA NLAA LAA
Upper Columbia River DPS LAA LAA LAA
Middle Columbia River DPS LAA LAA LAA
Lower Columbia River DPS LAA LAA LAA
Upper Willamette River DPS LAA LAA LAA
Snake River Basin DPS LAA LAA LAA
Northern California DPS NLAA NLAA LAA
California Central Valley DPS NLAA NLAA LAA
Central California Coast DPS NLAA NLAA LAA
South-Central California Coast DPS NLAA NLAA LAA
Southern California DPS NLAA NLAA NLAA
Rockfish
Bocaccio–Puget Sound/Georgia Basin DPS LAA NLAA LAA
Canary–Puget Sound/Georgia Basin DPS LAA NLAA LAA
Yelloweye –Puget Sound/Georgia Basin DPS LAA NLAA LAA
Pacific Eulachon–Southern DPS LAA NLAA LAA
Green Sturgeon –Southern DPS NLAA NLAA NLAA
295
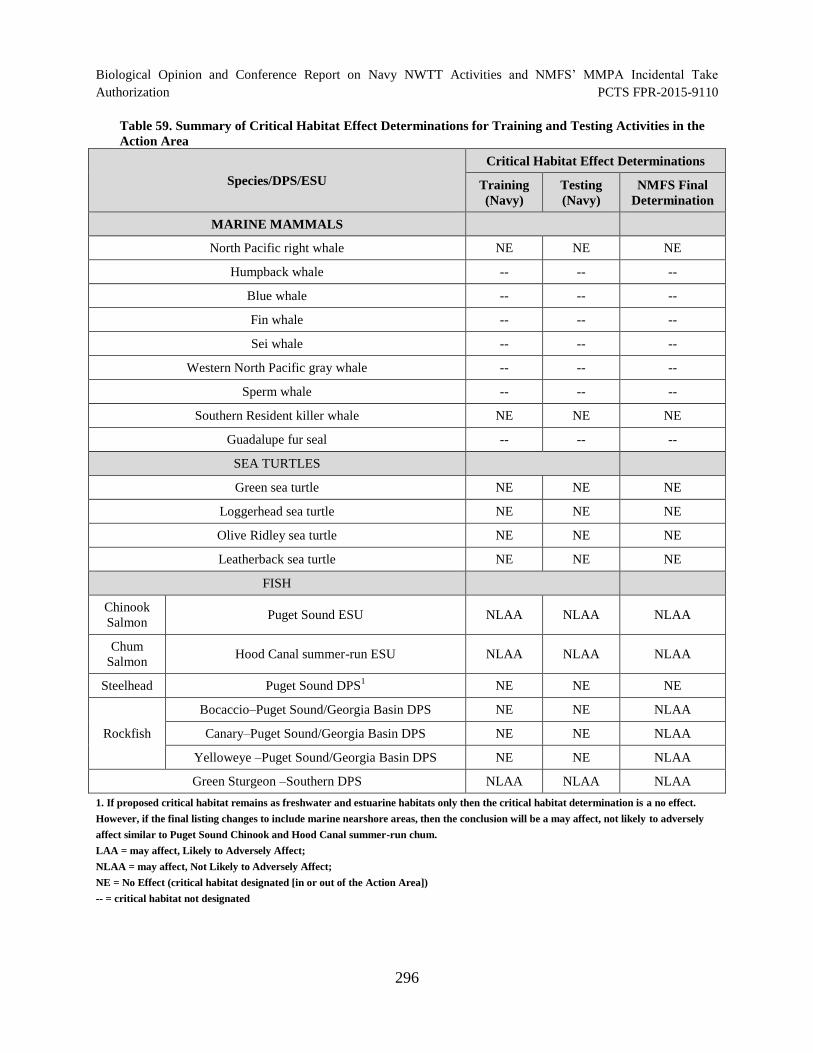
Biological Opinion and Conference Report on Navy NWTT Activities and NMFS’ MMPA Incidental Take
Authorization PCTS FPR-2015-9110
Table 59. Summary of Critical Habitat Effect Determinations for Training and Testing Activities in the
Action Area
Species/DPS/ESU
Critical Habitat Effect Determinations
Training
(Navy)
Testing
(Navy)
NMFS Final
Determination
MARINE MAMMALS
North Pacific right whale NE NE NE
Humpback whale - - -
Blue whale - - -
Fin whale - - --
Sei whale - - -
Western North Pacific gray whale - - -
Sperm whale - - -
Southern Resident killer whale NE NE NE
Guadalupe fur seal - - -
SEA TURTLES
Green sea turtle NE NE NE
Loggerhead sea turtle NE NE NE
Olive Ridley sea turtle NE NE NE
Leatherback sea turtle NE NE NE
FISH
Chinook
Salmon Puget Sound ESU NLAA NLAA NLAA
Chum
Salmon Hood Canal summer-run ESU NLAA NLAA NLAA
Steelhead Puget Sound DPS1
NE NE NE
Rockfish
Bocaccio–Puget Sound/Georgia Basin DPS NE NE NLAA
Canary–Puget Sound/Georgia Basin DPS NE NE NLAA
Yelloweye –Puget Sound/Georgia Basin DPS NE NE NLAA
Green Sturgeon –Southern DPS NLAA NLAA NLAA
1. If proposed critical habitat remains as freshwater and estuarine habitats only then the critical habitat determination is a no effect.
However, if the final listing changes to include marine nearshore areas, then the conclusion will be a may affect, not likely to adversely
affect similar to Puget Sound Chinook and Hood Canal summer-run chum.
LAA = may affect, Likely to Adversely Affect;
NLAA = may affect, Not Likely to Adversely Affect;
NE = No Effect (critical habitat designated [in or out of the Action Area])
-- = critical habitat not designated
296

Biological Opinion and Conference Report on Navy NWTT Activities and NMFS’ MMPA Incidental Take
Authorization PCTS FPR-2015-9110
5 ENVIRONMENTAL BASELINE
The “Environmental Baseline” includes the past and present impacts of all Federal, state, or
private actions and other human activities in the Action Area, the anticipated impacts of all
proposed Federal projects in the Action Area that have already undergone formal or early section
7 consultation, and the impact of state or private actions which are contemporaneous with the
consultation in process (50 CFR 402.02).
5.1 Climate Change
The latest Assessment Synthesis Report from the Working Groups on the Intergovernmental
Panel on Climate Change (IPCC) concluded climate change is unequivocal (IPCC 2014). The
Report concludes oceans have warmed, with ocean warming the greatest near the surface (e.g.,
the upper 75 m have warmed by 0.11 oC per decade over the period 1971 to 2010) (IPCC 2014).
Global mean sea level rose by 0.19 m between 1901 and 2010, and the rate of sea-level rise since
the mid-19th
century has been greater than the mean rate during the previous two millennia
(IPCC 2014). Additional consequences of climate change include increased ocean stratification,
decreased sea-ice extent, altered patterns of ocean circulation, and decreased ocean oxygen levels
(Doney et al. 2012a). Further, ocean acidity has increased by 26 percent since the beginning of
the industrial era (IPCC 2014) and this rise has been linked to climate change (Andersson et al.
2015; Foreman and Yamanaka 2011; GAO 2014; Murray et al. 2014; Okey et al. 2014;
Secretariat of the Convention on Biological Diversity 2014). Climate change is also expected to
increase the frequency of extreme weather and climate events including, but not limited to,
cyclones, heat waves, and droughts. (IPCC 2014). Climate change has the potential to impact
species abundance, geographic distribution, migration patterns, timing of seasonal activities
(IPCC 2014), and species viability into the future. Climate change is also expected to result in
the expansion of low oxygen zones in the marine environment (Gilly et al. 2013). Though
predicting the precise consequences of climate change on highly mobile marine species, such as
many of those considered in this Opinion, is difficult (Simmonds and Isaac 2007), recent
research has indicated a range of consequences already occurring.
Marine species ranges are expected to shift as they align their distributions to match their
physiological tolerances under changing environmental conditions (Doney et al. 2012a). Hazen
et al. (2012) examined top predator distribution and diversity in the Pacific Ocean in light of
rising sea surface temperatures using a database of electronic tags and output from a global
climate model. He predicted up to a 35 percent change in core habitat area for some key marine
predators in the Pacific Ocean, with some species predicted to experience gains in available core
habitat and some predicted to experience losses. Notably, leatherback sea turtles were predicted
to gain core habitat area, whereas loggerhead sea turtles and blue whales were predicted to
experience losses in available core habitat. McMahon and Hays (2006) predicted increased ocean
297
Biological Opinion and Conference Report on Navy NWTT Activities and NMFS’ MMPA Incidental Take Authorization PCTS FPR-2015-9110
temperatures would expand the distribution of leatherback sea turtles into more northern
latitudes. The authors noted this is already occurring in the Atlantic Ocean. MacLeod (2009)
estimated, based upon expected shifts in water temperature, 88 percent of cetaceans would be
affected by climate change, with 47 percent likely to be negatively affected. Willis-Norton et al.
(2015) acknowledge there would be both habitat loss and gain, but overall climate change could
result in a 15 percent loss of core pelagic habitat for leatherback sea turtles in the eastern south
Pacific.
Similarly, climate-mediated changes in important prey species populations are likely to affect
predator populations. For example, blue whales, as predators that specialize in eating krill, are
likely to change their distribution in response to changes in the distribution of krill (Clapham et
al. 1999; Payne et al. 1986; Payne et al. 1990b). (Pecl and Jackson 2008) predicted climate
change will likely result in squid that hatch out smaller and earlier, undergo faster growth over
shorter life-spans, and mature younger at a smaller size. This could have significant negative
consequences for species such as sperm whales, whose diets can be dominated by cephalopods.
For ESA-listed species that undergo long migrations, if either prey availability or habitat
suitability is disrupted by changing ocean temperature regimes, the timing of migration can
change or negatively impact population sustainability (Simmonds and Eliott. 2009).
Changes in global climatic patterns are expected to have profound effects on coastlines
worldwide, potentially having significant consequences for the species considered in this
Opinion that are partially dependent on terrestrial habitat areas (i.e., sea turtles). For example,
rising sea levels are projected to inundate some sea turtle nesting beaches (Caut et al. 2009;
Wilkinson and Souter 2008), change patterns of coastal erosion and sand accretion that are
necessary to maintain those beaches, and increase the number of turtle nests destroyed by
tropical storms and hurricanes (Wilkinson and Souter 2008). The loss of nesting beaches may
have catastrophic effects on global sea turtle populations if they are unable to colonize new
beaches, or if new beaches do not provide the habitat attributes (e.g., sand depth, temperature
regimes, refuge) necessary for egg survival. Additionally, increasing temperatures in sea turtle
nests, as is expected with climate change, alters sex ratios, reduces incubation times (producing
smaller hatchlings), and reduces nesting success due to exceeded thermal tolerances (Fuentes et
al. 2009b; Fuentes et al. 2010; Fuentes et al. 2009c; Glen et al. 2003). All of these temperature
related impacts have the potential to significantly impact sea turtle reproductive success and
ultimately, long-term species viability. Poloczanska et al. (2009b) noted that extant marine turtle
species have survived past climatic shifts, including glacial periods and warm events, and
therefore may have the ability to adapt to ongoing climate change (e.g., by finding new nesting
beaches). However, the authors also suggested since the current rate of warming is very rapid,
expected changes may outpace sea turtles’ ability to adapt.
298
Biological Opinion and Conference Report on Navy NWTT Activities and NMFS’ MMPA Incidental Take Authorization PCTS FPR-2015-9110
Previous warming events (e.g., El Niño, the 1977 through 1998 warm phase of the Pacific
Decadal Oscillation) may illustrate the potential consequences of climate change. Off the U.S.
west coast, past warming events have reduced nutrient input and primary productivity in the
California Current, which also reduced productivity of zooplankton through upper-trophic level
consumers (Doney et al. 2012a; Sydeman et al. 2009; Veit et al. 1996). In the past, warming
events have resulted in reduced food supplies for marine mammals along the U.S. west coast
(Feldkamp et al. 1991; Hayward 2000; Le Boeuf and Crocker 2005). Some marine mammal
distributions may have shifted northward in response to persistent prey occurrence in more
northerly waters during El Niño events (Benson et al. 2002; Danil and Chivers 2005; Lusseau et
al. 2004; Norman et al. 2004b; Shane 1994; Shane 1995). Low reproductive success and body
condition in humpback whales may have resulted from the 1997/1998 El Niño (Cerchio et al.
2005).
There is now widespread consensus within the scientific community that average atmospheric
temperatures on earth are increasing (warming) and that this will continue for at least the next
several decades (IPCC 2001; IPCC 2014; Oreskes 2004; Poloczanska et al. 2013). There is also
consensus within the scientific community that this warming trend will alter current weather
patterns and patterns associated with climatic phenomena, including the timing and intensity of
extreme events such as heat-waves, floods, storms, and wet-dry cycles. The threats posed by the
direct and indirect effects of global climate change are, or will be, common to many of the
species we discuss in this Opinion (Doney et al. 2012b; Hazen et al. 2012; Poloczanska et al.
2013).
Climate change is projected to have substantial direct and indirect effects on individuals,
populations, species, and the structure and function of marine, coastal, and terrestrial ecosystems
in the reasonably foreseeable future (Houghton 2001; IPCC 2001; IPCC 2002; Parry et al. 2007)
(Alter et al. 2010; Cheung et al. 2015; Ramp et al. 2015). The direct effects of climate change
will result in increases in atmospheric temperatures, changes in sea surface temperatures,
patterns of precipitation, and sea level. Oceanographic models project a weakening of the
thermohaline circulation resulting in a reduction of heat transport into high latitudes of Europe,
an increase in the mass of the Antarctic ice sheet, and a decrease in the Greenland ice sheet,
although the magnitude of these changes remain unknown. Species that are shorter-lived, of
larger body size, or generalist in nature are likely to be better able to adapt to climate change
over the long term versus those that are longer-lived, smaller-sized, or rely upon specialized
habitats (Brashares 2003; Cardillo 2003; Cardillo et al. 2005; Issac 2009; Purvis et al. 2000).
Climate change is most likely to have its most pronounced effects on species whose populations
are already in tenuous positions (Issac 2009). As such, we expect the risk of extinction to listed
species to rise with the degree of climate shift associated with global warming.
299
Biological Opinion and Conference Report on Navy NWTT Activities and NMFS’ MMPA Incidental Take
Authorization PCTS FPR-2015-9110
The IPCC (2014) estimated that by the mid-21st century, the spatial shifts of marine species will
cause species richness to increase at mid and high latitudes (high confidence) and to decrease at
tropical latitudes (medium confidence), resulting in global redistribution of catch potential for
fishes and invertebrates, with implications for food security. Animal displacements are projected
to lead to high-latitude invasions and high local-extinction rates in the tropics and semi-enclosed
seas. This will cause a 30 to 70 percent increase in the fisheries yield of some high-latitude
regions by 2055 (relative to 2005), a redistribution at mid latitudes, but a drop of 40 to 60 percent
in the tropics and the Antarctic, based on 2 °C warming above pre-industrial values (medium
confidence in the direction of trends in fisheries yields, low confidence in the magnitude of
change). If a decrease in global net primary production (NPP) or a shift towards smaller primary
producers occurs, the overall fisheries catch potential may also decrease.
The limits to acclimatization or adaptation capacity are presently unknown. However, mass
extinctions occurring during much slower rates of climate change in Earth history suggest that
evolutionary rates in some organisms may not be fast enough to cope (IPCC 2014).
The IPCC also estimated that average global land and sea surface temperature has increased by
0.6 °C (±0.2) since the mid-1800s, with most of the change occurring since 1976. Eleven of the
12 warmest years on record since 1850 have occurred since 1995 (Poloczanska et al. 2009a).
Furthermore, the Northern Hemisphere (where a greater proportion of ESA-listed species occur)
is warming faster than the Southern Hemisphere, although land temperatures are rising more
rapidly than over the oceans (Poloczanska et al. 2009a). This temperature increase is greater than
what would be expected given the range of natural climatic variability recorded over the past
1,000 years (Crowley 2000). Furthermore, the Northern Hemisphere (where a greater proportion
of ESA-listed species occur) is warming faster than the Southern Hemisphere, although land
temperatures are rising more rapidly than over the oceans (Poloczanska et al. 2009a). The IPCC
reviewed computer simulations of the effect of greenhouse gas emissions on observed climate
variations that have been recorded in the past and evaluated the influence of natural phenomena
such as solar and volcanic activity. Based on their review, the IPCC concluded that natural
phenomena are insufficient to explain the increasing trend in land and sea surface temperature,
and that most of the warming observed over the last 50 years is likely to be attributable to human
activities (IPCC 2001). Climatic models estimate that global temperatures would increase
between 1.4 to 5.8 °C from 1990 to 2100 if humans do nothing to reduce greenhouse gas
emissions (IPCC 2001). Fiedler et al. (2013) for the 50-year period from 1958 to 2008 concluded
that climatic variability has led to documented changes in the pycnocline in the eastern tropical
and North Pacific. In particular, “in the eastern equatorial Pacific the pycnocline shoaled by 10 m
and weakened by 5 percent over the 50 years, while in the California Current the pycnocline
deepened by ~5 m but showed little net change in stratification (which weakened by 5 percent to
the mid-1970s, strengthened by 8 percent to the mid-1990s, and then weakened by 4 percent to
300
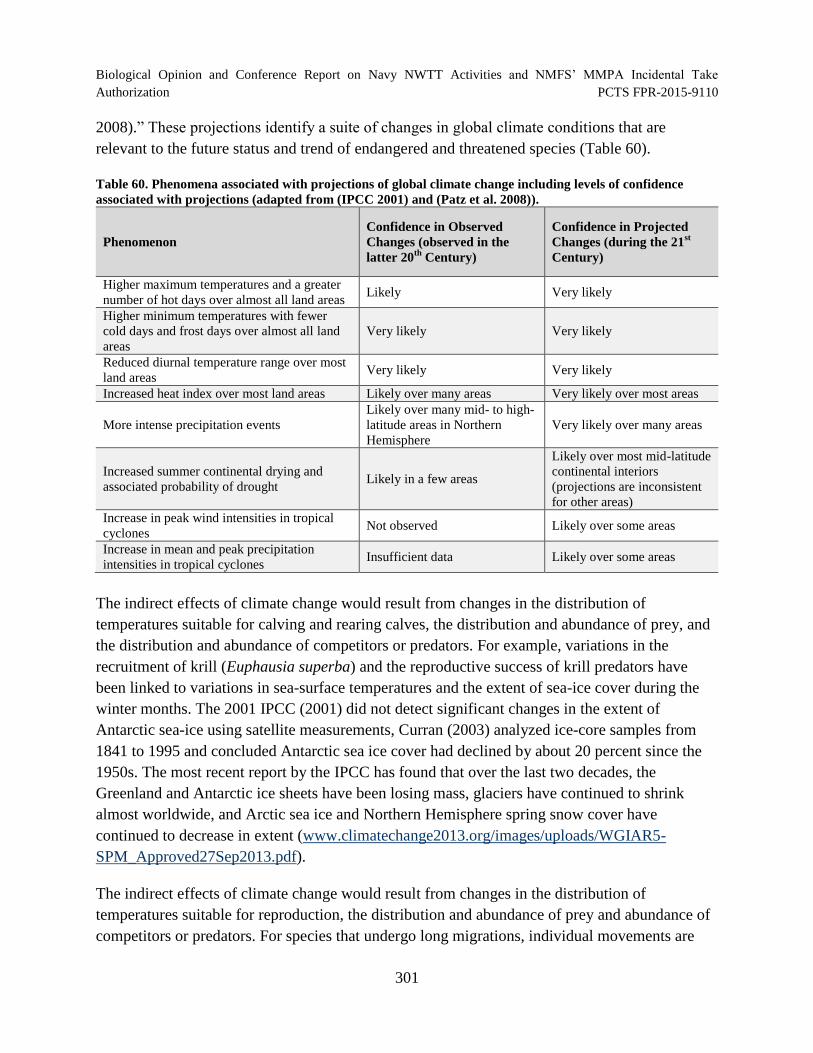
Biological Opinion and Conference Report on Navy NWTT Activities and NMFS’ MMPA Incidental Take
Authorization PCTS FPR-2015-9110
2008).” These projections identify a suite of changes in global climate conditions that are
relevant to the future status and trend of endangered and threatened species (Table 60).
Table 60. Phenomena associated with projections of global climate change including levels of confidence
associated with projections (adapted from (IPCC 2001) and (Patz et al. 2008)).
Phenomenon
Confidence in Observed
Changes (observed in the
latter 20th
Century)
Confidence in Projected
Changes (during the 21st
Century)
Higher maximum temperatures and a greater
number of hot days over almost all land areas Likely Very likely
Higher minimum temperatures with fewer
cold days and frost days over almost all land
areas
Very likely Very likely
Reduced diurnal temperature range over most
land areas Very likely Very likely
Increased heat index over most land areas Likely over many areas Very likely over most areas
More intense precipitation events
Likely over many mid- to high-
latitude areas in Northern
Hemisphere
Very likely over many areas
Increased summer continental drying and
associated probability of drought Likely in a few areas
Likely over most mid-latitude
continental interiors
(projections are inconsistent
for other areas)
Increase in peak wind intensities in tropical
cyclones Not observed Likely over some areas
Increase in mean and peak precipitation
intensities in tropical cyclones Insufficient data Likely over some areas
The indirect effects of climate change would result from changes in the distribution of
temperatures suitable for calving and rearing calves, the distribution and abundance of prey, and
the distribution and abundance of competitors or predators. For example, variations in the
recruitment of krill (Euphausia superba) and the reproductive success of krill predators have
been linked to variations in sea-surface temperatures and the extent of sea-ice cover during the
winter months. The 2001 IPCC (2001) did not detect significant changes in the extent of
Antarctic sea-ice using satellite measurements, Curran (2003) analyzed ice-core samples from
1841 to 1995 and concluded Antarctic sea ice cover had declined by about 20 percent since the
1950s. The most recent report by the IPCC has found that over the last two decades, the
Greenland and Antarctic ice sheets have been losing mass, glaciers have continued to shrink
almost worldwide, and Arctic sea ice and Northern Hemisphere spring snow cover have
continued to decrease in extent (www.climatechange2013.org/images/uploads/WGIAR5
SPM_Approved27Sep2013.pdf).
The indirect effects of climate change would result from changes in the distribution of
temperatures suitable for reproduction, the distribution and abundance of prey and abundance of
competitors or predators. For species that undergo long migrations, individual movements are
301
Biological Opinion and Conference Report on Navy NWTT Activities and NMFS’ MMPA Incidental Take
Authorization PCTS FPR-2015-9110
usually associated with prey availability or habitat suitability. If either is disrupted by changing
ocean temperature regimes, the timing of migration can change or negatively impact population
sustainability (Simmonds and Eliott. 2009). For sea turtles, warming ocean temperatures may
extend poleward the habitat which they can utilize (Poloczanska et al. 2009a). Seagrass habitats
have declined by 29 percent in the last 130 years and 19 percent of coral reefs have been lost due
to human degradation, reducing lower latitude habitat for some sea turtle species (Poloczanska et
al. 2009a). Primary production is estimated to have declined by 6 percent between the early
1980s and 2010, making foraging more difficult for marine species (Hoegh-Guldberg and Bruno
2010).
The Antarctic Peninsula, which is the northern extension of the Antarctic continent, contains the
richest areas of krill in the Southern Ocean. The extent of sea ice cover around this Peninsula has
the highest degree of variability relative to other areas within the distribution of krill. Relatively
small changes in climate conditions are likely to exert a strong influence on the seasonal pack-ice
zone in the Peninsula area, which is likely to affect densities of krill in this region. Because krill
are important prey for baleen whales or form a critical component of the food chains on which
baleen whales depend, increasing the variability of krill densities or causing those densities to
decline dramatically is likely to have adverse effect on populations of baleen whales in the
Southern Ocean.
Reid and Croxall (2001) analyzed a 23-year time series of the reproductive performance of
predators that depend on krill for prey — Antarctic fur seals (Arctocephalus gazella), gentoo
penguins (Pygoscelis papua), macaroni penguins (Eudyptes chrysolophus), and black-browed
albatrosses (Thalassarche melanophrys) — at South Georgia Island and concluded that these
populations experienced increases in the 1980s followed by significant declines in the 1990s
accompanied by an increase in the frequency of years with reduced reproductive success. The
authors concluded that macaroni penguins and black-browed albatrosses had declined by as
much as 50 percent in the 1990s, although incidental mortalities in longline fisheries probably
contributed to the decline of the albatross. These authors concluded, however, that these declines
result, at least in part, from changes in the structure of the krill population, particularly reduced
recruitment into older age classes, which lowers the number of predators this prey species can
sustain. The authors concluded that the biomass of krill within the largest size class was
sufficient to support predator demand in the 1980s but not in the 1990s.
Similarly, a study of relationships between climate and sea-temperature changes and the arrival
of squid off southwestern England over a 20-year period concluded that veined squid (Loligo
forbesi) migrate eastwards in the English Channel earlier when water in the preceding months is
warmer, and that higher temperatures and early arrival correspond with warm phases of the
North Atlantic oscillation (Sims et al. 2001). The timing of squid peak abundance advanced by
120 to 150 days in the warmest years compared with the coldest. Seabottom temperatures were
302
Biological Opinion and Conference Report on Navy NWTT Activities and NMFS’ MMPA Incidental Take
Authorization PCTS FPR-2015-9110
closely linked to the extent of squid movement and temperature increases over the five months
prior to and during the month of peak squid abundance did not differ between early and late
years. These authors concluded that the temporal variation in peak abundance of squid seen off
Plymouth represents temperature-dependent movement, which is in turn mediated by climatic
changes associated with the North Atlantic Oscillation. Changes in oxygen concentrations and
positon within the California Current have the potential to impact the prey of sperm whales.
Hazen et al. (2012) predicted up to 35 percent change in core habitat for some key Pacific
species based on climate change scenarios predicated on the rise in average sea surface
temperature by 2100. Climate-mediated changes in the distribution and abundance of keystone
prey species like krill and climate-mediated changes in the distribution of cephalopod
populations worldwide is likely to affect marine mammal populations as they re-distribute
throughout the world’s oceans in search of prey. Blue whales, as predators that specialize in
eating krill, seem likely to change their distribution in response to changes in the distribution of
krill (for example, see Payne et al. 1990a; Payne 1986); if they did not change their distribution
or could not find the biomass of krill necessary to sustain their population numbers, their
populations seem likely to experience declines similar to those observed in other krill predators,
which would cause dramatic declines in their population sizes or would increase the year-to-year
variation in population size; either of these outcomes would dramatically increase the extinction
probabilities of these whales.
Sperm whales, whose diets can be dominated by cephalopods, would have to re-distribute
following changes in the distribution and abundance of their prey. This statement assumes that
projected changes in global climate would only affect the distribution of cephalopod populations,
but would not reduce the number or density of cephalopod populations. If, however, cephalopod
populations collapse or decline dramatically, sperm whale populations are likely to collapse or
decline dramatically as well.
Periodic weather patterns such as El Niño, La Niña, the Pacific decadal oscillation, and North
Pacific Gyre Oscillation can fundamentally change oceanographic conditions in the northeastern
Pacific and the biology that is based upon it (Chenillat et al. 2013; Chenillat et al. 2012; Doney et
al. 2012b; Kudela et al. 2008; Litzow and Mueter 2013; Mundy and Cooney 2005; Mundy and
Olsson 2005; Stabeno et al. 2004; Sydeman et al. 2013). Roughly every 3 to 7 years, El Niño can
influence the northeastern Pacific (JOI/USSSP 2003; Stabeno et al. 2004). Typical changes
include increased winter air temperature, precipitation, sea level, and down welling favorable
conditions (Royer and Weingartner 1999; Whitney et al. 1999). La Niña events tend to swing
these conditions in the negative direction (Stabeno et al. 2004). However, sea surface
temperatures (SSTs) can take 1 year to change following an El Niño event or change to varying
degrees (Bailey et al. 1995; Brodeur et al. 1996a; Freeland 1990; Royer 2005). The 1982/1983 El
Niño and other down welling events are generally regarded to have reduced food supplies for
303
Biological Opinion and Conference Report on Navy NWTT Activities and NMFS’ MMPA Incidental Take
Authorization PCTS FPR-2015-9110
marine mammals along the U.S. west coast (Feldkamp et al. 1991; Hayward 2000; Le Boeuf and
Crocker 2005). During La Niña conditions in the Gulf of California, Bryde’s whales were found
to be more abundant, possibly due to increased availability of their prey under La Niña
conditions (Salvadeo et al. 2011). Marine mammal distribution and social organization (group
size) is also believed to have shifted northward in response to persistent or extralimital prey
occurrence in more northerly waters during El Niño events (Benson et al. 2002; Danil and
Chivers 2005; Lusseau et al. 2004; Norman et al. 2004b; Shane 1994; Shane 1995). Low
reproductive success and body condition in humpback whales have also been suggested to have
resulted from the 1997/1998 El Niño (Cerchio et al. 2005). El Niño events in the winters of 1952
to 1953, 1957 to 1958, 1965 to 1966, and 1982 to 1983 were associated with strong down
welling anomalies, which reduces nutrient availability for plankton (Bailey et al. 1995; Thomas
and Strub 2001; Wheeler and Hill 1999). Plankton diversity also shifts, as smaller plankton are
better able to cope with reduced nutrient availability (Corwith and Wheeler 2002; Sherr et al.
2005).
The Pacific decadal oscillation is the leading mode of variability in the North Pacific and
operates over longer periods than either El Niño or La Niña and is capable of altering sea surface
temperature, surface winds, and sea level pressure (Mantua 2002; Mantua and Hare 2002b;
Stabeno et al. 2004). Unlike El Niño and La Niña events, Pacific decadal oscillation events can
persist for 20 to 30 years, are more prominent outside the tropics, and mechanisms controlling
them are relatively unknown (Hare and Mantua 2000; Mantua and Hare 2002b; Minobe 1997;
Minobe 1999). During positive Pacific decadal oscillations, the northeastern Pacific experiences
above-average sea surface temperatures while the central and western Pacific Ocean undergoes
below-normal sea surface temperatures (Mundy and Olsson 2005; Royer 2005). Warm Pacific
decadal oscillation regimes, as with El Niño events, tends to decrease productivity along the U.S.
west coast (Childers et al. 2005; Hare et al. 1999). However, during the 1977 warm phase of the
Pacific decadal oscillation, euphausiid biomass remained the same and copepod abundance
actually increased in the Pacific northwest; zooplankton biomass doubled in offshore waters of
the Gulf of Alaska (Brodeur et al. 1996b; Brodeur and Ware 1992; Francis and Hare 1997;
MacCall et al. 2005; McFarlane and Beamish 1992). Opposite sea surface temperature regimes
occur during negative Pacific decadal oscillations (Mundy and Olsson 2005). Positive Pacific
decadal oscillations occurred from 1925 to 1946 and 1977 to 1999. Negative Pacific decadal
oscillations occurred from 1890 to 1924, 1947 to 1976, and 1999 to present (Childers et al. 2005;
Mantua et al. 1997; Minobe 1997).
Recently, additional research has shown that the North Pacific Gyre Oscillation as impacted by
the Pacific Decadal Oscillation and El Niño or La Niña events may have a dominant influence on
California Current oceanography and associated biological productively (Chenillat et al. 2013;
Di Lorenzo et al. 2008; Litzow and Mueter 2013; Patara et al. 2012; Sydeman et al. 2013). While
fluctuations in the North Pacific Gyre Oscillation are strongly influenced by the Pacific Decadal
304
Biological Opinion and Conference Report on Navy NWTT Activities and NMFS’ MMPA Incidental Take
Authorization PCTS FPR-2015-9110
Oscillation, the North Pacific Gyre Oscillation in turn has a more dramatic impact and is better
correlated with North Pacific variability in salinity, nutrients, chlorophyll, and a variety of
zooplankton taxa (Di Lorenzo et al. 2008). Chenillat et al. (2013) found that within the California
Current System, changes in the North Pacific Gyre Oscillation impacted timing of spring time
favorable winds responsible for the wind driven upwelling and associated nutrient and biological
productivity. Sydeman et al. (2013) showed how variation in the North Pacific Gyre Oscillation
could account for North Pacific krill productively (primarily Thysanoessa spinifera).
Thysanoessa spinifera is a key prey species for blue whales off Central and Southern California
(Fiedler et al. 1998; Schoenherr 1991).
Foraging is not the only aspect that climate change could influence. Acevedo-Whitehouse and
Duffus (2009) proposed that the rapidity of environmental changes, such as those resulting from
global warming, can harm immunocompetence and reproductive parameters in wildlife to the
detriment of population viability and persistence. An example of this is the altered sex ratios
observed in sea turtle populations worldwide (Fuentes et al. 2009a; Mazaris et al. 2008; Reina et
al. 2008; Robinson et al. 2008). This does not appear to have yet affected population viabilities
through reduced reproductive success, although nesting and emergence dates of days to weeks in
some locations have changed over the past several decades (Poloczanska et al. 2009a). Altered
ranges can also result in the spread of novel diseases to new areas via shifts in host ranges
(Simmonds and Eliott. 2009). It has also been suggested that increases in harmful algal blooms
could be a result from increases in sea surface temperature (Simmonds and Eliott. 2009).
Changes in global climatic patterns will likely have profound effects on the coastlines of every
continent by increasing sea levels and the intensity, if not the frequency, of hurricanes and
tropical storms (Wilkinson and Souter 2008). A half degree Celsius increase in temperatures
during hurricane season from 1965 to 2005 correlated with a 40 percent increase in cyclone
activity in the Atlantic. Sea levels have risen an average of 1.7 mm/year over the 20th
century due
to glacial melting and thermal expansion of ocean water; this rate will likely increase. Based on
computer models, these phenomena would inundate nesting beaches of sea turtles, change
patterns of coastal erosion and sand accretion that are necessary to maintain those beaches, and
would increase the number of turtle nests destroyed by tropical storms and hurricanes (Wilkinson
and Souter 2008). The loss of nesting beaches, by itself, would have catastrophic effects on sea
turtle populations globally if they are unable to colonize new beaches that form or if the beaches
do not provide the habitat attributes (sand depth, temperature regimes, refuge) necessary for egg
survival. In some areas, increases in sea level alone may be sufficient to inundate sea turtle nests
and reduce hatching success (Caut et al. 2009). Storms may also cause direct harm to sea turtles,
causing “mass” strandings and mortality (Poloczanska et al. 2009a). Increasing temperatures in
sea turtle nests alters sex ratios, reduces incubation times (producing smaller hatchling), and
reduces nesting success due to exceeded thermal tolerances (Fuentes et al. 2009b; Fuentes et al.
2010; Fuentes et al. 2009c). Additionally, green sea turtle hatchling size also appears to be
305
Biological Opinion and Conference Report on Navy NWTT Activities and NMFS’ MMPA Incidental Take
Authorization PCTS FPR-2015-9110
influenced by incubation temperatures, with smaller hatchlings produced at higher temperatures
(Glen et al. 2003). An air temperature increase of 3° C is likely to exceed the thermal threshold
of most clutches, leading to death (Hawkes et al. 2007). Smaller individuals likely experience
increased predation (Fuentes et al. 2009b). Climatic anomalies influencing the Marianas Islands
include El Niño/Southern Oscillation (ENSO) and La Niña events (Giese and Carton 1999;
Mantua and Hare 2002a; NOAA 2005a; NOAA 2005b; Sugimoto et al. 2001; Trenberth 1997).
Recent research egg and hatchling mortality of leatherback turtles in northwest Costa Rica were
affected by climatic variability (precipitation and air temperature) driven by the El Niño
Southern Oscillation (ENSO). Drier and warmer conditions associated with El Niño increased
egg and hatchling mortality (Santidrián Tomillo et al. 2012). The fourth assessment report of the
IPCC projects a warming and drying in Central America and other regions of the World (IPCC
2007). Using projections from an ensemble of global climate models contributed to the
Intergovernmental Panel on Climate Change report, Santidrián et al. (2012) projected that egg
and hatchling survival will rapidly decline in the region over the next 100 years, due to warming
and drying in northwestern Costa Rica. Warming and drying trends may threaten the survival of
sea turtles.
5.2 Whaling
Large whale population numbers in the action areas have historically been impacted by
commercial exploitation, mainly in the form of whaling. Prior to current prohibitions on whaling,
such as the International Whaling Commission’s 1966 moratorium, most large whale species had
been depleted to the extent it was necessary to list them as endangered under the Endangered
Species Act of 1966. For example, from 1900 to 1965 nearly 30,000 humpback whales were
captured and killed in the Pacific Ocean with an unknown number of additional animals captured
and killed before 1900 (Perry et al. 1999a). Sei whales are estimated to have been reduced to 20
percent (8,600 out of 42,000) of their pre-whaling abundance in the North Pacific (Tillman
1977b). In addition, 9,500 blue whales were reported killed by commercial whalers in the North
Pacific between 1910 and 1965 (Ohsumi and Wada. 1972); 46,000 fin whales between 1947and
1987 (Rice 1984); and 25,800 sperm whales (Barlow et al. 1997). North Pacific right whales
once numbered 11,000 animals but commercial whaling has now reduced their population to 29
to 100 animals (Wada 1973).
5.3 Fisheries
Listed salmon are incidentally caught in several fisheries that operate in the NWTT Action Area,
including groundfish fisheries that operate off the coasts of Washington; fisheries for Pacific
salmon that operate under the Pacific Salmon Treaty; salmon fisheries that are managed by the
U.S. Pacific Fisheries Management Council under the Pacific Coast Management Plan; salmon
fisheries managed by the U.S. Fraser River Panel; commercial ocean salmon troll fisheries that
306
Biological Opinion and Conference Report on Navy NWTT Activities and NMFS’ MMPA Incidental Take
Authorization PCTS FPR-2015-9110
operate off the coasts of Oregon and Washington; and subsistence, commercial, and recreational
fisheries for Pacific salmon that operate in the Columbia River. These fisheries incidentally
capture endangered and threatened salmon. Endangered Species Act section 7 consultation
standards aim to limit the impact of ocean salmon fisheries on ESA-listed stocks. For example,
the maximum age-3 impact rate for 2015 ocean salmon fisheries on Sacramento River winter
Chinook is 19 percent (PFMC 2015).
The whiting fishery, which is a component of the groundfish fisheries, were expected to
incidentally capture not more than 11,000 Chinook salmon per year and have been estimated to
have caught an average of 7,281 each year from 1991 to 2005 (NMFS 2006b). The bottom trawl
component of the groundfish fishery was expected to capture between 6,000 and 9,000 Chinook
salmon each year, with 5,000 to 8,000 of these salmon captured in the Vancouver and Columbia
catch areas. On average, the bottom trawl groundfish fisheries captured 11,320 Chinook salmon,
40 coho salmon, and 13 chum salmon from 2002 to 2004 (NMFS 2006b).
Biological opinions that NMFS has issued on these fisheries concluded that the fisheries were
not likely to jeopardize the continued existence of endangered or threatened salmon that were
likely to be captured in the fisheries. Biological opinions on the effects of these fisheries on
southern resident killer whales, which rely on salmon for food, concluded that fishery-related
removals of salmon were not likely to jeopardize the continued existence of southern resident
killer whales.
Entrapment and entanglement in commercial fishing gear is one of the most frequently
documented sources of human-caused mortality in large whale species and sea turtles. For
example, in 1978, Nishimura and Nakahigashi (1990) estimated that 21,200 turtles, including
greens, leatherback turtles, loggerheads, olive ridleys and hawksbills, were captured annually by
Japanese tuna longliners in the Western Pacific and South China Sea, with a reported mortality
of approximately 12,300 turtles per year. Using commercial tuna longline logbooks, research
vessel data and questionnaires, Nishimura and Nakahigashi (1990) estimated that for every
10,000 hooks in the Western Pacific and South China Sea, one turtle is captured, with a mortality
rate of 42 percent.
NMFS has observed 3,251 sets, representing approximately 3,874,635 hooks (data from
February 1994 through December 31, 1999). The observed entanglement rate for sperm whales
would equal about 0.31 whales per 1,000 sets or 0.0002 per 1,000 hooks. At those rates, we
would expect about 200 sperm whales entanglements per 1,000 sets. However, only one sperm
whale has been entangled in this gear; as a result, NMFS believes that the estimated
entanglement rate substantially overestimates a sperm whale’s actual probability of becoming
entangled in this gear and the potential hazards longline gear poses to sperm whales.
307
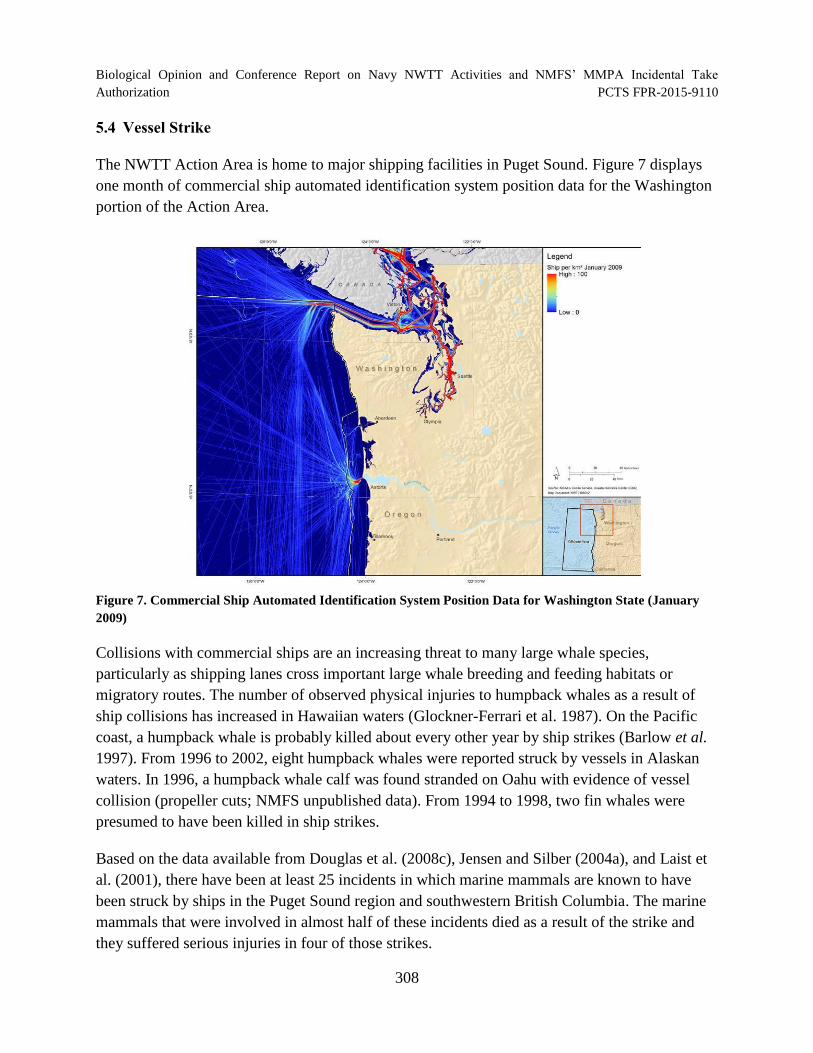
Biological Opinion and Conference Report on Navy NWTT Activities and NMFS’ MMPA Incidental Take
Authorization PCTS FPR-2015-9110
5.4 Vessel Strike
The NWTT Action Area is home to major shipping facilities in Puget Sound. Figure 7 displays
one month of commercial ship automated identification system position data for the Washington
portion of the Action Area.
Figure 7. Commercial Ship Automated Identification System Position Data for Washington State (January
2009)
Collisions with commercial ships are an increasing threat to many large whale species,
particularly as shipping lanes cross important large whale breeding and feeding habitats or
migratory routes. The number of observed physical injuries to humpback whales as a result of
ship collisions has increased in Hawaiian waters (Glockner-Ferrari et al. 1987). On the Pacific
coast, a humpback whale is probably killed about every other year by ship strikes (Barlow et al.
1997). From 1996 to 2002, eight humpback whales were reported struck by vessels in Alaskan
waters. In 1996, a humpback whale calf was found stranded on Oahu with evidence of vessel
collision (propeller cuts; NMFS unpublished data). From 1994 to 1998, two fin whales were
presumed to have been killed in ship strikes.
Based on the data available from Douglas et al. (2008c), Jensen and Silber (2004a), and Laist et
al. (2001), there have been at least 25 incidents in which marine mammals are known to have
been struck by ships in the Puget Sound region and southwestern British Columbia. The marine
mammals that were involved in almost half of these incidents died as a result of the strike and
they suffered serious injuries in four of those strikes.
308

Biological Opinion and Conference Report on Navy NWTT Activities and NMFS’ MMPA Incidental Take
Authorization PCTS FPR-2015-9110
Virtually all of the rorqual whale species have been documented to have been hit by vessels. This
includes blue whales (Berman-Kowalewski et al. 2010; Calambokidis 2012; Van Waerebeek et
al. 2007), fin whales (as recently as November 2011 in San Diego) (Douglas et al. 2008a; Van
Waerebeek et al. 2007), sei whales (Felix and Waerebeek 2005; Van Waerebeek et al. 2007),
Bryde’s whales (Felix and Waerebeek 2005; Van Waerebeek et al. 2007), minke whales (Van
Waerebeek et al. 2007), and humpback whales (Douglas et al. 2008a; Lammers et al. 2003; Van
Waerebeek et al. 2007). For example, in April 2013 (at Burien, Washington) and June 2013 (at
Ocean City, Washington) two stranded fin whales that had been struck by vessels brought the
total to nine known fin whales having stranded in Washington after being struck by vessels in
approximately the last decade (Schorr et al. 2013).
Fin whales were struck most frequently, accounting for almost 30 percent of the total number of
incidents and two-thirds of the incidents in which the whale died as a result of the collision.
Northern resident killer whales were struck slightly less frequently, although a cluster of ship
strikes in 2006 accounted for four of the six ship strikes involving this population of killer
whales. Humpback whales were third in frequency, followed by southern resident killer whales,
offshore killer whales, and blue whales. About two-thirds (17 out of the 25) of the incidents
occurred in waters off British Columbia, although the locations were variable.
The adult male southern resident killer whale (L98) that was killed in a collision with a tug boat
in 2006 may have reduced the demographic health of this killer whale population. At population
sizes between 75 and 90 individuals, we would expect southern resident killer whales to have
higher probabilities of becoming extinct because of demographic stochasticity, demographic
heterogeneity (Coulson et al. 2006; Fox 2007)—including stochastic sex determination (Lande et
al. 2003)—and the effects of phenomena interacting with environmental variability. Although
the small number of adult male southern resident killer whales might represent a stable condition
for this species, it might also reflect the effects of stochastic sex determination. If the latter is the
case, the death of L98 in a population with a smaller percentage of males would increase the
imbalance of male-to-female gender ratios in this population and increase the population’s
probability of further declines in the future.
Allen et al. (2012) recorded the noises from 24 ships ranging in length from 10.4 m to 294.1 m at
hydrophone depths of 5, 15, and 25 m and calculated source levels to characterize the three-
dimensional acoustic environment a mysticete would encounter during a whale/ship approach.
Results indicated that mysticetes near the sea surface may experience greater difficulty localizing
oncoming ships than in deeper waters as a combined result of lower SLs at the surface in shallow
locations, bow null effect acoustic shadow zones, and masking from ambient noise. As a
consequence, the range of detection for a ship may be too close for a mysticete to execute a
successful avoidance maneuver.
309
Biological Opinion and Conference Report on Navy NWTT Activities and NMFS’ MMPA Incidental Take
Authorization PCTS FPR-2015-9110
5.5 Water Quality Degradation
Between 2000 and 2006, counties in Puget Sound increased by 315,965 people or by more than
50,000 people per year, with associated increases in the area of impervious surface and
population density per square mile of impervious surface in the Puget Sound region (PSAT
2007). Between 1991 and 2001, the area of impervious surface in the Puget Sound basin
increased 10.4 percent (PSAT 2007). By 2001, impervious surface covered 7.3 percent of the
Puget Sound region below 1,000 feet elevation; in some counties and watersheds in the region,
this area was substantially higher.
Over the same time interval, about 190 square miles of forest (about 2.3 percent of the total
forested area of the Puget Sound basin) was converted to other uses. In areas below 1,000 feet
elevation, the change was more dramatic: 3.9 percent of total forest area was converted to other
uses. By 2004, about 1,474 fresh and marine waters in Puget Sound were listed as “impaired
waters” in Puget Sound. Fifty-nine percent of these waters tested were impaired because of toxic
contamination, pathogens, low dissolved oxygen or high temperatures. Less than one-third of
these impaired waters have cleanup plans in place. Chinook salmon from Puget Sound have 2-to
6 times the concentrations of PCBs in their bodies as other Chinook salmon populations on the
Pacific Coast. Because of this contamination, the Washington State Department of Health issued
consumption advisories for Puget Sound Chinook (PSAT 2007).
The quality of water in the Puget Sound Basin and aquatic biota those water support have been
affected by a range of forestry, agricultural, and urban development practices. The chemical
quality of surface water in the foothills and mountains is generally suitable for most uses.
However, the physical hydrology, water temperature, and biologic integrity of streams have been
influenced to varying degrees by logging (Ebbert et al. 2000).
Because of development, many streams in the Puget Lowlands have undergone changes in
structure and function with a trend toward simplification of stream channels and loss of habitat
(Ebbert et al. 2000). Sources of contaminants to lowland streams and lower reaches of large
rivers are largely nonpoint because most major point sources discharge directly to Puget Sound.
Compared with that in small streams in the Puget Lowlands, the quality of water in the lower
reaches of large rivers is better because much of the flow is derived from the forested
headwaters.
More than half of the agricultural acreage in the basin is located in Whatcom, Skagit, and
Snohomish Counties. Agricultural land use consists of about 60 percent cropland and 40 percent
pasture. Livestock produce a large amount of manure that is applied as fertilizer to cropland,
some- times in excess amounts, resulting in runoff of nitrogen and phosphorus to surface water
and leaching of nitrate to ground water. Runoff from agricultural areas also carries sediment,
pesticides, and bacteria to streams (Ebbert et al. 2000). Pesticides and fumigant-related
310
Biological Opinion and Conference Report on Navy NWTT Activities and NMFS’ MMPA Incidental Take
Authorization PCTS FPR-2015-9110
compounds are present, usually at low concentrations, in shallow ground water in agricultural
areas.
Heavy industry is generally located on the shores of the urban bays and along the lower reaches
of their influent tributaries, such as Commencement Bay and the Puyallup River in Tacoma and
Elliott Bay and the Duwamish Waterway in Seattle. High-density commercial and residential
development occurs primarily within and adjacent to the major cities. Development in recent
years has continued around the periphery of these urban areas but has trended toward lower
density. This trend has resulted in increasing urban sprawl in the central Puget Sound Basin.
Urban land-use activities have significantly reduced the quality of streams in the Puget Sound
Basin (Ebbert et al. 2000). Water-quality concerns related to urban development include
providing adequate sewage treatment and disposal, transport of contaminants to streams by storm
runoff, and preservation of stream corridors.
Water availability has been and will continue to be a major, long- term issue in the Puget Sound
Basin. It is now widely recognized that ground-water withdrawals can deplete streamflows
(Ebbert et al. 2000), and one of the increasing demands for surface water is the need to maintain
instream flows for fish and other aquatic biota.
Pollutants founds in Puget Sound Chinook salmon have found their way into the food chain of
the Sound. Harbor seals in southern Puget Sound, which feed on Chinook salmon, have PCB
levels that are seven times greater than those found in harbor seals from the Georgia Basin.
Concentrations of polybrominated diphenyl ether (also known as PBDE, a product of flame
retardants that are used in household products like fabrics, furniture, and electronics) in seals
have increased from less than 50 parts per billion in fatty tissue to more than 1,000 ppb over the
past 20 years (PSAT 2007).
Water quality appears poised to have larger-scale effects on the marine ecosystem of the Puget
Sound – Georgia Basin as evidenced by the intensity and persistence of water stratification in the
basin. Historically, Puget Sound was thought to have an unlimited ability to assimilate waste
from cities, farms and industries in the region and decisions about human occupation of the
landscape were based on that belief. More recent data suggests that the marine ecosystems of the
basin have a much more limited ability to assimilate pollution, particularly in areas such as Hood
Canal, south Puget Sound, inner Whidbey basin and the central Georgia Basin. In these areas, as
strong stratification has developed and persisted, the respective water quality has steadily
decreased. As waters become more stratified, through weather, climate or circulation changes,
they become even more limited in their ability to assimilate pollution.
The presence of high levels of persistent organic pollutants, such as PCBs, DDT, and flame–
retardants have also been documented in southern resident killer whales (Herman et al. 2005;
311
Biological Opinion and Conference Report on Navy NWTT Activities and NMFS’ MMPA Incidental Take
Authorization PCTS FPR-2015-9110
Ross et al. 2000; Ylitalo et al. 2001). Although the consequences of these pollutants on the
fitness of individual killer whales and the population itself remain unknown, in other species
these pollutants have been reported to suppress immune responses (Kakuschke and Prange.
2007), impair reproduction, and exacerbate the energetic consequences of physiological stress
responses when they interact with other compounds in an animal’s tissues (Martineau 2007).
Because of their long life span, position at the top of the food chain, and their blubber stores,
killer whales would be capable of accumulating high concentrations of contaminants.
5.6 Ocean Noise
The marine mammals that occur in the Action Area are regularly exposed to several sources of
natural and anthropogenic sounds. Anthropogenic noises that could affect ambient noise arise
from the following general types of activities in and near the sea, any combination of which can
contribute to the total noise at any one place and time. These noises include transportation,
dredging, construction; oil, gas, and mineral exploration in offshore areas; geophysical (seismic)
surveys; sonars; explosions; and ocean research activities (Richardson et al. 1995d).
A wide variety of anthropogenic and natural sources contribute to ocean noise throughout the
world’s oceans (Hatch and Wright 2007b). Anthropogenic sources of noise that are most likely
to contribute to increases in ocean noise are vessel noise from commercial shipping and general
vessel traffic, oceanographic research, oil and gas exploration, underwater construction, and
naval and other use of sound navigation and ranging.
Any potential for cumulative impact should be put into the context of recent changes to ambient
sound levels in the world’s oceans as a result of anthropogenic activities. However, there is a
large and variable natural component to the ambient noise level as a result of events such as
earthquakes, rainfall, waves breaking, and lightning hitting the ocean as well as biological noises
such as those from snapping shrimp, other crustaceans, fishes, and the vocalizations of marine
mammals (Crawford and Huang 1999; Hildebrand 2004; Patek 2002).
Andrew et al. (2002) compared ocean ambient sound from the 1960s to the 1990s from a
receiver off the California coast. The data showed an increase in ambient noise of approximately
10 dB in the frequency ranges of 20 to 80 Hz and 200 to 300 Hz, and about 3 dB at 100 Hz over
a 33-year period. Each 3 dB increase is noticeable to the human ear as a doubling in sound level.
A possible explanation for the rise in ambient noise is the increase in shipping noise. There are
approximately 11,000 supertankers worldwide, each operating approximately 300 days per year,
each producing constant broadband noise at typical source levels of 198 dB (Hildebrand 2004).
Generally the most energetic regularly operated sound sources are seismic airgun arrays from
approximately 90 vessels with typically 12 to 48 individual guns per array, firing about every 10
seconds (Hildebrand 2004).
312
Biological Opinion and Conference Report on Navy NWTT Activities and NMFS’ MMPA Incidental Take
Authorization PCTS FPR-2015-9110
Seismic surveys are typically conducted by towing a sound source behind a research vessel, such
as an airgun array that emits acoustic energy in timed intervals. The transmitted acoustic energy
is reflected and received by an array of hydrophones. This acoustic information is processed to
provide information about geological structure below the seafloor. The oil and gas industry
conduct seismic surveys to search for new hydrocarbon deposits. In addition, research geologists
conduct seismic surveys to study plate tectonics as well as other topics in marine geology. The
underwater sound produced by seismic surveys could affect marine life, including ESA-listed
marine species. All seismic surveys conducted by U.S. vessels are subject to the MMPA
authorization process administered by the NMFS, as well as the NEPA process associated with
issuing MMPA authorizations.
Noise is of particular concern to marine mammals because many species use sound as a primary
sense for navigating, finding prey, avoiding predators, and communicating with other
individuals. As described in greater detail later in this Opinion, noise may cause marine
mammals to leave a habitat, impair their ability to communicate, or to cause stress. Noise can
cause behavioral disturbances, mask other sounds including their own vocalizations, may result
in injury and, in some cases, may result in behaviors that ultimately lead to death. The severity of
these impacts can vary greatly between minor impacts that have no real cost to the animal, to
more severe impacts that may have lasting consequences. A comprehensive discussion of the
potential impacts of ocean noise on listed species is included in the Effects of the Action section
of this Opinion.
The marine mammals that occur in the Action Area are regularly exposed to several sources of
natural and anthropogenic sounds. Anthropogenic noises that could affect ambient noise arise
from the following general types of activities in and near the sea, any combination of which can
contribute to the total noise at any one place and time. These noises include transportation,
dredging, construction; oil, gas, and mineral exploration in offshore areas; geophysical (seismic)
surveys; sonars; explosions; and ocean research activities (Richardson et al. 1995d).
Noise in the marine environment has received a lot of attention in recent years and is likely to
continue to receive attention in the foreseeable future. Several investigators have argued that
anthropogenic sources of noise have increased ambient noise levels in the ocean over the last 50
years (Jasny et al. 2005; NRC 1994a; NRC 2000; NRC 2003b; NRC 2005; Richardson et al.
1995d). There can be regional and temporal variations including reductions in anthropogenic
noise, especially from commercial shipping volume as it is affected by economic drivers
(McKenna et al. 2012a). As discussed in the preceding section, much of this increase is due to
increased shipping as ships become more numerous and of larger tonnage (NRC 2003b).
Commercial fishing vessels, cruise ships, transport boats, airplanes, helicopters and recreational
boats all contribute sound into the ocean (NRC 2003b). The military uses sound to test the
systems of Navy vessels as well as for naval operations. In some areas where oil and gas
313
Biological Opinion and Conference Report on Navy NWTT Activities and NMFS’ MMPA Incidental Take
Authorization PCTS FPR-2015-9110
production takes place, noise originates from the drilling and production platforms, tankers,
vessel and aircraft support, seismic surveys, and the explosive removal of platforms (NRC
2003b).
Kipple and Gabriele (2007) measured sounds emitted from 38 vessels ranging in size from 14 to
962 feet at speeds of 10 knots and at a distance of 500 yards from the hydrophone in Glacier
Bay, Alaska. Sound levels ranged from a minimum of 157 to a maximum of 182 dB re 1
µPa@1m, with sound levels showing an increasing trend with both increasing vessel size and
with increasing vessel speed. Vessel sound levels also showed dependence on propulsion type
and horsepower. Vessel noise can result from several sources including propeller cavitation,
vibration of machinery, flow noise, structural radiation, and auxiliary sources such as pumps,
fans and other mechanical power sources. McKenna et al. (2012b) measured radiated noise from
several types of commercial ships, combining acoustic measurements with ship passage
information from AIS. On average, container ships and bulk carriers had the highest estimated
broadband source levels (186 dB re 1 lPa2
20 to 1000 Hz), despite major differences in size and
speed. Differences in the dominant frequency of radiated noise were found to be related to ship
type, with bulk carrier noise predominantly near 100 Hz while container ship and tanker noise
was predominantly below 40 Hz. The tanker had less acoustic energy in frequencies above 300
Hz, unlike the container and bulk carrier.
Sound emitted from large vessels, such as shipping and cruise ships, is the principal source of
low frequency noise in the ocean today, and marine mammals are known to react to or be
affected by that noise (Anderwald et al. 2013; Erbe et al. 2014; Foote et al. 2004; Guerra et al.
2014; Hatch and Wright 2007a; Hildebrand 2005b; Holt et al. 2008a; Kerosky et al. 2013; May-
Collado and Quinones-Lebron 2014; Melcon et al. 2012; Richardson et al. 1995c; Williams et al.
2014b). As noted previously, in the Inland Waters of Puget Sound, Erbe et al. (2012) estimated
the maximum annual underwater sound exposure level from vessel traffic near Seattle was 215
dB re 1 µPa2-s and Bassett et al. (2010) measured mean sound pressure levels at Admiralty Inlet
from commercial shipping at 117 dB re 1 µPa with a maximum exceeded 135 dB re 1 µPa on
some occasions. In contrast, Navy combatant vessels have been designed to generate minimal
noise and use ship quieting technology to elude detection by enemy passive acoustic devices
(Mintz and Filadelfo 2011).
Bassett et al. (2012b) recorded vessel traffic over a period of just under a year as large vessels
passed within 20 km of a hydrophone site located at Admiralty Inlet in Puget Sound. During this
period there were 1,363 unique Automatic Identification System transmitting vessels recorded.
In 2014, there were over 5,300 cargo, cruise, or fishing vessels docking at one of the major ports
in Puget Sound. In addition to these port calls resulting in approximately 10,600 annual vessel
transits, there is the routine ferry, recreational, and other vessel traffic from commercial activities
such as whale watching in the Inland Waters portion of the NWTT Study Area. Because Navy
314
Biological Opinion and Conference Report on Navy NWTT Activities and NMFS’ MMPA Incidental Take
Authorization PCTS FPR-2015-9110
vessels are much fewer in number, they are a small component of overall vessel traffic and
vessel noise in most areas where they operate; this is especially the case in the Study Area (see
(Mintz and Filadelfo 2011) concerning a general summary for the U.S. EEZ).
Many researchers have described behavioral responses of marine mammals to the sounds
produced by helicopters and fixed-wing aircraft, boats and ships, as well as dredging, construct
ion, geological explorations, etc. (Richardson et al. 1995d). Most observations have been limited
to short-term behavioral responses, which included cessation of feeding, resting, or social inter
actions. Smultea et al. (2008) documented a recognized “stress behavioral reaction” by a group
of sperm whales in response to small aircraft fly-bys. The group ceased forward movement,
moved closer together in a parallel flank-to-flank formation, and formed a fan-shaped semi-circle
with the lone calf remaining near the middle of the group. Several studies have demonstrated
short-term effects of disturbance on humpback whale behavior (Baker et al. 1983; Bauer and
Herman 1986; Hall 1982; Krieger and Wing 1984), but the long-term effects, if any, are unclear
or not detectable. Carretta et al. (2001) and Jasny et al. (2005) identified the increasing levels of
anthropogenic noise as a habitat concern for whales and other cetaceans because of its potential
effect on their ability to communicate. Significant changes in odontocete behavior attributed to
vessel noise have been documented up to at least 5.2 kilometers away from the vessel (Pirotta et
al. 2012).
Erbé (2002b) recorded underwater noise of whale-watching boats in the popular killer whale-
watching region of southern British Columbia and northwestern Washington State. Source levels
ranged from 145 to 169 dB re 1 Pa - 1 m and increased as the vessel’s speed increased. Based on
sound propagation models, she concluded that the noise of fast boats would be audible to killer
whales over 16 km, would mask killer whale calls over 14 km, would elicit behavioral response
over 200 m, and would cause a temporary threshold shifts of 5 dB within 450 m after 30 to 50
minutes of exposure. She concluded that boats cruising at slow speeds would be audible and
would cause masking at 1 km, would elicit behavioral responses at 50 m, and would result in
temporary threshold shifts at 20 m.
Galli et al. (2003) measured ambient noise levels and source levels of whale-watch boats in Haro
Strait. They measured ambient noise levels of 91 dB (at frequencies between 50 and 20,000 Hz)
on extremely calm days (corresponding to sea states of zero) and 116 dB on the roughest day on
which they took measures (corresponding to a sea state of ~5). Mean sound spectra from acoustic
moorings set off Cape Flattery, Washington, showed that close ships dominated the sound field
below 10 kHz while rain and drizzle were the dominant sound sources above 20 kHz. At these
sites, shipping noise dominated the sound field about 10 to 30 percent of the time but the amount
of shipping noise declined as weather conditions deteriorated. The large ships they measured
produced source levels that averaged 184 dB at 1 m ± 4 dB, which was similar to the 187 dB at 1
m reported by Greene (1995).
315
Biological Opinion and Conference Report on Navy NWTT Activities and NMFS’ MMPA Incidental Take
Authorization PCTS FPR-2015-9110
The engines associated with the boats in their study produced sounds in the 0.5 to 8.0 KHz range
at source levels comparable to those of killer whale vocalizations. They concluded that those
boats in their study that travelled at their highest speeds proximate to killer whales could make
enough noise to make hearing difficult for the whales.
In addition to the disturbance associated with the presence of vessel, the vessel traffic affects the
acoustic ecology of southern resident killer whales, which would affect their social ecology.
Foote et al. (2004) compared recordings of southern resident killer whales that were made in the
presence or absence of boat noise in Puget Sound during three time periods between 1977 and
2003. They concluded that the duration of primary calls in the presence of boats increased by
about 15 percent during the last of the three time periods (2001 to 2003). At the same time, Holt
et al. (2009a) reported that southern resident killer whales in Haro Strait off the San Juan Islands
in Puget Sound, Washington, increased the amplitude of their social calls in the face of increased
sounds levels of background noise. Although the costs of these vocal adjustments remains
unknown, Foote et al. (2004) suggested that the amount of boat noise may have reached a
threshold above which the killer whales needs to increase the duration of their vocalization to
avoid masking by the boat noise.
Commercial shipping traffic is a major source of low frequency (5 to 500 Hz) human generated
sound in the world’s oceans (NRC 2003b; Simmonds and Hutchinson 1996). The radiated noise
spectrum of merchant ships ranges from 20 to 500 Hz and peaks at approximately 60 Hz. Ross
(Ross 1976) estimated that between 1950 and 1975 shipping had caused a rise in ambient ocean
noise levels of 10 dB; based on his estimates, Ross predicted a continuously increasing trend in
ocean ambient noise of 0.55 dB per year. Chapman and Price (2011) recorded low frequency
deep ocean ambient noise in the Northeast Pacific Ocean from 1976 to 1986 and reported that the
trend of 0.55 dB per year predicted by Ross (1976) persisted until at least around 1980;
afterward, the increase per year was significantly less, about 0.2 dB per year. Within the Action
Area identified in this Opinion, the vessel sound inside the western half of the Strait of Juan de
Fuca and off the Washington coast comes from cargo ships (86 percent), tankers (6 percent), and
tugs (5 percent) (NMFS 2008d citing Mintz and Filadelfo 2004a, 2004b)).
(Williams et al. 2014a) measured ocean noise levels at 12 sites in the Canadian Pacific Ocean,
including Haro Strait, and reported that noise levels were high enough to reduce the
communication spaces for fin, humpback and killer whales under typical (median) conditions by
1, 52 and 62 percent, respectively, and 30, 94 and 97 percent under noisy conditions.
Bassett et al. (2012a) paired one year of AIS data with hydrophone recordings in Puget Sound’s
Admiralty Inlet to assess ambient noise levels and the contribution of vessel noise to these levels.
Results suggested ambient noise levels between 20 Hz and 30 kHz were largely driven by vessel
activity and that the increases associated with vessel traffic were biologically significant.
316
Biological Opinion and Conference Report on Navy NWTT Activities and NMFS’ MMPA Incidental Take
Authorization PCTS FPR-2015-9110
Throughout the year, at least one AIS-transmitting vessel was within the study area 90 percent of
the time and multiple vessels were present 68 percent of the time. A vessel noise budget showed
cargo vessels accounted for 79 percent of acoustic energy, while passenger ferries and tugs had
lower source levels but spent substantially more time in the study site and contributed 18 percent
of the energy in the budget. All vessels generated acoustic energy at frequencies relevant to all
marine mammal functional hearing groups.
Urick (1983) provided a discussion of the ambient noise spectrum expected in the deep ocean.
Shipping, seismic activity, and weather are primary causes of deep-water ambient noise. Noise
levels between 20 and 500 Hz appear to be dominated by distant shipping noise that usually
exceeds wind-related noise. Above 300 Hz, the level of wind-related noise might exceed
shipping noise. Wind, wave, and precipitation noise originating close to the point of
measurement dominate frequencies from 500 to 50,000 Hz. The ambient noise frequency
spectrum and level can be predicted fairly accurately for most deep-water areas based primarily
on known shipping traffic density and wind state (wind speed, Beaufort wind force, or sea state)
(Urick 1983). For frequencies between 100 and 500 Hz, Urick (1983) has estimated the average
deep water ambient noise spectra to be 73 to 80 dB for areas of heavy shipping traffic and high
sea states, and 46 to 58 dB for light shipping and calm seas.
In contrast to deep water, ambient noise levels in shallow waters (i.e., coastal areas, bays,
harbors, etc.) are subject to wide variations in level and frequency depending on time and
location. The primary sources of noise include distant shipping and industrial activities, wind and
waves, and marine animals (Urick 1983). At any given time and place, the ambient noise level is
a mixture of these noise types. In addition, sound propagation is also affected by the variable
shallow water conditions, including the depth, bottom slope, and type of bottom. Where the
bottom is reflective, the sound levels tend to be higher than when the bottom is absorptive.
McDonald et al. (2006a) reported that wind-driven wave noise was an important contributor to
ocean ambient noise in the 200 to 500 Hz band. Ross (1976) and Wenz (Wenz 1962) compared
wind data for five northeast Pacific sites and concluded wind was the primary cause for
differences in average ambient noise levels above 200 Hz. Assuming the observed increases in
ambient noise these authors reported are representative of the larger coast, McDonald et al.
(2006a) concluded that the breakpoint between shipping and wind dominated noise has probably
now moved well above 200 Hz.
Measurements taken at San Nicolas Island identified seasonal differences in ocean ambient
levels due to seasonal changes in wind driven waves, biological sound production, and shipping
route changes (McDonald et al. 2006a). The strongest seasonal signal at the San Nicolas South
site was attributed to blue whale singing (Burtenshaw et al. 2004a) which had a broad peak near
20 Hz in the spectral data (because fin whales occur in the area throughout the year, the seasonal
317
Biological Opinion and Conference Report on Navy NWTT Activities and NMFS’ MMPA Incidental Take
Authorization PCTS FPR-2015-9110
difference was attributed to blue whales, which only occur in the areas seasonally). When the
band of fin whale calls were excluded, the average February 2004 ambient pressure spectrum
level was 10 to 14 dB higher than the February 1965 and 1966 levels over the 10 to 50 Hz band.
Above 100 Hz, there was a 1 to 2 dB difference between the two sets of February noise data
(McDonald et al. 2006a). Afterward, the increase per year was significantly less, about 0.2dB/yr.
5.7 Commercial and Private Marine Mammal Watching
Vessels (both commercial and private) engaged in marine mammal watching also have the
potential to impact whales in the Action Area. A recent study of whale watch activities
worldwide has found that the business of viewing whales and dolphins in their natural habitat has
grown rapidly over the past decade into a billion dollar ($US) industry involving over 80
countries and territories and over 9 million participants (Hoyt 2001). In 1988, the Center for
Marine Conservation and the NMFS sponsored a workshop to review and evaluate whale
watching programs and management needs (CMC and NMFS 1988). That workshop produced
several recommendations for addressing potential harassment of marine mammals during
wildlife viewing activities that include developing regulations to restrict operating thrill craft
near cetaceans, swimming and diving with the animals, and feeding cetaceans in the wild.
Since then, NMFS has promulgated regulations at 50 CFR §224.103 that specifically prohibit:
(1) the negligent or intentional operation of an aircraft or vessel, or the doing of any other
negligent or intentional act which results in disturbing or molesting a marine mammal; (2)
feeding or attempting to feed a marine mammal in the wild; and (3) approaching humpback
whales in Hawaii and Alaska waters closer than 100 yards (91.4 m). In addition, NMFS launched
an education and outreach campaign to provide commercial operators and the general public
with responsible marine mammal viewing guidelines which in part state that viewers should: (1)
remain at least 50 yards from dolphins, porpoise, seals, sea lions and sea turtles and 100 yards
from large whales; (2) limit observation time to 30 minutes; (3) never encircle, chase or entrap
animals with boats; (4) place boat engine in neutral if approached by a wild marine mammal; (5)
leave the water if approached while swimming; and (6) never feed wild marine mammals. In
January 2002, NMFS also published an official policy on human interactions with wild marine
mammals which states that: “NOAA Fisheries cannot support, condone, approve or authorize
activities that involve closely approaching, interacting or attempting to interact with whales,
dolphins, porpoises, seals or sea lions in the wild. This includes attempting to swim with, pet,
touch or elicit a reaction from the animals.”
Although considered by many to be a non-consumptive use of marine mammals with economic,
recreational, educational and scientific benefits, marine mammal watching is not without
potential negative impacts. One concern is that animals may become more vulnerable to vessel
318
Biological Opinion and Conference Report on Navy NWTT Activities and NMFS’ MMPA Incidental Take
Authorization PCTS FPR-2015-9110
strikes once they habituate to vessel traffic. Another concern is that preferred habitats may be
abandoned if disturbance levels are too high.
The number and proximity of vessels, particularly whale-watch vessels in the areas occupied by
southern resident killer whales, represents a source of chronic disturbance for this population.
Numerous studies of interactions between surface vessels and marine mammals have
demonstrated that free-ranging marine mammals engage in avoidance behavior when surface
vessels move toward them. It is not clear whether these responses are caused by the physical
presence of a surface vessel, the underwater noise generated by the vessel, or an interaction
between the two (Goodwin and Cotton 2004; Lusseau 2006). However, several authors suggest
that the noise generated during motion is probably an important factor (Blane and Jaakson 1994;
Evans et al. 1992; Evans et al. 1994). These studies suggest that the behavioral responses of
marine mammals to surface vessels are similar to their behavioral responses to predators.
Several investigators have studied the effects of whale watch vessels on marine mammals
(Amaral and Carlson 2005a; Au and Green 2000a; Christiansen et al. 2013; Christiansen et al.
2011; Corkeron 1995; Erbe 2002b; Felix 2001; Magalhaes et al. 2002; May-Collado and
Quinones-Lebron 2014; Richter et al. 2006; Scheidat et al. 2004; Simmonds 2005a; Watkins
1986; Williams et al. 2002a). The whale’s behavioral responses to whale watching vessels
depended on the distance of the vessel from the whale, vessel speed, vessel direction, vessel
noise, and the number of vessels. Responses changed with these different variables and, in some
circumstances, the whales or dolphins did not respond to the vessels, but in other circumstances,
whales changed their vocalizations, surface time, swimming speed, swimming angle or direction,
respiration rates, dive times, feeding behavior, and social interactions.
5.8 Navy Training and Testing Activities in the Action Area
The Navy has been conducting exercises in the NWTT Action Area for over 60 years. In terms
of surface combatant ships, currently there are two aircraft carriers and five Navy destroyers
home-ported at naval facilities within Puget Sound. Monitoring in conjunction with Navy
exercises to determine the effects of active sonar and explosives on marine mammals was
initiated in 2010 as part of the MMPA regulations that allowed NMFS to issue LOAs for Navy
military readiness activities in the NWTRC. Stranding data has been collected by researchers in
the NWTRC for approximately 30 years as well as by NMFS for roughly 22 years. Though not
all dead or injured marine mammals can be accounted for, if marine mammals were being
harmed by the Navy training exercises in the NWTRC with any regularity, evidence of that harm
would have been detected over the 30-year period.
319
Biological Opinion and Conference Report on Navy NWTT Activities and NMFS’ MMPA Incidental Take
Authorization PCTS FPR-2015-9110
5.8.1 Summary of Activities Under Previous LOAs and Biological Opinions
Here we provide information regarding the Navy’s activities under the 2010 to 2011, 2011 to
2012 and the 2012 to 2015 LOAs and biological opinions. This information was provided by the
Navy in annual exercise reports, monitoring reports, and the ESA consultation request package.
We also reviewed the classified reports to verify compliance with previous ESA biological
opinions and Incidental Take Statements.
5.8.1.1 Activities Conducted Through May 2014
In the annual exercise reports, the Navy reported that no individual category of authorized
system(s) or training event(s) exceeded authorized quantities (to include sonar and explosives)
within the NWTRC (Navy 2011; Navy 2012a). The Navy did not provide the number of
exercises, expended/detonated rounds, or the number of IEER events in the unclassified reports
(Navy 2011; Navy 2012a). Neither individual testing activities nor activities under the Keyport
LOA or Opinion are reported herein, but are also below authorized take quantities.
5.8.1.2 Activities Not Conducted
The Navy did not conduct the following activities under the 2010 to 2011, 2011 to 2012, or to
date per the 2012 to 2015 LOAs and biological opinions:
Sinking exercises (SINKEX)
Installation of the Portable Undersea Tracking Range (PUTR);
Installation of the underwater training minefield (non-explosive).
While no EOD underwater detonations (UNDETs) were undertaken through 2012, there were a
few, low level EOD UNDETs in 2013 to 2014 (source: Navy 2013 and 2014 annual exercise
reports). The 2013 NWTRC Annual Exercise Report included one UNDET (November 15, 2012,
one 1.5 lbs NEW charge). The 2014 NWTRC Annual Exercise Report included seven UNDETs
(all reduced charge weight events, <1 ounce each) [August 28, 2013; three 1 oz NEW charges;
and April 2, 2014, four 1 oz NEW charges]. A total of three EOD UNDET events with eight
underwater explosions occurred within NWTRC from November 2013 through April 2014. The
maximum NEW was 1.5 lb. Most (88 percent) were 1-oz charges.
5.8.1.3 Estimated Take of ESA-listed Species Through May 2014
The Navy’s classified annual NWTRC Exercise Report contains the list of authorized systems
used for the reporting year through May 2014. Of the sonar systems authorized under NMFS
Final Rule and LOA for the NWTRC, one system reported annual use (May 2012 to May 2013)
higher than the average annual use authorized in the LOA and incidental take statement of the
320

Biological Opinion and Conference Report on Navy NWTT Activities and NMFS’ MMPA Incidental Take
Authorization PCTS FPR-2015-9110
2012 to 2015 biological opinion. This occurred over a one-week period in September 2012
during an additional unscheduled training event in the offshore waters of the NWTRC, and
accounted for over 116 percent of the annual authorization for this system as reported in the
classified NWTRC Exercise Report. However, in terms of the five-year authorization from the
NWTRC Final MMPA Rule, the system in question is still only at 38 percent of total authorized
use after three of five years. Accordingly, for purposes of the now-superseded 2010 and 2012
biological opinions, NMFS has determined that this estimated annual exceedance would not
result in a change to those earlier conclusions that the Navy training activities in the NWTRC are
not likely to jeopardize listed species or likely to destroy or adversely modify critical habitat.
NMFS will consider the estimated take from these activities as well as those identified in the
Navy’s May 2014 annual report, as part of the environmental baseline for this consultation.
Table 61 contains annual NWTRC estimated post-calculation annual potential exposures through
May 2014 as well as cumulative species specific estimates for the entire period through May
2014. Post-calculation comparisons may not be indicative of actual exposures based on real-
world short and long-term spatial movements of various species and their relative occurrence
within the NWTRC. Additionally, post-calculated takes are relative to the model-predicted
values derived for the 2010 programmatic biological opinion and MMPA rule/LOA.
During the 2012 to 2013 reporting period, based on calculations using the earlier model,
humpback whale takes exceeded the 15 annual take estimates (19 post-calculated) by four
exposures potentially resulting in behavioral harassment. Of the 19 exposures, 19 were from
active sonar and zero from explosive sources. Fin whale estimated takes (57) were also exceeded
by four exposures potentially resulting in behavioral harassment. Of the 61 exposures to fin
whales, 60 were from sonar and 1 from explosive sources. Sperm whale takes were exceeded
by19 exposures (130 post-calculation vs. 111 annual authorized). Of The 130 exposures, 129
were from sonar and 1 from explosive sources. All post-calculated explosive exposures were
from 76-mm GUNEX only.
Due to difficulty in determining particular stock densities of killer whales, all stocks of killer
whales were combined for NWTRC modeling exposures. This included offshore, transient, and
southern resident killer whale stocks. There was no Navy modeled exposure to killer whales
from explosives. Most (86 percent) of modeled exposures to killer whales in general were from
surface ship sonar (12 Level B/behavioral harassment exposures) and 14 percent from DICAS
sonobuoys (2 Level B/behavioral harassment exposures). Likelihood of offshore exposure to
surface ship sonar by southern resident killer whales is low given southern resident killer whale
summer inshore Puget Sound preference, and winter nearshore transient movements along the
Washington-Oregon-northern California coasts. Therefore, the Navy assumed that any May 2012
to May 2014 exposures based solely on the post-calculation, would be to offshore or transient
stocks of killer whales and not to southern resident killer whales.
321
Biological Opinion and Conference Report on Navy NWTT Activities and NMFS’ MMPA Incidental Take
Authorization PCTS FPR-2015-9110
5.8.1.4 Training Use May 2013 to May 2014
The Navy’s 2014 classified annual NWTRC Exercise Report contains the list of authorized
systems and their reported use from 2 May 2013 to 1 May 2014. Of the sonar systems and
explosives authorized under NMFS’ NWTRC Final Rule, Letters of Authorization (LOA), and
biological opinions (BO) for the NWTRC during this period, no sonar system exceeded any
authorized amount and there was no offshore explosive use reported.
5.8.1.5 Exposures during the current year and predicted through November 2015
Table 61 contains NWTRC estimated post-calculation annual potential exposures from May
2013 to May 2014; cumulative species-specific estimates for the period from November 2010
through May 2014; and an estimate of total percentage of exposures compared to the amount
authorized over 5-years if in the final year there was 100 percent system use.
The post-calculation estimates for this period indicate annual species-specific estimates of
exposure for the period May 2013 to May 2014 range from zero percent of annual authorization
to four percent of the annual authorization. In terms of cumulative potential exposures under the
NWTRC Final Rule from November 2010 through May 2014, species-specific exposures range
from 25 to 43 percent of total five-year authorization at the end of the fourth of five years.
In terms of quantity of potential exposures to Endangered Species Act (ESA) cetacean species,
of the six ESA species (blue whale, fin whale, humpback whale, sei whale, sperm whale,
Southern Resident killer whale), there was potentially only one exposure to sperm whales.
If the Navy were to use 100 percent of all sonar system and explosive use authorized under the
NWTRC Final Rule, LOA, and the 2012 Opinion, the cumulative species-specific exposure
estimates would be between 36 to 59 percent of total authorized over the five-year period. Takes
of all ESA species would be below 50 percent of the authorized maximum. Navy post
calculations for remaining years will not be comparable to previous years due to the change in
modeling criteria; however relative percentages might be appropriate for comparison to previous
performance.
322
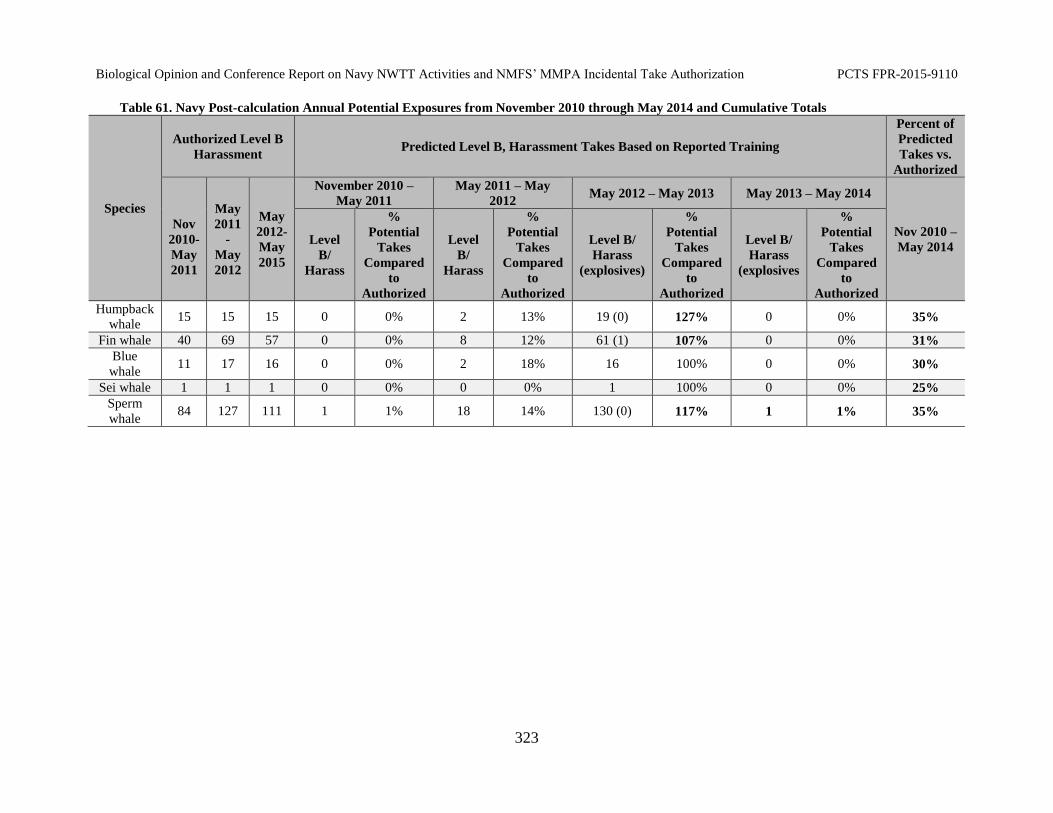
Biological Opinion and Conference Report on Navy NWTT Activities and NMFS’ MMPA Incidental Take Authorization PCTS FPR-2015-9110
Table 61. Navy Post-calculation Annual Potential Exposures from November 2010 through May 2014 and Cumulative Totals
Species
Authorized Level B
Harassment Predicted Level B, Harassment Takes Based on Reported Training
Percent of
Predicted
Takes vs.
Authorized
Nov
2010
May
2011
May
2011
-
May
2012
May
2012
May
2015
November 2010 –
May 2011
May 2011 – May
2012 May 2012 – May 2013 May 2013 – May 2014
Nov 2010 –
May 2014 Level
B/
Harass
%
Potential
Takes
Compared
to
Authorized
Level
B/
Harass
%
Potential
Takes
Compared
to
Authorized
Level B/
Harass
(explosives)
%
Potential
Takes
Compared
to
Authorized
Level B/
Harass
(explosives
%
Potential
Takes
Compared
to
Authorized
Humpback
whale 15 15 15 0 0% 2 13% 19 (0) 127% 0 0% 35%
Fin whale 40 69 57 0 0% 8 12% 61 (1) 107% 0 0% 31%
Blue
whale 11 17 16 0 0% 2 18% 16 100% 0 0% 30%
Sei whale 1 1 1 0 0% 0 0% 1 100% 0 0% 25%
Sperm
whale 84 127 111 1 1% 18 14% 130 (0) 117% 1 1% 35%
323
Biological Opinion and Conference Report on Navy NWTT Activities and NMFS’ MMPA Incidental Take
Authorization PCTS FPR-2015-9110
5.8.1.6 Monitoring
The Navy provided the following summary (also see Table 62) of monitoring related to the
NWTRC training activities accomplished from November 2011 through May 2014. This
information was provided as part of the Comprehensive Marine Species Monitoring Report for
The Navy’s Northwest Training Range Complex 2011-2014. U.S. Pacific Fleet, Pearl Harbor,
Hawaii. Final July 1, 2014:
1) Long-term fixed passive acoustic monitoring is an effective way to determine seasonal
species-specific occurrence of vocalizing and potentially foraging animals. It does not account
for non-vocalizing animals. Passive acoustic monitoring can also be used to record natural and
anthropogenic sounds leading to better assessment of ambient noise conditions.
By the summer of 2014, Navy funded passive acoustic monitoring will have been ongoing off
the coast of Washington State for close to 10 years. Navy research funding and reporting
occurred from 2004 to 2010 (Kerosky et al. 2013; Oleson and Hildebrand 2012; Oleson et al.
2009; Rice et al. 2015; Trickey et al. 2015). Under NWTRC compliance monitoring from 2011
to 2014, over 27,000 hours of passive acoustic data has been collected from two passive acoustic
devices on the shelf and slope (DoN 2011; DoN 2012a; DoN 2013a).
Specific passive acoustic monitoring observations include:
Future National Marine Fisheries Service (NMFS) and Navy adaptive management
should be conducted with an eye toward reviewing the relevance of continued data
collection. Toward that end, the Navy in 2014 to 2015 will focus on analysis from just
one NWTRC passive device (slope site).
Passive acoustic monitoring confirmed that highly infrequent low levels of Navy active
mid-frequency sonar were detected by the two fixed monitoring sites off the Washington
coast. From 2008 to 2013, passive sensors only detected four to seven days per year from
temporally separated mid-frequency sonar events lasting at most a few hours in duration.
This is consistent with the a) overall low level of at-sea sonar training in the NWTRC as
compared to other Navy range complexes, and b) the general tendency for unit-level
sonar and explosive training to occur further offshore, sometimes >50 miles.
Passive acoustic monitoring has the potential, via expanded analysis tools, to begin
addressing the possible impacts of anthropogenic sources on marine mammal
vocalization and echolocation, with the assumptions that changes in vocalizations and
echolocation rates are indicative of behavioral changes. However, this kind of analysis is
better suited for those areas where the Navy in-water training occurs more frequently
324
Biological Opinion and Conference Report on Navy NWTT Activities and NMFS’ MMPA Incidental Take Authorization PCTS FPR-2015-9110
such as Southern California or Hawaii vice the more limited Navy in-water training
within the NWTRC.
2) Satellite tracking tags can be an effective indicator of marine mammal distribution and
movement patterns at short (days-weeks) and long time scales (months-year) (DoN 2011; DoN
2012a; DoN 2013a; Mate 2013; Schorr et al. 2013).
The Navy believes for future NWTRC tagging efforts from 2014 forward, longer term tags are
preferred for continued monitoring. Long term tags will not only provide information on baleen
whale distributions in terms of local bathymetric features, but also allow determination of
percentages of time individuals spend within and outside of the NWTRC.
In particular, certain offshore sub-areas within NWTRC are more likely to have in-water Navy
training events as compared to the rest of the NWTRC. Therefore, comparisons of baleen whale
residence times and area restricted searches (potential foraging metric) in sub-areas of the
NWTRC can be valuable in comparing potential baleen whale interactions or lack of interactions
with Navy training events.
Specific tagging observations include:
Navy funded gray whale projects from 2011 to 2013 in NWTRC provided valuable
distribution information. To support the need for longer term tracking of additional
cetacean species following the success of the gray whale tagging, the Navy funded a new
large scale tagging effort for blue and fin whales. The focus of this study will be
movement patterns and residency pattern of blue and fin whales along the U.S. West
Coast, including within NWTRC. This project was funded in spring 2014 for a planned
summer 2014 field season.
3) Finally, as the Navy prepares for future study question-based monitoring within the Pacific
Northwest, the Navy funded a new study in the spring of 2014 to model offshore movements of
Southern Resident killer whales. Work will be performed by scientists affiliated with NMFS’
Northwest Fisheries Science Center (NWFSC).
The first year of this project occurred from fall 2014 through spring 2015 and involved the: a)
deployment of 15 bottom-mounted acoustic monitoring devices, b) purchase of four (4) satellite
tracking tags for eventual attachment to Southern Resident killer whales, c) and development of
a new state-space model to predict Southern Resident killer whale offshore movement and
habitat. Model development will be started concurrently with the 2014 to 2015 field data
collection. Previously collected NWFSC passive acoustic and tagging data from the past two
years of offshore Southern Resident effort will be used to initiate model development. Continued
field efforts under the NWTT monitoring plan will continue for the fall 2015 to spring 2016
season.
325
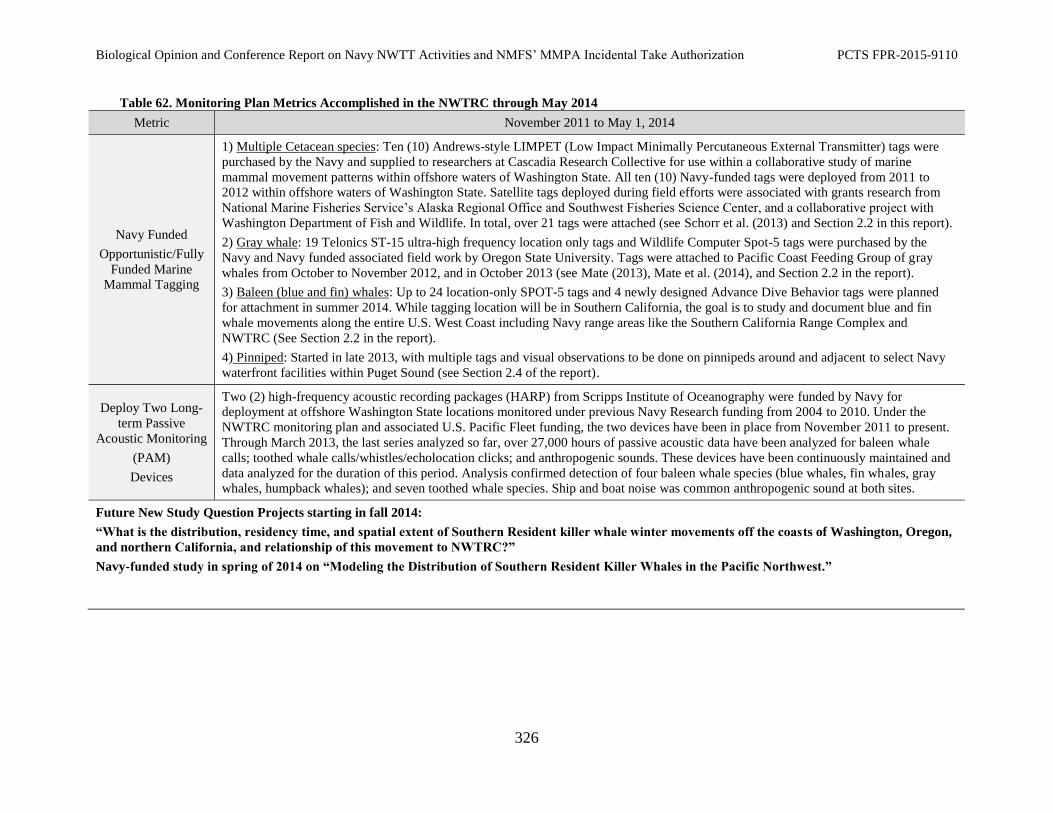
Biological Opinion and Conference Report on Navy NWTT Activities and NMFS’ MMPA Incidental Take Authorization PCTS FPR-2015-9110
Table 62. Monitoring Plan Metrics Accomplished in the NWTRC through May 2014
Metric November 2011 to May 1, 2014
Navy Funded
Opportunistic/Fully
Funded Marine
Mammal Tagging
1) Multiple Cetacean species: Ten (10) Andrews-style LIMPET (Low Impact Minimally Percutaneous External Transmitter) tags were
purchased by the Navy and supplied to researchers at Cascadia Research Collective for use within a collaborative study of marine
mammal movement patterns within offshore waters of Washington State. All ten (10) Navy-funded tags were deployed from 2011 to
2012 within offshore waters of Washington State. Satellite tags deployed during field efforts were associated with grants research from
National Marine Fisheries Service’s Alaska Regional Office and Southwest Fisheries Science Center, and a collaborative project with
Washington Department of Fish and Wildlife. In total, over 21 tags were attached (see Schorr et al. (2013) and Section 2.2 in this report).
2) Gray whale: 19 Telonics ST-15 ultra-high frequency location only tags and Wildlife Computer Spot-5 tags were purchased by the
Navy and Navy funded associated field work by Oregon State University. Tags were attached to Pacific Coast Feeding Group of gray
whales from October to November 2012, and in October 2013 (see Mate (2013), Mate et al. (2014), and Section 2.2 in the report).
3) Baleen (blue and fin) whales: Up to 24 location-only SPOT-5 tags and 4 newly designed Advance Dive Behavior tags were planned
for attachment in summer 2014. While tagging location will be in Southern California, the goal is to study and document blue and fin
whale movements along the entire U.S. West Coast including Navy range areas like the Southern California Range Complex and
NWTRC (See Section 2.2 in the report).
4) Pinniped: Started in late 2013, with multiple tags and visual observations to be done on pinnipeds around and adjacent to select Navy
waterfront facilities within Puget Sound (see Section 2.4 of the report).
Deploy Two Long
term Passive
Acoustic Monitoring
(PAM)
Devices
Two (2) high-frequency acoustic recording packages (HARP) from Scripps Institute of Oceanography were funded by Navy for
deployment at offshore Washington State locations monitored under previous Navy Research funding from 2004 to 2010. Under the
NWTRC monitoring plan and associated U.S. Pacific Fleet funding, the two devices have been in place from November 2011 to present.
Through March 2013, the last series analyzed so far, over 27,000 hours of passive acoustic data have been analyzed for baleen whale
calls; toothed whale calls/whistles/echolocation clicks; and anthropogenic sounds. These devices have been continuously maintained and
data analyzed for the duration of this period. Analysis confirmed detection of four baleen whale species (blue whales, fin whales, gray
whales, humpback whales); and seven toothed whale species. Ship and boat noise was common anthropogenic sound at both sites.
Future New Study Question Projects starting in fall 2014:
“What is the distribution, residency time, and spatial extent of Southern Resident killer whale winter movements off the coasts of Washington, Oregon, and northern California, and relationship of this movement to NWTRC?”
Navy-funded study in spring of 2014 on “Modeling the Distribution of Southern Resident Killer Whales in the Pacific Northwest.”
326
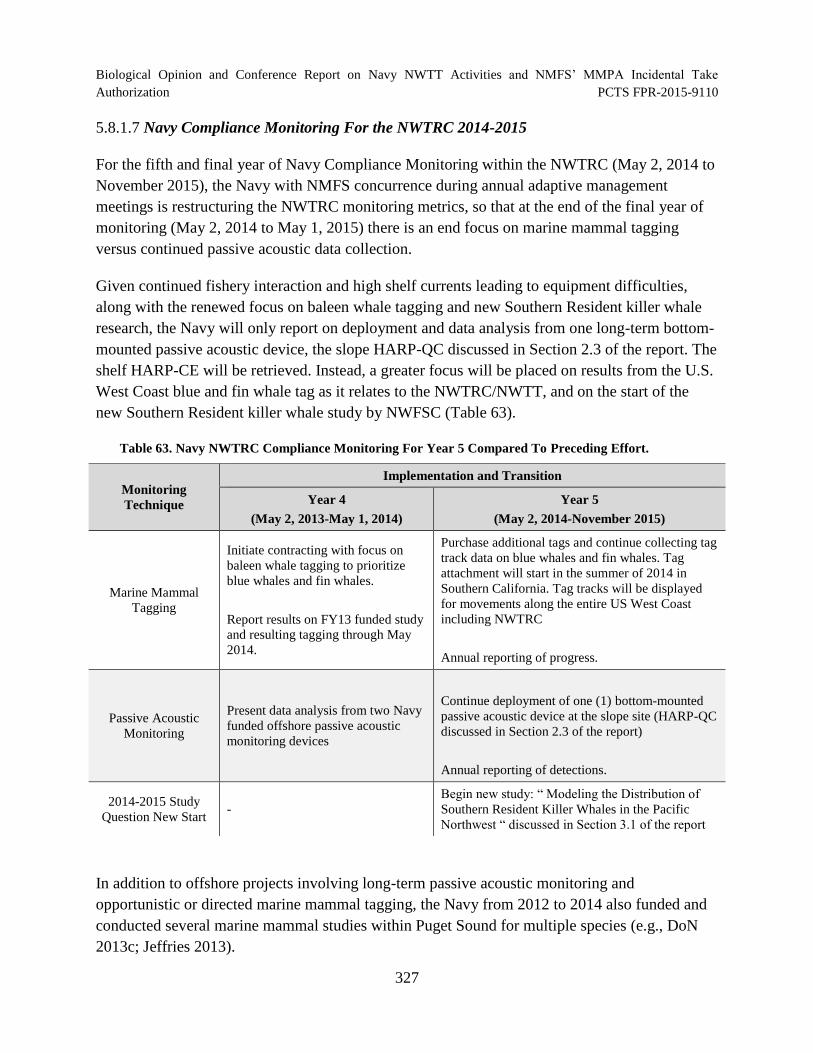
Biological Opinion and Conference Report on Navy NWTT Activities and NMFS’ MMPA Incidental Take
Authorization PCTS FPR-2015-9110
5.8.1.7 Navy Compliance Monitoring For the NWTRC 2014-2015
For the fifth and final year of Navy Compliance Monitoring within the NWTRC (May 2, 2014 to
November 2015), the Navy with NMFS concurrence during annual adaptive management
meetings is restructuring the NWTRC monitoring metrics, so that at the end of the final year of
monitoring (May 2, 2014 to May 1, 2015) there is an end focus on marine mammal tagging
versus continued passive acoustic data collection.
Given continued fishery interaction and high shelf currents leading to equipment difficulties,
along with the renewed focus on baleen whale tagging and new Southern Resident killer whale
research, the Navy will only report on deployment and data analysis from one long-term bottom-
mounted passive acoustic device, the slope HARP-QC discussed in Section 2.3 of the report. The
shelf HARP-CE will be retrieved. Instead, a greater focus will be placed on results from the U.S.
West Coast blue and fin whale tag as it relates to the NWTRC/NWTT, and on the start of the
new Southern Resident killer whale study by NWFSC (Table 63).
Table 63. Navy NWTRC Compliance Monitoring For Year 5 Compared To Preceding Effort.
Monitoring
Technique
Implementation and Transition
Year 4
(May 2, 2013-May 1, 2014)
Year 5
(May 2, 2014-November 2015)
Marine Mammal
Tagging
Initiate contracting with focus on
baleen whale tagging to prioritize
blue whales and fin whales.
Report results on FY13 funded study
and resulting tagging through May
2014.
Purchase additional tags and continue collecting tag
track data on blue whales and fin whales. Tag
attachment will start in the summer of 2014 in
Southern California. Tag tracks will be displayed
for movements along the entire US West Coast
including NWTRC
Annual reporting of progress.
Passive Acoustic
Monitoring
Present data analysis from two Navy
funded offshore passive acoustic
monitoring devices
Continue deployment of one (1) bottom-mounted
passive acoustic device at the slope site (HARP-QC
discussed in Section 2.3 of the report)
Annual reporting of detections.
2014-2015 Study
Question New Start -
Begin new study: “ Modeling the Distribution of
Southern Resident Killer Whales in the Pacific
Northwest “ discussed in Section 3.1 of the report
In addition to offshore projects involving long-term passive acoustic monitoring and
opportunistic or directed marine mammal tagging, the Navy from 2012 to 2014 also funded and
conducted several marine mammal studies within Puget Sound for multiple species (e.g., DoN
2013c; Jeffries 2013).
327
Biological Opinion and Conference Report on Navy NWTT Activities and NMFS’ MMPA Incidental Take
Authorization PCTS FPR-2015-9110
The Navy assessed that long-term fixed passive acoustic monitoring is an effective way to
determine seasonal species-specific occurrence of vocalizing and potentially foraging animals. It
does not account for non-vocalizing animals. Passive acoustic monitoring can also be used to
record natural and anthropogenic sounds leading to better assessment of ambient noise
conditions. Passive acoustic monitoring has potential via expanded analysis to begin addressing
possible impacts of anthropogenic sources on marine mammal vocalization and echolocation,
with the assumptions that changes in vocalizations and echolocation rates are indicative of
behavioral changes. However, the Navy concluded that this kind of analysis is better suited for
those areas where the Navy in-water training occurs more frequently such as Southern California
or Hawaii vice the more limited Navy in-water training within the NWTRC.
In the report the Navy also concluded that satellite tracking tags can be an effective indicator of
marine mammal distribution and movement patterns at short (days to weeks) and long time
scales (months to years). Longer term tag tracks are needed in order to better determine baleen
whale distributions in terms of bathymetric features, and to determine what percentage of time
individuals spend within the NWTRC and outside of the NWTRC.
Finally, the Navy is beginning to transition NWTRC compliance monitoring away from strictly
metric-based accomplishments (i.e., number of devices deployed, number of tags attached), to a
more region-specific and species-specific format. To that end, two new ecological based studies
have been initiated in 2014. One study using passive acoustic tools, satellite tagging, and
advanced modeling will attempt to refine predictions of offshore occurrence and locations for
Southern Resident killer whales. Another new study using satellite location tags and advanced
modeling will detail long-term blue and fin whale occurrence, migration, and local residency
patterns along the U.S. West Coast including within and outside of NWTRC.
5.9 Scientific Research and Permits
Scientific research permits issued by the NMFS currently authorize studies listed species in the
North Pacific Ocean, some of which extend into portions of the Action Area for the proposed
project. Authorized research on ESA-listed whales includes close vessel and aerial approaches,
biopsy sampling, tagging, ultrasound, and exposure to acoustic activities, and breath sampling.
Research activities involve non-lethal “takes” of these whales by harassment, with none resulting
in mortality. Sea turtle research includes capture, handling, restraint, tagging, biopsy, blood
sampling, lavage, ultrasound, and tetracycline injection. Table 64 describes the cumulative
number of takes for each listed species in the Action Area authorized in scientific research
permits.
328
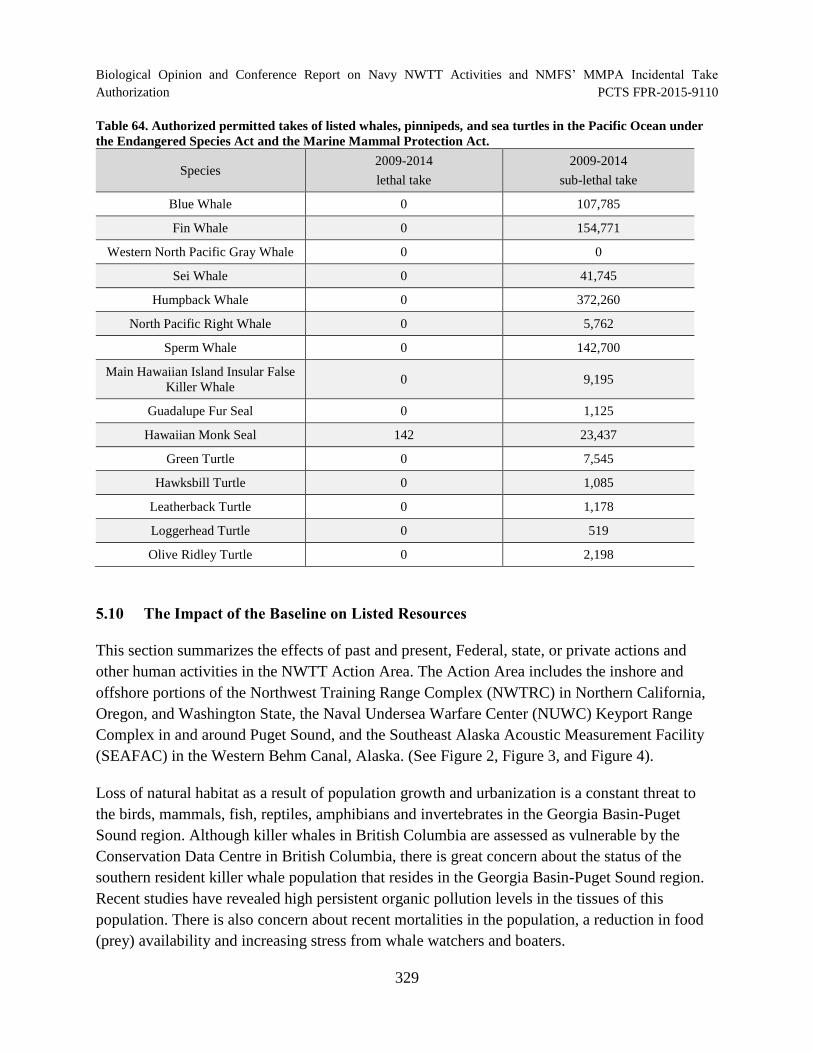
Biological Opinion and Conference Report on Navy NWTT Activities and NMFS’ MMPA Incidental Take
Authorization PCTS FPR-2015-9110
Table 64. Authorized permitted takes of listed whales, pinnipeds, and sea turtles in the Pacific Ocean under
the Endangered Species Act and the Marine Mammal Protection Act.
Species 2009-2014
lethal take
2009-2014
sub-lethal take
Blue Whale 0 107,785
Fin Whale 0 154,771
Western North Pacific Gray Whale 0 0
Sei Whale 0 41,745
Humpback Whale 0 372,260
North Pacific Right Whale 0 5,762
Sperm Whale 0 142,700
Main Hawaiian Island Insular False
Killer Whale 0 9,195
Guadalupe Fur Seal 0 1,125
Hawaiian Monk Seal 142 23,437
Green Turtle 0 7,545
Hawksbill Turtle 0 1,085
Leatherback Turtle 0 1,178
Loggerhead Turtle 0 519
Olive Ridley Turtle 0 2,198
5.10 The Impact of the Baseline on Listed Resources
This section summarizes the effects of past and present, Federal, state, or private actions and
other human activities in the NWTT Action Area. The Action Area includes the inshore and
offshore portions of the Northwest Training Range Complex (NWTRC) in Northern California,
Oregon, and Washington State, the Naval Undersea Warfare Center (NUWC) Keyport Range
Complex in and around Puget Sound, and the Southeast Alaska Acoustic Measurement Facility
(SEAFAC) in the Western Behm Canal, Alaska. (See Figure 2, Figure 3, and Figure 4).
Loss of natural habitat as a result of population growth and urbanization is a constant threat to
the birds, mammals, fish, reptiles, amphibians and invertebrates in the Georgia Basin-Puget
Sound region. Although killer whales in British Columbia are assessed as vulnerable by the
Conservation Data Centre in British Columbia, there is great concern about the status of the
southern resident killer whale population that resides in the Georgia Basin-Puget Sound region.
Recent studies have revealed high persistent organic pollution levels in the tissues of this
population. There is also concern about recent mortalities in the population, a reduction in food
(prey) availability and increasing stress from whale watchers and boaters.
329
Biological Opinion and Conference Report on Navy NWTT Activities and NMFS’ MMPA Incidental Take
Authorization PCTS FPR-2015-9110
Sixty-four of the vertebrate species that are native to Puget Sound are considered at some risk of
extinction within the Sound, including one out of four native reptile species, 18 percent of the
freshwater fish species, 15 percent of all native amphibian species, 12 percent of all native
mammal species, and 12 percent of the native breeding bird species. Forty-one of the 298
vertebrates that are native to the Georgia Basin are either threatened, endangered, or candidates
for these designations, including white sturgeon, Vancouver Island marmot, Oregon spotted frog,
and sharp-tailed snake. Fourteen of the 41 species of freshwater fish that are native to the
Georgia Basin and 10 mammal species are considered at risk of population collapses, declines, or
extinction within the Georgia Basin. The Canadian government is examining 30 other species
that are native to the Georgia Basin for potential as endangered species.
Southern resident killer whales were listed as endangered because of their exposure to the
various stressors that occur in the range of the species and in the Action Area for this
consultation. Exposure to those stressors resulted in the species’ decline from around 200
individuals to about 67 individuals in the 1970s and the species’ apparent inability to increase in
abundance above the 75 to 90 individuals that currently comprise this species. The phenomena
that are impairing the ability of the species to increase abundance potentially increase the
extinction risk of southern resident killer whales and could amplify the potential consequences of
human-related activities on this species. Based on their population size and population ecology
(that is, slow-growing mammals that give birth to single calves with several years between
births), we assume that southern resident killer whales would have elevated extinction
probabilities because of exogenous threats caused by anthropogenic activities that result in the
death or injury of individual whales (for example, ship strikes or entanglement) and natural
phenomena (such as disease, predation, or changes in the distribution and abundance of their
prey in response to changing climate) as well as endogenous threats resulting from the small size
of their population. Based on the number of other species in similar circumstances that have
become extinct (and the small number of species that have avoided extinction in similar
circumstances), the longer southern resident killer whales remain in these circumstances, the
greater their extinction probability becomes. (Williams et al. 2014b) indicated that northern
resident killer whales showed moderate (severity score 2 to 4) responses to the presence of the
large ships that use Johnstone Strait in summer months, but behavioral responses were best
explained by combinations of time (Year and Month), age of the animal, number of ships (CAR,
COL and TUG) and the broadband noise level received by the whale (RL_rms).
NMFS has consistently concluded that the various fisheries that incidentally capture endangered
or threatened salmon or steelhead in the Action Area are not likely to jeopardize the continued
existence of those species. However, the effects of the fisheries combined with the effects of
water quality degradation in the Puget Sound – Georgia Basin region on Puget Sound Chinook
salmon, Hood canal summer-run chum salmon, and Puget Sound steelhead are not known but
330
Biological Opinion and Conference Report on Navy NWTT Activities and NMFS’ MMPA Incidental Take
Authorization PCTS FPR-2015-9110
have increased the extinction risks of other endangered or threatened anadromous fish species
(for example, delta smelt in the San Francisco estuary).
Thus far under the current MMPA rule (2010 to 2015), the Navy’s training activities on the
NWTRC have resulted in estimated take that are well below the five-year levels evaluated in the
previous Biological Opinion for the Northwest Training Range Complex. There have not been
any vessel strikes of any species during training activities in the NWTRC during the five-year
period.
Collectively, the stressors described above have had, and likely continue to have, lasting impacts
on the ESA-listed species considered in this Opinion. Some of these stressors result in mortality
or serious injury to individual animals (e.g., vessel strike, whaling), whereas others result in
more indirect (e.g., a fishery that impacts prey availability) or non-lethal (e.g., whale watching,
anthropogenic sound) impacts. Assessing the aggregate impacts of these stressors on the species
considered in this Opinion is difficult and, to our knowledge, no such analysis exists. This
becomes even more difficult considering that many of the species in this Opinion are wide
ranging and subject to stressors in locations well beyond the NWTT Action Area.
We consider the best indicator of the aggregate impact of the Environmental Baseline on ESA-
listed resources to be the status and trends of those species. As noted in Table 15, some of the
species considered in this Opinion are seeing increases in population abundance, some are
declining, and for some, the status remains unknown. Taken together, this indicates that the
Environmental Baseline is impacting species in different ways. For the species that are
increasing in population abundance, they are doing so despite the potential negative impacts of
the Environmental Baseline. Therefore, while the Environmental Baseline described previously
may slow their recovery, recovery is not being prevented. For the species that may be declining
in abundance, it is possible that the suite of conditions described in the Environmental Baseline
is preventing their recovery. However, it is also possible that their populations are at such low
levels (e.g., due to historic commercial whaling) that even when the species’ primary threats are
removed, the species may not be able to achieve recovery. At small population sizes, they may
experience phenomena such as demographic stochasticity, inbreeding depression, and Allee
effects, among others, that cause their population size to become a threat in and of itself. A
thorough review of the status and trends of each species is presented in the Status of Listed
Resources section of this Opinion.
6 EFFECTS OF THE ACTION ON ESA-LISTED SPECIES AND CRITICAL HABITAT
Section 7 regulations define “effects of the action” as the direct and indirect effects of an action
on the species or critical habitat, together with the effects of other activities that are interrelated
or interdependent with that action, that will be added to the environmental baseline (50 CFR
331
Biological Opinion and Conference Report on Navy NWTT Activities and NMFS’ MMPA Incidental Take
Authorization PCTS FPR-2015-9110
402.02). Indirect effects are those that are caused by the proposed action and are later in time, but
are reasonably certain to occur. This effects analyses section is organized following the stressor,
exposure, response, risk assessment framework.
The jeopardy analysis relies upon the regulatory definition of “to jeopardize the continued
existence of a listed species,” which is “to engage in an action that would be expected, directly or
indirectly, to reduce appreciably the likelihood of both the survival and recovery of a listed
species in the wild by reducing the reproduction, numbers, or distribution of that species” (50
CFR 402.02). Therefore, the jeopardy analysis considers both survival and recovery of the
species.
The adverse modification analysis considers the impacts on the conservation value of designated
critical habitat. This biological opinion does not rely on the regulatory definition of "destruction
or adverse modification" of critical habitat at 50 CFR 402.02, which was invalidated by Gifford
Pinchot Task Force v. United States Fish and Wildlife Service, 378 F.3d 1059 (9th Cir. 2004),
amended by 387 F.3d 968 (9th Cir. 2004). Instead, we have relied upon the statutory provisions
of the ESA to complete our analysis with respect to critical habitat.
6.1 Stressors Associated with the Proposed Action
The potential stressors (risks) to ESA-listed species that we analyzed based on the training and
testing activities the Navy proposes to conduct in the NWTT Action Area are summarized in
Table 65.
332
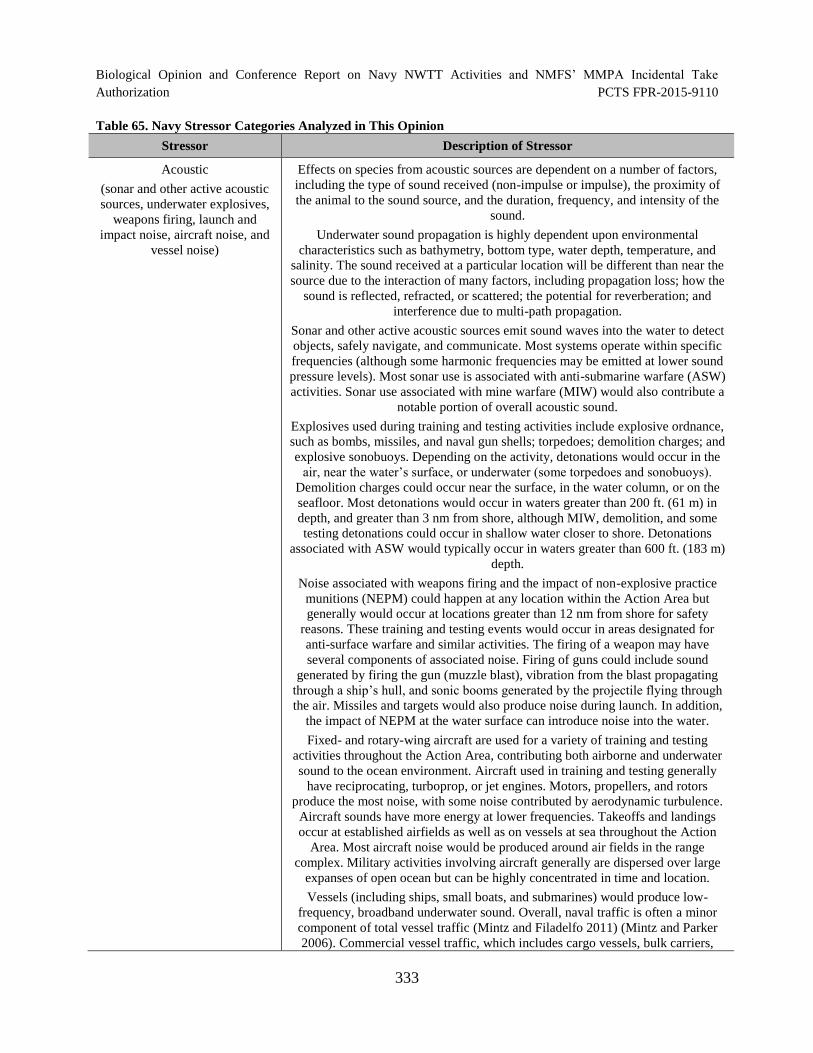
Biological Opinion and Conference Report on Navy NWTT Activities and NMFS’ MMPA Incidental Take Authorization PCTS FPR-2015-9110
Table 65. Navy Stressor Categories Analyzed in This Opinion
Stressor Description of Stressor
Acoustic Effects on species from acoustic sources are dependent on a number of factors,
(sonar and other active acoustic
sources, underwater explosives,
weapons firing, launch and
including the type of sound received (non-impulse or impulse), the proximity of
the animal to the sound source, and the duration, frequency, and intensity of the
sound.
impact noise, aircraft noise, and Underwater sound propagation is highly dependent upon environmental
vessel noise) characteristics such as bathymetry, bottom type, water depth, temperature, and
salinity. The sound received at a particular location will be different than near the
source due to the interaction of many factors, including propagation loss; how the
sound is reflected, refracted, or scattered; the potential for reverberation; and
interference due to multi-path propagation.
Sonar and other active acoustic sources emit sound waves into the water to detect
objects, safely navigate, and communicate. Most systems operate within specific
frequencies (although some harmonic frequencies may be emitted at lower sound
pressure levels). Most sonar use is associated with anti-submarine warfare (ASW)
activities. Sonar use associated with mine warfare (MIW) would also contribute a
notable portion of overall acoustic sound.
Explosives used during training and testing activities include explosive ordnance,
such as bombs, missiles, and naval gun shells; torpedoes; demolition charges; and
explosive sonobuoys. Depending on the activity, detonations would occur in the
air, near the water’s surface, or underwater (some torpedoes and sonobuoys).
Demolition charges could occur near the surface, in the water column, or on the
seafloor. Most detonations would occur in waters greater than 200 ft. (61 m) in
depth, and greater than 3 nm from shore, although MIW, demolition, and some
testing detonations could occur in shallow water closer to shore. Detonations
associated with ASW would typically occur in waters greater than 600 ft. (183 m)
depth.
Noise associated with weapons firing and the impact of non-explosive practice
munitions (NEPM) could happen at any location within the Action Area but
generally would occur at locations greater than 12 nm from shore for safety
reasons. These training and testing events would occur in areas designated for
anti-surface warfare and similar activities. The firing of a weapon may have
several components of associated noise. Firing of guns could include sound
generated by firing the gun (muzzle blast), vibration from the blast propagating
through a ship’s hull, and sonic booms generated by the projectile flying through
the air. Missiles and targets would also produce noise during launch. In addition,
the impact of NEPM at the water surface can introduce noise into the water.
Fixed- and rotary-wing aircraft are used for a variety of training and testing
activities throughout the Action Area, contributing both airborne and underwater
sound to the ocean environment. Aircraft used in training and testing generally
have reciprocating, turboprop, or jet engines. Motors, propellers, and rotors
produce the most noise, with some noise contributed by aerodynamic turbulence.
Aircraft sounds have more energy at lower frequencies. Takeoffs and landings
occur at established airfields as well as on vessels at sea throughout the Action
Area. Most aircraft noise would be produced around air fields in the range
complex. Military activities involving aircraft generally are dispersed over large
expanses of open ocean but can be highly concentrated in time and location.
Vessels (including ships, small boats, and submarines) would produce low-
frequency, broadband underwater sound. Overall, naval traffic is often a minor
component of total vessel traffic (Mintz and Filadelfo 2011) (Mintz and Parker
2006). Commercial vessel traffic, which includes cargo vessels, bulk carriers,
333
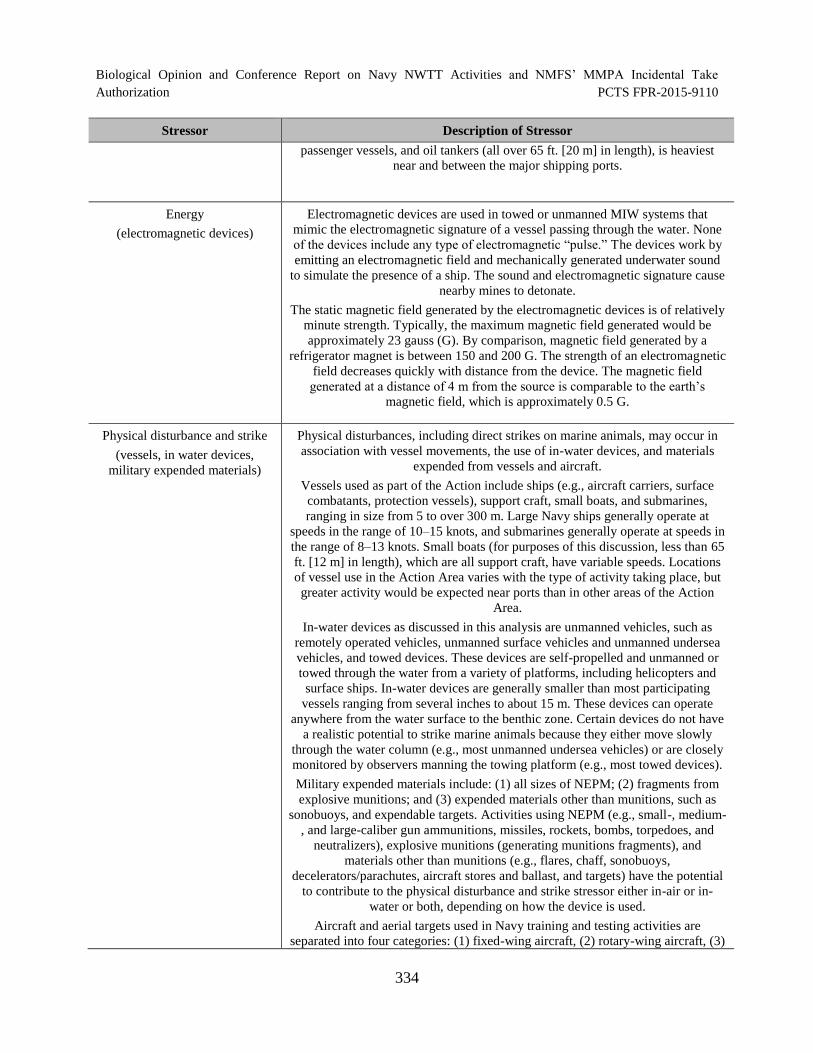
Biological Opinion and Conference Report on Navy NWTT Activities and NMFS’ MMPA Incidental Take Authorization PCTS FPR-2015-9110
Stressor Description of Stressor
passenger vessels, and oil tankers (all over 65 ft. [20 m] in length), is heaviest
near and between the major shipping ports.
Energy
(electromagnetic devices)
Electromagnetic devices are used in towed or unmanned MIW systems that
mimic the electromagnetic signature of a vessel passing through the water. None
of the devices include any type of electromagnetic “pulse.” The devices work by
emitting an electromagnetic field and mechanically generated underwater sound
to simulate the presence of a ship. The sound and electromagnetic signature cause
nearby mines to detonate.
The static magnetic field generated by the electromagnetic devices is of relatively
minute strength. Typically, the maximum magnetic field generated would be
approximately 23 gauss (G). By comparison, magnetic field generated by a
refrigerator magnet is between 150 and 200 G. The strength of an electromagnetic
field decreases quickly with distance from the device. The magnetic field
generated at a distance of 4 m from the source is comparable to the earth’s
magnetic field, which is approximately 0.5 G.
Physical disturbance and strike
(vessels, in water devices,
military expended materials)
Physical disturbances, including direct strikes on marine animals, may occur in
association with vessel movements, the use of in-water devices, and materials
expended from vessels and aircraft.
Vessels used as part of the Action include ships (e.g., aircraft carriers, surface
combatants, protection vessels), support craft, small boats, and submarines,
ranging in size from 5 to over 300 m. Large Navy ships generally operate at
speeds in the range of 10–15 knots, and submarines generally operate at speeds in
the range of 8–13 knots. Small boats (for purposes of this discussion, less than 65
ft. [12 m] in length), which are all support craft, have variable speeds. Locations
of vessel use in the Action Area varies with the type of activity taking place, but
greater activity would be expected near ports than in other areas of the Action
Area.
In-water devices as discussed in this analysis are unmanned vehicles, such as
remotely operated vehicles, unmanned surface vehicles and unmanned undersea
vehicles, and towed devices. These devices are self-propelled and unmanned or
towed through the water from a variety of platforms, including helicopters and
surface ships. In-water devices are generally smaller than most participating
vessels ranging from several inches to about 15 m. These devices can operate
anywhere from the water surface to the benthic zone. Certain devices do not have
a realistic potential to strike marine animals because they either move slowly
through the water column (e.g., most unmanned undersea vehicles) or are closely
monitored by observers manning the towing platform (e.g., most towed devices).
Military expended materials include: (1) all sizes of NEPM; (2) fragments from
explosive munitions; and (3) expended materials other than munitions, such as
sonobuoys, and expendable targets. Activities using NEPM (e.g., small-, medium
, and large-caliber gun ammunitions, missiles, rockets, bombs, torpedoes, and
neutralizers), explosive munitions (generating munitions fragments), and
materials other than munitions (e.g., flares, chaff, sonobuoys,
decelerators/parachutes, aircraft stores and ballast, and targets) have the potential
to contribute to the physical disturbance and strike stressor either in-air or in-
water or both, depending on how the device is used.
Aircraft and aerial targets used in Navy training and testing activities are
separated into four categories: (1) fixed-wing aircraft, (2) rotary-wing aircraft, (3)
334
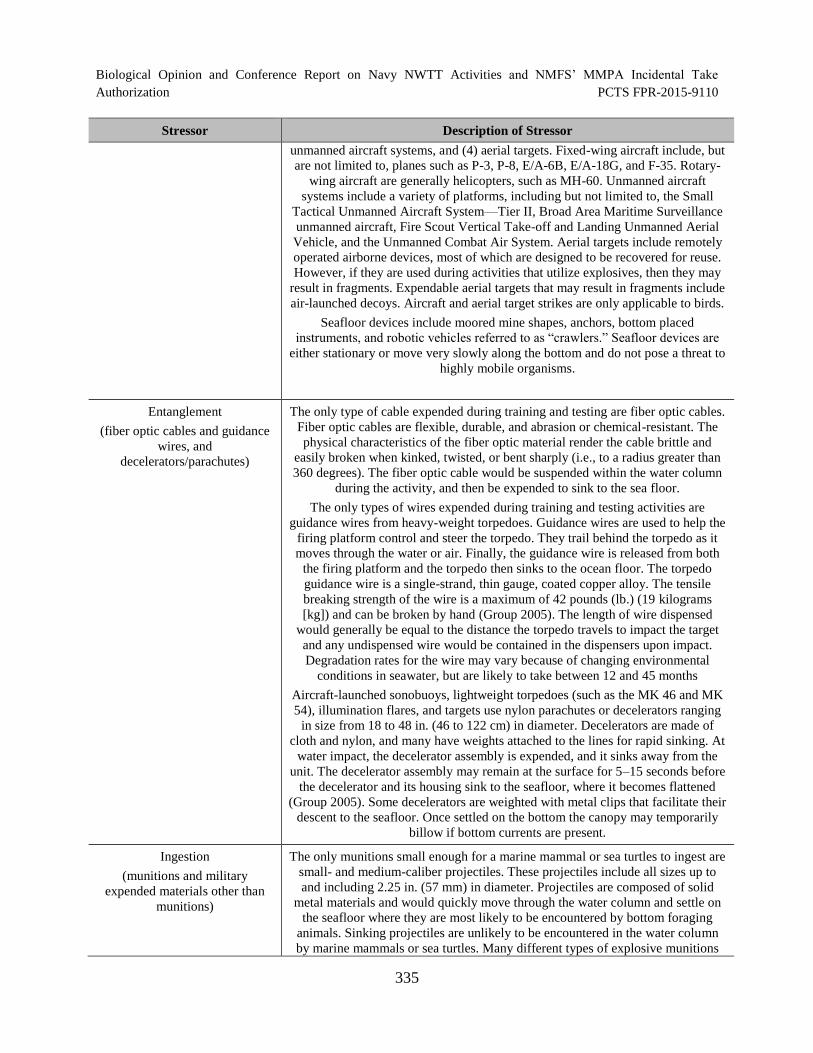
Biological Opinion and Conference Report on Navy NWTT Activities and NMFS’ MMPA Incidental Take Authorization PCTS FPR-2015-9110
Stressor Description of Stressor
unmanned aircraft systems, and (4) aerial targets. Fixed-wing aircraft include, but
are not limited to, planes such as P-3, P-8, E/A-6B, E/A-18G, and F-35. Rotary-
wing aircraft are generally helicopters, such as MH-60. Unmanned aircraft
systems include a variety of platforms, including but not limited to, the Small
Tactical Unmanned Aircraft System—Tier II, Broad Area Maritime Surveillance
unmanned aircraft, Fire Scout Vertical Take-off and Landing Unmanned Aerial
Vehicle, and the Unmanned Combat Air System. Aerial targets include remotely
operated airborne devices, most of which are designed to be recovered for reuse.
However, if they are used during activities that utilize explosives, then they may
result in fragments. Expendable aerial targets that may result in fragments include
air-launched decoys. Aircraft and aerial target strikes are only applicable to birds.
Seafloor devices include moored mine shapes, anchors, bottom placed
instruments, and robotic vehicles referred to as “crawlers.” Seafloor devices are
either stationary or move very slowly along the bottom and do not pose a threat to
highly mobile organisms.
Entanglement
(fiber optic cables and guidance
wires, and
decelerators/parachutes)
The only type of cable expended during training and testing are fiber optic cables.
Fiber optic cables are flexible, durable, and abrasion or chemical-resistant. The
physical characteristics of the fiber optic material render the cable brittle and
easily broken when kinked, twisted, or bent sharply (i.e., to a radius greater than
360 degrees). The fiber optic cable would be suspended within the water column
during the activity, and then be expended to sink to the sea floor.
The only types of wires expended during training and testing activities are
guidance wires from heavy-weight torpedoes. Guidance wires are used to help the
firing platform control and steer the torpedo. They trail behind the torpedo as it
moves through the water or air. Finally, the guidance wire is released from both
the firing platform and the torpedo then sinks to the ocean floor. The torpedo
guidance wire is a single-strand, thin gauge, coated copper alloy. The tensile
breaking strength of the wire is a maximum of 42 pounds (lb.) (19 kilograms
[kg]) and can be broken by hand (Group 2005). The length of wire dispensed
would generally be equal to the distance the torpedo travels to impact the target
and any undispensed wire would be contained in the dispensers upon impact.
Degradation rates for the wire may vary because of changing environmental
conditions in seawater, but are likely to take between 12 and 45 months
Aircraft-launched sonobuoys, lightweight torpedoes (such as the MK 46 and MK
54), illumination flares, and targets use nylon parachutes or decelerators ranging
in size from 18 to 48 in. (46 to 122 cm) in diameter. Decelerators are made of
cloth and nylon, and many have weights attached to the lines for rapid sinking. At
water impact, the decelerator assembly is expended, and it sinks away from the
unit. The decelerator assembly may remain at the surface for 5–15 seconds before
the decelerator and its housing sink to the seafloor, where it becomes flattened
(Group 2005). Some decelerators are weighted with metal clips that facilitate their
descent to the seafloor. Once settled on the bottom the canopy may temporarily
billow if bottom currents are present.
Ingestion
(munitions and military
expended materials other than
munitions)
The only munitions small enough for a marine mammal or sea turtles to ingest are
small- and medium-caliber projectiles. These projectiles include all sizes up to
and including 2.25 in. (57 mm) in diameter. Projectiles are composed of solid
metal materials and would quickly move through the water column and settle on
the seafloor where they are most likely to be encountered by bottom foraging
animals. Sinking projectiles are unlikely to be encountered in the water column
by marine mammals or sea turtles. Many different types of explosive munitions
335
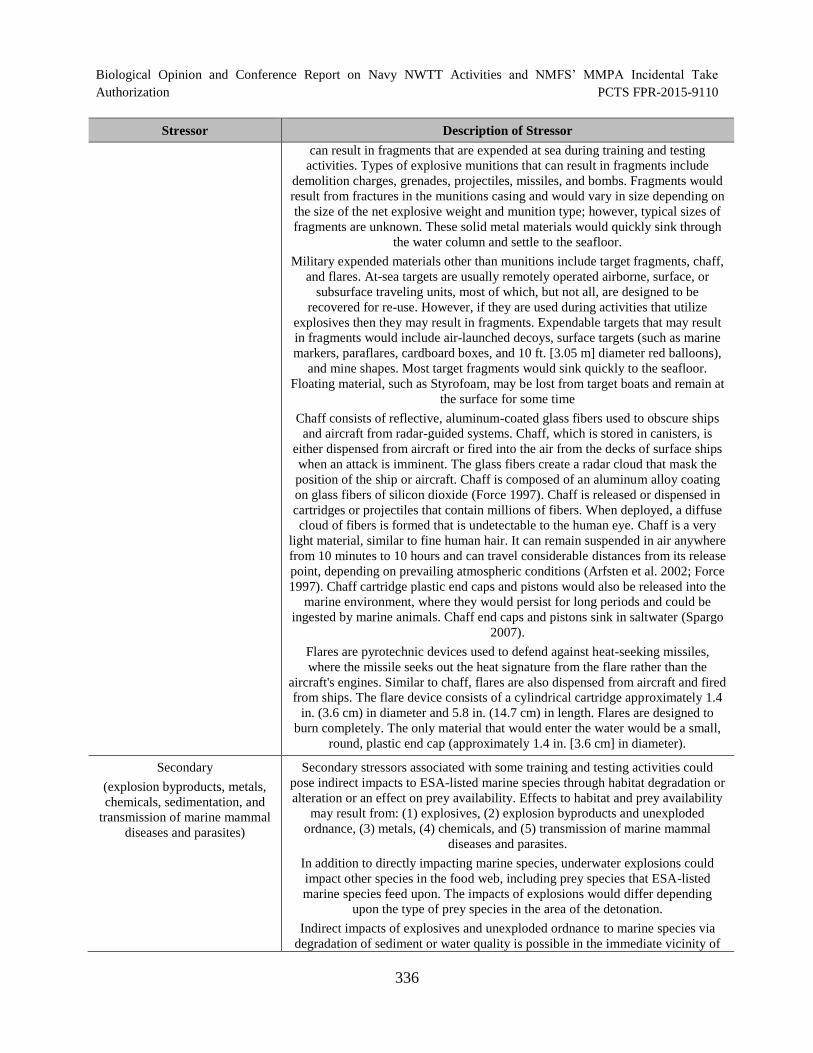
Biological Opinion and Conference Report on Navy NWTT Activities and NMFS’ MMPA Incidental Take Authorization PCTS FPR-2015-9110
Stressor Description of Stressor
can result in fragments that are expended at sea during training and testing
activities. Types of explosive munitions that can result in fragments include
demolition charges, grenades, projectiles, missiles, and bombs. Fragments would
result from fractures in the munitions casing and would vary in size depending on
the size of the net explosive weight and munition type; however, typical sizes of
fragments are unknown. These solid metal materials would quickly sink through
the water column and settle to the seafloor.
Military expended materials other than munitions include target fragments, chaff,
and flares. At-sea targets are usually remotely operated airborne, surface, or
subsurface traveling units, most of which, but not all, are designed to be
recovered for re-use. However, if they are used during activities that utilize
explosives then they may result in fragments. Expendable targets that may result
in fragments would include air-launched decoys, surface targets (such as marine
markers, paraflares, cardboard boxes, and 10 ft. [3.05 m] diameter red balloons),
and mine shapes. Most target fragments would sink quickly to the seafloor.
Floating material, such as Styrofoam, may be lost from target boats and remain at
the surface for some time
Chaff consists of reflective, aluminum-coated glass fibers used to obscure ships
and aircraft from radar-guided systems. Chaff, which is stored in canisters, is
either dispensed from aircraft or fired into the air from the decks of surface ships
when an attack is imminent. The glass fibers create a radar cloud that mask the
position of the ship or aircraft. Chaff is composed of an aluminum alloy coating
on glass fibers of silicon dioxide (Force 1997). Chaff is released or dispensed in
cartridges or projectiles that contain millions of fibers. When deployed, a diffuse
cloud of fibers is formed that is undetectable to the human eye. Chaff is a very
light material, similar to fine human hair. It can remain suspended in air anywhere
from 10 minutes to 10 hours and can travel considerable distances from its release
point, depending on prevailing atmospheric conditions (Arfsten et al. 2002; Force
1997). Chaff cartridge plastic end caps and pistons would also be released into the
marine environment, where they would persist for long periods and could be
ingested by marine animals. Chaff end caps and pistons sink in saltwater (Spargo
2007).
Flares are pyrotechnic devices used to defend against heat-seeking missiles,
where the missile seeks out the heat signature from the flare rather than the
aircraft's engines. Similar to chaff, flares are also dispensed from aircraft and fired
from ships. The flare device consists of a cylindrical cartridge approximately 1.4
in. (3.6 cm) in diameter and 5.8 in. (14.7 cm) in length. Flares are designed to
burn completely. The only material that would enter the water would be a small,
round, plastic end cap (approximately 1.4 in. [3.6 cm] in diameter).
Secondary
(explosion byproducts, metals,
chemicals, sedimentation, and
transmission of marine mammal
diseases and parasites)
Secondary stressors associated with some training and testing activities could
pose indirect impacts to ESA-listed marine species through habitat degradation or
alteration or an effect on prey availability. Effects to habitat and prey availability
may result from: (1) explosives, (2) explosion byproducts and unexploded
ordnance, (3) metals, (4) chemicals, and (5) transmission of marine mammal
diseases and parasites.
In addition to directly impacting marine species, underwater explosions could
impact other species in the food web, including prey species that ESA-listed
marine species feed upon. The impacts of explosions would differ depending
upon the type of prey species in the area of the detonation.
Indirect impacts of explosives and unexploded ordnance to marine species via
degradation of sediment or water quality is possible in the immediate vicinity of
336
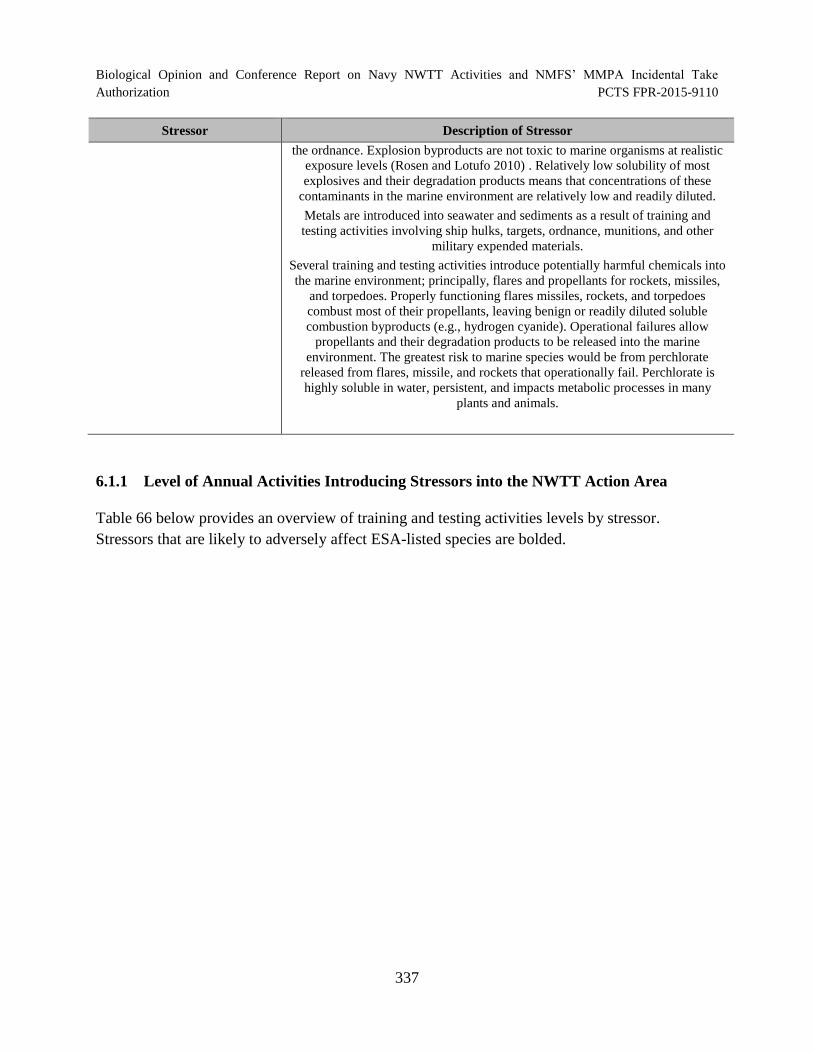
Biological Opinion and Conference Report on Navy NWTT Activities and NMFS’ MMPA Incidental Take Authorization PCTS FPR-2015-9110
Stressor Description of Stressor
the ordnance. Explosion byproducts are not toxic to marine organisms at realistic
exposure levels (Rosen and Lotufo 2010) . Relatively low solubility of most
explosives and their degradation products means that concentrations of these
contaminants in the marine environment are relatively low and readily diluted.
Metals are introduced into seawater and sediments as a result of training and
testing activities involving ship hulks, targets, ordnance, munitions, and other
military expended materials.
Several training and testing activities introduce potentially harmful chemicals into
the marine environment; principally, flares and propellants for rockets, missiles,
and torpedoes. Properly functioning flares missiles, rockets, and torpedoes
combust most of their propellants, leaving benign or readily diluted soluble
combustion byproducts (e.g., hydrogen cyanide). Operational failures allow
propellants and their degradation products to be released into the marine
environment. The greatest risk to marine species would be from perchlorate
released from flares, missile, and rockets that operationally fail. Perchlorate is
highly soluble in water, persistent, and impacts metabolic processes in many
plants and animals.
6.1.1 Level of Annual Activities Introducing Stressors into the NWTT Action Area
Table 66 below provides an overview of training and testing activities levels by stressor.
Stressors that are likely to adversely affect ESA-listed species are bolded.
337
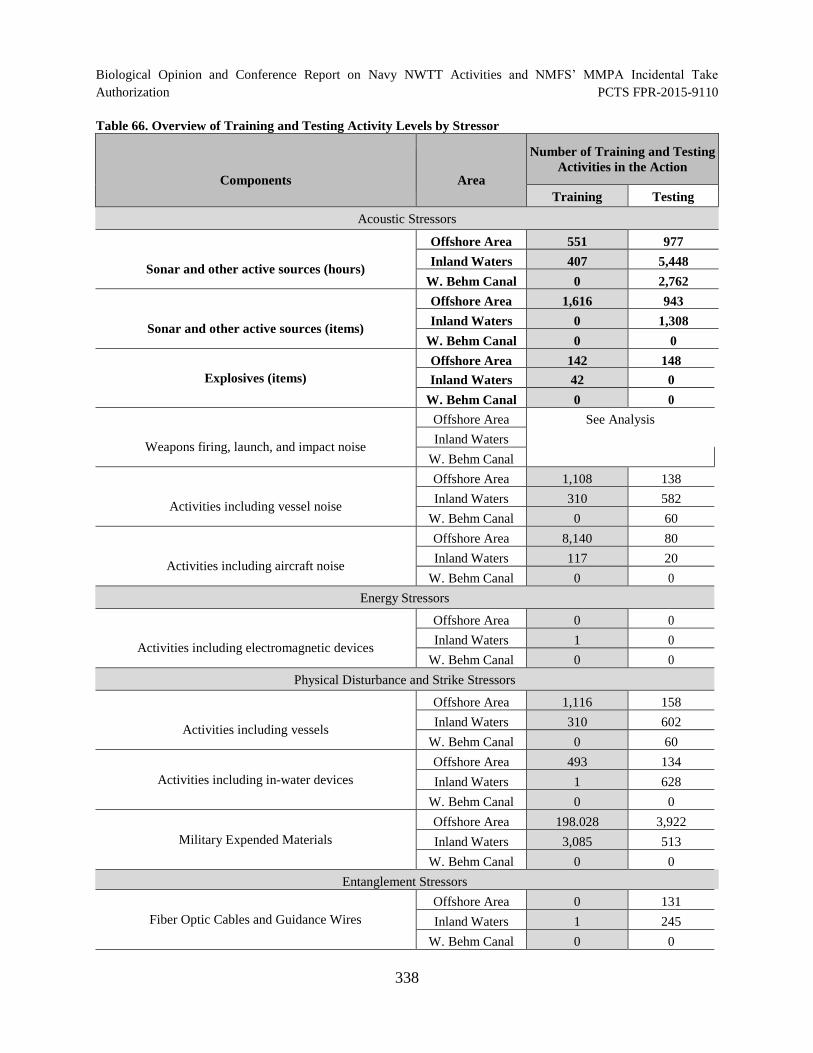
Biological Opinion and Conference Report on Navy NWTT Activities and NMFS’ MMPA Incidental Take Authorization PCTS FPR-2015-9110
Table 66. Overview of Training and Testing Activity Levels by Stressor
Number of Training and Testing
Activities in the Action Components Area
Training Testing
Acoustic Stressors
Sonar and other active sources (hours)
Offshore Area 551 977
Inland Waters 407 5,448
W. Behm Canal 0 2,762
Sonar and other active sources (items)
Offshore Area 1,616 943
Inland Waters 0 1,308
W. Behm Canal 0 0
Explosives (items)
Offshore Area 142 148
Inland Waters 42 0
W. Behm Canal 0 0
Weapons firing, launch, and impact noise
Offshore Area See Analysis
Inland Waters
W. Behm Canal
Activities including vessel noise
Offshore Area 1,108 138
Inland Waters 310 582
W. Behm Canal 0 60
Activities including aircraft noise
Offshore Area 8,140 80
Inland Waters 117 20
W. Behm Canal 0 0
Energy Stressors
Activities including electromagnetic devices
Offshore Area 0 0
Inland Waters 1 0
W. Behm Canal 0 0
Physical Disturbance and Strike Stressors
Activities including vessels
Offshore Area 1,116 158
Inland Waters 310 602
W. Behm Canal 0 60
Offshore Area 493 134
Activities including in-water devices Inland Waters 1 628
W. Behm Canal 0 0
Offshore Area 198.028 3,922
Military Expended Materials Inland Waters 3,085 513
W. Behm Canal 0 0
Entanglement Stressors
Fiber Optic Cables and Guidance Wires
Offshore Area 0 131
Inland Waters 1 245
W. Behm Canal 0 0
338
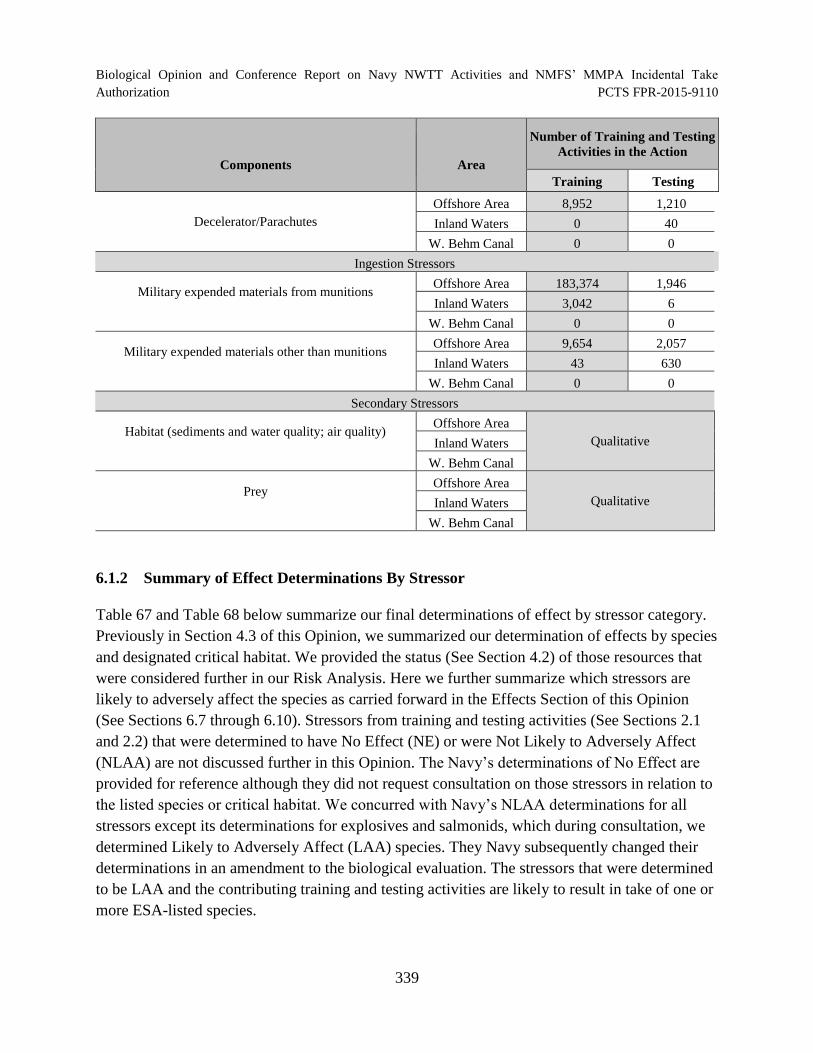
Biological Opinion and Conference Report on Navy NWTT Activities and NMFS’ MMPA Incidental Take Authorization PCTS FPR-2015-9110
Components Area
Number of Training and Testing
Activities in the Action
Training Testing
Decelerator/Parachutes
Offshore Area
Inland Waters
W. Behm Canal
8,952
0
0
1,210
40
0
Ingestion Stressors
Military expended materials from munitions Offshore Area 183,374 1,946
Inland Waters 3,042 6
W. Behm Canal 0 0
Military expended materials other than munitions Offshore Area 9,654 2,057
Inland Waters 43 630
W. Behm Canal 0 0
Secondary Stressors
Habitat (sediments and water quality; air quality) Offshore Area
Inland Waters
W. Behm Canal
Qualitative
Prey Offshore Area
Inland Waters
W. Behm Canal
Qualitative
6.1.2 Summary of Effect Determinations By Stressor
Table 67 and Table 68 below summarize our final determinations of effect by stressor category.
Previously in Section 4.3 of this Opinion, we summarized our determination of effects by species
and designated critical habitat. We provided the status (See Section 4.2) of those resources that
were considered further in our Risk Analysis. Here we further summarize which stressors are
likely to adversely affect the species as carried forward in the Effects Section of this Opinion
(See Sections 6.7 through 6.10). Stressors from training and testing activities (See Sections 2.1
and 2.2) that were determined to have No Effect (NE) or were Not Likely to Adversely Affect
(NLAA) are not discussed further in this Opinion. The Navy’s determinations of No Effect are
provided for reference although they did not request consultation on those stressors in relation to
the listed species or critical habitat. We concurred with Navy’s NLAA determinations for all
stressors except its determinations for explosives and salmonids, which during consultation, we
determined Likely to Adversely Affect (LAA) species. They Navy subsequently changed their
determinations in an amendment to the biological evaluation. The stressors that were determined
to be LAA and the contributing training and testing activities are likely to result in take of one or
more ESA-listed species.
339
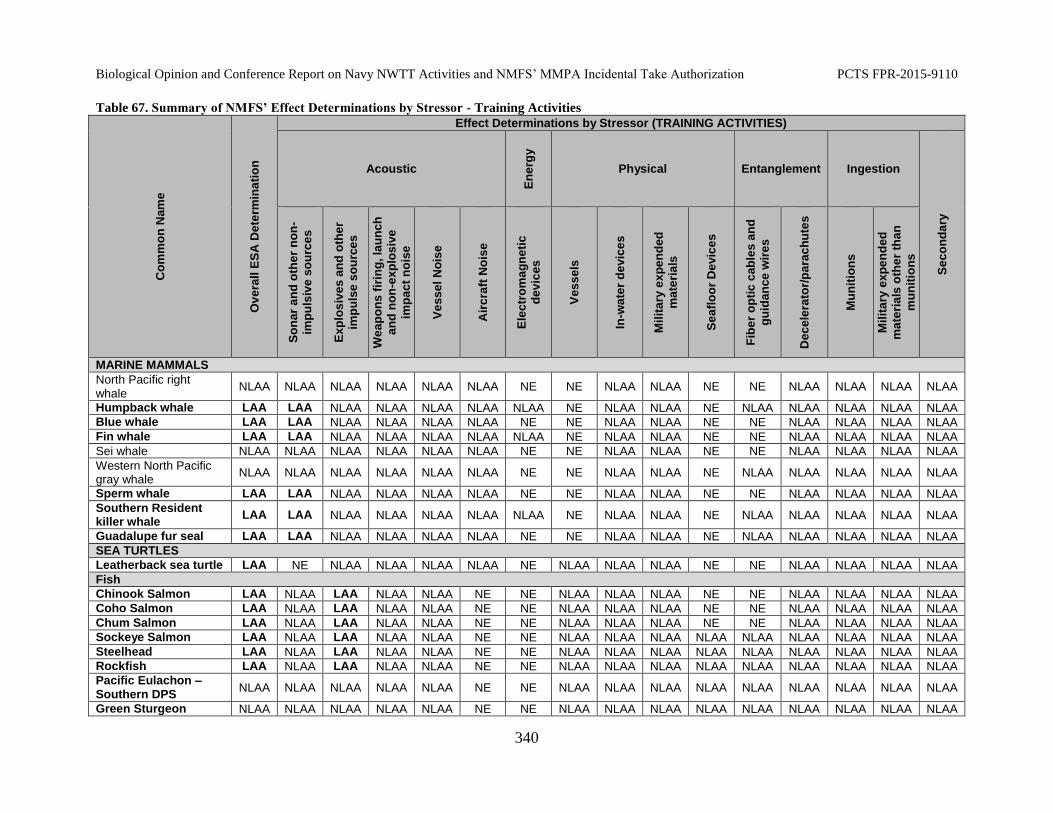
Biological Opinion and Conference Report on Navy NWTT Activities and NMFS’ MMPA Incidental Take Authorization PCTS FPR-2015-9110
Table 67. Summary of NMFS’ Effect Determinations by Stressor - Training Activities
Co
mm
on
Nam
e
Ov
era
ll E
SA
Dete
rmin
ati
on
Effect Determinations by Stressor (TRAINING ACTIVITIES)
Acoustic
En
erg
y
Physical Entanglement Ingestion
Se
co
nd
ary
So
na
r a
nd
oth
er
no
n-
imp
uls
ive
so
urc
es
Ex
plo
siv
es a
nd
oth
er
imp
uls
e s
ou
rce
s
We
ap
on
s f
irin
g, la
un
ch
an
d n
on
-ex
plo
siv
e
imp
ac
t n
ois
e
Ve
ss
el
No
ise
Air
cra
ft N
ois
e
Ele
ctr
om
ag
ne
tic
de
vic
es
Ve
ss
els
In-w
ate
r d
evic
es
Mil
ita
ry e
xp
en
de
d
ma
teri
als
Se
afl
oo
r D
evic
es
Fib
er
op
tic
cab
les a
nd
gu
ida
nce
wir
es
Dec
ele
rato
r/p
ara
ch
ute
s
Mu
nit
ion
s
Mil
ita
ry e
xp
en
de
d
ma
teri
als
oth
er
tha
n
mu
nit
ion
s
MARINE MAMMALS
North Pacific right whale
NLAA NLAA NLAA NLAA NLAA NLAA NE NE NLAA NLAA NE NE NLAA NLAA NLAA NLAA
Humpback whale LAA LAA NLAA NLAA NLAA NLAA NLAA NE NLAA NLAA NE NLAA NLAA NLAA NLAA NLAA
Blue whale LAA LAA NLAA NLAA NLAA NLAA NE NE NLAA NLAA NE NE NLAA NLAA NLAA NLAA
Fin whale LAA LAA NLAA NLAA NLAA NLAA NLAA NE NLAA NLAA NE NE NLAA NLAA NLAA NLAA
Sei whale NLAA NLAA NLAA NLAA NLAA NLAA NE NE NLAA NLAA NE NE NLAA NLAA NLAA NLAA
Western North Pacific gray whale
NLAA NLAA NLAA NLAA NLAA NLAA NE NE NLAA NLAA NE NLAA NLAA NLAA NLAA NLAA
Sperm whale LAA LAA NLAA NLAA NLAA NLAA NE NE NLAA NLAA NE NE NLAA NLAA NLAA NLAA
Southern Resident killer whale
LAA LAA NLAA NLAA NLAA NLAA NLAA NE NLAA NLAA NE NLAA NLAA NLAA NLAA NLAA
Guadalupe fur seal LAA LAA NLAA NLAA NLAA NLAA NE NE NLAA NLAA NE NLAA NLAA NLAA NLAA NLAA
SEA TURTLES
Leatherback sea turtle LAA NE NLAA NLAA NLAA NLAA NE NLAA NLAA NLAA NE NE NLAA NLAA NLAA NLAA
Fish
Chinook Salmon LAA NLAA LAA NLAA NLAA NE NE NLAA NLAA NLAA NE NE NLAA NLAA NLAA NLAA
Coho Salmon LAA NLAA LAA NLAA NLAA NE NE NLAA NLAA NLAA NE NE NLAA NLAA NLAA NLAA
Chum Salmon LAA NLAA LAA NLAA NLAA NE NE NLAA NLAA NLAA NE NE NLAA NLAA NLAA NLAA
Sockeye Salmon LAA NLAA LAA NLAA NLAA NE NE NLAA NLAA NLAA NLAA NLAA NLAA NLAA NLAA NLAA
Steelhead LAA NLAA LAA NLAA NLAA NE NE NLAA NLAA NLAA NLAA NLAA NLAA NLAA NLAA NLAA
Rockfish LAA NLAA LAA NLAA NLAA NE NE NLAA NLAA NLAA NLAA NLAA NLAA NLAA NLAA NLAA
Pacific Eulachon – Southern DPS
NLAA NLAA NLAA NLAA NLAA NE NE NLAA NLAA NLAA NLAA NLAA NLAA NLAA NLAA NLAA
Green Sturgeon NLAA NLAA NLAA NLAA NLAA NE NE NLAA NLAA NLAA NLAA NLAA NLAA NLAA NLAA NLAA
340
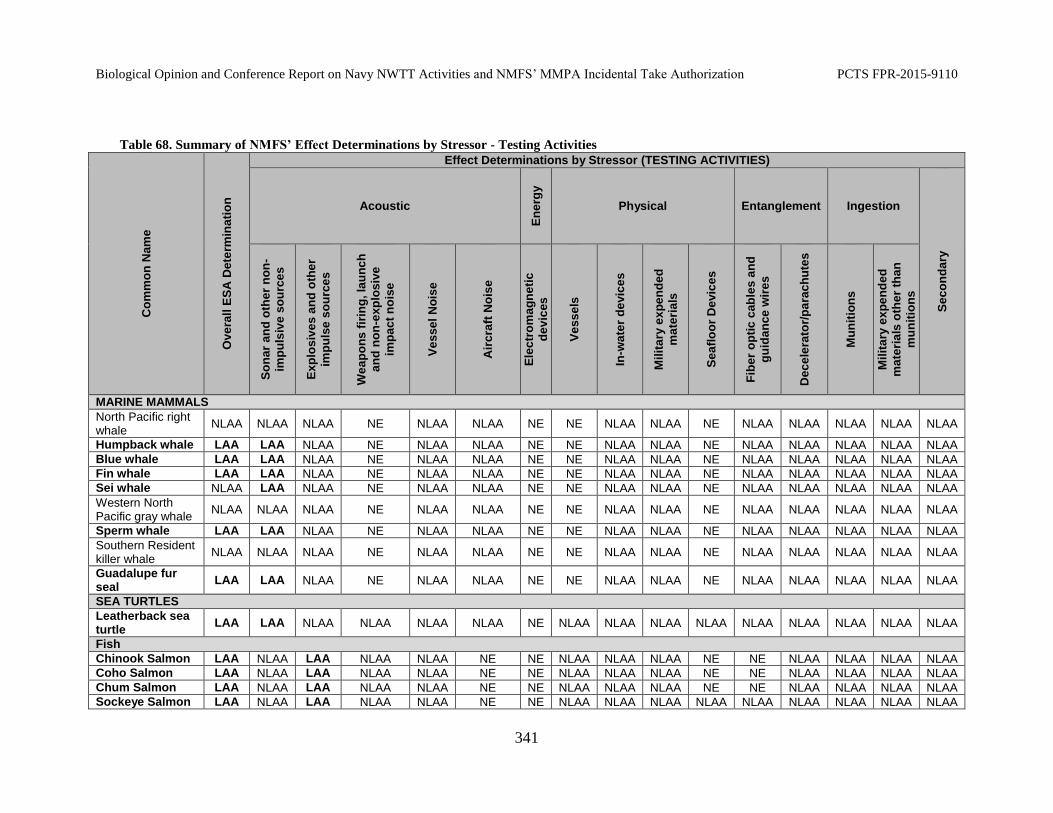
Biological Opinion and Conference Report on Navy NWTT Activities and NMFS’ MMPA Incidental Take Authorization PCTS FPR-2015-9110
Table 68. Summary of NMFS’ Effect Determinations by Stressor - Testing Activities C
om
mo
n N
am
e
Ov
era
ll E
SA
Dete
rmin
ati
on
Effect Determinations by Stressor (TESTING ACTIVITIES)
Acoustic
En
erg
y
Physical Entanglement Ingestion
Se
co
nd
ary
So
na
r a
nd
oth
er
no
n-
imp
uls
ive
so
urc
es
Ex
plo
siv
es a
nd
oth
er
imp
uls
e s
ou
rce
s
We
ap
on
s f
irin
g, la
un
ch
an
d n
on
-ex
plo
siv
e
imp
ac
t n
ois
e
Ve
ss
el
No
ise
Air
cra
ft N
ois
e
Ele
ctr
om
ag
ne
tic
de
vic
es
Ve
ss
els
In-w
ate
r d
evic
es
Mil
ita
ry e
xp
en
de
d
ma
teri
als
Se
afl
oo
r D
evic
es
Fib
er
op
tic
cab
les a
nd
gu
ida
nce
wir
es
Dec
ele
rato
r/p
ara
ch
ute
s
Mu
nit
ion
s
Mil
ita
ry e
xp
en
de
d
ma
teri
als
oth
er
tha
n
mu
nit
ion
s
MARINE MAMMALS
North Pacific right whale
NLAA NLAA NLAA NE NLAA NLAA NE NE NLAA NLAA NE NLAA NLAA NLAA NLAA NLAA
Humpback whale LAA LAA NLAA NE NLAA NLAA NE NE NLAA NLAA NE NLAA NLAA NLAA NLAA NLAA
Blue whale LAA LAA NLAA NE NLAA NLAA NE NE NLAA NLAA NE NLAA NLAA NLAA NLAA NLAA
Fin whale LAA LAA NLAA NE NLAA NLAA NE NE NLAA NLAA NE NLAA NLAA NLAA NLAA NLAA
Sei whale NLAA LAA NLAA NE NLAA NLAA NE NE NLAA NLAA NE NLAA NLAA NLAA NLAA NLAA
Western North Pacific gray whale
NLAA NLAA NLAA NE NLAA NLAA NE NE NLAA NLAA NE NLAA NLAA NLAA NLAA NLAA
Sperm whale LAA LAA NLAA NE NLAA NLAA NE NE NLAA NLAA NE NLAA NLAA NLAA NLAA NLAA
Southern Resident killer whale
NLAA NLAA NLAA NE NLAA NLAA NE NE NLAA NLAA NE NLAA NLAA NLAA NLAA NLAA
Guadalupe fur seal
LAA LAA NLAA NE NLAA NLAA NE NE NLAA NLAA NE NLAA NLAA NLAA NLAA NLAA
SEA TURTLES
Leatherback sea turtle
LAA LAA NLAA NLAA NLAA NLAA NE NLAA NLAA NLAA NLAA NLAA NLAA NLAA NLAA NLAA
Fish
Chinook Salmon LAA NLAA LAA NLAA NLAA NE NE NLAA NLAA NLAA NE NE NLAA NLAA NLAA NLAA
Coho Salmon LAA NLAA LAA NLAA NLAA NE NE NLAA NLAA NLAA NE NE NLAA NLAA NLAA NLAA
Chum Salmon LAA NLAA LAA NLAA NLAA NE NE NLAA NLAA NLAA NE NE NLAA NLAA NLAA NLAA
Sockeye Salmon LAA NLAA LAA NLAA NLAA NE NE NLAA NLAA NLAA NLAA NLAA NLAA NLAA NLAA NLAA
341
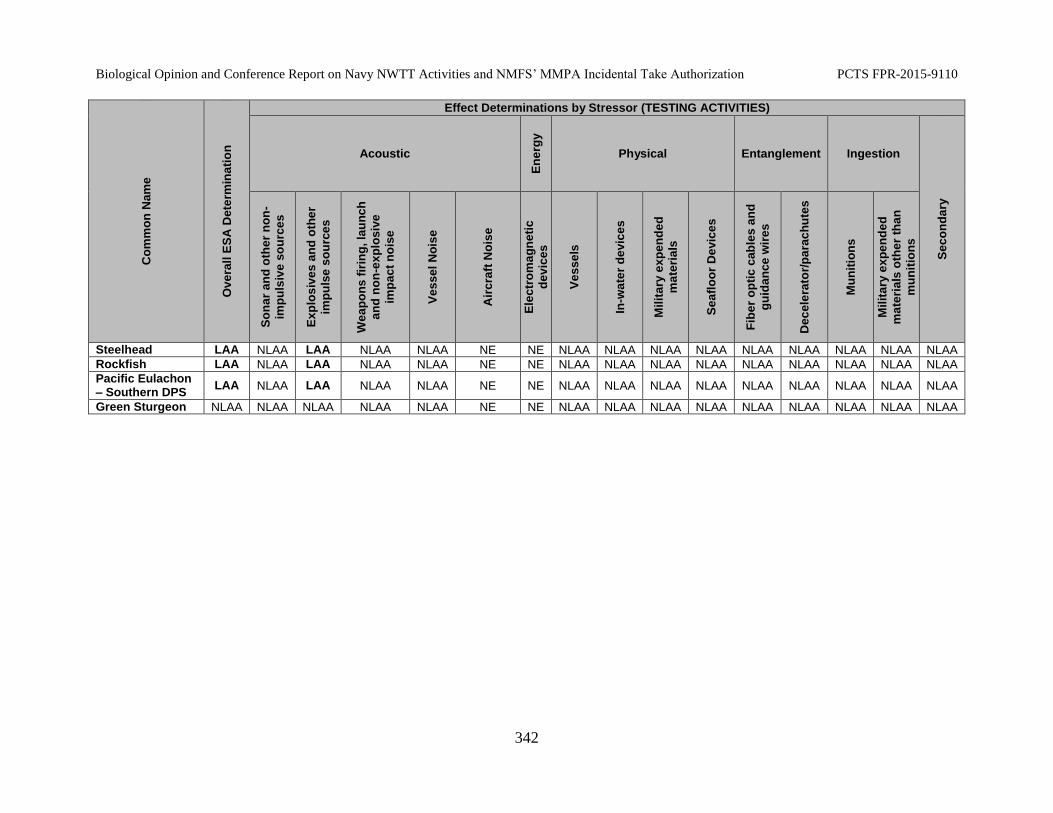
Biological Opinion and Conference Report on Navy NWTT Activities and NMFS’ MMPA Incidental Take Authorization PCTS FPR-2015-9110
Co
mm
on
Nam
e
Ov
era
ll E
SA
Dete
rmin
ati
on
Effect Determinations by Stressor (TESTING ACTIVITIES)
Acoustic
En
erg
y
Physical Entanglement Ingestion
Se
co
nd
ary
So
na
r a
nd
oth
er
no
n-
imp
uls
ive
so
urc
es
Ex
plo
siv
es a
nd
oth
er
imp
uls
e s
ou
rce
s
We
ap
on
s f
irin
g, la
un
ch
an
d n
on
-ex
plo
siv
e
imp
ac
t n
ois
e
Ve
ss
el
No
ise
Air
cra
ft N
ois
e
Ele
ctr
om
ag
ne
tic
de
vic
es
Ve
ss
els
In-w
ate
r d
evic
es
Mil
ita
ry e
xp
en
de
d
ma
teri
als
Se
afl
oo
r D
evic
es
Fib
er
op
tic
cab
les a
nd
gu
ida
nce
wir
es
Dec
ele
rato
r/p
ara
ch
ute
s
Mu
nit
ion
s
Mil
ita
ry e
xp
en
de
d
ma
teri
als
oth
er
tha
n
mu
nit
ion
s
Steelhead LAA NLAA LAA NLAA NLAA NE NE NLAA NLAA NLAA NLAA NLAA NLAA NLAA NLAA NLAA
Rockfish LAA NLAA LAA NLAA NLAA NE NE NLAA NLAA NLAA NLAA NLAA NLAA NLAA NLAA NLAA
Pacific Eulachon – Southern DPS
LAA NLAA LAA NLAA NLAA NE NE NLAA NLAA NLAA NLAA NLAA NLAA NLAA NLAA NLAA
Green Sturgeon NLAA NLAA NLAA NLAA NLAA NE NE NLAA NLAA NLAA NLAA NLAA NLAA NLAA NLAA NLAA
342
Biological Opinion and Conference Report on Navy NWTT Activities and NMFS’ MMPA Incidental Take
Authorization PCTS FPR-2015-9110
6.2 Stressors Not Likely to Adversely Affect ESA-listed Species
The following section discusses stressors that are not likely to adversely affect ESA-listed
species. If a stressor is likely to adversely affect any of the ESA-listed species in the NWTT
Action Area, it is carried forward in our effects analysis.
6.2.1 Vessel Strike
There has never been a vessel strike to a whale during any of the training or testing activities
proposed in the NWTT Action Area. There has been only one whale strike in the Pacific
Northwest by the Navy since such records have been kept (June 1994 to present). In August
2012, a San Diego homeported DDG at-sea about 35 nm west of Coos Bay, Oregon struck a
whale while transiting to San Diego after visiting Seattle for a Fleet Week celebration. The whale
(believed to be a minke whale) was last seen swimming away from the location. The fate of the
animal is unknown and although no blood or other obvious indications of injury to the whale
were detected, this does not negate the possibility that there may have been serious internal
injury to the whale resulting from the encounter. Given the only documented Naval vessel whale
strike in the Pacific Northwest since 1994 did not occur as part of training and testing and was
not believed to be an ESA-listed whale, strikes of ESA-listed whales associated with NWTT
activities is not reasonably certain to occur. The training and testing activities proposed that
involve vessel movement are described in Chapter 2 (Description of Proposed Action and
Alternatives) of the Final EIS/OEIS. Activities involving vessel movement would be widely
dispersed throughout the Action Area.
Vessel strikes from commercial, recreational, and Navy vessels are known to affect large whales
and have resulted in serious injury and occasional fatalities to cetaceans (Berman-Kowalewski et
al. 2010; Calambokidis 2012; Douglas et al. 2008b; Laggner 2009; Lammers et al. 2003).
Reviews of the literature on ship strikes mainly involve collisions between commercial vessels
and whales (e.g., Laist et al. (2001), Jensen and Silber (2004b)). The ability of any ship to detect
a marine mammal and avoid a collision depends on a variety of factors, including environmental
conditions, ship design, size, speed, and manning, as well as the behavior of the animal. Records
of collisions date back to the early 17th century, and the worldwide number of collisions appears
to have increased steadily during recent decades (Laist et al. 2001; Ritter 2012).
Vessel speed, size and mass are all important factors in determining potential impacts of a vessel
strike to marine mammals. For large vessels, speed and angle of approach can influence the
severity of a strike. Based on modeling, Silber et al. (2010) found that whales at the surface
experienced impacts that increased in magnitude with the ship’s increasing speed. Results of the
study also indicated that potential impacts were not dependent on the whale’s orientation to the
path of the ship, but that vessel speed may be an important factor. At ship speeds of 15 knots or
higher (7.7 m/second), there was a marked increase in intensity of centerline impacts to whales.
343
Biological Opinion and Conference Report on Navy NWTT Activities and NMFS’ MMPA Incidental Take
Authorization PCTS FPR-2015-9110
Results also indicated that when the whale was below the surface (about one to two times the
vessel draft), there was a pronounced propeller suction effect. This suction effect may draw the
whale into the hull of the ship, increasing the probability of propeller strikes (Silber et al. 2010).
Key points in discussion of participating vessels in relationship to potential ship strike include:
¨ Many military ships have their bridges positioned closer to the bow, offering better
visibility ahead of the ship (compared to a commercial merchant vessel).
¨ There are often aircraft associated with the training or testing activity, which can more
readily detect cetaceans in the vicinity of a vessel or ahead of a vessel’s present course
before crew on the vessel would be able to detect them.
¨ Military ships are generally more maneuverable than commercial merchant vessels, and if
cetaceans are spotted in the path of the ship, would be capable of changing course more
quickly. Military ships operate at the slowest speed possible consistent with either transit
needs or training or testing needs. While minimum speed is intended as a fuel
conservation measure particular to a certain ship class, secondary benefits include better
ability to spot and avoid objects in the water including marine mammals. In addition, a
standard operating procedure for Navy vessels is to maneuver the vessel to maintain a
distance of at least 500 yd. (457 m) from any observed whale and to avoid approaching
whales head-on, as long as safety of navigation is not imperiled.
¨ The crew size on military vessels is generally larger than merchant ships, allowing for the
possibility of stationing more trained Lookouts on the bridge. At all times when vessels
are underway, trained Lookouts and bridge navigation teams are used to detect objects on
the surface of the water ahead of the ship, including cetaceans. Additional Lookouts,
beyond those already stationed on the bridge and on navigation teams, are positioned as
Lookouts during some training events.
¨ Lookouts receive extensive training including Marine Species Awareness Training,
which instructs Lookouts to recognize marine species detection cues (e.g., floating
vegetation or flocks of seabirds) as well as provides additional information to aid in the
detection of cetaceans.
While it is possible for a Navy vessel to strike a cetacean during the course of training and
testing activities in NWTT Action Area, we do not believe this is reasonably certain to occur. As
stated previously, the Navy has been training in the Action Area for years and no such incident
has occurred. Additionally, the Navy employs minimization measures to reduce the likelihood
for a surface vessel to strike a large whale.
Given the low abundance of leatherback sea turtles in the Action Area (particularly in inland
waters where vessel traffic is most concentrated), the low number of vessels associated with
NWTT activities (relative to commercial traffic in the area and relative to the amount of Navy
vessel traffic in other training ranges where strikes have been documented such as the HSTT
Study Area), the use of strike mitigation measures, the potential for the bow wave of large
vessels to preclude a vessel strike, and the lack of documented cases of Navy vessels in the
NWTT Action Area striking a leatherback sea turtle, the likelihood of a Navy vessel associated
344

Biological Opinion and Conference Report on Navy NWTT Activities and NMFS’ MMPA Incidental Take
Authorization PCTS FPR-2015-9110
with NWTT activities to strike a leatherback sea turtle is so low as to be discountable.
Consequently, NMFS has determined that the likelihood of vessel strike during training and
testing over the five-year period of the MMPA rule and continuing into the reasonably
foreseeable future is sufficiently low to be discountable and therefore is not discussed further in
this Opinion.
6.2.2 Effects of Weapons Firing, Launch and Impact Noise
Ship fired munitions can create blast waves from the gun muzzle and along the trajectory of the
shell but it is expected the noise will only be detectable to marine mammals and sea turtles
within a very small footprint along the trajectory. Aircraft fired munitions are not expected to
have sound waves emanating from the firing source that would be of sufficient intensity to
propagate a sound wave into the water. Non-explosive ordnance can also impact the water with
substantial force and produce loud noises but no TTS exposures of ESA-listed marine mammals
are predicted by Navy modeling efforts. Marine mammals, sea turtles, and ESA-listed fish within
the audible range of activities involving weapons firing, launch, and impact noise may exhibit a
behavioral startle response but are expected to quickly return to normal behavior. Activities
involving weapons firing, launch, and impact noise are sporadic events of short duration
reducing the likelihood of subjecting individual marine mammals, sea turtles, or ESA-listed fish
to prolonged or repeated exposures. Due to the short duration and sporadic nature of munition
firing, the low likelihood that an ESA-listed animal would be in close enough proximity to detect
sound from munition firing above water, and the high likelihood that an ESA-listed animal able
to detect noise from weapons firing would react very briefly, an increase in the likelihood of
injury from significant disruption of breeding, feeding, or sheltering for ESA-listed marine
mammals and sea turtles. Therefore, the effects of weapons firing, launch, and impact noise on
ESA-listed marine mammals, sea turtles, and ESA-listed fish would not rise to the level of take
and any behavioral impacts would be insignificant.
6.2.3 Effects of Aircraft Noise
Studies have shown that aircraft presence and operation can result in changes in behavior of
cetaceans (Arcangeli and Crosti 2009; Holt et al. 2009b; Luksenburg and Parsons 2009b; Noren
et al. 2009; Patenaude et al. 2002; Richter et al. 2006; Richter et al. 2003b; Smultea et al. 2008).
Many of the activities the U.S. Navy conducts in the NWTT Action Area involve some level of
activity from aircraft that include helicopters, maritime patrols, and fighter jets. Low-flying
aircraft produce sounds that marine mammals can hear when they occur at or near the ocean’s
surface. Helicopters generally tend to produce sounds that can be heard at or below the ocean’s
surface more than fixed-wing aircraft of similar size and larger aircraft tend to be louder than
smaller aircraft. Underwater sounds from aircraft are strongest just below the surface and directly
under the aircraft. Sounds from aircraft would not have physical effects on marine mammals but
345
Biological Opinion and Conference Report on Navy NWTT Activities and NMFS’ MMPA Incidental Take
Authorization PCTS FPR-2015-9110
represent acoustic stimuli (primarily low-frequency sounds from engines and rotors) that have
been reported to affect the behavior of some marine mammals and sea turtles.
We did not estimate the number of endangered or threatened species that are likely to be exposed
to noise from aircraft overflight, take-offs and landings from carriers, or other fixed or rotary-
wing aircraft operations at altitudes low enough for the sounds to be salient at or immediately
below the ocean’s surface. Nevertheless, we assume any ESA-listed species that occur in the
Action Area during training exercises and testing activities that involve aircraft are likely to be
exposed to minor acoustic stimuli associated with aircraft traffic.
Several authors have reported that sperm whales did not react to fixed-wing aircraft or
helicopters in some circumstances (Au and Perryman 1982b; Clarke 1956b; Gambell 1968;
Green et al. 1992a) and reacted in others (Clarke 1956b; Fritts et al. 1983; Mullin et al. 1991;
Patenaude et al. 2002; Richter et al. 2006; Richter et al. 2003a; Smultea et al. 2008; Wursig et al.
1998). Richardson et al. (1985b) reported that bowhead whales responded behaviorally to fixed-
wing aircraft that were used in their surveys and research studies when the aircraft were less than
457 m above sea level; their reactions were uncommon at 457 m, and were undetectable above
610 meters. They also reported that bowhead whales did not respond behaviorally to helicopter
overflights at about 153 m above sea level.
Smultea et al. (2008) studied the response of sperm whales to low-altitude (233 to 269 m) flights
by a small fixed-wing airplane near Kauai and reviewed data available from other studies. They
concluded that sperm whales responded behaviorally to aircraft passes in about 12 percent of
encounters. All of the reactions consisted of sudden dives and occurred when the aircraft was
less than 360 m from the whales (lateral distance). They concluded that the sperm whales had
perceived the aircraft as a predatory stimulus and responded with defensive behavior. In at least
one case, Smultea et al. (2008) reported that the sperm whales formed a semi-circular “fan”
formation that was similar to defensive formations reported by other investigators.
In a review of aircraft noise effects on marine mammals, Luksenburg and Parsons (2009a)
determined that the sensitivity of whales and dolphins to aircraft noise may depend on the
animals’ behavioral state at the time of exposure (e.g. resting, socializing, foraging or travelling)
as well as the altitude and lateral distance of the aircraft to the animals. While resting animals
seemed to be disturbed the most, low flying aircraft with close lateral distances over shallow
water elicited stronger disturbance responses than higher flying aircraft with greater lateral
distances over deeper water ((Patenaude et al. 2002; Smultea et al. 2008) in Luksenburg and
Parsons (2009a)).
Thorough reviews on the behavioral reactions of marine mammals to aircraft and missile
overflight are presented in Richardson et al. (1995d), Efroymson et al. (2000), Luksenburg and
Parsons (2009b), and Holst et al. (2011). The most common responses of cetaceans to aircraft
346
Biological Opinion and Conference Report on Navy NWTT Activities and NMFS’ MMPA Incidental Take
Authorization PCTS FPR-2015-9110
overflights were short surfacing durations, abrupt dives, and percussive behavior (breaching and
tail slapping) (Nowacek et al. 2007). Other behavioral responses such as flushing and fleeing the
area of the source of the noise have also been observed (Holst et al. 2011; Manci et al. 1988).
Richardson et al. (1995d) noted that marine mammal reactions to aircraft overflight largely
consisted of opportunistic and anecdotal observations. These observations lack a clear distinction
between reactions potentially caused by the noise of the aircraft and the visual cue an aircraft
presents. In addition, it was suggested that variations in the responses noted were due to other
undocumented factors associated with overflight (Richardson et al. 1995d). These factors could
include aircraft type (single engine, multi-engine, jet turbine), flight path (centered on the animal,
off to one side, circling, level and slow), environmental factors such as wind speed, sea state,
cloud cover, and locations where native subsistence hunting continues.
6.2.3.1 Mysticetes
Mysticetes either ignore or occasionally dive in response to aircraft overflights (Efroymson et al.
2000; Koski et al. 1998). Richardson et al. (1995d) reported that while data on the reactions of
mysticetes is meager and largely anecdotal, there is no evidence that single or occasional aircraft
flying above mysticetes causes long-term displacement of these mammals. In general, overflights
above 1,000 ft. (305 m) do not cause a reaction.
Bowhead whales in the Beaufort Sea exhibited a transient behavioral response to fixed-wing
aircraft and vessels. Reactions were frequently observed at less than 1,000 ft. (305 m) above sea
level, infrequently observed at 1,500 ft. (457 m), and not observed at 2,000 ft. (610 m) above sea
level (Richardson et al. 1995d). Bowhead whales reacted to helicopter overflights by diving,
breaching, changing direction or behavior, and altering breathing patterns. Behavioral reactions
decreased in frequency as the altitude of the helicopter increased to 492 ft. (150 m) or higher. It
should be noted that bowhead whales may have more acute responses to anthropogenic activity
than many other marine mammals since these animals are often presented with limited egress due
to limited open water between ice floes. Additionally, many of these animals may be hunted by
Alaska Natives, which could lead to animals developing additional sensitivity to human noise and
presence.
6.2.3.2 Odontocetes
Variable responses to aircraft have been observed in toothed whales, though overall little change
in behavior has been observed during flyovers. Toothed whale responses to aircrafts include
diving, slapping the water with their flukes or flippers, swimming away from the direction of the
aircraft, or not visibly reacting (Richardson et al. 1995d).
During standard marine mammal surveys at an altitude of 750 ft. (229 m), some sperm whales
remained on or near the surface the entire time the aircraft was in the vicinity, while others dove
347
Biological Opinion and Conference Report on Navy NWTT Activities and NMFS’ MMPA Incidental Take
Authorization PCTS FPR-2015-9110
immediately or a few minutes after being sighted. Other authors have corroborated the variability
in sperm whales’ reactions to fixed-wing aircraft or helicopters (Green et al. 1992b; Richter et al.
2006; Richter et al. 2003b; Smultea et al. 2008; Wursig et al. 1998). In one study, sperm whales
showed no reaction to a helicopter until they encountered the downdrafts from the rotors
(Richardson et al. 1995d). A group of sperm whales responded to a circling aircraft (altitude of
800 to 1,100 ft. [244 to 335 m]) by moving closer together and forming a defensive fan-shaped
semicircle, with their heads facing outward. Several individuals in the group turned on their
sides, apparently to look up toward the aircraft (Smultea et al. 2008). Whale-watching aircraft
apparently caused sperm whales to turn more sharply but did not affect blow interval, surface
time, time to first click, or the frequency of aerial behavior (Richter et al. 2003b). Navy aircraft
do not fly at low altitude, hover over, or follow whales and so are not expected to evoke this type
of response.
Smaller delphinids generally react to overflights either neutrally or with a startle response
(Wursig et al. 1998). The same species that show strong avoidance behavior to vessel traffic
(Kogia species and beaked whales) also react to aircraft (Wursig et al. 1998). Beluga whales
reacted to helicopter overflights by diving, breaching, changing direction or behavior, and
altering breathing patterns to a greater extent than mysticetes in the same area (Patenaude et al.
2002). These reactions increased in frequency as the altitude of the helicopter dropped below 492
ft. (150 m).
6.2.3.3 Sea Turtles
Based on sea turtle sensory biology (Bartol et al. 1999b; Ketten and Bartol 2005; Ketten and
Bartol 2006; Lenhardt et al. 1994a; Ridgway et al. 1969), sound from low flying aircraft could be
heard by a sea turtle at or near the surface. Turtles might also detect low flying aircraft via visual
cues such as the aircraft's shadow. Hazel et al. (2007) suggested that green turtles rely more on
visual cues than auditory cues when reacting to approaching water vessels. This suggests that sea
turtles might not respond to aircraft overflights based on noise alone. Based on limited
morphological and scientific study, ESA-listed fish are likely less sensitive to above-water
acoustic noise, such as that originating from aircraft, than marine mammals.
6.2.3.4 Conclusion
In conclusion, the low number of aircraft flights, typical altitudes of flights, sporadic occurrence
of flights, limited duration of flights, and the lack of substantial sound propagation into the water
column from aircraft indicates there is a low probability of exposing marine mammals, sea
turtles, and ESA-;listed fish to aircraft noise at perceivable levels. In the event an ESA-listed
species was exposed to aircraft noise, it would likely result in temporary behavioral responses.
These behavioral responses would not increase the likelihood of injury from significantly
disrupting breeding, feeding, or sheltering and would not rise to the level of take. Therefore, the
348
Biological Opinion and Conference Report on Navy NWTT Activities and NMFS’ MMPA Incidental Take
Authorization PCTS FPR-2015-9110
effects of aircraft noise on ESA-listed species is insignificant and not likely to adversely affect
them.
6.2.4 Effects of Vessel Noise
Sounds emitted by large vessels can be characterized as low-frequency, continuous, or tonal, and
sound pressure levels at a source will vary according to speed, burden, capacity and length
(Kipple and Gabriele 2007; McKenna et al. 2012b; Richardson et al. 1995d). Vessels ranging
from 135 to 337 m (Nimitz-class aircraft carriers, for example, have lengths of about 332 m)
generate peak source sound levels from 169 to 200 dB between 8 Hz and 430 Hz. Source levels
for 593 container ship transits were estimated from long-term acoustic recording received levels
in the Santa Barbara shipping channel, and a simple transmission loss model using Automatic
Identification System data for source-receiver range (McKenna et al. 2013). Ship noise levels
could vary 5 to 10 dB depending on transit conditions. Given the sound propagation of low
frequency sounds, a large vessel in this sound range can be heard 139 to 463 km away (Polefka
2004). Hatch et al. (2008) measured commercial ship underwater noise levels and reported
average source level estimates (71 to 141 Hz, root-mean-square pressure re 1 uPa ± SE) for
individual vessels ranged from 158 ± 2 dB (research vessel) to 186 ± 2 dB (oil tanker). McKenna
et al (2012b) in a study off Southern California documented different acoustic levels and spectral
shapes observed from different modern ship-types.
Numerous studies of interactions between surface vessels and marine mammals have
demonstrated that free-ranging marine mammals engage in avoidance behavior when surface
vessels move toward them. It is not clear whether these responses are caused by the physical
presence of a surface vessel, the underwater noise generated by the vessel, or an interaction
between the two (Amaral and Carlson 2005b; Au and Green 2000b; Bain et al. 2006; Bauer
1986; Bejder et al. 1999; Bejder and Lusseau. 2008; Bejder et al. 2009; Bryant et al. 1984;
Corkeron 1995; Erbe 2002b; Félix 2001; Goodwin and Cotton 2004; Lemon et al. 2006; Lusseau
2003; Lusseau 2006; Magalhaes et al. 2002; Nowacek et al. 2001; Richter et al. 2003b; Scheidat
et al. 2004; Simmonds 2005b; Watkins 1986; Williams et al. 2002b; Wursig et al. 1998).
However, several authors suggest that the noise generated during motion is probably an
important factor (Blane and Jaakson 1994; Evans et al. 1992; Evans et al. 1994). These studies
suggest that the behavioral responses of marine mammals to surface vessels are similar to their
behavioral responses to predators.
Based on the suite of studies of cetacean behavior to vessel approaches (Acevedo 1991b; Aguilar
Soto et al. 2006; Arcangeli and Crosti 2009; Au and Perryman 1982a; Au and Green 2000b; Bain
et al. 2006; Bauer and Herman 1986; Bejder et al. 1999; Bejder et al. 2006a; Bejder et al. 2006b;
Bryant et al. 1984; Christiansen et al. 2010; Corkeron 1995; David 2002; Erbe 2002b; Felix
2001; Goodwin and Cotton 2004; Hewitt 1985b; Lusseau 2003; Lusseau 2006; Magalhaes et al.
349
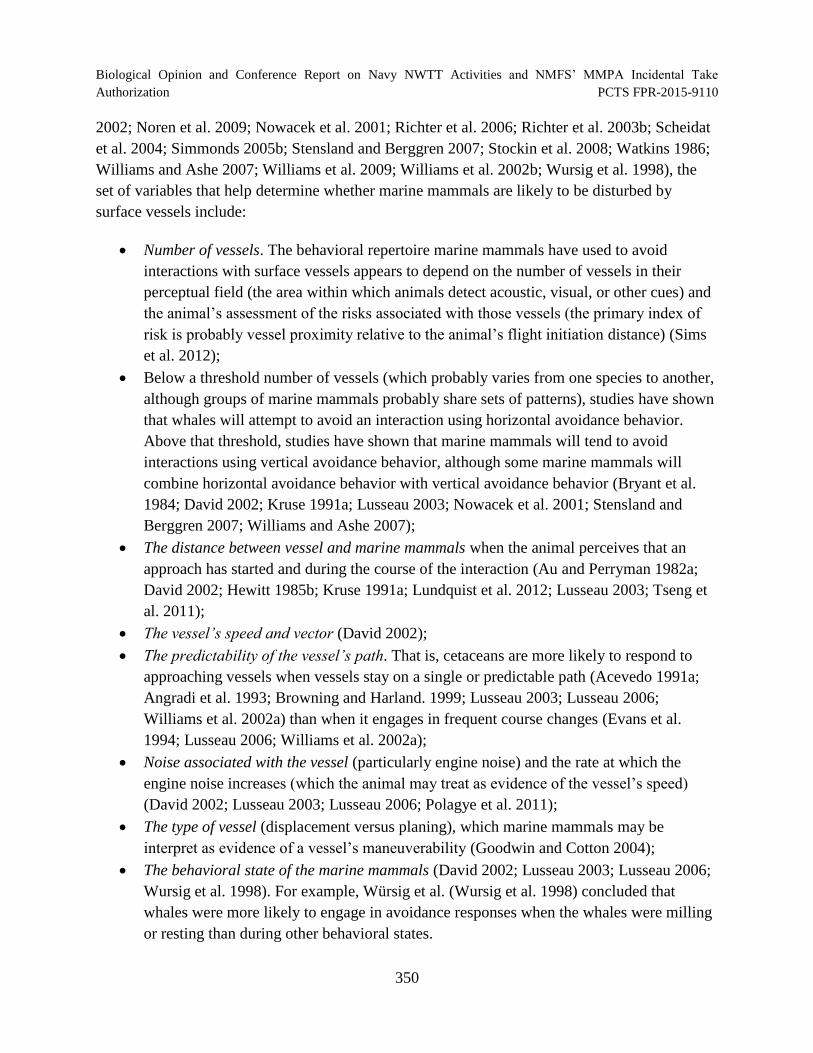
Biological Opinion and Conference Report on Navy NWTT Activities and NMFS’ MMPA Incidental Take
Authorization PCTS FPR-2015-9110
2002; Noren et al. 2009; Nowacek et al. 2001; Richter et al. 2006; Richter et al. 2003b; Scheidat
et al. 2004; Simmonds 2005b; Stensland and Berggren 2007; Stockin et al. 2008; Watkins 1986;
Williams and Ashe 2007; Williams et al. 2009; Williams et al. 2002b; Wursig et al. 1998), the
set of variables that help determine whether marine mammals are likely to be disturbed by
surface vessels include:
Number of vessels. The behavioral repertoire marine mammals have used to avoid
interactions with surface vessels appears to depend on the number of vessels in their
perceptual field (the area within which animals detect acoustic, visual, or other cues) and
the animal’s assessment of the risks associated with those vessels (the primary index of
risk is probably vessel proximity relative to the animal’s flight initiation distance) (Sims
et al. 2012);
Below a threshold number of vessels (which probably varies from one species to another,
although groups of marine mammals probably share sets of patterns), studies have shown
that whales will attempt to avoid an interaction using horizontal avoidance behavior.
Above that threshold, studies have shown that marine mammals will tend to avoid
interactions using vertical avoidance behavior, although some marine mammals will
combine horizontal avoidance behavior with vertical avoidance behavior (Bryant et al.
1984; David 2002; Kruse 1991a; Lusseau 2003; Nowacek et al. 2001; Stensland and
Berggren 2007; Williams and Ashe 2007);
The distance between vessel and marine mammals when the animal perceives that an
approach has started and during the course of the interaction (Au and Perryman 1982a;
David 2002; Hewitt 1985b; Kruse 1991a; Lundquist et al. 2012; Lusseau 2003; Tseng et
al. 2011);
The vessel’s speed and vector (David 2002);
The predictability of the vessel’s path. That is, cetaceans are more likely to respond to
approaching vessels when vessels stay on a single or predictable path (Acevedo 1991a;
Angradi et al. 1993; Browning and Harland. 1999; Lusseau 2003; Lusseau 2006;
Williams et al. 2002a) than when it engages in frequent course changes (Evans et al.
1994; Lusseau 2006; Williams et al. 2002a);
Noise associated with the vessel (particularly engine noise) and the rate at which the
engine noise increases (which the animal may treat as evidence of the vessel’s speed)
(David 2002; Lusseau 2003; Lusseau 2006; Polagye et al. 2011);
The type of vessel (displacement versus planing), which marine mammals may be interpret as evidence of a vessel’s maneuverability (Goodwin and Cotton 2004);
The behavioral state of the marine mammals (David 2002; Lusseau 2003; Lusseau 2006;
Wursig et al. 1998). For example, Würsig et al. (Wursig et al. 1998) concluded that
whales were more likely to engage in avoidance responses when the whales were milling
or resting than during other behavioral states.
350
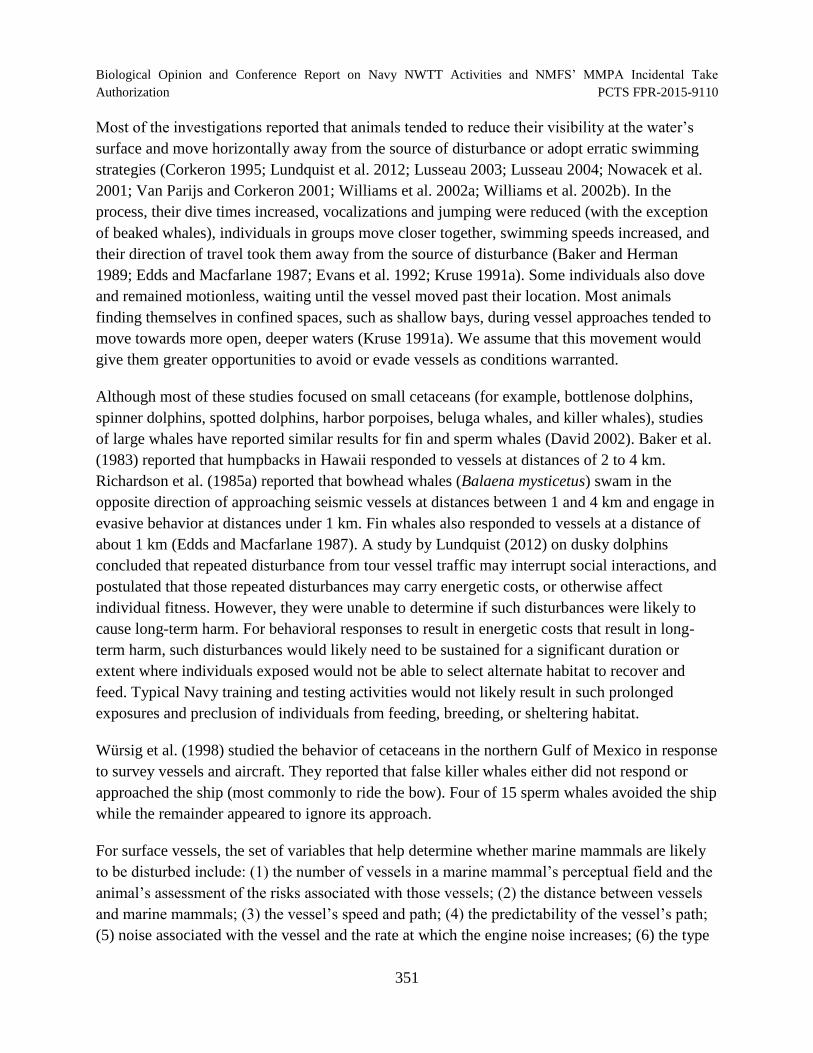
Biological Opinion and Conference Report on Navy NWTT Activities and NMFS’ MMPA Incidental Take
Authorization PCTS FPR-2015-9110
Most of the investigations reported that animals tended to reduce their visibility at the water’s
surface and move horizontally away from the source of disturbance or adopt erratic swimming
strategies (Corkeron 1995; Lundquist et al. 2012; Lusseau 2003; Lusseau 2004; Nowacek et al.
2001; Van Parijs and Corkeron 2001; Williams et al. 2002a; Williams et al. 2002b). In the
process, their dive times increased, vocalizations and jumping were reduced (with the exception
of beaked whales), individuals in groups move closer together, swimming speeds increased, and
their direction of travel took them away from the source of disturbance (Baker and Herman
1989; Edds and Macfarlane 1987; Evans et al. 1992; Kruse 1991a). Some individuals also dove
and remained motionless, waiting until the vessel moved past their location. Most animals
finding themselves in confined spaces, such as shallow bays, during vessel approaches tended to
move towards more open, deeper waters (Kruse 1991a). We assume that this movement would
give them greater opportunities to avoid or evade vessels as conditions warranted.
Although most of these studies focused on small cetaceans (for example, bottlenose dolphins,
spinner dolphins, spotted dolphins, harbor porpoises, beluga whales, and killer whales), studies
of large whales have reported similar results for fin and sperm whales (David 2002). Baker et al.
(1983) reported that humpbacks in Hawaii responded to vessels at distances of 2 to 4 km.
Richardson et al. (1985a) reported that bowhead whales (Balaena mysticetus) swam in the
opposite direction of approaching seismic vessels at distances between 1 and 4 km and engage in
evasive behavior at distances under 1 km. Fin whales also responded to vessels at a distance of
about 1 km (Edds and Macfarlane 1987). A study by Lundquist (2012) on dusky dolphins
concluded that repeated disturbance from tour vessel traffic may interrupt social interactions, and
postulated that those repeated disturbances may carry energetic costs, or otherwise affect
individual fitness. However, they were unable to determine if such disturbances were likely to
cause long-term harm. For behavioral responses to result in energetic costs that result in long
term harm, such disturbances would likely need to be sustained for a significant duration or
extent where individuals exposed would not be able to select alternate habitat to recover and
feed. Typical Navy training and testing activities would not likely result in such prolonged
exposures and preclusion of individuals from feeding, breeding, or sheltering habitat.
Würsig et al. (1998) studied the behavior of cetaceans in the northern Gulf of Mexico in response
to survey vessels and aircraft. They reported that false killer whales either did not respond or
approached the ship (most commonly to ride the bow). Four of 15 sperm whales avoided the ship
while the remainder appeared to ignore its approach.
For surface vessels, the set of variables that help determine whether marine mammals are likely
to be disturbed include: (1) the number of vessels in a marine mammal’s perceptual field and the
animal’s assessment of the risks associated with those vessels; (2) the distance between vessels
and marine mammals; (3) the vessel’s speed and path; (4) the predictability of the vessel’s path;
(5) noise associated with the vessel and the rate at which the engine noise increases; (6) the type
351
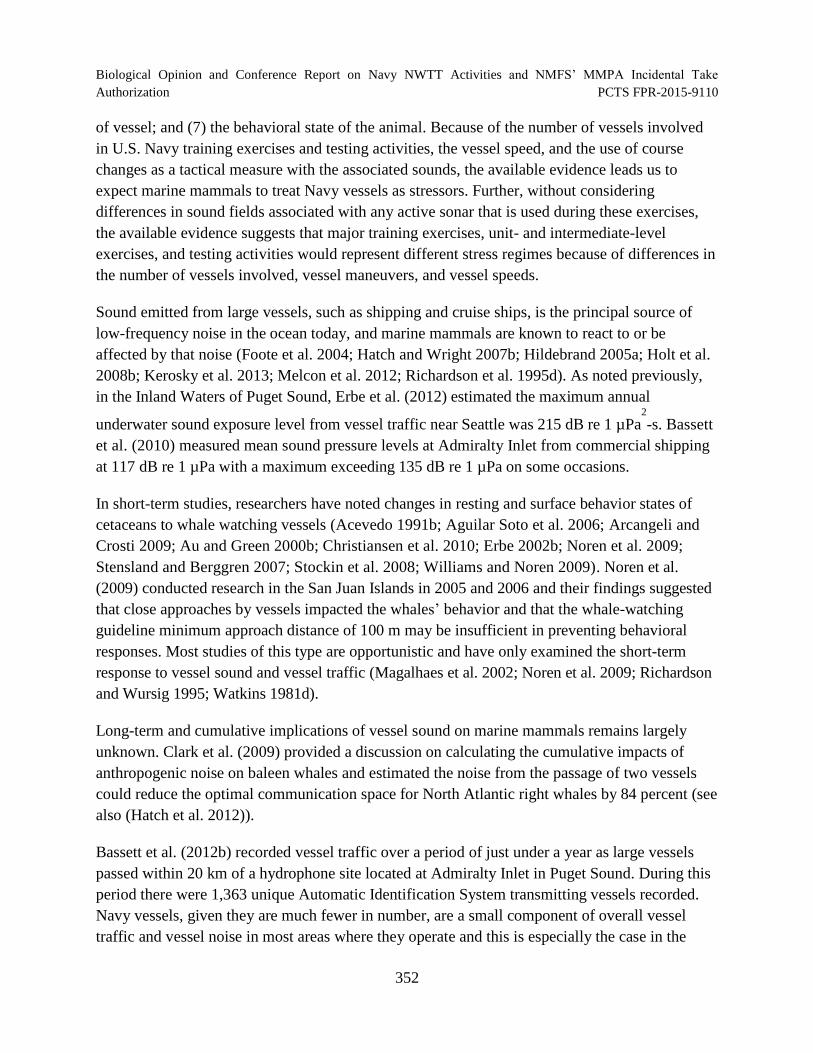
Biological Opinion and Conference Report on Navy NWTT Activities and NMFS’ MMPA Incidental Take
Authorization PCTS FPR-2015-9110
of vessel; and (7) the behavioral state of the animal. Because of the number of vessels involved
in U.S. Navy training exercises and testing activities, the vessel speed, and the use of course
changes as a tactical measure with the associated sounds, the available evidence leads us to
expect marine mammals to treat Navy vessels as stressors. Further, without considering
differences in sound fields associated with any active sonar that is used during these exercises,
the available evidence suggests that major training exercises, unit- and intermediate-level
exercises, and testing activities would represent different stress regimes because of differences in
the number of vessels involved, vessel maneuvers, and vessel speeds.
Sound emitted from large vessels, such as shipping and cruise ships, is the principal source of
low-frequency noise in the ocean today, and marine mammals are known to react to or be
affected by that noise (Foote et al. 2004; Hatch and Wright 2007b; Hildebrand 2005a; Holt et al.
2008b; Kerosky et al. 2013; Melcon et al. 2012; Richardson et al. 1995d). As noted previously,
in the Inland Waters of Puget Sound, Erbe et al. (2012) estimated the maximum annual 2
underwater sound exposure level from vessel traffic near Seattle was 215 dB re 1 µPa -s. Bassett
et al. (2010) measured mean sound pressure levels at Admiralty Inlet from commercial shipping
at 117 dB re 1 µPa with a maximum exceeding 135 dB re 1 µPa on some occasions.
In short-term studies, researchers have noted changes in resting and surface behavior states of
cetaceans to whale watching vessels (Acevedo 1991b; Aguilar Soto et al. 2006; Arcangeli and
Crosti 2009; Au and Green 2000b; Christiansen et al. 2010; Erbe 2002b; Noren et al. 2009;
Stensland and Berggren 2007; Stockin et al. 2008; Williams and Noren 2009). Noren et al.
(2009) conducted research in the San Juan Islands in 2005 and 2006 and their findings suggested
that close approaches by vessels impacted the whales’ behavior and that the whale-watching
guideline minimum approach distance of 100 m may be insufficient in preventing behavioral
responses. Most studies of this type are opportunistic and have only examined the short-term
response to vessel sound and vessel traffic (Magalhaes et al. 2002; Noren et al. 2009; Richardson
and Wursig 1995; Watkins 1981d).
Long-term and cumulative implications of vessel sound on marine mammals remains largely
unknown. Clark et al. (2009) provided a discussion on calculating the cumulative impacts of
anthropogenic noise on baleen whales and estimated the noise from the passage of two vessels
could reduce the optimal communication space for North Atlantic right whales by 84 percent (see
also (Hatch et al. 2012)).
Bassett et al. (2012b) recorded vessel traffic over a period of just under a year as large vessels
passed within 20 km of a hydrophone site located at Admiralty Inlet in Puget Sound. During this
period there were 1,363 unique Automatic Identification System transmitting vessels recorded.
Navy vessels, given they are much fewer in number, are a small component of overall vessel
traffic and vessel noise in most areas where they operate and this is especially the case in the
352
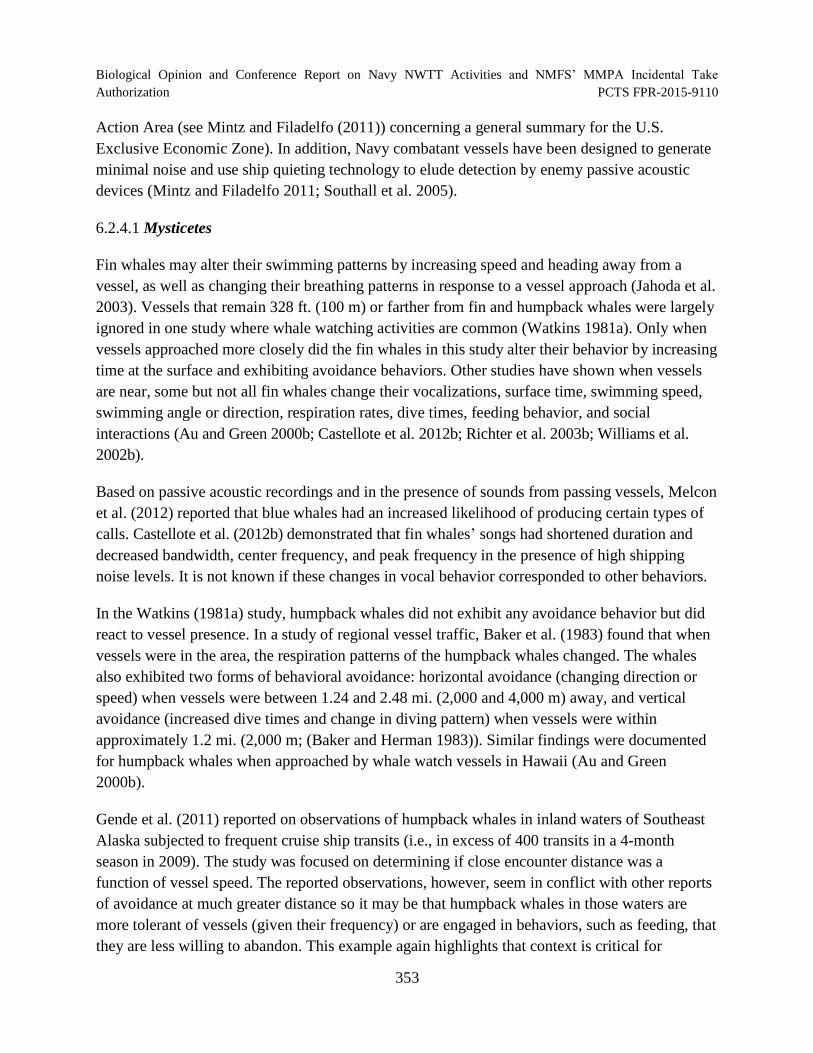
Biological Opinion and Conference Report on Navy NWTT Activities and NMFS’ MMPA Incidental Take
Authorization PCTS FPR-2015-9110
Action Area (see Mintz and Filadelfo (2011)) concerning a general summary for the U.S.
Exclusive Economic Zone). In addition, Navy combatant vessels have been designed to generate
minimal noise and use ship quieting technology to elude detection by enemy passive acoustic
devices (Mintz and Filadelfo 2011; Southall et al. 2005).
6.2.4.1 Mysticetes
Fin whales may alter their swimming patterns by increasing speed and heading away from a
vessel, as well as changing their breathing patterns in response to a vessel approach (Jahoda et al.
2003). Vessels that remain 328 ft. (100 m) or farther from fin and humpback whales were largely
ignored in one study where whale watching activities are common (Watkins 1981a). Only when
vessels approached more closely did the fin whales in this study alter their behavior by increasing
time at the surface and exhibiting avoidance behaviors. Other studies have shown when vessels
are near, some but not all fin whales change their vocalizations, surface time, swimming speed,
swimming angle or direction, respiration rates, dive times, feeding behavior, and social
interactions (Au and Green 2000b; Castellote et al. 2012b; Richter et al. 2003b; Williams et al.
2002b).
Based on passive acoustic recordings and in the presence of sounds from passing vessels, Melcon
et al. (2012) reported that blue whales had an increased likelihood of producing certain types of
calls. Castellote et al. (2012b) demonstrated that fin whales’ songs had shortened duration and
decreased bandwidth, center frequency, and peak frequency in the presence of high shipping
noise levels. It is not known if these changes in vocal behavior corresponded to other behaviors.
In the Watkins (1981a) study, humpback whales did not exhibit any avoidance behavior but did
react to vessel presence. In a study of regional vessel traffic, Baker et al. (1983) found that when
vessels were in the area, the respiration patterns of the humpback whales changed. The whales
also exhibited two forms of behavioral avoidance: horizontal avoidance (changing direction or
speed) when vessels were between 1.24 and 2.48 mi. (2,000 and 4,000 m) away, and vertical
avoidance (increased dive times and change in diving pattern) when vessels were within
approximately 1.2 mi. (2,000 m; (Baker and Herman 1983)). Similar findings were documented
for humpback whales when approached by whale watch vessels in Hawaii (Au and Green
2000b).
Gende et al. (2011) reported on observations of humpback whales in inland waters of Southeast
Alaska subjected to frequent cruise ship transits (i.e., in excess of 400 transits in a 4-month
season in 2009). The study was focused on determining if close encounter distance was a
function of vessel speed. The reported observations, however, seem in conflict with other reports
of avoidance at much greater distance so it may be that humpback whales in those waters are
more tolerant of vessels (given their frequency) or are engaged in behaviors, such as feeding, that
they are less willing to abandon. This example again highlights that context is critical for
353
Biological Opinion and Conference Report on Navy NWTT Activities and NMFS’ MMPA Incidental Take
Authorization PCTS FPR-2015-9110
predicting and understanding behavioral reactions as concluded by Southall et al. (2007b) and
Ellison et al. (2012).
Sei whales have been observed ignoring the presence of vessels and passing close to them
(National Marine Fisheries Service 1993). In the presence of approaching vessels, blue whales
perform shallower dives accompanied by more frequent surfacing, but otherwise do not exhibit
strong reactions (Calambokidis et al. 2009a). Minke whales in the Antarctic did not show any
apparent response to a survey vessel moving at normal cruising speeds (about 12 knots) at a
distance of 5.5 nm; however, when the vessel drifted or moved at very slow speeds (about 1
knot), many whales approached it (Leatherwood et al. 1982a).
Although not expected to be in the NWTT Action Area, North Atlantic right whales tend not to
respond to the sounds of oncoming vessels (Nowacek et al. 2004) and therefore might provide
insight to behavioral responses of other baleen whales. North Atlantic right whales continue to
use habitats in high vessel traffic areas (Nowacek et al. 2004). Studies show that North Atlantic
right whales demonstrate little if any reaction to sounds of vessels approaching or the presence of
the vessels themselves (Nowacek et al. 2004; Terhune and Verboom 1999). Although this may
minimize potential disturbance from passing ships, it does increase the whales’ vulnerability to
potential ship strike. The regulated approach distance for North Atlantic right whales is 500
yards (yd.) (457 m) (NMFS 1997a).
Using historical records, Watkins (1986) showed that the reactions of four species of mysticetes
to vessel traffic and whale watching activities in Cape Cod had changed over the 25-year period
examined (1957 through 1982). Reactions of minke whales changed from initially more positive
reactions, such as coming towards the boat or research equipment to investigate, to more
'uninterested' reactions towards the end of the study. Finback [fin] whales, the most numerous
species in the area, showed a trend from initially more negative reactions, such as swimming
away from the boat with limited surfacing, to more uninterested (ignoring) reactions allowing
boats to approach within 98.4 ft. (30 m). Right whales showed little change over the study period,
with a roughly equal number of reactions judged to be negative and uninterested; no right whales
were noted as having positive reactions to vessels. Humpback whales showed a trend from
negative to positive reactions with vessels during the study period. The author concluded that the
whales had habituated to the human activities over (Watkins 1986).
Mysticetes have been shown to both increase and decrease calling behavior in the presence of
vessel noise. An increase in feeding call rates and repetition by humpback whales in Alaskan
waters was associated with vessel noise (Doyle et al. 2008). Melcon et al. (2012) also recently
documented that blue whales increased the proportion of time spent producing certain types of
calls when vessels were present. Conversely, decreases in singing activity by humpback whales
have been noted near Brazil due to boat traffic (Sousa-Lima and Clark 2008). The Central North
354
Biological Opinion and Conference Report on Navy NWTT Activities and NMFS’ MMPA Incidental Take
Authorization PCTS FPR-2015-9110
Pacific stock of humpback whales is the focus of whale-watching activities in both its feeding
grounds (Alaska) and breeding grounds (Hawaii). Regulations addressing minimum approach
distances and vessel operating procedures are in place in Hawaii, however, there is still concern
that whales may abandon preferred habitats if the disturbance is too high (Allen and Angliss
2010a).
6.2.4.2 Odontocetes
Sperm whales generally react only to vessels approaching within several hundred meters;
however, some individuals may display avoidance behavior, such as quick diving (Magalhaes et
al. 2002; Wursig et al. 1998). One study showed that after diving, sperm whales showed a
reduced timeframe from when they emitted the first click than before vessel interaction (Richter
et al. 2006). Small whale-watching and research vessels generate more noise in higher frequency
bands and are more likely to approach odontocetes directly, and to spend more time near the
individual whale. Reactions to Navy vessels are not well documented, but smaller whale-
watching and research boats have been shown to cause these species to alter their breathing
intervals and echolocation patterns.
Wursig et al. (1998) reported most Kogia species and beaked whales react negatively to vessels
by quick diving and other avoidance maneuvers. Cox et al. (2006) noted very little information is
available on the behavioral impacts of vessels or vessel noise on beaked whales. A single
observation of vocal disruption of a foraging dive by a tagged Cuvier’s beaked whale
documented when a large noisy vessel was opportunistically present, suggests that vessel noise
may disturb foraging beaked whales (Aguilar Soto et al. 2006). Tyack et al. (2011b) noted the
result of a controlled exposure to pseudorandom noise suggests beaked whales would respond to
vessel noise at similar received levels to those noted previously for mid-frequency sonar.
Most delphinids react neutrally to vessels, although both avoidance and attraction behavior is
known (Hewitt 1985a; Wursig et al. 1998). Avoidance reactions include a decrease in resting
behavior or change in travel direction (Bejder et al. 2006a). Incidence of attraction includes
harbor porpoises approaching a vessel and common, rough-toothed, and bottlenose dolphins bow
riding and jumping in the wake of a vessel (Norris and Prescott 1961; Shane et al. 1986) (Ritter
2002; Wursig et al. 1998). A study of vessel reactions by dolphin communities in the eastern
tropical Pacific found that populations that were often the target of tuna purse-seine fisheries
(spotted, spinner and common dolphins) show evasive behavior when approached; however
populations that live closer to shore (within 100 nm; coastal spotted and bottlenose dolphins) that
are not set on by purse-seine fisheries tend to be attracted to vessels (Archer et al. 2010a; Archer
et al. 2010b). Pirotta et al. (2015) quantified the effect of boat disturbance on bottlenose dolphin
foraging and determined that foraging activity was more affected by boat presence than noise
level.
355
Biological Opinion and Conference Report on Navy NWTT Activities and NMFS’ MMPA Incidental Take
Authorization PCTS FPR-2015-9110
Killer whales, the largest of the delphinids, are targeted by numerous small whale-watching
vessels in the Pacific Northwest. For the 2012 season, it was reported that 1,590 vessel incidents
were possible violations of the federal vessel approach regulations or MMPA and ESA laws as
well (Eisenhardt 2013). Research suggests that whale-watching distances may be insufficient to
prevent behavioral disturbances due to vessel noise (Noren et al. 2009). In 2012, there were 79
U.S. and Canadian commercial whale watch vessels in the Haro Strait region (Eisenhardt 2013).
These vessels have measured source levels that ranged from 145 to 169 dB re 1 µPa at 1 m. The
sound they produce underwater has the potential to result in behavioral disturbance, interfere
with communication, and affect the killer whales’ hearing (Erbe 2002b). Killer whales foraged
significantly less and traveled significantly more when boats were within 328 ft. (100 m) (Kruse
1991b; Lusseau et al. 2009; Trites and Bain 2000; Williams and Noren 2009; Williams et al.
2002b). These short-term feeding activity disruptions may have important long-term population-
level effects (Lusseau et al. 2009; Noren et al. 2009). The reaction of the killer whales to whale-
watching vessels may be in response to the vessel pursuing them, rather than to the noise of the
vessel itself, or to the number of vessels in their proximity.
Odontocetes have been shown to make short-term changes to vocal parameters such as intensity
(Holt et al. 2008a) as an immediate response to vessel noise, as well as increase the pitch,
frequency modulation, and length of whistling (May-Collado and Wartzok 2008). Likewise,
modification of multiple vocalization parameters has been shown in belugas residing in an area
known for high levels of commercial traffic. These animals decreased their call rate, increased
certain types of calls, and shifted upward in frequency content in the presence of small vessel
noise (Lesage et al. 1999). Another study detected a measurable increase in the amplitude of
their vocalizations when ships were present (Scheifele et al. 2005). Killer whales off the
northwestern coast of the United States have been observed to increase the duration of primary
calls once a threshold in observed vessel density (e.g., whale watching) was reached, which has
been suggested as a response to increased masking noise produced by the vessels (Foote et al.
2004). On the other hand, long-term modifications to vocalizations may be indicative of a
learned response to chronic noise, or of a genetic or physiological shift in the populations. For
example, the source level of killer whale vocalizations has been shown to increase with higher
background noise levels associated with vessel traffic (Hotchkin and Parks 2013). In addition,
calls with a high-frequency component have higher source levels than other calls, which may be
related to behavioral state, or may reflect a sustained increase in background noise levels (Holt et
al. 2008a).
6.2.4.3 Conclusion
We recognize that Navy vessels almost certainly incorporate quieting technologies that reduce
their acoustic signature (relative to the acoustic signature of similarly sized vessels) in order to
reduce their vulnerability to detection by enemy vessels (Southall 2005). Nevertheless, we do not
356
Biological Opinion and Conference Report on Navy NWTT Activities and NMFS’ MMPA Incidental Take
Authorization PCTS FPR-2015-9110
assume that any quieting technology would be sufficient to prevent marine mammals from
detecting sounds produced by approaching Navy vessels and perceiving those sounds as
predatory stimuli. We also consider evidence that factors other than received sound level,
including the activity state of animals exposed to different sounds, the nature and novelty of a
sound, and spatial relations between sound source and receiving animals (i.e., the exposure
context) strongly affect the probability of a behavioral response (Ellison et al. 2012).
We considered the research and reports cited above and conclude that ESA-listed marine
mammals, sea turtles, ESA-listed fish are likely to either not react or exhibit an avoidance
behavior. Most avoidance responses would consist of slow movements away from vessels the
animals perceive are on an approaching course, perhaps accompanied by slightly longer dives in
marine mammals and turtles. Most of the changes in behavior would consist of a temporary shift
from behavioral states that have low energy requirements (resting or milling) to behavioral states
with higher energy requirements (active swimming or traveling) and then returning to the resting
or milling behavior.
Behavioral disruptions of ESA-listed species resulting from the presence of vessels or
submarines are expected to be temporary. Animals are expected to resume their migration,
feeding, or other behaviors with no significant impact to their breeding, feeding or sheltering.
Marine mammals react to vessels in a variety of ways and seem to be generally influenced by the
activity the marine mammal is engaged in when a vessel approaches (Richardson et al. 1995d).
Some respond negatively by retreating or engaging in antagonistic responses while other animals
ignore the stimulus altogether (Terhune and Verboom 1999; Watkins 1986). Given the short
duration of vessel noise stressors, the infrequency of this stressor, and the temporary nature of
biological responses of marine mammals, sea turtles and ESA-listed fish to this stressor, these
ESA-listed species are either not likely to respond or are not likely to respond in ways that might
be adverse (the responses might represent an approach or attentive movement, a small change in
orientation in the waters, etc.).
In conclusion, ESA-listed species are either not likely to respond to vessel noise or are not likely
to measurably respond in ways that would significantly disrupt normal behavior patterns which
include, but are not limited to, breeding, feeding or sheltering. Therefore, the effects of noise
from Navy vessels on ESA-listed species would not rise to the level of take and is considered
insignificant.
6.2.5 Effects of Fiber Optic Cables, Guidance Wires, and Decelerators/Parachutes from
Entanglement
Expended materials from U.S. Navy training and testing may pose a risk of entanglement or
ingestion to marine mammals, sea turtles, and ESA-listed fish in the NWTT Action Area. These
interactions could occur at the sea surface, in the water column, or on the seafloor. Similar to
357
Biological Opinion and Conference Report on Navy NWTT Activities and NMFS’ MMPA Incidental Take
Authorization PCTS FPR-2015-9110
interactions with other types of marine debris (e.g., fishing gear, plastics), interactions with
military expended materials could result in negative sub-lethal effects, mortality, or result in no
impact.
Expended materials from Navy training and testing may include the following: fiber optic cables,
guidance wires, parachutes, 55 gallon drums, sonobuoy tubes, unrecovered aircraft stores (e.g.,
fuel tanks, carriages, dispensers, racks), ship hulks, and targets. At-sea targets are usually
remotely-operated airborne, surface, or subsurface traveling units, most of which are designed to
be recovered for reuse. However, if they are used during activities that utilize high-explosives,
they may fragment. Expendable targets that may fragment include air-launched decoys, surface
targets (such as marine markers, paraflares, cardboard boxes, and 10 ft. diameter red balloons),
and mine shapes. Most expended materials and target fragments are expected to sink quickly to
the seafloor. Floating material, such as Styrofoam, may be lost from target boats and remain at
the surface for some time.
There has never been a reported or recorded instance of marine mammals or sea turtles entangled
in military expended materials. Though there is a potential for ESA-listed species to encounter
military expended material, given the large geographic area involved, and the presumably low
densities of threatened or endangered species in the NWTT Action Area, we do not believe such
interactions are likely to occur. Additionally, most expended materials are expected to sink upon
release, and relatively few ESA-listed animals feed in the deepwater benthic habitats where most
expended materials are likely to settle. While disturbance or strike from any expended material
as it falls through the water column is possible, it is not likely because the objects will slow in
velocity as they sink toward the bottom (e.g., guidance wires sink at an estimated rate of 0.7 ft.
[0.2 m] per second), and can be avoided by highly mobile organisms such as marine mammals,
fish (e.g., salmon, eulachon, rockfish), and sea turtles. Bottom feeding animals have an increased
likelihood of encountering expended materials because they may find them during feeding long
after the training or testing event has occurred. If encountered, foraging animals may ingest the
item or become entangled by it.
If encountered, it is unlikely that an animal would get entangled in a fiber optic cable, guidewire,
parachute, or other expended material while it was sinking or upon settling to the seafloor. An
animal would have to swim through loops or become twisted within the cable or wire to become
entangled, and given the properties of the expended cables and wires (low breaking strength and
sinking rates) the probability of injury or mortality from expended materials is low. Specifically,
fiber optic cable is brittle and would be expected to break if kinked, twisted or sharply bent.
Thus, the physical properties of the fiber optic cable would not allow the cable to loop, greatly
reducing the likelihood of entanglement of ESA-listed species. Based on degradation times,
guidance wires would break down within one to two years and no longer pose an entanglement
risk. The length of the guidance wires vary, but greater lengths increase the likelihood that a
358
Biological Opinion and Conference Report on Navy NWTT Activities and NMFS’ MMPA Incidental Take
Authorization PCTS FPR-2015-9110
marine mammal or sea turtle could become entangled. Parachutes used by the Navy range in size
from 18 to 48 in. (46 to 122 cm), but the vast majority of expended decelerator/parachutes are
small (18 in.) cruciform shaped decelerators used with sonobuoys. They have short attachment
lines and, upon water impact, may remain at the surface for 5 to 15 seconds before the
decelerator/parachute and its housing sink to the seafloor. Entanglement of an animal in a
parachute assembly at the surface or within the water column would be unlikely, since the
parachute would have to land directly on an animal, or an animal would have to swim into it
before it sinks. It is possible that a bottom feeding animal (e.g., sperm whale, sea turtle) could
become entangled when they are foraging in areas where parachutes have settled on the seafloor.
For example, if bottom currents are present, the canopy may temporarily billow and pose a
greater entanglement threat. However, the likelihood of currents causing a billowing of a
parachute and being encountered by an ESA-listed species is so unlikely as to be considered
discountable.
In conclusion, based on their deep-water location of use, their sinking rate, their degradation rate,
and the presumably low density of ESA-listed species, the likelihood of ESA-listed species
becoming entangled in expended materials is so low as to be discountable. Therefore,
entanglement is not likely to adversely affect ESA-listed species.
6.2.6 Effects of Munitions and Other Military Expended Materials from Ingestion
The only munitions and other materials small enough to be ingested by ESA-listed marine
mammals, sea turtles, and ESA-listed fish are small- and medium-caliber projectiles, broken
pieces of firing targets, chaff, flare caps, decelerators/parachutes, and shrapnel fragments from
explosive ordnance. Most expendable materials will be used over deep water and these items will
sink quickly and settle on the seafloor with the exception of chaff and some firing target
materials. Given the limited time most items will spend in the water column it is not reasonably
expected these items will be accidentally ingested by ESA-listed species not accustomed to
foraging on the sea floor. The ESA-listed species potentially exposed to expended munitions and
shrapnel fragments while foraging on the sea floor is limited to sperm whales. Sperm whales are
capable of foraging along the sea floor in deep water. However, the relatively low density of both
sperm whales and expended materials along the vast sea floor suggests ingestion would be rare.
In cases where sperm whales, sea turtles, and ESA-listed fish do accidentally ingest expended
materials small enough to be eaten it is likely they will pass through the digestive tract and not
result in an increased likelihood of injury from significant disruption of breeding, feeding, or
sheltering.
Chaff is composed of fine fibers of silicon dioxide coated with aluminum alloy. Due to their light
weight and small size they float and can be carried great distances in both air and water currents.
Their dispersal in wind and water results in chaff fibers likely occur in low densities on the ocean
359
Biological Opinion and Conference Report on Navy NWTT Activities and NMFS’ MMPA Incidental Take
Authorization PCTS FPR-2015-9110
surface. Given the small size, low densities, and low toxicity of chaff, any accidental ingestion
by ESA-listed species feeding at the ocean surface is not expected to result in an increased
likelihood of injury from significant disruption of breeding, feeding, or sheltering. Firing target
materials are normally retrieved before sinking and it is not reasonable to expect ingestion of
these items to occur.
In conclusion, ESA-listed species are either so unlikely to ingest expended material as to be
discountable, or in the case of bottom-feeding species, any ingested materials are likely to pass
through the digestive tract without causing injury or any effects rising to the level of take.
Therefore, the effects of ingested expended materials on ESA-listed species is either
discountable, or insignificant, and not likely to adversely affect them.
6.2.7 Effects of Electromagnetic Devices
Normandeau et al. (2011) concluded there was behavioral, anatomical, and theoretical evidence
indicating cetaceans sense magnetic fields. Most of the evidence in this regard is indirect
evidence from correlation of sighting and stranding locations suggesting that cetaceans may be
influenced by local variation in the earth’s magnetic field (Kirschvink 1990; Klinowska 1985;
Walker et al. 1992). Results from one study in particular showed that long-finned and short-
finned pilot whales, striped dolphin, Atlantic spotted dolphin, Atlantic white-sided dolphin, fin
whale, common dolphin, harbor porpoise, sperm whale, and pygmy sperm whale were found to
strand in areas where the earth’s magnetic field was locally weaker than surrounding areas
(negative magnetic anomaly) (Kirschvink 1990). Results also indicated that certain species may
be able to detect total intensity changes of only 0.05 microtesla (Kirschvink et al. 1986). This
gives insight into what changes in intensity levels some species are capable of detecting, but does
not provide experimental evidence of levels to which animals may physiologically or
behaviorally respond. Further, not all physiological or behavioral responses are biologically
significant and rise to the level of take as defined in the ESA.
Impacts to marine mammals associated with electromagnetic fields are dependent on the
animal’s proximity to the source and the strength of the magnetic field. Electromagnetic fields
associated with naval training exercises and testing activities are relatively weak (only 10 percent
of the earth’s magnetic field at 79 ft.), temporary, and localized. Once the source is turned off or
moves from the location, the electromagnetic field is gone. A marine mammal would have to be
present within the electromagnetic field (approximately 656 ft. [200 m] from the source) during
the activity in order to detect it. Again, detection does not necessarily signify a significant
biological response rising to the level of take as defined under the ESA. Given the small area
associated with mine fields, the infrequency and short duration of magnetic energy use, the low
intensity of electromagnetic energy sources, and the density of cetaceans in these areas, the
likelihood of ESA-listed cetaceans being exposed to electromagnetic energy at sufficient
360
Biological Opinion and Conference Report on Navy NWTT Activities and NMFS’ MMPA Incidental Take
Authorization PCTS FPR-2015-9110
intensities to create a biologically relevant response is so low as to be discountable. Therefore,
electromagnetic energy from mine neutralization equipment is not likely to adversely affect
ESA-listed cetaceans and will not be considered further in this Opinion.
Sea turtles use geomagnetic fields to navigate at sea, and therefore changes in those fields could
impact their movement patterns (Lohmann and Lohmann 1996a; Lohmann and Lohmann
1996b). Turtles in all life stages orient to the earth’s magnetic field to position themselves in
oceanic currents; this helps them locate seasonal feeding and breeding grounds and to return to
their nesting sites (Lohmann and Lohmann 1996a; Lohmann and Lohmann 1996b). Experiments
show that sea turtles can detect changes in magnetic fields, which may cause them to deviate
from their original direction (Lohmann and Lohmann 1996a; Lohmann and Lohmann 1996b).
Sea turtles also use nonmagnetic cues for navigation and migration, and these additional cues
may compensate for variations in magnetic fields. Experimental studies show that hatchlings and
juvenile turtles are sensitive to the earth’s natural magnetic field and they can distinguish
magnetic inclination in different places during their migration routes (Lohmann 1991; Luschi et
al. 2007). Sea turtles can distinguish magnetic differences lighter than 9 milliteslas (or 9,000
microteslas (µT)) (Lohmann et al. 2001; Lohmann et al. 1999).
If located in the immediate area (within about 650 ft. [200 m]) where electromagnetic devices are
being used, sea turtles could deviate from their original movements. Even if detectable, the
electromagnetic devices used in training exercises and testing activities are not expected to cause
more than a short-term behavioral disturbance to sea turtles because of the: (1) relatively low
intensity of the magnetic fields generated (0.2 µT [or 200 nT] at 200 m [656.2 ft.] from the
source), (2) very localized potential impact area, and (3) temporary duration of the activities
(hours). Impacts of exposure to electromagnetic stressors are not expected to result in substantial
changes to an individual’s behavior, growth, survival, annual reproductive success, lifetime
reproductive success (fitness), or species recruitment, and are not expected to result in
population-level impacts. Therefore, the effects of electromagnetic energy from mine
neutralization equipment are insignificant and not likely to adversely affect ESA-listed sea
turtles.
In a recent literature review on the effects of electromagnetic fields on marine species (Fisher
and Slater 2010) teleost fish were noted to potentially use magnetic fields for orientation. There
are several potential mechanisms that Pacific salmon use for navigation, including orienting to
the Earth’s magnetic field, utilizing a celestial compass, and using the odor of their natal stream
to migrate back to their original spawning grounds (Groot and Margolis 1998; Quinn and Groot
1983). Crystals of magnetite have been found in four species of Pacific salmon, though not in
sockeye salmon (Mann et al. 1988; Walker et al. 1988). These magnetite crystals are believed to
serve as a compass that orients to the Earth’s magnetic field. Quinn and Brannon (1982)
conclude that while salmon can apparently detect B-fields, their behavior is likely governed by
361
Biological Opinion and Conference Report on Navy NWTT Activities and NMFS’ MMPA Incidental Take
Authorization PCTS FPR-2015-9110
multiple stimuli as demonstrated by the ineffectiveness of artificial B-field stimuli. Supporting
this, (Yano et al. 1997) found no observable effect on the horizontal and vertical movements of
adult chum salmon that had been fitted with a tag that generated an artificial B-field around the
head of each fish. Furthermore, research conducted by Ueda et al. (1998) on adult sockeye
salmon suggests that, rather than magnetoreception, this species relies on visual cues to locate
natal stream and on olfactory cues to reach its natal spawning channel. Blockage of magnetic
sense had no effect on the ability of the fish to locate their natal stream.
We assume that ESA-listed fish most likely avoid sources of strong electromagnetic fields and
that any potential behavioral responses would be very minor and only occur very near the source.
Therefore, we conclude that ESA-listed fish are not likely to be adversely affected by
electromagnetic devices during Navy training and testing activities.
6.2.8 Effects of In-water Devices and expended material from direct physical strikes
Despite thousands of Navy exercises in which torpedoes, in-water devices (unmanned surface
vehicles, unmanned undersea vehicles, towed devices), or expended materials have been used
there have been no recorded instances of marine species strikes. Therefore, the likelihood of
striking a marine mammal, sea turtle, or ESA-listed fish is so unlikely as to be discountable. Any
ESA-listed marine mammal, sea turtle, or fish species is likely to exhibit behavioral avoidance of
in-water devices in the event they are within range to detect them. Any such avoidance behavior
would be of short duration and intensity that it will not increase the likelihood of injury from
disruption of breeding, feeding, or sheltering and would not rise to the level of take.
6.2.9 Secondary Stressors
This section analyzes potential impacts to marine mammals, sea turtles, and ESA-listed fish
exposed to stressors indirectly through impacts to their habitat or prey or through the
introduction of parasites or disease. Stressors from Navy training and testing activities could
pose indirect impacts to marine mammals via habitat or prey. These include (1) explosives and
byproducts, (2) metals, (3) chemicals, and (4) transmission of disease and parasites. The first
three secondary stressors have the potential to decrease water and sediment quality.
Underwater explosions may reduce available prey items for ESA-listed species by either directly
killing prey or by scaring them from the area. Behavioral avoidance of explosive ordnance by
prey species may facilitate behavioral avoidance of additional explosives by ESA-listed species
as they follow their food source as it flees. This benefit would remove ESA-listed species from
blast locations while not interrupting feeding behavior. Due to the infrequent use of underwater
explosives and the limited locations at which underwater explosives are used, it is not expected
their use will have a persistent effect on prey availability of the health of the aquatic food web.
High-order explosions consume most of the explosive material, creating typical combustion
362
Biological Opinion and Conference Report on Navy NWTT Activities and NMFS’ MMPA Incidental Take
Authorization PCTS FPR-2015-9110
byproducts. Explosion by-products associated with high order detonations present no indirect
stressors to marine ESA-listed species because most byproducts are common in seawater and the
rest are quickly diluted below appreciable levels. Explosive byproducts are not expected to result
in detectable changes in sediment or water quality. Low-order explosives leave more explosive
material in the water but this material is not water soluble, degrades quickly, and is quickly
diluted. The levels of explosive materials and byproducts are not detectable above background
levels 1 to 2 m from a degrading source.
Metals are introduced into seawater and sediments as a result of training and testing activities
involving the destruction of ship hulks, targets, ordnance, munitions, and other military expended
materials. Concentrations of metals in sea water are lower than concentrations in sediments.
Metals deposited on the sea floor will be buried in sediment and slowly degrade over time. Most
metals used in Navy expendables is benign and all corroding metals would either be diluted into
the ocean currents or be sequestered in the sediments immediately surrounding the source (Navy
2013). It is extremely unlikely that marine mammals would be indirectly impacted by metals via
the water and few marine ESA-listed species feed primarily on the seafloor where they would
come into contact with marine sediments.
Chemicals are introduced into the marine environment primarily through the degradation of
expendables. Flares missiles, rockets, and torpedoes combust most of their propellants and fuels;
leaving benign or readily diluted soluble combustion byproducts; however, operational failures
result in the release of propellants and degradation products to be released (Navy 2013). The
greatest risk to marine mammals from flares, missile, and rocket propellants that operationally
fail is perchlorate, which is highly soluble in water, persistent, and impacts metabolic processes.
Propylene glycol dinitrate and nitrodiphenylamine (toxic component of torpedo fuel) adsorb to
sediments, have relatively low toxicity, and are readily degraded by biological processes (Navy
2013). Polychlorinated biphenyls are present in target vessels used in sinking exercises but the
Environmental Protection Agency considers the quantity introduced from these Navy exercises
to be within the standards of the Marine Protection, Research, and Sanctuaries Act. Rapid
dilution of introduced chemicals would occur and toxic concentrations are unlikely to be
encountered in seawater (Navy 2013).
The primary vector through which parasites of disease would be transferred to new locations and
the ESA-listed species there would be through the deployment of marine mammals used by the
Navy’s Marine Mammal Systems. Pinnipeds and dolphins used in the Marine Mammal Program
are under exceptional care and control. Navy animals receive regular veterinarian care, including
predeployment exams, regular deworming, and regional screening for specific pathogens of
interest (Navy 2013). The animals are fed restaurant-quality fish to minimize the likelihood of
parasite ingestion and animal waste is collected and managed to control the potential spread of
parasites. Prior to animal deployment Navy personnel observe the surrounding area and if wild
363
Biological Opinion and Conference Report on Navy NWTT Activities and NMFS’ MMPA Incidental Take
Authorization PCTS FPR-2015-9110
marine mammals are spotted animal deployment is delayed. Contact between Navy animals and
wild animals is minimized to the greatest extent possible. In the 40 years the Marine Mammal
Program has been operating there has been no known disease or parasite transmissions from
Navy animals to wild animals (Navy 2013). Given the exceptional care Navy animals receive,
the waste disposal protocols, the minimal time Navy animals are in contact with wild animals,
and the 40 years of their use without incident, it is unlikely parasites or diseases will be
transferred to ESA-listed species.
Given the information provided above regarding the potential for explosives and byproducts,
metals, chemicals, and transmission of disease and parasites to indirectly affect marine ESA-
listed cetacean, pinniped, sea turtle and fish species through habitat and prey availability impacts,
the likelihood of ESA-listed species being exposed to toxic levels of explosives, explosive
byproducts, metals, other chemicals, or parasites/disease resulting from NWTT activities are so
unlikely as to be considered discountable. Therefore, secondary stressors from NWTT activities
are not likely to adversely affect ESA-listed species.
6.2.10 Indirect Effects of Injury and Mortality of Chinook Salmon from Explosions on
Southern Resident Killer Whales
Southern Resident killer whale have the potential to be adversely affected in the NWTT Action
Area. The injury and/or mortality of Chinook salmon that would result from explosions could
result in some level of harm to Southern Resident killer whales by reducing prey availability if
the extent of take of salmon is large enough. A reduction in availability of salmon may cause
animals to forage for longer periods, travel to alternate locations, or abandon foraging efforts.
Hilborn et al. (2012) reported that information from Southern Resident killer whales in the
summer indicates a heavy reliance on Chinook salmon. As Chinook salmon abundance declines
in the fall, the diet data show that chum salmon and other species become more important. There
are little winter diet data, but the data that do exist also suggest the importance of Chinook
salmon (Hilborn et al. 2012).
The age distribution of Chinook salmon consumed by Southern Resident killer whales does not
match the predicted age distribution of Chinook salmon thought to be available to killer whales.
Instead, Southern Resident killer whales consume greater proportions of the larger (older) fish
(particularly the 4- and 5-year-olds) relative to the overall numbers of Chinook salmon present
(Hilborn et al. 2012). Accordingly, we assessed the injury and mortality of Chinook salmon from
Navy training and testing activities and the percent reduction of the adult Puget Sound Chinook
salmon. The only activity we determined may result in injury of death of ESA-listed Puget
Sound Chinook salmon was detonations during training and testing in both inland and offshore
waters. The percent of adult Puget Sound Chinook salmon that we estimated would be killed or
364

Biological Opinion and Conference Report on Navy NWTT Activities and NMFS’ MMPA Incidental Take
Authorization PCTS FPR-2015-9110
injured by these detonations is listed in Table 69. Details on the methodology used to estimate
this level of impact is in Section 6.11.
Table 69. The percent of ESA-listed adult Puget Sound Chinook salmon that would be affected (injured or
killed) by Navy detonations.
Species Location Natural Hatchery: adipose intact Hatchery: adipose clip
Inland 0.0077 0.0001 0
Chinook Offshore 0.0050 0.0051 0
Total 0.0127 0.0052 0
As described in further detail in Section 6.11, this extent of injury and mortality of Chinook
salmon is extremely low and would not be detectable above baseline conditions and assessed
levels of take of Chinook salmon from activities including commercial and recreational fisheries.
Therefore, the extent of effects to Southern Resident killer whales from this adverse impact is not
anticipated to result in significant behavioral effects and would not likely increase the risk of
injury or mortality for whales currently in the population. We conclude that the indirect effects to
Southern Resident killer whales from this percent reduction in availability of Puget Sound
Chinook salmon to be insignificant, would not rise to the level of take, and is not considered
further in this Opinion.
6.3 Risk Assessment Framework – Marine Mammals
The following is a summary of available information used to develop the Navy’s risk assessment
criteria for acoustic stressors. We subsequently reviewed and adopted the criteria for this risk
analysis.
6.3.1 Direct Injury of Marine Mammals From Acoustic Stressors
The potential for direct injury of marine mammals has been inferred from terrestrial mammal
experiments and from post-mortem examination of marine mammals believed to have been
exposed to underwater explosions (Ketten et al. 1993; Richmond et al. 1973; Yelverton et al.
1973). Additionally, non-injurious effects on marine mammals (e.g., TTS) are extrapolated to
injurious effects (e.g., PTS) based on data from terrestrial mammals to derive the criteria serving
as the potential for injury (Southall et al. 2007b). Actual effects on marine mammals may differ
from terrestrial animals due to anatomical and physiological adaptations to the marine
environment, such as a reinforced trachea and flexible thoracic cavity (Ridgway and Dailey
1972) that may decrease the risk of lung injury.
Potential non-auditory direct injury from non-impulsive sound sources, such as sonar, is unlikely
due to relatively lower peak pressures and slower rise times than potentially injurious impulsive
365
Biological Opinion and Conference Report on Navy NWTT Activities and NMFS’ MMPA Incidental Take
Authorization PCTS FPR-2015-9110
sources such as explosives. Non-impulsive sources also lack the strong shock waves associated
with explosions. Therefore, primary blast injury and barotrauma (i.e., injuries caused by large
pressure changes; discussed below) would not occur from exposure to non-impulsive sources
such as sonar. Further, though there have been marine mammal strandings associated with use of
sonar, as Ketten (2012) has recently summarized, “to date, there has been no demonstrable
evidence of acute, traumatic, disruptive, or profound auditory damage in any marine mammal as
the result [of] anthropogenic noise exposures, including sonar.” The theories of sonar induced
acoustic resonance and sonar induced bubble formation are discussed below. These phenomena,
if they were to occur, would require the co-occurrence of a precise set of circumstances that are
unlikely to occur.
6.3.2 Primary Blast Injury and Barotrauma
The greatest potential for direct, non-auditory tissue effects is primary blast injury and
barotrauma after exposure to high amplitude impulsive sources, such as explosions. Primary blast
injuries result from the initial compression of a body exposed to a blast wave. Primary blast
injury is usually limited to gas-containing structures (e.g., lung and gut) and the auditory system
(Craig Jr. 2001a; Craig Jr. and Hearn 1998). Barotrauma refers to injuries caused when large
pressure changes occur across tissue interfaces, normally at the boundaries of air-filled tissues
such as the lungs. Primary blast injury to the respiratory system may be fatal depending upon the
severity of the trauma. Rupture of the lung may introduce air into the vascular system, producing
air emboli that can restrict oxygen delivery to the brain or heart. Though often secondary in life-
threatening severity to pulmonary blast trauma, the gastrointestinal tract can also suffer
contusions and lacerations from blast exposure, particularly in air-containing regions of the tract.
Although hemorrhage of solid organs (e.g., liver, spleen, and kidney) from blast exposure is
possible, rupture of these organs is rarely encountered.
The only known occurrence of mortality or injury to a marine mammal due to Navy training or
testing involving impulsive sources occurred in March 2011 at the Silver Strand Training
Complex. Prior to this incident, this area had been used for underwater demolitions training for at
least three decades without incident. On this occasion, however, a group of long-beaked common
dolphins entered the mitigation zone surrounding an area where a time-delayed firing device had
been initiated on an explosive with a net explosive weight of 8.76 lb (3.97 kg) placed at a depth
of 48 ft. (14.6 m). Approximately 1 minute after detonation, three animals were observed dead at
the surface; a fourth animal was discovered 3 days later stranded dead 42 nm to the north of the
detonation. Upon necropsy, all four animals were found to have sustained typical mammalian
primary blast injuries (Danil and St. Leger 2011). See the NWTT Final EIS/OEIS for more
information on the topic of stranding. Since this incident, the Navy, in consultation with NMFS,
developed additional mitigation measures to minimize the potential for similar incidents in the
future.
366
Biological Opinion and Conference Report on Navy NWTT Activities and NMFS’ MMPA Incidental Take
Authorization PCTS FPR-2015-9110
6.3.3 Auditory Trauma
Relatively little is known about auditory system trauma in marine mammals resulting from a
known sound exposure. A single study spatially and temporally correlated the occurrence of
auditory system trauma in humpback whales with the detonation of a 5,000 kg (11,023 lb.)
explosive (Ketten et al. 1993). The exact magnitude of the exposure in this study cannot be
determined, but it is likely the trauma was caused by the shock wave produced by the explosion.
There are no known occurrences of direct auditory trauma in marine mammals exposed to
tactical sonar or other non-impulsive sound sources (Ketten 2012). The potential for auditory
trauma in marine mammals exposed to impulsive sources (e.g., explosions) is inferred from tests
of submerged terrestrial mammals exposed to underwater explosions (Ketten et al. 1993;
Richmond et al. 1973; Yelverton et al. 1973).
6.3.4 Acoustic Resonance
Acoustic resonance has been proposed as a hypothesis suggesting that acoustically induced
vibrations (sound) from sonar or sources with similar operating characteristics could be
damaging tissues of marine mammals. In 2002, NMFS convened a panel of government and
private scientists to investigate the issue (NMFS 2002). They modeled and evaluated the
likelihood that Navy mid-frequency sonar caused resonance effects in beaked whales that
eventually led to their stranding in the Bahamas (DoN 2015a). The conclusions of that group
were that resonance in air-filled structures was not likely to have caused the stranding (NMFS
2002). The frequencies at which resonance was predicted to occur were below the frequencies
utilized by the mid-frequency sonar systems associated with the Bahamas event. Furthermore, air
cavity vibrations, even at resonant frequencies, were not considered to be of sufficient amplitude
to cause tissue damage, even under the worst-case scenario in which air volumes would be
undamped by surrounding tissues and the amplitude of the resonant response would be maximal.
These same conclusions would apply to other training activities involving acoustic sources.
Therefore, we conclude that acoustic resonance is not likely under realistic conditions during
training and testing activities and this type of impact is not considered further in this analysis.
6.3.5 Bubble Formation (Acoustically Induced)
A suggested cause of injury to marine mammals is rectified diffusion (Crum and Mao 1996), the
process of increasing the size of a bubble by exposing it to a sound field. The process is
dependent upon a number of factors including the sound pressure level and duration. Under this
hypothesis, one of three things could happen: (1) bubbles grow to the extent that tissue
hemorrhage (injury) occurs, (2) bubbles develop to the extent an immune response is triggered or
nervous tissue is subjected to enough localized pressure that pain or dysfunction occurs (a stress
response without injury), or (3) the bubbles are cleared by the lung without negative consequence
to the animal. The probability of rectified diffusion, or any other indirect tissue effect, will
367
Biological Opinion and Conference Report on Navy NWTT Activities and NMFS’ MMPA Incidental Take
Authorization PCTS FPR-2015-9110
necessarily be based upon what is known about the specific process involved. Rectified diffusion
is more likely if the environment in which the ensonified bubbles exist is supersaturated with gas.
Repetitive diving by marine mammals can cause the blood and some tissues to accumulate gas to
a greater degree than is supported by the surrounding environmental pressure (Ridgway and
Howard 1979). The dive patterns of some marine mammals (e.g., beaked whales) are
theoretically predicted to induce greater supersaturation (Houser 2010; Houser et al. 2001b). If
rectified diffusion were possible in marine mammals exposed to high-level sound, conditions of
tissue supersaturation could theoretically speed the rate of bubble growth and increase the size of
the bubbles. Subsequent effects due to tissue trauma and emboli would presumably mirror those
observed in humans suffering from decompression sickness. It is unlikely the short duration of
sonar or explosion sounds would be long enough to drive bubble growth to any substantial size, if
such a phenomenon occurs.
An alternative but related hypothesis has also been suggested: stable microbubbles could be
destabilized by high-level sound exposures such that bubble growth then occurs through static
diffusion of gas out of the tissues. In such a scenario, the marine mammal would need to be in a
gas-supersaturated state for enough time for bubbles to become a problematic size. Recent
research with ex vivo supersaturated bovine tissues suggested that for a 37 kHz signal, a sound
exposure of approximately 215 dB re 1 μPa would be required before microbubbles became
destabilized and grew (Crum et al. 2005). Assuming spherical spreading loss and a nominal sonar
source level of 235 dB re 1 μPa at 1 m, a whale would need to be within 10 m (33 ft.) of the
sonar dome to be exposed to such sound levels. Furthermore, tissues in the study were
supersaturated by exposing them to pressures of 400 to 700 kilopascals for hours and then
releasing them to ambient pressures. Assuming the equilibration of gases with the tissues
occurred when the tissues were exposed to the high pressures, levels of supersaturation in the
tissues could have been as high as 400 to 700 percent. These levels of tissue supersaturation are
substantially higher than model predictions for marine mammals (Houser et al. 2001a; Saunders
et al. 2008). It is improbable this mechanism is responsible for stranding events or traumas
associated with beaked whale strandings. Both the degree of supersaturation and exposure levels
observed to cause microbubble destabilization are unlikely to occur.
There is considerable disagreement among scientists as to the likelihood of this phenomenon
(Evans and Miller 2004; Piantadosi and Thalmann 2004). Although it has been argued that
traumas from beaked whale strandings are consistent with gas emboli and bubble-induced tissue
separations (Fernandez et al. 2005a; Jepson et al. 2003), bubble formation as the cause of the
traumas has not been verified. The presence of bubbles postmortem, particularly after
decompression, is not necessarily indicative of bubble pathology (Bernaldo de Quiros et al.
2012; Dennison et al. 2011; Moore et al. 2009). Prior experimental work has also demonstrated
the post-mortem presence of bubbles following decompression in laboratory animals can occur as
a result of invasive investigative procedures (Stock et al. 1980).
368

Biological Opinion and Conference Report on Navy NWTT Activities and NMFS’ MMPA Incidental Take
Authorization PCTS FPR-2015-9110
6.3.6 Nitrogen Decompression
Although not a direct injury, variations in marine mammal diving behavior or avoidance
responses could possibly result in nitrogen tissue supersaturation and nitrogen off-gassing.
Nitrogen supersaturation and off-gassing levels could result in deleterious vascular and tissue
bubble formation (Hooker et al. 2012; Jepson et al. 2003; Saunders et al. 2008). Nitrogen off-
gassing occurring in human divers is called decompression sickness. The mechanism for bubble
formation from saturated tissues would be indirect and also different from rectified diffusion, but
the effects would be similar. The potential process for this to occur is hypothetical and under
debate in the scientific community (Hooker et al. 2012; Saunders et al. 2008). It is speculated if
exposure to a startling sound elicits a rapid ascent to the surface, tissue gas saturation sufficient
for the evolution of nitrogen bubbles might result (Fernandez et al. 2005a; Hooker et al. 2012;
Jepson et al. 2003). In this scenario, the rate of ascent would need to be sufficiently rapid to
compromise behavioral or physiological protections against nitrogen bubble formation.
Previous modeling suggests even unrealistically rapid rates of ascent from normal dive behaviors
are unlikely to result in supersaturation to the extent bubble formation would be expected in
beaked whales (Zimmer and Tyack 2007). Tyack et al. (2006) suggested emboli observed in
animals exposed to mid-frequency active (MFA) sonar (Fernandez et al. 2005a; Jepson et al.
2003) could stem from a behavioral response that involves repeated dives, shallower than the
depth at which lung collapse would occur. A bottlenose dolphin was trained to repetitively dive
to elevate nitrogen saturation to the point that asymptomatic nitrogen bubble formation was
predicted to occur. However, inspection of the vascular system of the dolphin via ultrasound did
not demonstrate the formation of any nitrogen gas bubbles (Houser 2010).
More recently, modeling has suggested that the long, deep dives performed regularly by beaked
whales over a lifetime could result in the saturation of tissues (e.g., fat, bone lipid) to the point
that they are supersaturated when the animals are at the surface (Hooker et al. 2009; Saunders et
al. 2008). Proposed adaptations for prevention of bubble formation under conditions of persistent
tissue saturation have been suggested (Fahlman et al. 2006; Hooker et al. 2009). Since bubble
formation is facilitated by compromised blood flow, it has been suggested that rapid stranding
may lead to bubble formation in animals with supersaturated tissues because of the stress of
stranding and the cardiovascular collapse that can accompany it (Houser 2010).
A fat embolic syndrome was identified by Fernandez et al. (2005b) coincident with the
identification of bubble emboli in stranded beaked whales. The fat embolic syndrome was the
first pathology of this type identified in marine mammals, and was thought to possibly arise from
the formation of bubbles in fat bodies, which subsequently resulted in the release of fat emboli
into the blood stream. Recently, Dennison et al. (2011) reported on investigations of dolphins
stranded in 2009 and 2010.Using ultrasound the authors identified gas bubbles in kidneys from
369
Biological Opinion and Conference Report on Navy NWTT Activities and NMFS’ MMPA Incidental Take
Authorization PCTS FPR-2015-9110
21 of 22 live-stranded dolphins and in the liver from two of 22. The authors postulated stranded
animals are unable to recompress by diving, and thus may retain bubbles that are otherwise re
absorbed in animals that can continue to dive. The researchers concluded minor bubble formation
can be tolerated since the majority of stranded dolphins released did not re-strand (Dennison et
al. 2011). Recent modeling by Kvadsheim (2012) determined behavioral and physiological
responses to sonar have the potential to result in bubble formation. However, the observed
behavioral responses of cetaceans to sonar do not imply any significantly increased risk over
what may otherwise occur normally in individual marine mammals. As a result, no marine
mammals addressed in this analysis are given differential treatment due to the possibility for
acoustically mediated bubble growth.
6.3.7 Hearing Loss
The most familiar effect of exposure to high intensity sound is hearing loss, meaning an increase
in the hearing threshold. Both auditory injury and auditory fatigue may result in hearing loss. The
meaning of the term “hearing loss” does not equate to “deafness.” Hearing loss is a noise-induced
threshold shift, or simply a threshold shift. If high-intensity sound over stimulates tissues in the
ear, causing a threshold shift, the impacted area of the ear (associated with and limited by the
sound’s frequency band) no longer provides the same auditory impulses to the brain as before the
exposure (Ketten 2012). The distinction between PTS and TTS is based on whether there is a
complete recovery of a threshold shift following a sound exposure. If the threshold shift
eventually returns to zero (the threshold returns to the pre-exposure value), the threshold shift is a
TTS.
For TTS, full recovery of the hearing loss (to the pre-exposure threshold) has been determined
from studies of marine mammals, and this recovery occurs within minutes to hours for the small
amounts of TTS that have been experimentally induced (Finneran et al. 2005b; Finneran and
Schlundt 2010; Nachtigall et al. 2004). The recovery time is related to the exposure duration,
sound exposure level, and the magnitude of the threshold shift, with larger threshold shifts and
longer exposure durations requiring longer recovery times (Finneran et al. 2005b; Finneran and
Schlundt 2010; Mooney et al. 2009a; Mooney et al. 2009b). In some cases, threshold shifts as
large as 50 dB (loss in sensitivity) have been temporary, although recovery sometimes required
as much as 30 days (Ketten 2012). If the threshold shift does not return to zero but leaves some
finite amount of threshold shift, then that remaining threshold shift is a PTS. Again for clarity,
PTS, as discussed in this document, is not the complete loss of hearing, but instead is the loss of
hearing sensitivity over a particular range of frequency. Figure 8 shows one hypothetical
threshold shift that completely recovers, a TTS, and one that does not completely recover,
leaving some PTS. The actual amount of threshold shift depends on the amplitude, duration,
frequency, temporal pattern of the sound exposure, and on the susceptibility of the individual
animal.
370
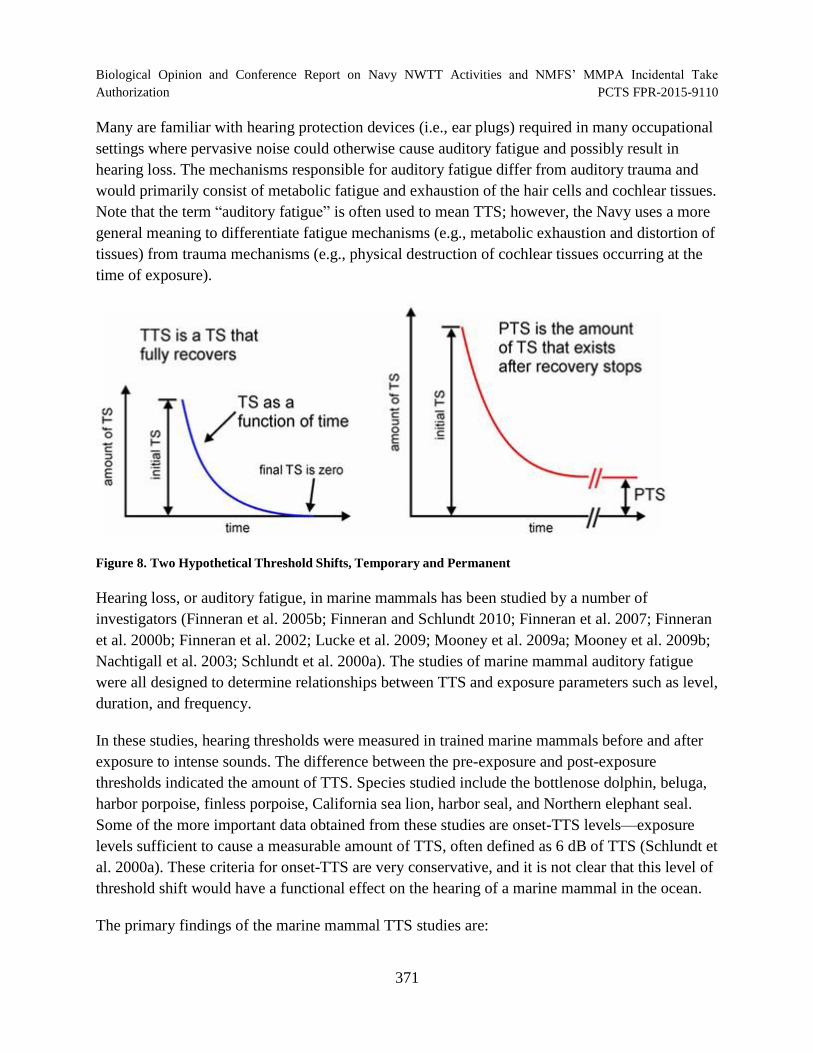
Biological Opinion and Conference Report on Navy NWTT Activities and NMFS’ MMPA Incidental Take
Authorization PCTS FPR-2015-9110
Many are familiar with hearing protection devices (i.e., ear plugs) required in many occupational
settings where pervasive noise could otherwise cause auditory fatigue and possibly result in
hearing loss. The mechanisms responsible for auditory fatigue differ from auditory trauma and
would primarily consist of metabolic fatigue and exhaustion of the hair cells and cochlear tissues.
Note that the term “auditory fatigue” is often used to mean TTS; however, the Navy uses a more
general meaning to differentiate fatigue mechanisms (e.g., metabolic exhaustion and distortion of
tissues) from trauma mechanisms (e.g., physical destruction of cochlear tissues occurring at the
time of exposure).
Figure 8. Two Hypothetical Threshold Shifts, Temporary and Permanent
Hearing loss, or auditory fatigue, in marine mammals has been studied by a number of
investigators (Finneran et al. 2005b; Finneran and Schlundt 2010; Finneran et al. 2007; Finneran
et al. 2000b; Finneran et al. 2002; Lucke et al. 2009; Mooney et al. 2009a; Mooney et al. 2009b;
Nachtigall et al. 2003; Schlundt et al. 2000a). The studies of marine mammal auditory fatigue
were all designed to determine relationships between TTS and exposure parameters such as level,
duration, and frequency.
In these studies, hearing thresholds were measured in trained marine mammals before and after
exposure to intense sounds. The difference between the pre-exposure and post-exposure
thresholds indicated the amount of TTS. Species studied include the bottlenose dolphin, beluga,
harbor porpoise, finless porpoise, California sea lion, harbor seal, and Northern elephant seal.
Some of the more important data obtained from these studies are onset-TTS levels—exposure
levels sufficient to cause a measurable amount of TTS, often defined as 6 dB of TTS (Schlundt et
al. 2000a). These criteria for onset-TTS are very conservative, and it is not clear that this level of
threshold shift would have a functional effect on the hearing of a marine mammal in the ocean.
The primary findings of the marine mammal TTS studies are:
371

Biological Opinion and Conference Report on Navy NWTT Activities and NMFS’ MMPA Incidental Take
Authorization PCTS FPR-2015-9110
The growth and recovery of TTS shift are analogous to those in terrestrial mammals. This
means that, as in terrestrial mammals, threshold shifts primarily depend on the amplitude,
duration, frequency content, and temporal pattern of the sound exposure.
The amount of TTS increases with exposure sound pressure level and the exposure
duration.
For continuous sounds, exposures of equal energy lead to approximately equal effects
(Ward 1997). For intermittent sounds, less hearing loss occurs than from a continuous
exposure with the same energy (some recovery will occur during the quiet period between
exposures (Kastelein et al. 2014a; Kryter et al. 1965; Ward 1997).
Sound exposure level is correlated with the amount of TTS and is a good predictor for
onset-TTS from single, continuous exposures with similar durations. This agrees with
human TTS data presented by (Ward et al. 1958; Ward et al. 1959a; Ward et al. 1959b).
However, for longer duration sounds beyond 16 to 32 seconds, the relationship between
TTS and sound exposure level breaks down and duration becomes a more important
contributor to TTS (Finneran and Schlundt 2010). Still, for a wide range of exposure
durations, wound exposure level correlates reasonably well to TTS growth (Popov et al.
2014).
The maximum TTS after tonal exposures occurs one-half to one octave above the exposure frequency (Finneran et al. 2007; Schlundt et al. 2000a). TTS from tonal exposures can thus extend over a large (greater than one octave) frequency range.
For bottlenose dolphins, sounds with frequencies above 10 kHz are more hazardous than
those at lower frequencies (i.e., lower sound exposure levels required to affect hearing)
(Finneran and Schlundt 2010; Finneran and Schlundt 2013).
The amount of observed TTS tends to decrease with increasing time following the
exposure. The time required for complete recovery of hearing depends on the magnitude
of the initial shift; for relatively small shifts recovery may be complete in a few minutes,
while large shifts (e.g., 40 dB) may require several days for recovery.
TTS can accumulate across multiple intermittent exposures, but the resulting TTS will be
less than the TTS from a single, continuous exposure with the same sound exposure level.
This means that predictions based on total, cumulative sound exposure level will
overestimate the amount of TTS from intermittent exposures.
Although there have been no marine mammal studies designed to measure PTS, the potential for
PTS in marine mammals can be estimated based on known similarities between the inner ears of
marine and terrestrial mammals. Experiments with marine mammals have revealed their
similarities with terrestrial mammals with respect to features such as TTS, age-related hearing
loss (called Presbycusis), ototoxic drug-induced hearing loss, masking, and frequency selectivity.
Therefore, in the absence of marine mammal PTS data, onset-PTS shift exposure levels may be
estimated by assuming some upper limit of TTS that equates the onset of PTS, then using TTS
372
Biological Opinion and Conference Report on Navy NWTT Activities and NMFS’ MMPA Incidental Take
Authorization PCTS FPR-2015-9110
relationships from marine and terrestrial mammals to determine the exposure levels capable of
producing this amount of TTS.
Hearing loss resulting from auditory fatigue could effectively reduce the distance over which
animals can communicate, detect biologically relevant sounds such as predators, and echolocate
(for odontocetes). The costs to marine mammals with TTS, or even some degree of PTS have not
been studied; however, a relationship between the duration, magnitude, and frequency range of
hearing loss could have consequences to biologically important activities (e.g., intraspecific
communication, foraging, and predator detection) that affect survivability and reproduction.
However, the classification of modeled effects from acoustic stressors, such as TTS and PTS, are
performed in a manner as to conservatively overestimate the impacts of those effects. Acoustic
stressors are binned and all stressors within each bin are modeled as the loudest source,
necessarily overestimating impacts within each bin. Therefore, the temporary duration of TTS
may be on the shorter end of the range and last briefly. Even longer duration TTS is only
expected to last hours or at most a few days. The brief amount of time marine mammals are
expected to experience TTS is unlikely to significantly impair their ability to communicate,
forage, or breed and will not have fitness level consequences at the individual or population
level. Although PTS is a permanent shift in hearing, it is not the same as deafness and to our
knowledge there are no published studies on the long-term effects of PTS on marine mammal
fitness. Conceivably, PTS could result in changes to individual’s ability to communicate, breed,
and forage but it is unclear if these impacts would significantly impact their fitness. Results from
2 years (2009 and 2010) of intensive monitoring by independent scientists and Navy observers in
the Southern California and Hawaii Range Complexes have recorded an estimated 161,894
marine mammals with no evidence of distress or unusual behavior observed during Navy
activities. This supports that TTS and PTS are unlikely to significantly impair their ability to
communicate, forage, or breed and will not have fitness level consequences at the individual or
population level.
6.3.8 Auditory Masking
Auditory masking occurs when a sound, or noise in general, limits the perception of another
sound. As with hearing loss, auditory masking can effectively limit the distance over which a
marine mammal can communicate, detect biologically relevant sounds, and echolocate
(odontocetes). Unlike hearing loss, which likely results in a behavioral stress response,
behavioral changes resulting from auditory masking may not be coupled with a stress response.
Another important distinction between masking and hearing loss is that masking only occurs in
the presence of the sound stimulus, whereas hearing loss can persist after the stimulus is gone.
Critical ratios, a measure of the relative ability of an animal to extract signals from noise, have
been determined for pinnipeds (Southall et al. 2000; Southall et al. 2003) and bottlenose dolphins
373
Biological Opinion and Conference Report on Navy NWTT Activities and NMFS’ MMPA Incidental Take
Authorization PCTS FPR-2015-9110
(Johnson 1967) and detections of signals under varying masking conditions have been
determined for active echolocation and passive listening tasks in odontocetes (Au and Pawloski
1989a; Au and Pawloski 1989b; Branstetter 2013; Erbe 2000; Johnson 1971). These studies
provide baseline information from which the probability of masking can be estimated.
Clark et al. (2009) developed a methodology for estimating masking effects on communication
signals for low frequency cetaceans, including calculating the cumulative impact of multiple
noise sources. For example, their technique calculates that in Stellwagen Bank National Marine
Sanctuary, when two commercial vessels pass through a North Atlantic right whale’s (a baleen
whale like blue, fin, sei, and humpback whales) optimal communication space (estimated as a
sphere of water with a diameter of 20 km), that space is decreased by 84 percent. This
methodology relies on empirical data on source levels of calls (which is unknown for many
species), and requires many assumptions about ancient ambient noise conditions and
simplifications of animal behavior. However, it is an important step in determining the impact of
anthropogenic noise on animal communication. Subsequent research for the same species and
location estimated that an average of 63 to 67 percent of North Atlantic right whale’s
communication space has been reduced by an increase in ambient noise levels, and that noise
associated with transiting vessels is a major contributor to the increase in ambient noise (Hatch et
al. 2012).
Vocal changes in response to anthropogenic noise can occur across sounds produced by marine
mammals, such as whistling, echolocation click production, calling, and singing. Changes to
vocal behavior and call structure may result from a need to compensate for an increase in
background noise. In cetaceans, vocalization changes have been reported from exposure to
anthropogenic noise sources such as sonar, vessel noise, and seismic surveying. Vocalizations
may also change in response to variation in the natural acoustic environment (e.g., from variation
in sea surface motion)(Dunlop et al. 2014).
In the presence of low frequency active sonar, humpback whales have been observed to increase
the length of their songs (Fristrup et al. 2003; Miller et al. 2000), possibly due to the overlap in
frequencies between the whale song and the low frequency active sonar. North Atlantic right
whales have been observed to increase the frequency and amplitude (intensity) (Parks 2009) of
their calls while reducing the rate of calling in areas of increased anthropogenic noise (Parks et
al. 2007). In contrast, both sperm and pilot whales potentially ceased sound production during
experimental sound exposure (Bowles et al. 1994), although it cannot be absolutely determined
whether the inability to acoustically detect the animals was due to the cessation of sound
production or the displacement of animals from the area.
Different vocal responses in marine mammals have been documented in the presence of seismic
survey noise. An overall decrease in vocalization during active surveying has been noted in large
374
Biological Opinion and Conference Report on Navy NWTT Activities and NMFS’ MMPA Incidental Take
Authorization PCTS FPR-2015-9110
marine mammal groups (Potter et al. 2007). In contrast, blue whale feeding and social calls
increased when seismic exploration was underway (Di Lorio and Clark 2010), indicative of a
potentially compensatory response to the increased noise level. (Melcon et al. 2012) recently
documented that blue whales decreased the proportion of time spent producing certain types of
calls when simulated mid-frequency sonar was present. At present it is not known if these
changes in vocal behavior corresponded to changes in foraging or any other behaviors.
Controlled exposure experiments in 2007 and 2008 in the Bahamas recorded responses of false
killer whales, short-finned pilot whales, and melon-headed whales to simulated MFA sonar
(Deruiter et al. 2013a). The responses to exposures between species were variable. After hearing
each MFA signal, false killer whales were found to “increase their whistle production rate and
made more-MFA-like whistles” (Deruiter et al. 2013a). In contrast, melon-headed whales had
“minor transient silencing” after each MFA signal, while pilot whales had no apparent response.
Consistent with the findings of other previous research (see, for example, (Southall et al.
2007b)), Deruiter et al. (2013a) found the responses were variable by species and with the
context of the sound exposure.
Evidence suggests that at least some marine mammals have the ability to acoustically identify
predators. For example, harbor seals that reside in the coastal waters off British Columbia are
frequently targeted by certain groups of killer whales, but not others. The seals discriminate
between the calls of threatening and non-threatening killer whales (Deecke et al. 2002), a
capability that should increase survivorship while reducing the energy required for attending to
and responding to all killer whale calls. Auditory masking may prevent marine mammals from
responding to the acoustic cues produced by their predators. The effects of auditory masking on
the predator-prey relationship depends on the duration of the masking and the likelihood of
encountering a predator during the time that predator cues are impeded.
6.3.9 Physiological Stress
Marine mammals naturally experience stressors within their environment and as part of their life
histories. Changing weather and ocean conditions, exposure to diseases and naturally occurring
toxins, lack of prey availability, social interactions with members of the same species, and
interactions with predators all contribute to the stress a marine mammal experiences. In some
cases, naturally occurring stressors can have profound impacts on marine mammals; for example,
chronic stress, as observed in stranded animals with long-term debilitating conditions (e.g.,
disease), has been demonstrated to result in an increased size of the adrenal glands and an
increase in the number of epinephrine-producing cells (Clark et al. 2006).
Anthropogenic activities have the potential to provide additional stressors above and beyond
those that occur naturally. For example, various efforts have investigated the impact of vessels on
marine mammals (both whale-watching and general vessel traffic noise) and demonstrated that
375
Biological Opinion and Conference Report on Navy NWTT Activities and NMFS’ MMPA Incidental Take
Authorization PCTS FPR-2015-9110
impacts do occur (Bain 2002; Erbe 2002b; Noren et al. 2009; Pirotta et al. 2015; Williams and
Ashe 2006; Williams and Noren 2009). In an analysis of energy costs to killer whales, Williams
et al. (2009) suggested that whale-watching in the Johnstone Strait resulted in lost feeding
opportunities due to vessel disturbance. Ayres et al. (2012) measured fecal hormones of southern
resident killer whales in the Salish Sea to assess the lack of prey (salmon) and vessel traffic on
species recovery. Ayres et al. (2012) suggested that the lack of prey overshadowed any
population-level physiological impacts on southern resident killer whales from vessel traffic.
Marine mammals may exhibit a behavioral response or combinations of behavioral responses
upon exposure to anthropogenic sounds. If a sound is detected by a marine mammal, a stress
response (e.g., startle or annoyance) or a cueing response (based on a past stressful experience)
can occur. Although preliminary because of the small numbers of samples collected, different
types of sounds have been shown to produce variable stress responses in marine mammals.
Belugas demonstrated no catecholamine (hormones released in situations of stress) response to
the playback of oil drilling sounds (Thomas et al. 1990) but showed an increase in
catecholamines following exposure to impulsive sounds produced from a seismic water gun
(Romano et al. 2004). A bottlenose dolphin exposed to the same seismic water gun signals did
not demonstrate a catecholamine response, but did demonstrate an elevation in aldosterone, a
hormone that may be a significant indicator of stress in odontocetes (St. Aubin et al. 2001; St.
Aubin and Geraci 1989). Increases in heart rate were observed in bottlenose dolphins to which
conspecific calls were played, although no increase in heart rate was observed when tank noise
was played back (Miksis et al. 2001). Collectively, these results suggest a variable response that
depends on the characteristics of the received signal and prior experience with the received
signal.
Other types of stressors include the presence of vessels, fishery interactions, acts of pursuit and
capture, the act of stranding, and pollution. In contrast to the limited amount of work performed
on stress responses resulting from sound exposure, a considerably larger body of work exists on
stress responses associated with pursuit, capture, handling and stranding. A study compared
pathological changes in organs/tissues of odontocetes stranded on beaches or captured in nets
over a 40-year period (Cowan and Curry 2008). The type of changes observed indicate
multisystemic harm caused in part by an overload of catecholamines into the system, as well as a
restriction in blood supply capable of causing tissue damage or tissue death. This response to a
stressor or stressors is thought be mediated by the over-activation of the animal’s normal
physiological adaptations to diving or escape. Pursuit, capture and short-term holding of belugas
have been observed to result in decreased thyroid hormones (St. Aubin and Geraci 1988) and
increases in epinephrine (St. Aubin and Dierauf 2001). In dolphins, the trend is more
complicated with the duration of the handling time potentially contributing to the magnitude of
the stress response (Ortiz and Worthy 2000; St. Aubin 2002; St. Aubin et al. 1996). Male grey
seals subjected to capture and short-term restraint showed an increase in cortisol levels
376
Biological Opinion and Conference Report on Navy NWTT Activities and NMFS’ MMPA Incidental Take
Authorization PCTS FPR-2015-9110
accompanied by an increase in testosterone (Lidgard et al. 2008). This result may be indicative
of a compensatory response that enables the seal to maintain reproduction capability in spite of
stress. Elephant seals demonstrate an acute cortisol response to handling, but do not demonstrate
a chronic response; on the contrary, adult females demonstrate a reduction in the adrenocortical
response following repetitive chemical immobilization (Engelhard et al. 2002). Similarly, no
correlation between cortisol levels and heart/respiration rate changes were seen in harbor
porpoises during handling for satellite tagging (Eskesen et al. 2009). Taken together, these
studies illustrate the wide variations in the level of response that can occur when faced with these
stressors.
Factors to consider when trying to predict a stress or cueing response include the mammal’s life
history stage and whether they are experienced with the stressor. Prior experience with a stressor
may be of particular importance as repeated experience with a stressor may dull the stress
response via acclimation (St. Aubin and Dierauf 2001).
The sound characteristics that correlate with specific stress responses in marine mammals are
poorly understood. Therefore, in practice and for the purposes of this Opinion, a stress response
is assumed if a physical injury such as hearing loss or trauma is predicted; or if a significant
behavioral response is predicted.
6.3.10 Behavioral Reactions
The response of a marine mammal to an anthropogenic sound will depend on the frequency,
duration, temporal pattern and amplitude of the sound as well as the animal’s prior experience
with the sound and the context in which the sound is encountered (i.e., what the animal is doing
at the time of the exposure). The distance from the sound source and whether it is perceived as
approaching or moving away can affect the way an animal responds to a sound (Wartzok et al.
2003). For marine mammals, a review of responses to anthropogenic sound was first conducted
by Richardson and others (Richardson et al. 1995d). More recent reviews (Ellison et al. 2012;
Nowacek et al. 2007; Southall et al. 2009) (Southall et al. 2007b) address studies conducted
since 1995 and focus on observations where the received sound level of the exposed marine
mammal(s) was known or could be estimated.
Except for some vocalization changes that may be compensating for auditory masking, all
behavioral reactions are assumed to occur due to a preceding stress or cueing response, however
stress responses cannot be predicted directly due to a lack of scientific data (see preceding
section). Responses can overlap; for example, an increased respiration rate is likely to be coupled
with a flight response. Differential responses are expected among and within species since
hearing ranges vary across species, the behavioral ecology of individual species is unlikely to
completely overlap, and individuals of the same species may react differently to the same, or
similar, stressor.
377
Biological Opinion and Conference Report on Navy NWTT Activities and NMFS’ MMPA Incidental Take
Authorization PCTS FPR-2015-9110
Southall et al. (2007a) synthesized data from many past behavioral studies and observations to
determine the likelihood of behavioral reactions to specific sound levels exposures. While in
general, the louder the sound source the more intense the behavioral response, it was clear that
the proximity of a sound source and the animal’s experience, motivation, and conditioning were
also critical factors influencing the response (Southall et al. 2007b). After examining all of the
available data, the authors felt that the derivation of thresholds for behavioral response based
solely on exposure level was not supported because context of the animal at the time of sound
exposure was an important factor in estimating response. Nonetheless, in some conditions
consistent avoidance reactions were noted at higher sound levels dependent on the marine
mammal species or group allowing conclusions to be drawn. Most low-frequency cetaceans
(mysticetes) observed in studies usually avoided sound sources at levels of greater than or equal
to 160 dB re 1 µPa. Published studies of mid-frequency cetaceans analyzed include sperm
whales, belugas, bottlenose dolphins, and river dolphins. These groups showed no clear
tendency, but for non-impulsive sounds, captive animals tolerated levels in excess of 170 dB re 1
µPa before showing behavioral reactions, such as avoidance, erratic swimming, and attacking the
test apparatus. High-frequency cetaceans (observed from studies with harbor porpoises) exhibited
changes in respiration and avoidance behavior at levels between 90 and 140 dB re 1 µPa, with
profound avoidance behavior noted for levels exceeding this. Phocid seals showed avoidance
reactions at or below 190 dB re 1 µPa, thus seals may actually receive levels adequate to produce
TTS before avoiding the source. Recent studies with beaked whales have shown them to be
particularly sensitive to noise, with animals during 3 playbacks of sound breaking off foraging
dives at levels below 142 dB re 1 µPa, although acoustic monitoring during actual sonar
exercises revealed some beaked whales continuing to forage at levels up to 157 dB re 1 µPa
(Tyack et al. 2011b). Passive acoustic monitoring of beaked whales, classified as Blainville's
beaked whales and Cross-seamount type beaked whales, at Pacific Missile Range Facility,
Kauai, Hawaii showed statistically significant differences in dive rates, diel occurrence patterns,
and spatial distribution of dives after the initiation of a training event. However, for the beaked
whale dives that continued to occur during MFAS activity, differences from normal dive profiles
and click rates were not detected with estimated receive levels up to 137 dB re 1 uPa while the
animals were at depth during their dives (Manzano-Roth et al. 2013b).
6.3.10.1.1 Behavioral Reactions of Marine Mammals to Impulsive Sound Sources
The following sections describe the behavioral reactions of marine mammals to impulsive sound
sources such as underwater explosions.
6.3.10.1.2 Mysticetes
Baleen whales have shown a variety of responses to impulsive sound sources, including
avoidance, reduced surface intervals, altered swimming behavior, and changes in vocalization
378

Biological Opinion and Conference Report on Navy NWTT Activities and NMFS’ MMPA Incidental Take
Authorization PCTS FPR-2015-9110
rates (Richardson et al. 1995c; Southall et al. 2007d). While most bowhead whales did not show
active avoidance until within 8 km of seismic vessels (Richardson et al. 1995b), some whales
avoided vessels by more than 20 km at received levels as low as 120 dB re 1 µPa root mean
square. Additionally, Malme et al. (1988) observed clear changes in diving and respiration
patterns in bowheads at ranges up to 73 km from seismic vessels, with received levels as low as
125 dB re 1 µPa.
Gray whales migrating along the U.S. west coast showed avoidance responses to seismic vessels
at 164 dB re 1 µPa (10 percent of animals showed avoidance response), and at 190 dB re 1 µPa
(90 percent of animals showed avoidance response), with similar results for whales in the Bering
Sea (Malme et al. 1986; Malme et al. 1988). In contrast, noise from seismic surveys was not
found to impact Western North Pacific gray whale feeding behavior or exhalation rates off the
coast of Russia (Gailey et al. 2007; Yazvenko et al. 2007).
Humpback whales showed avoidance behavior at ranges of 5 to 8 km from a seismic array during
observational studies in western Australia (McCauley et al. 1998; Todd et al. 1996a) found no
clear short-term behavioral responses by foraging humpbacks to explosions associated with
construction operations in Newfoundland, but did see a trend of increased rates of net
entanglement and a shift to a higher incidence of net entanglement closer to the noise source.
2Seismic pulses at average received levels of 131 dB re 1 µPa -s caused blue whales to increase
call production (Di Lorio and Clark 2010). McDonald et al. (1995) tracked a blue whale with
seafloor seismometers and reported that it stopped vocalizing and changed its travel direction at a
range of 10 km from the seismic vessel (estimated received level 143 dB re 1 µPa peak-to-peak).
Castellote et al. (2012a) found that vocalizing fin whales in the Mediterranean left the area where
a seismic survey was being conducted and that their displacement persisted beyond the
completion of the survey. These studies demonstrate that even low levels of noise received far
from the noise source can induce behavioral responses.
6.3.10.1.3 Odontocetes
Madsen et al. (2006) and Miller et al. (2009) tagged and monitored eight sperm whales in the
Gulf of Mexico exposed to seismic airgun surveys. Sound sources were approximately 2 to 7 nm
away from the whales and, based on multipath propagation received levels, were as high as 162
dB SPL re 1 µPa with energy content greatest between 0.3 kHz to 3.0 kHz (Madsen et al. 2006).
The whales showed no horizontal avoidance, although the whale that was approached most
closely had an extended resting period and did not resume foraging until the airguns had ceased
firing (Miller et al. 2009). The remaining whales continued to execute foraging dives throughout
exposure, however swimming movements during foraging dives were 6 percent lower during
exposure than control periods, suggesting subtle effects of noise on foraging behavior (Miller et
379
Biological Opinion and Conference Report on Navy NWTT Activities and NMFS’ MMPA Incidental Take
Authorization PCTS FPR-2015-9110
al. 2009). Captive bottlenose dolphins sometimes vocalized after an exposure to impulsive sound
from a seismic watergun (Finneran and Schlundt 2010; Thompson et al. 2013).
6.3.10.2 Pinnipeds
A review of behavioral reactions by pinnipeds to impulsive noise can be found in Richardson et
al. (1995a) and Southall et al. (2007c). Blackwell et al. (2004) observed that ringed seals
exhibited little or no reaction to drilling noise with mean underwater levels of 157 dB re 1 µPa
root mean square and in air levels of 112 dB re 20 µPa, suggesting the seals had habituated to the
noise. In contrast, captive California sea lions avoided sounds from an impulsive source at levels
of 165 to 170 dB re 1 µPa (Finneran et al. 2003b).
Experimentally, Götz and Janik (2011) tested underwater responses to a startling sound (sound
with a rapid rise time and a 93 dB sensation level [the level above the animal's threshold at that
frequency]) and a non-startling sound (sound with the same level, but with a slower rise time) in
wild-captured gray seals. The animals exposed to the startling treatment avoided a known food
source, whereas animals exposed to the non-startling treatment did not react or habituated during
the exposure period. The results of this study highlight the importance of the characteristics of
the acoustic signal in an animal’s habituation.
6.3.10.3 Behavioral Reactions of Marine Mammals to Non-Impulsive Sources
The following sections describe the behavioral reactions of marine mammals to non-impulsive
sound sources such as sonar.
6.3.10.3.1 Mysticetes
Specific to Navy systems using low frequency sound, studies were undertaken pursuant to the
Navy’s Low Frequency Sound Scientific Research Program. These studies found only short-term
responses to low frequency sound by mysticetes (fin, blue, and humpback whales) including
changes in vocal activity and avoidance of the source vessel (Clark and Fristrup 2001; Croll et al.
2001b; Fristrup et al. 2003; Miller et al. 2000; Nowacek et al. 2007). Work by Risch et al. (2012)
found that humpback whale vocalizations were reduced concurrently with pulses from the low
frequency Ocean Acoustic Waveguide Remote Sensing (OAWRS) source located approximately
200 km away. However, (Gong et al. 2014), disputes these findings, suggesting that Risch et al.
(2012) mistakes natural variations in humpback whale song occurrence for changes caused by
OAWRS activity approximately 200 km away. Risch et al. (2014) responded to Gong et al.
(2014) and highlighted the context-dependent nature of behavioral responses to acoustic
stressors.
380
Biological Opinion and Conference Report on Navy NWTT Activities and NMFS’ MMPA Incidental Take
Authorization PCTS FPR-2015-9110
Baleen whales exposed to moderate low-frequency signals demonstrated no variation in foraging
activity (Croll et al. 2001b). However, five out of six North Atlantic right whales exposed to an
acoustic alarm interrupted their foraging dives, although the alarm signal was long in duration,
lasting several minutes, and purposely designed to elicit a reaction from the animals as a
prospective means to protect them from ship strikes (Nowacek et al. 2004). Although the
animal’s received sound pressure level was similar in the latter two studies (133 to 150 dB re 1
µPa), the frequency, duration, and temporal pattern of signal presentation were different.
Additionally, the right whales did not respond to playbacks of either right whale social sounds or
vessel noise, highlighting the importance of the sound characteristics, species differences, and
individual sensitivity in producing a behavioral reaction.
Low-frequency signals of the Acoustic Thermometry of Ocean Climate sound source were not
found to affect dive times of humpback whales in Hawaiian waters (Frankel and Clark 2000) or
to overtly affect elephant seal dives off California (Costa et al. 2003). However, they did produce
subtle effects that varied in direction and degree among the individual seals, again illustrating the
uncertain nature of behavioral effects and consequent difficulty in defining and predicting them.
Despite previous assumptions based on vocalizations and anatomy that blue whales
predominantly hear low-frequency sounds below 400 Hz (Croll et al. 2001b; Oleson et al. 2007b;
Stafford and Moore 2005a), preliminary results from the 2010 and 2011 field seasons of an
ongoing behavioral response study in Southern California waters indicated that in some cases
and at low received levels, tagged blue whales responded to mid-frequency sonar. However,
those responses were mild and there was a quick return to their baseline activity (Southall et al.
2011a). Blue whales appeared to ignore sonar transmissions at received levels lower than
approximately 150 dB and generally ignored received levels greater than these when they were
engaged in feeding behavior (Southall et al. 2011a).
Goldbogen et al. (2013) used DTAGs to test the response of blue whales in the Southern
California Bight to playbacks of simulated MFA sonar. Source levels of simulated sonar and
control sounds (pseudo-random noise or PRN) in the 3.5 to 4.0 kHz range were ramped up in 3
dB increments from 160 to 210 dB re 1 µPa. Responses varied depending on the whales’ prior
behavioral state: surface feeding whales showed no response, while deep feeding whales and
whales that were not feeding were affected. Responses among affected animals ranged from
termination of deep foraging dives to prolonged mid-water dives. The reactions were context
dependent, leading the authors to conclude a combination of received sound level and the
behavioral state of the animal are likely to influence behavioral response. The authors note that
whales responded even at low SPLs, suggesting that received level alone may not be a reliable
predictor of behavior. Goldbogen et al. (2013) noted that behavioral responses observed were
temporary and whales typically resumed normal behavior quickly after the cessation of sound
exposure. Perhaps the most significant response documented in the study resulted from an
381
Biological Opinion and Conference Report on Navy NWTT Activities and NMFS’ MMPA Incidental Take
Authorization PCTS FPR-2015-9110
experiment involving PRN rather than simulated sonar, which corresponded with a blue whale
terminating a foraging bout. The more significant reaction to PRN may be indicative of
habituation to mid-frequency sonar signals; the authors noted that the responses they documented
were in a geographical region with a high level of naval activity and where mid-frequency sonar
use is common.
Melcon et al. (2012) tested whether MFA sonar and other anthropogenic noises in the mid-
frequency band affected the “D-calls” produced by blue whales in the Southern California Bight.
The authors used passive acoustic monitoring data recorded with stationary High-frequency
Acoustic Recording Packages in the Southern California Bight. The likelihood of an animal
calling decreased with the increased received level of mid-frequency sonar, beginning at a sound
pressure level of approximately 110 to 120 dB re 1 µPa. Observations indicated that after sonar
cessation, blue whales start producing D calls again. The authors concluded that blue whales
heard and devoted attention to the sonar, despite its high frequency (relative to their putative
hearing sensitivity) and its low received level. However, the authors noted that while D calls are
typically associated with blue whale foraging behavior, they were unable to determine if
suppression of D calls reflected a change in their feeding performance or abandonment of
foraging behavior.
Martin et al. (2015a) used bottom mounted hydrophone arrays to estimate minke whale densities
in the Pacific Missile Range Facility (PMRF) located off Kauai, Hawaii before, during, and after
Navy training events involving active sonar. The study indicated minke whales decreased calling
during the transmission of MFA sonar, but could not determine whether or not the whales left the
area. The authors also suggested the presence of Naval surface ships during MFA transmission
should be considered as a factor in the cessation of calling, rather than assuming the MFA sonar
itself is the sole cause for the cessation of calling.
6.3.10.3.2 Odontocetes
From 2007 to present, behavioral response studies have been conducted through the
collaboration of various research organizations in the Bahamas, Southern California,
Mediterranean, Cape Hatteras, and Norwegian waters. These studies attempted to define and
measure responses of beaked whales and other cetaceans to controlled exposures of sonar and
other sounds to better understand their potential impacts. Results from the 2007 to 2008 study
conducted near the Bahamas showed a change in diving behavior of an adult Blainville's beaked
whale to playback of mid-frequency source and predator sounds (Boyd et al. 2008; Southall et al.
2009; Tyack et al. 2011c). Reaction to mid-frequency sounds included premature cessation of
clicking, termination of a foraging dive, and a slower ascent rate to the surface. Preliminary
results have been presented for the behavioral response study in Southern California waters (e.g.,
(Boyd et al. 2008; Southall et al. 2013; Southall et al. 2012a; Southall et al. 2011a).
382

Biological Opinion and Conference Report on Navy NWTT Activities and NMFS’ MMPA Incidental Take Authorization PCTS FPR-2015-9110
For example, Stimpert et al. (2014) tagged a Baird’s beaked whale and exposed it to simulated
mid-frequency sonar. Some changes in the animal’s dive behavior and locomotion were
observed when received level reached 127 dB re 1µPa. Deruiter et al. (2013b) presented results
from two Cuvier’s beaked whales that were tagged and exposed to simulated MFA sonar during
the 2010 and 2011 field seasons of the southern California behavioral response study. The 2011
whale was also incidentally exposed to MFA sonar from a distant naval exercise. Received levels
from the MFA sonar signals from the controlled and incidental exposures were calculated as 84
to 144 and 78 to 106 dB re 1 µPa root mean square, respectively. Both whales showed responses
to the controlled exposures, ranging from initial orientation changes to avoidance responses
characterized by energetic fluking and swimming away from the source. However, the authors
did not detect similar responses to incidental exposure to distant naval sonar exercises at
comparable received levels, indicating that context of the exposures (e.g., source proximity,
controlled source ramp-up) may have been a significant factor. Cuvier's beaked whale responses
suggested particular sensitivity to sound exposure as consistent with results for Blainville’s
beaked whale. Similarly, beaked whales exposed to sonar during British training exercises
stopped foraging (DSTL 2007).
Miller et al. (2011) reported on behavioral responses of pilot whales, killer whales, and sperm
whales off Norway to Norwegian Navy mid-frequency sonar sources (a 3-year effort called the
3S experiments) (see also (Antunes et al. 2014; Kuningas et al. 2013; Kvadsheim et al. 2011;
Miller et al. 2014; Miller et al. 2012; Sivle et al. 2012)). Reactions at different distances and
received levels were variable, and types of responses observed included cessation of feeding,
avoidance, changes in vocalizations, and changes in dive behavior. Some exposures elicited no
observable reactions, and others resulted in brief or minor reactions, such as minor changes in
vocalizations or locomotion. The experimental exposures occurred across different behavioral
and environmental contexts, which may have played a role in the type of response observed, at
least for killer whales (Miller et al. 2014). Some aspects of the experiment differ from typical
Navy actions and may have exacerbated observed reactions; for example, animals were directly
approached by the source vessel, researchers conducted multiple approaches toward the same
animal groups over the course of each session, some exposures were conducted in
bathymetrically restricted areas, and, in some cases, researchers “leapfrogged” the boat to
repeatedly move ahead of the animals in order to repeatedly approach animals on their travel
path. For example, separation of a killer whale calf from its mother occurred during the fifth
vessel approach towards a killer whale group in a fjord. In contrast, Navy vessels avoid
approaching marine mammals head-on, and vessels will maneuver to maintain a distance of at
least 500 yd. (457 m) from observed animals. Furthermore, Navy mitigation measures would
dictate powerdown of hull-mounted ASW sonars within 1,000 yd. (914m) of marine mammals
and ultimately shutdown if an animal is within 200 yd. (183 m).
383
Biological Opinion and Conference Report on Navy NWTT Activities and NMFS’ MMPA Incidental Take
Authorization PCTS FPR-2015-9110
In the 2007 to 2008 Bahamas study, playback sounds of a potential predator— a killer whale—
resulted in a similar but more pronounced reaction, which included longer inter-dive intervals
and a sustained straight-line departure of more than 20 km from the area. The authors noted,
however, that the magnified reaction to the predator sounds could represent a cumulative effect
of exposure to the two sound types since killer whale playback began approximately 2 hours after
mid-frequency source playback (Boyd et al. 2008; Tyack et al. 2011c). In contrast, preliminary
analyses suggest that none of the pilot whales or false killer whales in the Bahamas showed an
avoidance response to controlled exposure playbacks (Southall et al. 2009).
Through analysis of the behavioral response studies, a preliminary overarching effect of greater
sensitivity to all anthropogenic exposures was seen in beaked whales compared to the other
odontocetes studied (Southall et al. 2009). Therefore, recent studies have focused specifically on
beaked whale responses to MFA sonar transmissions or controlled exposure playback of
simulated sonar on various military ranges (Claridge and Durban 2009; DSTL 2007; McCarthy
et al. 2011; Moretti 2009; Tyack et al. 2011c). In the Bahamas, Blainville’s beaked whales
located on the range will move off-range during MFA sonar use and return only after the sonar
transmissions have stopped, sometimes taking several days to do so (Claridge and Durban 2009;
McCarthy et al. 2011; Moretti 2009; Tyack et al. 2011c). Moretti et al. (2014) used recordings
from seafloor mounted hydrophones at the Atlantic Undersea Test and Evaluation Center
(AUTEC) to analyze the probability of Blainsville’s beaked whale dives before, during, and after
Navy sonar exercises. They developed an empirical risk function and predicted a 0.5 probability
of disturbance at received levels of 150 dB.
Claridge (2013) used photo-recapture methods to estimate population abundance and
demographics of Blainville’s beaked whale (Mesoplodon densirostris) in the Bahamas at two
sample locations; one within the bounds of the AUTEC where sonar training occurs and the
second along the edge of Abaco Island approximately 170 km to the north. To investigate the
potential effect of beaked whale exposure to MFA sonar, Claridge assumed that the two sample
sites should have equal potential abundances and hypothesized that a lower abundance found at
the AUTEC was due to either reduced prey availability at AUTEC or due to population level
effects from the exposure to MFA sonar at AUTEC.
There are two major issues with this study. First, all of the re-sighted whales during the 5-year
study at both sites were female. Claridge acknowledges that this can lead to a negative bias in the
estimation of abundances. It has been shown in other cetacean species that females with calves
may prefer “nursery” habitats or form nursery groups with other mother-calf pairs (e.g.,
(Claridge 2006; Scott et al. 1990; Weir et al. 2008)). It may be that the site at Abaco is a
preferred site for females with calves, while the site at AUTEC is not, and therefore over the 5
year study period fewer females with calves were observed at AUTEC as these females went
elsewhere in the area during the 3-year weaning period. In addition, Marques et al. (2009)
384
Biological Opinion and Conference Report on Navy NWTT Activities and NMFS’ MMPA Incidental Take
Authorization PCTS FPR-2015-9110
estimated the Blainville’s beaked whale population at AUTEC to be between 22.5 and 25.3
animals per 1,000 km2. This density was estimated over 6 days using passive acoustic methods,
which is a method Claridge identified as one that may be better for estimating beaked whale
densities than visual methods. The results at AUTEC are also biased by reduced effort and a
shorter overall study period that did not capture some of the emigration/immigration trends
Claridge identified at Abaco. For these reasons among others, it is unclear whether there are
significant differences in the abundances between the two sites.
Second, Claridge assumed that the two sites are identical and therefore should have equal
potential abundances; Abaco is a “control” site with the difference being the use of sonar at
AUTEC. Although the sample boundaries at each location were drawn to create samples “of
comparable size,” there are differences between the two sample area locations as follows: the
Abaco site is along a leeward shore, AUTEC is windward; the Abaco sample area is a long
narrow margin along a canyon wall, the rectangular AUTEC sample site is a portion of a deep
and landlocked U-shaped trough. In addition to the physical differences, Claridge notes that it
remains unclear whether or not variation in productivity between sites influenced what she refers
to as the substantial differences in abundance. Claridge reports that a study investigating prey
distributions at her sample locations was unable to sample prey at the beaked whale foraging
depth. Claridge dismisses the possibility of differences in prey availability between the sites
noting that there is no supporting evidence that prey availability differs between the two sites. As
this study illustrates, the multiple and complex factors required by investigations of potential
long-term cause and effect from actions at sea require a comprehensive assessment of all factors
influencing potential trends in species abundances that are not likely attributable to a single cause
and effect.
In the Caribbean, research on sperm whales in 1983 coincided with the U.S. intervention in
Grenada. Sperm whales interrupted their activities by stopping echolocation and leaving the area.
This response was assumed to be the result of underwater sounds originating from submarine
mid to high-frequency sonar signals (Watkins et al. 1985b; Watkins and Schevill 1975a). The
authors did not provide any sound levels associated with these observations, although they did
note getting a similar reaction from banging on their boat hull. It was unclear if the sperm whales
were reacting to the sonar signal itself or to a potentially new unknown sound as had been
demonstrated on another occasion during which sperm whales in the Caribbean stopped
vocalizing when presented with sounds from nearby acoustic pingers (Watkins and Schevill
1975a).
Researchers at the Navy's Marine Mammal Program facility in San Diego, California have
conducted a series of controlled experiments on bottlenose dolphins and beluga whales to study
TTS (Finneran 2010; Finneran 2011; Finneran et al. 2001; Finneran et al. 2003a; Finneran et al.
2010; Finneran and Schlundt 2004; Schlundt et al. 2000a). Ancillary to the TTS studies,
385
Biological Opinion and Conference Report on Navy NWTT Activities and NMFS’ MMPA Incidental Take
Authorization PCTS FPR-2015-9110
scientists evaluated whether the marine mammals performed their trained tasks when prompted,
during and after exposure to mid-frequency tones. Altered behavior during experimental trials
usually involved refusal of animals to return to the site of the sound stimulus. This refusal
included what appeared to be deliberate attempts to avoid a sound exposure or to avoid the
location of the exposure site during subsequent tests (Finneran et al. 2002; Schlundt et al. 2000a).
Bottlenose dolphins exposed to 1-second tones exhibited short-term changes in behavior above
received sound levels of 178 to 193 dB re 1 µPa root mean square, and beluga whales did so at
received levels of 180 to 196 dB re 1 µPa and above. In some instances, animals exhibited
aggressive behavior toward the test apparatus (Ridgway et al. 1997; Schlundt et al. 2000a).
While these studies were not designed to test avoidance behavior and animals were commonly
reinforced with food, the controlled environment and ability to measure received levels provide
insight on received levels at which animals will behaviorally responds to noise sources. More
recently, a controlled-exposure study was conducted with Navy bottlenose dolphins at the Navy
Marine Mammal Program facility specifically to study behavioral reactions to simulated mid-
frequency sonar (Houser et al. 2013). Animals were trained to swim across a pen, touch a panel,
and return to the starting location. During transit, a simulated mid-frequency sonar signal was
played. Behavioral reactions were more likely with increasing received level and included
increased respiration rates, fluke or pectoral fin slapping, and refusal to participate, among
others. From these data, it was determined that bottlenose dolphins were more likely to respond
to the initial trials, but habituated to the sound over the course of 10 trials except at the highest
received levels. All dolphins responded at the highest received level (185 dB re 1 µPa).
Studies with captive harbor porpoises showed increased respiration rates upon introduction of
acoustic alarms, such as those used on fishing nets to help deter marine mammals from becoming
caught or entangled (Kastelein et al. 2001; Kastelein et al. 2006a) and emissions for underwater
data transmission (Kastelein et al. 2005). However, exposure of the same acoustic alarm to a
striped dolphin under the same conditions did not elicit a response (Kastelein et al. 2006b), again
highlighting the importance in understanding species differences in the tolerance of underwater
noise (Southall et al. 2007b). Henderson et al. (2014) observed behavioral responses of
delphinids to MFA sonar in the Southern California Bight from 2004 to 2008. The authors
observed responses ranging from changes in behavioral state or direction of travel, to changes in
vocalization activity. Behavioral responses were generally observed at received sound pressure
levels ranging from 107 to 117 dBrms re: 1 µPa. We are not reasonably certain that exposure to
such sound pressure levels will elicit a substantive behavioral reaction and rise to the level of
take per the ESA.
6.3.10.4 Pinnipeds
Different responses displayed by captive and wild phocid seals to sound judged to be
‘unpleasant’ have been reported; where captive seals habituated (did not avoid the sound), and
386
Biological Opinion and Conference Report on Navy NWTT Activities and NMFS’ MMPA Incidental Take
Authorization PCTS FPR-2015-9110
wild seals showed avoidance behavior (Götz and Janik 2011). Captive seals received food
(reinforcement) during sound playback, while wild seals were exposed opportunistically. These
results indicate that motivational state (e.g., reinforcement via food acquisition) can be a factor in
whether or not an animal habituates to novel or unpleasant sounds. Another study found that
captive hooded seals reacted to 1 to 7 kHz sonar signals by moving to the areas of least sound
pressure level, at levels between 160 and 170 dB re 1 µPa (Kvadsheim et al. 2010).
Captive studies with other pinnipeds have shown a reduction in dive times when presented with
qualitatively ‘unpleasant’ sounds. These studies indicated that the subjective interpretation of the
pleasantness of a sound, minus the more commonly studied factors of received sound level and
sounds associated with biological significance, can affect diving behavior (Götz and Janik 2011).
More recently, a controlled-exposure studies was conducted with U.S. Navy California sea lions
(Zalophus californianus) at the Navy Marine Mammal Program facility specifically to study
behavioral reactions (Houser et al. 2013). Animals were trained to swim across a pen, touch a
panel, and return to the starting location. During transit, a simulated mid-frequency sonar signal
was played. Behavioral reactions included increased respiration rates, prolonged submergence,
and refusal to participate, among others. Younger animals were more likely to respond than older
animals, while some sea lions did not respond consistently at any level.
6.3.11 Repeated Exposures of Marine Mammals
Navy sonar systems are generally deployed from highly mobile vessels or in-water devices
which do not directly target marine mammals. Further, the typical duty cycle with most tactical
anti-submarine warfare is lower than used in the controlled exposure experiments described
above, transmitting about once per minute (Navy 2013). For example, a typical Navy vessel with
hull mounted MFA sonar would travel over 0.3 kilometers between pings (based on a speed of
10 knots/hr and transmission rate of 1 ping/min). Based on this distance traveled and potential
avoidance behavior of acoustically exposed animals, we expect repeat acoustic exposures
capable of eliciting a behavioral response to an individual over a brief period of time to be rare.
For sonar devices that are stationary (e.g. dipped sonar), due to the duty cycle, duration of active
transmission in a specific location, and mitigation measures (e.g. avoidance of visible marine
mammals), we would not expect repeated exposures.
Some individuals may be exposed to multiple sound-producing activities over a season, year, or
life stage. Repeated exposure to acoustic and other anthropogenic stimuli has been studied in
several cases, especially as related to vessel traffic and whale watching. Common dolphins in
New Zealand responded to dolphin-watching vessels by interrupting foraging and resting bouts,
and took longer to resume behaviors in the presence of the vessel (Stockin 2008). Bejder et al.
(2006a) studied responses of bottlenose dolphins to vessel approaches and found shorter lasting
reactions in populations exposed to higher levels of vessel traffic. The authors indicated that
387
Biological Opinion and Conference Report on Navy NWTT Activities and NMFS’ MMPA Incidental Take
Authorization PCTS FPR-2015-9110
lesser reactions in populations of dolphins regularly subjected to high levels of vessel traffic
could be a sign of habituation, or it could be that the more sensitive animals in this population
previously abandoned the area of higher human activity.
Marine mammals exposed to high levels of human activities may leave the area, habituate to the
activity, or tolerate the disturbance and remain in the area. Individual marine mammals that are
more tolerant may stay in a disturbed area, whereas individuals that are more sensitive may leave
for areas with less human disturbance. Animals that remain throughout the disturbance may be
unable to leave the area for a variety of physiological or environmental reasons. However, given
the highly migratory, wide ranging life histories, and open ocean environments of the species
considered in this Opinion, we do not believe this will result from Navy training and testing
activities in the NWTT Action Area. Longer-term displacement can lead to changes in
abundance or distribution patterns of the species in the affected region if they do not become
acclimated to the presence of the sound (Bejder et al. 2006b; Blackwell et al. 2004; Teilmann et
al. 2006). Gray whales in Baja California abandoned a historical breeding lagoon in the mid
1960s due to an increase in dredging and commercial shipping operations. Whales did repopulate
the lagoon after shipping activities had ceased for several years (Bryant et al. 1984). Over a
shorter time scale, studies on the Atlantic Undersea Test and Evaluation Center instrumented
range in the Bahamas have shown that some Blaineville's beaked whales may be resident during
all or part of the year in the area, and that individuals may move off of the range for several days
during and following a sonar event. However animals are thought to continue feeding at short
distances (a few kilometers) from the range out of the louder sound fields (less than 157 dB re 1
µPa) (McCarthy et al. 2011; Tyack et al. 2011c). Mysticetes in the northeast tended to adjust to
vessel traffic over a number of years, trending towards more neutral responses to passing vessels
(Watkins 1986) indicating that some animals may habituate or otherwise learn to cope with high
levels of human activity. Nevertheless, the long-term consequences of these habitat utilization
changes are unknown, and likely vary depending on the species, geographic areas, and the degree
of acoustic or other human disturbance.
Moore and Barlow (2013) have noted a decline in beaked whales in a broad area of the Pacific
Ocean area out to 300 nm from the coast and extending from the Canadian-U.S. border to the tip
of Baja Mexico. There are scientific caveats and limitations to the data used for that analysis, as
well as oceanographic and species assemblage changes not thoroughly addressed in Moore and
Barlow (2013), although the authors suggest Navy sonar as one possible explanation for the
apparent decline in beaked whale numbers over that broad area. In the small portion of the
Pacific coast overlapping the Navy's SOCAL Range Complex, long-term residency by individual
Cuvier's beaked whales and documented higher densities of beaked whales provide indications
that the proposed decline in numbers elsewhere along the Pacific coast is not apparent where the
Navy has been intensively training with sonar and other systems for decades. While it is possible
that a downward trend in beaked whales may have gone unnoticed at the range complex (due to a
388
Biological Opinion and Conference Report on Navy NWTT Activities and NMFS’ MMPA Incidental Take
Authorization PCTS FPR-2015-9110
lack of survey precision) or that beaked whale densities may have been higher before the Navy
began using sonar more than 60 years ago, there is no data available to suggest that beaked whale
numbers have declined on the range where Navy sonar use has routinely occurred. As Moore and
Barlow (2013) point out, it remains clear that the Navy range in SOCAL continues to support
high densities of beaked whales. Furthermore, a large part of the U.S. West Coast Action Area
used by Moore and Barlow (2013) in their assessment of possible reasons for the decline include
vast areas where the Navy does not conduct in-water training with sonar or explosives.
Establishing a causal link between anthropogenic noise, animal communication, and individual
impacts as well as population viability is difficult to quantify and assess (McGregor 2013; Read
et al. 2014). Assessing the effects of sounds, both individually and cumulatively, on marine
species is difficult because responses depend on a variety of factors including age class, prior
experience, behavioral state at the time of exposure, and indirect effects. Responses may be also
be influenced by other non-sound related factors (Ellison et al. 2011; Goldbogen et al. 2013;
Kight and Swaddle 2011; McGregor 2013; Read et al. 2014; Williams et al. 2014a). McGregor
(2013) summarized sound impacts and described two types of possible effects based on the
studies they reviewed: 1) an apparent effect of noise on communication, but with a link between
demonstrated proximate cost and ultimate cost in survival or reproductive success being inferred
rather than demonstrated, and 2) studies showing a decrease in population density or diversity in
relation to noise, but with a relationship that is usually a correlation, so factors other than noise
or its effect on communication might account for the relationship. Within the ocean environment,
aggregate anthropogenic impacts have to be considered in context of natural variation and
climate change (Boyd and Hutchins 2012). These contexts can include additive effects from two
or more factors, multiplicity where response from two or more factors is greater than the sum of
individual effects, synergism between factors and response, antagonism as a negative feedback
between factors, acclimation as a short-term individual response, and adaptation as a long-term
population change (Boyd and Hutchins 2012). To address aggregate impacts and responses from
any changes due to processes such as habituation, tolerance, and sensitization, future
experiments over an extended period of time still need further research (Bejder et al. 2009;
Blickley et al. 2012; Read et al. 2014).
Some, including Goldbogen et al. (2013) and Stockin et al. (2008) have speculated that repeated
interruptions of a marine mammal’s normal activity could lead to fitness consequences and
eventually, long-term implications for the population. However, to our knowledge, empirical
data has not confirmed this to be the case. For example, Goldbogen et al. (2013) suggested that
if a blue whale responded to MFA sonar by temporarily interrupting feeding behavior, this could
have impacts on individual fitness and eventually, population health. However, for this to be
true, we would have to assume that an individual whale could not compensate for this lost
feeding opportunity by either immediately feeding at another location, by feeding shortly after
cessation of acoustic exposure, or by feeding at a later time. There is no indication this is the
389
Biological Opinion and Conference Report on Navy NWTT Activities and NMFS’ MMPA Incidental Take
Authorization PCTS FPR-2015-9110
case, particularly since unconsumed prey would still be available in the environment following
the cessation of acoustic exposure.
If sound exposure were to be concentrated in a relatively small geographic area over a long
period of time (e.g., days or weeks), it would be possible for individuals confined to a specific
area to be exposed to acoustic stressors (e.g., MFA sonar) multiple times during a relatively short
time period. However, we do not expect this to occur as we would expect individuals to move
and avoid areas where exposures to acoustic stressors are at higher levels (e.g., greater than
120dB). For example, Goldbogen et al. (2013) indicated some horizontal displacement of deep
foraging blue whales in response to simulated MFA sonar. Given these animal’s mobility and
large ranges, we would expect these individuals to temporarily select alternative foraging sites
nearby until the exposure levels in their initially selected foraging area have decreased.
Therefore, even temporary displacement from initially selected foraging habitat is not expected
to impact the fitness of any individual animals because we would expect equivalent foraging to
be available in close proximity. Because we do not expect any fitness consequences from any
individual animals, we do not expect any population level effects from these behavioral
responses.
6.3.12 Stranding
When a marine mammal swims or floats (live or dead) onto shore and becomes “beached” or
incapable of returning to sea, the event is termed a “stranding” (Geraci et al. 1999; Geraci and
Lounsbury 2005). Animals outside of their “normal” habitat are also sometimes considered
“stranded” even though they may not have beached themselves. The legal definition for a
stranding within the United States is that: (A) a marine mammal is dead and is (i) on a beach or
shore of the United States; or (ii) in waters under the jurisdiction of the United States (including
any navigable waters); or (B) a marine mammal is alive and is (i) on a beach or shore of the
United States and is unable to return to the water; (ii) on a beach or shore of the United States
and, although able to return to the water, is apparently in need of medical attention; or (iii) in the
waters under the jurisdiction of the United States (including any navigable waters), but is unable
to return to its natural habitat under its own power or without assistance” (16 United States Code
Section 1421h).
Marine mammals are subjected to a variety of natural and anthropogenic factors, acting alone or
in combination, which may cause a marine mammal to strand on land or die at-sea (Geraci et al.
1999; Geraci and Lounsbury 2005). Even for the fractions of more thoroughly investigated
strandings involving post-stranding data collection and necropsies, the cause (or causes) for the
majority of strandings remain undetermined. Natural factors related to strandings include the
availability of food, predation, disease, parasitism, climatic influences, and aging (Bradshaw et
al. 2006; Culik 2004; Geraci et al. 1999; Geraci and Lounsbury 2005; Hoelzel 2003; NRC
390
Biological Opinion and Conference Report on Navy NWTT Activities and NMFS’ MMPA Incidental Take
Authorization PCTS FPR-2015-9110
2003a; Perrin and Geraci 2002; Walker et al. 2005). Anthropogenic factors include pollution
(Anonmyous 2010; Elfes et al. 2010; Hall et al. 2006a; Hall et al. 2006b; Jepson et al. 2005;
Tabuchi et al. 2006), vessel strike (Berman-Kowalewski et al. 2010; De Stephanis and Urquiola
2006; Geraci and Lounsbury 2005; Jensen and Silber 2003; Laist et al. 2001), fisheries
interactions (Look 2011; Read et al. 2006), entanglement (Baird and Gorgone 2005; Johnson et
al. 2005; Saez et al. 2013), and noise (Cox et al. 2006; NRC 2003a; Richardson et al. 1995d).
Along the coasts of the continental United States and Alaska between 2001 and 2009, there were
approximately 1,400 cetacean strandings and 4,300 pinniped strandings (5,700 total) per year
(NMFS 2011j; NMFS 2011k; NMFS 2011m). Several “mass stranding” events—strandings that
involve two or more individuals of the same species (excluding a single cow-calf pair)—that
have occurred over the past two decades have been associated with naval operations, seismic
surveys, and other anthropogenic activities that introduced sound into the marine environment.
An in-depth discussion of strandings is presented in DoN (2013b).
Sonar use during exercises involving Navy (most often in association with other nations' defense
forces) has been identified as a contributing cause or factor in five specific mass stranding
events: Greece in 1996; the Bahamas in March 2000; Madeira Island, Portugal in 2000; the
Canary Islands in 2002, and Spain in 2006 (MMC 2006). While not considered an official
stranding event pursuant to U.S. law, these five mass stranding events have resulted in
approximately 40 known stranding deaths among cetaceans, consisting mostly of beaked whales,
with a potential link to sonar (ICES 2005a; ICES 2005b; ICES 2005c). The U.S.-Navy-funded
research involving Behavioral Response Studies in SOCAL and the Bahamas discussed
previously were motivated by the desire to understand any links between the use of mid-
frequency sonar and cetacean behavioral responses, including the potential for strandings.
Although these events have served to focus attention on the issue of impacts resulting from the
use of sonar, as Ketten (2012) recently pointed out, “ironically, to date, there has been no
demonstrable evidence of acute, traumatic, disruptive, or profound auditory damage in any
marine mammal as the result [of] anthropogenic noise exposures, including sonar.”
In these previous circumstances, exposure to non-impulsive acoustic energy has been considered
a potential indirect cause of the death of marine mammals (Cox et al. 2006). One hypothesis
regarding a potential cause of the strandings is tissue damage resulting from “gas and fat embolic
syndrome” (Fernandez et al. 2005a; Jepson et al. 2003; Jepson et al. 2005). Models of nitrogen
saturation in diving marine mammals have been used to suggest that altered dive behavior might
result in the accumulation of nitrogen gas such that the potential for nitrogen bubble formation is
increased (Houser 2010; Houser et al. 2001b; Zimmer and Tyack 2007). If so, this mechanism
might explain the findings of gas and bubble emboli in stranded beaked whales. It is also
possible that stranding is a behavioral response to a sound under certain contextual conditions
and that the subsequently observed physiological effects (e.g., overheating, decomposition, or
391
Biological Opinion and Conference Report on Navy NWTT Activities and NMFS’ MMPA Incidental Take
Authorization PCTS FPR-2015-9110
internal hemorrhaging from being on shore) were the result of the stranding rather than direct
physical impact from exposure to sonar (Cox et al. 2006).
In May 2003 there was an incident involving the use of mid-frequency sonar by the USS
SHOUP, which was portrayed in some media reports at the time as having potentially causing
harbor porpoise strandings in the region. On May 5, 2003, in the area of Admiralty Inlet, the USS
SHOUP began the use of mid-frequency sonar as part of a training event, which continued until
later that afternoon and ended as the USS SHOUP transited Haro Strait heading north. Between
May 2 and June 2, 2003, approximately 16 strandings involving 15 harbor porpoises (Phocoena
phocoena) and 1 Dall’s porpoise (Phocoenoides dalli) had been reported to the Northwest
Marine Mammal Stranding Network, and allegations were made that these strandings had been
caused by the USS SHOUP’s use of sonar. A comprehensive review of all strandings and the
events involving USS SHOUP on May 5, 2003, were subsequently presented in a report by U.S.
Department of Navy (DON 2004).
Additionally NMFS undertook a series of necropsy analyses on the stranded animals to
determine the cause of the strandings (NMFS 2005a; Norman et al. 2004a). Necropsies were
performed on 10 of the porpoises and two heads were selected for computed tomographic
imaging (Norman et al. 2004a).
None of the 11 harbor porpoises demonstrated signs of acoustic trauma. A putative cause of
death was determined for five of the porpoises based only on the necropsy results; two animals
had blunt trauma injuries and three animals had indication of disease processes. A cause of death
could not be determined in the remaining animals, which is consistent with the expected
percentage of marine mammal necropsies conducted within the northwest region. It is important
to note, that these determinations were based only on the evidence from the necropsy to avoid
bias with regard to determinations of the potential presence or absence of acoustic trauma. For
example, the necropsy investigators had no knowledge of other potential external causal factors,
such as Specimen 33NWR05005 having been found tangled in a fishing net, which may have
otherwise assisted in their determination regarding the likely cause of death for that animal.
Additionally, seven of the porpoises collected and analyzed died prior to SHOUP departing to
sea on May 5, 2003. Of these seven, one, discovered on May 5, 2003, was in a state of moderate
decomposition, indicating it died before May 5; the cause of death was determined, most likely,
to be Salmonella septicemia. Another porpoise, discovered at Port Angeles on May 6, 2003, was
in a state of moderate decomposition, indicating that this porpoise also died prior to May 5. One
stranded harbor porpoise discovered fresh on May 6 is the only animal that could potentially be
linked to the USS SHOUP’s May 5 active sonar use. Necropsy results for this porpoise found no
evidence of acoustic trauma. The remaining eight strandings were discovered 1 to 3 weeks after
the USS SHOUP’s May 5 use of sonar. Two of the eight porpoises died from blunt trauma injury
392
Biological Opinion and Conference Report on Navy NWTT Activities and NMFS’ MMPA Incidental Take
Authorization PCTS FPR-2015-9110
and a third suffered from parasitic infestation, which possibly contributed to its death (Norman et
al. 2004a). For the remaining five porpoises, NMFS was unable to identify the causes of death.
NMFS concluded from a retrospective analysis of stranding events that the number of harbor
porpoise stranding events in the approximate month surrounding the USS SHOUP’s use of sonar
was higher than expected based on annual strandings of harbor porpoises (Norman et al. 2004a).
This conclusion in the NMFS report also conflicts with data from The Whale Museum, which
has documented and responded to harbor porpoise strandings since 1980 (Osborne 2003).
According to The Whale Museum, the number of strandings as of May 15, 2003, was consistent
with what was expected based on historical stranding records and was less than that occurring in
certain years. For example, since 1992, the San Juan Stranding Network has documented an
average of 5.8 porpoise strandings per year. In 1997, there were 12 strandings in the San Juan
Islands, with more than 30 strandings throughout the general Puget Sound area. In reporting their
findings, NMFS acknowledged that the intense level of media attention to the 2003 strandings
likely resulted in increased reporting effort by the public over that which is normally observed
(Norman et al. 2004a). NMFS also noted in its report that the “sample size is too small and
biased to infer a specific relationship with respect to sonar usage and subsequent strandings.” It
was also clear that in 2003, the number of strandings from May to June was also higher for the
outer coast, indicating a much wider phenomena than use of sonar by USS SHOUP in Puget
Sound for one day in May. It was later determined by NMFS that the number of harbor porpoise
strandings in the northwest had been increased beginning in 2003 and through 2006. On
November 3, 2006, an Unusual Mortality Event in the Pacific Northwest was declared by NMFS
(see (DoN 2013b), Cetacean Stranding Report for more detail on this Unusual Mortality Event).
The speculative association of the harbor porpoise strandings to the use of sonar by the USS
SHOUP was inconsistent with prior stranding events linked to the use of mid-frequency sonar.
Specifically, in prior events strandings occurred shortly after the use of sonar (less than 36 hours)
and stranded individuals were spatially co-located. Although MFA sonar was used by the USS
SHOUP, the distribution of harbor porpoise strandings by location and with respect to time
surrounding the event do not support the suggestion that MFA sonar was a cause of harbor
porpoise strandings. Rather, a lack of evidence of any acoustic trauma within the harbor
porpoises, and the identification of probable causes of stranding or death in several animals,
supports the conclusion that harbor porpoise strandings in 2003 in the Pacific Northwest were
unrelated to the sonar activities by the USS SHOUP.
As the ICES (2005c) noted, taken in context of marine mammal populations in general, sonar is
not a major threat, or significant portion of the overall ocean noise budget. This has also been
demonstrated by monitoring in areas where the Navy operates (Bassett et al. 2010; Baumann-
Pickering et al. 2010; Hildebrand et al. 2011; McDonald et al. 2006a; Tyack et al. 2011a).
Regardless of the direct cause, the Navy considers potential sonar related strandings important
393
Biological Opinion and Conference Report on Navy NWTT Activities and NMFS’ MMPA Incidental Take
Authorization PCTS FPR-2015-9110
and continues to fund research and work with scientists to better understand circumstances that
may result in strandings. During a Navy training event on March 4, 2011, at the Silver Strand
Training Complex in San Diego, California, four long-beaked common dolphins were killed by
the detonation of an underwater explosive (Danil and St. Leger 2011). This area has been used
for underwater demolitions training for at least 3 decades without incident. During this
underwater detonation training event, a pod of 100 to 150 long-beaked common dolphins were
moving towards the explosive’s 700-yd. (640 m) exclusion zone monitored by a personnel in a
safety boat and participants in a dive boat. Within the exclusion zone, approximately 5 minutes
remained on a time-delayed firing device connected to a single 8.76 lb (3.8 kg) explosive charge
set at a depth of 48 ft. (14.6 m), approximately 0.5 to 0.75 nm from shore. Although the dive boat
was placed between the pod and the explosive in an effort to guide the dolphins away from the
area, that effort was unsuccessful and three long-beaked common dolphins died as a result of
being in proximity to the explosion. In addition, to the three dolphins found dead on March 4th
at
the event site, the remains of a fourth dolphin were discovered on March 7th
(3 days later and
approximately 42 mi. (68 km) from the location where the training event occurred), which was
assessed as being related to this event (Danil and St. Leger 2011). Details such as the dolphins’
depth and distance from the explosive at the time of the detonation could not be estimated from
the 250-yd (229 m) standoff point of the observers in the dive boat or the safety boat.
These dolphin mortalities are the only known occurrence of a Navy training event involving
impulsive energy (underwater detonation) that has resulted in injury to a marine mammal.
Despite this being a rare occurrence, the Navy has reviewed training requirements, safety
procedures, and potential mitigation measures and, along with NMFS, is determining appropriate
changes to reduce the potential for this to occur in the future.
In comparison to potential strandings or injury resulting from events associated with Navy
activities, marine mammal strandings and injury from commercial vessel ship strike (Berman-
Kowalewski et al. 2010; Silber et al. 2010), impacts from urban pollution (Hooker et al. 2007;
O'Shea and Brownell Jr. 1994), and annual fishery-related entanglement, bycatch, injury, and
mortality (Baird and Gorgone 2005; Forney and Kobayashi 2007; Saez et al. 2013), have been
estimated worldwide to be orders of magnitude greater (hundreds of thousands of animals versus
tens of animals; (Culik 2004; ICES 2005c; Read et al. 2006)) than the few potential injurious
impacts that could be possible as a result of Navy activities. This does not negate the potential
influence of mortality or additional stress to small, regionalized sub-populations which may be at
greater risk from human related mortalities (fishing, vessel strike, sound) than populations with
larger oceanic level distributions, but overall the Navy’s impact in the oceans and inland water
areas where training occurs is small by comparison to other human activities. Nonetheless, the
focus of our analysis is to determine, considering the status of the resources, the environmental
baseline and effects from future non-federal activities, whether the Navy’s activities are likely to
jeopardize listed species or are likely to destroy or adversely modify critical habitat.
394
Biological Opinion and Conference Report on Navy NWTT Activities and NMFS’ MMPA Incidental Take
Authorization PCTS FPR-2015-9110
6.3.13 Long-term Consequences to the Individual and the Population
Long-term consequences to a population are determined by examining changes in the population
growth rate. Individual effects that could lead to a reduction in the population growth rate include
mortality or injury (that removes animals from the reproductive pool), hearing loss (which
depending on severity could impact navigation, foraging, predator avoidance, or
communication), chronic stress (which could make individuals more susceptible to disease),
displacement of individuals (especially from preferred foraging or mating grounds), and
disruption of social bonds (due to masking of conspecific signals or displacement). However, the
long-term consequences of any of these effects are difficult to predict because individual
experience and time can create complex contingencies, especially for intelligent, long-lived
animals like marine mammals. While a lost reproductive opportunity could be a measureable cost
to the individual, the outcome for the animal, and ultimately the population, can range from
insignificant to significant. Any number of factors, such as maternal inexperience, years of poor
food supply, or predator pressure, could produce a cost of a lost reproductive opportunity, but
these events may be “made up” during the life of a normal healthy individual. The same holds
true for exposure to human-generated noise sources. These biological realities must be taken into
consideration when assessing risk, uncertainties about that risk, and the feasibility of preventing
or recouping such risks. The long-term consequence of relatively trivial events like short-term
masking of a conspecific’s social sounds, or a single lost feeding opportunity, can be exaggerated
beyond its actual importance by focusing on the single event and not the important variable,
which is the individual and its lifetime parameters of growth, reproduction and survival.
Population models are well known from many fields in biology including fisheries and wildlife
management. These models accept inputs for the population size and changes in vital rates of the
population such as the mean values for survival age, lifetime reproductive success, and
recruitment of new individuals into the population. The time-scale of the inputs in a population
model for long-lived animals such as marine mammals is on the order of seasons, years, or life
stages (e.g., neonate, juvenile, reproductive adult), and are often concerned only with the success
of individuals from one time period or stage to the next. Unfortunately, information is not
available to accurately assess the impact of acoustic and explosive exposure on individual marine
mammal vitals rates. Further for assessing the impact of acoustic and explosive impacts to marine
mammal populations, many of the inputs required by population models are not known.
Recently, efforts have been made to understand the linkage between a stressor, such as
anthropogenic sound, and its immediate behavioral or physiological consequences for the
individual, and then the subsequent effects on that individual’s vital rates (growth, survival and
reproduction), and the consequences, in turn, for the population. In 2005, a panel convened by
the National Research Council of the United States National Academy of Sciences published a
report on ‘Marine Mammal Populations and Ocean Noise: Determining When Noise Causes
395
Biological Opinion and Conference Report on Navy NWTT Activities and NMFS’ MMPA Incidental Take
Authorization PCTS FPR-2015-9110
Biologically Significant Effects’. The panel developed what it called “a conceptual model” that
outlined how marine mammals might be affected by anthropogenic noise and how population
level effects could be inferred on the basis of observed behavioral changes. They called this
model ‘Population Consequences of Acoustic Disturbance’ (PCAD). In 2009 the US Office of
Naval Research (ONR) set up a working group to transform this framework into a formal
mathematical structure and determine how that structure could be parameterized using data from
a number of case studies. The ONR working group extended the PCAD framework so that it
could be used to consider other forms of disturbance and to address the impact of disturbance on
physiology as well as behavior. Their current version of that framework is now known as PCoD
(Population Consequences of Disturbance) (New et al. 2014). It is important to note that PCoD is
ongoing and is an exploratory project to determine how an interim PCoD approach might inform
analysis. It is not intended to provide an actual assessment of the population-level consequences
of disturbance for beaked whale populations on Navy ranges.
New et al. (2013) developed a mathematical model simulating a functional link between feeding
energetics and a species’ requirements for survival and reproductions for 21 species of beaked
whale. The authors report “reasonable confidence” in their model, although approximately 29
percent (6 of 21 beaked whale species modeled) failed to survive or reproduce, which the authors
attribute to possible inaccuracies in the underlying parameters. Based on the model simulation,
New et al. (2013) determined that if habitat quality and “accessible energy” (derived from the
availability of either plentiful prey or prey with high energy content) are both high, then survival
rates are high as well. If these variables are low, then adults may survive but calves will not. For
the 29 percent of beaked whale species for which the model failed (within the assumed range of
current inputs), the assumption was a 2-year calving period (or inter-calf interval), however, for
species with longer gestation periods (such as the 17-month gestation period of Baird’s beaked
whale (Berardius bairdii), this inter-calf interval may be too short. For Blainville’s beaked
whale, (Claridge 2013) has shown that calf age at separation is at least 3 years, and that the inter-
calf interval at Abaco in the Bahamas may be 4 years. New et al. (2013) acknowledge that an
assumed 2-year calving period in the modeling may not be long enough to build up the energetic
resources necessary for mother and calf survival.
As another critical model assumption, prey preferences were modeled based on stomach content
analyses of stranded animals, which the authors acknowledge are traditionally poor estimates of
the diets of healthy animals, as stranded animals are often sick prior to stranding. Stomach
content remnants of prey species do not digest equally, as only the hard parts of some prey types
remain (e.g., fish otoliths, beaks of cephalopods) and thus often provide an incomplete picture of
diet. Given these unknowns and the failure of the simulation to work for 29 percent of beaked
whale species, the modeled survival rates of all beaked whales, particularly those modeled with
prey having low energy content, may be better than simulated if higher-energy prey makes up a
larger part of the diet than assumed by the model simulations.
396
Biological Opinion and Conference Report on Navy NWTT Activities and NMFS’ MMPA Incidental Take
Authorization PCTS FPR-2015-9110
In short, for the model output New et al. (2013) created to correctly represent links between the
species and their environment, that model must identify all the critical and relevant ecological
parameters as input variables, provide the correct values for those parameters, and then the
model must appropriately integrate modeling functions to duplicate the complex relationships the
model intends to represent. If an assumption (model input) such as calving period or prey
preferences is incorrect (and there is presently no way to know), then the model would not be
representing what may actually be occurring. New et al. (2013) report that their simulations
suggest that adults will survive but not reproduce if anthropogenic disturbances result in being
displaced to areas of “impaired foraging.” Underlying this suggestion is the additional unstated
assumption that habitat capable of sustaining a beaked whale is limited in proximity to where
any disturbance has occurred and there are no data to indicate that is a valid assumption.
While the New et al. (2013) model provides a test case for future research, this pilot study has
very little of the critical data necessary to form any conclusions applicable to current
management decisions. The authors note the need for more data on prey species and reproductive
parameters including gestation and lactation duration, as the model results are particularly
affected by these assumptions. Therefore, any suggestion of biological sensitivity to the
simulation’s input parameters is uncertain.
New et al. (2014) used a simulation model to assess how behavioral disruptions (e.g., significant
disruption of foraging behavior) may affect southern elephant seal health, offspring survival,
individual fitness, and population growth rate. They suggested their model can determine the
population consequences of disturbance from short-term changes in individual animals. Their
model assumed that disturbance affected behavior by reducing the number of drift dives in which
the animals were feeding and increasing the time they spent in transit. For example, they
suggested a disturbance lasting 50 percent of an average annual foraging trip would reduce pup
survival by 0.4 percent. If this level of disturbance continued over 30 years and the population
did not adapt, the authors found that the population size would decrease by approximately 10
percent.
The findings of New et al. (2014) are not applicable to the temporary behavioral disruptions that
may be caused by Navy training and testing activities for a number of reasons. First, the model
assumed that individuals would be unable to compensate for lost foraging opportunities. As
described previously, available empirical data does not confirm this would be the case. For
example, elephant seals are unlikely to be affected by short-term variations in prey availability
because they take long foraging trips, allowing for some margin of error in prey availability
(Costa 1993), as cited in New et al. (2014). We expect the species considered in this Opinion to
be similarly unaffected. We have no information to suggest animals eliciting a behavioral
response (e.g., temporary disruption of feeding) to Navy training and testing activities would be
unable to compensate for this temporary disruption in feeding activity by either immediately
397
Biological Opinion and Conference Report on Navy NWTT Activities and NMFS’ MMPA Incidental Take
Authorization PCTS FPR-2015-9110
feeding at another location, by feeding shortly after cessation of acoustic exposure, or by feeding
at a later time. Additionally, the behavioral disruption of ESA-listed species reasonably expected
to occur due to Navy training and testing activities will not have as long of a duration as those
considered in the New et al. (2014) study. As discussed in Section 6.3.11, no individual animals
will be exposed to Navy training and testing activities for a long enough duration to disrupt 50
percent of its annual feeding opportunities over multiple years. New et al. (2014) suggest it
would be unlikely even for episodic environmental change, such as El Niño events, to affect the
probability of population persistence. As suggested by the authors, the New et al. (2014) model
may be more applicable to the consideration of potential long-term behavioral disruptions (e.g.,
those that may result from climate change).
Until an appropriate quantitative model is developed and until all relevant empirical data is
collected to support such a model for the species considered in this Opinion, the best assessment
of long-term consequences from training and testing activities will be to monitor the populations
over time within a given Navy range complex. A Navy workshop on Marine Mammals and
Sound (Fitch et al. 2011) indicated a critical need for baseline biological data on marine mammal
abundance, distribution, habitat, and behavior over sufficient time and space to evaluate impacts
from human-generated activities on long-term population survival. The Navy has developed
monitoring plans for protected marine mammals and sea turtles occurring on Navy ranges with
the goal of assessing the impacts of training activities on marine species and the effectiveness of
the Navy’s current mitigation practices. Monitoring has resulted in data on occurrence, exposure,
and behavioral response in the NWTT Action Area. All monitoring reported are available to the
public and posted at www.navymarinespeciesmonitoring.us/.
6.3.14 Criteria for Predicting Acoustic and Explosive Impacts – Marine Mammals
When Navy activities introduce sound or explosive energy into the marine environment, an
analysis of potential impacts to marine mammals is conducted. To do this, information about the
numerical sound and energy levels that are likely to elicit certain types of physiological and
behavioral reactions is needed. The following contains information on the criteria, thresholds,
and methodology for quantifying effects from acoustic and explosive sources, which were jointly
developed by the Navy and NMFS. While we provide the criteria for all functional hearing
groups and taxa, we did not assess effects to high-frequency cetaceans, phocid seals, or sea
otters.
6.3.14.1 Frequency Weighting
Frequency-weighting functions are used to adjust the received sound level based on the
sensitivity of the animal to the frequency of the sound. The weighting functions de-emphasize
sound exposures at frequencies to which marine mammals are not particularly sensitive. This
effectively makes the acoustic thresholds frequency-dependent, which means they are applicable
398
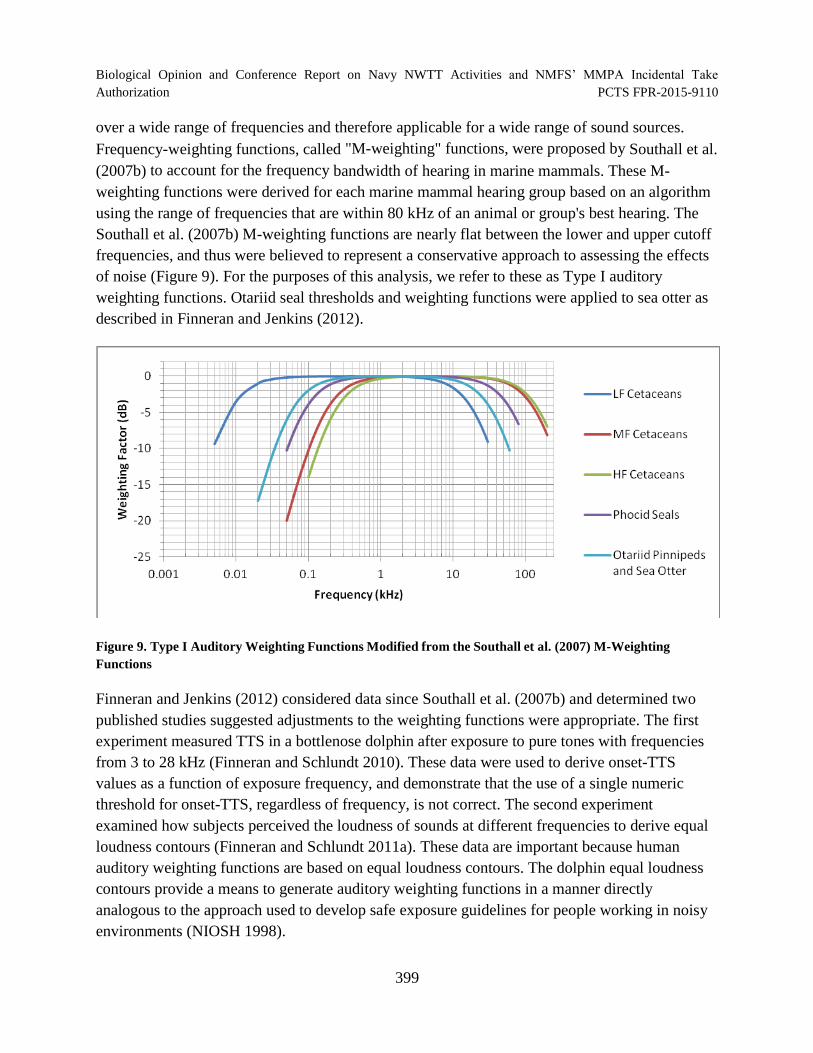
Biological Opinion and Conference Report on Navy NWTT Activities and NMFS’ MMPA Incidental Take
Authorization PCTS FPR-2015-9110
over a wide range of frequencies and therefore applicable for a wide range of sound sources.
Frequency-weighting functions, called "M-weighting" functions, were proposed by Southall et al.
(2007b) to account for the frequency bandwidth of hearing in marine mammals. These M-
weighting functions were derived for each marine mammal hearing group based on an algorithm
using the range of frequencies that are within 80 kHz of an animal or group's best hearing. The
Southall et al. (2007b) M-weighting functions are nearly flat between the lower and upper cutoff
frequencies, and thus were believed to represent a conservative approach to assessing the effects
of noise (Figure 9). For the purposes of this analysis, we refer to these as Type I auditory
weighting functions. Otariid seal thresholds and weighting functions were applied to sea otter as
described in Finneran and Jenkins (2012).
Figure 9. Type I Auditory Weighting Functions Modified from the Southall et al. (2007) M-Weighting
Functions
Finneran and Jenkins (2012) considered data since Southall et al. (2007b) and determined two
published studies suggested adjustments to the weighting functions were appropriate. The first
experiment measured TTS in a bottlenose dolphin after exposure to pure tones with frequencies
from 3 to 28 kHz (Finneran and Schlundt 2010). These data were used to derive onset-TTS
values as a function of exposure frequency, and demonstrate that the use of a single numeric
threshold for onset-TTS, regardless of frequency, is not correct. The second experiment
examined how subjects perceived the loudness of sounds at different frequencies to derive equal
loudness contours (Finneran and Schlundt 2011a). These data are important because human
auditory weighting functions are based on equal loudness contours. The dolphin equal loudness
contours provide a means to generate auditory weighting functions in a manner directly
analogous to the approach used to develop safe exposure guidelines for people working in noisy
environments (NIOSH 1998).
399
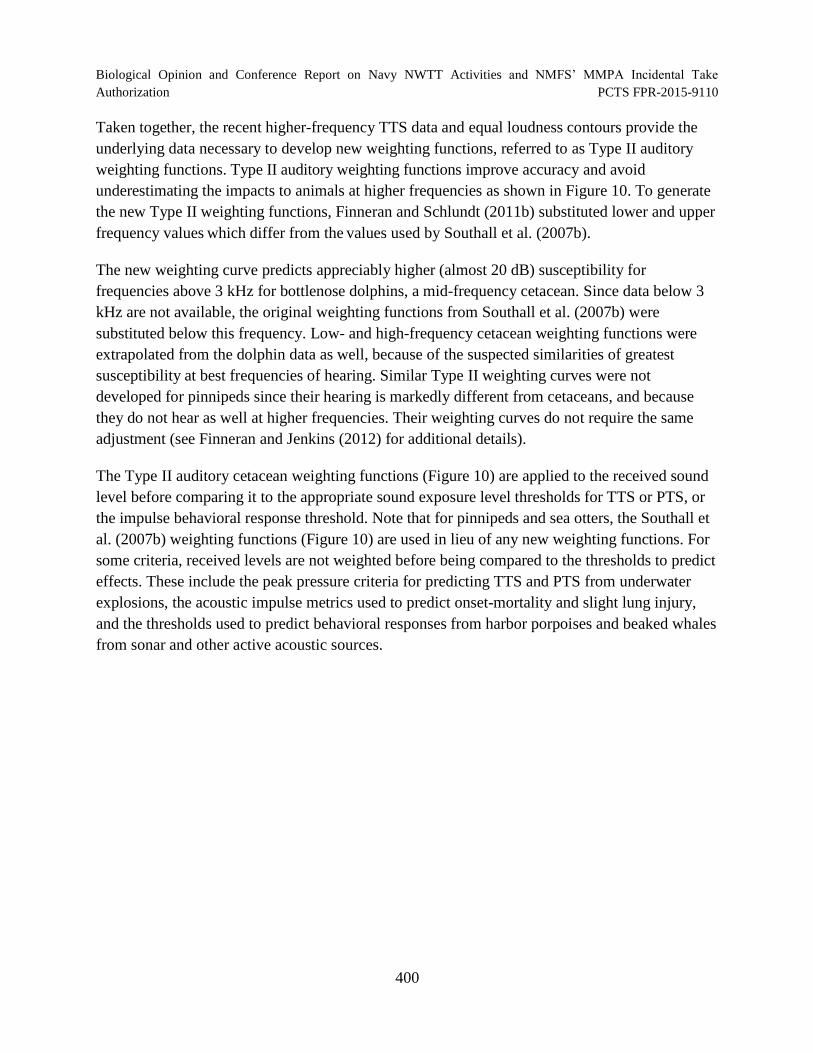
Biological Opinion and Conference Report on Navy NWTT Activities and NMFS’ MMPA Incidental Take
Authorization PCTS FPR-2015-9110
Taken together, the recent higher-frequency TTS data and equal loudness contours provide the
underlying data necessary to develop new weighting functions, referred to as Type II auditory
weighting functions. Type II auditory weighting functions improve accuracy and avoid
underestimating the impacts to animals at higher frequencies as shown in Figure 10. To generate
the new Type II weighting functions, Finneran and Schlundt (2011b) substituted lower and upper
frequency values which differ from the values used by Southall et al. (2007b).
The new weighting curve predicts appreciably higher (almost 20 dB) susceptibility for
frequencies above 3 kHz for bottlenose dolphins, a mid-frequency cetacean. Since data below 3
kHz are not available, the original weighting functions from Southall et al. (2007b) were
substituted below this frequency. Low- and high-frequency cetacean weighting functions were
extrapolated from the dolphin data as well, because of the suspected similarities of greatest
susceptibility at best frequencies of hearing. Similar Type II weighting curves were not
developed for pinnipeds since their hearing is markedly different from cetaceans, and because
they do not hear as well at higher frequencies. Their weighting curves do not require the same
adjustment (see Finneran and Jenkins (2012) for additional details).
The Type II auditory cetacean weighting functions (Figure 10) are applied to the received sound
level before comparing it to the appropriate sound exposure level thresholds for TTS or PTS, or
the impulse behavioral response threshold. Note that for pinnipeds and sea otters, the Southall et
al. (2007b) weighting functions (Figure 10) are used in lieu of any new weighting functions. For
some criteria, received levels are not weighted before being compared to the thresholds to predict
effects. These include the peak pressure criteria for predicting TTS and PTS from underwater
explosions, the acoustic impulse metrics used to predict onset-mortality and slight lung injury,
and the thresholds used to predict behavioral responses from harbor porpoises and beaked whales
from sonar and other active acoustic sources.
400
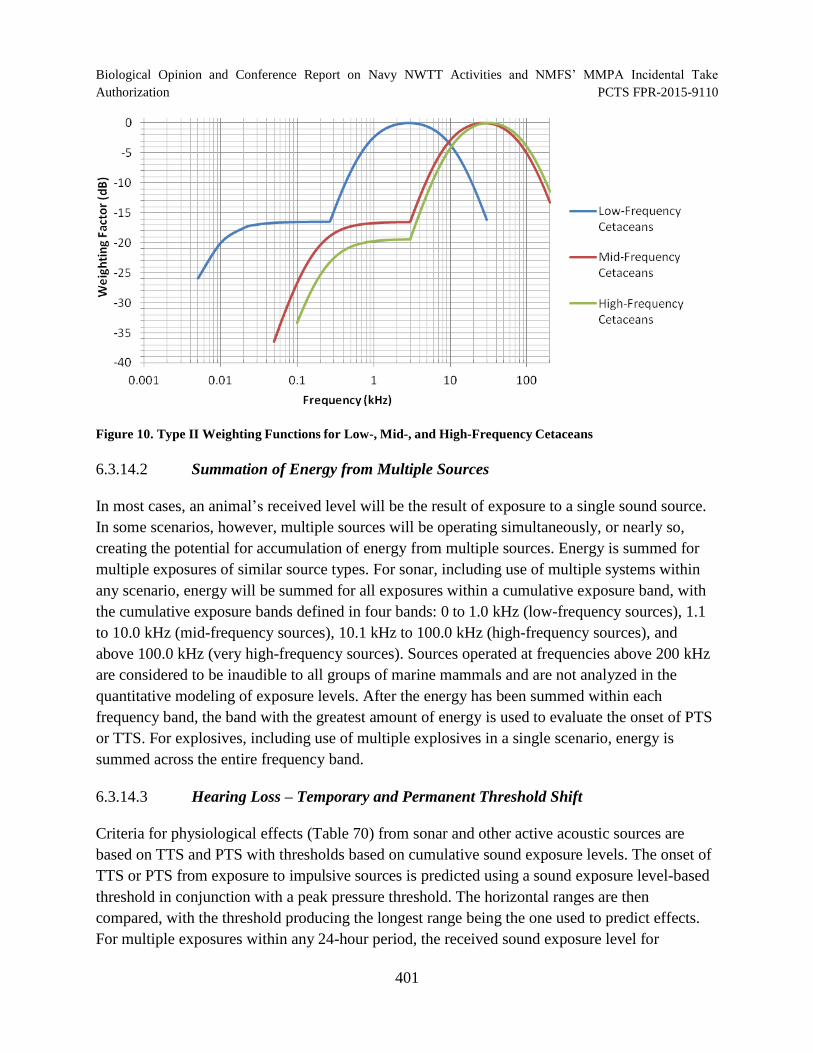
Biological Opinion and Conference Report on Navy NWTT Activities and NMFS’ MMPA Incidental Take Authorization PCTS FPR-2015-9110
Figure 10. Type II Weighting Functions for Low-, Mid-, and High-Frequency Cetaceans
6.3.14.2 Summation of Energy from Multiple Sources
In most cases, an animal’s received level will be the result of exposure to a single sound source.
In some scenarios, however, multiple sources will be operating simultaneously, or nearly so,
creating the potential for accumulation of energy from multiple sources. Energy is summed for
multiple exposures of similar source types. For sonar, including use of multiple systems within
any scenario, energy will be summed for all exposures within a cumulative exposure band, with
the cumulative exposure bands defined in four bands: 0 to 1.0 kHz (low-frequency sources), 1.1
to 10.0 kHz (mid-frequency sources), 10.1 kHz to 100.0 kHz (high-frequency sources), and
above 100.0 kHz (very high-frequency sources). Sources operated at frequencies above 200 kHz
are considered to be inaudible to all groups of marine mammals and are not analyzed in the
quantitative modeling of exposure levels. After the energy has been summed within each
frequency band, the band with the greatest amount of energy is used to evaluate the onset of PTS
or TTS. For explosives, including use of multiple explosives in a single scenario, energy is
summed across the entire frequency band.
6.3.14.3 Hearing Loss – Temporary and Permanent Threshold Shift
Criteria for physiological effects (Table 70) from sonar and other active acoustic sources are
based on TTS and PTS with thresholds based on cumulative sound exposure levels. The onset of
TTS or PTS from exposure to impulsive sources is predicted using a sound exposure level-based
threshold in conjunction with a peak pressure threshold. The horizontal ranges are then
compared, with the threshold producing the longest range being the one used to predict effects.
For multiple exposures within any 24-hour period, the received sound exposure level for
401
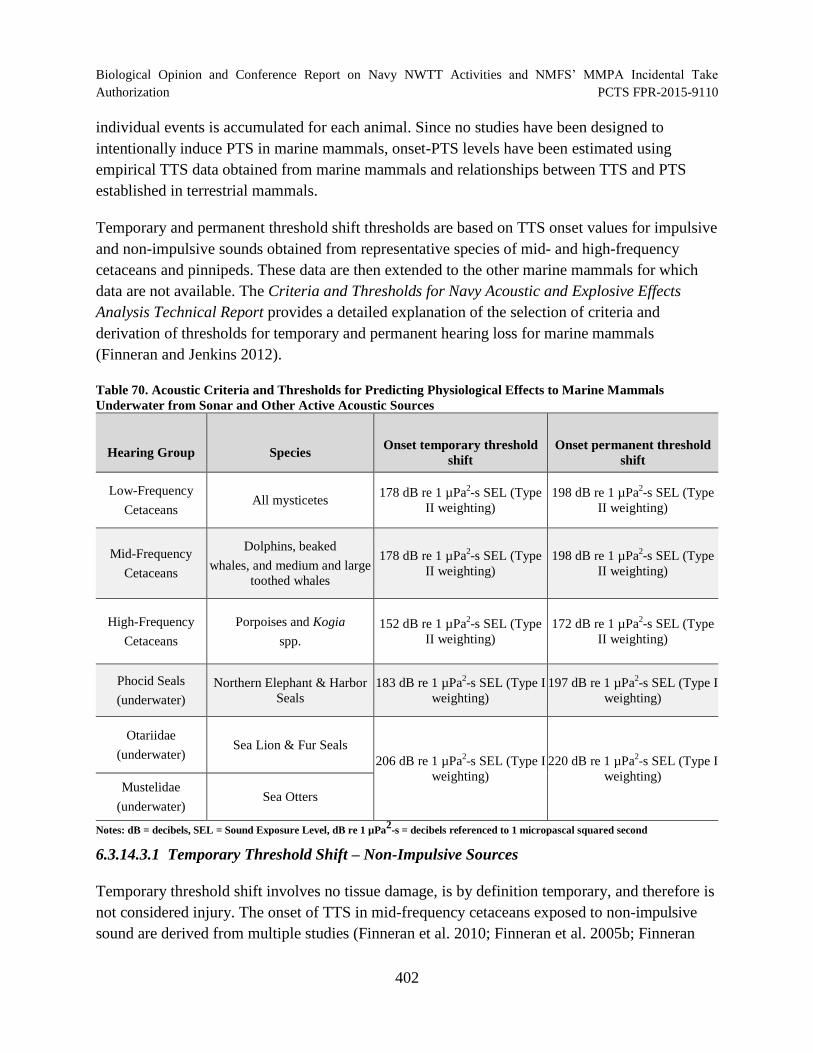
Biological Opinion and Conference Report on Navy NWTT Activities and NMFS’ MMPA Incidental Take
Authorization PCTS FPR-2015-9110
individual events is accumulated for each animal. Since no studies have been designed to
intentionally induce PTS in marine mammals, onset-PTS levels have been estimated using
empirical TTS data obtained from marine mammals and relationships between TTS and PTS
established in terrestrial mammals.
Temporary and permanent threshold shift thresholds are based on TTS onset values for impulsive
and non-impulsive sounds obtained from representative species of mid- and high-frequency
cetaceans and pinnipeds. These data are then extended to the other marine mammals for which
data are not available. The Criteria and Thresholds for Navy Acoustic and Explosive Effects
Analysis Technical Report provides a detailed explanation of the selection of criteria and
derivation of thresholds for temporary and permanent hearing loss for marine mammals
(Finneran and Jenkins 2012).
Table 70. Acoustic Criteria and Thresholds for Predicting Physiological Effects to Marine Mammals
Underwater from Sonar and Other Active Acoustic Sources
Hearing Group Species Onset temporary threshold
shift
Onset permanent threshold
shift
Low-Frequency
Cetaceans All mysticetes
178 dB re 1 µPa 2 -s SEL (Type
II weighting)
198 dB re 1 µPa 2 -s SEL (Type
II weighting)
Mid-Frequency
Cetaceans
Dolphins, beaked
whales, and medium and large
toothed whales
178 dB re 1 µPa 2 -s SEL (Type
II weighting)
198 dB re 1 µPa 2 -s SEL (Type
II weighting)
High-Frequency
Cetaceans
Porpoises and Kogia
spp.
152 dB re 1 µPa 2 -s SEL (Type
II weighting)
172 dB re 1 µPa 2 -s SEL (Type
II weighting)
Phocid Seals
(underwater)
Northern Elephant & Harbor
Seals
183 dB re 1 µPa 2 -s SEL (Type I
weighting)
197 dB re 1 µPa 2 -s SEL (Type I
weighting)
Otariidae
(underwater)
Mustelidae
(underwater)
Sea Lion & Fur Seals
Sea Otters
206 dB re 1 µPa 2 -s SEL (Type I
weighting)
220 dB re 1 µPa 2 -s SEL (Type I
weighting)
2Notes: dB = decibels, SEL = Sound Exposure Level, dB re 1 µPa -s = decibels referenced to 1 micropascal squared second
6.3.14.3.1 Temporary Threshold Shift – Non-Impulsive Sources
Temporary threshold shift involves no tissue damage, is by definition temporary, and therefore is
not considered injury. The onset of TTS in mid-frequency cetaceans exposed to non-impulsive
sound are derived from multiple studies (Finneran et al. 2010; Finneran et al. 2005b; Finneran
402
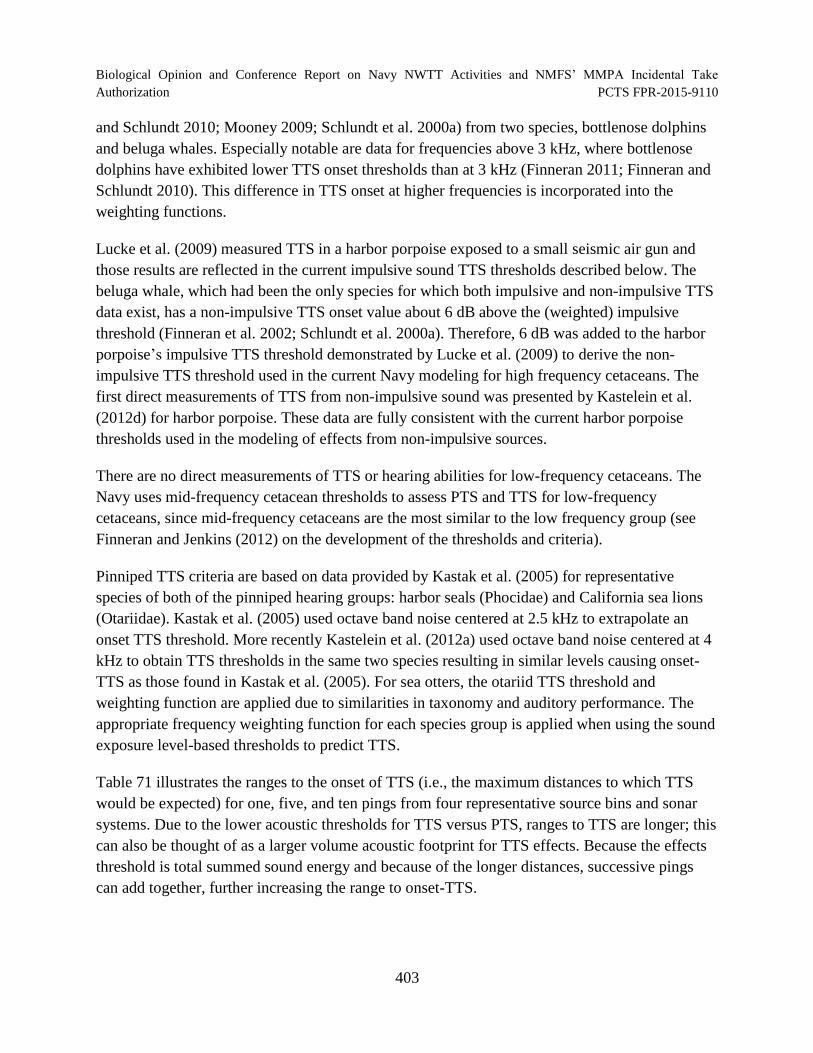
Biological Opinion and Conference Report on Navy NWTT Activities and NMFS’ MMPA Incidental Take
Authorization PCTS FPR-2015-9110
and Schlundt 2010; Mooney 2009; Schlundt et al. 2000a) from two species, bottlenose dolphins
and beluga whales. Especially notable are data for frequencies above 3 kHz, where bottlenose
dolphins have exhibited lower TTS onset thresholds than at 3 kHz (Finneran 2011; Finneran and
Schlundt 2010). This difference in TTS onset at higher frequencies is incorporated into the
weighting functions.
Lucke et al. (2009) measured TTS in a harbor porpoise exposed to a small seismic air gun and
those results are reflected in the current impulsive sound TTS thresholds described below. The
beluga whale, which had been the only species for which both impulsive and non-impulsive TTS
data exist, has a non-impulsive TTS onset value about 6 dB above the (weighted) impulsive
threshold (Finneran et al. 2002; Schlundt et al. 2000a). Therefore, 6 dB was added to the harbor
porpoise’s impulsive TTS threshold demonstrated by Lucke et al. (2009) to derive the non-
impulsive TTS threshold used in the current Navy modeling for high frequency cetaceans. The
first direct measurements of TTS from non-impulsive sound was presented by Kastelein et al.
(2012d) for harbor porpoise. These data are fully consistent with the current harbor porpoise
thresholds used in the modeling of effects from non-impulsive sources.
There are no direct measurements of TTS or hearing abilities for low-frequency cetaceans. The
Navy uses mid-frequency cetacean thresholds to assess PTS and TTS for low-frequency
cetaceans, since mid-frequency cetaceans are the most similar to the low frequency group (see
Finneran and Jenkins (2012) on the development of the thresholds and criteria).
Pinniped TTS criteria are based on data provided by Kastak et al. (2005) for representative
species of both of the pinniped hearing groups: harbor seals (Phocidae) and California sea lions
(Otariidae). Kastak et al. (2005) used octave band noise centered at 2.5 kHz to extrapolate an
onset TTS threshold. More recently Kastelein et al. (2012a) used octave band noise centered at 4
kHz to obtain TTS thresholds in the same two species resulting in similar levels causing onset-
TTS as those found in Kastak et al. (2005). For sea otters, the otariid TTS threshold and
weighting function are applied due to similarities in taxonomy and auditory performance. The
appropriate frequency weighting function for each species group is applied when using the sound
exposure level-based thresholds to predict TTS.
Table 71 illustrates the ranges to the onset of TTS (i.e., the maximum distances to which TTS
would be expected) for one, five, and ten pings from four representative source bins and sonar
systems. Due to the lower acoustic thresholds for TTS versus PTS, ranges to TTS are longer; this
can also be thought of as a larger volume acoustic footprint for TTS effects. Because the effects
threshold is total summed sound energy and because of the longer distances, successive pings
can add together, further increasing the range to onset-TTS.
403
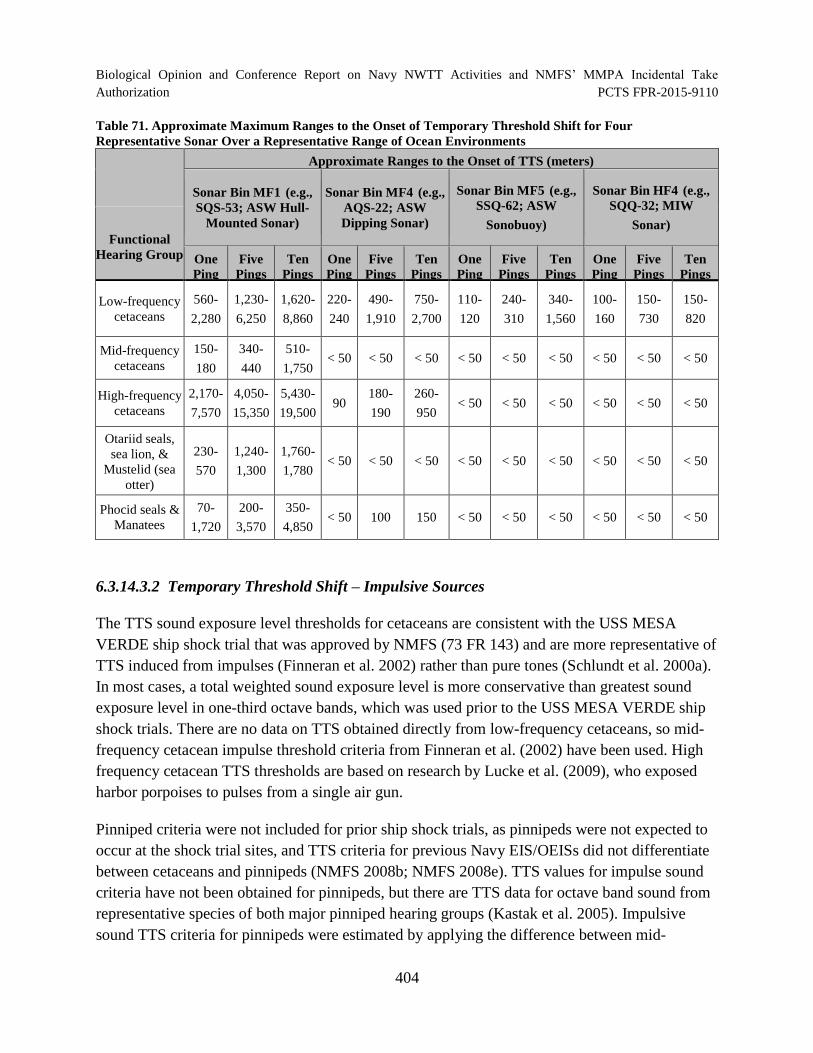
Biological Opinion and Conference Report on Navy NWTT Activities and NMFS’ MMPA Incidental Take
Authorization PCTS FPR-2015-9110
Table 71. Approximate Maximum Ranges to the Onset of Temporary Threshold Shift for Four
Representative Sonar Over a Representative Range of Ocean Environments
Approximate Ranges to the Onset of TTS (meters)
Sonar Bin MF1 (e.g.,
SQS-53; ASW Hull-
Mounted Sonar)
Sonar Bin MF4 (e.g.,
AQS-22; ASW
Dipping Sonar)
Sonar Bin MF5 (e.g.,
SSQ-62; ASW
Sonobuoy)
Sonar Bin HF4 (e.g.,
SQQ-32; MIW
Sonar) Functional
Hearing Group One
Ping
Five
Pings
Ten
Pings
One
Ping
Five
Pings
Ten
Pings
One
Ping
Five
Pings
Ten
Pings
One
Ping
Five
Pings
Ten
Pings
Low-frequency
cetaceans
560
2,280
1,230
6,250
1,620
8,860
220
240
490
1,910
750
2,700
110
120
240
310
340
1,560
100
160
150
730
150
820
Mid-frequency
cetaceans
150
180
340
440
510
1,750 < 50 < 50 < 50 < 50 < 50 < 50 < 50 < 50 < 50
High-frequency
cetaceans
2,170
7,570
4,050
15,350
5,430
19,500 90
180
190
260
950 < 50 < 50 < 50 < 50 < 50 < 50
Otariid seals,
sea lion, &
Mustelid (sea
otter)
230
570
1,240
1,300
1,760
1,780 < 50 < 50 < 50 < 50 < 50 < 50 < 50 < 50 < 50
Phocid seals &
Manatees
70
1,720
200
3,570
350
4,850 < 50 100 150 < 50 < 50 < 50 < 50 < 50 < 50
6.3.14.3.2 Temporary Threshold Shift – Impulsive Sources
The TTS sound exposure level thresholds for cetaceans are consistent with the USS MESA
VERDE ship shock trial that was approved by NMFS (73 FR 143) and are more representative of
TTS induced from impulses (Finneran et al. 2002) rather than pure tones (Schlundt et al. 2000a).
In most cases, a total weighted sound exposure level is more conservative than greatest sound
exposure level in one-third octave bands, which was used prior to the USS MESA VERDE ship
shock trials. There are no data on TTS obtained directly from low-frequency cetaceans, so mid-
frequency cetacean impulse threshold criteria from Finneran et al. (2002) have been used. High
frequency cetacean TTS thresholds are based on research by Lucke et al. (2009), who exposed
harbor porpoises to pulses from a single air gun.
Pinniped criteria were not included for prior ship shock trials, as pinnipeds were not expected to
occur at the shock trial sites, and TTS criteria for previous Navy EIS/OEISs did not differentiate
between cetaceans and pinnipeds (NMFS 2008b; NMFS 2008e). TTS values for impulse sound
criteria have not been obtained for pinnipeds, but there are TTS data for octave band sound from
representative species of both major pinniped hearing groups (Kastak et al. 2005). Impulsive
sound TTS criteria for pinnipeds were estimated by applying the difference between mid
404

Biological Opinion and Conference Report on Navy NWTT Activities and NMFS’ MMPA Incidental Take
Authorization PCTS FPR-2015-9110
frequency cetacean TTS onset for impulsive and non-impulsive sounds to the pinniped non-
impulsive TTS data (Kastak et al. 2005), a methodology originally developed by Southall et al.
(Southall et al. 2007b). Therefore, the TTS criteria for impulsive sounds from explosions for
pinnipeds is 6 dB less than the non-impulsive onset-TTS criteria derived from Kastak et al.
(2005).
6.3.14.3.3 Permanent Threshold Shift – Non-Impulsive Sources
There are no direct measurements of PTS onset in marine mammals. Well understood
relationships between terrestrial mammalian TTS and PTS have been applied to marine
mammals. Threshold shifts up to 40 to 50 dB have been induced in terrestrial mammals without
resultant PTS (Miller et al. 1963; Ward et al. 1958; Ward et al. 1959a; Ward et al. 1959b). These
data would suggest that a PTS criteria of 40 dB would be reasonable for conservatively
predicting (overestimating) PTS in marine mammals. Data from terrestrial mammal testing
(Ward et al. 1958; Ward et al. 1959a; Ward et al. 1959b) show growth of TTS by 1.5 to 1.6 dB
for every 1 dB increase in exposure level. The difference between measureable TTS onset (6 dB)
and the selected 40 dB upper safe limit of TTS yields a difference in TTS of 34 dB which, when
divided by a TTS growth function of 1.6 indicates that an increase in exposure of 21 dB would
result in 40 dB of TTS. For simplicity and additional conservatism we have rounded that number
down to 20 dB (Southall et al. 2007b).
Therefore, exposures to sonar and other active acoustic sources with levels 20 dB above those
producing TTS are assumed to produce a PTS. For example, an onset-TTS criteria of 195 dB re 1 2 2
µPa -s would have a corresponding onset-PTS criteria of 215 dB re 1 µPa -s. This extrapolation
process is identical to that recently proposed by Southall et al. (Southall et al. 2007b). The
method overestimates or predicts greater effects than have actually been observed in tests on a
bottlenose dolphin (Finneran and Schlundt 2010; Schlundt et al. 2006) and is therefore
protective.
Kastak et al. (2007) obtained different TTS growth rates for pinnipeds than Finneran and
colleagues obtained for mid-frequency cetaceans. NMFS recommended reducing the estimated
PTS criteria for both groups of pinnipeds, based on the difference in TTS growth rate reported by
Kastak et al. (2007) (14 dB instead of 20 dB).
The appropriate frequency weighting function for each species group is applied when using the
sound exposure level-based thresholds to predict PTS.
Table 72 lists the ranges to the PTS threshold (i.e., range to the onset of PTS: the maximum
distance to which PTS would be expected), relative to the marine mammal’s functional hearing
group, from three of the most powerful sonar systems. For a SQS-53 sonar transmitting for 1
405
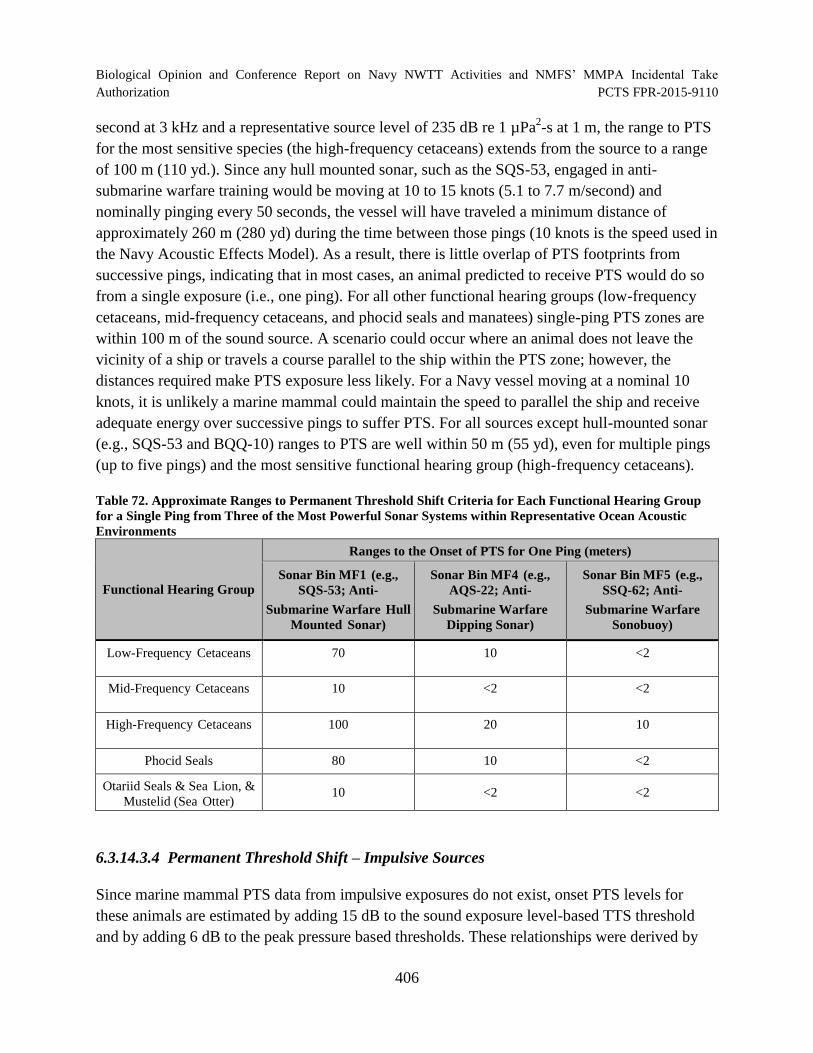
Biological Opinion and Conference Report on Navy NWTT Activities and NMFS’ MMPA Incidental Take
Authorization PCTS FPR-2015-9110
second at 3 kHz and a representative source level of 235 dB re 1 µPa2-s at 1 m, the range to PTS
for the most sensitive species (the high-frequency cetaceans) extends from the source to a range
of 100 m (110 yd.). Since any hull mounted sonar, such as the SQS-53, engaged in anti
submarine warfare training would be moving at 10 to 15 knots (5.1 to 7.7 m/second) and
nominally pinging every 50 seconds, the vessel will have traveled a minimum distance of
approximately 260 m (280 yd) during the time between those pings (10 knots is the speed used in
the Navy Acoustic Effects Model). As a result, there is little overlap of PTS footprints from
successive pings, indicating that in most cases, an animal predicted to receive PTS would do so
from a single exposure (i.e., one ping). For all other functional hearing groups (low-frequency
cetaceans, mid-frequency cetaceans, and phocid seals and manatees) single-ping PTS zones are
within 100 m of the sound source. A scenario could occur where an animal does not leave the
vicinity of a ship or travels a course parallel to the ship within the PTS zone; however, the
distances required make PTS exposure less likely. For a Navy vessel moving at a nominal 10
knots, it is unlikely a marine mammal could maintain the speed to parallel the ship and receive
adequate energy over successive pings to suffer PTS. For all sources except hull-mounted sonar
(e.g., SQS-53 and BQQ-10) ranges to PTS are well within 50 m (55 yd), even for multiple pings
(up to five pings) and the most sensitive functional hearing group (high-frequency cetaceans).
Table 72. Approximate Ranges to Permanent Threshold Shift Criteria for Each Functional Hearing Group
for a Single Ping from Three of the Most Powerful Sonar Systems within Representative Ocean Acoustic
Environments
Functional Hearing Group
Ranges to the Onset of PTS for One Ping (meters)
Sonar Bin MF1 (e.g.,
SQS-53; Anti-
Submarine Warfare Hull
Mounted Sonar)
Sonar Bin MF4 (e.g.,
AQS-22; Anti-
Submarine Warfare
Dipping Sonar)
Sonar Bin MF5 (e.g.,
SSQ-62; Anti-
Submarine Warfare
Sonobuoy)
Low-Frequency Cetaceans 70 10 <2
Mid-Frequency Cetaceans 10 <2 <2
High-Frequency Cetaceans 100 20 10
Phocid Seals 80 10 <2
Otariid Seals & Sea Lion, &
Mustelid (Sea Otter) 10 <2 <2
6.3.14.3.4 Permanent Threshold Shift – Impulsive Sources
Since marine mammal PTS data from impulsive exposures do not exist, onset PTS levels for
these animals are estimated by adding 15 dB to the sound exposure level-based TTS threshold
and by adding 6 dB to the peak pressure based thresholds. These relationships were derived by
406
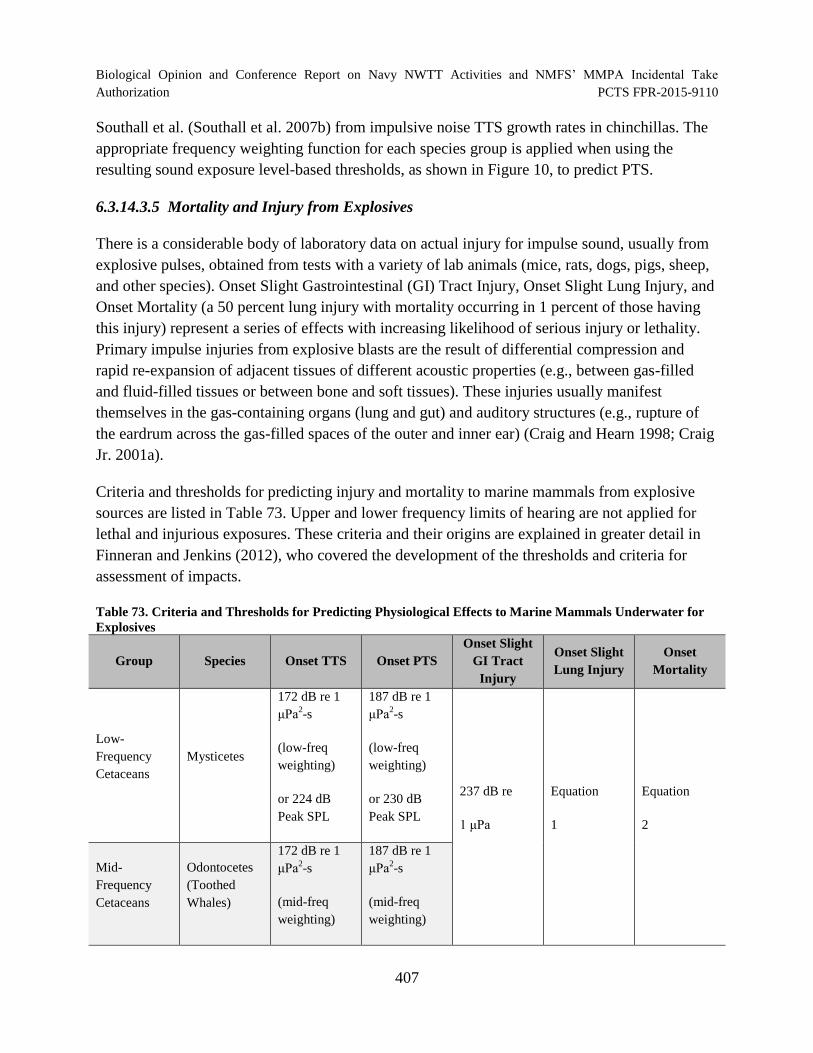
Biological Opinion and Conference Report on Navy NWTT Activities and NMFS’ MMPA Incidental Take
Authorization PCTS FPR-2015-9110
Southall et al. (Southall et al. 2007b) from impulsive noise TTS growth rates in chinchillas. The
appropriate frequency weighting function for each species group is applied when using the
resulting sound exposure level-based thresholds, as shown in Figure 10, to predict PTS.
6.3.14.3.5 Mortality and Injury from Explosives
There is a considerable body of laboratory data on actual injury for impulse sound, usually from
explosive pulses, obtained from tests with a variety of lab animals (mice, rats, dogs, pigs, sheep,
and other species). Onset Slight Gastrointestinal (GI) Tract Injury, Onset Slight Lung Injury, and
Onset Mortality (a 50 percent lung injury with mortality occurring in 1 percent of those having
this injury) represent a series of effects with increasing likelihood of serious injury or lethality.
Primary impulse injuries from explosive blasts are the result of differential compression and
rapid re-expansion of adjacent tissues of different acoustic properties (e.g., between gas-filled
and fluid-filled tissues or between bone and soft tissues). These injuries usually manifest
themselves in the gas-containing organs (lung and gut) and auditory structures (e.g., rupture of
the eardrum across the gas-filled spaces of the outer and inner ear) (Craig and Hearn 1998; Craig
Jr. 2001a).
Criteria and thresholds for predicting injury and mortality to marine mammals from explosive
sources are listed in Table 73. Upper and lower frequency limits of hearing are not applied for
lethal and injurious exposures. These criteria and their origins are explained in greater detail in
Finneran and Jenkins (2012), who covered the development of the thresholds and criteria for
assessment of impacts.
Table 73. Criteria and Thresholds for Predicting Physiological Effects to Marine Mammals Underwater for
Explosives
Group Species Onset TTS Onset PTS
Onset Slight
GI Tract
Injury
Onset Slight
Lung Injury
Onset
Mortality
Low-
Frequency
Cetaceans
Mysticetes
172 dB re 1
μPa2 -s
(low-freq
weighting)
or 224 dB
Peak SPL
187 dB re 1
μPa2 -s
(low-freq
weighting)
or 230 dB
Peak SPL
237 dB re
1 μPa
Equation
1
Equation
2
Mid-
Frequency
Cetaceans
Odontocetes
(Toothed
Whales)
172 dB re 1
μPa2 -s
(mid-freq
weighting)
187 dB re 1
μPa2 -s
(mid-freq
weighting)
407
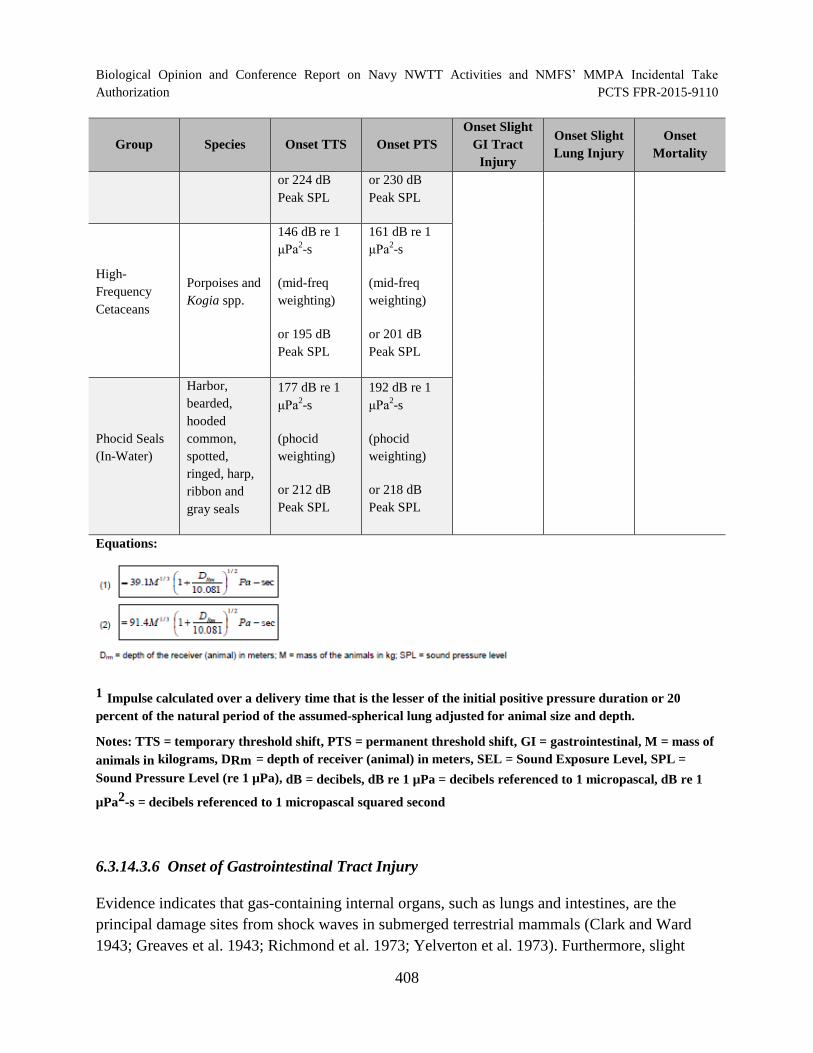
Biological Opinion and Conference Report on Navy NWTT Activities and NMFS’ MMPA Incidental Take Authorization PCTS FPR-2015-9110
Group Species Onset TTS Onset PTS
Onset Slight
GI Tract
Injury
Onset Slight
Lung Injury
Onset
Mortality
or 224 dB
Peak SPL
or 230 dB
Peak SPL
High-
Frequency
Cetaceans
Porpoises and
Kogia spp.
146 dB re 1
μPa2 -s
(mid-freq
weighting)
or 195 dB
Peak SPL
161 dB re 1
μPa2 -s
(mid-freq
weighting)
or 201 dB
Peak SPL
Phocid Seals
(In-Water)
Harbor,
bearded,
hooded
common,
spotted,
ringed, harp,
ribbon and
gray seals
177 dB re 1
μPa2 -s
(phocid
weighting)
or 212 dB
Peak SPL
192 dB re 1
μPa2 -s
(phocid
weighting)
or 218 dB
Peak SPL
Equations:
1 Impulse calculated over a delivery time that is the lesser of the initial positive pressure duration or 20
percent of the natural period of the assumed-spherical lung adjusted for animal size and depth.
Notes: TTS = temporary threshold shift, PTS = permanent threshold shift, GI = gastrointestinal, M = mass of
animals in kilograms, DRm = depth of receiver (animal) in meters, SEL = Sound Exposure Level, SPL =
Sound Pressure Level (re 1 µPa), dB = decibels, dB re 1 µPa = decibels referenced to 1 micropascal, dB re 1
2µPa -s = decibels referenced to 1 micropascal squared second
6.3.14.3.6 Onset of Gastrointestinal Tract Injury
Evidence indicates that gas-containing internal organs, such as lungs and intestines, are the
principal damage sites from shock waves in submerged terrestrial mammals (Clark and Ward
1943; Greaves et al. 1943; Richmond et al. 1973; Yelverton et al. 1973). Furthermore, slight
408
Biological Opinion and Conference Report on Navy NWTT Activities and NMFS’ MMPA Incidental Take
Authorization PCTS FPR-2015-9110
injury to the gastrointestinal tract may be related to the magnitude of the peak shock wave
pressure over the hydrostatic pressure and would be independent of the animal’s size and mass
(Goertner 1982).
There are instances where injury to the gastrointestinal tract could occur at a greater distance
from the source than slight lung injury, especially for animals near the surface. Gastrointestinal
tract injury from small test charges (described as “slight contusions”) was observed at peak
pressure levels as low as 104 pounds per square inch (psi), equivalent to a sound pressure level
of 237 dB re 1 µPa (Richmond et al. 1973). This criterion was previously used by the Navy and
NMFS for ship shock trials (Finneran and Jenkins (2012); 63 FR 230, 66 FR 87, 73 FR 143).
6.3.14.3.7 Slight Lung Injury and Mortality
The most commonly reported internal bodily injury from impulse energy is hemorrhaging in the
fine structure of the lungs. Biological damage is governed by the impulse of the underwater blast
(pressure integrated over time), not peak pressure or energy (Richmond et al. 1973; Yelverton
and Richmond 1981; Yelverton et al. 1973; Yelverton et al. 1975). Therefore, impulse was used
as a metric upon which internal organ injury could be predicted. Species-specific minimal animal
masses are used for determining impulse-based thresholds of slight lung injury and mortality.
The Criteria and Thresholds for Navy Acoustic and Explosive Effects Analysis technical report
(Finneran and Jenkins 2012) provides a nominal conservative body mass for each species based
on newborn weights. In some cases body masses were extrapolated from similar species rather
than the listed species. The scaling of lung volume to depth is conducted for all species since
data is from experiments with terrestrial animals held near the water's surface.
Because the thresholds for onset of mortality and onset of slight lung injury are proportional to
the cube root of body mass, the use of all newborn, or calf, weights rather than representative
adult weights results in an over-estimate of effects to animals near an explosion. The range to
onset mortality for a newborn compared to an adult animal of the same species can range from
less than twice to over four times as far from an explosion, depending on the differences in calf
versus adult sizes for a given species and the size of the explosion. Considering that injurious
high pressures due to explosions propagate away from detonations in a roughly spherical
manner, the volumes of water in which the threshold for onset mortality may be exceeded are
generally less than a fifth for an adult animal versus a calf.
The use of onset mortality and onset slight lung injury is a conservative method to estimate
potential mortality and recoverable (non-mortal, non-PTS) injuries, respectively. When
analyzing impulse-based effects, all animals within the range to these thresholds are assumed to
experience the effect. The onset mortality and onset slight lung injury criteria is based on the
impulse at which these effects are predicted for 1 percent of animals; the portion of animals
affected would increase closer to the explosion. All animals receive the effect vice a percentage;
409
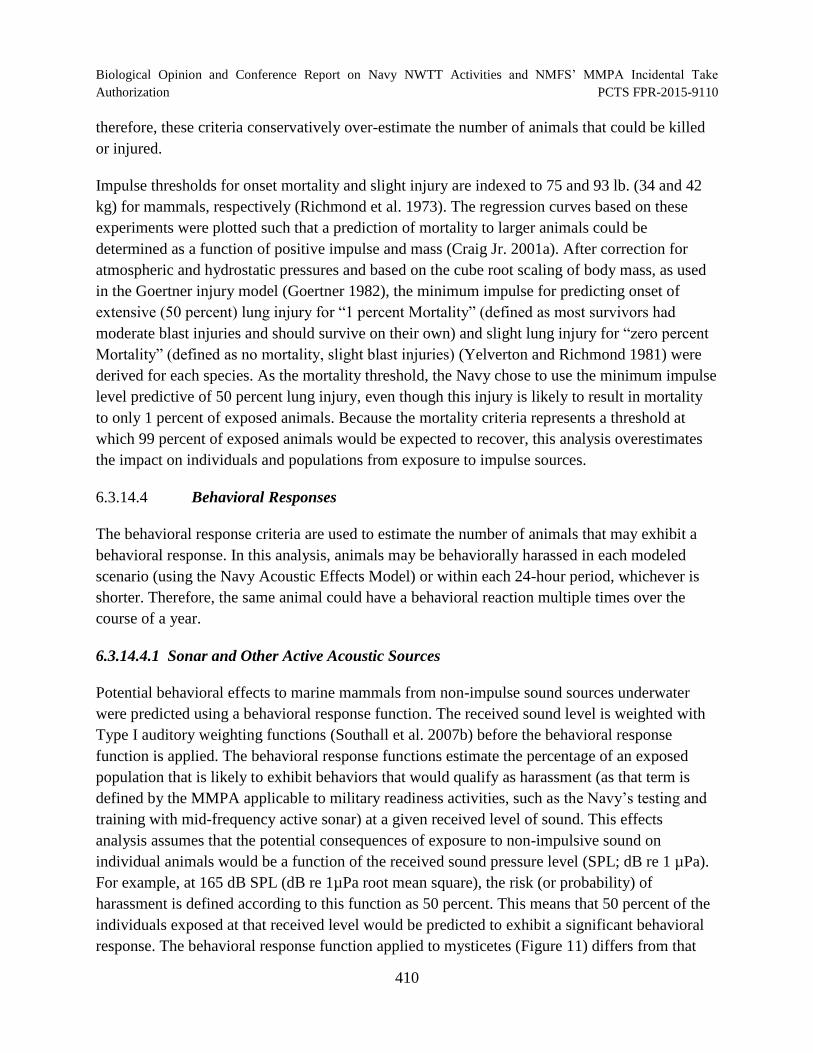
Biological Opinion and Conference Report on Navy NWTT Activities and NMFS’ MMPA Incidental Take
Authorization PCTS FPR-2015-9110
therefore, these criteria conservatively over-estimate the number of animals that could be killed
or injured.
Impulse thresholds for onset mortality and slight injury are indexed to 75 and 93 lb. (34 and 42
kg) for mammals, respectively (Richmond et al. 1973). The regression curves based on these
experiments were plotted such that a prediction of mortality to larger animals could be
determined as a function of positive impulse and mass (Craig Jr. 2001a). After correction for
atmospheric and hydrostatic pressures and based on the cube root scaling of body mass, as used
in the Goertner injury model (Goertner 1982), the minimum impulse for predicting onset of
extensive (50 percent) lung injury for “1 percent Mortality” (defined as most survivors had
moderate blast injuries and should survive on their own) and slight lung injury for “zero percent
Mortality” (defined as no mortality, slight blast injuries) (Yelverton and Richmond 1981) were
derived for each species. As the mortality threshold, the Navy chose to use the minimum impulse
level predictive of 50 percent lung injury, even though this injury is likely to result in mortality
to only 1 percent of exposed animals. Because the mortality criteria represents a threshold at
which 99 percent of exposed animals would be expected to recover, this analysis overestimates
the impact on individuals and populations from exposure to impulse sources.
6.3.14.4 Behavioral Responses
The behavioral response criteria are used to estimate the number of animals that may exhibit a
behavioral response. In this analysis, animals may be behaviorally harassed in each modeled
scenario (using the Navy Acoustic Effects Model) or within each 24-hour period, whichever is
shorter. Therefore, the same animal could have a behavioral reaction multiple times over the
course of a year.
6.3.14.4.1 Sonar and Other Active Acoustic Sources
Potential behavioral effects to marine mammals from non-impulse sound sources underwater
were predicted using a behavioral response function. The received sound level is weighted with
Type I auditory weighting functions (Southall et al. 2007b) before the behavioral response
function is applied. The behavioral response functions estimate the percentage of an exposed
population that is likely to exhibit behaviors that would qualify as harassment (as that term is
defined by the MMPA applicable to military readiness activities, such as the Navy’s testing and
training with mid-frequency active sonar) at a given received level of sound. This effects
analysis assumes that the potential consequences of exposure to non-impulsive sound on
individual animals would be a function of the received sound pressure level (SPL; dB re 1 µPa).
For example, at 165 dB SPL (dB re 1µPa root mean square), the risk (or probability) of
harassment is defined according to this function as 50 percent. This means that 50 percent of the
individuals exposed at that received level would be predicted to exhibit a significant behavioral
response. The behavioral response function applied to mysticetes (Figure 11) differs from that
410
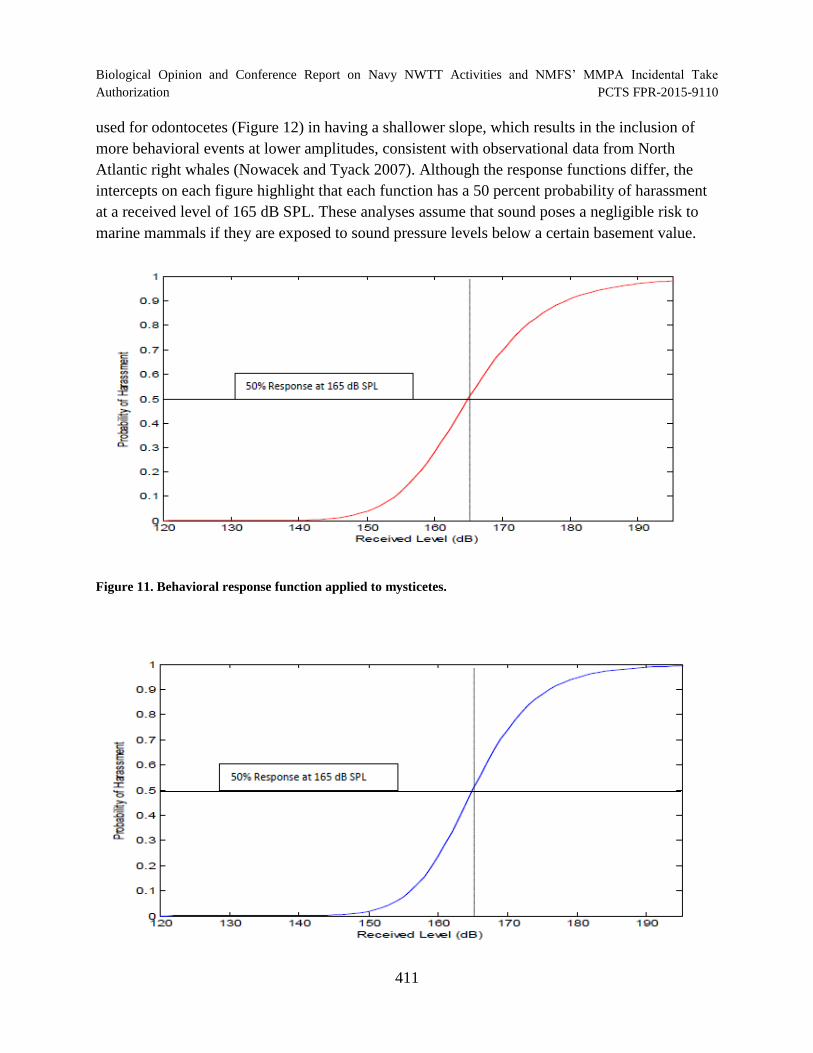
Biological Opinion and Conference Report on Navy NWTT Activities and NMFS’ MMPA Incidental Take
Authorization PCTS FPR-2015-9110
used for odontocetes (Figure 12) in having a shallower slope, which results in the inclusion of
more behavioral events at lower amplitudes, consistent with observational data from North
Atlantic right whales (Nowacek and Tyack 2007). Although the response functions differ, the
intercepts on each figure highlight that each function has a 50 percent probability of harassment
at a received level of 165 dB SPL. These analyses assume that sound poses a negligible risk to
marine mammals if they are exposed to sound pressure levels below a certain basement value.
Figure 11. Behavioral response function applied to mysticetes.
411
Biological Opinion and Conference Report on Navy NWTT Activities and NMFS’ MMPA Incidental Take
Authorization PCTS FPR-2015-9110
Figure 12. Behavioral response function applied to odontocetes and pinnipeds.
The distances over which the sound pressure level from four representative sonar sources is
within the indicated 6-dB bins, and the percentage of animals that may exhibit a significant
behavioral response under the mysticete and odontocete behavioral response function, are shown
in Table 74 and Table 75 respectively.
412
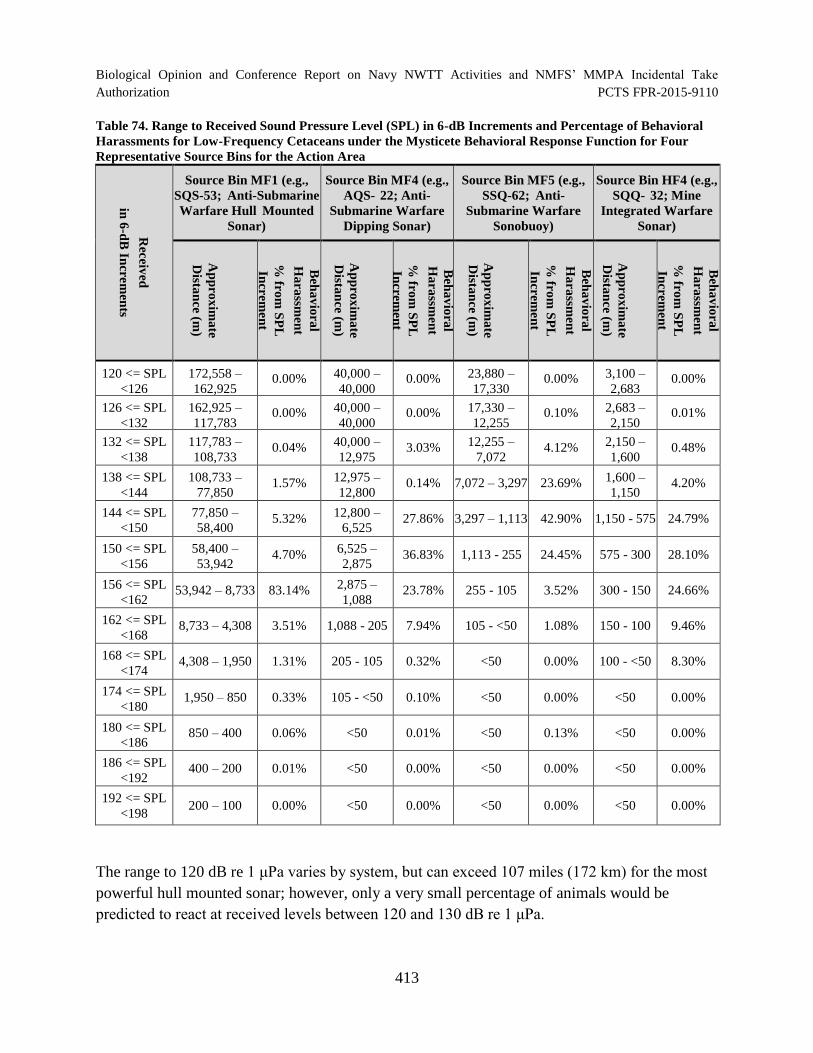
Biological Opinion and Conference Report on Navy NWTT Activities and NMFS’ MMPA Incidental Take
Authorization PCTS FPR-2015-9110
Table 74. Range to Received Sound Pressure Level (SPL) in 6-dB Increments and Percentage of Behavioral
Harassments for Low-Frequency Cetaceans under the Mysticete Behavioral Response Function for Four
Representative Source Bins for the Action Area
Rec
eived
in 6
-dB
Incre
men
ts
Source Bin MF1 (e.g.,
SQS-53; Anti-Submarine
Warfare Hull Mounted
Sonar)
Source Bin MF4 (e.g.,
AQS 22; Anti-
Submarine Warfare
Dipping Sonar)
Source Bin MF5 (e.g.,
SSQ-62; Anti-
Submarine Warfare
Sonobuoy)
Source Bin HF4 (e.g.,
SQQ 32; Mine
Integrated Warfare
Sonar)
Ap
pro
xim
ate
Dista
nce (m
)
Beh
av
iora
l
Ha
rassm
ent
% fro
m S
PL
Incre
men
t
Ap
pro
xim
ate
Dista
nce (m
)
Beh
av
iora
l
Ha
rassm
ent
% fro
m S
PL
Incre
men
t
Ap
pro
xim
ate
Dista
nce (m
)
Beh
av
iora
l
Ha
rassm
ent
% fro
m S
PL
Incre
men
t
Ap
pro
xim
ate
Dista
nce (m
)
Beh
av
iora
l
Ha
rassm
ent
% fro
m S
PL
Incre
men
t
120 <= SPL
<126
172,558 –
162,925 0.00% 40,000 –
40,000 0.00% 23,880 –
17,330 0.00% 3,100 –
2,683 0.00%
126 <= SPL
<132
162,925 –
117,783 0.00% 40,000 –
40,000 0.00% 17,330 –
12,255 0.10% 2,683 –
2,150 0.01%
132 <= SPL
<138
117,783 –
108,733 0.04% 40,000 –
12,975 3.03% 12,255 –
7,072 4.12% 2,150 –
1,600 0.48%
138 <= SPL
<144
108,733 –
77,850 1.57% 12,975 –
12,800 0.14% 7,072 – 3,297 23.69% 1,600 –
1,150 4.20%
144 <= SPL
<150
77,850 –
58,400 5.32% 12,800 –
6,525 27.86% 3,297 – 1,113 42.90% 1,150 - 575 24.79%
150 <= SPL
<156
58,400 –
53,942 4.70%
6,525 –
2,875 36.83% 1,113 - 255 24.45% 575 - 300 28.10%
156 <= SPL
<162 53,942 – 8,733 83.14% 2,875 –
1,088 23.78% 255 - 105 3.52% 300 - 150 24.66%
162 <= SPL
<168 8,733 – 4,308 3.51% 1,088 - 205 7.94% 105 - <50 1.08% 150 - 100 9.46%
168 <= SPL
<174 4,308 – 1,950 1.31% 205 - 105 0.32% <50 0.00% 100 - <50 8.30%
174 <= SPL
<180 1,950 – 850 0.33% 105 - <50 0.10% <50 0.00% <50 0.00%
180 <= SPL
<186 850 – 400 0.06% <50 0.01% <50 0.13% <50 0.00%
186 <= SPL
<192 400 – 200 0.01% <50 0.00% <50 0.00% <50 0.00%
192 <= SPL
<198 200 – 100 0.00% <50 0.00% <50 0.00% <50 0.00%
The range to 120 dB re 1 μPa varies by system, but can exceed 107 miles (172 km) for the most
powerful hull mounted sonar; however, only a very small percentage of animals would be
predicted to react at received levels between 120 and 130 dB re 1 μPa.
413
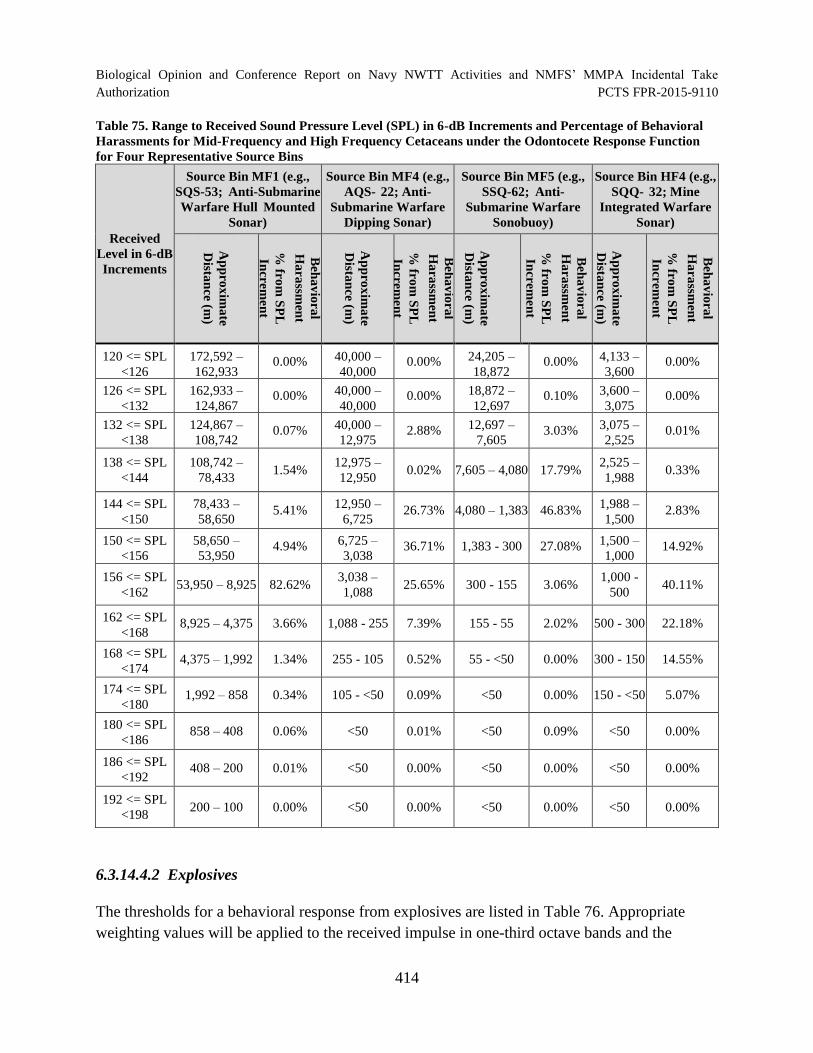
Biological Opinion and Conference Report on Navy NWTT Activities and NMFS’ MMPA Incidental Take
Authorization PCTS FPR-2015-9110
Table 75. Range to Received Sound Pressure Level (SPL) in 6-dB Increments and Percentage of Behavioral
Harassments for Mid-Frequency and High Frequency Cetaceans under the Odontocete Response Function
for Four Representative Source Bins
Received
Level in 6-dB
Increments
Source Bin MF1 (e.g.,
SQS-53; Anti-Submarine
Warfare Hull Mounted
Sonar)
Source Bin MF4 (e.g.,
AQS 22; Anti-
Submarine Warfare
Dipping Sonar)
Source Bin MF5 (e.g.,
SSQ-62; Anti-
Submarine Warfare
Sonobuoy)
Source Bin HF4 (e.g.,
SQQ 32; Mine
Integrated Warfare
Sonar)
Ap
pro
xim
ate
Dista
nce (m
)
Beh
av
iora
l
Ha
rassm
ent
% fro
m S
PL
Incre
men
t
Ap
pro
xim
ate
Dista
nce (m
)
Beh
av
iora
l
Ha
rassm
ent
% fro
m S
PL
Incre
men
t
Ap
pro
xim
ate
Dista
nce (m
)
Beh
av
iora
l
Ha
rassm
ent
% fro
m S
PL
Incre
men
t
Ap
pro
xim
ate
Dista
nce (m
)
Beh
av
iora
l
Ha
rassm
ent
% fro
m S
PL
Incre
men
t
120 <= SPL
<126
172,592 –
162,933 0.00% 40,000 –
40,000 0.00% 24,205 –
18,872 0.00% 4,133 –
3,600 0.00%
126 <= SPL
<132
162,933 –
124,867 0.00% 40,000 –
40,000 0.00% 18,872 –
12,697 0.10% 3,600 –
3,075 0.00%
132 <= SPL
<138
124,867 –
108,742 0.07% 40,000 –
12,975 2.88% 12,697 –
7,605 3.03% 3,075 –
2,525 0.01%
138 <= SPL
<144
108,742 –
78,433 1.54%
12,975 –
12,950 0.02% 7,605 – 4,080 17.79%
2,525 –
1,988 0.33%
144 <= SPL
<150
78,433 –
58,650 5.41%
12,950 –
6,725 26.73% 4,080 – 1,383 46.83%
1,988 –
1,500 2.83%
150 <= SPL
<156
58,650 –
53,950 4.94% 6,725 –
3,038 36.71% 1,383 - 300 27.08% 1,500 –
1,000 14.92%
156 <= SPL
<162 53,950 – 8,925 82.62%
3,038 –
1,088 25.65% 300 - 155 3.06%
1,000
500 40.11%
162 <= SPL
<168 8,925 – 4,375 3.66% 1,088 - 255 7.39% 155 - 55 2.02% 500 - 300 22.18%
168 <= SPL
<174 4,375 – 1,992 1.34% 255 - 105 0.52% 55 - <50 0.00% 300 - 150 14.55%
174 <= SPL
<180 1,992 – 858 0.34% 105 - <50 0.09% <50 0.00% 150 - <50 5.07%
180 <= SPL
<186 858 – 408 0.06% <50 0.01% <50 0.09% <50 0.00%
186 <= SPL
<192 408 – 200 0.01% <50 0.00% <50 0.00% <50 0.00%
192 <= SPL
<198 200 – 100 0.00% <50 0.00% <50 0.00% <50 0.00%
6.3.14.4.2 Explosives
The thresholds for a behavioral response from explosives are listed in Table 76. Appropriate
weighting values will be applied to the received impulse in one-third octave bands and the
414
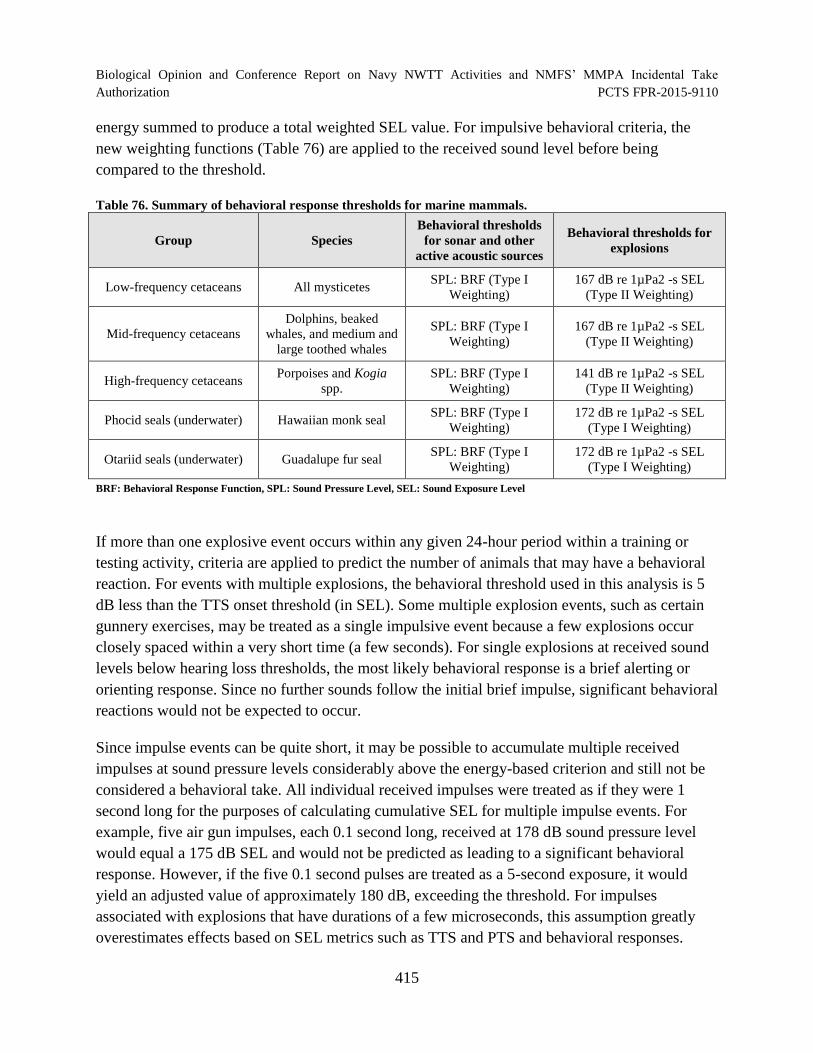
Biological Opinion and Conference Report on Navy NWTT Activities and NMFS’ MMPA Incidental Take
Authorization PCTS FPR-2015-9110
energy summed to produce a total weighted SEL value. For impulsive behavioral criteria, the
new weighting functions (Table 76) are applied to the received sound level before being
compared to the threshold.
Table 76. Summary of behavioral response thresholds for marine mammals.
Group Species
Behavioral thresholds
for sonar and other
active acoustic sources
Behavioral thresholds for
explosions
Low-frequency cetaceans All mysticetes SPL: BRF (Type I
Weighting)
167 dB re 1µPa2 -s SEL
(Type II Weighting)
Mid-frequency cetaceans
Dolphins, beaked
whales, and medium and
large toothed whales
SPL: BRF (Type I
Weighting)
167 dB re 1µPa2 -s SEL
(Type II Weighting)
High-frequency cetaceans Porpoises and Kogia
spp.
SPL: BRF (Type I
Weighting)
141 dB re 1µPa2 -s SEL
(Type II Weighting)
Phocid seals (underwater) Hawaiian monk seal SPL: BRF (Type I
Weighting)
172 dB re 1µPa2 -s SEL
(Type I Weighting)
Otariid seals (underwater) Guadalupe fur seal SPL: BRF (Type I
Weighting)
172 dB re 1µPa2 -s SEL
(Type I Weighting)
BRF: Behavioral Response Function, SPL: Sound Pressure Level, SEL: Sound Exposure Level
If more than one explosive event occurs within any given 24-hour period within a training or
testing activity, criteria are applied to predict the number of animals that may have a behavioral
reaction. For events with multiple explosions, the behavioral threshold used in this analysis is 5
dB less than the TTS onset threshold (in SEL). Some multiple explosion events, such as certain
gunnery exercises, may be treated as a single impulsive event because a few explosions occur
closely spaced within a very short time (a few seconds). For single explosions at received sound
levels below hearing loss thresholds, the most likely behavioral response is a brief alerting or
orienting response. Since no further sounds follow the initial brief impulse, significant behavioral
reactions would not be expected to occur.
Since impulse events can be quite short, it may be possible to accumulate multiple received
impulses at sound pressure levels considerably above the energy-based criterion and still not be
considered a behavioral take. All individual received impulses were treated as if they were 1
second long for the purposes of calculating cumulative SEL for multiple impulse events. For
example, five air gun impulses, each 0.1 second long, received at 178 dB sound pressure level
would equal a 175 dB SEL and would not be predicted as leading to a significant behavioral
response. However, if the five 0.1 second pulses are treated as a 5-second exposure, it would
yield an adjusted value of approximately 180 dB, exceeding the threshold. For impulses
associated with explosions that have durations of a few microseconds, this assumption greatly
overestimates effects based on SEL metrics such as TTS and PTS and behavioral responses.
415
Biological Opinion and Conference Report on Navy NWTT Activities and NMFS’ MMPA Incidental Take
Authorization PCTS FPR-2015-9110
6.4 Risk Assessment Framework - Sea Turtles
Direct injury to sea turtles from non-explosive sound sources, such as sonar, is unlikely because
of relatively lower peak pressures and slower rise times than potentially injurious sources such as
explosions. Nonexplosive sources also lack the strong shock waves that are associated with
explosions. Therefore, primary blast injury and barotrauma would not result from exposure to
non-impulsive sources such as sonar, and are only considered for explosive detonations.
The potential for trauma in sea turtles exposed to explosive sources has been inferred from tests
of submerged terrestrial mammals exposed to underwater explosions (Ketten et al. 1993;
Richmond et al. 1973; Yelverton et al. 1973). The effects of an underwater explosion on a sea
turtle depend upon several factors, including size, type, and depth of both the animal and the
explosive, depth of the water column, and distance from the charge to the animal. Smaller sea
turtles would generally be more susceptible to injury. The compression of blast-sensitive, gas-
containing organs when a sea turtle increases depth reduces likelihood of injury to these organs.
The location of the explosion in the water column and the underwater environment determines
whether most energy is released into the water or the air and influences the propagation of the
blast wave.
6.4.1 Primary Blast Injury and Barotrauma
The greatest potential for direct, non-auditory tissue impacts to sea turtles is primary blast injury
and barotrauma after exposure to the shock waves of high-amplitude impulsive sources, such as
explosions. Primary blast injuries result from the initial compression of a body exposed to the
high pressure of a blast or shock wave. Primary blast injury is usually limited to gas-containing
structures (e.g., lung and gut) and the pressure-sensitive components of the auditory system
(discussed below) (Craig and Hearn 1998; SG 1991), although additional injuries could include
concussive brain damage and cranial, skeletal, or shell fractures (Ketten 1995). Barotrauma
refers to injuries caused when large pressure changes occur across tissue interfaces, normally at
the boundaries of air-filled tissues such as the lungs. Primary blast injury to the respiratory
system may be fatal depending on the severity of the trauma. Rupture of the lung may introduce
air into the vascular system, producing air blockages that can restrict oxygen delivery to the brain
and heart. Although often secondary in life-threatening severity to pulmonary blast trauma, the
gastrointestinal tract can also suffer bruising and tearing from blast exposure, particularly in air-
containing regions of the tract. Potential traumas include internal bleeding, bowel perforation,
tissue tears, and ruptures of the hollow abdominal organs. Although hemorrhage of solid organs
(e.g., liver, spleen, and kidney) from blast exposure is possible, rupture of these organs is rarely
encountered. Non-lethal injuries could increase a sea turtle’s risk of predation, disease, or
infection.
416
Biological Opinion and Conference Report on Navy NWTT Activities and NMFS’ MMPA Incidental Take
Authorization PCTS FPR-2015-9110
6.4.2 Auditory Trauma
Components of the auditory system that detect smaller or more gradual pressure changes can also
be damaged when overloaded at high pressures with rapid rise times. Rupture of the tympanic
membrane, while not necessarily a serious or life-threatening injury, may lead to permanent
hearing loss (Ketten 1993; Ketten 1995). No data exist to correlate the sensitivity of the tympanic
membrane and middle and inner ear to trauma from shock waves from underwater explosions
(Viada et al. 2008).
The specific impacts of bulk cavitation (the collapse of air spaces created by explosive
detonations) on sea turtles are unknown. The presence of a sea turtle within the cavitation region
created by the detonation of small charges could annoy, injure, or increase the severity of the
injuries caused by the shock wave. The area of cavitation from a large charge, such as those used
in ship shock trials, is expected to result in mortality for smaller animals (Craig Jr. and Rye
2008). An animal located at (or near) the cavitation closure depth would be subjected to a short
duration (“water hammer”) pressure pulse; however, direct shock wave impacts alone would be
expected to cause auditory system injuries and could cause internal organ injuries.
6.4.3 Hearing Loss
Hearing loss could effectively reduce the distance over which sea turtles can detect biologically
relevant sounds. Both auditory trauma (a direct injury discussed above) and auditory fatigue may
result in hearing loss, but the mechanisms responsible for auditory fatigue differ from auditory
trauma. Hearing loss due to auditory fatigue is also known as threshold shift, a reduction in
hearing sensitivity at certain frequencies. Threshold shift is the difference between hearing
thresholds measured before and after an intense, fatiguing sound exposure. Threshold shift
occurs when hair cells in the ear fatigue, causing them to become less sensitive over a small
range of frequencies related to the sound source to which an animal was exposed. The actual
amount of threshold shift depends on the amplitude, duration, frequency, and temporal pattern of
the sound exposure. No studies are published on inducing threshold shift in sea turtles; therefore,
the potential for the impact on sea turtles is inferred from studies of threshold shift in other
animals.
Temporary threshold shift is a hearing loss that recovers to the original hearing threshold over a
period. An animal may not even be aware of a TTS. It does not become deaf, but requires a
louder sound stimulus (relative to the amount of TTS) to detect a sound within the affected
frequencies. Temporary threshold shift may last several minutes to several days, depending on
the intensity and duration of the sound exposure that induced the threshold shift (including
multiple exposures).
417
Biological Opinion and Conference Report on Navy NWTT Activities and NMFS’ MMPA Incidental Take
Authorization PCTS FPR-2015-9110
Permanent threshold shift is a permanent hearing loss at a certain frequency range. Permanent
threshold shift is non-recoverable due to the destruction of tissues within the auditory system.
The animal does not become deaf, but requires a louder sound stimulus (relative to the amount of
PTS) to detect a sound within the affected frequencies.
Little is known about how sea turtles use sound in their environment. Based on knowledge of
their sensory biology (Bartol and Ketten 2006; Moein Bartol and Musick 2003), sea turtles may
be able to detect objects within the water column (e.g., vessels, prey, predators) via some
combination of auditory and visual cues. However, research examining the ability of sea turtles
to avoid collisions with vessels shows they may rely more on their vision than auditory cues
(Hazel et al. 2007). Similarly, while sea turtles may rely on acoustic cues to identify nesting
beaches, they appear to rely on other non-acoustic cues for navigation, such as magnetic fields
(Lohmann and Lohmann 1996a; Lohmann and Lohmann 1996b) and light (Avens and Lohmann
2003). Additionally, they are not known to produce sounds underwater for communication. As a
result, we do not expect instances of TTS and PTS to have fitness consequences for individual
turtles.
6.4.4 Auditory Masking
Auditory masking occurs when a sound prevents or limits the distance over which an animal
detects other biologically relevant sounds. When a noise has a sound level above the sound of
interest, and in a similar frequency band, auditory masking could occur. Any sound above
ambient noise levels and within an animal’s hearing range could cause masking. The degree of
masking increases with increasing noise levels; a noise that is just-detectable over ambient levels
is unlikely to actually cause any substantial masking, whereas a louder noise may mask sounds
over a wider frequency range. In addition, a continuous sound would have more potential for
masking than a sound with a low duty cycle. In the open ocean, ambient noise levels are between
about 60 and 80 dB re 1 μPa (NRC 2003a), especially at lower frequencies (below 100 Hz) and
inshore, ambient noise levels, especially around busy ports, can exceed 120 dB re 1 μPa.
Unlike hearing loss, which likely results in a stress response, behavioral changes resulting from
auditory masking may not be coupled with a stress response. Another important distinction
between masking and hearing loss is that masking only occurs in the presence of the sound
stimulus, whereas hearing loss can persist after the stimulus is gone.
Little is known about how sea turtles use sound in their environment. Based on knowledge of
their sensory biology (Bartol and Ketten 2006; Moein Bartol and Musick 2003), sea turtles may
be able to detect objects within the water column (e.g., vessels, prey, predators) via some
combination of auditory and visual cues. However, research examining the ability of sea turtles
to avoid collisions with vessels shows they may rely more on their vision than auditory cues
(Hazel et al. 2007). Similarly, while sea turtles may rely on acoustic cues to identify nesting
418
Biological Opinion and Conference Report on Navy NWTT Activities and NMFS’ MMPA Incidental Take
Authorization PCTS FPR-2015-9110
beaches, they appear to rely on other non-acoustic cues for navigation, such as magnetic fields
(Lohmann and Lohmann 1996a; Lohmann and Lohmann 1996b) and light (Avens and Lohmann
2003). Additionally, they are not known to produce sounds underwater for communication. As a
result, sound may play a limited role in a sea turtle’s environment. Therefore, the potential for
masking may be limited.
6.4.5 Physiological Stress
Sea turtles may exhibit a behavioral response or combinations of behavioral responses upon
exposure to anthropogenic sounds. If a sound is detected, a stress response (i.e., startle or
annoyance) or a cueing response (based on a past stressful experience) can occur. Sea turtles
naturally experience stressors within their environment and as part of their life histories.
Changing weather and ocean conditions, exposure to diseases and naturally occurring toxins,
lack of prey availability, social interactions with members of the same species, nesting, and
interactions with predators all contribute to stress. Anthropogenic activities could provide
additional stressors above and beyond those that occur in the absence of human activity.
Immature Kemp’s ridley sea turtles show physiological responses to the acute stress of capture
and handling through increased levels of the stress hormone corticosterone, along with biting and
rapid flipper movement (Gregory and Schmid 2001). Though it should be noted that Kemp’s
ridley sea turtles are not found in the NWTT Action Area, we would expect the turtles
considered in this Opinion to have a similar physiological stress response. Captive olive ridley
hatchlings showed heightened blood glucose levels indicating physiological stress (Zenteno et al.
2008). Repeated exposure to stressors, including human disturbance such as vessel disturbance
and anthropogenic sound, may result in negative consequences to the health and viability of an
individual or population (Gregory and Schmid 2001). Factors to consider when predicting a
stress or cueing response is whether an animal is naïve or has prior experience with a stressor.
Prior experience with a stressor may be of particular importance as repeated experience with a
stressor may dull the stress response via acclimation (Hazel et al. 2007).
6.4.6 Behavioral Reactions
Little is known about the hearing ability of sea turtles and their response to acoustic disturbance
and thus analogous species for which data are available are used to estimate the potential
behavioral reactions to sound. The response of a sea turtle to an anthropogenic sound will depend
on the frequency, duration, temporal pattern, and amplitude of the sound, as well as the animal’s
prior experience with the sound and the context in which the sound is encountered (i.e., what the
animal is doing at the time of the exposure). Distance from the sound source and whether it is
perceived as approaching or moving away could also affect the way a sea turtle responds.
Potential behavioral responses to anthropogenic sound could include startle reactions, disruption
419
Biological Opinion and Conference Report on Navy NWTT Activities and NMFS’ MMPA Incidental Take
Authorization PCTS FPR-2015-9110
of feeding, disruption of migration, changes in respiration, alteration of swim speed, alteration of
swim direction, and area avoidance.
It is also possible that behavioral reactions could lead to negative physiological consequences.
For example, Garcia-Parraga et al. (2014) reported evidence of decompression sickness (DCS;
e.g., gas embolism) in sea turtles following capture in trawls or gillnets, with a higher incidence
of DCS when caught in deeper waters. It is possible that a sea turtle could have an extreme
behavioral avoidance reaction (e.g., surfacing too quickly in an attempt to avoid noise) that could
lead to DCS-like symptoms and fitness consequences. However, it should be noted that this is
the first, and to our knowledge, only study that has documented DCS-like symptoms in sea
turtles. Previous research has suggested sea turtles are protected against DCS through
anatomical, physiological, and behavioral adaptations (Berkson 1967; Castellini 2012; Fossette
et al. 2010; Lutcavage and Lutz 1997; Piantadosi and Thalmann 2004). Given this uncertainty in
the available literature and the lack of evidence that this sort of extreme behavioral avoidance
reaction would be expected, we do not believe such a reaction is likely to occur and we do not
consider DCS in sea turtles further in this Opinion.
6.4.6.1 Behavioral Reactions to Impulsive Sound Sources
Studies of sea turtle responses to sounds are limited, though a few studies examined sea turtle
reactions to airguns, which produce broadband impulse sound. O'Hara and Wilcox (1990)
attempted to create a sound barrier at the end of a canal using seismic airguns. They reported that
loggerhead turtles kept in a 984 ft by 148 ft (300 m by 45 m) enclosure in a 10 m deep canal
maintained a distance of 98 ft (30 m) from airguns fired every 15 seconds, with the strongest
sound components within the 25 Hz to 1,000 Hz frequency range. McCauley et al. (2000)
estimated that the received level at which turtles avoided sound in the O'Hara and Wilcox (1990)
experiment was 175 to 176 dB re 1 μPa root mean square.
Moein Bartol et al. (1995) investigated the use of air guns to repel juvenile loggerhead sea turtles
from hopper dredges. Sound frequencies of the airguns ranged from 100 Hz to 1,000 Hz at three
levels: 175, 177, and 179 dB re 1 μPa at 1 m. The turtles avoided the airguns during the initial
exposures (mean range of 24 m), but additional trials several days afterward did not elicit
statistically significant avoidance. They concluded that this was due to either habituation or a
temporary shift in the turtles’ hearing capability.
McCauley et al. (2000) exposed caged green and loggerhead sea turtles to an approaching-
departing single air gun to gauge behavioral responses. The trials showed that above a received
level of 166 dB re 1 μPa root mean square, the turtles noticeably increased their swimming
activity compared to non-operational periods, with swimming time increasing as air gun levels
increased during approach. Above 175 dB re 1 μPa root mean square, behavior became more
erratic, possibly indicating the turtles were in an agitated state (McCauley et al. 2000). The
authors noted that the point at which the turtles showed erratic behavior and exhibited possible
420
Biological Opinion and Conference Report on Navy NWTT Activities and NMFS’ MMPA Incidental Take
Authorization PCTS FPR-2015-9110
agitation would be expected to approximately equal the point at which active avoidance would
occur for unrestrained turtles (McCauley et al. 2000).
No obvious avoidance reactions by free-ranging sea turtles, such as swimming away, were
observed during a multi-month seismic survey using airgun arrays, although fewer sea turtles
were observed when the seismic airguns were active than when they were inactive (Weir 2007).
The author noted that sea state and the time of day affected both airgun operations and sea turtle
surface basking behavior, making it difficult to draw conclusions from the data. Further,
DeRuiter and Larbi Doukara (2012) noted diving behavior following airgun shots in loggerhead
turtles, and noted a decreased dive probability with increasing distance from the airgun array.
6.4.6.2 Behavioral Reactions to Non-Impulsive Sources
No studies have been performed to examine the response of sea turtles to sonar. However, based
on the limited range of hearing, they may respond to sources operating below 2 kHz but are
unlikely to sense higher frequency sounds.
6.4.6.3 Behavioral Reactions to Vessels
Vessel noise and visual stimuli (vessels and shadows) could disturb sea turtles, and potentially
elicit a startle response, avoidance, or other behavioral reaction. Sea turtles are frequently
exposed to research, ecotourism, commercial, government, and private vessel traffic. Some sea
turtles may habituate to vessel noise, and may be more likely to respond to the sight of a vessel
rather than the sound of a vessel, although both may play a role in prompting reactions (Hazel et
al. 2007).
6.4.6.4 Behavioral Reactions to Aircraft and Missile Overflight
Sea turtles may respond to both the physical presence (visual effects of the aircraft and shadows)
and to the noise generated by aircraft. Helicopters may produce strong downdrafts, a vertical
flow of air that becomes a surface wind, which can also affect an animal's behavior at or near the
surface. In most cases, exposure of a sea turtle to fixed-wing or rotary-wing aircraft would last
for only seconds as the aircraft quickly passes overhead. Animals would have to be at or near the
surface at the time of an overflight to be exposed to appreciable sound levels or visual stimuli.
6.4.7 Repeated Exposures of Sea Turtles
Navy sonar systems are generally deployed from highly mobile vessels or in-water devices
which do not directly target sea turtles. The typical duty cycle with most tactical anti-submarine
warfare is about once per minute (Navy 2013). For example, a typical Navy vessel with hull
mounted MFA sonar would travel over 0.3 kilometers between pings (based on a speed of 10
knots/hr and transmission rate of 1 ping/min). Based on this distance traveled and potential
avoidance behavior of acoustically exposed animals, we expect repeat acoustic exposures
capable of eliciting a behavioral response to an individual over a brief period of time to be rare.
421
Biological Opinion and Conference Report on Navy NWTT Activities and NMFS’ MMPA Incidental Take Authorization PCTS FPR-2015-9110
For sonar devices that are stationary (e.g. dipped sonar), due to the duty cycle, duration of active
transmission in a specific location, and mitigation measures (e.g. avoidance of visible sea
turtles), we would not expect repeated exposures.
Establishing a causal link between anthropogenic noise and individual impacts as well as
population viability is difficult to quantify and assess (McGregor 2013; Read et al. 2014).
Assessing the effects of sounds, both individually and cumulatively, on marine species is
difficult because responses depend on a variety of factors including age class, prior experience,
behavioral state at the time of exposure, and indirect effects. Responses may be also be
influenced by other non-sound related factors (Ellison et al. 2011; Goldbogen et al. 2013; Kight
and Swaddle 2011; McGregor 2013; Read et al. 2014; Williams et al. 2014a). Within the ocean
environment, aggregate anthropogenic impacts have to be considered in context of natural
variation and climate change (Boyd and Hutchins 2012). These contexts can include additive
effects from two or more factors, multiplicity where response from two or more factors is greater
than the sum of individual effects, synergism between factors and response, antagonism as a
negative feedback between factors, acclimation as a short-term individual response, and
adaptation as a long-term population change (Boyd and Hutchins 2012). To address aggregate
impacts and responses from any changes due to processes such as habituation, tolerance, and
sensitization, future experiments over an extended period of time still need further research
(Bejder et al. 2009; Blickley et al. 2012; Read et al. 2014).
Little is known about how sea turtles use sound in their environment. Based on knowledge of
their sensory biology (Bartol and Ketten 2006; Moein Bartol and Musick 2003), sea turtles may
be able to detect objects within the water column (e.g., vessels, prey, predators) via some
combination of auditory and visual cues. However, research examining the ability of sea turtles
to avoid collisions with vessels shows they may rely more on their vision than auditory cues
(Hazel et al. 2007). Similarly, while sea turtles may rely on acoustic cues to identify nesting
beaches, they appear to rely on other non-acoustic cues for navigation, such as magnetic fields
(Lohmann and Lohmann 1996a; Lohmann and Lohmann 1996b) and light (Avens and Lohmann
2003). Additionally, they are not known to produce sounds underwater for communication.
Therefore, repeated interruptions of a sea turtle’s normal activity due to acoustic stressors is
unlikely to lead to fitness consequences and long-term implications for the population. To result
in significant fitness consequences we would have to assume that an individual turtle detects and
responds to the acoustic source, and that it could not compensate for lost feeding opportunities
by either immediately feeding at another location, by feeding shortly after cessation of acoustic
exposure, or by feeding at a later time. There is no indication this is the case, particularly since
foraging habitat would still be available in the environment following the cessation of acoustic
exposure.
422
Biological Opinion and Conference Report on Navy NWTT Activities and NMFS’ MMPA Incidental Take
Authorization PCTS FPR-2015-9110
Sea turtles may habituate to, or become tolerant of, repeated exposures over time, such as
ambient noise found in areas of high vessel traffic (Hazel et al. 2007). After initial avoidance
reactions, loggerhead sea turtles habituated to repeated experimental exposures to airguns of up
to a source level of 179 dB re 1 μPa in an enclosure. The habituation behavior was retained by
the sea turtles when exposures were separated by several days (Moein Bartol et al. 1995).
Individual sea turtles that are more tolerant may stay in a disturbed area, whereas individuals that
are more sensitive may leave for areas with less human disturbance. Animals that remain
throughout the disturbance may be unable to leave the area for a variety of physiological or
environmental reasons. However, given the highly migratory and wide ranging life histories of
the species considered in this Opinion, we do not believe this will result from Navy training and
testing activities in the NWTT Action Area.
If sound exposure were to be concentrated in a relatively small geographic area over a long
period of time (e.g., days or weeks), it would be possible for individuals confined to a specific
area to be exposed to acoustic stressors (e.g., MFA sonar) multiple times during a relatively short
time period. We do not expect this to occur as we would expect individuals to move and avoid
areas where exposures to acoustic stressors are at higher levels (e.g., greater than 120 dB). Given
sea turtles’ mobility and large ranges, we would expect these individuals to temporarily select
alternative foraging sites nearby until the exposure levels in their initially selected foraging area
have decreased. Therefore, even temporary displacement from initially selected foraging habitat
is not expected to impact the fitness of any individual animals because we would expect
equivalent foraging to be available in close proximity. As a result of being capable of moving
outside the range of behavioral responses from acoustic stressors, being physiologically less
susceptible to acoustic stressors, and relying on senses other than hearing for important
biological behaviors; we do not expect any fitness consequences from any individual animals nor
do we expect any population level effects from behavioral responses.
6.4.8 Criteria for Predicting Acoustic and Explosive Impacts – Sea Turtles
In this Opinion, we consider two primary categories of sound sources that the Navy used in its
analyses of sound impacts on sea turtles: impulsive sources (e.g., explosives, airguns, weapons
firing) and non-impulsive sources (e.g., sonar, pingers, and countermeasure devices). The Navy,
in cooperation with NMFS, developed acoustic impacts criteria and thresholds for sea turtle
exposures to various sound sources.
6.4.8.1 Frequency Weighting
Animals generally do not hear equally well across their entire hearing range. Several studies
using green, loggerhead, and Kemp’s ridley turtles suggest sea turtles are most sensitive to low-
frequency sounds, although this sensitivity varies slightly by species and age (Bartol et al. 1999a;
Bartol and Ketten 2006; Lenhardt et al. 1994b; Ridgeway et al. 1969). Sea turtles possess an
423
Biological Opinion and Conference Report on Navy NWTT Activities and NMFS’ MMPA Incidental Take
Authorization PCTS FPR-2015-9110
overall hearing range of approximately 100 Hz to 1 kHz, with an upper limit of 2 kHz (Bartol et
al. 1999a; Bartol and Ketten 2006; Lenhardt et al. 1994b; Ridgeway et al. 1969). Because
hearing thresholds are frequency-dependent, an auditory weighting function was developed for
sea turtles (turtle-weighting, or T-weighting). The T-weighting function simply defines lower
and upper frequency boundaries beyond which sea turtle hearing sensitivity decreases. The
single frequency cutoffs at each end of the frequency range where hearing sensitivity begins to
decrease are based on the most liberal interpretations of sea turtle hearing abilities (10 Hz and 2
kHz). These boundaries are precautionary and exceed the demonstrated or anatomy-based
hypothetical upper and lower limits of sea turtle hearing. The T-weighting function adjusts the
received sound level, based on sensitivity to different frequencies, emphasizing frequencies to
which sea turtles are most sensitive and reducing emphasis on frequencies outside of their
estimated useful range of hearing. For example, a 160 dB re 1 μPa tone at 10 kHz, far outside sea
turtle best range of hearing, is estimated to be perceived by a sea turtle as a 130 dB re 1 μPa
sound (i.e., 30 dB lower). Stated another way, a sound outside of the range of best hearing would
have to be more intense to have the same impact as a sound within the range of best hearing.
6.4.8.2 Hearing Loss – Temporary and Permanent Threshold Shift
Whereas TTS represents a temporary reduction of hearing sensitivity, PTS represents tissue
damage that does not recover and permanent reduced sensitivity to sounds over specific
frequency ranges. To date, no known data are available on potential hearing impairments (i.e.,
TTS and PTS) in sea turtles. Sea turtles, based on their auditory anatomy (Lenhardt et al. 1985;
Moein Bartol and Musick 2003; Wartzok and Ketten 1999; Wever 1978; Wyneken 2001), almost
certainly have poorer absolute sensitivity (i.e., higher thresholds) across much of their hearing
range than do the mid-frequency cetacean species. Therefore, applying TTS and PTS criteria
derived from mid-frequency cetaceans to sea turtles provides a protective approach to estimating
acoustic impacts to sea turtles (PTS and TTS data are not available for low-frequency cetaceans).
Criteria for hearing loss due to onset of TTS and PTS are based on sound exposure level (for
non-impulsive and impulsive sources) and peak pressure (for impulsive sources only).
To determine the sound exposure level, the turtle weighting function is applied to the acoustic
exposure to emphasize only those frequencies within a sea turtle’s hearing range. Multiple
exposures within any 24-hour period are considered one continuous exposure for the purposes of
calculating the received sound exposure level for a given individual. This conservatively
assumes no recovery of hearing between exposures during a 24-hour period. The weighted sound
exposure level is then compared to weighted threshold values for TTS and PTS. If the weighted
exposure level meets or exceeds the weighted threshold, then the physiological impact (TTS or
PTS) is assumed to occur. For impacts from exposures to impulsive sources, the metric (peak
pressure or sound exposure level) and threshold level that results in the longest range to impact is
424
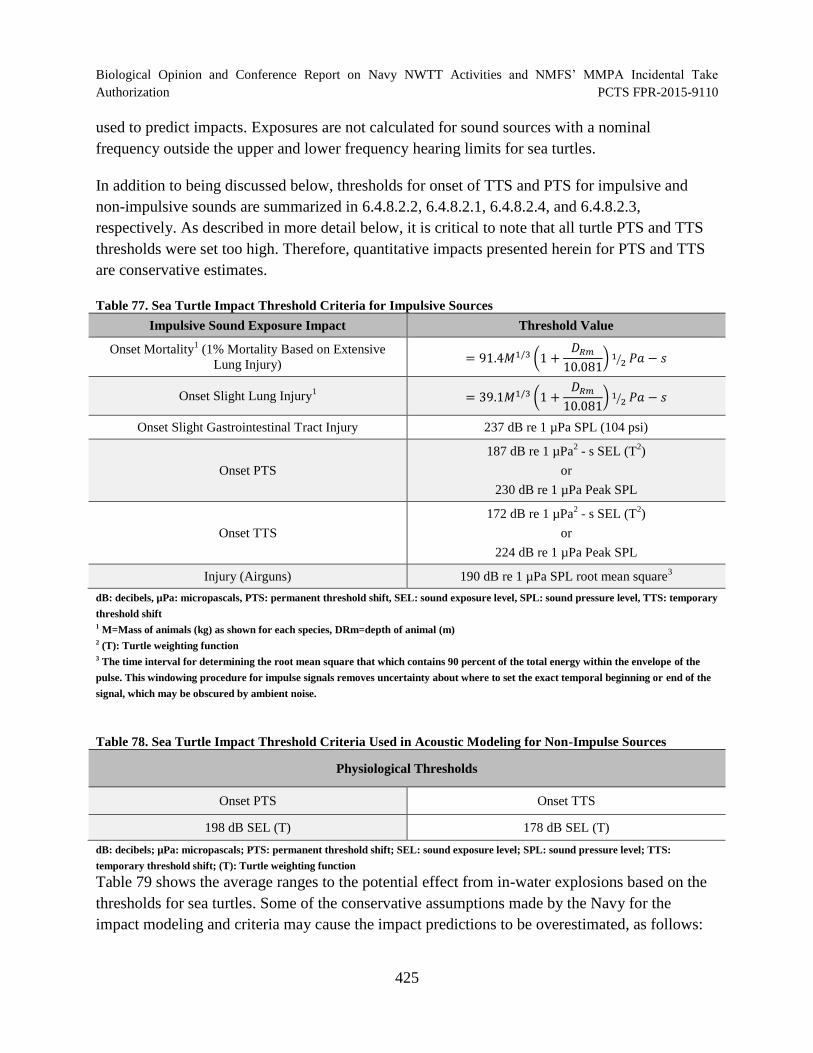
Biological Opinion and Conference Report on Navy NWTT Activities and NMFS’ MMPA Incidental Take
Authorization PCTS FPR-2015-9110
used to predict impacts. Exposures are not calculated for sound sources with a nominal
frequency outside the upper and lower frequency hearing limits for sea turtles.
In addition to being discussed below, thresholds for onset of TTS and PTS for impulsive and
non-impulsive sounds are summarized in 6.4.8.2.2, 6.4.8.2.1, 6.4.8.2.4, and 6.4.8.2.3,
respectively. As described in more detail below, it is critical to note that all turtle PTS and TTS
thresholds were set too high. Therefore, quantitative impacts presented herein for PTS and TTS
are conservative estimates.
Table 77. Sea Turtle Impact Threshold Criteria for Impulsive Sources
Impulsive Sound Exposure Impact Threshold Value
Onset Mortality1
(1% Mortality Based on Extensive
Lung Injury) = 91.4𝑀1/3 (1 +
𝐷𝑅𝑚
10.081) 1⁄2 𝑃𝑎 , 𝑠
Onset Slight Lung Injury1
= 39.1𝑀1/3 (1 + 𝐷𝑅𝑚
10.081) 1⁄2 𝑃𝑎 , 𝑠
Onset Slight Gastrointestinal Tract Injury 237 dB re 1 µPa SPL (104 psi)
Onset PTS
187 dB re 1 µPa2
- s SEL (T2)
or
230 dB re 1 µPa Peak SPL
Onset TTS
172 dB re 1 µPa2
- s SEL (T2)
or
224 dB re 1 µPa Peak SPL
Injury (Airguns) 190 dB re 1 µPa SPL root mean square3
dB: decibels, µPa: micropascals, PTS: permanent threshold shift, SEL: sound exposure level, SPL: sound pressure level, TTS: temporary
threshold shift 1 M=Mass of animals (kg) as shown for each species, DRm=depth of animal (m) 2 (T): Turtle weighting function 3 The time interval for determining the root mean square that which contains 90 percent of the total energy within the envelope of the
pulse. This windowing procedure for impulse signals removes uncertainty about where to set the exact temporal beginning or end of the
signal, which may be obscured by ambient noise.
Table 78. Sea Turtle Impact Threshold Criteria Used in Acoustic Modeling for Non-Impulse Sources
Physiological Thresholds
Onset PTS Onset TTS
198 dB SEL (T) 178 dB SEL (T)
dB: decibels; µPa: micropascals; PTS: permanent threshold shift; SEL: sound exposure level; SPL: sound pressure level; TTS:
temporary threshold shift; (T): Turtle weighting function
Table 79 shows the average ranges to the potential effect from in-water explosions based on the
thresholds for sea turtles. Some of the conservative assumptions made by the Navy for the
impact modeling and criteria may cause the impact predictions to be overestimated, as follows:
425
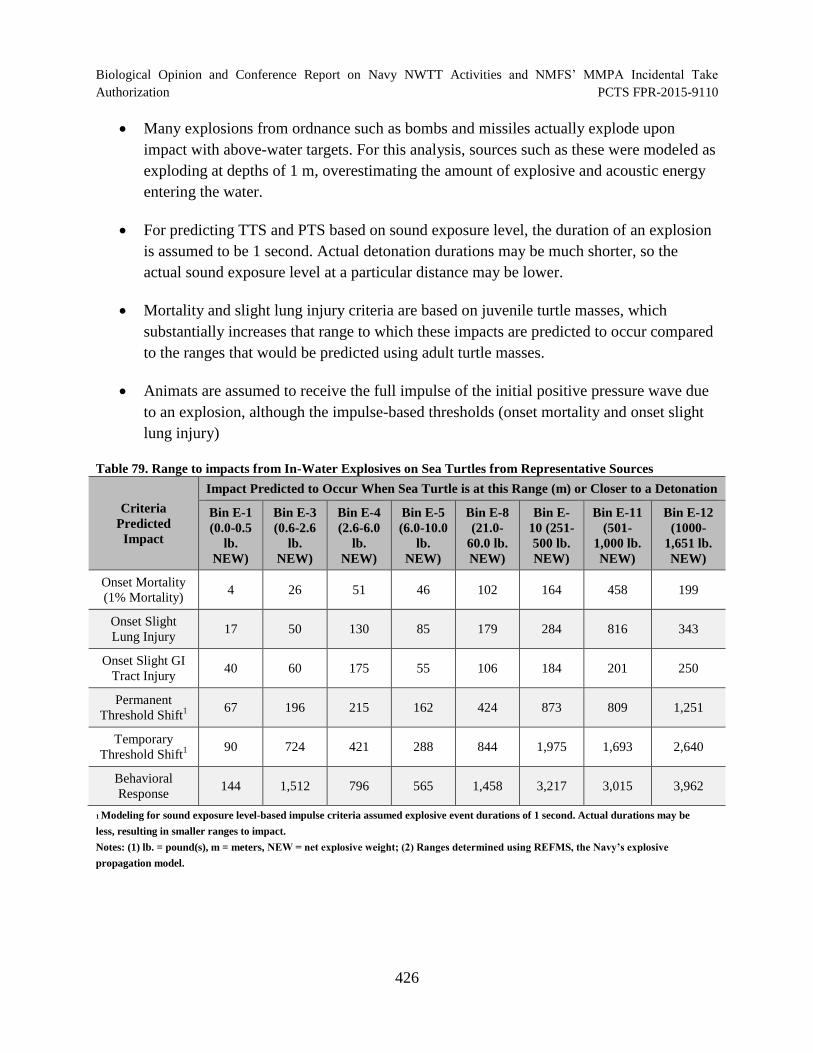
Biological Opinion and Conference Report on Navy NWTT Activities and NMFS’ MMPA Incidental Take
Authorization PCTS FPR-2015-9110
Many explosions from ordnance such as bombs and missiles actually explode upon
impact with above-water targets. For this analysis, sources such as these were modeled as
exploding at depths of 1 m, overestimating the amount of explosive and acoustic energy
entering the water.
For predicting TTS and PTS based on sound exposure level, the duration of an explosion
is assumed to be 1 second. Actual detonation durations may be much shorter, so the
actual sound exposure level at a particular distance may be lower.
Mortality and slight lung injury criteria are based on juvenile turtle masses, which
substantially increases that range to which these impacts are predicted to occur compared
to the ranges that would be predicted using adult turtle masses.
Animats are assumed to receive the full impulse of the initial positive pressure wave due
to an explosion, although the impulse-based thresholds (onset mortality and onset slight
lung injury)
Table 79. Range to impacts from In-Water Explosives on Sea Turtles from Representative Sources
Criteria
Predicted
Impact
Impact Predicted to Occur When Sea Turtle is at this Range (m) or Closer to a Detonation
Bin E-1
(0.0-0.5
lb.
NEW)
Bin E-3
(0.6-2.6
lb.
NEW)
Bin E-4
(2.6-6.0
lb.
NEW)
Bin E-5
(6.0-10.0
lb.
NEW)
Bin E-8
(21.0
60.0 lb.
NEW)
Bin E
10 (251
500 lb.
NEW)
Bin E-11
(501
1,000 lb.
NEW)
Bin E-12
(1000
1,651 lb.
NEW)
Onset Mortality
(1% Mortality) 4 26 51 46 102 164 458 199
Onset Slight
Lung Injury 17 50 130 85 179 284 816 343
Onset Slight GI
Tract Injury 40 60 175 55 106 184 201 250
Permanent
Threshold Shift1 67 196 215 162 424 873 809 1,251
Temporary
Threshold Shift1 90 724 421 288 844 1,975 1,693 2,640
Behavioral
Response 144 1,512 796 565 1,458 3,217 3,015 3,962
1 Modeling for sound exposure level-based impulse criteria assumed explosive event durations of 1 second. Actual durations may be
less, resulting in smaller ranges to impact.
Notes: (1) lb. = pound(s), m = meters, NEW = net explosive weight; (2) Ranges determined using REFMS, the Navy’s explosive
propagation model.
426
Biological Opinion and Conference Report on Navy NWTT Activities and NMFS’ MMPA Incidental Take
Authorization PCTS FPR-2015-9110
6.4.8.2.1 Temporary Threshold Shift – Non-Impulsive Sources
Based on best available science regarding TTS in marine vertebrates (Finneran et al. 2002;
Southall et al. 2007c) and the lack of information regarding TTS in sea turtles, the total T-
weighted sound exposure level of 178 dB re 1 micro Pascal squared second (μPa2
-s) is used to
estimate exposures resulting in TTS for sea turtles. The T-weighting function is used in
conjunction with this non-impulsive criterion, which effectively provides an upper cutoff of
2 kHz. The T-weighted non-impulsive TTS threshold of 178 dB re 1 µPa2
-s sound exposure
level was inadvertently based on Type II weighted cetacean TTS data rather than Type I
weighted cetacean TTS data. This resulted in incorrectly lowering the turtle TTS threshold by 17
dB. The sea turtle non-impulsive TTS threshold, based on mid-frequency cetacean data, should
be 17 dB higher than 178 dB re 1 µPa2
-s. Because an incorrectly lowered threshold was used to
quantitatively analyze acoustic impacts on sea turtles, the quantitative impacts presented herein
for non-impulsive TTS are conservative (i.e., over-predicted).
6.4.8.2.2 Temporary Threshold Shift – Impulsive Sources
Based on best available science regarding TTS in marine vertebrates (Finneran et al. 2005b;
Finneran et al. 2000b; Finneran et al. 2002; Nachtigall et al. 2003; Nachtigall et al. 2004;
Schlundt et al. 2000a) and the lack of information regarding TTS in sea turtles, the respective
total T-weighted sound exposure level of 172 dB re 1 µPa2-s or peak pressure of 224 dB re 1 µPa
(23 pounds per square inch [psi]) is used to estimate exposures resulting in TTS for sea turtles.
The T-weighting function is applied when using the sound exposure level-based thresholds to
predict TTS.
The T-weighted impulsive TTS threshold of 172 dB re 1 μPa2-s sound exposure level was
inadvertently based on Type II weighted cetacean TTS data rather than Type I weighted cetacean
TTS data. This resulted in incorrectly lowering the turtle TTS threshold. The sea turtle impulsive
TTS threshold, based on Type I mid-frequency cetacean data, should be 183 dB re 1 μPa2-s.
Because an incorrectly lowered threshold was used to quantitatively analyze acoustic impacts to
sea turtles, the quantitative impacts presented herein for impulsive TTS are conservative (i.e.,
over-predicted).
6.4.8.2.3 Permanent Threshold Shift – Non-Impulsive Sources
Since no studies were designed to intentionally induce PTS in sea turtles, levels for onset of PTS
for these animals must be estimated using TTS data and relationships between TTS and PTS
established in terrestrial mammals. Permanent threshold shift can be estimated based on the
growth rate of a threshold shift and the level of threshold shift required to potentially become
non-recoverable. A variety of terrestrial and marine mammal data show that threshold shifts up
to 40 to 50 dB may be recoverable, and that 40 dB is a reasonable upper limit of a threshold shift
427
Biological Opinion and Conference Report on Navy NWTT Activities and NMFS’ MMPA Incidental Take
Authorization PCTS FPR-2015-9110
that does not induce PTS (Southall et al. 2007b; Ward et al. 1958; Ward et al. 1959a). This
analysis assumes that continuous-type exposures producing threshold shifts of 40 dB or more
always result in some amount of PTS. Data from terrestrial mammal testing (Ward et al. 1958;
Ward et al. 1959a) show TTS growth of 1.5 to 1.6 dB for every 1 dB increase in sound exposure
level. The difference between minimum measureable TTS onset (6 dB) and the 40 dB upper safe
limit of TTS yields a difference of 34 dB. When divided by a TTS growth rate of 1.6 dB TTS per
dB sound exposure level, there is an indication that an increase in exposure of a 21.25 dB sound
exposure level would result in 40 dB of TTS. For simplicity and conservatism, the number was
rounded down to 20 dB sound exposure level. Therefore, non-impulsive exposures of 20 dB
sound exposure level above those producing a TTS may be assumed to produce a PTS. The onset
of TTS threshold of 195 dB re 1 μPa2-s for sea turtles has a corresponding onset of PTS
threshold of 198 dB re 1 μPa2-s. The T-weighting function is applied when using the sound
exposure level-based thresholds to predict PTS.
The T-weighted non-impulsive TTS threshold of 178 dB re 1 μPa2-s sound exposure level was
inadvertently based on Type II weighted cetacean TTS data rather than Type I weighted cetacean
TTS data. This resulted in incorrectly lowering the turtle TTS threshold by 17 dB; consequently,
also incorrectly lowering the sea turtle PTS threshold by 17 dB. The sea turtle non-impulsive
PTS threshold, based on mid-frequency cetacean data, should be 17 dB higher than 198 dB re 1
μPa2-s. Because an incorrectly lowered threshold was used to quantitatively analyze acoustic
impacts to sea turtles, the quantitative impacts presented herein for non-impulsive PTS are
conservative (i.e., overpredicted).
6.4.8.2.4 Permanent Threshold Shift – Impulsive sources
Because marine mammal and sea turtle PTS data from impulsive exposures do not exist, onset of
PTS levels for these animals are estimated by adding 15 dB to the sound exposure level-based
TTS threshold and adding 6 dB to the peak pressure-based thresholds. These relationships were
derived by Southall et al. (Southall et al. 2007b) from impulsive noise TTS growth rates in
chinchillas. This results in onset of PTS thresholds of total weighted sound exposure level of 187
dB re 1 μPa2-s or peak pressure of 230 dB re 1 µPa for sea turtles. The T-weighting function is
applied when using the sound exposure level-based thresholds to predict PTS.
The T-weighted impulsive PTS threshold of 187 dB re 1 μPa2-s sound exposure level was
inadvertently based on Type II weighted cetacean TTS data rather than Type I weighted cetacean
TTS data. This resulted in incorrectly lowering the turtle TTS threshold. The sea turtle impulsive
PTS threshold, based on Type I mid-frequency cetacean data, should be 198 dB re 1 μPa2-s.
Because an incorrectly lowered threshold was used to quantitatively analyze acoustic impacts to
sea turtles, the quantitative impacts presented herein for impulsive PTS are conservative (i.e.,
over-predicted).
428
Biological Opinion and Conference Report on Navy NWTT Activities and NMFS’ MMPA Incidental Take
Authorization PCTS FPR-2015-9110
6.4.8.3 Mortality and Injury from Explosions
There is a considerable body of laboratory data on actual injuries from impulsive sounds, usually
from explosive pulses, obtained from tests with a variety of vertebrate species (e.g., (Goertner et
al. 1994; Richmond et al. 1973; Yelverton et al. 1973)). Based on these studies, potential
impacts, with decreasing likelihood of serious injury or lethality, include onset of mortality,
onset of slight lung injury, and onset of slight gastrointestinal injury. In the absence of data
specific to sea turtles, criteria developed to assess impacts to protected marine mammals are also
used to assess impacts to protected sea turtles. These criteria are discussed below.
6.4.8.3.1 Criteria for Mortality and Slight Lung Injury
In air or submerged, the most commonly reported internal bodily injury to sea turtles from
explosive detonations is hemorrhaging in the fine structure of the lungs. The likelihood of
internal bodily injury is related to the received impulse of the underwater blast (pressure
integrated over time), not peak pressure or energy (Richmond et al. 1973; Yelverton and
Richmond 1981; Yelverton et al. 1973; Yelverton et al. 1975). Therefore, impulse is used as a
metric upon which internal organ injury can be predicted. Onset mortality and onset slight lung
injury are defined as the impulse level that would result in one percent mortality (most survivors
have moderate blast injuries and should survive) and zero percent mortality (recoverable, slight
blast injuries) in the exposed population, respectively. Criteria for onset mortality and onset
slight lung injury were developed using data from explosive impacts on mammals (Yelverton
and Richmond 1981).
The impulse required to cause lung damage is related to the volume of the lungs. The lung
volume is related to both the size (mass) of the animal and compression of gas-filled spaces at
increasing water depth. Turtles have relatively low lung volume to body mass and a relatively
stronger anatomical structure compared to mammals; therefore application of the criteria derived
from studies of impacts of explosions on mammals may be conservative. Table 80 provides a
conservative body mass for each sea turtle species based on juvenile mass.
Juvenile body mass was selected for analysis given the early rapid growth of these reptiles
(newborn turtles weigh less than 0.5 percent of maximum adult body mass). In addition, small
turtles tend to remain at shallow depths in the surface pressure release zone, reducing potential
exposure to injurious impulses. Therefore, use of hatchling weight would provide unrealistically
low thresholds for estimating injury to sea turtles. The use of juvenile body mass rather than
adult body mass was chosen to produce reasonably conservative estimates of injury.
429
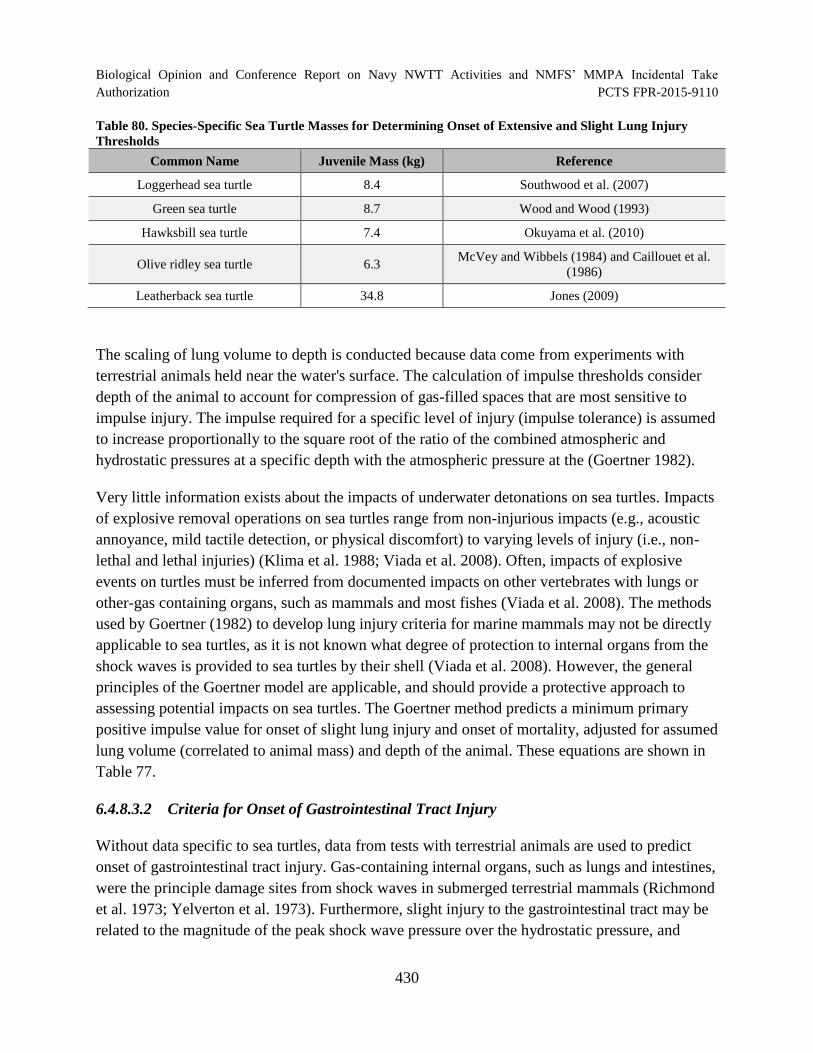
Biological Opinion and Conference Report on Navy NWTT Activities and NMFS’ MMPA Incidental Take
Authorization PCTS FPR-2015-9110
Table 80. Species-Specific Sea Turtle Masses for Determining Onset of Extensive and Slight Lung Injury
Thresholds
Common Name Juvenile Mass (kg) Reference
Loggerhead sea turtle 8.4 Southwood et al. (2007)
Green sea turtle 8.7 Wood and Wood (1993)
Hawksbill sea turtle 7.4 Okuyama et al. (2010)
Olive ridley sea turtle 6.3 McVey and Wibbels (1984) and Caillouet et al.
(1986)
Leatherback sea turtle 34.8 Jones (2009)
The scaling of lung volume to depth is conducted because data come from experiments with
terrestrial animals held near the water's surface. The calculation of impulse thresholds consider
depth of the animal to account for compression of gas-filled spaces that are most sensitive to
impulse injury. The impulse required for a specific level of injury (impulse tolerance) is assumed
to increase proportionally to the square root of the ratio of the combined atmospheric and
hydrostatic pressures at a specific depth with the atmospheric pressure at the (Goertner 1982).
Very little information exists about the impacts of underwater detonations on sea turtles. Impacts
of explosive removal operations on sea turtles range from non-injurious impacts (e.g., acoustic
annoyance, mild tactile detection, or physical discomfort) to varying levels of injury (i.e., non
lethal and lethal injuries) (Klima et al. 1988; Viada et al. 2008). Often, impacts of explosive
events on turtles must be inferred from documented impacts on other vertebrates with lungs or
other-gas containing organs, such as mammals and most fishes (Viada et al. 2008). The methods
used by Goertner (1982) to develop lung injury criteria for marine mammals may not be directly
applicable to sea turtles, as it is not known what degree of protection to internal organs from the
shock waves is provided to sea turtles by their shell (Viada et al. 2008). However, the general
principles of the Goertner model are applicable, and should provide a protective approach to
assessing potential impacts on sea turtles. The Goertner method predicts a minimum primary
positive impulse value for onset of slight lung injury and onset of mortality, adjusted for assumed
lung volume (correlated to animal mass) and depth of the animal. These equations are shown in
Table 77.
6.4.8.3.2 Criteria for Onset of Gastrointestinal Tract Injury
Without data specific to sea turtles, data from tests with terrestrial animals are used to predict
onset of gastrointestinal tract injury. Gas-containing internal organs, such as lungs and intestines,
were the principle damage sites from shock waves in submerged terrestrial mammals (Richmond
et al. 1973; Yelverton et al. 1973). Furthermore, slight injury to the gastrointestinal tract may be
related to the magnitude of the peak shock wave pressure over the hydrostatic pressure, and
430
Biological Opinion and Conference Report on Navy NWTT Activities and NMFS’ MMPA Incidental Take
Authorization PCTS FPR-2015-9110
would be independent of the animal’s size and mass (Goertner 1982). Slight contusions to the
gastrointestinal tract were reported during small charge tests (Richmond et al. 1973), when the
peak was 237 dB re 1 μPa. Therefore, this value is used to predict onset of gastrointestinal tract
injury in sea turtles exposed to explosions.
6.4.8.4 Criteria for Behavioral Reactions
A sea turtle’s behavioral responses to sound are assumed to be variable and context specific. For
instance, a single impulse may cause a brief startle reaction. A sea turtle may swim farther away
from the sound source, increase swimming speed, change surfacing time, and decrease foraging
if the stressor continues to occur. For each potential behavioral change, the magnitude of the
change ultimately would determine the severity of the response; most responses would be short-
term avoidance reactions.
A few studies reviewed in Section 6.4.6, investigated behavioral responses of sea turtles to
impulsive sounds emitted by airguns (McCauley et al. 2000; Moein Bartol et al. 1995; O'Hara
and Wilcox 1990). There are no studies of sea turtle behavioral responses to sonar.
Cumulatively, available airgun studies indicate that perception and a behavioral reaction to a
repeated sound may occur with sound pressure levels greater than 166 dB re 1 μPa root mean
square, and that more erratic behavior and avoidance may occur at higher thresholds around 175
to 179 dB re 1 μPa root mean square (McCauley et al. 2000; Moein Bartol et al. 1995; O'Hara
and Wilcox 1990). When exposed to impulsive acoustic energy from an airgun above 175 dB re
1 μPa root mean square, sea turtle behavior becomes more erratic, possibly indicating the turtles
were in an agitated state (McCauley et al. 2000). A received level of 175 dB re 1 μPa root mean
square is more likely to be the point at which avoidance may occur in unrestrained turtles, with a
comparable sound exposure level of 160 dB re 1 μPa2
-s (McCauley et al. 2000). Airgun studies
used sources that fired repeatedly over some duration. For single impulses at received levels
below threshold shift (hearing loss) levels, the most likely behavioral response is assumed to be a
startle response. Since no further sounds follow the initial brief impulse, the biological
significance is considered to be minimal.
Behavioral responses of sea turtles to airgun exposures in caged enclosures are likely to be
different than those from turtles exposed to impulsive acoustic sources from NWTT activities in
the open environment. Although information regarding the behavioral response of sea turtles to
acoustic stressors is generally lacking, McCauley et al. (2000) provides an indication that 175 dB
re 1 μPa root mean square is a reasonable threshold criterion in the absence of more rigorous
experimental or observational data. The 175 dB re 1 μPa root mean square threshold criterion for
behavioral take in sea turtles may change with better available information in the future, but
currently is the best available science. To assess the number of sea turtles expected to
behaviorally respond to acoustic stress all turtles exposed to sound equal to, or greater than, 175
431
Biological Opinion and Conference Report on Navy NWTT Activities and NMFS’ MMPA Incidental Take
Authorization PCTS FPR-2015-9110
dB and less than the criterion for TTS were summed. No attempt to process these exposures or
evaluate the effectiveness of mitigation measures was made, suggesting any behavioral take
estimates of sea turtles from acoustic stressors are likely overestimates. We are unaware of any
sea turtle response studies to non-impulsive acoustic energy; therefore, we used the same criteria
as those for impulsive acoustic stressors.
6.5 Risk Assessment Framework – Fish
This section is largely based on a technical report prepared for the Navy: Effects of Mid- and
High-Frequency Sonars on Fish (Popper 2008b). Additionally, Popper and Hastings (Popper and
Hastings 2009a; Popper and Hastings 2009b) provide a critical overview of some of the most
recent research regarding potential effects of anthropogenic sound on fish.
Studies of the effects of human-generated sound on fish have been reviewed in numerous places
(e.g., (Hastings and Popper 2005; NRC 1994b; Popper 2003; Popper 2008a; Popper and Hastings
2009a; Popper and Hastings 2009b; Popper et al. 2004)). Most investigations, however, have
been in the gray literature (non-peer-reviewed reports—see (Hastings and Popper 2005; Popper
2008a; Popper and Hastings 2009a) for extensive critical reviews of this material). Studies have
been published assessing the effect on fish of short-duration, high-intensity signals such as might
be found near high-intensity sonar, pile driving, or seismic air guns. The investigators in such
studies examined short-term effects that could result in death to the exposed fish, as well as
hearing loss and long-term consequences (Doksaeter et al. 2009; Govoni et al. 2003; McCauley
et al. 2003; Popper et al. 2007; Popper et al. 2005). Information is also discussed from a
technical report that resulted from a working group established by the Acoustical Society of
America on sound exposure guidelines for fishes and sea turtles (Popper et al. 2014).
6.5.1 Direct Injury of Fish from Non-Impulsive Acoustic Stressors
Potential direct injuries from non-impulsive sound sources, such as sonar, are unlikely because
of the relatively lower peak pressures and slower rise times than potentially injurious sources
such as explosives. Non-impulsive sources also lack the strong shock wave such as that
associated with an explosion. The theories of sonar induced acoustic resonance, bubble
formation, neurotrauma, and lateral line system injury are discussed below, although these would
likely occur only in fish very close to the sound source and are therefore unlikely to impact entire
populations of fish or have an impact in a large area.
No studies have indicated any physiological damage to adult fish from mid-frequency active
sonar. Kvadsheim and Sevaldsen (2005) showed that intense sonar activities in herring spawning
areas affected less than 0.3 percent of the total juvenile stock. Jørgensen et al. (2005) exposed
fish larvae and juveniles representing four species (of three families) to sounds that were
designed to simulate mid-frequency sonar transmissions (1 to 6.5 kHz) to study the effects of the
432
Biological Opinion and Conference Report on Navy NWTT Activities and NMFS’ MMPA Incidental Take
Authorization PCTS FPR-2015-9110
exposure on the survival, development, and behavior of the larvae and juveniles (the study used
larvae and juveniles of Atlantic herring (Clupea harengus) Atlantic cod (Gadus morhua), saithe
(Pollachius virens), and spotted wolffish (Anarhichas minor)). The researchers placed the fish in
plastic bags three meters from the sound source and exposed them to between four and 100
pulses of one-second duration of pure tones at 1.5, 4, and 6.5 kHz. The fish in only two groups
out of the 42 tested exhibited adverse effects beyond a behavioral response. These two groups
were both composed of herring, a hearing specialist, and were tested with sound pressure levels
of 189 dB re 1 µPa, which resulted in a post-exposure mortality of 20 to 30 percent. In the
remaining 40 tests, there were no observed effects on behavior, growth (length and weight), or
the survival of fish that were kept as long as 34 days post exposure. While statistically significant
losses were documented in the two groups impacted, the researchers only tested that particular
sound level once, so it is not known if this increased mortality was due to the level of the test
signal or to other unknown factors.
Halvorsen et al. (2012) exposed rainbow trout to simulated MFA (2.8 to 3.8 kHz) sonar at
received sound pressure levels of 210 dB re 1 uPa, resulting in cumulative sound exposure levels
of 220 dB re 1 uPa. The authors did not observe any mortality or hearing sensitivity changes in
rainbow trout and suggested that the frequency range of MFA sonar may be above the most
sensitive hearing range of the species. Similarly, Kane et al. (2010) found that low-and mid-
frequency exposure caused no acute, gross or histopathology, nor any mortality to rainbow trout,
I. punctatus, or Lepomis sp. Popper et al. (2008c; 2007; Popper and Hastings 2009b) investigated
the effects of exposing several fish species to the Navy’s SURTASS LFA sonar, focusing on the
hearing and on non-auditory tissues. Their study exposed the fish to LFA sonar pulses for time
intervals that would be substantially longer than what would occur in nature, but the fish did not
experience mortalities or damage to body tissues at the gross or histological level.
Swim bladder resonance is a function of the size and geometry of the air cavity, depth of the fish,
and frequency of the transmitted signal. Wavelengths associated with mid-frequency sounds are
shorter than wavelengths associated with lower frequency sounds. It is the lower frequencies that
are expected to produce swim bladder resonance in adult fishes. Resonance frequencies for
juvenile fish are 1 to 8 kHz and can escalate physiological impact (Kvadsheim and Sevaldsen
2005; Lo̸vik and Hovem 1979).
High sound pressure levels may cause bubbles to form from micronuclei in the blood stream or
other tissues of animals, possibly causing embolism damage (Ketten 1998). Fish have small
capillaries where these bubbles could be caught and lead to the rupturing of the capillaries and
internal bleeding. It has also been speculated that this phenomena could also take place in the
eyes of fish due to potentially high gas saturation within the fish’s eye tissues (Popper and
Hastings 2009a; Popper and Hastings 2009b). As reviewed in Popper and Hastings Popper and
Hastings (2009a), Hastings (1990; 1995b) found ‘acoustic stunning’ (loss of consciousness) in
433
Biological Opinion and Conference Report on Navy NWTT Activities and NMFS’ MMPA Incidental Take
Authorization PCTS FPR-2015-9110
blue gouramis (Trichogaster trichopterus) following an 8-minute exposure to a 150 Hz pure tone
with a peak sound pressure level (SPL) of 198 dB re 1 μPa. This species of fish has an air bubble
in the mouth cavity directly adjacent to the animal’s braincase that may have caused this injury.
Hastings (1990; 1995b) also found that goldfish exposed to two hours of continuous wave sound
at 250 Hz with peak pressures of 204 dB re 1 μPa, and fathead minnows exposed to 0.5 hours of
150 Hz continuous wave sound at a peak level of 198 dB re 1 μPa did not survive. The only
study on the effect of exposure of the lateral line system to continuous wave sound (conducted
on one freshwater species) suggests no effect on these sensory cells by intense pure tone signals
(Hastings et al. 1996a).
Popper et al. (2014) developed sound exposure guidelines for fishes exposed to low and mid-
frequency naval sonar. The authors did not did not provide evidence that injury or mortality
could occur from naval sonar, and indicated that if injury or mortality occurs, it is thought to
begin at higher sound levels than have been tested to date. The authors concluded that the
relative risk of injury or mortality to fish with no swim bladders exposed to low and mid-
frequency sonar was low, no matter the distance from the source.
6.5.2 Primary Blast Injury and Barotrauma
The greatest potential for direct, non-auditory tissue effects in fish is primary blast injury and
barotrauma following exposure to explosions. Primary blast injury refers to those injuries that
result from the initial compression of a body exposed to a blast wave. Primary blast injury is
usually limited to gas-containing structures (e.g., swim bladder) and the auditory system.
Barotrauma refers to injuries caused when the swim bladder or other gas-filled structures vibrate
in response to the signal, particularly if there is a relatively sharp rise-time and the walls of the
structure strike near-by tissues and damage them. The relative risk of injury or mortality to fish
with no swim bladders exposed to explosions is anticipated to be much lower than fish with
swim bladders.
An underwater explosion generates a shock wave that produces a sudden, intense change in local
pressure as it passes through the water (DoN 1998; DoN 2001). Pressure waves extend to a
greater distance than other forms of energy produced by the explosion (i.e., heat and light) and
are therefore the most likely source of negative effects to marine life from underwater explosions
(Craig Jr. 2001b; DoN 2006; SIO 2005). The shock wave from an underwater explosion is lethal
to fish at close range causing massive organ and tissue damage and internal bleeding (Keevin
and Hempen 1997). At greater distance from the detonation point, the extent of mortality or
injury depends on a number of factors including fish size, body shape, orientation, and species
(Keevin and Hempen 1997; Wright 1982). Additional factors include the current physical
condition of the fish and the presence of a swim bladder. At the same distance from the source,
larger fish are generally less susceptible to death or injury, elongated forms that are round in
434
Biological Opinion and Conference Report on Navy NWTT Activities and NMFS’ MMPA Incidental Take
Authorization PCTS FPR-2015-9110
cross-section are less at risk than deep-bodied forms, and fish oriented sideways to the blast
suffer the greatest impact (Edds-Walton and Finneran 2006; O'Keefe and Young 1984; Wiley et
al. 1981; Yelverton et al. 1975). Species with gas-filled organs have higher mortality than those
without them (Continental Shelf Associates Inc. 2004; Goertner et al. 1994).
Two aspects of the shock wave appear most responsible for injury and death to fish: the received
peak pressure and the time required for the pressure to rise and decay (Dzwilewski and Fenton
2002). Higher peak pressure and abrupt rise and decay times are more likely to cause acute
pathological effects (Wright and Hopky 1998). Rapidly oscillating pressure waves might rupture
the kidney, liver, spleen, and sinus and cause venous hemorrhaging (Keevin and Hempen 1997).
They can also generate bubbles in blood and other tissues, possibly causing embolism damage
(Ketten 1998). Oscillating pressure waves might also burst gas-containing organs. The swim
bladder, the gas-filled organ used by most bony fish to control buoyancy, is the primary site of
damage from explosives (Wright 1982; Yelverton et al. 1975). Gas-filled swim bladders resonate
at different frequencies than surrounding tissue and can be torn by rapid oscillation between
high- and low-pressure waves. The range over which damage may occur in a fish without a swim
bladder is on the order of 100 times less than that for swim bladder fish (Popper et al. 2014).
Studies that have documented fish killed during planned underwater explosions indicate that
most fish that die do so within one to four hours, and almost all die within a day (Hubbs and
Rechnitzer 1952; Yelverton et al. 1975). Fitch and Young (1948) found that the type of fish
killed changed when blasting was repeated at the same marine location within 24 hours of
previous blasting. They observed that most fish killed on the second day were scavengers,
presumably attracted by the victims of the previous day’s blasts. However, fishes collected
during these types of studies have mostly been recovered floating on the water’s surface.
Gitschlag et al. (2001) collected both floating fish and those that were sinking or lying on the
bottom after explosive removal of nine oil platforms in the northern Gulf of Mexico. They found
that 3 to 87 percent (46 percent average) of the specimens killed during a blast might float to the
surface. Other impediments to accurately characterizing the magnitude of fish mortality included
currents and winds that transported floating fishes out of the sampling area and predation by
seabirds or other fishes. Popper et al. (2014) developed sound exposure guidelines for fishes and
generally estimated that mortality and mortal injury would occur when the peak sound pressure
level from a single explosion exceeds 229 to 234 dB re 1 μPa.
There have been few studies of the impact of underwater explosions on early life stages of fishes
(eggs, larvae, juveniles). Fitch and Young (1948) reported the demise of larval anchovies
exposed to underwater blasts off California, and Nix and Chapman (1985) found that anchovy
and eulachon larvae died following the detonation of buried charges. It has been suggested that
impulsive sounds, such as that produced by seismic airguns, may cause damage to the cells of the
lateral line in fish larvae and fry when in close proximity (15 ft. [5 m]) to the sound source
435
Biological Opinion and Conference Report on Navy NWTT Activities and NMFS’ MMPA Incidental Take
Authorization PCTS FPR-2015-9110
(Booman et al. 1996). Similar to adult fishes, the presence of a swim bladder contributes to
shock wave-induced internal damage in larval and juvenile fishes (Settle et al. 2002). Shock
wave trauma to internal organs of larval pinfish and spot from shock waves was documented by
Govoni et al. (2003). These were laboratory studies, however, and have not been verified in the
field.
Interim criteria for injury of fish were discussed in Stadler and Woodbury (2009). The onset of
physical injury would be expected if either the peak sound pressure level exceeds 206 dB re 1
μPa, or the cumulative sound exposure level, accumulated over all pile strikes generally
occurring within a single day, exceeds 187 dB re 1 micropascal squared second (μPa2-s) for fish
two grams or larger, or 183 dB re 1 μPa2-s for smaller fish (Stadler and Woodbury 2009). A
more recent study by Halvorsen et al. (2011) used carefully controlled laboratory conditions to
determine the level of pile driving sound that may cause a direct injury to the fish tissues
(barotrauma). The investigators found that juvenile Chinook salmon (Oncorhynchus
tshawytscha) received less than a single strike sound exposure level of 179 to 181 dB re 1μ Pa2-s
and cumulative sound exposure level of less than 211 dB re 1 μPa2-s over the duration of the pile
driving activity would sustain no more than mild, non-life-threatening injuries.
6.5.3 Hearing Loss
Available information on the hearing sensitivities of the species considered in this Opinion is
presented in Section 4. Exposure to high intensity sound can cause hearing loss, also known as a
noise-induced threshold shift, or simply a threshold shift (Miller 1974). A TTS is a temporary,
recoverable loss of hearing sensitivity. A TTS may last several minutes to several weeks and the
duration may be related to the intensity of the sound source and the duration of the sound
(including multiple exposures). A permanent threshold shift (PTS) is non-recoverable, results
from the destruction of tissues within the auditory system, and can occur over a small range of
frequencies related to the sound exposure. As with temporary threshold shift, the animal does not
become deaf but requires a louder sound stimulus (relative to the amount of PTS) to detect a
sound within the affected frequencies; however, in this case, the effect is permanent.
Permanent hearing loss, or permanent threshold shift has not been documented in fish. The
sensory hair cells of the inner ear in fish can regenerate after they are damaged, unlike in
mammals where sensory hair cells loss is permanent (Lombarte et al. 1993; Smith et al. 2006a).
As a consequence, any hearing loss in fish may be as temporary as the timeframe required to
repair or replace the sensory cells.
Sound is composed of two major components, the propagating sound pressure wave and particle
motion. All fishes detect particle motion with their inner ear otoliths (otoconia in elasmobranchs)
which act as accelerometers (Casper and Mann 2006). Sound pressure, however, can only be
detected by fishes which have a pressure-to-displacement transducer, usually the swim bladder in
436
Biological Opinion and Conference Report on Navy NWTT Activities and NMFS’ MMPA Incidental Take
Authorization PCTS FPR-2015-9110
some teleost fishes (Casper and Mann 2006). Some fishes have evolved a specialized connection
between the swim bladder and the inner ear which can transmit the sound pressure signal being
detected by the bladder. In the case of the otophysans such as goldfish, modified vertebrae
known as the Weberian ossicles have evolved for this function.
6.5.3.1 Non-impulsive Sound Sources
Studies of the effects of long-duration sounds with sound pressure levels below 170 to 180 dB re
1 μPa indicate that there is little to no effect of long-term exposure on species (such as those
considered in this Opinion) that lack notable anatomical hearing specialization (Amoser and
Ladich 2003; Scholik and Yan 2001; Smith et al. 2004a; Smith et al. 2004b; Wysocki et al.
2007). The longest of these studies exposed young rainbow trout (Onorhynchus mykiss), to a
level of noise equivalent to one that fish would experience in an aquaculture facility (e.g., on the
order of 150 dB re 1 μPa) for about 9 months. The investigators found no effect on hearing (i.e.,
TTS) as compared to fish raised at 110 dB re 1 μPa.
In contrast, studies on fish with hearing specializations (i.e., greater sensitivity to lower sound
pressures and higher frequencies) have shown that there is some hearing loss after several days
or weeks of exposure to increased background sounds, although the hearing loss seems to
recover (e.g., (Scholik and Yan 2002b; Smith et al. 2006a; Smith et al. 2004b)). Smith et al.
(Smith et al. 2006a; Smith et al. 2004b) exposed goldfish to noise at 170 dB re 1 μPa and found a
clear relationship between the amount of hearing loss (TTS) and the duration of exposure until
maximum hearing loss occurred after 24 hours of exposure. A 10-minute exposure resulted in a 5
dB TTS, whereas a 3-week exposure resulted in a 28 dB TTS that took over 2 weeks to return to
pre-exposure baseline levels (Smith et al. 2004b) (Note: recovery time not measured by
investigators for shorter exposure durations).
Similarly, Wysocki and Ladich (2005) investigated the influence of noise exposure on the
auditory sensitivity of two freshwater fish with notable hearing specializations, the goldfish and
the lined Raphael catfish (Platydoras costatus), and on a freshwater fish without notable
specializations, the pumpkinseed sunfish (Lepomis gibbosus). Baseline thresholds showed
greatest hearing sensitivity around 0.5 kHz in the goldfish and catfish and at 0.1 kHz in the
sunfish. For the goldfish and catfish, continuous white noise of approximately 130 dB re 1 μPa at
1 m resulted in a significant TTS of 23 to 44 dB. In contrast, the auditory thresholds in the
sunfish declined by 7 to 11 dB. The duration of exposure and time to recovery was not addressed
in this study. Scholik and Yan (2001) demonstrated TTS in fathead minnows (Pimephales
promelas) after a 24-hour exposure to white noise (0.3 to 2.0 kHz) at 142 dB re 1 μPa that did
not recover as long as 14 days post-exposure.
Studies have also examined the effects of the sound exposures from Surveillance Towed Array
Sensor System Low-Frequency Active sonar on fish hearing (Kane et al. 2010; Popper et al.
437
Biological Opinion and Conference Report on Navy NWTT Activities and NMFS’ MMPA Incidental Take
Authorization PCTS FPR-2015-9110
2007). Hearing was measured both immediately post exposure and for several days thereafter.
Maximum received sound pressure levels were 193 dB re 1 μPa for 324 or 628 seconds. Catfish
and some specimens of rainbow trout showed 10 to 20 dB of hearing loss immediately after
exposure to the low-frequency active sonar when compared to baseline and control animals;
however, another group of rainbow trout showed no hearing loss. Recovery in trout took at least
48 hours, but studies were not completed. The different results between rainbow trout groups is
difficult to understand, but may be due to developmental or genetic differences in the various
groups of fish. Catfish hearing returned to, or close to, normal within about 24 hours after
exposure to low-frequency active sonar. Furthermore, examination of the inner ears of the fish
during necropsy (note: maximum time fish were held post exposure before sacrifice was 96
hours) revealed no differences from the control groups in ciliary bundles or other features
indicative of hearing loss (Kane et al. 2010).
The study of mid-frequency active sonar by the same investigators also examined potential
effects on fish hearing and the inner ear (Halvorsen et al. 2012; Kane et al. 2010). Out of the four
species tested (rainbow trout, channel catfish, largemouth bass, and yellow perch) only one
group of channel catfish, tested in December, showed any hearing loss after exposure to mid-
frequency active sonar. The signal consisted of a 2 second (s) long, 2.8 kHz to 3.8 kHz frequency
sweep followed by a 3.3 kHz tone of 1 s duration.
The stimulus was repeated five times with a 25 second interval. The maximum received sound
pressure level was 210 dB re 1 μPa. These animals, which have the widest hearing range of any
of the species tested, experienced approximately 10 dB of threshold shift that recovered within
24 hours. Channel catfish tested in October did not show any hearing loss. The investigators
speculated that the difference in hearing loss between catfish groups might have been due to the
difference in water temperature of the lake where all of the testing took place (Seneca Lake, New
York) between October and December.
Alternatively, the observed hearing loss differences between the two catfish groups might have
been due to differences between the two stocks of fish (Halvorsen et al. 2012). Any effects on
hearing in channel catfish due to sound exposure appear to be (Halvorsen et al. 2012; Kane et al.
2010). Investigators observed no damage to ciliary bundles or other features indicative of hearing
loss in any of the other fish tested including the catfish tested in October (Kane et al. 2010).
Some studies have suggested that there may be some loss of sensory hair cells due to high
intensity sources; however, none of these studies concurrently investigated effects on hearing.
Enger (1981) found loss of ciliary bundles of the sensory cells in the inner ears of Atlantic cod
following 1 to 5 hours of exposure to pure tone sounds between 50 and 400 Hz with a sound
pressure level of 180 dB re 1 μPa.
438
Biological Opinion and Conference Report on Navy NWTT Activities and NMFS’ MMPA Incidental Take
Authorization PCTS FPR-2015-9110
Hastings (1995b) found auditory hair-cell damage in a species with notable anatomical hearing
specializations, the goldfish (Carassius auratus) exposed to 250 Hz and 500 Hz continuous tones
with maximum peak levels of 204 dB re 1 μPa and 197 dB re 1 μPa, respectively, for about 2
hours. Similarly, Hastings et al. (1996a) demonstrated damage to some sensory hair cells in
oscars (Astronotus ocellatus) following a 1-hour exposure to a pure tone at 300 Hz with a peak
pressure level of 180 dB re 1 μPa. In none of the studies was the hair cell loss more than a
relatively small percent (less than a maximum of 15 percent) of the total sensory hair cells in the
hearing organs.
In his sounds exposure guidelines for fishes, Popper et al. (2014) estimate exposure to low
frequency sonar > 193 dBrms re 1 μPa may lead to TTS in bony fish. The authors were not able to
estimate a sound exposure level for mid-frequency sonar at which they would expect TTS. As
discussed above, studies of the effects of long-duration sounds with sound pressure levels below
170 to 180 dB re 1 μPa indicate that there is little to no effect of long-term exposure on species
that lack notable anatomical hearing specialization.
6.5.3.2 Explosions and Other Impulsive Sound Sources
Popper et al. (2005) examined the effects of a seismic airgun array on a fish with hearing
specializations, the lake chub (Couesius plumbeus), and two species that lack notable
specializations, the northern pike (Esox lucius) and the broad whitefish (Coregonus nasus) (a
salmonid). In this study the average received exposure levels were a mean peak pressure level of
207 dB re 1 μPa; sound pressure level of 197 dB re 1 μPa; and single-shot sound exposure level
of 177 dB re 1 μPa2-s. The results showed temporary hearing loss for both lake chub and
northern pike to both 5 and 20 airgun shots, but not for the broad whitefish. Hearing loss was
approximately 20 to 25 dB at some frequencies for both the northern pike and lake chub, and full
recovery of hearing took place within 18 hours after sound exposure. Examination of the sensory
surfaces of the ears by an expert on fish inner ear structure showed no damage to sensory hair
cells in any of the fish from these exposures (Song et al. 2008).
McCauley et al. (2003) showed loss of a small percent of sensory hair cells in the inner ear of the
pink snapper (Pagrus auratus) exposed to a moving airgun array for 1.5 hours. Maximum
received levels exceeded 180 dB re 1 μPa2-s for a few shots. The loss of sensory hair cells
continued to increase for up to at least 58 days post exposure to 2.7 percent of the total cells. It is
not known if this hair cell loss would result in hearing loss since fish have tens or even hundreds
of thousands of sensory hair cells in the inner ear (Lombarte and Popper 1994; Popper and
Hoxter 1984) and only a small portion were affected by the sound. The question remains as to
why McCauley et al. (2003) found damage to sensory hair cells while Popper et al. (2005) did
not. There are many differences between the studies, including species, precise sound source,
and spectrum of the sound that it is hard to speculate.
439
Biological Opinion and Conference Report on Navy NWTT Activities and NMFS’ MMPA Incidental Take
Authorization PCTS FPR-2015-9110
Hastings et al. (2008) exposed the pinecone soldierfish (Myripristis murdjan), a fish with
anatomical specializations to enhance their hearing; and three species without notable
specializations: the blue green damselfish (Chromis viridis), the saber squirrelfish (Sargocentron
spiniferum), and the bluestripe seaperch (Lutjanus kasmira) to an airgun array. Fish in cages in
16 ft. (4.9 m) of water were exposed to multiple airgun shots with a cumulative sound exposure
level of 190 dB re 1 μPa2-s. The authors found no hearing loss in any fish following exposures.
In his sound exposure guidelines for fishes, Popper et al. (2014) was not able to develop specific
criteria (i.e., sound pressure levels that would result in an impact) for sound exposure from
explosions that would lead to PTS, TTS, or behavioral responses. However, the authors did
indicate that that individuals relatively close to the source would have a higher relative risk of
being impacted than individuals further away.
6.5.4 Auditory Masking
Auditory masking refers to the presence of a noise that interferes with a fish’s ability to hear
biologically relevant sounds. Fish use sounds to detect predators and prey, and for schooling,
mating, and navigating, among other uses (Myrberg Jr. 1980; Popper et al. 2003). Masking of
sounds associated with these behaviors could have impacts to fish by reducing their ability to
perform these biological functions.
Any noise (i.e., unwanted or irrelevant sound, often of an anthropogenic nature) detectable by a
fish can prevent the fish from hearing biologically important sounds including those produced by
prey or predators (Myrberg Jr. 1980; Popper et al. 2003). Auditory masking may take place
whenever the noise level heard by a fish exceeds ambient noise levels, the animal's hearing
threshold, and the level of a biologically relevant sound. Masking is found among all vertebrate
groups, and the auditory system in all vertebrates, including fish, is capable of limiting the
effects of masking noise, especially when the frequency range of the noise and biologically
relevant signal differ (Fay 1988; Fay and Simmons 1999).
The frequency of the sound is an important consideration for fish because many marine fish are
limited to detection of the particle motion component of low frequency sounds at relatively high
sound intensities (Amoser and Ladich 2005). The frequency of the acoustic stimuli must first be
compared to the animal’s known or suspected hearing sensitivity to establish if the animal can
potentially detect the sound.
One of the problems with existing fish auditory masking data is that the bulk of the studies have
been done with goldfish, a freshwater fish with well-developed anatomical specializations that
enhance hearing abilities. The data on other species are much less extensive. As a result, less is
known about masking in marine species, many of which lack the notable anatomical hearing
specializations. However, Wysocki and Ladich (2005) suggest that ambient sound regimes may
440
Biological Opinion and Conference Report on Navy NWTT Activities and NMFS’ MMPA Incidental Take
Authorization PCTS FPR-2015-9110
limit acoustic communication and orientation, especially in animals with notable hearing
specializations.
Tavolga studied the effects of noise on pure-tone detection in two species without notable
anatomical hearing specializations, the pin fish (Lagodon rhomboids) and the African mouth-
breeder (Tilapia macrocephala), and found that the masking effect was generally a linear
function of masking level, independent of frequency (Tavolga 1974a; Tavolga 1974b). In
addition, Buerkle studied five frequency bandwidths for Atlantic cod in the 20 to 340 Hz region
and showed masking across all hearing ranges (Buerkle 1968; Buerkle 1969). Chapman and
Hawkins (1973) found that ambient noise at higher sea states in the ocean has masking effects in
cod, Gadus morhua (L.), haddock, Melanogrammus aeglefinus (L.), and pollock, Pollochinus
pollachinus (L.), and similar results were suggested for several sciaenid species by Ramcharitar
and Popper (2004). Thus, based on limited data, it appears that for fish, as for mammals,
masking may be most problematic in the frequency region near the signal. There have been a few
field studies that may suggest masking could have an impact on wild fish.
Gannon et al. (2005) showed that bottlenose dolphins (Tursiops truncatus) move toward acoustic
playbacks of the vocalization of Gulf toadfish (Opsanus beta). Bottlenose dolphins employ a
variety of vocalizations during social communication including low-frequency pops. Toadfish
may be able to best detect the low-frequency pops since their hearing is best below 1 kHz, and
there is some indication that toadfish have reduced levels of calling when bottlenose dolphins
approach (Remage-Healey et al. 2006). Silver perch have also been shown to decrease calls
when exposed to playbacks of dolphin whistles mixed with other biological sounds (Luczkovich
et al. 2000). Results of the Luczkovich et al. (2000) study, however, must be viewed with caution
because it is not clear what sound may have elicited the silver perch response (Ramcharitar et al.
2006). Astrup (1999) and Mann et al. (1998) hypothesized that high frequency detecting species
(e.g., clupeids) may have developed sensitivity to high frequency sounds to avoid predation by
odontocetes. Therefore, the presence of masking noise may hinder a fish’s ability to detect
predators and therefore increase predation.
Of considerable concern is that human-generated sounds could mask the ability of fish to use
communication sounds, especially when the fish are communicating over some distance. In
effect, the masking sound may limit the distance over which fish can communicate, thereby
having an impact on important components of their behavior. For example, the sciaenids, which
are primarily inshore species, are one of the most active sound producers among fish, and the
sounds produced by males are used to “call” females to breeding sights (Ramcharitar et al. 2001)
reviewed in Ramcharitar et al. (2006). If the females are not able to hear the reproductive sounds
of the males, there could be a significant impact on the reproductive success of a population of
sciaenids. Since most sound production in fish used for communication is generally below 500
441
Biological Opinion and Conference Report on Navy NWTT Activities and NMFS’ MMPA Incidental Take
Authorization PCTS FPR-2015-9110
Hz (Slabbekoorn et al. 2010), sources with significant low-frequency acoustic energy could
affect communication in fish.
Also potentially vulnerable to masking is navigation by larval fish, although the data to support
such an idea are still exceedingly limited. There is indication that larvae of some reef fish
(species not identified in study) may have the potential to navigate to juvenile and adult habitat
by listening for sounds emitted from a reef (either due to animal sounds or non-biological
sources such as surf action)(e.g., (Higgs 2005)).
In a study of an Australian reef system, the sound signature emitted from fish choruses was
between 0.8 and 1.6 kHz (Cato 1978) and could be detected by hydrophones 3 to 4 nm from the
reef (McCauley and Cato 2000). This bandwidth is within the detectable bandwidth of adults and
larvae of the few species of reef fish, such as the damselfish, Pomacentrus partitus, and bicolor
damselfish, Eupomacentrus partitus, that have been studied (Kenyon 1996; Myrberg Jr. 1980).
At the same time, it has not been demonstrated conclusively that sound, or sound alone, is an
attractant of larval fish to a reef, and the number of species tested has been very limited.
Moreover, there is also evidence that larval fish may be using other kinds of sensory cues, such
as chemical signals, instead of, or alongside of, sound (Atema et al. 2002).
Popper et al. (2014) evaluated the potential for masking in fishes and concluded there is no
reason to expect masking from explosions because while the detection of biologically important
sounds would be reduced, this effect would only occur during the brief duration of the sound.
The authors did not find any data on masking by sonar in fishes, but concluded that if it were to
occur, it would only occur during the sonar transmissions and would result in a narrow range of
frequencies being masked (Popper et al. 2014).
6.5.5 Physiological Stress
As with masking, a fish must first be able to detect a sound above its hearing threshold for that
particular frequency and the ambient noise before a behavioral reaction or physiological stress
can occur.
Stress refers to biochemical and physiological responses to increases in background sound. The
initial response to an acute stimulus is a rapid release of stress hormones into the circulatory
system, which may cause other responses such as elevated heart rate and blood chemistry
changes. Although an increase in background sound has been shown to cause stress in humans,
only a limited number of studies have measured biochemical responses by fish to acoustic stress
(Remage-Healey et al. 2006; Smith et al. 2004b; Wysocki et al. 2007; Wysocki et al. 2006) and
the results have varied. There is evidence that a sudden increase in sound pressure level or an
increase in background noise levels can increase stress levels in fish (Popper and Hastings
2009a; Popper and Hastings 2009b). Exposure to acoustic energy has been shown to cause a
442
Biological Opinion and Conference Report on Navy NWTT Activities and NMFS’ MMPA Incidental Take
Authorization PCTS FPR-2015-9110
change in hormone levels (physiological stress) and altered behavior in some species such as the
goldfish (Carassius auratus) (Pickering 1981; Smith et al. 2004a; Smith et al. 2004b), but not all
species tested to date, such as the rainbow trout (Oncorhynchus mykiss) (Wysocki et al. 2007).
Remage-Healey et al. (2006) found elevated cortisol levels, a stress hormone, in Gulf toadfish
exposed to low frequency bottlenose dolphin sounds. Additionally, the toadfish’ call rates
dropped by about 50 percent, presumably because the calls of the toadfish, a primary prey for
bottlenose dolphins, give away the fish’s location to the dolphin. The researchers observed none
of these effects in toadfish exposed to an ambient control sound (i.e., low-frequency snapping
shrimp ‘pops’).
Smith et al. (2004b) found no increase in corticosteroid, a stress hormone, in goldfish exposed to
a continuous, band-limited noise (0.1 to 10 kHz) with a sound pressure level of 170 dB re 1 μPa
for 1 month. Wysocki et al. (2007) exposed rainbow trout to continuous band-limited noise with
a sound pressure level of about 150 dB re 1 μPa for 9 months with no observed stress effects.
Growth rates and effects on the trout’s immune system were not significantly different from
control animals held at sound pressure level of 110 dB re 1 μPa.
6.5.6 Behavioral Reactions
There are little data available on the behavioral reactions of fish, and almost no research
conducted on any long-term behavioral effects or the potential cumulative effects from repeated
exposures to loud sounds (Popper and Hastings 2009a; Popper and Hastings 2009b). Behavioral
effects to fish could include disruption or alteration of natural activities such as swimming,
schooling, feeding, breeding, and migrating. Sudden changes in sound level can cause fish to
dive, rise, or change swimming direction. There is a lack of studies that have investigated the
behavioral reactions of unrestrained fish to anthropogenic sound, especially in the natural
environment. Studies of caged fish have identified three basic behavioral reactions to sound:
startle, alarm, and avoidance (McCauley et al. 2000; Pearson et al. 1992). Changes in sound
intensity may be more important to a fish’s behavior than the maximum sound level. Sounds that
fluctuate in level tend to elicit stronger responses from fish than even stronger sounds with a
continuous level (Schwartz 1985).
6.5.6.1 Non-impulsive Sound Sources
Gearin et al. (2000) studied responses of adult sockeye salmon (Oncorhynchus nerka) and
sturgeon (Acipenser sp.) to pinger sounds produced by acoustic devices designed to deter marine
mammals from gillnet fisheries. The pingers produced sounds with broadband energy with peaks
at 2 kHz or 20 kHz. They found that fish did not exhibit any reaction or behavior change to the
pingers, which demonstrated that the alarm was either inaudible to the salmon and sturgeon, or
443
Biological Opinion and Conference Report on Navy NWTT Activities and NMFS’ MMPA Incidental Take
Authorization PCTS FPR-2015-9110
that neither species was disturbed by the mid-frequency sound (Gearin et al. 2000). Based on
hearing threshold data, it is highly likely that the salmonids did not hear the sounds.
Culik et al. (2001) did a very limited number of experiments to determine the catch rate of
herring in the presence of pingers producing sounds that overlapped with the frequency range of
hearing for herring (2.7 kHz to over 160 kHz). They found no change in catch rates in gill nets
with or without the higher frequency (greater than 20 kHz) sounds present, although there was an
increase in the catch rate with the signals from 2.7 kHz to 19 kHz (a different source than the
higher frequency source). The results could mean that the fish did not “pay attention” to the
higher frequency sound or that they did not hear it, but that lower frequency sounds may be
attractive to fish. At the same time, it should be noted that there were no behavioral observations
on the fish, and so how the fish actually responded when they detected the sound is not known.
Doksaeter et al. (2009) studied the reactions of wild, overwintering herring to Royal Netherlands
Navy experimental mid-frequency active sonar and killer whale feeding sounds. The behavior of
the fish was monitored using upward looking echosounders. The received levels from the 1 to2
kHz and 6 to 7 kHz sonar signals ranged from 127 to 197 dB re 1 μPa and 139 to 209 dB re 1
μPa, respectively. Escape reactions were not observed upon the presentation of the mid-
frequency active sonar signals; however, the playback of the killer whale sounds elicited an
avoidance reaction. The authors concluded that mid-frequency sonar could be used in areas of
overwintering herring without substantially affecting the fish.
Studies documenting behavioral responses of fish to vessels show that Barents Sea capelin
(Mallotus villosus) may exhibit avoidance responses to engine noise, sonar, depth finders, and
fish finders (Jørgensen et al. 2004). Avoidance reactions are quite variable depending on the type
of fish, its life history stage, behavior, time of day, and the sound propagation characteristics of
the water (Schwartz 1985). Misund (1997) found that fish ahead of a ship that showed avoidance
reactions did so at ranges of 160 to 490 ft. (48.8 to 149.4 m). When the vessel passed over them,
some species of fish responded with sudden escape responses that included lateral avoidance or
downward compression of the school.
In a study by Chapman and Hawkins (1973) the low-frequency sounds of large vessels or
accelerating small vessels caused avoidance responses by herring. Avoidance ended within 10
seconds after the vessel departed. Twenty-five percent of the fish groups habituated to the sound
of the large vessel and 75 percent of the responsive fish groups habituated to the sound of small
boats.
Popper et al. (2014) concluded that the relative risk of a fish eliciting a behavioral reaction in
response to low-frequency sonar was low, regardless of the distance from the sound source. The
authors expected a limited number of species may respond to mid-frequency sonar since most
444
Biological Opinion and Conference Report on Navy NWTT Activities and NMFS’ MMPA Incidental Take
Authorization PCTS FPR-2015-9110
fish do not have specializations that enable them to hear above 2,500 Hz (Halvorsen et al. 2012;
Popper et al. 2014).
6.5.6.2 Explosions and Other Impulsive Sound Sources
Pearson et al. (1992) exposed several species of rockfish (Sebastes spp.) to a seismic airgun. The
investigators placed the rockfish in field enclosures and observed the fish’s behavior while firing
the airgun at various distances for 10 minute trials. Dependent upon the species, rockfish
exhibited startle or alarm reactions between peak to peak sound pressure level of 180 dB re 1 μPa
and 205 dB re 1 μPa. The authors reported the general sound level where behavioral alterations
became evident was at about 161 dB re 1 μPa for all species. During all of the observations, the
initial behavioral responses only lasted for a few minutes, ceasing before the end of the 10
minute trial.
Similarly, Skalski et al. (1992) showed a 52 percent decrease in rockfish (Sebastes sp.) caught
with hook-and-line (as part of the study—fisheries independent) when the area of catch was
exposed to a single airgun emission at 186 to 191 dB re 1 μPa (mean peak level) (See also
(Pearson et al. 1987; Pearson et al. 1992)). They also demonstrated that fish would show a startle
response to sounds as low as 160 dB re 1 μPa, but this level of sound did not appear to elicit
decline in catch. Wright (1982) also observed changes in fish behavior as a result of the sound
produced by an explosion, with effects intensified in areas of hard substrate.
Wardle et al. (2001) used a video system to examine the behaviors of fish and invertebrates on
reefs in response to emissions from seismic airguns. The researchers carefully calibrated the
airguns to have a peak level of 210 dB re 1 μPa at 16 m and 195 dB re 1 μPa at 109 m from the
source. There was no indication of any observed damage to the marine organisms. They found
no substantial or permanent changes in the behavior of the fish or invertebrates on the reef
throughout the course of the study, and no marine organisms appeared to leave the reef.
Engås et al. (1996) and Engås and Løkkeborg (2002) examined movement of fish during and
after a seismic airgun study by measuring catch rates of haddock (Melanogrammus aeglefinus)
and Atlantic cod as an indicator of fish behavior using both trawls and long-lines as part of the
experiment. These investigators found a significant decline in catch of both species that lasted
for several days after termination of airgun use. Catch rate subsequently returned to normal. The
conclusion reached by the investigators was that the decline in catch rate resulted from the fish
moving away from the airgun sounds at the fishing site. However, the investigators did not
actually observe behavior, and it is possible that the fish just changed depth.
The same research group showed, more recently, parallel results for several additional pelagic
species including blue whiting and Norwegian spring spawning herring (Slotte et al. 2004).
However, unlike earlier studies from this group, the researchers used fishing sonar to observe
445
Biological Opinion and Conference Report on Navy NWTT Activities and NMFS’ MMPA Incidental Take
Authorization PCTS FPR-2015-9110
behavior of the local fish schools. They reported that fish in the area of the airguns appeared to
go to greater depths after the airgun exposure compared to their vertical position prior to the
airgun usage. Moreover, the abundance of animals 18 to 31 miles (29 to 50 km) away from the
ensonification increased, suggesting that migrating fish would not enter the zone of seismic
activity.
Alteration in natural behavior patterns due to exposure to impulsive noise (such as pile driving
and explosions) has not been well studied. However, one study (Mueller-Blenkle et al. 2010),
which took place with fish enclosed in a mesocosm (an enclosure providing a limited body of
water with close to natural conditions), demonstrated behavioral reactions of cod and Dover sole
(Solea solea) to impulsive sounds from pile driving. Sole showed a significant increase in
swimming speed. Cod reacted, but not significantly, and both species showed directed movement
away from the sources with signs of habituation after multiple exposures. For sole, reactions
were seen with peak sound pressure levels of 144 to 156 dB re 1 μPa; and cod showed altered
behavior at peak sound pressure levels of 140 to 161 dB re 1 μPa. For both species, this -3 -4
corresponds to a peak particle motion between 6.51x10 and 8.62x10 meters per second
squared (m/s2).
Popper et al. (2014) indicated very little is known about the effects of explosions of wild fish
behavior, but suggested that startle responses, likely lasting less than a second, could occur from
exposure to explosives and that such responses would not necessarily result in significant
changes to subsequent behavior.
6.5.7 Repeated Exposures of Fish
As noted previously, there is almost no research on any long-term behavioral effects or the
potential cumulative effects from repeated exposures of fish to loud sounds (Popper and
Hastings 2009a; Popper and Hastings 2009b). Assessing the effects of sounds, both individually
and cumulatively, on marine species is difficult because responses depend on a variety of factors
including age class, prior experience, behavioral state at the time of exposure, and indirect
effects. Responses may be also be influenced by other non-sound related factors (Ellison et al.
2011; Goldbogen et al. 2013; Kight and Swaddle 2011; McGregor 2013; Read et al. 2014;
Williams et al. 2014a). Within the ocean environment, aggregate anthropogenic impacts have to
be considered in context of natural variation and climate change (Boyd and Hutchins 2012). To
address aggregate impacts and responses from any changes due to processes such as habituation,
tolerance, and sensitization, future experiments over an extended period of time still need further
research (Bejder et al. 2009; Blickley et al. 2012; Read et al. 2014).
Most of the fish that may be exposed to acoustic stressors would be exposed periodically or
episodically over certain months or seasons when the Navy is training and testing in the NWTT
Action Area. The majority of the proposed training and testing activities occur over a small
446
Biological Opinion and Conference Report on Navy NWTT Activities and NMFS’ MMPA Incidental Take
Authorization PCTS FPR-2015-9110
spatial scale relative to the entire Action Area, have few participants, and are of a short duration
(the order of a few hours or less). These periodic or episodic exposure and response scenarios
most often allow sufficient time to return to baseline conditions and resumption of normal
behavioral activities such as feeding and breeding. For example, Navy sonar systems are
generally deployed from highly mobile vessels or in-water devices which do not directly target
ESA-listed resources. A typical Navy vessel with hull mounted MFA sonar would travel over 0.3
kilometers between pings (based on a speed of 10 knots/hr and transmission rate of 1 ping/min)
(Navy 2013). Based on this distance traveled and potential avoidance behavior of acoustically
exposed animals, we expect repeat acoustic exposures capable of eliciting a behavioral response
to an individual over a brief period of time to be rare. For sonar devices that are stationary (e.g.
dipped sonar), successive events are not done in the same location. Additionally, due to the duty
cycle, duration of active transmission in a specific location, and mobility of the ESA-listed fish
species considered in this Opinion, we would not expect repeated exposures.
Repeated exposure to impulsive acoustic stressors may be more likely as successive detonations
could occur in close proximity to one another. However, with the exception of those individuals
that are close enough to be killed or seriously injured, we would expect the effect of repeated
exposures under this scenario to not impact the fitness of individual fish. As suggested by Popper
et al. (2014), most responses to detonations are expected to be temporary startle responses with
the animal resuming normal activity shortly after exposure. The same would be expected if
multiple startle responses occur resulting from successive detonations. It also may be possible for
detonations to temporarily affect refugia or foraging habitat selection. However, given these
animal’s mobility, we would expect individuals to temporarily select alternative refuge or forage
sites nearby until the exposure levels in their initially selected location have decreased. To result
in significant fitness consequences, we would have to assume that an individual fish could not
compensate for lost feeding opportunities by either immediately feeding at another location, by
feeding shortly after cessation of acoustic exposure, or by feeding at a later time. Similarly, we
would have to assume individuals could not find alternative refuge habitat nearby. There is no
indication this is the case. Therefore, even temporary displacement from initially selected habitat
is not expected to impact the fitness of any individual animals because we would expect
equivalent habitat to be available in close proximity. As noted previously, fish may also
experience hearing loss if an individual is in close proximity to an underwater detonation.
However, hearing loss would be temporary because unlike marine mammals, fish are capable of
regenerating sensory hairs and no permanent hearing loss has ever been reported in fish
(Lombarte et al. 1993; Smith et al. 2006b). Because we do not expect any fitness consequences
from any individual animals, we do not expect any population level effects from these responses.
Multiple stressors may also have synergistic effects. For example, fish that experience temporary
hearing loss or injury from acoustic stressors could be more susceptible to physical strike and
disturbance stressors via a decreased ability to detect and avoid threats. These interactions are
447
Biological Opinion and Conference Report on Navy NWTT Activities and NMFS’ MMPA Incidental Take
Authorization PCTS FPR-2015-9110
speculative, and without data on the combination of multiple Navy stressors, the synergistic
impacts from the combination of Navy stressors are difficult to predict in any meaningful way.
6.5.8 Criteria for Predicting Acoustic and Explosive Impacts - Fish
Navy activities introduce sound or explosive energy into the marine environment, therefore,
NMFS must conduct an analysis of potential effects to ESA-listed fish species. To do this,
information about the numerical sound and energy levels that are likely to elicit certain types of
physiological and behavioral reactions is needed. The following contains information on the
criteria, thresholds, and methodology for quantifying impacts from acoustic and explosive
sources, which were jointly developed between the Navy, NMFS, and the U.S. Fish and Wildlife
Service for this consultation. For additional information on the methodology used to develop
these criteria, see Renken (2015).
6.5.8.1 Non-impulsive Acoustic Sources (Sonar)
As we discussed in Section 6.5.1 of this Opinion, potential direct injuries to fish from non-
impulsive sound sources, such as sonar, are unlikely because of the relatively lower peak
pressures and slower rise times than potentially injurious sources such as explosives. Non-
impulsive sources also lack the strong shock wave such as that associated with an explosion.
However, if a sonar source level is high enough and an individual fish is close enough to the
source, physiological injury may be possible. As such, we established thresholds (Table 81) to
assess potential auditory effects such as TTS, recoverable injury, and mortal injury and mortality
(i.e., onset mortality) to assess these potential effects. Table 82 provides the estimated range to
effects based on these thresholds. As anticipated, these ranges are very small for the most
powerful sonar sources in each category.
448
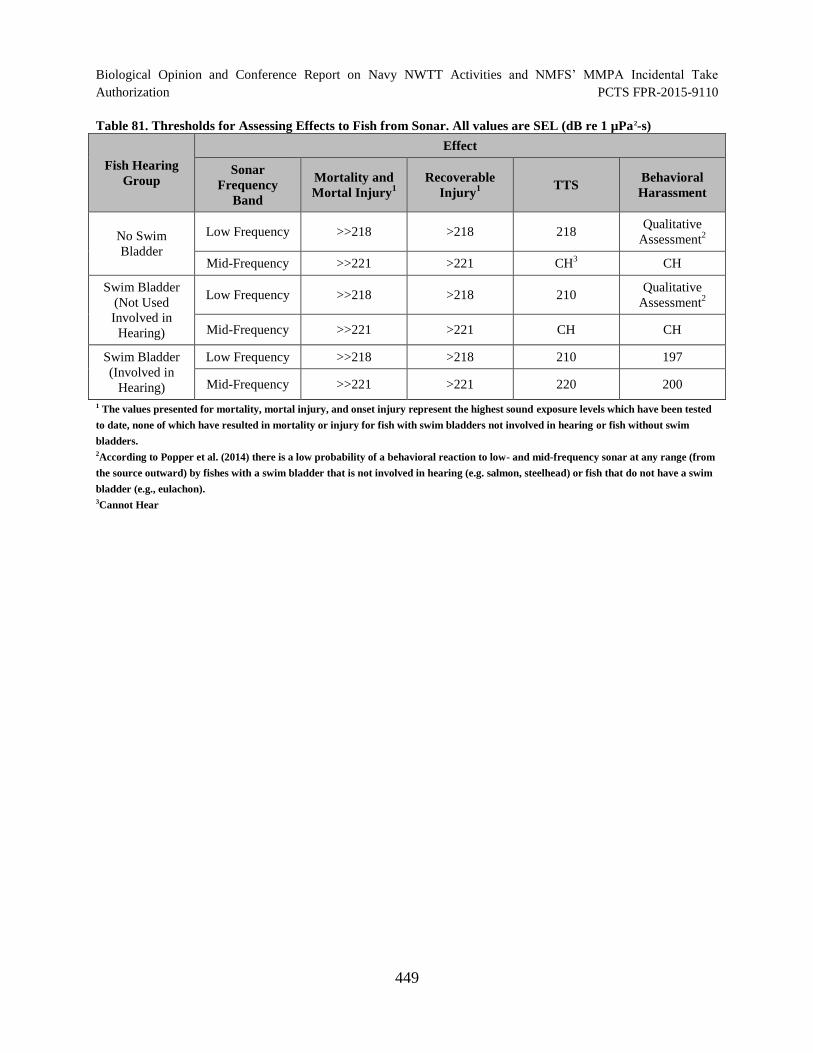
Biological Opinion and Conference Report on Navy NWTT Activities and NMFS’ MMPA Incidental Take Authorization PCTS FPR-2015-9110
Table 81. Thresholds for Assessing Effects to Fish from Sonar. All values are SEL (dB re 1 µPa2-s)
Fish Hearing
Group
Effect
Sonar
Frequency
Band
Mortality and
Mortal Injury1
Recoverable
Injury1 TTS
Behavioral
Harassment
No Swim
Bladder
Low Frequency >>218 >218 218 Qualitative
Assessment2
Mid-Frequency >>221 >221 CH3
CH
Swim Bladder
(Not Used
Involved in
Hearing)
Low Frequency >>218 >218 210 Qualitative
Assessment2
Mid-Frequency >>221 >221 CH CH
Swim Bladder
(Involved in
Hearing)
Low Frequency >>218 >218 210 197
Mid-Frequency >>221 >221 220 200
1 The values presented for mortality, mortal injury, and onset injury represent the highest sound exposure levels which have been tested
to date, none of which have resulted in mortality or injury for fish with swim bladders not involved in hearing or fish without swim
bladders. 2According to Popper et al. (2014) there is a low probability of a behavioral reaction to low- and mid-frequency sonar at any range (from
the source outward) by fishes with a swim bladder that is not involved in hearing (e.g. salmon, steelhead) or fish that do not have a swim
bladder (e.g., eulachon). 3Cannot Hear
449
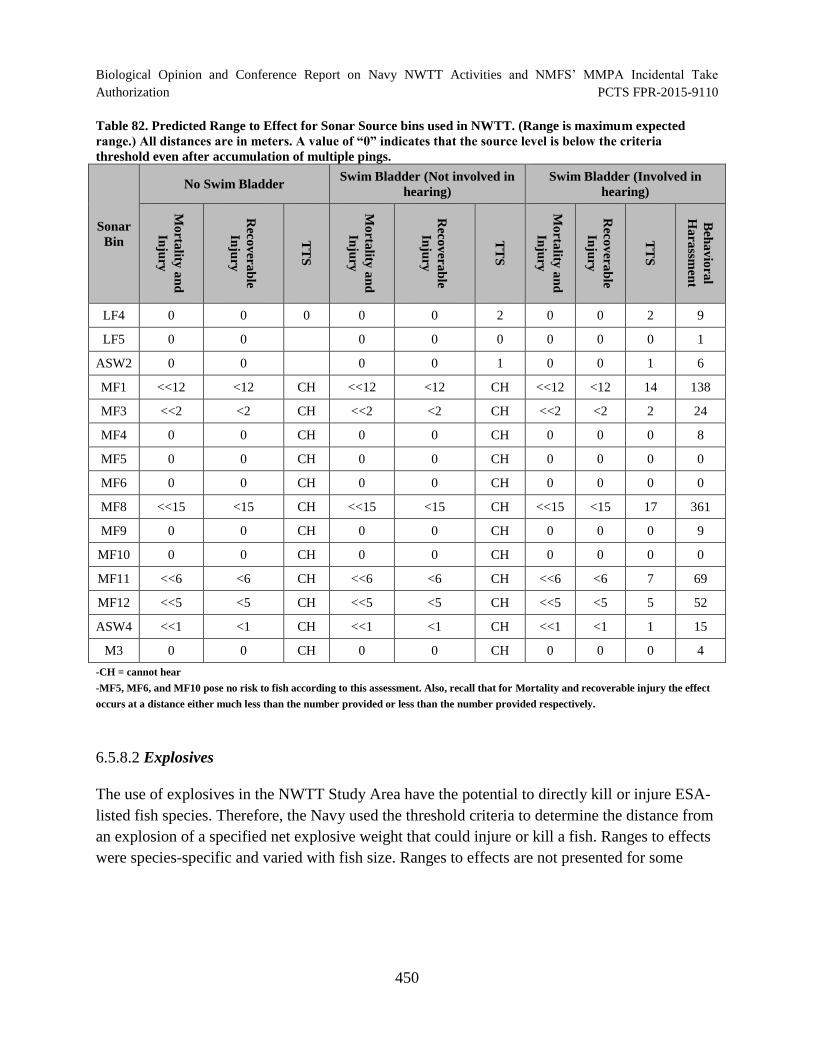
Biological Opinion and Conference Report on Navy NWTT Activities and NMFS’ MMPA Incidental Take Authorization PCTS FPR-2015-9110
Table 82. Predicted Range to Effect for Sonar Source bins used in NWTT. (Range is maximum expected
range.) All distances are in meters. A value of “0” indicates that the source level is below the criteria
threshold even after accumulation of multiple pings.
Sonar
Bin
No Swim Bladder Swim Bladder (Not involved in
hearing)
Swim Bladder (Involved in
hearing)
Mo
rtality
an
d
Inju
ry
Rec
ov
era
ble
Inju
ry
TT
S
Mo
rtality
an
d
Inju
ry
Rec
ov
era
ble
Inju
ry
TT
S
Mo
rtality
an
d
Inju
ry
Rec
ov
era
ble
Inju
ry
TT
S
Beh
av
iora
l
Ha
rassm
ent
LF4 0 0 0 0 0 2 0 0 2 9
LF5 0 0 0 0 0 0 0 0 1
ASW2 0 0 0 0 1 0 0 1 6
MF1 <<12 <12 CH <<12 <12 CH <<12 <12 14 138
MF3 <<2 <2 CH <<2 <2 CH <<2 <2 2 24
MF4 0 0 CH 0 0 CH 0 0 0 8
MF5 0 0 CH 0 0 CH 0 0 0 0
MF6 0 0 CH 0 0 CH 0 0 0 0
MF8 <<15 <15 CH <<15 <15 CH <<15 <15 17 361
MF9 0 0 CH 0 0 CH 0 0 0 9
MF10 0 0 CH 0 0 CH 0 0 0 0
MF11 <<6 <6 CH <<6 <6 CH <<6 <6 7 69
MF12 <<5 <5 CH <<5 <5 CH <<5 <5 5 52
ASW4 <<1 <1 CH <<1 <1 CH <<1 <1 1 15
M3 0 0 CH 0 0 CH 0 0 0 4
-CH = cannot hear
-MF5, MF6, and MF10 pose no risk to fish according to this assessment. Also, recall that for Mortality and recoverable injury the effect
occurs at a distance either much less than the number provided or less than the number provided respectively.
6.5.8.2 Explosives
The use of explosives in the NWTT Study Area have the potential to directly kill or injure ESA-
listed fish species. Therefore, the Navy used the threshold criteria to determine the distance from
an explosion of a specified net explosive weight that could injure or kill a fish. Ranges to effects
were species-specific and varied with fish size. Ranges to effects are not presented for some
450
Biological Opinion and Conference Report on Navy NWTT Activities and NMFS’ MMPA Incidental Take
Authorization PCTS FPR-2015-9110
explosive bins where the species or life-stage considered is not expected to co-occur in space or
time. Ranges to effects are presented in meters18
.
18 Eulachon do not possess swim bladders and so are far less susceptible to injury and mortality from explosions
than fish with swim bladders. The range from an explosive event over which damage may occur to fish without
swim bladders is on the order of 100 times less than that for a fish with a swim bladder (Goertner 1978). Therefore,
the range to effects values for eulachon were calculated using the same methodology as was used for the other fish
species considered in this Opinion, and then each range to effect value was divided by 100 to account for the fact
that eulachon do not possess a swim bladder.
451
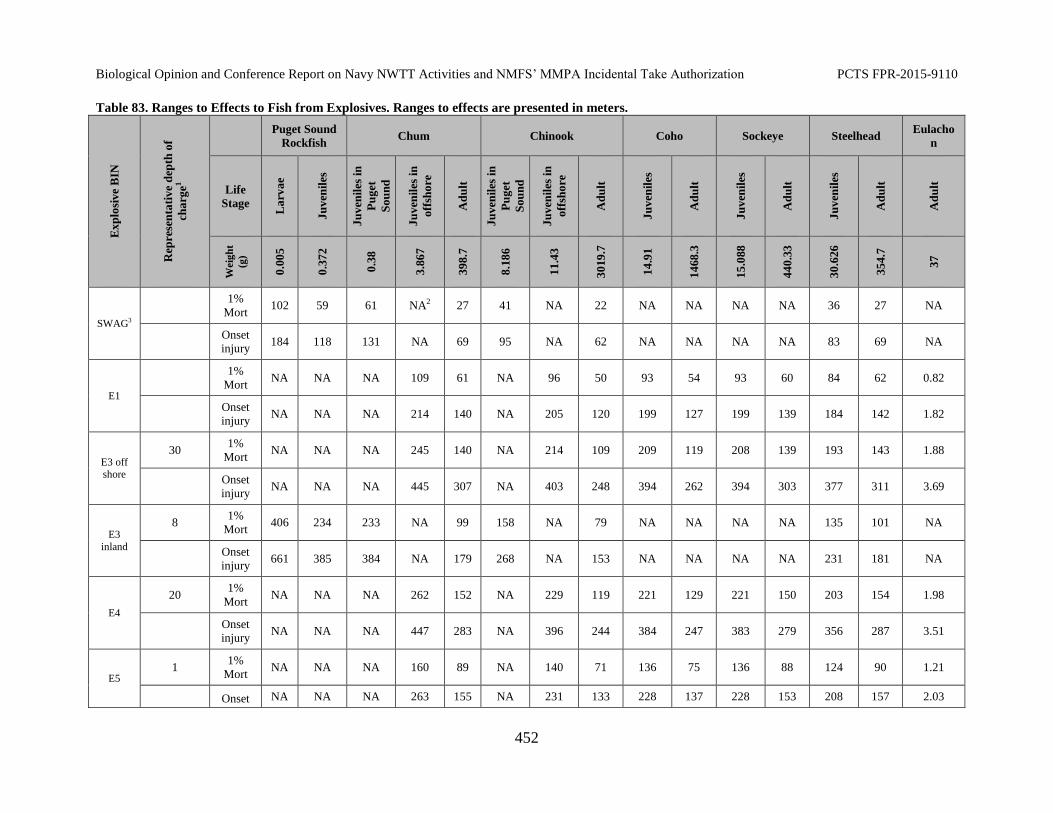
Biological Opinion and Conference Report on Navy NWTT Activities and NMFS’ MMPA Incidental Take Authorization PCTS FPR-2015-9110
Table 83. Ranges to Effects to Fish from Explosives. Ranges to effects are presented in meters. E
xp
losi
ve
BIN
Rep
rese
nta
tiv
e d
epth
of
cha
rge1
Puget Sound
Rockfish Chum Chinook Coho Sockeye Steelhead
Eulacho
n
Life
Stage
La
rva
e
Ju
ven
iles
Ju
ven
iles
in
Pu
get
So
un
d
Ju
ven
iles
in
off
sho
re
Ad
ult
Ju
ven
iles
in
Pu
get
So
un
d
Ju
ven
iles
in
off
sho
re
Ad
ult
Ju
ven
iles
Ad
ult
Ju
ven
iles
Ad
ult
Ju
ven
iles
Ad
ult
Ad
ult
Weig
ht
(g)
0.0
05
0.3
72
0.3
8
3.8
67
39
8.7
8.1
86
11
.43
30
19
.7
14
.91
14
68
.3
15
.088
44
0.3
3
30
.626
35
4.7
37
SWAG3
1%
Mort 102 59 61 NA2 27 41 NA 22 NA NA NA NA 36 27 NA
Onset
injury 184 118 131 NA 69 95 NA 62 NA NA NA NA 83 69 NA
E1
1%
Mort NA NA NA 109 61 NA 96 50 93 54 93 60 84 62 0.82
Onset
injury NA NA NA 214 140 NA 205 120 199 127 199 139 184 142 1.82
E3 off shore
30 1%
Mort NA NA NA 245 140 NA 214 109 209 119 208 139 193 143 1.88
Onset
injury NA NA NA 445 307 NA 403 248 394 262 394 303 377 311 3.69
E3
inland
8 1%
Mort 406 234 233 NA 99 158 NA 79 NA NA NA NA 135 101 NA
Onset
injury 661 385 384 NA 179 268 NA 153 NA NA NA NA 231 181 NA
E4
20 1%
Mort NA NA NA 262 152 NA 229 119 221 129 221 150 203 154 1.98
Onset
injury NA NA NA 447 283 NA 396 244 384 247 383 279 356 287 3.51
E5 1
1%
Mort NA NA NA 160 89 NA 140 71 136 75 136 88 124 90 1.21
Onset NA NA NA 263 155 NA 231 133 228 137 228 153 208 157 2.03
452
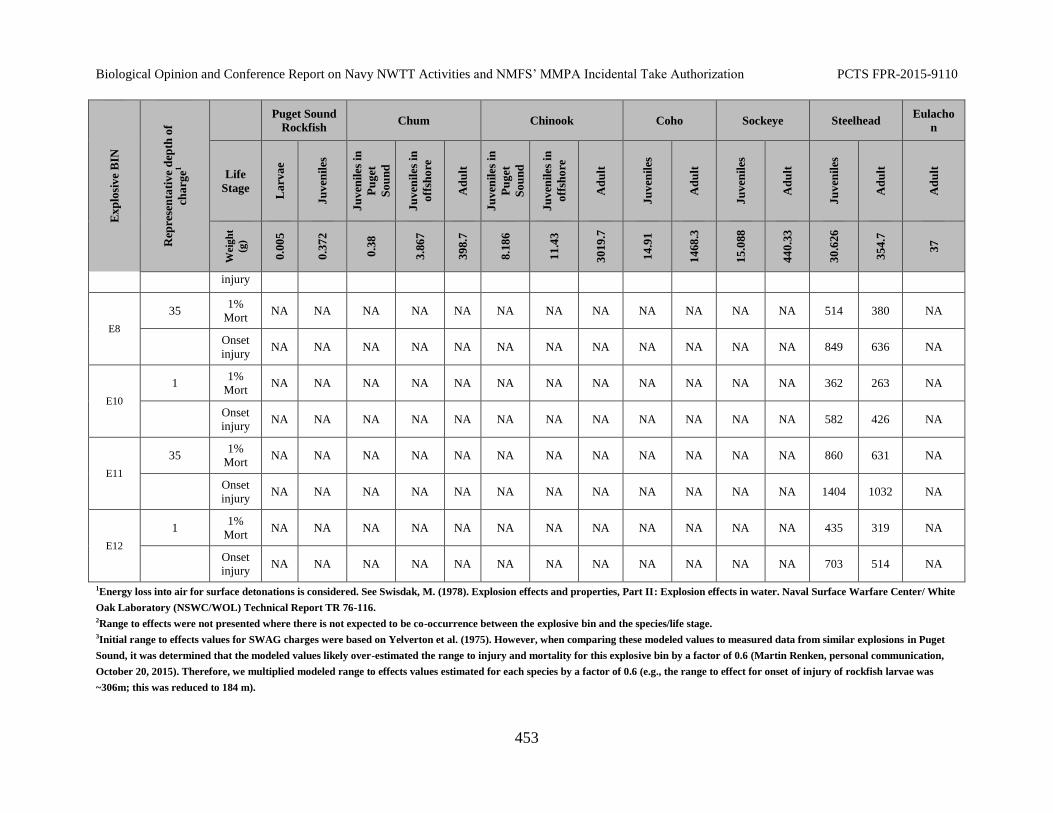
Biological Opinion and Conference Report on Navy NWTT Activities and NMFS’ MMPA Incidental Take Authorization PCTS FPR-2015-9110
Ex
plo
siv
e B
IN
Rep
rese
nta
tiv
e d
epth
of
cha
rge1
Puget Sound
Rockfish Chum Chinook Coho Sockeye Steelhead
Eulacho
n
Life
Stage
La
rva
e
Ju
ven
iles
Ju
ven
iles
in
Pu
get
So
un
d
Ju
ven
iles
in
off
sho
re
Ad
ult
Ju
ven
iles
in
Pu
get
So
un
d
Ju
ven
iles
in
off
sho
re
Ad
ult
Ju
ven
iles
Ad
ult
Ju
ven
iles
Ad
ult
Ju
ven
iles
Ad
ult
Ad
ult
Weig
ht
(g)
0.0
05
0.3
72
0.3
8
3.8
67
39
8.7
8.1
86
11
.43
30
19
.7
14
.91
14
68
.3
15
.088
44
0.3
3
30
.626
35
4.7
37
injury
E8
35 1%
Mort NA NA NA NA NA NA NA NA NA NA NA NA 514 380 NA
Onset
injury NA NA NA NA NA NA NA NA NA NA NA NA 849 636 NA
E10
1 1%
Mort NA NA NA NA NA NA NA NA NA NA NA NA 362 263 NA
Onset
injury NA NA NA NA NA NA NA NA NA NA NA NA 582 426 NA
E11
35 1%
Mort NA NA NA NA NA NA NA NA NA NA NA NA 860 631 NA
Onset
injury NA NA NA NA NA NA NA NA NA NA NA NA 1404 1032 NA
E12
1 1%
Mort NA NA NA NA NA NA NA NA NA NA NA NA 435 319 NA
Onset
injury NA NA NA NA NA NA NA NA NA NA NA NA 703 514 NA
1Energy loss into air for surface detonations is considered. See Swisdak, M. (1978). Explosion effects and properties, Part II: Explosion effects in water. Naval Surface Warfare Center/ White
Oak Laboratory (NSWC/WOL) Technical Report TR 76-116. 2Range to effects were not presented where there is not expected to be co-occurrence between the explosive bin and the species/life stage. 3Initial range to effects values for SWAG charges were based on Yelverton et al. (1975). However, when comparing these modeled values to measured data from similar explosions in Puget
Sound, it was determined that the modeled values likely over-estimated the range to injury and mortality for this explosive bin by a factor of 0.6 (Martin Renken, personal communication,
October 20, 2015). Therefore, we multiplied modeled range to effects values estimated for each species by a factor of 0.6 (e.g., the range to effect for onset of injury of rockfish larvae was
~306m; this was reduced to 184 m).
453
Biological Opinion and Conference Report on Navy NWTT Activities and NMFS’ MMPA Incidental Take
Authorization PCTS FPR-2015-9110
6.6 Density Estimate Use in Exposure Estimates
The following sections discuss the density estimates used in the effects analyses.
6.6.1 Marine Mammals
There is no single source of density data for every area, species, and season because of the fiscal
costs, resources, and effort involved to provide enough survey coverage to sufficiently estimate
density. Therefore, to characterize marine mammal density for areas of concern such as the
Action Area, the Navy compiled data from multiple sources. Each data source may use different
methods to estimate density, of which, uncertainty in the estimate can be directly related to the
method applied.
The Navy thus developed a protocol to select the best available data sources based on species,
area, and time (season). The Navy then used this protocol to identify the best available density
data from available sources, including habitat-based density models, line-transect analyses, and
peer-reviewed published studies. These data were incorporated into a Geographic Information
System database that includes seasonal (summer/fall and winter/spring) density values for every
marine mammal species present within the Action Area. Detailed information on the Navy’s
selection protocol, datasets, and specific density values are provided in a Pacific Navy Marine
Species Density Database Technical Report (U.S. Department of the Navy 2014).
A quantitative impact analysis requires an estimate of the number of animals that might be
affected. A key element of this estimation is knowledge of the abundance and concentration of
the species in specific areas where those activities will occur. The most appropriate unit of metric
for this type of analysis is density or the number of animals present per unit area. Marine species
density estimation requires a significant amount of effort to both collect and analyze data to
produce a reasonable estimate. Unlike surveys for terrestrial wildlife, many marine species spend
much of their time submerged, and are not easily observed. In order to collect enough sighting
data to make reasonable density estimates, multiple observations are required, often in areas that
are not easily accessible (e.g., far offshore). Ideally, marine species sighting data would be
collected for the specific area and time period of interest and density estimates derived
accordingly. However, in many places poor weather conditions and high sea states prohibit the
completion of comprehensive surveys.
For most cetacean species, abundance is estimated using line-transect surveys or mark-recapture
studies.(Barlow 2010b; Barlow and Forney 2007; Calambokidis et al. 2008b). The result provides
one single density estimate value, for each species, across broad geographic areas, such as waters
within the U.S. Exclusive Economic Zone off California, Oregon, and Washington. This is the
general approach applied in estimating cetacean abundance in the NMFS stock assessment
454

Biological Opinion and Conference Report on Navy NWTT Activities and NMFS’ MMPA Incidental Take
Authorization PCTS FPR-2015-9110
reports. Though the single value provides a good average estimate of abundance (total number of
individuals) for a specified area, it does not provide information on the species distribution or
concentrations within that area, and does not estimate density for other timeframes/seasons that
were not surveyed. More recently, habitat modeling has been used to estimate cetacean densities
(Barlow et al. 2009b; Becker et al. 2012a; Becker et al. 2012b; Becker et al. 2010; Becker et al.
2012c; Ferguson et al. 2006; Forney et al. 2012; Redfern et al. 2006). These models estimate
cetacean density as a continuous function of habitat variables (e.g., sea surface temperature,
seafloor depth, etc.) and thus allow predictions of cetacean densities on finer spatial scales than
traditional line-transect or mark-recapture analyses. Within the Action Area that was modeled,
densities can be predicted wherever these habitat variables can be measured or estimated.
Currently-published density estimates rely on low numbers of sightings available for their
derivation. This can lead to uncertainty which is typically expressed by the coefficient of
variation of the estimate, which is derived using standard statistical methods and describes the
amount of variation with respect to the population mean. It is expressed as a fraction or
sometimes a percentage and can range upward from zero, indicating no uncertainty, to high
values. For example, a coefficient of variation of 0.85 would indicate high uncertainty in the
population estimate. When the coefficient of variation exceeds 1.0, the estimate is very uncertain.
The uncertainty associated with movements of animals into or out of an area (due to factors such
as availability of prey or changing oceanographic conditions) is much larger than is indicated by
the coefficient of variation.
The methods used to estimate pinniped at-sea densities are typically different than those used for
cetaceans. Pinniped abundance is generally estimated via shore counts of animals at known
rookeries and haul-out sites. Translating these numbers to in-water densities is difficult given the
variability in foraging ranges, migration, and haul-out behavior between species and within each
species, and is driven by factors such as age class, sex class, seasonal variation, etc. Details of the
density derivation for each species of pinniped in the Action Area are provided in the Pacific
Navy Marine Species Density Database Technical Report (U.S. Department of the Navy 2014).
In summary, the methods used to derive pinniped densities involved a series of species-specific
data reviews to compile the most accurate and up-to-date information available. This review was
undertaken by a panel of subject matter experts, including marine mammal scientists from the
Washington State Department of Fish and Wildlife, Navy, and ManTech International. Once all
available information, including known haul-out sites and local abundance, had been reviewed
and updated as necessary, the resulting numbers of animals were assigned to inland water areas
divided into regions consistent with Jeffries et al. (Jeffries et al. 2003). The total abundance
divided by the area of the region was the resultant density for each species in a given location.
455
Biological Opinion and Conference Report on Navy NWTT Activities and NMFS’ MMPA Incidental Take
Authorization PCTS FPR-2015-9110
6.6.2 Leatherback Sea Turtle
A quantitative analysis of impacts on a species requires data on the abundance and concentration
of the species population in the potentially impacted area. The most appropriate metric for this
type of analysis is density, which is the number of animals present per unit area. There is no
single source of density data for every area of the world, species, and season because of the fiscal
costs, resources, and effort involved in providing survey coverage to sufficiently estimate
density. Therefore, to characterize the marine species density for large areas such as the Action
Area, the Navy compiled data from several sources. To compile and structure the most
appropriate database of marine species density data, the Navy developed a protocol to select the
best available data sources based on species, area, and time (season). The resulting Geographic
Information System database called the Navy Marine Species Density Database (DON 2012b)
includes seasonal density values the leatherback sea turtle present within the Action Area. The
species’ density distribution matched the expected distribution from published literature and the
NMFS stock assessments. In this Opinion, sea turtle density data were used as an input in the
NAEMO in their original temporal and spatial resolution.
6.6.3 Fish
The methodologies used to estimate densities of ESA-listed fish in the Action Area are described
in section 6.11.
6.7 Exposure and Response – Non-Impulsive Acoustic Stressors - Training
The following sections discuss our analysis of stressors that are likely to adversely affect ESA-
listed species. If a stressor is likely to adversely affect any of the ESA-listed species in the
NWTT Action Area, it is discussed further in this Section. Exposure of fish to acoustic stressors
was not modeled due to limited information on species distribution and density in the Action
Area.
6.7.1 Exposure and Response of Marine Mammals to Non-Impulsive Acoustic Stressors –
Training Activities
For this consultation, we considered exposure estimates from the Phase II NAEMO model at
several output points for marine mammals and sea turtles. First, we estimated the total number of
ESA-listed species (animats) that would be exposed to acoustic sources prior to the application
of a dose-response curve or criteria. We term these the “unprocessed” estimates. This estimate is
the number of times individual animats or animals are likely to be exposed to the acoustic
environment that is a result of training exercises, regardless of whether they are “taken” as a
result of that exposure. In most cases, the number of animals “taken” by an action would be a
subset of the number of animals that are exposed to the action because (1) in some
456
Biological Opinion and Conference Report on Navy NWTT Activities and NMFS’ MMPA Incidental Take
Authorization PCTS FPR-2015-9110
circumstances, animals might not respond to an exposure or (2) some responses may be negative
for an individual animal without constituting a form of “take” (for example, some physiological
stress responses only have fitness consequences when they are sustained and would only
constitute a “take” as a result of cumulative exposure).
A second set of exposure estimates (“model-estimated”) of listed species were generated and
“processed” using dose-response curves and criteria for temporary and permanent threshold shift
developed by the Navy and NMFS’ Permits Division for the purpose of identifying harassment
pursuant to the MMPA. Neither sets of exposure estimates, the unprocessed or processed, were
adjusted to account for standard mitigation actions that NMFS’ Permits Division requires under
the MMPA rule and LOA to avoid marine mammals, nor were the estimates adjusted to account
for avoidance responses that might be taken by individual animals once they sense the presence
of Navy vessels or aircraft. Since the processed exposure estimates represent incidental take for
purposes of the ESA, we base our jeopardy analyses and determinations on these estimates. As
stated above, these estimates were not adjusted to take into account the standard mitigation
measures required under the MMPA rule or conducted by the Navy.
6.7.1.1 Blue Whale
The NAEMO output estimates that blue whales will be exposed to sonar and other non-impulsive
acoustic stressors associated with training activities throughout the year. The unprocessed
estimate of exposure events above 120 dB SPL and the contribution of activities to these
exposures are provided in Table 84. We do not rely on these potential exposures for our jeopardy
analysis, but include this information to illustrate the context of exposures of species to non-
impulsive acoustic sources. The low received level (approximately 120 dB SPL) from the sonar
at a distance exceeding approximately 54 mi. (100 km) is modeled as having some minor
behavioral effects although masking by other ambient sounds, such as other vocalizing whales
(Au et al. 2000b) or other potential biological sources (D’Spain and Batchelor 2006), make
reaction to the sound from sonar and other active sound sources by mysticetes at that distance
less likely.
457
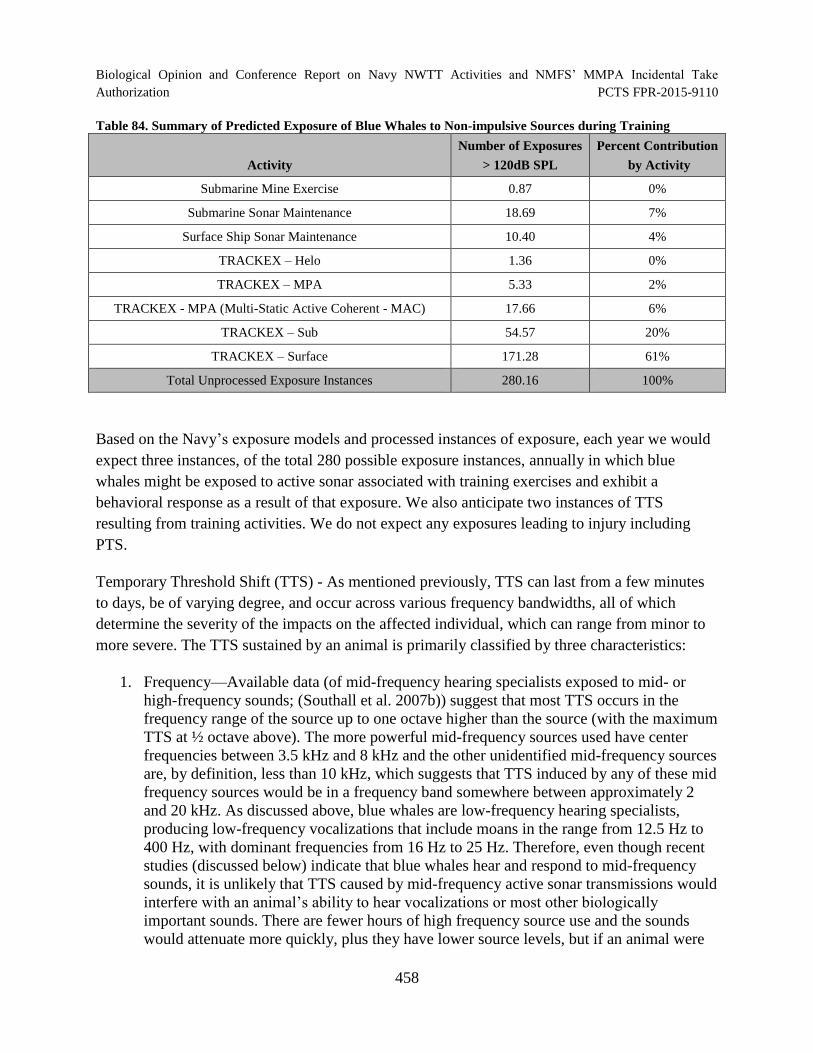
Biological Opinion and Conference Report on Navy NWTT Activities and NMFS’ MMPA Incidental Take Authorization PCTS FPR-2015-9110
Table 84. Summary of Predicted Exposure of Blue Whales to Non-impulsive Sources during Training
Activity
Number of Exposures
> 120dB SPL
Percent Contribution
by Activity
Submarine Mine Exercise 0.87 0%
Submarine Sonar Maintenance 18.69 7%
Surface Ship Sonar Maintenance 10.40 4%
TRACKEX – Helo 1.36 0%
TRACKEX – MPA 5.33 2%
TRACKEX - MPA (Multi-Static Active Coherent - MAC) 17.66 6%
TRACKEX – Sub 54.57 20%
TRACKEX – Surface 171.28 61%
Total Unprocessed Exposure Instances 280.16 100%
Based on the Navy’s exposure models and processed instances of exposure, each year we would
expect three instances, of the total 280 possible exposure instances, annually in which blue
whales might be exposed to active sonar associated with training exercises and exhibit a
behavioral response as a result of that exposure. We also anticipate two instances of TTS
resulting from training activities. We do not expect any exposures leading to injury including
PTS.
Temporary Threshold Shift (TTS) - As mentioned previously, TTS can last from a few minutes
to days, be of varying degree, and occur across various frequency bandwidths, all of which
determine the severity of the impacts on the affected individual, which can range from minor to
more severe. The TTS sustained by an animal is primarily classified by three characteristics:
1. Frequency—Available data (of mid-frequency hearing specialists exposed to mid- or
high-frequency sounds; (Southall et al. 2007b)) suggest that most TTS occurs in the
frequency range of the source up to one octave higher than the source (with the maximum
TTS at ½ octave above). The more powerful mid-frequency sources used have center
frequencies between 3.5 kHz and 8 kHz and the other unidentified mid-frequency sources
are, by definition, less than 10 kHz, which suggests that TTS induced by any of these mid
frequency sources would be in a frequency band somewhere between approximately 2
and 20 kHz. As discussed above, blue whales are low-frequency hearing specialists,
producing low-frequency vocalizations that include moans in the range from 12.5 Hz to
400 Hz, with dominant frequencies from 16 Hz to 25 Hz. Therefore, even though recent
studies (discussed below) indicate that blue whales hear and respond to mid-frequency
sounds, it is unlikely that TTS caused by mid-frequency active sonar transmissions would
interfere with an animal’s ability to hear vocalizations or most other biologically
important sounds. There are fewer hours of high frequency source use and the sounds
would attenuate more quickly, plus they have lower source levels, but if an animal were
458
Biological Opinion and Conference Report on Navy NWTT Activities and NMFS’ MMPA Incidental Take
Authorization PCTS FPR-2015-9110
to incur TTS from these sources, it would cover a higher frequency range (sources are
between 20 kHz and 100 kHz, which means that TTS could range up to 200 kHz;
however, high frequency systems are typically used less frequently and for shorter time
periods than surface ship and aircraft mid-frequency systems, so TTS from these sources
is even less likely).
2. Degree of the shift (i.e., how many dB is the sensitivity of the hearing reduced by)—
Generally, both the degree of TTS and the duration of TTS will be greater if the marine
mammal is exposed to a higher level of energy (which would occur when the peak dB
level is higher or the duration is longer). The threshold for the onset of TTS was
discussed previously in this document. An animal would have to approach closer to the
source or remain in the vicinity of the sound source appreciably longer to increase the
received SEL, which would be difficult considering the lookouts, the sightability of blue
whales and other listed mysticetes, and the nominal speed of an active sonar vessel (10 to
15 knots). In the TTS studies, some using exposures of almost an hour in duration or up
to 217 SEL, most of the TTS induced was 15 dB or less, though Finneran et al. (2007)
induced 43 dB of TTS with a 64-second exposure to a 20 kHz source. However, mid-
frequency active sonar emits a nominal ping every 50 seconds, and incurring those levels
of TTS is highly unlikely.
3. Duration of TTS (recovery time)—In the TTS laboratory studies, some using exposures
of almost an hour in duration or up to 217 SEL, almost all individuals recovered within 1
day (or less, often in minutes), though in one study (Finneran et al. 2007), recovery took
4 days. Based on the range of degree and duration of TTS reportedly induced by
exposures to non-pulse sounds of energy higher than that to which freeswimming marine
mammals in the field are likely to be exposed during mid-frequency/high-frequency
active sonar training exercises in the Action Area, it is unlikely that blue whales or other
listed cetaceans would ever sustain a TTS from MFAS that alters their sensitivity by
more than 20 dB for more than a few days (and any incident of TTS would likely be far
less severe due to the short duration of the majority of the exercises and the speed of a
typical vessel). Also, because of the short distance within which animals would need to
approach the sound source, it is unlikely that animals would be exposed to the levels
necessary to induce TTS in subsequent time periods such that their recovery is impeded.
In addition, the mitigation zones prescribed in the final MMPA rule encompass the ranges to
PTS for the most sensitive marine mammal functional hearing group, which is usually the high-
frequency cetacean hearing group. Therefore, the mitigation zones are even more protective for
blue whales and other low-frequency cetaceans, and likely cover a larger portion of the potential
range to onset of TTS. Accordingly, the prescribed mitigation and the sightability of blue whales
and other mysticetes (due to their large size) reduce the potential for a significant TTS or
behavioral reaction threshold shift to occur.
Therefore, for blue whales and other listed mysticetes analyzed in this Opinion, even though the
modeled TTS estimates may change from year to year over baseline conditions, NMFS does not
459
Biological Opinion and Conference Report on Navy NWTT Activities and NMFS’ MMPA Incidental Take
Authorization PCTS FPR-2015-9110
anticipate TTS of a long duration or severe degree to occur as a result of exposure to mid- or
high-frequency active sonar utilized in the NWTT Action Area.
The classification of modeled effects from acoustic stressors, such as TTS, are performed in a
manner as to conservatively overestimate the impacts of those effects. Acoustic stressors are
binned and all stressors within each bin are modeled as the loudest source, overestimating
impacts within each bin. Therefore, the temporary duration of many TTS exposures may be on
the shorter end of the range and last only a few minutes. Even longer duration TTS are expected
to typically last hours. Given the brief amount of time blue whales are expected to experience
TTS, it is unlikely to significantly impair their ability to communicate, forage, or breed and will
not have fitness level consequences at the individual or population level. Results from 2 years
(2009 and 2010) of intensive monitoring by independent scientists and Navy observers in the
Southern California (SOCAL) and Hawaii Range Complexes have recorded an estimated 161,894
marine mammals with no evidence of distress or unusual behavior observed during Navy
activities, supporting that TTS is unlikely to significantly impair the ability of blue whales to
communicate, forage, or breed and will not have fitness level consequences at the individual or
population level.
Behavioral Responses - As discussed, the Navy uses the behavioral response function to quantify
the number of behavioral responses that would qualify as Level B behavioral harassment under
the MMPA. As the statutory definition is currently applied, a wide range of behavioral reactions
may qualify as Level B harassment under the MMPA, including but not limited to avoidance of
the sound source, temporary changes in vocalizations or dive patterns, temporary avoidance of
an area, or temporary disruption of feeding, migrating, or reproductive behaviors. The estimates
calculated using the behavioral response function do not differentiate between the different types
of potential reactions. Nor do the estimates provide information regarding the potential fitness or
other biological consequences of the reactions on the affected individuals. We therefore consider
the available scientific evidence to determine the likely nature of the modeled blue whale
behavioral responses and the potential fitness consequences for affected individuals.
While we recognize that animal hearing evolved separately from animal vocalizations and, as a
result, it may be inappropriate to make inferences about an animal’s hearing sensitivity from
their vocalizations, we have no data on blue whale hearing so we assume that blue whale
vocalizations are partially representative of their hearing sensitivities. Blue whales are not likely
to respond to high-frequency sound sources associated with the proposed training exercises and
testing activities because of their hearing sensitivities. Despite previous assumptions based on
vocalizations and anatomy that blue whales predominantly hear low-frequency sounds below
400 Hz (Croll et al. 2001b; Oleson et al. 2007b; Stafford and Moore 2005a), recent research has
indicated blue whales not only hear mid-frequency active sonar transmissions, in some cases
460
Biological Opinion and Conference Report on Navy NWTT Activities and NMFS’ MMPA Incidental Take
Authorization PCTS FPR-2015-9110
they respond to those transmissions (Goldbogen et al. 2013; Melcon et al. 2012; Southall et al.
2011a).
As discussed previously in this Opinion, blue whales may hear some sounds in the mid-
frequency range and exhibit behavioral responses to sounds in this range depending on received
level and context (Goldbogen et al. 2013; Melcon et al. 2012). However, both Goldbogen et al.
(2013) and Melcon et al. (2012) indicated that behavioral responses to simulated or operational
MFA sonar were temporary, with whales resuming normal behavior quickly after the cessation
of sound exposure. Further, responses were discernible for whales in certain behavioral states
(i.e., deep feeding), but not in others (i.e., surface feeding). As stated in Goldbogen et al. (2013)
when summarizing the response of blue whales to simulated MFA sonar, “We emphasize that
elicitation of the response is complex, dependent on a suite of contextual (e.g., behavioral state)
and sound exposure factors (e.g., maximum received level), and typically involves temporary
avoidance responses that appear to abate quickly after sound exposure.”
Melcon et al. (2012) reported that blue whales exposed to mid-frequency sonar in the Southern
California Bight were less likely to produce low frequency calls (D calls) usually associated with
feeding behavior. However, they were unable to determine if suppression of D calls reflected a
change in their feeding performance or abandonment of foraging behavior and indicated that
implications of the documented responses are unknown. Goldbogen et al. (2013) speculated that
if the documented temporary behavioral responses interrupted feeding behavior, this could have
impacts on individual fitness and eventually, population health. However, for this to be true, we
would have to assume that an individual whale could not compensate for this lost feeding
opportunity by either immediately feeding at another location, by feeding shortly after cessation
of acoustic exposure, or by feeding at a later time. There is no indication this is the case,
particularly since unconsumed prey would likely still be available in the environment in most
cases following the cessation of acoustic exposure.
Moreover, there are important differences between the acoustic sources used in the authors’
Controlled Exposure Experiments. As discussed previously, perhaps the most significant
response documented in the study occurred during a controlled exposure experiments involving
pseudo-random noise rather than simulated sonar, which corresponded with a blue whale
terminating a foraging bout. The more significant reaction to PRN may be indicative of
habituation to mid-frequency sonar signals; the authors noted that the responses they documented
were in a geographical region with a high level of naval activity and where mid-frequency sonar
use is common. In addition, during the controlled exposure experiments, sound sources were
deployed from a stationary source vessel positioned approximately 1,000 m from the focal
animals, with one transmission onset every 25 seconds (Southall et al. 2012a). In contrast, most
Navy sonar systems are deployed from highly mobile vessels or in-water devices which do not
directly target marine mammals. Further, the typical duty cycle with most tactical anti-submarine
461
Biological Opinion and Conference Report on Navy NWTT Activities and NMFS’ MMPA Incidental Take
Authorization PCTS FPR-2015-9110
warfare is lower than used in the controlled exposure experiments described above, transmitting
about once per minute with most active sonar pulses lasting no more than a few seconds (Navy
2013). Moreover, a typical Navy vessel with hull mounted MFA sonar would travel over 0.3
kilometers between pings (based on a speed of 10 knots/hr and transmission rate of 1 ping/min).
Based on this distance traveled and potential avoidance behavior of acoustically exposed
animals, we expect repeat acoustic exposures capable of eliciting a behavioral response to an
individual over a brief period of time to be rare. In the event an individual is exposed to multiple
sound sources that elicit a behavioral response (e.g., disruption of feeding) in a short amount of
time, we do not expect these exposures to have fitness consequences as individuals will resume
feeding upon cessation of the sound exposure and unconsumed prey will still be available in the
environment.
As noted in Southall et al. (Southall et al. 2007b), substantive behavioral reactions to noise
exposure (such as disruption of critical life functions, displacement, or avoidance of important
habitat) are considered more likely to be significant if they last more than 24 hours, or recur on
subsequent days. Major training exercises conducted in the NWTT Action Area can last several
weeks, and during those exercises there may be periods of continuous sonar use. Not every major
training exercise has anti-submarine warfare events where sonar is used. However, even the
longest periods of "continuous" active sonar use rarely last longer than 12 hours, and active sonar
use is not truly continuous because a sonar system is actively transmitting a small portion of the
time (once per minute for approximately 10 seconds). For Navy active sonar use, a period of
concentrated, near continuous anti-submarine warfare sonar use means that sound energy is
being put in the water nearly 2 percent of the time. Sonar sound is not transmitting when trying
to listen for returns of a detection of a submarine or contact of something else in the water
column. Vessels equipped with the most powerful sonar systems would also generally be moving
at speeds of 10 to15 knots separated in distances when using active sonar. Thus, even during
major training exercises, it is unlikely that a specific geographic area or water column would be
ensonified at high levels for prolonged periods of time, which could increase the risk of
significant behavioral responses or repeated disturbances in close temporal proximity. Even if
sound exposure were to be concentrated in a relatively small geographic area over a long period
of time (e.g., days or weeks during major training exercises), we would expect that some
individual whales would most likely respond by temporarily avoiding areas where exposures to
acoustic stressors are at higher levels (e.g., greater than 120 dB). For example, Goldbogen et al.
(2013) indicated some horizontal displacement of deep foraging blue whales in response to
simulated MFA sonar. However, given these animal’s mobility and large ranges, we would
expect these individuals to temporarily select alternative foraging sites nearby until the exposure
levels in their initially selected foraging area have decreased. Therefore, even temporary
displacement from initially selected foraging habitat is not expected to impact the fitness of any
individual animals because we would expect similar foraging to be available in close proximity.
462
Biological Opinion and Conference Report on Navy NWTT Activities and NMFS’ MMPA Incidental Take
Authorization PCTS FPR-2015-9110
Because we do not expect any fitness consequences from any individual animals, we do not
expect any population level effects from these behavioral responses.
On a related point, for purposes of this Opinion, we assume that the Navy’s activities and
associated impacts will continue into the reasonably foreseeable future at the annual levels
discussed herein. This raises the question of whether the annual instances of modeled TTS or
behavioral disturbances could indirectly lead to more serious aggregate or long-term impacts
over time. Under certain conditions, chronic exposure to acoustic sources or other stimuli that
can cause individual stress or behavioral responses can also lead to additional long-term adverse
impacts. For example, investigators concluded that gray whales and humpback whales
abandoned some of their coastal habitat in California and Hawaii, respectively, because of
persistent underwater noise associated with extensive vessel traffic (Gard 1974; Reeves 1977;
Salden 1988). Another study of terrestrial mammals suggests that while short-term stress
responses are often beneficial, conditions of chronic or long-term stress can lead to adverse
physiological effects (Romero and Butler 2007). However, because acoustic disturbances caused
by Navy sonar and explosives are short-term, intermittent, and (in the case of sonar) transitory,
even during major training exercises, we would not expect the Navy’s activities to create
conditions of long-term, continuous underwater noise leading to habitat abandonment or long
term hormonal or physiological stress responses in marine mammals. Moreover, as discussed
previously, Navy testing and training activities, including the use of MFA sonar, have been
ongoing in the NWTT Action Area for decades, and there is no evidence that the activities have
caused blue whales or other listed species evaluated in this Opinion to abandon important habitat
or any other severe adverse impacts.
Further, recent evidence indicates that the Eastern North Pacific blue whale population, which
includes blue whales in Southern California, has likely reached carrying capacity (Monnahan et
al. 2014a). As stated previously, Navy training and testing activities in that area as with similar
activities in the NWTT Action Area, include the use of MFA sonar, and have been ongoing for
decades. Therefore, any potential temporary behavioral impacts on blue whales from the use of
MFA during Navy training and testing activities in the NWTT Action Area are also likely to
have not prevented the recovery of the blue whales throughout its range. The TTS and behavioral
response estimates may change from year to year, which could mean an increase in the number
of individual animals exposed per year or an increase in the number of times per year some
animals are exposed. However, the severity of individual responses, and the consequences of
those responses on the fitness of affected individuals, is not expected to change.
Establishing a causal link between anthropogenic noise, animal communication, and individual
impacts as well as population viability is difficult to quantify and assess (McGregor 2013; Read
et al. 2014). It is difficult to assess the effects of sounds individually and cumulatively on marine
species because a number of factors can influence these effects including: indirect effects, age
463
Biological Opinion and Conference Report on Navy NWTT Activities and NMFS’ MMPA Incidental Take
Authorization PCTS FPR-2015-9110
class, prior experience, behavioral state at the time of exposure, and that responses may be
influenced by other non-sound related factors (Ellison et al. 2011; Goldbogen et al. 2013; Kight
and Swaddle 2011; McGregor 2013; Read et al. 2014; Williams et al. 2014a). However, although
there is significant uncertainty, based upon the available evidence and the foregoing analysis, we
conclude that continuation of annual modeled instances of TTS and behavioral disturbances into
the reasonably foreseeable future is unlikely to cause aggregate or long-term adverse effects on
blue whales, such as abandonment of important habitat or adverse physiological effects resulting
from chronic or long-term stress.
Non-impulsive acoustic stressors from Navy training activities conducted during five-year period
of proposed MMPA Rule and into the reasonably foreseeable future are not likely to reduce the
viability or recovery of these populations. We anticipate temporary behavioral responses and
TTS, but do not anticipate any injury or mortality from acoustic stressors. We do not anticipate
those behavioral responses to result in fitness consequences to any individuals and therefore, we
do not expect acoustic stressors to result in substantial changes in reproduction, numbers, or
distribution of these populations. This conclusion is further supported by Monnahan et al.
(2014a) which concluded that the ENP blue whale population has likely reached carrying
capacity despite decades of Navy training and testing activities, including MFA sonar, in the
Hawaii and Southern California Training Ranges.
6.7.1.2 Fin Whale
The NAEMO output estimates that fin whales will be exposed to sonar and other non-impulsive
acoustic stressors associated with training activities throughout the year. The unprocessed
estimate of exposure events above 120 dB SPL and the contribution of activities to these
exposures are provided in (Table 85). We do not rely on these potential exposures for our
jeopardy analysis, but include this information to illustrate the context of exposures of species to
non-impulsive acoustic sources. The low received level (approximately 120 dB SPL) from the
sonar at a distance exceeding approximately 54 mi. (100 km) is modeled as having some minor
behavioral effects although masking by other ambient sounds, such as other vocalizing whales
(Au et al. 2000b) or other potential biological sources (D’Spain and Batchelor 2006), make
reaction to the sound from sonar and other active sound sources by mysticetes at that distance
less likely.
464
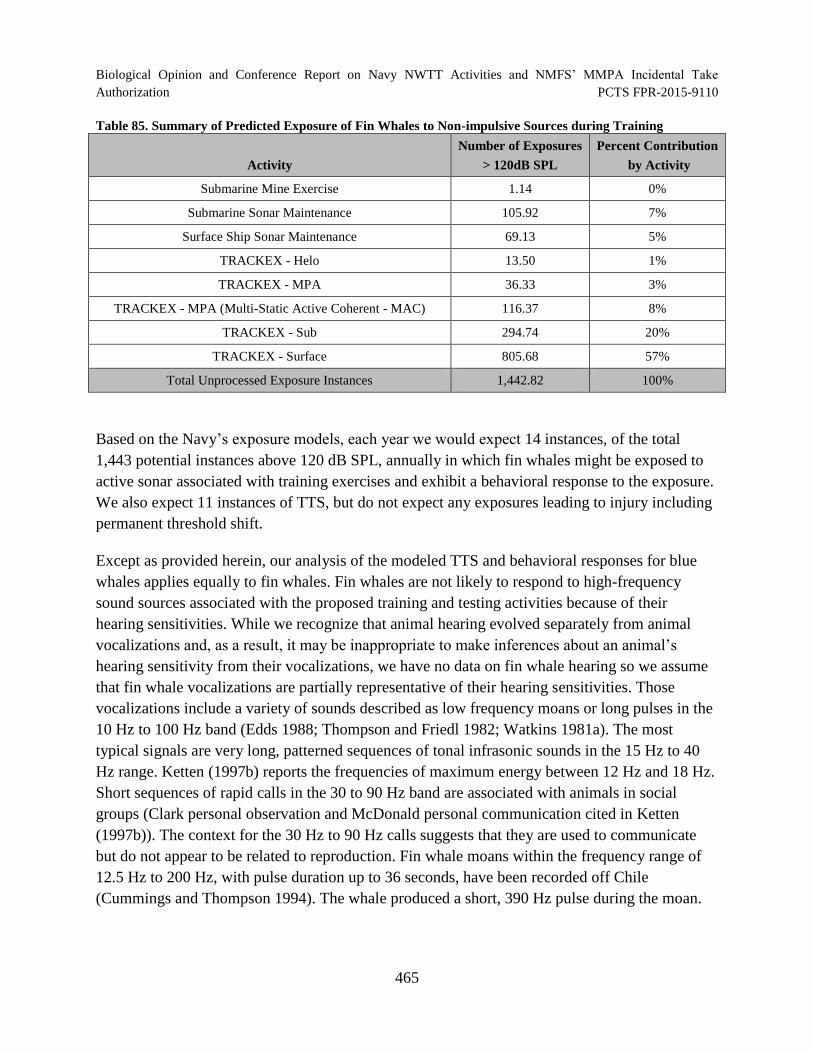
Biological Opinion and Conference Report on Navy NWTT Activities and NMFS’ MMPA Incidental Take Authorization PCTS FPR-2015-9110
Table 85. Summary of Predicted Exposure of Fin Whales to Non-impulsive Sources during Training
Activity
Number of Exposures
> 120dB SPL
Percent Contribution
by Activity
Submarine Mine Exercise 1.14 0%
Submarine Sonar Maintenance 105.92 7%
Surface Ship Sonar Maintenance 69.13 5%
TRACKEX - Helo 13.50 1%
TRACKEX - MPA 36.33 3%
TRACKEX - MPA (Multi-Static Active Coherent - MAC) 116.37 8%
TRACKEX - Sub 294.74 20%
TRACKEX - Surface 805.68 57%
Total Unprocessed Exposure Instances 1,442.82 100%
Based on the Navy’s exposure models, each year we would expect 14 instances, of the total
1,443 potential instances above 120 dB SPL, annually in which fin whales might be exposed to
active sonar associated with training exercises and exhibit a behavioral response to the exposure.
We also expect 11 instances of TTS, but do not expect any exposures leading to injury including
permanent threshold shift.
Except as provided herein, our analysis of the modeled TTS and behavioral responses for blue
whales applies equally to fin whales. Fin whales are not likely to respond to high-frequency
sound sources associated with the proposed training and testing activities because of their
hearing sensitivities. While we recognize that animal hearing evolved separately from animal
vocalizations and, as a result, it may be inappropriate to make inferences about an animal’s
hearing sensitivity from their vocalizations, we have no data on fin whale hearing so we assume
that fin whale vocalizations are partially representative of their hearing sensitivities. Those
vocalizations include a variety of sounds described as low frequency moans or long pulses in the
10 Hz to 100 Hz band (Edds 1988; Thompson and Friedl 1982; Watkins 1981a). The most
typical signals are very long, patterned sequences of tonal infrasonic sounds in the 15 Hz to 40
Hz range. Ketten (1997b) reports the frequencies of maximum energy between 12 Hz and 18 Hz.
Short sequences of rapid calls in the 30 to 90 Hz band are associated with animals in social
groups (Clark personal observation and McDonald personal communication cited in Ketten
(1997b)). The context for the 30 Hz to 90 Hz calls suggests that they are used to communicate
but do not appear to be related to reproduction. Fin whale moans within the frequency range of
12.5 Hz to 200 Hz, with pulse duration up to 36 seconds, have been recorded off Chile
(Cummings and Thompson 1994). The whale produced a short, 390 Hz pulse during the moan.
465
Biological Opinion and Conference Report on Navy NWTT Activities and NMFS’ MMPA Incidental Take
Authorization PCTS FPR-2015-9110
Results of studies on blue whales (Goldbogen et al. 2013) (Southall et al. 2011a), which have
similar auditory physiology compared to fin whales, indicate that some individuals hear some
sounds in the mid-frequency range and exhibit behavioral responses to sounds in this range
depending on received level and context. However, as described previously in this Opinion,
regarding the response of blue whales to MFA sonar, we expect any behavioral response to be
temporary and to not result in any fitness consequences to individual whales. Without more
specific information, we assume the response of fin whales to TTS to be similar to that of blue
whales. Additionally, several fin whales were tagged during the Southern California-10 BRS and
no obvious responses to the controlled exposure to a mid-frequency sound source were detected
by the visual observers or in the initial tag analysis (Southall et al. 2011a).
Further, work by Moore and Barlow (2011) indicate that since 1991, there is strong evidence of
increasing fin whale abundance in the California Current area, which includes the Southern
California Range Complex, an area in which Navy training and testing activities, including the
use of MFA sonar, have been ongoing for decades. The authors predict continued increases in fin
whale numbers over the next decade in that area, and that perhaps fin whale densities are
reaching “current ecosystem limits.” This indicates that any potential temporary behavioral
impacts on fin whales from the use of MFA during Navy training and testing activities have not
prevented fin whale numbers from increasing and potentially nearing ecosystem limits in
Southern California. Since training and testing activities in the NWTT Action Area are similar to
those in Southern California, we would expect the effects to be similar in the NWTT Action
Area and thus not a limiting factor in the recovery of fin whales. The TTS and behavioral
response estimates may change over baseline conditions from year to year, which could mean an
increase in the number of individual animals exposed per year or an increase in the number of
times per year some animals are exposed. However, the severity of individual responses, and the
consequences of those responses on the fitness of affected individuals, is not expected to change.
Non-impulsive acoustic stressors from Navy training exercises and testing activities conducted
during the five-year year period of the proposed MMPA Rule and into the reasonably foreseeable
future are not likely to significantly interact (exposure and response) with a sufficient number of
fin whales to reduce the viability or recovery of these populations. We anticipate temporary
behavioral responses, but do not anticipate any injury or mortality from acoustic stressors.
Therefore, we do not anticipate those behavioral responses to result in substantial changes in
reproduction, numbers, or distribution of these populations.
6.7.1.2.1 Humpback Whale
The NAEMO output estimates that humpback whales will be exposed to sonar and other non-
impulsive acoustic stressors associated with training activities throughout the year. The
unprocessed estimate of exposure events above 120 dB SPL and the contribution of activities to
466
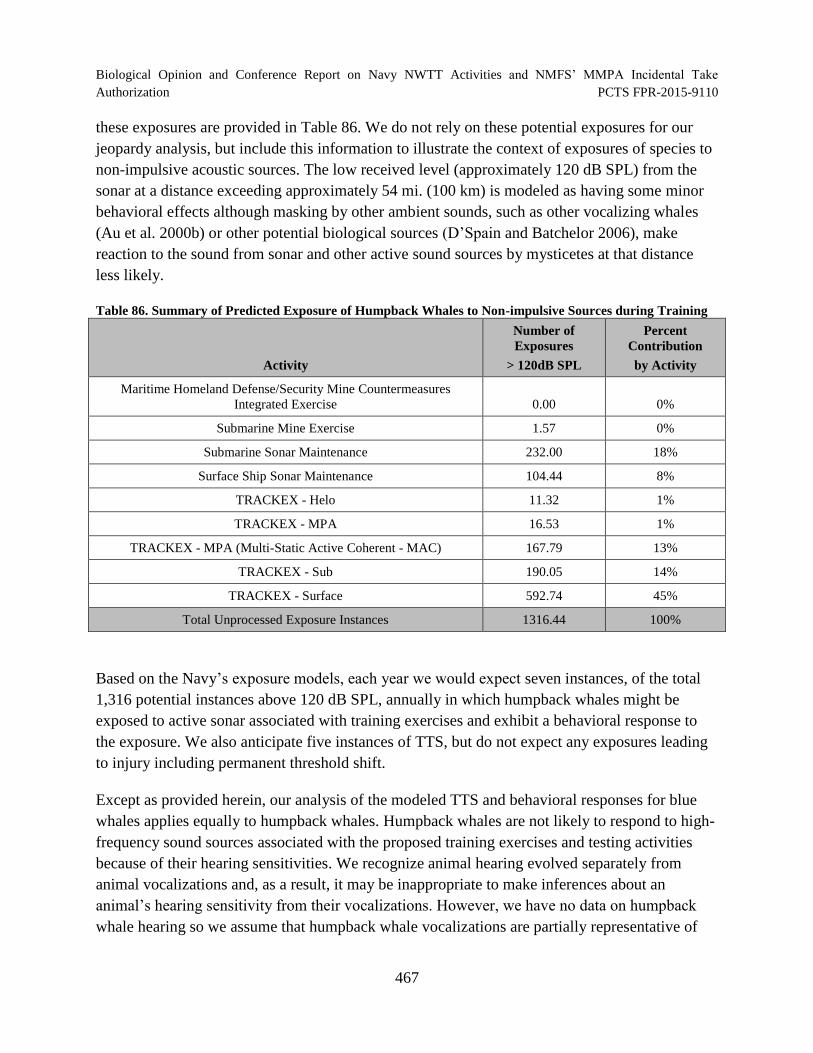
Biological Opinion and Conference Report on Navy NWTT Activities and NMFS’ MMPA Incidental Take
Authorization PCTS FPR-2015-9110
these exposures are provided in Table 86. We do not rely on these potential exposures for our
jeopardy analysis, but include this information to illustrate the context of exposures of species to
non-impulsive acoustic sources. The low received level (approximately 120 dB SPL) from the
sonar at a distance exceeding approximately 54 mi. (100 km) is modeled as having some minor
behavioral effects although masking by other ambient sounds, such as other vocalizing whales
(Au et al. 2000b) or other potential biological sources (D’Spain and Batchelor 2006), make
reaction to the sound from sonar and other active sound sources by mysticetes at that distance
less likely.
Table 86. Summary of Predicted Exposure of Humpback Whales to Non-impulsive Sources during Training
Activity
Number of
Exposures
> 120dB SPL
Percent
Contribution
by Activity
Maritime Homeland Defense/Security Mine Countermeasures
Integrated Exercise 0.00 0%
Submarine Mine Exercise 1.57 0%
Submarine Sonar Maintenance 232.00 18%
Surface Ship Sonar Maintenance 104.44 8%
TRACKEX - Helo 11.32 1%
TRACKEX - MPA 16.53 1%
TRACKEX - MPA (Multi-Static Active Coherent - MAC) 167.79 13%
TRACKEX - Sub 190.05 14%
TRACKEX - Surface 592.74 45%
Total Unprocessed Exposure Instances 1316.44 100%
Based on the Navy’s exposure models, each year we would expect seven instances, of the total
1,316 potential instances above 120 dB SPL, annually in which humpback whales might be
exposed to active sonar associated with training exercises and exhibit a behavioral response to
the exposure. We also anticipate five instances of TTS, but do not expect any exposures leading
to injury including permanent threshold shift.
Except as provided herein, our analysis of the modeled TTS and behavioral responses for blue
whales applies equally to humpback whales. Humpback whales are not likely to respond to high-
frequency sound sources associated with the proposed training exercises and testing activities
because of their hearing sensitivities. We recognize animal hearing evolved separately from
animal vocalizations and, as a result, it may be inappropriate to make inferences about an
animal’s hearing sensitivity from their vocalizations. However, we have no data on humpback
whale hearing so we assume that humpback whale vocalizations are partially representative of
467
Biological Opinion and Conference Report on Navy NWTT Activities and NMFS’ MMPA Incidental Take
Authorization PCTS FPR-2015-9110
their hearing sensitivities. As discussed in the Status of Listed Resources narrative for humpback
whales, these whales produce a wide variety of sounds.
Humpback whales vocalize less frequently in their summer feeding areas than in their winter
ranges at lower latitudes. Feeding groups produce distinctive sounds ranging from 20 Hz to 2
kHz, with median durations of 0.2 to 0.8 seconds and source levels of 175 to 192 dB (Thompson
et al. 1986b). These sounds are attractive and appear to rally animals to the feeding activity
(D'Vincent et al. 1985b; Sharpe and Dill 1997). To summarize, humpback whales produce at
least three kinds of sounds:
1. Complex songs with components ranging from 20Hz to 4 kHz with estimated source
levels from 144 to 174 dB; these are mostly sung by males on the breeding grounds
(Payne and McVay 1971; Winn et al. 1970)
2. Social sounds in the breeding areas that extend from 50Hz to more than 10 kHz with
most energy below 3 kHz (Richardson et al. 1995d; Tyack and Whitehead 1983); and
3. Feeding area vocalizations that are less frequent, but tend to be 20Hz to 2 kHz with
estimated source levels in excess of 175 dB re 1 µPa-m (Richardson et al. 1995d;
Thompson et al. 1986b). Sounds often associated with possible aggressive behavior by
males (Silber 1986; Tyack 1983) are quite different from songs, extending from 50 Hz to
10 kHz (or higher), with most energy in components below 3 kHz. These sounds appear
to have an effective range of up to 9 km (Tyack and Whitehead 1983).
Au et al. (2006b) conducted field investigations of humpback whale songs that led these
investigators to conclude that humpback whales have an upper frequency limit reaching as high
as 24 kHz. Based on this information, it is reasonable to assume that the active mid-frequency
sonar the U.S. Navy uses during active sonar training exercises and testing activities in the
NWTT Action Area are within the hearing and vocalization ranges of humpback whales. There
is limited information on how humpback whales are likely to respond upon being exposed to
mid-frequency active sonar (most of the information available addresses their probable responses
to low-frequency active sonar or impulsive sound sources). Maybaum (Maybaum 1993)
conducted sound playback experiments to assess the effects of mid-frequency active sonar on
humpback whales in Hawaiian waters. Specifically, she exposed focal pods to sounds of a 3.3
kHz sonar pulse, a sonar frequency sweep from 3.1 to 3.6 kHz, and a control (blank) tape while
monitoring their behavior, movement, and underwater vocalizations. The two types of sonar
signals differed in their effects on the humpback whales, although the whales exhibited
avoidance behavior when exposed to both sounds. The whales responded to the sounds by
increasing their distance from the sound; however, the frequency or duration of their dives or the
rate of underwater vocalizations did not change. Similar to the conclusions drawn regarding
responses of blue whales to MFA sonar, we expect any behavioral response to be temporary and
to not result in any fitness consequences to individual humpback whales. Without more specific
468
Biological Opinion and Conference Report on Navy NWTT Activities and NMFS’ MMPA Incidental Take
Authorization PCTS FPR-2015-9110
information, we assume the response of humpback whales to TTS to be similar to that of blue
whales.
Humpback whales have been known to react to low frequency industrial noises at estimated
received levels of 115 to 124 dB (Malme et al. 1985), and to calls of other humpback whales at
received levels as low as 102 dB (Frankel et al. 1995). Malme et al. (1985) found no clear
response to playbacks of drill ship and oil production platform noises at received levels up to 116
dB re 1 Pa. Studies of reactions to airgun noises were inconclusive (Malme et al. 1985).
Humpback whales on the breeding grounds did not stop singing in response to underwater
explosions (Payne and McVay 1971). Humpback whales on feeding grounds did not alter short-
term behavior or distribution in response to explosions with received levels of about 150 dB re 1
Pa/Hz at 350 Hz (Lien et al. 1993; Todd et al. 1996b). However, at least two individuals were
probably killed by the high-intensity, impulse blasts and had extensive mechanical injuries in
their ears (Ketten et al. 1993; Todd et al. 1996b). The explosions may also have increased the
number of humpback whales entangled in fishing nets (Todd et al. 1996b). Frankel and Clark
(1998) showed that breeding humpbacks showed only a slight statistical reaction to playbacks of
60 to 90 Hz sounds with a received level of up to 190 dB. Although these studies have
demonstrated that humpback whales will exhibit short-term behavioral reactions to boat traffic
and playbacks of industrial noise, the long-term effects of these disturbances on the individuals
exposed to them are not known. Humpback whales in Stellwagen Bank National Marine
Sanctuary reduced their calling rates coincident with an Ocean Acoustic Waveguide Remote
Sensing experiment 200 km away with FM pulses centered at 415, 734, and 949 Hz (Risch et al.
2012). However, Gong et al. (2014), disputes these findings, suggesting that Risch et al. (2012)
mistakes natural variations in humpback whale song occurrence for changes caused by OAWRS
activity approximately 200 km away. Risch et al. (2014) responded to Gong et al. (2014) and
highlighted the context-dependent nature of behavioral responses to acoustic stressors.
The overall abundance of humpback whales in the Pacific has continued to increase. The TTS
and behavioral response estimates may change from year to year over baseline conditions, which
could mean an increase in the number of individual animals exposed per year or an increase in
the number of times per year some animals are exposed. However, the severity of individual
responses, and the consequences of those responses on the fitness of affected individuals, is not
expected to change.
Acoustic stressors from Navy training and testing activities conducted during the five-year
period of the proposed MMPA Rule and into the reasonably foreseeable future are not likely to
significantly interact (exposure and response) with a sufficient number of humpback whales to
reduce the viability of these populations or adversely impact species recovery. We anticipate
temporary behavioral responses, but do not anticipate any injury or mortality from acoustic
469
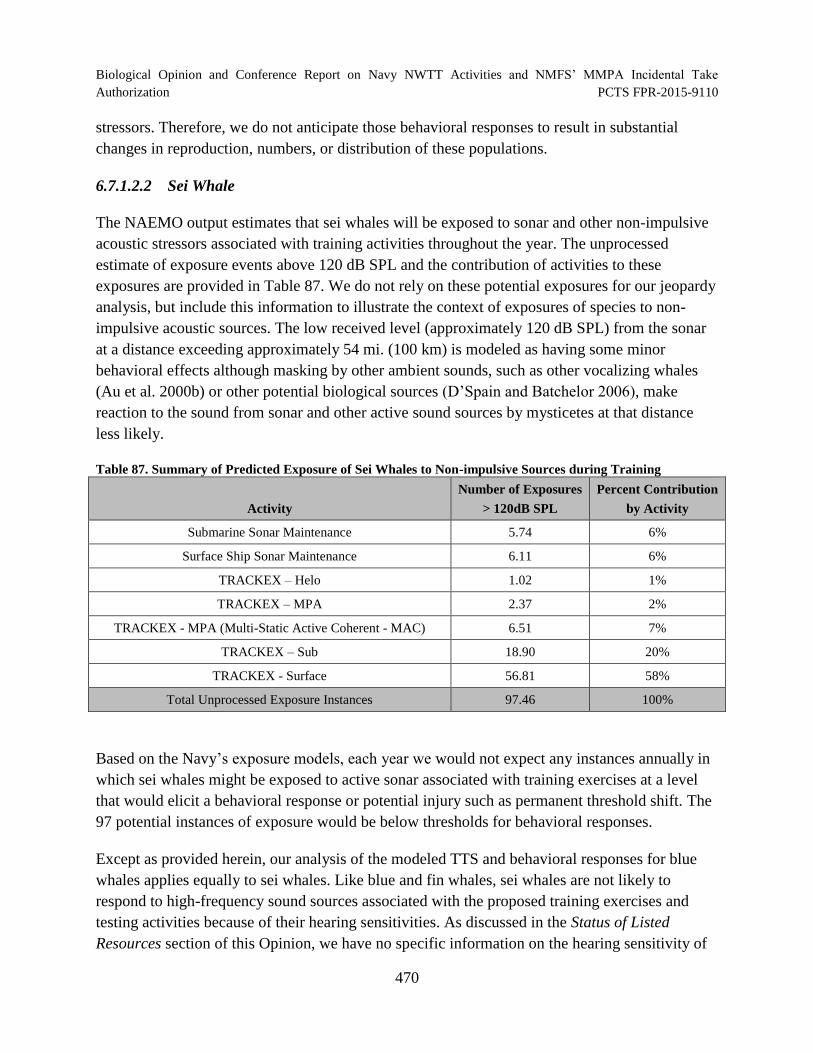
Biological Opinion and Conference Report on Navy NWTT Activities and NMFS’ MMPA Incidental Take
Authorization PCTS FPR-2015-9110
stressors. Therefore, we do not anticipate those behavioral responses to result in substantial
changes in reproduction, numbers, or distribution of these populations.
6.7.1.2.2 Sei Whale
The NAEMO output estimates that sei whales will be exposed to sonar and other non-impulsive
acoustic stressors associated with training activities throughout the year. The unprocessed
estimate of exposure events above 120 dB SPL and the contribution of activities to these
exposures are provided in Table 87. We do not rely on these potential exposures for our jeopardy
analysis, but include this information to illustrate the context of exposures of species to non-
impulsive acoustic sources. The low received level (approximately 120 dB SPL) from the sonar
at a distance exceeding approximately 54 mi. (100 km) is modeled as having some minor
behavioral effects although masking by other ambient sounds, such as other vocalizing whales
(Au et al. 2000b) or other potential biological sources (D’Spain and Batchelor 2006), make
reaction to the sound from sonar and other active sound sources by mysticetes at that distance
less likely.
Table 87. Summary of Predicted Exposure of Sei Whales to Non-impulsive Sources during Training
Activity
Number of Exposures
> 120dB SPL
Percent Contribution
by Activity
Submarine Sonar Maintenance 5.74 6%
Surface Ship Sonar Maintenance 6.11 6%
TRACKEX – Helo 1.02 1%
TRACKEX – MPA 2.37 2%
TRACKEX - MPA (Multi-Static Active Coherent - MAC) 6.51 7%
TRACKEX – Sub 18.90 20%
TRACKEX - Surface 56.81 58%
Total Unprocessed Exposure Instances 97.46 100%
Based on the Navy’s exposure models, each year we would not expect any instances annually in
which sei whales might be exposed to active sonar associated with training exercises at a level
that would elicit a behavioral response or potential injury such as permanent threshold shift. The
97 potential instances of exposure would be below thresholds for behavioral responses.
Except as provided herein, our analysis of the modeled TTS and behavioral responses for blue
whales applies equally to sei whales. Like blue and fin whales, sei whales are not likely to
respond to high-frequency sound sources associated with the proposed training exercises and
testing activities because of their hearing sensitivities. As discussed in the Status of Listed
Resources section of this Opinion, we have no specific information on the hearing sensitivity of
470
Biological Opinion and Conference Report on Navy NWTT Activities and NMFS’ MMPA Incidental Take
Authorization PCTS FPR-2015-9110
sei whales. Based on their anatomical and physiological similarities to both blue and fin whales,
we assume that the hearing thresholds of sei whales will be similar as well and will be centered
on low-frequencies in the 10 to 200 Hz.
Results of studies on blue whales (Goldbogen et al. 2013; Southall et al. 2011a), which have
similar auditory physiology compared to sei whales, indicate that some individuals hear some
sounds in the mid-frequency range and exhibit behavioral responses to sounds in this range
depending on received level and context. However, as we discussed in the response of blue
whales to MFA sonar, we expect any behavioral response to be temporary and to not result in
any fitness consequences to individual whales. Without more specific information, we assume
the response of sei whales to TTS to be similar to that of blue whales. The TTS and behavioral
response estimates may change from year to year over baseline conditions, which could mean an
increase in the number of individual animals exposed per year or an increase in the number of
times per year some animals are exposed. However, the severity of individual responses, and the
consequences of those responses on the fitness of affected individuals, is not expected to change.
Non-impulsive acoustic stressors from Navy training exercises and testing activities conducted
during the five-year period of the proposed MMPA Rule and into the reasonably foreseeable
future are not likely to significantly interact (exposure and response) with a sufficient number of
sei whales to reduce the viability of these populations or their ability to recover. We anticipate
temporary behavioral responses from training activities, but do not anticipate any injury or
mortality from acoustic stressors. We do not anticipate those behavioral responses to rise to the
level of take or to result in changes in reproduction, numbers, or distribution of these
populations.
6.7.1.2.3 Sperm Whale
The NAEMO output estimates that sperm whales will be exposed to sonar and other non-
impulsive acoustic stressors associated with training activities throughout the year. The
unprocessed estimate of exposure events above 120 dB SPL and the contribution of activities to
these exposures are provided in Table 88. We do not rely on these potential exposures for our
jeopardy analysis, but include this information to illustrate the context of exposures of species to
non-impulsive acoustic sources. The vast majority of exposure instances are at received levels
that are not likely to result in significant behavioral responses or higher level effects. In other
words, the number of exposures that may result in a take is a small subset of the total estimated
exposure instances that are expected. In other words, stressors from the Environmental Baseline
and these acoustic stressors that by themselves do not result in significant behavioral responses,
are present in the environment (baseline) and may or may not elicit minor responses such as
alerting animals to pending danger such as exposure to higher-level acoustic stressors that may
result or simply adding to ocean noise levels.
471
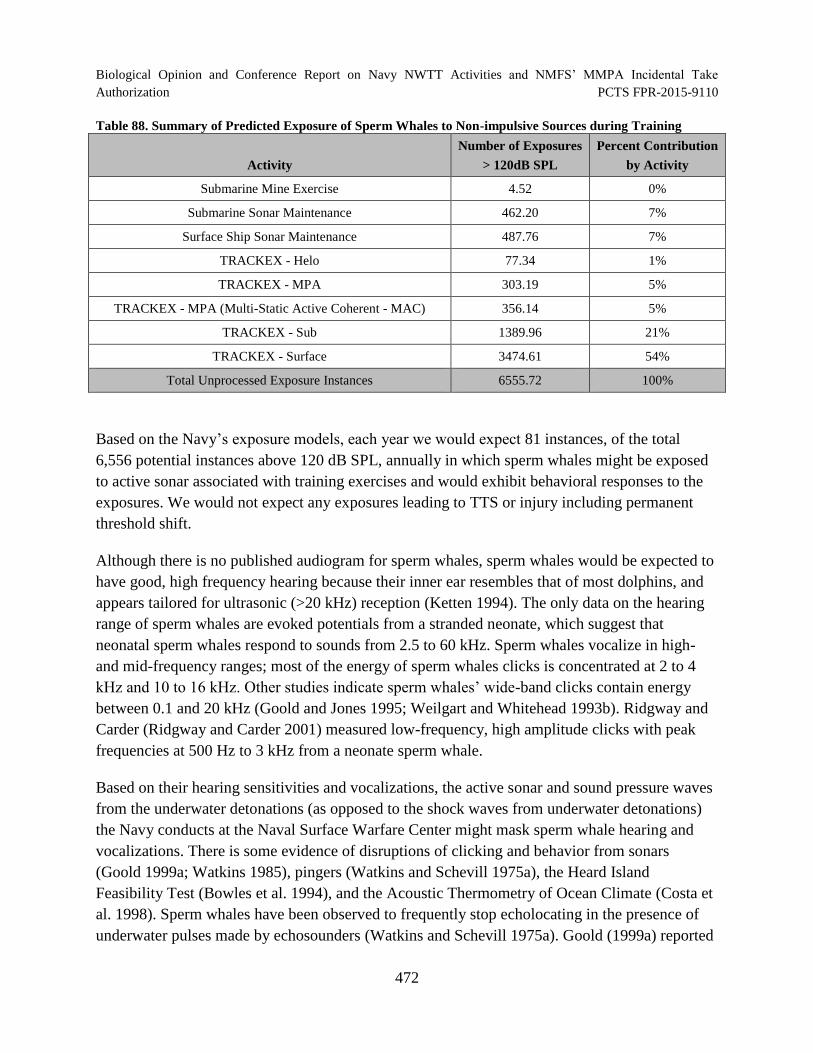
Biological Opinion and Conference Report on Navy NWTT Activities and NMFS’ MMPA Incidental Take Authorization PCTS FPR-2015-9110
Table 88. Summary of Predicted Exposure of Sperm Whales to Non-impulsive Sources during Training
Activity
Number of Exposures
> 120dB SPL
Percent Contribution
by Activity
Submarine Mine Exercise 4.52 0%
Submarine Sonar Maintenance 462.20 7%
Surface Ship Sonar Maintenance 487.76 7%
TRACKEX - Helo 77.34 1%
TRACKEX - MPA 303.19 5%
TRACKEX - MPA (Multi-Static Active Coherent - MAC) 356.14 5%
TRACKEX - Sub 1389.96 21%
TRACKEX - Surface 3474.61 54%
Total Unprocessed Exposure Instances 6555.72 100%
Based on the Navy’s exposure models, each year we would expect 81 instances, of the total
6,556 potential instances above 120 dB SPL, annually in which sperm whales might be exposed
to active sonar associated with training exercises and would exhibit behavioral responses to the
exposures. We would not expect any exposures leading to TTS or injury including permanent
threshold shift.
Although there is no published audiogram for sperm whales, sperm whales would be expected to
have good, high frequency hearing because their inner ear resembles that of most dolphins, and
appears tailored for ultrasonic (>20 kHz) reception (Ketten 1994). The only data on the hearing
range of sperm whales are evoked potentials from a stranded neonate, which suggest that
neonatal sperm whales respond to sounds from 2.5 to 60 kHz. Sperm whales vocalize in high-
and mid-frequency ranges; most of the energy of sperm whales clicks is concentrated at 2 to 4
kHz and 10 to 16 kHz. Other studies indicate sperm whales’ wide-band clicks contain energy
between 0.1 and 20 kHz (Goold and Jones 1995; Weilgart and Whitehead 1993b). Ridgway and
Carder (Ridgway and Carder 2001) measured low-frequency, high amplitude clicks with peak
frequencies at 500 Hz to 3 kHz from a neonate sperm whale.
Based on their hearing sensitivities and vocalizations, the active sonar and sound pressure waves
from the underwater detonations (as opposed to the shock waves from underwater detonations)
the Navy conducts at the Naval Surface Warfare Center might mask sperm whale hearing and
vocalizations. There is some evidence of disruptions of clicking and behavior from sonars
(Goold 1999a; Watkins 1985), pingers (Watkins and Schevill 1975a), the Heard Island
Feasibility Test (Bowles et al. 1994), and the Acoustic Thermometry of Ocean Climate (Costa et
al. 1998). Sperm whales have been observed to frequently stop echolocating in the presence of
underwater pulses made by echosounders (Watkins and Schevill 1975a). Goold (1999a) reported
472
Biological Opinion and Conference Report on Navy NWTT Activities and NMFS’ MMPA Incidental Take
Authorization PCTS FPR-2015-9110
six sperm whales that were driven through a narrow channel using ship noise, echosounder, and
fish finder emissions from a flotilla of 10 vessels. Watkins and Scheville (Watkins and Schevill
1975a) showed that sperm whales interrupted click production in response to pinger (6 to 13
kHz) sounds. They also stopped vocalizing for brief periods when codas were being produced by
other individuals, perhaps because they can hear better when not vocalizing themselves (Goold
and Jones 1995).
Sperm whales have been reported to have reacted to military sonar, apparently produced by a
submarine, by dispersing from social aggregations, moving away from the sound source,
remaining relatively silent and becoming difficult to approach (Watkins 1985). Captive
bottlenose dolphins and a white whale exhibited changes in behavior when exposed to 1 sec
pulsed sounds at frequencies similar to those emitted by multi-beam sonar that is used in
geophysical surveys (Ridgway and Carder 1997; Schlundt et al. 2000b), and to shorter
broadband pulsed signals (Finneran et al. 2000a; Finneran et al. 2002). Behavioral changes
typically involved what appeared to be deliberate attempts to avoid the sound exposure or to
avoid the location of the exposure site during subsequent tests (Finneran et al. 2002; Schlundt et
al. 2000b). Dolphins exposed to 1-sec intense tones exhibited short-term changes in behavior
above received sound levels of 178 to 193 dB re 1 Parms and belugas did so at received levels of
180 to 196 dB and above. Received levels necessary to elicit such reactions to shorter pulses
were higher (Finneran et al. 2000a; Finneran et al. 2002). Test animals sometimes vocalized after
exposure to pulsed, mid-frequency sound from a watergun (Finneran et al. 2002). In some
instances, animals exhibited aggressive behavior toward the test apparatus (Ridgway and Carder
1997; Schlundt et al. 2000b). The relevance of these data to free-ranging odontocetes is
uncertain. In the wild, cetaceans sometimes avoid sound sources well before they are exposed to
the levels listed above, and reactions in the wild may be more subtle than those described by
Ridgway et al. (1997) and Schlundt et al. (2000b).
Other studies identify instances in which sperm whales did not respond to anthropogenic sounds.
Sperm whales did not alter their vocal activity when exposed to levels of 173 dB re 1 Pa from
impulsive sounds produced by 1 g TNT detonators (Madsen and Mohl 2000). Richardson et al.
(1995d) citing a personal communication with J. Gordon suggested that sperm whales in the
Mediterranean Sea continued calling when exposed to frequent and strong military sonar signals.
When Andre et al. (1997) exposed sperm whales to a variety of sounds to determine what sounds
may be used to scare whales out of the path of vessels, sperm whales were observed to have
startle reactions to 10 kHz pulses (180 dB re 1 Pa at the source), but not to the other sources
played to them.
Published reports identify instances in which sperm whales have responded to an acoustic source
and other instances in which they did not appear to respond behaviorally when exposed to
seismic surveys. Mate et al. (1994) reported an opportunistic observation of the number of sperm
473
Biological Opinion and Conference Report on Navy NWTT Activities and NMFS’ MMPA Incidental Take
Authorization PCTS FPR-2015-9110
whales to have decreased in an area after the start of airgun seismic testing. However, Davis et
al. (2000) noted that sighting frequency did not differ significantly among the different acoustic
levels examined in the northern Gulf of Mexico, contrary to what Mate et al. (1994) reported.
Sperm whales may also have responded to seismic airgun sounds by ceasing to call during some
(but not all) times when seismic pulses were received from an airgun array >300 km away
(Bowles et al. 1994).
A study offshore of northern Norway indicated that sperm whales continued to call when
exposed to pulses from a distant seismic vessel. Received levels of the seismic pulses were up to
146 dB re 1 Pa peak-to-peak (Madsen et al. 2002). Similarly, a study conducted off Nova
Scotia that analyzed recordings of sperm whale sounds at various distances from an active
seismic program did not detect any obvious changes in the distribution or behavior of sperm
whales (McCall-Howard 1999). Recent data from vessel-based monitoring programs in United
Kingdom waters suggest that sperm whales in that area may have exhibited some changes in
behavior in the presence of operating seismic vessels (Stone 1997; Stone 1998; Stone 2000;
Stone 2001; Stone 2003). However, the compilation and analysis of the data led the author to
conclude that seismic surveys did not result in observable effects to sperm whales (Stone 2003).
The results from these waters seem to show that some sperm whales tolerate seismic surveys.
These studies suggest that the behavioral responses of sperm whales to anthropogenic sounds are
highly variable, but do not appear to result in the death or injury of individual whales or result in
reductions in the fitness of individuals involved. Responses of sperm whales to anthropogenic
sounds probably depend on the age and sex of animals being exposed, as well as other factors.
There is evidence that many individuals respond to certain sound sources, provided the received
level is high enough to evoke a response, while other individuals do not.
6.7.1.2.4 Southern Resident Killer Whale
The NAEMO output estimates that Southern Resident killer whales will be exposed to sonar and
other non-impulsive acoustic stressors associated with training activities throughout the year.
The unprocessed estimate of exposure events above 120 dB SPL and the contribution of
activities to these exposures are provided in Table 89. We do not rely on these potential
exposures for our jeopardy analysis, but include this information to illustrate the context of
exposures of species to non-impulsive acoustic sources. The vast majority of exposure instances
are at received levels that are not likely to result in significant behavioral responses or higher
level effects. In other words, the number of exposures that may result in a take is a small subset
of the total estimated exposure instances that are expected. In other words, stressors from the
Environmental Baseline and these acoustic stressors that by themselves do not result in
significant behavioral responses, are present in the environment (baseline) and may or may not
474
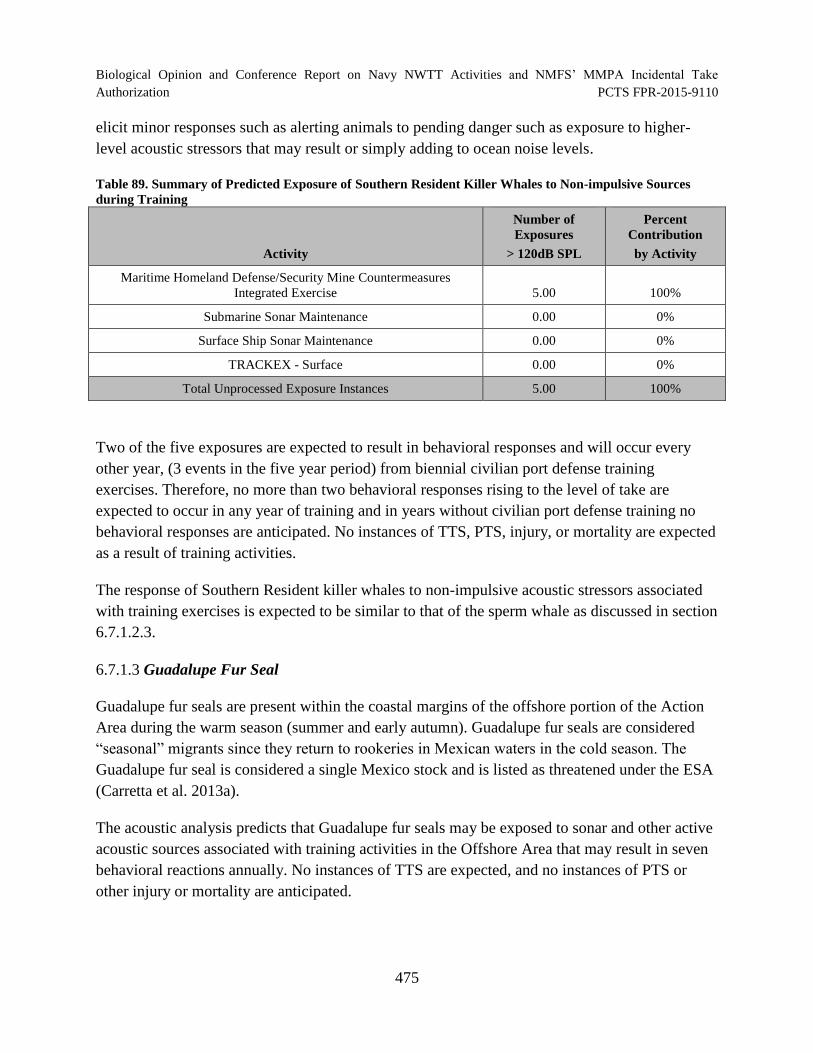
Biological Opinion and Conference Report on Navy NWTT Activities and NMFS’ MMPA Incidental Take
Authorization PCTS FPR-2015-9110
elicit minor responses such as alerting animals to pending danger such as exposure to higher-
level acoustic stressors that may result or simply adding to ocean noise levels.
Table 89. Summary of Predicted Exposure of Southern Resident Killer Whales to Non-impulsive Sources
during Training
Activity
Number of
Exposures
> 120dB SPL
Percent
Contribution
by Activity
Maritime Homeland Defense/Security Mine Countermeasures
Integrated Exercise 5.00 100%
Submarine Sonar Maintenance 0.00 0%
Surface Ship Sonar Maintenance 0.00 0%
TRACKEX - Surface 0.00 0%
Total Unprocessed Exposure Instances 5.00 100%
Two of the five exposures are expected to result in behavioral responses and will occur every
other year, (3 events in the five year period) from biennial civilian port defense training
exercises. Therefore, no more than two behavioral responses rising to the level of take are
expected to occur in any year of training and in years without civilian port defense training no
behavioral responses are anticipated. No instances of TTS, PTS, injury, or mortality are expected
as a result of training activities.
The response of Southern Resident killer whales to non-impulsive acoustic stressors associated
with training exercises is expected to be similar to that of the sperm whale as discussed in section
6.7.1.2.3.
6.7.1.3 Guadalupe Fur Seal
Guadalupe fur seals are present within the coastal margins of the offshore portion of the Action
Area during the warm season (summer and early autumn). Guadalupe fur seals are considered
“seasonal” migrants since they return to rookeries in Mexican waters in the cold season. The
Guadalupe fur seal is considered a single Mexico stock and is listed as threatened under the ESA
(Carretta et al. 2013a).
The acoustic analysis predicts that Guadalupe fur seals may be exposed to sonar and other active
acoustic sources associated with training activities in the Offshore Area that may result in seven
behavioral reactions annually. No instances of TTS are expected, and no instances of PTS or
other injury or mortality are anticipated.
475
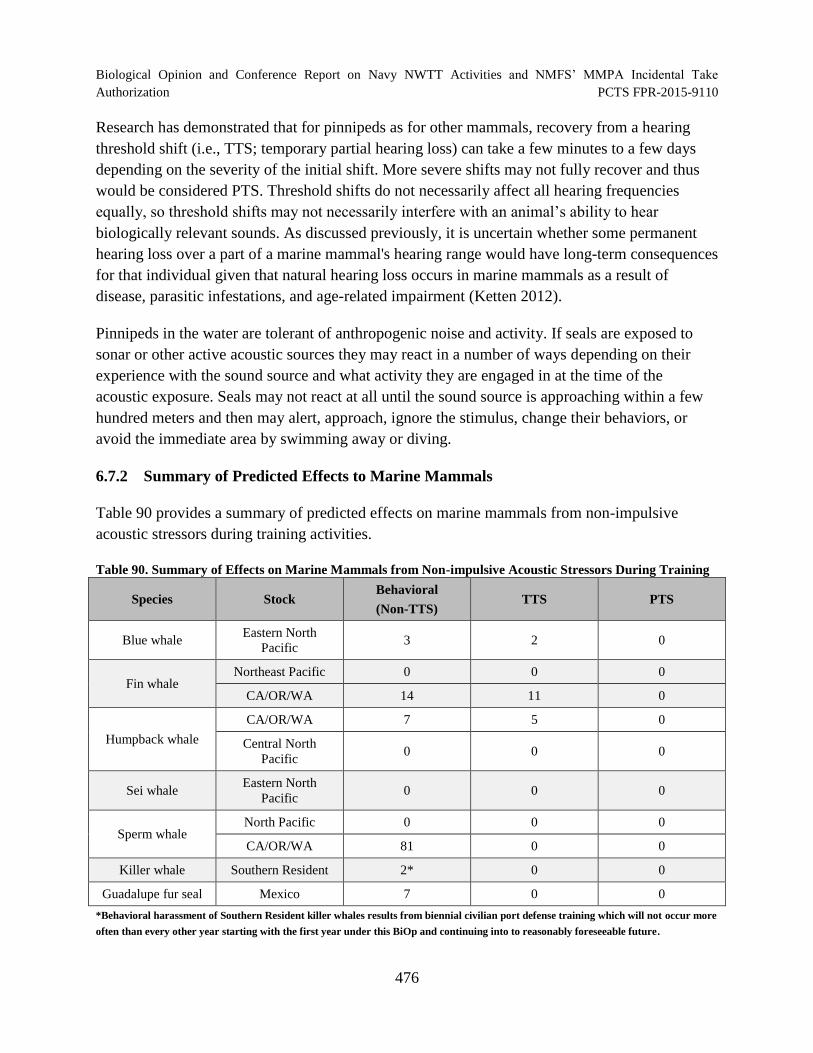
Biological Opinion and Conference Report on Navy NWTT Activities and NMFS’ MMPA Incidental Take
Authorization PCTS FPR-2015-9110
Research has demonstrated that for pinnipeds as for other mammals, recovery from a hearing
threshold shift (i.e., TTS; temporary partial hearing loss) can take a few minutes to a few days
depending on the severity of the initial shift. More severe shifts may not fully recover and thus
would be considered PTS. Threshold shifts do not necessarily affect all hearing frequencies
equally, so threshold shifts may not necessarily interfere with an animal’s ability to hear
biologically relevant sounds. As discussed previously, it is uncertain whether some permanent
hearing loss over a part of a marine mammal's hearing range would have long-term consequences
for that individual given that natural hearing loss occurs in marine mammals as a result of
disease, parasitic infestations, and age-related impairment (Ketten 2012).
Pinnipeds in the water are tolerant of anthropogenic noise and activity. If seals are exposed to
sonar or other active acoustic sources they may react in a number of ways depending on their
experience with the sound source and what activity they are engaged in at the time of the
acoustic exposure. Seals may not react at all until the sound source is approaching within a few
hundred meters and then may alert, approach, ignore the stimulus, change their behaviors, or
avoid the immediate area by swimming away or diving.
6.7.2 Summary of Predicted Effects to Marine Mammals
Table 90 provides a summary of predicted effects on marine mammals from non-impulsive
acoustic stressors during training activities.
Table 90. Summary of Effects on Marine Mammals from Non-impulsive Acoustic Stressors During Training
Species Stock Behavioral
(Non-TTS) TTS PTS
Blue whale Eastern North
Pacific 3 2 0
Fin whale Northeast Pacific 0 0 0
CA/OR/WA 14 11 0
CA/OR/WA 7 5 0
Humpback whale Central North
Pacific 0 0 0
Sei whale Eastern North
Pacific 0 0 0
Sperm whale North Pacific 0 0 0
CA/OR/WA 81 0 0
Killer whale Southern Resident 2* 0 0
Guadalupe fur seal Mexico 7 0 0
*Behavioral harassment of Southern Resident killer whales results from biennial civilian port defense training which will not occur more
often than every other year starting with the first year under this BiOp and continuing into to reasonably foreseeable future.
476
Biological Opinion and Conference Report on Navy NWTT Activities and NMFS’ MMPA Incidental Take
Authorization PCTS FPR-2015-9110
6.7.3 Exposure and Response of Leatherback Sea Turtles to Non-Impulsive Acoustic
Stressors – Training Activities
For this consultation, we considered exposure estimates from the Navy Acoustic Effects Model
(NAEMO) at two output points. First, the total number of ESA-listed species (animats) that
would be exposed to acoustic sources greater than 120 dB prior to the application of a dose-
response curve or criteria. We term these the “unprocessed” estimates. This estimate is the
number of times individual animats or animals are likely to be exposed to the acoustic
environment that is a result of training exercises and testing activities, regardless of whether they
are “taken” as a result of that exposure. In most cases, the number of animals “taken” by an
action would be a subset of the number of animals that are exposed to the action because (1) in
some circumstances, animals might not respond to an exposure and (2) some responses may be
negative for an individual animal without constituting a form of “take” (for example, some
physiological stress responses only have fitness consequences when they are sustained and
would only constitute a “take” as a result of cumulative exposure).
The second set of predicted exposures (“processed”) of listed species were generated and
processed using dose-response curves and criteria for temporary and permanent threshold shift
developed by the Navy and NMFS. Neither sets of exposure estimates, the unprocessed or
processed, consider standard mitigation actions to avoid marine mammals, nor did the estimates
consider any avoidance responses that might be taken by individual animals once they sense the
presence of Navy vessels or aircraft or the stressor.
Most Navy sonar and other active acoustic sources used during training and testing in the NWTT
Action Area use frequency ranges that are higher than the estimated hearing range of sea turtles
(10 Hz to 2 kHz). Therefore, most of these sources have no impact on sea turtle hearing. It is
likely that only sonar with source levels greater than 160 dB re 1 μPa at 1 m using frequencies
within the hearing range of sea turtles have potential for acoustic impacts on sea turtles that may
lead to take pursuant to the ESA. Other active acoustic sources with low source level, narrow
beam width, downward-directed transmission, short pulse lengths, frequencies above known
hearing ranges, or some combination of these factors are not anticipated to result in impacts on
sea turtles. These sources generally have frequencies greater than 200 kHz and source levels less
than 160 dB re 1 μPa. The types of sources with source levels less than 160 dB are primarily
hand-held sonar, range pingers, transponders, and acoustic communication devices.
Sea turtles that reside in the Action Area may be exposed several times throughout the year to
sound from sonar and other active acoustic sources. Exposures to sonar and other active acoustic
sources in open water areas would be intermittent and geographically variable. The potential for
leatherback sea turtles to experience some form of hearing loss was predicted by the Navy using
the NAEMO. To quantify the impacts of acoustic exposures to sea turtles, training and testing
477

Biological Opinion and Conference Report on Navy NWTT Activities and NMFS’ MMPA Incidental Take
Authorization PCTS FPR-2015-9110
activities that employ acoustic sources using frequencies in the hearing range of sea turtles were
analyzed. Most Navy sonar and active acoustic sources used during testing and training activities
use frequencies that are outside of the estimated hearing range of turtles.
The model output estimates that leatherback sea turtles will be exposed to sonar and other non-
impulsive acoustic stressors associated with training activities throughout the year.
Table 91. Summary of Predicted Exposure of Leatherback Sea Turtles to Non-impulsive Sources during
Training
Activity
Number of Exposures
> 120dB SPL
Percent Contribution
by Activity
Submarine Mine Exercise 0.00 0%
Submarine Sonar Maintenance 0.00 0%
Surface Ship Sonar Maintenance 0.00 0%
TRACKEX - Helo 0.00 0%
TRACKEX - MPA 0.00 0%
TRACKEX - MPA (Multi-Static Active Coherent - MAC) 321.28 100%
TRACKEX - Sub 0.00 0%
TRACKEX - Surface 0.00 0%
Total Unprocessed Exposure Instances 321.28 100%
Our analysis based on Navy modeling indicates that leatherback sea turtles may be exposed
approximately 321 times annually to sonar and other active acoustic sources associated with
training activities in the Offshore Area of the NWTT Action Area. Of the total predicted
exposures above 120 dB SPL, these exposures are anticipated to result in one TTS exposure
annually. Zero sea turtles are predicted to experience PTS due to training with sonar and other
active acoustic sources, which would permanently reduce perception of sound within a limited
frequency range. We do not anticipate any instances of behavioral harassment above the
predicted instance of TTS.
Cues preceding the commencement of the event (e.g., vessel presence and movement, aircraft
overflight) may result in some animals departing the immediate area, even before active sound
sources begin transmitting. Avoidance behavior could reduce the sound exposure level
experienced by a sea turtle and therefore reduce the likelihood and degree of TTS predicted near
sound sources. In addition, PTS and TTS threshold criteria for sea turtles are conservatively
based on criteria developed for mid-frequency marine mammals. Therefore, actual TTS impacts
are expected to be substantially less than the predicted quantities.
478

Biological Opinion and Conference Report on Navy NWTT Activities and NMFS’ MMPA Incidental Take
Authorization PCTS FPR-2015-9110
Sea turtles may exhibit short-term behavioral reactions, such as swimming away or diving to
avoid the immediate area around a source, although studies examining sea turtle behavioral
responses to sound have used impulsive sources, not non-impulsive sources. In most cases,
acoustic exposures are intermittent, allowing time to recover from an incurred energetic cost,
resulting in no long-term consequence. These short-term intermittent behavioral reactions are not
expected to rise to the level of take.
6.7.4 Exposure and Response of Fish to Non-Impulsive Acoustic Stressors – Training
Activities
For the purposes of this consultation, the Navy and NMFS developed sound exposure criteria for
low and mid frequency sonar for fish (see section 6.5.8.1). Sound exposure criteria varied
depending on whether or not the species of fish has a swim bladder and whether or not the swim
bladder is involved in hearing. As discussed in Popper et al. (2014), fishes with swim bladders
near the ear that are involved in hearing generally have lower sound pressure thresholds than do
purely particle motion species. All fish considered in this Opinion have swim bladders that are
not involved in hearing (with the exception of eulachon which do not have a swim bladder and
are even less susceptible to injury or mortality from underwater sound) so our discussion and
analysis focuses on these criteria. The criteria developed are discussed in Section 3.1.3 and
shown in Section 6.5.8.1.
Threshold criteria were not developed for high frequency sonar sources. Only a few species of
shad within the Clupeidae family (herrings) are known to be able to detect high-frequency sonar
and other active acoustic sources greater than 10,000 Hz. The species considered in this Opinion
would not detect these sounds and would therefore experience no stress, behavioral disturbance,
or auditory masking. High-frequency sonar is not anticipated to cause mortality or injury due to
the lack of fast rise times, lack of high peak pressures, and the lack of high acoustic impulse.
Also, similar to low and mid-frequency sonar, mortality or injury have not been shown to occur
from exposure to high frequency sonar sources. For these reasons, the potential effects of high
frequency active sonar will not be discussed further in this Opinion.
While we present threshold criteria for mortality, mortal injury, and recoverable injury from
exposure to low and mid-frequency sonar, these effects are extremely unlikely to occur. Sonar is
not anticipated to cause mortality or injury due to the lack of fast rise times, lack of high peak
pressures, and the lack of high acoustic impulse. Additionally, exposure to low and mid-
frequency sonar has been tested and has not been shown to cause mortality or injury to any fish
with swim bladders (Kane et al. 2010; Popper et al. 2007). The values presented represent the
highest sound exposure levels which have been tested to date, none of which have resulted in
mortality or injury for fish with swim bladders not involved in hearing. All ESA-listed fish
considered in this Opinion have swim bladders not involved in hearing (with the exception of
479
Biological Opinion and Conference Report on Navy NWTT Activities and NMFS’ MMPA Incidental Take
Authorization PCTS FPR-2015-9110
eulachon which do not have swim bladders and are even less susceptible to injury or mortality
from underwater sound). The criteria developed were highly conservative. Therefore, we
conclude that ESA-listed fish species considered in this Opinion will not experience injury or
mortality from exposure to low and mid-frequency sonar.
Sonar has been shown to induce TTS in some fish species with swim bladders (Halvorsen et al.
2013; Halvorsen et al. 2012; Popper et al. 2007). As shown in Section 6.5.8.1, all fish within a
two meter radius of sources in the LF4 source bin (low-frequency sources equal to 180 dB and
up to 200 dB) and within 1 meter of sources in the ASW2 source bin (mid-frequency multi-static
active coherent sonobuoy) could experience TTS. Sources in the LF4 source bin are proposed to
be used for 110 hours and sources in the ASW2 source bin are proposed to be used for 64 hours
annually. Sonar use within the LF4 source bin will only occur during testing in inland waters.
Fish within two meters of the source could experience TTS. Sonar use with the ASW2 source bin
will occur during testing in the offshore environment, >12 nautical miles from shore. Fish within
one meter of this source could experience TTS.
However, any hearing loss would be temporary, and individuals would be expected to fully
recover shortly after exposure (Lombarte et al. 1993; Smith et al. 2006a). Additionally, the ESA-
listed species considered in this Opinion lack notable hearing specialization, minimizing the
likelihood of each instance of TTS affecting an individual’s fitness. To our knowledge, no
studies have examined the fitness implications when a fish, without notable hearing
specialization, experiences TTS. Popper et al. (2014) suggested that fishes experiencing TTS
may have a decreased ability to communicate, detect predators or prey, or assess their
environment. However, the species considered in this Opinion are able to rely on alternative
mechanisms (e.g., sight, lateral line system) to detect prey, avoid predators, spawn, and to orient
in the water column (Popper et al. 2014). Additionally, hearing is not thought to play a role in
salmon migration (e.g., Putnam et al. 2013). Because these species are able to rely on alternative
mechanisms for these essential life functions, instances of TTS would not increase the likelihood
of injury by annoying a fish to such an extent as to significantly disrupt normal behavioral
patterns, including breeding, feeding, or sheltering and would not rise to the level of take.
Therefore, the effect of exposure to acoustic stressors that may result in TTS is insignificant and
is not likely to adversely affect the ESA-listed fish species considered in this Opinion.
Available evidence indicates that sonar use in the Action Area would not have the potential to
substantially mask key environmental sounds for the ESA-listed fish species considered in this
Opinion. Mid-frequency sound sources would not mask environmental sounds for the fish
considered in this Opinion because these species are limited to detection of the particle motion
component of low-frequency sounds (DoN 2015c). Low frequency sonar usage could cause brief
periods of masking for fish within a few kilometers of the source while the source is active, but
the effects would be infrequent and transient as both the vessel and the individual fish are
480
Biological Opinion and Conference Report on Navy NWTT Activities and NMFS’ MMPA Incidental Take
Authorization PCTS FPR-2015-9110
moving while in the ocean environment. Popper et al. (2014) also noted that the narrow
bandwidth of most sonar signals would only result in a limited range of frequencies being
masked. Additionally, as noted previously, the species considered in this Opinion can utilize
other sensory cues (e.g., sight, particle motion detection) during the brief period in which low-
frequency sonar may be in close proximity to an individual. Therefore, the effect of exposure to
non-impulsive acoustic stressors from Navy activities is insignificant and is not likely to
adversely affect the ESA-listed fish species considered in this Opinion.
6.8 Exposure and Response – Non-Impulsive Acoustic Stressors - Testing
The following sections discuss our analysis of stressors that are likely to adversely affect ESA-
listed species. If a stressor is likely to adversely affect any of the ESA-listed species in the
NWTT Action Area, it is discussed further in this Section.
6.8.1 Exposure and Response of Marine Mammals to Non-Impulsive Acoustic Stressors –
Testing Activities
For this consultation, we considered exposure estimates from the Phase II NAEMO model at
several output points for marine mammals and sea turtles. First, we estimated the total number of
ESA-listed species (animats) that would be exposed to acoustic sources prior to the application
of a dose-response curve or criteria. We term these the “unprocessed” estimates. This estimate is
the number of times individual animats or animals are likely to be exposed to the acoustic
environment that is a result of testing exercises, regardless of whether they are “taken” as a result
of that exposure. In most cases, the number of animals “taken” by an action would be a subset of
the number of animals that are exposed to the action because (1) in some circumstances, animals
might not respond to an exposure or (2) some responses may be negative for an individual
animal without constituting a form of “take” (for example, some physiological stress responses
only have fitness consequences when they are sustained and would only constitute a “take” as a
result of cumulative exposure).
A second set of exposure estimates (“model-estimated”) of listed species were generated and
“processed” using dose-response curves and criteria for temporary and permanent threshold shift
developed by the Navy and NMFS’ Permits Division for the purpose of identifying harassment
pursuant to the MMPA. Neither sets of exposure estimates, the unprocessed or processed, were
adjusted to account for standard mitigation actions that NMFS’ Permits Division requires under
the MMPA rule and LOA to avoid marine mammals, nor were the estimates adjusted to account
for any avoidance responses that might be taken by individual animals once they sense the
presence of Navy vessels or aircraft. Since the processed exposure estimates represent incidental
take for purposes of the ESA, we base our jeopardy analyses and determinations on these
estimates. As stated above, these estimates were not adjusted to account for the standard
mitigation measures required under the MMPA rule or conducted by the Navy.
481
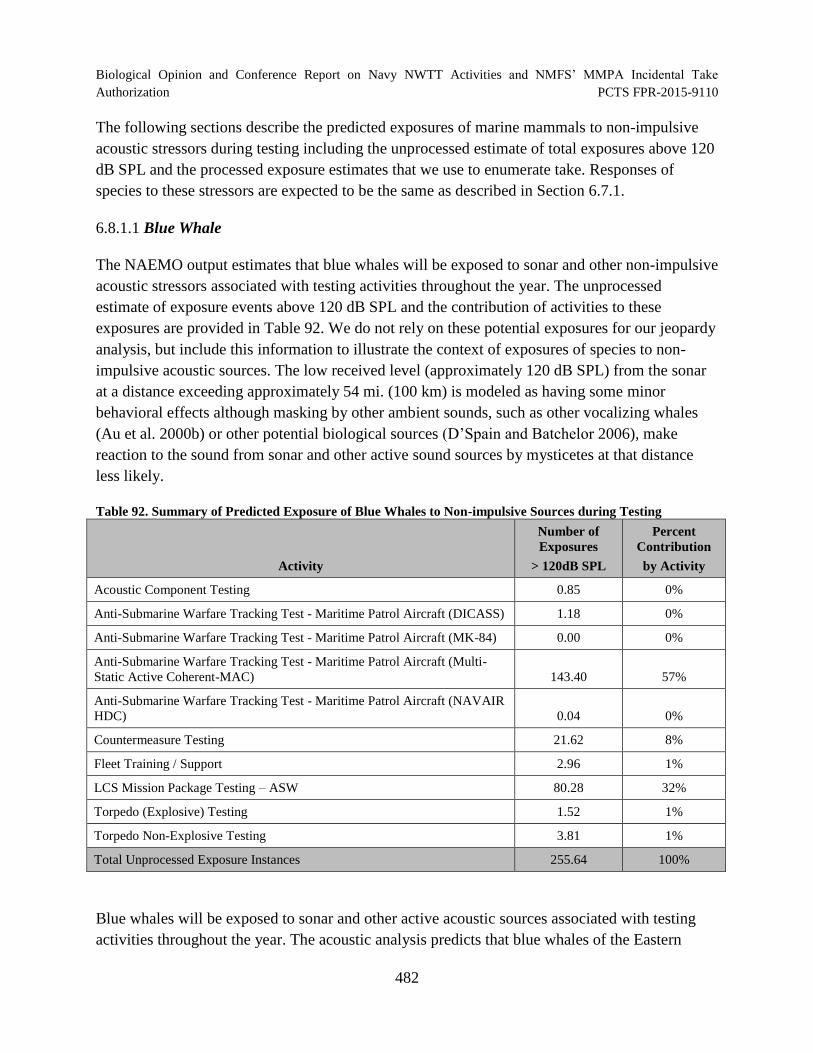
Biological Opinion and Conference Report on Navy NWTT Activities and NMFS’ MMPA Incidental Take
Authorization PCTS FPR-2015-9110
The following sections describe the predicted exposures of marine mammals to non-impulsive
acoustic stressors during testing including the unprocessed estimate of total exposures above 120
dB SPL and the processed exposure estimates that we use to enumerate take. Responses of
species to these stressors are expected to be the same as described in Section 6.7.1.
6.8.1.1 Blue Whale
The NAEMO output estimates that blue whales will be exposed to sonar and other non-impulsive
acoustic stressors associated with testing activities throughout the year. The unprocessed
estimate of exposure events above 120 dB SPL and the contribution of activities to these
exposures are provided in Table 92. We do not rely on these potential exposures for our jeopardy
analysis, but include this information to illustrate the context of exposures of species to non-
impulsive acoustic sources. The low received level (approximately 120 dB SPL) from the sonar
at a distance exceeding approximately 54 mi. (100 km) is modeled as having some minor
behavioral effects although masking by other ambient sounds, such as other vocalizing whales
(Au et al. 2000b) or other potential biological sources (D’Spain and Batchelor 2006), make
reaction to the sound from sonar and other active sound sources by mysticetes at that distance
less likely.
Table 92. Summary of Predicted Exposure of Blue Whales to Non-impulsive Sources during Testing
Activity
Number of
Exposures
> 120dB SPL
Percent
Contribution
by Activity
Acoustic Component Testing 0.85 0%
Anti-Submarine Warfare Tracking Test - Maritime Patrol Aircraft (DICASS) 1.18 0%
Anti-Submarine Warfare Tracking Test - Maritime Patrol Aircraft (MK-84) 0.00 0%
Anti-Submarine Warfare Tracking Test - Maritime Patrol Aircraft (Multi-
Static Active Coherent-MAC) 143.40 57%
Anti-Submarine Warfare Tracking Test - Maritime Patrol Aircraft (NAVAIR
HDC) 0.04 0%
Countermeasure Testing 21.62 8%
Fleet Training / Support 2.96 1%
LCS Mission Package Testing – ASW 80.28 32%
Torpedo (Explosive) Testing 1.52 1%
Torpedo Non-Explosive Testing 3.81 1%
Total Unprocessed Exposure Instances 255.64 100%
Blue whales will be exposed to sonar and other active acoustic sources associated with testing
activities throughout the year. The acoustic analysis predicts that blue whales of the Eastern
482
Biological Opinion and Conference Report on Navy NWTT Activities and NMFS’ MMPA Incidental Take
Authorization PCTS FPR-2015-9110
North Pacific stock may be exposed to sonar and other active acoustic sources associated with
testing activities in the Offshore Area that the 256 potential exposures above 120 dB SPL each
year may result in six TTS exposures annually. We do not anticipate any instances of injury
including PTS.
As we discussed in 6.7.1.1, Blue whales exposed to mid-frequency are less likely to produce low
frequency calls usually associated with feeding behavior (Melcon et al. 2012). It is not known
whether the lower rates of calling actually indicated a reduction in feeding behavior or social
contact since the study used data from remotely deployed, passive acoustic monitoring buoys. In
contrast, blue whales increased their likelihood of calling when ship noise was present, and
decreased their likelihood of calling in the presence of explosive noise, although this result was
not statistically significant (Melcon et al. 2012).
Additionally, the likelihood of an animal calling decreased with the increased received level of
mid-frequency sonar, beginning at a sound pressure level of approximately 110 to 120 dB re 1
µPa (Melcon et al. 2012). Preliminary results from the 2010 to 2011 field season of an ongoing
behavioral response study in Southern California waters indicated that in some cases and at low
received levels, tagged blue whales responded to mid-frequency sonar but that those responses
were mild and there was a quick return to their baseline activity (Southall et al. 2011a). Blue
whales responded to a mid-frequency sound source, with a source level between 160 and 210 dB
re 1 µPa at 1 m and a received sound level up to 160 dB re 1 µPa, by exhibiting generalized
avoidance responses and changes to dive behavior during CEEs (Goldbogen et al. 2013).
However, reactions were not consistent across individuals based on received sound levels alone,
and likely were the result of a complex interaction between sound exposure factors such as
proximity to sound source and sound type (mid-frequency sonar simulation vs. pseudo-random
noise), environmental conditions, and behavioral state. Surface feeding whales did not show a
change in behavior during CEEs, but deep feeding and non-feeding whales showed temporary
reactions that quickly abated after sound exposure. Whales were sometimes less than a mile from
the sound source during CEEs.
6.8.1.2 Fin Whale
The NAEMO output estimates that fin whales will be exposed to sonar and other non-impulsive
acoustic stressors associated with testing activities throughout the year. The unprocessed
estimate of exposure events above 120 dB SPL and the contribution of activities to these
exposures are provided in Table 93. We do not rely on these potential exposures for our jeopardy
analysis, but include this information to illustrate the context of exposures of species to non-
impulsive acoustic sources. The low received level (approximately 120 dB SPL) from the sonar
at a distance exceeding approximately 54 mi. (100 km) is modeled as having some minor
behavioral effects although masking by other ambient sounds, such as other vocalizing whales
483
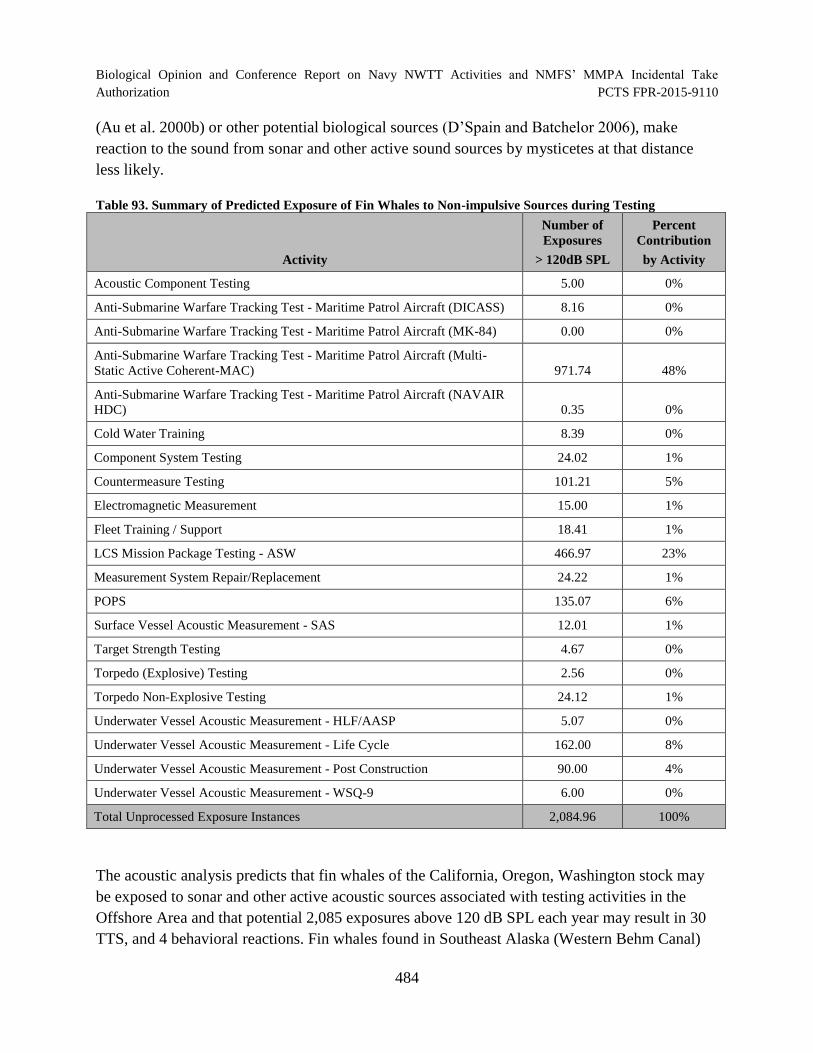
Biological Opinion and Conference Report on Navy NWTT Activities and NMFS’ MMPA Incidental Take
Authorization PCTS FPR-2015-9110
(Au et al. 2000b) or other potential biological sources (D’Spain and Batchelor 2006), make
reaction to the sound from sonar and other active sound sources by mysticetes at that distance
less likely.
Table 93. Summary of Predicted Exposure of Fin Whales to Non-impulsive Sources during Testing
Activity
Number of
Exposures
> 120dB SPL
Percent
Contribution
by Activity
Acoustic Component Testing 5.00 0%
Anti-Submarine Warfare Tracking Test - Maritime Patrol Aircraft (DICASS) 8.16 0%
Anti-Submarine Warfare Tracking Test - Maritime Patrol Aircraft (MK-84) 0.00 0%
Anti-Submarine Warfare Tracking Test - Maritime Patrol Aircraft (Multi-
Static Active Coherent-MAC) 971.74 48%
Anti-Submarine Warfare Tracking Test - Maritime Patrol Aircraft (NAVAIR
HDC) 0.35 0%
Cold Water Training 8.39 0%
Component System Testing 24.02 1%
Countermeasure Testing 101.21 5%
Electromagnetic Measurement 15.00 1%
Fleet Training / Support 18.41 1%
LCS Mission Package Testing - ASW 466.97 23%
Measurement System Repair/Replacement 24.22 1%
POPS 135.07 6%
Surface Vessel Acoustic Measurement - SAS 12.01 1%
Target Strength Testing 4.67 0%
Torpedo (Explosive) Testing 2.56 0%
Torpedo Non-Explosive Testing 24.12 1%
Underwater Vessel Acoustic Measurement - HLF/AASP 5.07 0%
Underwater Vessel Acoustic Measurement - Life Cycle 162.00 8%
Underwater Vessel Acoustic Measurement - Post Construction 90.00 4%
Underwater Vessel Acoustic Measurement - WSQ-9 6.00 0%
Total Unprocessed Exposure Instances 2,084.96 100%
The acoustic analysis predicts that fin whales of the California, Oregon, Washington stock may
be exposed to sonar and other active acoustic sources associated with testing activities in the
Offshore Area and that potential 2,085 exposures above 120 dB SPL each year may result in 30
TTS, and 4 behavioral reactions. Fin whales found in Southeast Alaska (Western Behm Canal)
484
Biological Opinion and Conference Report on Navy NWTT Activities and NMFS’ MMPA Incidental Take
Authorization PCTS FPR-2015-9110
are recognized as part of the Northeast Pacific stock. Furthermore, the acoustic analysis predicts
fin whales of the Northeast Pacific stock may be exposed to sonar and other active acoustic
sources associated with testing activities that may result in two behavioral reactions annually.
We do not anticipate any instances of injury including PTS.
6.8.1.3 Humpback Whale
The NAEMO output estimates that humpback whales will be exposed to sonar and other non-
impulsive acoustic stressors associated with testing activities throughout the year. The
unprocessed estimate of exposure events above 120 dB SPL and the contribution of activities to
these exposures are provided in Table 94. We do not rely on these potential exposures for our
jeopardy analysis, but include this information to illustrate the context of exposures of species to
non-impulsive acoustic sources. The low received level (approximately 120 dB SPL) from the
sonar at a distance exceeding approximately 54 mi. (100 km) is modeled as having some minor
behavioral effects although masking by other ambient sounds, such as other vocalizing whales
(Au et al. 2000b) or other potential biological sources (D’Spain and Batchelor 2006), make
reaction to the sound from sonar and other active sound sources by mysticetes at that distance
less likely.
485
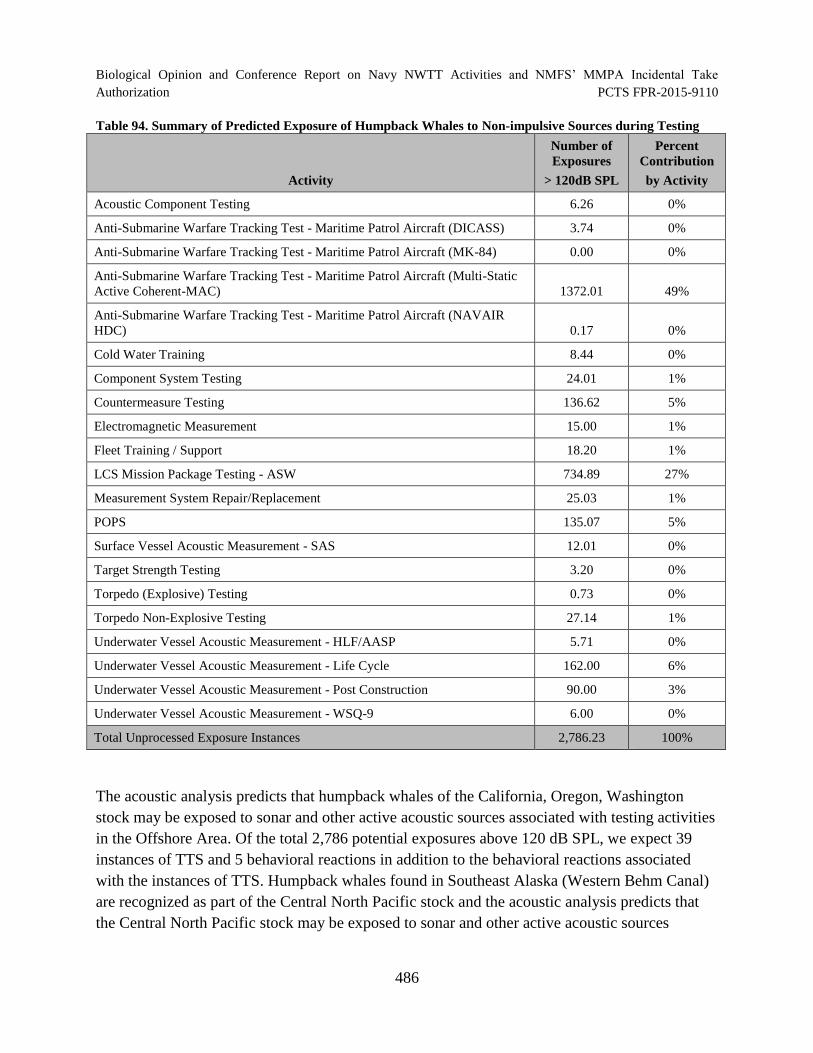
Biological Opinion and Conference Report on Navy NWTT Activities and NMFS’ MMPA Incidental Take
Authorization PCTS FPR-2015-9110
Table 94. Summary of Predicted Exposure of Humpback Whales to Non-impulsive Sources during Testing
Activity
Number of
Exposures
> 120dB SPL
Percent
Contribution
by Activity
Acoustic Component Testing 6.26 0%
Anti-Submarine Warfare Tracking Test - Maritime Patrol Aircraft (DICASS) 3.74 0%
Anti-Submarine Warfare Tracking Test - Maritime Patrol Aircraft (MK-84) 0.00 0%
Anti-Submarine Warfare Tracking Test - Maritime Patrol Aircraft (Multi-Static
Active Coherent-MAC) 1372.01 49%
Anti-Submarine Warfare Tracking Test - Maritime Patrol Aircraft (NAVAIR
HDC) 0.17 0%
Cold Water Training 8.44 0%
Component System Testing 24.01 1%
Countermeasure Testing 136.62 5%
Electromagnetic Measurement 15.00 1%
Fleet Training / Support 18.20 1%
LCS Mission Package Testing - ASW 734.89 27%
Measurement System Repair/Replacement 25.03 1%
POPS 135.07 5%
Surface Vessel Acoustic Measurement - SAS 12.01 0%
Target Strength Testing 3.20 0%
Torpedo (Explosive) Testing 0.73 0%
Torpedo Non-Explosive Testing 27.14 1%
Underwater Vessel Acoustic Measurement - HLF/AASP 5.71 0%
Underwater Vessel Acoustic Measurement - Life Cycle 162.00 6%
Underwater Vessel Acoustic Measurement - Post Construction 90.00 3%
Underwater Vessel Acoustic Measurement - WSQ-9 6.00 0%
Total Unprocessed Exposure Instances 2,786.23 100%
The acoustic analysis predicts that humpback whales of the California, Oregon, Washington
stock may be exposed to sonar and other active acoustic sources associated with testing activities
in the Offshore Area. Of the total 2,786 potential exposures above 120 dB SPL, we expect 39
instances of TTS and 5 behavioral reactions in addition to the behavioral reactions associated
with the instances of TTS. Humpback whales found in Southeast Alaska (Western Behm Canal)
are recognized as part of the Central North Pacific stock and the acoustic analysis predicts that
the Central North Pacific stock may be exposed to sonar and other active acoustic sources
486
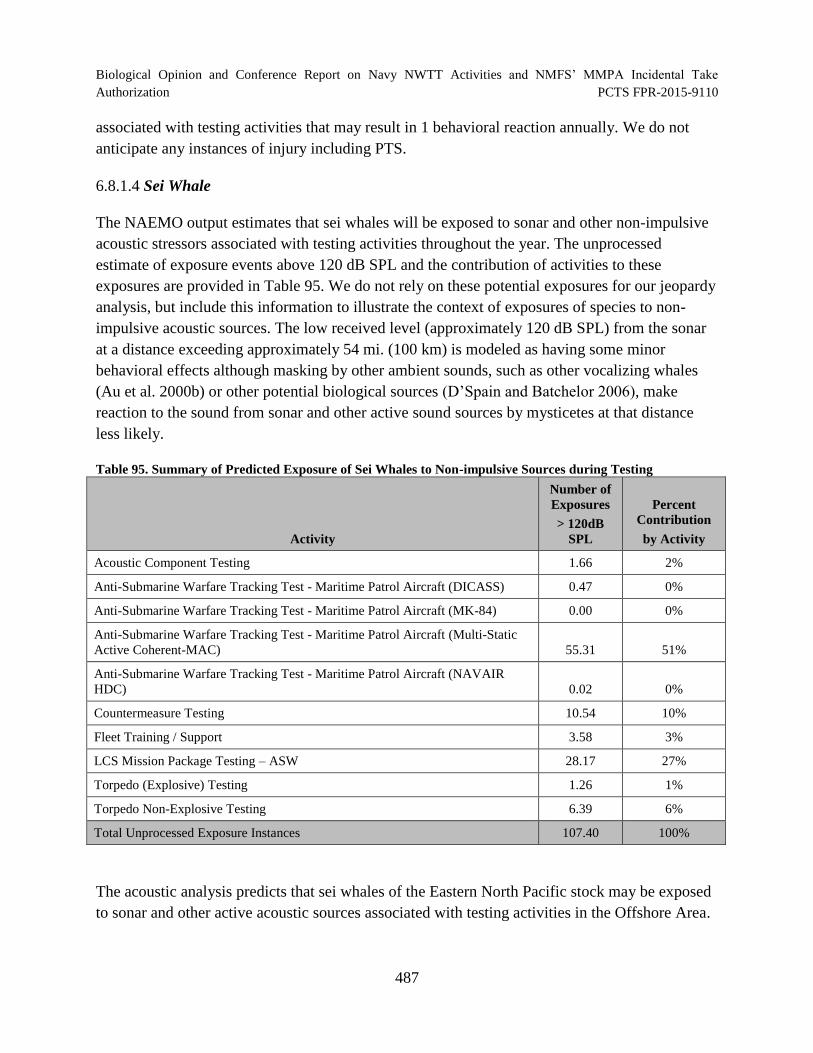
Biological Opinion and Conference Report on Navy NWTT Activities and NMFS’ MMPA Incidental Take
Authorization PCTS FPR-2015-9110
associated with testing activities that may result in 1 behavioral reaction annually. We do not
anticipate any instances of injury including PTS.
6.8.1.4 Sei Whale
The NAEMO output estimates that sei whales will be exposed to sonar and other non-impulsive
acoustic stressors associated with testing activities throughout the year. The unprocessed
estimate of exposure events above 120 dB SPL and the contribution of activities to these
exposures are provided in Table 95. We do not rely on these potential exposures for our jeopardy
analysis, but include this information to illustrate the context of exposures of species to non-
impulsive acoustic sources. The low received level (approximately 120 dB SPL) from the sonar
at a distance exceeding approximately 54 mi. (100 km) is modeled as having some minor
behavioral effects although masking by other ambient sounds, such as other vocalizing whales
(Au et al. 2000b) or other potential biological sources (D’Spain and Batchelor 2006), make
reaction to the sound from sonar and other active sound sources by mysticetes at that distance
less likely.
Table 95. Summary of Predicted Exposure of Sei Whales to Non-impulsive Sources during Testing
Activity
Number of
Exposures
> 120dB
SPL
Percent
Contribution
by Activity
Acoustic Component Testing 1.66 2%
Anti-Submarine Warfare Tracking Test - Maritime Patrol Aircraft (DICASS) 0.47 0%
Anti-Submarine Warfare Tracking Test - Maritime Patrol Aircraft (MK-84) 0.00 0%
Anti-Submarine Warfare Tracking Test - Maritime Patrol Aircraft (Multi-Static
Active Coherent-MAC) 55.31 51%
Anti-Submarine Warfare Tracking Test - Maritime Patrol Aircraft (NAVAIR
HDC) 0.02 0%
Countermeasure Testing 10.54 10%
Fleet Training / Support 3.58 3%
LCS Mission Package Testing – ASW 28.17 27%
Torpedo (Explosive) Testing 1.26 1%
Torpedo Non-Explosive Testing 6.39 6%
Total Unprocessed Exposure Instances 107.40 100%
The acoustic analysis predicts that sei whales of the Eastern North Pacific stock may be exposed
to sonar and other active acoustic sources associated with testing activities in the Offshore Area.
487
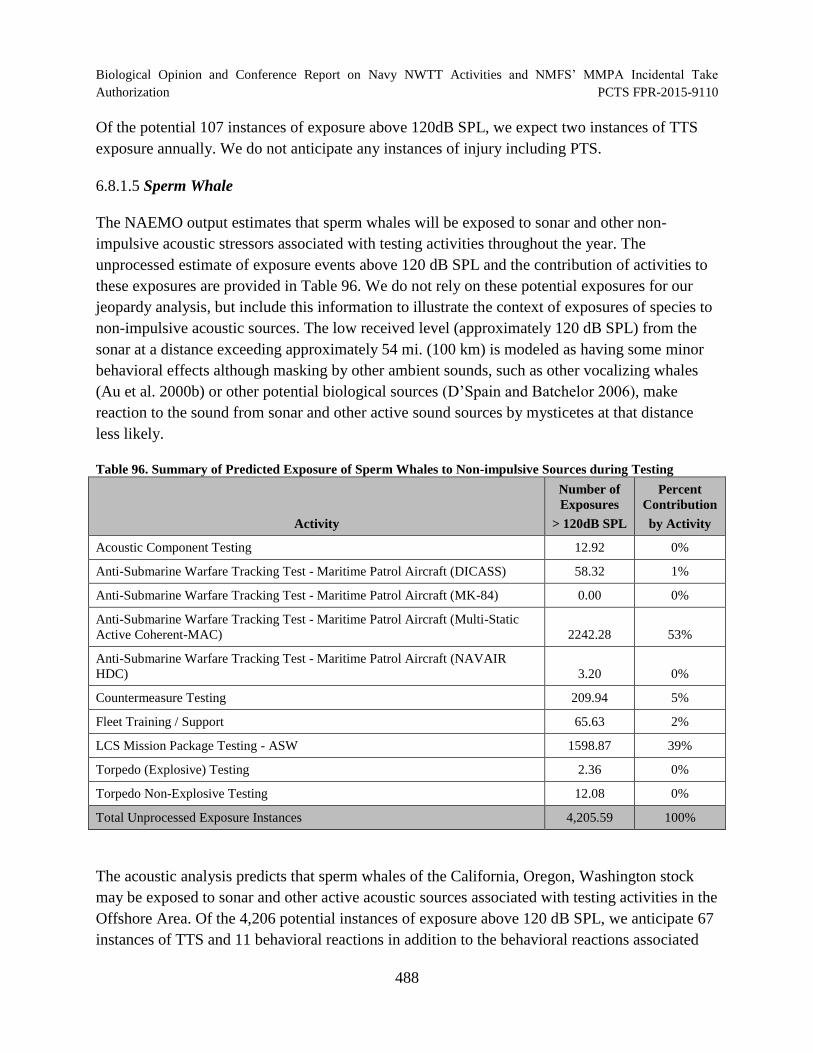
Biological Opinion and Conference Report on Navy NWTT Activities and NMFS’ MMPA Incidental Take
Authorization PCTS FPR-2015-9110
Of the potential 107 instances of exposure above 120dB SPL, we expect two instances of TTS
exposure annually. We do not anticipate any instances of injury including PTS.
6.8.1.5 Sperm Whale
The NAEMO output estimates that sperm whales will be exposed to sonar and other non-
impulsive acoustic stressors associated with testing activities throughout the year. The
unprocessed estimate of exposure events above 120 dB SPL and the contribution of activities to
these exposures are provided in Table 96. We do not rely on these potential exposures for our
jeopardy analysis, but include this information to illustrate the context of exposures of species to
non-impulsive acoustic sources. The low received level (approximately 120 dB SPL) from the
sonar at a distance exceeding approximately 54 mi. (100 km) is modeled as having some minor
behavioral effects although masking by other ambient sounds, such as other vocalizing whales
(Au et al. 2000b) or other potential biological sources (D’Spain and Batchelor 2006), make
reaction to the sound from sonar and other active sound sources by mysticetes at that distance
less likely.
Table 96. Summary of Predicted Exposure of Sperm Whales to Non-impulsive Sources during Testing
Activity
Number of
Exposures
> 120dB SPL
Percent
Contribution
by Activity
Acoustic Component Testing 12.92 0%
Anti-Submarine Warfare Tracking Test - Maritime Patrol Aircraft (DICASS) 58.32 1%
Anti-Submarine Warfare Tracking Test - Maritime Patrol Aircraft (MK-84) 0.00 0%
Anti-Submarine Warfare Tracking Test - Maritime Patrol Aircraft (Multi-Static
Active Coherent-MAC) 2242.28 53%
Anti-Submarine Warfare Tracking Test - Maritime Patrol Aircraft (NAVAIR
HDC) 3.20 0%
Countermeasure Testing 209.94 5%
Fleet Training / Support 65.63 2%
LCS Mission Package Testing - ASW 1598.87 39%
Torpedo (Explosive) Testing 2.36 0%
Torpedo Non-Explosive Testing 12.08 0%
Total Unprocessed Exposure Instances 4,205.59 100%
The acoustic analysis predicts that sperm whales of the California, Oregon, Washington stock
may be exposed to sonar and other active acoustic sources associated with testing activities in the
Offshore Area. Of the 4,206 potential instances of exposure above 120 dB SPL, we anticipate 67
instances of TTS and 11 behavioral reactions in addition to the behavioral reactions associated
488
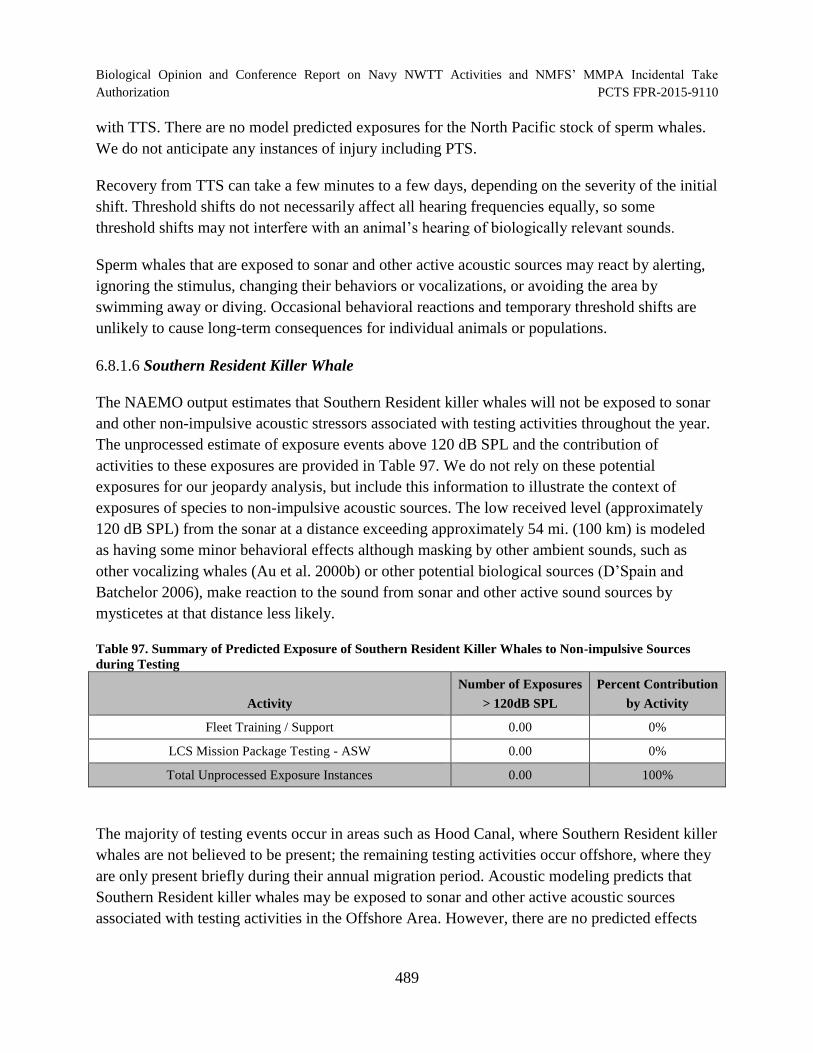
Biological Opinion and Conference Report on Navy NWTT Activities and NMFS’ MMPA Incidental Take
Authorization PCTS FPR-2015-9110
with TTS. There are no model predicted exposures for the North Pacific stock of sperm whales.
We do not anticipate any instances of injury including PTS.
Recovery from TTS can take a few minutes to a few days, depending on the severity of the initial
shift. Threshold shifts do not necessarily affect all hearing frequencies equally, so some
threshold shifts may not interfere with an animal’s hearing of biologically relevant sounds.
Sperm whales that are exposed to sonar and other active acoustic sources may react by alerting,
ignoring the stimulus, changing their behaviors or vocalizations, or avoiding the area by
swimming away or diving. Occasional behavioral reactions and temporary threshold shifts are
unlikely to cause long-term consequences for individual animals or populations.
6.8.1.6 Southern Resident Killer Whale
The NAEMO output estimates that Southern Resident killer whales will not be exposed to sonar
and other non-impulsive acoustic stressors associated with testing activities throughout the year.
The unprocessed estimate of exposure events above 120 dB SPL and the contribution of
activities to these exposures are provided in Table 97. We do not rely on these potential
exposures for our jeopardy analysis, but include this information to illustrate the context of
exposures of species to non-impulsive acoustic sources. The low received level (approximately
120 dB SPL) from the sonar at a distance exceeding approximately 54 mi. (100 km) is modeled
as having some minor behavioral effects although masking by other ambient sounds, such as
other vocalizing whales (Au et al. 2000b) or other potential biological sources (D’Spain and
Batchelor 2006), make reaction to the sound from sonar and other active sound sources by
mysticetes at that distance less likely.
Table 97. Summary of Predicted Exposure of Southern Resident Killer Whales to Non-impulsive Sources
during Testing
Activity
Number of Exposures
> 120dB SPL
Percent Contribution
by Activity
Fleet Training / Support 0.00 0%
LCS Mission Package Testing - ASW 0.00 0%
Total Unprocessed Exposure Instances 0.00 100%
The majority of testing events occur in areas such as Hood Canal, where Southern Resident killer
whales are not believed to be present; the remaining testing activities occur offshore, where they
are only present briefly during their annual migration period. Acoustic modeling predicts that
Southern Resident killer whales may be exposed to sonar and other active acoustic sources
associated with testing activities in the Offshore Area. However, there are no predicted effects
489
Biological Opinion and Conference Report on Navy NWTT Activities and NMFS’ MMPA Incidental Take
Authorization PCTS FPR-2015-9110
from these testing activities because there are no potential exposures above 120 dB SPL and
subsequently there are no potential exposures that would exceed the current effects thresholds.
6.8.1.7 Guadalupe Fur Seal
Guadalupe fur seals are present within the coastal margins of the offshore portion of the Action
Area during the warm season (summer and early autumn). Guadalupe fur seals are considered
“seasonal” migrants since they return to rookeries in Mexican waters in the cold season. The
Guadalupe fur seal is considered a single Mexico stock and is listed as threatened under the ESA
(Carretta et al. 2013a).
The acoustic analysis predicts that Guadalupe fur seals may be exposed to sonar and other active
acoustic sources associated with testing activities in the Offshore Area that may result in three
behavioral reactions annually. We do not anticipate any instances of injury including PTS.
Research and observations show that pinnipeds in the water are tolerant of anthropogenic noise
and activity. If seals are exposed to sonar or other active acoustic sources they may react in a
number of ways depending on their experience with the sound source and what activity they are
engaged in at the time of the acoustic exposure. Seals may not react at all until the sound source
is approaching within a few hundred meters and then may alert, ignore the stimulus, change their
behaviors, or avoid the immediate area by swimming away or diving. Significant behavioral
reactions would not be expected in most cases.
6.8.2 Summary of Predicted Effects to Marine Mammals
Table 98 provides a summary of predicted effects on marine mammals from non-impulsive
acoustic stressors during testing activities.
490
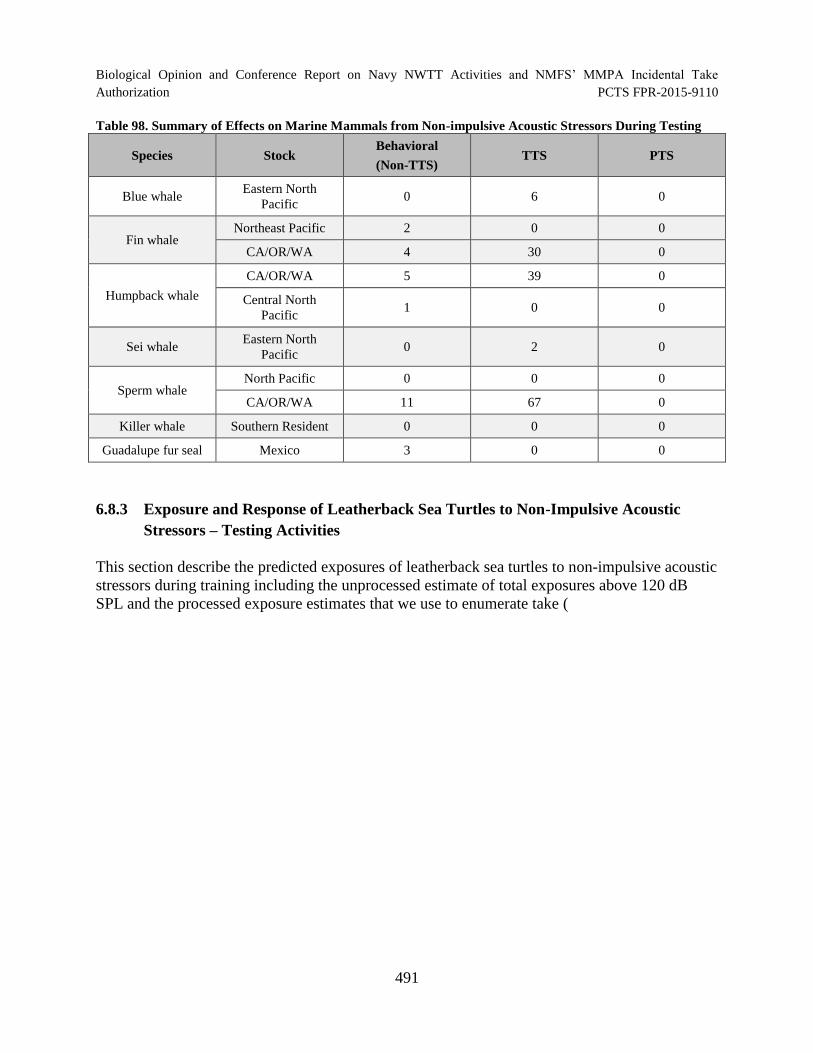
Biological Opinion and Conference Report on Navy NWTT Activities and NMFS’ MMPA Incidental Take Authorization PCTS FPR-2015-9110
Table 98. Summary of Effects on Marine Mammals from Non-impulsive Acoustic Stressors During Testing
Species Stock Behavioral
(Non-TTS) TTS PTS
Blue whale Eastern North
Pacific 0 6 0
Fin whale Northeast Pacific 2 0 0
CA/OR/WA 4 30 0
CA/OR/WA 5 39 0
Humpback whale Central North
Pacific 1 0 0
Sei whale Eastern North
Pacific 0 2 0
Sperm whale North Pacific 0 0 0
CA/OR/WA 11 67 0
Killer whale Southern Resident 0 0 0
Guadalupe fur seal Mexico 3 0 0
6.8.3 Exposure and Response of Leatherback Sea Turtles to Non-Impulsive Acoustic
Stressors – Testing Activities
This section describe the predicted exposures of leatherback sea turtles to non-impulsive acoustic
stressors during training including the unprocessed estimate of total exposures above 120 dB
SPL and the processed exposure estimates that we use to enumerate take (
491

492
Biological Opinion and Conference Report on Navy NWTT Activities and NMFS’ MMPA Incidental Take
Authorization PCTS FPR-2015-9110
Table 99).
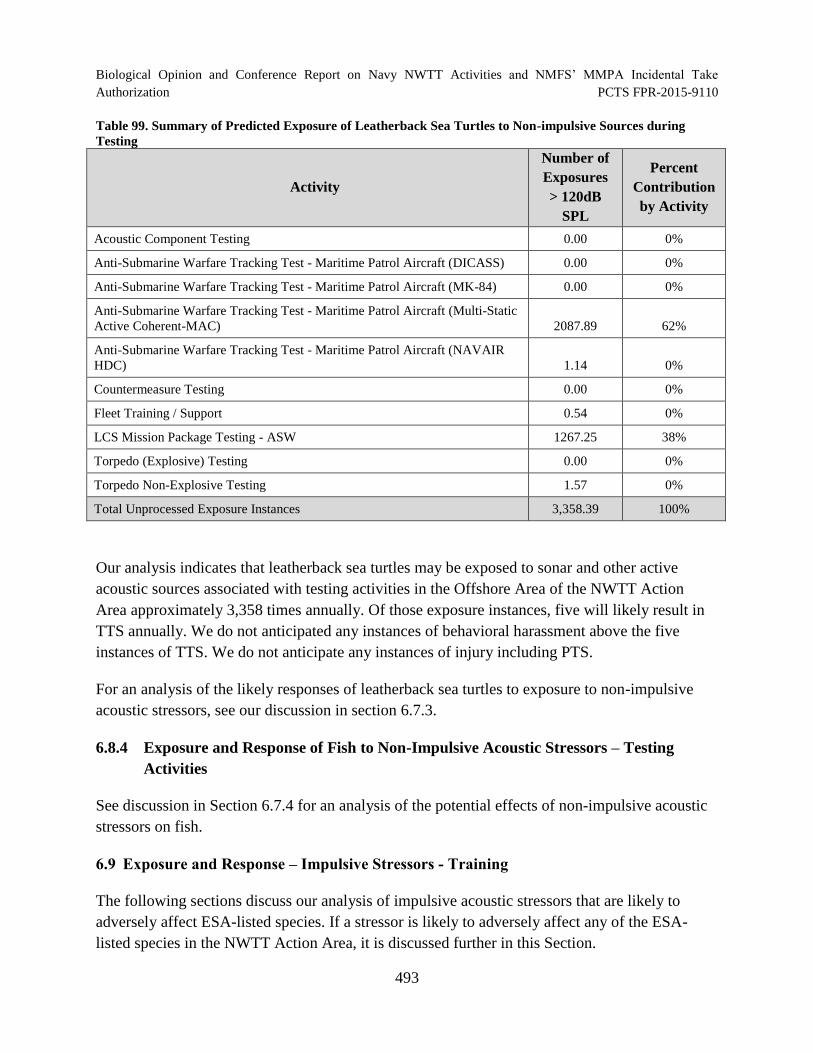
Biological Opinion and Conference Report on Navy NWTT Activities and NMFS’ MMPA Incidental Take
Authorization PCTS FPR-2015-9110
Table 99. Summary of Predicted Exposure of Leatherback Sea Turtles to Non-impulsive Sources during
Testing
Activity
Number of
Exposures
> 120dB
SPL
Percent
Contribution
by Activity
Acoustic Component Testing 0.00 0%
Anti-Submarine Warfare Tracking Test - Maritime Patrol Aircraft (DICASS) 0.00 0%
Anti-Submarine Warfare Tracking Test - Maritime Patrol Aircraft (MK-84) 0.00 0%
Anti-Submarine Warfare Tracking Test - Maritime Patrol Aircraft (Multi-Static
Active Coherent-MAC) 2087.89 62%
Anti-Submarine Warfare Tracking Test - Maritime Patrol Aircraft (NAVAIR
HDC) 1.14 0%
Countermeasure Testing 0.00 0%
Fleet Training / Support 0.54 0%
LCS Mission Package Testing - ASW 1267.25 38%
Torpedo (Explosive) Testing 0.00 0%
Torpedo Non-Explosive Testing 1.57 0%
Total Unprocessed Exposure Instances 3,358.39 100%
Our analysis indicates that leatherback sea turtles may be exposed to sonar and other active
acoustic sources associated with testing activities in the Offshore Area of the NWTT Action
Area approximately 3,358 times annually. Of those exposure instances, five will likely result in
TTS annually. We do not anticipated any instances of behavioral harassment above the five
instances of TTS. We do not anticipate any instances of injury including PTS.
For an analysis of the likely responses of leatherback sea turtles to exposure to non-impulsive
acoustic stressors, see our discussion in section 6.7.3.
6.8.4 Exposure and Response of Fish to Non-Impulsive Acoustic Stressors – Testing
Activities
See discussion in Section 6.7.4 for an analysis of the potential effects of non-impulsive acoustic
stressors on fish.
6.9 Exposure and Response – Impulsive Stressors - Training
The following sections discuss our analysis of impulsive acoustic stressors that are likely to
adversely affect ESA-listed species. If a stressor is likely to adversely affect any of the ESA-
listed species in the NWTT Action Area, it is discussed further in this Section.
493
Biological Opinion and Conference Report on Navy NWTT Activities and NMFS’ MMPA Incidental Take
Authorization PCTS FPR-2015-9110
6.9.1 Exposure and Response of Marine Mammals to Impulsive Acoustic Stressors –
Training Activities
As with non-impulsive sources, we considered exposure estimates from the Navy Acoustic
Effects Model for marine mammals and sea turtles. First, we estimated the total number of ESA-
listed species (animats) that would be exposed to acoustic sources prior to the application of a
dose-response curve or criteria. We term these the “unprocessed” estimates. This estimate is the
number of times individual animats or animals are likely to be exposed to the acoustic
environment that is a result of training exercises, regardless of whether they are “taken” as a
result of that exposure. In most cases, the number of animals “taken” by an action would be a
subset of the number of animals that are exposed to the action because (1) in some
circumstances, animals might not respond to an exposure and (2) some responses may be
negative for an individual animal without constituting a form of “take” (for example, some
physiological stress responses only have fitness consequences when they are sustained and
would only constitute a “take” as a result of cumulative exposure).
A second set of exposure estimates (“model-estimated”) of listed species were generated and
“processed” using criteria for temporary and permanent threshold shift developed by the Navy
and NMFS’ Permits Division for the purpose of identifying harassment pursuant to the MMPA.
As above, these are the estimates we use in our jeopardy analysis and determination.
Mitigation measures are effective at reducing instances of injury or mortality, but would not
further reduce potential behavioral impacts to lesser impacts due to the potential distance from
the source stressor. The Navy states that avoidance and mitigation only reduces those "Level A"
(potential to injure or kill) impacts to "Level B" impacts. In this case there are no Level A
exposures and thus the estimated amounts are not changed. In other words, neither sets of
exposure estimates, the unprocessed or processed, were adjusted to account for standard
mitigation actions that NMFS’ Permits Division requires under the MMPA rule and LOA to
avoid marine mammals, nor were the estimates adjusted to account for any avoidance responses
that might be taken by individual animals once they sense the presence of Navy vessels or
aircraft.
Estimated unprocessed exposures of marine mammals and sea turtles to impulsive sound from
underwater detonations during training exercises at levels greater than 120 dB SPL are
summarized in the following sections. As with these estimates for the non-impulsive sources, we
do not rely on these estimates in our jeopardy analysis.
6.9.1.1 Blue Whale
The NAEMO output estimates that blue whales will be exposed to explosions associated with
training activities throughout the year. The unprocessed estimate of exposure events above
494
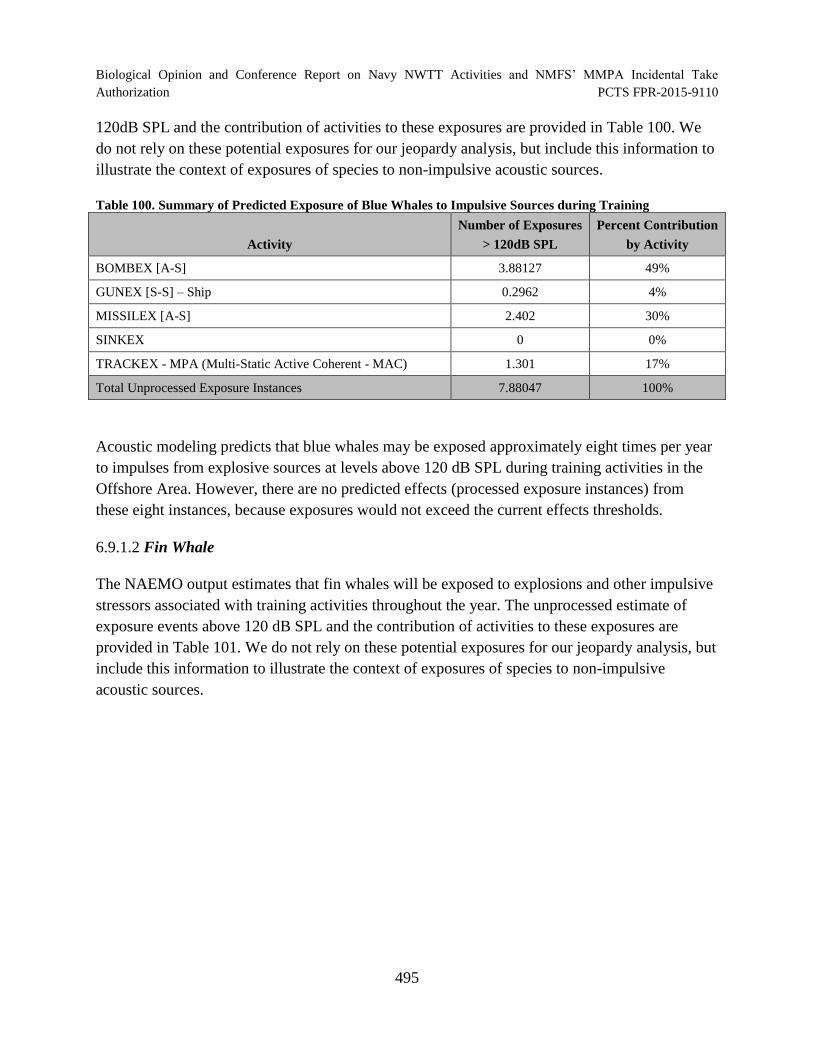
Biological Opinion and Conference Report on Navy NWTT Activities and NMFS’ MMPA Incidental Take
Authorization PCTS FPR-2015-9110
120dB SPL and the contribution of activities to these exposures are provided in Table 100. We
do not rely on these potential exposures for our jeopardy analysis, but include this information to
illustrate the context of exposures of species to non-impulsive acoustic sources.
Table 100. Summary of Predicted Exposure of Blue Whales to Impulsive Sources during Training
Activity
Number of Exposures
> 120dB SPL
Percent Contribution
by Activity
BOMBEX [A-S] 3.88127 49%
GUNEX [S-S] – Ship 0.2962 4%
MISSILEX [A-S] 2.402 30%
SINKEX 0 0%
TRACKEX - MPA (Multi-Static Active Coherent - MAC) 1.301 17%
Total Unprocessed Exposure Instances 7.88047 100%
Acoustic modeling predicts that blue whales may be exposed approximately eight times per year
to impulses from explosive sources at levels above 120 dB SPL during training activities in the
Offshore Area. However, there are no predicted effects (processed exposure instances) from
these eight instances, because exposures would not exceed the current effects thresholds.
6.9.1.2 Fin Whale
The NAEMO output estimates that fin whales will be exposed to explosions and other impulsive
stressors associated with training activities throughout the year. The unprocessed estimate of
exposure events above 120 dB SPL and the contribution of activities to these exposures are
provided in Table 101. We do not rely on these potential exposures for our jeopardy analysis, but
include this information to illustrate the context of exposures of species to non-impulsive
acoustic sources.
495
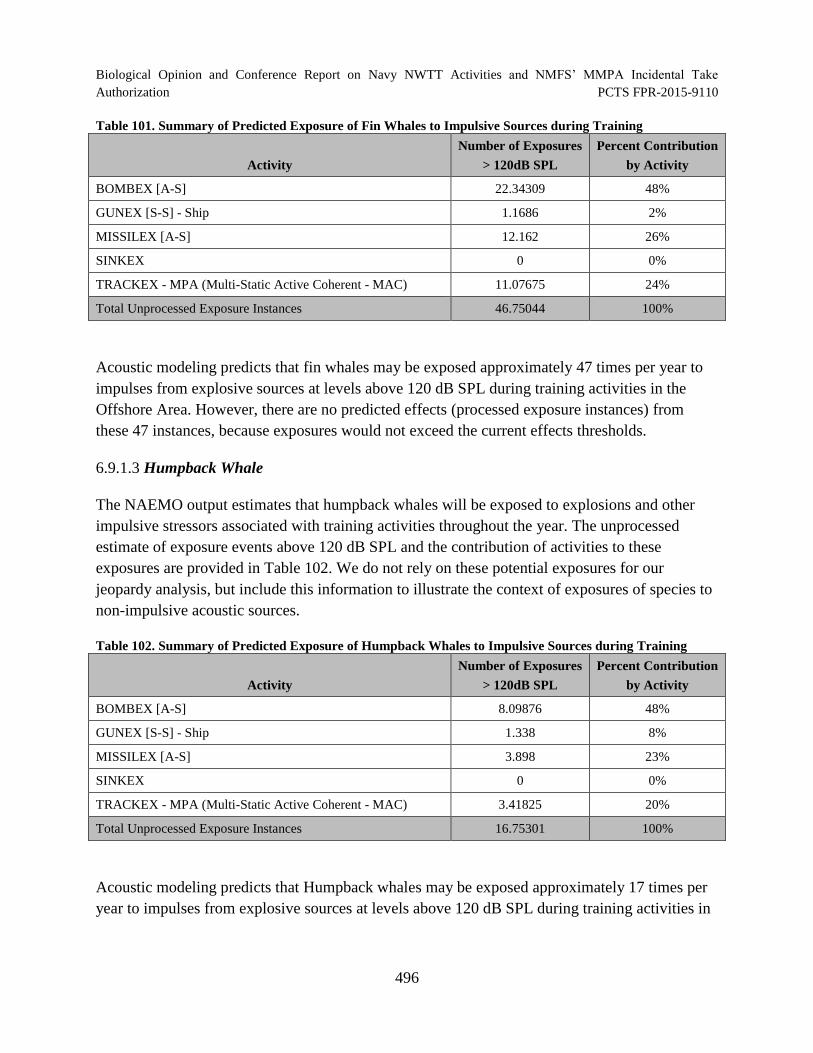
Biological Opinion and Conference Report on Navy NWTT Activities and NMFS’ MMPA Incidental Take Authorization PCTS FPR-2015-9110
Table 101. Summary of Predicted Exposure of Fin Whales to Impulsive Sources during Training
Activity
Number of Exposures
> 120dB SPL
Percent Contribution
by Activity
BOMBEX [A-S] 22.34309 48%
GUNEX [S-S] - Ship 1.1686 2%
MISSILEX [A-S] 12.162 26%
SINKEX 0 0%
TRACKEX - MPA (Multi-Static Active Coherent - MAC) 11.07675 24%
Total Unprocessed Exposure Instances 46.75044 100%
Acoustic modeling predicts that fin whales may be exposed approximately 47 times per year to
impulses from explosive sources at levels above 120 dB SPL during training activities in the
Offshore Area. However, there are no predicted effects (processed exposure instances) from
these 47 instances, because exposures would not exceed the current effects thresholds.
6.9.1.3 Humpback Whale
The NAEMO output estimates that humpback whales will be exposed to explosions and other
impulsive stressors associated with training activities throughout the year. The unprocessed
estimate of exposure events above 120 dB SPL and the contribution of activities to these
exposures are provided in Table 102. We do not rely on these potential exposures for our
jeopardy analysis, but include this information to illustrate the context of exposures of species to
non-impulsive acoustic sources.
Table 102. Summary of Predicted Exposure of Humpback Whales to Impulsive Sources during Training
Activity
Number of Exposures
> 120dB SPL
Percent Contribution
by Activity
BOMBEX [A-S] 8.09876 48%
GUNEX [S-S] - Ship 1.338 8%
MISSILEX [A-S] 3.898 23%
SINKEX 0 0%
TRACKEX - MPA (Multi-Static Active Coherent - MAC) 3.41825 20%
Total Unprocessed Exposure Instances 16.75301 100%
Acoustic modeling predicts that Humpback whales may be exposed approximately 17 times per
year to impulses from explosive sources at levels above 120 dB SPL during training activities in
496
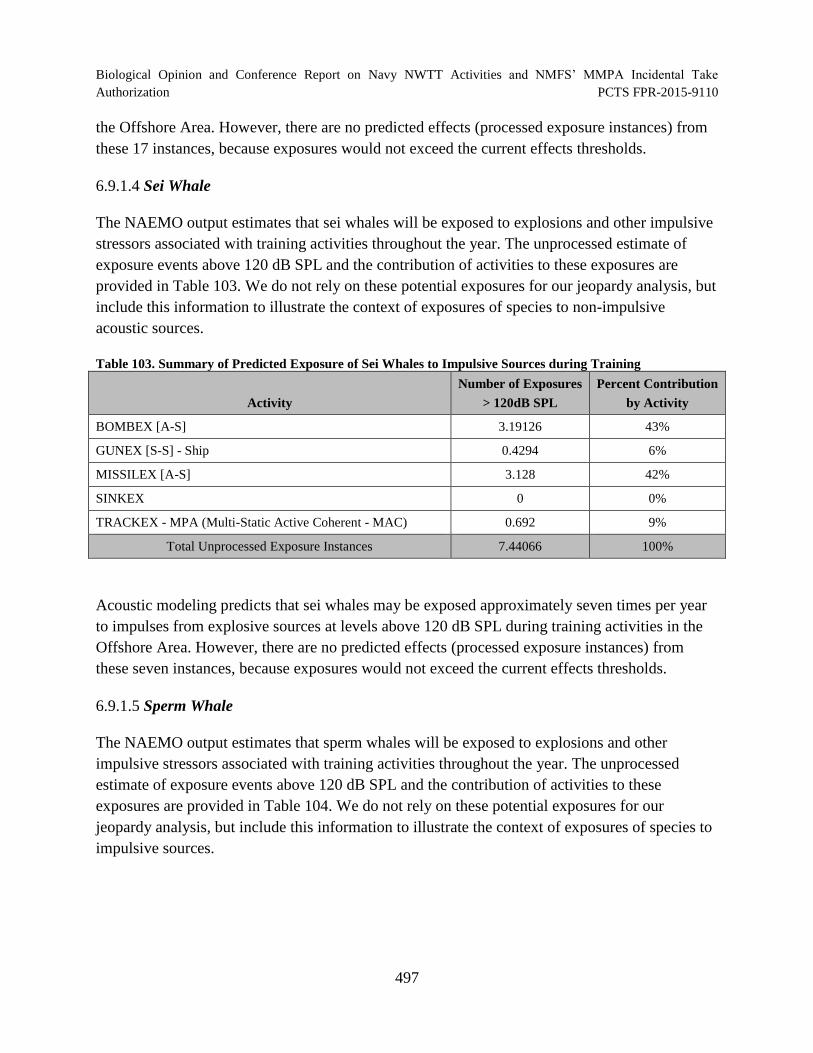
Biological Opinion and Conference Report on Navy NWTT Activities and NMFS’ MMPA Incidental Take
Authorization PCTS FPR-2015-9110
the Offshore Area. However, there are no predicted effects (processed exposure instances) from
these 17 instances, because exposures would not exceed the current effects thresholds.
6.9.1.4 Sei Whale
The NAEMO output estimates that sei whales will be exposed to explosions and other impulsive
stressors associated with training activities throughout the year. The unprocessed estimate of
exposure events above 120 dB SPL and the contribution of activities to these exposures are
provided in Table 103. We do not rely on these potential exposures for our jeopardy analysis, but
include this information to illustrate the context of exposures of species to non-impulsive
acoustic sources.
Table 103. Summary of Predicted Exposure of Sei Whales to Impulsive Sources during Training
Activity
Number of Exposures
> 120dB SPL
Percent Contribution
by Activity
BOMBEX [A-S] 3.19126 43%
GUNEX [S-S] - Ship 0.4294 6%
MISSILEX [A-S] 3.128 42%
SINKEX 0 0%
TRACKEX - MPA (Multi-Static Active Coherent - MAC) 0.692 9%
Total Unprocessed Exposure Instances 7.44066 100%
Acoustic modeling predicts that sei whales may be exposed approximately seven times per year
to impulses from explosive sources at levels above 120 dB SPL during training activities in the
Offshore Area. However, there are no predicted effects (processed exposure instances) from
these seven instances, because exposures would not exceed the current effects thresholds.
6.9.1.5 Sperm Whale
The NAEMO output estimates that sperm whales will be exposed to explosions and other
impulsive stressors associated with training activities throughout the year. The unprocessed
estimate of exposure events above 120 dB SPL and the contribution of activities to these
exposures are provided in Table 104. We do not rely on these potential exposures for our
jeopardy analysis, but include this information to illustrate the context of exposures of species to
impulsive sources.
497
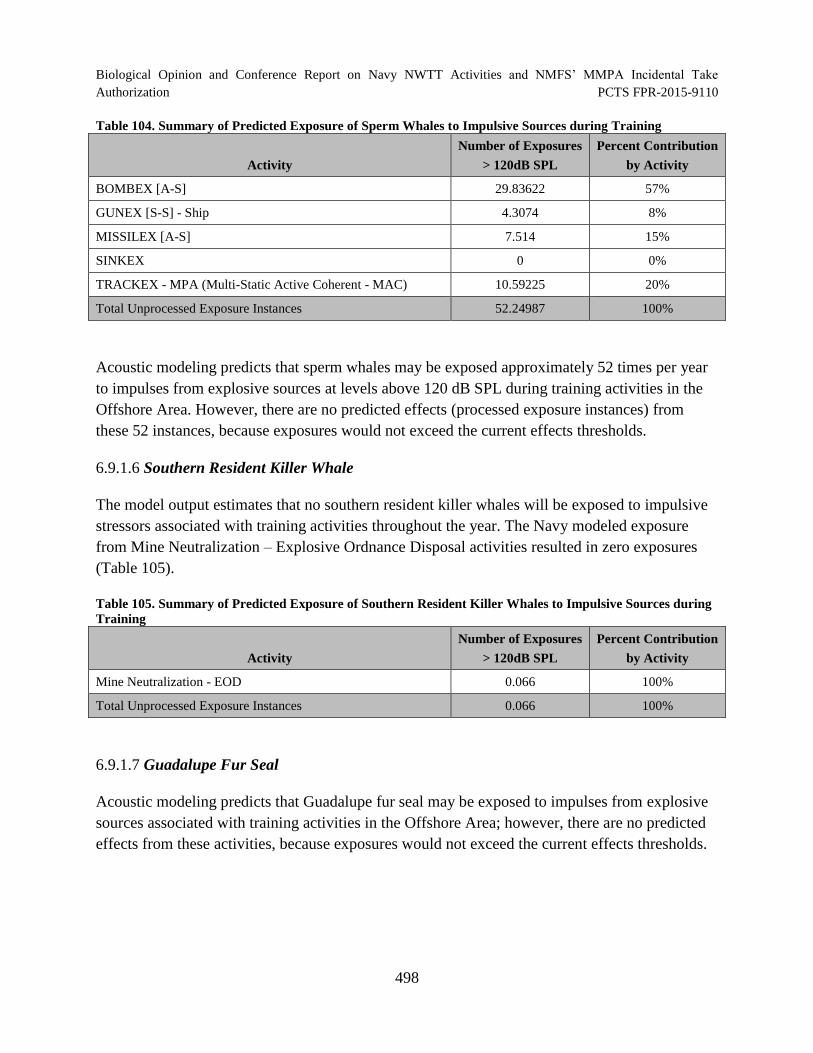
Biological Opinion and Conference Report on Navy NWTT Activities and NMFS’ MMPA Incidental Take Authorization PCTS FPR-2015-9110
Table 104. Summary of Predicted Exposure of Sperm Whales to Impulsive Sources during Training
Activity
Number of Exposures
> 120dB SPL
Percent Contribution
by Activity
BOMBEX [A-S] 29.83622 57%
GUNEX [S-S] - Ship 4.3074 8%
MISSILEX [A-S] 7.514 15%
SINKEX 0 0%
TRACKEX - MPA (Multi-Static Active Coherent - MAC) 10.59225 20%
Total Unprocessed Exposure Instances 52.24987 100%
Acoustic modeling predicts that sperm whales may be exposed approximately 52 times per year
to impulses from explosive sources at levels above 120 dB SPL during training activities in the
Offshore Area. However, there are no predicted effects (processed exposure instances) from
these 52 instances, because exposures would not exceed the current effects thresholds.
6.9.1.6 Southern Resident Killer Whale
The model output estimates that no southern resident killer whales will be exposed to impulsive
stressors associated with training activities throughout the year. The Navy modeled exposure
from Mine Neutralization – Explosive Ordnance Disposal activities resulted in zero exposures
(Table 105).
Table 105. Summary of Predicted Exposure of Southern Resident Killer Whales to Impulsive Sources during
Training
Activity
Number of Exposures
> 120dB SPL
Percent Contribution
by Activity
Mine Neutralization - EOD 0.066 100%
Total Unprocessed Exposure Instances 0.066 100%
6.9.1.7 Guadalupe Fur Seal
Acoustic modeling predicts that Guadalupe fur seal may be exposed to impulses from explosive
sources associated with training activities in the Offshore Area; however, there are no predicted
effects from these activities, because exposures would not exceed the current effects thresholds.
498
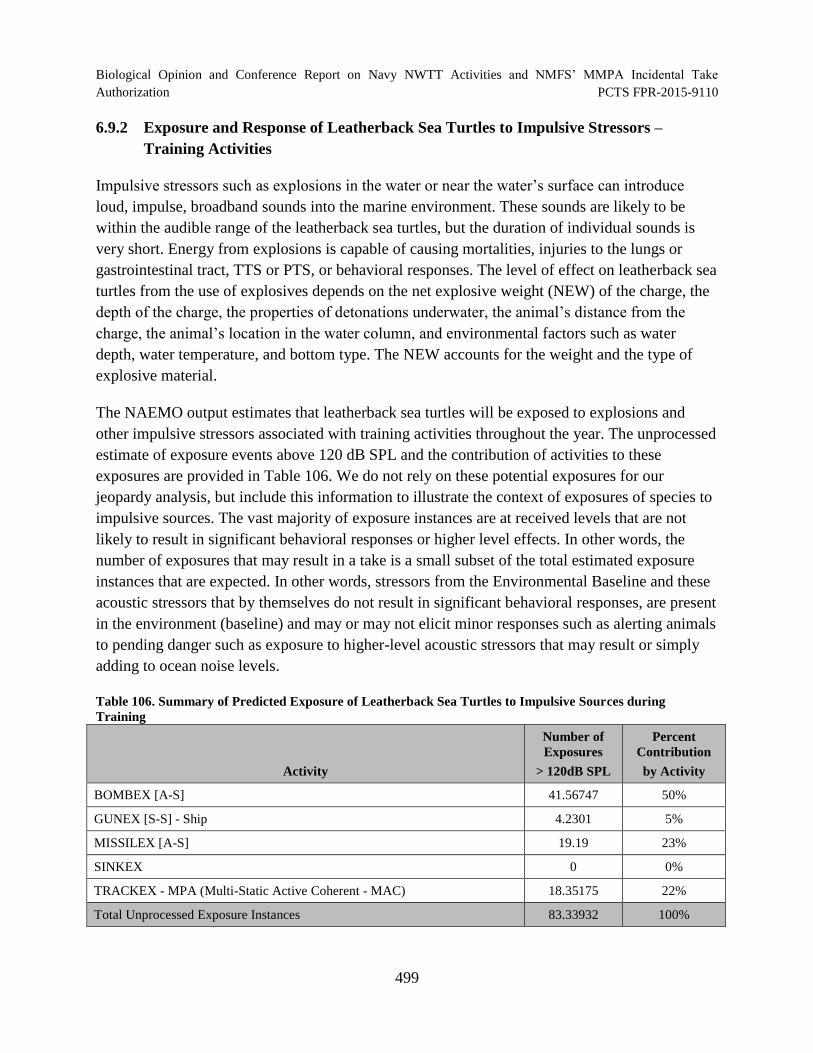
Biological Opinion and Conference Report on Navy NWTT Activities and NMFS’ MMPA Incidental Take
Authorization PCTS FPR-2015-9110
6.9.2 Exposure and Response of Leatherback Sea Turtles to Impulsive Stressors –
Training Activities
Impulsive stressors such as explosions in the water or near the water’s surface can introduce
loud, impulse, broadband sounds into the marine environment. These sounds are likely to be
within the audible range of the leatherback sea turtles, but the duration of individual sounds is
very short. Energy from explosions is capable of causing mortalities, injuries to the lungs or
gastrointestinal tract, TTS or PTS, or behavioral responses. The level of effect on leatherback sea
turtles from the use of explosives depends on the net explosive weight (NEW) of the charge, the
depth of the charge, the properties of detonations underwater, the animal’s distance from the
charge, the animal’s location in the water column, and environmental factors such as water
depth, water temperature, and bottom type. The NEW accounts for the weight and the type of
explosive material.
The NAEMO output estimates that leatherback sea turtles will be exposed to explosions and
other impulsive stressors associated with training activities throughout the year. The unprocessed
estimate of exposure events above 120 dB SPL and the contribution of activities to these
exposures are provided in Table 106. We do not rely on these potential exposures for our
jeopardy analysis, but include this information to illustrate the context of exposures of species to
impulsive sources. The vast majority of exposure instances are at received levels that are not
likely to result in significant behavioral responses or higher level effects. In other words, the
number of exposures that may result in a take is a small subset of the total estimated exposure
instances that are expected. In other words, stressors from the Environmental Baseline and these
acoustic stressors that by themselves do not result in significant behavioral responses, are present
in the environment (baseline) and may or may not elicit minor responses such as alerting animals
to pending danger such as exposure to higher-level acoustic stressors that may result or simply
adding to ocean noise levels.
Table 106. Summary of Predicted Exposure of Leatherback Sea Turtles to Impulsive Sources during
Training
Activity
Number of
Exposures
> 120dB SPL
Percent
Contribution
by Activity
BOMBEX [A-S] 41.56747 50%
GUNEX [S-S] - Ship 4.2301 5%
MISSILEX [A-S] 19.19 23%
SINKEX 0 0%
TRACKEX - MPA (Multi-Static Active Coherent - MAC) 18.35175 22%
Total Unprocessed Exposure Instances 83.33932 100%
499
Biological Opinion and Conference Report on Navy NWTT Activities and NMFS’ MMPA Incidental Take
Authorization PCTS FPR-2015-9110
As the table above illustrates, up to 142 training activities using explosives at or beneath the
water surface would be conducted annually and potentially expose leatherback sea turtles to
underwater impulse sound. The largest source class used during training would be E12 (> 650 to
1,000 lb. NEW), which would be used 10 times annually in the NWTT Action Area. Leatherback
sea turtles may be exposed to impulse sound from explosive sources associated with training
activities in the Offshore Area; however, there are no predicted mortality, onset slight lung
injury, gastrointestinal tract injury, PTS, or TTS effects from these activities, because exposures
would not exceed the current effects thresholds.
In addition to Navy-modeled estimates for TTS, PTS, Slight Lung Injury, and Mortality from
impulsive acoustic stressors, we calculated the number of modeled (unprocessed) instances of
behavioral harassment of sea turtle species. To do this, we summed the number of modeled
exposures greater than 175 dB and subtracted instances of estimated TTS, PTS, slight lung
injury, and mortality (zero in this case) to provide an estimate (balance of exposures greater than
175dB) of exposures that may result in more than minor behavioral responses potentially rising
to the level of “take” pursuant to the ESA. These unprocessed estimates do not take into account
Navy standard operating procedures and mitigation activities that might reduce actual instances
of harassment. From this we concluded that 14 leatherback sea turtles would be behaviorally
harassed.
Activities consisting of single explosions, such as bombing and missile exercise, are expected to
only elicit short-term startle reactions. If a sea turtle hears multiple explosions in a short period,
such as during gunnery, firing, or sonobuoy exercises, it may react by avoiding the area. Most
activities would consist of a limited number of explosions and exposures would not occur over
long durations. Similar to training activities, behavioral effects are expected to be minor and
temporary.
Little is known about how sea turtles use sound in their environment. Based on knowledge of
their sensory biology (Bartol and Ketten 2006; Moein Bartol and Musick 2003), sea turtles may
be able to detect objects within the water column (e.g., vessels, prey, predators) via some
combination of auditory and visual cues. However, research examining the ability of sea turtles
to avoid collisions with vessels shows they may rely more on their vision than auditory cues
(Hazel et al. 2007). Similarly, while sea turtles may rely on acoustic cues to identify nesting
beaches, they appear to rely on other non-acoustic cues for navigation, such as magnetic fields
(Lohmann and Lohmann 1996a; Lohmann and Lohmann 1996b) and light (Avens and Lohmann
2003). Additionally, they are not known to produce sounds underwater for communication.
Further, although the information on the hearing capabilities of sea turtles is limited, the
information available suggests that the auditory capabilities of sea turtles are centered in the low-
frequency range (<2 kHz) (Bartol et al. 1999b; Dow Piniak et al. 2012; Lenhardt et al. 1983;
500
Biological Opinion and Conference Report on Navy NWTT Activities and NMFS’ MMPA Incidental Take
Authorization PCTS FPR-2015-9110
Lenhardt et al. 1994a; Martin et al. 2012; O'Hara and Wilcox 1990; Ridgway et al. 1969), with
greatest sensitivity below 1 kHz. A more recent review on sea turtle hearing and sound exposure
indicated that sea turtles detect sounds at less than 1000Hz and therefore would not be affected
by mid or high-frequency active sonar (Popper et al. 2014).
Similarly, a study on the effects of airguns on sea turtle behavior also suggests that sea turtles are
most likely to respond to low-frequency sounds. McCauley et al. (2000) reported that green and
loggerhead turtles will avoid air-gun arrays at 2 km and at 1 km with received levels of 166 dB
re 1 Pa and 175 db re 1 Pa, respectively. The sea turtles responded consistently: above a level
of approximately 166 dB re 1 Pa the turtles noticeably increased their swimming activity
compared to non-airgun operation periods. Above 175 dB re 1 Pa mean squared pressure their
behavior became more erratic possibly indicating the turtles were in an agitated state. A study
conducted in the Mediterranean Sea found that of 164 loggerhead turtles observed, 57 percent
responded to the firing of an air gun array (source level 252 dB re 1 μPa [peak]) by diving at or
before their closest point of approach to the airguns, with dive probability decreasing with
increasing distance from the airgun array (DeRuiter and Larbi Doukara 2012).
Acoustic stressors associated with the Navy’s activities in the NWTT Action Area have the
ability to cause behavioral responses in sea turtles. The response of a sea turtle to an
anthropogenic sound will depend on the frequency, duration, temporal pattern, and amplitude of
the sound, as well as the animal’s prior experience with the sound and the context in which the
sound is encountered (i.e., what the animal is doing at the time of the exposure). Distance from
the sound source and whether it is perceived as approaching or moving away could also affect
the way a sea turtle responds. Potential behavioral responses to anthropogenic sound could
include startle reactions, disruption of feeding, disruption of migration, changes in respiration,
alteration of swim speed, alteration of swim direction, and area avoidance. Any disruptions are
expected to be temporary in nature, with the animal resuming normal behaviors shortly after the
exposure. To result in significant fitness consequences we would have to assume that an
individual turtle detects and responds to the acoustic source, and that it could not compensate for
the energy expended during evasion and any potential lost feeding opportunities by either
immediately feeding at another location, by feeding shortly after cessation of acoustic exposure,
or by feeding at a later time. Similarly, to result in significant fitness consequences we would
have to assume that an individual turtle detects and responds to the acoustic source, and that it
could not compensate for the energy expended during evasion rather than would have been
incurred during normal migration, respiration, swimming speed, and swimming direction. There
is no indication this is the case, particularly since foraging habitat would still be available in the
environment following the cessation of acoustic exposure. Therefore, behavioral responses of
leatherback sea turtles to acoustic stressors is unlikely to lead to fitness consequences and long
term implications for the population.
501
Biological Opinion and Conference Report on Navy NWTT Activities and NMFS’ MMPA Incidental Take
Authorization PCTS FPR-2015-9110
6.10 Exposure and Response – Impulsive Stressors - Testing
The following sections discuss our analysis of impulsive stressors that are likely to adversely
affect ESA-listed species. If a stressor is likely to adversely affect any of the ESA-listed species
in the NWTT Action Area, it is discussed further in this Section.
6.10.1 Exposure and Response of Marine Mammals to Impulsive Acoustic Stressors –
Testing Activities
As with impulsive sources during training activities, we considered exposure estimates from the
Navy Acoustic Effects Model for marine mammals. First, the total number of ESA-listed species
(animats) that would be exposed to acoustic sources prior to the application of criteria. We term
these the “unprocessed” estimates. This estimate is the number of times individual animats or
animals are likely to be exposed to the acoustic environment that is a result of training exercises,
regardless of whether they are “taken” as a result of that exposure. In most cases, the number of
animals “taken” by an action would be a subset of the number of animals that are exposed to the
action because (1) in some circumstances, animals might not respond to an exposure and (2)
some responses may be negative for an individual animal without constituting a form of “take”
(for example, some physiological stress responses only have fitness consequences when they are
sustained and would only constitute a “take” as a result of cumulative exposure).
A second set of exposure estimates (“model-estimated”) of listed species were generated and
“processed” using criteria for temporary and permanent threshold shift developed by the Navy
and NMFS’ Permits Division for the purpose of identifying harassment pursuant to the MMPA.
As above, these are the estimates we use in our jeopardy analysis and determination.
Mitigation measures are effective at reducing instances of injury or mortality, but would not
further reduce potential behavioral impacts to lesser impacts due to the potential distance from
the source stressor. The Navy states that avoidance and mitigation only reduces those "Level A"
(potential to injure or kill) impacts to "Level B" impacts. In this case there are no Level A
exposures and thus the estimated amounts are not changed. In other words, neither sets of
exposure estimates, the unprocessed or processed, were adjusted to account for standard
mitigation actions that NMFS’ Permits Division requires under the MMPA rule and LOA to
avoid marine mammals, nor were the estimates adjusted to account for any avoidance responses
that might be taken by individual animals once they sense the presence of Navy vessels or
aircraft.
Estimated unprocessed exposures of marine mammals to impulsive sound from underwater
detonations during training exercises at levels greater than 120 dB SPL are summarized in the
following sections. As with these estimates for the non-impulsive sources, we do not rely on
these estimates in its jeopardy analysis.
502
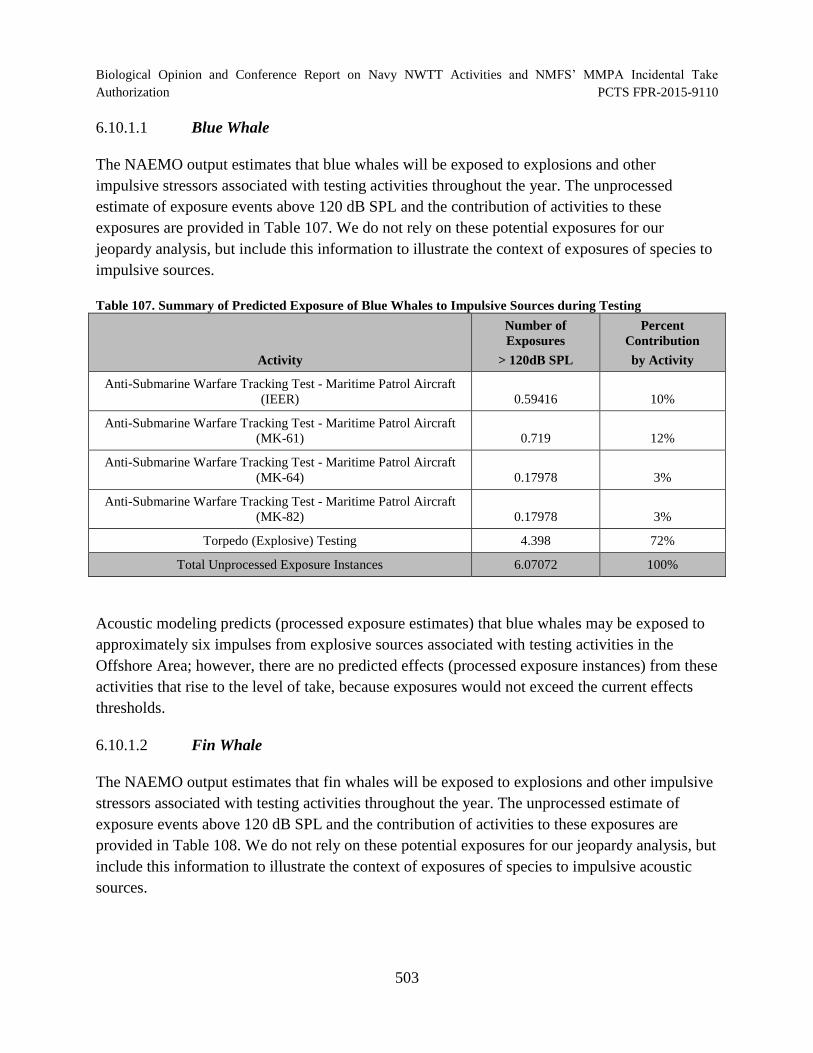
Biological Opinion and Conference Report on Navy NWTT Activities and NMFS’ MMPA Incidental Take
Authorization PCTS FPR-2015-9110
6.10.1.1 Blue Whale
The NAEMO output estimates that blue whales will be exposed to explosions and other
impulsive stressors associated with testing activities throughout the year. The unprocessed
estimate of exposure events above 120 dB SPL and the contribution of activities to these
exposures are provided in Table 107. We do not rely on these potential exposures for our
jeopardy analysis, but include this information to illustrate the context of exposures of species to
impulsive sources.
Table 107. Summary of Predicted Exposure of Blue Whales to Impulsive Sources during Testing
Activity
Number of
Exposures
> 120dB SPL
Percent
Contribution
by Activity
Anti-Submarine Warfare Tracking Test - Maritime Patrol Aircraft
(IEER) 0.59416 10%
Anti-Submarine Warfare Tracking Test - Maritime Patrol Aircraft
(MK-61) 0.719 12%
Anti-Submarine Warfare Tracking Test - Maritime Patrol Aircraft
(MK-64) 0.17978 3%
Anti-Submarine Warfare Tracking Test - Maritime Patrol Aircraft
(MK-82) 0.17978 3%
Torpedo (Explosive) Testing 4.398 72%
Total Unprocessed Exposure Instances 6.07072 100%
Acoustic modeling predicts (processed exposure estimates) that blue whales may be exposed to
approximately six impulses from explosive sources associated with testing activities in the
Offshore Area; however, there are no predicted effects (processed exposure instances) from these
activities that rise to the level of take, because exposures would not exceed the current effects
thresholds.
6.10.1.2 Fin Whale
The NAEMO output estimates that fin whales will be exposed to explosions and other impulsive
stressors associated with testing activities throughout the year. The unprocessed estimate of
exposure events above 120 dB SPL and the contribution of activities to these exposures are
provided in Table 108. We do not rely on these potential exposures for our jeopardy analysis, but
include this information to illustrate the context of exposures of species to impulsive acoustic
sources.
503
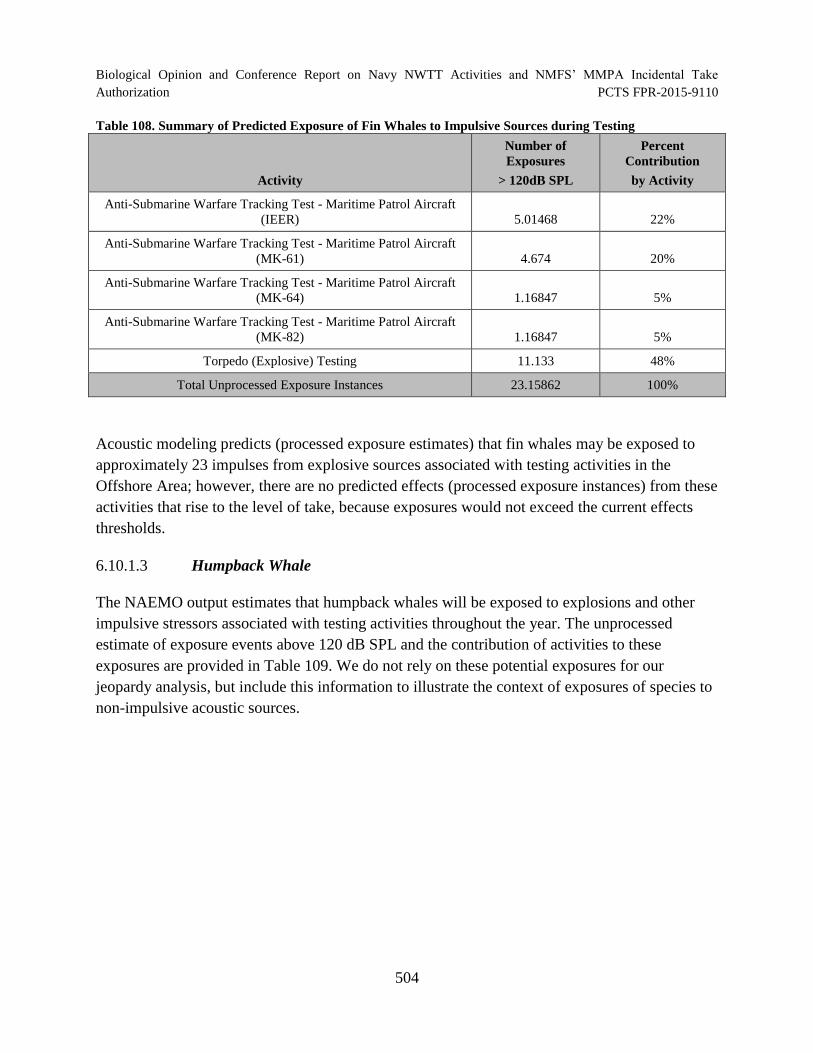
Biological Opinion and Conference Report on Navy NWTT Activities and NMFS’ MMPA Incidental Take Authorization PCTS FPR-2015-9110
Table 108. Summary of Predicted Exposure of Fin Whales to Impulsive Sources during Testing
Activity
Number of
Exposures
> 120dB SPL
Percent
Contribution
by Activity
Anti-Submarine Warfare Tracking Test - Maritime Patrol Aircraft
(IEER) 5.01468 22%
Anti-Submarine Warfare Tracking Test - Maritime Patrol Aircraft
(MK-61) 4.674 20%
Anti-Submarine Warfare Tracking Test - Maritime Patrol Aircraft
(MK-64) 1.16847 5%
Anti-Submarine Warfare Tracking Test - Maritime Patrol Aircraft
(MK-82) 1.16847 5%
Torpedo (Explosive) Testing 11.133 48%
Total Unprocessed Exposure Instances 23.15862 100%
Acoustic modeling predicts (processed exposure estimates) that fin whales may be exposed to
approximately 23 impulses from explosive sources associated with testing activities in the
Offshore Area; however, there are no predicted effects (processed exposure instances) from these
activities that rise to the level of take, because exposures would not exceed the current effects
thresholds.
6.10.1.3 Humpback Whale
The NAEMO output estimates that humpback whales will be exposed to explosions and other
impulsive stressors associated with testing activities throughout the year. The unprocessed
estimate of exposure events above 120 dB SPL and the contribution of activities to these
exposures are provided in Table 109. We do not rely on these potential exposures for our
jeopardy analysis, but include this information to illustrate the context of exposures of species to
non-impulsive acoustic sources.
504
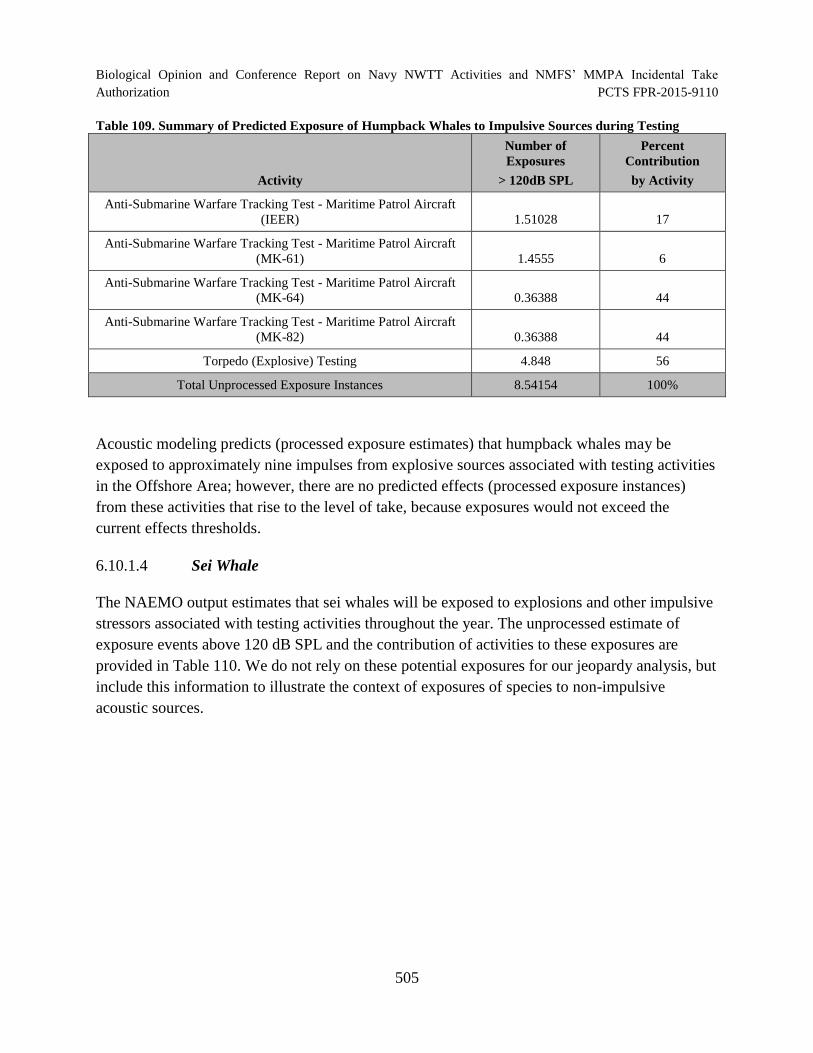
Biological Opinion and Conference Report on Navy NWTT Activities and NMFS’ MMPA Incidental Take Authorization PCTS FPR-2015-9110
Table 109. Summary of Predicted Exposure of Humpback Whales to Impulsive Sources during Testing
Activity
Number of
Exposures
> 120dB SPL
Percent
Contribution
by Activity
Anti-Submarine Warfare Tracking Test - Maritime Patrol Aircraft
(IEER) 1.51028 17
Anti-Submarine Warfare Tracking Test - Maritime Patrol Aircraft
(MK-61) 1.4555 6
Anti-Submarine Warfare Tracking Test - Maritime Patrol Aircraft
(MK-64) 0.36388 44
Anti-Submarine Warfare Tracking Test - Maritime Patrol Aircraft
(MK-82) 0.36388 44
Torpedo (Explosive) Testing 4.848 56
Total Unprocessed Exposure Instances 8.54154 100%
Acoustic modeling predicts (processed exposure estimates) that humpback whales may be
exposed to approximately nine impulses from explosive sources associated with testing activities
in the Offshore Area; however, there are no predicted effects (processed exposure instances)
from these activities that rise to the level of take, because exposures would not exceed the
current effects thresholds.
6.10.1.4 Sei Whale
The NAEMO output estimates that sei whales will be exposed to explosions and other impulsive
stressors associated with testing activities throughout the year. The unprocessed estimate of
exposure events above 120 dB SPL and the contribution of activities to these exposures are
provided in Table 110. We do not rely on these potential exposures for our jeopardy analysis, but
include this information to illustrate the context of exposures of species to non-impulsive
acoustic sources.
505
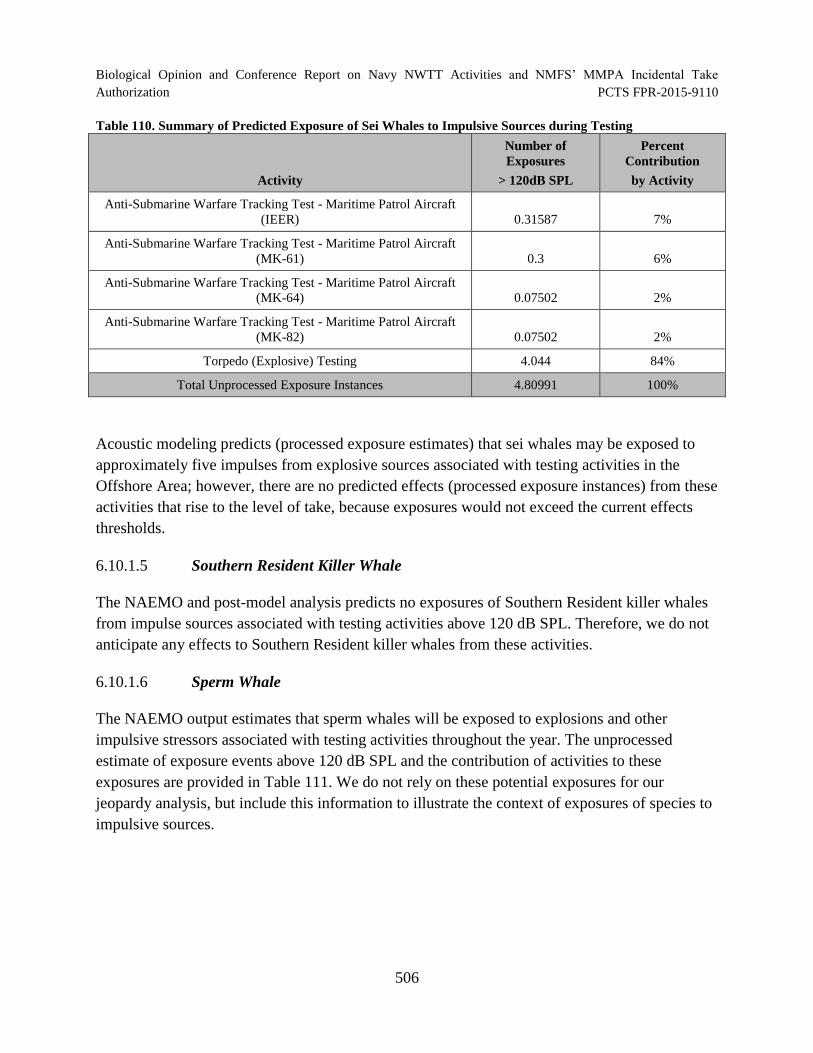
Biological Opinion and Conference Report on Navy NWTT Activities and NMFS’ MMPA Incidental Take Authorization PCTS FPR-2015-9110
Table 110. Summary of Predicted Exposure of Sei Whales to Impulsive Sources during Testing
Activity
Number of
Exposures
> 120dB SPL
Percent
Contribution
by Activity
Anti-Submarine Warfare Tracking Test - Maritime Patrol Aircraft
(IEER) 0.31587 7%
Anti-Submarine Warfare Tracking Test - Maritime Patrol Aircraft
(MK-61) 0.3 6%
Anti-Submarine Warfare Tracking Test - Maritime Patrol Aircraft
(MK-64) 0.07502 2%
Anti-Submarine Warfare Tracking Test - Maritime Patrol Aircraft
(MK-82) 0.07502 2%
Torpedo (Explosive) Testing 4.044 84%
Total Unprocessed Exposure Instances 4.80991 100%
Acoustic modeling predicts (processed exposure estimates) that sei whales may be exposed to
approximately five impulses from explosive sources associated with testing activities in the
Offshore Area; however, there are no predicted effects (processed exposure instances) from these
activities that rise to the level of take, because exposures would not exceed the current effects
thresholds.
6.10.1.5 Southern Resident Killer Whale
The NAEMO and post-model analysis predicts no exposures of Southern Resident killer whales
from impulse sources associated with testing activities above 120 dB SPL. Therefore, we do not
anticipate any effects to Southern Resident killer whales from these activities.
6.10.1.6 Sperm Whale
The NAEMO output estimates that sperm whales will be exposed to explosions and other
impulsive stressors associated with testing activities throughout the year. The unprocessed
estimate of exposure events above 120 dB SPL and the contribution of activities to these
exposures are provided in Table 111. We do not rely on these potential exposures for our
jeopardy analysis, but include this information to illustrate the context of exposures of species to
impulsive sources.
506
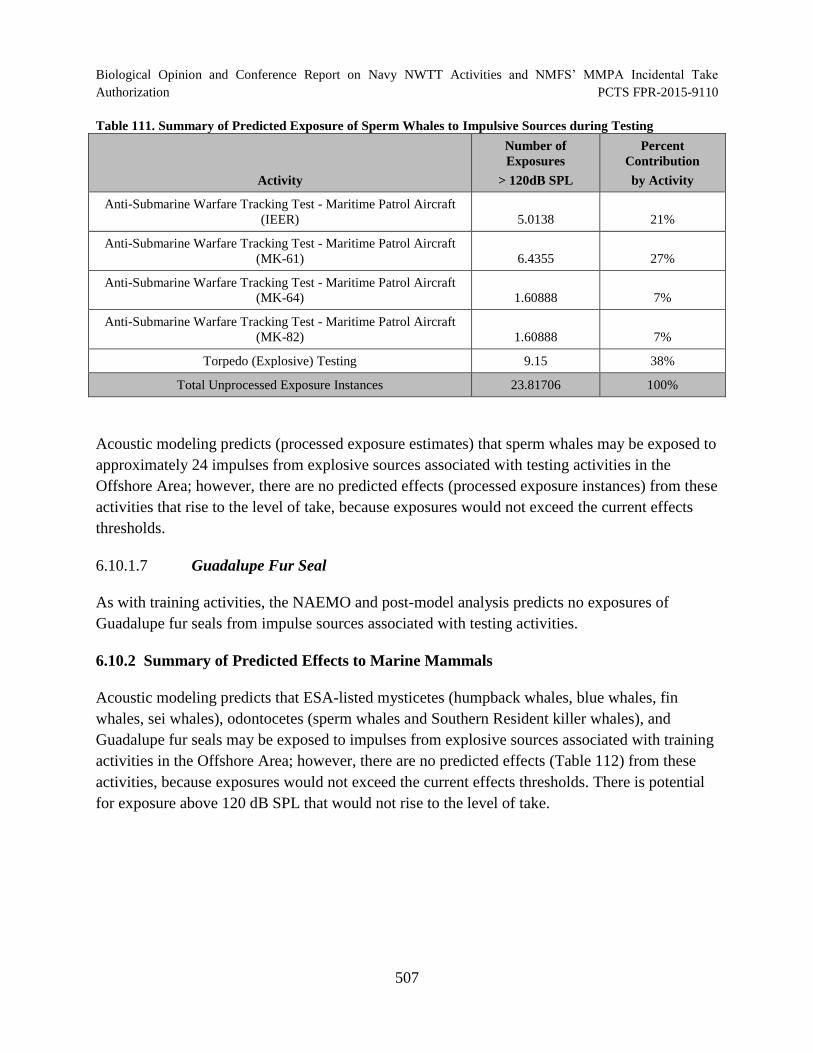
Biological Opinion and Conference Report on Navy NWTT Activities and NMFS’ MMPA Incidental Take Authorization PCTS FPR-2015-9110
Table 111. Summary of Predicted Exposure of Sperm Whales to Impulsive Sources during Testing
Activity
Number of
Exposures
> 120dB SPL
Percent
Contribution
by Activity
Anti-Submarine Warfare Tracking Test - Maritime Patrol Aircraft
(IEER) 5.0138 21%
Anti-Submarine Warfare Tracking Test - Maritime Patrol Aircraft
(MK-61) 6.4355 27%
Anti-Submarine Warfare Tracking Test - Maritime Patrol Aircraft
(MK-64) 1.60888 7%
Anti-Submarine Warfare Tracking Test - Maritime Patrol Aircraft
(MK-82) 1.60888 7%
Torpedo (Explosive) Testing 9.15 38%
Total Unprocessed Exposure Instances 23.81706 100%
Acoustic modeling predicts (processed exposure estimates) that sperm whales may be exposed to
approximately 24 impulses from explosive sources associated with testing activities in the
Offshore Area; however, there are no predicted effects (processed exposure instances) from these
activities that rise to the level of take, because exposures would not exceed the current effects
thresholds.
6.10.1.7 Guadalupe Fur Seal
As with training activities, the NAEMO and post-model analysis predicts no exposures of
Guadalupe fur seals from impulse sources associated with testing activities.
6.10.2 Summary of Predicted Effects to Marine Mammals
Acoustic modeling predicts that ESA-listed mysticetes (humpback whales, blue whales, fin
whales, sei whales), odontocetes (sperm whales and Southern Resident killer whales), and
Guadalupe fur seals may be exposed to impulses from explosive sources associated with training
activities in the Offshore Area; however, there are no predicted effects (Table 112) from these
activities, because exposures would not exceed the current effects thresholds. There is potential
for exposure above 120 dB SPL that would not rise to the level of take.
507
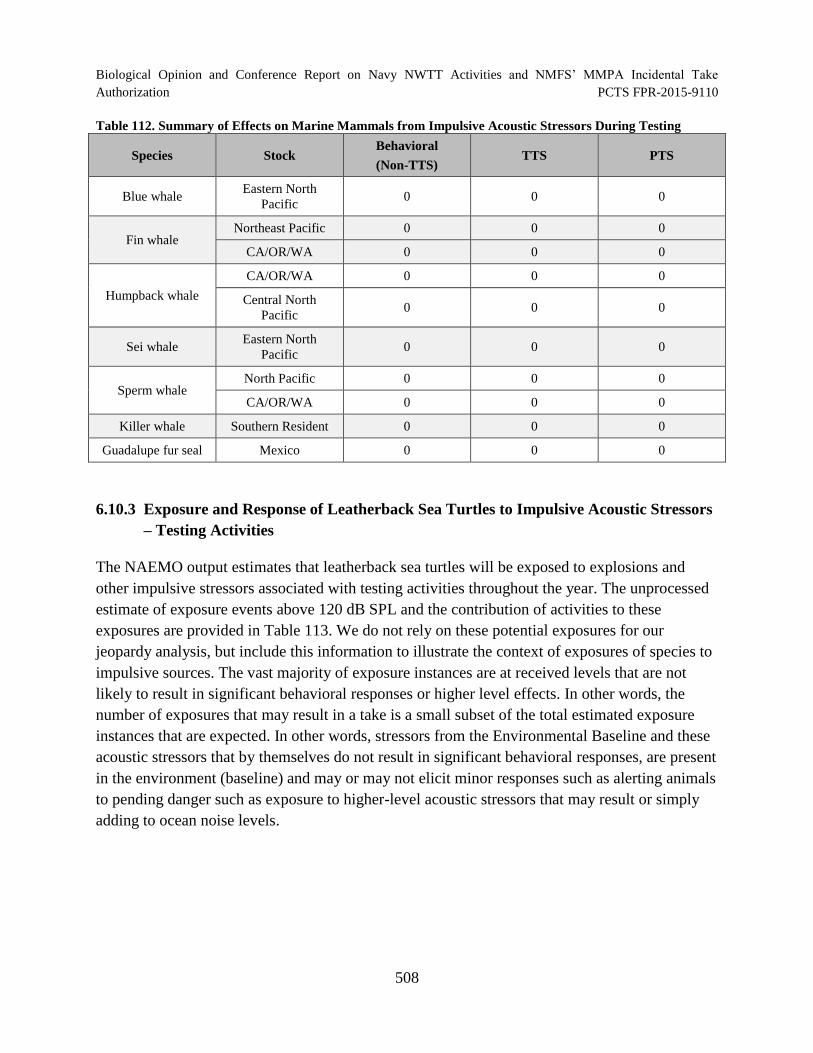
Biological Opinion and Conference Report on Navy NWTT Activities and NMFS’ MMPA Incidental Take Authorization PCTS FPR-2015-9110
Table 112. Summary of Effects on Marine Mammals from Impulsive Acoustic Stressors During Testing
Species Stock Behavioral
(Non-TTS) TTS PTS
Blue whale Eastern North
Pacific 0 0 0
Fin whale Northeast Pacific 0 0 0
CA/OR/WA 0 0 0
CA/OR/WA 0 0 0
Humpback whale Central North
Pacific 0 0 0
Sei whale Eastern North
Pacific 0 0 0
Sperm whale North Pacific 0 0 0
CA/OR/WA 0 0 0
Killer whale Southern Resident 0 0 0
Guadalupe fur seal Mexico 0 0 0
6.10.3 Exposure and Response of Leatherback Sea Turtles to Impulsive Acoustic Stressors
– Testing Activities
The NAEMO output estimates that leatherback sea turtles will be exposed to explosions and
other impulsive stressors associated with testing activities throughout the year. The unprocessed
estimate of exposure events above 120 dB SPL and the contribution of activities to these
exposures are provided in Table 113. We do not rely on these potential exposures for our
jeopardy analysis, but include this information to illustrate the context of exposures of species to
impulsive sources. The vast majority of exposure instances are at received levels that are not
likely to result in significant behavioral responses or higher level effects. In other words, the
number of exposures that may result in a take is a small subset of the total estimated exposure
instances that are expected. In other words, stressors from the Environmental Baseline and these
acoustic stressors that by themselves do not result in significant behavioral responses, are present
in the environment (baseline) and may or may not elicit minor responses such as alerting animals
to pending danger such as exposure to higher-level acoustic stressors that may result or simply
adding to ocean noise levels.
508
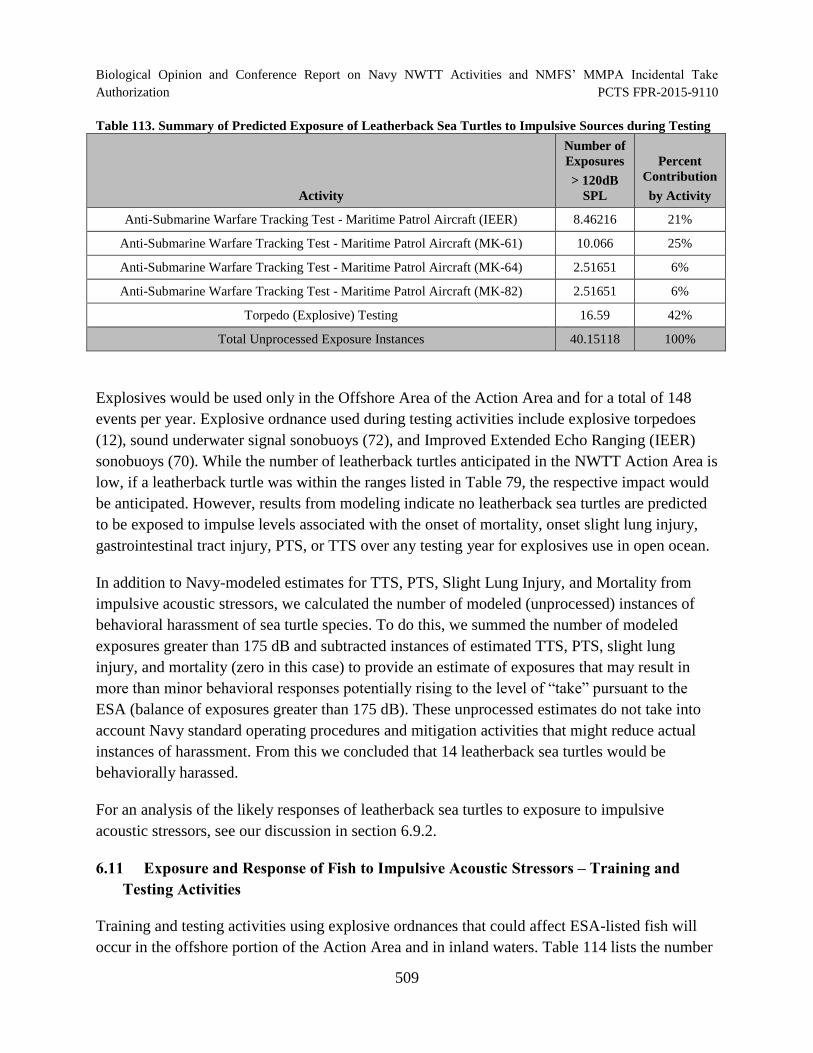
Biological Opinion and Conference Report on Navy NWTT Activities and NMFS’ MMPA Incidental Take Authorization PCTS FPR-2015-9110
Table 113. Summary of Predicted Exposure of Leatherback Sea Turtles to Impulsive Sources during Testing
Activity
Number of
Exposures
> 120dB
SPL
Percent
Contribution
by Activity
Anti-Submarine Warfare Tracking Test - Maritime Patrol Aircraft (IEER) 8.46216 21%
Anti-Submarine Warfare Tracking Test - Maritime Patrol Aircraft (MK-61) 10.066 25%
Anti-Submarine Warfare Tracking Test - Maritime Patrol Aircraft (MK-64) 2.51651 6%
Anti-Submarine Warfare Tracking Test - Maritime Patrol Aircraft (MK-82) 2.51651 6%
Torpedo (Explosive) Testing 16.59 42%
Total Unprocessed Exposure Instances 40.15118 100%
Explosives would be used only in the Offshore Area of the Action Area and for a total of 148
events per year. Explosive ordnance used during testing activities include explosive torpedoes
(12), sound underwater signal sonobuoys (72), and Improved Extended Echo Ranging (IEER)
sonobuoys (70). While the number of leatherback turtles anticipated in the NWTT Action Area is
low, if a leatherback turtle was within the ranges listed in Table 79, the respective impact would
be anticipated. However, results from modeling indicate no leatherback sea turtles are predicted
to be exposed to impulse levels associated with the onset of mortality, onset slight lung injury,
gastrointestinal tract injury, PTS, or TTS over any testing year for explosives use in open ocean.
In addition to Navy-modeled estimates for TTS, PTS, Slight Lung Injury, and Mortality from
impulsive acoustic stressors, we calculated the number of modeled (unprocessed) instances of
behavioral harassment of sea turtle species. To do this, we summed the number of modeled
exposures greater than 175 dB and subtracted instances of estimated TTS, PTS, slight lung
injury, and mortality (zero in this case) to provide an estimate of exposures that may result in
more than minor behavioral responses potentially rising to the level of “take” pursuant to the
ESA (balance of exposures greater than 175 dB). These unprocessed estimates do not take into
account Navy standard operating procedures and mitigation activities that might reduce actual
instances of harassment. From this we concluded that 14 leatherback sea turtles would be
behaviorally harassed.
For an analysis of the likely responses of leatherback sea turtles to exposure to impulsive
acoustic stressors, see our discussion in section 6.9.2.
6.11 Exposure and Response of Fish to Impulsive Acoustic Stressors – Training and
Testing Activities
Training and testing activities using explosive ordnances that could affect ESA-listed fish will
occur in the offshore portion of the Action Area and in inland waters. Table 114 lists the number
509
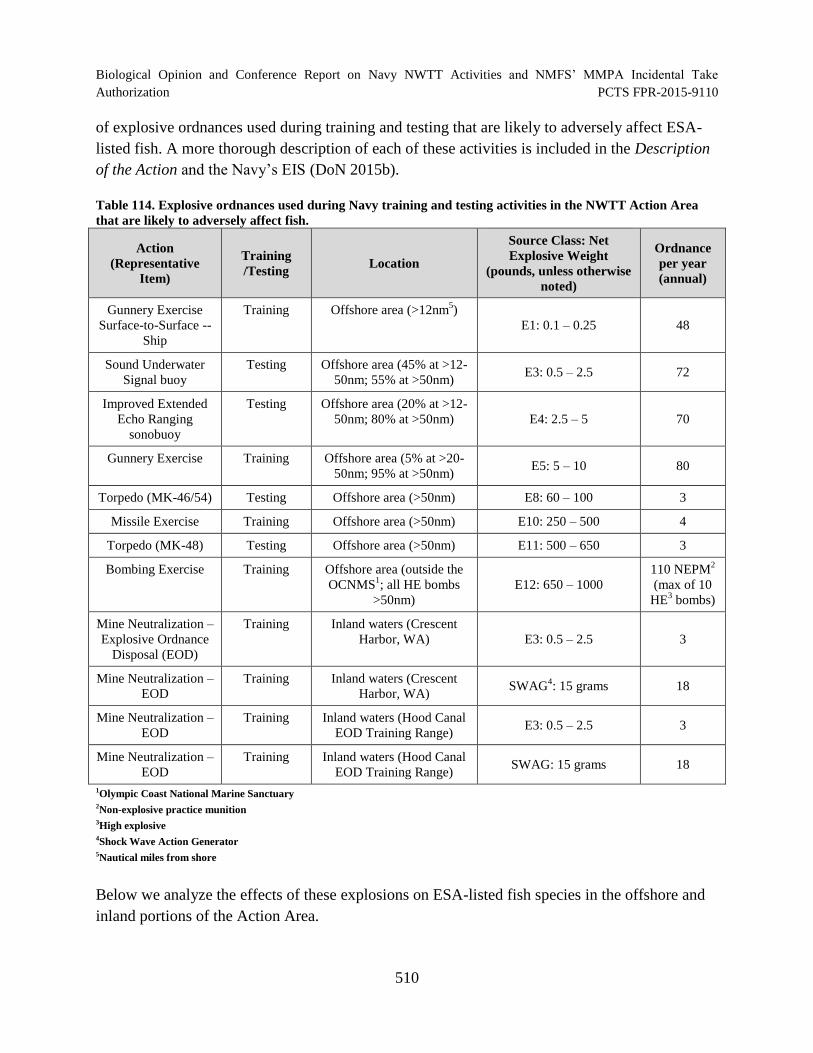
Biological Opinion and Conference Report on Navy NWTT Activities and NMFS’ MMPA Incidental Take
Authorization PCTS FPR-2015-9110
of explosive ordnances used during training and testing that are likely to adversely affect ESA-
listed fish. A more thorough description of each of these activities is included in the Description
of the Action and the Navy’s EIS (DoN 2015b).
Table 114. Explosive ordnances used during Navy training and testing activities in the NWTT Action Area
that are likely to adversely affect fish.
Action
(Representative
Item)
Training
/Testing Location
Source Class: Net
Explosive Weight
(pounds, unless otherwise
noted)
Ordnance
per year
(annual)
Gunnery Exercise
Surface-to-Surface -
Ship
Training Offshore area (>12nm5)
E1: 0.1 – 0.25 48
Sound Underwater
Signal buoy
Testing Offshore area (45% at >12
50nm; 55% at >50nm) E3: 0.5 – 2.5 72
Improved Extended
Echo Ranging
sonobuoy
Testing Offshore area (20% at >12
50nm; 80% at >50nm) E4: 2.5 – 5 70
Gunnery Exercise Training Offshore area (5% at >20
50nm; 95% at >50nm) E5: 5 – 10 80
Torpedo (MK-46/54) Testing Offshore area (>50nm) E8: 60 – 100 3
Missile Exercise Training Offshore area (>50nm) E10: 250 – 500 4
Torpedo (MK-48) Testing Offshore area (>50nm) E11: 500 – 650 3
Bombing Exercise Training Offshore area (outside the
OCNMS1; all HE bombs
>50nm)
E12: 650 – 1000
110 NEPM2
(max of 10
HE3
bombs)
Mine Neutralization –
Explosive Ordnance
Disposal (EOD)
Training Inland waters (Crescent
Harbor, WA) E3: 0.5 – 2.5 3
Mine Neutralization –
EOD
Training Inland waters (Crescent
Harbor, WA) SWAG
4: 15 grams 18
Mine Neutralization –
EOD
Training Inland waters (Hood Canal
EOD Training Range) E3: 0.5 – 2.5 3
Mine Neutralization –
EOD
Training Inland waters (Hood Canal
EOD Training Range) SWAG: 15 grams 18
1Olympic Coast National Marine Sanctuary 2Non-explosive practice munition 3High explosive 4Shock Wave Action Generator 5Nautical miles from shore
Below we analyze the effects of these explosions on ESA-listed fish species in the offshore and
inland portions of the Action Area.
510
Biological Opinion and Conference Report on Navy NWTT Activities and NMFS’ MMPA Incidental Take
Authorization PCTS FPR-2015-9110
6.11.1.1 Offshore area
It is difficult to accurately estimate the number of individuals from each ESU/DPS that will
experience adverse effects from elevated underwater noise and sound pressures in the offshore
environment because fish distribution is influenced by a number of environmental factors.
Further, salmon and steelhead from different ESUs/DPSs (some ESA-listed and some not) are
mixed in the open ocean environment (Bellinger et al. 2015), making it even more difficult to
identify how many individuals of certain ESU/DPS may be affected by an activity at a specified
location and time. Ocean salmon fisheries off the west coast of the United States are managed
using a tool that predicts cohort-based stock abundance and time and area stock compositions
(Bellinger et al. 2015). This allows managers to predict harvest levels from specific stocks of fish
in order to maximize harvest, while maintaining conservation goals. However, a similar analysis
was not possible for this Opinion because the Navy is not able to identify when and where
specific activities will occur beyond the general terms described in Section 2 (e.g., >50nm
offshore of Washington, Oregon, or California).
We estimated the number of salmon, steelhead, and eulachon (ESA-listed rockfish do not occur
in the offshore portion of the Action Area) that may be killed or injured from detonations in the
offshore environment using the acoustic threshold criteria established for this Opinion and
available information on the offshore densities and distributions of the ESA-listed fish species
considered in this Opinion. Below we summarize the information available regarding ESA-listed
fish habitat use in offshore marine waters. This information will allow us to determine which
ESUs and DPSs may be affected by a specific activity, which life stage may be affected, and to
assess the effect of underwater explosions on the ESA-listed fish species considered in this
Opinion.
6.11.1.1.1 Chinook
Chinook salmon distribution in marine waters can be identified in general terms only because it
varies seasonally and inter-annually due to a variety of environmental factors (PFMC 2014).
Two general life history strategies have been described for Chinook outmigrating from their
natal rivers: subyearling life history types which enter marine waters during their first year of life
and tend to remain in shallow coastal waters, and yearling types, which spend more time in
freshwater before migrating to the ocean, and migrate further offshore and north faster than
subyearlings (Burke et al. 2013). Additionally, some Chinook salmon originating from Puget
Sound remain within the Salish Sea throughout their lives, before returning to their natal systems
as adults to spawn (Chamberlin et al. 2011). In general, once Chinook leave their natal rivers,
they use the cool, upwelled waters of the continental shelf for migration and feeding (Bellinger et
al. 2015). Juvenile Chinook salmon are generally found within 55 km of the Washington,
Oregon, and California coast, with the vast majority found less than 28 km offshore (Fisher and
511
Biological Opinion and Conference Report on Navy NWTT Activities and NMFS’ MMPA Incidental Take
Authorization PCTS FPR-2015-9110
Pearcy 1995; Pearcy and Fisher 1990; PFMC 2014). Bi et al. (2011) similarly found that while
juvenile Chinook can occur in more offshore, deeper waters, they are most abundant on the inner
continental shelf at a median depth of 55 meters. Bi et al. (2007) found that subyearling,
yearling, and subadult Chinook salmon abundances were negatively correlated with depth.
Peterson et al. (2010) found that during sampling of continental shelf and oceanic waters of the
Pacific Northwest, juvenile salmonids were found almost exclusively in continental shelf waters.
Coded wire tag recoveries from high seas fisheries and tagging programs suggest Chinook
salmon do utilize areas outside the continental shelf. Commercial fisheries catch data suggest
that most maturing Chinook salmon off the West Coast of the continental United States are
found within 60 km of the coast (PFMC 2014). Chinook are thought to be less surface oriented
than other Pacific salmon, most abundant at depths of 30 to 70 m, and most often caught as
adults in commercial troll fisheries at depths of 30 m or greater (PFMC 2014). However, juvenile
Chinook salmon are known to be more abundant than adults near the surface, most frequently
found at depths of less than 37 m (Fisher and Pearcy 1995). Walker et al. (2007) observed
Chinook at an average depth of 42 meters. Through observations of 883 purse seine net sets off
the Oregon and Washington coast, Pearcy and Fisher (1990) did not find any evidence of large
schools of juvenile salmonids.
Migratory patterns of Chinook salmon can vary greatly within and among populations (PFMC
2014), but some general patterns have been described. For example, Chinook salmon originating
from north of Cape Blanco in Oregon tend to migrate towards the Gulf of Alaska, whereas those
originating south of Cape Blanco tend to migrate west and south to forage in waters off Oregon
and California (PFMC 2014). Weitkamp (2010) examined coded wire-tag recovery data and
found that Chinook salmon originating from a particular freshwater region share a common
marine distribution. Chinook originating from Washington and Oregon were recovered within an
area from their respective state coasts to southeast Alaska, and fish originating from southern
Oregon and California were generally only recovered off the coast of Oregon and California.
While these general patterns have been observed, Weitkamp and Neely (2002) suggested that
Pacific salmon, including Chinook, exhibit high diversity in ocean migration patterns, rivaling
the variability that has been well demonstrated in freshwater life history. Celewycz et al. (2014)
presented data analyzing Chinook salmon distribution in the eastern North Pacific Ocean from
coded wire tag recoveries. Significant variability in ocean distribution was observed. For
example, Chinook salmon from Washington and Oregon were recovered as far north as Bristol
Bay, but as far south as northern California. Chinook salmon from Idaho were recovered as far
north as the Gulf of Alaska and as far south as northern California. However, most recoveries
occurred off the Washington coast and west of Vancouver Island. Chinook from the Puget Sound
ESU are generally found in ocean environments from the Washington coast to the west coast of
Vancouver Island, though a small percentage are recovered as far north as Alaska (NMFS
2008a). Bellinger et al. (2015) used genetic stock identification techniques in the ocean salmon
troll fishery and found Puget Sound salmon as far south as Fort Bragg, California. Chinook from
512
Biological Opinion and Conference Report on Navy NWTT Activities and NMFS’ MMPA Incidental Take
Authorization PCTS FPR-2015-9110
the Lower Columbia River ESU are found as far north as Alaska (NMFS 2008a), but as far south
as offshore of San Francisco (Bellinger et al. 2015). Upper Willamette River Chinook are
thought to be a far north migrating stock (NMFS 2008a), though Bellinger et al. (2015) observed
individuals from this ESU caught as far south as the Klamath River region. The center of Snake
River fall-run ESUs ocean distribution is thought to be located off the west coast of Vancouver
Island (NMFS 2008a), though they have been found as far south as the Bay Area, California
(Bellinger et al. 2015). Bellinger et al. (2015) also observed Central Valley spring-run Chinook
caught in Central Oregon Coast fisheries. The California coastal ESU of Chinook salmon
appears to be widely distributed along the mainland west coast of the U.S., with Bellinger et al.
(2015) observed individuals from this ESU from Northern Oregon to south of Monterey Bay.
This encompassed the author’s entire study area, indicating the species’ distribution could range
even further.
A number of factors can drive variation in migratory pathways for Chinook salmon. Bi et al.
(2011) found that copepod community structure helps determine salmon distribution in oceanic
waters because it provides useful information on ocean conditions (i.e., strength of upwelling).
Burke et al. (2013) found that Columbia River yearling Chinook salmon have stock-specific
spatial distributions in the marine environment that shift through time. The authors found that
geospatial variation (e.g., latitude and distance from shore) drove habitat selection in the marine
environment more than environmental variation (e.g., chlorophyll a and temperature), potentially
leading individuals to select habitat areas with suboptimal environmental conditions. Bi et al.
(2007) indicated that coho abundance was strongly correlated with variations in chlorophyll a
concentrations (which vary annually), and observed large temporal variations in overall habitat
usage in waters off the Washington and Oregon coast. Sampling in 2003 and 2000 indicated
large areas of habitat usage off the coast of Washington and Oregon, whereas the total area of
habitat usage was lower in 2001, 2002, and 2004. This study also highlighted the variability in
habitat selection by life stage with subyearling and subadult Chinook found closer to shore than
yearling Chinook.
6.11.1.1.2 Coho
In general, once coho leave their natal rivers, they use the cool, upwelled waters of the
continental shelf for migration and feeding (Bellinger et al. 2015). Two general patterns have
been described for coho salmon once they emigrate from freshwater with some spending several
weeks in coastal waters before migrating north and offshore, and others remaining in coastal
waters for at least the first summer before migrating north (PFMC 2014). The degree to which
juveniles migrate offshore appears to depend on the strength of upwelling, with strong upwelling
years leading to wider dispersal, farther from shore (Pearcy 1992). Juvenile coho appear to be
distributed further offshore than juvenile Chinook. Bi et al. (2011) observed juvenile coho to be
most abundant at a median depth of 88 m and Chinook to be most abundant at a median depth of
513

Biological Opinion and Conference Report on Navy NWTT Activities and NMFS’ MMPA Incidental Take
Authorization PCTS FPR-2015-9110
58 m. While coho can be found further offshore, juvenile and maturing coho salmon are most
abundant within 60 km off the coasts of Washington, Oregon, and California (PFMC 2014). The
majority of juveniles are found within 37 km of the coast (Pearcy 1992; Pearcy and Fisher 1990).
Similarly, Bi et al. (2007) found that abundance of yearling and subadult coho was negatively
correlated with depth.
In marine waters, coho are generally found within the upper portion of the water column (PFMC
2014). Walker et al. (2007) found that the average depth of coho salmon in the North Pacific
Ocean was 11 meters. Through observations of 883 purse seine net sets off the Oregon and
Washington coast, Pearcy and Fisher (1990) did not find any evidence of large schools of
juvenile salmonids.
Similar to Chinook, coho salmon distribution in the marine environment varies considerably
among seasons, years, life stages, and populations. Weitkamp and Neely (2002) provided
evidence that coho salmon exhibit high diversity in ocean migration patterns, rivaling the
variability that has been well demonstrated in freshwater life history. The authors also showed
that coho salmon from different freshwater regions inhabit different areas of the coastal ocean,
identifying 12 distinct ocean distribution patterns from California to Alaska. However, despite
these general patterns, fish from a given population were widely distributed in the coastal ocean
(Weitkamp and Neely 2002). Bi et al. (2007) indicated that coho abundance was strongly
correlated with variations in chlorophyll a concentrations (which vary annually), and observed
large temporal variations in overall habitat usage in waters off the Washington and Oregon coast.
Sampling in 2003 and 2000 indicated large areas of habitat usage off the coast of Washington
and Oregon, whereas the area of habitat usage was lower in 2001, 2002, and 2004. This study
also highlighted the variability in habitat selection by life stage with subadult coho found closer
to shore than yearling coho.
6.11.1.1.3 Chum
The ocean distribution of chum is thought to be the broadest of any Pacific salmon (Neave et al.
1976), with the species found throughout the North Pacific Ocean north of the
Oregon/Washington border. In general, chum move north and west along the coast upon entering
saltwater, and have moved offshore by the end of their first ocean year (Byron and Burke 2014;
Quinn 2005). Pearcy and Fisher (1990) observed the highest CPUE of juvenile chum inshore of
37 km, though some were caught over 55 km offshore. Hartt and Dell (1986) observed that the
vast majority of juvenile chum from Washington state migrate northward within a narrow coastal
belt less than 20nm miles. Though juvenile chum salmon are generally believed to migrate far to
the north by the late summer after they have entered saltwater in the spring (Hartt and Dell
1986), Pearcy and Fisher (1990) suggest that at least some individuals reside in coastal
Washington waters for several months after they enter the marine environment. Some data
514
Biological Opinion and Conference Report on Navy NWTT Activities and NMFS’ MMPA Incidental Take
Authorization PCTS FPR-2015-9110
suggests that Puget Sound chum, including those in the ESU, may not make an extended
migration into northern British Columbian and Alaskan waters, but instead may travel directly
offshore into the north Pacific Ocean (Hartt and Dell 1986). Pearcy and Fisher (1990) noted that
juvenile chum salmon were less abundant than either coho or chinook salmon off the Oregon and
Washington coast. Chum salmon are known to be surface oriented, using the upper 20 meters of
the water column 78 percent of the time during the day and 95 percent of the time at night. The
remaining time, they can be found down to depths of 60 meters (Ishida et al. 1997). Similarly,
Walker et al. (2007) found the average depth of chum salmon to be 16 meters in the North
Pacific Ocean. Through observations of 883 purse seine net sets off the Oregon and Washington
coast, Pearcy and Fisher (1990) did not find any evidence of large schools of juvenile salmonids.
Data from Neave et al. (1976) indicated that catches of chum salmon in the NWTT Action Area
off the coast of the continental US were lower than areas further to the north and further offshore
(e.g., the Gulf of Alaska, the Bering Sea, and areas far offshore in the North Pacific).
6.11.1.1.4 Sockeye
In general, it is thought that sockeye follow a similar migration pattern as chum once they enter
the ocean, moving north and west along the coast, and have moved offshore by the end of their
first ocean year (Byron and Burke 2014; Quinn 2005). Previously, French et al. (1976c)
summarized the general migration pattern of sockeye salmon originating in the various
tributaries of the northeastern Pacific Ocean from the Alaska Peninsula to the Columbia River.
Tag recovery data indicated a general mixing of these stocks during their residence in the
northeastern Pacific Ocean. These fish primarily occur east of 160oW and north of 48
oN (north of
the NWTT Action Area). It is thought that most fish originating from these areas have departed
the high seas by early August of their second year at sea, to return to their natal rivers to spawn
(French et al. 1976c). Pearcy and Fisher (1990) observed the highest CPUE of juvenile sockeye
inshore of 37 km, though some were caught over 55 km offshore. They noted that, similar to
juvenile chum salmon, juvenile sockeye salmon were less abundant than either coho or salmon
off the Oregon and Washington coast. Through observations of 883 purse seine net sets off the
Oregon and Washington coast, Pearcy and Fisher (1990) did not find any evidence of large
schools of juvenile salmonids.
ESA-listed sockeye salmon from Redfish Lake, Idaho and Ozette Lake, Washington may occur
in the offshore Action Area prior to and during their migration north of their natal watersheds.
Tucker et al. (2009) caught juvenile sockeye salmon originating from the Columbia River
(inclusive of Redfish Lake sockeye) and the Washington coast (inclusive of Lake Ozette
sockeye) from May through August. By October, all juvenile sockeye from these areas had
moved north to waters off Vancouver Island, southeast Alaska, and the Gulf of Alaska.
Northward migration is thought to be rapid for juvenile sockeye. For example, Tucker et al.
515

Biological Opinion and Conference Report on Navy NWTT Activities and NMFS’ MMPA Incidental Take
Authorization PCTS FPR-2015-9110
(2009) recovered three coded wire tagged sockeye and determined that each had traveled
between 1,800 and 2,500 km in under two months at an estimated travel rate of 40-48 km/day.
Walker et al. (2007) recorded the vertical distribution of salmonids in North Pacific Ocean using
data storage tags. The authors found that the average depth for sockeye was three meters, though
the species was found down to 83 meters.
6.11.1.1.5 Steelhead
Steelhead are thought to rely heavily on offshore marine waters for feeding, with high seas
tagging programs indicating steelhead make more extensive migrations offshore in their first
year than any other Pacific salmonids (Quinn and Myers 2004). Commercial fisheries catch data
indicate similar trends (Quinn and Myers 2004). The species spends approximately 1-3 years in
freshwater, then migrates rapidly through estuaries, bypassing coastal migration routes of other
salmonids, moving into oceanic offshore feeding grounds (Daly et al. 2014; Quinn and Myers
2004). Daly et al. (2014) analyzed NOAA Fisheries pelagic trawl survey data from off the coast
of Oregon and Washington that targeted early marine phase juvenile salmonids to learn more
about the distribution of steelhead in marine waters. Juvenile steelhead were consistently caught
at the westernmost stations (>55km from shore) indicating a more offshore distribution for the
species. Further, some of the steelhead that were caught in these far offshore waters had only
been in saltwater for 1-3 days, indicating a rapid offshore migration (Daly et al. 2014). The
results of Daly et al. (2014) were consistent with those presented by Pearcy and Fisher (1990),
who found that catches of juvenile steelhead were generally highest at stations located more than
28 km from shore. Light et al. (1989) mapped the ocean distribution of steelhead in the North
Pacific using catch per unit effort data from U.S., Canadian, USSR, and Japanese research
vessels fishing with purse seines, gill nets, and longlines. Steelhead were distributed across the
North Pacific throughout the year, but were in higher abundance closer to the US and Canadian
coasts in spring and winter, and more evenly distributed in summer and fall.
Tagging and diet studies indicate that adult and juvenile steelhead are surface oriented, spending
most of their time in the upper portions of the water column (Daly et al. 2014). Walker et al.
(2007) summarized information from a series of studies off British Columbia looking at the
vertical distribution of steelhead and found the species spends 72 percent of its time in the top 1
m of the water column, with few movements below 7 m.
6.11.1.1.6 Eulachon
Eulachon appear to live near the ocean bottom, or on the continental shelf at depths most
commonly of 20 to 200 m, though they may occur as deep as 500 m (NMFS 2006a). The species
typically spends 3 to 5 years in saltwater before returning to freshwater to spawn.
516
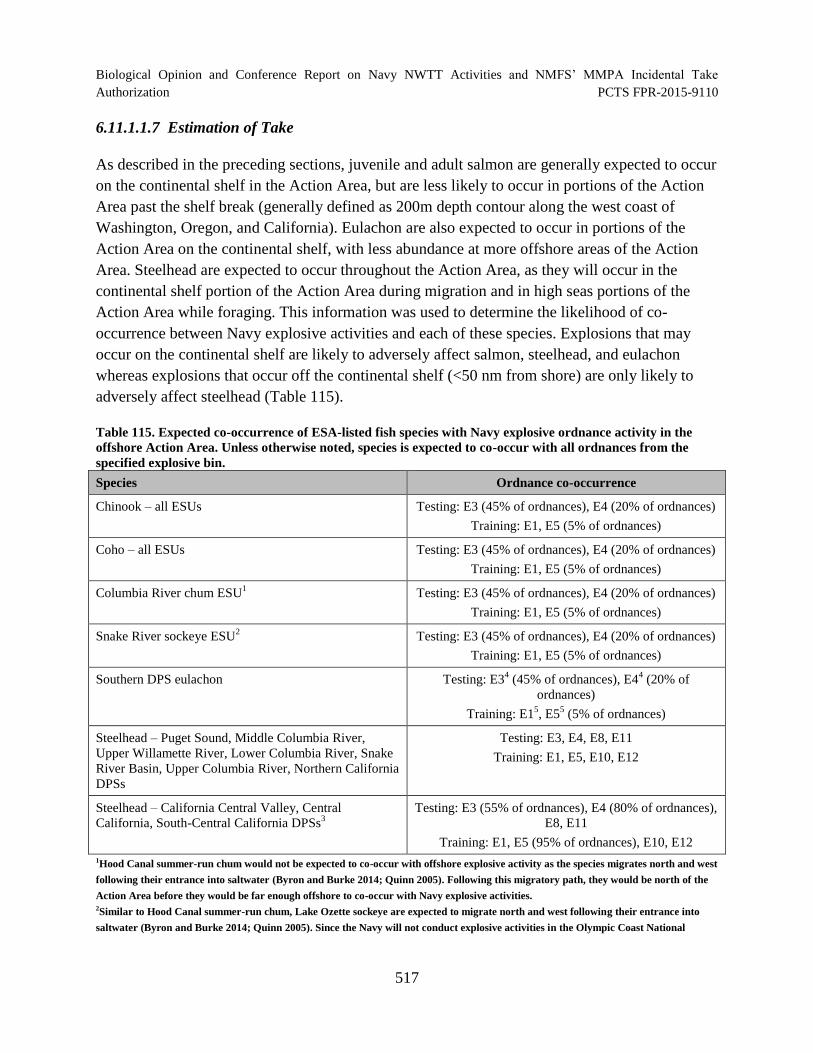
Biological Opinion and Conference Report on Navy NWTT Activities and NMFS’ MMPA Incidental Take
Authorization PCTS FPR-2015-9110
6.11.1.1.7 Estimation of Take
As described in the preceding sections, juvenile and adult salmon are generally expected to occur
on the continental shelf in the Action Area, but are less likely to occur in portions of the Action
Area past the shelf break (generally defined as 200m depth contour along the west coast of
Washington, Oregon, and California). Eulachon are also expected to occur in portions of the
Action Area on the continental shelf, with less abundance at more offshore areas of the Action
Area. Steelhead are expected to occur throughout the Action Area, as they will occur in the
continental shelf portion of the Action Area during migration and in high seas portions of the
Action Area while foraging. This information was used to determine the likelihood of co-
occurrence between Navy explosive activities and each of these species. Explosions that may
occur on the continental shelf are likely to adversely affect salmon, steelhead, and eulachon
whereas explosions that occur off the continental shelf (<50 nm from shore) are only likely to
adversely affect steelhead (Table 115).
Table 115. Expected co-occurrence of ESA-listed fish species with Navy explosive ordnance activity in the
offshore Action Area. Unless otherwise noted, species is expected to co-occur with all ordnances from the
specified explosive bin.
Species Ordnance co-occurrence
Chinook – all ESUs Testing: E3 (45% of ordnances), E4 (20% of ordnances)
Training: E1, E5 (5% of ordnances)
Coho – all ESUs Testing: E3 (45% of ordnances), E4 (20% of ordnances)
Training: E1, E5 (5% of ordnances)
Columbia River chum ESU1
Testing: E3 (45% of ordnances), E4 (20% of ordnances)
Training: E1, E5 (5% of ordnances)
Snake River sockeye ESU2
Testing: E3 (45% of ordnances), E4 (20% of ordnances)
Training: E1, E5 (5% of ordnances)
Southern DPS eulachon Testing: E34
(45% of ordnances), E44
(20% of
ordnances)
Training: E15 , E5
5 (5% of ordnances)
Steelhead – Puget Sound, Middle Columbia River,
Upper Willamette River, Lower Columbia River, Snake
River Basin, Upper Columbia River, Northern California
DPSs
Testing: E3, E4, E8, E11
Training: E1, E5, E10, E12
Steelhead – California Central Valley, Central
California, South-Central California DPSs3
Testing: E3 (55% of ordnances), E4 (80% of ordnances),
E8, E11
Training: E1, E5 (95% of ordnances), E10, E12
1Hood Canal summer-run chum would not be expected to co-occur with offshore explosive activity as the species migrates north and west
following their entrance into saltwater (Byron and Burke 2014; Quinn 2005). Following this migratory path, they would be north of the
Action Area before they would be far enough offshore to co-occur with Navy explosive activities. 2Similar to Hood Canal summer-run chum, Lake Ozette sockeye are expected to migrate north and west following their entrance into
saltwater (Byron and Burke 2014; Quinn 2005). Since the Navy will not conduct explosive activities in the Olympic Coast National
517
Biological Opinion and Conference Report on Navy NWTT Activities and NMFS’ MMPA Incidental Take
Authorization PCTS FPR-2015-9110
Marine Sanctuary and considering this migratory path, Lake Ozette sockeye would be expected to be north of the Action Area before
they would be far enough offshore to co-occur with Navy explosive activities. 3Steelhead from these DPSs originate from rivers south of the Action Area. Because, steelhead migrate rapidly through estuaries,
bypassing coastal migration routes of other salmonids, moving into oceanic offshore feeding grounds (Daly et al. 2014; Quinn and Myers
2004), we would not expect individuals from these DPSs to co-occur with explosions that may occur on the continental shelf. However,
based on their life history strategy of maturing in oceanic waters throughout the North Pacific (Light et al. 1989), we would expect
individuals from these DPSs to be present in portions of the Action Area off the continental shelf (> 50nm from shore). 4Detonations in these explosive bins are expected to occur at > 30 meter water depths and therefore, would be expected to co-occur with
eulachon. 5Detonations in these explosive bins will occur at the surface. Based on the small range to effects for eulachon in these explosive bins and
the depth at which this species would be expected to occur, we do not expect eulachon would experience injurious underwater sound
levels from detonations in this explosive bin.
For each ESA-listed salmon and eulachon ESU and steelhead DPS, we estimated a density of
animals in the offshore Action Area based on information regarding the species’ distribution and
abundance. The 2015 biological opinion analyzing the effects of NMFS Southwest Fisheries
Science Center (SWFSC) proposed research activities on ESA-listed species contained the latest
information on salmon and steelhead abundance (i.e., outmigrants and adults)(NMFS 2015). This
information is presented in Table 116.
518
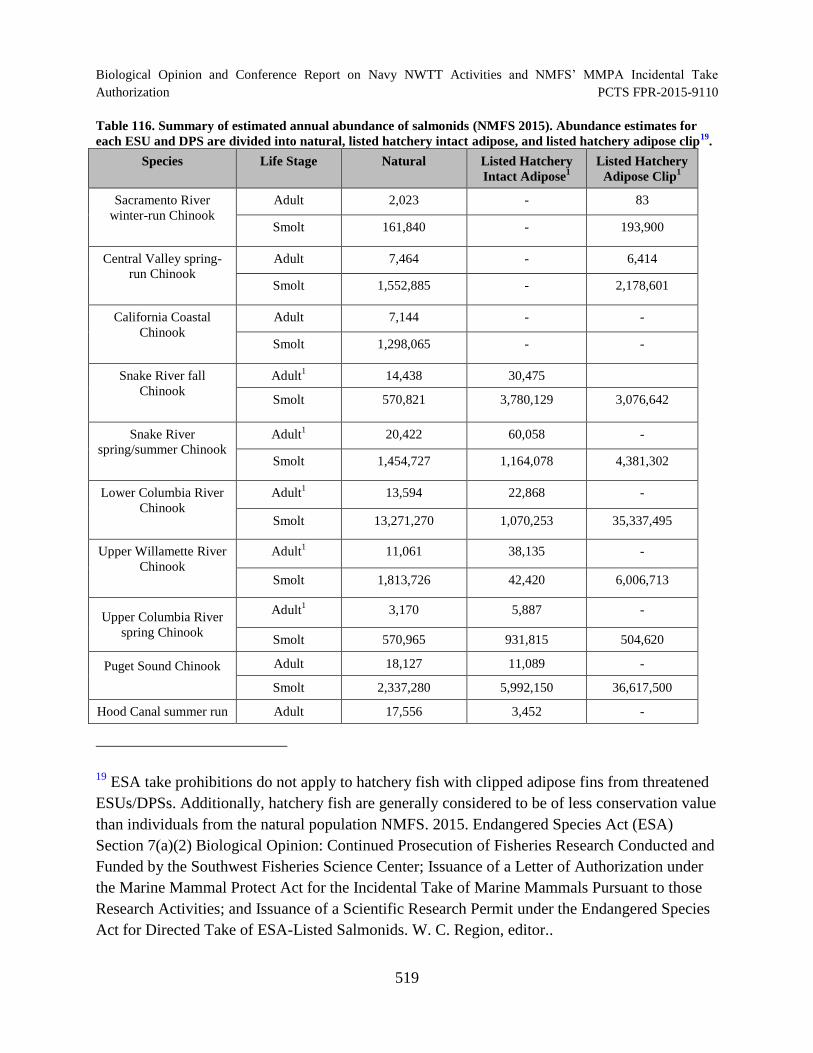
Biological Opinion and Conference Report on Navy NWTT Activities and NMFS’ MMPA Incidental Take
Authorization PCTS FPR-2015-9110
Table 116. Summary of estimated annual abundance of salmonids (NMFS 2015). Abundance estimates for
each ESU and DPS are divided into natural, listed hatchery intact adipose, and listed hatchery adipose clip19
.
Species Life Stage Natural Listed Hatchery
Intact Adipose1
Listed Hatchery
Adipose Clip1
Sacramento River
winter-run Chinook
Adult 2,023 - 83
Smolt 161,840 - 193,900
Central Valley spring-
run Chinook
Adult 7,464 - 6,414
Smolt 1,552,885 - 2,178,601
California Coastal
Chinook
Adult 7,144 - -
Smolt 1,298,065 - -
Snake River fall
Chinook
Adult1
14,438 30,475
Smolt 570,821 3,780,129 3,076,642
Snake River
spring/summer Chinook
Adult1
20,422 60,058 -
Smolt 1,454,727 1,164,078 4,381,302
Lower Columbia River
Chinook
Adult1
13,594 22,868 -
Smolt 13,271,270 1,070,253 35,337,495
Upper Willamette River
Chinook
Adult1
11,061 38,135 -
Smolt 1,813,726 42,420 6,006,713
Upper Columbia River
spring Chinook
Adult1
3,170 5,887 -
Smolt 570,965 931,815 504,620
Puget Sound Chinook Adult 18,127 11,089 -
Smolt 2,337,280 5,992,150 36,617,500
Hood Canal summer run Adult 17,556 3,452 -
19 ESA take prohibitions do not apply to hatchery fish with clipped adipose fins from threatened
ESUs/DPSs. Additionally, hatchery fish are generally considered to be of less conservation value
than individuals from the natural population NMFS. 2015. Endangered Species Act (ESA)
Section 7(a)(2) Biological Opinion: Continued Prosecution of Fisheries Research Conducted and
Funded by the Southwest Fisheries Science Center; Issuance of a Letter of Authorization under
the Marine Mammal Protect Act for the Incidental Take of Marine Mammals Pursuant to those
Research Activities; and Issuance of a Scientific Research Permit under the Endangered Species
Act for Directed Take of ESA-Listed Salmonids. W. C. Region, editor..
519
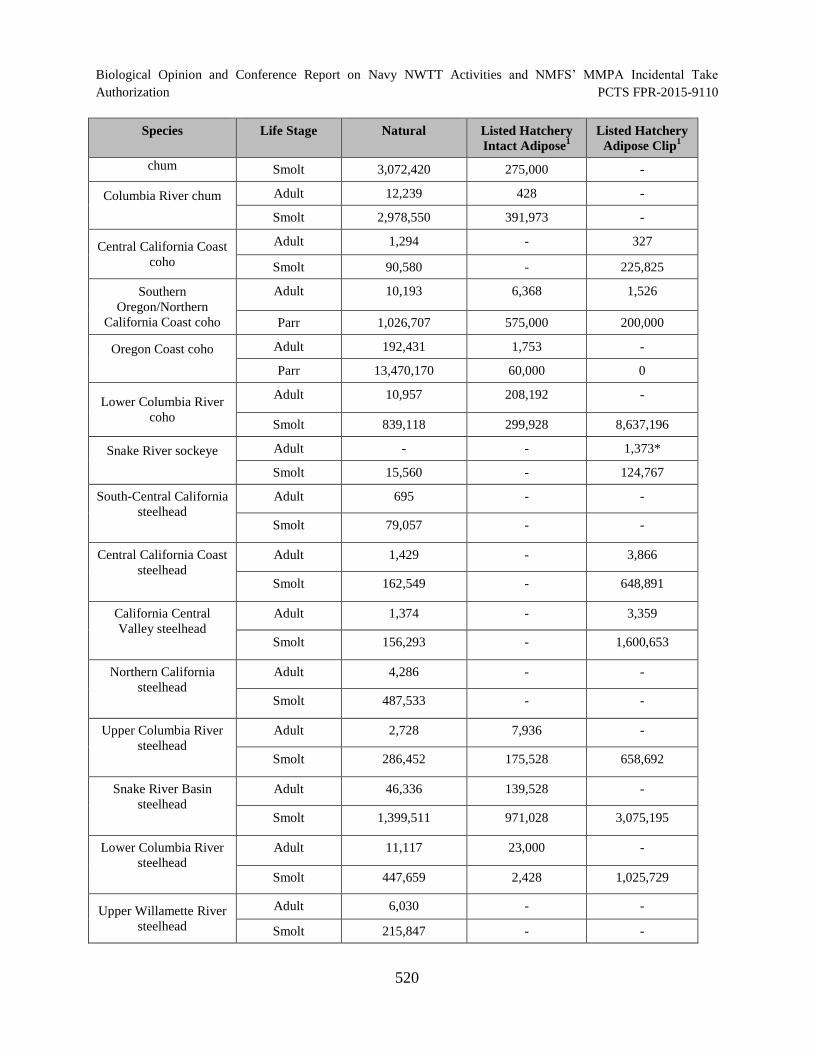
Biological Opinion and Conference Report on Navy NWTT Activities and NMFS’ MMPA Incidental Take Authorization PCTS FPR-2015-9110
Species Life Stage Natural Listed Hatchery
Intact Adipose1
Listed Hatchery
Adipose Clip1
chum Smolt 3,072,420 275,000 -
Columbia River chum Adult 12,239 428 -
Smolt 2,978,550 391,973 -
Central California Coast
coho
Adult 1,294 - 327
Smolt 90,580 - 225,825
Southern
Oregon/Northern
California Coast coho
Adult 10,193 6,368 1,526
Parr 1,026,707 575,000 200,000
Oregon Coast coho Adult 192,431 1,753 -
Parr 13,470,170 60,000 0
Lower Columbia River
coho
Adult 10,957 208,192 -
Smolt 839,118 299,928 8,637,196
Snake River sockeye Adult - - 1,373*
Smolt 15,560 - 124,767
South-Central California
steelhead
Adult 695 - -
Smolt 79,057 - -
Central California Coast
steelhead
Adult 1,429 - 3,866
Smolt 162,549 - 648,891
California Central
Valley steelhead
Adult 1,374 - 3,359
Smolt 156,293 - 1,600,653
Northern California
steelhead
Adult 4,286 - -
Smolt 487,533 - -
Upper Columbia River
steelhead
Adult 2,728 7,936 -
Smolt 286,452 175,528 658,692
Snake River Basin
steelhead
Adult 46,336 139,528 -
Smolt 1,399,511 971,028 3,075,195
Lower Columbia River
steelhead
Adult 11,117 23,000 -
Smolt 447,659 2,428 1,025,729
Upper Willamette River
steelhead
Adult 6,030 - -
Smolt 215,847 - -
520
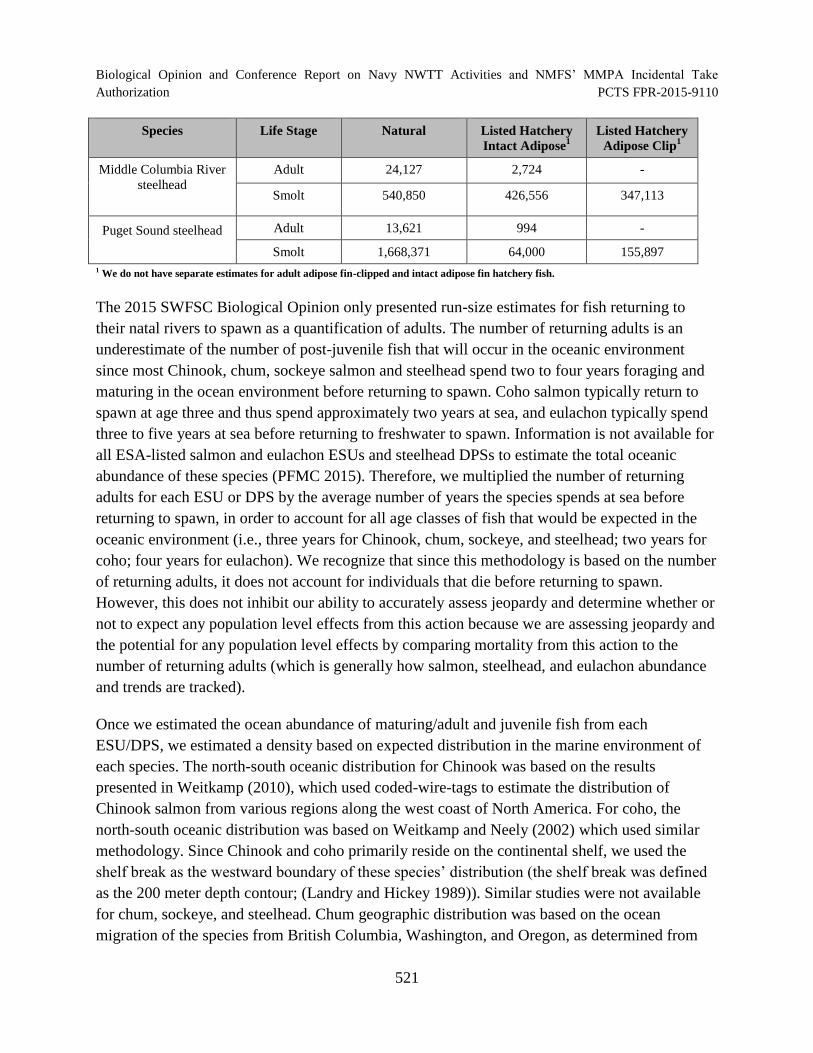
Biological Opinion and Conference Report on Navy NWTT Activities and NMFS’ MMPA Incidental Take Authorization PCTS FPR-2015-9110
Species Life Stage Natural Listed Hatchery
Intact Adipose1
Listed Hatchery
Adipose Clip1
Middle Columbia River
steelhead
Adult 24,127 2,724 -
Smolt 540,850 426,556 347,113
Puget Sound steelhead Adult 13,621 994 -
Smolt 1,668,371 64,000 155,897
1 We do not have separate estimates for adult adipose fin-clipped and intact adipose fin hatchery fish.
The 2015 SWFSC Biological Opinion only presented run-size estimates for fish returning to
their natal rivers to spawn as a quantification of adults. The number of returning adults is an
underestimate of the number of post-juvenile fish that will occur in the oceanic environment
since most Chinook, chum, sockeye salmon and steelhead spend two to four years foraging and
maturing in the ocean environment before returning to spawn. Coho salmon typically return to
spawn at age three and thus spend approximately two years at sea, and eulachon typically spend
three to five years at sea before returning to freshwater to spawn. Information is not available for
all ESA-listed salmon and eulachon ESUs and steelhead DPSs to estimate the total oceanic
abundance of these species (PFMC 2015). Therefore, we multiplied the number of returning
adults for each ESU or DPS by the average number of years the species spends at sea before
returning to spawn, in order to account for all age classes of fish that would be expected in the
oceanic environment (i.e., three years for Chinook, chum, sockeye, and steelhead; two years for
coho; four years for eulachon). We recognize that since this methodology is based on the number
of returning adults, it does not account for individuals that die before returning to spawn.
However, this does not inhibit our ability to accurately assess jeopardy and determine whether or
not to expect any population level effects from this action because we are assessing jeopardy and
the potential for any population level effects by comparing mortality from this action to the
number of returning adults (which is generally how salmon, steelhead, and eulachon abundance
and trends are tracked).
Once we estimated the ocean abundance of maturing/adult and juvenile fish from each
ESU/DPS, we estimated a density based on expected distribution in the marine environment of
each species. The north-south oceanic distribution for Chinook was based on the results
presented in Weitkamp (2010), which used coded-wire-tags to estimate the distribution of
Chinook salmon from various regions along the west coast of North America. For coho, the
north-south oceanic distribution was based on Weitkamp and Neely (2002) which used similar
methodology. Since Chinook and coho primarily reside on the continental shelf, we used the
shelf break as the westward boundary of these species’ distribution (the shelf break was defined
as the 200 meter depth contour; (Landry and Hickey 1989)). Similar studies were not available
for chum, sockeye, and steelhead. Chum geographic distribution was based on the ocean
migration of the species from British Columbia, Washington, and Oregon, as determined from
521
Biological Opinion and Conference Report on Navy NWTT Activities and NMFS’ MMPA Incidental Take
Authorization PCTS FPR-2015-9110
tagging data and presented in Neave et al. (1976). The migration pattern described in Neave et al.
(1976) did not include information on individuals found immediately offshore of their river of
origin in Oregon and Washington. Chum migrate north and west once they leave their river of
origin (Byron and Burke 2014; Quinn 2005) and are generally found on the continental shelf,
inshore of 37 km from the coast (Pearcy and Fisher 1990). Therefore, we added the area of the
continental shelf from each ESU’s river of origin north to the mouth of Puget Sound (the area
southernmost point where Neave et al. (1976) presented tagging data). We used the same
geographic distribution for sockeye as we did for chum because in general, it is thought that
sockeye follow a similar migration pattern once they enter the ocean, moving north and west
along the coast, and having moved offshore by the end of their first ocean year (Byron and Burke
2014; Quinn 2005). For steelhead, we relied on the geographic ocean distribution of the species
described in Light et al. (1989). We used the distribution of the species during winter, where they
were most geographically condensed. This resulted in a higher species density that would have
been estimated in other seasons, and therefore likely overestimates impacts to steelhead for
detonations that occur in spring, summer, and fall. Since we do not know when Navy detonations
will occur, using this distribution is more conservative for the species since we are assessing
impacts to the species should a worst-case scenario be implemented (i.e., all detonations
occurring in winter when the species is most densely distributed). However, it is more likely that
Navy explosive activities will be spread out more evenly throughout the seasons during times
when steelhead are also more widely dispersed. Based on the distribution information presented
above, we used ArcMap version 10.2.1 (ESRI, Redlands, CA) to determine the area (km2) of
habitat in the offshore portion of the Action Area that each species ESU or DPS is known to
occupy (Table 117).
522
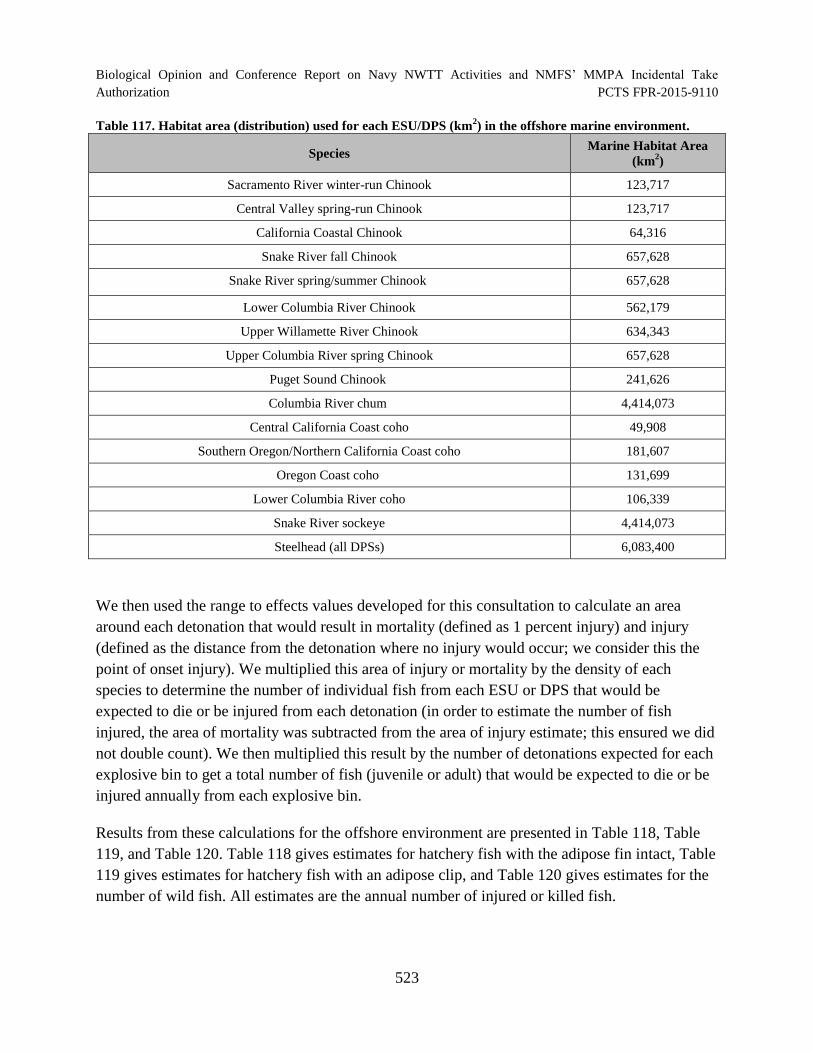
Biological Opinion and Conference Report on Navy NWTT Activities and NMFS’ MMPA Incidental Take Authorization PCTS FPR-2015-9110
Table 117. Habitat area (distribution) used for each ESU/DPS (km2) in the offshore marine environment.
Species Marine Habitat Area
(km2)
Sacramento River winter-run Chinook 123,717
Central Valley spring-run Chinook 123,717
California Coastal Chinook 64,316
Snake River fall Chinook 657,628
Snake River spring/summer Chinook 657,628
Lower Columbia River Chinook 562,179
Upper Willamette River Chinook 634,343
Upper Columbia River spring Chinook 657,628
Puget Sound Chinook 241,626
Columbia River chum 4,414,073
Central California Coast coho 49,908
Southern Oregon/Northern California Coast coho 181,607
Oregon Coast coho 131,699
Lower Columbia River coho 106,339
Snake River sockeye 4,414,073
Steelhead (all DPSs) 6,083,400
We then used the range to effects values developed for this consultation to calculate an area
around each detonation that would result in mortality (defined as 1 percent injury) and injury
(defined as the distance from the detonation where no injury would occur; we consider this the
point of onset injury). We multiplied this area of injury or mortality by the density of each
species to determine the number of individual fish from each ESU or DPS that would be
expected to die or be injured from each detonation (in order to estimate the number of fish
injured, the area of mortality was subtracted from the area of injury estimate; this ensured we did
not double count). We then multiplied this result by the number of detonations expected for each
explosive bin to get a total number of fish (juvenile or adult) that would be expected to die or be
injured annually from each explosive bin.
Results from these calculations for the offshore environment are presented in Table 118, Table
119, and Table 120. Table 118 gives estimates for hatchery fish with the adipose fin intact, Table
119 gives estimates for hatchery fish with an adipose clip, and Table 120 gives estimates for the
number of wild fish. All estimates are the annual number of injured or killed fish.
523
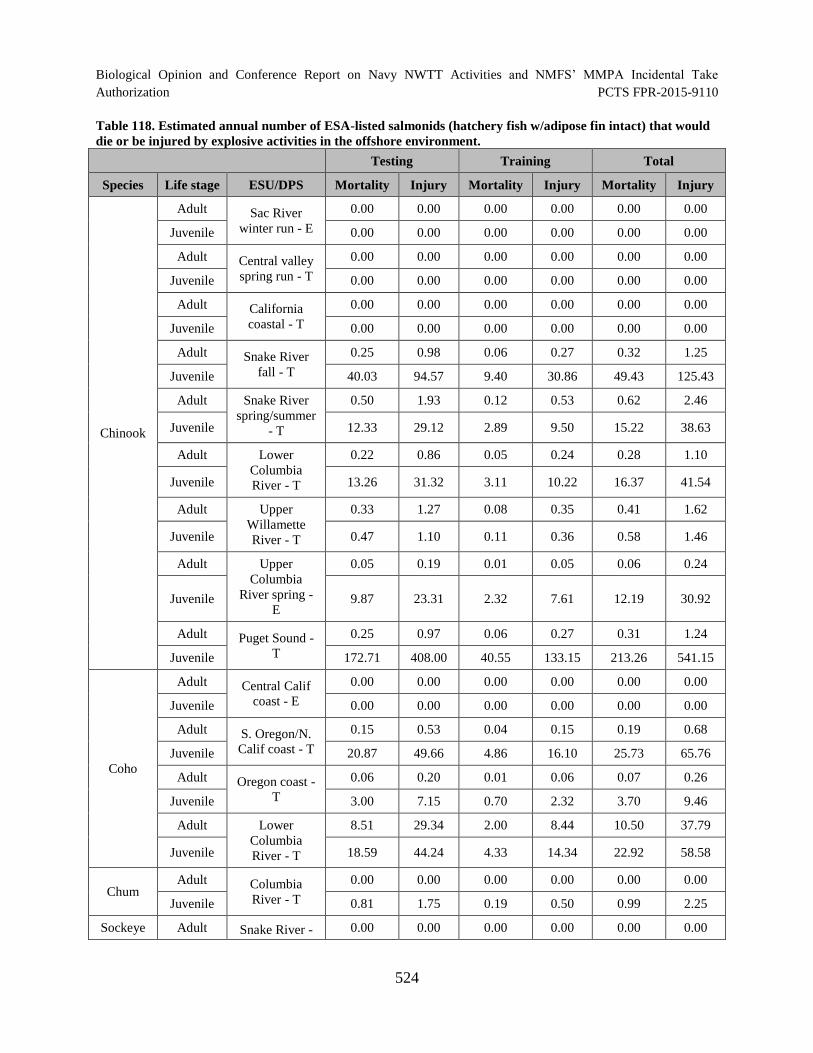
Biological Opinion and Conference Report on Navy NWTT Activities and NMFS’ MMPA Incidental Take
Authorization PCTS FPR-2015-9110
Table 118. Estimated annual number of ESA-listed salmonids (hatchery fish w/adipose fin intact) that would
die or be injured by explosive activities in the offshore environment.
Testing Training Total
Species Life stage ESU/DPS Mortality Injury Mortality Injury Mortality Injury
Chinook
Adult Sac River
winter run - E
0.00 0.00 0.00 0.00 0.00 0.00
Juvenile 0.00 0.00 0.00 0.00 0.00 0.00
Adult Central valley
spring run - T
0.00 0.00 0.00 0.00 0.00 0.00
Juvenile 0.00 0.00 0.00 0.00 0.00 0.00
Adult California
coastal - T
0.00 0.00 0.00 0.00 0.00 0.00
Juvenile 0.00 0.00 0.00 0.00 0.00 0.00
Adult Snake River
fall - T
0.25 0.98 0.06 0.27 0.32 1.25
Juvenile 40.03 94.57 9.40 30.86 49.43 125.43
Adult Snake River
spring/summer
- T
0.50 1.93 0.12 0.53 0.62 2.46
Juvenile 12.33 29.12 2.89 9.50 15.22 38.63
Adult Lower
Columbia
River - T
0.22 0.86 0.05 0.24 0.28 1.10
Juvenile 13.26 31.32 3.11 10.22 16.37 41.54
Adult Upper
Willamette
River - T
0.33 1.27 0.08 0.35 0.41 1.62
Juvenile 0.47 1.10 0.11 0.36 0.58 1.46
Adult Upper
Columbia
River spring
E
0.05 0.19 0.01 0.05 0.06 0.24
Juvenile 9.87 23.31 2.32 7.61 12.19 30.92
Adult Puget Sound
T
0.25 0.97 0.06 0.27 0.31 1.24
Juvenile 172.71 408.00 40.55 133.15 213.26 541.15
Coho
Adult Central Calif
coast - E
0.00 0.00 0.00 0.00 0.00 0.00
Juvenile 0.00 0.00 0.00 0.00 0.00 0.00
Adult S. Oregon/N.
Calif coast - T
0.15 0.53 0.04 0.15 0.19 0.68
Juvenile 20.87 49.66 4.86 16.10 25.73 65.76
Adult Oregon coast
T
0.06 0.20 0.01 0.06 0.07 0.26
Juvenile 3.00 7.15 0.70 2.32 3.70 9.46
Adult Lower
Columbia
River - T
8.51 29.34 2.00 8.44 10.50 37.79
Juvenile 18.59 44.24 4.33 14.34 22.92 58.58
Chum Adult Columbia
River - T
0.00 0.00 0.00 0.00 0.00 0.00
Juvenile 0.81 1.75 0.19 0.50 0.99 2.25
Sockeye Adult Snake River 0.00 0.00 0.00 0.00 0.00 0.00
524

Biological Opinion and Conference Report on Navy NWTT Activities and NMFS’ MMPA Incidental Take Authorization PCTS FPR-2015-9110
Testing Training Total
Species Life stage ESU/DPS Mortality Injury Mortality Injury Mortality Injury
Juvenile E 0.00 0.00 0.00 0.00 0.00 0.00
Steelhead
Adult South-Central
California - T
0.00 0.00 0.00 0.00 0.00 0.00
Juvenile 0.00 0.00 0.00 0.00 0.00 0.00
Adult Central Calif
T
0.00 0.00 0.00 0.00 0.00 0.00
Juvenile 0.00 0.00 0.00 0.00 0.00 0.00
Adult California
Central Valley
- T
0.00 0.00 0.00 0.00 0.00 0.00
Juvenile 0.00 0.00 0.00 0.00 0.00 0.00
Adult Northern Calif
- T
0.00 0.00 0.00 0.00 0.00 0.00
Juvenile 0.00 0.00 0.00 0.00 0.00 0.00
Adult Upper
Columbia
River - E
0.06 0.15 0.03 0.05 0.08 0.20
Juvenile 0.78 1.69 0.36 0.67 1.14 2.36
Adult Snake River
basin - T
1.03 2.67 0.46 0.90 1.49 3.58
Juvenile 4.30 9.32 2.00 3.71 6.30 13.03
Adult Lower
Columbia
River - T
0.17 0.44 0.08 0.15 0.25 0.59
Juvenile 0.01 0.02 0.00 0.01 0.02 0.03
Adult Upper
Willamette
River - T
0.00 0.00 0.00 0.00 0.00 0.00
Juvenile 0.00 0.00 0.00 0.00 0.00 0.00
Adult Middle
Columbia
River - T
0.02 0.05 0.01 0.02 0.03 0.07
Juvenile 1.89 4.10 0.88 1.63 2.77 5.72
Adult Puget Sound
T
0.01 0.02 0.00 0.01 0.01 0.03
Juvenile 0.28 0.61 0.13 0.24 0.42 0.86
525
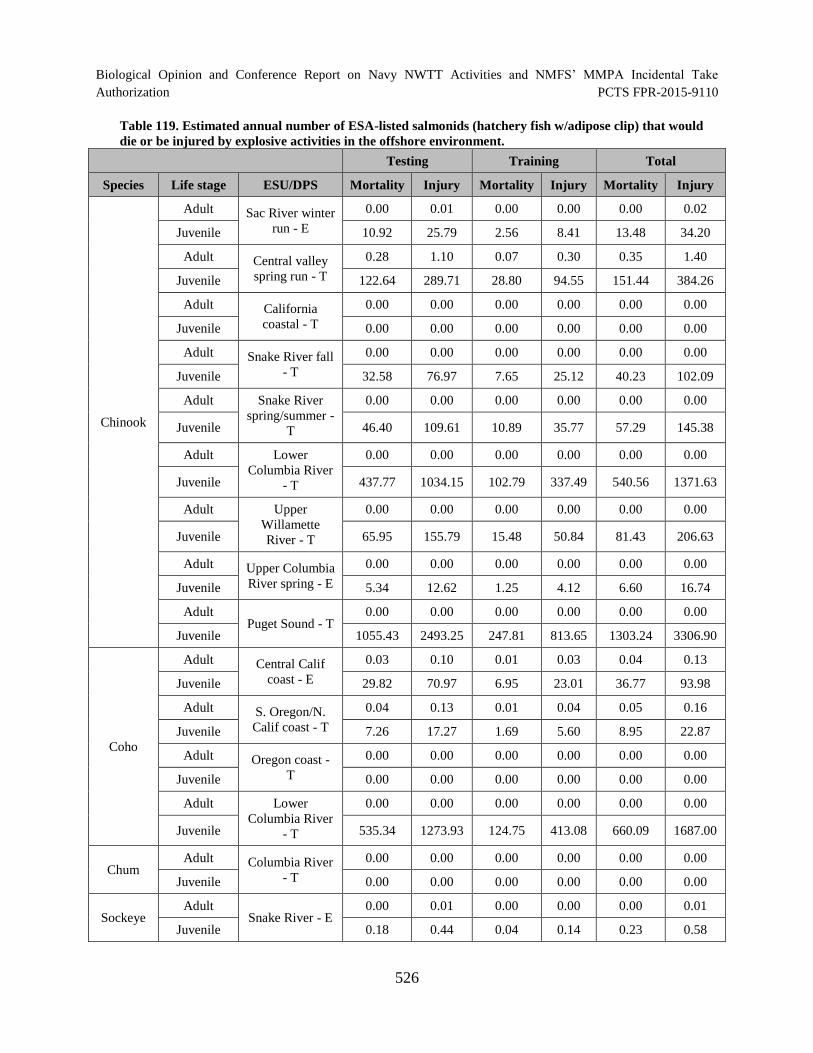
Biological Opinion and Conference Report on Navy NWTT Activities and NMFS’ MMPA Incidental Take
Authorization PCTS FPR-2015-9110
Table 119. Estimated annual number of ESA-listed salmonids (hatchery fish w/adipose clip) that would
die or be injured by explosive activities in the offshore environment.
Testing Training Total
Species Life stage ESU/DPS Mortality Injury Mortality Injury Mortality Injury
Chinook
Adult Sac River winter
run - E
0.00 0.01 0.00 0.00 0.00 0.02
Juvenile 10.92 25.79 2.56 8.41 13.48 34.20
Adult Central valley
spring run - T
0.28 1.10 0.07 0.30 0.35 1.40
Juvenile 122.64 289.71 28.80 94.55 151.44 384.26
Adult California
coastal - T
0.00 0.00 0.00 0.00 0.00 0.00
Juvenile 0.00 0.00 0.00 0.00 0.00 0.00
Adult Snake River fall
- T
0.00 0.00 0.00 0.00 0.00 0.00
Juvenile 32.58 76.97 7.65 25.12 40.23 102.09
Adult Snake River
spring/summer
T
0.00 0.00 0.00 0.00 0.00 0.00
Juvenile 46.40 109.61 10.89 35.77 57.29 145.38
Adult Lower
Columbia River
- T
0.00 0.00 0.00 0.00 0.00 0.00
Juvenile 437.77 1034.15 102.79 337.49 540.56 1371.63
Adult Upper
Willamette
River - T
0.00 0.00 0.00 0.00 0.00 0.00
Juvenile 65.95 155.79 15.48 50.84 81.43 206.63
Adult Upper Columbia
River spring - E
0.00 0.00 0.00 0.00 0.00 0.00
Juvenile 5.34 12.62 1.25 4.12 6.60 16.74
Adult Puget Sound - T
0.00 0.00 0.00 0.00 0.00 0.00
Juvenile 1055.43 2493.25 247.81 813.65 1303.24 3306.90
Coho
Adult Central Calif
coast - E
0.03 0.10 0.01 0.03 0.04 0.13
Juvenile 29.82 70.97 6.95 23.01 36.77 93.98
Adult S. Oregon/N.
Calif coast - T
0.04 0.13 0.01 0.04 0.05 0.16
Juvenile 7.26 17.27 1.69 5.60 8.95 22.87
Adult Oregon coast
T
0.00 0.00 0.00 0.00 0.00 0.00
Juvenile 0.00 0.00 0.00 0.00 0.00 0.00
Adult Lower
Columbia River
- T
0.00 0.00 0.00 0.00 0.00 0.00
Juvenile 535.34 1273.93 124.75 413.08 660.09 1687.00
Chum Adult Columbia River
- T
0.00 0.00 0.00 0.00 0.00 0.00
Juvenile 0.00 0.00 0.00 0.00 0.00 0.00
Sockeye Adult
Snake River - E 0.00 0.01 0.00 0.00 0.00 0.01
Juvenile 0.18 0.44 0.04 0.14 0.23 0.58
526
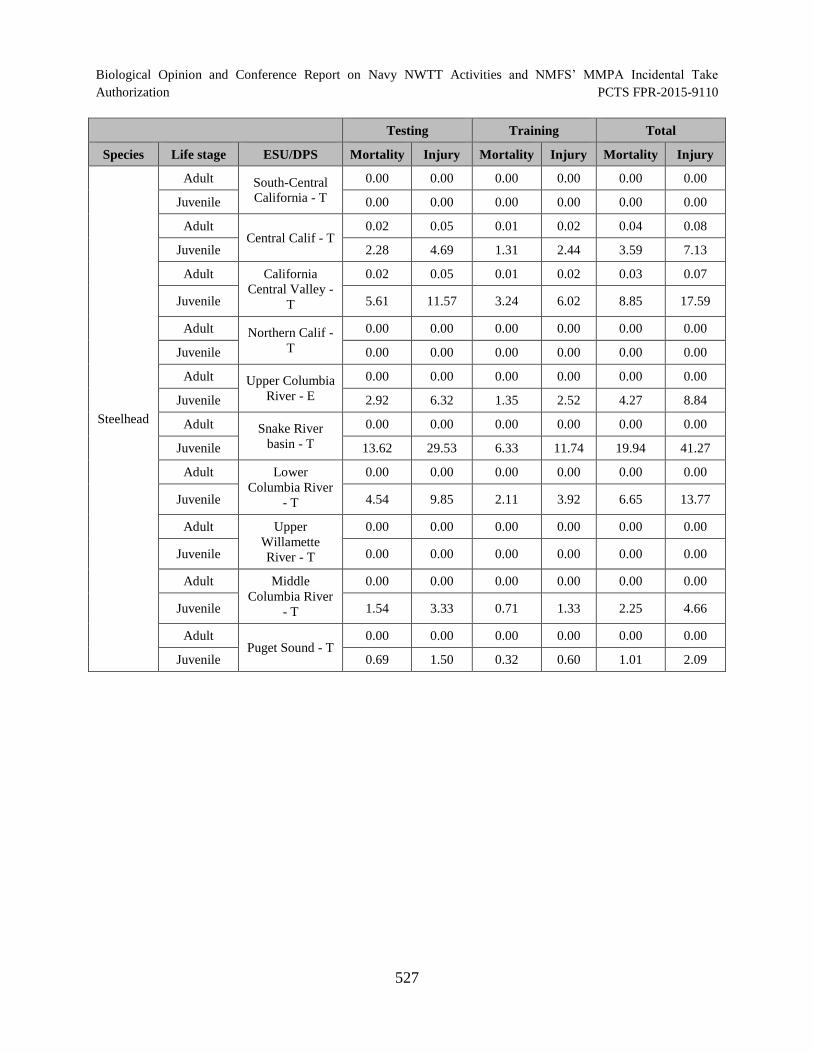
Biological Opinion and Conference Report on Navy NWTT Activities and NMFS’ MMPA Incidental Take Authorization PCTS FPR-2015-9110
Testing Training Total
Species Life stage ESU/DPS Mortality Injury Mortality Injury Mortality Injury
Steelhead
Adult South-Central
California - T
0.00 0.00 0.00 0.00 0.00 0.00
Juvenile 0.00 0.00 0.00 0.00 0.00 0.00
Adult Central Calif - T
0.02 0.05 0.01 0.02 0.04 0.08
Juvenile 2.28 4.69 1.31 2.44 3.59 7.13
Adult California
Central Valley
T
0.02 0.05 0.01 0.02 0.03 0.07
Juvenile 5.61 11.57 3.24 6.02 8.85 17.59
Adult Northern Calif
T
0.00 0.00 0.00 0.00 0.00 0.00
Juvenile 0.00 0.00 0.00 0.00 0.00 0.00
Adult Upper Columbia
River - E
0.00 0.00 0.00 0.00 0.00 0.00
Juvenile 2.92 6.32 1.35 2.52 4.27 8.84
Adult Snake River
basin - T
0.00 0.00 0.00 0.00 0.00 0.00
Juvenile 13.62 29.53 6.33 11.74 19.94 41.27
Adult Lower
Columbia River
- T
0.00 0.00 0.00 0.00 0.00 0.00
Juvenile 4.54 9.85 2.11 3.92 6.65 13.77
Adult Upper
Willamette
River - T
0.00 0.00 0.00 0.00 0.00 0.00
Juvenile 0.00 0.00 0.00 0.00 0.00 0.00
Adult Middle
Columbia River
- T
0.00 0.00 0.00 0.00 0.00 0.00
Juvenile 1.54 3.33 0.71 1.33 2.25 4.66
Adult Puget Sound - T
0.00 0.00 0.00 0.00 0.00 0.00
Juvenile 0.69 1.50 0.32 0.60 1.01 2.09
527
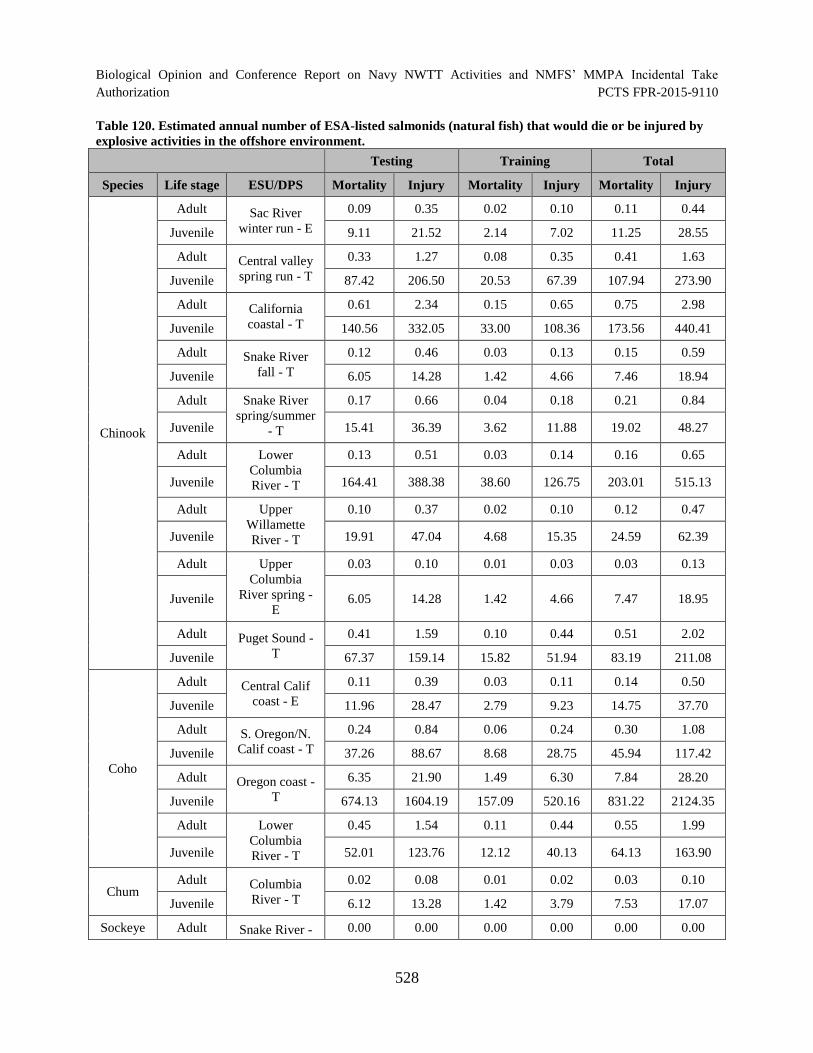
Biological Opinion and Conference Report on Navy NWTT Activities and NMFS’ MMPA Incidental Take
Authorization PCTS FPR-2015-9110
Table 120. Estimated annual number of ESA-listed salmonids (natural fish) that would die or be injured by
explosive activities in the offshore environment.
Testing Training Total
Species Life stage ESU/DPS Mortality Injury Mortality Injury Mortality Injury
Chinook
Adult Sac River
winter run - E
0.09 0.35 0.02 0.10 0.11 0.44
Juvenile 9.11 21.52 2.14 7.02 11.25 28.55
Adult Central valley
spring run - T
0.33 1.27 0.08 0.35 0.41 1.63
Juvenile 87.42 206.50 20.53 67.39 107.94 273.90
Adult California
coastal - T
0.61 2.34 0.15 0.65 0.75 2.98
Juvenile 140.56 332.05 33.00 108.36 173.56 440.41
Adult Snake River
fall - T
0.12 0.46 0.03 0.13 0.15 0.59
Juvenile 6.05 14.28 1.42 4.66 7.46 18.94
Adult Snake River
spring/summer
- T
0.17 0.66 0.04 0.18 0.21 0.84
Juvenile 15.41 36.39 3.62 11.88 19.02 48.27
Adult Lower
Columbia
River - T
0.13 0.51 0.03 0.14 0.16 0.65
Juvenile 164.41 388.38 38.60 126.75 203.01 515.13
Adult Upper
Willamette
River - T
0.10 0.37 0.02 0.10 0.12 0.47
Juvenile 19.91 47.04 4.68 15.35 24.59 62.39
Adult Upper
Columbia
River spring
E
0.03 0.10 0.01 0.03 0.03 0.13
Juvenile 6.05 14.28 1.42 4.66 7.47 18.95
Adult Puget Sound
T
0.41 1.59 0.10 0.44 0.51 2.02
Juvenile 67.37 159.14 15.82 51.94 83.19 211.08
Coho
Adult Central Calif
coast - E
0.11 0.39 0.03 0.11 0.14 0.50
Juvenile 11.96 28.47 2.79 9.23 14.75 37.70
Adult S. Oregon/N.
Calif coast - T
0.24 0.84 0.06 0.24 0.30 1.08
Juvenile 37.26 88.67 8.68 28.75 45.94 117.42
Adult Oregon coast
T
6.35 21.90 1.49 6.30 7.84 28.20
Juvenile 674.13 1604.19 157.09 520.16 831.22 2124.35
Adult Lower
Columbia
River - T
0.45 1.54 0.11 0.44 0.55 1.99
Juvenile 52.01 123.76 12.12 40.13 64.13 163.90
Chum Adult Columbia
River - T
0.02 0.08 0.01 0.02 0.03 0.10
Juvenile 6.12 13.28 1.42 3.79 7.53 17.07
Sockeye Adult Snake River 0.00 0.00 0.00 0.00 0.00 0.00
528

Biological Opinion and Conference Report on Navy NWTT Activities and NMFS’ MMPA Incidental Take Authorization PCTS FPR-2015-9110
Testing Training Total
Species Life stage ESU/DPS Mortality Injury Mortality Injury Mortality Injury
Juvenile E 0.02 0.05 0.01 0.02 0.03 0.07
Steelhead
Adult South-Central
California - T
0.00 0.01 0.00 0.00 0.01 0.01
Juvenile 0.28 0.57 0.16 0.30 0.44 0.87
Adult Central Calif
T
0.01 0.02 0.00 0.01 0.01 0.03
Juvenile 0.57 1.18 0.33 0.61 0.90 1.79
Adult California
Central Valley
- T
0.01 0.02 0.00 0.01 0.01 0.03
Juvenile 0.55 1.13 0.32 0.59 0.86 1.72
Adult Northern Calif
- T
0.03 0.08 0.01 0.03 0.05 0.11
Juvenile 2.16 4.68 1.00 1.86 3.16 6.54
Adult Upper
Columbia
River - E
0.02 0.05 0.01 0.02 0.03 0.07
Juvenile 1.27 2.75 0.59 1.09 1.86 3.84
Adult Snake River
basin - T
0.34 0.89 0.15 0.30 0.49 1.19
Juvenile 6.20 13.44 2.88 5.34 9.08 18.78
Adult Lower
Columbia
River - T
0.08 0.21 0.04 0.07 0.12 0.29
Juvenile 1.98 4.30 0.92 1.71 2.90 6.01
Adult Upper
Willamette
River - T
0.04 0.12 0.02 0.04 0.06 0.15
Juvenile 0.96 2.07 0.44 0.82 1.40 2.90
Adult Middle
Columbia
River - T
0.18 0.46 0.08 0.16 0.26 0.62
Juvenile 2.39 5.19 1.11 2.07 3.51 7.26
Adult Puget Sound
T
0.10 0.26 0.04 0.09 0.15 0.35
Juvenile 7.39 16.02 3.43 6.37 10.82 22.39
6.11.1.1.8 Estimation of Take for Eulachon
Eulachon appear to live near the ocean bottom, or on the continental shelf at depths most
commonly of 20 to 200 m (NMFS 2006a). Because most eulachon are expected to occur on the
continental shelf, we assessed impacts to eulachon for the detonations that may occur over the
continental shelf and in water deep enough where they may be affected by explosions as
determined by the range to injury and mortality values (explosions in bins E3, E4). We do not
expect the eulachon to be affected by explosions off the shelf break due to the depth at which the
animals will occur in these areas (near the ocean bottom) and sound propagation loss.
529
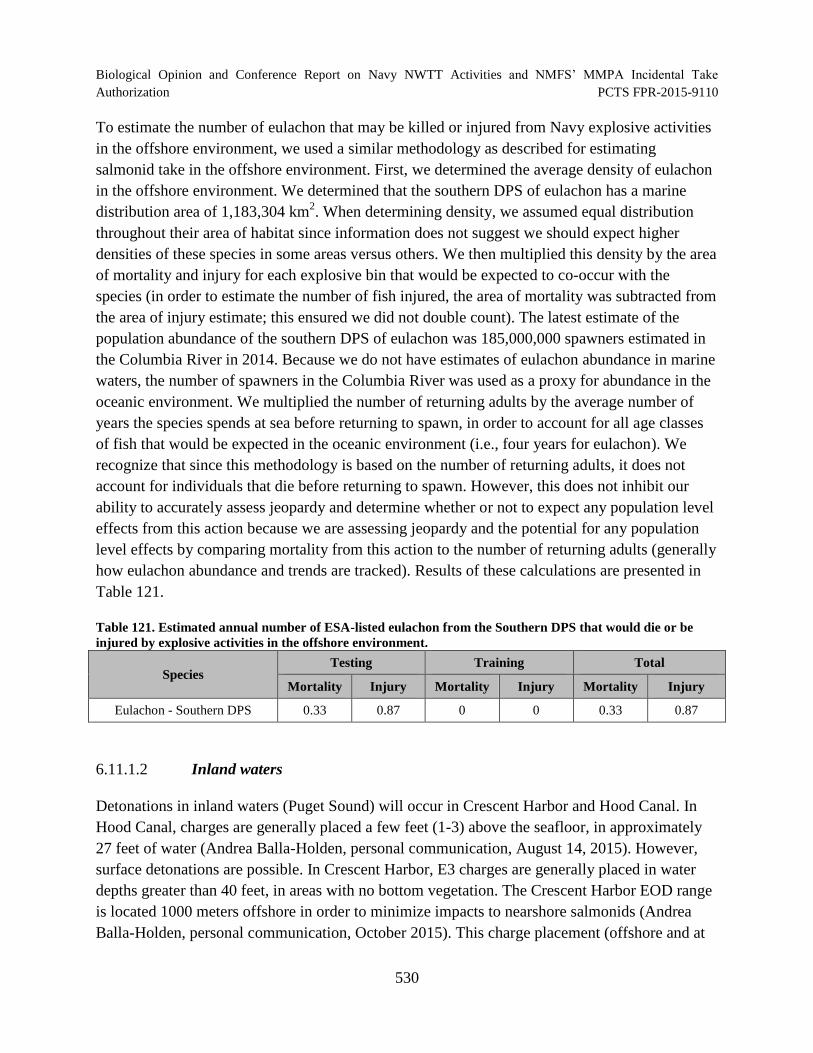
Biological Opinion and Conference Report on Navy NWTT Activities and NMFS’ MMPA Incidental Take
Authorization PCTS FPR-2015-9110
To estimate the number of eulachon that may be killed or injured from Navy explosive activities
in the offshore environment, we used a similar methodology as described for estimating
salmonid take in the offshore environment. First, we determined the average density of eulachon
in the offshore environment. We determined that the southern DPS of eulachon has a marine
distribution area of 1,183,304 km2. When determining density, we assumed equal distribution
throughout their area of habitat since information does not suggest we should expect higher
densities of these species in some areas versus others. We then multiplied this density by the area
of mortality and injury for each explosive bin that would be expected to co-occur with the
species (in order to estimate the number of fish injured, the area of mortality was subtracted from
the area of injury estimate; this ensured we did not double count). The latest estimate of the
population abundance of the southern DPS of eulachon was 185,000,000 spawners estimated in
the Columbia River in 2014. Because we do not have estimates of eulachon abundance in marine
waters, the number of spawners in the Columbia River was used as a proxy for abundance in the
oceanic environment. We multiplied the number of returning adults by the average number of
years the species spends at sea before returning to spawn, in order to account for all age classes
of fish that would be expected in the oceanic environment (i.e., four years for eulachon). We
recognize that since this methodology is based on the number of returning adults, it does not
account for individuals that die before returning to spawn. However, this does not inhibit our
ability to accurately assess jeopardy and determine whether or not to expect any population level
effects from this action because we are assessing jeopardy and the potential for any population
level effects by comparing mortality from this action to the number of returning adults (generally
how eulachon abundance and trends are tracked). Results of these calculations are presented in
Table 121.
Table 121. Estimated annual number of ESA-listed eulachon from the Southern DPS that would die or be
injured by explosive activities in the offshore environment.
Species Testing Training Total
Mortality Injury Mortality Injury Mortality Injury
Eulachon - Southern DPS 0.33 0.87 0 0 0.33 0.87
6.11.1.2 Inland waters
Detonations in inland waters (Puget Sound) will occur in Crescent Harbor and Hood Canal. In
Hood Canal, charges are generally placed a few feet (1-3) above the seafloor, in approximately
27 feet of water (Andrea Balla-Holden, personal communication, August 14, 2015). However,
surface detonations are possible. In Crescent Harbor, E3 charges are generally placed in water
depths greater than 40 feet, in areas with no bottom vegetation. The Crescent Harbor EOD range
is located 1000 meters offshore in order to minimize impacts to nearshore salmonids (Andrea
Balla-Holden, personal communication, October 2015). This charge placement (offshore and at
530
Biological Opinion and Conference Report on Navy NWTT Activities and NMFS’ MMPA Incidental Take
Authorization PCTS FPR-2015-9110
depth) was determined, through discussions with NMFS and USFWS prior to this consultation,
to be least impactful to listed resources (John Mosher, personal communication, August 14,
2015). Prior to any detonation in inland waters there is a significant amount of human in-water
activity in the area that would likely deter fish from being in the immediate vicinity of the
explosion (John Mosher, personal communication, August 14, 2015).
Below we present information on the ESA-listed fish species considered in this Opinion that are
likely to occur in Puget Sound, their likelihood of co-occurring with detonations in Crescent
Harbor and Hood Canal, and the methods we used to estimate the number of fish that may be
killed or injured by Navy activities. Several fish species considered in this Opinion are not
discussed in this section because they are not expected to occur in Puget Sound (e.g., Lower
Columbia River Chinook salmon ESU) or because they occur in extremely low densities in Puget
Sound where the likelihood of an individual of these species co-occurring with Navy EOD
activities in Puget Sound is so low as to be discountable (e.g., green sturgeon).
6.11.1.2.1 Chinook
Juvenile and adult Puget Sound Chinook would likely be affected by Navy EOD activities at
both Crescent Harbor and Hood Canal.
6.11.1.2.1.1 Crescent Harbor
Crescent Harbor is located at the north end of Saratoga Passage, just west of Skagit Bay. There is
no known Chinook salmon spawning habitat in streams flowing into Crescent Harbor
(http://apps.wdfw.wa.gov/salmonscape/map.html), but Puget Sound Chinook from the Skagit,
Stillaguamish, and Snohomish Rivers (and to a lesser degree, rivers from southern Puget Sound)
would be expected to occur in the Harbor (NMFS 2012a). Additionally, an unknown number of
Puget Sound Chinook which mature solely in the Salish Sea and do not migrate into the North
Pacific Ocean (i.e., blackmouths), may spend at least a portion of their time foraging in Crescent
Harbor. Survey and research sampling within Crescent Harbor have indicated juvenile Puget
Sound Chinook use both the intertidal and offshore areas of the Harbor with smaller individuals
generally found in intertidal habitat and larger individuals found in the offshore (E. Beamer,
Skagit Coop, personal communication, D. Heatwole, Skagit Coop, personal communication,
cited in (NMFS 2012a)). This is consistent with Puget Sound Chinook life history information
which suggests that most juveniles enter estuaries and occupy nearshore habitats primarily
during the spring and early summer, but that by mid-summer, most Chinook have migrated to
more offshore habitats (Duffy et al. 2010b). Beamish et al. (1998) studied intra-annual changes
in the abundance of Chinook salmon in Puget Sound and collected the majority of juveniles in
rope trawl tows at depths ranging from 0 to 15 meters. Beamer et al. (2003) studied wild
Chinook salmon pocket estuary, nearshore, and offshore habitat use in Skagit Bay. The authors
found juvenile Chinook are over 100 times more abundant in pocket estuary habitat (0.5 meter
531
Biological Opinion and Conference Report on Navy NWTT Activities and NMFS’ MMPA Incidental Take
Authorization PCTS FPR-2015-9110
max depth) and 10 times more abundant in nearshore habitat (2.8 meter max depth) than in more
offshore areas adjacent to nearshore habitat. Based on the range to injury and mortality for the
charges proposed for use in Crescent Harbor and the distance of the site from these nearshore
habitats (EOD range is in waters greater than 40 feet deep and 1,000 meters offshore), we do not
expect injurious sound levels to be able to reach nearshore and pocket estuary habitats (as
described in (Beamer et al. 2003)) in Crescent Harbor that would be expected to hold the highest
concentrations of fish.
Rice et al. (2011) studied the use of the Puget Sound neritic zone (surface waters overlaying the
sublittoral zone; similar habitat to the location of the Crescent Harbor EOD range) in greater
Puget Sound. They sampled at various sites in the Whidbey Basin, including Crescent Harbor. In
the Whidbey Basin, 73 percent of the fish captured were unmarked, which is consistent with
there being more wild fish in this portion of the Sound than in areas further south. Juvenile
Chinook density in the Whidbey Basin was highest in July and August with approximately 15
unmarked and 6 marked fish/hectare.
To estimate the number of juvenile Chinook salmon that we would expect to be killed or injured
from EOD activity at Crescent Harbor, we used a similar methodology as described for
estimating take of ESA-listed salmonids in the offshore portion of the Action Area. We used the
juvenile density information presented above for Whidbey Basin from Rice et al. (2011). In order
to be conservative and because we do not know when the Navy will be conducting EOD
activities, we assumed all detonations would occur during July and August, when we would
expect the highest densities of juvenile Chinook in the EOD range. Once we derived our density
estimates, we then multiplied these densities by the area of mortality and injury as estimated by
the Navy (in order to estimate the number of fish injured, the area of mortality was subtracted
from the area of injury estimate; this ensured we did not double count). Results of these
calculation are presented in Table 122.
For adults, we do not have open water density information for the EOD site in Crescent Harbor
or any similar areas adjacent to Crescent Harbor. However, information suggests that adult
Chinook density in Crescent Harbor is likely much lower than would be expected in some other
areas and habitat types in the Sound (e.g., river mouths, deltas, and estuaries of the Skagit and
Snohomish Rivers) because there are no documented spawning rivers in the immediate vicinity
of the EOD range. Therefore, adult salmon are unlikely to stage in large numbers in the Harbor,
but available information suggests that very low numbers of migrating adults could occur within
the range to effects for underwater detonations for very short periods of time (though Crescent
Harbor is not a direct migratory route from the ocean to any Chinook spawning rivers). Given
the very low densities of adults that may occur in the area, the short amount of time any
individuals would be likely to spend in Crescent Harbor, and the low number of explosion events
532
Biological Opinion and Conference Report on Navy NWTT Activities and NMFS’ MMPA Incidental Take
Authorization PCTS FPR-2015-9110
that will occur throughout the year, we do not expect more than one adult Puget Sound Chinook
salmon may be injured or killed each year from Navy explosive activities at Crescent Harbor.
6.11.1.2.1.2 Hood Canal
Hood Canal has extant populations of Puget Sound Chinook in the Skokomish River watershed
and Mid Hood Canal region (including spawning populations in the Hamma Hamma,
Duckabush, and Dosewallips watersheds) (Ford 2011c). Hood Canal Chinook typically spawn
mid-September to late October (Commission 2003). All juvenile Chinook emigrating from or
adults immigrating to these watersheds must pass by the Hood Canal EOD site. Additionally, an
unknown number of Puget Sound Chinook which mature solely in the Salish Sea and do not
migrate into the North Pacific Ocean, are likely to spend at least a portion of their time foraging
in proximity to the Hood Canal EOD range (e.g., (Tribe and Wildlife 2007)). We do not have
information on the marine residence times of individual Hood Canal chinook, but based on life
history information, we assume juvenile Chinook spend significantly more time rearing in Hood
Canal nearshore areas than steelhead or chum. Generally, Puget Sound Chinook juveniles
emigrate from freshwater natal areas to estuarine and nearshore habitats from January through
April as fry, and from April through early July as larger subyearlings (NMFS 2011h).
As indicated in the Status of Listed Resources section of this Opinion, the number of natural
origin spawners returning to Hood Canal Rivers averaged 311 individuals from 2008-2012. Over
the same time period, hatchery origin spawners averaged 1,226 individuals per year. NMFS
(2015) calculated that this number of returning spawners would result in a total of 122,960
outmigrants per year.
In order to minimize impacts to adult Puget Sound Chinook from Hood Canal, the Navy will
avoid to the maximum extent practicable (unless necessitated by readiness requirements) the use
of the larger size charges (>0.5-2.5 lb), and only conduct training with one ounce or less charges
during August, September, and October. Because the Navy could not rule out conducting
explosions using these larger size charges during the adult migration and spawning period and in
order to be conservative (i.e., assess the maximum effect to the species which could be
considered reasonable), we assumed E3 detonations could occur during the adult migration
period.
To estimate the number of Chinook salmon that we would expect to be killed or injured from
EOD activity at Hood Canal, we first estimated the average density of Chinook salmon of each
life stage in Hood Canal. We do not have EOD range-specific density information for Chinook
salmon at Hood Canal. Since there are no documented Chinook spawning rivers in the
immediate vicinity of the Hood Canal EOD range, adult and juvenile Chinook salmon are
unlikely to stage in large concentrations near the range. This information suggests Chinook
density at the EOD ranges is likely lower than would be expected in some other areas and habitat
533
Biological Opinion and Conference Report on Navy NWTT Activities and NMFS’ MMPA Incidental Take Authorization PCTS FPR-2015-9110
types in Hood Canal (e.g., Hood Canal salmon spawning river mouths/estuaries). Most
individuals that will occur in close proximity to the range would be expected to be migrating
through the range, though some juveniles could reside in higher numbers in nearshore areas
within the injury/mortality range of the explosions. In order to be conservative, we assumed
equal distribution of each life stage throughout the Canal since information does not suggest we
should expect higher densities of these species at the EOD ranges than in other areas of the
Canal. In order to derive our density estimates, we divided the number of adult or juvenile fish
expected in the Hood Canal20
by the area of the Canal (Hood Canal has a surface area of 358.4
km2). We then multiplied this density by the area of mortality and injury as estimated by the
Navy (in order to estimate the number of fish injured, the area of mortality was subtracted from
the area of injury estimate; this ensured we did not double count). Results of these calculation are
presented in Table 122.
We recognize that this methodology likely overestimates the number of adult Puget Sound
Chinook from Hood Canal that will die or be injured from Navy EOD activities. Most notably,
our analysis and resulting take estimates assume all detonations (E3 and SWAG charges) will
occur when adult Puget Sound Chinook are in the Canal. While we did this to be conservative
and to analyze the highest potential effect of the activity on ESA-listed species that could be
considered reasonable, it is also possible that EOD activity may be spread more evenly
throughout the year and occur during times when the species is not in Hood Canal or near the
EOD range, particularly since the Navy will only conduct detonations with the larger charges
during their migration period if necessitated by readiness requirement. If the Navy were to
conduct some or all EOD activities during times of the year when adult Puget Sound Chinook are
not present, the number of individuals that would die or be injured as a result of Navy EOD
activities would be expected to be much lower. Also, this methodology does not consider habitat
selection within the Hood Canal by the species. Adult fish in close proximity to the EOD range
that may be affected would only be migrating through the area since there are no spawning rivers
in immediate proximity to the range and would not be staging to enter freshwater spawning
rivers at this location. Further, juveniles are expected at lower densities in the EOD range than in
other areas of the Canal, where individuals of this life stage would be more likely to congregate
(e.g., tidal channels, mudflats, marshes, and eelgrass meadows). These habitat types are not
present in the Hood Canal EOD range. Additionally, it is worth noting that Navy monitoring of
20 Without better information on residence time of outmigrating juvenile or returning adult Chinook salmon in Hood
Canal and since Chinook are thought to spend significantly more time rearing in estuarine and nearshore waters
before migrating into open water habitats (months instead of days), we assumed all Chinook salmon originating
from and returning to Hood Canal rivers could reside in the Canal concurrently. This likely overestimates Chinook
salmon abundance in the Canal since some proportion of juveniles will spend less time in the Canal than others and
some will die from other causes (e.g., predation) while migrating through the Canal. Additionally, adult migration is
staggered such that some returning fish will have likely already entered freshwater before others have entered Hood
Canal. This methodology results in a conservative estimate of take.
534
Biological Opinion and Conference Report on Navy NWTT Activities and NMFS’ MMPA Incidental Take
Authorization PCTS FPR-2015-9110
previous similar UNDETs at Hood Canal have never documented fish kills of the magnitude
estimated to occur (Chip Johnson, personal communication, October 2015). However, Navy
monitoring may not detect all fish that would die from an explosive event as some may not float
to the surface of the water in order to be detected by visual observation and some may be
captured by foraging birds prior to detection. Additionally, injured fish that may later die would
not be expected to be detected as they also may not immediately float to the surface of the water
to be detected by visual observation.
6.11.1.2.2 Steelhead
Juvenile and adult Puget Sound steelhead would likely be affected by Navy training activities
using explosives at both Crescent Harbor and Hood Canal.
6.11.1.2.2.1 Crescent Harbor
Puget Sound steelhead abundance in Crescent Harbor is likely very low. Steelhead are seldom
observed in Puget Sound at any life stage (NMFS 2012a). Steelhead do not spawn on Whidbey
Island, including streams flowing into Crescent Harbor
(http://apps.wdfw.wa.gov/salmonscape/map.html). As mentioned previously, steelhead do not
rear in estuarine or nearshore areas for long periods of time, but migrate quickly through these
areas into oceanic waters of the North Pacific Ocean. Puget Sound steelhead generally migrate to
the ocean from mid-April through late May when they are typically 2 to 3 years old. At this age
and size, they are not dependent on shallow nearshore areas, and they are well dispersed
throughout Puget Sound. Therefore, any outmigrating steelhead occurring in Crescent Harbor,
would likely only be present for a short period of time as they migrate towards open water.
Similarly, Crescent Harbor is not in direct route to steelhead spawning rivers on the eastern side
of Skagit Bay from oceanic waters, so any adults that may migrate through Crescent Harbor
would likely only occur in the harbor for a brief period of time. This information leads us to
conclude that steelhead density in Crescent Harbor is expected to be much lower than in other
locations in Puget Sound (e.g., in marine waters directly offshore from their natal rivers).
However, a few individuals could occur in the Harbor while migrating.
We do not have information available to estimate the density of juvenile or adult steelhead that
may migrate through the EOD site at Crescent Harbor. However, the information presented
above suggests that very low numbers of migrating juveniles and adults could occur within the
range to effects for underwater detonations for very short periods of time. Given the very low
densities of juveniles and adults that may occur in the area, the short amount of time any
individuals would be likely to spend in Crescent Harbor, and the low number of explosion events
that will occur throughout the year, we do not expect more than one juvenile and one adult Puget
Sound may be injured or killed each year from Navy explosive activities at Crescent Harbor.
535
Biological Opinion and Conference Report on Navy NWTT Activities and NMFS’ MMPA Incidental Take
Authorization PCTS FPR-2015-9110
6.11.1.2.2.2 Hood Canal
Steelhead spawn in rivers flowing into the Hood Canal, though not in rivers adjacent to the Hood
Canal EOD range. Immigrating and emigrating steelhead must pass by the Hood Canal EOD
range on their way to their natal rivers to spawn or on their way out to oceanic waters in the
North Pacific to mature. Typically, Puget Sound steelhead juveniles emigrate from their natal
rivers as two-year olds from March through June (NMFS 2011h). Moore et al. (2010b) found
that acoustically tagged steelhead smolts from Hood Canal rivers migrated from their natal river
mouths to areas outside of the Hood Canal over an average of 15 to 17 days. Therefore, based on
emigration timing and residence time in Hood Canal, most steelhead smolts will have left Hood
Canal by mid-July.
As indicated in the Status of Listed Resources section of this Opinion, the number of natural
origin spawners returning to Hood Canal Rivers averaged 967 individuals from 2009 to 2013.
NMFS (2015) calculated that this number of returning spawners would result in a total of
109,997 outmigrants per year.
We estimated the number of juvenile Puget Sound steelhead that may be injured or killed from
detonations at the Hood Canal EOD site using similar methodology as described for estimating
offshore take. To estimate steelhead juvenile density at the EOD site in Hood Canal, we first
determined the average number of fish leaving freshwater from Hood Canal rivers per day by
dividing the annual number of outmigrating juveniles by the number of days in the migration
period (March through June; 122 days). We then multiplied this number by the average time an
individual fish is expected to spend in Hood Canal once it leaves freshwater (17 days, as
described above). This results in the average number of juvenile Puget Sound steelhead we
would expect in the Canal on a given day during the middle portion of the out-migration period
(during first and last 17 days of the out-migration period, fewer individual steelhead would be
expected in the Canal). We then divide this number by the area of Hood Canal (358.4 km2) to
determine juvenile steelhead density during the outmigration period. To be conservative, we
assumed all detonations will occur during the outmigration period as the Navy is unable to
predict when detonations will occur. For adults, we did not have information to estimate the
amount of time each fish would be expected to reside in Hood Canal before entering freshwater
to spawn. Therefore, we assumed the entire annual run could occur in the Canal on a given day.
We then divided this number by the area of Hood Canal to estimate adult density in the Canal on
a given day during the run. Once we had juvenile and adult densities, we multiplied these
numbers by the area of injury and mortality for each detonation, then multiplied this number by
the number of detonations. (in order to estimate the number of fish injured, the area of mortality
was subtracted from the area of injury estimate; this ensured we did not double count).
536
Biological Opinion and Conference Report on Navy NWTT Activities and NMFS’ MMPA Incidental Take
Authorization PCTS FPR-2015-9110
6.11.1.2.3 Chum
Hood Canal summer-run chum juveniles migrate from freshwater into estuary habitat generally
from the first week in February through the second week in April. Estimated peak emergence
occurs around March 22 (Wildlife and Tribes 2000). Upon initially arriving in the estuary, chum
inhabit nearshore waters, at depths ranging between 1.5 and 5 meters (Wildlife and Tribes 2000).
At this initial stage, they are thought to concentrate in the top few meters of the water column,
forming loose aggregations during daylight hours. Once fry reach a size of approximately 45 to
50 mm, they tend to move rapidly into deeper offshore areas, migrating approximately 7 to 14
km/day (Wildlife and Tribes 2000). At this speed and growth rate, Hood Canal chum exit the
Canal approximately 14 days after entering seawater, with approximately 90 percent of the
annual population exiting by late April, on average (Wildlife and Tribes 2000).
Returning adults begin to arrive in Hood Canal in early August, and are thought to stage in front
of their stream of origin for approximately ten to twelve days. During this time, they are
generally found in subestuary habitats (e.g., tidal channels, mudflats, marshes, and eelgrass
meadows) of the Hood Canal. Migration into freshwater spawning grounds generally occurs
from late August to late October (Wildlife and Tribes 2000). The number of natural origin
spawners in Hood Canal averaged 11,946 individuals from 2009 to 2013, and the number of
hatchery origin spawners averaged 1,189 individuals over the same period (NMFS 2015). NMFS
(2015) estimated this number of spawners would produce 1,920,944 outmigrants annually.
Based on the timing of returning adults and out-migrating juveniles, we do not expect Hood
Canal summer chum of any life stage to be present in the Hood Canal portion of the Action Area
from May through July, or November through January. From February through April we would
expect juveniles to be present in the Action Area as they rear in Hood Canal, and then migrate
towards the main basin of Puget Sound and into the North Pacific Ocean. Additionally, we
expect adults to be present in the Hood Canal portion of the Action Area from August through
October. If Navy EOD activities were to occur during either of these time periods, Hood Canal
summer-chum could be affected by underwater explosions.
In order to minimize impacts to juvenile Hood Canal summer-run chum, the Navy will not
conduct any of the planned larger size (E3; >0.5 to 2.5 lb) detonations at the Hood Canal site
during February, March, or April (the juvenile outmigration period of juvenile chum (Wildlife
and Tribes 2000)). During this time period, the EOD unit will only conduct training with SWAG
charges, which are one ounce or less in net explosive weight (Andrea Balla-Holden, personal
communication, October 21, 2015). Therefore, when estimating the number of juvenile Hood
Canal summer-run chum that may be killed or injured, we assumed there would be no co-
occurrence of juvenile chum with the use of E3 detonations.
537
Biological Opinion and Conference Report on Navy NWTT Activities and NMFS’ MMPA Incidental Take
Authorization PCTS FPR-2015-9110
In order to minimize impacts to adult Hood Canal summer-run chum, the Navy will avoid to the
maximum extent practicable (unless necessitated by readiness requirements) the use of the larger
size charges (>0.5 to 2.5 lb), and only conduct training with one ounce or less charges during
August, September, and October, the adult migration period for Hood Canal summer-run Chum.
Because the Navy could not rule out conducting explosions using these larger size charges
during the adult migration period and in order to be conservative (i.e., assess the maximum effect
to the species which could be considered reasonable), we assumed E3 detonations could occur
during the adult migration period.
We estimated the number of Hood Canal summer-run Chum (juvenile and adult) that may be
injured or killed from detonations in inland waters using similar methodology as described for
estimating offshore take. To estimate chum juvenile density at the EOD site in Hood Canal, we
first determined the average number of fish leaving freshwater from Hood Canal rivers per day
by dividing the annual number of outmigrating juveniles by the number of days in the migration
period (74 days). We then multiplied this number by the average time an individual fish is
expected to spend in Hood Canal once it leaves freshwater (14 days, as described above). This
results in the average number of juvenile Hood Canal summer-run chum we would expect in the
Canal on a given day during the middle portion of the out-migration period (during first and last
14 days of the out-migration period, fewer individual salmon would be expected in the Canal).
We then divide this number by the area of Hood Canal (358.4 km2) to determine summer-run
chum density during the outmigration period. To be conservative, we assumed all SWAG
detonations will occur during the outmigration period as the Navy is unable to predict when
these detonations will occur (as noted above, E3 charges will not be used during the outmigration
period). For adults, we did not have information to estimate the amount of time each fish would
be expected to reside in Hood Canal before entering freshwater to spawn. Therefore, we assumed
the entire annual summer-run could occur in the Canal on a given day. We then divided this
number by the area of Hood Canal to estimate adult density in the Canal on a given day during
the run. Once we had juvenile and adult densities, we multiplied these numbers by the area of
injury and mortality for each detonation, then multiplied this number by the number of
detonations. (in order to estimate the number of fish injured, the area of mortality was subtracted
from the area of injury estimate; this ensured we did not double count).
We recognize that this methodology likely overestimates the number of Hood Canal summer-run
chum that will die or be injured from Navy EOD activities. Most notably, our analysis and
resulting take estimates assume all SWAG charge detonations occur when juvenile Hood Canal
summer-run chum are in the Canal. Additionally, our analysis and resulting take estimates
assume all detonations (E3 and SWAG charges) will occur when adult Hood Canal summer-run
chum are in the Canal. While we did this to be conservative and to analyze the highest potential
effect of the activity on ESA-listed species that could be considered reasonable, it is also possible
that EOD activity may be spread more evenly throughout the year and occur during times when
538
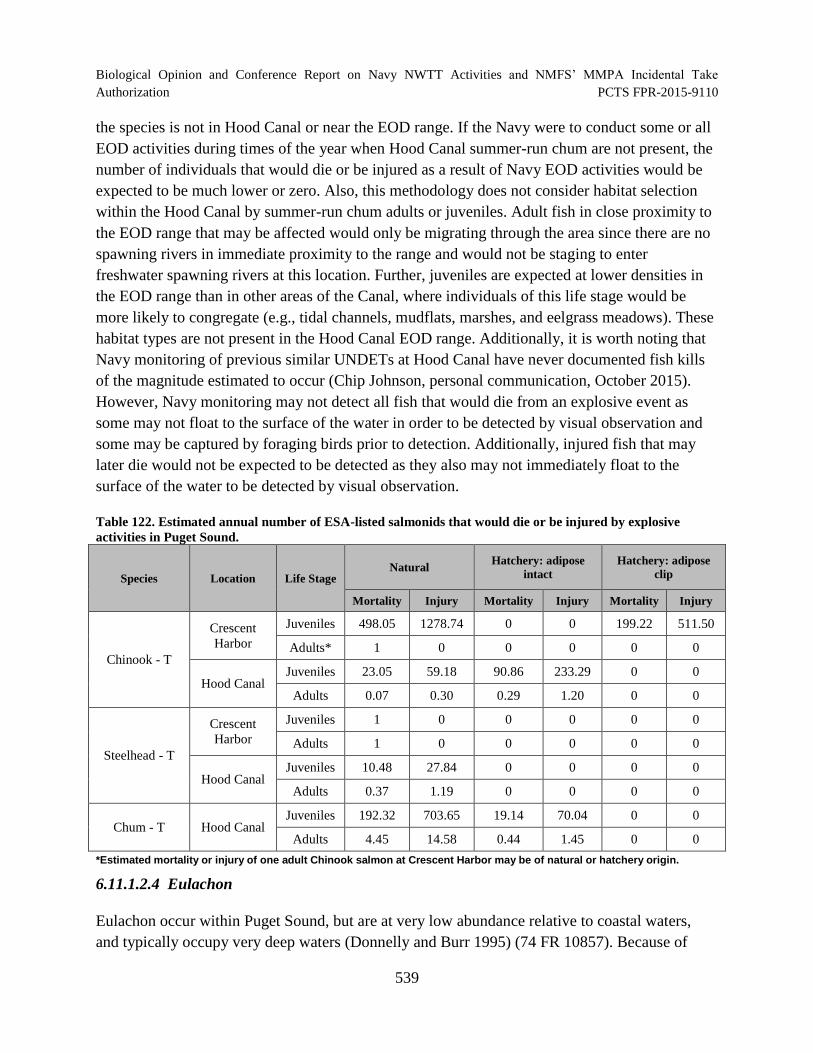
Biological Opinion and Conference Report on Navy NWTT Activities and NMFS’ MMPA Incidental Take
Authorization PCTS FPR-2015-9110
the species is not in Hood Canal or near the EOD range. If the Navy were to conduct some or all
EOD activities during times of the year when Hood Canal summer-run chum are not present, the
number of individuals that would die or be injured as a result of Navy EOD activities would be
expected to be much lower or zero. Also, this methodology does not consider habitat selection
within the Hood Canal by summer-run chum adults or juveniles. Adult fish in close proximity to
the EOD range that may be affected would only be migrating through the area since there are no
spawning rivers in immediate proximity to the range and would not be staging to enter
freshwater spawning rivers at this location. Further, juveniles are expected at lower densities in
the EOD range than in other areas of the Canal, where individuals of this life stage would be
more likely to congregate (e.g., tidal channels, mudflats, marshes, and eelgrass meadows). These
habitat types are not present in the Hood Canal EOD range. Additionally, it is worth noting that
Navy monitoring of previous similar UNDETs at Hood Canal have never documented fish kills
of the magnitude estimated to occur (Chip Johnson, personal communication, October 2015).
However, Navy monitoring may not detect all fish that would die from an explosive event as
some may not float to the surface of the water in order to be detected by visual observation and
some may be captured by foraging birds prior to detection. Additionally, injured fish that may
later die would not be expected to be detected as they also may not immediately float to the
surface of the water to be detected by visual observation.
Table 122. Estimated annual number of ESA-listed salmonids that would die or be injured by explosive
activities in Puget Sound.
Species Location Life Stage Natural
Hatchery: adipose
intact
Hatchery: adipose
clip
Mortality Injury Mortality Injury Mortality Injury
Chinook - T
Crescent
Harbor
Juveniles 498.05 1278.74 0 0 199.22 511.50
Adults* 1 0 0 0 0 0
Hood Canal Juveniles 23.05 59.18 90.86 233.29 0 0
Adults 0.07 0.30 0.29 1.20 0 0
Steelhead - T
Crescent
Harbor
Juveniles 1 0 0 0 0 0
Adults 1 0 0 0 0 0
Hood Canal Juveniles 10.48 27.84 0 0 0 0
Adults 0.37 1.19 0 0 0 0
Chum - T Hood Canal Juveniles 192.32 703.65 19.14 70.04 0 0
Adults 4.45 14.58 0.44 1.45 0 0
*Estimated mortality or injury of one adult Chinook salmon at Crescent Harbor may be of natural or hatchery origin.
6.11.1.2.4 Eulachon
Eulachon occur within Puget Sound, but are at very low abundance relative to coastal waters,
and typically occupy very deep waters (Donnelly and Burr 1995) (74 FR 10857). Because of
539
Biological Opinion and Conference Report on Navy NWTT Activities and NMFS’ MMPA Incidental Take
Authorization PCTS FPR-2015-9110
their relative low abundance and occurrence in very deep waters where EOD activities will not
occur, we do not expect underwater explosions to adversely affect the southern DPS of eulachon.
6.11.1.2.5 Rockfish
The life histories, and therefore potential for exposure to underwater detonations, of the three
rockfish species considered in this Opinion are similar, with some slight differences discussed
below. All three have pelagic larval and juvenile stages, followed by a juvenile stage in shallow
water, and a sub-adult/adult stage occurring in deeper waters. Larvae can make small movements
on their own, but predominantly their movement is determined by ocean currents (Drake et al.
2010; Tagal et al. 2002). Larvae and pelagic juveniles are expected to occur throughout the water
column in Puget Sound (Love et al. 2002; Weis 2004). Once canary rockfish and bocaccio reach
1 to 3.5 inches, they move into shallow nearshore waters, with rocky or cobble substrates,
preferably with kelp (Love et al. 1991; Love et al. 2002). Alternatively, juvenile yellow rockfish
do not occupy intertidal habitat, but are observed in deeper, offshore waters greater than 30
meters (Love et al. 1991; Studebaker et al. 2009; Yamanaka et al. 2006). Adults of each species
are most commonly found between 40 and 250 meters (Love et al. 2002; Orr et al. 2000).
Based on rockfish life histories, as described above, larvae and pelagic juvenile ESA-listed
rockfish would be expected to be adversely affected by underwater explosions in inland waters.
Greene and Godersky (2012) conducted larval rockfish surveys throughout Puget Sound. In
Hood Canal, the highest density of rockfish larvae sampled was 26.5 rockfish larvae/1000 m3,
observed near the Skokomish River in April. With the exception of May, when lower densities
were observed, the authors did not catch larval rockfish in Hood Canal during any other months
sampled (April through October). The highest density of rockfish larvae sampled in the Whidbey
Basin (the region where Crescent Harbor is located) was 16.3 rockfish larvae/1000 m3, observed
in April. Rockfish larvae were not observed in any months in the Whidbey Basin except for
April.
Additionally, juvenile canary rockfish and bocaccio may be affected when they reside in
nearshore waters. We do not expect adult rockfish of any species or juvenile yelloweye rockfish
to be affected by underwater explosions because they would occur in waters deeper than
underwater explosions are expected to occur.
For juvenile (canary rockfish and bocaccio) and larval (all species) rockfish, we estimated the
impact of EOD activity on these populations by assessing the percentage of the population that
may be affected because we did not have information to estimate densities of these species at
these life stages. We divided the area of injury and mortality by the area of Puget Sound (the
species range). This estimates the proportion of larval and juvenile rockfish that may be
impacted by Navy EOD activity at Hood Canal or Crescent Harbor, assuming equal distribution
of the species. Using this methodology, we determined the proportion of Puget Sound larval (all
540
Biological Opinion and Conference Report on Navy NWTT Activities and NMFS’ MMPA Incidental Take
Authorization PCTS FPR-2015-9110
species) and juvenile rockfish (Canary and bocaccio) that would be injured and killed is 0.003
and 0.002, respectively.
6.11.1.3 Forage Fish Community
Sound pressure waves from explosive activities will reach levels that would be expected to injure
or kill forage fish. This creates an indirect effect to salmonids that prey on forage fish. While
juvenile or sub-adult salmonids prey on larval or juvenile forage fish for some portion of their
prey base, adult salmonids utilize forage fish as a major component of their prey base. Direct
mortality of forage fish from explosive activities may cause a temporary and localized reduction
in available prey for adult salmonids that may attempt to forage in the Action Area. However,
adverse effects to listed fish are not expected to occur from this because the reduction in prey
availability will occur in limited spatial and temporal scales, and prey resources will continue to
be available to salmonids outside of the immediate area of injury and mortality zone of each
explosion. Forage fish abundance will return to the area when explosive activities cease.
6.11.1.4 Potential for TTS and Behavioral Reactions
Some individual ESA-listed fish may experience TTS as a result of Navy impulsive acoustic
stressors. However, the fish species considered in this Opinion lack notable hearing
specialization, minimizing the likelihood of each instance of TTS affecting an individual’s
fitness. To our knowledge, no studies have examined the fitness implications when a fish,
without notable hearing specialization, experiences TTS. Popper et al. (2014) suggested that
fishes experiencing TTS may have a decreased ability to communicate, detect predators or prey,
or assess their environment. However, these species are able to rely on alternative mechanisms
(e.g., sight, lateral line system) to detect prey, avoid predators, spawn, and to orient in the water
column (Popper et al. 2014). Additionally, hearing is not thought to play a role in salmon,
steelhead, or eulachon migration (e.g., (Putnam et al. 2013)). Temporary threshold shift is also
short term in duration with fish being able to replace hair cells when they are damaged
(Lombarte et al. 1993; Smith et al. 2006a). Because these species are able to rely on alternative
mechanisms for these essential life functions, instances of TTS would not increase the likelihood
of injury by annoying a fish to such an extent as to significantly disrupt normal behavioral
patterns, including breeding, feeding, or sheltering and would not rise to the level of take.
Therefore, the effect of exposure to acoustic stressors that may result in TTS is insignificant and
is not likely to adversely affect the ESA-listed fish species considered in this Opinion.
Additionally, behavioral effects resulting from reactions to sound created by the explosions will
be temporary (e.g., a startle response), and we do not expect these reactions to have any
measurable effects on any individual’s fitness. We expect individuals that exhibit a temporary
behavioral response will return to pre-detonation behavior immediately following each
explosion. Similar to instances of TTS, we do not expect these short term behavioral reactions to
541
Biological Opinion and Conference Report on Navy NWTT Activities and NMFS’ MMPA Incidental Take
Authorization PCTS FPR-2015-9110
increase the likelihood of injury by annoying a fish to such an extent as to significantly disrupt
normal behavioral patterns, including breeding, feeding, or sheltering, and therefore such
reactions would not rise to the level of take. Therefore, the effect of detonations that may result
in behavioral reactions is insignificant and is not likely to adversely affect the ESA-listed fish
species considered in this Opinion.
6.11.1.5 Assessing the Effect of Take on ESA-listed Fish Populations
It is important to note injury was defined as the distance from the detonation where no injury
would occur; we consider this the point of onset injury. We expect the majority of fish injuries to
be minor and recoverable although some injuries may lead to internal bleeding, barotrauma, and
death. Fish that are near the range to mortality may be more likely to incur a more severe injury
that could lead to mortality with time (e.g., internal bleeding, barotrauma, higher susceptibility to
predation). Because we do not have information to estimate what proportion of injured
individuals will die, for the purposes of assessing jeopardy and potential population-level effects,
we will assume all fish that may be injured may die. Additionally, it is important to emphasize
that the mortality threshold is based on the distance from the detonation that would be expected
to result in one percent of fish exposed dying. Therefore, this is a conservative method to
estimate injury and mortality and resulting estimates of take are also conservative.
Many of the take estimates resulted in fractional numbers of fish being killed or injured. Since
the Navy cannot kill or injure fractional numbers of fish, we evaluated the effect of this level of
anticipated take over a 10 year period (e.g., if 0.1 fish were estimated to be killed in one year, 1
fish was estimated to be killed in 10 years). If take estimates over this 10 year period were still
<1 fish killed or injured, but ≥0.1, this estimate was rounded up to one. If over the 10 year period
any estimates were <0.1, we determined injury or mortality was not reasonably certain to occur
and therefore, discountable. Expressing take over a 10 year period allows us to consider the
effects of low levels of take that may not be expected to occur in a single year, but would be
likely over a longer period of time.
We assume for the purposes of this analysis that the current annual level of activities and impacts
will continue into the reasonably foreseeable future, and we have made our jeopardy
determination on that basis. If the status of the species and Navy activity levels remain the same,
we would expect the estimated number of fish killed or injured by Navy explosive activities in a
10-year period to continue into the reasonably foreseeable future. However, we believe that
because our estimates of the number of ESA-listed fish that will be injured or killed is dependent
on fish abundance, attempting to predict the number of fish affected by Navy activities beyond
ten years into the future is too speculative to allow for a scientifically meaningful assessment of
the impacts on ESA-listed species beyond this timeframe. This is because fish abundance may
change significantly over even a limited period of time (e.g., escapement of Upper Willamette
542
Biological Opinion and Conference Report on Navy NWTT Activities and NMFS’ MMPA Incidental Take
Authorization PCTS FPR-2015-9110
River spring Chinook, Table 25; escapement of Central Valley spring Chinook, Table 28) due to
a variety of factors including changes in fisheries harvest strategies, habitat conditions, and other
changes in the environmental baseline that may impact reproductive success. That being said,
there is no evidence that expressing take over a ten-year period risks overlooking effects that
might appear only over a longer period of time because our analysis was structured such that the
magnitude of the percentage of the population affected would not be expected to change over
time unless Navy activity levels changed. Additionally, because MMPA take authorization is
limited to five years, we will need to reassess the Navy’s proposed action under both the MMPA
and ESA prior to the expiration of the proposed take authorization, and not less than every five
years thereafter. These periodic reassessments will allow us to update the environmental
baseline, assess any changes in ESA-listed fish species status, and to adjust our estimates of
injury and mortality accordingly. In this manner, we will be able to ensure that our assessment of
the effect of the Navy’s ongoing activities and the resultant impacts on listed fish species are up
to date, and that no impacts are omitted from consideration.
In order to evaluate the potential for this level of take from Navy activities (training and testing)
to appreciably reduce the likelihood of the survival and recovery of any of the ESA-listed fish
species considered in this Opinion, we compared the level of take anticipated to the most current
population abundance estimates for each ESU or DPS. Results from this analysis are presented in
terms of a percentage of each ESU or DPS that would be expected to die or be injured from
Navy activities over a 10 year timeframe, assuming activity levels are maintained and status of
the species does not change. Results for the offshore portion of the Action Area are in Table 123,
Table 124, and Table 125. Results from inland waters are presented in Table 126.
543
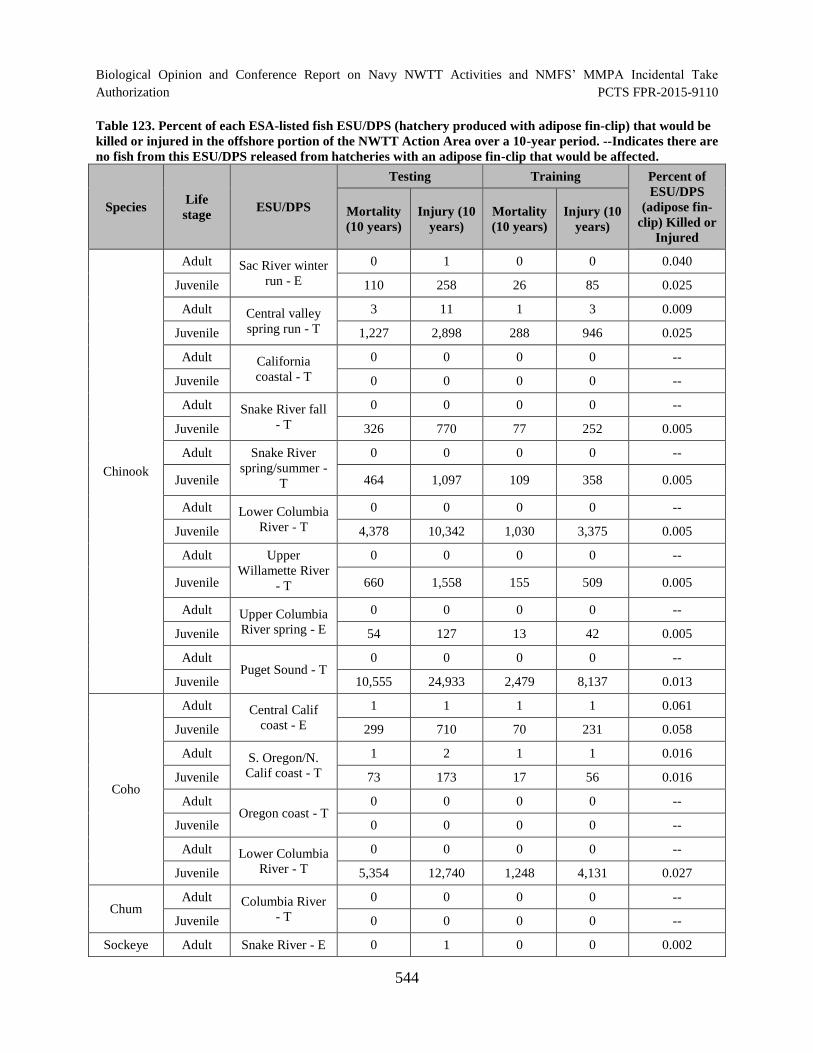
Biological Opinion and Conference Report on Navy NWTT Activities and NMFS’ MMPA Incidental Take
Authorization PCTS FPR-2015-9110
Table 123. Percent of each ESA-listed fish ESU/DPS (hatchery produced with adipose fin-clip) that would be
killed or injured in the offshore portion of the NWTT Action Area over a 10-year period. --Indicates there are
no fish from this ESU/DPS released from hatcheries with an adipose fin-clip that would be affected.
Species Life
stage ESU/DPS
Testing Training Percent of
ESU/DPS
(adipose fin-
clip) Killed or
Injured
Mortality
(10 years)
Injury (10
years)
Mortality
(10 years)
Injury (10
years)
Chinook
Adult Sac River winter
run - E
0 1 0 0 0.040
Juvenile 110 258 26 85 0.025
Adult Central valley
spring run - T
3 11 1 3 0.009
Juvenile 1,227 2,898 288 946 0.025
Adult California
coastal - T
0 0 0 0 -
Juvenile 0 0 0 0 -
Adult Snake River fall
- T
0 0 0 0 -
Juvenile 326 770 77 252 0.005
Adult Snake River
spring/summer
T
0 0 0 0 -
Juvenile 464 1,097 109 358 0.005
Adult Lower Columbia
River - T
0 0 0 0 -
Juvenile 4,378 10,342 1,030 3,375 0.005
Adult Upper
Willamette River
- T
0 0 0 0 -
Juvenile 660 1,558 155 509 0.005
Adult Upper Columbia
River spring - E
0 0 0 0 -
Juvenile 54 127 13 42 0.005
Adult Puget Sound - T
0 0 0 0 -
Juvenile 10,555 24,933 2,479 8,137 0.013
Coho
Adult Central Calif
coast - E
1 1 1 1 0.061
Juvenile 299 710 70 231 0.058
Adult S. Oregon/N.
Calif coast - T
1 2 1 1 0.016
Juvenile 73 173 17 56 0.016
Adult Oregon coast - T
0 0 0 0 -
Juvenile 0 0 0 0 -
Adult Lower Columbia
River - T
0 0 0 0 -
Juvenile 5,354 12,740 1,248 4,131 0.027
Chum Adult Columbia River
- T
0 0 0 0 -
Juvenile 0 0 0 0 --
Sockeye Adult Snake River - E 0 1 0 0 0.002
544
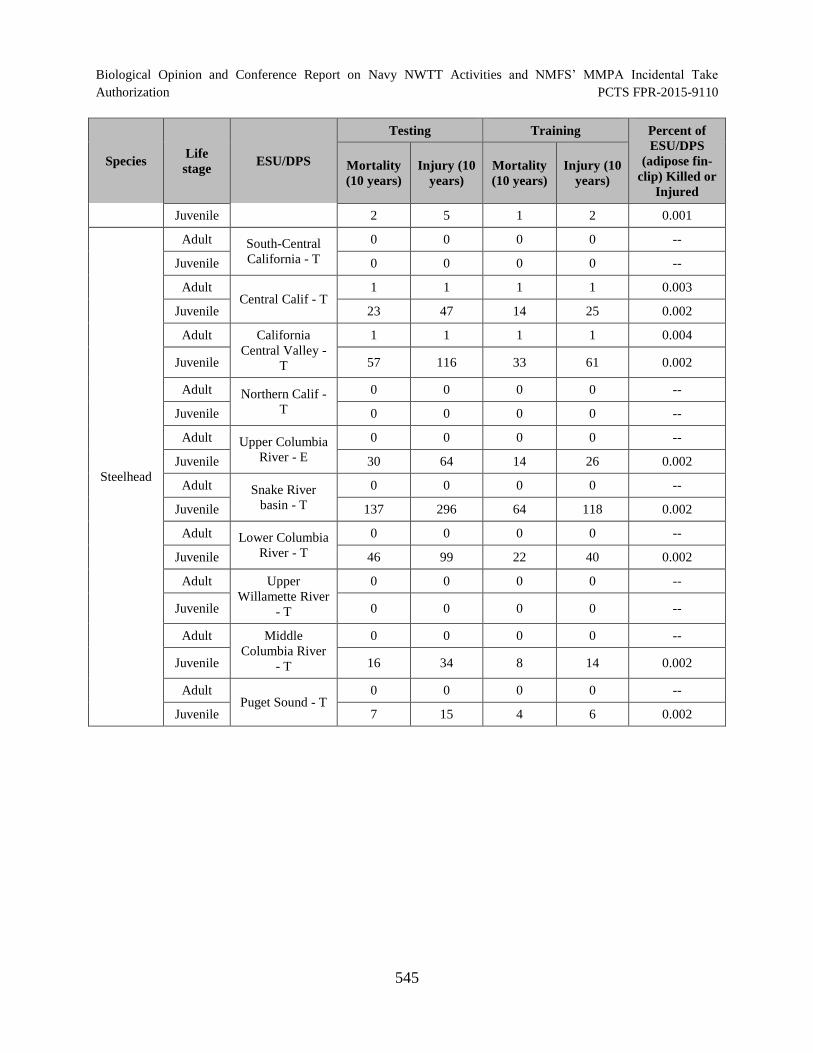
Biological Opinion and Conference Report on Navy NWTT Activities and NMFS’ MMPA Incidental Take Authorization PCTS FPR-2015-9110
Species Life
stage ESU/DPS
Testing Training Percent of
ESU/DPS
(adipose fin-
clip) Killed or
Injured
Mortality
(10 years)
Injury (10
years)
Mortality
(10 years)
Injury (10
years)
Juvenile 2 5 1 2 0.001
Steelhead
Adult South-Central
California - T
0 0 0 0 -
Juvenile 0 0 0 0 -
Adult Central Calif - T
1 1 1 1 0.003
Juvenile 23 47 14 25 0.002
Adult California
Central Valley
T
1 1 1 1 0.004
Juvenile 57 116 33 61 0.002
Adult Northern Calif
T
0 0 0 0 -
Juvenile 0 0 0 0 -
Adult Upper Columbia
River - E
0 0 0 0 -
Juvenile 30 64 14 26 0.002
Adult Snake River
basin - T
0 0 0 0 -
Juvenile 137 296 64 118 0.002
Adult Lower Columbia
River - T
0 0 0 0 -
Juvenile 46 99 22 40 0.002
Adult Upper
Willamette River
- T
0 0 0 0 -
Juvenile 0 0 0 0 -
Adult Middle
Columbia River
- T
0 0 0 0 -
Juvenile 16 34 8 14 0.002
Adult Puget Sound - T
0 0 0 0 -
Juvenile 7 15 4 6 0.002
545
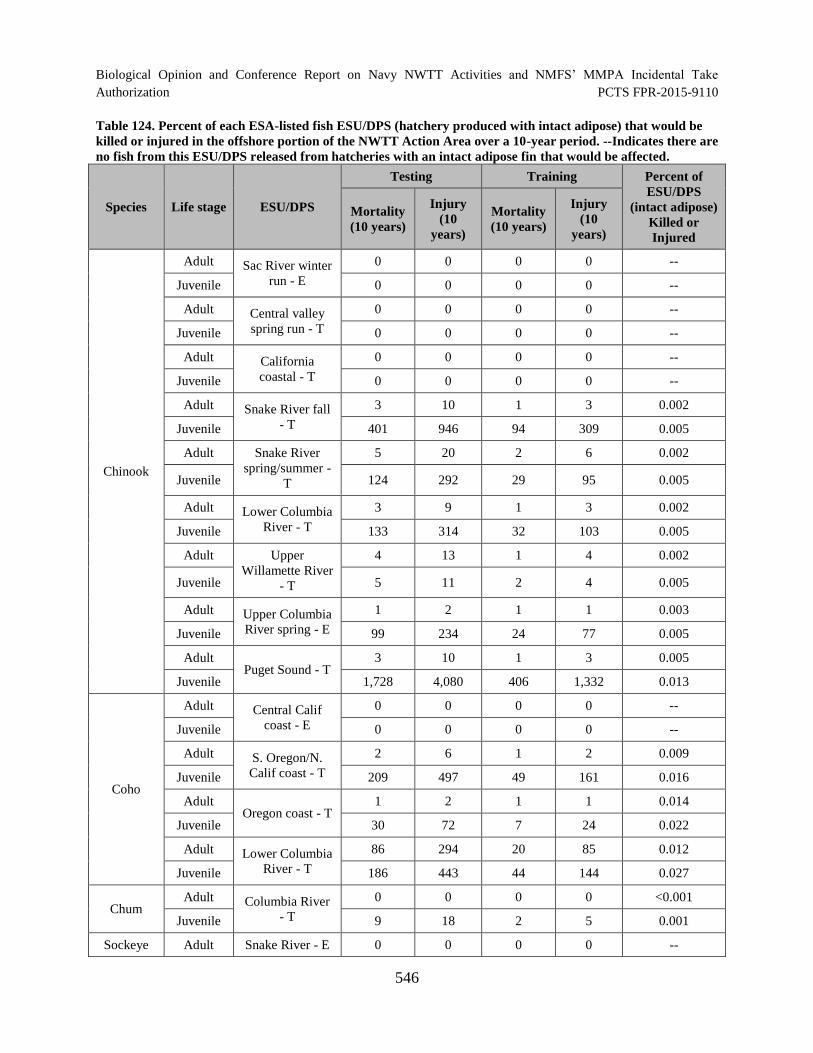
Biological Opinion and Conference Report on Navy NWTT Activities and NMFS’ MMPA Incidental Take
Authorization PCTS FPR-2015-9110
Table 124. Percent of each ESA-listed fish ESU/DPS (hatchery produced with intact adipose) that would be
killed or injured in the offshore portion of the NWTT Action Area over a 10-year period. --Indicates there are
no fish from this ESU/DPS released from hatcheries with an intact adipose fin that would be affected.
Species Life stage ESU/DPS
Testing Training Percent of
ESU/DPS
(intact adipose)
Killed or
Injured
Mortality
(10 years)
Injury
(10
years)
Mortality
(10 years)
Injury
(10
years)
Chinook
Adult Sac River winter
run - E
0 0 0 0 -
Juvenile 0 0 0 0 -
Adult Central valley
spring run - T
0 0 0 0 -
Juvenile 0 0 0 0 -
Adult California
coastal - T
0 0 0 0 -
Juvenile 0 0 0 0 -
Adult Snake River fall
- T
3 10 1 3 0.002
Juvenile 401 946 94 309 0.005
Adult Snake River
spring/summer
T
5 20 2 6 0.002
Juvenile 124 292 29 95 0.005
Adult Lower Columbia
River - T
3 9 1 3 0.002
Juvenile 133 314 32 103 0.005
Adult Upper
Willamette River
- T
4 13 1 4 0.002
Juvenile 5 11 2 4 0.005
Adult Upper Columbia
River spring - E
1 2 1 1 0.003
Juvenile 99 234 24 77 0.005
Adult Puget Sound - T
3 10 1 3 0.005
Juvenile 1,728 4,080 406 1,332 0.013
Coho
Adult Central Calif
coast - E
0 0 0 0 -
Juvenile 0 0 0 0 -
Adult S. Oregon/N.
Calif coast - T
2 6 1 2 0.009
Juvenile 209 497 49 161 0.016
Adult Oregon coast - T
1 2 1 1 0.014
Juvenile 30 72 7 24 0.022
Adult Lower Columbia
River - T
86 294 20 85 0.012
Juvenile 186 443 44 144 0.027
Chum Adult Columbia River
- T
0 0 0 0 <0.001
Juvenile 9 18 2 5 0.001
Sockeye Adult Snake River - E 0 0 0 0 -
546
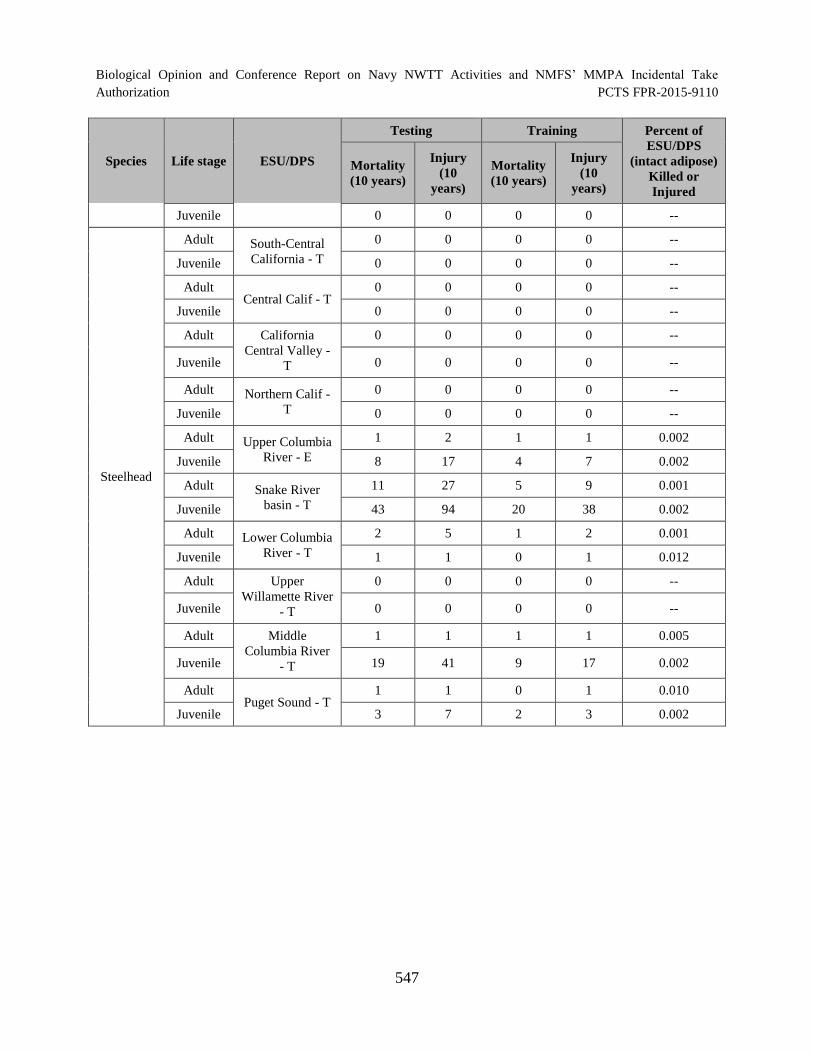
Biological Opinion and Conference Report on Navy NWTT Activities and NMFS’ MMPA Incidental Take Authorization PCTS FPR-2015-9110
Species Life stage ESU/DPS
Testing Training Percent of
ESU/DPS
(intact adipose)
Killed or
Injured
Mortality
(10 years)
Injury
(10
years)
Mortality
(10 years)
Injury
(10
years)
Juvenile 0 0 0 0 --
Steelhead
Adult South-Central
California - T
0 0 0 0 -
Juvenile 0 0 0 0 -
Adult Central Calif - T
0 0 0 0 -
Juvenile 0 0 0 0 -
Adult California
Central Valley
T
0 0 0 0 -
Juvenile 0 0 0 0 -
Adult Northern Calif
T
0 0 0 0 -
Juvenile 0 0 0 0 -
Adult Upper Columbia
River - E
1 2 1 1 0.002
Juvenile 8 17 4 7 0.002
Adult Snake River
basin - T
11 27 5 9 0.001
Juvenile 43 94 20 38 0.002
Adult Lower Columbia
River - T
2 5 1 2 0.001
Juvenile 1 1 0 1 0.012
Adult Upper
Willamette River
- T
0 0 0 0 -
Juvenile 0 0 0 0 -
Adult Middle
Columbia River
- T
1 1 1 1 0.005
Juvenile 19 41 9 17 0.002
Adult Puget Sound - T
1 1 0 1 0.010
Juvenile 3 7 2 3 0.002
547
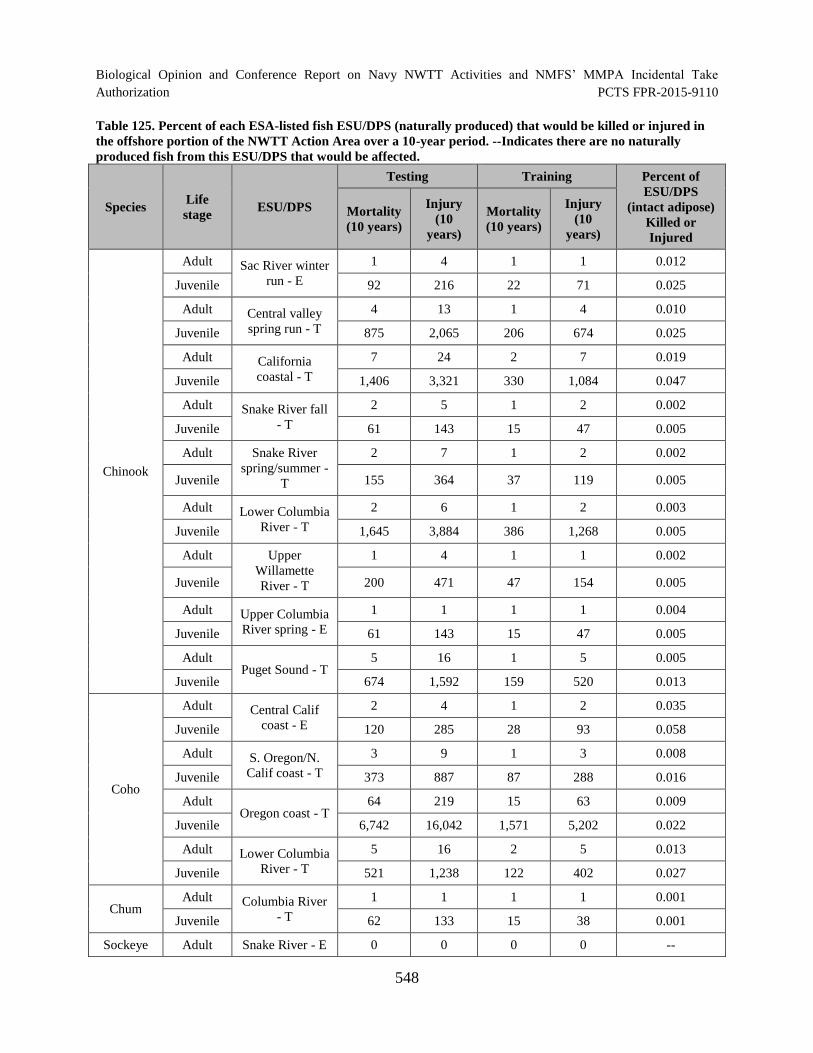
Biological Opinion and Conference Report on Navy NWTT Activities and NMFS’ MMPA Incidental Take
Authorization PCTS FPR-2015-9110
Table 125. Percent of each ESA-listed fish ESU/DPS (naturally produced) that would be killed or injured in
the offshore portion of the NWTT Action Area over a 10-year period. --Indicates there are no naturally
produced fish from this ESU/DPS that would be affected.
Species Life
stage ESU/DPS
Testing Training Percent of
ESU/DPS
(intact adipose)
Killed or
Injured
Mortality
(10 years)
Injury
(10
years)
Mortality
(10 years)
Injury
(10
years)
Chinook
Adult Sac River winter
run - E
1 4 1 1 0.012
Juvenile 92 216 22 71 0.025
Adult Central valley
spring run - T
4 13 1 4 0.010
Juvenile 875 2,065 206 674 0.025
Adult California
coastal - T
7 24 2 7 0.019
Juvenile 1,406 3,321 330 1,084 0.047
Adult Snake River fall
- T
2 5 1 2 0.002
Juvenile 61 143 15 47 0.005
Adult Snake River
spring/summer
T
2 7 1 2 0.002
Juvenile 155 364 37 119 0.005
Adult Lower Columbia
River - T
2 6 1 2 0.003
Juvenile 1,645 3,884 386 1,268 0.005
Adult Upper
Willamette
River - T
1 4 1 1 0.002
Juvenile 200 471 47 154 0.005
Adult Upper Columbia
River spring - E
1 1 1 1 0.004
Juvenile 61 143 15 47 0.005
Adult Puget Sound - T
5 16 1 5 0.005
Juvenile 674 1,592 159 520 0.013
Coho
Adult Central Calif
coast - E
2 4 1 2 0.035
Juvenile 120 285 28 93 0.058
Adult S. Oregon/N.
Calif coast - T
3 9 1 3 0.008
Juvenile 373 887 87 288 0.016
Adult Oregon coast - T
64 219 15 63 0.009
Juvenile 6,742 16,042 1,571 5,202 0.022
Adult Lower Columbia
River - T
5 16 2 5 0.013
Juvenile 521 1,238 122 402 0.027
Chum Adult Columbia River
- T
1 1 1 1 0.001
Juvenile 62 133 15 38 0.001
Sockeye Adult Snake River - E 0 0 0 0 -
548
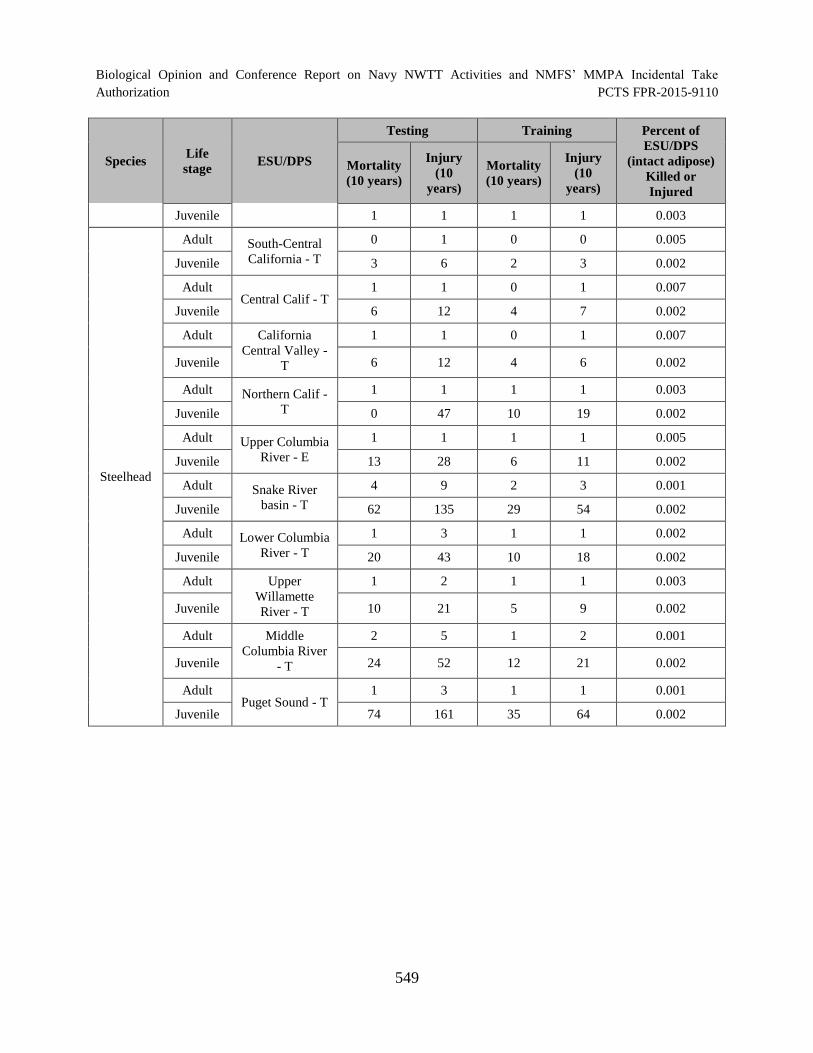
Biological Opinion and Conference Report on Navy NWTT Activities and NMFS’ MMPA Incidental Take Authorization PCTS FPR-2015-9110
Species Life
stage ESU/DPS
Testing Training Percent of
ESU/DPS
(intact adipose)
Killed or
Injured
Mortality
(10 years)
Injury
(10
years)
Mortality
(10 years)
Injury
(10
years)
Juvenile 1 1 1 1 0.003
Steelhead
Adult South-Central
California - T
0 1 0 0 0.005
Juvenile 3 6 2 3 0.002
Adult Central Calif - T
1 1 0 1 0.007
Juvenile 6 12 4 7 0.002
Adult California
Central Valley
T
1 1 0 1 0.007
Juvenile 6 12 4 6 0.002
Adult Northern Calif
T
1 1 1 1 0.003
Juvenile 0 47 10 19 0.002
Adult Upper Columbia
River - E
1 1 1 1 0.005
Juvenile 13 28 6 11 0.002
Adult Snake River
basin - T
4 9 2 3 0.001
Juvenile 62 135 29 54 0.002
Adult Lower Columbia
River - T
1 3 1 1 0.002
Juvenile 20 43 10 18 0.002
Adult Upper
Willamette
River - T
1 2 1 1 0.003
Juvenile 10 21 5 9 0.002
Adult Middle
Columbia River
- T
2 5 1 2 0.001
Juvenile 24 52 12 21 0.002
Adult Puget Sound - T
1 3 1 1 0.001
Juvenile 74 161 35 64 0.002
549
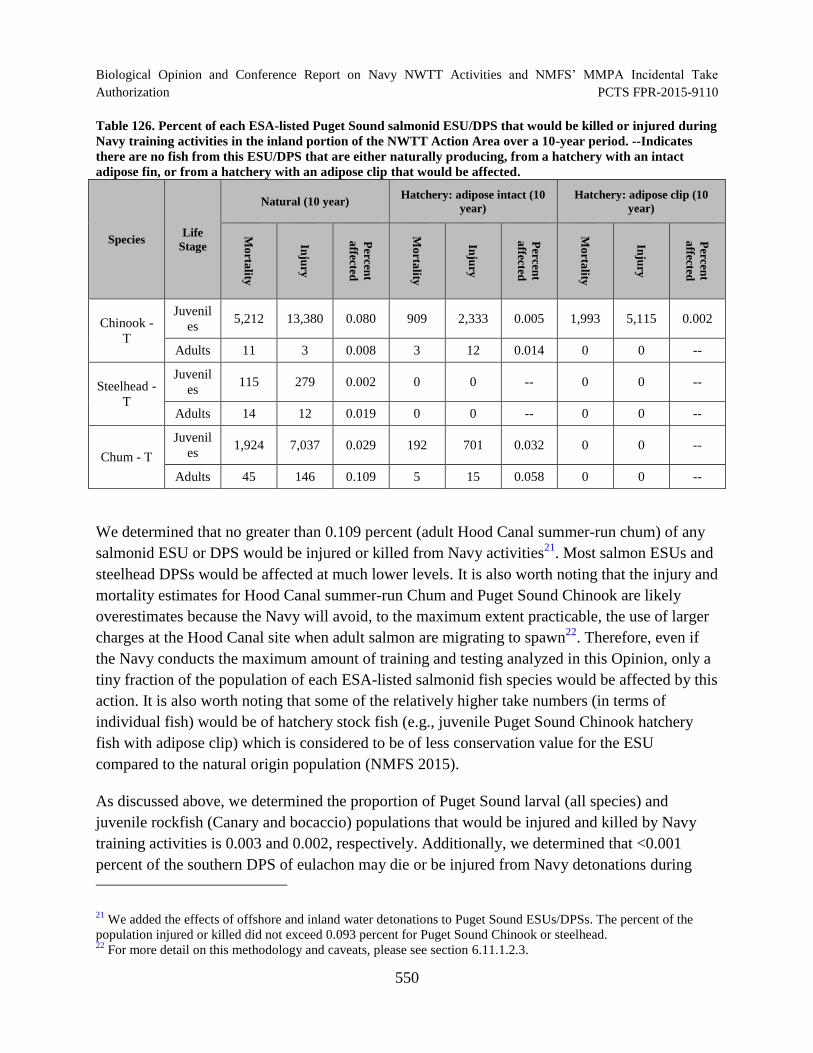
Biological Opinion and Conference Report on Navy NWTT Activities and NMFS’ MMPA Incidental Take
Authorization PCTS FPR-2015-9110
Table 126. Percent of each ESA-listed Puget Sound salmonid ESU/DPS that would be killed or injured during
Navy training activities in the inland portion of the NWTT Action Area over a 10-year period. --Indicates
there are no fish from this ESU/DPS that are either naturally producing, from a hatchery with an intact
adipose fin, or from a hatchery with an adipose clip that would be affected.
Species Life
Stage
Natural (10 year) Hatchery: adipose intact (10
year)
Hatchery: adipose clip (10
year)
Mo
rtality
Inju
ry
Percen
t
affected
Mo
rtality
Inju
ry
Percen
t
affected
Mo
rtality
Inju
ry
Percen
t
affected
Chinook
T
Juvenil
es 5,212 13,380 0.080 909 2,333 0.005 1,993 5,115 0.002
Adults 11 3 0.008 3 12 0.014 0 0 --
Steelhead
T
Juvenil
es 115 279 0.002 0 0 - 0 0 -
Adults 14 12 0.019 0 0 - 0 0 -
Chum - T
Juvenil
es 1,924 7,037 0.029 192 701 0.032 0 0 -
Adults 45 146 0.109 5 15 0.058 0 0 -
We determined that no greater than 0.109 percent (adult Hood Canal summer-run chum) of any
salmonid ESU or DPS would be injured or killed from Navy activities21
. Most salmon ESUs and
steelhead DPSs would be affected at much lower levels. It is also worth noting that the injury and
mortality estimates for Hood Canal summer-run Chum and Puget Sound Chinook are likely
overestimates because the Navy will avoid, to the maximum extent practicable, the use of larger
charges at the Hood Canal site when adult salmon are migrating to spawn22
. Therefore, even if
the Navy conducts the maximum amount of training and testing analyzed in this Opinion, only a
tiny fraction of the population of each ESA-listed salmonid fish species would be affected by this
action. It is also worth noting that some of the relatively higher take numbers (in terms of
individual fish) would be of hatchery stock fish (e.g., juvenile Puget Sound Chinook hatchery
fish with adipose clip) which is considered to be of less conservation value for the ESU
compared to the natural origin population (NMFS 2015).
As discussed above, we determined the proportion of Puget Sound larval (all species) and
juvenile rockfish (Canary and bocaccio) populations that would be injured and killed by Navy
training activities is 0.003 and 0.002, respectively. Additionally, we determined that <0.001
percent of the southern DPS of eulachon may die or be injured from Navy detonations during
21 We added the effects of offshore and inland water detonations to Puget Sound ESUs/DPSs. The percent of the
population injured or killed did not exceed 0.093 percent for Puget Sound Chinook or steelhead. 22
For more detail on this methodology and caveats, please see section 6.11.1.2.3.
550
Biological Opinion and Conference Report on Navy NWTT Activities and NMFS’ MMPA Incidental Take
Authorization PCTS FPR-2015-9110
training (0 percent) and testing (<0.001 percent). These levels of injury and mortality are
miniscule from a population-level perspective and, assuming no changes in the status of the
species, would not be expected to reduce appreciably the likelihood of survival and recovery of
these populations over a ten-year period or continuing into the reasonably foreseeable future.
In addition to quantifying the number of individuals that we expect to be injured or killed and the
corresponding proportion of each population that would be impacted, we assessed the likelihood
that U.S. Navy underwater detonations could injure or kill a significant proportion of individuals
from a single, potentially small, population during a single detonation or series of detonations.
This discussion also relates to whether or not Navy activities would be expected to impact
salmonid species structure and diversity. However, as stated throughout this Opinion, including
in the Status of Listed Resources section, the ESA-listed salmonids that are likely to be impacted
by these activities exhibit significant life history variation, even within populations (e.g.,
Bellinger et al. 2015; Burke et al. 2013; Weitkamp and Neely 2002). For example, Chinook
salmon from the Skagit River, a portion of the Puget Sound ESU, are categorized into six
populations (Zimmerman et al. 2015). The six populations are named according to the time of
river entry (spring, summer, and fall) and location of spawning. Additionally, out-migrant life
history varies with individuals out-migrating as fry, sub-yearling parr, or yearling smolts
(Zimmerman et al. 2015). Because of this life history variability, we would expect Chinook
salmon from the Skagit River to be widely dispersed in space and time in the Action Area where
they may be affected by Navy activities. Additionally, salmonids are not known to school
(Pearcy and Fisher 1990) and occur in relatively low densities, decreasing the likelihood that a
significant number of individuals would be impacted. Therefore, we do not expect a large
proportion of individuals from a single population to be grouped together in space and time such
that they would be killed or injured by a single detonation or series of detonations. Additionally,
because of the variability in life history exhibited within the ESA-listed entities considered in
this Opinion and the infrequent nature of Navy training and testing (spread out across space and
time), we would not expect the proposed action to affect species structure and diversity.
In summary, we conclude that the level of incidental take of ESA-listed fish species during Navy
training and testing activities each year that has been proposed and considered in this Opinion
represents a very small reduction in abundance that is not likely to appreciably impact any ESA-
listed fish populations over time. We also conclude that the diversity of ESA-listed fish
populations will be not be affected by this limited amount of take that should be distributed
across populations across their ranges and through time during outmigration and emigration
periods. We have generally identified and considered the worst case scenario of potential injury
and mortality for each ESA-listed fish population considered in this Opinion, where applicable,
leading to the most conservative estimates of expected take. We have concluded that the
proposed action will have a very small effect on the species’ abundance, and will not affect
population structure or diversity at all. As a result, we conclude that the proposed action would
551
Biological Opinion and Conference Report on Navy NWTT Activities and NMFS’ MMPA Incidental Take
Authorization PCTS FPR-2015-9110
not reasonably be expected to appreciably reduce the likelihood of the survival and recovery of
any of the ESA-listed fish species that may be affected by this proposed action.
6.12 Cumulative Effects
“Cumulative effects” are those effects of future state or private activities, not involving Federal
activities, that are reasonably certain to occur within the Action Area of the Federal action
subject to consultation (50 CFR 402.02). Future Federal actions that are unrelated to the
proposed action are not considered in this section because they require separate consultation
pursuant to section 7 of the ESA.
During this consultation, NMFS searched for information on future State, tribal, local, or private
actions that were reasonably certain to occur in the Action Area. Most of the Action Area
includes federal military reserves or is outside of territorial waters of the United States of
America, which would preclude the possibility of future state, tribal, or local action that would
not require some form of federal funding or authorization. NMFS conducted electronic searches
of Google and other electronic search engines. Those searches produced no evidence of future
private action in the Action Area that would not require federal authorization or funding and is
reasonably certain to occur. As a result, NMFS is not aware of any actions of this kind that are
likely to occur in the Action Area during the reasonably foreseeable future.
7 INTEGRATION AND SYNTHESIS
The Integration and Synthesis section is the final step in our assessment of the risk posed to
species and critical habitat as a result of implementing the proposed action. In this section, we
add the effects of the action (Section 6) to the environmental baseline (Section 4) and the
cumulative effects (Section 6.11) to formulate the agency’s biological opinion as to whether the
proposed action is likely to: (1) reduce appreciably the likelihood of both the survival and
recovery of an ESA-listed species in the wild by reducing its numbers, reproduction, or
distribution; or (2) reduce the value of designated or proposed critical habitat for the
conservation of the species. These assessments are made in full consideration of the status of the
species and critical habitat (Section 4) and the Environmental Baseline in the Action Area
(Section 5).
The following discussions separately summarize the probable risks the proposed action poses to
threatened and endangered species and critical habitat that are likely to be exposed. These
summaries integrate the exposure profiles presented previously with the results of our response
analyses for each of the actions considered in this Opinion.
Our effects analyses identified the probable risks the Navy training and testing activities and
issuance of an MMPA rule and LOA to authorize take of marine mammals would pose to ESA
552
Biological Opinion and Conference Report on Navy NWTT Activities and NMFS’ MMPA Incidental Take
Authorization PCTS FPR-2015-9110
listed individuals that will be exposed to these actions. We measure risks to individuals of
endangered or threatened species using changes in the individuals’ “fitness” or the individual’s
growth, survival, annual reproductive success, and lifetime reproductive success. When we do
not expect listed animals exposed to an action’s effects to experience reductions in fitness, we
would not expect the action to have adverse consequences on the viability of the populations
those individuals represent or the species those populations comprise. As a result, if we conclude
that listed animals are not likely to experience reductions in their fitness, we would conclude our
assessment. If, however, we conclude that listed animals are likely to experience reductions in
their fitness, we would assess the consequences of those fitness reductions for the population or
populations the individuals in an Action Area represent.
The activities the Navy conducts in the NWTT Action Area will continue to introduce a suite of
stressors into the marine and coastal ecosystems. The stressors include: low, mid, and high-
frequency active sonar from surface vessels, torpedoes, and dipping sonar; shock waves and
sound fields associated with underwater detonations, acoustic and visual cues from surface
vessels as they move through the ocean’s surface, and sounds transferred into the water column
from fixed-wing aircraft and helicopters. Repeatedly exposing endangered and threatened marine
animals to each of these individual stressors could pose additional risks as the exposures
accumulate over time. Repeated exposures are discussed in more detail in sections 6.3.11, 6.4.7,
and 6.5.7. Also, exposing endangered and threatened marine animals to this suite of stressors
could pose additional risks as the stressors interact with one another or with other stressors that
already occur in those areas. More importantly, endangered and threatened marine animals that
occur in the NWTT Action Area would be exposed to combinations of stressors produced by
Navy activities at the same time they are exposed to stressors from other human activities and
natural phenomena. We recognize these interactions might have effects on endangered and
threatened species that we have not considered; however, the data available do not allow us to do
more than acknowledge the possibility.
For the purposes of this Opinion, we assume that all of these activities in the NWTT Action Area
and associated impacts will continue into the reasonably foreseeable future at the levels set forth
in the Final EIS/OEIS and MMPA rule. To address the likelihood of long-term additive or
accumulative effects, we first considered (1) stressors that accumulate in the environment, and
(2) effects that represent either the response of individuals, populations, or species to that
accumulation of stressors.
Sound does not permanently accumulate in the environment; therefore, an accumulative effects
analysis of this stressor is not warranted. However, repeated exposure of individuals to acoustic
stress can cause auditory fatigue and hearing loss. We expect ESA-listed species will not receive
repeated exposures at a rate at which recovery between exposures would not occur because of
the intermittent nature and duration of Navy acoustic sources. Navy activities in the NWTT
553
Biological Opinion and Conference Report on Navy NWTT Activities and NMFS’ MMPA Incidental Take
Authorization PCTS FPR-2015-9110
Action Area involving active sonar or underwater detonations are infrequent, short-term, and
generally unit level. Unit level events occur over a small spatial scale (one to a few 10s of square
miles) and with few participants (usually one or two). Single-unit unit level training would
typically involve a few hours of sonar use, with a typical nominal ping of every 50 seconds (duty
cycle). Even though an animal’s exposure to active sonar may be more than one time, the
intermittent nature of the sonar signal, its low duty cycle, and the fact that both the vessel and
animal are moving provide a very small chance that exposure to active sonar for individual
animals and stocks would be repeated over extended periods of time. Consequently, the Navy’s
NWTT activities do not create conditions of chronic, continuous underwater noise and are
unlikely to lead to habitat abandonment or long-term hormonal or physiological stress responses
in marine mammals.
Although Goldbogen et al. (2013) speculates that “frequent exposures to mid-frequency
anthropogenic sounds may pose significant risk to the recovery rates of endangered blue whale
populations,” the authors acknowledge that the actual responses of individual blue whales to
simulated mid-frequency sonar documented in the study “typically involves temporary avoidance
responses that appear to abate quickly after sound exposure.” Moreover, the most significant
response documented in the study occurred not as a result of exposure to simulated mid-
frequency sonar but as a result of exposure to pseudo-random noise. Therefore, the overall
weight of scientific evidence indicates that substantive behavioral responses by mysticetes, if
any, from exposure to mid-frequency active sonar and other active acoustic sources evaluated in
this Opinion are likely to be temporary and are unlikely to have any long-term adverse impact on
individual animals or affected populations. Even if sound exposure were to be concentrated in a
relatively small geographic area over a long period of time (e.g., days or weeks during major
training exercises), we would expect that some individual whales would avoid areas where
exposures to acoustic stressors are at higher levels (e.g., greater than 120 dB). For example,
Goldbogen et al. (2013) indicated some horizontal displacement of deep foraging blue whales in
response to simulated MFA sonar. Given these animal’s mobility and large ranges, we would
expect these individuals to temporarily select alternative foraging sites nearby until the exposure
levels in their initially selected foraging area have decreased. Therefore, even temporary
displacement from initially selected foraging habitat is not expected to impact the fitness of any
individual animals because we would expect equivalent foraging habitat to be available in close
proximity. Because we do not expect any fitness consequences from any individual animals, we
do not expect any population level effects from these behavioral responses.
Further, establishing a causal link between anthropogenic noise, animal communication, and
individual impacts as well as population viability is difficult to quantify and assess (McGregor
2013; Read et al. 2014). The difficulty in assessing the effects of sounds individually and
cumulatively on marine species is the confounding nature of indirect effects, age class, prior
experience, behavioral state at the time of exposure, and that responses may be influenced by
554
Biological Opinion and Conference Report on Navy NWTT Activities and NMFS’ MMPA Incidental Take
Authorization PCTS FPR-2015-9110
other non-sound related factors (Ellison et al. 2011; Goldbogen et al. 2013; Kight and Swaddle
2011; McGregor 2013; Read et al. 2014; Williams et al. 2014a).
Our assessment that the continuation of the Navy activities into the reasonably foreseeable future
is unlikely to have any adverse additive or long-term impacts on the affected threatened or
endangered species (assuming current levels of activity and no significant changes in the status
of species or to the Environmental Baseline) is also consistent with the absence of any
documented population-level or adverse aggregate impacts resulting from Navy activities to date,
despite decades of training in the NWTT Action Area using many of the same systems. Most of
the training activities the Navy conducts in the NWTT Action Area are similar, if not identical,
to activities that have been occurring in the same locations for decades.
Our regulations require us to consider, using the best available scientific data, effects of the
action that are “likely” and “reasonably certain” to occur rather than effects that are speculative
or uncertain. See 50 C.F.R. § 402.02 (defining to “jeopardize the continued existence of” and
“effects of the action”). Our analysis and conclusions in this Opinion are based on estimates of
exposures and take assuming that the Navy conduct the maximum number of authorized training
and testing activities for the maximum number of authorized hours. The effects of the action in
relation to the Status of Listed Resources and the Environmental Baseline are presented by each
species below.
7.1 Blue Whale
Blue whales are only present in the offshore portion of the NWTT Action Area. Blue whales
may be exposed to acoustic stressors associated with training and testing activities throughout
the year. Blue whales found in offshore portion of the NWTT Action Area are recognized as part
of the Eastern North Pacific stock. The acoustic analysis predicts that blue whales of the Eastern
North Pacific stock may be exposed to sonar and other active acoustic sources associated with
training activities in the Offshore Area that may result in two TTS and three behavioral reactions
annually. Blue whales may also be exposed to sonar and other active acoustic sources associated
with testing activities throughout the year. The acoustic analysis predicts that blue whales of the
Eastern North Pacific stock may be exposed to sonar and other active acoustic sources associated
with testing activities in the Offshore Area that may result in six TTS exposures annually.
Acoustic modeling predicts that ESA-listed mysticetes including blue whales may be exposed to
impulses from explosive sources associated with training and testing activities in the Offshore
Area; however, there are no predicted effects from these activities, because exposures would not
exceed the current effects thresholds.
While we recognize that animal hearing evolved separately from animal vocalizations and, as a
result, it may be inappropriate to make inferences about an animal’s hearing sensitivity from
555
Biological Opinion and Conference Report on Navy NWTT Activities and NMFS’ MMPA Incidental Take
Authorization PCTS FPR-2015-9110
their vocalizations, we have no data on blue whale hearing so we assume that blue whale
vocalizations are partially representative of their hearing sensitivities. Blue whales are not likely
to respond to high-frequency sound sources associated with the proposed training and testing
activities because of their hearing sensitivities. Despite previous assumptions based on
vocalizations and anatomy that blue whales predominantly hear low-frequency sounds below
400 Hz (Croll et al. 2001b; Oleson et al. 2007b; Stafford and Moore 2005a), recent research has
indicated blue whales not only hear mid-frequency active sonar transmissions, in some cases
they respond to those transmissions (Southall et al. 2011a).
Blue whales may hear some sounds in the mid-frequency range and exhibit behavioral responses
to sounds in this range depending on received level and context (Goldbogen et al. (2013) and
Melcon et al. (2012)). However, both Goldbogen et al. (2013) and Melcon et al. (2012) indicated
that behavioral responses to simulated or operational MFA sonar were temporary, with whales
resuming normal behavior quickly after the cessation of sound exposure. Further, responses were
discernible for whales in certain behavioral states (i.e., deep feeding), but not in others (i.e.,
surface feeding). As stated in Goldbogen et al. (2013) when summarizing the response of blue
whales to simulated MFA sonar, “We emphasize that elicitation of the response is complex,
dependent on a suite of contextual (e.g., behavioral state) and sound exposure factors (e.g.,
maximum received level), and typically involves temporary avoidance responses that appear to
abate quickly after sound exposure.” Goldbogen et al. (2013) also speculated that if this
temporary behavioral response interrupted feeding behavior, this could have impacts on
individual fitness and eventually, population health. However, for this to be true, we would have
to assume that an individual whale could not compensate for this lost feeding opportunity by
either immediately feeding at another location, by feeding shortly after cessation of acoustic
exposure, or by feeding at a later time. Additionally, in instances of TTS, individuals would
likely fully recover within 24 hours of exposure and resume normal behavioral activities. There
is no indication, particularly since unconsumed prey would still be available in the environment
following the cessation of acoustic exposure and resumption of normal behaviors following
instances of behavioral response including responses associated with TTS.
During the Controlled Exposure Experiments (CEEs) used in Goldbogen et al. (2013), sound
sources were deployed from a stationary source vessel positioned approximately 1,000 m from
the focal animals, with one transmission onset every 25 seconds (Southall et al. 2012b). In
contrast, most Navy sonar systems are deployed from highly mobile vessels or in-water devices
which do not directly target marine mammals. Further, the typical duty cycle with most tactical
anti-submarine warfare is lower than used in the CEEs described above, transmitting about once
per minute (DoN 2015b). For example, a typical Navy vessel with hull mounted MFA sonar
would travel over 0.3 kilometers between pings (based on a speed of 10 knots/hr and
transmission rate of 1 ping/min). Based on this distance traveled and potential avoidance
behavior of acoustically exposed animals, we expect repeat acoustic exposures capable of
556
Biological Opinion and Conference Report on Navy NWTT Activities and NMFS’ MMPA Incidental Take
Authorization PCTS FPR-2015-9110
eliciting a behavioral response to an individual over a brief period of time to be rare. In the event
an individual is exposed to multiple sound sources that elicit a behavioral response (e.g.,
disruption of feeding) in a short amount of time, including instances of TTS, we do not expect
these exposures to have fitness consequences as individuals will resume feeding upon cessation
of the sound exposure and unconsumed prey will still be available in the environment.
Even if sound exposure were to be concentrated in a relatively small geographic area over a long
period of time (e.g., days or weeks during major training exercises), we would expect that some
individual whales would avoid areas where exposures to acoustic stressors are at higher levels
(e.g., greater than 120 dB). For example, Goldbogen et al. (2013) indicated some horizontal
displacement of deep foraging blue whales in response to simulated MFA sonar. Given these
animal’s mobility and large ranges, we would expect these individuals to temporarily select
alternative foraging sites nearby until the exposure levels in their initially selected foraging area
have decreased. Therefore, even temporary displacement from initially selected foraging habitat
is not expected to impact the fitness of any individual animals because we would expect
equivalent foraging to be available in close proximity. Because we do not expect any fitness
consequences from any individual animals, we do not expect any population level effects from
these behavioral responses.
Most of the blue whales that are exposed to acoustic stressors would be exposed periodically or
episodically over certain months or seasons from military activities in the NWTT Action Area.
Given the nature of testing and training as described above, these periodic or episodic exposure
and behavioral response scenarios, including TTS, most often allow sufficient time to return to
baseline conditions and resumption of normal behavioral activities such as feeding and breeding.
As described previously, including in this Opinion, the available scientific information does not
provide evidence that exposure to acoustic stressors from Navy training and testing activities will
impact the fitness of any individuals of this species. Therefore exposure to acoustic stressors will
not have population or species level impacts.
Further, recent evidence indicates that the Eastern North Pacific blue whale population, has
likely reached carrying capacity (Monnahan et al. 2014a). Navy training and testing activities,
including the use of MFA sonar, have been ongoing in this area for decades. Therefore, any
potential temporary behavioral impacts on blue whales from the use of MFA during Navy
training and testing activities do not appear to have inhibited population growth of the Eastern
North Pacific blue whale population in that area. We would expect similar effects to exist in the
NWTT Action Area.
The 1998 blue whale recovery plan does not outline downlisting or delisting criteria. The
recovery plan does list several stressors potentially affecting the status of blue whales in the
North Pacific Ocean that are relevant to NWTT activities including: vessel strike, vessel
557
Biological Opinion and Conference Report on Navy NWTT Activities and NMFS’ MMPA Incidental Take
Authorization PCTS FPR-2015-9110
disturbance, and military operations (including sonar). At the time the recovery plan was
published, the effects of these stressors on blue whales in the Pacific Ocean were not well
documented, their impact on recovery was not understood, and no attempt was made to prioritize
the importance of these stressors on recovery. As described previously, anthropogenic noise
associated with NWTT activities is not expected to impact the fitness of any individuals of this
species. No mortality of blue whales is expected to occur from NWTT activities.
Based on the evidence available, including the Environmental Baseline and Cumulative Effects,
stressors resulting from training and testing activities the Navy will conduct in the NWTT Action
Area on an annual basis, cumulatively over the five year period of the MMPA Rule from
November 2015 through November 2020, or cumulatively for the reasonably foreseeable future
(assuming there are no significant changes to the Status of Listed Resources or Environmental
Baseline), would not be expected to appreciably reduce the likelihood of the survival of blue
whales in the wild by reducing the reproduction, numbers, or distribution of that species. We also
conclude that effects from ongoing Navy training and testing activities continuing into the
reasonably foreseeable future would not be expected, directly or indirectly, to appreciably reduce
the likelihood of recovery of blue whales in the wild by reducing the reproduction, numbers, or
distribution of that species. NWTT stressors will not affect the population dynamics, behavioral
ecology, and social dynamics of individual blue whales in ways or to a degree that would reduce
their fitness. We anticipate temporary behavioral responses, but do not anticipate any injury or
mortality from acoustic stressors. We do not anticipate those behavioral responses to result in
fitness consequences to any individuals and therefore, we do not expect acoustic stressors to
result in substantial changes in reproduction, numbers, or distribution of these populations. An
action that is not likely to reduce the fitness of individual whales would not be likely to reduce
the viability of the populations those individual whales compose (that is, we would not expect
reductions in the reproduction, numbers, or distribution of those populations). We do not
anticipate any reductions in survival rate or trajectory of recovery of the species as listed
pursuant to the ESA that would be sufficient to be readily perceived or estimated.
7.2 Fin Whale
Fin whales could be present in all portions of the NWTT Action Area and may be exposed to
acoustic sources associated with training and testing activities throughout the year. Fin whales
found in the offshore portions of the Action Area and the Inland Waters of Puget Sound area are
recognized as part of the California, Oregon, Washington stock. The acoustic analysis predicts
that fin whales of the California, Oregon, Washington stock may be exposed to sonar and other
active acoustic sources associated with training activities in the Offshore Area that may result in
11 TTS and 14 behavioral reactions annually. Fin whales may also be exposed to sonar and other
active acoustic sources associated with testing activities throughout the year. The acoustic
analysis predicts that fin whales of the California, Oregon, Washington stock may be exposed to
558
Biological Opinion and Conference Report on Navy NWTT Activities and NMFS’ MMPA Incidental Take
Authorization PCTS FPR-2015-9110
sonar and other active acoustic sources associated with testing activities in the Offshore Area that
may result in 30 TTS, and 4 behavioral reactions. Fin whales found in Southeast Alaska
(Western Behm Canal) are recognized as part of the Northeast Pacific stock. The acoustic
analysis predicts fin whales of the Northeast Pacific stock may be exposed to sonar and other
active acoustic sources associated with testing activities that may result in two behavioral
reactions annually.
Acoustic modeling predicts that ESA-listed mysticetes including fin whales may be exposed to
impulses from explosive sources associated with training and testing activities in the Offshore
Area; however, there are no predicted effects from these activities, because exposures would not
exceed the current effects thresholds.
Frequencies associated with mid-frequency sonar have generally been considered above the
hearing range of fin whales. However, recent observations of blue whale responses to the mid-
frequency sonar sounds support the possibility that this ecologically, physiologically, and
taxonomically similar species may be capable of detecting and responding to them. Additional
data are necessary to determine the potential impact that mid-frequency sonar may or may not
have on fin whales. Considering information presented in this opinion, we consider fin whales to
be able to hear and respond to mid-frequency sonar as blue whales appear to.
Most of the fin whales that are exposed to acoustic stressors would be exposed periodically or
episodically over certain months or seasons from military activities in the NWTT Action Area.
Given the nature of testing and training as described above, these periodic or episodic exposure
and behavioral response scenarios, including responses to TTS, most often allow sufficient time
to return to baseline conditions and resumption of normal behavioral activities such as feeding
and breeding. Individuals exposed to acoustic stressors at levels resulting in TTS will likely fully
recover within 24 hours of the exposure and resume normal behaviors including feeding. As
described previously in this Opinion, the available scientific information does not provide
evidence that exposure to acoustic stressors from Navy training and testing activities will impact
the fitness of any individuals of this species. Therefore exposure to acoustic stressors will not
have population or species level impacts.
The 2010 fin whale recovery plan defines three recovery populations by ocean basin (the North
Atlantic, North Pacific, and Southern Hemisphere) and sets criteria for the downlisting and
delisting of this species. Both downlisting and delisting requirements include abatement of
threats associated with fisheries, climate change, direct harvest, anthropogenic noise, and ship
collision. Of these, anthropogenic noise and ship collision are relevant to NWTT activities. As
discussed previously, anthropogenic noise associated with NWTT activities will not impact the
fitness of any individuals of this species. Downlisting criteria for fin whales includes the
maintenance of at least 250 mature females and 250 mature males in each recovery population,
559
Biological Opinion and Conference Report on Navy NWTT Activities and NMFS’ MMPA Incidental Take
Authorization PCTS FPR-2015-9110
which is already exceeded in the North Pacific. To qualify for downlisting, each recovery
population must also have no more than a 1 percent chance of extinction in 100 years. To qualify
for delisting, each recovery population must also have no more than a 10 percent chance of
becoming endangered in 20 years. To our knowledge a population viability analysis has not been
conducted on fin whale recovery populations.
Based on the evidence available, including the Environmental Baseline and Cumulative Effects,
stressors resulting from training and testing activities the Navy conduct in the NWTT Action
Area on an annual basis, cumulatively over the five year period of the MMPA Rule from
November 2015 through November 2020, or cumulatively for the reasonably foreseeable future
(assuming there are no significant changes to the Status of Listed Resources or Environmental
Baseline), would not be expected to appreciably reduce the likelihood of the survival of fin
whales in the wild by reducing the reproduction, numbers, or distribution of that species. We also
conclude that effects from ongoing Navy training and testing activities continuing into the
reasonably foreseeable future would not be expected, directly or indirectly, to appreciably reduce
the likelihood of recovery of fin whales in the wild by reducing the reproduction, numbers, or
distribution of that species. NWTT stressors will not affect the population dynamics, behavioral
ecology, and social dynamics of individual fin whales in ways or to a degree that would reduce
their fitness. An action that is not likely to reduce the fitness of individual whales would not be
likely to reduce the viability of the populations those individual whales represent (that is, we
would not expect reductions in the reproduction, numbers, or distribution of those populations).
We do not anticipate any reductions in survival rate or trajectory of recovery of the species as
listed pursuant to the ESA that would be sufficient to be readily perceived or estimated.
7.3 Humpback Whale
Humpback whales could be in all portions of the NWTT Action Area and may be exposed to
sonar and other active acoustic sources associated with training activities throughout the year.
Humpback whales found in the offshore portions of the Action Area and the Inland Waters of
Puget Sound area are recognized as part of the California, Oregon, Washington stock. The
humpback whales in the Action Area potentially belong to one of three proposed DPSs: the non
ESA-listed Hawaii DPS, the non-ESA-listed Mexico DPS, or the threatened Central America
DPS. All three of these DPSs may feed seasonally in the Action Area.
The acoustic analysis predicts that humpback whales of the California, Oregon, Washington
stock may be exposed to sonar and other active acoustic sources associated with training
activities in the Offshore Area that may result in five TTS and seven behavioral reactions
annually. The acoustic analysis also predicts that humpback whales of the California, Oregon,
Washington stock may be exposed to sonar and other active acoustic sources associated with
testing activities in the Offshore Area that may result in 39 TTS and 5 behavioral reactions.
560
Biological Opinion and Conference Report on Navy NWTT Activities and NMFS’ MMPA Incidental Take
Authorization PCTS FPR-2015-9110
Humpback whales found in Southeast Alaska (Western Behm Canal) are recognized as part of
the Central North Pacific stock and the acoustic analysis predicts that the Central North Pacific
stock may be exposed to sonar and other active acoustic sources associated with testing activities
that may result in 1 behavioral reaction annually.
Acoustic modeling predicts that ESA-listed mysticetes including humpback whales may be
exposed to impulses from explosive sources associated with training activities in the Offshore
Area; however, there are no predicted effects from these activities, because exposures would not
exceed the current effects thresholds. The NAEMO and post-model analysis also predicts no
exposures of humpback whales from impulse sources associated with testing activities.
Frequencies associated with mid-frequency sonar have generally been considered above the
hearing range of humpback whales. However, recent observations of blue whale responses to the
mid-frequency sonar sounds support the possibility that this ecologically, physiologically, and
taxonomically similar species may be capable of detecting and responding to them. Additional
data are necessary to determine the potential impact that mid-frequency sonar may or may not
have on humpback whales. Considering information presented in this opinion, we consider
humpback whales to be able to hear and respond to mid-frequency sonar similar to blue whales.
Most of the humpback whales that are exposed to acoustic stressors would be exposed
periodically or episodically over certain months or seasons from military activities in the NWTT
Action Area. Given the nature of testing and training as described above, these periodic or
episodic exposure and behavioral response scenarios, including responses to TTS, most often
allow sufficient time to return to baseline conditions and resumption of normal behavioral
activities such as feeding and breeding. As described previously in this Opinion, the available
scientific information does not provide evidence that exposure to acoustic stressors from Navy
training and testing activities will impact the fitness of any individuals of this species. Therefore
exposure to acoustic stressors will not have population or species level impacts.
The general increase in the number of humpback whales range-wide suggests that the stress
regime these whales are exposed to including activities in the NWTT Action Area have not
prevented these whales from increasing their numbers. Humpback whales have been exposed to
Navy training exercises in the NWTT Action Area, including vessel traffic, aircraft traffic, active
sonar, and underwater detonations, for more than a generation. Although the Navy proposes to
increase the frequency of some of these activities, we do not believe those increases are likely to
affect the rate at which humpback whale counts are increasing.
The 1991 humpback whale recovery plan does not outline specific downlisting and delisting
criteria. The recovery plan does list several threats known or suspected of impacting humpback
whale recovery including subsistence hunting, commercial fishing stressors, habitat degradation,
loss of prey species, ship collision, and acoustic disturbance. Of these, ship collision and acoustic
561
Biological Opinion and Conference Report on Navy NWTT Activities and NMFS’ MMPA Incidental Take
Authorization PCTS FPR-2015-9110
disturbance are relevant to NWTT activities. As described previously, anthropogenic noise
associated with NWTT activities will not impact the fitness of any individuals of this species.
Based on the evidence available, including the Environmental Baseline and Cumulative Effects,
stressors resulting from training and testing activities the Navy will conduct in the NWTT Action
Area on an annual basis, cumulatively over the five year period of the MMPA rule from
November 2015 through November 2020, or cumulatively for the reasonably foreseeable future
(assuming there are no significant changes to the Status of Listed Resources or Environmental
Baseline), would not be expected to appreciably reduce the likelihood of the survival of
humpback whales in the wild by reducing the reproduction, numbers, or distribution of that
species as currently listed, or currently proposed for listing, under the ESA. We also conclude
that effects from ongoing Navy training and testing activities continuing into the reasonably
foreseeable future would not be expected, directly or indirectly, to appreciably reduce the
likelihood of recovery of humpback whales in the wild by reducing the reproduction, numbers,
or distribution of that species as currently listed, or currently proposed for listing, under the ESA.
NWTT stressors will not affect the population dynamics, behavioral ecology, and social
dynamics of individual humpback whales in ways or to a degree that would reduce their fitness.
An action that is not likely to reduce the fitness of individual whales would not be likely to
reduce the viability of the populations those individual whales represent (that is, we would not
expect reductions in the reproduction, numbers, or distribution of those populations). We do not
anticipate any reductions in survival rate or trajectory of recovery of the species as listed
pursuant to the ESA, or as currently proposed pursuant to the ESA, that would be sufficient to be
readily perceived or estimated. Due to a lack of fitness consequences to individuals and the
populations they represent, we also do not anticipate any reductions in survival rate or trajectory
of recovery of the threatened Central America DPS as currently proposed.
7.4 Sei Whale
Sei whales may be exposed to sonar and other active acoustic sources associated with training
activities in the Offshore Area; however, there are no predicted effects from these activities,
because exposures would not exceed the current effects thresholds. Sei whales may also be
exposed to sonar and other active acoustic sources associated with testing activities throughout
the year. The acoustic analysis predicts that sei whales of the Eastern North Pacific stock may be
exposed to sonar and other active acoustic sources associated with testing activities in the
Offshore Area that may result in two TTS exposures annually.
Acoustic modeling predicts that ESA-listed mysticetes including sei whales may be exposed to
impulses from explosive sources associated with training activities in the Offshore Area;
however, there are no predicted effects from these activities, because exposures would not
562
Biological Opinion and Conference Report on Navy NWTT Activities and NMFS’ MMPA Incidental Take
Authorization PCTS FPR-2015-9110
exceed the current effects thresholds. The NAEMO and post-model analysis also predicts no
exposures of sei whales from impulse sources associated with testing activities.
Frequencies associated with mid-frequency sonar have generally been considered above the
hearing range of sei whales. However, recent observations of blue whale responses to the mid-
frequency sonar sounds support the possibility that this ecologically, physiologically, and
taxonomically similar species may be capable of detecting and responding to them. Additional
data are necessary to determine the potential impact that mid-frequency sonar may or may not
have on sei whales. Considering information presented in this opinion, we consider sei whales to
be able to hear and respond to mid-frequency sonar similar to blue whales.
Most of the sei whales that are exposed to acoustic stressors would be exposed periodically or
episodically over certain months or seasons from military activities in the NWTT Action Area.
Given the nature of testing and training as described above, these periodic or episodic exposure
and behavioral response scenarios, including responses to TTS, most often allow sufficient time
to return to baseline conditions and resumption of normal behavioral activities such as feeding
and breeding. Individuals experiencing TTS are likely to fully recover within 24 hours of
exposure and return to normal behaviors. As described previously in this Opinion, the available
scientific information does not provide evidence that exposure to acoustic stressors from Navy
training and testing activities will impact the fitness of any individuals of this species. Therefore
exposure to acoustic stressors will not have population or species level impacts.
The 2011 sei whale recovery plan defines three recovery populations by ocean basin (the North
Atlantic, North Pacific, and Southern Hemisphere) and sets criteria for the downlisting and
delisting of this species. Both downlisting and delisting requirements include abatement of
threats associated with fisheries, climate change, direct harvest, anthropogenic noise, and ship
collision. Of these, anthropogenic noise and ship collision are relevant to NWTT activities. As
described previously, anthropogenic noise associated with NWTT activities will not impact the
fitness of any individuals of this species. Downlisting criteria for fin whales includes the
maintenance of 1,500 mature, reproductive individuals with at least 250 mature females and 250
mature males in each recovery population, which is already exceeded in the North Pacific. To
qualify for downlisting, each recovery population must also have no more than a 1 percent
chance of extinction in 100 years. To qualify for delisting, each recovery population must also
have no more than a 10 percent chance of becoming endangered in 20 years. To our knowledge a
population viability analysis has not been conducted on sei whale recovery populations.
Based on the evidence available, including the Environmental Baseline and Cumulative Effects,
stressors resulting from training and testing activities the Navy will conduct in the NWTT Action
Area on an annual basis, cumulatively over the five year period of the MMPA regulations from
November 2015 through November 2020, or cumulatively for the reasonably foreseeable future
563
Biological Opinion and Conference Report on Navy NWTT Activities and NMFS’ MMPA Incidental Take
Authorization PCTS FPR-2015-9110
(assuming there are no significant changes to the Status of Listed Resources or Environmental
Baseline), would not be expected to appreciably reduce the likelihood of the survival of sei
whales in the wild by reducing the reproduction, numbers, or distribution of that species. We also
conclude that effects from ongoing Navy training and testing activities continuing into the
reasonably foreseeable future would not be expected, directly or indirectly, to appreciably reduce
the likelihood of recovery of sei whales in the wild by reducing the reproduction, numbers, or
distribution of that species. NWTT stressors will not affect the population dynamics, behavioral
ecology, and social dynamics of individual sei whales in ways or to a degree that would reduce
their fitness. An action that is not likely to reduce the fitness of individual whales would not be
likely to reduce the viability of the populations those individual whales represent (that is, we
would not expect reductions in the reproduction, numbers, or distribution of those populations).
We do not anticipate any reductions in survival rate or trajectory of recovery of the species as
listed pursuant to the ESA that would be sufficient to be readily perceived or estimated.
7.5 Sperm Whale
Sperm whales are likely to be found only in the offshore portion of the Action Area. Sperm
whales found in the Offshore Area are recognized as part of the California, Oregon, Washington
stock. The acoustic analysis predicts that sperm whales of the California, Oregon, Washington
stock may be exposed to sonar and other active acoustic sources associated with training
activities in the Offshore Area that may result in 81 behavioral reactions annually. The acoustic
analysis predicts that sperm whales of the California, Oregon, Washington stock may be exposed
to sonar and other active acoustic sources associated with testing activities in the Offshore Area
that may result in 67 TTS and 11 behavioral reactions. There are no model predicted exposures
for the North Pacific stock of sperm whales.
Acoustic modeling predicts that including sperm whales may be exposed to impulses from
explosive sources associated with training activities in the Offshore Area; however, there are no
predicted effects from these activities, because exposures would not exceed the current effects
thresholds. The NAEMO and post-model analysis also predicts no exposures of sperm whales
from impulse sources associated with testing activities.
Most of the sperm whales that are exposed to acoustic stressors would be exposed periodically or
episodically over certain months or seasons from military activities in the NWTT Action Area.
Given the nature of testing and training as described above, these periodic or episodic exposure
and behavioral response scenarios, including responses to TTS, most often allow sufficient time
to return to baseline conditions and resumption of normal behavioral activities such as feeding
and breeding. Individuals experiencing TTS will likely fully recover within 24 hours and resume
normal behaviors. As described previously in this Opinion, the available scientific information
does not provide evidence that exposure to acoustic stressors from Navy training and testing
564
Biological Opinion and Conference Report on Navy NWTT Activities and NMFS’ MMPA Incidental Take
Authorization PCTS FPR-2015-9110
activities will impact the fitness of any individuals of this species. Therefore exposure to acoustic
stressors will not have population or species level impacts.
The 2010 sperm whale recovery plan defines three recovery populations by ocean basin (the
Atlantic Ocean/Mediterranean Sea, Pacific Ocean, and Indian Ocean) and sets criteria for the
downlisting and delisting of this species. Both downlisting and delisting requirements include
abatement of threats associated with fisheries, climate change, direct harvest, oil spills,
anthropogenic noise, and ship collision. Of these, anthropogenic noise and ship collision are
relevant to NWTT activities. As discussed previously, anthropogenic noise associated with
NWTT activities will not impact the fitness of any individuals of this species. Downlisting
criteria for sperm whales includes the maintenance of 1,500 mature, reproductive individuals
with at least 250 mature females and 250 mature males in each recovery population, which is
already exceeded in the North Pacific. To qualify for downlisting, each recovery population must
also have no more than a 1 percent chance of extinction in 100 years. To qualify for delisting,
each recovery population must also have no more than a 10 percent chance of becoming
endangered in 20 years. To our knowledge a population viability analysis has not been conducted
on sperm whale recovery populations.
Based on the evidence available, including the environmental baseline and cumulative effects,
we conclude that impulsive and non-impulsive stressors resulting from training and testing
activities the Navy plans to conduct in the NWTT Action Area on an annual basis, cumulatively
over the five year period of the MMPA regulations from November 2015 through November
2020, or cumulatively for the reasonably foreseeable future (assuming there are no significant
changes to the status of the species or Environmental Baseline), would not be expected to
appreciably reduce the likelihood of the survival of sperm whales in the wild by reducing the
reproduction, numbers, or distribution of that species. We also conclude that effects from
ongoing Navy training and testing activities continuing into the reasonably foreseeable future
would not be expected, directly or indirectly, to appreciably reduce the likelihood of recovery of
sperm whales in the wild by reducing the reproduction, numbers, or distribution of that species.
NWTT stressors will not affect the population dynamics, behavioral ecology, and social
dynamics of individual sperm whales in ways or to a degree that would reduce their fitness. An
action that is not likely to reduce the fitness of individual whales would not be likely to reduce
the viability of the populations those individual whales represent (that is, we would not expect
reductions in the reproduction, numbers, or distribution of those populations). We do not
anticipate any reductions in survival rate or trajectory of recovery of the species as listed
pursuant to the ESA that would be sufficient to be readily perceived or estimated.
565
Biological Opinion and Conference Report on Navy NWTT Activities and NMFS’ MMPA Incidental Take
Authorization PCTS FPR-2015-9110
7.6 Southern Resident Killer Whale
Southern Resident killer whales may be exposed to sonar and other active acoustic sources
associated with training activities while they reside in the NWTT Action Area. The majority of
training activities occur in the offshore portion of the NWTT Action Area. The predicted effects
would occur in the Inland Waters area of Puget Sound, where Southern Resident killer whales
could be exposed to sonar and other active acoustic sources that may result in two behavioral
reactions biennially from civilian port defense training. In years without civilian port defense
training no Southern Resident killer whale takes are anticipated. We do not expect any instances
of TTS, PTS, injury, or mortality from training or testing activities. Southern Resident killer
whales may also be exposed to sonar and other active acoustic sources associated with testing
activities while they reside in the NWTT Action Area. The majority of testing events occur in
areas such as Hood Canal, where Southern Resident killer whales are not believed to be present;
the remaining testing activities occur offshore, where they are only present briefly during their
annual migration period. Acoustic modeling predicts that Southern Resident killer whales may
be exposed to sonar and other active acoustic sources associated with testing activities in the
Offshore Area; however, there are no predicted effects from these testing activities, because
exposures would not exceed the current effects thresholds.
Acoustic modeling predicts Southern Resident killer whales may be exposed to impulses from
explosive sources associated with training activities in the Offshore Area; however, there are no
predicted effects from these activities, because exposures would not exceed the current effects
thresholds. The NAEMO and post-model analysis also predicts no exposures of Southern
Resident killer whales from impulse sources associated with testing activities.
The small numbers of Southern Resident killer whales that are exposed to acoustic stressors
would be exposed periodically or episodically over certain months or seasons from military
activities in the NWTT Action Area. Given the nature of testing and training as described above,
these periodic or episodic exposure and behavioral response scenarios most often allow sufficient
time to return to baseline conditions and resumption of normal behavioral activities such as
feeding and breeding. As described previously in this Opinion, the available scientific
information does not provide evidence that exposure to acoustic stressors from Navy training and
testing activities will impact the fitness of any individuals of this species. Therefore exposure to
acoustic stressors will not have population or species level impacts.
The 2008 southern resident killer whale recovery plan sets criteria for the downlisting and
delisting of this species. Both downlisting and delisting requirements include abatement of
threats such as those associated with prey availability, water contamination, ship collision, and
anthropogenic noise. Of these, anthropogenic noise is relevant to NWTT activities. As discussed
previously, anthropogenic noise associated with NWTT activities will not impact the fitness of
566
Biological Opinion and Conference Report on Navy NWTT Activities and NMFS’ MMPA Incidental Take
Authorization PCTS FPR-2015-9110
any individuals of this species. Downlisting criteria for southern resident killer whales include an
average growth of 2.3 percent per year for 14 years and progress toward addressing threats
represent sustained growth to indicate that the population could be downlisted to threatened. To
qualify for delisting, the population of southern resident killer whales must include a sustained
average growth of 2.3 percent per year for 28 years and population parameters consistent with a
healthy growing population.
Based on the evidence available, including the environmental baseline and cumulative effects,
we conclude that impulsive and non-impulsive stressors resulting from training and testing
activities the Navy plans to conduct in the NWTT Action Area on an annual basis, cumulatively
over the five year period of the MMPA regulations from November 2015 through November
2020, or cumulatively for the reasonably foreseeable future (assuming there are no significant
changes to the status of the species or Environmental Baseline), would not be expected to
appreciably reduce the likelihood of the survival of Southern Resident killer whales in the wild
by reducing the reproduction, numbers, or distribution of that species. We also conclude that
effects from ongoing Navy training and testing activities continuing into the reasonably
foreseeable future would not be expected, directly or indirectly, to appreciably reduce the
likelihood of recovery of Southern Resident killer whales in the wild by reducing the
reproduction, numbers, or distribution of that species. NWTT stressors will not affect the
population dynamics, behavioral ecology, and social dynamics of individual Southern Resident
killer whales in ways or to a degree that would reduce their fitness. An action that is not likely to
reduce the fitness of individual whales would not be likely to reduce the viability of the
populations those individual whales represent (that is, we would not expect reductions in the
reproduction, numbers, or distribution of those populations). We do not anticipate any reductions
in survival rate or trajectory of recovery of the species as listed pursuant to the ESA that would
be sufficient to be readily perceived or estimated.
7.7 Guadalupe Fur Seal
Guadalupe fur seals are present within the coastal margins of the offshore portion of the Action
Area during the warm season (summer and early autumn). Guadalupe fur seals are considered
“seasonal” migrants since they return to rookeries in Mexican waters in the cold season. The
acoustic analysis predicts that Guadalupe fur seals may be exposed to sonar and other active
acoustic sources associated with training activities in the Offshore Area that may result in seven
behavioral reactions annually. Additionally, Guadalupe fur seals may be exposed to sonar and
other active acoustic sources associated with testing activities. The acoustic analysis predicts that
Guadalupe fur seals may be exposed to sonar and other active acoustic sources associated with
testing activities in the Offshore Area that may result in three behavioral reactions annually.
567

Biological Opinion and Conference Report on Navy NWTT Activities and NMFS’ MMPA Incidental Take
Authorization PCTS FPR-2015-9110
Acoustic modeling predicts that Guadalupe fur seals may be exposed to impulses from explosive
sources associated with training and testing activities in the Offshore Area; however, there are no
predicted effects from these activities, because exposures would not exceed the current effects
thresholds.
We do not anticipate any instances of PTS, injury or mortality from any stressors associated with
training or testing activities. Pinnipeds in the water are tolerant of anthropogenic noise and
activity. The available scientific information does not provide evidence that behavioral responses
of pinnipeds to acoustic stressors from Navy training and testing activities will impact the fitness
of any individuals of this species. Therefore, exposure to acoustic stressors will not have
population or species level impacts.
The Guadalupe fur seal does not have a recovery plan; therefore, specific downlisting and
delisting criteria are not established. We concluded no mortality of individuals would occur and
that effects from acoustic stressors would be temporary and not impact the fitness of individuals
or the population. In the absence of fitness consequences on individuals or the population to
which those individuals belong, we do not expect an appreciable reduction in the ability of this
entity to recover.
Therefore, based on the evidence available, including the environmental baseline and cumulative
effects, we conclude that impulsive and non-impulsive stressors resulting from training and
testing activities the Navy plans to conduct in the NWTT Action Area on an annual basis,
cumulatively over the five year period of the MMPA regulations from November 2015 through
November 2020, or cumulatively for the reasonably foreseeable future (assuming there are no
significant changes to the status of the species or Environmental Baseline), would not be
expected to appreciably reduce the likelihood of the survival of Guadalupe fur seals in the wild
by reducing the reproduction, numbers, or distribution of that species. We also conclude that
effects from ongoing Navy training and testing activities continuing into the reasonably
foreseeable future would not be expected, directly or indirectly, to appreciably reduce the
likelihood of recovery of Guadalupe fur seals in the wild by reducing the reproduction, numbers,
or distribution of that species. NWTT stressors will not affect the population dynamics,
behavioral ecology, and social dynamics of individual seals in ways or to a degree that would
reduce their fitness. An action that is not likely to reduce the fitness of individual whales would
not be likely to reduce the viability of the populations those individual whales represent (that is,
we would not expect reductions in the reproduction, numbers, or distribution of those
populations). We do not anticipate any reductions in survival rate or trajectory of recovery of the
species as listed pursuant to the ESA that would be sufficient to be readily perceived or
estimated.
568
Biological Opinion and Conference Report on Navy NWTT Activities and NMFS’ MMPA Incidental Take
Authorization PCTS FPR-2015-9110
7.8 Leatherback Sea Turtles
The Navy’s acoustic analysis predicts that leatherback sea turtles may be exposed to sonar and
other active acoustic sources associated with training activities in the Offshore Area that may
result in one TTS (from non-impulsive sources) and 14 behavioral (from impulsive sources)
exposures annually. The acoustic analysis also predicts that leatherback sea turtles may be
exposed to sonar and other active acoustic sources associated with testing activities in the
Offshore Area that may result in five TTS (from non-impulsive sources) and 14 behavioral (from
impulsive sources) exposures annually.
Up to 142 training activities using explosives at or beneath the water surface would be conducted
annually and potentially expose leatherback sea turtles to underwater impulse sound. The largest
source class used during training would be E12 (> 650 to 1,000 lb. NEW), which would be used
10 times annually 50 nm or further from shore in the NWTT Action Area. Leatherback sea
turtles may be exposed to impulse sound from explosive sources associated with training
activities in the Offshore Area; however, there are no predicted mortality, onset slight lung
injury, gastrointestinal tract injury, PTS, or TTS effects from these activities, because exposures
would not exceed the current effects thresholds.
Testing activities using explosives at or beneath the water surface would potentially expose
leatherback sea turtles to underwater impulse sound. Explosives would be used only in the
Offshore Area of the Action Area and for a total of 148 events per year. Explosive ordnance used
during testing activities include explosive torpedoes (6), sound underwater signal sonobuoys
(72), and Improved Extended Echo Ranging (IEER) sonobuoys (70). Results from modeling
indicate no leatherback sea turtles are predicted to be exposed to impulse levels associated with
the onset of mortality, onset slight lung injury, gastrointestinal tract injury, PTS, or TTS over any
testing year for explosives use in open ocean.
Some sea turtles beyond the ranges of the above impacts may behaviorally react if they hear a
detonation. Activities consisting of single detonations, such as bombing and missile exercise, are
expected to only elicit short-term startle reactions. If a sea turtle hears multiple detonations in a
short period, such as during gunnery, firing, or sonobuoy exercises, it may react by avoiding the
area. Any significant behavioral reactions could lead to a sea turtle expending energy and
missing opportunities to secure resources. However, because most activities would consist of a
limited number of detonations and exposures would not occur over long durations, there would
be an opportunity to recover from an incurred energetic cost.
Little is known about how sea turtles use sound in their environment. Based on knowledge of
their sensory biology (Bartol and Ketten 2006; Moein Bartol and Musick 2003), sea turtles may
be able to detect objects within the water column (e.g., vessels, prey, predators) via some
combination of auditory and visual cues. However, research examining the ability of sea turtles
569
Biological Opinion and Conference Report on Navy NWTT Activities and NMFS’ MMPA Incidental Take
Authorization PCTS FPR-2015-9110
to avoid collisions with vessels shows they may rely more on their vision than auditory cues
(Hazel et al. 2007). Similarly, while sea turtles may rely on acoustic cues to identify nesting
beaches, they appear to rely on other non-acoustic cues for navigation, such as magnetic fields
(Lohmann and Lohmann 1996a; Lohmann and Lohmann 1996b) and light (Avens and Lohmann
2003). Additionally, they are not known to produce sounds underwater for communication.
Further, although the information on the hearing capabilities of sea turtles is limited, the
information available suggests that the auditory capabilities of sea turtles are centered in the low-
frequency range (<2 kHz) (Bartol et al. 1999b; Dow Piniak et al. 2012; Lenhardt et al. 1983;
Lenhardt et al. 1994a; Martin et al. 2012; O'Hara and Wilcox 1990; Ridgway et al. 1969), with
greatest sensitivity below 1 kHz.
As described previously in this Opinion, potential behavioral responses of sea turtles to
anthropogenic sound could include startle reactions, disruption of feeding, disruption of
migration, changes in respiration, alteration of swim speed, alteration of swim direction, and area
avoidance. Any disruptions are expected to be temporary in nature, with the animal resuming
normal behaviors shortly after the exposure. To result in significant fitness consequences we
would have to assume that an individual turtle detects and responds to the acoustic source, and
that it could not compensate for lost feeding opportunities by either immediately feeding at
another location, by feeding shortly after cessation of acoustic exposure, or by feeding at a later
time. There is no indication this is the case, particularly since foraging habitat would still be
available in the environment following the cessation of acoustic exposure. Similarly, we expect
temporary disruptions of migration and swim speed or direction to be inconsequential because
they can resume these behaviors almost immediately following the cessation of the sound
exposure. Further, these sorts of behavioral disruptions may be similar to natural disruptions
such those resulting from predator avoidance, or fluctuations in oceanographic conditions.
Therefore, behavioral responses of sea turtles to acoustic stressors are unlikely to lead to fitness
consequences and long-term implications for the population.
We assume that acoustic stressors from Navy training and testing activities conducted during the
five-year MMPA rule and into the reasonably foreseeable future are likely to cause TTS in ESA-
listed sea turtles in the NWTT Action Area at the levels described above. However, as described
previously in this Opinion, there is no evidence that TTS results in energetic effects to individual
sea turtles or would be likely to significantly reduce the viability of the population these
individuals represent. Given that sea turtles do not rely on acoustic cues for most important life
functions, it is anticipated that TTS will not result in fitness consequences to individuals or the
populations to which they belong.
Most of the sea turtles that are exposed to acoustic stressors would be exposed periodically or
episodically over certain months or seasons when the Navy is training and testing in the Action
570
Biological Opinion and Conference Report on Navy NWTT Activities and NMFS’ MMPA Incidental Take
Authorization PCTS FPR-2015-9110
Area. These periodic or episodic exposure and response scenarios most often allow sufficient
time for the affected individuals to return to baseline conditions and resumption of normal
behavioral activities. As described previously in this Opinion, available scientific information
does not provide evidence that exposure of sea turtles to acoustic stressors leading to sub-lethal
effects from Navy training and testing activities will reduce the fitness of any individuals of this
species.
The 1998 recovery plan for the U.S. Pacific populations of leatherback sea turtles does not
identify any major threats occurring in the Action Area, but sets criteria for the delisting the
species. Delisting requires identifying regional stocks to source beaches, stability in the number
of nesting females over 25 years, maintenance of at least 5,000 females in each stock over 6
years, maintenance of healthy foraging habitat, increases of foraging populations, completion of
all priority one tasks, and the finalization of management plans. Leatherbacks affected by the
proposed testing and training activities are not expected to experience fitness consequences
because this species does not rely heavily on auditory cues from their environment for breeding,
feeding, or sheltering. Because of a lack of fitness consequences and that acoustic stressors are
not identified as a threat to leatherback recovery, we do not expect sub-lethal leatherback sea
turtle take to impede recovery of this species.
Based on the evidence available, including the Environmental Baseline and Cumulative Effects,
stressors resulting from training and testing activities the Navy will conduct in the NWTT Action
Area on an annual basis, or cumulatively for the reasonably foreseeable future (assuming there
are no significant changes to the Status of Listed Resources or Environmental Baseline), would
not be expected to appreciably reduce the likelihood of the survival of leatherback sea turtles in
the wild by reducing the reproduction, numbers, or distribution of that species. We also conclude
that effects from ongoing Navy training and testing activities continuing into the reasonably
foreseeable future would not be expected, directly or indirectly, to appreciably reduce the
likelihood of recovery of leatherback sea turtles in the wild by reducing the reproduction,
numbers, or distribution of that species. Therefore, we do not anticipate any measurable or
detectable reductions in survival rate or trajectory of recovery of sub-populations in the North
Pacific or to these species as listed pursuant to the ESA.
7.9 Threatened and Endangered Fishes
As described in Section 6, the only impacts to ESA-listed fish species that are expected would be
injury and/or death of some individuals due to explosive activities. As described in Section
6.11.1.5, the highest percentage of any ESU or DPS that is expected to be injured or killed from
these activities in the offshore portion of the Action Area is 0.061 percent. The highest
percentage of any ESU or DPS that is expected to be injured or killed from these activities in the
inland portion of the Action Area is 0.109 percent. Most ESA-listed fish species ESUs and DPSs
571
Biological Opinion and Conference Report on Navy NWTT Activities and NMFS’ MMPA Incidental Take
Authorization PCTS FPR-2015-9110
would be affected at much lower levels. This level of mortality and injury represents a very small
reduction in abundance that is not likely to appreciably reduce the likelihood of survival and
recovery of any ESA-listed Pacific salmon, steelhead, rockfish, or southern eulachon. It is also
worth noting that, as described in Section 6.11, the methodology used to quantify injury and
mortality was conservative. Additionally, we conclude that the diversity of ESA-listed fish
populations will not be affected by this limited amount of take because it is expected to be
distributed across populations through species’ ranges in the ocean. As a result, the activities the
Navy plans to conduct annually in the NWTT Action Area would not appreciably reduce the
likelihood of ESA-listed Pacific salmon, steelhead, rockfish, or southern eulachon surviving and
recovering in the wild.
Some individual ESA-listed fish may experience TTS as a result of Navy impulsive acoustic
stressors. However, the fish species considered in this Opinion lack notable hearing
specialization, minimizing the likelihood of each instance of TTS affecting an individual’s
fitness. These species are able to rely on alternative mechanisms (e.g., sight, lateral line system)
to detect prey, avoid predators, spawn, and to orient in the water column (Popper et al. 2014).
Additionally, hearing is not thought to play a role in salmon, steelhead, or eulachon migration
(e.g., (Putnam et al. 2013)). Temporary threshold shift is also short term in duration with fish
being able to replace hair cells when they are damaged (Lombarte et al. 1993; Smith et al.
2006a). Because these species are able to rely on alternative mechanisms for these essential life
functions, instances of TTS would not increase the likelihood of injury by annoying a fish to
such an extent as to significantly disrupt normal behavioral patterns, including breeding, feeding,
or sheltering and would not rise to the level of take.
Additionally, behavioral effects resulting from reactions to sound created by the explosions will
be temporary (e.g., a startle response), and we do not expect these reactions to have any
measurable effects on any individual’s fitness. We expect individuals that exhibit a temporary
behavioral response will return to pre-detonation behavior immediately following each
explosion. Similar to instances of TTS, we do not expect these short term behavioral reactions to
increase the likelihood of injury by annoying a fish to such an extent as to significantly disrupt
normal behavioral patterns, including breeding, feeding, or sheltering and would not rise to the
level of take.
Based on the evidence available, including the Environmental Baseline and Cumulative Effects,
stressors resulting from training and testing activities the Navy will conduct in the NWTT Action
Area on an annual basis, or cumulatively for the reasonably foreseeable future (assuming there
are no significant changes to the Status of Listed Resources or Environmental Baseline), would
not be expected to appreciably reduce the likelihood of the survival of Pacific salmon, steelhead,
eulachon, or rockfish in the wild by reducing the reproduction, numbers, or distribution of those
species, ESUs, or DPSs. We also conclude that effects from ongoing Navy training and testing
572
Biological Opinion and Conference Report on Navy NWTT Activities and NMFS’ MMPA Incidental Take
Authorization PCTS FPR-2015-9110
activities continuing into the reasonably foreseeable future would not be expected, directly or
indirectly, to appreciably reduce the likelihood of recovery of Pacific salmon, steelhead,
eulachon, or rockfish in the wild by reducing the reproduction, numbers, or distribution of those
species, ESUs, or DPSs. Therefore, we do not anticipate any measurable or detectable reductions
in survival rate or trajectory of recovery of these species as listed pursuant to the ESA.
8 CONCLUSION
During the consultation, we reviewed the current status of blue whales, fin whales, humpback
whales, sei whales, Southern resident killer whales, sperm whales, Guadalupe fur seals,
leatherback sea turtles, Puget Sound/Georgia Basin bocaccio, Puget Sound/Georgia Basin
yelloweye and canary rockfish, southern DPS of Pacific eulachon, Chinook salmon (Sacramento
River winter-run, Central valley spring-run, California coastal, Snake River fall, Snake River
spring/summer, Lower Columbia River, Upper Willamette River, Upper Columbia River, and
Puget Sound ESUs), chum salmon (Hood Canal summer-run and Columbia River ESUs), coho
salmon (Central California coast, Southern Oregon Northern California coast, Lower Columbia
River, and Oregon Coast ESUs), Snake River sockeye salmon ESU, and steelhead (South Central
California Coast, Central California Coast, California Central Valley, Northern California, Upper
Columbia River, Snake River Basin, Lower Columbia River, Upper Willamette River, Middle
Columbia River, and Puget Sound DPSs). We also assessed the status of the proposed threatened
Central America DPS of humpback whale as part of our conference report. Additionally, we
assessed the Environmental Baseline for the NWTT Action Area including ongoing Navy
training and testing in the NWTT Action Area along with the potential effects of Navy proposed
NWTT from November 2015 through November 2020 (and into the foreseeable future) along
with the National Marine Fisheries Service’s Permit Division’s proposed rule on the take of
marine mammals incidental to training and testing activities and proposed letter of authorization
for the five-year period.
We conclude that Navy training and testing activities in the NWTT Action Area and NMFS’
issuance of the MMPA regulations and LOA are likely to adversely affect but will not
appreciably reduce the ability of these threatened and endangered species under NMFS’
jurisdiction to survive and recover in the wild. Therefore, we conclude that these activities are
not likely to jeopardize the continued existence of any endangered or threatened species. The
actions also will not result in the destruction or adverse modification of critical habitat during the
five-year period of the MMPA rule or continuing into the reasonably foreseeable future. These
conclusions will remain valid assuming that the type, amount and extent of training and testing
do not exceed levels assessed in this Opinion and/or the status of the species affected by these
actions does not change significantly from that assessed in this Opinion.
573
Biological Opinion and Conference Report on Navy NWTT Activities and NMFS’ MMPA Incidental Take
Authorization PCTS FPR-2015-9110
9 INCIDENTAL TAKE STATEMENT
Section 9 of the ESA prohibits the take of endangered species without special exemption. ESA §
9 statutory prohibitions are limited to “endangered” species unless extended to “threatened”
species. In the case of threatened species, section 4(d) of the ESA leaves it to the Secretary’s
discretion whether and to what extent to extend the statutory 9(a) ‘‘take’’ prohibitions, and
directs the agency to issue regulations it considers necessary and advisable for the conservation
of the species.
Take is defined as to harass, harm, pursue, hunt, shoot, wound, kill, trap, capture or collect, or to
attempt to engage in any such conduct. Harm is further defined by NMFS to include significant
habitat modification or degradation that results in death or injury to listed species by significantly
impairing essential behavioral patterns, including breeding, feeding, or sheltering. Under the
Marine Mammal Protection Act, Level B harassment for military readiness activities, such as the
activities analyzed in this Opinion, is defined as “any act that disturbs or is likely to disturb a
marine mammal or marine mammal stock in the wild by causing disruption of natural behavioral
patterns, including, but not limited to, migration, surfacing, nursing, breeding, feeding, or
sheltering, to a point where such behavioral patterns are abandoned or significantly altered.” 16
U.S.C. § 1362(18)(B)(ii).
For this consultation, we interpreted “harass” for marine mammals using the MMPA definition.23
For sea turtles and fish species, we applied “harass” to mean an intentional or negligent action
that has the potential to injure an animal or disrupt its normal behavior to a point where such
behaviors are abandoned or significantly altered.
Incidental take is defined as take that is incidental to, and not the purpose of, the carrying out of
an otherwise lawful activity. Section 7(b)(4) and section 7(o)(2) provide that taking that is
incidental to an otherwise lawful agency action is not considered to be prohibited taking under
the ESA if that action is performed in compliance with the terms and conditions of this incidental
take statement.
23 As discussed in the Opinion, the Navy uses a behavioral response function to quantify the number of behavioral
responses that would qualify as Level B behavioral harassment under the MMPA. As the statutory definition is
currently applied, a wide range of behavioral reactions may qualify as Level B harassment under the MMPA,
including but not limited to avoidance of the sound source, temporary changes in vocalizations or dive patterns,
temporary avoidance of an area, or temporary disruption of feeding, migrating, or reproductive behaviors. The
estimates calculated using the behavioral response function do not differentiate between the different types of
potential reactions. Nor do the estimates provide information regarding the potential fitness or other biological
consequences of the reactions on the affected individuals. In the Opinion, we therefore considered the available
scientific evidence to determine the likely nature of the modeled marine mammals behavioral responses and the
potential fitness consequences for affected individuals.
574
Biological Opinion and Conference Report on Navy NWTT Activities and NMFS’ MMPA Incidental Take
Authorization PCTS FPR-2015-9110
9.1 Amount or Extent of Take
The section 7 regulations require NMFS to specify the impact of any incidental take of
endangered or threatened species; that is, the amount or extent, of such incidental taking on the
species (50 CFR §402.14(i)(1)(i)). The amount of take represents the number of individuals that
are expected to be taken by proposed actions while the extent of take or “the extent of land or
marine area that may be affected by an action” if we cannot assign numerical limits for animals
that could be incidentally taken during the course of an action (51 FR 19953). The amount of
take resulting from the Navy’s activities was estimated based on the best information available.
Section 7(b)(4)(C) of the ESA provides that if an endangered or threatened marine mammal is
involved, the taking must first be authorized by Section 101(a)(5) of the MMPA. Accordingly,
the terms of this incidental take statement and the exemption from Section 9 of the ESA become
effective only upon the issuance of MMPA authorization (i.e., five year regulations and LOA) to
take the marine mammals identified here. Absent such authorization, this statement is inoperative
for marine mammals.
The effects analysis contained in this Opinion concluded that individual blue whales, fin whales,
humpback whales, sei whales, sperm whales, Southern Resident killer whales, leatherback sea
turtles, and listed fish species have small probabilities of being exposed to the active sonar,
sound fields associated with underwater detonations, or noise and other environmental cues
associated with the movement of surface vessels. In some instances, we concluded that this
exposure was likely to result in evasive behavior or changes in behavioral state, which we would
consider “harassment” for the purposes of this Incidental Take Statement.
The instances of harassment identified in Table 127 (Training Activities) and Table 128 (Testing
Activities) would generally represent changes from foraging, resting, milling, and other
behavioral states that require lower energy expenditures to traveling, avoidance, and behavioral
states that require higher energy expenditures and, therefore, would represent minor disruptions
of the normal behavioral patterns of the marine mammals and sea turtles that have been exposed
from which individuals would recover from quickly. As discussed throughout this Opinion, these
disruptions are expected to be temporary and the animals are expected to fully recover. However,
because the possibility remains that some takes in the form of harassment could occur as a result
of exposures, we specify a level of take by harassment that is exempted from the take
prohibitions. No whales or sea turtles are likely to die or be wounded or injured as a result of
their exposure to the Navy NWTT activities. Therefore, for the purposes of this Biological
Opinion and Incidental Take Statement, we assume that the Navy NWTT training and testing
activities are likely to result in incidental “take” shown in Table 127 and Table 128, respectively.
575
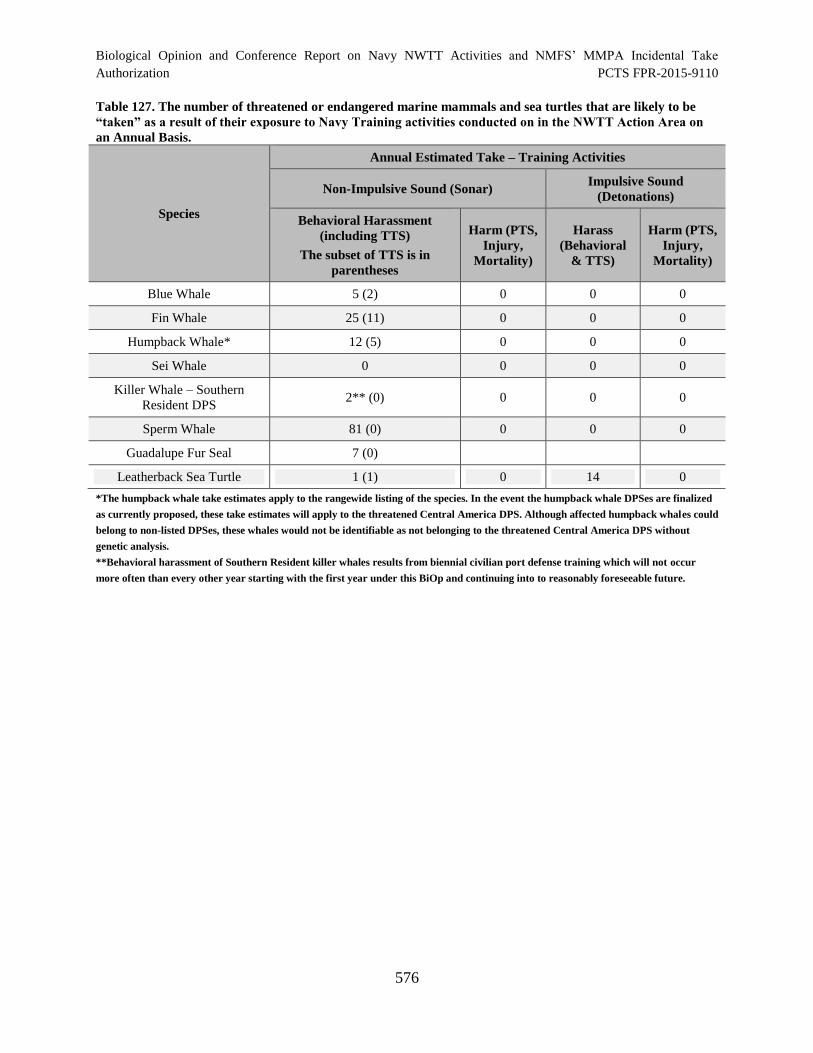
Biological Opinion and Conference Report on Navy NWTT Activities and NMFS’ MMPA Incidental Take Authorization PCTS FPR-2015-9110
Table 127. The number of threatened or endangered marine mammals and sea turtles that are likely to be
“taken” as a result of their exposure to Navy Training activities conducted on in the NWTT Action Area on
an Annual Basis.
Species
Annual Estimated Take – Training Activities
Non-Impulsive Sound (Sonar) Impulsive Sound
(Detonations)
Behavioral Harassment
(including TTS)
The subset of TTS is in
parentheses
Harm (PTS,
Injury,
Mortality)
Harass
(Behavioral
& TTS)
Harm (PTS,
Injury,
Mortality)
Blue Whale 5 (2) 0 0 0
Fin Whale 25 (11) 0 0 0
Humpback Whale* 12 (5) 0 0 0
Sei Whale 0 0 0 0
Killer Whale – Southern
Resident DPS 2** (0) 0 0 0
Sperm Whale 81 (0) 0 0 0
Guadalupe Fur Seal 7 (0)
Leatherback Sea Turtle 1 (1) 0 14 0
*The humpback whale take estimates apply to the rangewide listing of the species. In the event the humpback whale DPSes are finalized
as currently proposed, these take estimates will apply to the threatened Central America DPS. Although affected humpback whales could
belong to non-listed DPSes, these whales would not be identifiable as not belonging to the threatened Central America DPS without
genetic analysis.
**Behavioral harassment of Southern Resident killer whales results from biennial civilian port defense training which will not occur
more often than every other year starting with the first year under this BiOp and continuing into to reasonably foreseeable future.
576
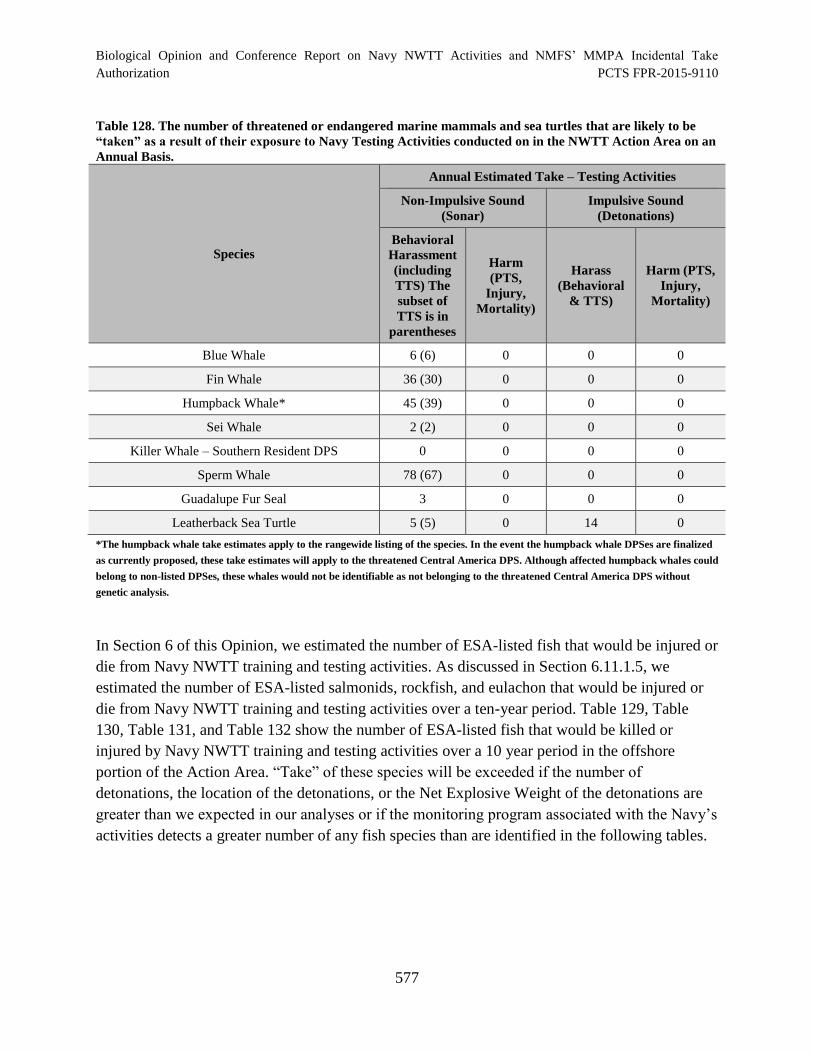
Biological Opinion and Conference Report on Navy NWTT Activities and NMFS’ MMPA Incidental Take
Authorization PCTS FPR-2015-9110
Table 128. The number of threatened or endangered marine mammals and sea turtles that are likely to be
“taken” as a result of their exposure to Navy Testing Activities conducted on in the NWTT Action Area on an
Annual Basis.
Species
Annual Estimated Take – Testing Activities
Non-Impulsive Sound
(Sonar)
Impulsive Sound
(Detonations)
Behavioral
Harassment
(including
TTS) The
subset of
TTS is in
parentheses
Harm
(PTS,
Injury,
Mortality)
Harass
(Behavioral
& TTS)
Harm (PTS,
Injury,
Mortality)
Blue Whale 6 (6) 0 0 0
Fin Whale 36 (30) 0 0 0
Humpback Whale* 45 (39) 0 0 0
Sei Whale 2 (2) 0 0 0
Killer Whale – Southern Resident DPS 0 0 0 0
Sperm Whale 78 (67) 0 0 0
Guadalupe Fur Seal 3 0 0 0
Leatherback Sea Turtle 5 (5) 0 14 0
*The humpback whale take estimates apply to the rangewide listing of the species. In the event the humpback whale DPSes are finalized
as currently proposed, these take estimates will apply to the threatened Central America DPS. Although affected humpback whales could
belong to non-listed DPSes, these whales would not be identifiable as not belonging to the threatened Central America DPS without
genetic analysis.
In Section 6 of this Opinion, we estimated the number of ESA-listed fish that would be injured or
die from Navy NWTT training and testing activities. As discussed in Section 6.11.1.5, we
estimated the number of ESA-listed salmonids, rockfish, and eulachon that would be injured or
die from Navy NWTT training and testing activities over a ten-year period. Table 129, Table
130, Table 131, and Table 132 show the number of ESA-listed fish that would be killed or
injured by Navy NWTT training and testing activities over a 10 year period in the offshore
portion of the Action Area. “Take” of these species will be exceeded if the number of
detonations, the location of the detonations, or the Net Explosive Weight of the detonations are
greater than we expected in our analyses or if the monitoring program associated with the Navy’s
activities detects a greater number of any fish species than are identified in the following tables.
577
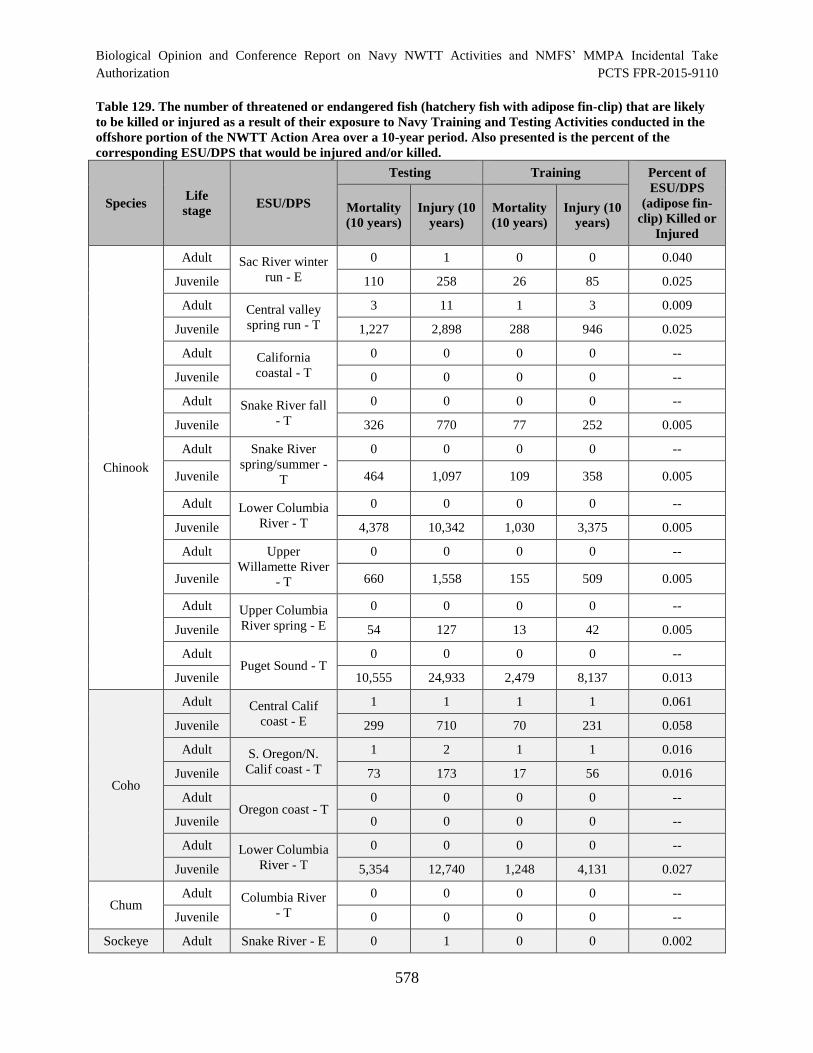
Biological Opinion and Conference Report on Navy NWTT Activities and NMFS’ MMPA Incidental Take
Authorization PCTS FPR-2015-9110
Table 129. The number of threatened or endangered fish (hatchery fish with adipose fin-clip) that are likely
to be killed or injured as a result of their exposure to Navy Training and Testing Activities conducted in the
offshore portion of the NWTT Action Area over a 10-year period. Also presented is the percent of the
corresponding ESU/DPS that would be injured and/or killed.
Species Life
stage ESU/DPS
Testing Training Percent of
ESU/DPS
(adipose fin-
clip) Killed or
Injured
Mortality
(10 years)
Injury (10
years)
Mortality
(10 years)
Injury (10
years)
Chinook
Adult Sac River winter
run - E
0 1 0 0 0.040
Juvenile 110 258 26 85 0.025
Adult Central valley
spring run - T
3 11 1 3 0.009
Juvenile 1,227 2,898 288 946 0.025
Adult California
coastal - T
0 0 0 0 -
Juvenile 0 0 0 0 -
Adult Snake River fall
- T
0 0 0 0 -
Juvenile 326 770 77 252 0.005
Adult Snake River
spring/summer
T
0 0 0 0 -
Juvenile 464 1,097 109 358 0.005
Adult Lower Columbia
River - T
0 0 0 0 -
Juvenile 4,378 10,342 1,030 3,375 0.005
Adult Upper
Willamette River
- T
0 0 0 0 -
Juvenile 660 1,558 155 509 0.005
Adult Upper Columbia
River spring - E
0 0 0 0 -
Juvenile 54 127 13 42 0.005
Adult Puget Sound - T
0 0 0 0 -
Juvenile 10,555 24,933 2,479 8,137 0.013
Coho
Adult Central Calif
coast - E
1 1 1 1 0.061
Juvenile 299 710 70 231 0.058
Adult S. Oregon/N.
Calif coast - T
1 2 1 1 0.016
Juvenile 73 173 17 56 0.016
Adult Oregon coast - T
0 0 0 0 -
Juvenile 0 0 0 0 -
Adult Lower Columbia
River - T
0 0 0 0 -
Juvenile 5,354 12,740 1,248 4,131 0.027
Chum Adult Columbia River
- T
0 0 0 0 -
Juvenile 0 0 0 0 --
Sockeye Adult Snake River - E 0 1 0 0 0.002
578
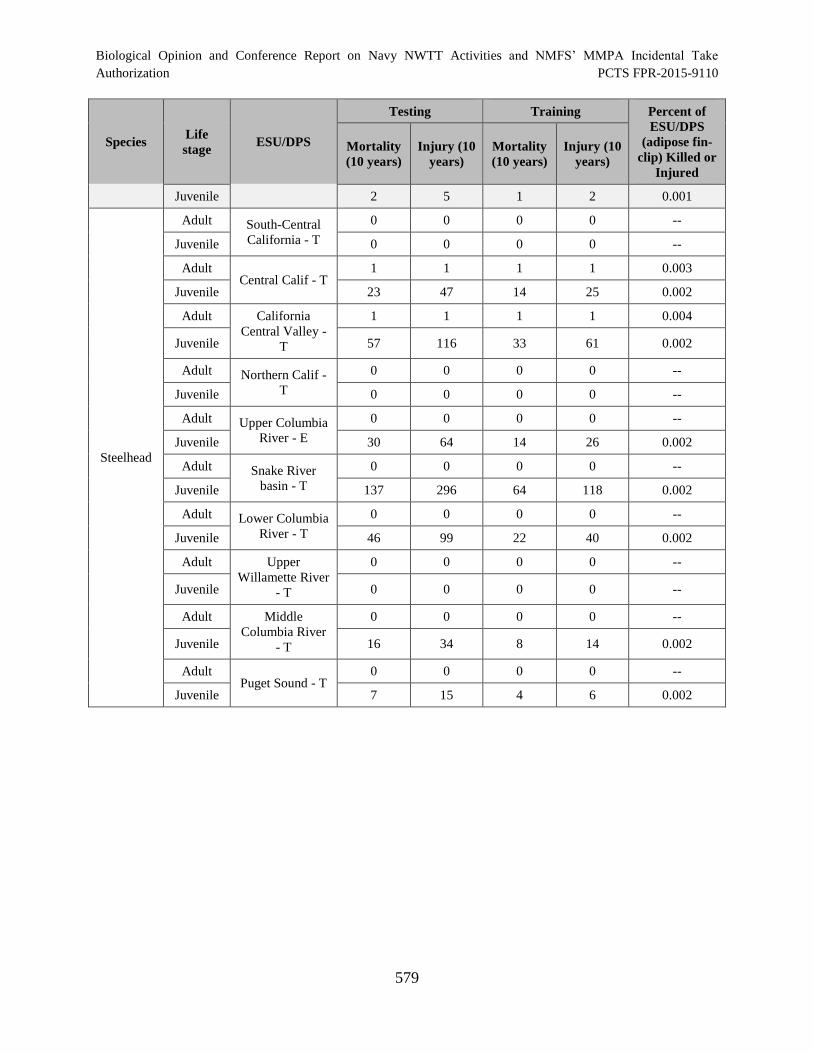
Biological Opinion and Conference Report on Navy NWTT Activities and NMFS’ MMPA Incidental Take Authorization PCTS FPR-2015-9110
Species Life
stage ESU/DPS
Testing Training Percent of
ESU/DPS
(adipose fin-
clip) Killed or
Injured
Mortality
(10 years)
Injury (10
years)
Mortality
(10 years)
Injury (10
years)
Juvenile 2 5 1 2 0.001
Steelhead
Adult South-Central
California - T
0 0 0 0 -
Juvenile 0 0 0 0 -
Adult Central Calif - T
1 1 1 1 0.003
Juvenile 23 47 14 25 0.002
Adult California
Central Valley
T
1 1 1 1 0.004
Juvenile 57 116 33 61 0.002
Adult Northern Calif
T
0 0 0 0 -
Juvenile 0 0 0 0 -
Adult Upper Columbia
River - E
0 0 0 0 -
Juvenile 30 64 14 26 0.002
Adult Snake River
basin - T
0 0 0 0 -
Juvenile 137 296 64 118 0.002
Adult Lower Columbia
River - T
0 0 0 0 -
Juvenile 46 99 22 40 0.002
Adult Upper
Willamette River
- T
0 0 0 0 -
Juvenile 0 0 0 0 -
Adult Middle
Columbia River
- T
0 0 0 0 -
Juvenile 16 34 8 14 0.002
Adult Puget Sound - T
0 0 0 0 -
Juvenile 7 15 4 6 0.002
579
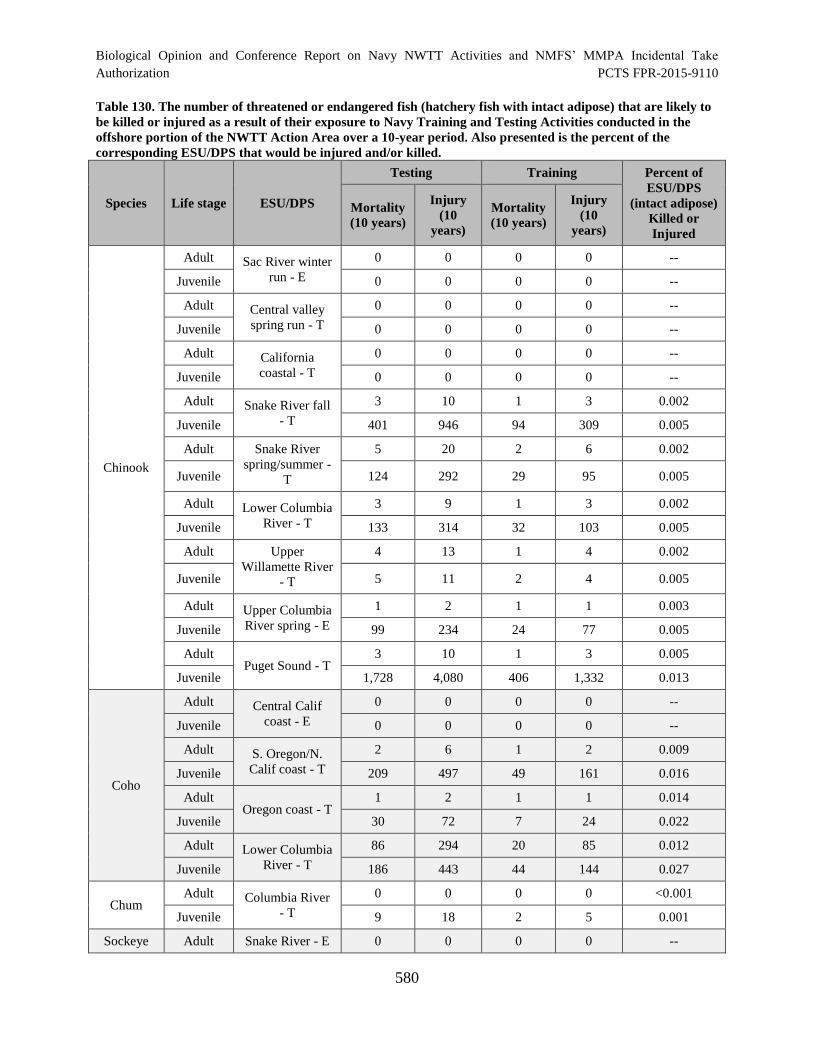
Biological Opinion and Conference Report on Navy NWTT Activities and NMFS’ MMPA Incidental Take
Authorization PCTS FPR-2015-9110
Table 130. The number of threatened or endangered fish (hatchery fish with intact adipose) that are likely to
be killed or injured as a result of their exposure to Navy Training and Testing Activities conducted in the
offshore portion of the NWTT Action Area over a 10-year period. Also presented is the percent of the
corresponding ESU/DPS that would be injured and/or killed.
Species Life stage ESU/DPS
Testing Training Percent of
ESU/DPS
(intact adipose)
Killed or
Injured
Mortality
(10 years)
Injury
(10
years)
Mortality
(10 years)
Injury
(10
years)
Chinook
Adult Sac River winter
run - E
0 0 0 0 -
Juvenile 0 0 0 0 -
Adult Central valley
spring run - T
0 0 0 0 -
Juvenile 0 0 0 0 -
Adult California
coastal - T
0 0 0 0 -
Juvenile 0 0 0 0 -
Adult Snake River fall
- T
3 10 1 3 0.002
Juvenile 401 946 94 309 0.005
Adult Snake River
spring/summer
T
5 20 2 6 0.002
Juvenile 124 292 29 95 0.005
Adult Lower Columbia
River - T
3 9 1 3 0.002
Juvenile 133 314 32 103 0.005
Adult Upper
Willamette River
- T
4 13 1 4 0.002
Juvenile 5 11 2 4 0.005
Adult Upper Columbia
River spring - E
1 2 1 1 0.003
Juvenile 99 234 24 77 0.005
Adult Puget Sound - T
3 10 1 3 0.005
Juvenile 1,728 4,080 406 1,332 0.013
Coho
Adult Central Calif
coast - E
0 0 0 0 -
Juvenile 0 0 0 0 -
Adult S. Oregon/N.
Calif coast - T
2 6 1 2 0.009
Juvenile 209 497 49 161 0.016
Adult Oregon coast - T
1 2 1 1 0.014
Juvenile 30 72 7 24 0.022
Adult Lower Columbia
River - T
86 294 20 85 0.012
Juvenile 186 443 44 144 0.027
Chum Adult Columbia River
- T
0 0 0 0 <0.001
Juvenile 9 18 2 5 0.001
Sockeye Adult Snake River - E 0 0 0 0 -
580

Biological Opinion and Conference Report on Navy NWTT Activities and NMFS’ MMPA Incidental Take Authorization PCTS FPR-2015-9110
Species Life stage ESU/DPS
Testing Training Percent of
ESU/DPS
(intact adipose)
Killed or
Injured
Mortality
(10 years)
Injury
(10
years)
Mortality
(10 years)
Injury
(10
years)
Juvenile 0 0 0 0 --
Steelhead
Adult South-Central
California - T
0 0 0 0 -
Juvenile 0 0 0 0 -
Adult Central Calif - T
0 0 0 0 -
Juvenile 0 0 0 0 -
Adult California
Central Valley
T
0 0 0 0 -
Juvenile 0 0 0 0 -
Adult Northern Calif
T
0 0 0 0 -
Juvenile 0 0 0 0 -
Adult Upper Columbia
River - E
1 2 1 1 0.002
Juvenile 8 17 4 7 0.002
Adult Snake River
basin - T
11 27 5 9 0.001
Juvenile 43 94 20 38 0.002
Adult Lower Columbia
River - T
2 5 1 2 0.001
Juvenile 1 1 0 1 0.012
Adult Upper
Willamette River
- T
0 0 0 0 -
Juvenile 0 0 0 0 -
Adult Middle
Columbia River
- T
1 1 1 1 0.005
Juvenile 19 41 9 17 0.002
Adult Puget Sound - T
1 1 0 1 0.010
Juvenile 3 7 2 3 0.002
581
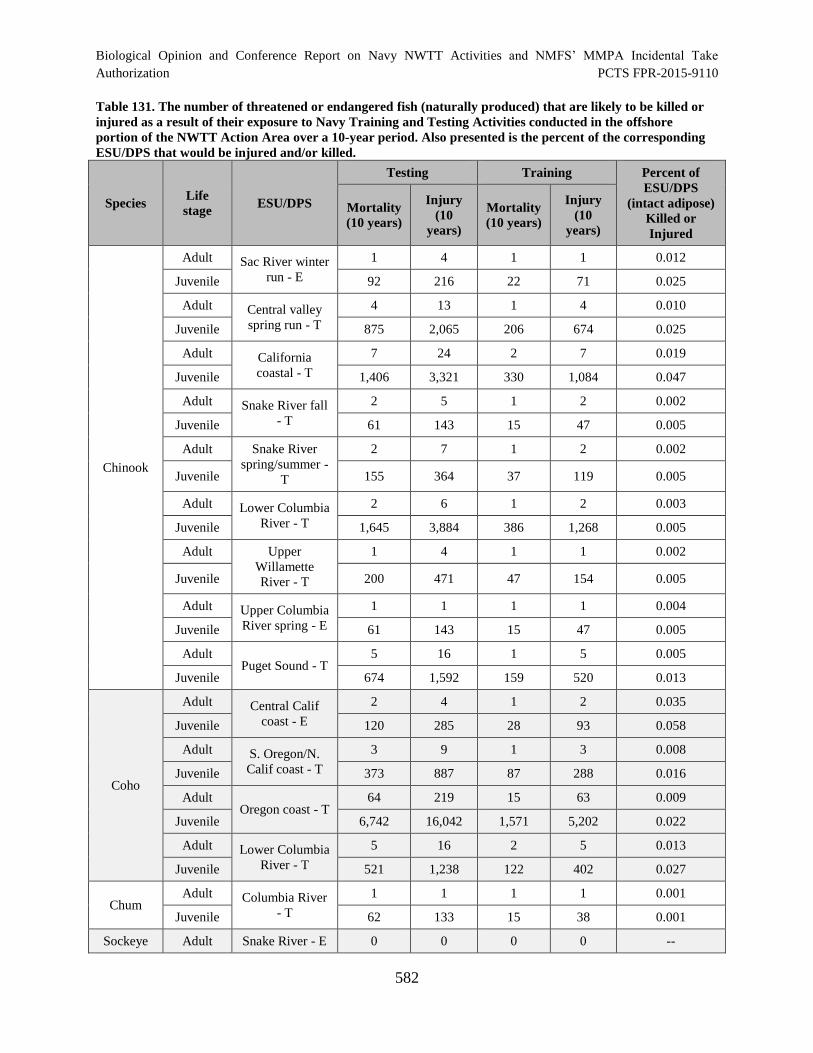
Biological Opinion and Conference Report on Navy NWTT Activities and NMFS’ MMPA Incidental Take
Authorization PCTS FPR-2015-9110
Table 131. The number of threatened or endangered fish (naturally produced) that are likely to be killed or
injured as a result of their exposure to Navy Training and Testing Activities conducted in the offshore
portion of the NWTT Action Area over a 10-year period. Also presented is the percent of the corresponding
ESU/DPS that would be injured and/or killed.
Species Life
stage ESU/DPS
Testing Training Percent of
ESU/DPS
(intact adipose)
Killed or
Injured
Mortality
(10 years)
Injury
(10
years)
Mortality
(10 years)
Injury
(10
years)
Chinook
Adult Sac River winter
run - E
1 4 1 1 0.012
Juvenile 92 216 22 71 0.025
Adult Central valley
spring run - T
4 13 1 4 0.010
Juvenile 875 2,065 206 674 0.025
Adult California
coastal - T
7 24 2 7 0.019
Juvenile 1,406 3,321 330 1,084 0.047
Adult Snake River fall
- T
2 5 1 2 0.002
Juvenile 61 143 15 47 0.005
Adult Snake River
spring/summer
T
2 7 1 2 0.002
Juvenile 155 364 37 119 0.005
Adult Lower Columbia
River - T
2 6 1 2 0.003
Juvenile 1,645 3,884 386 1,268 0.005
Adult Upper
Willamette
River - T
1 4 1 1 0.002
Juvenile 200 471 47 154 0.005
Adult Upper Columbia
River spring - E
1 1 1 1 0.004
Juvenile 61 143 15 47 0.005
Adult Puget Sound - T
5 16 1 5 0.005
Juvenile 674 1,592 159 520 0.013
Coho
Adult Central Calif
coast - E
2 4 1 2 0.035
Juvenile 120 285 28 93 0.058
Adult S. Oregon/N.
Calif coast - T
3 9 1 3 0.008
Juvenile 373 887 87 288 0.016
Adult Oregon coast - T
64 219 15 63 0.009
Juvenile 6,742 16,042 1,571 5,202 0.022
Adult Lower Columbia
River - T
5 16 2 5 0.013
Juvenile 521 1,238 122 402 0.027
Chum Adult Columbia River
- T
1 1 1 1 0.001
Juvenile 62 133 15 38 0.001
Sockeye Adult Snake River - E 0 0 0 0 -
582
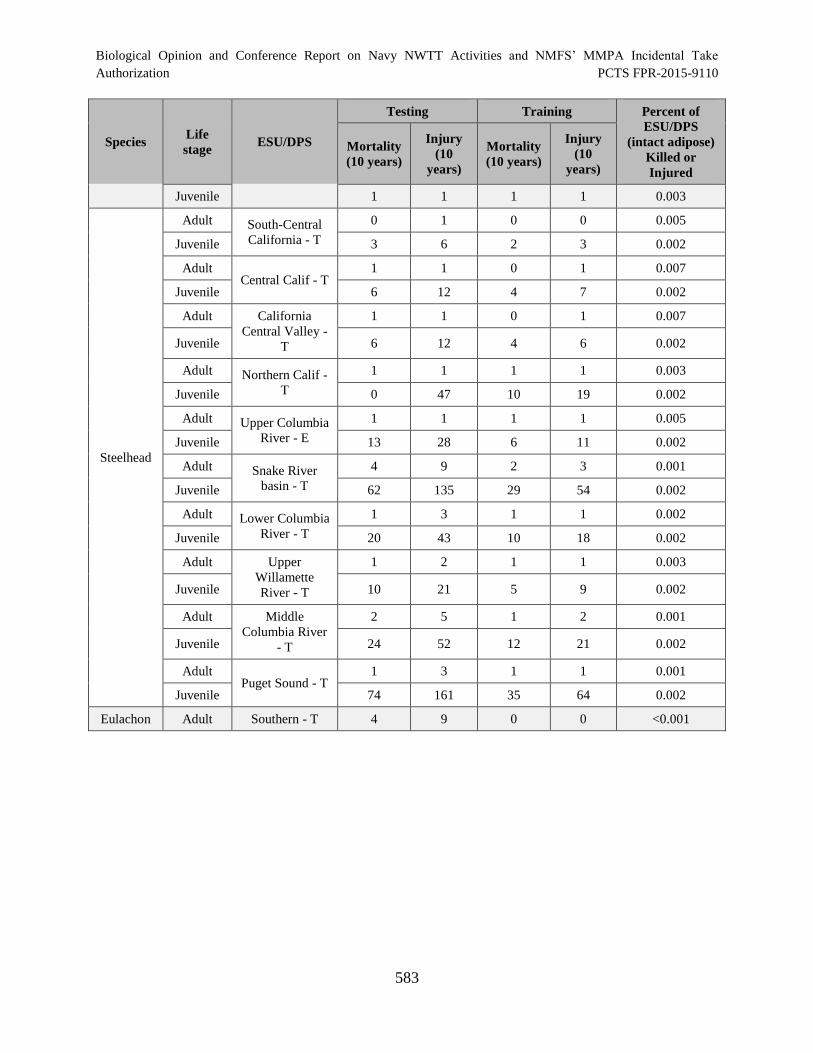
Biological Opinion and Conference Report on Navy NWTT Activities and NMFS’ MMPA Incidental Take Authorization PCTS FPR-2015-9110
Species Life
stage ESU/DPS
Testing Training Percent of
ESU/DPS
(intact adipose)
Killed or
Injured
Mortality
(10 years)
Injury
(10
years)
Mortality
(10 years)
Injury
(10
years)
Juvenile 1 1 1 1 0.003
Steelhead
Adult South-Central
California - T
0 1 0 0 0.005
Juvenile 3 6 2 3 0.002
Adult Central Calif - T
1 1 0 1 0.007
Juvenile 6 12 4 7 0.002
Adult California
Central Valley
T
1 1 0 1 0.007
Juvenile 6 12 4 6 0.002
Adult Northern Calif
T
1 1 1 1 0.003
Juvenile 0 47 10 19 0.002
Adult Upper Columbia
River - E
1 1 1 1 0.005
Juvenile 13 28 6 11 0.002
Adult Snake River
basin - T
4 9 2 3 0.001
Juvenile 62 135 29 54 0.002
Adult Lower Columbia
River - T
1 3 1 1 0.002
Juvenile 20 43 10 18 0.002
Adult Upper
Willamette
River - T
1 2 1 1 0.003
Juvenile 10 21 5 9 0.002
Adult Middle
Columbia River
- T
2 5 1 2 0.001
Juvenile 24 52 12 21 0.002
Adult Puget Sound - T
1 3 1 1 0.001
Juvenile 74 161 35 64 0.002
Eulachon Adult Southern - T 4 9 0 0 <0.001
583
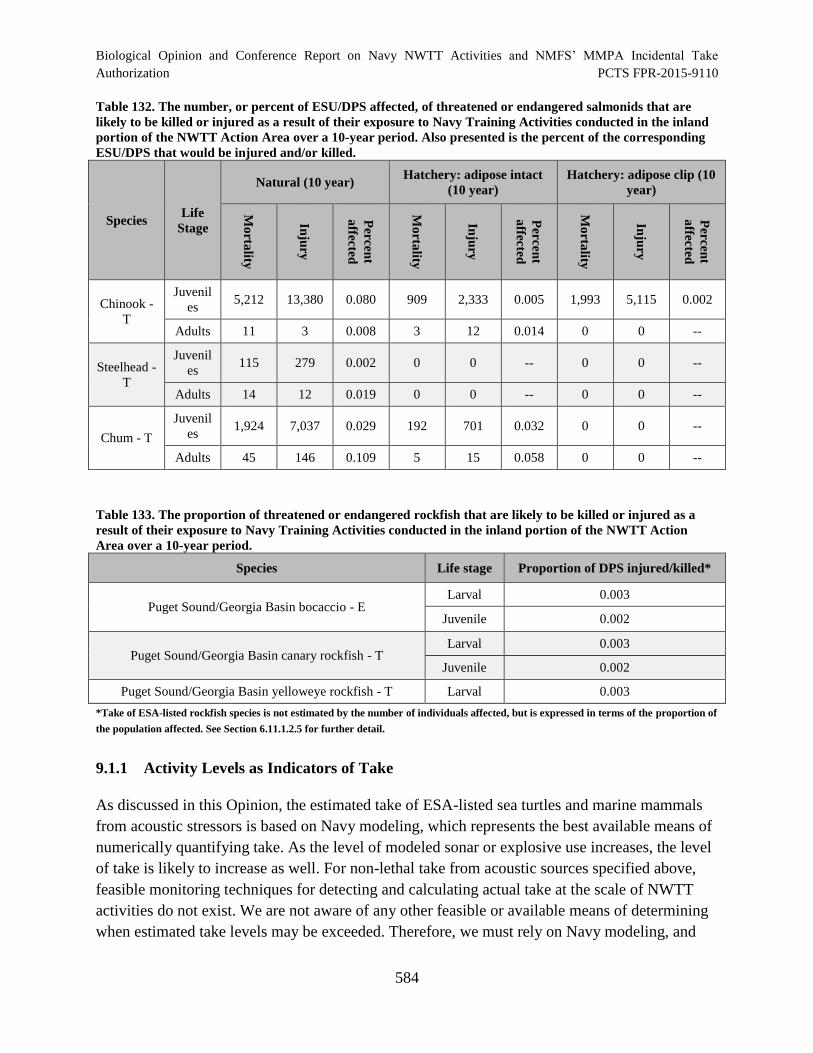
Biological Opinion and Conference Report on Navy NWTT Activities and NMFS’ MMPA Incidental Take
Authorization PCTS FPR-2015-9110
Table 132. The number, or percent of ESU/DPS affected, of threatened or endangered salmonids that are
likely to be killed or injured as a result of their exposure to Navy Training Activities conducted in the inland
portion of the NWTT Action Area over a 10-year period. Also presented is the percent of the corresponding
ESU/DPS that would be injured and/or killed.
Species Life
Stage
Natural (10 year) Hatchery: adipose intact
(10 year)
Hatchery: adipose clip (10
year)
Mo
rtality
Inju
ry
Per
cen
t
affec
ted
Mo
rtality
Inju
ry
Per
cen
t
affec
ted
Mo
rtality
Inju
ry
Per
cen
t
affec
ted
Chinook
T
Juvenil
es 5,212 13,380 0.080 909 2,333 0.005 1,993 5,115 0.002
Adults 11 3 0.008 3 12 0.014 0 0 --
Steelhead
T
Juvenil
es 115 279 0.002 0 0 - 0 0 -
Adults 14 12 0.019 0 0 - 0 0 -
Chum - T
Juvenil
es 1,924 7,037 0.029 192 701 0.032 0 0 -
Adults 45 146 0.109 5 15 0.058 0 0 -
Table 133. The proportion of threatened or endangered rockfish that are likely to be killed or injured as a
result of their exposure to Navy Training Activities conducted in the inland portion of the NWTT Action
Area over a 10-year period.
Species Life stage Proportion of DPS injured/killed*
Puget Sound/Georgia Basin bocaccio - E Larval 0.003
Juvenile 0.002
Puget Sound/Georgia Basin canary rockfish - T Larval 0.003
Juvenile 0.002
Puget Sound/Georgia Basin yelloweye rockfish - T Larval 0.003
*Take of ESA-listed rockfish species is not estimated by the number of individuals affected, but is expressed in terms of the proportion of
the population affected. See Section 6.11.1.2.5 for further detail.
9.1.1 Activity Levels as Indicators of Take
As discussed in this Opinion, the estimated take of ESA-listed sea turtles and marine mammals
from acoustic stressors is based on Navy modeling, which represents the best available means of
numerically quantifying take. As the level of modeled sonar or explosive use increases, the level
of take is likely to increase as well. For non-lethal take from acoustic sources specified above,
feasible monitoring techniques for detecting and calculating actual take at the scale of NWTT
activities do not exist. We are not aware of any other feasible or available means of determining
when estimated take levels may be exceeded. Therefore, we must rely on Navy modeling, and
584
Biological Opinion and Conference Report on Navy NWTT Activities and NMFS’ MMPA Incidental Take
Authorization PCTS FPR-2015-9110
the link between sonar or explosive use and the level of take, to determine when anticipated take
levels have been exceeded. As such, we established a term and condition of this Incidental Take
Statement that requires the Navy to report to NMFS any exceedance of activity specified in the
preceding Opinion and in the final MMPA rule before the exceedance occurs if operational
security considerations allow, or as soon as operational security considerations allow after the
relevant activity is conducted. Exceedance of an activity level will require the Navy to reinitiate
consultation.
Detection of injury or mortality of larval, juvenile, or adult individuals of fish inshore or offshore
during Navy training and testing activities will also be extremely difficult. Although we have
established as a term and condition (number seven) a reasonable monitoring and reporting
program for the take of fish during underwater detonations (EOD activities) in the inshore areas,
monitoring techniques to calculate actual take of larval, juvenile, or adult fish including detection
and collection of individuals and assessment of injuries or death is not feasible at the scale of
NWTT activities. Therefore, in addition to the inshore monitoring and reporting program
required by the terms and conditions, we must rely on predicted take associated with levels of
activities and any opportunistic observations of potential injured or dead larval, juvenile, or adult
fish during training and testing activities to determine when anticipated take levels have been
exceeded. “Take” of these species will have been exceeded if the number of detonations, the
location of the detonations, or the Net Explosive Weight of the detonations are greater than we
expected in our analyses or if the monitoring program associated with the Navy’s activities
detects a greater number of any fish species than are identified in the preceding tables.
9.2 Effects of the Take
In the accompanying Opinion, we determined that the anticipated take levels specified above are
not likely to result in jeopardy to any of the affected species or destruction or adverse
modification of critical habitat that has been designated for such species.
9.3 Reasonable and Prudent Measures
The measures described below are nondiscretionary, and must be undertaken by the Navy so that
they become binding conditions for the exemption in section 7(o)(2) to apply. Section 7(b)(4) of
the ESA requires that when a proposed agency action is found to be consistent with section
7(a)(2) of the ESA and the proposed action may incidentally take individuals of ESA-listed
species, NMFS will issue a statement that specifies the impact of any incidental taking of
endangered or threatened species. To minimize such impacts, reasonable and prudent measures,
and term and conditions to implement the measures, must be provided. Only incidental take
resulting from the agency actions and any specified reasonable and prudent measures and terms
and conditions identified in the incidental take statement are exempt from the taking prohibition
of section 9(a), pursuant to section 7(o) of the ESA.
585
Biological Opinion and Conference Report on Navy NWTT Activities and NMFS’ MMPA Incidental Take
Authorization PCTS FPR-2015-9110
“Reasonable and prudent measures” are nondiscretionary measures to minimize the amount or
extent of incidental take (50 CFR 402.02). NMFS believes the reasonable and prudent measures
described below are necessary and appropriate to minimize the impacts of incidental take on
threatened and endangered species:
The following reasonable and prudent measures are necessary and appropriate to minimize
impacts of incidental take of the species listed in Table 127 and Table 128 in the incidental take
statement of this biological opinion.
1. The Navy and NMFS’ Permits Division shall implement mitigation and reporting
measures to limit the potential for interactions with ESA-listed species (i.e., marine
mammals, sea turtles, and fish) that may rise to the level of take as a result of the
proposed actions described in this Opinion.
2. The Navy and NMFS’ Permits Division shall report all observed interactions resulting in
take with any ESA-listed species (i.e., marine mammals, sea turtles, fish) resulting from
the proposed training and testing activities and any observations of stranded or dead
ESA-listed marine mammals and sea turtles that are not attributable to Navy training and
testing but are observed during the course of Navy training and testing activities and
while implementing monitoring requirements required by this Opinion and the MMPA
LOAs.
3. The Navy and NMFS’ Permits Division shall report any activities not included in the
Description of the Action in Section 2 prior to implementation (if operational security
allows or as soon as operational security considerations allow after the relevant activity is
conducted) and any exceedances of activity levels (Table 2, Table 5, and Table 6)
immediately upon determining that a planned activity may exceed these levels or that
these levels have been exceeded. Exceedance of an activity will require the Navy to
reinitiate consultation.
4. The Navy and NMFS’ Permits and Conservation Division shall submit reports that
identify the general location, timing, number of sonar hours and other aspects of the
training exercises and testing activities, and any potential to exceed levels of training and
testing analyzed in this Opinion they conduct in the NWTT Action Area over the five
year period of the MMPA regulations and letters of authorization to help assess the actual
amount or extent of take incidental to training and testing activities.
9.4 Terms and Conditions
To be exempt from the prohibitions of section 9 of the ESA, the Navy and NMFS’ Permits and
Conservation Division must comply with the following terms and conditions, which implement
the Reasonable and Prudent Measures described above and outlines the mitigation, monitoring
586
Biological Opinion and Conference Report on Navy NWTT Activities and NMFS’ MMPA Incidental Take
Authorization PCTS FPR-2015-9110
and reporting measures required by the section 7 regulations (50 CFR 402.14(i)). These terms
and conditions are non-discretionary. If the Navy and NMFS’s Permits and Conservation
Division fail to ensure compliance with these terms and conditions and their implementing
reasonable and prudent measures, the protective coverage of section 7(o)(2) may lapse.
1. If a dead or injured marine mammal or leatherback sea turtle is observed during the
training and testing activities, the Navy shall immediately contact NMFS and appropriate
stranding networks.
2. The Navy shall monitor and coordinate with marine mammal and sea turtle stranding
networks to help determine any potential relationship of any stranding with Navy training
and testing activities.
3. If the Navy plans to conduct a training or testing activity that was not assessed in this
Opinion as part of the proposed action, the Navy shall contact NMFS prior to executing
the activity (if operational security allows or as soon as operational security
considerations allow after the relevant activity is conducted) and shall reinitiate
consultation as appropriate.
4. The Navy must report to NMFS any exceedance of activity levels (e.g. sonar hours and
the type and numbers of explosives used) of planned testing or training events specified
in the preceding Opinion and in the final MMPA rule before the exceedance occurs and if
operational security considerations allow, or as soon as operational security
considerations allow after the relevant activity is conducted. Exceedance of an activity
level will require the Navy to reinitiate consultation.
5. The Navy shall implement all mitigation and monitoring measures as proposed in the
action described in the Final EIS/OEIS and consultation initiation package, as specified
in the final MMPA rule and LOAs, and as described in this Opinion in Sections 0 and
2.3.
6. NMFS’ Permits Division shall ensure that all mitigation and monitoring measures as
proposed by the Navy and as proposed by NMFS in the final MMPA rule and in Sections
0 and 2.3 of this Opinion are implemented by the U.S. Navy through the issuance of a
final rule and subsequent letters of authorization (LOA) pursuant to the MMPA.
7. The Navy shall accomplish the following monitoring for take of fish during underwater
detonations (EOD activities) in the inshore areas:
a. To the extent practicable, minimize potential effects of underwater detonations by
scheduling training and testing events during periods of the year when salmonid
abundance is lowest.
587
Biological Opinion and Conference Report on Navy NWTT Activities and NMFS’ MMPA Incidental Take Authorization PCTS FPR-2015-9110
b. Survey underwater detonation areas prior to each event to inform
“go”, “no go” decisions and to minimize the potential for interactions with ESA-listed
species. Surveys should attempt to confirm the absence of salmonids and/or indicators of
the presence of salmonids in the mitigation zone. The Navy should employ visual
observations from boats, and other available technology to detect fish and other
indicators consistent with standard operating procedures and as deemed practicable.
c. After each explosion or at the conclusion of multiple explosion events, survey the
impact area and areas immediately downstream to detect possible injured or killed
salmonids. If injured or killed fish are detected, consistent with standard operating
procedures and safety, try to determine the species affected and estimate the number of
adult and juvenile fish.
d. Prepare a report of compliance after each EOD event.
e. Compile and provide hydrophone data from underwater detonation events to
verify assumptions used in the derivation of ranges to effects to fish from explosives. If
there is sufficient data to make conclusions on ranges to effect from all source classes
(NEW) this condition will be met. If not, continue to collect measurements of received
sound levels at various distances from the source using hydrophones and other
appropriate devices as needed.
10 CONSERVATION RECOMMENDATIONS
Section 7(a)(1) of the ESA directs Federal agencies to use their authorities to further the
purposes of the ESA by carrying out conservation programs for the benefit of the threatened and
endangered species. Conservation recommendations are discretionary agency activities to
minimize or avoid adverse effects of a proposed action on ESA-listed species or critical habitat,
to help implement recovery plans or develop information (50 CFR 402.02).
1. Monitor sighting, location, and stranding data for ESA-listed marine mammals and sea
turtle species in the NWTT Action Area.
2. As practicable, develop procedures to aid any individuals of an ESA-listed marine
mammals, sea turtles, and fish that have been impacted by NWTT activities and is in a
condition requiring assistance to increase likelihood of survival.
3. Continue to model potential impacts to ESA-listed species using NAEMO and other
relevant models; validate assumptions used in risk analyses; and seek new information
and higher quality data for use in such efforts.
4. Continue technical assistance/adaptive management efforts with NMFS to help inform
future consultations on Navy training and testing in the NWTT Action Area.
588
Biological Opinion and Conference Report on Navy NWTT Activities and NMFS’ MMPA Incidental Take Authorization PCTS FPR-2015-9110
5. The Navy should coordinate with NMFS to understand acoustic effects to fish and to
develop criteria for future consultations.
6. The Navy should explore methods to better quantify behavioral take of sea turtles not
rising to the level of TTS.
11 REINITIATION OF CONSULTATION
This concludes formal consultation on proposed Northwest Training and Testing activities the
Navy will conduct and NMFS’s promulgation of regulations and issuance of incidental take
authorizations pursuant to the MMPA from November 2015 through November 2020. As
provided in 50 CFR §402.16, reinitiation of formal consultation is required where discretionary
Federal agency involvement or control over the action has been retained (or is authorized by law)
and if: (1) the amount or extent of incidental take is exceeded; (2) new information reveals
effects of the agency action that may affect listed species or critical habitat in a manner or to an
extent not considered in this opinion; (3) the agency action is subsequently modified in a manner
that causes an effect to the listed species or critical habitat not considered in this opinion; or (4) a
new species is listed or critical habitat designated that may be affected by the action. In instances
where the amount or extent of incidental take is exceeded, the Navy and NMFS’ Permits
Division must contact the ESA Interagency Cooperation Division, Office of Protected Resources
immediately.
12 INFORMATION QUALITY ACT
Section 515 of the Treasury and General Government Appropriations Act for Fiscal Year 2001
(Public Law 106-554, AKA the Data Quality Act or Information Quality Act) directed the Office
of Management and Budget (OMB) to issue government-wide guidelines that “provide policy
and procedural guidance to federal agencies for ensuring and maximizing the quality, objectivity,
utility, and integrity of information (including statistical information) disseminated by federal
agencies.” OMB complied by issuing guidelines which direct each federal agency to 1) issue its
own guidelines; 2) establish administrative mechanisms allowing affected persons to seek and
obtain correction of information that does not comply with the OMB 515 Guidelines or the
agency guidelines; and 3) report periodically to OMB on the number and nature of complaints
received by the agency and how the complaints were handled. The OMB Guidelines can be
found at:
http://www.whitehouse.gov/omb/fedreg/reproducible2.pdf
The Department of Commerce Guidelines can be found at:
http://ocio.os.doc.gov/ITPolicyandPrograms/Information_Quality/index.htm
589
Biological Opinion and Conference Report on Navy NWTT Activities and NMFS’ MMPA Incidental Take
Authorization PCTS FPR-2015-9110
The NOAA Section 515 Information Quality Guidelines, created with input and reviews from
each of the components of NOAA Fisheries, went into effect on October 1, 2002. The NOAA
Information Quality Guidelines are posted on the NOAA Office of the Chief Information Officer
Webpage. http://www.cio.noaa.gov/Policy_Programs/info_quality.html
13 REFERENCES
Aburto, A., D. J. Rountry, and J. L. Danzer. 1997a. Behavioral response of blue whales to active
signals. Naval Command, Control and Ocean Surveilance Center, RDT&E Division.
Aburto, A., D. J. Rountry, and J. L. Danzer. 1997b. Behavioral responses of blue whales to
active signals. Naval Command, Control and Ocean Surveillance Center, RDT&E
division, Technical Report 1746, San Diego, CA.
Aburto, A. D., J. Rountry, and J. L. Danzer. 1997c. Behavioral response of blue whales to active
signals. Naval Command, Control, and Ocean Surveillance Center, RDT&E Division,
San Diego, CA.
Acevedo-Gutierrez, A., D. A. Croll, and B. R. Tershy. 2002. High feeding costs limit dive time
in the largest whales. Journal of Experimental Biology 205(12):1747-1753.
Acevedo-Whitehouse, K., and A. L. J. Duffus. 2009. Effects of environmental change on wildlife
health. Philosophical Transactions of the Royal Society of London B Biological Sciences
364(1534):3429-3438.
Acevedo, A. 1991a. Interactions between boats and bottlenose dolphins, Tursiops truncatus, in the entrance to Ensenada de la Paz, Mexico. Aquatic Mammals 17(3):120-124.
Acevedo, A. 1991b. Interactions between boats and bottlenose dolphins, Tursiops truncatus, in the entrance to Ensenada de la Paz, Mexico. Aquatic Mammals 17(3):120-124.
Achinstein, P. 2001. The Book of Evidence. Oxford University Press, New York, New York.
Adams, P. B., M. J. Bowers, H. E. Fish, T. E. Laidig, and K. R. Silberberg. 1999. Historical and
Current Presence-Absence of Coho Salmon (Oncorhynchus kisutch) in the Central
California Coast Evolutionarily Significant Unit, National Marine Fisheries Service,
Southwest Fisheries Science Center. Administrative Report SC-99-02. 24 pp.
Adams, P. B., and coauthors. 2007. Population status of North American green sturgeon,
Acipenser medirostris. Environmental Biology of Fishes 79:339-356.
Adams, P. B., C. B. Grimes, J. E. Hightower, S. T. Lindley, and M. L. Moser. 2002. Status
Review for the North American green sturgeon. NOAA, National Marine Fisheries
Service, Southwest Fisheries Science Center, Santa Cruz, California.
Agler, B. A., and coauthors. 1990. Fin whale (Balaenoptera physalus) photographic
identification: Methodology and preliminary results from the western North Atlantic.
Report of the International Whaling Commission Special Issue 12:349-356.
Aguayo, L. A. 1974. Baleen whales off continental Chile. Pages 209-217 in W. E. Schevill,
editor. The Whale Problem: A Status Report. Harvard University Press, Cambridge,
Massachusetts.
Aguilar, A. 1983. Organochlorine pollution in sperm whales, Physeter macrocephalus, from the
temperate waters of the eastern North Atlantic. Marine Pollution Bulletin 14(9):349-352.
Aguilar, A., and A. Borrell. 1988. Age- and sex-related changes in organochlorine compound
levels in fin whales (Balaenoptera physalus) from the Eastern North Atlantic. Marine
Environmental Research 25(1988?):195-211.
590
Biological Opinion and Conference Report on Navy NWTT Activities and NMFS’ MMPA Incidental Take
Authorization PCTS FPR-2015-9110
Aguilar, A., and C. H. Lockyer. 1987. Growth, physical maturity, and mortality of fin whales
(Balaenoptera physalus) inhabiting the temperate waters of the northeast Atlantic.
Canadian Journal of Zoology 65:253-264.
Aguilar Soto, N., and coauthors. 2006. Does intense ship noise disrupt foraging in deep-diving
Cuvier's beaked whales (Ziphius cavirostris)? Marine Mammal Science 22(3):690-699.
Allen, B. M., and R. P. Angliss. 2010a. Alaska marine mammal stock assessments, 2009.
National Oceanic and Atmospheric Administration, National Marine Fisheries Service,
Alaska Fisheries Science Center.
Allen, B. M., and R. P. Angliss. 2010b. Alaska Marine Mammal Stock Assessments, 2009. U.S.
Department of Commerce.
Allen, B. M., and R. P. Angliss. 2012. Alaska marine mammal stock assessments, 2011.
Allen, B. M., and R. P. Angliss. 2013. Alaska marine mammal stock assessments, 2012. NOAA,
National Marine Fisheries Service, Alaska Fisheries Science Center.
Allen, B. M., and R. P. Angliss. 2014. Alaska marine mammal stock assessments, 2013. National
Oceanic and Atmospheric Administration, National Marine Fisheries Service, Alaska
Fisheries Science Center.
Allen, J. K., M. L. Peterson, G. V. Sharrard, D. L. Wright, and S. K. Todd. 2012. Radiated noise
from commercial ships in the Gulf of Maine: Implications for whale/vessel collisions.
Journal of the Acoustical Society of America 132(3):EL229-EL235.
Allen, M. A., and S. Riley. 2012. Fisheries and Habitat Assessment of the Big Sur River Lagoon,
California.
Allen, P., and J. Cech. 2007. Age/size effects on juvenile green sturgeon, Acipenser medirostris ,
oxygen consumption, growth, and osmoregulation in saline environments. Environmental
Biology of Fishes 79(3):211-229.
Allen, P. J., J. A. Hobbs, J. J. Cech, J. P. Van Eenennaam, and S. I. Doroshov. 2009. Using Trace
Elements in Pectoral Fin Rays to Assess Life History Movements in Sturgeon: Estimating
Age at Initial Seawater Entry in Klamath River Green Sturgeon. Transactions of the
American Fisheries Society 138(2):240-250.
Allen, P. J., and J.J. Cech, Jr. 2007. Age/size effects on juvenile green sturgeon, Acipenser
medirostris, oxygen consumption, growth, and osmoregulation in saline environments.
Environmental Biology of Fishes 79:211-229.
Alter, S. E., M. P. Simmonds, and J. R. Brandon. 2010. Forecasting the consequences of climate-
driven shifts in human behavior on cetaceans. Marine Policy 34:943-954.
Amaral, K., and C. Carlson. 2005a. Scientific basis for whale watching guidelines. A review of
current research. Unpublished paper to the IWC Scientific Committee. 17 pp. Ulsan,
Korea, June (SC/57/WW1).
Amaral, K., and C. Carlson. 2005b. Summary of non-lethal research techniques for the study of
cetaceans. United Nations Environment Programme UNEP(DEC)/CAR WG.27/REF.5.
3p. Regional Workshop of Experts on the Development of the Marine Mammal Action
Plan for the Wider Caribbean Region. Bridgetown, Barbados, 18-21 July.
Amoser, S., and F. Ladich. 2003. Diversity in noise-induced temporary hearing loss in
otophysine fishes. Journal of the Acoustical Society of America 113(4):2170-2179.
Amoser, S., and F. Ladich. 2005. Are hearing sensitivities of freshwater fish adapted to the
ambient noise in their habitats? Journal of Experimental Biology 208:3533-3542.
Andersson, A. J., and coauthors. 2015. Understanding ocean acidification impacts on
organismalto ecological scales. Oceanography 28(2):16-27.
591
Biological Opinion and Conference Report on Navy NWTT Activities and NMFS’ MMPA Incidental Take Authorization PCTS FPR-2015-9110
Anderwald, P., and coauthors. 2013. Displacement responses of a mysticete, an odontocete, and
a phocid seal to construction-related vessel traffic. Endangered Species Research
21(3):231-240.
Andre, M., and L. F. L. Jurado. 1997. Sperm whale (Physeter macrocephalus) behavioural
response after the playback of artificial sounds. Pages 92 in Proceedings of the Tenth
Annual Conference of the European Cetacean Society, Lisbon, Portugal.
André, M., M. Terada, and Y. Watanabe. 1997. Sperm whale (Physeter macrocephalus)
behavioural responses after the playback of artificial sounds. Report of the International
Whaling Commission 47:499-504.
Andrew, R. K., B. M. Howe, and J. A. Mercer. 2002. Ocean ambient sound: Comparing the
1960s with the 1990s for a receiver off the California coast. Acoustics Research Letters
Online 3(2):65-70.
Andrews, A. H., and coauthors. 2005. Bomb radiocarbon and lead-radium disequilibria in
otoliths of bocacio rockfish (Sebstes paucispinis): a determination of age and longevity
for a difficult-to-age fish. Marine and Freshwater Research 56:517-528.
Andrews, A. H., and coauthors. 2007. Age validation of canary rockfish (Sebastes pinniger)
using two independent otolith techniques: lead-radium and bomb radiocarbon dating.
Marine and Freshwater Research 58(6):531-541.
Andrews, R. C. 1916. The sei whale (Balaenoptera borealis Lesson). Memoirs of the American
Museum of Natural History, New Series 1(6):291-388.
Angliss, R. P., and B. M. Allen. 2009. Alaska marine mammal stock assessments, 2008.
Angliss, R. P., and R. B. Outlaw. 2005. Alaska marine mammal stock assessments, 2005. U.S.
Department of Commerce, NMFSAFSC-161.
Angliss, R. P., and R. B. Outlaw. 2008. Alaska marine mammal stock assessments, 2007.
Department of Commerce, NMFS-AFSC-180.
Angradi, A. M., C. Consiglio, and L. Marini. 1993. Behaviour of striped dolphins (Stenella
coeruleoalba) in the central Tyrrhenian Sea in relation to commercial ships. European
Research on Cetaceans 7:77-79. Proceedings of the Seventh Annual Conference of the
European Cetacean Society, Inverness, Scotland, 18-21 February.
Anonmyous. 2010. Report of the IWC Pollution 2000+ Phase II Workshop. 22-24 February
2010, The Marine Mammal Center, Sausalito, CA, USA. International Whaling
Commission Scientific Committee, Agadir, Morocco.
Antonelis, G. A., and C. H. Fiscus. 1980. The pinnipeds of the California Current. California
Cooperative Oceanic Fisheries Investigations Reports 21:68-78.
Antunes, R., and coauthors. 2014. High thresholds for avoidance of sonar by free-ranging long-
finned pilot whales (Globicephala melas). Marine Pollution Bulletin 83(1):165-180.
Arcangeli, A., and R. Crosti. 2009. The short-term impact of dolphin-watching on the behaviour
of bottlenose dolphins (Tursiops truncatus) in western Australia. Journal of Marine
Animals and their Ecology 2(1):3-9.
Archer, F. I., S. L. Mesnick, and A. C. Allen. 2010a. Variation and predictors of vessel response
behavior in a tropical dolphin community. National Oceanic and Atmospheric
Administration, National Marine Fisheries Service, Southwest Fisheries Science Center.
Archer, F. I., J. V. Redfern, T. Gerrodette, S. J. Chivers, and W. F. Perrin. 2010b. Estimation of
relative exposure of dolphins to fishery activity. Marine Ecology Progress Series
410:245-255.
592
Biological Opinion and Conference Report on Navy NWTT Activities and NMFS’ MMPA Incidental Take Authorization PCTS FPR-2015-9110
Arfsten, D., C. Wilson, and B. Spargo. 2002. Radio frequency chaff: The effects of its use in
training on the environment. Ecotoxicology and Environmental Safety 53:1-11.
Arnbom, T., V. Papastavrou, L. S. Weilgart, and H. Whitehead. 1987. Sperm whales react to an
attack by killer whales. Journal of Mammalogy 68(2):450-453.
Astrup, J. 1999. Ultrasound detection in fish - a parallel to the sonar-mediated detection of bats
by ultrasound-sensitive insects? Comparative Biochemistry and Physiology A 124:19-27.
Atema, J., M. J. Kinsford, and G. Gerlach. 2002. Larval reef fish could use odour for detection,
retention and orientation to reefs. Marine Ecology Progress Series 241:151-160.
Atkinson, K. A. 2010. Habitat conditions and steelhead abundance and growth in a California
lagoon. San Jose State University.
Au, D., and W. Perryman. 1982a. Movement and speed of dolphin schools responding to an
approaching ship. Fishery Bulletin 80:371-379.
Au, D., and W. Perryman. 1982b. Movement and speed of dolphin schools responding to an
approaching ship. Fishery Bulletin 80(2):371-379.
Au, W., J. Darling, and K. Andrews. 2001. High-frequency harmonics and source level of
humpback whale songs. Journal of the Acoustical Society of America 110(5 Part 2):2770.
Au, W. W. L., J. K. B. Ford, J. K. Horne, and K. A. Newman Allman. 2004. Echolocation
signals of free-ranging killer whales (Oricinus orca) and modeling of foraging for
chinook salmon (Oncorhynchus tshawytscha). Journal of the Acoustical Society of
America 115(2).
Au, W. W. L., and M. Green. 2000a. Acoustic interaction of humpback whales and whale-
watching boats. Marine Environmental Research 49:469-481.
Au, W. W. L., and M. Green. 2000b. Acoustic interaction of humpback whales and whale-
watching boats. Marine Environmental Research 49(5):469-481.
Au, W. W. L., J. Mobley, W. C. Burgess, M. O. Lammers, and P. E. Nachtigall. 2000a. Seasonal
and diurnal trends of chorusing humpback whales wintering in waters off western Maui.
Marine Mammal Science 16(3):15.
Au, W. W. L., and coauthors. 2006a. Acoustic properties of humpback whale songs. Journal of
the Acoustical Society of America 120(2):1103.
Au, W. W. L., and coauthors. 2006b. Acoustic properties of humpback whale songs. Journal of
Acoustical Society of America 120(August 2006):1103-1110.
Au, W. W. L., and D. A. Pawloski. 1989a. A comparison of signal detection between an
echolocating dolphin and an optimal receiver. Journal of Comparative Physiology A
Sensory, Neural and Behavioral Physiology 164(4):451-458.
Au, W. W. L., and J. L. Pawloski. 1989b. Detection of noise with rippled spectra by the Atlantic
bottlenose dolphin. Journal of the Acoustical Society of America 86(2):591-596.
Au, W. W. L., A. N. Popper, and R. R. Fay. 2000b. Hearing by whales and dolphins. Springer-
Verlag, New York.
Aurioles-Gamboa, D., and F. J. Camacho-Rios. 2007. Diet and feeding overlap of two otariids,
Zalophus californianus and Arctocephalus townsendi: Implications to survive
environmental uncertainty. Aquatic Mammals 33(3):315-326.
Avens, L., and K. Lohmann. 2003. Use of multiple orientation cues by juvenile loggerhead sea
turtles Caretta caretta. Journal of Experimental Biology 206:4317–4325.
Ayres, K. L., and coauthors. 2012. Distinguishing the impacts of inadequate prey and vessel
traffic on an endangered killer whale (Orcinus orca) population. PLoS ONE 7(6):e36842.
593
Biological Opinion and Conference Report on Navy NWTT Activities and NMFS’ MMPA Incidental Take
Authorization PCTS FPR-2015-9110
Baglivio, E. A. 2012. Comparing the demographics of two steelhead populations and their
habitat. California Polytechnic State University.
Bailey, H., and coauthors. 2010. Behavioural estimation of blue whale movements in the
northeast Pacific from state-space model analysis of satellite tracks. Endangered Species
Research 10(1):93-106.
Bailey, K. M., and coauthors. 1995. ENSO events in the northern Gulf of Alaska, and effects on
selected marine fisheries. CalCOFI Reports 36:78-96.
Bain, D. E. 2002. A model linking energetic effects of whale watching to killer whale (Orcinus
orca) population dynamics. Friday Harbor Laboratories, University of Washington,
Friday Harbor, Washington.
Bain, D. E., D. Lusseau, R. Williams, and J. C. Smith. 2006. Vessel traffic disrupts the foraging
behavior of southern resident killer whales (Orcinus spp.). International Whaling
Commission.
Baird, R., S. W. Martin, D. L. Webster, and B. L. Southall. 2014. Assessment of modeled
received sound pressure levels and movements of satellite-tagged odontocetes exposed to
mid-frequency active sonar at the Pacific Missile Range Facility: February 2011 through
February 2013. U. S. Pacific Fleet.
Baird, R. W. 2000. The Killer Whale: foraging specializations and group hunting. Pages 127-153
in J. Mann, R. Conner, P. L. Tyack, and H. Whitehead, editors. Cetacean societies: Field
studies of dolphins and whales University of Chicago Press, Chicago, Illinois.
Baird, R. W. 2001. Status of killer whales, Orcinus orca, in Canada. The Canadian Field-
Naturalist 115(4):676-701.
Baird, R. W., and A. M. Gorgone. 2005. False killer whale dorsal fin disfigurements as a
possible indicator of long-line fishery interactions in Hawaiian waters. Pacific Science
59(4):593-601.
Baker, C. S. 1985. The population structure and social organization of humpback whales
(Megaptera novaeangliae) in the central and eastern North Pacific. University of Hawaii,
Honolulu.
Baker, C. S., and L. M. Herman. 1983. Seasonal contrasts in the social behavior of the North
Pacific humpback whale. Pages 5 in Fifth Biennial Conference on the Biology of Marine
Mammals, New England Aquarium, Boston, Massachusetts.
Baker, C. S., and L. M. Herman. 1987. Alternative population estimates of humpback whales
(Megaptera novaeangliae) in Hawaiian waters. Canadian Journal of Zoology
65(11):2818-2821.
Baker, C. S., and L. M. Herman. 1989. Behavioral responses of summering humpback whales to
vessel traffic: Experimental and opportunistic observations (Megaptera novaeangliae).
Tech. Rep. No. NPS-NR-TRS-89-01. 50 pgs. Final report to the National Park Service,
Alaska Regional Office, Anchorage, Alaska [Available from the U.S. Dept. Interior,
NPS, Alaska Reg. Off., Room 107, 2525 Gambell St., Anchorage, AK 99503.
Baker, C. S., L. M. Herman, B. G. Bays, and G. B. Bauer. 1983. The impact of vessel traffic on
the behavior of humpback whales in southeast Alaska: 1982 season. National Oceanic
and Atmospheric Administration, National Marine Fisheries Service, Alaska Fisheries
Science Center, National Marine Mammal Laboratory.
Baker, C. S., and coauthors. 2013. Strong maternal fidelity and natal philopatry shape genetic
structure in North Pacific humpback whales. Marine Ecology Progress Series 494:291
306.
594
Biological Opinion and Conference Report on Navy NWTT Activities and NMFS’ MMPA Incidental Take Authorization PCTS FPR-2015-9110
Barlow, J. 1994. Abundance of large whales in California coastal waters: A comparison of ship
surveys in 1979/80 and in 1991. Report of the International Whaling Commission
44:399-406.
Barlow, J. 1995. Abundance of cetaceans in California waters. Part I: Ship surveys in summer
and fall of 1991. Fishery Bulletin 93(1):1-14.
Barlow, J. 1997. Preliminary estimates of cetacean abundance off California, Oregon, and
Washington based on a 1996 ship survey and comparisons of passing and closing modes.
National Oceanic and Atmospheric Administration, National Marine Fisheries Service,
Southwest Fisheries Science Center, Admin. Rept. LJ-97- 11, La Jolla, California.
Barlow, J. 2003a. Cetacean abundance in Hawaiian waters during summer/fall 2002. National
Oceanic and Atmospheric Administration, National Marine Fisheries Service, Southwest
Fisheries Science Center.
Barlow, J. 2003b. Preliminary estimates of the abundance of cetaceans along the U.S. West
Coast: 1991-2001. National Oceanic and Atmospheric Administration, National Marine
Fisheries Service, Southwest Fisheries Science Center LJ-03-03.
Barlow, J. 2010a. Cetacean abundance in the California Current estimated from a 2008 ship-
based line-transect survey. National Oceanic and Atmospheric Administration, National
Marine Fisheries Service, Southwest Fisheries Science Center.
Barlow, J. 2010b. Cetacean abundance in the California Current estimated from a 2008 ship-
based line transect survey. National Oceanic and Atmospheric Administration, National
Marine Fisheries Service, Southwest Fisheries Science Center.
Barlow, J., and coauthors. 2011. Humpback whale abundance in the North Pacific estimated by
photographic capture-recapture with bias correction from simulation studies. Marine
Mammal Science 27(4):793-818.
Barlow, J., and coauthors. 2009a. Predictive modeling of cetacean densities in the eastern Pacific
Ocean. National Oceanic and Atmospheric Administration, National Marine Fisheries
Service, Southwest Fisheries Science Center, La Jolla, California.
Barlow, J., and coauthors. 2009b. Predictive modeling of cetacean densities in the eastern Pacific
Ocean. National Oceanic and Atmospheric Administration, National Marine Fisheries
Service, Southwest Fisheries Science Center.
Barlow, J., and K. A. Forney. 2007. Abundance and population density of cetaceans in the
California Current ecosystem. Fishery Bulletin 105(4):509-526.
Barlow, J., and coauthors. 1997. U.S. Pacific Marine Mammal Stock Assessments: 1996
Southwest Fisheries Science Center, National Marine Fisheries Service, National Oceanic
and Atmospheric Administration, NOAA-TM-NMFS-SWFSC-248.
Barlow, J., and B. L. Taylor. 2001a. Estimates of large whale abundance off California, Oregon,
Washington, and Baja California based on 1993 and 1996 ship surveys. National Oceanic
and Atmospheric Administration, National Marine Fisheries Service, Southwest Fisheries
Science Center, LJ-01-03.
Barlow, J., and B. L. Taylor. 2001b. Estimates of large whale abundance off California, Oregon,
Washington, and Baja California based on 1993 and 1996 ship surveys. National Marine
Fisheries Service, Southwest Fisheries Science Center, LJ-01-03.
Barlow, J., and B. L. Taylor. 2005. Estimates of sperm whale abundance in the northeastern
temperate Pacific from a combined acoustic and visual survey. Marine Mammal Science
21(3):429-445.
595
Biological Opinion and Conference Report on Navy NWTT Activities and NMFS’ MMPA Incidental Take
Authorization PCTS FPR-2015-9110
Barnhart, R. A. 1986a. Species profiles: life histories and environmental requirements of coastal
fishes and invertebrates (Pacific Southwest): steelhead. US Army Corps of Engineers,
TR-EL-82-4/872-11-60, Arcada, California.
Barnhart, R. A. 1986b. Species profiles: Life histories and environmental requirements of coastal
fishes and invertebrates (Pacific Southwest): Steelhead. Humboldt State University, TR
EL-82-4/82-11-60, Arcada, California.
Barre, L. 2012. Personal communication between Lynne Barre (NMFS) and Andrea Balla-
Holden (Navy).
Barss, W. H. 1989. Maturity and reproductive cycle for 35 species from the family Scorpaenidae
found off Oregon. Oregon Department of Fish and Game, Portland, Oregon.
Bartol, S., J. Musick, and M. Lenhardt. 1999a. Auditory evoked potentials of the loggerhead sea
turtle (Caretta caretta). Copeia 1999(3):836-840.
Bartol, S. M., and D. R. Ketten. 2006. Turtle and tuna hearing. Pages 98-103 in Y. Swimmer,
and R. W. Brill, editors. Sea Turtle and Pelagic Fish Sensory Biology: Developing
Techniques to Reduce Sea Turtle Bycatch in Longline Fisheries, volume Technical
Memorandum NMFS-PIFSC-7. U.S Department of Commerce, National Oceanic and
Atmospheric Administration, National Marine Fisheries Service, Pacific Islands Fisheries
Science Center.
Bartol, S. M., J. A. Musick, and M. Lenhardt. 1999b. Auditory Evoked Potentials of the
Loggerhead Sea Turtle (Caretta caretta). Copeia 3:836-840.
Bassett, C., B. Polagye, M. Holt, and J. Thomson. 2012a. A vessel noise budget for Admiralty
Inlet, Puget Sound, Washington (USA). Journal of the Acoustical Society of America
132(6):3706-3719.
Bassett, C., B. Polagye, M. M. Holt, and J. Thomson. 2012b. A vessel noise budget for
Admiralty Inlet, Puget Sound, Washington (USA). Journal of the Acoustical Society of
America 6(132):3706-3719.
Bassett, C., J. Thomson, and B. Polagye. 2010. Characteristics of underwater ambient noise at a
proposed tidal energy site in Puget Sound. Pages 8 in Oceans 2010 MTS/IEEE
Conference, Seattle, Washington.
Bauer, G., and L. M. Herman. 1986. Effects of vessel traffic on the behavior of humpback
whales in Hawaii. National Marine Fisheries Service, Honolulu, Hawaii.
Bauer, G. B. 1986. The behavior of humpback whales in Hawaii and modifications of behavior
induced by human interventions. (Megaptera novaeangliae). University of Hawaii. 314p.
Baumann-Pickering, S., and coauthors. 2010. Characterization of marine mammal recordings
from the Hawaii Range Complex. Naval Postgraduate School.
Baumann-Pickering, S., and coauthors. 2012. Appendix; Marine species monitoring for the U.S.
Navy's Gulf of Alaska temporary maritime activities area annual report 2012.
Baumgartner, M. F., and D. M. Fratantoni. 2008. Diel periodicity in both sei whale vocalization
rates and the vertical migration of their copepod prey observed from ocean gliders.
Limnology and Oceanography 53(5 Part 2):2197-2209.
Baumgartner, M. F., and coauthors. 2008. Low frequency vocalizations attributed to sei whales
(Balaenoptera borealis). Journal of the Acoustical Society of America 124(2):1339-1349.
Baylis, H. A. 1928. Parasites of whales. Natural History Magazine 1(2):55-57.
Beakes, M. P., and coauthors. 2010. Smolt transformation in two California steelhead
populations: Effects of temporal variability in growth. Transactions of the American
Fisheries Society 139(5):1263-1275.
596
Biological Opinion and Conference Report on Navy NWTT Activities and NMFS’ MMPA Incidental Take
Authorization PCTS FPR-2015-9110
Beamer, E., A. McBride, R. Henderson, and K. Wolf. 2003. The importance of non-natal pocket
estuaries in Skagit Bay to wild Chinook salmon: an emerging priority for restoration.
Skagit System Cooperative Research Department.
Beamer, E. M., R. E. McClure, and B. A. Hayman. 2000. Fiscal year 1999 Skagit River chinook
restoration research, Skagit System Cooperative, P.O. Box 368, La Conner, WA.
Beamesderfer, R. C., and M. A. H. Webb. 2002a. Green sturgeon status review information.
State Water Contractors, Sacramento, California.
Beamesderfer, R. C. P., and M. A. H. Webb. 2002b. Green sturgeon status review information.
S.P. Cramer and Associates, Gresham, Oregon.
Beamish, R. J., M. Folkes, R. Sweeting, and C. Mahnken. 1998. Intra-annual changes in the
abundance of coho, Chinook, and chum salmon in Puget Sound in 1997. Puget Sound
Research'98, Puget Sound Water Quality Action Team, Olympia, Washington.
Beauchamp, D. A., M. F. Shepard, and G. O. Pallley. 1983. Species Profiles: Life Histories and
Environmental Requirements of Coastal Fishes and Invertebrates (Pacific Northwest)
Chinook Salmon. FWS/OBS-82/11.6, TR EL-82-4, October 1983. Prepared for the U.S.
Department of Interior, Fish and Wildlife Service, and the U.S. Army Corps of
Engineers, Coastal Ecology Group, Waterways Experiment Station. 23p.
Beaudreau, A. H., and T. E. Essington. 2007. Spatial, temporal, and ontogenetic patterns of
predation on rockfishes by lingcod. Transactions of the American Fisheries Society
136:1438-1452.
Becker, E. A., and coauthors. 2012a. Forecasting cetacean abundance patterns to enhance
management decisions. Endangered Species Research 16(2):97-112.
Becker, E. A., K. A. Forney, M. C. Ferguson, J. Barlow, and J. V. Redfern. 2012b. Predictive
modeling of cetacean densities in the California current ecosystem based on summer/fall
ship surveys in 1991-2008. NOAA, National Marine Fisheries Service, Southwest
Fisheries Science Center.
Becker, E. A., and coauthors. 2010. Comparing California Current cetacean-habitat models
developed using in situ and remotely sensed sea surface temperature data. Marine
Ecology Progress Series 413:163-183.
Becker, E. A., K. A. Forney, D. G. Foley, and J. Barlow. 2012c. Density and spatial distribution
patterns of cetaceans in the Central North Pacific based on habitat models. NOAA,
National Marine Fisheries Service, Southwest Fisheries Science Center.
Bejder, L., S. M. Dawson, and J. A. Harraway. 1999. Responses by Hector's dolphins to boats
and swimmers in Porpoise Bay, New Zealand. Marine Mammal Science 15(3):738-750.
Bejder, L., and D. Lusseau. 2008. Valuable lessons from studies evaluating impacts of cetacean-
watch tourism. Bioacoustics 17-Jan(3-Jan):158-161. Special Issue on the International
Conference on the Effects of Noise on Aquatic Life. Edited By A. Hawkins, A. N. Popper
& M. Wahlberg.
Bejder, L., A. Samuels, H. Whitehead, H. Finn, and S. Allen. 2009. Impact assessment research:
Use and misuse of habituation, sensitisation and tolerance to describe wildlife responses
to anthropogenic stimuli. Marine Ecology Progress Series 395:177-185.
Bejder, L., A. Samuels, H. Whitehead, and N. Gales. 2006a. Interpreting short-term behavioural
responses to disturbance within a longitudinal perspective. Animal Behaviour
72(5):1149-1158.
Bejder, L., and coauthors. 2006b. Decline in relative abundance of bottlenose dolphins exposed
to long-term disturbance. Conservation Biology 20(6):1791-1798.
597
Biological Opinion and Conference Report on Navy NWTT Activities and NMFS’ MMPA Incidental Take
Authorization PCTS FPR-2015-9110
Belcher, R. L., and T.E. Lee, Jr. 2002. Arctocephalus townsendi. Mammalian Species 700(1):1
5.
Bellinger, M. R., and coauthors. 2015. Geo-Referenced, Abundance Calibrated Ocean
Distribution of Chinook Salmon (Oncorhynchus tshawytscha) Stocks across the West
Coast of North America. PLOS One 10(7).
Bemis, W. E., and B. Canard. 1997. Sturgeon rivers: An introduction to acipenseriform
biogeography and life history. Environmental Biology of Fishes 48:167-183.
Benson, S. R., D. A. Croll, B. B. Marinovic, F. P. Chavez, and J. T. Harvey. 2002. Changes in
the cetacean assemblage of a coastal upwelling ecosystem during El Niño 1997-98 and
La Niña 1999. Progress in Oceanography 54:279-291.
Benson, S. R., and coauthors. 2007. Post-nesting migrations of leatherback turtles (Dermochelys
coriacea) from Jamursba-Medi, Bird's Head Peninsula, Indonesia. Chelonian
Conservation and Biology 6(1):150-154.
Benson, S. R., and coauthors. 2011. Large-scale movements and high-use areas of western
Pacific leatherback turtles, Dermochelys coriacea. Ecosphere 2(7).
Berchok, C. L., D. L. Bradley, and T. B. Gabrielson. 2006a. St. Lawrence blue whale
vocalizations revisited: Characterization of calls detected from 1998 to 2001. J Acoust
Soc Am 120(4):2340-2354.
Berchok, C. L., D. L. Bradley, and T. B. Gabrielson. 2006b. St. Lawrence blue whale
vocalizations revisited: Characterization of calls detected from 1998 to 2001. Journal of
the Acoustical Society of America 120(4):2340-2354.
Berkeley, S. A., M. A. Hixon, R. J. Larson, and M. S. Love. 2004. Fisheries Sustainability via
protection of age structure and spatial distribution of fish populations. Fisheries 29(8):23
32.
Berkson, H. 1967. Physiological adjustments to deep diving in the Pacific green turtle (Chelonia
mydas agassizii). Comparative Biochemistry and Physiology A-Molecular and
Integrative Physiology 21(3):507-524.
Berman-Kowalewski, M., and coauthors. 2010. Association between blue whale (Balaenoptera
musculus) mortality and ship strikes along the California coast. Aquatic Mammals
36(1):59-66.
Bernaldo de Quiros, Y., and coauthors. 2012. Decompression vs. decomposition: Distribution,
amount, and gas composition of bubbles in stranded marine mammals. Frontiers in
Zoology 3:177.
Bérubé, M., and coauthors. 1998. Population genetic structure of North Atlantic, Mediterranean
and Sea of Cortez fin whales, Balaenoptera physalus (Linnaeus 1758): analysis of
mitochondrial and nuclear loci. Molecular Ecology 7:585-599.
Bérubé, M., J. U. R., r. E. Dizon, R. L. Brownell, and P. J. Palsboll. 2002. Genetic identification
of a small and highly isolated population of fin whales (Balaenoptera physalus) in the
Sea of Cortez, México. Conservation Genetics 3(2):183-190.
Berzin, A. A. 1971. The sperm whale. (Physeter macrocephalus). Pishchevaya Promyshlennost
Moscow, NTIS No. TT-71-50152.
Berzin, A. A., and A. A. Rovnin. 1966. The distribution and migrations of whales in the
northeastern part of the Pacific, Chuckchee and Bering Seas. Soviet Research on Marine
Mammals in the Far East. K. I. Panin (ed.). p.103-136.
Best, P. B., P. A. S. Canham, and N. Macleod. 1984. Patterns of reproduction in sperm whales,
Physeter macrocephalus. Report of the International Whaling Commission Special Issue
598
Biological Opinion and Conference Report on Navy NWTT Activities and NMFS’ MMPA Incidental Take Authorization PCTS FPR-2015-9110
6:51-79. Reproduction in Whales, Dolphins and Porpoises. Proceedings of the
Conference Cetacean Reproduction Estimating Parameters For stock Assessment and
Management.
Best, P. B., and C. H. Lockyer. 2002. Reproduction, growth and migrations of sei whales
Balaenoptera borealis off the west coast of South Africa in the 1960s. South African
Journal of Marine Science 24:111-133.
Bi, H., W. T. Peterson, J. Lamb, and E. Casilas. 2011. Copepods and salmon: characterizing the
spatial distribution of juvenile salmon along the Washington and Oregon coast, USA.
Fisheries Oceanography 20:125-138.
Bi, H., R. E. Ruppel, and W. T. Peterson. 2007. Modeling the pelagic habitat of salmon off the
Pacific Northwest (USA) coast using logistic regression. Marine Ecology Progress Series
336:249-265.
Biggs, D. C., R. R. Leben, and J. G. Ortega-Ortiz. 2000. Ship and satellite studies of mesoscale
circulation and sperm whale habitats in the northeast Gulf of Mexico during GulfCet II.
Gulf of Mexico Science 18(1):15-22.
Bisson, P., A. K. Sullivan, and J. L. Nielsen. 1988. Channel hydraulics, habitat use, and body
form of juvenile coho salmon, steelhead, and cutthroat trout in streams. Transactions of
the American Fisheries Society 117:262-273.
Bjorkstedt, E., and coauthors. 2005. An analysis of historical population structure for
evolutionarily signficant units of Chinook salmon, coho salmon, and steelhead in the
north-Central California Coast Recovery Domain, NOAA-TM-NMFS-SWFSC-382.
Bjorndal, K. A. 1997. Foraging ecology and nutrition of sea turtles. Pages 199–231 in The
Biology of Sea Turtles. CRC Press, Boca Raton, Florida.
Black, B. A. 2009. Climate-driven synchrony across tree, bivalve, and rockfish growth-
increment chronologies of the northeast Pacific. Marine Ecology-Progress Series 378:37
46.
Black, N. 2011. Fish-eating (resident) killer whales sighted in Monterey Bay on February 10,
2011. Monterey Bay Whale Watch.
Blackwell, S. B., J. W. Lawson, and M. T. Williams. 2004. Tolerance by ringed seals (Phoca
hispida) to impact pipe-driving and construction sounds at an oil production island.
Journal of the Acoustical Society of America 115(5):2346-2357.
Blane, J. M., and R. Jaakson. 1994. The impact of ecotourism boats on the St. Lawrence beluga
whales (Delphinapterus leucas). Environmental Conservation 21(3):267-269.
Bleakney, J. S. 1965. Reports of Marine Turtles from New England and Eastern Canada. The
Canadian Field-Naturalist 79:120-128.
Blickley, J. L., D. Blackwood, and G. L. Patricelli. 2012. Experimental evidence for the effects
of chronic anthropogenic noise on abundance of greater sage-grouse at leks. Conservation
Biology 26(3):461-471.
Boehlert, G. W. 1980. Size composition, age composition, and growth of canary rockfish,
Sebastes pinniger, and splitnose rockfish, S. diploproa, from the 1977 rockfish survey.
Marine Fisheries Review 42:57-63.
Boehlert, G. W., and R. F. Kappenman. 1980. Variation of growth with latitude in two species of
rockfish (Sebastes pinniger and S. diploproa) from the northeast Pacific Ocean. Marine
Ecology Progress Series 3:1-10.
Booman, C., and coauthors. 1996. Effekter av luftkanonskyting pa egg, larver og ynell.
Havforskningsinstituttet.
599
Biological Opinion and Conference Report on Navy NWTT Activities and NMFS’ MMPA Incidental Take Authorization PCTS FPR-2015-9110
Borrell, A. 1993. PCB and DDTs in blubber of cetaceans from the northeastern North Atlantic.
Marine Pollution Bulletin 26(3):146.
Borrell, A., and A. Aguilar. 1987. Variations in DDE percentage correlated with total DDT
burden in the blubber of fin and sei whales. Marine Pollution Bulletin 18(2):70-74.
Bostrom, B. L., T. T. Jones, M. Hastings, and D. R. Jones. 2010. Behaviour and Physiology: The
Thermal Strategy of Leatherback Turtles. PLoS ONE 5(11):e13925.
Boughton, D. A., and coauthors. 2006. Steelhead of the south-central/southern California coast:
Population characterization for recovery planning. National Oceanic and Atmospheric
Administration, National Marine Fisheries Service, Southwest Fisheries Science Center,
NOAA-TM_NMFS_SWFSC-394.
Boughton, D. A., and coauthors. 2005. Contraction of the southern range limit for anadromous
Oncorhynchus mykiss. National Oceanic and Atmospheric Administration, National
Marine Fisheries Service, Southwest Fisheries Science Center, NOAA-TM-NMFS
SWFSC-380.
Bowlby, C. E., G. A. Green, and M. L. Bonnell. 1994. Observations of leatherback turtles
offshore of Washington and Oregon. Northwestern Naturalist 75(1):33-35.
Bowles, A. E., M. Smultea, B. Wursig, D. P. Demaster, and D. Palka. 1994. Relative abundance
and behavior of marine mammals exposed to transmissions from the Heard Island
feasibility test. Journal of the Acoustical Society of America 96(4):2469-2484.
Boyd, I., D. Claridge, C. Clark, B. Southall, and P. Tyack. 2008. Behavioral Response Study
2007 BRS-07 cruise report.
Boyd, P. W., and D. A. Hutchins. 2012. Understanding the responses of ocean biota to a complex
matrix of cumulative anthropogenic change. Marine Ecology Progress Series 470:125
135.
Bradshaw, C. J. A., K. Evans, and M. A. Hindell. 2006. Mass cetacean strandings - a plea for
empiricism. Conservation Biology 20(2):584-586.
Braham, H. W. 1991. Endangered whales: A status update. A report on the 5-year status of
stocks review under the 1978 amendments to the U.S. Endangered Species Act. National
Oceanic and Atmospheric Administration, National Marine Fisheries Service, Alaska
Fisheries Science Center, National Marine Mammal Laboratory, Seattle, Washington.
Branch, T. A., and coauthors. 2007. Past and present distribution, densities and movements of
blue whales Balaenoptera musculus in the Southern Hemisphere and northern Indian
Ocean. Mammal Review 37(2):116-175.
Branstetter, B. K. 2013. Auditory masking patterns in bottlenose dolphins from anthropogenic
and natural noise sources. Office of Naval Research.
Brashares, J. S. 2003. Ecological, behavioral, and life-history correlates of mammal extinctions
in West Africa. Conservation Biology 17(3):733-743.
Brett, J. R. 1979. Environmental factors and growth. in W.S. Hoar, D.J. Randall, and J.R. Brett
(editors) Fish Physiology. Academic Press, New York.
Brodeur, R. D., E. A. Daly, C. E. Benkwitt, C. A. Morgan, and R. L. Emmett. 2010. Catching the
prey: Sampling juvenile fish and invertebrate prey fields of juvenile coho and Chinook
salmon during their early marine residence. Fisheries Research.
Brodeur, R. D., B. W. Frost, S. R. Hare, R. C. Francis, and W. J. I. Jr. 1996a. Interannual
variations in zooplankton biomass in the Gulf of Alaska, and covariation with California
Current zooplankton biomass. CalCOFI Reports 37:80-99.
600
Biological Opinion and Conference Report on Navy NWTT Activities and NMFS’ MMPA Incidental Take
Authorization PCTS FPR-2015-9110
Brodeur, R. D., B. W. Frost, S. R. Hare, R. C. Francis, and J. W.J. Ingraham. 1996b. Interannual
variations in zooplankton biomass in the Gulf of Alaska, and covariation with California
Current zooplankton biomass. CalCOFI Reports 37:80-99.
Brodeur, R. D., and D. M. Ware. 1992. Long-term variability in zooplankton biomass in the
subarctic Pacific Ocean. Fisheries Oceanography 1(1):32-38.
Brown, D. W., and coauthors. 1985. Bioaccumulation study: Organic compounds in sediment
and biota from Grays Harbor and reference area. U.S. Army Corps of Engineers, Seattle,
Washington.
Brown, L. R., P. B. Moyle, and R. M. Yoshiyama. 1994. Historical decline and current status of
coho salmon in California. North American Journal of Fisheries Management 14(2):237
261.
Brownell Jr., R. L., P. J. Clapham, T. Miyashita, and T. Kasuya. 2001. Conservation status of
North Pacific right whales. Journal of Cetacean Research and Management (Special Issue
2):269-286.
Brownell Jr., R. L., A. R. Lang, A. M. Burdin, A. B. Bradford, and D. W. Weller. 2009. The
western gray whale population is distinct: A response to SC/61/BRG22. International
Whaling Commission Scientific Committee, Madeira, Portugal.
Browning, L. J., and E. J. Harland. 1999. Are bottlenose dolphins disturbed by fast ferries?
European Research on Cetaceans 13:92-98. Proceedings of the thirteenth Annual
Conference of the European Cetacean Society. P. G. H. Evans, J. Cruz & J. A. Raga-
Eds.). Valencia, Spain, 5-8 April.
BRT. 2005. Green sturgeon (Acipenser medirostris) status review update. National Oceanic and
Atmospheric Administration, National Marine Fisheries Service, Southwest Fisheries
Science Center, Biological Review Team.
Bryant, P. J., C. M. Lafferty, and S. K. Lafferty. 1984. Reoccupation of Laguna Guerrero Negro,
Baja California, Mexico, by gray whales. (Eschrichtius robustus). M. L. Jones, S. L.
Swartz, and S. Leatherwood, editors. The Gray Whale, Eschrichtius robustus. Academic
Press, New York.
Buerkle, U. 1968. Relation of pure tone thresholds to background noise level in the Atlantic cod
(Gadus morhua). Journal of the Fisheries Research Board of Canada 25:1155-1160.
Buerkle, U. 1969. Auditory masking and the critical band in Atlantic cod (Gadus morhua).
Journal of the Fisheries Research Board of Canada 26:1113-1119.
Buhle, E. R., K. K. Holsman, M. D. Scheuerell, and A. Albaugh. 2009. Using an unplanned
experiment to evaluate the effects of hatcheries and environmental variation on
threatened populations of wild salmon. Biological Conservation 142(11):2449-2455.
Burdin, A. M., A. L. Bradford, G. A. Tsidulko, and M. Sidorenko. 2011. Status of western gray
whales off northeastern Sakhalin Island and eastern Kamchatka, Russia in 2010.
International Whaling Commission-Scientific Committee, Tromso, Norway.
Burgner, R. L. 1991a. Life history of sockeye salmon. C. Groot, and L. Margolis, editors. Pacific
Salmon Life Histories. UBC Press, Vancouver, Canada.
Burgner, R. L. 1991b. The life history of sockeye salmon (Oncorhynchus nerka). Pages 3-117 in
C. Groot, and L. Margolis, editors. Life history of Pacific salmon. University of British
Columbia Press, Vancouver, British Columbia, Canada.
Burgner, R. L., and coauthors. 1992. Distribution and origins of steelhead trout (Oncorhynchus
mykiss) in offshore waters of the North Pacific. International North Pacific Fisheries
Commission Bulletin 51:1-92.
601
Biological Opinion and Conference Report on Navy NWTT Activities and NMFS’ MMPA Incidental Take Authorization PCTS FPR-2015-9110
Burke, B. J., M. C. Liermann, D. J. Teel, and J. J. Anderson. 2013. Environmental and geospatial
factors drive juvenile Chinook salmon distribution during early ocean migration. NRC
Research Press 70:1167-1177.
Burtenshaw, J. C., and coauthors. 2004a. Acoustic and satellite remote sensing of blue whale
seasonality and habitat in the Northeast Pacific. Deep-Sea Research Part Ii-Topical
Studies in Oceanography 51(10-11):967-986.
Burtenshaw, J. C., and coauthors. 2004b. Acoustic and satellite remote sensing of blue whale
seasonality and habitat in the Northeast Pacific. Deep Sea Research Part II: Topical
Studies in Oceanography 51(10-11):967-986.
Busby, P. J., and coauthors. 1996a. Status Rreview of West Coast Steelhead from Washington,
Oregon, and California. U.S. Department of Commerce, Northwest Fisheries Science
Center, NMFS-NWFSC-27, Seattle, Washington.
Busby, P. J., and coauthors. 1996b. Status Review of West Coast Steelhead from Washington,
Idaho, Oregon, and California. U.S. Department of Commerce NOAA Technical
Memorandum NMFS-NWFSC-27, 275p.
Busby, P. J., and coauthors. 1996c. Status review of west coast steelhead from Washington,
Idaho, Oregon, and California. National Oceanographic and Atmospheric Administration,
National Marine Fisheries Service, NMFS-NWFSC-27.
Byron, C. J., and B. J. Burke. 2014. Salmon ocean migration models suggest a variety of
population-specific strategies. Reviews in Fish Biology and Fisheries 24(3):737-756.
Cailliet, G. M., and coauthors. 2001. Age determination and validation studies of marine fishes:
do deep-dwellers live longer? Pages 739-764 in.
Cailliet, G. M., E. J. Burton, J. M. Cope, and L. A. Kerr. 2000. Biological characteristics of
nearshore fishes of California: A review of existing knowledge. Pacific States Marine
Fisheries Commission and California Department of Fish and Game
Caillouet, C. W., and coauthors. 1986. Growth and survival of Kemp's ridley sea turtle,
Lepidochelys kempi, in captivity. National Oceanic and Atmospheric Administration,
National Marine Fisheries Service.
Calambokidis, J. 1997. The humpbacks of Costa Rica. Humpback whales and the California-
Costa Rica connection. Whale-Journal of the Oceanic Society 1(1):4-7,10.
Calambokidis, J. 2010. Provide a vessel to conduct observations and deploy sound source for a
behavioral response study of cetaceans off southern California. Office of Naval Research.
Calambokidis, J. 2012. Summary of ship-strike related research on blue whales in 2011.
Calambokidis, J., J. Barlow, J. K. B. Ford, T. E. Chandler, and A. B. Douglas. 2009a. Insights
into the population structure of blue whales in the eastern North Pacific from recent
sightings and photographic identification. Marine Mammal Science 25(4):816-832.
Calambokidis, J., J. Barlow, J. K. B. Ford, T. E. Chandler, and A. B. Douglas. 2009b. Insights
into the population structure of blue whales in the eastern North Pacific from recent
sightings and photographic identification. Marine Mammal Science 25(4):816-832.
Calambokidis, J., and T. Chandler. 2000. Marine mammal observations and mitigation
associated with USGS seismic surveys in the Southern California Bight in 2000.
Cascadia Research Collective report. Prepared for the U.S. Geological Survey. 13pp.
Calambokidis, J., and coauthors. 2002. Abundance, range and movements of a feeding
aggregation of gray whales (Eschrichtius robustus) from California to southeastern
Alaska in 1998. Journal of Cetacean Research and Management 4(3):267-276.
602
Biological Opinion and Conference Report on Navy NWTT Activities and NMFS’ MMPA Incidental Take Authorization PCTS FPR-2015-9110
Calambokidis, J., E. Falcone, A. Douglas, L. Schlender, and J. Jessie Huggins. 2009c.
Photographic identification of humpback and blue whales off the US West Coast: Results
and updated abundance estimates from 2008 field season. Cascadia Research, Olympia,
Washington.
Calambokidis, J., and coauthors. 2008a. SPLASH: Structure of Populations, Levels of
Abundance and Status of Humpback Whales in the North Pacific U.S. Dept of commerce,
Western Administrative Center, Seattle, Washington.
Calambokidis, J., and coauthors. 2008b. SPLASH: Structure of populations, levels of abundance
and status of humpback whales in the North Pacific U.S. Department of Commerce,
Western Administrative Center, Seattle, Washington.
Calambokidis, J., J. L. Laake, and A. Klimek. 2010. Abundance and population structure of
seasonal gray whales in the Pacific Northwest, 1998-2008. International Whaling
Commission Scientific Committee, Agadir, Morocco.
Calambokidis, J., B. R. Mate, E. M. Oleson, L. Irvine, and C. E. H. A. B. Douglas. 2009d. The
Costa Rica Dome as a winter feeding and breeding areas for North Pacific blue whales.
Pages 47 in Eighteenth Biennial Conference on the Biology of Marine Mammals, Quebec
City, Canada.
Calambokidis, J., and coauthors. 2003. Feeding and vocal behavior of blue whales determined
through simultaneous visual-acoustic monitoring and deployment of suction-cap attached
tags. Pages 27 in Abstracts of the 15th
Biennial Conference on the Biology of Marine
Mammals, Greensboro, North Carolina.
Calambokidis, J., and G. H. Steiger. 1990. Sightings and movements of humpback whales in
Puget Sound, Washington. Northwestern Naturalist 71(2):45-49.
Calambokidis, J., and coauthors. 1990. Sightings and movements of blue whales off central
California 1986-88 from photo-identification of individuals. Report of the International
Whaling Commission (Special Issue 12):343-348.
Calambokidis, J., G. H. Steiger, D. K. Ellifrit, B. L. Troutman, and C. E. Bowlby. 2004a.
Distribution and abundance of humpback whales (Megaptera novaeangliae) and other
marine mammals off the northern Washington coast. Fishery Bulletin 102(4):563-580.
Calambokidis, J., G. H. Steiger, D. K. Ellifrit, B. L. Troutman, and C. E. Bowlby. 2004b.
Distribution and abundance of humpback whales (Megaptera novaeangliae) and other
marine mammals off the northern Washington coast. Fishery Bulletin 102(4):563-580.
Calambokidis, J., and coauthors. 1996. Interchange and isolation of humpback whales off
California and other North Pacific feeding grounds. Marine Mammal Science 12(2):215
226.
Calambokidis, J., and coauthors. 2001. Movements and population structure of humpback whales
in the North Pacific. Marine Mammal Science 17(4):769-794.
Calambokidis, J., and coauthors. 1997. Abundance and population structure of humpback whales
in the North Pacific basin. Southwest Fisheries Science Center, 50ABNF500113, La
Jolla, CA.
CALFED. 2000. CALFED Bay-Delta Program Programmatic Record of Decision.
California Hatchery Scientific Review Group. 2012. California Hatchery Review Report,
Prepared for the US Fish and Wildlife Service and Pacific States Marine Fisheries
Commission. June 2012. 100 pgs.
603
Biological Opinion and Conference Report on Navy NWTT Activities and NMFS’ MMPA Incidental Take
Authorization PCTS FPR-2015-9110
Calkins, D. G. 1986. Marine Mammals. Pages 527−558 in D. W. Hood, and S. T. Zimmerman,
editors. In The Gulf of Alaska, Physical Environment and Biological Resources.
Government Printing Office, Washington, D.C.
Campbell, G. S., and coauthors. 2015. Inter-annual and seasonal trends in cetacean distribution,
density and abundance off southern California. Deep Sea Research Part II: Topical
Studies in Oceanography 112:143-157.
Carder, D. A., and S. Ridgway. 1990. Auditory brainstem response in a neonatal sperm whale.
Journal of the Acoustic Society of America 88(Supplement 1):S4.
Cardillo, M. 2003. Biological determinants of extinction risk: Why are smaller species less
vulnerable? Animal Conservation 6:63-69.
Cardillo, M., G. M. Mace, K. E. Jones, and J. Bielby. 2005. Multiple causes of high extinction
risk in large mammal species. Science 309:1239-1241.
Carlson, and Hastings. 2007. Momorandum: Update on recommendations for revised interim
sound exposure criteria for fish during pile driving activities.
Carlson, H. R., and R. R. Straty. 1981. Habitat and nursery grounds of Pacific rockfish, Sebastes
spp., in rocky coastal areas of southeastern Alaska. Marine Fisheries Review 43(7):13-19.
Carr, M. H. 1983. Spatial and temporal patterns of recruitment of young-of-the-year rockfishes
(Genus Sebastes) into a central California kelp forest. San Francisco State University.
Carretta, J., and coauthors. 2002. U.S. Pacific marine mammal stock assessments: 2002. U.S.
Department of Commerce, NMFS-SWFSC-346.
Carretta, J. V., J. Barlow, K. A. Forney, M. M. Muto, and J. Baker. 2001. U.S. Pacific marine
mammal stock assessments: 2001. National Oceanic and Atmospheric Administration,
National Marine Fisheries Service, Southwest Fisheries Science Center, NOAA-TM
NMFS-SWFSC-317.
Carretta, J. V., and S. J. Chivers. 2004. Preliminary estimates of marine mammal mortality and
biological sampling of cetaceans in California gillnet fisheries for 2003. Unpublished
paper to the IWC Scientific Committee. 20 pp. Sorrento, Italy, July (SC/56/SM1).
Carretta, J. V., and coauthors. 2007. U.S. Pacific marine mammal stock assessments: 2007.
Carretta, J. V., and coauthors. 2010a. U. S. Pacific marine mammal stock assessments: 2009.
U.S. Department of Commerce, National Oceanic and Atmospheric Administration,
National Marine Fisheries Service, Southwest Fisheries Science Center, La Jolla,
California.
Carretta, J. V., and coauthors. 2009. U.S. Pacific Marine Mammal Stock Assessments: 2008.
U.S. Department of Commerce, NOAA.
Carretta, J. V., and coauthors. 2010b. U.S. Pacific marine mammal stock assessments: 2009.
NOAA.
Carretta, J. V., and coauthors. 2005. U.S. Pacific marine mammal stock assessments: 2004.
National Oceanic and Atmospheric Administration, National Marine Fisheries Service,
Southwest Fisheries Center, NOAA-TM-NMFS-SWFSC-358.
Carretta, J. V., and coauthors. 2012. U.S. Pacific marine mammal stock assessments: 2011.
Carretta, J. V., and coauthors. 2013a. U.S. Pacific marine mammal stock assessments: 2012.
National Oceanic and Atmospheric Administration, National Marine Fisheries Service,
Southwest Fisheries Science Center.
Carretta, J. V., and coauthors. 2014. U. S. Pacific marine mammal stock assessments, 2013.
National Oceanic and Atmospheric Administration, National Marine Fisheries Service,
Southwest Fisheries Science Center.
604
Biological Opinion and Conference Report on Navy NWTT Activities and NMFS’ MMPA Incidental Take Authorization PCTS FPR-2015-9110
Carretta, J. V., S. M. Wilkin, M. M. Muto, and K. Wilkinson. 2013b. Sources of human-related
injury and mortality for U. S. Pacific West Coast Marine Mammal Stock Assessments,
2007-2011. NOAA, National Marine Fisheries Service, Southwest Fisheries Science
Center.
Cascadia Research. 2012. Examination of stranded gray whale found floating in Saratoga
Passage on 22 April 2012.
http://www.cascadiaresearch.org/examination_of_stranded_gray_whale
23April2012.htm.
Casillas, E., and coauthors. 1998. Essential fish habitat west coast National Marine Fisheries
Service, Seattle, Washington.
Casper, B. M., and D. A. Mann. 2006. Evoked potential audiograms of the nurse shark
(Ginglymostoma cirratum) and the yellow stingray (Urobatis jamaicensis).
Environmental Biology of Fishes 76:101-108.
Castellini, M. 2012. Life under water: Physiological adaptations to diving and living at sea.
Comprehensive Physiology 2(3):1889-1919.
Castellote, M., C. Clark, and M. O. Lammers. 2012a. Acoustic and behavioral changes by fin
whales (Balaenoptera physalus) in response to shipping and airgun noise. Biological
Conservation 147:115-122.
Castellote, M., C. W. Clark, and M. O. Lammers. 2012b. Acoustic and behavioural changes by
fin whales (Balaenoptera physalus) in response to shipping and airgun noise. Biological
Conservation 147(1):115-122.
Cato, D. H. 1978. Marine biological choruses observed in tropical waters near Australia. Journal
of the Acoustical Society of America 64(3):736-743.
Caut, S., E. Guirlet, and M. Girondot. 2009. Effect of tidal overwash on the embryonic
development of leatherback turtles in French Guiana. Marine Environmental Research
69(4):254-261.
CDFG. 1965. California fish and wildlife plan. California Department of Fish and Game,
Sacramento, California.
CDFG. 1998. Report to the Fish and Game Commission: A status review of the spring-run
chinook salmon (Oncorhynchus tshawytscha) in the Sacramento River drainage.
California Department of Fish and Game 98-01.
CDFG. 2002. California Department of Fish and Game comments to NMFS regarding green
sturgeon listing. California Department of Fish and Game.
CDFG. 2008. Anadromous Fish Restoration Program, GRANDTAB Ssalmon data
http://www.delta.dfg.ca.gov/afrp/. U.S. Fish and Wildlife Service.
CDFW. 2013. Grandtab Spreadsheet of Adult Chinook Escapement in the Central Valley.
http://www.calfish.org/tabid/104/Default.aspx.
Cech Jr., J. J., and coauthors. 2000. Biological assessment of green sturgeon in the Sacramento-
San Joaquin watershed (phase 1). CALFED Bay-Delta Program.
Celewycz, A. G., E. A. Fergusson, J. H. Moss, and J. A. Orsi. 2014. High seas salmonid coded-
wire tag recovery data, 2013. N. NOAA, Alaska Fish. Sci. Cent., Auke Bay Laboratories,
Ted Stevens Marine Res. Institute, Northwest Fish. Sci. Cent., editor. North Pacific
Anadromous Fish Commission, Juneau, AK.
Cerchio, S., J. K. Jacobsen, D. M. Cholewiak, and E. A. Falcone. 2005. Reproduction of female
humpback whales off the Revillagigedo Archipelago during a severe El Niño event.
605
Biological Opinion and Conference Report on Navy NWTT Activities and NMFS’ MMPA Incidental Take Authorization PCTS FPR-2015-9110
Pages 55 in Sixteenth Biennial Conference on the Biology of Marine Mammals, San
Diego, California.
CETAP. 1982. A characterization of marine mammals and turtles in the mid- and north-Atlantic
areas of the U.S. Outer Continental Shelf. Cetacean and Turtle Assessment Program,
Bureau of Land Management, BLM/YL/TR-82/03, Washington, D.C.
Chaloupka, M., P. Dutton, and H. Nakano. 2004. Status of sea turtle stocks in the Pacific. Pages
135-164 in Expert Consultation on Interactions Between Sea Turtles and Fisheries within
an Ecosystem Context, volume FAO Fisheries Report. No. 738, Rome.
Chamberlin, J. W., A. N. Kagley, K. L. Fresh, and T. P. Quinn. 2011. Movements of Yearling
Chinook Salmon during the First Summer in Marine Waters of Hood Canal, Washington.
Transactions of the American Fisheries Society 140(2):429-439.
Chapman, C., and A. Hawkins. 1973. A field study of hearing in the cod, Gadus morhua L.
Journal of Comparative Psysiology 85:147-167.
Chapman, D. W., and T. C. Bjornn. 1969. Distribution of salmonids in streams, with special
reference to food and feeding. Pages 153-176 in T. G. Northcote, editor Symposium on
Salmon and Trout in Streams: H.R. MacMillan Lectures in Fisheries, . University of
British Columbia, Institute of Fisheries, Vancouver, British Columbia, Canada.
Chapman, N. R., and A. Price. 2011. Low frequency deep ocean ambient noise trend in the
Northeast Pacific Ocean. Journal of the Acoustical Society of America 129(5):EL161
EL165.
Charif, R. A., D. K. Mellinger, K. J. Dunsmore, K. M. Fristrup, and C. W. Clark. 2002.
Estimated source levels of fin whale (Balaenoptera physalus) vocalizations: Adjustments
for surface interference. Marine Mammal Science 18(1):81-98.
Chenillat, F., P. Riviere, X. Capet, P. J. S. Franks, and B. Blanke. 2013. California coastal
upwelling onset variability: Cross-shore and bottom-up propagation in the planktonic
ecosystem. PLoS ONE 8(5):e62281.
Chenillat, F., P. Riviere, X. Capet, E. D. Lorenzo, and B. Blanke. 2012. North Pacific Gyre
Oscillation modulates seasonal timing and ecosystem functioning in the California
Current upwelling system. Geophysical Research Letters 39.
Cherfas, J. 1989. The Hunting of the Whale. Viking Penguin Inc., New York, New York.
Chesney, D., and M. Knechtle. 2011. Shasta River Chinook and Coho Observations, 2010‐2011,
Siskiyou County, CA. California Department of Fish and Game, Klamath River Project,
Yreka, CA.
Cheung, W. W. L., R. D. Brodeur, T. A. Okey, and D. Pauly. 2015. Projecting future changes in
distributions of pelagic fish speciesof Northeast Pacific shelf seas. Progress in
Oceanography 130:19-31. dx.doi.org/10.1016/j.pocean.2014.09.003.
Chevalier, J., X. Desbois, and M. Girondot. 1999. The Reason of Decline of Leatherback Turtles
(Dermochelys coriacea) in French Guiana: a Hypothesis. Pages 79-87 in C. Miaud, and
R. Guyétant, editors. Current Studies in Herpetology SEH, Le Bourget du Lac.
Childers, A. R., T. E. Whitledge, and D. A. Stockwell. 2005. Seasonal and interannual variability
in the distribution of nutrients and chlorophyll a across the Gulf of Alaska shelf: 1998
2000. Deep-Sea Research II 52:193-216.
Christal, J., and H. Whitehead. 1997. Aggregations of mature male sperm whales on the
Galápagos Islands breeding ground. Marine Mammal Science 13(1):59-69.
Christal, J., H. Whitehead, and E. Lettevall. 1998. Sperm whale social units: Variation and
change. Canadian Journal of Zoology 76(8):1431-1440.
606
Biological Opinion and Conference Report on Navy NWTT Activities and NMFS’ MMPA Incidental Take Authorization PCTS FPR-2015-9110
Christiansen, F., D. Lusseau, E. Stensland, and P. Berggren. 2010. Effects of tourist boats on the
behaviour of Indo-Pacific bottlenose dolphins off the south coast of Zanzibar.
Endangered Species Research 11(1):91-99.
Christiansen, F., M. Rasmussen, and D. Lusseau. 2013. Whale watching disrupts feeding
activities of minke whales on a feeding ground. Marine Ecology Progress Series 478:239
251.
Christiansen, F., M. H. Rasmussen, and D. Lusseau. 2011. Whalewatching boats disrupt the
foraging activities of minke whales in Faxaflói bay, Iceland. Pages 61 in Nineteenth
Biennial Conference on the Biology of Marine Mammals, Tampa, Florida.
Chua, T. H. 1988. On the road to extinction: The leatherback turtle (Dermochelys coriacea) in
Terengganu, Malaysia. Pages 153-158 in A. Sasekumar, R. D'Cruz, and S. L. H. Lim,
editors. Eleventh Annual Seminar, Malaysian Society of Marine Sciences, Kuala
Lumpur, Malaysia.
Clapham, P. J. 1994. Maturational changes in patterns of association in male and female
humpback whales, Megaptera novaeangliae. Journal of Zoology 234(2):265-274.
Clapham, P. J. 1996. The social and reproductive biology of humpback whales: an ecological
perspective. Mammal Review 26:27-49.
Clapham, P. J., and coauthors. 2004a. Distribution of North Pacific right whales (Eubalaena
japonica) as shown by 19th and 20th century whaling catch and sighting records. Journal
of Cetacean Research and Management 6(1):1-6.
Clapham, P. J., and coauthors. 2004b. Distribution of North Pacific right whales (Eubalaena
japonica) as shown by 19th and 20th century whaling catch and sighting records. Journal
of Cetacean Research and Management 6(1):1-6.
Clapham, P. J., S. B. Young, and R. L. Brownell Jr. 1999. Baleen whales: conservation issues
and the status of the most endangered populations. Mammal Review 29(1):35-60.
Claridge, D., and J. Durban. 2009. Monitoring beaked whale movements during submarine
commanders course using satellite telemetry tags. Office of Naval Research.
Claridge, D. E. 2006. Fine-scale distribution and habitat selection of beaked whales. University
of Aberdeen, Scotland.
Claridge, D. E. 2013. Population ecology of Blainville's beaked whales (Mesoplodon
densirostris). University of St. Andrews.
Clark, C. 2006. Acoustic communication in the great whales: The medium and the message.
Presentation at the 86th Annual Conference of the American Society of Mammalogists.
Clark, C., and coauthors. 2009. Acoustic masking of baleen whale communications: Potential
impacts from anthropogenic sources. Pages 56 in Eighteenth Biennial Conference on the
Biology of Marine Mammals, Quebec City, Canada.
Clark, C. W., J. F. Borsani, and G. Notarbartolo-di-Sciara. 2002. Vocal activity of fin whales,
Balaenoptera physalus, in the Ligurian Sea. Marine Mammal Science 18(1):286-295.
Clark, C. W., and P. J. Clapham. 2004. Acoustic monitoring on a humpback whale (Megaptera
novaeangliae) feeding ground shows continual singing into late spring. Proceedings of
the Royal Society of London Series B Biological Sciences 271(1543):1051-1057.
Clark, C. W., and K. M. Fristrup. 2001. Baleen whale responses to low-frequency human-made
underwater sounds. Journal of the Acoustical Society of America 110(5 Part 2):2751.
Clark, C. W., and G. J. Gagnon. 2004. Low-frequency vocal behaviors of baleen whales in the
North Atlantic: Insights from Integrated Undersea Surveillance System detections,
607
Biological Opinion and Conference Report on Navy NWTT Activities and NMFS’ MMPA Incidental Take Authorization PCTS FPR-2015-9110
locations, and tracking from 1992 to 1996. Journal of Underwater Acoustics (USN)
52(3):48.
Clark, L. S., D. F. Cowan, and D. C. Pfeiffer. 2006. Morphological changes in the Atlantic
bottlenose dolphin (Tursiops truncatus) adrenal gland associated with chronic stress.
Journal of Comparative Pathology 135(4):208-216.
Clark, S. L., and J. W. Ward. 1943. The effects of rapid compression waves on animals
submerged in water. Surgery, Gynecology and Obstetrics 77:403-412.
Clarke, C. W., and R. A. Charif. 1998. Acoustic monitoring of large whales to the west of Britain
and Ireland using bottom mounted hydrophone arrays, October 1996-September 1997.
Clarke, J. T., and S. E. Moore. 2002. A note on observations of gray whales in the southern
Chukchi and northern Bering Seas, August-November, 1980-89. Journal of Cetacean
Research And Management 4(3):283-288.
Clarke, M. R. 1976. Observations on sperm whale diving. Journal of the Marine Biological
Association of the United Kingdom 56(3):809-810.
Clarke, M. R. 1986. Cephalopods in the diet of odontocetes. Research on Dolphins. M. M.
Bryden and R. J. Harrison (eds.). Oxford Univ. Press, Oxford, England. ISBN 0-19
857606-4. p.281-321.
Clarke, R. 1956a. A giant squid swallowed by a sperm whale. Proceedings of the Zoological
Society of London 126:645.
Clarke, R. 1956b. Marking whales from a helicopter. Proceedings of the Zoological Society of
London 126:646.
Clarke, R. 1980. Catches of sperm whales and whalebone whales in the southeast Pacific
between 1908 and 1975. Report of the International Whaling Commission 30:285-288.
Sc/31/Doc 26).
Clemens, W. A., and G. V. Wilby. 1961. Fishes of the Pacific Coast of Canada, Second edition,
volume 68. Fisheries Research Board of Canada.
CMC, and NMFS. 1988. Proceedings of a workshop to review and evaluate whale watching
programs and management needs. Center for Marine Conservation and National Marine
Fisheries Service, Monterey, California.
Cole, T. V. N., D. L. Hartley, and R. L. Merrick. 2005. Mortality and serious injury
determinations for large whales stocks along the eastern seaboard of the United States,
1999-2003. NOAA, NMFS, NEFSC.
Collard, S. B. 1990. The influence of oceanographic features on post-hatchling sea turtle
distribution and dispersion in the pelagic environment. Pages 111-114 in T. H.
Richardson, J. I. Richardson, and M. Donnelly, editors. Tenth Annual Workshop on Sea
Turtle Biology and Conservation.
Colway, C., and D. E. Stevenson. 2007. Confirmed records of two green sturgeon from the
Bering Sea and Gulf of Alaska. Northwestern Naturalist 88:188-192.
Commission, I. W. 2004. Report of the Workshop on the Western Gray Whale: Research and
Monitoring Needs, 22-25 October 2002, Ulsan, Korea. Journal of Cetacean Research And
Management 6(Supplement):487-500.
Commission, W. S. C. 2003. Salmon and steelhead habitat limiting factors: Water resource
inventory area 16 Dosewallips-Skokomish Basin.
Continental Shelf Associates Inc. 2004. Explosive removal of offshore structures. U.S.
Department of the Interior, Minerals Management Service, OCS MMS 2003-070, New
Orleans, Louisiana.
608
Biological Opinion and Conference Report on Navy NWTT Activities and NMFS’ MMPA Incidental Take
Authorization PCTS FPR-2015-9110
Coombs, C. I. 1979. Reef fishes near Depoe Bay, Oregon: Movement and the recreational
fishery. Oregon State University.
Coombs, S., and J. C. Montgomery. 1999. The enigmatic lateral line system Pages 319-362 in
A. N. Popper, and R.R.Fay, editors. Comparative Hearing: Fishes and Amphibians
volume Springer Handbook of Auditory Research V.11. Springer-Verlag, N.Y.
Corkeron, P. J. 1995. Humpback whales (Megaptera novaeangliae) in Hervey Bay, Queensland:
Behaviour and responses to whale-watching vessels. Canadian Journal of Zoology
73(7):1290-1299.
Corwith, H. L., and P. A. Wheeler. 2002. El Niño related variations in nutrient and chlorophyll
distributions off Oregon. Progress in Oceanography 54:361-380.
COSEWIC. 2002. COSEWIC assessment and update status report on the blue whale
Balaenoptera musculus (Atlantic population, Pacific population) in Canada.vi + 32.
COSEWIC. in press. COSEWIC assessment and status report on the canary rockfish Sebastes
pinniger in Canada. Committee on the Status of Endangered Wildlife in Canada, Ottawa,
Canada.
Costa, D. P. 1993. The relationship between reproductive and foraging energetics and the
evolution of the Pinnipedia. Pages 293-314 in I. L. Boyd, editor. Marine Mammals
Advances in Behavioural and Population Biology. Oxford University Press, New York.
Costa, D. P., and coauthors. 2003. The effect of a low-frequency sound source (acoustic
thermometry of the ocean climate) on the diving behavior of juvenile northern elephant
seals, Mirounga angustirostris. Journal of the Acoustical Society of America
113(2):1155-1165.
Costa, D. P., and coauthors. 1998. Response of elephant seals to ATOC sound transmissions.
The World Marine Mammal Science Conference, 20-24 January Monaco. p.29. (=Twelth
Biennial Conference on the Biology of Marine Mammals).
Coulson, T., and coauthors. 2006. Estimating individual contributions to population growth:
Evolutionary fitness in ecological time. Proceedings of the Royal Society Biological
Sciences Series B 273:547-555.
Cowan, D. E., and B. E. Curry. 2008. Histopathology of the alarm reaction in small odontocetes.
Journal of Comparative Pathology 139(1):24-33.
Cox, T. M., and coauthors. 2006. Understanding the impacts of anthropogenic sound on beaked
whales. Journal of Cetacean Research and Management 7(3):177-187.
Craig, J. C., and C. W. Hearn. 1998. Physical impacts of explosions on marine mammals and
turtles. Pages 43 in D. o. t. Navy, editor. Final Environmental Impact Statement, Shock
Testing the SEAWOLF Submarine. U.S. Department of the Navy, Southern Division,
Naval Facilities Engineering Command, North Charleston, South Carolina.
Craig Jr., J. C. 2001a. Appendix D, physical impacts of explosions on marine mammals and
turtles. Final Environmental Impact Statement, Shock Trial of the Winston Churchill
(DDG 81). U.S. Department of the Navy, Naval Sea Systems Command.
Craig Jr., J. C. 2001b. Appendix D, Physical Impacts of Explosions on Marine Mammals and
Turtles. Final Environmental Impact Statement, Shock Trial of the WINSTON
CHURCHILL (DDG 81). Department of the Navy, Naval Sea Systems Command
(NAVSEA), Department of the Navy, Naval Sea Systems Command (NAVSEA).
Craig Jr., J. C., and C. W. Hearn. 1998. Appendix D. Physical impacts of explosions on marine
mammals and turtles. Final Environmental Impact Statement on Shock Testing of the
Seawolf Submarine. Department of the Navy, North Charleston, South Carolina.
609
Biological Opinion and Conference Report on Navy NWTT Activities and NMFS’ MMPA Incidental Take Authorization PCTS FPR-2015-9110
Craig Jr., J. C., and K. W. Rye. 2008. Appendix D: Criteria and thresholds for injury. Shock
Trial of the Mesa Verde (LPD 19). U.S. Navy, Chief of Naval Operations, Arlington,
Virginia.
Cranford, T. W. 1992. Functional morphology of the odontocete forehead: implications for
sound generation. University of California at Santa Cruz, Santa Cruz, California.
Cranford, T. W., and P. Krysl. 2015. Fin whale sound reception mechanisms: Skull vibration
enables low-frequency hearing. PLoS ONE 10(1):e116222.
Crawford, J. D., and X. Huang. 1999. Communication signals and sound production mechanisms
of mormyrid electric fish. Journal of Experimental Biology 202:1417-1426.
Croll, D., and coauthors. 1999a. From wind to whales: Foraging ecology of rorquals in the
California Current. Thirteen Biennial Conference on the Biology of Marine Mammals, 28
November - 3 December Wailea Maui HI. p.41.
Croll, D. A., A. Acevedo-Gutierrez, B. R. Tershy, and J. Urban-Ramirez. 2001a. The diving
behavior of blue and fin whales: is dive duration shorter than expected based on oxygen
stores? Comparative Biochemistry and Physiology a-Molecular & Integrative Physiology
129(4):797-809.
Croll, D. A., and coauthors. 2002. Only male fin whales sing loud songs. Nature 417:809.
Croll, D. A., C. W. Clark, J. Calambokidis, W. T. Ellison, and B. R. Tershy. 2001b. Effect of
anthropogenic low-frequency noise on the foraging ecology of Balaenoptera whales.
Animal Conservation 4(1):13-27.
Croll, D. A., C. W. Clark, J. Calambokidis, W. T. Ellison, and B. R. Tershy. 2001c. Effect of
anthropogenic low-frequency noise on the foraging ecology of Balaenoptera whales.
Animal Conservation 4(1):13-27.
Croll, D. A., B. R. Tershy, A. Acevedo, and P. Levin. 1999b. Marine vertebrates and low
frequency sound. Marine Mammal and Seabird Ecology Group, Institute of Marine
Sciences, University of California Santa Cruz.
Croll, D. A., B. R. Tershy, A. Acevedo, and P. Levin. 1999c. Marine vertebrates and low
frequency sound. Technical report for LFA EIS, 28 February 1999. Marine Mammal
and Seabird Ecology Group, Institute of Marine Sciences, University of California Santa
Cruz. 437p.
Crowley, T. J. 2000. Causes of climate change over the past 1000 years. Science 289(5477):270
277.
Crum, L. A., and coauthors. 2005. Monitoring bubble growth in supersaturated blood and tissue
ex vivo and the relevance to marine mammal bioeffects. Acoustics Research Letters
Online 6(3):214-220.
Crum, L. A., and Y. Mao. 1996. Acoustically enhanced bubble growth at low frequencies and its
implications for human diver and marine mammal safety. Journal of the Acoustical
Society of America 99(5):2898-2907.
Culik, B. M. 2004. Review of small cetaceans. Distribution, behaviour, migration and threats.
United Nations Environment Programme.
Culik, B. M., S. Koschinski, N. Tregenza, and G. Ellis. 2001. Reactions of harbor porpoises
Phocoena phocoena and herring Clupea harengus to acoustic alarms. Marine Ecology
Progress Series 211:255-260.
Cummings, W. C., and P. O. Thompson. 1971. Underwater sounds from the blue whale,
Balaenoptera musculus. Journal of the Acoustical Society of America 50(4B):1193-1198.
610
Biological Opinion and Conference Report on Navy NWTT Activities and NMFS’ MMPA Incidental Take Authorization PCTS FPR-2015-9110
Cummings, W. C., and P. O. Thompson. 1994. Characteristics and seasons of blue and finback
whale sounds along the U.S. west coast as recorded at SOSUS stations. Journal of the
Acoustical Society of America 95:2853.
Cunningham, C. J., M. G. Courage, T. P. Quinn, and D. Reznick. 2013. Selecting for the
phenotypic optimum: Size-related trade-offs between mortality risk and reproductive
output in female sockeye salmon. Functional Ecology 27(5):1233-1243.
Curran, M. A. J., T. D. V. Ommen, V. I. Morgan, K. L. Phillips, and A. S. Palmer. 2003. Ice core
evidence for Antarctic sea ice decline since the 1950s. Science 302(5648):1203-1206.
Currens, K. P., and coauthors. 2009. Identification of an independent population of sockeye
salmon in Lake Ozette, Washington. U.S. Department of Commerce, NOAA Technical
Memorandum NMFS-NWFSC-96, 18 p.
D'Vincent, C. G., R. M. Nilson, and R. E. Hanna. 1985a. Vocalization and coordinated feeding
behavior of the humpback whale in southeastern Alaska. Scientific Reports of the Whales
Research Institute 36:41-47.
D'Vincent, C. G., R. M. Nilson, and R. E. Hanna. 1985b. Vocalization and coordinated feeding
behavior of the humpback whale in southeastern Alaska. Scientific Reports of the Whales
Research Institute 36:41-47.
D’Spain, G. L., and H. H. Batchelor. 2006. Observations of biological choruses in the Southern
California Bight: A chorus at midfrequencies. Journal of the Acoustical Society of
America 120(4):1942.
Dahlheim, M. E., and J. E. Heyning. 1999. Killer whale Orcinus orca (Linnaeus, 1758). Pages
281-322 in S. Ridgway, and R. Harrison, editors. Handbook of Marine Mammals.
Academic Press, San Diego, California.
Dahlheim, M. E., J. M. Waite, and P. A. White. 2009. Cetaceans of southeast Alaska:
Distribution and seasonal occurrence. U.S. Department of Commerce, Lincoln, Nebraska.
Daly, E. A., and coauthors. 2014. Juvenile Steelhead Distribution, Migration, Feeding, and
Growth in the Columbia River Estuary, Plume, and Coastal Waters. Marine and Coastal
Fisheries: Dynamics, Management, and Ecosystem Science 6(1):62-80.
Danil, K., and S. J. Chivers. 2005. Habitat-based spatial and temporal variability of life history
characteristics of female common dolphins (Delphinus delphis) in the eastern tropical
Pacific. Pages 67 in Sixteenth Biennial Conference on the Biology of Marine Mammals,
San Diego, California.
Danil, K., and J. A. St. Leger. 2011. Seabird and dolphin mortality associated with underwater
detonation exercises. Marine Technology Society Journal 45(6):89-95.
Danilewicz, D., M. Tavares, I. B. Moreno, P. H. Ott, and C. C. Trigo. 2009. Evidence of feeding
by the humpback whale (Megaptera novaeangliae) in mid-latitude waters of the western
South Atlantic. JMBA2 - Biodiversity Records-Published Online 3Pgs.
Dark, T. A., M. E. Wilkins, and K. Edwards. 1983. Bottom trawl survey of canary rockfish
(Sebastes pinninger), yellowtail rockfish (S. flavidus), bocaccio (S. paucispinis), and
chilipepper (S. goodei) off Washington-California, 1980. NMFS, NWFSC and Alaska
Fisheries Center, Seattle, Washington.
Darling, J. D., and S. Cerchio. 1993. Movement of a Humpback Whale (Megaptera-
Novaeangliae) between Japan and Hawaii. Marine Mammal Science 9(1):84-89.
Darling, J. D., and H. Morowitz. 1986. Census of Hawaiian humpback whales (Megaptera
novaeangliae) by individual identification. Canadian Journal of Zoology 64(1):105-111.
611
Biological Opinion and Conference Report on Navy NWTT Activities and NMFS’ MMPA Incidental Take
Authorization PCTS FPR-2015-9110
Davenport, J., and G. H. Balazs. 1991. 'Fiery bodies' - Are pyrosomas an important component
of the diet of leatherback turtles? British Herpetological Society Bulletin 37:33-38.
David, L. 2002. Disturbance to Mediterranean cetaceans caused by vessel traffic. Cetaceans of
the Mediterranean and Black Seas: State of Knowledge and Conservation Strategies. G.
Notarbartolo de Sciara (ed.). Section 11. 21pp. A report to the ACCOBAMS Secretariat,
Monaco, February.
Davis, R. W., W. E. Evans, and B. Würsig. 2000. Cetaceans, Sea Turtles and Seabirds in the
Northern Gulf of Mexico: Distribution, Abundance and Habitat Associations. Volume II:
Technical Report. Texas A&M, OCS Study MMS 2000-03, Galveston.
Davis, R. W., and coauthors. 2007. Diving behavior of sperm whales in relation to behavior of a
major prey species, the jumbo squid, in the Gulf of California, Mexico. Marine Ecology
Progress Series 333:291-302.
Davis, R. W., and coauthors. 2002. Cetacean habitat in the northern oceanic Gulf of Mexico.
Deep-Sea Research Part I-Oceanographic Research Papers 49(1):121-142.
De Stephanis, R., and E. Urquiola. 2006. Collisions between ships and cetaceans in Spain.
International Whaling Commission Scientific Committee, St. Kitts and Nevis, West
Indies.
Debich, A. J., and coauthors. 2013. Passive acoustic monitoring for marine mammals in the Gulf
of Alaska temporary maritime activities area 2012-2013. University of California San
Diego, Scripps Institution of Oceanography, Marine Physical Laboratory, La Jolla,
California.
Deecke, V. B., P. J. B. Slater, and J. K. B. Ford. 2002. Selective habituation shapes acoustic
predator recognition in harbour seals. Nature 417(6912):171-173.
DeLacy, A. C., C. R. Hitz, and R. L. Dryfoos. 1964. Maturation, gestation, and birth of rockfish
(Sebastodes) from Washington and adjacent waters. Washington Department of
Fisheries.
Delacy, A. C., B. S. Miller, and S. F. Borton. 1972. Checklist of Puget Sound fishes. University
of Washington, Seattle, Washington.
DeMott, G. E. 1983. Movement of tagged lingcod and rockfishes off Depoe Bay, Oregon.
Oregon State University.
Deng, X. 2000. Artificial reproduction and early life stages of the green surgeon (Acipenser
medirostris). dissertation. University of California, Davis.
Dennison, S., and coauthors. 2011. Bubbles in live-stranded dolphins. Proceedings of the Royal
Society Biological Sciences Series B.
Deruiter, S. L., and coauthors. 2013a. Delphinid whistle production and call matching during
playback of simulated military sonar. Marine Mammal Science 29(2):E46-E59.
DeRuiter, S. L., and K. Larbi Doukara. 2012. Loggerhead turtles dive in response to airgun
sound exposure. Endangered Species Research 16(1):55-63.
Deruiter, S. L., and coauthors. 2013b. First direct measurements of behavioural responses by
Cuvier's beaked whales to mid-frequency active sonar. Biology Letters 9(4):Article
20130223.
Dey, D. B. 2012. Estimation of Percentages for Listed Pacific Salmon and Steelhead Smolts
Arriving at Various Locations in the Columbia River Basin in 2011, NOAA Fisheries
memo to J.J. Lecky, March 6, 2012.
Di Lorenzo, E., and coauthors. 2008. North Pacific Gyre Oscillation links ocean climate and
ecosystem change. Geophysical Research Letters 35.
612
Biological Opinion and Conference Report on Navy NWTT Activities and NMFS’ MMPA Incidental Take Authorization PCTS FPR-2015-9110
Di Lorio, L., and C. W. Clark. 2010. Exposure to seismic survey alters blue whale acoustic
communication. Biology Letters 6(1):51-54.
Dohl, T. P. 1983. Return of the humpback whale (Megaptera novaeangliae) to central California.
Fifth Biennial Conference on the Biology of Marine Mammals, 27 November-1
December New England Aquarium Boston MA. p.23-24.
Dohl, T. P., R. C. Guess, M. L. Duman, and R. C. Helm. 1983. Cetaceans of central and northern
California, 1980-83: Status, abundance, and distribution. Minerals Management Service,
Contract No. 14-12-0001-29090.
Doksaeter, L., and coauthors. 2009. Behavioral responses of herring (Clupea harengus) to 1–2
and 6–7 kHz sonar signals and killer whale feeding sounds. Journal of the Acoustical
Society of America 125(1):554-564.
Doksaeter, L., N. O. Handegard, O. R. Godo, P. H. Kvadsheim, and N. Nordlund. 2012.
Behavior of captive herring exposed to naval sonar transmissions (10–16 kHz)
throughout a yearly cycle. Journal of the Acoustical Society of America 131(2):1632
1642.
Dolphin, W. F. 1987. Ventilation and dive patterns of humpback whales, Megaptera
novaeangliae, on their Alaskan feeding grounds. Canadian Journal of Zoology 65(1):83
90.
DoN. 1991. Environmental Assessment for the Naval Sonobuoy Testing in Southeast Alaska.
Naval Avionics Center, U.S. Navy.
DoN. 1998. Final environmental impact statement, shock-testing the SEAWOLF submarine.
Department of the Navy, Washington, DC.
DoN. 2001. Airborne mine neutralization system (AMNS) inert target tests: Environmental
assessment and overseas environmental assessment. U.S. Department of the Navy,
Coastal Systems Station, Panama City, Florida.
DON. 2004. Report on the results of the inquiry into allegations of marine mammal impacts
surrounding the use of active sonar by USS Shoup (DDG 86) in the Haro Strait on or
about 5 May 2003.
DoN. 2006. Archival search report for certain Northeast Range Complex Training/Testing
ranges: Small point mining range, ex-salmon site and the Tomahawk missile recovery
site at Ralph Odom Survival Training Facility. U.S. Department of the Navy, Norfolk,
Virginia.
DoN. 2011. Annual range complex monitoring report- year 1, 12 November 2010 to 01 May
2011 for the U.S. Navy’s Northwest Training Range Complex. Department of the Navy.
DoN. 2012a. Annual range complex monitoring report- year 2 from 2 May 2011 to 1 May 2012
for the U.S. Navy’s Northwest Training Range Complex. Department of the Navy.
DON. 2012b. Commander Task Force 20, 4th, and 6th Fleet Navy marine species density
database: Technical report. Department of the Navy, Norfolk, Virginia.
DoN. 2013a. Annual range complex monitoring report- year 3 from 2 May 2012 to 1 May 2013
for the U.S. Navy’s Northwest Training Range Complex. Department of the Navy.
DoN. 2013b. Marine mammal strandings associated with U.S. Navy sonar activities. Department
of the Navy, Space and Naval Warfare Systems Center Pacific, San Diego, California.
DoN. 2013c. Marine species monitoring report for the U.S. Navy’s Northwest Training Range
Complex- annual report 2013. Department of the Navy, U.S. Pacific Fleet, Pearl Harbor,
Hawaii.
613

Biological Opinion and Conference Report on Navy NWTT Activities and NMFS’ MMPA Incidental Take Authorization PCTS FPR-2015-9110
DoN. 2015a. Mariana Islands Training and Testing Activities Final Environmental Impact
Statement/Overseas Environmental Impact Statement. Naval Facilities Command,
Pacific, Pearl Harbor, HI.
DoN. 2015b. Northwest Training and Testing Activities Final Environmental Impact
Statement/Overseas Environmental Impact Statement. N. Naval Facilities Engineering
Command, EV21.KK, editor, Silverdale, WA.
DoN. 2015c. Northwest Training and Testing Biological Evaluation to Support Endangered
Species Act Section 7 Consultation with the National Marine Fisheries Service.
Doney, S. C., and coauthors. 2012a. Climate change impacts on marine ecosystems. Marine
Science 4.
Doney, S. C., and coauthors. 2012b. Climate change impacts on marine ecosystems. Annual
Reviews in Marine Science 4.
Donnelly, R. F., and R. L. Burr. 1995. Relative abundance and distribution of Puget Sound trawl-
caught demersal fishes. Pages 1,038 in Puget Sound Research.
Donovan, G. P. 1984. Blue whales off Peru, December 1982, with special reference to pygmy
blue whales. (Balaenoptera musculus). Report of the International Whaling Commission
34:473-476.-Sc/35/Ps27).
Donovan, G. P. 1991. A review of IWC stock boundaries. Report of the International Whaling
Commission (Special Issue 13).
Dorn, M. W. 2002. Advice on west coast rockfish harvest rates from Bayesian meta-analysis of
stock-recruit relationships. North American Journal of Fisheries Management 22:280
300.
Dorne, J. L. C. M., and A. G. Renwick. 2005. The refinement of uncertainty/safety factors in risk
assessment by the incorporation of data on toxicokinetic variability in humans.
Toxicological Sciences 86(1):20-26.
Douglas, A. B., and coauthors. 2008a. Incidence of ship strikes of large whales in Washington
State. Journal of the Marine Biological Association of the United Kingdom 88(06):1121
1132.
Douglas, A. B., and coauthors. 2008b. Incidence of ship strikes of large whales in Washington
State. Journal of the Marine Biological Association of the United Kingdom.
Douglas, A. B., and coauthors. 2008c. Incidence of ship strikes of large whales in Washington
State. Journal of the Marine Biological Association of the United Kingdom 88(6):1121
1132.
Dow Piniak, W. E., D. A. Mann, S. A. Eckert, and C. A. Harms. 2012. Amphibious hearing in
sea turtles. Pages 83-87 in Advances in Experimental Medicine and Biology. Springer.
Doyle, L. R., and coauthors. 2008. Applicability of information theory to the quantification of
responses to anthropogenic noise by southeast Alaskan humpback whales. Entropy
10(2):33-46.
Drake, J. M., and B. D. Griffen. 2010. Early warning signals of extinction in deteriorating
environments. Nature 467(7314):456-459.
Drake, J. S., and coauthors. 2010. Status of five species of rockfish in Puget Sound, Washington:
Bocaccio (Sebastes paucispinis), Canary Rockfish (Sebastes pinniger), Yelloweye
Rockfish (Sebastes ruberrimus), Greenstriped Rockfish (Sebastes elongatus) and
Redstripe Rockfish (Sebastes proriger). Pages 234 in N. T. M. U.S. Department of
Commerce, editor, NMFS-NWFSC.
614
Biological Opinion and Conference Report on Navy NWTT Activities and NMFS’ MMPA Incidental Take
Authorization PCTS FPR-2015-9110
DSTL. 2007. Observations of marine mammal behaviour in response of active sonar. Ministry of
Defence, Defense Science and Technology Laboratory.
Dufault, S., H. Whitehead, and M. Dillon. 1999. An examination of the current knowledge on the
stock structure of sperm whales (Physeter macrocephalus) worldwide. Journal of
Cetacean Research and Management 1:1-10.
Duffy, E. J., D. A. Beauchamp, R. M. Sweeting, R. J. Beamish, and J. S. Brennan. 2010a.
Ontogenetic diet shifts of juvenile Chinook salmon in nearshore and offshore habitats of
Puget Sound. Transactions of American Fisheries Society 139:803-823.
Duffy, E. J., D. A. Beauchamp, R. M. Sweeting, R. J. Beamish, and J. S. Brennan. 2010b.
Ontogenetic diet shifts of juvenile Chinook salmon in nearshore and offshore habitats of
Puget Sound. Transactions of the American Fisheries Society 139:803-823.
Dumbauld, B. R., D. L. Holden, and O. P. Langness. 2008. Do sturgeon limit burrowing shrimp
populations in Pacific Northwest Estuaries? Environmental Bioology of Fishes 83:283
296.
Dunlop, R. A., D. H. Cato, and M. J. Noad. 2008. Non-song acoustic communication in
migrating humpback whales (Megaptera novaeangliae). Marine Mammal Science
24(3):613-629.
Dunlop, R. A., D. H. Cato, and M. J. Noad. 2014. Evidence of a Lombard response in migrating
humpback whales (Megaptera novaeangliae). Journal of the Acoustical Society of
America 136(1):430-437.
Dutton, D. L., P. H. Dutton, M. Chaloupka, and R. H. Boulon. 2005. Increase of a Caribbean
leatherback turtle Dermochelys coriacea nesting population linked to long-term nest
protection. Biological Conservation 126(2):186-194.
Dutton, P. H. 2006. Geographic variation in foraging strategies of leatherback populations: A
hedge against catastrophy? Pages 189 in Twenty-Sixth Annual Conference on Sea Turtle
Conservation and Biology.
Dutton, P. H., G. H. Balazs, and A. E. Dizon. 1998. Genetic stock identification of sea turtles
caught in the Hawaii-based pelagic longline fishery. Pages 45-46 in S. P. Epperly, and J.
Braun, editors. Seventeenth Annual Sea Turtle Symposium.
Dutton, P. H., S. R. Benson, and S. A. Eckert. 2006. Identifying origins of leatherback turtles
from Pacific foraging grounds off Central California, USA. Pages 228 in N. J. Pilcher,
editor Proceedings of the Twenty-third Annual Symposium on Sea Turtle Biology and
Conservation.
Dutton, P. H., B. W. Bowen, D. W. Owens, A. Barragan, and S. K. Davis. 1999. Global
phylogeography of the leatherback turtle (Dermochelys coriacea). Journal of Zoology
248:397-409.
Dutton, P. H., S. K. Davis, T. Guerra, and D. Owens. 1996. Molecular phylogeny for marine
turtles based on sequences of the ND4-leucine tRNA and control regions of
mitochondrial DNA. Molecular Phylogenetics and Evolution 5(3):511-521.
Dutton, P. H., and coauthors. 2007. Status and genetic structure of nesting populations of
leatherback turtles (Dermochelys coriacea) in the western Pacific. Chelonian
Conservation and Biology 6(1):47-53.
Dutton, P. H., S. Roden, L. M. Galver, and G. Hughes. 2003. Genetic population structure of
leatherbacks in the Atlantic elucidated by microsatellite markers. Pages 44-45 in J. A.
Seminoff, editor Proceedings of the Twenty-second Annual Symposium on Sea Turtle
Biology and Conservation.
615
Biological Opinion and Conference Report on Navy NWTT Activities and NMFS’ MMPA Incidental Take
Authorization PCTS FPR-2015-9110
Dzwilewski, P. T., and G. Fenton. 2002. Shock wave/sound propagation modeling results for
calculating marine protected species impact zones during explosive removal of offshore
structures. Minerals Management Service, New Orleans, Louisiana.
Ebbert, J. C., S. S. Embrey, R. W. Black, A. J. Tesoriero, and A. L. Haggland. 2000. Water
Quality in the Puget Sound Basin, Washington and British Columbia, 1996–98, volume
1216. U.S. Geological Survey, Tacoma, Washington.
Echeverria, T. W. 1987. Thirty-four species of California rockfishes: maturity and seasonality of
reproduction. Fisheries Bulletin 85(2):229-250.
Eckert, K. L. 1987. Environmental unpredictability and leatherback sea turtle (Dermochelys
coriacea) nest loss. Herpetologica 43(3):315-323.
Eckert, K. L. 1993a. The biology and population status of marine turtles in the North Pacific
Ocean. National Oceanic and Atmospheric Administration, National Marine Fisheries
Service, Southwest Fisheries Science Center, NOM-TM-NM FS-S W FSC-186,
Honolulu, HI.
Eckert, K. L. 1993b. The biology and population status of marine turtles in the North Pacific
Ocean. U.S. Department of Commerce, National Oceanic and Atmospheric
Administration, National Marine Fisheries Service.
Eckert, S. A. 2002. Distribution of juvenile leatherback sea turtle Dermochelys coriacea
sightings. Marine Ecology Progress Series 230:289-293.
Eckert, S. A., K. L. Eckert, P. Ponganis, and G. L. Kooyman. 1989a. Diving and foraging
behavior of leatherback sea turtles (Dermochelys coriacea). Canadian Journal of Zoology
67:2834-2840.
Eckert, S. A., K. L. Eckert, and T. H. Richardson. 1989b. Proceedings of the Ninth Annual
Workshop on Sea Turtle Conservation and Biology. U.S. Department of Commerce,
NMFS-SEFC-232.
Eckert, S. A., J. Gearhart, and P. Lewis. 2007. Experiment to evaluate the target catch and
bycatch reduction effectiveness of surface and mid-water drift gillnets in Trinidad.
National Marine Fisheries Service, NOAA-NMFS-PO DG133F06SE5011.
Eckert, S. A., H.-C. Liew, K. L. Eckert, and E.-H. Chan. 1996. Shallow water diving by
leatherback turtles in the South China Sea. Chelonian Conservation and Biology
2(2):237-243.
Eckert, S. A., and L. Sarti. 1997. Distant fisheries implicated in the loss of the world's largest
leatherback nesting population. Marine Turtle Newsletter 78:2-7.
Edds-Walton, P. L. 1997. Acoustic communication signals of mysticete whales. Bioacoustics-the
International Journal of Animal Sound and Its Recording 8:47-60.
Edds-Walton, P. L., and J. Finneran. 2006. Evaluation of evidence for altered behavior and
auditory deficits in fishes due to human-generated noise sources. Department of the
Navy, SSC San Diego, San Diego, California.
Edds, P. L. 1988. Characteristics of finback Balaenoptera physalus vocalizations in the St.
Lawrence estuary. Bioacoustics 1:131-149.
Edds, P. L., and J. A. F. Macfarlane. 1987. Occurrence and general behavior of balaenopterid
cetaceans summering in the St. Lawrence Estuary, Canada. Canadian Journal of Zoology
65(6):1363-1376.
Efroymson, R. A., W. H. Rose, S. Nemeth, and G. W. Suter II. 2000. Ecological risk assessment
framework for low-altitude overflights by fixed-wing and rotary-wing military aircraft.
Oak Ridge National Laboratory, Oak Ridge, Tennessee.
616
Biological Opinion and Conference Report on Navy NWTT Activities and NMFS’ MMPA Incidental Take Authorization PCTS FPR-2015-9110
Eisenhardt, E. P. 2013. 2012 Soundwatch program annual contract report. Soundwatch Public
Outreach/Boater Education.
Eldredge, L. G. 1991. Annotated checklist of the marine mammals of Micronesia. Micronesica
24(2):217-230.
Eldredge, L. G. 2003. The marine reptiles and mammals of Guam. Micronesica 35(36):653-660.
Eldridge, M. B., E. C. Norton, B. M. Jarvis, and R. B. MacFarlane. 2002. Energetics of early
development in the viviparous yellowtail rockfish. Journal of Fish Biology 61(5):1122
1134.
Elfes, C. T., and coauthors. 2010. Geographic variation of persistent organic pollutant levels in
humpback whale (Megaptera novaeangliae) feeding areas of the North Pacific and North
Atlantic. Environmental Toxicology and Chemistry 29(4):824-834.
Ellison, W. T., B. L. Southall, C. W. Clark, and A. S. Frankel. 2011. A new context-based
approach to assess marine mammal behavioral responses to anthropogenic sounds.
Conservation Biology.
Ellison, W. T., B. L. Southall, C. W. Clark, and A. S. Frankel. 2012. A new context-based
approach to assess marine mammal behavioral responses to anthropogenic sounds.
Conservation Biology 26(1):21-28.
Emery, B. M., L. Washburn, M. S. Love, M. M. Hishimoto, and J. C. Ohlmann. 2006. Do oil and
gas platforms off California reduce recruitment of bocaccio (Sebastes paucispinis) to
natural habitat? An analysis based on trajectories derived from high-frequency radar.
Fishery Bulletin 104(3):391-400.
Emmett, R. L., S. L. Stone, S. A. Hinton, and M. E. Monaco. 1991a. Distribution and abundance
of fishes and invertebrates in West Coast estuaries. National Oceanic and Atmospheric
Administration, National Ocean Service, Strategic Environmental Assessments Division,
Rockville, Maryland.
Emmett, R. L., S. L. Stone, S. A. Hinton, and M. E. Monaco. 1991b. Distribution and abundance
of fishes and invertebrates in West Coast estuaries. Vol. 11: Species life history
summaries. National Oceanic and Atmospheric Administration, National Ocean Service,
Strategic Environmental Assessments Division, Rockville, Maryland.
Engås, A., and S. Løkkeborg. 2002. Effects of seismic shooting and vessel-generated noise on
fish behaviour and catch rates. Bioacoustics 12:313-315.
Engås, A., S. Løkkeborg, E. Ona, and A. V. Soldal. 1996. Effects of seismic shooting on local
abundance and catch rates of cod (Gadus morhua) and haddock (Melanogrammus
aeglefinus). Canadian Journal of Fisheries and Aquatic Sciences 53:2238-2249.
Engelhard, G. H., S. M. J. M. Brasseur, A. J. Hall, H. R. Burton, and P. J. H. Reijnders. 2002.
Adrenocortical responsiveness in southern elephant seal mothers and pups during
lactation and the effect of scientific handling. Journal of Comparative Physiology B
Biochemical Systemic and Environmental Physiology 172(4):315-328.
Enger, P. S. 1981. Frequency discrimination in teleosts-central or peripheral?, New York, Spring
Verlag.
Erbe, C. 2000. Detection of whale calls in noise: Performance comparison between a beluga
whale, human listeners, and a neural network. Journal of the Acoustical Society of
America 108(1):297-303.
Erbe, C. 2002a. Hearing abilities of baleen whales. Defence R&D Canada – Atlantic report CR
2002-065. Contract Number: W7707-01-0828. 40pp.
617
Biological Opinion and Conference Report on Navy NWTT Activities and NMFS’ MMPA Incidental Take Authorization PCTS FPR-2015-9110
Erbe, C. 2002b. Underwater noise of whale-watching boats and potential effects on killer whales
(Orcinus orca), based on an acoustic impact model. Marine Mammal Science 18(2):394
418.
Erbe, C., A. MacGillivray, and R. Williams. 2012. Mapping cumulative noise from shipping to
inform marine spatial planning. Journal of the Acoustical Society of America
132(5):EL423-EL428.
Erbe, C., R. Williams, D. Sandilands, and E. Ashe. 2014. Identifying modeled ship noise
hotspots for marine mammals of Canada's Pacific region. PLoS ONE 9(3):e89820.
Erickson, D. L., and J. E. Hightower. 2007. Oceanic distribution and behavior of green sturgeon.
American Fisheries Society Symposium 56:197-211.
Erickson, D. L., J. A. North, J. E. Hightower, J. Webb, and L. Lauck. 2001. Movement and
habitat use of green sturgeon Acipenser medirostris in the Rogue River, Oregon.
Unpublished draft.
Erickson, D. L., and A. H. Webb. 2007a. Spawning periodicity, spawning migration, and size at
maturity of green sturgeon, Acipenser medirostris, in the Rogue River, Oregon.
Environmental Biology of Fishes 79(3-4):255-268.
Erickson, D. L., and M. A. H. Webb. 2007b. Spawning periodicity, spawning migration, and size
at maturity of green sturgeon, Acipenser medirostris, in the Rogue River, Oregon.
Environmental Biology of Fishes 79:255-268.
Eschmeyer, W. N., E. S. Herald, and H. Hammann. 1983. A Field Guide to Pacific Coast Fishes
of North America. Houghton Mifflin Company, Boston, Massachusetts.
Eskesen, G., and coauthors. 2009. Stress level in wild harbour porpoises (Phocoena phocoena)
during satellite tagging measured by respiration, heart rate and cortisol. Journal of the
Marine Biological Association of the United Kingdom 89(5):885-892.
Etnier, M. A. 2002. Occurrences of Guadalupe fur seals (Arctocephalus townsend) on the
Washington coast over the past 500 years. Marine Mammal Science 18(2):551-557.
Ettlinger, E., M. Horwitz, B. Schleifer, and G. M. Andrew. 2012. Lagunitas Creek spawner
survey report 2011-2012. Marin Municipal Water District (MMWD), Corte Madera,
California.
Evans, K., M. Hindell, and G. Hince. 2004. Concentrations of organochlorines in sperm whales
(Physeter macrocephalus) from Southern Australian waters. Marine Pollution Bulletin
48:486-503.
Evans, P. G. H., P. J. Canwell, and E. Lewis. 1992. An experimental study of the effects of
pleasure craft noise upon bottle-nosed dolphins in Cardigan Bay, West Wales. European
Research on Cetaceans 6:43-46. Proceedings of the Sixth Annual Conference of the
European Cetacean Society, San Remo, Italy, 20-22 February.
Evans, P. G. H., and coauthors. 1994. A study of the reactions of harbour porpoises to various
boats in the coastal waters of southeast Shetland. European Research on Cetaceans 8:60
64.
Evans, P. G. H., and L. A. Miller. 2004. Proceedings of the Workshop on Active Sonar and
Cetaceans. Workshop on Active Sonar and Cetaceans, Las Palmas, Gran Canaria.
Everest, F. H. 1972. Habitat selection and spatial interaction by juvenile chinook salmon and
steelhead trout in two Idaho streams. Journal of the Fisheries Research Board of Canada
29(1):91-100.
618
Biological Opinion and Conference Report on Navy NWTT Activities and NMFS’ MMPA Incidental Take
Authorization PCTS FPR-2015-9110
Fahlman, A., A. Olszowka, B. Bostrom, and D. R. Jones. 2006. Deep diving mammals: Dive
behavior and circulatory adjustments contribute to bends avoidance. Respiratory
Physiology and Neurobiology 153(1):66-77.
Farak, A., T. Jefferson, J. Rivers, and R. Uyeyama. 2011. Cruise Report, Marine Species
Monitoring & Lookout Effectiveness Study, Submarine Commanders Course 11-1 and
Undersea Warfare Exercise, Feb. 2011, Hawaii Range Complex.
Farr, R. A., and J. C. Kern. 2004. Green sturgeon population characteristics in Oregon. Oregon
Department of Fish and Wildlife, Clackamas, Oregon.
Fay, R. R. 1988. Hearing in Vertebrates: A Psychophysics Handbook. Hill-Fay Associates,
Winnetka, Illinois.
Fay, R. R., and A. M. Simmons. 1999. The sense of hearing in fishes and amphibians. Pages
269-318 in R. R. Fay, and A. N. Popper, editors. Comparative Hearing: Fish and
Amphibians, volume 11. Springer, New York.
Fearnbach, H., J. W. Durhan, S. A. Mizroch, S. Barbeaux, and P. R. Wade. 2012. Winter
observations of a group of female and immature sperm whales in the high-latitude waters
near the Aleutian Islands, Alaska. Marine Biodiversity Records 5: e13.
Feder, H. M., C. H. Turner, and C. Limbaugh. 1974. Observations on fishes associated with kelp
beds in southern California. Fisheries Bulletin 160:144.
Feldkamp, S. D., R. L. DeLong, and G. A. Antonelis. 1991. Effects of El Niño 1983 on the
foraging patterns of California sea lions (Zalophus californianus) near San Miguel Island,
California. Pages 146-155 in F. Trillmich, and K. A. Ono, editors. Pinnipeds and El Niño:
Responses to environmental stress. Springer-Verlag, Berlin, Germany.
Felix, F. 2001. Observed changes of behavior in humphack whales during whalewatching
encounters off Ecuador. Pages 69 in 14th Biennial Conference on the Biology of Marine
Mammals, Vancouver, Canada.
Félix, F. 2001. Observed changes of behavior in humpback whales during whalewatching
encounters off Ecuador. 14th Biennial Conference on the Biology of Marine Mammals,
Vancouver, Canada.
Felix, F., and K. V. Waerebeek. 2005. Whale mortality from ship strikes in Ecuador and West
Africa. Latin American Journal of Aquatic Mammals 4(1):55-60.
Felleman, F., J. R. Heimlich-Boran, and R. W. Osborne. 1991. The feeding ecology of killer
whales (Orcinus orca) in the Pacific Northwest. Pages 113-148 in K. Pryor, and K.
Norris, editors. Dolphin Societies, discoveries, and puzzles. University of California
Press, Berkeley, California.
Ferguson, J. W. 2010. Memorandum to James H. Lecky: Estimation of Percentages for Listed
Pacific Salmon and Steelhead Smolts Arriving at Various Locations in the Columbia River Basin
in 2010, Northwest Fisheries Science Center. November 9, 2010.
Ferguson, M. C., J. Barlow, S. B. Reilly, and T. Gerrodette. 2006. Predicting Cuvier's (Ziphius
cavirostris) and Mesoplodon beaked whale population density from habitat
characteristics in the eastern tropical Pacific Ocean. Journal of Cetacean Research and
Management 7(3):287-299.
Fernandez, A., and coauthors. 2005a. Gas and fat embolic syndrome involving a mass stranding
of beaked whales (Family Ziphiidae) exposed to anthropogenic sonar signals. Veterinary
Pathology 42(4):446-457.
619
Biological Opinion and Conference Report on Navy NWTT Activities and NMFS’ MMPA Incidental Take Authorization PCTS FPR-2015-9110
Fernandez, A., and coauthors. 2005b. New gas and fat embolic pathology in beaked whales
stranded in the Canary Islands. Pages 90 in Sixteenth Biennial Conference on the Biology
of Marine Mammals, San Diego, California.
Fiedler, P. C., R. Mendelssohn, D. M. Palacios, and S. J. Bograd. 2013. Pycnocline Variations in
the Eastern Tropical and North Pacific, 1958–2008. Journal of Climate 26:583-599.
Fiedler, P. C., and coauthors. 1998. Blue whale habitat and prey in the California Channel
Islands. Deep-Sea Research Part Ii-Topical Studies in Oceanography 45(8-9):1781-1801.
Field, J. C., and S. Ralston. 2005. Spatial variability in rockfish (Sebastes spp.) recruitment
events in the California Current System. Canadian Journal of Fisheries and Aquatic
Sciences 62(10):2199-2210.
Filadelfo, R., and coauthors. 2009. Correlating military sonar use with beaked whale mass
strandings: What do the historical data show? Aquatic Mammals 35(4):435-444.
Findlay, K. P., and P. B. Best. 1995. Summer incidence of humpback whales on the west coast of
South Africa. (Megaptera novaeangliae). South African Journal of Marine Science
15:279-282.
Finneran, J. 2015. Auditory weighting functions and TTS/PTS exposure functions for TAP Phase
3 acoustic effects analyses.
Finneran, J. J. 2010. Auditory weighting functions and frequency-dependent effects of sound in
bottlenose dolphins (Tursiops truncatus). Office of Naval Research.
Finneran, J. J. 2011. Auditory weighting functions and frequency-dependent effects of sound in
bottlenose dolphins (Tursiops truncatus). Office of Naval Research.
Finneran, J. J., and coauthors. 2005a. Pure tone audiograms and possible aminoglycoside
induced hearing loss in belugas (Delphinapterus leucas). Journal of the Acoustical
Society of America 117(6):3936-3943.
Finneran, J. J., D. A. Carder, and S. H. Ridgway. 2001. Temporary threshold shift (TTS) in
bottlenose dolphins (Tursiops truncatus) exposed to tonal signals. Journal of the
Acoustical Society of America 110(5 Part 2):2749.
Finneran, J. J., D. A. Carder, and S. H. Ridgway. 2003a. Temporary Threshold Shift (TTS)
measurements in bottlenose dolphins (Tursiops truncatus), belugas (Delphinapterus
leucas), and California sea lions (Zalophus californianus). Environmental Consequences
of Underwater Sound (ECOUS) Symposium, San Antonio, Texas
Finneran, J. J., D. A. Carder, C. E. Schlundt, and R. L. Dear. 2010. Temporary threshold shift in
a bottlenose dolphin (Tursiops truncatus) exposed to intermittent tones. Journal of the
Acoustical Society of America 127(5):3267-3272.
Finneran, J. J., D. A. Carder, C. E. Schlundt, and S. H. Ridgway. 2005b. Temporary threshold
shift in bottlenose dolphins (Tursiops truncatus) exposed to mid-frequency tones. Journal
of the Acoustical Society of America 118(4):2696-2705.
Finneran, J. J., R. Dear, D. A. Carder, and S. H. Ridgway. 2003b. Auditory and behavioral
responses of California sea lions (Zalophus californianus) to single underwater impulses
from an arc-gap transducer. Journal of the Acoustical Society of America 114(3):1667
1677.
Finneran, J. J., and A. K. Jenkins. 2012. Criteria and thresholds for U.S. Navy acoustic and
explosive effects analysis. Department of Navy, San Diego, California.
Finneran, J. J., and C. E. Schlundt. 2004. Effects of intense pure tones on the behavior of trained
odontocetes. SPAWAR Systems Center, San Diego.
620
Biological Opinion and Conference Report on Navy NWTT Activities and NMFS’ MMPA Incidental Take Authorization PCTS FPR-2015-9110
Finneran, J. J., and C. E. Schlundt. 2010. Frequency-dependent and longitudinal changes in
noise-induced hearing loss in a bottlenose dolphin (Tursiops truncatus). Journal of the
Acoustical Society of America 128(2):567-570.
Finneran, J. J., and C. E. Schlundt. 2011a. Noise-induced temporary threshold shift in marine
mammals. Journal of the Acoustical Society of America 129(4):2432.
Finneran, J. J., and C. E. Schlundt. 2011b. Subjective loudness level measurements and equal
loudness contours in a bottlenose dolphin (Tursiops truncatus). Journal of the Acoustical
Society of America 130(5):3124-3136.
Finneran, J. J., and C. E. Schlundt. 2013. Effects of fatiguing tone frequency on temporary
threshold shift in bottlenose dolphins (Tursiops truncatus). Journal of the Acoustical
Society of America 133(3):1819-1826.
Finneran, J. J., C. E. Schlundt, B. Branstetter, and R. L. Dear. 2007. Assessing temporary
threshold shift in a bottlenose dolphin (Tursiops truncatus) using multiple simultaneous
auditory evoked potentials. Journal of the Acoustical Society of America 122(2):1249
1264.
Finneran, J. J., and coauthors. 2000a. Auditory and Behavioral Responses of Bottlenose
Dolphins (Tursiops truncatus) and a Belga Whale (Delphinapterus leucas) to Impulsive
Sounds Resembling Distant Signatures of Underwater Explosions. Journal of the
Acoustical Society of America 108(1):417-431.
Finneran, J. J., C. E. Schlundt, R. Dear, D. A. Carder, and S. H. Ridgway. 2000b. Masked
temporary threshold shift (MTTS) in odontocetes after exposure to single underwater
impulses from a seismic watergun. Journal of the Acoustical Society of America 108(5
2):2515.
Finneran, J. J., C. E. Schlundt, R. Dear, D. A. Carder, and S. H. Ridgway. 2002. Temporary shift
in masked hearing thresholds in odontocetes after exposure to single underwater impulses
from a seismic watergun. Journal of the Acoustical Society of America 111(6):2929
2940.
Fischer, J. B. 1829. Synopsis Mammalium. J.G. Cottae, Stuttgart.
Fish Passage Center. 2005. Weekly Report #05-30. http://www.fpc.org.
Fisher, C., and M. Slater. 2010. Effects of electromagnetic fields on marine species: a literature
review. Ecology and Environment, Inc. and Science Applications International Corp.,
Oregon Wave Energy Trust.
Fisher, J. P., and W. G. Pearcy. 1995. Distribution, migration, and growth of juvenile Chinook
salmon, Oncorhynchus tshawytscha, off Oregon and Washington. Fisheries Bulletin
93:274-289.
Fitch, J. E., and P. H. Young. 1948. Use and effect of explosives in Calfornia coastal waters.
California Division Fish and Game.
Fitch, R., J. Harrison, and J. Lewandowski. 2011. Report to the National Ocean Council Ocean
Science and Technology Interagency Policy Committee. Marine Mammal and Sound
Workshop. Bureau of Ocean Energy Management, Department of the Navy, and National
Oceanic and Atmospheric Administration, Washington, D.C.
Foerster, R. E. 1968. The sockeye salmon. Bulletin of the Fisheries Research Board of Canada
162.
Foote, A. D., R. W. Osborne, and A. R. Hoelzel. 2004. Whale-call response to masking boat
noise. Nature 428:910.
621
Biological Opinion and Conference Report on Navy NWTT Activities and NMFS’ MMPA Incidental Take Authorization PCTS FPR-2015-9110
Foote, C. J. 1990. An experimental comparison of male and female spawning territoriality in a
Pacific salmon. Behaviour 115:283-313.
Force, U. S. A. 1997. Environmental effects of self-protection chaff and flares, Prepared for
Headquarters Air Combat Command, Langley Air Force Base, Virginia.
Ford, J. K. B. 1989. Acoustic behaviour of resident killer whales (Orcinus orca) off Vancouver
Island, British Columbia. Canadian Journal of Zoology 67:727-745.
Ford, J. K. B. 1991. Vocal traditions among resident killer whales (Orcinus orca) in coastal
waters of British Columbia. Canadian Journal of Zoology 69(6):1454-1483.
Ford, J. K. B. 2002. Killer Whale Orcinus orca. Pages 669-676 in W. F. Perrin, B. Würsig, and J.
G. M. Thewissen, editors. Encyclopedia of Marine Mammals. Academic Press, San
Diego, California.
Ford, J. K. B., G. M. Ellis, and K. C. Balcomb. 1994a. Killer Whales: The Natural History and
Genealogy of Orcinus orca in British Columbia and Washington State. UBC Press,
Vancouver, Canada.
Ford, J. K. B., G. M. Ellis, and K. C. Balcomb. 2000. Killer whales: The natural history and
genealogy of Orcinus orca in British Columbia and Washington State, 2nd Edition. UBC
Press, Vancouver, British Columbia.
Ford, J. K. B., G. M. Ellis, and K. C. Balcomb. 1994b. Killer whales: The natural history and
genealogy of Orcinus orca in British Columbia and Washington State. UBC Press,
University of British Columbia, Vancouver, Canada. 102pp. ISBN 0-7748-0469-6.
Ford, J. K. B., and R. R. Reeves. 2008. Fight or flight: Antipredator strategies of baleen whales.
Mammal Review 38(1):50-86.
Ford, M. J. 2011a. Status review update for Pacific salmon and steelhead listed under the
Endangered Species Act: Pacific northwest. National Oceanic and Atmospheric
Administration, National Marine Fisheries Service, Northwest Fisheries Science Center.
Ford, M. J., (editor). 2011b. Status review update for Pacific salmon and steelhead listed under
the Endangered Species Act: Pacific Northwest. Pages 281 p in U.S. Department of
Commerce, editor U.S. Geological Survey Circular.
Ford, M. J., (editor). 2011c. Status review update for Pacific salmon and steelhead listed under
the Endangered Species Act: Pacific Northwest. Pages 281 p in U.S. Department of
Commerce, editor.
Foreman, M. G., and Y. E. Yamanaka. 2011. Report of Working Group 20 on Evaluations of
Climate Change Projections, PICES Sci. Rep. No. 40, 165 pp.
Forney, K., and D. Kobayashi. 2007. Updated estimates of mortality and injury of cetaceans in
the Hawaii-based longline fishery, 1994-2005. National Oceanic and Atmospheric
Administration, National Marine Fisheries Service, Southwest Fisheries Science Center.
Forney, K. A. 2007. Preliminary estimates of cetacean abundance along the U.S. west coast and
within four national marine sanctuarnes during 2005. NOAA Technical Memorandum
NMFS-SWFSC-406. 33p.
Forney, K. A., and J. Barlow. 1998. Seasonal patterns in the abundance and distribution of
California cetaceans, 1991-1992. Marine Mammal Science 14(3):460-489.
Forney, K. A., and R. L. Brownell Jr. 1996. Preliminary report of the 1994 Aleutian Island
marine mammal survey. National Oceanic and Atmospheric Administration, National
Marine Fisheries Service, Southwest Fisheries Science Center, Paper SC/48/011, La
Jolla, California.
622
Biological Opinion and Conference Report on Navy NWTT Activities and NMFS’ MMPA Incidental Take
Authorization PCTS FPR-2015-9110
Forney, K. A., and coauthors. 2012. Habitat-based spatial models of cetacean density in the
eastern Pacific Ocean. Endangered Species Research 16(2):113-133.
Forney, K. A., J. R. L. Brownell, and P. C. Fiedler. 1995. The distribution of marine mammals
along the Aleutian Islands in 1994 - where have all the blue whales gone? Eleventh
Biennial Conference on the Biology of Marine Mammals, 14-18 December 1995 Orlando
FL. p.39.
Fossette, S., and coauthors. 2010. Behaviour and buoyancy regulation in the deepest-diving
reptile: The leatherback turtle. Journal of Experimental Biology 213(23):4074-4083.
Foster, E. P., M. S. Fitzpatrick, G. W. Feist, C. B. Schreck, and J. Yates. 2001. Gonad
organochlorine concentrations and plasma steroid levels in white sturgeon (Acipenser
transmontanus) from the Columbia River, USA. Bulletin of Environmental
Contamination and Toxicology 67:239–245.
Fox, J. W. 2007. Testing the mechanisms by which source-sink dynamics alter competitive
outcomes in a model system. The American Naturalist 170(3):396-408.
Francis, R. C., and S. R. Hare. 1997. Regime scale climate forcing of salmon populations in the
northeast Pacific--Some new thoughts and findings. Pages 113-127 in R. L. Emmett, and
M. H. Schiewe, editors. Estuarine and ocean survival of northeastern Pacific salmon:
Proceedings of the workshop, volume NOAA Technical Memorandum NMFS-NWFSC
29. NOAA.
Frankel, A. S., and C. W. Clark. 1998. Results of low-frequency playback of M-sequence noise
to humpback whales, Megaptera novaeangliae, in Hawai'i. Canadian Journal of Zoology
76(3):521-535.
Frankel, A. S., and C. W. Clark. 2000. Behavioral responses of humpback whales (Megaptera
novaeangliae) to full-scale ATOC signals. Journal of the Acoustical Society of America
108(4):1930-1937.
Frankel, A. S., C. W. Clark, L. M. Herman, and C. M. Gabriele. 1995. Spatial distribution,
habitat utilization, and social interactions of humpback whales, Megaptera novaeangliae,
off Hawaii, determined using acoustic and visual techniques. Canadian Journal of
Zoology 73(6):1134-1146.
Frantzis, A., and P. Alexiadou. 2008. Male sperm whale (Physeter macrocephalus) coda
production and coda-type usage depend on the presence of conspecifics and the
behavioural context. Canadian Journal of Zoology 86(1):62-75.
Frazer, L. N., and E. Mercado III. 2000. A sonar model for humpback whale song. IEEE Journal
of Oceanic Engineering 25(1):160-182.
Freeland, H. J. 1990. Sea surface temperatures along the coast of British Columbia: Regional
evidence for a warming trend. Canadian Journal of Fisheries and Aquatic Sciences
47:346-350.
French, R., H. Bilton, M. Osako, and A. Hartt. 1976a. Distribution and origin of sockeye salmon
(Oncorhynchus nerka) in offshore waters of the North Pacific Ocean. International North
Pacific Fisheries Commission.
French, R., H. Bilton, M. Osako, and A. Hartt. 1976b. Distribution and origin of sockeye salmon
(Oncorhynchus nerka) in offshore waters of the North Pacific Ocean. International North
Pacific Fisheries Commission Bulletin 34.
French, R., H. Bilton, M. Osako, and A. C. Hartt. 1976c. Distribution and origin of sockeye
salmon (Oncorhynchus nerka) in offshore waters of the North Pacific Ocean.
International North Pacific Fisheries Commission, Vancouver, Canada.
623
Biological Opinion and Conference Report on Navy NWTT Activities and NMFS’ MMPA Incidental Take Authorization PCTS FPR-2015-9110
Fretey, J. 2001. Biogeography and conservation of marine turtles of the Atlantic Coast of Africa.
CMS Technical Series Publication No. 6, UNEP/CMS Secretariat.
Fristrup, K. M., L. T. Hatch, and C. W. Clark. 2003. Variation in humpback whale (Megaptera
novaeangliae) song length in relation to low-frequency sound broadcasts. Journal of the
Acoustical Society of America 113(6):3411-3424.
Fritts, T. H., and coauthors. 1983. Turtles, birds, and mammals in the northern Gulf of Mexico
and nearby Atlantic waters. U.S. Fish and Wildlife Service, Division of Biological
Services, Washington, D. C. .
Fritts, T. H., M. L. Stinson, and R. Marquez M. 1982. Status of Sea Turtle Nesting in Southern
Baja California, Mexico. Bulletin of Southern California Academy of Science 81(2):51
60.
Fuentes, M., M. Hamann, and C. J. Limpus. 2009a. Past, current and future thermal profiles of
green turtle nesting grounds: Implications from climate change. Journal of Experimental
Marine Biology and Ecology 383(1):56-64.
Fuentes, M. M. P. B., M. Hamann, and C. J. Limpus. 2009b. Past, current and future thermal
profiles of green turtle nesting grounds: Implications from climate change. Journal of
Experimental Marine Biology and Ecology in press(in press):in press.
Fuentes, M. M. P. B., C. J. Limpus, and M. Hamann. 2010. Vulnerability of sea turtle nesting
grounds to climate change. Global Change Biology in press(in press):in press.
Fuentes, M. M. P. B., and coauthors. 2009c. Proxy indicators of sand temperature help project
impacts of global warming on sea turtles in northern Australia. Endangered Species
Research 9:33-40.
Futuymda, D. J. 1986. Evolutionary biology, Second ed. edition. Sinauer
Associates, Inc., Sunderland, Massachussetts.
Gabriele, C. M., and A. S. Frankel. 2002. Surprising humpback whale songs in Glacier Bay
National Park. Alaska Park Science: Connections to Natural and Cultural Resource
Studies in Alaska's National Parks. p.17-21.
Gagnon, G. J., and C. W. Clark. 1993. The use of U.S. Navy IUSS passive sonar to monitor the
movements of blue whale. (Balaenoptera musculus). Tenth Biennial Conference on the
Biology of Marine Mammals, 11-15 November Galveston TX. p.50.
Gailey, G., B. Wursig, and T. L. McDonald. 2007. Abundance, behavior, and movement patterns
of western gray whales in relation to a 3-D seismic survey, northeast Sakhalin Island,
Russia. Environmental Monitoring and Assessment 134(1-3):75-91.
Gaines, S. D., and J. Roughgarden. 1987. Fish in offshore kelp forests affect recruitment to
intertidal barnacle populations. Science 235:479-481.
Gallagher, S. P., S. Thompson, and D. W. Wright. 2013. Coastal Mendocino County Salmonid
Life Cycle and Regional Monitoring: Monitoring Status and Trends 2012. State of
California, The Resources Agency, Department of Fish and Game.
Gallagher, S. P., and D. W. Wright. 2011. Coastal Mendocino County Salmonid Life Cycle and
Regional Monitoring: Monitoring Status and Trends 2010. State of California, The
Resources Agency, Department of Fish and Game.
Gallagher, S. P., and D. W. Wright. 2012. Coastal Mendocino County Salmonid Life Cycle and
Regional Monitoring: Monitoring Status and Trends 2011. State of California, The
Resources Agency, Department of Fish and Game.
624

Biological Opinion and Conference Report on Navy NWTT Activities and NMFS’ MMPA Incidental Take
Authorization PCTS FPR-2015-9110
Galli, L., and coauthors. 2003. Boat Source-Level Noise in Haro Strait: Relevance to Orca
Whales. Orca Vocalization and Localization. Colorado College.
Gambaiani, D. D., P. Mayol, S. J. Isaac, and M. P. Simmonds. 2009. Potential impacts of climate
change and greenhouse gas emissions on Mediterranean marine ecosystems and
cetaceans. Journal of the Marine Biological Association of the United Kingdom
89(1):179-201.
Gambell, R. 1968. Aerial observations of sperm whale behaviour. Norsk Hvalfangst-Tidende
57(6):126-138.
Gambell, R. 1985a. Fin Whale Balaenoptera physalus (Linnaeus, 1758). Pages 171-192 in
Handbook of Marine Mammals. Vol. 3: The Sirenians and Baleen Whales. Academic
Press, London, U.K.
Gambell, R. 1985b. Sei whale, Balaenoptera borealis Lesson, 1828. Pages 155-170 in S. H.
Ridway, and S. R. Harrison, editors. Handbook of Marine Mammals, volume 3: The
Sirenians and Baleen Whales. Academic Press, London.
Gannon, D. P., and coauthors. 2005. Prey detection by bottlenose dolphins, Tursiops truncatus:
An experimental test of the passive listening hypothesis. Animal Behaviour 69(3):709
720.
GAO. 2014. Ocean Acidification. Report to Congress, . September 2014. United States
Government Accountability Office GAO 14-736. 41 p.
Garcia-Parraga, D., and coauthors. 2014. Decompression sickness ('the bends') in sea turtles.
Diseases of Aquatic Organisms 111(3):191-205.
Gard, R. 1974. Aerial census of gray whales in Baja California lagoons, 1970 and 1973, with
notes on behavior, mortality and conservation. California Fish and Game 60(3):132-143.
Gardner, S. C., and S. Chavez-Rosales. 2000. Changes in the relative abundance and distribution
of gray whales (Eschrichtius robustus) in Magdalena Bay, Mexico during an El Nino
event. Marine Mammal Science 16(4):728-738.
Gascon, D., and R. A. Miller. 1981. Colonization by nearshore fish on small artificial reefs in
Barkley Sound, British Columbia. Canadian Journal of Zoology 59:1635-1646.
Gaskin, D. E. 1973. Sperm whales in the western South Pacific. (Physeter catodon). New
Zealand Journal of Marine and Freshwater Research 7-Jan(2-Jan):1-20.
Gauthier, J. M., C. D. Metcalfe, and R. Sears. 1997. Chlorinated organic contaminants in blubber
biopsies from northwestern Atlantic balaenopterid whales summering in the Gulf of St
Lawrence. Marine Environmental Research 44(2):201-223.
Gaydos, J. K., K. C. Balcomb III, R. W. Osborne, and L. Dierauf. 2004. Evaluating potential
infectious disease threats for southern killer whales, Orcinus orca: a model for
endangered species. Biological Conservation 117:253-262.
Gearin, P. J., and coauthors. 2000. Experimental testing of acoustic alarms (pingers) to reduce
bycatch of harbour porpoise, Phocoena phocoena, in the state of Washington. Journal of
Cetacean Research and Management 2(1):1-10.
Geist, D. R., C. J. Murray, T. P. Hanrahan, and Y. Xie. 2009. A model of the effects of flow
fluctuations on fall Chinook salmon spawning habitat availability in the Columbia River.
North American Journal of Fisheries Management 28:1911-1927.
Gende, S. M., and coauthors. 2011. A Bayesian approach for understanding the role of ship
speed in whale-ship encounters. Ecological Applications 21(6):2232-2240.
Geraci, J. R., J. Harwood, and V. J. Lounsbury. 1999. Marine mammal die-offs: Causes,
investigations, and issues. Pages 367-395 in J. R. Twiss Jr., and R. R. Reeves, editors.
625
Biological Opinion and Conference Report on Navy NWTT Activities and NMFS’ MMPA Incidental Take Authorization PCTS FPR-2015-9110
Conservation and Management of Marine Mammals. Smithsonian Institution Press,
Washington, D. C.
Geraci, J. R., and V. J. Lounsbury. 2005. Marine Mammals Ashore: A Field Guide for
Strandings, Second edition. National Aquarium in Baltimore, Baltimore, Maryland.
Gero, S., D. Engelhaupt, L. Rendell, and H. Whitehead. 2009. Who Cares? Between-group
variation in alloparental caregiving in sperm whales. Behavioral Ecology 20(4):838-843.
Giese, B. S., and J. A. Carton. 1999. Interannual and decadal variability in the tropical and
midlatitude Pacific Ocean. Journal of Climate 12(3402-3418).
Gilly, W. F., J. M. Beman, S. Y. Litvin, and B. H. Robison. 2013. Oceanographic and Biological
Effects of Shoaling of the Oxygen Minimum Zone. Annual Review of Marine Science
5:393.
Gilman, E. 2008. Pacific leatherback conservation and research activities, financing and
priorities. The World Conservation Union and Western Pacific Fishery Management
Council and IUCN, Honolulu, Hawaii.
Gilpatrick, J. W., Jr., W. L. Perryman, J. R. L. Brownell, M. S. Lynn, and M. L. Deangelis. 1997.
Geographical variation in North Pacific and Southern Hemisphere blue whales
(Balaenoptera musculus). Unpublished paper to the IWC Scientific Committee. 33 pp.
Bournemouth, September (SC/49/O9).
Gitschlag, G. R., M. J. Schirripa, and J. E. Powers. 2001. Estimation of fisheries impacts due to
underwater explosives used to sever and salvage oil and gas platforms in the U.S. Gulf of
Mexico. Minerals Management Service.
Glen, F., A. C. Broderick, B. J. Godley, and G. C. Hays. 2003. Incubation environment affects
phenotype of naturally incubated green turtle hatchlings. Journal of the Marine Biological
Association of the United Kingdom 83:1183-1186.
Glockner-Ferrari, D. A., M. J. Ferrari, and D. McSweeney. 1987. Occurrence of abnormalities,
injuries, and strandings of humpback whales in Hawaiian waters. Seventh Biennial
Conference on the Biology of Marine Mammals, 5-9 December Miami Florida. p.26.
Glockner, D. A., and S. C. Venus. 1983. Identification, growth rate, and behavior of humpback
whale (Megaptera novaeangliae) cows and calves in the waters off Maui, Hawaii, 1977
79. Pages 223-258 in R. Payne, editor. Communication and Behavior of Whales.
Westview Press, Boulder, CO.
Goertner, J. F. 1978. Dynamical model for explosion injury to fish. Naval Surface Weapons
Center White Oak Lab, Silver Spring, MD.
Goertner, J. F. 1982. Prediction of underwater explosion safe ranges for sea mammals. Naval
Surface Weapons Center, Silver Spring, Maryland.
Goertner, J. F., M. L. Wiley, G. A. Young, and W. W. McDonald. 1994. Effects of underwater
explosions on fish without swimbladders. Naval Surface Warfare Center, Silver Spring,
Maryland.
Goff, G. P., and J. Lien. 1988. Atlantic leatherback turtles, Dermochelys coriacea, in cold water
off Newfoundland and Labrador. The Canadian Field-Naturalist 102:1-5.
Goldbogen, J. A., and coauthors. 2013. Blue whales respond to simulated mid-frequency military
sonar. Proceedings of the Royal Society of London Series B Biological Sciences
280(1765):Article 20130657.
Gong, Z., and coauthors. 2014. Ecosystem scale acoustic sensing reveals humpback whale
behavior synchronous with herring spawning processes and re-evaluation finds no effect
626
Biological Opinion and Conference Report on Navy NWTT Activities and NMFS’ MMPA Incidental Take Authorization PCTS FPR-2015-9110
of sonar on humpback song occurrence in the Gulf of Maine in fall 2006. PLoS ONE
9(10):e10473.
Good, T. P., R. S. Waples, and P. Adams. 2005a. Updated status of federally listed ESUs of
West Coast salmon and steelhead. U.S. Department Commerce, NOAA, NMFS,
NWFSC.
Good, T. P., R. S. Waples, and P. Adams. 2005b. Updated status of federally listed ESUs of
West Coast salmon and steelhead. NOAA Technical Memorandum NMFS-NWFSC-66.
U.S. Department of Commerce.
Good, T. P., R. S. Waples, and P. Adams. 2005c. Updated status of federally listed ESUs of
West Coast salmon and steelhead. U.S. Department of Commerce, NMFS-NWFSC-66,
Seattle, WA.
Good, T. P., R. S. Waples, and P. Adams, (editors). 2005d. Updated status of federally listed
ESUs of west coast salmon and steelhead. Pages 598 p in U.S. Department of Commerce,
editor.
Goodwin, L., and P. A. Cotton. 2004. Effects of boat traffic on the behaviour of bottlenose
dolphins (Tursiops truncatus). Aquatic Mammals 30(2):279-283.
Goold, J. C. 1999a. Behavioural and acoustic observations of sperm whales in Scapa Flow,
Orkney Islands. Journal of the Marine Biological Association of the U.K. 79:541-550.
Goold, J. C. 1999b. Behavioural and acoustic observations of sperm whales in Scapa Flow,
Orkney Islands. Journal of the Marine Biological Association of the United Kingdom
79(3):541-550.
Goold, J. C., and S. E. Jones. 1995. Time and frequency domain characteristics of sperm whale
clicks. Journal of the Acoustical Society of America 98(3):1279-1291.
Goold, J. C., H. Whitehead, and R. J. Reid. 2002. North Atlantic sperm whale, Physeter
macrocephalus, strandings on the coastlines of the British Isles and Eastern Canada. The
Canadian Field-Naturalist 116:371–388.
Gordon, J. C. D. 1987. The behaviour and ecology of sperm whales off Sri Lanka. (Physeter
macrocephalus). University of Cambridge, Cambridge. 347 pp.
Gosho, M. E., D. W. Rice, and J. M. Breiwick. 1984. The sperm whale, Physeter macrocephalus.
Marine Fisheries Review 46(4):54-64. the status of Endangered Whales. 100Pgs.
Götz, T., and V. M. Janik. 2011. Repeated elicitation of the acoustic startle reflex leads to
sensation in subsequent avoidance behaviour and induces fear conditioning. BMC
Neuroscience 12(30):13.
Govoni, J. J., L. R. Settle, and M. A. West. 2003. Trauma to juvenile pinfish and spot inflicted
by submarine detonations. Journal of Aquatic Animal Health 15:111-119.
Govoni, J. J., M. A. West, L. R. Settle, R. T. Lynch, and M. D. Greene. 2008. Effects of
underwater explosions on larval fish: Implications for a coastal engineering project.
Journal of Coastal Research 24(Special Issue 2):228-233.
Greaves, F. C., R. H. Draeger, O. A. Brines, J. S. Shaver, and E. L. Corey. 1943. An
experimental study of concussion. United States Naval Medical Bulletin 41(1):339-352.
Green, G. A., and coauthors. 1992a. Cetacean distribution and abundance off Oregon and
Washington, 1989-1990. Pages 100 in J. J. Brueggeman, editor. Oregon and Washington
Marine Mammal and Seabird Surveys, volume OCS Study MMS 91-0093. Minerals
Management Service, Los Angeles, California.
627
Biological Opinion and Conference Report on Navy NWTT Activities and NMFS’ MMPA Incidental Take Authorization PCTS FPR-2015-9110
Green, G. A., and coauthors. 1992b. Cetacean distribution and abundance off Oregon and
Washington, 1989-1990. Oregon and Washington Marine Mammal and Seabird Surveys.
Minerals Management Service Contract Report 14-12-0001-30426.
Greene, C., and A. Godersky. 2012. Larval rockfish in Puget Sound surface waters, Northwest
Fisheries Science Center.
Greene, C. R., and S. E. Moore. 1995. Man-made Noise. Pp in Marine Mammals and Noise.
Pages 101-158 in W. J. Richardson, C. R. Greene, C. I. Malme, and D. H. Thomson,
editors. Marine Mammals and Noise. Academic Press, Inc., San Diego, California.
Greer, A. E., J. D. Lazell Jr., and R. M. Wright. 1973. Anatomical evidence for counter-current
heat exchanger in the leatherback turtle (Dermochelys coriacea). Nature 244:181.
Gregory, L. F., and J. R. Schmid. 2001. Stress responses and sexing of wild Kemp's ridley sea
turtles (Lepidochelys kempii) in the northwestern Gulf of Mexico. General and
Comparative Endocrinology 124:66-74.
Gregr, E. J. 2011. Insights into North Pacific right whale Eubalaena japonica habitat from
historic whaling records. Endangered Species Research 15(3):223-239.
Gregr, E. J., L. Nichol, J. K. B. Ford, G. Ellis, and A. W. Trites. 2000. Migration and population
structure of northeastern Pacific whales off coastal British Columbia: An analysis of
commercial whaling records from 1908-1967. Marine Mammal Science 16(4):699-727.
Gregr, E. J., and A. W. Trites. 2001. Predictions of critical habitat for five whale species in the
waters of coastal British Columbia. Canadian Journal of Fisheries and Aquatic Sciences
58(7):1265-1285.
Griffin, R. B. 1999. Sperm whale distributions and community ecology associated with a warm-
core ring off Georges Bank. Marine Mammal Science 15(1):33-51.
Griffith, J., M. Alexanders, R. Rogers, J. Drotts, and P. Stevenson. 2004. Annual Report 2003,
Stillaguamish River Smolt Trapping Project, Stillaguamish Tribe of Indians. Arlington,
WA.
Groot, C., and L. Margolis. 1991. Pacific salmon life histories. University of British Columbia.
University of British Columbia Press, Vancouver, Canada.
Groot, C., and L. Margolis. 1998. Pacific salmon life histories. UBC Press, Canada.
Group, E. S. 2005. CFMETR Environmental Assessment Update 2005. (RMC-CCE-ES-05-21,
pp. 652). Kingston, Ontario: Environmental Sciences Group, Royal Military College.
Group, M. S. 2011. Spawning Ground Surveys, 2010-2011 Season Mattole River Watershed.
Guerra, M., S. M. Dawson, T. E. Brough, and W. J. Rayment. 2014. Effects of boats on the
surface and acoustic behaviour of an endangered population of bottlenose dolphins.
Endangered Species Research 24(3):221-236.
Guillemot, P. J., R. J. Larson, and W. H. Lenarz. 1985. Seasonal cycles of fat and gonad volume
in five species of northern California rockfish (Scorpaenidae: Sebastes). Fishery Bulletin
1983(299-311).
Gunderson, D. R., P. Callahan, and B. Goiney. 1980. Maturation and fecundity of four species of
Sebastes. Marine Fisheries Review 42:74-79.
Gustafson, R. G., M. J. Ford, D. Teel, and J. S. Drake. 2010. Status review of eulachon
(Thaleichthys pacificus) in Washington, Oregon, and California. Pages 360 p in U.S.
Department of Commerce, editor.
Haggerty, M. J., A. C. Ritchie, J. G. Shellberg, M. J. Crewson, and J. Jalonen. 2009. Lake Ozette
Sockeye Limiting Factors Analysis. Prepared for the Makah Indian Tribe and NOAA
628

Biological Opinion and Conference Report on Navy NWTT Activities and NMFS’ MMPA Incidental Take Authorization PCTS FPR-2015-9110
Fisheries in Cooperation with the Lake Ozette Sockeye Steering Committee, Port
Angeles, WA.
Hain, J. H. W., G. R. Carter, S. D. Kraus, C. A. Mayo, and H. E. Winn. 1982. Feeding behavior
of the humpback whale, Megaptera novaeangliae, in the western North Atlantic. Fishery
Bulletin 80(2):259-268.
Hain, J. H. W., and coauthors. 1995. Apparent bottom feeding by humpback whales on
Stellwagen Bank. Marine Mammal Science 11(4):464-479.
Hain, J. H. W., M. A. M. Hyman, R. D. Kenney, and H. E. Winn. 1985. The role of cetaceans in
the shelf-edge region of the Northeastern United States. Marine Fisheries Review
47(1):13-17.
Hain, J. H. W., M. J. Ratnaswamy, R. D. Kenney, and H. E. Winn. 1992. The fin whale,
Balaenoptera physalus, in waters of the northeastern United States continental shelf.
Reports of the International Whaling Commission 42:653-669.
Hall, A. J., and coauthors. 2006a. The risk of infection from polychlorinated biphenyl exposure
in the harbor porpoise (Phocoena phocoena): A case-control approach. Environmental
Health Perspectives 114(5):704-711.
Hall, A. J., and coauthors. 2006b. Individual-based model framework to assess population
consequences of polychlorinated biphenyl exposure in bottlenose dolphins.
Environmental Health Perspectives 114(Supplement 1):60-64.
Hall, J. D. 1982. Prince William Sound, Alaska: Humpback whale population and vessel traffic
study. National Oceanic and Atmospheric Administration, National Marine Fisheries
Service, Alaska Fisheries Science Center, Juneau Management Office, Contract No. 81
ABG-00265., Juneau, Alaska.
Hallock, R. J., W. F. Van Woert, and L. Shapovalov. 1961. An evaluation of stocking hatchery-
reared steelhead rainbow trout (Salmo gairdneri gairdneri) in the Sacramento River
System. Fish Bulletin 114:1-74.
Halstead, B. W., P. S. Auerbach, and D. R. Campbell. 1990. A colour atlas of dangerous marine
animals. Wolfe Medical Publications Ltd, W.S. Cowell Ltd, Ipswich, England.
Halvorsen, M. B., T. Carlson, and A. N. Popper. 2013. Effects of exposure to pile-driving sounds
on fish. Bioacoustics 17:305-307.
Halvorsen, M. B., B. M. Casper, C. M. Woodley, T. J. Carlson, and A. N. Popper. 2011.
Predicting and mitigating hydroacouctic impacts on fish from pile installations. National
Academy of Sciences, Transportation Research Board, National Cooperative Highway
Research Program.
Halvorsen, M. B., W. T. Ellison, D. R. Choicoine, and A. N. Popper. 2012. Effects of mid-
frequency active sonar on hearing in fish. Journal of the Acoustical Society of America
131(1):599-607.
Hamilton, P. K., G. S. Stone, and S. M. Martin. 1997. Note on a deep humpback whale
(Megaptera novaeangliae) dive near Bermuda. Bulletin of Marine Science 61(2):491-494.
Hamilton, T. A., and coauthors. 2009. Atlas of cetacean sightings from Southwest Fisheries
Science Center cetacean ecosystem surveys: 1986-2005. National Oceanic and
Atmospheric Administration, National Marine Fisheries Service, Southwest Fisheries
Science Center.
Hannah, R. W., and S. A. Jones. 2007. Effectiveness of bycatch reduction devices (BRDs) in the
ocean shrimp (Pandalus jordani) trawl fishery. Fisheries Research 85:217-225.
629
Biological Opinion and Conference Report on Navy NWTT Activities and NMFS’ MMPA Incidental Take
Authorization PCTS FPR-2015-9110
Hannon, J., and B. Deason. 2005. American River Steelhead (Oncorhynchus mykiss) Spawning
2001 – 2005. US Bureau of Reclamation.
Hard, J. J., and coauthors. 2007. Status review of Puget Sound steelhead (Oncorhynchus mykiss).
U.S. Department of Commerce, NOAA Technical Memorandum NMFS-NWFSC-81,
117 p.
Hare, S. R., and N. J. Mantua. 2000. Empirical evidence for North Pacific regime shifts in 1977
and 1989. Progress in Oceanography 47:103-145.
Hare, S. R., N. J. Mantua, and R. C. Francis. 1999. Inverse production regimes: Alaska and west
coast Pacific salmon. Fisheries Habitat 24(1):6-14.
Hart, J. L. 1973. Pacific fishes of Canada. Bulletin of the Fisheries Research Board of Canada
180.
Hartmann, A. R. 1987. Movement of scorpionfishes (Scorpaenidae: Sebastes and Scorpaena) in
the Southern California Bight. Bulletin of the California Department of Fish and Game
73:68-79.
Hartt, A. C., and M. B. Dell. 1986. Early oceanic migrations and growth of juvenile Pacific
salmon and steelhead trout. International North Pacific Fisheries Commission,
Vancouver, Canada.
Harvey, C. J. 2005. Effects of El Niño events on energy demand and egg production of rockfish
(Scorpaenidae: Sebastes): a bioenergetics approach. Fishery Bulletin 103:71-83.
Harwood, L. A., and I. Stirling. 1987. Patterns of aggregation in ringed seals, bearded seals and
bowhead whales in the Beaufort Sea during late summer. Seventh Biennial Conference
on the Biology of Marine Mammals, 5-9 December Miami Florida. p.29.
Harwood, M. B., and D. Hembree. 1987. Incidental catch of small cetaceans in the offshore
gillnet fishery in northern Australian waters: 1981-1985. Report of the International
Whaling Commission 37:363-367.
Hashagen, K. A., G. A. Green, and B. Adams. 2009. Observations of humpback whales,
Megaptera novaeangliae, in the Beaufort Sea, Alaska. Northwestern Naturalist 90(2):160
162.
Hastings, M., A. Popper, J. Finneran, and P. Lanford. 1996a. Effects of low-frequency
underwater sound on hair cells of the inner ear and lateral line of the teleost fish
Astronotus ocellatus. Journal of the Acoustical Society of America 99(3):1759-1766.
Hastings, M. C. 1990. Effects of underwater sound on fish. AT&T Bell Laboratories.
Hastings, M. C. 1991. Effects of underwater sound on bony fishes. Pages 1-18 in 122nd Meeting
of the Acoustical Society of America.
Hastings, M. C. 1995a. Physical effects of noise on fishes. Pages 979-984 in Proceedings of
INTER-NOISE 95, The 1995 International Congress on Noise Control Engineering.
Hastings, M. C. 1995b. Physical effects of noise on fishes. The 1995 International Congress on
Noise Control Engineering.
Hastings, M. C., and A. N. Popper. 2005. Effects of sound on fish. California Department of
Transportation, Sacramento, California.
Hastings, M. C., A. N. Popper, J. J. Finneran, and P. J. Lanford. 1996b. Effects of low-frequency
underwater sound on hair cells of the inner ear and lateral line of the teleost fish
Astronotus ocellatus. Journal of the Acoustical Society of America 99:8.
Hastings, M. C., C. A. Reid, C. C. Grebe, R. L. Hearn, and J. G. Colman. 2008. The effects of
seismic airgun noise on the hearing sensitivity of tropical reef fishes at Scott Reef,
Western Australia. Proceedings of the Institute of Acoustics 30(5):8.
630
Biological Opinion and Conference Report on Navy NWTT Activities and NMFS’ MMPA Incidental Take Authorization PCTS FPR-2015-9110
Hatch, L., and coauthors. 2008. Characterizing the relative contributions of large vessels to total
ocean noise fields: A case study using the Gerry E. Studds Stellwagen Bank National
Marine Sanctuary. Environmental Management 42(5):735-752.
Hatch, L., and A. J. Wright. 2007a. A brief review of anthropogenic sound in the oceans.
International Journal of Comparative Psychology 20:12.
Hatch, L. T., C. W. Clark, S. M. V. Parijs, A. S. Frankel, and D. W. Ponirakis. 2012. Quantifying
loss of acoustic communication space for right whales in and around a US. National
Marine Sanctuary. Conservation Biology 26(6):983-994.
Hatch, L. T., and C. W. Clark. 2004. Acoustic differentiation between fin whales in both the
North Atlantic and North Pacific Oceans, and integration with genetic estimates of
divergence. Unpublished paper to the IWC Scientific Committee. 37 pp. Sorrento, Italy,
July (SC/56/SD6).
Hatch, L. T., and A. J. Wright. 2007b. A brief review of anthropogenic souond in the oceans.
International Journal of Comparative Psychology 201(2-3):121-133.
Hatten, J. R., and K. F. Tiffan. 2009. A spatial model to assess the effects of hydropower
operations on Columbia River fall Chinook salmon spawning habitat. North American
Journal of Fisheries Management 29:1379-1405.
Haw, F., and R. Buckley. 1971. Saltwater Fishing in Washington. Stanley N. Jones, Seattle,
Washington.
Hawkes, L. A., A. C. Broderick, M. H. Godfrey, and B. J. Godley. 2007. Investigating the
potential impacts of climate change on a marine turtle population. Global Change
Biology 13:1-10.
Hawkins, A. D., and A. D. F. Johnstone. 1978. The hearing of the Atlantic salmon, Salmo salar.
Journal of Fish Biology 13(6):655-673.
Hay, D. 2002. The eulachon in Northern British Columbia. Pages 98-107 in T. Pitcher, M.
Vasconcellos, S. Heymans, C. Brignall, and N. Haggan, editors. Fisheries Centre
Research Reports, Information Supporting Past and Present Ecosystem Models of
Northern British Columbia and the Newfoundland Shelf, volume 10. Fisheries Center,
University of British Columbia, Vancouver, British Columbia.
Hay, D., and P. B. McCarter. 2000. Status of the eulachon Thaleichthys pacificus in Canada.
Pages 92 in F. a. O. Canada, editor Research Document 2000/145. Canadian Stock
Assessment Secretariat, Ottawa, Canada.
Hayward, T. L. 2000. El Niño 1997-98 in the coastal waters of southern California: A timeline of
events. CalCOFl Reports 41:98-116.
Hazel, J., I. R. Lawler, H. Marsh, and S. Robson. 2007. Vessel speed increases collision risk for
the green turtle Chelonia mydas. Endangered Species Research 3:105-113.
Hazen, E. L., and coauthors. 2012. Predicted habitat shifts of Pacific top predators in a changing
climate. Nature Climate Change Letters.
Healey, M. C. 1983. Coastwide distribution and ocean migration patterns of stream- and ocean-
type chinook salmon, Oncorhynchus tshawytscha. Canadian Field-Naturalist 97:427-433.
Healey, M. C. 1991. Life history of chinook salmon (Oncorhynchus tshawytscha). Pages 311
393 in C. Groot, and L. Margolis, editors. Pacific salmon life histories. UBC
Press, Vancouver, British Columbia.
631
Biological Opinion and Conference Report on Navy NWTT Activities and NMFS’ MMPA Incidental Take Authorization PCTS FPR-2015-9110
Healey, M. C., and W. R. Heard. 1984. Inter- and intra-population variation in the fecundity of
chinook salmon (Oncorhynchus tshawytscha) and its relevance to life history theory.
Can. J. Fish. Aquat. Sci. 41:476-483.
Hebdon, J. L., P. Kline, D. Taki, and T. A. Flagg. 2004. Evaluating reintroduction strategies for
Redfish Lake sockeye salmon captive brood progeny. American Fisheries Society
Symposium 44:401-413.
Heimlich-Boran, J. R. 1988. Behavioral ecology of killer whales (Orcinus orca) in the Pacific
Northwest. Canadian Journal of Zoology 66:565-578.
Heimlich-Boran, S. L. 1986. Cohesive relationships among Puget Sound killer whales. Pages
251-284 in B. C. Kirkevold, and J. S. Lockard, editors. Behavioral Biology of Killer
Whales. Alan R. Liss, Inc. , New York.
Helweg, D. A., A. S. Frankel, J. Joseph R. Mobley, and L. M. Herman. 1992. Humpback whale
song: Our current understanding. Pages 459-483 in J. A. Thomas, R. A. Kastelein, and A.
Y. Supin, editors. Marine Mammal Sensory Systems. Plenum Press, New York.
Henderson, D. 1990. Gray whales and whalers on the China coast in 1869. (Eschrichtius
robustus). Whalewatcher 24(4):14-16.
Henderson, E. E., and coauthors. 2014. Delphinid behavioral responses to incidental mid-
frequency active sonar. Journal of the Acoustical Society of America 136(4):2003-2014.
Henry, J., and P. B. Best. 1983. Organochlorine residues in whales landed at Durban, South
Africa. Marine Pollution Bulletin 14(6):223-227.
Herman, D. P., and coauthors. 2005. Feeding ecology of eastern North Pacific killer whales
Orcinus orca from fatty acid, stable isotope, and organochlorine analyses of blubber
biopsies. Marine Ecology Progress Series 302:275-291.
Herman, L. M. 1979. Humpback whales in Hawaiian waters: A study in historical ecology.
(Megaptera novaeangliae). Pacific Science 33(1):1-16.
Heublein, J. C., J. T. Kelly, C. E. Crocker, A. P. Klimley, and S. T. Lindley. 2009. Migration of
green sturgeon, Acipenser medirostris, in the Sacramento River. Environmental Biology
of Fishes 84(3):245-258.
Hewitt, R. P. 1985a. Reaction of dolphins to a survey vessel: Effects on census data. Fishery
Bulletin 83(2):187-194.
Hewitt, R. P. 1985b. Reaction of dolphins to a survey vessel: Effects on census data. Fishery
Bulletin 83(2):187-194.
Heyning, J. E., and T. D. Lewis. 1990. Entanglements of baleen whales in fishing gear off
southern California. (Eschrichtius robustus, Balaenoptera acutorostrata, Megaptera
novaeangliae). Report of the International Whaling Commission 40:427-431.
Sc/41/Ps14).
Higgs, D. M. 2005. Auditory cues as ecological signals for marine fishes. Marine Ecology
Progress Series 287:278-281.
Hilborn, R., and coauthors. 2012. The Effects of Salmon Fisheries on Southern Resident Killer
Whales: Final Report of the Independent Science Panel. Prepared with the assistance of
D.R. Marmorek and A.W. Hall, ESSA Technologies Ltd., Vancouver, B.C. for National
Marine Fisheries Service (Seattle. WA) and Fisheries and Oceans Canada (Vancouver.
BC). xv + 61 pp. + Appendices.
Hildebrand, J. 2004. Sources of anthropogenic sound in the marine environment. University of
California, San Diego, Scripps Institution of Oceanography.
632

Biological Opinion and Conference Report on Navy NWTT Activities and NMFS’ MMPA Incidental Take Authorization PCTS FPR-2015-9110
Hildebrand, J. 2005a. Impacts of anthropogenic sound. Pages 101-123 in J. E. Reynolds III, W.
F. Perrin, R. R. Reeves, S. Montgomery, and T. J. Ragen, editors. Marine Mammal Research: Conservation Beyond Crisis. Johns Hopkins University Press, Baltimore.
Hildebrand, J. A. 2005b. Impacts of anthropogenic sound. Pages 101-124 in J. E. Reynolds,
editor. Marine Mammal Research: Conservation Beyond Crisis. The John Hopkins
University Press.
Hildebrand, J. A., and coauthors. 2011. Passive acoustic monitoring for marine mammals in the
SOCAL Naval Training Area 2010-2011. Inter-American Tropical Tuna Commission.
Hildebrand, J. A., and coauthors. 2012. Passive Acoustic Monitoring for Marine Mammals in the
SOCAL Naval Training Area 2011-2012, Marine Physical Laboratory, Scripps Institution
of Oceanography, University of California San Diego.
Hill, P. S., and D. P. DeMaster. 1998. Alaska Marine Mammal Stock Assessments, 1998. U.S.
Department of Commerce, NMFS-AFSC-97.
Hill, P. S., J. L. Laake, and E. Mitchell. 1999. Results of a pilot program to document
interactions between sperm whales and longline vessels in Alaska waters. NOAA
Technical Memorandum NMFS-AFSC-108. 51p.
Hirth, H., J. Kasu, and T. Mala. 1993. Observations on a leatherback turtle Dermochelys
coriacea nesting population near Piguwa, Papua New Guinea. Biological Conservation
65:77-82.
Hitz, C. R. 1962. Seasons of birth of rockfish (Sebastodes) in Oregon coastal waters.
Transactions of the American Fisheries Society 91:231-233.
Hodge, R. P., and B. L. Wing. 2000. Occurrences of marine turtles in Alaska Waters: 1960-1998.
Herpetological Review 31(3):148-151.
Hoegh-Guldberg, O., and J. F. Bruno. 2010. The impact of climate change on the world's marine
ecosystems. Science 328(5985):1523-1528.
Hoelzel, A. 2003. Marine Mammal Biology. Blackwell Publishing.
Holmberg, E. K., D. Day, N. Pasquale, and B. Pattie. 1967. Research report on the Washington
trawl fishery 1962-64. Washington Department of Fisheries, Research Division.
Holst, M., and coauthors. 2011. Responses of pinnipeds to Navy missile launches at San Nicolas
Island, California. Aquatic Mammals 37(2):139-150.
Holt, M., V. Veirs, and S. Veirs. 2008a. Investigating noise effects on the call amplitude of
endangered Southern Resident killer whales (Orcinus orca). Journal of the Acoustical
Society of America 123(5 Part 2):2985.
Holt, M. M., D. P. Noren, V. Veirs, C. K. Emmons, and S. Veirs. 2009a. Speaking up: Killer
whales (Orcinus orca) increase their call amplitude in response to vessel noise. Journal of
the Acoustical Society of America 125(1):EL27-EL32.
Holt, M. M., D. P. Noren, V. Veirs, C. K. Emmons, and S. Veirs. 2009b. Speaking up: Killer
whales (Orcinus orca) increase their call amplitude in response to vessel noise. Journal of
the Acoustical Society of America 125(1):El27-El32.
Holt, M. M., V. Veirs, and S. Veirs. 2008b. Noise effects on the call amplitude of southern
resident killer whales (Orcinus orca). Bioacoustics 117(1-3):164-166.
Hood Canal Coordinating Council. 2005. Hood Canal & Eastern Strait of Juan de Fuca summer
chum salmon recovery plan.
Hooker, S. K., R. W. Baird, and A. Fahlman. 2009. Could beaked whales get the bends? Effect
of diving behaviour and physiology on modelled gas exchange for three species: Ziphius
633
Biological Opinion and Conference Report on Navy NWTT Activities and NMFS’ MMPA Incidental Take Authorization PCTS FPR-2015-9110
cavirostris, Mesoplodon densirostris and Hyperoodon ampullatus. Respiratory
Physiology and Neurobiology 167(3):235-246.
Hooker, S. K., and coauthors. 2012. Deadly diving? Physiological and behavioural management
of decompression stress in diving mammals. Proceedings of the Royal Society of London
Series B Biological Sciences 279(1731):1041-1050.
Hooker, S. K., and coauthors. 2007. Changes in persistent contaminant concentration and
CYP1A1 protein expression in biopsy samples from northern bottlenose whales,
Hyperoodon ampullatus, folowing the onset of nearby oil and gas development.
Environmental Pollution:1-12.
Horwood, J. W. 1987. The sei whale: Population biology, ecology, and management. Croom
Helm Ltd., Kent, England.
Hotchkin, C., and S. Parks. 2013. The Lombard effect and other noise-induced vocal
modifications: Insight from mammalian communication systems. Biological Reviews
88(4):809-824.
Houghton, J. 2001. The science of global warming. Interdisciplinary Science Reviews 26(4):247
257.
Houser, D., R. Howard, and S. Ridgway. 2001a. Can diving behavior increase the chance of
acoustically driven bubble growth in marine mammals? Pages 103 in Fourteenth Biennial
Conference on the Biology of Marine Mammals, Vancouver, Canada.
Houser, D., S. W. Martin, L. Yeates, D. E. Crocker, and J. J. Finneran. 2013. Behavioral
responses of bottlenose dolphins (Tursiops truncatus) and California sea lions (Zalophus
californianus) to controlled exposures of simulated sonar signals. Pages 98 in Twentieth
Biennial Conference on the Biology of Marine Mammals, Dunedin, New Zealand.
Houser, D. S. 2010. Integration of marine mammal movement and behavior into the effects of
sound on the marine environment. Office of Naval Research.
Houser, D. S., R. Howard, and S. Ridgway. 2001b. Can diving-induced tissue nitrogen
supersaturation increase the chance of acoustically driven bubble growth in marine
mammals? Journal of Theoretical Biology 213:183-195.
Houston, J. J. 1988. Status of green sturgeon, Acipenser medirostris, in Canada. Canadian Field-
Naturalist 102:286-290.
Hoyt, E. 2001. Whale Watching 2001: Worldwide Tourism Numbers, Expenditures, and
Expanding Socioeconomic Benefits. International Fund for Animal Welfare,, Yarmouth
Port, MA, USA.
Hubbs, C. L., and A. B. Rechnitzer. 1952. Report on experiments designed to determine effects
of underwater explosions on fish life. California Fish and Game 38(3):333-366.
Huff, D. D., S. T. Lindley, P. S. Rankin, and E. A. Mora. 2011. Green sturgeon physical habitat
use in the coastal Pacific Ocean. PLoS ONE 6(9):e25156.
Hume, M. 2013. “Miracle” whale leaves scientists elated – and relieved. The Globe and Mail,
The Globe and Mail, http://www.theglobeandmail.com/news/british
columbia/miraclewhale-leaves-scientists-elated-and-relieved/article12735936/.
IC-TRT. 2007. Viability criteria for application to Interior Columbia Basin salmonid ESUs.
Review draft. Interior Columbia Tecnical Recovery Team, Northwest Fisheries Science
Center, National Marine Fisheries Service, editor, Seattle.
ICES. 2005a. Answer to DG Environment request on scientific information concerning impact of
sonar activities on cetacean populations. ICES.
ICES. 2005b. Report of the ad-hoc group on the impact of sonar on cetaceans.
634
Biological Opinion and Conference Report on Navy NWTT Activities and NMFS’ MMPA Incidental Take Authorization PCTS FPR-2015-9110
ICES. 2005c. Report of the ad-hoc group on the impacts of sonar on cetaceans and fish.
International Council for the Exploration of the Sea.
Ichihara, T. 1966. The pygmy blue whale, Balaenoptera musculus brevicauda, a new subspecies
from the Antarctic. Whales, Dolphins and Porpoises. K. S. Norris (ed.). University of
California Press, Berkeley, CA. p.79-113.
Idaho Department of Environmental Quality. 2011. Idaho Department of Environmental Quality
final 2010 integrated report. Boise, Idaho.
IEPSPWT. 1999. Monitoring, assessment, and research on central valley steelhead: Status of
knowledge, review of existing programs, and assessment of needs in comprehensive
monitoring, assessment, and research program plan. Interagency Ecological Program
Steelhead Project Work Team.
IGFA. 1991. World record game fishes. International Game Fish Association.
Ilyashenko, V. Y. 2009. How isolated is the 'western' gray whale population? International
Whaling Commission Scientific Committee, Madeira, Portugal.
IPCC. 2001. Climate Change 2001: Working Group II: Impacts, Adaptation and Vulnerability. J.
J. McCarthy, O. F. Canziani, N. A. Leary, D. J. Dokken, and K. S. White, editors.
Intergovernmental Panel on Climate Change. Cambridge University Press, Cambridge,
United Kingdom.
IPCC, editor. 2002. Climate change and biodiversity, Geneva, Switzerland.
IPCC. 2007. Climate Change 2007: Synthesis Report. Intergovernmental Panel on Climate
Change, Valencia, Spain.
IPCC. 2014. Climate change 2014: Impacts, adaptation, and vulnerability. IPCC Working Group
II contribution to AR5. Intergovernmental Panel on Climate Change.
ISAB. 2007. Climate change impacts on Columbia River Basin fish and wildlife. Columbia
River Basin Indian Tribes and National Marine Fisheries Service, Portland, Oregon.
Ishida, Y., A. Yano, M. Ban, and M. Ogura. 1997. Vertical Movement of Chum Salmon,
Oncorhynchus keta, in the western North Pacific Ocean as Determined by a Depth-
recording Archival Tag. National Research Institute of Far Seas Fisheries, Japan.
Israel, J. A., K. J. Bando, E. C. Anderson, and B. May. 2009. Polyploid microsatellite data reveal
stock complexity among estuarine North American green sturgeon (Acipenser
medirostris). Canadian Journal of Fisheries and Aquatic Sciences 66(9):1491-1504.
Issac, J. L. 2009. Effects of climate change on life history: Implications for extinction risk in
mammals. Endangered Species Research 7(2):115-123.
IUCN. 2010. IUCN Red List of Threatened Species. Version 2010.4.
Ivashchenko, Y. V., P. J. Clapham, and R. L. Brownell Jr. 2013. Soviet catches of whales in the
North Pacific: Revised totals. Journal of Cetacean Research and Management 13(1):59
71.
Ivashin, M. V., and A. A. Rovnin. 1967. Some results of the Soviet whale marking in the waters
of the North Pacific. Norsk Hvalfangst-Tidende 56(6):123-135.
IWC. 2003. Report of the workshop on the western gray whale: Research and monitoring needs.
International Whaling Commission.
IWC. 2005. Annex K: Report of the standing working group on environmental concerns.
International Whaling Commission.
IWC. 2012. Extracts from the IWC64 Scientific Committee report relevant to the WGWAP.
International Whaling Commission.
635
Biological Opinion and Conference Report on Navy NWTT Activities and NMFS’ MMPA Incidental Take Authorization PCTS FPR-2015-9110
Jahoda, M., and coauthors. 2003. Mediterranean Fin Whale's (Balaenoptera physalus) response
to small vessels and biopsy sampling assessed through passive tracking and timing of
respiration. Marine Mammal Science 19(1):96-110.
Jankovitz, J. 2013. 2012-2013 Escapement estimates for Central California Coast Coho salmon
and steelhead south of the Golden Gate, Unpublished report.
Jaquet, N. 1996. How spatial and temporal scales influence understanding of sperm whale
distribution: A review. (Physeter macrocephalus). Mammal Review 26(1):51-65.
Jaquet, N., and D. Gendron. 2009. The social organization of sperm whales in the Gulf of
California and comparisons with other populations. Journal of the Marine Biological
Association of the United Kingdom 89(5):975-983.
Jaquet, N., and H. Whitehead. 1996. Scale-dependent correlation of sperm whales distribution
with environmental features and productivity in the South Pacific. Marine Ecology
Progress Series 135:1-9.
Jasny, M., J. Reynolds, C. Horowitz, and A. Wetzler. 2005. Sounding the depths II: The rising
toll of sonar, shipping and industrial ocean noise on marine life. Natural Resources
Defense Council, New York, New York.
Jefferson, T. A., P. J. Stacey, and R. W. Baird. 1991. A review of killer whale interactions with
other marine mammals: Predation to co-existence. (Orcinus orca). Mammal Review
21(4):151-180.
Jeffries, S. 2013. Final report: Aerial surveys of pinniped haulout sites in Pacific northwest
inland waters. Washington Department of Fish and Wildlife, Lakewood Washington.
Jeffries, S., H. Huber, J. Calambokidis, and J. Laake. 2003. Trends and status of harbor seals in
Washington State 1978-1999. Journal of Wildlife Management 67(1):207-218.
Jensen, A. S., and G. K. Silber. 2003. Large whale ship strike database. U.S. Department of
Commerce, NOAA Technical Memorandum. NMFS-OPR.
Jensen, A. S., and G. K. Silber. 2004a. Large Whale Ship Strike Database. U.S. Department of
Commerce, NMFS-OPR-25.
Jensen, A. S., and G. K. Silber. 2004b. Large Whale Ship Strike Database. U.S. Department of
Commerce, NOAA Technical Memorandum. NMFS-OPR. 37p. Available at:
http://www.nmfs.noaa.gov/pr/pdfs/shipstrike/lwssdata.pdf.
Jepson, P. D., and coauthors. 2003. Gas-bubble lesions in stranded cetaceans: Was sonar
responsible for a spate of whale deaths after an Atlantic military exercise? Nature
425(6958):575-576.
Jepson, P. D., and coauthors. 2005. Relationships between polychlorinated biphenyls and health
status in harbor porpoises (Phocoena phocoena) stranded in the United Kingdom.
Environmental Toxicology and Chemistry 24(1):238-248.
Jochens, A. E., and coauthors. 2006. Sperm whale seismic study in the Gulf of Mexico;
Summary report 2002-2004. U.S. Department of the Interior, Minerals Management
Service, Gulf of Mexico OCS Region, OCS Study MMS 2006-034, New Orleans,
Louisiana.
Johnson, A., and coauthors. 2005. Fishing gear involved in entanglements of right and humpback
whales. Marine Mammal Science 21(4):635-645.
Johnson, C. S. 1967. Sound detection thresholds in marine mammals. Pages 247-260 in W. N.
Tavolga, editor Marine Bio-acoustics. Pergamon Press, Lerner Marine Laboratory,
Bimini, Bahamas.
636
Biological Opinion and Conference Report on Navy NWTT Activities and NMFS’ MMPA Incidental Take Authorization PCTS FPR-2015-9110
Johnson, C. S. 1971. Auditory masking of one pure tone by another in the bottlenosed porpoise.
Journal of the Acoustical Society of America 49(4 Part 2):1317-1318.
Johnson, D. W. 2006. Predation, habitat complexity, and variation in density-dependent
mortality of temperate reef fishes. Ecology 87:1179-1188.
Johnson, J. H., and A. A. Wolman. 1984. The humpback whale, Megaptera novaeangliae.
Marine Fisheries Review 46(4):30-37.
Johnson, M. P., and P. L. Tyack. 2003. A digital acoustic recording tag for measuring the
response of wild marine mammals to sound. IEEE Journal of Oceanic Engineering
28(1):3-12.
Johnson, O. W., and coauthors. 1997. Status review of chum salmon from Washington, Oregon,
and California. U.S. Department of Commerce.
Johnson, S. W., M. L. Murphy, and D. J. Csepp. 2003. Distribution, habitat, and behavior of
rockfishes, Sebastes spp., in nearshore waters of southeastern Alaska: Observations from
a remotely operated vehicle. Environmental Biology of Fishes 66(3):259-270.
JOI/USSSP, C. G. E. a. 2003. The interplay of collisional tectonics and late Cenozoic glacial
climate in Alaska and the northeastern Pacific Ocean. Continental Dynamics Program-
Earth Sciences Division-National Science Foundation and Joint Oceanographic
Institutions/U.S. Science Support Program, Austin, Texas.
Jones, T. T. 2009. Energetics of the leatherback turtle (Dermochelys coriacea).
Jørgensen, R., N. O. Handegard, H. Gjøsæter, and A. Slotte. 2004. Possible vessel avoidance
behaviour of capelin in a feeding area and on a spawning ground. Fisheries Research
69(2):251-261.
Jørgensen, R., K. K. Olsen, I.-B. Falk-Petersen, and P. Kanapthippilai. 2005. Investigations of
potential effects of low frequency sonar signals on survival, development and behavior of
fish larvae and juveniles. Pages 51 in. The Norwegian College of Fishery Science,
University of Tromsø, Tromsø, Norway.
Jurasz, C. M., and V. Jurasz. 1979. Feeding modes of the humpback whale, Megaptera
novaeangliae, in southeast Alaska. Scientific Reports of the Whales Research Institute,
Tokyo 31:69-83.
Kakuschke, A., and A. Prange. 2007. The influence of metal pollution on the immune system a
potential stressor for marine mammals in the North Sea. International Journal of
Comparative Psychology 201(2-3):179-193.
Kanda, N., M. Goto, V. Y. Ilyashenko, and L. A. Pastene. 2010. Preliminary mtDNA analysis of
gray whales from Japan and Russia. International Whaling Commission.
Kane, A. S., and coauthors. 2010. Exposure of fish to high-intensity sonar does not induce acute
pathology. Journal of Fish Biology 76(7):1825-1840.
Kastak, D., and coauthors. 2007. Onset, growth, and recovery of in-air temporary threshold shift
in a California sea lion (Zalophus californianus). Journal of the Acoustical Society of
America 122(5):2916-2924.
Kastak, D., B. L. Southall, R. J. Schusterman, and C. R. Kastak. 2005. Underwater temporary
threshold shift in pinnipeds: Effects of noise level and duration. Journal of the Acoustical
Society of America 118(5):3154-3163.
Kastelein, R. A., R. Gransier, and L. Hoek. 2013a. Comparative temporary threshold shifts in a
harbor porpoise and harbor seal, and severe shift in a seal (L). . Journal of the Acoustical
Society of America 134:13-16.
637
Biological Opinion and Conference Report on Navy NWTT Activities and NMFS’ MMPA Incidental Take Authorization PCTS FPR-2015-9110
Kastelein, R. A., R. Gransier, L. Hoek, A. Macleod, and J. M. Terhune. 2012a. Hearing threshold
shifts and recovery in harbor seals (Phoca vitulina) after octave-band noise exposure at 4
kHz. Journal of the Acoustical Society of America 132(4):2745-2761.
Kastelein, R. A., R. Gransier, L. Hoek, A. Macleod, and J. M. Terhune. 2012b. Hearing
threshold shifts and recovery in harbor seals (Phoca vitulina) after octave-band noise
exposure at 4 kHz. Journal of the Acoustical Society of America 132:2745-2761.
Kastelein, R. A., R. Gransier, L. Hoek, and J. Olthuis. 2012c. Temporary hearing threshold shifts
and recovery in a harbor porpoise (Phocoena phocoena) after octave-band noise at 4 kHz.
. Journal of the Acoustical Society of America 132:3525-3537.
Kastelein, R. A., R. Gransier, L. Hoek, and J. Olthuis. 2012d. Temporary threshold shifts and
recovery in a harbor porpoise (Phocoena phocoena) after octave-band noise at 4 kHz.
Journal of the Acoustical Society of America 132:3525-3537.
Kastelein, R. A., R. Gransier, L. Hoek, and M. Rambags. 2013b. Hearing frequency thresholds
of harbor porpoise (Phocoena phocoena) temporarily affected by a continuous 1.5 kHz
tone. Journal of the Acoustical Society of America 34:2286-2292.
Kastelein, R. A., R. Gransier, M. A. T. Marijt, and L. Hoek. 2015. Hearing frequency thresholds
of harbor porpoises (Phocoena phocoena) temporarily affected by played back offshore
pile driving sounds. Journal of the Acoustical Society of America 137(2):556-564.
Kastelein, R. A., D. d. Haan, N. Vaughan, C. Staal, and N. M. Schooneman. 2001. The influence
of three acoustic alarms on the behaviour of harbour porpoises (Phocoena phocoena) in a
floating pen. Marine Environmental Research 52(4):351-371.
Kastelein, R. A., S. V. D. Heul, J. M. Terhune, W. C. Verboom, and R. J. V. Triesscheijn. 2006a.
Deterring effects of 8-45 kHz tone pulses on harbour seals (Phoca vitulina) in a large
pool. Marine Environmental Research 62(5):356-373.
Kastelein, R. A., L. Hoek, R. Gransier, M. Rambags, and N. Claeys. 2014a. Effect of level,
duration, and inter-pulse interval of 1-2kHz sonar signal exposures on harbor porpoise
hearing. Journal of the Acoustical Society of America 136(1):412-422.
Kastelein, R. A., L. Hoek, R. Gransier, M. Rambags, and N. Claeys. 2014b. Effects of level,
duration, and inter-pulse interval of 1-2 kHz sonar signal exposures on harbor porpoise
hearing. Journal of the Acoustical Society of America 136:412-422.
Kastelein, R. A., N. Jennings, W. C. Verboom, D. d. Haan, and N. M. Schooneman. 2006b.
Differences in the response of a striped dolphin (Stenella coeruleoalba) and a harbour
porpoise (Phocoena phocoena) to an acoustic alarm. Marine Environmental Research
61(3):363-378.
Kastelein, R. A., J. Schop, R. Gransier, and L. Hoek. 2014c. Frequency of greatest temporary
hearing threshold shift in harbor porpoise (Phocoena phocoena) depends on the noise
level. Journal of the Acoustical Society of America 136:1410-1418.
Kastelein, R. A., J. Schop, R. Gransier, and L. Hoek. 2014d. Frequency of greatest temporary
hearing threshold shift in harbor porpoises (Phocoena phocoena) depends on the noise
level. Journal of the Acoustical Society of America 136(3):1410-1418.
Kastelein, R. A., W. C. Verboom, M. Muijsers, N. V. Jennings, and S. Van der Heul. 2005. The
influence of acoustic emissions for underwater data transmission on the behavior of
harbour poroises (Phocoena phocoena) in a floating pen. Marine Enviornmental
Research 59:287-307.
638
Biological Opinion and Conference Report on Navy NWTT Activities and NMFS’ MMPA Incidental Take Authorization PCTS FPR-2015-9110
Kastelein, R. A., and coauthors. 2009. Critical ratios in harbor porpoises (Phocoena phocoena)
for tonal signals between 0.315 and 150 kHz in random Gaussian white noise. Journal of
the Acoustical Society of America 126(3):1588-1597.
Kasuya, T., and T. Miyashita. 1988. Distribution of sperm whale stocks in the North Pacific.
Scientific Reports of the Whales Research Institute, Tokyo 39:31-75.
Kato, H., and T. Kasuya. 2002. Some analyses on the modern whaling catch history of the
western North Pacific stock of gray whales (Eschrichtius robustus), with special reference
to the Ulsan whaling ground. Journal of Cetacean Research And Management 4(3):277
282.
Kato, H., T. Miyashita, and H. Shimada. 1995. Segregation of the two sub-species of the blue
whale in the Southern Hemisphere. (Balanenoptera musculus). Report of the International
Whaling Commission 45:273-283.-Sc/46/Sh10).
Katona, S. K., and H. P. Whitehead. 1981. Identifying humpback whales using their natural
markings. (Megaptera novaeangliae). Polar Record 20(128):439-444.
Kaufman, G. D., and M. Osmond. 1987. Aspects of population dynamics of East Australian
humpback whales. Seventh Biennial Conference on the Biology of Marine Mammals, 5-9
December Miami Florida. p.36.
Kawamura, A. 1974. Food and feeding ecology of the southern sei whale. Scientific Reports of
the Whales Research Institute, Tokyo 26:25-144.
Keefer, M. L., C. A. Peery, and M. J. Henrich. 2008. Temperature mediated en route migration
mortality and travel rates of endangered Snake River sockeye salmon. Ecology of
Freshwater Fish 17:136-145.
Keevin, T. M., and G. L. Hempen. 1997. The environmental effects of underwater explosions
with methods to mitigate impacts.
Kenney, R. D., and H. E. Winn. 1987. Cetacean biomass densities near submarine canyons
compared to adjacent shelf/slope areas. Continental Shelf Research 7(2):107-114.
Kenyon, T. 1996. Ontogenetic changes in the auditory sensitivity of damselfishes
(Pomacentridae). Journal of Comparative Physiology 179:553-561.
Kerosky, S. M., and coauthors. 2013. Passive acoustic monitoring for marine mammals in the
Northwest Training Range Complex 2011-2012. University of California San Diego,
Scripps Institution of Oceanography, Marine Physical Laboratory, La Jolla, California.
Ketten, D. R. 1992. The cetacean ear: Form, frequency, and evolution. Pages 53-75 in J. A.
Thomas, R. A. Kastelein, and A. Y. Supin, editors. Marine Mammal Sensory Systems.
Plenum Press, New York.
Ketten, D. R. 1993. Low frequency tuning in marine mammal ears. Pages 3 in Tenth Biennial
Conference on the Biology of Marine Mammals, Galveston, Texas.
Ketten, D. R. 1994. Whale ears: Structural analyses and implications for acoustic trauma. Journal
of the Acoustical Society of America 96(5 Pt.2):3269-3270. the 128th Meeting of the
Acoustical Society of America. Austin, Texas. 28 Nov.-2 Dec.
Ketten, D. R. 1995. Estimates of blast injury and acoustic trauma zones for marine mammals
from underwater explosions. Pages 391-407 in R. A. Kastelein, J. A. Thomas, and P. E.
Nachtigall, editors. Sensory Systems of Aquatic Mammals. De Spil Publishers, Woerden.
Ketten, D. R. 1997a. Structure and function in whale ears. Bioacoustics 8:103-135.
Ketten, D. R. 1997b. Structure and function in whale ears. Bioacoustics-the International Journal
of Animal Sound and Its Recording 8:103-135.
639
Biological Opinion and Conference Report on Navy NWTT Activities and NMFS’ MMPA Incidental Take Authorization PCTS FPR-2015-9110
Ketten, D. R. 1998. Marine Mammal Auditory Systems: A Summary of Audiometroc and
Anatomical Data and its Implications for Underwater Acoustic Impacts. U.S. Department
of Commerce, NOAA-TM-NMFS-SWFSC-256.
Ketten, D. R. 2012. Marine mammal auditory system noise impacts: Evidence and incidence.
Pages 6 in A. N. Popper, and A. Hawkings, editors. The Effects of Noise on Aquatic Life.
Springer Science.
Ketten, D. R., and S. M. Bartol. 2005. Functional Measures of Sea Turtle Hearing.
Ketten, D. R., and S. M. Bartol. 2006. Functional measures of sea turtle hearing. Office of Naval
Research, Arlington, VA.
Ketten, D. R., J. Lien, and S. Todd. 1993. Blast injury in humpback whale ears: Evidence and
implications. Journal of the Acoustical Society of America 94(3 Part 2):1849-1850.
Ketten, D. R., and D. C. Mountain. 2014. Inner ear frequency maps: First stage audiograms of
low to infrasonic hearing in mysticetes. Pages 41 in Fifth International Meeting on the
Effects of Sounds in the Ocean on Marine Mammals (ESOMM - 2014), Amsterdam, The
Netherlands.
Kight, C. R., and J. P. Swaddle. 2011. How and why environmental noise impacts animals: An
integrative, mechanistic review. Ecology Letters.
Kipple, B., and C. Gabriele. 2007. Underwater noise from skiffs to ships. Pages 172-175 in
Fourth Glacier Bay Science Symposium.
Kirkwood, G. P. 1992. Background to the development of revised management procedures,
Annex I. Report of the International Whaling Commission 42:236-239.
Kirschvink, J. L. 1990. Geomagnetic sensitivity in cetaceans: An update with live stranding
records in the United States. Pages 639-649 in J. A. Thomas, and R. A. Kastelein, editors.
Sensory Abilities of Cetaceans: Laboratory and Field Evidence. Plenum Press, New
York.
Kirschvink, J. L., A. E. Dizon, and J. A. Westphal. 1986. Evidence from strandings for
geomagnetic sensitivity in cetaceans. Journal of Experimental Biology 120:1-24.
Kjeld, J. M. 1982. Hormones, electrolytes and other blood constituents in large whales.
Unpublished paper to the IWC Scientific Committee. 4 pp. Cambridge, June
(SC/34/O12).
Klima, E. F., G. R. Gitschlag, and M. L. Renaud. 1988. Impacts of the explosive removal of
offshore petroleum platforms on sea turtles and dolphins. Marine Fisheries Review
50(3):33-42.
Klinowska, M. 1985. Cetacean live stranding sites relate to geomagnetic topography. Aquatic
Mammals 11(1):27-32.
Knechtle, M., and D. Chesney. 2011. 2010 Scott River Salmon Studies Final Report. California
Department of Fish and Game.
Knowlton, A., C. W. Clark, and S. Kraus. 1991. Sounds recorded in the presence of sei whale,
Balaenoptera borealis. Acoustical Society of America.
Knudsen, F. R., P. S. Enger, and O. Sand. 1992. Awareness Reactions And Avoidance
Responses To Sound In Juvenile Atlantic Salmon, Salmo-Salar L. Journal of Fish
Biology 40(4):523-534.
Knudsen, F. R., P. S. Enger, and O. Sand. 1994. Avoidance responses to low-frequency sound in
downstream migrating Atlantic salmon smolt, Salmo-salar. Journal of Fish Biology
45(2):227-233.
640
Biological Opinion and Conference Report on Navy NWTT Activities and NMFS’ MMPA Incidental Take Authorization PCTS FPR-2015-9110
Koehler, J. T., and P. D. Blank. 2012. Napa River steelhead and salmon smolt monitoring
program. Napa County Resource Conservation District, Napa, California.
Koski, W. R., J. W. Lawson, D. H. Thomson, and W. J. Richardson. 1998. Point Mugu Sea
Range marine mammal technical report. Naval Air Warfare Center, Weapons Division
and Southwest Division, Naval Facilities Engineering Command.
Krahn, M. M., and coauthors. 2007. Persistent organic pollutants and stable isotopes in biopsy
samples (2004/2006) from Southern Resident killer whales. Marine Pollution Bulletin
54(12):1903-1911.
Krahn, M. M., and coauthors. 2002. Status review of Southern Resident killer whales (Orcinus
orca) under the Endangered Species Act. U.S. Deptartment of Commerce, NMFS
NWFSC-54.
Kramer, D. E., and V. M. O'Connell. 1995. Guide to Northeast Pacific rockfishes. Genera
Sebastes and Sebastolobus. Alaska Sea Grant.
Kraus, S. D., J. H. Prescott, A. R. Knowlton, and G. S. Stone. 1986. Migration and calving of
right whales (Eubalaena glacialis) in the western North Atlantic. Report of the
International Whaling Commission Special Issue 10:139-144.
Krieger, K., and B. L. Wing. 1984. Hydroacoustic surveys and identifications of humpback
whale forage in Glacier Bay, Stephens Passage, and Frederick Sound, southeastern
Alaska, Summer 1983. U.S. Department of Commerce, NMFS/NWC-66.
Krigsman, L. M. 2000. A review of larval duration for Pacific coast temperate reek fishes;
including kelp rockfish, Sebastes atrovirens. University of California at Santa Cruz Santa
Cruz, California.
Kruse, G. O., and D. L. Scarnecchia. 2001. Assessment of bioaccumulated metal and
organochlorine compounds in relation to physiological biomarkers in Kootenai River
white sturgeon. Journal of Applied Ichthyology 18:430-438.
Kruse, S. 1991a. The interactions between killer whales and boats in Johnstone Strait, B.C. K.
Pryor, and K. Norris, editors. Dolphin Societies: Discoveries and Puzzles. University of
California Press.
Kruse, S. 1991b. The interactions between killer whales and boats in Johnstone Strait, B.C. K.
Pryor, and K. Norris, editors. Dolphin Societies - Discoveries and Puzzles. University of
California Press, Berkeley, California.
Kryter, K. D., W. D. Ward, J. D. Miller, and D. H. Eldredge. 1965. Hazardous exposure to
intermittent and steady-state noise. Journal of the Acoustical Society of America
39(3):451-464.
Kudela, R. M., and coauthors. 2008. New insights into the controls and mechanisms of plankton
productivity along the US West Coast. Oceanography 21(4):46-59.
Kuningas, S., P. H. Kvadsheim, F. P. A. Lam, and P. J. O. Miller. 2013. Killer whale presence in
relation to naval sonar activity and prey abundance in northern Norway. ICES Journal of
Marine Science 70(7):1287-1293.
Kvadsheim, P. 2012. Estimated tissue and blood N2 levels and risk of decompression sickness in
deep-, intermediate-, and shallow-diving toothed whales during exposure to naval sonar.
Frontiers in Physiology 3.
Kvadsheim, P., and coauthors. 2011. Behavioural response studies of cetaceans to naval sonar
signals in Norwegian waters - 3S-2011 cruise report. Norwegian Defence Research
Establishment (FFI).
641
Biological Opinion and Conference Report on Navy NWTT Activities and NMFS’ MMPA Incidental Take Authorization PCTS FPR-2015-9110
Kvadsheim, P. H., and E. M. Sevaldsen. 2005. The potential impact of 1-8 kHz active sonar on
stocks of juvenile fish during sonar exercises. Forsvarets Forskningsinstitutt.
Kvadsheim, P. H., E. M. Sevaldsen, L. P. Folkow, and A. S. Blix. 2010. Behavioural and
physiological responses of hooded seals (Cystophora cristata) to 1 to 7 kHz sonar
signals. Aquatic Mammals 36(3):239-247.
Lackey, R. T. 2009. Challenges to sustaining diadromous fishes through 2100: lessons learned
from western North America. In Challenges for diadromous fishes in a dynamic global
environment. A. Haro, and coeditors, editors. American Fisheries Society Symposium,
Bethesda, Maryland.
Lafortuna, C. L., M. Jahoda, A. Azzellino, F. Saibene, and A. Colombini. 2003. Locomotor
behaviours and respiratory pattern of the Mediterranean fin whale (Balaenoptera
physalus). European Journal of Applied Physiology 303(3-4):387-395.
Lafortuna, C. L., and coauthors. 1999. Locomotor behaviour and respiratory patterns in
Mediterranean fin whales (Balaenoptera physalus) tracked in their summer feeding
ground. Pages 156-160 in P. G. H. Evan, and E. C. M. Parsons, editors. Proceedings of
the Twelfth Annual Conference of the European Cetacean Society, Monaco.
Lagerquist, B. A., K. M. Stafford, and B. R. Mate. 2000. Dive characteristics of satellite-
monitored blue whales (Balaenoptera musculus) off the Central California coast. Marine
Mammal Science 16(2):375-391.
Laggner, D. 2009. Blue whale (Baleanoptera musculus) ship strike threat assessment in the Santa
Barbara Channel, California. Master's. Evergreen State College.
Lagueux, C. J. 1998. Demography of marine turtles harvested by Miskitu indians of Atlantic
Nicaragua. Pages 90 in R. Byles, and Y. Fernandez, editors. Proceedings of the Sixteenth
Annual Symposium on Sea Turtle Biology and Conservation. U.S. Department of
Commerce, Hilton Head, South Carolina.
Laidig, T. E., J. R. Chess, and D. F. Howard. 2007. Relationship between abundance of juvenile
rockfishes (Sebastes spp.) and environmental variables documented off northern
California and potential mechanisms for the covariation. Fishery Bulletin 105(1):39-48.
Laist, D. W., A. R. Knowlton, J. G. Mead, A. S. Collet, and M. Podesta. 2001. Collisions
between ships and whales. Marine Mammal Science 17(1):35-75.
Lamb, A., and P. Edgell. 1986. Coastal fishes of the Pacific northwest. Harbour Publishing Co.
Ltd.
Lambertsen, R. H. 1983. Crassicaudiasis of the North Atlantic fin whale (Balaenoptera
physalus): Prevalence, pathogenesis, transmission, and life cycle. Fifth Biennial
Conference on the Biology of Marine Mammals, 27 November-1 December New
England Aquarium Boston MA. p.59.
Lambertsen, R. H. 1986. Disease of the common fin whale (Balaenopters physalus):
Crassicaudiosis of the urinary system. Journal of Mammalogy 67(2):353-366.
Lambertsen, R. H. 1992. Crassicaudosis: A parasitic disease threatening the health and
population recovery of large baleen whales. (Balaenoptera musculus, Balaenoptera
physalus, Megaptera novaeangliae). Revue Scientifique Et Technique Office
International Des Epizooties 11(4):1131-1141.
Lambertsen, R. H., B. A. Kohn, J. P. Sundberg, and C. D. Buergelt. 1987. Genital papillomatosis
in sperm whale bulls. Journal of Wildlife Diseases 23(3):361-367.
642
Biological Opinion and Conference Report on Navy NWTT Activities and NMFS’ MMPA Incidental Take
Authorization PCTS FPR-2015-9110
Lambourn, D. M., and coauthors. 2012. 2007-2009 Pacific Northwest Guadalupe fur seal
(Arctocephalus townsendi) Unusual Mortality Event (UME) Summary Report, NOAA
UME Committee, May 2012.
Lammers, A., A. Pack, and L. Davis. 2003. Historical evidence of whale/vessel collisions in
Hawaiian waters (1975-present). Ocean Science Institute.
Lance, M. M., and S. J. Jeffries. 2007. Temporal and spatial variability of harbor seal diet in the
San Juan archipelago. Washington Department of Fish and Wildlife.
Lande, R., S. Engen, and B. E. Saether. 2003. Estimating density dependence in time-series of
age-structured populations. Pages 55-65 in R. M. Sibley, J. Hone, and T. H. Clutton-
Brock, editors. Wildlife Population Growth Rates. Cambridge University Press,
Cambridge, United Kingdom.
Landry, M. R., and B. M. Hickey. 1989. Coastal Oceanography of Washington and Oregon.
Elsevier Science Publishing Company Inc., New York, NY.
Lang, A. R., and coauthors. 2011. Genetic analysis of stock structure and movements of gray
whales in the eastern and western North Pacific. International Whaling Commission.
Lang, A. R., and coauthors. 2004. Genetic differentiation between western and eastern gray
whale populations using microsatellite markers. International Whaling Commission
Scientific Committee, Sorrento, Italy.
Lang, A. R., D. W. Weller, R. G. Leduc, A. M. Burdin, and J. R. L. Brownell. 2005. Genetic
assessment of the western gray whale population. Current research and future directions.
Unpublished paper to the IWC Scientific Committee. 13 pp. Ulsan, Korea, June
(SC/57/BRG14).
Lang, A. R., D. W. Weller, R. G. Leduc, A. M. Burdin, and J. Robert L. Brownell. 2010. Genetic
differentiation between western and eastern (Eschrichtius robustus) gray whale
populations using microsatellite markers. Unpublished paper to the IWC Scientific
Committee, Agadir, Morocco.
Laplanche, C., O. Adam, M. Lopatka, and J. F. Motsch. 2005. Sperm whales click focussing:
Towards an understanding of single sperm whale foraging strategies. Pages 56 in
Nineteenth Annual Conference of the European Cetacean Society, La Rochelle, France.
Latishev, V. M. 2007. Scientific report from factory ships "Vladivostok" and "Dalniy Vostok" in
1967. Pages 16-17 in Y. V. Ivashchenko, P. J. Clapham, and R. L. Brownell Jr., editors.
Scientific reports of Soviet whaling expeditions in the North Pacific, 1955-1978. ,
volume NOAA Technical Memorandum NMFS-AFSC-175. U.S. Department of
Commerce, National Oceanic and Atmospheric Administration, National Marine
Fisheries Service, Alaska Fisheries Science Center, Seattle, Washington.
Laufle, J. C., G. B. Pauley, and M. F. Shepard. 1986. Species profiles: life histories and
environmental requirements of coastal fishes and invertebrates (Pacific Northwest). Coho
salmon. [Oncorhynchus kisutch], TR-EL-82-4/82-11.48; Other: ON: TI86901607 United
StatesOther: ON: TI86901607Wed Feb 06 21:03:04 EST 2008NTIS, PC A03/MF
A01.TIC; ERA-11-048738; EDB-86-152539English.
Law, R. J., R. L. Stringer, C. R. Allchin, and B. R. Jones. 1996. Metals and organochlorines in
sperm whales (Physetes macrocephalus) stranded arounf the North Sea during the
1994/1995 winter. Marine Pollution Bulletin 32(1):72-77.
Lawson, P. W., and coauthors. 2007. Identification of historical populations of coho salmon
(Onchorynchus kisutch) in the Oregon Coast evolutionarily significant unit. Pages 129 p
in U.S. Department of Commerce, editor.
643

Biological Opinion and Conference Report on Navy NWTT Activities and NMFS’ MMPA Incidental Take Authorization PCTS FPR-2015-9110
Lazell Jr., J. D. 1980. New England Waters: Critical Habitat for Marine Turtles. Copeia
1980(2):290-295.
Le Boeuf, B. J., and D. E. Crocker. 2005. Ocean climate and seal condition. BMC Biology 3:9.
Lea, R. N., R. D. McAllister, and D. A. VenTresca. 1999. Biological aspects of nearshore
rockfishes of the genus Sebastes from central California. Fishery Bulletin 177:1-109.
Leatherwood, S., F. T. Awbrey, and J. A. Thomas. 1982a. Minke whale response to a transiting
survey vessel. Report of the International Whaling Commission 32:795-802.
Leatherwood, S., D. K. Caldwell, and H. E. Winn. 1976. Whales, dolphins, and porpoises of the
western North Atlantic: A guide to their identification. NOAA Technical Report NMFS
CIRCULAR No. 396. 176p.
Leatherwood, S., R. R. Reeves, W. F. Perrin, and W. E. Evans. 1982b. Whales, dolphins and
porpoises of the eastern north Pacific and adjacent Arctic waters. A guide to their
Identification. National Marine Fisheries Service.
Leduc, R. G., and coauthors. 2002. Genetic differences between western and eastern gray whales
(Eschrichtius robustus). Journal of Cetacean Research And Management 4(1):1-5.
Lee, Y. W., and D. B. Sampson. 2009. Dietary variations in three co-occurring rockfish species
off the Pacific Northwest during anomalous oceanographic events in 1998 and 1999.
Fishery Bulletin 107(4):510-522.
Lemon, M., T. P. Lynch, D. H. Cato, and R. G. Harcourt. 2006. Response of travelling
bottlenose dolphins (Tursiops aduncus) to experimental approaches by a powerboat in
Jervis Bay, New South Wales, Australia. Biological Conservation 127(4):363-372.
Lenarz, W. H., and T. W. Echeverria. 1991. Sexual dimorphism in Sebastes. Environmental
Biology of Fishes 30:71-80.
Lenhardt, M. L. 1994. Seismic and very low frequency sound induced behaviors in captive
loggerhead marine turtles (Caretta caretta). Pages 238-241 in K. A. Bjorndal, A. B.
Bolten, D. A. Johnson, and P. J. Eliazar, editors. Proceedings of the Fourteenth Annual
Symposium on Sea Turtle Biology and Conservation.
Lenhardt, M. L., S. Bellmund, R. A. Byles, S. W. Harkins, and J. A. Musick. 1983. Marine turtle
reception of bone conducted sound. The Journal of auditory research 23:119-125.
Lenhardt, M. L., R. C. Klinger, and J. A. Musick. 1985. Marine turtle middle-ear anatomy.
Journal of Auditory Research 25(1):66-72.
Lenhardt, M. L., S. E. Moein, J. A. Musick, and D. E. Barnard. 1994a. Evaluation of the
Response of Loggerhead Sea Turtles (Caretta caretta) to a Fixed Sound Source. Draft
Final Report Submitted to the U.S. Army Corps of Engineers, Waterways Experiment
Station:13.
Lenhardt, M. L., S. E. Moein, J. A. Musick, and D. E. Barnard. 1994b. Evaluation of the
response of loggerhead sea turtles (Caretta caretta) to a fixed sound source. U.S. Army
Corps of Engineers, Waterways Experiment Station.
Lesage, V., C. Barrette, M. C. S. Kingsley, and B. Sjare. 1999. The effect of vessel noise on the
vocal behavior of Belugas in the St. Lawrence River estuary, Canada. Marine Mammal
Science 15(1):65-84.
Lewison, R. L., S. A. Freeman, and L. B. Crowder. 2004. Quantifying the effects of fisheries on
threatened species: The impact of pelagic longlines on loggerhead and leatherback sea
turtles. Ecology Letters 7:221-231.
644
Biological Opinion and Conference Report on Navy NWTT Activities and NMFS’ MMPA Incidental Take
Authorization PCTS FPR-2015-9110
Lidgard, D. C., D. J. Boness, W. D. Bowen, and J. I. McMillan. 2008. The implications of stress
on male mating behavior and success in a sexually dimorphic polygynous mammal, the
grey seal. Hormones and Behavior 53(1):241-248.
Lien, J. 1994. Entrapments of large cetaceans in passive inshore fishing gear in Newfoundland
and Labrador (1979-1990). Report of the International Whaling Commission (Special
Issue 15):149–157.
Lien, J., S. Todd, P. Stevick, F. Marques, and D. Ketten. 1993. The reaction of humpback whales
to underwater explosions: Orientation, movements, and behavior. Journal of the
Acoustical Society of America 94(3 pt.2):1849.
Light, J. T., C. K. Harris, and R. L. Burgner. 1989. Ocean distribution and migration of steelhead
(Oncorhynchus mykiss, formerly Salmo gairdneri). International North Pacific Fisheries
Commission, Fisheries Research Institute.
Lindley, S. T., and coauthors. 2009. What caused the Sacramento River fall Chinook stock
collapse?, Pre-publication report to the Pacific Fishery Management
Council. March 18, 2009, 57 p.
Lindley, S. T., and coauthors. 2008. Marine migration of North American green sturgeon.
Transactions of the American Fisheries Society 137:182-194.
Linnæus, C. 1758. Systema Naturæ per Regna Tria Naturæ, Secundum Classes, Ordines, Genera,
Species, Cum Characteribus, Differentiis, Synonymis, Locis, volume Tomus I. Salvius.
Litzow, M. A., and F. J. Mueter. 2013. Assessing the ecological importance of climate regime
shifts: An approach from the North Pacific Ocean. Progress in Oceanography.
Lohmann, K. J. 1991. Magnetic orientation by hatchling loggerhead sea turtles (Caretta caretta).
Journal of Experimental Biology 155:37-49.
Lohmann, K. J., S. D. Cain, S. A. Dodge, and C. M. F. Lohmann. 2001. Regional magnetic fields
as navigational markers for sea turtles. Science 294(5541):364-366.
Lohmann, K. J., J. T. Hester, and C. M. F. Lohmann. 1999. Long-distance navigation in sea
turtles. Ethology, Ecology and Evolution 11(1):1-23.
Lohmann, K. J., and C. M. F. Lohmann. 1996a. Detection of magnetic field intensity by sea
turtles. Nature 380:59-61.
Lohmann, K. J., and C. M. F. Lohmann. 1996b. Orientation and open-sea navigation in sea
turtles. Journal of Experimental Biology 199(1):73-81.
Lombarte, A., and A. N. Popper. 1994. Quantitative analyses of postembryonic hair cell addition
in the otolithic endorgans of the inner ear of the European hake, Merluccius merluccius
(Gadiformes, Teleostei). Journal of Comparative Neurology 345(419-428).
Lombarte, A., H. Y. Yan, A. N. Popper, J. C. Chang, and C. Platt. 1993. Damage and
regeneration of hair cell ciliary bundles in a fish ear following treatment with gentamicin.
Hearing Research 66:166-174.
Look, D. 2011. Hawaii update of stranding and entanglement information. C. Erkelens, editor.
Love, M. S. 1978. Aspects of the life history of the olive rockfish (Sebastes serranoides).
University of California at Santa Barbara, Santa Barbara, California.
Love, M. S., M. H. Carr, and L. J. Haldorson. 1991. The ecology of substrate-associated
juveniles of the genus Sebastes. Environmental Biology of Fishes 30:225-243.
Love, M. S., J. E. Caselle, and K. Herbinson. 1998a. Declines in nearshore rockfish recruitment
and populations in the southern California Bight as measured by impingement rates in
coastal electrical power generating stations. Fishery Bulletin 96(3):492-501.
645
Biological Opinion and Conference Report on Navy NWTT Activities and NMFS’ MMPA Incidental Take
Authorization PCTS FPR-2015-9110
Love, M. S., J. E. Caselle, and W. Van Buskirk. 1998b. A severe decline in the commercial
passenger fishing vessel rockfish (Sebastes spp.) catch in the Southern California Bight,
1980-1996. California Cooperative Oceanic Fisheries Investigations Reports 39:180-195.
Love, M. S., D. M. Schroeder, and W. Lenarz. 2005. Distribution of bocaccio (Sebastes
paucispinis) and cow cod (Sebastes levis) around oil platforms and natural outcrops off
California with implications for larval production. Bulletin of Marine Science 77:397
408.
Love, M. S., and coauthors. 2006. Potential use of offshore marine structures in rebuilding an
overfished rockfish species, bocaccio (Sebastes paucispinis). Fishery Bulletin 104:383
390.
Love, M. S., and M. Yoklavich. 2008. Habitat characteristics of juvenile cow cod, Sebastes levis
(Scorpaenidae), in Southern California. Environmental Biology of Fishes 82:195-202.
Love, M. S., M. M. Yoklavich, and L. Thorsteinson. 2002. The Rockfishes of the Northeast
Pacific. University of California Press, Berkeley, California.
Love, M. S., and A. York. 2005. A comparison of the fish assemblages associated with an oil/gas
pipeline and adjacent seafloor in the Santa Barbara Channel, southern California bight.
Bulletin of Marine Science 77:101-117.
Love, M. S., and A. York. 2006. The relationships between fish assemblages and the amount of
bottom horizontal beam exposed at California oil platforms: fish habitat preferences at
man-made platforms and (by inference) at natural reefs. Fishery Bulletin 104(4):542-549.
Lovell, J. M., M. M. Findlay, R. M. Moate, J. R. Nedwell, and M. A. Pegg. 2005. The inner ear
morphology and hearing abilities of the Paddlefish (Polyodon spathula) and the Lake
Sturgeon (Acipenser fulvescens). Comparative Biochemistry and Physiology a-Molecular
& Integrative Physiology 142(3):286-296.
Lo̸vik, A., and J. M. Hovem. 1979. An experimental investigation of swimbladder resonance in
fishes. Journal of the Acoustical Society of America 66(3):850.
Lower Columbia Fish Recovery Board. 2010a. Washington lower Columbia salmon recovery &
fish and wildlife subbasin plan. Olympia, Washington.
Lower Columbia Fish Recovery Board. 2010b. Washington lower Columbia salmon recovery &
fish and wildlife subbasin plan, Olympia, Washington. May 28.
Lucke, K., U. Siebert, P. A. Lepper, and M.-A. Blanchet. 2009. Temporary shift in masked
hearing thresholds in a harbor porpoise (Phocoena phocoena) after exposure to seismic
airgun stimuli. Journal of the Acoustical Society of America 125(6):4060-4070.
Luczkovich, J. J., and coauthors. 2000. Sounds of sex and death in the sea: bottlenose dolphin
whistles suppress mating choruses of silver perch. Bioacoustics 10(4):323-334.
Luksenburg, J. A., and E. C. M. Parsons. 2009a. The effects of aircraft on cetaceans:
Implications for aerial whalewatching. Sixty First Meeting of the International Whaling
Commission, Madeira, Portugal.
Luksenburg, J. A., and E. C. M. Parsons. 2009b. The effects of aircraft on cetaceans:
implications for aerial
whalewatching. Unpublished report to the International Whaling Commission.
Lundquist, D., N. J. Gemmell, and B. Wursig. 2012. Behavioural responses of dusky dolphin
groups (Lagenorhynchus obscurus) to tour vessels off Kaikoura, New Zealand. PLoS
ONE 7(7):e41969.
646
Biological Opinion and Conference Report on Navy NWTT Activities and NMFS’ MMPA Incidental Take Authorization PCTS FPR-2015-9110
Luschi, P., and coauthors. 2007. Marine turtles use geomagnetic cues during open-sea homing.
Current Biology 17(2):126-133.
Lusseau, D. 2003. Effects of tour boats on the behavior of bottlenose dolphins: Using Markov
chains to model anthropogenic impacts. Conservation Biology 17(6):1785-1793.
Lusseau, D. 2004. The hidden cost of tourism: Detecting long-term effects of tourism using
behavioral information. Ecology and Society 9(1):2.
Lusseau, D. 2006. The short-term behavioral reactions of bottlenose dolphins to interactions with
boats in Doubtful Sound, New Zealand. Marine Mammal Science 22(4):802-818.
Lusseau, D., D. E. Bain, R. Williams, and J. C. Smith. 2009. Vessel traffic disrupts the foraging
behavior of southern resident killer whales Orcinus orca. Endangered Species Research
6:211-221.
Lusseau, D., and coauthors. 2004. Parallel influence of climate on the behaviour of Pacific killer
whales and Atlantic bottlenose dolphins. Ecology Letters 7:1068-1076.
Lutcavage, M. E., and P. L. Lutz. 1997. Diving physiology. Pages 277-295 in The Biology of
Sea Turtles. CRC Press, Boca Raton, Florida.
Lux, J., R. Reina, and L. Stokes. 2003. Nesting activity of leatherback turtles (Dermochelys
coriacea) in relation to tidal and lunar cycles at Playa Grande, Costa Rica. Pages 215-216
in J. A. S. (compiler), editor Proceedings of the 22nd Annual Symposium on Sea Turtle
Biology and Conservation. Department of Commerce, NOAA Technical Memorandum
NMFS-SEFSC-503.
Lyrholm, T., and U. Gyllensten. 1998. Global matrilineal population structure in sperm whales
as indicated by mitochondrial DNA sequences. Proceedings of the Royal Society of
London Series B 265(1406):1679-1684.
Lyrholm, T., O. Leimar, and U. Gyllensten. 1996. Low diversity and biased substitution patterns
in the mitochondrial DNA control region of sperm whales: Implications for estimates of
time since common ancestry. (Physeter macrocephalus). Molecular Biology and
Evolution 13(10):1318-1326.
Lyrholm, T., O. Leimar, B. Johanneson, and U. Gyllensten. 1999. Sex-biased dispersal in sperm
whales: Contrasting mitochondrial and nuclear genetic structure of global populations.
Transactions of the Royal Society of London, Series B: Biological Sciences
266(1417):347-354.
Lyubimova, T. G. 1965. Main stages in the life cycle of the rockfish Sebastodes alutus (Gilbert)
in the Gulf of Alaska. Trudy Vniro 49:85-111.
MacCall, A., and coauthors. 2005. Recent ecosystem changes in the California Current System.
Pages 162 in J. King, editor. Report of the Study Group on Fisheries and Ecosystem
Responses to Recent Regime Shifts, volume PICES Scientific Report No. 28.
MacCall, A. D. 1996. Patterns of low frequency variability in fish populations of the California
Current. California Cooperative Oceanic Fisheries Investigation Report.
MacCall, A. D. 2002. Use of known-biomass production models to determine productivity of
west coast groundfish stocks. North American Journal of Fisheries Management 22:272
279.
MacCall, A. D. 2003. Status of bocaccio off California in 2003. Pacific Fishery Management
Council, Portland, Oregon.
MacCall, A. D. 2008. Bocaccio rebuilding analysis for 2007. NMFS, SWFSC, Fish Ecology
Division.
647

Biological Opinion and Conference Report on Navy NWTT Activities and NMFS’ MMPA Incidental Take
Authorization PCTS FPR-2015-9110
MacCall, A. D., and X. He. 2002a. Bocaccio rebuilding analysis for 2002. Pacific Fishery
Management Council, Portland, Oregon.
MacCall, A. D., and X. He. 2002b. Status review of the southern stock of bocaccio (Sebastes
paucispinis). National Oceanic and Atmospheric Administration, National Marine
Fisheries Service, Southwest Fisheries Science Center, Santa Cruz Laboratory, Santa
Cruz, California.
MacGregor, J. S. 1970. Fecundity, multiple spawning, and description of the gonads in
Sebastodes. United States Fish and Wildlife Service, Washington, D. C. .
Mackintosh, N. A. 1965. Blue and fin whales. Pages 174-182 in The Stocks of Whales. Fishing
News.
Macleod, C. D. 2009. Global climate change, range changes and potential implications for the
conservation of marine cetaceans: A review and synthesis. Endangered Species Research
7(2):125-136.
Madsen, P. T., and coauthors. 2003. Sound production in neonate sperm whales (L). Journal of
the Acoustical Society of America 113(6):2988-2991.
Madsen, P. T., and coauthors. 2006. Quantitative measures of air-gun pulses recorded on sperm
whales (Physeter macrocephalus) using acoustic tags during controlled exposure
experiments. Journal of the Acoustical Society of America 120(4):2366-2379.
Madsen, P. T., and B. Mohl. 2000. Sperm whales (Physeter catodon L 1758) do not react to
sounds from detonators. Journal of the Acoustical Society of America 107:668-671.
Madsen, P. T., B. Mohl, B. K. Nielsen, and M. Wahlberg. 2002. Male sperm whale behaviour
during exposures to distant seismic survey pulses. Aquatic Mammals 28(3):231-240.
Magalhaes, S., and coauthors. 2002. Short-term reactions of sperm whales (Physeter
macrocephalus) to whale-watching vessels in the Azores. Aquatic Mammals 28(3):267
274.
Malme, C. I., P. R. Miles, P. Tyack, C. W. Clark, and J. E. Bird. 1985. Investigation of the
potential effects of underwater noise from petroleum industry activities on feeding
humpback whale behavior. Report No. 5851, prepared for Minerals Management Service,
Alaska OCS Offfice, 949 East 36th Avenue, Anchorage, AK 99508. MMS 85-0019.
205pp.
Malme, C. I., B. Wursig, J. E. Bird, and P. Tyack. 1986. Behavioral responses of gray whales to
industrial noise: feeding observations and predictive modeling.
Malme, C. I., B. Wursig, J. E. Bird, and P. Tyack. 1988. Observations of feeding gray whale
responses to controlled industrial noise exposure. W. M. Sackinger, editor. Port and
OCean Engineering Under Arctic Conditions, volume II, Fairbanks, AK; University of
Alaska.
Manci, K. M., D. N. Gladwin, R. Villella, and M. G. Cavendish. 1988. Effects of aircraft noise
and sonic booms on domestic animals and wildlife: A literature synthesis. U.S. Fish and
Wildlife Service, National Ecology Research Center, Ft. Collins, Colorado.
Mann, D. A., Z. Lu, M. C. Hastings, and A. N. Popper. 1998. Detection of ultrasonic tones and
simulated dolphin echolocation clicks by a teleost fish, the American shad (Alosa
sapidissima). Journal of the Acoustical Society of America 104(1):562-568.
Mann, S., N. H. Sparks, M. M. Walker, and J. L. Kirschvink. 1988. ULTRASTRUCTURE,
MORPHOLOGY AND ORGANIZATION OF BIOGENIC MAGNETITE FROM
SOCKEYE SALMON, ONCORHYNCHUS NERKA: IMPLICATIONS FOR
MAGNETORECEPTION. J. Exp. Biol. 140:35-49.
648
Biological Opinion and Conference Report on Navy NWTT Activities and NMFS’ MMPA Incidental Take Authorization PCTS FPR-2015-9110
Manning, D. J., and J. Martini-Lamb. 2012. Russian River Biological Opinion status and data
report year 2011-12. Sonoma County Water Agency, Santa Rosa, CA.
Mantua, N. 2002. Pacific-Decadal Oscillation (PDO). Pages 592-594 in M. C. MacCracken, and
J. S. Perry, editors. Encyclopedia of global environmental change. Volume 1: The earth
system: Physical and chemical dimensions of global environmental change. John Wiley
& Sons, Ltd., Chichister, England.
Mantua, N., and S. R. Hare. 2002a. The Pacific Decadal Oscillation. Journal of Oceanography
58:35-44.
Mantua, N. J., and S. R. Hare. 2002b. The Pacific Decadal Oscillation. Journal of Oceanography
58:35-44.
Mantua, N. J., S. R. Hare, Y. Zhang, J. M. Wallace, and R. C. Francis. 1997. A Pacific
interdecadal climate oscillation with impacts on salmon production. Bulletin of the
American Meteorological Society 78(6):1069-1079.
Manzano-Roth, R. A., E. Henderson, S. W. Martin, and B. Matsuyama. 2013a. The Impact of a
U.S. Navy Training Event on Beaked Whale Dives in Hawaiian Waters., Prepared by
SPAWAR Systems Center for Commander, U.S. Pacific Fleet as a Technical Report and
submitted to National Marine Fisheries Service as part of Department of the Navy, 2014,
Marine Species Monitoring for the U.S. Navy’s Hawaii Range Complex 2013 Annual
Report.
Manzano-Roth, R. A., E. E. Henderson, S. W. Martin, and B. Matsuvama. 2013b. Impacts of a
U.S. Navy training event on beaked whale dives in Hawaiian waters. Chief of Naval
Operations (N45).
Manzer, J. I. 1964. Preliminary observations on the vertical distributions of Pacific salmon
(genus Oncorhynchus) in the Gulf of Alaska. Journal of the Fisheries Research Board of
Canada 21:891-903.
Marcano, L. A., and J. J. Alió-M. 2000. Incidental capture of sea turtles by the industrial
shrimping fleet off northwestern Venezuela. Pages 107 in F. A. Abreu-Grobois, R.
Briseño-Dueñas, R. Márquez-Millán, and L. Sarti-Martínez, editors. 18th International
Sea Turtle Symposium. U.S. Department of Commerce.
Marcoux, M., H. Whitehead, and L. Rendell. 2006. Coda vocalizations recorded in breeding
areas are almost entirely produced by mature female sperm whales (Physeter
macrocephalus). Canadian Journal of Zoology 84(4):609-614.
Marine Species Modeling Team. 2013. Determination of Acoustic Effects on Marine Mammals
and Sea Turtles for the Phase II Northwest Training and Testing Environmental Impact
Statement/Overseas Environmental Impact Statement, NUWC-NPT Technical Report
XX,XX, Navy Undersea Warfare Center, Code 70, Newport, RI.
Marine Species Modeling Team. 2014. Determination of acoustic effects on marine mammals
and sea turtles for the Northwest Training and Testing environmental impact
statement/overseas environmental impact statement, Naval Undersea Warfare Center
Division, Newport, Rhode Island.
Marques, T. A., L. Thomas, J. Ward, N. DiMarzio, and P. L. Tyack. 2009. Estimating cetacean
population density using fixed passive acoustic sensors: An example with Blainville's
beaked whales. Journal of the Acoustical Society of America 125(4):1982-1994.
Márquez, M. R. 1990. Sea turtles of the world. An annotated and illustrated catalogue of sea
turtle species known to date.
649
Biological Opinion and Conference Report on Navy NWTT Activities and NMFS’ MMPA Incidental Take
Authorization PCTS FPR-2015-9110
Marsili, L., and S. Focardi. 1996. Organochlorine levels in subcutaneous blubber biopsies of fin
whales (Balaenoptera physalus) and striped dolphins (Stenella coeruleoalba) from the
Mediterranean Sea. Environmental Pollution 91(1):1-9.
Martin, K. J., and coauthors. 2012. Underwater hearing in the loggerhead turtle (Caretta caretta):
a comparison of behavioral and auditory evoked potential audiograms. The Journal of
Experimental Biology 215(17):3001-3009.
Martin, S. W., and R. A. Manzano-Roth. 2012. Estimated acoustic exposures on marine
mammals sighted during a US Naval training event in February 2011. , SPAWAR
Systems Center Pacific, San Diego, California.
Martin, S. W., C. R. Martin, B. Matsuama, and E. E. Henderson. 2015a. Minke whales respond
to US Navy training in Hawaiian waters. Journal of the Acoustical Society of America
137(5).
Martin, S. W., C. R. Martin, B. Matsuyama, and E. Henderson. 2014. Minke whales respond to
US Navy training in Hawaiian waters.
Martin, S. W., C. R. Martin, B. M. Matsuyama, and E. E. Henderson. 2015b. Minke whales
(Balaenoptera acutorostrata) respond to navy training. Journal of the Acoustical Society
of America 137(5):2533-2541.
Martineau, D. 2007. Potential synergism between stress and contaminants in free-ranging
cetaceans. International Journal of Comparative Psychology (20):194-216.
Masaki, Y. 1976. Biological studies on the North Pacific sei whale. Bulletin of Far Seas Fishery
Research 14:1-104.
Masaki, Y. 1977. The separation of the stock units of sei whales in the North Pacific. Report of
the International Whaling Commission (Special Issue 1):71-79.
Maser, C., B. R. Mate, J. F. Franklin, and C. T. Dyrness. 1981. Natural history of Oregon coast
mammals. U.S. Department of Agriculture, Forest Service, PNW-133, Portland, OR.
Matarese, A. C., A. W. Kendall, D. M. Blood, and B. M. Vinter. 1989. Laboratory guide to early
life history stages of northeast Pacific fishes. NOAA.
Mate, B. 2013. Improved satellite-monitored radio tags for large whales: Dependable ARGOS
location-only tags and a GPS-linked ARGOS tag reveal 3-dimensional body-orientation
and surface movements. Office of Naval Research.
Mate, B., A. Bradford, G. Tsidulko, V. Vertyankin, and V. Ilyashenko. 2011. Late-feeding
season movements of a western North Pacific gray whale off Sakhalin Island, Russia and
subsequent migration into the eastern North Pacific. International Whaling Commission-
Scientific Committee, Tromso, Norway.
Mate, B., L. Irvine, and T. Follett. 2014. Offshore Gray Whale Satellite Tagging in the
Northwest Training Range Complex (NWTRC), Prepared by Oregon Statue University
for Commander, U.S. Pacific Fleet, Pearl Harbor, Hawaii. Submitted to Naval Facilities
Engineering Command Northwest (NAVFAC NW), Silverdale, WA 98315-1101, under
Contract # N62470-10-D-3011, issued to HDR Inc., San Diego, California 92123. June
2014.
Mate, B., and coauthors. 2015. Final Report Baleen (Blue & Fin) Whale Tagging in Southern
California in Support of Marine Mammal Monitoring Across Multiple Navy Training
Areas (SOCAL, NWTRC, GOA) Final Report. Prepared for Commander, U.S. Pacific
Fleet. Submitted to Naval Facilities Engineering Command Pacific, Pearl Harbor, Hawaii
under Contract No. N62470-10-D-3011, Task Orders JP03 and KB27 issued to HDR,
Inc., San Diego, California. 31 July 2015.
650
Biological Opinion and Conference Report on Navy NWTT Activities and NMFS’ MMPA Incidental Take Authorization PCTS FPR-2015-9110
Mate, B. R., B. A. Lagerquist, and J. Calambokidis. 1998. The movements of North Pacific blue
whales off southern California and their southern fall migration. The World Marine
Mammal Science Conference, 20-24 January Monaco. p.87-88. (=Twelth Biennial
Conference on the Biology of Marine Mammals).
Mate, B. R., K. M. Stafford, and D. K. Ljungblad. 1994. A change in sperm whale (Physeter
macrocephalus) distribution correlated to seismic surveys in the Gulf of Mexico. Journal
of the Acoustical Society of America 96(5 Pt.2):3268-3269. the 128th Meeting of the
Acoustical Society of America. Austin, Texas. 28 Nov.-2 Dec.
Matkin, C. O., and coauthors. 2003. Photographic and acoustic monitoring of killer whales in
Prince William Sound and Kenai Fjords. North Gulf Oceanic Society, Homer, Alaska.
Matsuoka, K., T. Hakamada, and T. Miyashita. 2013a. Research plan for a cetacean sighting
surveys in the western North Pacific in 2013. IWC Scientific Committee, Jeju, Korea.
Matsuoka, K., S. Mizroch, Y.-R. An, S. Kumagai, and K. Hirose. 2013b. Cruise report of the
2012 IWC-Pacific Ocean Whale and Ecosystem Research (IWC-POWER). IWC
Scientific Committee, Jeju, Korea.
May-Collado, L. J., and S. G. Quinones-Lebron. 2014. Dolphin changes in whistle structure with
watercraft activity depends on their behavioral state. Journal of the Acoustical Society of
America 135(4):EL193-EL198.
May-Collado, L. J., and D. Wartzok. 2008. A comparison of bottlenose dolphin whistles in the
Atlantic Ocean: Factors promoting whistle variation. Journal of Mammalogy 89(5):1229
1240.
Maybaum, H. L. 1990. Effects of a 3.3 kHz sonar system on humpback whales, Megaptera
novaeangliae, in Hawaiian waters. EOS 71:92.
Maybaum, H. L. 1993. Responses of humpback whales to sonar sounds. Journal of the
Acoustical Society of America 94(3 Part 2):1848-1849.
Mazaris, A. D., A. S. Kallimanis, S. P. Sgardelis, and J. D. Pantis. 2008. Do long-term changes
in sea surface temperature at the breeding areas affect the breeding dates and
reproduction performance of Mediterranean loggerhead turtles? Implications for climate
change. Journal of Experimental Marine Biology and Ecology.
MBC. 1987. Ecology of important fisheries species offshore California. Minerals Management
Service, Camarillo, California.
McCall-Howard, M. P. 1999. Sperm whales Physter macrocephalus in the Gully, Nova Scotia:
population, distribution and responses to seismic surveying. Biology Department,
Dalhousie University.
McCarthy, E., and coauthors. 2011. Changes in spatial and temporal distribution and vocal
behavior of Blainville's beaked whales (Mesoplodon densirostris) during multiship
exercises with mid-frequency sonar. Marine Mammal Science 27(3):E206-E226.
McCauley, R. D., and D. H. Cato. 2000. Patterns of fish calling in a nearshore environment in
the Great Barrier Reef. Philosophical Transactions of the Royal Society of London,
Series B: Biological Sciences 355:1289-1293.
McCauley, R. D., and coauthors. 2000. Marine seismic surveys: Analysis and propagation of air-
gun signals; and effects of air-gun exposure on humpback whales, sea turtles, fishes and
squid Curtin University of Technology, Western Australia.
McCauley, R. D., J. Fewtrell, and A. N. Popper. 2003. High intensity anthropogenic sound
damages fish ears. Journal of the Acoustical Society of America 113(1):638-642.
651
Biological Opinion and Conference Report on Navy NWTT Activities and NMFS’ MMPA Incidental Take
Authorization PCTS FPR-2015-9110
McCauley, R. D., M.-N. Jenner, C. Jenner, K. A. McCabe, and J. Murdoch. 1998. The response
of humpback whales (Megaptera novaeangliae) to offshore seismic survey noise:
Preliminary results of observations about a working seismic vessel and experimental
exposures. Appea Journal 38:692-707.
McCullough, D. 1999. A review and synthesis of effects of alterations to the water temperature
regime on freshwater life stages of salmonids, with special referene to Chinook salmon.
Columbia Intertribal Fisheries Commission, Portland, OR. Prepared for the U.S.
Environmental Protection Agency Region 10. Published as EPA 910-R-99-010.
McDonald, M. A., J. Calambokidis, A. M. Teranishi, and J. A. Hildebrand. 2001a. The acoustic
calls of blue whales off California with gender data. Journal of the Acoustical Society of
America 109(4):1728-1735.
McDonald, M. A., J. Calambokidis, A. M. Teranishi, and J. A. Hildebrand. 2001b. The acoustic
calls of blue whales off California with gender data. (Balaenoptera musculus). Journal of
the Acoustical Society of America 109(4):1728-1735.
Mcdonald, M. A., J. A. Hildebrand, and S. Mesnick. 2009. Worldwide decline in tonal
frequencies of blue whale songs. Endangered Species Research 9(1):13-21.
McDonald, M. A., J. A. Hildebrand, and S. C. Webb. 1995. Blue and fin whales observed on a
seafloor array in the northeast Pacific. Journal of the Acoustical Society of America 98(2
Part 1):712-721.
McDonald, M. A., J. A. Hildebrand, and S. M. Wiggins. 2006a. Increases in deep ocean ambient
noise in the Northeast Pacific west of San Nicolas Island, California. Journal of the
Acoustical Society of America 120(2):711-718.
McDonald, M. A., and coauthors. 2005. Sei whale sounds recorded in the Antarctic. Journal of
the Acoustical Society of America 118(6):3941-3945.
McDonald, M. A., S. L. Mesnick, and J. A. Hildebrand. 2006b. Biogeographic characterisation
of blue whale song worldwide: Using song to identify populations. Journal of Cetacean
Research And Management 8(1):55-65.
McElhany, P., M. Chilcote, J. Myers, and R. Beamesderfer. 2007. Viability status of Oregon
salmon and steelhead populations in the Willamette and Lower Columbia Basins.
Prepared for Oregon Department of Fish and Wildlife and National Marine Fisheries
Service, Portland, Oregon.
McElhany, P., M. H. Ruckelshaus, M. J. Ford, T. C. Wainwright, and E. P. Bjorkstedt. 2000a.
Viable salmonid populations and the recovery of evolutionarily significant units. National
Oceanic and Atmospheric Administration, National Marine Fisheries Service, Northwest
Fisheries Science Center.
McElhany, P., M. H. Ruckelshaus, M. J. Ford, T. C. Wainwright, and E. P. Bjorkstedt. 2000b.
Viable salmonid populations and the recovery of evolutionarily significant units. Pages
156 p in U.S. Department of Commerce, editor.
McEwan, D., and T. A. Jackson. 1996. Steelhead restoration and management plan for
California. California Department of Fish and Game, Sacramento, California.
McEwan, D. R. 2001. Central valley steelhead. Pages 1-43 in R. L. Brown, editor. Contributions
to the Biology of the Central Valley Salmonids. California Department of Fish and
Game, Sacramento, California.
McFarlane, G. A., and R. J. Beamish. 1992. Climatic influence linking copepod production with
strong yearclasses in sablefish, Anoplopoma fimbria. Canadian Journal of Fisheries and
Aquatic Sciences 49:743-753.
652
Biological Opinion and Conference Report on Navy NWTT Activities and NMFS’ MMPA Incidental Take Authorization PCTS FPR-2015-9110
McGregor, P. K. 2013. Designing experiments to test for behavioural effects of sound.
Bioacoustics 17:336-338.
Mckenna, M. F. 2011. Blue whale response to underwater noise from commercial ships.
University of California, San Diego.
McKenna, M. F., S. L. Katz, S. M. Wiggins, D. Ross, and J. A. Hildebrand. 2012a. A quieting
ocean: Unintended consequence of a fluctuating economy. Journal of the Acoustical
Society of America 132(3):EL169-EL175.
McKenna, M. F., D. Ross, S. M. Wiggins, and J. A. Hildebrand. 2012b. Underwater radiated
noise from modern commercial ships. Journal of the Acoustical Society of America
131(2):92-103.
McKenna, M. F., S. M. Wiggins, and J. A. Hildebrand. 2013. Relationship between container
ship underwater noise levels and ship design, operational and oceanographic conditions.
Scientific Reports 3:1-10.
McMahon, C. R., and G. C. Hays. 2006. Thermal niche, large-scale movements and implications
of climate change for a critically endangered marine vertebrate. Global Change Biology
12(7):1330-1338.
McPherson, S., and J. C. Woodey. 2009. Cedar River and Lake Washington sockeye salmon
biological reference point estimates. Fisheries Consultant Submitted to Washington
Department of Fisheries and Wildlife
McSweeney, D. J., K. C. Chu, W. F. Dolphin, and L. N. Guinee. 1989. North Pacific humpback
whale songs - a comparison of southeast Alaskan feeding ground songs with Hawaiian
wintering ground songs. Marine Mammal Science 5(2):139-148.
McVey, J. P., and T. Wibbels. 1984. The growth and movements of captive-reared Kemp's ridley
sea turtles, Lepidochelys kempi, following their release in the Gulf of Mexico. NOAA,
National Marine Fisheries Service, Southeast Fisheries Center, Galveston Laboratory,
Galveston,Texas.
Meehan, W. R., and T. R. Bjornn. 1991. Salmonid distributions and life histories: Cutthroat
trout. Influence of forest and rangeland management on salmonid fishes and their
habitats. Bethesda, American Fisheries Society Special Publication 19:66-67.
Meier, S. K., and coauthors. 2007. Distribution and abundance of western gray whales off
northeastern Sakhalin Island, Russia, 2001-2003. Environmental Monitoring and
Assessment 134(1-3):107-136.
Melbourne, B. A., and A. Hastings. 2008. Extinction risk depends strongly on factors
contributing to stochasticity. Nature (454):100-103.
Melcon, M. L., and coauthors. 2012. Blue whales respond to anthropogenic noise. PLoS ONE
7(2):e32681.
Mellinger, D. K., and C. W. Clark. 2003. Blue whale (Balaenoptera musculus) sounds from the
North Atlantic. Journal of the Acoustical Society of America 114(2):1108-1119.
Mellinger, D. K., K. M. Stafford, and C. G. Fox. 2004a. Seasonal occurrence of sperm whale
(Physeter macrocephalus) sounds in the Gulf of Alaska, 1999-2001. Marine Mammal
Science 20(1):48-62.
Mellinger, D. K., K. M. Stafford, S. E. Moore, L. Munger, and C. G. Fox. 2004b. Detection of
North Pacific right whale (Eubalaena japonica) calls In the Gulf of Alaska. Marine
Mammal Science 20(4):872-879.
Merkel, T. J. 1957. Food habits of the king salmon Oncorhynchus tshawytscha. California Fish
and Game 43:249-270.
653
Biological Opinion and Conference Report on Navy NWTT Activities and NMFS’ MMPA Incidental Take Authorization PCTS FPR-2015-9110
Merz, J. E. 1994. A dietary analysis of juvenile Sacramento squawfish (Ptychocheilus grandis),
Chinook salmon (Oncorhynchus tshawytcha), and steelhead trout (O. mykiss) in the
Lower American River, Sacramento County, California. California State University,
Sacramento, CA.
Metcalfe, C., B. Koenig, T. Metcalfe, G. Paterson, and R. Sears. 2004. Intra- and inter-species
differences in persistent organic contaminants in the blubber of blue whales and
humpback whales from the Gulf of St. Lawrence, Canada. Marine Environmental
Research 57:245–260.
Metheny, M., and W. Duffy. 2014. Sonar estimation of adult salmonid abundance in Redwood
Creek, Humboldt County, California 2012-2013, U.S. Geological Survey, California
Cooperative Fish and Wildlife Research Unit Humboldt State University Report for
California Department of Fish and Wildlife Fisheries Restoration Grants Program
(Project Number: P1010301). March 2014.
Methot, R. D., and J. J. Stewart. 2005. Status of the U.S. canary rockfish resource in 2005.
National Marine Fisheries Service, NWFSC, Seattle, Washington.
Meyer, M., and A. N. Popper. 2002. Hearing in "primitive" fish: brainstem responses to pure
tone stimuli in the lake sturgeon, Acipenser fulvescens. Pages 11-12 in Abstracts of the
Association for Research in Otolaryngology.
Meyers, J. M., and coauthors. 1998. Status review of Chinook salmon from Washington, Idaho,
Oregon, and California. National Oceanic and Atmospheric Administration, National
Marine Fisheries Service, Northwest Fisheries Science Center.
Miksis, J. L., and coauthors. 2001. Cardiac responses to acoustic playback experiments in the
captive bottlenose dolphin (Tursiops truncatus). Journal of Comparative Psychology
115(3):227-232.
Miller, B. S., and S. F. Borton. 1980. Geographical distribution of Puget Sound fishes: Maps and
data source sheets. University of Washington Fisheries Research Institute.
Miller, D. J., and J. J. Geibel. 1973. Summary of blue rockfish and lingcod life histories; a reef
ecology study; and giant kelp, Macrocystis pyrifera, experiments in Monterey Bay,
California. Fishery Bulletin 137.
Miller, D. J., and R. N. Lea. 1972. Guide to the coastal marine fishes of California. Fishery
Bulletin 157:1-249.
Miller, J. D. 1974. Effects of noise on people. Journal of the Acoustical Society of America
56(3):729-764.
Miller, J. D., C. S. Watson, and W. P. Covell. 1963. Deafening effects of noise on the cat. Acta
Oto-Laryngologica Supplement 176:1-88.
Miller, M. H., and coauthors. 2014. Status review report: scalloped hammerhead shark (Sphyrna
lewini). National Marine Fisheries Service, NOAA.
Miller, M. J. 2004. The ecology and functional morphology of North American sturgeon and
paddlefish. Pages 87-102 in T. Greg, O. LeBreton, F. William, H. Beamish, and R. S.
McKinley, editors. Sturgeon and Paddlefish of North America. Kluwer Academic
Publishers, Netherlands.
Miller, P., and coauthors. 2011. The 3S experiments: Studying the behavioural effects of naval
sonar on killer whales (Orcinus orca), sperm whales (Physeter macrocephalus), and
long-finned pilot whales (Globicephala melas) in Norwegian waters. Scottish Oceans
Institute.
654
Biological Opinion and Conference Report on Navy NWTT Activities and NMFS’ MMPA Incidental Take Authorization PCTS FPR-2015-9110
Miller, P. J. O. 2006. Diversity in sound pressure levels and estimated active space of resident
killer whale vocalizations. Journal of Comparative Physiology A (192):449-459.
Miller, P. J. O., N. Biassoni, A. Samuels, and P. L. Tyack. 2000. Whale songs lengthen in
response to sonar. Nature 405(6789):903.
Miller, P. J. O., and coauthors. 2009. Using at-sea experiments to study the effects of airguns on
the foraging behavior of sperm whales in the Gulf of Mexico. Deep Sea Research Part I:
Oceanographic Research Papers 56(7):1168-1181.
Miller, P. J. O., M. P. Johnson, and P. L. Tyack. 2004. Sperm whale behaviour indicates the use
of echolocation click buzzes 'creaks' in prey capture. Proceedings of the Royal Society of
London Series B Biological Sciences 271(1554):2239-2247.
Miller, P. J. O., and coauthors. 2012. The severity of behavioral changes observed during
experimental exposures of killer (Orcinus orca), long-finned pilot (Globicephala melas),
and sperm (Physeter macrocephalus) whales to naval sonar. Aquatic Mammals
38(4):362-401.
Miller, R. J., and E. L. Brannon. 1982. The origin and development of life history patterns in
Pacific salmonids. Pages 296-309 in E. L. Brannon, and E. O. Salo, editors. The Salmon
and Trout Migratory Behavior Symposium. School of Fisheries, University of
Washington, Seattle, Washington.
Minobe, S. 1997. A 50-70 year climatic oscillation over the North Pacific and North America.
Geophysical Research Letters 24(6):683-686.
Minobe, S. 1999. Resonance in bidecadal and pentadecadal climate oscillations over the North
Pacific: Role in climatic regime shifts. Geophysical Research Letters 26(7):855-858.
Mintz, J., and R. Filadelfo. 2011. Exposure of marine mammals to broadband radiated noise.
CNA Analysis & Solutions.
Mintz, J. D., and C. L. Parker. 2006. Vessel traffic and speed around the U.S. coasts and around
Hawaii. CNA Corporation, Alexandria, Virginia.
Misund, O. 1997. Underwater acoustics in marine fisheries and fisheries research. Reviews in
Fish Biology and Fisheries 7:1-34.
Mitchell, E. 1974. Present status of northwest Atlantic fin and other whale stocks. Pages 108-169
in W. E. Schevill, editor. The whale problem: A status report. Harvard University Press,
Cambridge, MA.
Miyashita, T., H. Kato, and T. Kasuya. 1995. Worldwide map of cetacean distribution based on
Japanese sighting data (Volume 1). National Research Institute of Far Seas Fisheries,
Shizuoka.
Miyazaki, N. 1989. Notes on the school composition of killer whales (Orcinus orca) in the
Southern Hemisphere. Bulletin of the National Science Museum Series A-Zoology
15(1):53-59.
Mizroch, S. A., D. W. Rice, and J. M. Breiwick. 1984. The blue whale, Balaenoptera musculus.
Marine Fisheries Review 46(4):15-19.
Mizroch, S. A., D. W. Rice, D. Zwiefelhofer, J. Waite, and W. L. Perryman. 2009. Distribution
and movements of fin whales in the North Pacific Ocean. Mammal Review 39(3):193
227.
MMC. 2006. Advisory committee on acoustic impacts on marine mammals. Marine Mammal
Commission.
655
Biological Opinion and Conference Report on Navy NWTT Activities and NMFS’ MMPA Incidental Take Authorization PCTS FPR-2015-9110
Mobley Jr., J. R., and A. F. Pacini. 2013. Aerial Survey Monitoring for Marine Mammals and
Sea Turtles in the Hawaii Range Complex in Conjunction with a Navy Training Event,
SCC February 19-21 and August 12-13, 2013, Final Field Report. .
Moein Bartol, S., and J. A. Musick. 2003. Sensory biology of sea turtles. Pages 90-95 in P. L.
Lutz, J. A. Musick, and J. Wyneken, editors. The Biology of Sea Turtles, volume II. CRC
Press, Boca Raton, Florida.
Moein Bartol, S. E., and coauthors. 1995. Evaluation of seismic sources for repelling sea turtles
from hopper dredges. Pages 90-93 in L. Z. Hales, editor. Sea Turtle Research Program:
Summary Report, volume Technical Report CERC-95. U.S. Army Engineer Division,
South Atlantic and U.S. Naval Submarine Base, Kings Bay, GA.
Moein, S. E., and coauthors. 1994. Evaluation of seismic sources for repelling sea turtles from
hopper dredges. U.S. Army Corps of Engineers, Waterways Experiment Station.
Virginia Institute of Marine Science (VIMS), College of William and Mary, Gloucester
Point, Virginia.
Møhl, B., M. Wahlberg, P. T. Madsen, A. Heerfordt, and A. Lund. 2003. The monopulsed nature
of sperm whale clicks. Journal of the Acoustical Society of America 114:12.
Mohl, B., M. Wahlberg, P. T. Madsen, A. Heerfordt, and A. Lund. 2003. The monopulsed nature
of sperm whale clicks. Journal of the Acoustical Society of America 114(2):1143-1154.
Monnahan, C. C., T. A. Branch, and A. E. Punt. 2014a. Do ship strikes threaten the recovery of
endangered eastern North Pacific blue whales? Marine Mammal Science.
Monnahan, C. C., T. A. Branch, K. M. Stafford, Y. V. Ivashchenko, and E. M. Oleson. 2014b.
Estimating historical eastern North Pacific blue whale catches using spatial calling
patterns. PLoS ONE 9(6):e98974.
Mooney, T. A. 2009. Deafening dolphins. Nature 458:810.
Mooney, T. A., P. E. Nachtigall, M. Breese, S. Vlachos, and W. W. L. Au. 2009a. Predicting
temporary threshold shifts in a bottlenose dolphin (Tursiops truncatus): The effects of
noise level and duration. Journal of the Acoustical Society of America 125(3):1816-1826.
Mooney, T. A., and coauthors. 2008. Hearing pathways and directional sensitivity of the beluga
whale, Delphinapterus leucas. Journal of Experimental Marine Biology and Ecology
362(2):108-116.
Mooney, T. A., P. E. Nachtigall, and S. Vlachos. 2009b. Sonar-induced temporary hearing loss
in dolphins. Biology Letters 5(4):565-567.
Moore, J. E., and J. Barlow. 2011. Bayesian state-space model of fin whale abundance trends
from a 1991-2008 time series of line-transect surveys in the California Current. Journal of
Applied Ecology 48(5):1195-1205.
Moore, J. E., and J. P. Barlow. 2013. Declining abundance of beaked whales (family Ziphiidae)
in the California Current Large Marine Ecosystem. PLoS ONE 8(1):e52770.
Moore, M. E., B. A. Berejikian, and E. P. Tezak. 2010a. Early marine survival and behavior of
steelhead smolts through Hood Canal and the Strait of Juan de Fuca. Transactions of
American Fisheries Society 139:49-61.
Moore, M. E., B. A. Berejikian, and E. P. Tezak. 2010b. Early marine survival and behavior of
steelhead smolts through Hood Canal and the Strait of Juan de Fuca. Transactions of the
American Fisheries Society 139:49-61.
Moore, M. J., and coauthors. 2009. Gas bubbles in seals, dolphins, and porpoises entangled and
drowned at depth in gillnets. Veterinary Pathology 46(3):536-547.
656
Biological Opinion and Conference Report on Navy NWTT Activities and NMFS’ MMPA Incidental Take Authorization PCTS FPR-2015-9110
Moore, S. E. 2000. Variability of cetacean distribution and habitat selection in the Alaskan
Arctic, autumn 1982-91. Arctic 53(4):448-460.
Moore, S. E., and coauthors. 1998. Seasonal variation in reception of fin whale calls at five
geographic areas in the north Pacific. Marine Mammal Science 14(3):617-627.
Moore, S. E., K. M. Stafford, D. K. Mellinger, and J. A. Hildebrand. 2006. Listening for large
whales in the offshore waters of Alaska. BioScience 56(1):49-55.
Moran, J. R., S. D. Rice, and S. F. Teerlink. 2009. Humpback Whale Predation on Pacific
Herring in Southern Lynn Canal: Testing a Top-down Hypothesis, Alaska Marine
Science Symposium, Anchorage, AK, Jan 2008.
Morejohn, G. V., J. T. Harvey, and L. T. Krasnow. 1978. The importance of Loligo opalescens
in the food web of marine vertebrates in Monterey Bay, California. Pages 67-98 in C. W.
Recksiek, and H. W. Frey, editors. Biological, Oceanographic, and Acoustic Aspects of
the Market Squid, Loligo opalescens
Moretti, D. 2009. Passive portable detection and localization of beaked whales. Office of Naval
Research.
Moretti, D., and coauthors. 2014. A risk function for behavioral disruption of Blainsville's
beaked whales (Mesopiodon densirostris) from mid-frequency active sonar. Plos One
9(1).
Morreale, S. J., E. A. Standora, F. V. Paladino, and J. R. Spotila. 1994. Leatherback migrations
along deepwater bathymetric contours. Pages 109-110 in B. A. Schroeder, and B. E.
Witherington, editors. Proceedings of the Thirteenth Annual Symposium on Sea Turtle
Biology and Conservation.
Moser, H. G. 1967. Reproduction and development of Sebastodes paucispinis and comparison
with other rockfishes off southern California. Copeia 4:773-797.
Moser, H. G. 1996a. The early life stages of fishes in the California current region. National
Oceanic and Atmospheric Administration, National Marine Fisheries Service, La Jolla,
California.
Moser, H. G. 1996b. Scorpaenidae: scorpionfishes and rockfishes. Pages 733-795 in H. G.
Moser, editor. The early life stages of fishes in the California current region. Allen Press,
Lawrence, Kansas.
Moser, H. G., and G. W. Boehlert. 1991. Ecology of pelagic larvae and juveniles of the genus
Sebastes. Environmental Biology of Fishes 30:203-224.
Moser, H. G., and coauthors. 2000a. Abundance and distribution of rockfish (Sebastes) larvae in
the southern California Bight in relation to environmental conditions and fishery
exploitation. California Cooperative Oceanic Fisheries Report.
Moser, H. G., and coauthors. 2000b. Abundance and distribution of rockfish (Sebastes) larvae in
the Southern California Bight in relation to environmental conditions and fishery
exploitation. California Cooperative Oceanic Fisheries Investigations Reports 41:132
147.
Moser, M. L., and S. T. Lindley. 2007. Use of Washington estuaries by subadult and adult green
sturgeon. Environmental Biology of Fishes 79:243-253.
Moyle, P. B. 1976. The decline of anadromous fishes in California. Conservation Biology
8(3):869-870.
Moyle, P. B. 2002a. Inland fishes of California. Pages 502 in. University of California Press,
Berkeley, CA.
657
Biological Opinion and Conference Report on Navy NWTT Activities and NMFS’ MMPA Incidental Take Authorization PCTS FPR-2015-9110
Moyle, P. B. 2002b. Inland fishes of California. Revised and Expanded. University of California
Press, Berkeley, California.
Moyle, P. B., P. J. Foley, and R. M. Yoshiyama. 1992a. Status of green sturgeon, Acipenser
Medirostris, in California. National Oceanic and Atmospheric Administration, National
Marine Fisheries Service, Terminal Island, California.
Moyle, P. B., P. J. Foley, and R. M. Yoshiyama. 1992b. Status of green sturgeon, Acipenser
medirostris, in California. University of California, Davis, California.
Moyle, P. B., R. M. Yoshiyama, J. E. Williams, and E. D. Wikramanayake. 1995a. Fish species
of special concern in California.
Moyle, P. B., R. M. Yoshiyama, J. E. Williams, and E. D. Wikramanayake. 1995b. Fish species
of special concern in California. California Department of Fish and Game, Inland
Fisheries Division.
Mrosovsky, N. 1972. Spectrographs of the sounds of leatherback turtles. Herpetologica 28(3):
256-258.
Mrosovsky, N. 1980. Thermal biology of sea turtles. American Zoologist 20:531-547.
Mueller-Blenkle, C., and coauthors. 2010. Effects of pile-driving noise on the behaviour of
marine fish. COWRIE Ltd.
Mullin, K. D., and coauthors. 1991. Whales and dolphins offshore of Alabama. Journal of the
Alabama Academy of Science 62(1):48-58.
Mundy, P. R. 1997. The role of harvest management in determining the status and future of
Pacific salmon populations. Pages 315-330 in D. J. Stouder, P. A. Bisson, and R. J.
Naiman, editors. Pacific salmon and their ecosystems: Status and future options.
Chapman Hall, New York.
Mundy, P. R., and R. T. Cooney. 2005. Physical and biological background. Pages 15-23 in P. R.
Mundy, editor. The Gulf of Alaska: Biology and oceanography. Alaska Sea Grant
College Program, University of Alaska, Fairbanks, Alaska.
Mundy, P. R., and P. Olsson. 2005. Climate and weather. Pages 25-34 in P. R. Mundy, editor.
The Gulf of Alaska: Biology and oceanography. Alaska Sea Grant College Program,
University of Alaska, Fairbanks, Alaska.
Munk, K. 2001. Maximum ages of groundfishes in waters off Alaska and British Columbia and
consideration of age determination. Alaska Fisheries Research Bulletin 8:12-21.
Murray, C. S., A. Malvezzi, C. J. Gobler, and H. Baumann. 2014. Offspring sensitivity to ocean
acidification changes seasonally in a coastal marine fish. Marine Ecology Progress Series
504:1-11.
Musick, J. A., and C. J. Limpus. 1997. Habitat Utilization and Migration in Juvenile Sea Turtles.
Pages 137-163 in P. L. Lutz, and J. A. Musick, editors. The Biology of Sea Turtles. CRC
Press, Inc., Washington, D.C.
Myers, J. M., and coauthors. 2006. Historical population structure of Pacific salmonids in the
Willamette River and lower Columbia River basins. Pages 311 p in U.S. Department of
Commerce, editor.
Myrberg Jr., A. A. 1980. Fish bio-acoustics: its relevance to the 'not so silent world'.
Environmental Biology of Fishes 5(4):297-304.
Nachtigall, P. E., J. L. Pawloski, and W. W. L. Au. 2003. Temporary threshold shifts and
recovery following noise exposure in the Atlantic bottlenosed dolphin (Tursiops
truncatus). Journal of the Acoustical Society of America 113(6):3425-3429.
658

Biological Opinion and Conference Report on Navy NWTT Activities and NMFS’ MMPA Incidental Take Authorization PCTS FPR-2015-9110
Nachtigall, P. E., A. Y. Supin, J. L. Pawloski, and W. W. L. Au. 2004. Temporary threshold
shifts after noise exposure in the bottlenose dolphin (Tursiops truncatus) measured using
evoked auditory potentials. Marine Mammal Science 20(4):672-687.
Nakamoto, R. J., T. T. Kisanuki, and G. H. Goldsmith. 1995. Age and growth of Klamath River
green sturgeon (Acipenser medirostris). Project #93-FP-13. U.S. Fish and Wildlife
Service.
Nasu, K. 1974. Movements of baleen whales in relation to hydrographic conditions in the
northern part of the North Pacific Ocean, Bering Sea. Pages 345-361 in D. W. Hood, and
E. J. Kelley, editors. Oceanography of the Bering Sea. University of Alaska, Fairbanks,
Alaska.
Navy. 2010. Annual Range Complex Exercise Report 2 August 2009 to 1 August 2010 U.S.
Navy Southern California (SOCAL) Range Complex and Hawaii Range Complex (HRC)
Navy. 2011. Annual Range Complex Unclassified Exercise Report: Year 1 for the U.S. Navy's
Northwest Training Range Complex (NWTRC). Department of the Navy, U.S. Pacific
Fleet.
Navy. 2012a. Annual Range Complex Unclassified Exercise Report: Year 2 for the U.S. Navy's
Northwest Training Range Complex (NWTRC). Department of the Navy, U.S. Pacific
Fleet.
Navy. 2012b. Marine Species Monitoring for the U.S. Navy’s Southern California Range
Complex- Annual Report 2012. U.S. Pacific Fleet, Environmental Readiness Division,
U.S. Department of the Navy, Pearl Harbor, HI.
Navy. 2013. Hawaii-Southern California Training and Testing Activities Final Environmental
Impact Statement/Overseas Environmental Impact Statement.
Neave, F., T. Yonemori, and R. G. Bakkala. 1976. Distribution and origin of chum salmon in
offshore waters of the North Pacific Ocean. International North Pacific Fisheries
Commission.
Nelson, M., M. Garron, R. L. Merrick, R. M. Pace III, and T. V. N. Cole. 2007. Mortality and
serious injury determinations for baleen whale stocks along the United States eastern
seaboard and adjacent Canadian Maritimes, 2001-2005. U.S. Department of Commerce,
NOAA, Northeast Fisheries Science Center.
Nemoto, T. 1957. Foods of baleen whales in the northern Pacific. Scientific Reports of the
Whales Research Institute Tokyo 12:33-89.
Nemoto, T. 1964. School of baleen whales in the feeding areas. Scientific Reports of the Whales
Research Institute Tokyo 18:89-110.
Nemoto, T., and A. Kawamura. 1977. Characteristics of food habits and distribution of baleen
whales with special reference to the abundance of North Pacific sei and Bryde's whales.
Report of the International Whaling Commission (Special Issue 1):80-87.
New, L. F., and coauthors. 2014. Using short-term measures of behaviour to estimate long-term
fitness of southern elephant seals. Marine Ecology Progress Series 496:99-108.
New, L. F., D. J. Moretti, S. K. Hooker, D. P. Costa, and S. E. Simmons. 2013. Using energetic
models to investigate the survival and reproduction of beaked whales (family Ziphiidae).
PLoS ONE 8(7):e68725.
Nichol, L. M., and D. M. Shackleton. 1996. Seasonal movements and foraging behaviour of
northern resident killer whales (Orcinus orca) in relation to the inshore distribution of
salmon (Oncorhynchus spp ) in British Columbia. Canadian Journal of Zoology 74(6):9.
659
Biological Opinion and Conference Report on Navy NWTT Activities and NMFS’ MMPA Incidental Take Authorization PCTS FPR-2015-9110
Nickelson, T. E. 1998. A Habit-Based Assessment of Coho Salmon Production Potential and
Spawner Escapement Needs for Oregon Coastal Streams, INFORMATION REPORTS
NUMBER 98-4. Oregon Department of Fish and Wildlife. April, 1998.
Nickelson, T. E., and coauthors. 1992. Status of anadromous salmonids in Oregon coastal basins.
Oregon Department of Fish and Wildlife, Resource Development Section and Ocean
Salmon Management, Oregon Department of Fish and Wildlife, Portland, Oregon.
NIOSH. 1998. Criteria for a recommended standard: Occupational noise exposure (revised
criteria 1998). United States Department of Health and Human Services, Centers for
Disease Control and Prevention, National Institute for Occupational Safety and Health,
Cincinnati, Ohio.
Nishemura, W., and S. Nakahigashi. 1990. Incidental capture of sea turtles by Japanese research
and training vessels: Results of a questionnaire. Marine Turtle Newsletter 51:1-4.
Nishiwaki, M. 1966. Distribution and migration of the larger cetaceans in the North Pacific as
shown by Japanese whaling results. Whales, Dolphins and Porpoises. K. S. Norris (ed.).
University of California Press, Berkeley, CA. p.171-191.
Nishiymama, T. 1984. Two important factors in oceanic stages of salmon: food and temperature.
Pages 227-258 in The Pacific Salmon Biology Conference.
Nix, P., and P. Chapman. 1985. Monitoring of underwater blasting operations in False Creek,
British Columbia Proceedings of the workshop on effects of explosive use in the marine
environment. Canada Oil and Gas Lands Administration, Environmental Protection
Branch, Ottawa, Ontario.
NMFS-AKR. 2005. Final environmental impact statement for essential fish habitat identification
and conservation in Alaska. National Marine Fisheries Service, Juneau, Alaska.
NMFS-NWR. 2005. Pacific coast groundfish fishery management plan. Essential fish habitat
designation and minimization of adverse impacts. Final environmental impact statement.
National Marine Fisheries Service-Northwest Region, Seattle, Washington.
NMFS. 1991. Final recovery plan for the humpback whale (Megaptera novaeangliae). National
Oceanic and Atmospheric Administration, National Marine Fisheries Service, Office of
Protected Resources, Silver Spring, Maryland.
NMFS. 1997a. North Atlantic right whale protection - Interim final rule. Federal Register
62(30):6729-6738.
NMFS. 1997b. Status review update for West Coast steelhead from Washington, Idaho, Oregon,
and California. Memorandum date 7 July 1997 from the biological review team to the
National Marine Fisheries Service Northwest Regional Office.
NMFS. 1998a. Draft Recovery Plan for the Fin Whale (Balaenoptera physalus) and the Sei
Whale (Balaenoptera borealis). Pages 66 in. Prepared by R.R. Reeves, G.K. Silber, and
P.M. Payne for the National Marine Fisheries Service, National Oceanic and
Atmospheric Administration, Silver Spring, Maryland.
NMFS. 1998b. Recovery plan for the blue whale (Balaenoptera musculus). National Oceanic
and Atmospheric Administration, National Marine Fisheries Service, Silver Spring,
Maryland.
NMFS. 2001. Stock assessments of loggerhead and leatherback sea turtles and an assessment of
the impact of the pelagic longline fishery on the loggerhead and leatherback sea turtles of
the western North Atlantic.
660
Biological Opinion and Conference Report on Navy NWTT Activities and NMFS’ MMPA Incidental Take Authorization PCTS FPR-2015-9110
NMFS. 2002. Report of the workshop on acoustic resonance as a source of tissue trauma in
cetaceans, April 24 and 25, 2002. Silver Spring, MD. National Oceanic and Atmospheric
Administration, National Marine Fisheries Service.
NMFS. 2005a. Assessment of acoustic exposures on marine mammals in conjunction with USS
Shoup active sonar transmissions in the eastern Strait of Juan de Fuca and Haro Strait,
Washington 5 May 2003. National Oceanic and Atmospheric Administration, National
Marine Fisheries Service.
NMFS. 2005b. Proposed conservation plan for southern resident killer whales (Orcinus orca).
National Oceanic and Atmospheric Administration, National Marine Fisheries Service,
Northwest Region, Seattle, Washington.
NMFS. 2005c. Updated status of federally listed ESUs of West Coast salmon and steelhead. U.S.
Department of Commerce.
NMFS. 2006a. Eulachon: A review of biology and an annotated bibliography. A. F. S. Center,
editor.
NMFS. 2006b. Reinitiation of section 7 consultation regarding the Pacific Fisheries Management
Council's groundfish management plan. National Marine Fisheries Service, Northwest
Region.
NMFS. 2006d. Biological Opinion on the issuance of an incidental harassment authorization to
Scripps Institution of Oceanography for a marine seismic survey in the Eastern Tropical
Pacific Ocean. National Marine Fisheries Service, Silver Spring, Maryland. 76p.
NMFS. 2007a. Draft. Dawgz 'n the hood: The Hood Canal summer chum salmon ESU. Puget
Sound Technical Recovery Team, Northwest Fisheries Science Center, National Marine
Fisheries Service, editor, Seattle.
NMFS. 2007b. Recovery plan for the Hood Canal and eastern Strait of Juan de Fuca summer
chum salmon (Oncorhynchus keta). National Marine Fisheries Service, Northwest
Region, editor, Portland, Oregon.
NMFS. 2008a. Endangered Species Act Section 7(a)(2) Consultation Biological Opinion and
Magnuson-Stevens Fishery Conservation and Management Act Essential Fish Habitat
Consultation; Consultation on the Approval of Revised Regimes under the Pacific
Salmon Treaty and the Deferral of Management to Alaska of Certain Fisheries Included
in those Regimes. N. Region, editor.
NMFS. 2008b. Final Rule for the shock trial of the USS Mesa Verde, (LPD-19). 73(145).
NMFS. 2008c. Preliminary scientific conclusions of the review of the status of 5 species of
rockfish: bocaccio (Sebastes paucispinis), canary rockfish (Sebastes pinniger), yelloweye
rockfish (Sebastes ruberrimus), greenstriped rockfish (Sebastes elongatus) and redstripe
rockfish (Sebastes proriger) in Puget Sound, Washington. NMFS, NWFSC, Seattle,
Washignton.
NMFS. 2008d. Recovery plan for southern resident killer whales (Orcinus orca). National
Oceanic and Atmospheric Administration, National Marine Fisheries Service, Northwest
Region, Seattle, Washington.
NMFS. 2008e. Taking and importing marine mammals; taking marine mammals incidental to a
U.S. Navy shock trial. Federal Register 73(143):43130-43138.
NMFS. 2009a. Middle Columbia River steelhead distinct population segment ESA recovery
plan. November 30.
661
Biological Opinion and Conference Report on Navy NWTT Activities and NMFS’ MMPA Incidental Take
Authorization PCTS FPR-2015-9110
NMFS. 2009b. Recovery plan for Lake Ozette sockeye salmon (Oncorhynchus nerka). Pages
394 pp. in National Marine Fisheries Service, Salmon Recovery Division, editor,
Portland, Oregon.
NMFS. 2009c. Sperm whale 5-year review: Summary and evaluation. National Oceanic and
Atmospheric Administration, National Marine Fisheries Service, Office of Protected
Resources, Silver Spring, Maryland.
NMFS. 2010a. Critical habitat for the southern distinct population segment of eulachon. National
Oceanic and Atmospheric Administration, National Marine Fisheries Service, Northwest
Region, Protected Resources Division.
NMFS. 2010b. Final Recovery plan for the fin whale (Balaenoptera physalus). Pages 121 in.
Office of Protected Resources, National Marine Fisheries Service, National Oceanic and
Atmospheric Administration, Silver Spring, Maryland.
NMFS. 2010c. Final Recovery plan for the sperm whale (Physeter macrocephalus). Office of
Protected Resources, National Marine Fisheries Service, National Oceanic and
Atmospheric Administration, Silver Spring, Maryland.
NMFS. 2010d. Impacts of oil on marine mammals and sea turtles. National Marine Fisheries
Service, Silver Spring, Maryland.
NMFS. 2011a. 5-year review: summary and evaluation of Lower Columbia River Chinook,
Columbia River chum, Lower Columbia River coho, and Lower Columbia River
steelhead. National Marine Fisheries Service, editor, Portland, Oregon.
NMFS. 2011b. 5-year review: summary and evaluation of Puget Sound Chinook, Hood Canal
summer chum, and Puget Sound steelhead. National Marine Fisheries Service, Portland,
Oregon.
NMFS. 2011c. 5-year review: summary and evaluation of Snake River sockeye, Snake River
spring-summer Chinook, Snake River fall-run Chinook, Snake River Basin steelhead.
National Marine Fisheries Service, Portland, Oregon.
NMFS. 2011d. 5-Year Review: Summary and Evaluation of Southern California Coast Steelhead
Distinct Population Segment National Marine Fisheries Service Southwest Region Long
Beach, CA.
NMFS. 2011e. Biological opinion on the continued authorization of reef fish fishing under the
Gulf of Mexico (Gulf) Reef Fish Fishery Management Plan (RFFMP). NMFS.
NMFS. 2011f. Central Valley Recovery Domain 5-Year Review: Summary and Evaluation of
Central Valley Spring-run Chinook Salmon ESU, Southwest Region. 34 pp.
NMFS. 2011g. Draft recovery plan for Idaho Snake River spring/summer Chinook and steelhead
populations in the Snake River spring/summer Chinook salmon evolutionarily significant
unit and Snake River steelhead distinct population segment. Portland, Oregon.
NMFS. 2011h. Endangered Species Act Section 7 Formal Consultation and Magnuson-Stevens
Fishery Conservation and Management Act Essential Fish Habitat Consultation for the
Test Pile Program at Naval Base Kitsap Bangor, Kitsap County, Washington (5th field
HUC: 17110018, Hood Canal). W. C. Region, editor.
NMFS. 2011i. Hawaii pelagic longline fishery regulation summary. National Oceanic and
Atmospheric Administration, National Marine Fisheries Service, Pacific Islands Regional
Office.
NMFS. 2011j. Marine mammal health and stranding response program website. National
Oceanic and Atmospheric Administration, National Marine Fisheries Service, Office of
Protected Resources.
662
Biological Opinion and Conference Report on Navy NWTT Activities and NMFS’ MMPA Incidental Take Authorization PCTS FPR-2015-9110
NMFS. 2011k. Pacific Science Center stranding data. Excel file containing stranding from the
Hawaiian Islands. National Oceanic and Atmospheric Administration, National Marine
Fisheries Service.
NMFS. 2011l. South-Central/Southern California Coast Steelhead Recovery Planning Domain.
Five-Year Review: Summary and Evaluation of South-Central California Coast Steelhead
Distinct Population Segment, Southwest Region, Long Beach, California.
NMFS. 2011m. Southwest Region stranding database excel file containing strandning from
Southwest Region provided to Navy. National Oceanic and Atmospheric Administration,
National Marine Fisheries Service.
NMFS. 2012a. Endangered Species Act (ESA) Section 7(a)(2) Biological Opinion and
Magnuson-Stevens Fishery Conservation and Management Act Essential Fish Habitat
(EFH) Consultation, Department of the Navy, P-191 Breakwater, Island County. W. C.
Region, editor.
NMFS. 2012b. Final Environmental Assessment: Section 10 Permit Applications by the
Washington State Department of Fish and Wildlife for Incidental Take of ESA-listed
Rockfish and Other Listed Fish within the Puget Sound/Georgia Basin and Take Due to
Scientific Research, National Marine Fisheries Service Northwest Region.
NMFS. 2012c. Public draft recovery plan for southern Oregon/northern California coast coho
salmon (Oncorhynchus kisutch). National Marine Fisheries Service, editor, Arcata,
California.
NMFS. 2013. ESA Recovery Plan for Lower Columbia River Coho Salmon, Lower Columbia
River Chinook Salmon, Columbia River Chum Salmon, and Lower Columbia River
Steelhead. National Marine Fisheries Service, Northwest Region, editor.
NMFS. 2014. Eulachon Newsletter. R. Anderson, editor. NOAA Fisheries, West Coast Region,
Portland, OR.
NMFS. 2015. Endangered Species Act (ESA) Section 7(a)(2) Biological Opinion: Continued
Prosecution of Fisheries Research Conducted and Funded by the Southwest Fisheries
Science Center; Issuance of a Letter of Authorization under the Marine Mammal Protect
Act for the Incidental Take of Marine Mammals Pursuant to those Research Activities;
and Issuance of a Scientific Research Permit under the Endangered Species Act for
Directed Take of ESA-Listed Salmonids. W. C. Region, editor.
NMFS, and USFWS. 1998a. Recovery Plan for the U.S. Pacific Populations of the Leatherback
Turtles (Dermochelys coriacea). Silver Spring, Maryland.
NMFS, and USFWS. 1998b. Recovery plan for U.S. Pacific populations of the leatherback turtle
(Dermochelys coriacea). National Oceanic and Atmospheric Administration, National
Marine Fisheries Service, Office of Protected Resources, Silver Spring, Maryland.
NMFS, and USFWS. 2007a. Leatherback sea turtle (Dermochelys coriacea) 5-year review:
Summary and evaluation. National Marine Fisheries Service and U.S. Fish and Wildlife
Service, Silver Spring, Maryland.
NMFS, and USFWS. 2007b. Loggerhead Sea Turtle (Caretta caretta) 5-Year Review: Summary
and Evaluation. National Marine Fisheries Service and U.S. Fish and Wildlife Service.
NOAA. 2004. NOAA scientists sight blue whales in Alaska: critically endangered blue whales
rarely seen in Alaska waters. NOAA.
NOAA. 2005a. What is an El Niño? National Oceanic and Atmospheric Administration.
NOAA. 2005b. What is La Niña? National Oceanic and Atmospheric Administration.
663
Biological Opinion and Conference Report on Navy NWTT Activities and NMFS’ MMPA Incidental Take
Authorization PCTS FPR-2015-9110
NOAA Fisheries. 2011. Biennial report to Congress on the recovery program for threatened and
endangered species October 1, 2008 – September 30, 2010. National Oceanic and
Atmospheric Administration, National Marine Fisheries Service, editor, Washington,
D.C.
Noren, D. P., A. H. Johnson, D. Rehder, and A. Larson. 2009. Close approaches by vessels elicit
surface active behaviors by southern resident killer whales. Endangered Species Research
8(3):179-192.
Norman, S. A., and coauthors. 2004a. Cetacean strandings in Oregon and Washington between
1930 and 2002. Journal of Cetacean Research and Management 6(1):87-99.
Norman, S. A., and coauthors. 2004b. Cetacean strandings in Oregon and Washington between
1930 and 2002. Journal of Cetacean Research And Management 6(1):87-99.
Normandeau, Exponent, T. T., and A. Gill. 2011. Effects of EMFs from undersea powerbcables
on elasmobranchs and other marine species. U.S. Department of the Interior, Bureau of
Ocean Energy Management, Regulation, and Enforcement, Pacific OCS Region,
Camarillo, California.
Norris, K. S., and G. W. Harvey. 1972. A theory for the function of the spermaceti organ of the
sperm whale. Pages 393-417 in S. R. Galler, editor. Animal Orientation and Navigation.
Norris, K. S., and G. W. Harvey. 1972. A theory for the function of the spermaceti organ of the
sperm whale (Physeter catodon L.). Animal Orientation and Navigation. S. R. Galler, T.
Schmidt-Koenig, G. J. Jacobs and R. E. Belleville (eds.). p.397-417. National Air and
Space Administration, Washington, DC.
Norris, K. S., and J. H. Prescott. 1961. Observations on Pacific cetaceans of California and
Mexican waters. University of California Publications in Zoology 63(4):iv + 291-401.
Norris, T., and coauthors. 2012. Acoustic ecology and behavior of minke whales in the Hawaiian
and Marianas Islands: Localization, abundance estimation, and characterization of minke
whale boings. Pages 5 in A. N. Popper, and A. Hawkings, editors. The Effects of Noise
on Aquatic Life. Springer Science.
Nowacek, D. P., M. P. Johnson, and P. L. Tyack. 2004. North Atlantic right whales (Eubalaena
glacialis) ignore ships but respond to alerting stimuli. Proceedings of the Royal Society
of London Series B Biological Sciences 271(1536):227-231.
Nowacek, D. P., L. H. Thorne, D. W. Johnston, and P. L. Tyack. 2007. Responses of cetaceans
to anthropogenic noise. Mammal Review 37(2):81-115.
Nowacek, D. P., and P. L. Tyack. 2007. Response of North Atlantic right whales (Eubalaena
glacialis) at the surface to an alert/alarm stimulus. Seventeenth Biennial Conference on
the Biology of Marine Mammals, Cape Town, South Africa.
Nowacek, S. M., R. S. Wells, and A. R. Solow. 2001. Short-term effects of boat traffic on
bottlenose dolphins, Tursiops truncatus, in Sarasota Bay, Florida. Marine Mammal
Science 17(4):673-688.
NPFMC. 1990. Fishery management plan for the salmon fisheries in the EEZ off the coast of
Alaska. North Pacific Fisheries Management Council, Anchorage, Alaska.
NRC. 1994a. Low-frequency sound and marine mammals, current knowledge and research
needs. (National Research Council). National Academy Press, Washington, D.C.
NRC. 1994b. Low-Frequency Sound and Marine Mammals: Current Knowledge and Research
Needs. National Academic Press, Washington, D. C.
NRC. 2000. Marine Mammals and Low-Frequency Sound: Progress Since 1994. National
Academy Press, Washington, D. C.
664
Biological Opinion and Conference Report on Navy NWTT Activities and NMFS’ MMPA Incidental Take
Authorization PCTS FPR-2015-9110
NRC. 2003a. Ocean Noise and Marine Mammals. National Academies Press.
NRC. 2003b. Ocean Noise and Marine Mammals. National Academy Press, Washington, D.C.
NRC. 2005. Marine Mammal Populations and Ocean Noise: Determining when noise causes
biologically significant effects. National Research Council of the National Academies,
Washington, D.C.
NUWC. 2012. Determination of acoustic effects on marine mammals and sea turtles for the
phase II Hawaii and Southern California training and testing environmental impact
statement/overseas environmental impact statement. Department of the Navy, Naval
Undersea Warfare Command.
NWFSC. 2015. NOAA Salmon Population Summary: SPS Database.
http://www.nwfsc.noaa.gov/research/datatech/data/scidata.cfm.
O'Connell, V., and D. W. Carlisle. 1993. Habitat-specific density of adult yelloweye rockfish
Sebastes ruberrimus in the eastern Gulf of Alaska. Fishery Bulletin 91:304-309.
O'Connell, V. M. 1987. Reproductive seasons for some Sebastes species in southeastern Alaska.
O'Hara, J., and J. R. Wilcox. 1990. Avoidance responses of loggerhead turtles, Caretta caretta,
to low frequency sound. Copeia (2):564-567.
O'Keefe, D. J., and G. A. Young. 1984. Handbook on the environmental effects of underwater
explosions. Naval Surface Weapons Center.
O'Shea, T., and R. L. Brownell Jr. 1994. Organochlorine and metal contaminants in baleen
whales: A review and evaluation of conservation implications. Science of the Total
Environment 154(2-3):179-200.
ODFW. 2010a. Lower Columbia River conservation and recovery plan for Oregon populations
of salmon and steelhead. Oregon Department of Fish and Wildlife, Salem, Oregon.
ODFW. 2010b. Lower Columbia River conservation and recovery plan for Oregon populations
of salmon and steelhead, Oregon Department of Fish and Wildlife.
ODFW. 2011. Fish Propogation Annual Report for 2010. Oregon Department of Fish and
Wildlife.
ODFW. 2014a. 2014 Adult Returns and 2015 Expectations Columbia River Preliminary Draft –
December 12, 2014.
ODFW. 2014b. Coastal Salmonid Inventory Project.
http://oregonstate.edu/dept/ODFW/spawn/cohoabund.htm.
ODFW. 2014c. Fish Propogation Annual Report for 2013. Oregon Department of Fish and
Wildlife.
ODFW, and WDFW. 2010. JOINT STAFF REPORT: STOCK STATUS AND FISHERIES
FOR SPRING CHINOOK, SUMMER CHINOOK, SOCKEYE, STEELHEAD, AND
OTHER SPECIES, AND MISCELLANEOUS REGULATION. Joint Columbia River
Management Staff Oregon Department of Fish & Wildlife Washington Department of
Fish & Wildlife.
ODFW, and WDFW. 2011. 2011 JOINT STAFF REPORT: STOCK STATUS AND
FISHERIES FOR SPRING CHINOOK, SUMMER CHINOOK, SOCKEYE,
STEELHEAD, AND OTHER SPECIES, AND MISCELLANEOUS REGULATIONS
Joint Columbia River Management Staff Oregon Department of Fish & Wildlife
Washington Department of Fish & Wildlife.
ODFW, and WDFW. 2012. 2012 JOINT STAFF REPORT: STOCK STATUS AND
FISHERIES FOR SPRING CHINOOK, SUMMER CHINOOK, SOCKEYE,
STEELHEAD, AND OTHER SPECIES, AND MISCELLANEOUS REGULATIONS
665
Biological Opinion and Conference Report on Navy NWTT Activities and NMFS’ MMPA Incidental Take Authorization PCTS FPR-2015-9110
Joint Columbia River Management Staff Oregon Department of Fish & Wildlife
Washington Department of Fish & Wildlife January 20, 2012.
ODFW, and WDFW. 2013. 2013 JOINT STAFF REPORT: STOCK STATUS AND
FISHERIES FOR SPRING CHINOOK, SUMMER CHINOOK, SOCKEYE,
STEELHEAD, AND OTHER SPECIES, AND MISCELLANEOUS REGULATIONS
Joint Columbia River Management Staff Oregon Department of Fish & Wildlife
Washington Department of Fish & Wildlife.
ODFW, and WDFW. 2014a. 2014 Joint Staff Report: Stock Status and Fisheries for Spring
Chinook, Summer Chinook, Sockeye, Steelhead, and Other Species, and Miscellaneous
Regulation, Joint Columbia River Management Staff.
ODFW, and WDFW. 2014b. 2014 JOINT STAFF REPORT: STOCK STATUS AND
FISHERIES FOR SPRING CHINOOK, SUMMER CHINOOK, SOCKEYE,
STEELHEAD, AND OTHER SPECIES, AND MISCELLANEOUS REGULATIONS
Joint Columbia River Management Staff Oregon Department of Fish & Wildlife
Washington Department of Fish & Wildlife January 22, 2014.
ODFW and NMFS. 2011. Upper Willamette River conservation and recovery plan for Chinook
salmon and steelhead. Oregon Department of Fish and Wildlife and National Marine
Fisheries Service, Northwest Region, editor.
Ohsumi, S., and Y. Masaki. 1975. Japanese whale marking in the North Pacific, 1963-1972.
Bulletin of the Far Seas Fisheries Research Laboratory 12:171-219.
Ohsumi, S., and Y. Masaki. 1972. Report of the Scientific Committee, Annex J. Eighth
memorandum on the results of Japanese stock assessment of whales in the North Pacific.
Report of the International Whaling Commission 22:91-95.-Sc/23/5).
Ohsumi, S., and S. Wada. 1972. Stock assessment of blue whales in the North Pacific. Working
Paper for the 24th Meeting of the International Whaling Commission. 20 pp.
Okey, T. A., H. M. Alidina, V. Lo, and S. Jessen. 2014. Effects of climate change on Canada’s
Pacific marine ecosystems: a summary of scientific knowledge. Review of Fish Biology
and Fisheries 24:519-559.
Okuyama, J., T. Shimizu, O. Abe, K. Yoseda, and N. Arai. 2010. Wild versus head-started
hawksbill turtles Eretmochelys imbricata: Post-release behavior and feeding adaptions.
Endangered Species Research 10(1-3):181-190.
Olesiuk, P. F., M. A. Bigg, and G. M. Ellis. 1990. Life history and population dynamics of
resident killer whales (Orcinus orca) in the coastal waters of British Columbia and
Washington State. Report of the International Whaling Commission Special Issue
12:209-243.
Oleson, E., and J. Hildebrand. 2012. Marine mammal demographics off the outer Washington
coast and near Hawaii. Naval Postgraduate School.
Oleson, E. M., J. Calambokidis, J. Barlow, and J. A. Hildebrand. 2007a. Blue whale visual and
acoustic encounter rates in the Southern California Bight. Marine Mammal Science
23(3):574-597.
Oleson, E. M., and coauthors. 2007b. Behavioral context of call production by eastern North
Pacific blue whales. Marine Ecology Progress Series 330:269-284.
Oleson, E. M., and coauthors. 2007c. Behavioral context of call production by eastern North
Pacific blue whales. Marine Ecology Progress Series 330:269-284.
666
Biological Opinion and Conference Report on Navy NWTT Activities and NMFS’ MMPA Incidental Take
Authorization PCTS FPR-2015-9110
Oleson, E. M., J. Calambokidis, E. Falcone, G. Schorr, and J. A. Hildebrand. 2009. Acoustic and
visual monitoring for cetaceans along the outer Washington coast. Naval Postgraduate
School.
Oleson, E. M., J. Calambokidis, M. F. McKenna, and J. A. Hildebrand. 2012. Blue whale
behavioral response study & field testing of the new bioacoustic probe. Office of Naval
Research.
Oleson, E. M., and J. A. Hildebrand. 2011. Marine mammal demographics off the outer
Washington coast and near Hawaii. Naval Postgraduate School, Monterey, California.
Oleson, E. M., S. M. Wiggins, and J. A. Hildebrand. 2007d. Temporal separation of blue whale
call types on a southern California feeding ground. Animal Behaviour 74(4):881-894.
Olson, J. M. 1998. Temporal and Spatial Distribution Patterns of Sightings of Southern
Community and Transient Orcan in the Inland Waters of Washington and British
Columbia. Western Washington University.
Omura, H. 1988. Distribution and migration of the western Pacific stock of the gray whale
(Eschrichtius robustus). Scientific Reports of the Whales Research Institute 39:1-10.
Omura, H., T. Ichihara, and T. Kasuya. 1970. Osteology of pygmy blue whale with additional
information on external and other characteristics. (Balaenoptera musculus brevicauda).
Scientific Reports of the Whales Research Institute Tokyo 22:1-27, +5Pls.
Omura, H., S. Ohsumi, K. N. Nemoto, and T. Kasuya. 1969. Black right whales in the north
Pacific. Scientific Reports of the Whales Research Institute 21.
Orca Network. 2012. A review of the sighting archives from January 2003 through July 2012.
Oreskes, N. 2004. Beyond the ivory tower. The scientific consensus on climate change. Science
306(5702):1686.
Ormseth, O. A., and J. Vollenweider. 2007. Appendix 2: Forage fishes in the Gulf of Alaska. In
Stock assessment and fishery evaluation report for the groundfish resources of the Gulf of
Alaska, Anchorage, AK.
Orr, J. W., M. A. Brown, and D. C. Baker. 2000. Guide to rockfishes (Scoraenidae) of the genera
Sebastes, Sebastolobus, and Abelosebastes of the Northeast Pacific Ocean. Pages 56 in.
Ortiz, R. M., and G. A. J. Worthy. 2000. Effects of capture on adrenal steroid and vasopressin
concentrations in free-ranging bottlenose dolphins (Tursiops truncatus). Comparative
Biochemistry and Physiology A Molecular and Integrative Physiology 125(3):317-324.
Osborne, R. 2003. Historical information on porpoise strandings in San Juan County relative to
the May 5th Navy sonar incident. The Whale Museum.
Osborne, R., J. Calambokidis, and E. M. Dorsey. 1988a. A guide to marine mammals of Greater
Puget Sound. Island Publishers, Anacortes, Washington.
Osborne, R., J. Calambokidis, and E. M. Dorsey. 1988b. A guide to marine mammals of greater
Puget Sound. Island Publishers, Anacortes, Washington.
Osborne, R. W. 1999. A historical ecology of Salish Sea "Resident" killer whales (Orcinus
orca): with implications for management. Dissertation. University of Victoria, British
Columbia.
Pacific Coastal Salmon Recovery Fund. 2007. Pacific Coastal Salmon Recovery Fund
2007 Report to Congress for FY 2000-2006, U.S. Department of Commerce. National Oceanic
and Atmospheric Administration. National marine Fisheries Service. Online at
www.westcoast.fisheries.noaa.gov/protected_species/salmon_steelhead/recovery_plannin
g_and_implementation/recovery_plans_supporting_documents.html.
667
Biological Opinion and Conference Report on Navy NWTT Activities and NMFS’ MMPA Incidental Take Authorization PCTS FPR-2015-9110
Palacios, D. M., and B. R. Mate. 1996. Attack by false killer whales (Pseudorca crassidens) on
sperm whales (Physeter macrocephalus) in the Galapagos Islands. Marine Mammal
Science 12(4):582-587.
Palsson, W. A., and coauthors. 2008. The biology and assessment of rockfishes in Puget Sound.
Washington Department of Fish and Wildlife, Olympia, Washignton.
Palsson, W. A., and coauthors. 2009. The biology and assessment of rockfishes in Puget Sound,
FPT 09-04. Washington Dept. Fish and Wildlife, Olympia.
Panigada, S., and coauthors. 2006. Mediterranean fin whales at risk from fatal ship strikes.
Marine Pollution Bulletin 52(10):1287-1298.
Panigada, S., M. Zanardelli, S. Canese, and M. Jahoda. 1999. Deep diving performances of
Mediterranean fin whales. Thirteen Biennial Conference on the Biology of Marine
Mammals, 28 November - 3 December Wailea Maui HI. p.144.
Papastavrou, V., S. C. Smith, and H. Whitehead. 1989. Diving behaviour of the sperm whale,
Physeter macrocephalus, off the Galápagos Islands. Canadian Journal of Zoology
67(4):839-846.
Parks, S. E. 2009. Assessment of acoustic adaptations for noise compensation in marine
mammals. Office of Naval Research.
Parks, S. E., C. W. Clark, and P. L. Tyack. 2007. Short- and long-term changes in right whale
calling behavior: The potential effects of noise on acoustic communication. Journal of the
Acoustical Society of America 122(6):3725-3731.
Parry, M. L., O. F. Canziani, J. P. Palutikof, P. J. v. d. Linden, and C. E. Hanson. 2007.
Contribution of Working Group II to the Fourth Assessment Report of the
Intergovernmental Panel on Climate Change, Cambridge, UK.
Patara, L., M. Vichi, and S. Masina. 2012. Impacts of natural and anthropogenic climate
variations on North Pacific plankton in an Earth System Model. Ecological Modeling
244:132-147.
Patek, S. N. 2002. Squeaking with a sliding joint: Mechanics and motor control of sound
production in palinurid lobsters. Journal of Experimental Biology 205:2375-2385.
Patenaude, N. J., and coauthors. 2002. Aircraft sound and disturbance to bowhead and beluga
whales during spring migration in the Alaskan Beaufort Sea. Marine Mammal Science
18(2):309-335.
Patterson, B., and G. R. Hamilton. 1964. Repetitive 20 cycle per second biological hydroacoustic
signals at Bermuda. Marine Bio-acoustics, W N Tavolga ed. Pergamon Press Oxford.
p.125-145. Proceedings of a Symposium held at the Lerner Marine Laboratory Bimini
Bahamas April.
Patz, J., D. Campbell-Lendrum, H. Gibbs, and R. Woodruff. 2008. Health impact assessment of
global climate change: Expanding on comparative risk assessment approaches for policy
making. Annual Review of Public Health 29:27.
Pauley, G. B., B. M. Bortz, and M. F. Shepard. 1986a. Species profiles: Life histories and
environmental requirements of coastal fishes and invertebrates (Pacific Northwest) -
steelhead trout. U.S. Army Corps of Engineers, TR EL-82-4.
Pauley, G. B., B. M. Bortz, and M. F. Shepard. 1986b. Species Profiles: Life Histories and
Environmental Requirements of Coastal Fishes and Invertebrates (Pacific Northwest) -
Steelhead Trout. U.S. Fish Wildlife Service Biological Report 82(11.62). U.S. Army
Corps of Engineers, TR EL-82-4. 24p.
668

Biological Opinion and Conference Report on Navy NWTT Activities and NMFS’ MMPA Incidental Take
Authorization PCTS FPR-2015-9110
Pauley, G. B., K. L. Bowers, and G. L. Thomas. 1988. Species profiles: Life histories and
environmental requirements of coastal fishes and invertebrates (Pacific northwest) - chum
salmon. U.S. Department of Interior, Fish and Wildlife Service, and the U.S. Army Corps
of Engineers, Coastal Ecology Group, Waterways Experiment Station.
Pauley, G. B., R. Risher, and G. L. Thomas. 1989. Species profiles: Life histories and
environmental requirements of coastal fishes and invertebrates (Pacific northwest)
sockeye salmon. U.S. Department of the Interior, Fish and Wildlife Service, and the U.S.
Army Corps of Engineers, Coastal Ecology Group, Waterways Experiment Station.
Pavan, G., and coauthors. 2000. Time patterns of sperm whale codas recorded in the
Mediterranean Sea 1985-1996. Journal of the Acoustical Society of America
107(6):3487-3495.
Payne, K. 1985. Singing in humpback whales. Whalewatcher 19(1):3-6.
Payne, K., P. Tyack, and R. Payne. 1983. Progressive changes in the songs of humpback whales
(Megaptera novaeangliae): A detailed analysis of two seasons in Hawaii. Pages 9-57 in
R. Payne, editor. Communication and Behavior of Whales. Westview Press, Boulder,
CO.
Payne, P., J. Nicholas, L. O’Brien, and K. Powers. 1986. The distribution of the humpback
whale, Megaptera novaeangliae, on Georges Bank and in the Gulf of Maine in relation to
densities of the sand eel, Ammodytes americanus. Fisheries Bulletin 84:271-277.
Payne, P. M., and coauthors. 1990a. Recent fluctuations in the abundance of baleen whales in the
southern Gulf of Maine in relation to changes in prey abundance. Fishery Bulletin
88(4):687-696.
Payne, P. M., and coauthors. 1990b. Recent fluctuations in the abundance of baleen whales in the
southern Gulf of Maine in relation to changes in selected prey. Fishery Bulletin 88:687
696.
Payne, R. 1986. Long term behavioral studies of the southern right whale (Eubalaena australis).
Report of the International Whaling Commission Special Issue 10:161-167.-Right
Whales Past and Present status. Proceedings of the Workshop on the status of Right
Whales. Robert L. Brownell, Peter B. Best, John H. Prescott-Eds.).
Payne, R., and D. Webb. 1971. Orientation by means of long range acoustic signaling in baleen
whales. Annals of the New York Academy of Sciences 188(1):110-141.
Payne, R. S., and S. McVay. 1971. Songs of humpback whales. Humpbacks emit sounds in long,
predictable patterns ranging over frequencies audible to humans. Science 173(3997):585
597.
Pearcy, W. G. 1992. Ocean ecology of north Pacific salmonids, Univ. Washington Press, Seattle,
179.
Pearcy, W. G., and J. P. Fisher. 1990. Distribution and abundance of juvenile salmonids off
Oregon and Washington, 1981-1985. Pages 83p in.
Pearson, W. H., J. R. Skalski, and C. I. Malme. 1987. Effects of sounds from a geophysical
survey device on fishing success. United States Department of the Interior, Marine
Minerals Service, Battelle/Marine Research Laboratory.
Pearson, W. H., J. R. Skalski, and C. I. Malme. 1992. Effects of sounds from a geophysical
survey device on behavior of captive rockfish (Sebastes spp.). Canadian Journal of
Fisheries and Aquatic Sciences 49:1343-1356.
Pecl, G., and G. Jackson. 2008. The potential impacts of climate change on inshore squid:
biology, ecology and fisheries. Reviews in Fish Biology and Fisheries 18:373-385.
669
Biological Opinion and Conference Report on Navy NWTT Activities and NMFS’ MMPA Incidental Take Authorization PCTS FPR-2015-9110
Perkins, J. S., and P. C. Beamish. 1979. Net entanglements of baleen whales in the inshore
fishery of Newfoundland. Journal of the Fisheries Research Board of Canada 36:521-528.
Perrin, W. F., and J. R. Geraci. 2002. Stranding. Pages 1192-1197 in W. F. Perrin, B. Wursig,
and J. G. M. Thewissen, editors. Encyclopedia of Marine Mammals. Academic Press,
San Diego, California.
Perry, S. L., D. P. DeMaster, and G. K. Silber. 1999a. The great whales: History and status of six
species listed as endangered under the U.S. Endangered Species Act of 1973. Marine
Fisheries Review 61(1):1-74.
Perry, S. L., D. P. Demaster, and G. K. Silber. 1999b. The sei whale. Marine Fisheries Review
61(1):52-58.
Perry, S. L., D. P. Demaster, and G. K. Silber. 1999c. The sperm whales (Physeter
macrocephalus). Marine Fisheries Review 61(1):59-74. W. L. Hobart-Ed.). In the Great
Whales History and status of Six Species Listed As Endangered Under the U.S.
Endangered Species Act of.
Peterson, M., M. J. Thomas, and A. P. Klimley. 2011. Behavior and fine scale habitat usage
patterns of juvenile green sturgeon in the Sacramento-San Joaquin Delta. 141st Annual
Meeting of the American Fisheries Society. American Fisheries Society, Seattle,
Washington.
Peterson, W. T., C. A. Morgan, J. P. Fisher, and E. Casillas. 2010. Ocean distribution and habitat
associations of yearling coho (Oncorhynchus kisutch) and Chinook (O. tshawytscha)
salmon in the northern California Current. Fisheries Oceanography 19(6):508-525.
PFMC. 2000a. Amendment 14 to the Pacific coast salmon plan (1997). Incorporating the
regulatory impact review/initial regulatory flexibility analysis and final supplemental
environmental impact statement. Pages 420 in. Pacific Fishery Management Council,
Portland, Oregon.
PFMC. 2000b. Amendment 14 to the Pacific coast salmon plan (1997). Incorporating the
regulatory impact review/initial regulatory flexibility analysis and final supplemental
environmental impact statement. Pacific Fishery Management Council, Portland, Oregon.
PFMC. 2013. Review of 2012 ocean salmon fisheries: Stock Assessment and Fishery Evaluation
Document for the Pacific Coast Salmon Fishery Management Plan, Pacific Fishery
Management Council, 7700 NE Ambassador Place, Suite 101, Portland, Oregon 97220
1384.
PFMC. 2014. Appendix A to the Pacific Coast Salmon Fishery Management Plan. Pacific
Fishery Management Council, Portland, OR.
PFMC. 2015. Preseason Report I: Stock adundance analysis and environmental assessment Part
1 for 2015 ocean salmon fishery regulations. P. F. M. Council, editor, Portland, OR.
Phillips, J. B. 1960. Canary rockfish. California Department of Fish and Game.
Piantadosi, C. A., and E. D. Thalmann. 2004. Whales, sonar, and decompression sickness.
Nature 425:U1-2.
Pickering, A. D. 1981. Stress and Fish. Academic Press, New York.
Pike, G. C., and I. B. Macaskie. 1969. Marine mammals of British Columbia. Bulletin of the
Fisheries Research Board of Canada 171:1-54.
Pinela, A. M., and coauthors. 2009. Population genetics and social organization of the sperm
whale (Physeter macrocephalus) in the Azores inferred by microsatellite analyses.
Canadian Journal of Zoology 87(9):802-813.
670
Biological Opinion and Conference Report on Navy NWTT Activities and NMFS’ MMPA Incidental Take Authorization PCTS FPR-2015-9110
Piner, K. R., J. R. Wallace, O. S. Hamel, and R. Mikus. 2006. Evaluation of ageing accuracy of
bocaccio (Sebastes paucispinis) rockfish using bomb radiocarbon. Fisheries Research
77(2):200-206.
Pinnell, N., and D. Sandilands. 2004. Humpbacks pay a rare visit to the Strait of Georgia.
Sightings. The Newsletter of the B.C. Cetacean Sightings Network July/August(17):5.
Pinto De Sa Alves, L. C., A. Andriolo, A. N. Zerbini, J. L. A. Pizzorno, and P. J. Clapham. 2009.
Record of feeding by humpback whales (Megaptera novaeangliae) in tropical waters off
Brazil. Marine Mammal Science 25(2):416-419.
Pirotta, E., N. D. Merchant, P. M. Thompson, T. R. Barton, and D. Lusseau. 2015. Quantifying
the effect of boat disturbance on bottlenose dolphin foraging activity. Biological
Conservation 181:82-89.
Pirotta, E., and coauthors. 2012. Vessel noise affects beaked whale behavior: Results of a
dedicated acoustic response study. PLoS ONE 7(8):e42535.
Pitcher, T. J. 1986. Functions of shoaling behavior in teleosts. Pages 294-337 in The Behavior of
Teleost Fishes. John Hopkins University Press, Baltimore, Maryland.
Pitman, R. L., L. T. Ballance, S. I. Mesnick, and S. J. Chivers. 2001. Killer whale predation on
sperm whales: Observations and implications. Marine Mammal Science 17(3):494-507.
Polagye, B., J. Wood, C. Bassett, D. Tollit, and J. Thomson. 2011. Behavioral response of harbor
porpoises to vessel noise in a tidal strait. Journal of the Acoustical Society of America
129(4):2368.
Polefka, S. 2004. Anthropogenic noise and the Channel Islands National Marine Sanctuary: How
noise affects sanctuary resources, and what we can do about it. A report by the
Environmental Defense Center, Santa Barbara, CA. 53pp. September 28, 2004.
Poloczanska, E. S., and coauthors. 2013. Global imprint of climate change on marine life. Nature
Climate Change Letters.
Poloczanska, E. S., C. J. Limpus, and G. C. Hays. 2009a. Vulnerability of marine turtles in
climate change. Pages 151-211 in Advances in MArine Biology, volume 56. Academic
Press, New York.
Poloczanska, E. S., C. J. Limpus, and G. C. Hays. 2009b. Vulnerability of marine turtles to
climate change. Pages 151-211 in D. W. Sims, editor. Advances in Marine Biology,
volume 56. Academic Press, Burlington, Vermont.
Pool, S. A., R. D. Brodeur, N. L. Goodman, and E. A. Daly. 2008. Abundance, distribution, and
feeding patterns of juvenile coho salmon (Oncorhynchus kisutch) in the Juan de Fuca
Eddy Estuarine, Coastal and Shelf Science 80(1):85-94.
Popov, V., A. Supin, D. Nechaev, and E. V. Sysueva. 2013a. Temporary threshold shifts in naïve
and experienced belugas: Learning to dampen effects of fatiguing sounds? Pages 127 in
Third International Conference on the Effects of Noise of Aquatic Life, Budapest,
Hungary.
Popov, V. V., and A. Y. Supin. 2009. Comparison of directional selectivity of hearing in a
beluga whale and a bottlenose dolphin. Journal of the Acoustical Society of America
126(3):1581-1587.
Popov, V. V., A. Y. Supin, V. V. Rozhnov, D. I. Nechaev, and E. V. Sysueva. 2014. The limits
of applicability of the sound exposure level (SEL) metric to temporal threshold shifts
(TTS) in beluga whales, Delphinapterus leucas. Journal of Experimental Biology
217(10):1804-1810.
671

Biological Opinion and Conference Report on Navy NWTT Activities and NMFS’ MMPA Incidental Take Authorization PCTS FPR-2015-9110
Popov, V. V., and coauthors. 2013b. Hearing threshold shifts and recovery after noise exposure
in beluga whales, Delphinapterus leucas. Journal of Experimental Biology 216(9):1587
1596.
Popov, V. V., and coauthors. 2011. Noise-induced temporary threshold shift and recovery in
Yangtze finless porpoises Neophocaena phocaenoides asiaeorientalis. Journal of the
Acoustical Society of America 130(1):574-584.
Popper, A. N. 1977. Comparative structure of the fish ear. Journal of the Acoustical Society of
America 61(S1):S76-S76.
Popper, A. N. 2003. Effects of anthropogenic sound on fishes. Fisheries 28:24-31.
Popper, A. N. 2008a. Effects of human-generated sounds on fish. Pages 192 in Second
International Conference on Acoustic Communication by Animals, Oregon State
University, Corvallis, Oregon.
Popper, A. N. 2008b. Effects of mid- and high-frequency sonars on fish. U.S. Department of the
Navy, Naval Undersea Warfare Center Division, Newport, Rhode Island.
Popper, A. N. 2008c. Effects of mid- and high-frequency sonars on fish. Naval Undersea
Warfare Center Division Newport, Rhode Island. Contract N66604-07M-6056. 52pp.
Popper, A. N., J. Fewtrell, M. E. Smith, and R. D. McCauley. 2003. Anthroplogenic sound:
Effects on the behavior and physiology of fishes. Marine Technology Society Journal
37(4):35-40.
Popper, A. N., and coauthors. 2007. The effects of high-intensity, low-frequency active sonar on
rainbow trout. Journal of the Acoustical Society of America 122(1):623-635.
Popper, A. N., and M. C. Hastings. 2009a. The effects of anthropogenic sources of sound on
fishes. Journal of Fish Biology 75(3):455-489.
Popper, A. N., and M. C. Hastings. 2009b. The effects of human-generated sound on fish.
Integrative Zoology 4:43-52.
Popper, A. N., and coauthors. 2014. ASA S3/SC1.4 TR-2014 Sound Exposure Guidelines for
Fishes and Sea Turtles: A Technical Report prepared by ANSI-Accredited Standards
Committee S3/SC1 and registered with ANSI.
Popper, A. N., and B. Hoxter. 1984. Growth of a fish ear: 1. Quantitative analysis of sensory hair
cell and ganglion cell proliferation. Hearing Research 15:133-142.
Popper, A. N., D. T. T. Plachta, D. A. Mann, and D. Higgs. 2004. Response of clupeid fish to
ultrasound: A review. ICES Journal of Marine Science 61(7):1057-1061.
Popper, A. N., and C. R. Schilt. 2009. Hearing and acoustic behavior: Basic and applied
considerations. Pages 17-48 in J. F. Webb, R. R. Fay, and A. N. Popper, editors. Fish
Bioacoustics.
Popper, A. N., and coauthors. 2005. Effects of exposure to seismic airgun use on hearing of three
fish species. Journal of the Acoustical Society of America 117(6):3958-3971.
Potter, J. R., and coauthors. 2007. Visual and passive acoustic marine mammal observations and
high-frequency seismic source characteristics recorded during a seismic survey. IEEE
Journal of Oceanic Engineering 32(2):469-483.
Preston, D. 2003. Sei whale carcass provides opportunity for research. NWIFC News 29(3):4-5.
Pritchard, P. C. H. 1971. The leatherback or leathery turtle, Dermochelys coriacea. International
Union for the Conservation of Nature, Monograph 1:39 pp.
Pritchard, P. C. H. 1982a. Nesting of the leatherback turtle, Dermochelys coriacea, in Pacific
Mexico, with a new estimate of the world population status. Copeia 4:741-747.
672

Biological Opinion and Conference Report on Navy NWTT Activities and NMFS’ MMPA Incidental Take Authorization PCTS FPR-2015-9110
Pritchard, P. C. H. 1982b. Nesting of the leatherback turtle, Dermochelys coriacea, in Pacific
México, with a new estimate of the world population status. Copeia 1982(4):741-747.
PSAT. 2007. State of the Sound 2007. Puget Sound Action Team, Office of the Governor, State
of Washington.
PSTRT. 2007. Lake Ozette Sockeye Recovery Plan. NMFS Internal Review Draft Document.
Purvis, A., J. L. Gittleman, G. Cowlishaw, and G. M. Mace. 2000. Predicting extinction risk in
declining species. Proceedings of the Royal Society B-Biological Sciences 267:1947
1952.
Putnam, N. F., and coauthors. 2013. Evidence for geomagnetic imprinting as a homing
mechanism in Pacific salmon. Current Biology 23:312-316.
Pynn, L. 2013. Rare whale sighting stuns B.C. researchers. The Vancouver Sun.
Quinn, T. P. 2005. The Behavior and Ecology of Pacific Salmon and Trout. American Fisheries
Society and University of Washington Press, Seattle, Washington.
Quinn, T. P., and E. L. Brannon. 1982. The use of celestial and magnetic cues by orienting
sockeye salmon smolts. J. Comp. Physiol. 147:547-552.
Quinn, T. P., and C. Groot. 1983. Orientation of chum salmon (Oncorhynchus keta) after internal
and external magnetic field alteration. Can. J. Fish Aquat. Sci 40:1598-1606.
Quinn, T. P., and K. W. Myers. 2004. Anadromy and the marine migrations of Pacific salmon
and trout: Rounsefell revisited. Reviews in Fish Biology and Fisheries 14:421-442.
Radtke, L. D. 1966. Distribution of smelt, juvenile sturgeon, and starry flounder in the
Sacramento-San Joaquin Delta with observations on food of sturgeon. Pages 115-119 in:
J.L. Turner and D.W. Kelly, eds. Ecological studies of the Sacramento-San Joaquin
Estuary. Part II; California Department of Fish and Game, Fish Bulletin:136.
Ralston, S., and J. N. Ianelli. 1998. When lengths are better than ages: The complex case of
bocaccio. University of Alaska, Fairbanks, Alaska.
Ramcharitar, J., D. Gannon, and A. Popper. 2006. Bioacoustics of fishes of the family Sciaenidae
(croakers and drums). Transactions of the American Fisheries Society 135:1409-1431.
Ramcharitar, J., D. M. Higgs, and A. N. Popper. 2001. Sciaenid inner ears: A study in diversity.
Brain, Behavior and Evolution 58:152-162.
Ramcharitar, J., and A. N. Popper. 2004. Masked auditory thresholds in sciaenid fishes: A
comparative study. Journal of the Acoustical Society of America 116(3):1687-1691.
Ramp, C., J. Delarue, P. J. Palsboll, R. Sears, and P. S. Hammond. 2015. Adapting to a Warmer
Ocean—Seasonal Shift of Baleen Whale Movements over Three Decades. PLOS One
10(3):e0121374.doi:10.1371/journal.pone.0121374.
Rankin, C. H., and coauthors. 2009. Habituation revisited: An updated and revised description of
the behavioral characteristics of habituation. Neurobiology of Learning and Memory
92(2):135-138.
Rankin, S., and J. Barlow. 2007. Vocalizations of the sei whale Balaenoptera borealis off the
Hawaiian Islands. Bioacoustics 16(2):137-145.
Rankin, S., D. Ljungblad, C. Clark, and H. Kato. 2005. Vocalisations of Antarctic blue whales,
Balaenoptera musculus intermedia, recorded during the 2001/2002 and 2002/2003
IWC/SOWER circumpolar cruises, Area V, Antarctica. Journal of Cetacean Research
And Management 7(1):13-20.
Read, A. J., P. Drinker, and S. Northridge. 2006. Bycatch of marine mammals in U.S. and global
fisheries. Conservation Biology 20(1):163-169.
673

Biological Opinion and Conference Report on Navy NWTT Activities and NMFS’ MMPA Incidental Take Authorization PCTS FPR-2015-9110
Read, J., G. Jones, and A. N. Radford. 2014. Fitness costs as well as benefits are important when
considering responses to anthropogenic noise. Behavioral Ecology 25(1):4-7.
Redfern, J. V., and coauthors. 2006. Techniques for cetacean-habitat modeling. Marine Ecology
Progress Series 310:271-295.
Reed, D. H., J. J. O’Grady, J. D. Ballou, and R. Frankham. 2003. The frequency and severity of
catastrophic die-offs in vertebrates. Animal Conservation 6:109-114.
Reeves, R. R. 1977. The problem of gray whale (Eschrichtius robustus) harassment: At the
breeding lagoon and during migration. Marine Mammal Commission.
Reeves, R. R., S. Leatherwood, S. A. Karl, and E. R. Yohe. 1985. Whaling results at Akutan
(1912-39) and Port Hobron (1926-37). Report of the International Whaling Commission
35:441-457.
Reeves, R. R., T. D. Smith, and E. A. Josephson. 2008. Observations of western gray whales by
ship-based whalers in the 19th century. IWC Scientific Committee, Santiago, Chile.
Reeves, R. R., B. S. Stewart, P. Clapham, and J. Powell. 2002. Guide to marine mammals of the
world. Knopf, New York.
Reeves, R. R., and H. Whitehead. 1997. Status of the sperm whale, Physeter macrocephalus, in
Canada. The Canadian Field-Naturalist 111(2):15.
Regional Mark Processing Center. 2014. Regional Mark Information System: Standard
Reporting. http://www.rmpc.org/.
Reid, K., and J. Croxall. 2001. Environmental response of upper trophic-level predators reveals a
system change in an Antarctic marine ecosystem. Proceedings of the Royal Society of
London Series B 268:377–384.
Reilly, C. A., T. W. Echeverria, and S. Ralston. 1992. Interannual variation and overlap in the
diets of pelagic juvenile rockfish (genus Sebastes) off central California. Fishery Bulletin
90(3):505-515.
Reina, R. D., J. R. Spotila, F. V. Paladino, and A. E. Dunham. 2008. Changed reproductive
schedule of eastern Pacific leatherback turtles Dermochelys coriacea following the 1997–
98 El Niño to La Niña transition. Endangered Species Research.
Reisenbichler, R. R. 1997. Genetic factors contributing to declines of anadromous salmonids in
the Pacific Northwest. Pages 223-244 in D. J. Stouder, P. A. Bisson, and R. J. Naiman,
editors. Pacific Salmon and their Ecosystems. Chapman and Hall, New York.
Remage-Healey, L., D. P. Nowacek, and A. H. Bass. 2006. Dolphin foraging sounds suppress
calling and elevate stress hormone levels in a prey species, the Gulf toadfish. Journal of
Experimental Biology 209(22):4444-4451.
Rendell, L., and H. Whitehead. 2004. Do sperm whales share coda vocalizations? Insights into
coda usage from acoustic size measurement. Animal Behaviour 67(5):865-874.
Renken, M. 2015. Estimating range to effects for sonar and explosive sources assessed in the
NWTT EIS/OEIS. Naval Undersea Warfare Center Division Keyport.
Rice, A., and coauthors. 2015. Seasonality of killer whale (Orcinus orca) ecotypes in the
Northwest Training Range Complex, . Marine Physical Laboratory, Scripps Institution of
Oceanography, University of California San Diego. MPL TM-558. 10 p.
Rice, C. A., and coauthors. 2011. Abundance, stock origin, and length of marked and unmarked
juvenile Chinook salmon in the surface waters of greater Puget Sound. Transactions of
the American Fisheries Society 140(1):170-189.
674

Biological Opinion and Conference Report on Navy NWTT Activities and NMFS’ MMPA Incidental Take
Authorization PCTS FPR-2015-9110
Rice, D. W. 1974. Whales and whale research in the eastern North Pacific. Pages 170-195 in W.
E. Schevill, editor. The Whale Problem: A Status Report. Harvard University Press,
Cambridge, MA.
Rice, D. W. 1977. Synopsis of biological data on the sei whale and Bryde's whale in the eastern
North Pacific. Report of the International Whaling Commission (Special Issue 1):92-97.
Rice, D. W. 1978. The humpback whale in the North Pacific: distribution, exploitation, and
numbers. . U.S. Marine Mammal Commission, NTIS PB-280-794.
Rice, D. W. 1984. Cetaceans. Orders and Families of Recent Mammals of the World. S.
Anderson AND J. Knox Jones, Jr. (eds.). p.447-490. John Wiley AND Sons, Inc., New
York.
Rice, D. W. 1986. Sperm whales. Pages 94-101 in D. Haley, editor. Marine Mammals of Eastern
Pacific and Arctic Waters. Pacific Search Press, Seattle, Washington.
Rice, D. W. 1989. Sperm whale, Physeter macrocephalus (Linnaeus, 1758). Pages 177-233 in S.
H. Ridway, and S. R. Harrison, editors. Handbook of Marine Mammals Volume 4: River
Dolphins and the Larger Toothed Whales, volume 4.
Rice, D. W. 1998. Marine mammals of the world: systematics and distribution. Society for
Marine Mammalogy, Lawrence, KS.
Rice, D. W., A. A. Wolman, B. R. Mate, and J. T. Harvey. 1986. A Mass Stranding of Sperm
Whales in Oregon - Sex and Age Composition of the School. Marine Mammal Science
2(1):64-69.
Rice, D. W., and A. A. Wolman. 1982. Whale census in the Gulf of Alaska, June to August
1980. Report of the International Whaling Commission 32:491-497.-Sc/33/O7).
Richards, L. J. 1986. Depth and habitat distributions of three species of rockfish (Sebastes) in
British Columbia: Observations from the submersible PISCES IV. Environmental
Biology of Fishes 17:13-21.
Richards, L. J., and coauthors. 1985. SCUBA survey of rockfish assemblages in the Strait of
Georgia, July to October 1984. Department of Fisheries and Oceans, Fisheries Research
Branch, Pacific Biological Station.
Richardson, S. L., and W. A. Laroche. 1979. Development and occurrence of larvae and
juveniles of the rockfishes Sebastes crameri, Sebastes pinniger, and Sebastes
helvomaculatus (Family Scorpaenidae) off Oregon. Fishery Bulletin 77:1-46.
Richardson, W. J., R. A. Davids, C. R. Evans, and P. Norton. 1985a. Distribution of bowheads
and industrial activity. Pages 255-306 in W. J. Richardson, editor. Behavior, disturbance
and distribution of bowhead whales Balaena mysticetus in the eastern Beaufort Sea,
1980-84. Report from LGL Ecological Research Associates, Inc. for U.S. Minerals
Management Service, Bryan, Texas, and Reston, Virginia.
Richardson, W. J., and coauthors. 1995a. Assessment of potential impact of small explosions in
the Korea Strait on marine animals and fisheries. LGL Ltd. Environmental Research
Associates, BBN Systems and Technologies.
Richardson, W. J., K. J. Finley, G. W. Miller, R. A. Davis, and W. R. Koski. 1995b. Feeding,
social and migration behavior of bowhead whales, Balaena mysticetus, in Baffin-Bay vs
the Beaufort Sea - regions with different amounts of human activity. Marine Mammal
Science 11(1):1-45.
Richardson, W. J., M. A. Fraker, B. Wursig, and R. S. Wells. 1985b. Behavior of bowhead
whales Balaena mysticetus summering in the Beaufort Sea: Reactions to industrial
activities. Biological Conservation 32(3):195-230.
675
Biological Opinion and Conference Report on Navy NWTT Activities and NMFS’ MMPA Incidental Take Authorization PCTS FPR-2015-9110
Richardson, W. J., C. R. Greene Jr., C. I. Malme, and D. H. Thomson. 1995c. Marine Mammals
and Noise. Academic Press, San Diego, California.
Richardson, W. J., C. R. G. Jr., C. I. Malme, and D. H. Thomson. 1995d. Marine Mammals and
Noise. Academic Press, Inc., San Diego, California.
Richardson, W. J., and B. Wursig. 1995. Significance of responses and noise impacts. Pages 387
424 in W. J. Richardson, C. R. Greene Jr., C. I. Malme, and D. H. Thomson, editors.
Marine Mammals and Noise. Academic Press, San Diego.
Richardson, W. J., and B. Wursig. 1995. Significance of responses and noise impacts. (Chapter
11). Marine Mammals and Noise. p.387-424. Academic Press, San Diego.
Richmond, D. R., J. T. Yelverton, and E. R. Fletcher. 1973. Far-field underwater-blast injuries
produced by small charges. Lovelace Foundation for Medical Education and Research.
Richter, C., S. Dawson, and E. Slooten. 2006. Impacts of commercial whale watching on male
sperm whales at Kaikoura, New Zealand. Marine Mammal Science 22(1):46-63.
Richter, C. F., S. M. Dawson, and E. Slooten. 2003a. Sperm whale watching off Kaikoura, New
Zealand: Effects of current activities on surfacing and vocalisation patterns. Science for
Conservation 219.
Richter, C. F., S. M. Dawson, and E. Slooten. 2003b. Sperm whale watching off Kaikoura, New
Zealand: Effects of current activities on surfacing and vocalisation patterns. Department
of Conservation, Wellington, New Zealand. Science For Conservation 219. 78p.
Rick, T. C., and coauthors. 2009a. A trans-Holocene archaeological record of Guadalupe fur
seals (Arctocephalus townsendi) on the California coast. Marine Mammal Science
25(2):487-502.
Rick, T. C., and coauthors. 2009b. A trans-Holocene archaeological record of Guadalupe fur
seals (Arctocephalus townsendi) on the California coast. Marine Mammal Science
25(2):487-502.
Ricker, S. J., D. Ward, and C. W. Anderson. 2014. Results of Freshwater Creek Salmonid Life
Cycle Monitoring Station 2010-2013, California Department of Fish and Game,
Anadromous Fisheries Resource Assessment and Monitoring Program, 50 Ericson Ct.,
Arcata, CA 95521.
Ridgeway, S. H., E. G. Wever, J. G. McCormick, J. Palin, and J. H. Anderson. 1969. Hearing in
the giant sea turtle, Chelonia mydas. Proceedings of the National Academy of Science
64(3):884-890.
Ridgway, S. H., and D. A. Carder. 1997. Hearing deficits measured in some Tursiops truncatus,
and discovery of a deaf/mute dolphin. Journal of the Acoustical Society of America
101(1):590-594.
Ridgway, S. H., and D. A. Carder. 2001. Assessing hearing and sound production in cetaceans
not available for behavioral audiograms: experiences with sperm, pygmy sperm, and gray
whales. Aquatic Mammals 27(3):267-276.
Ridgway, S. H., and coauthors. 1997. Behavioural responses and temporary shift in masked
hearing threshold of bottlenose dolphins, Tursiops truncatus, to 1-second tones of 141 to
201 dB re 1 Pa. Naval Command, Control and Surveillance Center, RDT&E Division,
San Diego, California.
Ridgway, S. H., and M. D. Dailey. 1972. Cerebral and cerebellar involvement of trematode
parasites in dolphins and their possible role in stranding. Journal of Wildlife Diseases
8(1):33-43.
676
Biological Opinion and Conference Report on Navy NWTT Activities and NMFS’ MMPA Incidental Take
Authorization PCTS FPR-2015-9110
Ridgway, S. H., and R. Howard. 1979. Dolphin lung collapse and intramuscular circulation
during free diving: Evidence from nitrogen washout. Science 206(4423):1182-1183.
Ridgway, S. H., E. G. Wever, J. G. McCormick, J. Palin, and J. H. Anderson. 1969. Hearing in the
giant sea turtle, Chelonoa mydas. Proceedings of the National Academies of Science 64.
Rien, T. A., L. C. Burner, R. A. Farr, M. D. Howell, and J. A. North. 2001. Green sturgeon
population characteristics in Oregon. Annual Progress Report. Sportfish Restoration
Project F-178-R.
Risch, D., P. J. Corkeron, W. T. Ellison, and S. M. V. Parijs. 2012. Changes in humpback whale
song occurrence in response to an acoustic source 200 km away. PLoS ONE 7(1):e29741.
Risch, D., P. J. Corkeron, W. T. Ellison, and S. M. V. Parijs. 2014. Formal comment to Gong et
al: Ecosystem scale acoustic sensing reveals humpback whale behavior synchronous with
herring spawning processes and re-evaluation finds no effect of sonar on humpback song
occurrence in the Gulf of Maine in fall 2006. PLoS ONE 9(10):e109225.
Ritter, F. 2002. Behavioural observations of rough-toothed dolphins (Steno bredanensis) off La
Gomera, Canary Islands (1995-2000), with special reference to their interactions with
humans. Aquatic Mammals 28(1):46-59.
Ritter, F. 2012. Collisions of sailing vessels with cetaceans worldwide: First insights into a
seemingly growing problem. Journal of Cetacean Research and Management 12(1):119
127.
Rivers, J. A. 1997. Blue whale, Balaenoptera musculus, vocalizations from the waters off central
California. Marine Mammal Science 13(2):186-195.
Robinson, R. A., and coauthors. 2008. Travelling through a warming world: climate change and
migratory species. Endangered Species Research.
Roe, J. H., and coauthors. 2014. Predicting bycatch hotspots for endangered leatherback turtles
on longlines in the Pacific Ocean. Proceedings of the Royal Society Biological Sciences
281:20132559.
Romano, T. A., and coauthors. 2004. Anthropogenic sound and marine mammal health:
Measures of the nervous and immune systems before and after intense sound exposure.
Canadian Journal of Fisheries and Aquatic Sciences 61:1124-1134.
Romero, L. M., and L. K. Butler. 2007. Endochronology of stress. International Journal of
Comparative Psychology 20:89-95.
Rone, B. K., and coauthors. 2010a. Results from the April 2009 Gulf of Alaska Line Transect
Survey (GOALS) in the Navy Training Exercise Area. National Marine Fisheries
Service, NOAA Technical Memorandum NMFS-AFSC-209.
Rone, B. K., and coauthors. 2010b. Results of the April 2009 Gulf of Alaska Line-Transect
Survey (GOALS) in the Navy Training Exercise Area. NOAA.
Roni, P., and T. P. Quinn. 1995. Geographic variation in size and age of North American
chinook salmon. North American Journal of Fisheries Management 15:325–345.
Rosen, G., and G. R. Lotufo. 2010. Fate and effects of composition B in multispecies marine
exposures. Environmantal Toxicology and Chemistry 29(6):1330-1337.
Rosenthal, R. J., L. Haldorson, L. J. Field, V. Moran-O'Connell, and M. G. LaRiviere. 1982.
Inshore and shallow offshore bottomfish resources in the southeastern Gulf of Alaska.
Alaska Coastal Research, Sitka, Alaska.
Rosenthal, R. J., V. Moran-O'Connell, and M. C. Murphy. 1998. Feeding ecology of ten species
of rockfishes (Scorpaenidae) from the Gulf of Alaska. California Department of Fish and
Game 74:16-37.
677

Biological Opinion and Conference Report on Navy NWTT Activities and NMFS’ MMPA Incidental Take Authorization PCTS FPR-2015-9110
Ross, D. 1976. Mechanics of underwater noise. Pergamon Press, New York.
Ross, P. S., G. M. Ellis, M. G. Ikonomou, L. G. Barrett-Lennard, and R. F. Addison. 2000. High
PCB concentrations in free-ranging Pacific killer whales, Orcinus orca: Effects of age,
sex and dietary preference. Marine Pollution Bulletin 40(6):504-515.
Rowlett, R. A., G. A. Green, C. E. Bowlby, and M. A. Smultea. 1994. The first photographic
documentation of a northern right whale off Washington state. Northwestern Naturalist
75(3):102-104.
Royall, R. 2004. The likelihood paradigm for statistical evidence. Pages 119-152 in M. L. Taper,
and S. R. Lele, editors. The Nature of Scientific Evidence. Statistical, Philosophical, and
Empirical Considerations. University of Chicago Press, Chicago, Illinois.
Royce, W. F., L. S. Smith, and A. C. Hartt. 1968. Models of oceanic migrations of Pacific
salmon and comments on guidance mechanisms. Fisheries Bulletin 66:441-462.
Royer, T. C. 2005. Hydrographic responses at a coastal site in the northern Gulf of Alaska to
seasonal and interannual forcing. Deep-Sea Research II 52:267-288.
Royer, T. C., and T. Weingartner. 1999. Coastal hydrographic responses in the northern Gulf of
Alaska to the 1997-98 ENSO event. Proceedings of the 1998 Science Board Symposium
on the impacts of the 1997/98 El Niño event on the North Pacific Ocean and its marginal
seas.
Ruud, J. T. 1956. The blue whale. (Balaenoptera musculus). Scientific American 195:46-50.
Saez, L., and coauthors. 2013. Understanding the co-occurrence of large whales and commercial
fixed gear fisheries off the west coast of the United States. NOAA, National Marine
Fisheries Service, Southwest Region.
Sakuma, K. M., and S. Ralston. 1995. Distributional patterns of late larval groundfish off central
California in relation to hydrographic features during 1992 and 1993. California
Cooperative Oceanic Fisheries Investigations Reports 36:179-192.
Salden, D. R. 1988. Humpback whale encounter rates offshore of Maui, Hawaii. Journal of
Wildlife Management 52(2):301-304.
Salo, E. O. 1991a. The life history of chum salmon (Onchorhynchus keta). C. Groot, and L.
Margolis, editors. Pacific Salmon Life Histories. UBC Press, Vancouver, Canada.
Salo, E. O. 1991b. Life history of chum salmon (Oncorhynchus keta). Pages, editor Pacific
salmon life histories. University of British Columbia Press, Edmonton, Alberta.
Salvadeo, C. J., and coauthors. 2011. Bryde's whale (Balaenoptera edeni) in the southwestern
Gulf of California: Relationship with ENSO variability and prey availability. Ciencias
Marinas 37(2):215-225.
Samaran, F., C. Guinet, O. Adam, J. F. Motsch, and Y. Cansi. 2010. Source level estimation of
two blue whale subspecies in southwestern Indian Ocean. Journal of the Acoustical
Society of America 127(6):3800-3808.
Sandercock, F. K. 1991. The History of Coho Salmon (Oncorhynchus kisutch). Pages xx-xx in,
C. Groot and L. Margolis, eds. Pacific Salmon Life History. Vancouver: University of
British Columbia Press.
Santidrián Tomillo, P., and coauthors. 2012. Climate Driven Egg and Hatchling Mortality
Threatens Survival of Eastern Pacific Leatherback Turtles. PLoS ONE 7(5):e37602.
Sarti-Martinez, A. L. 2000. Dermochelys coriacea. IUCN Red List of Threatened Species.
Sarti M., L. 1996. A note about declining leatherbacks in Mexico. Marine Turtle Newsletter
75:25-26.
678
Biological Opinion and Conference Report on Navy NWTT Activities and NMFS’ MMPA Incidental Take
Authorization PCTS FPR-2015-9110
Saski, H., and coauthors. 2013. Habitat differentiation between sei (Balaenoptera borealis) and
Bryde’s whales (B. brydei) in the western North Pacific. Fisheries Oceanography
22(6):496-508.
Saunders, K. J., P. R. White, and T. G. Leighton. 2008. Models for predicting nitrogen tensions
in diving odontocetes. Pages 88 in Twenty Second Annual Conference of the European
Cetacean Society, Egnond aan Zee, The Netherlands.
Scarff, J. E. 1986a. Historic and present distribution of the right whale (Eubalaena glacialis) in
the eastern North Pacific south of 50°N and east of 180°W. Report of the International
Whaling Commission Special Issue 10:43-63.
Scarff, J. E. 1986b. Historic and present distribution of the right whale (Eubalaena glacialis) in
the eastern North Pacific south of 50oN and east of 180oW. Report of the International
Whaling Commission (Special Issue 10):43-63.
Schecklman, S., D. Houser, M. Cross, D. Hernandez, and M. Siderius. 2011. Comparison of
methods used for computing the impact of sound on the marine environment. Marine
Environmental Research 71:342-350.
Scheffer, V. B., and J. W. Slipp. 1948a. The whales and dolphins of Washington State with a key
to the cetaceans of the west coast of North America. The American Midland Naturalist
39:257-337.
Scheffer, V. B., and J. W. Slipp. 1948b. The whales and dolphins of Washington State with a key
to the cetaceans of the west coast of North America. American Midland Naturalist
39:257-337.
Scheidat, M., C. Castro, J. Gonzalez, and R. Williams. 2004. Behavioural responses of
humpback whales (Megaptera novaeangliae) to whalewatching boats near Isla de la
Plata, Machalilla National Park, Ecuador. Journal of Cetacean Research and Management
6(1):63-68.
Scheifele, P. M., and coauthors. 2005. Indication of a Lombard vocal response in the St.
Lawrence River beluga. Journal of the Acoustical Society of America 117(3):1486-1492.
Schevill, W. E., and W. A. Watkins. 1966. Sound structure and directionality in Orcinus (killer
whale). Zoologica 51(2):71-76 +6pls.
Schevill, W. E., W. A. Watkins, and R. H. Backus. 1964. The 20-cycle signals and Balaenoptera
(fin whales). Pages 147-152 in W. N. Tavolga, editor Marine Bio-acoustics. Pergamon
Press, Lerner Marine Laboratory, Bimini, Bahamas.
Schlundt, C. E., R. L. Dear, D. A. Carder, and J. J. Finneran. 2006. Growth and recovery of
temporary threshold shifts in a dolphin exposed to midfrequency tones with durations up
to 128 s. Journal of the Acoustical Society of America 120(5 Part 2):3227.
Schlundt, C. E., J. J. Finneran, D. A. Carder, and S. H. Ridgway. 2000a. Temporary shift in
masked hearing thresholds of bottlenose dolphins, Tursiops truncatus, and white whales,
Delphinapterus leucas, after exposure to intense tones. Journal of the Acoustical Society
of America 107(6):3496-3508.
Schlundt, C. R., J. J. Finneran, D. A. Carder, and S. H. Ridgway. 2000b. Temporary shift in
masked hearing thresholds of bottlenose dolphins, Tursiops truncatus, and white whale,
Delphinapterus leucas, after exposure to intense tones. Journal of the Acoustical Society
of America 107(6):3496-3508.
Schoenherr, J. R. 1991. Blue whales feeding on high concentrations of euphausiids around
Monterey Submarine Canyon. (Balaenoptera musculus). Canadian Journal of Zoology
69(3):583-594.
679
Biological Opinion and Conference Report on Navy NWTT Activities and NMFS’ MMPA Incidental Take Authorization PCTS FPR-2015-9110
Scholik, A. R., and H. Y. Yan. 2001. Effects of underwater noise on auditory sensitivity of a
cyprinid fish. Hearing Research 152(1-2):17-24.
Scholik, A. R., and H. Y. Yan. 2002a. Effects of Boat Engine Noise on the Auditory Sensitivity
of the Fathead Minnow, <i>Pimephales promelas</i>. Environmental Biology
of Fishes 63(2):203-209.
Scholik, A. R., and H. Y. Yan. 2002b. The effects of noise on the auditory sensitivity of the
bluegill sunfish, Lepomis macrochirus. Comparative Biochemistry and Physiology A
Molecular and Integrative Physiology 133(1):43-52.
Schorr, G., E. Falcone, J. Calambokidis, and C. Research. 2013. Summary of tag deployments on
cetaceans off Washington May 2010 to May 2013, San Diego, California.
Schroeder, D. M., and M. S. Love. 2002. Recreational fishing and marine fish populations in
California. California Cooperative Oceanic Fisheries Investigations Reports 43:182-190.
Schultz, L. P., and A. C. DeLacy. 1935. Fishes of the American Northwest : a catalogue of the
fishes of Washington and Oregon, with distributional records and a bibliography. s.n.,
Honolulu?
Schwartz, A. L. 1985. The behavior of fishes in their acoustsic environment. Environmental
Biology of Fishes 13(1):3-15.
Schwartz, F. J. 1978. Behavioral and tolerance responses to cold water temperatures by three
species of sea turtles (Reptilia, Cheloniidae) in North Carolina. Florida Marine Research
Publications 33:16-18.
Scott, M. D., R. S. Wells, A. B. Irvine, and B. R. Mate. 1990. Tagging and marking studies on
small cetaceans. Pages 489-514 in S. Leatherwood, and R. R. Reeves, editors. The
Bottlenose Dolphin. Academic Press, San Diego.
Scott, T. M., and S. Sadove. 1997. Sperm whale, Physeter macrocephalus, sightings in the
shallow shelf waters off Long Island, New York. Marine Mammal Science 13(2):4.
Scott, W. B., and E. J. Crossman. 1973. Freshwater fishes of Canada. Bulletin of the Fisheries
Research Board of Canada 184:1-966.
Sears, R. 1983. A glimpse of blue whales feeding in the Gulf of St. Lawrence. Whalewatcher
17(3):12-14.
Sears, R. 1987. Study on blue whales - brief description. Unpublished paper to the IWC
Scientific Committee. 2 pp. Bournemouth, June (SC/39/PS20).
Sebring, S. H., and coauthors. 2013. Relative vulnerability of PIT-tagged subyearling fall
Chinook salmon to predation by Caspian terns and double-crested cormorants in the
Columbia River Estuary. Transactions of the American Fisheries Society 142(5):1321
1334.
Secretariat of the Convention on Biological Diversity. 2014. An Updated Synthesis of the
Impacts of Ocean Acidification on Marine Biodiversity, Montreal, Technical Series No.
75, 99 pp.
Seiler, D., L. Kishimoto, and S. Neuhauser. 2002. 2001 Skagit River wild 0+ chinook production
evaluation, Contract report to Seattle City Light. Report FPA 02-11, Washington
Department of Fish and Wildlife, Olympia, Washington.
Seiler, D., G. Volkhardt, and L. Fleischer. 2004. Evaluation of downstream migrant salmon
production in 2001 from the Cedar River and Bear Creek, Washington Department of
Fish and Wildlife, Olympia.
680
Biological Opinion and Conference Report on Navy NWTT Activities and NMFS’ MMPA Incidental Take Authorization PCTS FPR-2015-9110
Seiler, D., G. Volkhardt, and L. Fleischer. 2005. Evaluation of downstream migrant salmon
production in 2004 from the Cedar River and Bear Creek, Washington Department of
Fish and Wildlife, Olympia, Washington.
Settle, L. R., J. J. Govoni, M. D. Greene, and M. A. West. 2002. Investigation of impacts of
underwater explosions on larval and early juvenile fishes. Fisheries and Oceans Canada.
SG. 1991. Conventional warfare ballistic, blast, and burn injuries. C. R. Zajitchuk, editor.
Textbook of Military Medicine. Office of the Surgeon General, Washington D.C.
Shallenberger, E. W. 1981. The status of Hawaiian cetaceans. Marine Mammal Commission.
Shane, S. H. 1994. Occurrence and habitat use of marine mammals at Santa Catalina Island,
California from 1983-91. Bulletin of the Southern California Academy of Sciences
93:13-29.
Shane, S. H. 1995. Behavior patterns of pilot whales and Risso's dolphins off Santa Catalina
Island, California. Aquatic Mammals 21(3):195-197.
Shane, S. H., R. S. Wells, B. Wursig, and B. Wursig. 1986. Ecology, behavior and social
organization of the bottle-nosed dolphin - a review. Marine Mammal Science 2(1):34-63.
Shared Strategy for Puget Sound. 2007. Puget Sound salmon recovery plan. Volume 1, recovery
plan, Seattle.
Sharpe, F. A., and L. M. Dill. 1997. The behavior of Pacific herring schools in response to
artificial humpback whale bubbles. (Megaptera novaeangliae). Canadian Journal of
Zoology 75(5):725-730.
Shelden, K. E. W., S. E. Moore, J. M. Waite, P. R. Wade, and D. J. Rugh. 2005. Historic and
current habitat use by North Pacific right whales Eubalaena japonica in the Bering Sea
and Gulf of Alaska. Mammal Review 35(2):129-155.
Shelden, K. E. W., and coauthors. 2000. Winter observations of cetaceans off the Northern
Washington coast. Northwest Naturalist 81:54-59.
Sherr, E. B., B. F. Sherr, and P. A. Wheeler. 2005. Distribution of coccoid cyanobacteria and
small eukaryotic phytoplankton in the upwelling ecosystem off the Oregon coast during
2001 and 2002. Deep-Sea Research II 52:317-330.
Sigurjonsson, J., T. Gunnlaugsson, and M. Payne. 1989. NASS-87: Shipboard sightings surveys
in Icelandic and adjacent waters June-July 1987. Report of the International Whaling
Commission 39:395-409.
Silber, G., J. Slutsky, and S. Bettridge. 2010. Hydrodynamics of a ship/whale collision. Journal
of Experimental Marine Biology and Ecology 391:10-19.
Silber, G. K. 1986. The Relationship of Social Vocalizations to Surface Behavior and
Aggression in the Hawaiian Humpback Whale (Megaptera novaeangliae). Canadian
Journal of Zoology 64(10):2075-2080.
Simao, S. M., and S. C. Moreira. 2005. Vocalizations of a female humpback whale in Arraial do
Cabo (Rj, Brazil). Marine Mammal Science 21(1):150-153.
Simenstad, C. A., and E. O. Salo. 1982. Foraging success as a determinant of estuarine and
nearshore carrying capacity of juvenile chum salmon (Oncorhychus keta) in Hood Canal,
Washington. Pages 21-37 in B.R. Melteff and R.A. Nevé, eds. Proceedings of the North
Pacific Aquaculture Symposium, Alaska Sea Grant Report 82-2.
Simmonds, M. P. 2005a. Whale watching and monitoring - some considerations. Unpublished
paper to the IWC Scientific Committee. 5 pp. Ulsan, Korea, June (SC/57/WW5).
681

Biological Opinion and Conference Report on Navy NWTT Activities and NMFS’ MMPA Incidental Take Authorization PCTS FPR-2015-9110
Simmonds, M. P. 2005b. Whale watching and monitoring: some considerations. Unpublished
paper submitted to the Scientific Committee of the International Whaling Commission
SC/57/WW5, Cambridge, United Kingdom.
Simmonds, M. P., and W. J. Eliott. 2009. Climate change and cetaceans: Concerns and recent
developments. Journal of the Marine Biological Association of the United Kingdom
89(1):203-210.
Simmonds, M. P., and J. D. Hutchinson. 1996. The conservation of whales and dolphins. John
Wiley and Sons, Chichester, U.K.
Simmonds, M. P., and S. J. Isaac. 2007. The impacts of climate change on marine mammals:
Early signs of significant problems. Oryx 41(1):19-26.
Sims, D. W., M. J. Genner, A. J. Southward, and S. J. Hawkins. 2001. Timing of squid migration
reflects North Atlantic climate variability. Proceedings of the Royal Society of London
Series B-Biological Sciences 268(1485):2607-2611.
Sims, P. Q., S. K. Hung, and B. Wursig. 2012. High-speed vessel noises in West Hong Kong
waters and their contributions relative to Indo-Pacific humpback dolphins (Sousa
chinensis). Journal of Marine Biology 2012:11.
Sinnen, W., and coauthors. 2011. Final Annual Report Trinity River Basin salmon and steelhead
monitoring project 2010-11 season. State of California, The Resources Agency,
Department of Fish and Game.
SIO. 2005. Environmental assessment of a planned low-energy marine seismic survey by the
Scripps Institution of Oceanography on the Lousiviile Ridge in the southwest Pacific
Ocean, January-February 2006. Scripps Institution of Oceanography.
Sirovic, A., and D. A. Demer. 2009. Sounds of captive rockfishes. Copeia (3):502-509.
Širović, A., and coauthors. 2012. Passive Acoustic Monitoring for Marine Mammals in the
Northwest Training Range Complex 2011. Marine Physical Laboratory, Scripps
Institution of Oceanography, University of California San Diego, La Jolla, CA.
Sirovic, A., J. A. Hildebrand, and S. M. Wiggins. 2007. Blue and fin whale call source levels and
propagation range in the Southern Ocean. Journal of the Acoustical Society of America
122(2):1208-1215.
Sirovic, A., and coauthors. 2004. Location and range of calling blue and fin whales off the
western Antarctic Peninsula. Journal of the Acoustical Society of America 116(4):2607.
Sirovic, A., and coauthors. 2015. North Pacific right whales (Eubalaena japonica) recorded in
the northeastern Pacific Ocean in 2013. Marine Mammal Science 31(2):800-807.
Širović, A., and coauthors. 2011. Marine Mammal Demographics of the Otuer Washington Coast
During 2008 - 2009. Naval Postgraduate School, Monterey, California.
Sirovic, A., L. N. Williams, S. M. Kerosky, S. M. Wiggins, and J. A. Hildebrand. 2012.
Temporal separation of two fin whale call types across the eastern North Pacific. Marine
Biology 160(1):47-57.
Sivle, L. D., and coauthors. 2012. Changes in dive behavior during naval sonar exposure in killer
whales, long-finned pilot whales, and sperm whales. Frontiers in Physiology 3:400.
Skalski, J. R., W. H. Pearson, and C. I. Malme. 1992. Effects of sounds from a geophysical
survey device on catch-per-unit-effort in a hook-and-line fishery for rockfish (Sebastes
spp.). Canadian Journal of Fisheries and Aquatic Sciences 49:1357-1365.
Slabbekoorn, H., and coauthors. 2010. A noisy spring: The impact of globally rising underwater
sound levels on fish. Trends in Ecology and Evolution 25(7):419-427.
682
Biological Opinion and Conference Report on Navy NWTT Activities and NMFS’ MMPA Incidental Take
Authorization PCTS FPR-2015-9110
Slijper, E. J. 1962. Whales. English translation Hutchinson & Co. (Publishers). First published in
the U.S. by Basic Books Publishing Co., Inc, New York. 475pp.
Slotte, A., K. Hansen, J. Dalen, and E. Ona. 2004. Acoustic mapping of pelagic fish distribution
and abundance in relation to a seismic shooting area off the Norwegian west coast.
Fisheries Research 67(2):143-150.
Smith, A. W., and A. B. Latham. 1978. Prevalence of vesicular exanthema of swine antibodies
among feral mammals associated with the southern California coastal zones. American
Journal of Veterinary Research 39(2):291-6.
Smith, J. N., A. W. Goldizen, R. A. Dunlop, and M. J. Noad. 2008. Songs of male humpback
whales, Megaptera novaeangliae, are involved in intersexual interactions. Animal
Behaviour 76(2):467-477.
Smith, M. E., A. B. Coffin, D. L. Miller, and A. N. Popper. 2006a. Anatomical and functional
recovery of the goldfish (Carassius auratus) ear following noise exposure. Journal of
Experimental Biology 209(21):4193-4202.
Smith, M. E., A. S. Kane, and A. N. Popper. 2004a. Acoustical stress and hearing sensitivity in
fishes: Does the linear threshold shift hypothesis hold water? Journal of Experimental
Biology 207(20):3591-3602.
Smith, M. E., A. S. Kane, and A. N. Popper. 2004b. Noise-induced stress response and hearing
loss in goldfish (Carassius auratus). Journal of Experimental Biology 207(3):427-435.
Smith, M. E., L. E. Wysocki, and A. N. Popper. 2006b. Effects of background sound on fish.
Journal of the Acoustical Society of America 119(5 Part 2):3283-3284.
Smultea, M. A., T. A. Jefferson, and A. M. Zoidis. 2010. Rare sightings of a bryde’s whale
(Balaenoptera edeni) and sei whales (B. borealis) (Cetacea: Balaenopteridae) northeast
of O‘ahu, Hawai‘i. Pacific Science 64(3):449-457.
Smultea, M. A., J. R. Mobley Jr., D. Fertl, and G. L. Fulling. 2008. An unusual reaction and
other observations of sperm whales near fixed-wing aircraft. Gulf and Caribbean
Research 20:75-80.
Sogard, S. M., S. A. Berkeley, and R. Fisher. 2008. Maternal effects in rockfishes Sebastes spp.:
a comparison among species. Marine Ecology-Progress Series 360:227-236.
Song, J., D. A. Mann, P. A. Cott, B. W. Hanna, and A. N. Popper. 2008. The inner ears of
northern Canadian freshwater fishes following exposure to seismic air gun sounds.
Journal of the Acoustical Society of America 124(2):1360-1366.
Sonoma County Water Agency. 2012. Chinook Salmon in the Russian River.
http://www.scwa.ca.gov/chinook/.
Sousa-Lima, R. S., and C. W. Clark. 2008. Modeling the effect of boat traffic on the fluctuation
of humpback whale singing activity in the Abrolhos National Marine Park, Brazil.
Canadian Acoustics 36(1):174-181.
Southall, B., and coauthors. 2009. Addressing the effects of human-generated sound on marine
life: An integrated research plan for U.S. federal agencies. Interagency Task Force on
Anthropogenic Sound and the Marine Environment of the Joint Subcommittee on Ocean
Science and Technology Washington, D. C.
Southall, B., and coauthors. 2007a. Aquatic mammals marine mammal noise exposure criteria:
Initial scientific recommendations. Aquatic Mammals 33(4):122.
Southall, B., and coauthors. 2013. Measuring cetacean reponses to military sonar: Behavioral
response studies in southern California (SOCAL-BRS). Pages 196 in Twentieth Biennial
Conference on the Biology of Marine Mammals, Dunedin, New Zealand.
683

Biological Opinion and Conference Report on Navy NWTT Activities and NMFS’ MMPA Incidental Take Authorization PCTS FPR-2015-9110
Southall, B., and coauthors. 2012a. Biological and behavioral response studies of marine
mammals in Southern California, 2011 ("SOCAL-11") final project report.
Southall, B., and coauthors. 2011a. Biological and Behavioral Response Studies of Marine
Mammals in Southern California, 2010 (“SOCAL -10”).
Southall, B. L. 2005. Shipping Noise and Marine Mammals: A Forum for Science, Management,
and Technology. National Oceanic and Atmospheric Administration, Fisheries Acoustics
Program, Arlington, Virginia.
Southall, B. L., and coauthors. 2007b. Marine mammal noise exposure criteria: initial scientific
recommendations. Aquatic Mammals 33(4):411-521.
Southall, B. L., and coauthors. 2007c. Marine mammal noise and exposure criteria: initial
scientific recommendations. Aquatic Mammals 33:411-521.
Southall, B. L., and coauthors. 2007d. Marine mammal noise exposure criteria: Initial scientific
recommendations. Aquatic Mammals 33(4):411-521.
Southall, B. L., and coauthors. 2011b. Biological and behavioral response studies of marine
mammals in southern California (SOCAL-10). Pages 279 in Nineteenth Biennial
Conference on the Biology of Marine Mammals, Tampa, Florida.
Southall, B. L., and coauthors. 2012b. Marine mammal behavioral response studies in southern
California: Advances in technology and experimental methods. Marine Technology
Society Journal 46(4):48-59.
Southall, B. L., R. J. Schusterman, and D. Kastak. 2000. Masking in three pinnipeds:
Underwater, low-frequency critical ratios. Journal of the Acoustical Society of America
108(3):1322-1326.
Southall, B. L., R. J. Schusterman, and D. Kastak. 2003. Auditory masking in three pinnipeds:
Aerial critical ratios and direct critical bandwidth measurements. Journal of the
Acoustical Society of America 114(3):1660-1666.
Southall, B. L., R. J. Schusterman, D. Kastak, and C. R. Kastak. 2005. Reliability of underwater
hearing thresholds in pinnipeds. Acoustics Research Letters Online 6(4):243-249.
Southwood, A., B. Higgins, R. Brill, and Y. Swimmer. 2007. Chemoreception in loggerhead sea
turtles: An assessment of the feasibility of using chemical deterrents to prevent sea turtle
interactions with longline fishing gear. National Oceanic and Atmospheric
Administration, National Marine Fisheries Service, Pacific Islands Fisheries Science
Center.
Southwood, A. L., and coauthors. 1999. Heart rates and diving behavior of leatherback sea
turtles in the Eastern Pacific Ocean. Journal of Experimental Biology 202(9):1115-1125.
Spargo, B. J. 2007. Chaff end cap and piston bouyancy. M. Collins, editor. Parson.
Spence, B. C., and coauthors. 2008. A framework for assessing the viability of threatened and
endangered salmon and steelhead in the nort-central California Coast Recovery Domain.
National Oceanic and Atmospheric Administration, National Marine Fisheries Service,
Southwest Fisheries Science Center.
Spence, B. C., E. P. Bjorkstedt, S. Paddock, and L. Nanus. 2012. Updates to biological viability
critieria for threatened steelhead populations in the North-Central California Coast
Recovery Domain, National Marine Fisheries Service. Southwest Fisheries Science
Center, Fisheries Ecology Division. March 23.
Spotila, J. R. 2004. Sea turtles: a complete guide to their biology, behavior, and conservation.
The Johns Hopkins University Press and Oakwood Arts, Baltimore, Maryland.
684
Biological Opinion and Conference Report on Navy NWTT Activities and NMFS’ MMPA Incidental Take Authorization PCTS FPR-2015-9110
Spotila, J. R., and coauthors. 1996. Worldwide population decline of Dermochelys coriacea: Are
leatherback turtles going extinct? Chelonian Conservation and Biology 2(2):209-222.
Spotila, J. R., R. D. Reina, A. C. Steyermark, P. T. Plotkin, and F. V. Paladino. 2000. Pacific
leatherback turtles face extinction. Nature 405:529-530.
SSPS. 2007a. Puget Sound salmon recovery plan. Volume 1, recovery plan. Shared Strategy for
Puget Sound, editor, Seattle, Washington.
SSPS. 2007b. Puget Sound salmon recovery plan. Volume 1, recovery plan. Shared Strategy for
Puget Sound, Seaatle, Washington.
St. Aubin, D. J. 2002. Further assessment of the potential for fishery-induced stress on dolphins
in the eastern tropical Pacific. National Oceanic and Atmospheric Administration,
National Marine Fisheries Service, Southwest Fisheries Science Center.
St. Aubin, D. J., S. Deguise, P. R. Richard, T. G. Smith, and J. R. Geraci. 2001. Hematology and
plasma chemistry as indicators of health and ecological status in beluga whales,
Delphinapterus leucas. Arctic 54(3):317-331.
St. Aubin, D. J., and L. A. Dierauf. 2001. Stress and marine mammals. Pages 253-269 in L. A.
Dierauf, and F. M. D. Gulland, editors. Handbook of Marine Mammal Medicine, Second
edition. CRC Press, Boca Raton.
St. Aubin, D. J., and J. R. Geraci. 1988. Capture and handling stress suppresses circulating levels
of thyroxine (T4) and triiodothyronine (T3) in beluga whale, Delphinapterus leucas.
Physiological Zoology 61(2):170-175.
St. Aubin, D. J., and J. R. Geraci. 1989. Adaptive changes in hematologic and plasmi chemical
constituents in captive beluga whales, Delphinapterus leucas. Canadian Journal of
Fisheries and Aquatic Sciences 46:796-803.
St. Aubin, D. J., S. H. Ridgway, R. S. Wells, and H. Rhinehart. 1996. Dolphin thyroid and
adrenal hormones: Circulating levels in wild and semidomesticated Tursiops truncatus,
and influence of sex, age, and season. Marine Mammal Science 12(1):1-13.
Stabeno, P. J., and coauthors. 2004. Meteorology and oceanography of the northern Gulf of
Alaska. Continental Shelf Research 24:859-897.
Stadler, J. H., and D. P. Woodbury. 2009. Assessing the effects to fishes from pile driving:
Application of new hydroacoustic criteria. Pages 1-8 in Internoise 2009 Innovations in
Practical Noise Control, Ottowa, Canada.
Stafford, K. M. 2003a. Two types of blue whale calls recorded in the Gulf of Alaska. Marine
Mammal Science 19(4):12.
Stafford, K. M. 2003b. Two types of blue whale calls recorded in the Gulf of Alaska. Marine
Mammal Science 19(4):682-693.
Stafford, K. M., C. G. Fox, and D. S. Clark. 1998. Long-range acoustic detection and localization
of blue whale calls in the northeast Pacific Ocean. (Balaenoptera musculus). Journal of
the Acoustical Society of America 104(6):3616-3625.
Stafford, K. M., D. K. Mellinger, S. E. Moore, and C. G. Fox. 2007. Seasonal variability and
detection range modeling of baleen whale calls in the Gulf of Alaska, 1999–2002. The
Journal of the Acoustical Society of America 122(6):3378-3390.
Stafford, K. M., and S. E. Moore. 2005a. Atypical calling by a blue whale in the Gulf of Alaska
(L). Journal of the Acoustical Society of America 117(5):2724-2727.
Stafford, K. M., and S. E. Moore. 2005b. Atypical calling by a blue whale in the Gulf of Alaska
(L). Journal of the Acoustical Society of America 117(5):2724-2727.
685
Biological Opinion and Conference Report on Navy NWTT Activities and NMFS’ MMPA Incidental Take Authorization PCTS FPR-2015-9110
Stafford, K. M., S. L. Nieukirk, and C. G. Fox. 2001a. Geographic and seasonal variation of blue
whale calls in the North Pacific. Journal of Cetacean Research and Management 3(1):65
76.
Stafford, K. M., S. L. Nieukirk, and C. G. Fox. 2001b. Geographic and seasonal variation of blue
whale calls in the North Pacific. (Balaenoptera musculus). Journal of Cetacean Research
And Management 3(1):65-76.
Stahl-Johnson, K. L. 1985. Descriptive characteristics of reared Sebastes caurinus and S.
auriculatus larvae. Pages 65-76 in A. W. Kendall Jr., and J. B. Marliave, editors. 3rd
International Symposium on the Early Life History of Fishes & 8th Annual Larval Fish
Conference.
Standora, E. A., J. R. Spotila, J. A. Keinath, and C. R. Shoop. 1984. Body temperatures, diving
cycles, and movement of a subadult leatherback turtle, Dermochelys coriacea.
Herpetologica 40:169-176.
Starr, R. M. 1998. Design principles for rockfish reserves on the U. S. West Coast. Marine
harvest refugia for west coast rockfish: a workshop.
Starr, R. M., J. N. Heine, J. M. Felton, and G. M. Cailliet. 2002. Movements of bocaccio
(Sebastes paucispinis) and greenspotted (S. chlorostictus) rockfishes in a Monterey
submarine canyon: implications for the design of marine reserves. Fishery Bulletin
100:324-337.
STAT. 1999. Status of the canary rockfish resource off Oregon and Washington in 1999.
National Marine Fisheries Service, Newport, Oregon.
Steiger, G. H., and coauthors. 2008. Geographic variation in killer whale attacks on humpback
whales in the North Pacific: Implications for predation pressure. Endangered Species
Research 4(3):247-256.
Stein, J. E., and coauthors. 1992. Bioindicators of contaminant exposure and sublethal effects:
Studies with benthic fish in Puget Sound, WA. Environmental Toxicology and Chemistry
11:701-714.
Stensland, E., and P. Berggren. 2007. Behavioural changes in female Indo-Pacific bottlenose
dolphins in response to boat-based tourism. Marine Ecology Progress Series 332:225
234.
Stevens, D. E., and L. W. Miller. 1983. Effects of river flow on abundance of young Chinook
salmon, American shad, longfin smelt, and delta smelt in the Sacramento-San Joaquin
river system. Journal of Fisheries Management 3:425-437.
Stillwater Sciences, Central Coast Salmon Enhancement, and Greenspace. 2012. Satna Rosa
Creek Watershed Management Plan, Prepared for the California Department of Fish and
Game, under a grant for the Fisheries Restoration Grant Program (P0740401).
Stimpert, A. K., and coauthors. 2014. Acoustic and foraging behavior of a Baird's beaked whale,
Berardius bairdii, exposed to simulated sonar. Scientific Reports 4(7031):8.
Stimpert, A. K., D. N. Wiley, W. W. L. Au, M. P. Johnson, and R. Arsenault. 2007.
‘Megapclicks’: Acoustic click trains and buzzes produced during night-time foraging of
humpback whales (Megaptera novaeangliae). Biology Letters 3(5):467-470.
Stinson, M. L. 1984. Biology of sea turtles in San Diego Bay, California, and in the northeastern
Pacific Ocean. San Diego State University.
Stock, M. K., and coauthors. 1980. Responses of fetal sheep to simulated no-decompression
dives. 48(5):776-780.
686
Biological Opinion and Conference Report on Navy NWTT Activities and NMFS’ MMPA Incidental Take Authorization PCTS FPR-2015-9110
Stockin, K., D. Lusseau, V. Binedell, N. Wiseman, and M. Orams. 2008. Tourism affects the
behavioural budget of the common dolphin Delphinus sp. in the Hauraki Gulf, New
Zealand. Marine Ecology Progress Series 355:287-295.
Stockin, K. A. 2008. The New Zealand common dolphin (Delphinus sp.) - identity, ecology and
conservation. Massey University.
Stolz, J., and J. Schnell. 1991. Trout. Stackpole Books, Harrisburg, Pennsylvania.
Stone, C. J. 1997. Cetacean observations during seismic survey in 1996. JNCC.
Stone, C. J. 1998. Cetacean observations during seismic surveys in 1997. Joint Nature
Conservation Committee, JNCC Report No. 278 Peterborough.
Stone, C. J. 2000. Cetacean observations during seismic surveys in 1998. Joint Nature
Conservation Committee, JNCC Report No. 301, Peterborough.
Stone, C. J. 2001. Cetacean observations during seismic surveys in 1999. Joint Nature
Conservation Committee, JNCC Report No. 316, Peterborough.
Stone, C. J. 2003. The effects of seismic activity on marine mammals in UK waters, 1998-2000.
Joint Nature Conservation Committee, JNCC Report No. 323.
Stone, G. S., S. K. Katona, A. Mainwaring, J. M. Allen, and H. D. Corbett. 1992. Respiration
and surfacing rates of fin whales (Balaenoptera physalus) observed from a lighthouse
tower. Report of the International Whaling Commission 42:739-745.
Stout, H. A., and coauthors. 2012. Scientific conclusions of the status review for Oregon Coast
coho salmon (Oncorhynchus kisutch). Pages 242 p. in U.S. Department of Commerce,
editor.
Straley, J., and T. O'Connell. 2005. Sperm whale interactions with longline fisheries in the Gulf
of Alaska. Oncorhynchus 15(1):1-2.
Straley, J., T. O'Connell, L. Behnken, and A. Thode. 2005. Southeast Alaska Sperm Whale
Avoidance Project: Fishermen and Scientists Working to Reduce Whale Depredation on
Longlines.
Strange, J. S. 2010. Upper thermal limits to migration in adult Chinook salmon: Evidence from
the Klamath River Basin. Transactions of American Fisheries Society 139:1091-1108.
Streamnet. 2014. Salmon and steelhead abundance data. http://www.streamnet.org/.
Studebaker, R. S., K. N. Cox, and T. J. Mulligan. 2009. Recent and historical spatial distributions
of juvenile rockfish species in rocky intertidal tide pools, with emphasis on black
rockfish. Transactions of the American Fisheries Society 138:645-651.
Suarez, A., P. H. Dutton, and J. Bakarbessy. 2000. Leatherback (Dermochelys coriacea) nesting
on the north Vogelkop coast of Irian Jaya, Indonesia. Pages 260 in H. Kalb, and T.
Wibbels, editors. Nineteenth Annual Symposium on Sea Turtle Biology and
Conservation. U.S. Department of Commerce, National Oceanic and Atmospheric
Administration, National Marine Fisheries Service, Southeast Fisheries Science Center.
Sugimoto, T., S. Kimura, and K. Tadokoro. 2001. Impact of El Niño events and climate regime
shift on living resources in the western North Pacific. Progress in Oceanograpy 49:113
127.
Supin, A. Y., P. E. Nachtigall, and M. Breese. 2011. Interaction of emitted sonar pulses and
simulated echoes in a false killer whale: An evoked-potential study. Journal of the
Acoustical Society of America 130(3):1711-1720.
Suzuki, Y., and H. Takeshima. 2004. Equal-loudness-level contours for pure tones. Journal of
Acoustical Society of America 116(2):918-933.
687
Biological Opinion and Conference Report on Navy NWTT Activities and NMFS’ MMPA Incidental Take Authorization PCTS FPR-2015-9110
Swain, D. P., A. F. Sinclair, and J. M. Hanson. 2007. Evolutionary response to size-selective
mortality in an exploited fish population. Proceedings of the Royal Society of London
Series B: Biological Sciences 274:1015-1022.
Swartz, S. L., B. L. Taylor, and D. J. Rugh. 2006. Gray whale Eschrichtius robustus population
and stock identity. Mammal Review 36(1):66-84.
Sydeman, W. J., K. A. Mills, J. A. Santora, and S. A. Thompson. 2009. Seabirds and climate in
the California Current - A synthesis of change. CalCOFI Rep 50.
Sydeman, W. J., J. A. Santora, S. A. Thompson, B. Marinovic, and E. D. Lorenzo. 2013.
Increasing variance in North Pacific climate relates to unprecedented ecosystem
variability off California. Global Change Biology 19:1662-1675.
Tabuchi, M., and coauthors. 2006. PCB-related alteration of thyroid hormones and thyroid
hormone receptor gene expression in free-ranging harbor seals (Phoca vitulina).
Environmental Health Perspectives 114(7):1024-1031.
Tagal, M., and coauthors. 2002. Larval development of yelloweye rockfish, Sebastes ruberrimus.
National Oceanic and Atmospheric Administration, Northwest Fisheries Science Center.
Tavolga, W. N. 1974a. Sensory parameters in communication among coral reef fishes. The
Mount Sinai Journal of Medicine 41(2):324-340.
Tavolga, W. N. 1974b. Signal/noise ratio and the critical band in fishes. Journal of the Acoustical
Society of America 55:1323-1333.
Teilmann, J., and coauthors. 2006. Reactions of captive harbor porpoises (Phocoena phocoena)
to pinger-like sounds. Marine Mammal Science 22(2):240-260.
Teloni, V., W. M. X. Zimmer, M. Wahlberg, and P. T. Madsen. 2007. Consistent acoustic size
estimation of sperm whales using clicks recorded from unknown aspects. Journal of
Cetacean Research And Management 9(2):127-136.
Terhune, J. M., and W. C. Verboom. 1999. Right whales and ship noises. Marine Mammal
Science 15(1):256-258.
Tershy, B. R., J. Urbán-R, D. Breese, L. Rojas-B, and L. T. Findley. 1993. Are fin whales
resident to the Gulf of California. Rev. Invest. Cient., Univ. Auton. de Baja California
Sur 1:69-71.
Teubert, R., R. Aschbacher, and M. Mitchell. 2011. Video weir technology pilot project final
project report 2008– 2010 steelhead escapements Cottonwood, Cow, and Bear Creeks,
Shasta and Tehama County, CA, Western Shasta Resource Conservation District,
Anderson, California.
TEWG. 2007. An assessment of the leatherback turtle population in the Atlantic Ocean. National
Oceanic and Atmospheric Administration, National Marine Fisheries Service, Southeast
Fisheries Science Center, Turtle Expert Working Group.
Thode, A., J. Straley, C. O. Tiemann, K. Folkert, and V. O'Connell. 2007. Observations of
potential acoustic cues that attract sperm whales to longline fishing in the Gulf of Alaska.
Journal of the Acoustical Society of America 122(2):1265-1277.
Thomas, A., and P. T. Strub. 2001. Cross-shelf phytoplankton pigment variability in the
California Current. Continental Shelf Research 21(11-12):1157-1190.
Thomas, J. A., R. A. Kastelein, and F. T. Awbrey. 1990. Behavior and blood catecholamines of
captive belugas during playbacks of noise from ships and oil drilling platform. Zoo
Biology 9(5):393-402.
688
Biological Opinion and Conference Report on Navy NWTT Activities and NMFS’ MMPA Incidental Take Authorization PCTS FPR-2015-9110
Thompson, P. M., and coauthors. 2013. Short-term disturbance by a commercial two-
dimensional seismic survey does not lead to long-term displacement of harbour
porpoises. Proceedings of the Royal Society Biological Sciences Series B 280(1771).
Thompson, P. O., W. C. Cummings, and S. J. Ha. 1986a. Sounds, source levels, and associated
behavior of humpback whales, Southeast Alaska. Journal of the Acoustical Society of
America 80(3):735-740.
Thompson, P. O., W. C. Cummings, and S. J. Ha. 1986b. Sounds, source levels, and associated
behavior of humpback whales, Southeast Alaska. Journal of the Acoustical Society of
America 80(3):735-740.
Thompson, P. O., L. T. Findley, O. Vidal, and W. C. Cummings. 1996. Underwater sounds of
blue whales, Balaenoptera musculus, in the Gulf of California, Mexico. Marine Mammal
Science 12(2):288-293.
Thompson, P. O., L. T. Findley, and O. Vidal. 1992. 20-Hz pulses and other vocalizations of fin
whales, Balaenoptera physalus, in the Gulf of California, Mexico. Journal of the
Acoustical Society of America 92(6):3051-3057.
Thompson, P. O., and W. A. Friedl. 1982. A long term study of low frequency sounds from
several species of whales off Oahu, Hawaii. Cetology 45:1-19.
Thompson, T. J., H. E. Winn, and P. J. Perkins. 1979. Mysticete sounds. Pages 403-431 in H. E.
Winn, and B. L. Olla, editors. Behavior of Marine Animals: Current Perspectives in
Research, volume 3 Cetaceans. Plenum Press, New York.
Thomsen, F., D. Franck, and J. K. B. Ford. 2001. Characteristics of whistles from the acoustic
repertoire of resident killer whales (Orcinus orca) off Vancouver Island, British
Columbia. Journal of the Acoustical Society of America 109(3):1240-1246.
Thomsen, F., D. Franck, and J. K. B. Ford. 2002. On the communicative significance of whistles
in wild killer whales (Orcinus orca). Naturwissenschaften 89(9):404-407.
Thomson, D. H., and W. J. Richardson. 1995. Marine mammal sounds. W. J. Richardson, J. C.
R. Greene, C. I. Malme, and D. H. Thomson, editors. Marine Mammals and Noise.
Academic Press, San Diego, California.
Tillman, M. F. 1977a. Estimates of population size for the North Pacific sei whale. Report of the
International Whaling Commission Special Issue 1:98-106.
Tillman, M. F. 1977b. Estimates of population size for the North Pacific sei whale.
(Balaenoptera borealis). Report of the International Whaling Commission Special Issue
1:98-106.-Sc/27/Doc 25).
Tissot, B. N., M. A. Hixon, and D. L. Stein. 2007. Habitat-based submersible assessment of
macro-invertebrate and groundfish assemblages at Heceta Bank, Oregon, from 1988 to
1990. Journal of Experimental Marine Biology and Ecology 352(1):50-64.
Todd, S., P. Stevick, J. Lien, F. Marques, and D. Ketten. 1996a. Behavioural effects of exposure
to underwater explosions in humpback whales (Megaptera novaeangliae). Canadian
Journal of Zoology 74(9):1661-1672.
Todd, S., P. T. Stevick, J. Lien, F. Marques, and D. Ketten. 1996b. Behavioral effects of
exposure to underwater explosions in humpback whales (Megaptera novaeangliae).
Canadian Journal of Zoology 74:1661-1672.
Tolimieri, N., and P. S. Levin. 2005. The roles of fishing and climate in the population dynamics
of bocaccio rockfish. Ecological Applications 15:458-468.
Tomás, J., J. Castroviejo, and J. A. Raga. 2000. Sea turtles in the South of Bioko Island
(Equatorial Guinea), Africa. Pages 247-250 in H. Kalb, and T. Wibbels, editors.
689
Biological Opinion and Conference Report on Navy NWTT Activities and NMFS’ MMPA Incidental Take Authorization PCTS FPR-2015-9110
Proceedings of the Nineteenth Annual Symposium on Sea Turtle Biology and
Conservation.
Tomilin, A. G. 1967. Mammals of the USSR and adjacent countries, Vol. 9, Cetacea. Akademiya
Nauk SSR, Moscow. (Translated from Russian by Israel Program for Scientific
Translantions. 717 pgs.).
Tonnessen, J. N., and A. O. Johnsen. 1982. The history of modern whaling. University of
California Press, Berkeley, CA.
Trenberth, K. E. 1997. The definition of El Niño. Bulletin of the American Meteorological
Society 78(12):2771-2777.
Tribe, S. I., and W. D. o. F. a. Wildlife. 2007. Skokomish River Chinook Salmon Recovery Plan.
Trickey, J. S., and coauthors. 2015. Passive Acoustic Monitoring for Marine Mammals in the
Northwest Training Range Complex July 2013 – April 2014, Marine Physical
Laboratory, Scripps Institution of Oceanography, University of California San Diego.
MPL TM-557. 44 p.
Trites, A. W., and D. E. Bain. 2000. Short- and long-term effects of whale watching on killer
whales (Orcinus orca) in British Columbia. University of British Columbia, Fisheries
Center, Marine Mammal Research Unit.
Trumble, S. J., E. M. Robinson, M. Berman-Kowalewski, C. W. Potter, and S. Usenko. 2013.
Blue whale earplug reveals lifetime contaminant exposure and hormone profiles.
Proceedings of the National Academy of Sciences 110(42):16922-16926.
Tseng, Y.-P., Y.-C. Huang, G. T. Kyle, and M.-C. Yang. 2011. Modeling the impacts of
cetacean-focused tourism in Taiwan: Observations from cetacean watching boats: 2002
2005. Environmental Management 47(1):56-66.
Tsidulko, G. A., Q. Zhu, E. Sun, and M. A. Vorontsova. 2005. Scammon Lagoon for the western
North Pacific gray whales? Pages 285 in Sixteenth Biennial Conference on the Biology
of Marine Mammals, San Diego, California.
Tucker, S., and coauthors. 2009. Seasonal stock-specific migrations of juvenile sockeye salmon
along the west coast of North America: Implications for growth. Transactions of the
American Fisheries Society 138(6):1458-1480.
Tyack, P. 1981. Interactions between singing Hawaiian humpback whales and conspecifics
nearby. (Megaptera novaeangliae). Behavioral Ecology and Sociobiology 8(2):105-116.
Tyack, P. 1983. Differential response of humpback whales, Megaptera novaeangliae, to playback
of song or social sounds. Behavioral Ecology and Sociobiology 13(1):49-55.
Tyack, P., T. A. Mooney, R. W. Baird, and P. E. Nachtigall. 2011a. Acoustic behavior, baseline
ecology and habitat use of pelagic odontocete species of concern. Office of Naval
Research.
Tyack, P., and H. Whitehead. 1983. Male competition in large groups of wintering humpback
whales. Behaviour 83(1/2):132-154.
Tyack, P., and coauthors. 2011b. Response of Dtagged Cuvier’s beaked whale, Ziphius
cavirostris, to controlled exposure of sonar sound. Pages 297 in Nineteenth Biennial
Conference on the Biology of Marine Mammals, Tampa, Florida.
Tyack, P. L. 1999. Communication and cognition. Pages 287-323 in J. E. R. III, and S. A.
Rommel, editors. Biology of Marine Mammals. Smithsonian Institution Press,
Washington.
Tyack, P. L. 2010. 3S2–Behavioral response studies of cetaceans to Naval signals in Norwegian
waters. Office of Naval Research.
690
Biological Opinion and Conference Report on Navy NWTT Activities and NMFS’ MMPA Incidental Take
Authorization PCTS FPR-2015-9110
Tyack, P. L., and C. W. Clark. 2000. Communication and acoustic behavior of dolphins and
whales. Hearing by Whales and Dolphins. p.156-224. W. W. L. Au, A. N. Popper, R. R.
Fay (eds.). Springer-Verlag, New York Inc.
Tyack, P. L., M. Johnson, N. Aguilar Soto, A. Sturlese, and P. T. Madsen. 2006. Extreme deep
diving of beaked whales. Journal of Experimental Biology 209:4238-4253.
Tyack, P. L., and coauthors. 2011c. Beaked whales respond to simulated and actual Navy sonar.
PLoS ONE 6(3):e17009.
Tynan, C. T., and coauthors. 2005a. Cetacean distributions relative to ocean processes in the
northern California Current System. Deep Sea Research Part II: Topical Studies in
Oceanography 52(1-2):145-167.
Tynan, C. T., and coauthors. 2005b. Cetacean distributions relative to ocean processes in the
northern California Current System. Deep Sea Research Part Ii: Topical studies in
Oceanography 52(1-2)145-167.
Tyurneva, O. Y., Y. M. Yakovlev, and V. V. Vertyankin. 2009. Photographic identification of
the Korean-Okhotsk gray whale (Eschrichtius robustus) offshore northeast Sakhalin
Island and southeast Kamchatka Peninsula (Russia), 2008. Unpublished paper to the IWC
Scientific Committee, Madeira, Portugal.
Ueda, H., and coauthors. 1998. Lacustrine Sockeye Salmon Return Straight to their Natal Area
from Open Water Using Both Visual and Olfactory Cues. Chem. Senses 23:207-212.
Upper Columbia Salmon Recovery Board. 2007. Upper Columbia spring Chinook salmon and
steelhead recovery plan.
Urick, R. J. 1983. Principles of Underwater Sound. McGraw-Hill.
USDC. 2007. Endangered and threatened species: Final listing determination for Puget Sound
steelhead. U.S. Department of Commerce, National Marine Fisheries Service. Federal
Register 72(91):26722-26735.
USDC. 2009a. Endangered and threatened species; recovery plans for Lake Ozette sockeye
salmon. U.S. Department of Commerce, National Marine Fisheries Service. Federal
Register 74(102):25706-25710.
USDC. 2009b. Endangered and threatened wildlife and plants: Final rulemaking to designate
critical habitat for the threatened southern distinct population segment of North American
green sturgeon. U.S. Department of Commerce, National Marine Fisheries Service.
Federal Register 74(195):52300-52351.
USDC. 2011. Endangered and threatened species: Designation of critical habitat for the southern
distinct population segment of eulachon. U.S. Department of Commerce, National
Marine Fisheries Service. Federal Register 76(203):65324-65352.
Van Eenennaam, J. P., and coauthors. 2006. Reproductive conditions of the Klamath River green
sturgeon. Transactions of the American Fisheries Society 135:151-163.
Van Parijs, S. M., and P. J. Corkeron. 2001. Boat traffic affects the acoustic behaviour of Pacific
humpback dolphins, Sousa chinensis. Journal of the Marine Biological Association of the
UK 81(3):6.
Van Waerebeek, K., and coauthors. 2007. Vessel collisions with small cetaceans worldwide and
with large whales in the Southern Hemisphere, an initial assessment. Latin American
Journal of Aquatic Mammals 6(1):43-69.
Vanderlaan, A. S. M., C. T. Taggart, A. R. Serdynska, R. D. Kenney, and M. W. Brown. 2008.
Reducing the risk of lethal encounters: Vessels and right whales in the Bay of Fundy and
on the Scotian Shelf. Endangered Species Research 4(3):283-283.
691
Biological Opinion and Conference Report on Navy NWTT Activities and NMFS’ MMPA Incidental Take Authorization PCTS FPR-2015-9110
Varanasi, U., and coauthors. 1993a. Contaminant exposure and associated biological effects in
juvenile Chinook salmon (Oncorhynchus tshawytscha) from urban and nonurban
estuaries of Puget Sound. NOAA Technical Memorandum NMFS-NWFSC-8. Seattle,
Washington.
Varanasi, U. E., and coauthors. 1993b. Contaminant exposure and associated biological effects in
juvenile Chinook salmon (Oncorhynchus tshawytscha) from urban and nonurban
estuaries of Puget Sound. NOAA Technical Memorandum NMFS-NWFSC-8. Seattle,
Washington.
Veit, R. R., P. Pyle, and J. A. McGowan. 1996. Ocean warming and long-term change in pelagic
bird abundance within the California current system. Marine Ecology Progress Series
139:11-18.
Vetter, R. D., and E. A. Lynn. 1997. Bathymetric demography, enzyme activity patterns, and
bioenergetics of deep-living scorpaenid fishes (genera Sebastes and Sebatolobus):
Paradigms revisited. Marine Ecology Progress Series 155:173-188.
Viada, S. T., and coauthors. 2008. Review of potential impacts to sea turtles from underwater
explosive removal of offshore structures. Environmental impact assessment review
28:267–285.
Vladimirov, V. A., and coauthors. 2006a. Results of 2005 western gray whale studies in coastal
waters off northeastern Sakhalin. Unpublished paper to the IWC Scientific Committee.
12 pp. St Kitts and Nevis, West Indies, June (SC/58/BRG28).
Vladimirov, V. A., and coauthors. 2006b. Distribution and abundance of western gray whales off
the northeast coast of Sakhalin Island (Russia), 2005. Unpublished paper to the IWC
Scientific Committee. 12 pp. St Kitts and Nevis, West Indies, June (SC/58/BRG29).
Vladimirov, V. A., and coauthors. 2005. Distribution and abundance of western gray whales off
the northeast coast of Sakhalin Island (Russia), 2004. Unpublished paper to the IWC
Scientific Committee. 6 pp. Ulsan, Korea, June (SC/57/BRG23).
Vladimirov, V. A., and coauthors. 2008. Distribution and abundance of western gray whales off
the northeast coast of Sakhalin Island (Russia), 2007. IWC Scientific Committee,
Santiago, Chile.
Vladimirov, V. A., S. P. Starodymov, A. G. Afanasyev-Grigoryev, and V. V. Vertyankin. 2009.
Distribution and abundance of western gray whales off the northeast coast of Sakhalin
Island, Russia, 2008. Unpublished paper to the IWC Scientific Committee, Madeira,
Portugal.
Vladimirov, V. A., S. P. Starodymov, M. S. Kornienko, and J. E. Muir. 2010. Distribution and
abundance of western gray whales in the waters off northeast Sakhalin Island, Russia,
2004-2009. Unpublished paper to the IWC Scientific Committee, Agadir, Morocco.
Volkhardt, G., and coauthors. 2005. 2004 Juvenile Salmonid Production Evaluation Report.
Green River, Wenatchee River,
and Cedar Creek, Washington Department of Fish and Wildlife.
Wada, S. 1973. The ninth memorandum on the stock assessment of whales in the North Pacific.
Report of the International Whaling Commission 23:164-169.
Wade, P. M., and coauthors. 2006. Acoustic detection and satellite tracking leads to discovery of
rare concentration of endangered North Pacific right whales. Biology Letters 2:417-419.
692
Biological Opinion and Conference Report on Navy NWTT Activities and NMFS’ MMPA Incidental Take
Authorization PCTS FPR-2015-9110
Wade, P. R., J. W. Durban, J. M. Waite, A. N. Zerbini, and M. E. Dahlheim. 2003. Surveying
killer whale abundance and distribution in the Gulf of Alaska and Aleutian Islands.
NOAA.
Wade, P. R., and coauthors. 2011a. The world's smallest whale population? Biology Letters
7(1):83-85.
Wade, P. R., and coauthors. 2011b. Rare detections of North Pacific right whales in the Gulf of
Alaska, with observations of their potential prey. Endangered Species Research 13(2):99
109.
Wainwright, T. C., and coauthors. 2008. Biological recovery criteria for the Oregon Coast coho
salmon evolutionarily significant unit. Pages 199 p in U.S. Department of Commerce,
editor, Seattle.
Waite, J. 2003. Cetacean Survey. National Marine Mammal Laboratory (NMML), Cetacean
Assessment and Ecology Program, Quarterly Report. Available online at:
http://www.afsc.noaa.gov/Quarterly/jas2003/divrptsNMML2.htm Accessed 5/30/08.
Waite, J. M., K. Wynne, and D. K. Mellinger. 2003. Documented sighting of a North Pacific
right whale in the Gulf of Alaska and post-sighting acoustic monitoring. Northwestern
Naturalist 84(1):38-43.
Waldron, K. D. 1968. Early larvae of the canary rockfish, Sebastodes pinniger. Journal of the
Fisheries Research Board of Canada 25:801-803.
Walker, M. M., J. L. Kirschvink, G. Ahmed, and A. E. Dizon. 1992. Evidence that fin whales
respond to the geomagnetic field during migration. Journal of Experimental Biology
171(1):67-78.
Walker, M. M., T. P. Quinn, J. L. Kirschvink, and C. Groot. 1988. Production of single- domain
magnetite throughout life by sockeye salmon Oncorhynchus nerka. J. Exp. Biol. 140:51
63.
Walker, R. J., E. O. Keith, A. E. Yankovsky, and D. K. Odell. 2005. Environmental correlates of
cetacean mass stranding sites in Florida. Marine Mammal Science 21(2):327-335.
Walker, R. V., V. V. Sviridov, S. Urawa, and T. Azumpaya. 2007. Spatio-Temporal Variation in
Vertical Distributions of Pacific Salmon in the Ocean. North Pacific Anadromous Fish
Commission Bulletin 4:193-201.
Wallace, J. R. 2001. Status of the yelloweye rockfish resource in 2001 for northern California
and Oregon waters. Washignton Department of Fish and Wildlife, Montesano,
Washignton.
Wallace, J. R. 2007. Update to the status of yelloweye rockfish (Sebastes ruberrimus) off the
U.S. West Coast in 2007. Pacific Fishery Management Council, Portland, Oregon.
Ward, B. R., and P. A. Slaney. 1993. Egg-to-Smolt Survival and Fry-to-Smolt Density
Dependence of Keogh River Steelhead Trout. R. J. Gibson, and R. E. Cutting, editors.
Production of juvenile Atlantic salmon, Salmon salar, in natural waters, Can. Spec. Publ.
Fish. Aquat. Sci. 118.
Ward, W. D. 1997. Effects of high-intensity sound. Pages 1497-1507 in M. J. Crocker, editor.
Encyclopedia of Acoustics. Wiley, New York, New York.
Ward, W. D., A. Glorig, and D. L. Sklar. 1958. Dependence of temporary threshold shift at 4 kc
on intensity and time. Journal of the Acoustical Society of America 30:944-954.
Ward, W. D., A. Glorig, and D. L. Sklar. 1959a. Relation between recovery from temporary
threshold shift and duration of exposure. Journal of the Acoustical Society of America
31(5):600-602.
693
Biological Opinion and Conference Report on Navy NWTT Activities and NMFS’ MMPA Incidental Take Authorization PCTS FPR-2015-9110
Ward, W. D., A. Glorig, and D. L. Sklar. 1959b. Temporary threshold shift from octave-band
noise: Applications to damage-risk criteria. Journal of the Acoustical Society of America
31(4):522-528.
Wardle, C. S., and coauthors. 2001. Effects of seismic air guns on marine fish. Continental Shelf
Research 21:1005-1027.
Waring, G. T. 1993. Spatial patterns of six cetaceans along a linear habitat. Tenth Biennial
Conference on the Biology of Marine Mammals, 11-15 November Galveston TX. p.2.
Symposium: Cetacean Habitats.
Waring, G. T., C. P. Fairfield, C. M. Ruhsam, and M. Sano. 1993. Sperm whales associated with
Gulf Stream features off the north-eastern USA shelf. Fisheries Oceanography 2(2):101
105.
Waring, G. T., E. Josephson, C. P. Fairfield, and K. M.-F. (Eds). 2009. U.S. Atlantic and Gulf of
Mexico Marine Mammal Stock Assessments -- 2008. NOAA Technical Memorandum
NMFS-NE-210. 440pp.
Waring, G. T., E. Josephson, C. P. Fairfield, and K. Maze-Foley. 2007. U.S. Atlantic and Gulf of
Mexico Marine Mammal Stock Assessments 2006. U.S. Department of Commerce,
NOAA, NMFS.
Waring, G. T., R. M. Pace, J. M. Quintal, C. P. Fairfield, and K. Maze-Foley. 2004. U.S. Atlantic
and Gulf of Mexico Marine Mammal Stock Assessments - 2003, Woods Hole,
Massachusetts.
Wartzok, D., and D. R. Ketten. 1999. Marine mammal sensory systems. Pages 117-175 in J. E.
R. III, and S. A. Rommel, editors. Biology of Marine Mammals. Smithsonian Institution
Press, Washington.
Wartzok, D., A. N. Popper, J. Gordon, and J. Merrill. 2003. Factors affecting the responses of
marine mammals to acoustic disturbance. Marine Technology Society Journal 37(4):6-15.
Washington, P. M., R. Gowan, and D. H. Ito. 1978. A biological report on eight species of
rockfish (Sebastes spp.) from Puget Sound, Washington. National Oceanic and
Atmospheric Administration, National Marine Fisheries Service, Seattle, Washington.
Washington State Department of Fish and Wildlife. 2012. Threatened and Endangered Wildlife
in Washington: 2011 Annual Report, Endangered Species Section, Wildlife Program.
Olympia, WA. .
Watkins, W. A. 1977. Acoustic behavior of sperm whales. Oceanus 20:50-58.
Watkins, W. A. 1981a. Activities and underwater sounds of fin whales. Scientific Reports of the
International Whaling Commission 33:83-117.
Watkins, W. A. 1981b. Activities and underwater sounds of fin whales. (Balaenoptera physalus).
Scientific Reports of the Whales Research Institute Tokyo 33:83-118.
Watkins, W. A. 1981c. Radio tagging of finback whales - Iceland, June-July 1980. Woods Hole
Oceanagraphic Institution.
Watkins, W. A. 1981d. Reaction of three species of whales, Balaenoptera physalus, Megaptera
novaeangliae, and Balaenoptera edeni to implanted radio tags. Deep Sea Research Part I:
Oceanographic Research Papers 28(6):589-599.
Watkins, W. A. 1985. Changes observed in the reaction of whales to human activities. National
Marine Fisheries Service.
Watkins, W. A. 1986. Whale Reactions to Human Activities in Cape-Cod Waters. Marine
Mammal Science 2(4):251-262.
694
Biological Opinion and Conference Report on Navy NWTT Activities and NMFS’ MMPA Incidental Take Authorization PCTS FPR-2015-9110
Watkins, W. A., M. A. Daher, K. M. Fristrup, T. J. Howald, and G. N. Disciara. 1993. Sperm
whales tagged with transponders and tracked underwater by sonar. Marine Mammal
Science 9(1):55-67.
Watkins, W. A., K. E. Moore, and P. Tyack. 1985a. Sperm whale acoustic behavior in the
southeast Caribbean. Cetology 49:1-15.
Watkins, W. A., K. E. Moore, and P. L. Tyack. 1985b. Sperm whale acoustic behaviors in the
southeast Caribbean. Cetology 49:1-15.
Watkins, W. A., and W. E. Schevill. 1975a. Sperm whales (Physeter catodon) react to pingers.
Deep Sea Research and Oceanogaphic Abstracts 22(3):123-129 +1pl.
Watkins, W. A., and W. E. Schevill. 1975b. Sperm whales (Physeter catodon) react to pingers.
Deep-Sea Research 22:123-129.
Watkins, W. A., and W. E. Schevill. 1977. Spatial distribution of Physeter catodon (sperm
whales) underwater. Deep Sea Research 24(7):693-699.
Watkins, W. A., P. Tyack, K. E. Moore, and J. E. Bird. 1987. The 20-Hz signals of finback
whales (Balaenoptera physalus). Journal of the Acoustical Society of America
82(6):1901-1912.
Watwood, S. L., P. J. O. Miller, M. Johnson, P. T. Madsen, and P. L. Tyack. 2006. Deep-diving
foraging behaviour of sperm whales (Physeter macrocephalus). Journal of Animal
Ecology 75:814-825.
WDF. 1975-1986. Washington state sport catch reports. Washington Department of Fisheries.
WDFW. 2010a. Lower Columbia Salmon Recovery and Fish & Wildlife Subbasin Plan, Lower
Columbia Fish Recovery Board. May 28, 2010.
WDFW. 2010b. WDFW Salmonid Stock Inventory (SaSI) database. Data submitted by WDFW
in response to the five-year status review of listed species.
WDFW. 2011. 2011 Wild Coho Forecasts for Puget Sound, Washington Coast, and Lower
Columbia River. http://wdfw.wa.gov/publications/.
WDFW. 2014. Salmonid Stock Inventory. https://data.wa.gov/Natural-Resources-
Environment/WDFW-Salmonid-Stock-Inventory-Populations/.
WDFW, and Point No Point Treaty Tribes. 2007. Five-year review of the summer chum salmon
conservation initiative: Supplemental report no. 7, summer chum salmon conservation
initiative – an implementation plan to recover summer chum in the Hood Canal and Strait
of Juan de Fuca Region. Washington Department of Fish and Wildlife, editor, Olympia,
Washington.
Webb, M. A., and coauthors. 2006. Mercury concentrations in gonad, liver, and muscle of white
sturgeon Acipenser transmontanus in the Lower Columbia River. Archives of
Environmental Contamination and Toxicology 50:443–451.
Wedemeyer, G. A., R. L. Saunders, and W. C. Clarke. 1980. Environmental factors affecting
smoltification and early marine survival of anadromous salmonids. Marine Fisheries
Review.
Weilgart, L., and H. Whitehead. 1993a. Coda communication by sperm whales (Physeter
macrocephalus) off the Galápagos Islands. Canadian Journal of Zoology 71(4):744-752.
Weilgart, L. S., and H. Whitehead. 1993b. Coda communication by sperm whales (Physeter
macrocephalus) off the Galapagos Islands. Canadian Journal of Zoology 71(4):744-752.
695
Biological Opinion and Conference Report on Navy NWTT Activities and NMFS’ MMPA Incidental Take
Authorization PCTS FPR-2015-9110
Weilgart, L. S., and H. Whitehead. 1997a. Group-specific dialects and geographical variation in
coda repertoire in South Pacific sperm whales. Behavioral Ecology and Sociobiology
40(5):277-285.
Weilgart, L. S., and H. Whitehead. 1997b. Group-specific dialects and geographical variation in
coda repertoire in South Pacific sperm whales. Behavioral Ecology and Sociobiology
40:277-285.
Weinberg, K. L. 1994. Rockfish assemblages of the middle shelf and upper slope off Oregon and
Washington. Fishery Bulletin 92(3):620-632.
Weinrich, M. T., and coauthors. 1992. Behavioral reactions of humpback whales Megaptera
novaeangliae to biopsy procedures. Fishery Bulletin 90(3):588-598.
Weir, C. R. 2007. Observations of marine turtles in relation to seismic airgun sound off Angola.
Marine Turtle Newsletter 116:17-20.
Weir, C. R., A. Frantzis, P. Alexiadou, and J. C. Goold. 2007. The burst-pulse nature of 'squeal'
sounds emitted by sperm whales (Physeter macrocephalus). Journal of the Marine
Biological Association of the U.K. 87(1):39-46.
Weir, J. S., N. M. T. Duprey, and B. Wursig. 2008. Dusky dolphin (Lagenorhynchus obscurus)
subgroup distribution: Are shallow waters a refuge for nursery groups? Canadian Journal
of Zoology 86(11):1225-1234.
Weirathmueller, M. J., W. S. D. Wilcock, and D. C. Soule. 2013. Source levels of fin whale
20Hz pulses measured in the Northeast Pacific Ocean. Journal of the Acoustical Society
of America 133(2):741-749.
Weis, L. J. 2004. The effects of San Juan County, Washington, marine protected areas on larval
rockfish production. University of Washington, Seattle, WA.
Weitkamp, L. A. 2009. Marine distributions of Chinook salmon from the West Coast of North
America determined by coded wire tag recoveries. Transactions of American Fisheries
Society 139:147-170.
Weitkamp, L. A. 2010. Marine Distributions of Chinook Salmon from the West Coast of North
America Determined by Coded Wire Tag Recoveries. Transactions of the American
Fisheries Society 139(1):147-170.
Weitkamp, L. A., and K. Neely. 2002. Coho salmon (Oncorhynchus kisutch) ocean migration
patterns: insight from marine coded-wire tag recoveries. Can. J. Fish. Aquat. Sci. 59.
Weitkamp, L. A., and coauthors. 1995. Status review of coho salmon from Washington, Oregon,
and California. U.S. Department of Commerce, NMFS-NWFSC-24.
Weller, D. W., and coauthors. 2013. Report of the National Marine Fisheries Service gray whale
stock identification workshop. National Marine Fisheries Service Gray Whale Stock
Identification Workshop. U.S. Department of Commerce, National Oceanic and
Atmospheric Administration, National Marine Fisheries Service, Southwest Fisheries
Science Center.
Weller, D. W., and coauthors. 2008. A photographic match of a western gray whale between
Sakhalin Island, Russia, and Honshu, Japan: The first link between the feeding ground
and a migratory corridor. Journal of Cetacean Research And Management 10(1):89-91.
Weller, D. W., and coauthors. 2007. Status of western gray whales off northeastern Sakhalin
Island, Russia. Unpublished paper to the IWC Scientific Committee. 11 pp. Anchorage,
AK, May (SC/59/BRG19).
Weller, D. W., and coauthors. 2004. Status of western gray whales off northeastern Sakhalin
Island, Russia, in 2003. IWC Scientific Committee, Sorrento, Italy.
696
Biological Opinion and Conference Report on Navy NWTT Activities and NMFS’ MMPA Incidental Take
Authorization PCTS FPR-2015-9110
Weller, D. W., and coauthors. 2006. Status of western gray whales off northeastern Sakhalin
Island, Russia, in 2005. Unpublished paper to the IWC Scientific Committee. 10 pp. St
Kitts and Nevis, West Indies, June (SC/58/BRG3).
Weller, D. W., and coauthors. 2003. Summer sightings of western gray whales in the Okhotsk
and western Bering Seas. International Whaling Commission Scientific Committee,
Berlin.
Weller, D. W., and coauthors. 2012a. Movements of gray whales between the western and
eastern North Pacific. Endangered Species Research 18:193-199.
Weller, D. W., and coauthors. 2012b. Movements of gray whales between the western and
eastern North Pacific. Endangered Species Research 18(3):193-199.
Weller, D. W., and coauthors. 1999. Gray whales (Eschrichtius robustus) off Sakhalin Island,
Russia: Seasonal and annual patterns of occurrence. Marine Mammal Science
15(4):1208-1227.
Weller, D. W., and coauthors. 1996. Observations of an interaction between sperm whales and
short-finned pilot whales in the Gulf of Mexico. Marine Mammal Science 12(4):588-593.
Wells, J. V., and M. E. Richmond. 1995. Populations, metapopulations, and species populations:
What are they and who should care? Wildlife Society Bulletin 23(3):458-462.
Wenz, G. M. 1962. Acoustic ambient noise in the ocean: Spectra and sources. Journal of the
Acoustical Society of America 34:1936-1956.
Wenzel, F., D. K. Mattila, and P. J. Clapham. 1988. Balaenoptera musculus in the Gulf of Maine.
Marine Mammal Science 4(2):172-175.
Westrheim, S. J. 1975. Reproduction, maturation, and identification of larvae of some Sebastes
(Scorpaenidae) species in the northeast Pacific Ocean. Journal of the Fisheries Research
Board of Canada 32:2399-2411.
Westrheim, S. J., and W. R. Harling. 1975. Age-length relationships for 26 scorpaenids in the
northeast Pacific Ocean. Fisheries and Marine Service Research Division, Nanaimo,
British Columbia.
Wever, E. G. 1978. The Reptile Ear: Its Structure and Function. Princeton University Press,
Princeton, New Jersey.
Wever, E. G., and J. A. Vernon. 1956. The sensitivity of the turtle's ear as shown by its electrical
potentials. Proceedings of the National Academies of Science 42.
Whale Museum. 2012. The Whale Museum.
Wheeler, P. A., and J. Hill. 1999. Biological effects of the 1997-1998 El Niño event off Oregon:
Nutrient and chlorophyll distributions. H. J. Freeland, W. T. Peterson, and A. Tyler,
editors. Proceedings of the 1998 Science Board Symposium on the impacts of the
1997/98 El Niño event on the North Pacific Ocean and its marginal seas. North Pacific
Marine Science Organization (PICES): PICES Scientific Report No. 10.
Whitehead, H. 2002a. Estimates of the current global population size and historical trajectory for
sperm whales. Marine Ecology Progress Series 242:295-304.
Whitehead, H. 2002b. Sperm whale Physeter macrocephalus. Pages 1165-1172 in W. F. Perrin,
B. Würsig, and J. G. M. Thewissen, editors. Encyclopedia of Marine Mammals.
Academic Press, San Diego, California.
Whitehead, H. 2003a. Society and culture in the deep and open ocean: The sperm whale and
other cetaceans. Pages 616 in F. B. M. d. Waal, and P. L. Tyack, editors. Animal Social
Complexity: Intelligence, Culture, and Individualized Societies. Harvard University
Press.
697
Biological Opinion and Conference Report on Navy NWTT Activities and NMFS’ MMPA Incidental Take
Authorization PCTS FPR-2015-9110
Whitehead, H. 2003b. Sperm Whales: Social Evolution in the Ocean. University of Chicago
Press.
Whitehead, H. 2008. Social and cultural evolution in the ocean: Convergences and contrasts with
terrestrial systems. The Deep Structure of Biology: Is Convergence Sufficiently
Ubiquitous to Give a Directional Signal? p.143-160. Simon conway Morris (ed.).
Templeton Foundation Press, West Conshohocken, Pennsylvania. ISBN 978-1-59947
138-9. 256pp.
Whitehead, H., J. Christal, and S. Dufault. 1997. Past and distant whaling and the rapid decline
of sperm whales off the Galapagos Islands. (Physeter macrocephalus). Conservation
Biology 11(6):1387-1396.
Whitehead, H., and S. L. Mesnick. 2003. Social structure and effects of differential removals by
sex in sperm whales: Methodology. Unpublished paper to the IWC Scientific Committee.
12 pp. Berlin, May (SC/55/O12).
Whitehead, H., and L. Weilgart. 1991. Patterns of visually observable behaviour and
vocalizations in groups of female sperm whales. Behaviour 118(3/4):275-295.
Whitney, F. A., D. L. Mackas, D. W. Welch, and M. Robert. 1999. Impact of the 1990s El Niños
on nutrient supply and productivity of Gulf of Alaska waters. Proceedings of the 1998
Science Board Symposium on the impacts of the 1997/98 El Niño event on the North
Pacific Ocean and its marginal seas. PICES Scientific Report No. 10.
Wiggins, S. M., E. M. Oleson, M. A. McDonald, and J. A. Hildebrand. 2005. Blue whale
(Balaenoptera musculus) diel call patterns offshore of southern California. Aquatic
Mammals 31(2):161-168.
Wildlife, W. D. o. F. a., and P. N. P. T. Tribes. 2000. Summer Chum Salmon Conservation
Initiative: An Implementation Plan to Recover Summer Chum in the Hood Canal and
Strait of Juan de Fuca Region.
Wiley, M. L., J. B. Gaspin, and J. F. Goertner. 1981. Effects of underwater explosions on fish
with a dynamical model to predict fishkill. Ocean Science and Engineering 6:223-284.
Wilkinson, C., and D. Souter. 2008. Status of Caribbean coral reefs after bleaching and
hurricanes in 2005. Global Coral Reef Monitoring Network and Reef and Rainforest
Research Centre, Townsville.
Wilkinson, K. 2013. Personal communication between Kristin Wilkinson (NOAA Fisheries,
Protected
Resources Division Marine Mammal Stranding Specialist) and Andrea Balla-Holden (Navy) in
July
2013, regarding Stranding Database. A. B.-H. (Navy), editor.
Williams, E. H., S. Ralston, A. D. MacCall, D. Woodbury, and D. E. Pearson. 1999. Stock
assessment of the canary rockfish resource in the waters off southern Oregon and
California in 1999. Pages 75 in Status of the Pacific coast groundfish fishery through
1999 and recommended acceptable biological catches for 2000 appendix: stock
assessments. Pacific Fishery Management Council, Portland, Oregon.
Williams, R., and E. Ashe. 2006. Northern resident killer whale responses to vessels varied with
number of boats.
Williams, R., and E. Ashe. 2007. Killer whale evasive tactics vary with boat number. (Orcinus
orca). Journal of Zoology 272(4):390-397.
698
Biological Opinion and Conference Report on Navy NWTT Activities and NMFS’ MMPA Incidental Take Authorization PCTS FPR-2015-9110
Williams, R., D. E. Bain, J. K. B. Ford, and A. W. Trites. 2002a. Behavioural responses of male
killer whales to a 'leapfrogging' vessel. Journal of Cetacean Research And Management
4(3):305-310.
Williams, R., D. E. Bain, J. C. Smith, and D. Lusseau. 2009. Effects of vessels on behaviour
patterns of individual southern resident killer whales Orcinus orca. Endangered Species
Research 6:199-209.
Williams, R., C. W. Clark, D. Ponirakis, and E. Ashe. 2014a. Acoustic quality of critical habitats
for three threatened whale populations. Animal Conservation 17(2):174-185.
Williams, R., C. Erbe, E. Ashe, A. Beerman, and J. Smith. 2014b. Severity of killer whale
behavioral responses to ship noise: A dose-response study. Marine Pollution Bulletin
79(1-2):254-260.
Williams, R., and D. P. Noren. 2009. Swimming speed, respiration rate, and estimated cost of
transport in adult killer whales. Marine Mammal Science 25(2):327-350.
Williams, R. M., A. W. Trites, and D. E. Bain. 2002b. Behavioral responses of killer whales
(Orcinus orca) to whale-watching boats: Opportunistic observations and experimental
approaches. Journal of Zoology 256(2):255-270.
Williams, T. H., and coauthors. 2006. Historical population structure of coho salmon in the
Southern Oregon/Northern California coasts evolutionarily significant unit. Pages 71 p in
U.S. Department of Commerce,.
Williams, T. H., S. T. Lindley, B. C. Spence, and D. A. Boughton. 2011. Status review update
for Pacific salmon and steelhead listed under the Endangered Species Act: Southwest.
National Marine Fisheries Service, Southwest Fisheries Science Center, Fisheries
Ecology Division, editor, Santa Cruz, California.
Willis-Norton, E., and coauthors. 2015. Climate change impacts on leatherback turtle pelagic
habitatin the Southeast Pacific. Deep-Sea Research II 113:260-267.
Wilson, J. A., and R. S. McKinley. 2004. Distribution, habitat and movements. Pages 40-69 in:
G.T.O. LeBreton, F.W.H. Beamish, and R.S. McKinley, eds. Sturgeon and paddlefish of
North America. Kluwer Academic Publishers.
Wing, B. L. 1977. Salmon food observations. Pages 20-27 in: Southeast Alaska troll log book
program: 1976 scientific report. Alaska Sea Grant Report 77-11.
Winn, H. E., P. J. Perkins, and T. C. Poulter. 1970. Sounds of the humpback whale. Proceedings
of the 7th Annual Conference on Biological Sonar and Diving Mammals, Stanford
Research Institute Menlo Park CA. p.39-52.
Winn, H. E., and N. E. Reichley. 1985. Humpback whale - Megaptera novaeangliae. Pages 241
274 in S. H. Ridgway, and S. R. Harrison, editors. Handbook of Marine Mammals: Vol. 3
The Sirenians and Baleen Whales. Academic Press Ltd., London.
Wise, J. P., Sr., and coauthors. 2009. A global assessment of chromium pollution using sperm
whales (Physeter macrocephalus) as an indicator species. Chemosphere 75(11):1461
1467.
Witt, M. J., and coauthors. 2009. Aerial surveying of the world's largest leatherback turtle
rookery: A more effective methodology for large-scale monitoring. Biological
Conservation 142(8):1719-1727.
Witteveen, B. H., R. J. Foy, K. M. Wynne, and Y. Tremblay. 2008. Investigation of foraging
habits and prey selection by humpback whales (Megaptera novaeangliae) using acoustic
tags and concurrent fish surveys. Marine Mammal Science 24(3):516-534.
699
Biological Opinion and Conference Report on Navy NWTT Activities and NMFS’ MMPA Incidental Take Authorization PCTS FPR-2015-9110
Witteveen, B. H., G. A. J. Worthy, K. M. Wynne, and J. D. Roth. 2009. Population structure of
North Pacific humpback whales on their feeding grounds revealed by stable carbon and
nitrogen isotope ratios. Marine Ecology Progress Series 379:299-310.
Wood, F., and J. Wood. 1993. Growth curve for captive-reared green sea turtles, Chelonia
mydas. Herpetological Journal 3:49-54.
Woodbury, D., and S. Ralston. 1991. Interannual variation in growth rates and back-calculated
birth-date distributions of pelagic juvenile rockfishes (Sebastes spp.) off the central
California coast. Fishery Bulletin 89(3):523-533.
Wright, A. J. 2005. Lunar cycles and sperm whales (Physeter macrocephalus) strandings on the
North Atlantic coastlines of the British Isles and Eastern Canada. Marine Mammal
Science 21(1):145-149.
Wright, A. J., and coauthors. 2007. Anthropogenic noise as a stressor in animals: A
multidisciplinary perspective. International Journal of Comparative Psychology 201(2
3):250-273.
Wright, D. G. 1982. A discussion paper on the effects of explosives on fish and marine mammals
in the waters of the Northwest Territories.
Wright, D. G., and G. E. Hopky. 1998. Guidelines for the use of explosives in or near Canadian
fisheries waters.
Wursig, B., S. K. Lynn, T. A. Jefferson, and K. D. Mullin. 1998. Behaviour of cetaceans in the
northern Gulf of Mexico relative to survey ships and aircraft. Aquatic Mammals
24(1):41-50.
Wyllie Echeverria, T. 1987. Thirty-four species of California rockfishes: maturity and
seasonality of reproduction. Fisheries Bulletin 85:229-250.
Wyneken, J. 2001. The anatomy of sea turtles. National Oceanic and Atmospheric
Administration, National Marine Fisheries Service, Southeast Fisheries Science Center.
Wysocki, L., and F. Ladich. 2005. Hearing in fishes under noise conditions. Journal of the
Association for Research in Otolaryngology 6(1):28-36.
Wysocki, L. E., S. Amoser, and F. Ladich. 2007. Diversity in ambient noise in European
freshwater habitats: Noise levels, spectral profiles, and impact on fishes. Journal of the
Acoustical Society of America 121(5):2559-2566.
Wysocki, L. E., J. P. Dittami, and F. Ladich. 2006. Ship noise and cortisol secretion in European
freshwater fishes. Biological Conservation 128(4):501-508.
Yablokov, A. V. 2000. Consequences and perspectives of whaling (instead of a preface). Pages
6-10 in Soviet Whaling Data (1949-1979). Center for Russian Environmental Policy
Marine Mammal Council, Moscow.
Yablokov, A. V., and L. S. Bogoslovskaya. 1984. A review of Russian research on the biology
and commercial whaling of the gray whale. Pages 465-486 in M. L. Jones, S. L. Swartz,
and S. Leatherwood, editors. The Gray Whale, Eschrichtius robustus. Academic Press,
New York.
Yablokov, A. V., V. A. Zemsky, Y. A. Mikhalev, V. V. Tormosov, and A. A. Berzin. 1998. Data
on Soviet whaling in the Antarctic in 1947–1972 (population aspects). Russian Journal of
Ecology 29:38–42.
Yakima/Klickitat Fisheries Project. 2014. Klickitat River Subbasin Data: Lyle Falls Adult Trap
Data. http://www.ykfp.org/klickitat/Data_lyleadulttrap.htm.
700
Biological Opinion and Conference Report on Navy NWTT Activities and NMFS’ MMPA Incidental Take
Authorization PCTS FPR-2015-9110
Yakovlev, Y. M., and O. Y. Tyurneva. 2004. Photo-identification of the western gray whale
(Eschrichtius robustus) on the northeastern Sakhalin shelf, Russia, 2002-2003.
International Whaling Commission Scientific Committee, Sorrento, Italy.
Yakovlev, Y. M., and O. Y. Tyurneva. 2005. A note on photo-identification of the western gray
whale (Eschrictius robustus) on the northeastern Sakhalin shelf, Russia, 2002-2004.
International Whaling Commission Scientific Committee, Ulsan, Korea.
Yamanaka, K. L., and A. R. Kronlund. 1997. Inshore rockfish stock assessment for the west
coast of Canada in 1996 and recommended yields for 1997.
Yamanaka, K. L., and coauthors. 2006. A review of yelloweye rockfish Sebastes ruberrimus
along the Pacific coast of Canada: Biology, distribution, and abundance trends
Yano, A., M. Ogura, A. Sato, Y. Sakaki, and Y. Shimizu. 1997. Effect of modified magnetic
field on the ocean migration of maturing chum salmon, Oncorhynchus keta. Marine
Biology 129:523-530.
Yazvenko, S. B., and coauthors. 2007. Feeding of western gray whales during a seismic survey
near Sakhalin Island, Russia. Environmental Monitoring and Assessment 134(1-3):93
106.
Yelverton, J. T., and D. R. Richmond. 1981. Underwater explosion damage risk criteria for fish,
birds, and mammals. Journal of the Acoustical Society of America 70(S1):S84.
Yelverton, J. T., D. R. Richmond, E. R. Fletcher, and R. K. Jones. 1973. Safe distances from
underwater explosions for mammals and birds. Defense Nuclear Agency.
Yelverton, J. T., D. R. Richmond, W. Hicks, H. Saunders, and E. R. Fletcher. 1975. The
relationship between fish size and their response to underwater blast. Lovelace
Foundation for Medical Education Research DNA 3677T, Albuquerque, N. M.
Ylitalo, G. M., and coauthors. 2001. Influence of life-history parameters on organochlorine
concentrations in free-ranging killer whales (Orcinus orca) from Prince William Sound,
AK. Science of the Total Environment 281:183-203.
Yochem, P. K., and S. Leatherwood. 1985. Blue whale Balaenoptera musculus (Linnaeus, 1758).
Pages 193-240 in S. H. Ridgway, and R. Harrison, editors. Handbook of Marine
Mammals, vol. 3: The Sirenians and Baleen Whales. Academic Press, London.
Yoklavich, M. M., and coauthors. 2000. Habitat associations of deep-water rockfishes in a
submarine canyon: An example of a natural refuge. Fishery Bulletin 98:625-641.
Young, G. A. 1991. Concise methods for predicting the effects of underwater explosions on
marine life. Naval Surface Warfare Center, Silver Spring.
Zabel, R. W. 2014a. Memorandum to Donna Weiting: Estimation of Percentages for Listed
Pacific Salmon and Steelhead Smolts Arriving at Various Locations in the Columbia River Basin
in 2013, Northwest Fisheries Science Center. March 13, 2014. Zabel, R. W. 2014b. Memorandum to Donna Weiting: Estimation of Percentages for Listed
Pacific Salmon and Steelhead Smolts Arriving at Various Locations in the Columbia River Basin
in 2014, Northwest Fisheries Science Center. November 4, 2014. Zenteno, M., M. Herrera, A. R. Barragan, and L. Sarti. 2008. Impact of different kinds and times
of retention in olive ridley's (Lepidochelys olivacea) hatchlings in blood glucose levels.
Pages 34-35 in A. F. Rees, M. Frick, A. Panagopoulou, and K. Williams, editors.
Twenty-Seventh Annual Symposium on Sea Turtle Biology and Conservation.
701
Biological Opinion and Conference Report on Navy NWTT Activities and NMFS’ MMPA Incidental Take
Authorization PCTS FPR-2015-9110
Zerbini, A., A. S. Kennedy, B. K. Rone, C. L. Berchok, and P. J. Clapham. 2010. Habitat use of
North Pacific right whales in the Bering Sea during summer as revealed by sighting and
telemetry data. Pages 153 in Alaska Marine Science Symposium, Anchorage, Alaska.
Zerbini, A. N., J. M. Waite, J. L. Laake, and P. R. Wade. 2006a. Abundance, trends and
distribution of baleen whales off Western Alaska and the central Aleutian Islands. Deep
Sea Research Part I-Oceanographic Research Papers 53(11):1772-1790.
Zerbini, A. N., J. M. Waite, J. L. Laake, and P. R. Wade. 2006b. Abundance, trends and
distribution of baleen whales off Western Alaska and the central Aleutian Islands. Deep-
Sea Research I 53:1772-1790.
Zimmer, W. M. X., and P. L. Tyack. 2007. Repetitive shallow dives pose decompression risk in
deep-diving beaked whales. Marine Mammal Science 23(4):888-925.
Zimmerman, M. S., C. Kinsel, E. Beamer, E. J. Connor, and D. E. Pflug. 2015. Abundance,
survival, and life history strategies of juvenile Chinook salmon in the Skagit River,
Washington. Transactions of the American Fisheries Society 144(3):627-641.
Zoidis, A. M., and coauthors. 2008. Vocalizations produced by humpback whale (Megaptera
novaeangliae) calves recorded in Hawaii. The Journal of the Acoustical Society of
America 123(3):1737-1746.
702