Observations of Mt. Etna volcanic ash plumes in 2006: An integrated approach from ground-based and...
13
Observations of Mt. Etna volcanic ash plumes in 2006: An integrated approach from ground-based and polar satellite NOAA–AVHRR monitoring system D. Andronico a, ⁎, C. Spinetti b , A. Cristaldi a , M.F. Buongiorno b a Istituto Nazionale di Geofisica e Vulcanologia, Sezione di Catania, Italy b Istituto Nazionale di Geofisica e Vulcanologia, Sezione CNT, Roma, Italy abstract article info Available online 24 November 2008 Keywords: volcanic ash Mt. Etna ground monitoring NOAA–AVHRR Mt. Etna, in Sicily (Italy), is one of the world's most frequent emitters of volcanic plumes. During the last ten years, Etna has produced copious tephra emission and fallout that have damaged the inhabited and cultivated areas on its slopes and created serious hazards to air traffic. Recurrent closures of the Catania International airport have often been necessary, causing great losses to the local economy. Recently, frequent episodes of ash emission, lasting from a few hours to days, occurred from July to December 2006, necessitating a look at additional monitoring techniques, such as remote sensing. The combination of a ground monitoring system with polar satellite data represents a novel approach to monitor Etna's eruptive activity, and makes Etna one of the few volcanoes for which this surveillance combination is routinely available. In this work, ash emission information derived from an integrated approach, based on comparing ground and NOAA–AVHRR polar satellite observations, is presented. This approach permits us to define the utility of real time satellite monitoring systems for both sporadic and continuous ash emissions. Using field data (visible observations, collection of tephra samples and accounts by local inhabitants), the duration and intensity of most of the tephra fallout events were evaluated in detail and, in some cases, the order of magnitude of the erupted volume was estimated. The ground data vs. satellite data comparison allowed us to define five different categories of Etna volcanic plumes according to their dimensions and plume height, taking into account wind intensity. Using frequent and good quality satellite data in real time, this classification scheme could prove helpful for investigations into a possible correlation between eruptive intensity and the presence and concentration of ash in the volcanic plume. The development and improvement of this approach may constitute a powerful warning system for Civil Protection, thus preventing unnecessary airport closures. © 2008 Elsevier B.V. All rights reserved. 1. Introduction Volcanic plumes are mixtures of solid particles and gases in different proportions that rise up above active volcanoes. Gases are exsolved from magma and water or incorporated from the atmo- sphere during eruptions (Sparks et al., 1997). Therefore, plumes are a visible indicator of eruptive activity. In recent years, the detection of ash-enriched plumes has become an important goal for volcanologists and civil institutions. Due to increasing air traffic, volcanic plumes constitute a primary source of hazard for aviation all over the world (Casadevall, 1994; Miller and Casadevall, 2000). There is no definition of a safe level of ash exposure for aircraft, and the “standard” atmosphere is normally considered to be free from volcanic ash (ICAO, 2004; FAA, 2001). To mitigate and prevent this high risk is thus crucial, and a number of investigations have been performed to detect volcanic plumes in the most hazardous areas, particularly in cloudy or night time conditions. New sophisticated instrumentations have been studied and tested in proximity of active volcanoes, using several technologies to detect ash plumes (e.g. Andò and Pecora, 2006; Francis and Rothery, 2000). One of the biggest producers of volcanic plumes in the world is Mt. Etna volcano in Sicily, Italy (Fig. 1). Such plumes are clearly visible both in quiet degassing periods as well as during eruptions (Allard et al., 1991; Haulet et al., 1977). Due to this quasi-persistent eruptive activity, there is a constant and serious hazard to both international and local air traffic, particularly if the eruption is highly explosive. The formation of volcanic plumes from Etna may occur both from the summit craters (located between 3000 and 3300 m a.s.l.; Fig. 1) and from eruptive fractures that often open on the flanks of the volcano. In recent years, Etna has frequently shown powerful explosive activity, including episodic paroxysms (more than 150 events since 1995; Alparone et al., 2007) and long-lasting explosive eruptions such as during 2001 for about 20 days (INGV-Staff, 2001; Scollo et al., 2007) and in 2002–03 for about 2 months (Andronico et al., 2003, 2005, 2008). Etna also undergoes intense degassing during periods of apparent quiescence or no eruptive activity. Continuous production of gas-enriched plumes is caused by the ordinary degassing occurring at its summit. This kind of Journal of Volcanology and Geothermal Research 180 (2009) 135–147 ⁎ Corresponding author. Piazza Roma 2, 95123 Catania, Italy. Tel.: +39 0957165800; fax: +39 095 435801. E-mail address: [email protected] (D. Andronico). 0377-0273/$ – see front matter © 2008 Elsevier B.V. All rights reserved. doi:10.1016/j.jvolgeores.2008.11.013 Contents lists available at ScienceDirect Journal of Volcanology and Geothermal Research journal homepage: www.elsevier.com/locate/jvolgeores
-
Upload
independent -
Category
Documents
-
view
3 -
download
0
Transcript of Observations of Mt. Etna volcanic ash plumes in 2006: An integrated approach from ground-based and...
Journal of Volcanology and Geothermal Research 180 (2009) 135–147
Contents lists available at ScienceDirect
Journal of Volcanology and Geothermal Research
j ourna l homepage: www.e lsev ie r.com/ locate / jvo lgeores
Observations of Mt. Etna volcanic ash plumes in 2006: An integrated approach fromground-based and polar satellite NOAA–AVHRR monitoring system
D. Andronico a,⁎, C. Spinetti b, A. Cristaldi a, M.F. Buongiorno b
a Istituto Nazionale di Geofisica e Vulcanologia, Sezione di Catania, Italyb Istituto Nazionale di Geofisica e Vulcanologia, Sezione CNT, Roma, Italy
⁎ Corresponding author. Piazza Roma 2, 95123 Catanifax: +39 095 435801.
E-mail address: [email protected] (D. Andronico).
0377-0273/$ – see front matter © 2008 Elsevier B.V. Aldoi:10.1016/j.jvolgeores.2008.11.013
a b s t r a c t
a r t i c l e i n f oAvailable online 24 November 2008
Keywords:
Mt. Etna, in Sicily (Italy), isyears, Etna has produced coareas on its slopes and crea
volcanic ashMt. Etnaground monitoringNOAA–AVHRR
ted serious hazards to air traffic. Recurrent closures of the Catania Internationalairport have often been necessary, causing great losses to the local economy. Recently, frequent episodes of ashemission, lasting from a few hours to days, occurred from July to December 2006, necessitating a look atadditional monitoring techniques, such as remote sensing. The combination of a ground monitoring system
one of the world's most frequent emitters of volcanic plumes. During the last tenpious tephra emission and fallout that have damaged the inhabited and cultivated
with polar satellite data represents a novel approach tomonitor Etna's eruptive activity, andmakes Etna one ofthe few volcanoes for which this surveillance combination is routinely available.In this work, ash emission information derived from an integrated approach, based on comparing ground andNOAA–AVHRR polar satellite observations, is presented. This approach permits us to define the utility of realtime satellite monitoring systems for both sporadic and continuous ash emissions. Using field data (visibleobservations, collection of tephra samples and accounts by local inhabitants), the duration and intensity ofmost of the tephra fallout events were evaluated in detail and, in some cases, the order of magnitude of theerupted volumewas estimated. The grounddata vs. satellite data comparison allowed us to definefive differentcategories of Etna volcanic plumes according to their dimensions and plume height, taking into account windintensity. Using frequent and good quality satellite data in real time, this classification scheme could provehelpful for investigations into a possible correlation between eruptive intensity and the presence andconcentration of ash in the volcanic plume. The development and improvement of this approach mayconstitute a powerful warning system for Civil Protection, thus preventing unnecessary airport closures.
© 2008 Elsevier B.V. All rights reserved.
1. Introduction
Volcanic plumes are mixtures of solid particles and gases indifferent proportions that rise up above active volcanoes. Gases areexsolved from magma and water or incorporated from the atmo-sphere during eruptions (Sparks et al., 1997). Therefore, plumes are avisible indicator of eruptive activity.
In recent years, the detection of ash-enriched plumes has become animportant goal for volcanologists and civil institutions. Due to increasingair traffic, volcanic plumes constitute a primary source of hazard foraviation all over the world (Casadevall, 1994; Miller and Casadevall,2000). There is no definition of a safe level of ash exposure for aircraft,and the “standard” atmosphere is normally considered to be free fromvolcanic ash (ICAO, 2004; FAA, 2001).
To mitigate and prevent this high risk is thus crucial, and a numberof investigations have beenperformed to detect volcanic plumes in the
a, Italy. Tel.: +39 095 7165800;
l rights reserved.
most hazardous areas, particularly in cloudy or night time conditions.New sophisticated instrumentations have been studied and tested inproximity of active volcanoes, using several technologies to detect ashplumes (e.g. Andò and Pecora, 2006; Francis and Rothery, 2000).
Oneof thebiggestproducers of volcanicplumes in theworld isMt. Etnavolcano in Sicily, Italy (Fig. 1). Such plumes are clearly visible both in quietdegassing periods aswell as during eruptions (Allard et al.,1991; Haulet etal., 1977). Due to this quasi-persistent eruptive activity, there is a constantand serious hazard to both international and local air traffic, particularly ifthe eruption is highly explosive. The formation of volcanic plumes fromEtnamay occur both from the summit craters (located between 3000 and3300 m a.s.l.; Fig. 1) and from eruptive fractures that often open on theflanks of the volcano. In recent years, Etna has frequently shownpowerfulexplosive activity, including episodic paroxysms (more than 150 eventssince1995;Alparoneetal., 2007) and long-lastingexplosiveeruptions suchas during 2001 for about 20 days (INGV-Staff, 2001; Scollo et al., 2007) andin 2002–03 for about 2 months (Andronico et al., 2003, 2005, 2008). Etnaalsoundergoes intensedegassingduringperiodsof apparentquiescenceorno eruptive activity. Continuous production of gas-enriched plumes iscaused by the ordinary degassing occurring at its summit. This kind of
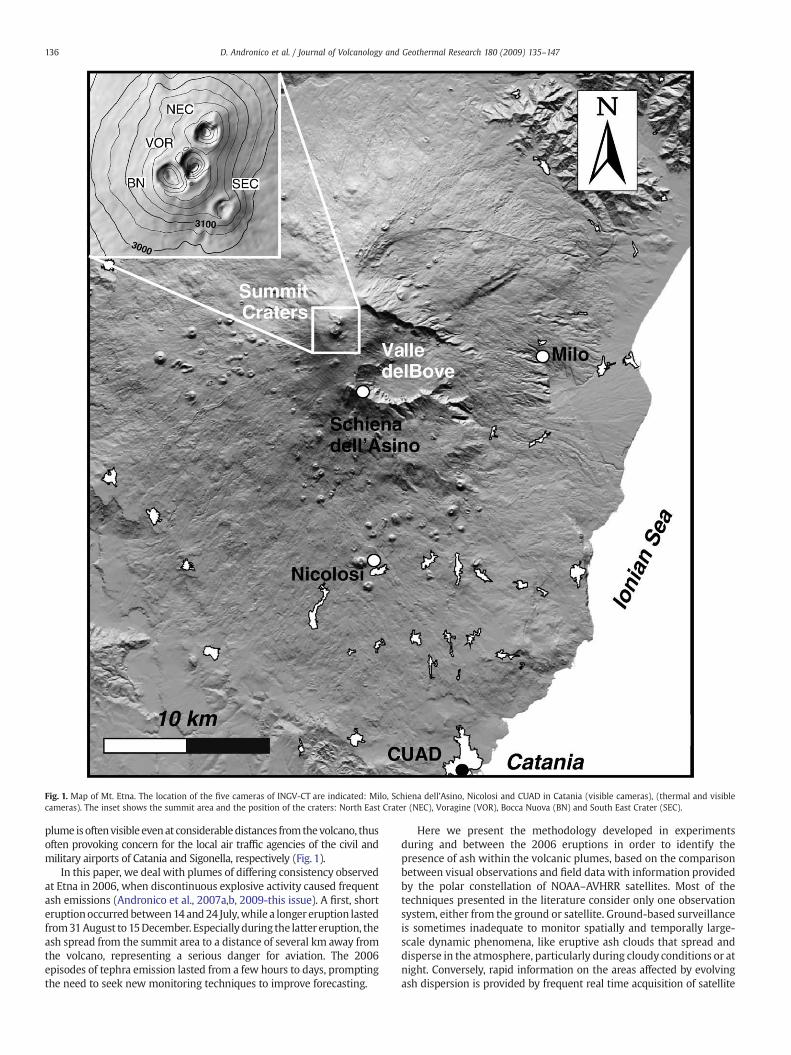
Fig. 1. Map of Mt. Etna. The location of the five cameras of INGV-CT are indicated: Milo, Schiena dell'Asino, Nicolosi and CUAD in Catania (visible cameras), (thermal and visiblecameras). The inset shows the summit area and the position of the craters: North East Crater (NEC), Voragine (VOR), Bocca Nuova (BN) and South East Crater (SEC).
136 D. Andronico et al. / Journal of Volcanology and Geothermal Research 180 (2009) 135–147
plume isoftenvisible evenat considerabledistances fromthevolcano, thusoften provoking concern for the local air traffic agencies of the civil andmilitary airports of Catania and Sigonella, respectively (Fig. 1).
In this paper, we deal with plumes of differing consistency observedat Etna in 2006, when discontinuous explosive activity caused frequentash emissions (Andronico et al., 2007a,b, 2009-this issue). A first, shorteruptionoccurred between14and24 July,while a longer eruption lastedfrom31August to 15December. Especially during the latter eruption, theash spread from the summit area to a distance of several km away fromthe volcano, representing a serious danger for aviation. The 2006episodes of tephra emission lasted from a few hours to days, promptingthe need to seek new monitoring techniques to improve forecasting.
Here we present the methodology developed in experimentsduring and between the 2006 eruptions in order to identify thepresence of ash within the volcanic plumes, based on the comparisonbetween visual observations and field data with information providedby the polar constellation of NOAA–AVHRR satellites. Most of thetechniques presented in the literature consider only one observationsystem, either from the ground or satellite. Ground-based surveillanceis sometimes inadequate to monitor spatially and temporally large-scale dynamic phenomena, like eruptive ash clouds that spread anddisperse in the atmosphere, particularly during cloudy conditions or atnight. Conversely, rapid information on the areas affected by evolvingash dispersion is provided by frequent real time acquisition of satellite
137D. Andronico et al. / Journal of Volcanology and Geothermal Research 180 (2009) 135–147
images. Nonetheless, limits of remote sensing techniques are welldocumented (Simpson et al., 2000; Prata et al., 2001; Pieri et al., 2002)and used stand-alone canproduce ambiguity in the context of providingoperational support of aviation safety (Simpson et al., 2001).
By comparing and integrating ground-based and remote sensingsystems, our goal was to enhance the ability of NOAA–AVHRR polarsatellite data to effectively detect the sporadic episodes of ash emissionsat Etna. After describing the eruptive activity, we present the resultscoming from the adopted methodology and propose a classification ofvolcanic plumes observed during 2006. This approach has emphasizedthe acquisition of real time information on the presence of ash in thevolcanic plume. The results obtained by comparing the two observationsystems are then integrated into the information streamprovidedby theIstituto Nazionale di Geofisica e Vulcanologia, Sezione di Catania (INGV-CT), devoted to the monitoring of Etna, in operational support of theItalian Civil Protection.We conclude by demonstrating the advantage ofalso introducing real-time satellite data into the monitoring system fordetecting weak, non-intense ash emissions, like those occurring atbasaltic volcanoes such as Etna.
2. The 2006 eruptive activity at Etna
Mt. Etna started erupting during the night of 14 July 2006, when afissure formed on the eastern flank of the South East Crater (SEC), one ofthe summit craters of Etna (Fig.1). Three vents opened along theeruptivefissure at about 3000ma.s.l., two of thememitting lava flows (joining upafter a few hundred meters) that propagated eastwards inside the Valledel Bove (Branca and Consoli, 2006). Between 15 and 23 July, strongStrombolian activity and lava flows were produced from a pit-craterdepression located on the east flank of the cone. Although the explosiveactivity caused ash emission, no formation of sustained eruptioncolumns occurred and tephra fallout was mainly confined over thesummit area of Etna. The eruption ended on 24 July 2006; several days ofsustained degassing activity without ash emission then took place.
Volcanic activity at SEC recommenced at the end of August 2006,initially due to moderate Strombolian activity. The new eruption endedon 15 December 2006. In this period, a more intense and differentiatederuptive activity affected SEC, characterised by almost continuousexplosive activity both at its summit and eastern slopes, andinterspersed only by a few temporary vents orminor fractures involvingsmall to significant rock-falls and debris avalanches during paroxysmalactivity (e.g., Branca and Polacci, 2006; Norini et al., 2008). From 4September, short lavaflowsoverflowed fromthe summit venteastwardsfor a few hundreds of meters (Calvari and Lodato, 2006) that stopped inmid-September. A neweruptive fracture opened on 13October from theEast base of SEC, trending ESE–WNW and reaching the altitude of2800 m a.s.l.; an effusive activity started forming lava flows spreadingeastwards and causingquasi-permanent lavafloweffusionup to the endof the eruption. Eruptive fractures also opened on the S-flank of BoccaNuova, emitting lavaflows for a fewhours on 26and 28October (Calvari,2006a; Coltelli, 2006) and on 16 November (Calvari, 2006b).
On the whole, the August–December 2006 eruption was pre-liminarily subdivided by Andronico et al. (2009-this issue) into threemain stages, during which eruptive activity (both explosive andeffusive) was characterised by different styles and intensity, hereafterbriefly described mainly from the explosive point of view.
2.1. First stage: 31 August–27 October
Seven prolonged episodes (lasting one to several days) ofdiscontinuous, strong Strombolian explosions occurred at SEC, usuallyforming ephemeral plumes over the summit of Etna. In between theseepisodes, minor explosions took place at the cone. Minor effusiveactivity produced short lava flows from the summit and along flankfractures opened on the cone slopes, while a permanent effusive vent-fissure opened at 2800 m a.s.l.
2.2. Second stage: 27 October–27 November
This phase featured elevenmain explosive episodes lasting a few totens of hours, whose intensity increased significantly with respect tothose observed during the first stage. Paroxysmal activity oftenoccurred in flank pit-craters that formed in the east part of the cone.This activity usually led to the formation of weak and/or discontinuousash-enriched plumes above SEC, eventually causing moderate to lighttephra showers as far as Catania and other villages around Etna.Effusive activity at the 2800 fracture continued.
2.3. Third stage: 27 November–15 December
After 27November, the eruptive style changed andSECwas affectedby 2–4 day-long episodes of prolonged ash emission. This activity wasmainly related to deep and pulsating explosions centred within themain pit-crater inherited from the last paroxysm of 27 November. As aconsequence, this style produced low, dense and ashy plumes that roseto altitudes of one–two hundreds of meters above the vent beforedriftingwith dominantwinds to form bent and usually narrow plumesover the summit, causing very light but continuous ash fallout over theroads. On some days air traffic was also disrupted even as far as theReggio Calabria airport, about 70 km north-eastward from the vent.
3. Methodology
The integrated observation approach described in this paper is basedon the continuous comparison between data on explosive activity andassociated tephra emission on one hand and satellite observation on theother, with the goal of predicting the next ash emission episodes at Etna.
3.1. Ground ash emission data
Monitoring of Etna is performed by INGV-CT which acquires datafromdifferent observational systems and geophysical and geochemicalnetworks. At present, ash emissions and associated fallout deposit aremonitored by integrating information derived from camera networks,visual observations and from tephra samples (Andronico et al., 2009-this issue). These operations aimed to evaluate the duration andintensity of most of the ash fallout events and eventually magnitudeand intensity according to the estimation of the erupted volume.
Most information is collected and analyzed at the operations room ofINGV-CT, where the pattern of the seismic tremor is continuouslymonitored. Each significant variation in tremor triggers a warning,possibly indicating an impendingexplosive activity (Alparoneet al., 2003,2007). Again in the operations room, images of Etna are transmitted inreal-time from the five live-cameras managed by INGV-CT around thevolcano (four visible and one thermal; Fig. 1). The visible cameras arelocated in Catania at CUAD (26 km S from SEC and 35 m a.s.l.), Nicolosi(15 kmS and 730ma.s.l.), Schiena dell'Asino (5 kmSSE and 2030ma.s.l.)andMilo (10 kmESE and 770ma.s.l.), while the thermal one is located inNicolosi. The visible cameras are Canon (VC-C4 models) and acquire a420×350 squared pixel image with 47.5° field of view. The thermalcamera is a FLIR ThermoVision® 320 M model and uses an uncooledmicrobolometer that detects the emitted radiation in the 7.5 to 13 µmband, acquires 320×240 squared pixel images and has a 24°×18° field ofview. All the cameras acquire an image every 2 s and transfer the videosignal in real time to the operations room,where all the images are storedand published (at a lower frame rate) on thewebsite www.ct.ingv.it. Theoperations room personnel are there to observe variations in eruptiveactivity and to eventually advise the volcanologist on-duty. The video-analysis of the permanent camera system is used to compile weeklyreports of the eruptive activity at Etna that are published on the INGV-CTwebsite. The camera network greatly helps monitoring potentialformation and evolution of eruptive plumes above the summit fromdifferent points of view, if the weather conditions are good. Wind
138 D. Andronico et al. / Journal of Volcanology and Geothermal Research 180 (2009) 135–147
direction and intensity provided from the Meteorological station atSigonella are used to define the area eventually affected by ash fallout.This whole set of information is used for planning the field surveys toacquire tephra samples and then reconstruct the ash fallout dispersal.
3.2. Satellite data
The INGV-CNT Satellite Receiving Station receives AVHRR (AdvancedVery High Resolution Radiometer) data in real-time. The station wasinstalled inRomeat the endof 2004. The tracking antenna is configured forcapturing data from the NOAA constellation, which currently comprises 6polar satellites orbiting over the Mediterranean area. The station is aTeraScan system which integrates hardware and software for automatedreceptionof data fromsatellites and fordata processing (Young, 2006). Themultispectral sensor AVHRR on board NOAA satellites acquires digitalimages in the wavelength range from visible to thermal infrared in fivedifferent channels (Gary, 2007). The digital images have 1.1 km of spatialresolution when data are acquired at nadir view (NOAA, 2000). Sicily iscovered byNOAAdata acquisition frequencyof aminimumof 4passes andmaximum of 9 per day, thus permitting day and night observation.
NOAA–AVHRR thermal infrared images have been used to develop atechnique fordetecting thepresenceof volcanic ash clouds (Prata,1989a,b;WenandRose,1994; Prata andGrant, 2001). The technique is the so-called“split window” or Brightness Temperature Difference (BTD) method, andhas been used extensively during many volcanic eruptions to identify thevolcanic ash plumes and also to discriminate them from meteorologicalclouds (Self andHolasek,1995; Schneider et al.,1995; Simpson et al., 2002;Tupper et al., 2004). The method is based on the wavelength dependentdifferential absorption of earth-emitted radiationmeasured by the sensorin terms of brightness temperature. The identification of volcanic clouds isbased on the difference between the brightness temperatures computedfrom two thermal infrared channels positioned around 11 and 12 µm. Dueto the volcanic ash spectral characteristics in absorbing more strongly at11 µm than at 12 µm, there will generally be a negative difference forvolcanic plumes (larger absorption at 11 than 12 µm) and positive formeteorological clouds (larger absorption at 12 than 11 µm). Thus, belowthe BTD threshold zero the presence of ash is theoretically identified.
However, this method has limitations as reported by Simpson et al.(2000). Themain limitation is thatmany volcanic clouds aremixedwithmeteorological clouds in which water vapor, water droplets and icecrystals act to mask the negative BTD volcanic cloud signal. There hasbeen substantial discussion in the literature concerning this effect andwhether theBTDmethod is optimal for aviationpurposes (Hufford et al.,2000; Prata et al., 2001; Simpson et al., 2001). The following effects havebeen demonstrated to change the threshold in a positive BTD: 1) highamounts of precipitable moisture in atmosphere; 2) optically denseclouds; 3) ice coating of volcanic particles; 4) high concentration ofaerosols; 5) volcanic particles with radius NN15 µm.
In this work, the BTD method has been applied to the real-timeNOAA–AVHRR images during the entire 2006 eruption. Comparing theBTD results with ground observations, we determined the best BTDthreshold for the detection of Etna volcanic ash plumes for dependabledetectionof sporadic ashemissions.Visible and thermal imageshave alsobeen used to better identify the volcanic plume. Once the ash is detected,theBTDmethodallows themappingof the associated ashplumeor cloudandthecalculationof parametersuseful for volcanic ashhazarddetectionand tracking. These parameters are: location, extension, direction andaltitude of the plume. The extension is considered as the length and thewidth of the plume; these values are calculated using the georeferencedimages after considering the pixel size of the analyzed data both inthermal and in the visible channels. The georeferenced images areautomatically provided by Terascan software. From the georeferencedimages, plume location anddirection are alsoobtained. Theplumeheightis estimated by the correlation between plume brightness temperaturesandatmospheric profiles (Holasek et al.,1996; Tupperet al., 2003). To thisend, we used the standard vertical atmospheric profile provided by the
Italian Air Force base in Trapani. If multiple layers have the sametemperature, the comparison between the wind direction and thecorresponding plume direction identifies the plume layer height. Thesupplemented wind correlation not only overcomes height ambiguitiescaused by atmospheric inversions, but also the underestimation due tonon-opaque clouds and clouds having emissivity of less than unity.
4. The volcanic plumes observed in 2006
During, and in between, the 2006 eruptions at Etna, we identified anumber of volcanic plumes both by volcanological observations andsatellite image analysis. The maximum number of observations ofvolcanic plumes from Etnawas obtained during the August–December2006 eruption.
From the volcanological point of view, a volcanic plume is primarilyobserved by means of live-cameras and visual observations from aroundEtna.However, this informationoftenneeds to be supportedwithfielddata.The quantitative measurements of the characteristics of an ash deposit onthe ground is the chief parameter for the identificationof different classes oferuptive plumes, and in particular the estimation of fallout rate (e.g., mass/unit area and mass/unit time). A low fallout rate may couple with short orlong explosive activity; nevertheless intense fallout may last from minutesup to several hours.With respect to duration, in 2006most explosive eventslasted hours to days. Only in few cases were the explosive events short, butwith a sequence of explosions in a fewminutes intense enough to produceeruption plumes that rose above and drifted away from the summit. One ofthemain features of the 2006 activity comparedwith previous paroxysmalactivity of Etna (e.g. fire-fountaining in 2000, flank eruptions in 2001 and2002–03), was the very low rate of sedimentation by ash fallout.
From the satellite remote sensing point of view, the satelliteobservation system automatically acquired Etna images during everyNOAA satellite acquisition. Images are a square of 40×40 km in dimensionand centred at the Etna summit craters (latitude: 37°51.50′; longitude:14°58.01′). The processing of multispectral images allowed the identifica-tion of Etnean volcanic plumes, when their dimensions are greater thanthe pixel size of the acquired image. The meteorological cloud mask andtheBTDmethodare automaticallyapplied to every imageand its relativelysmall dimension reduced ambiguous cases. Larger images (covering thewhole of Sicily) are usedwhen a volcanic plume is detected in the smaller40×40 km image. Using the Sicily BTD image and the visible channel, theplumeparameters, namely plume direction, extension (length andwidth)and height, are calculated.
During 2006, we observed a number of volcanic plumes related todifferent typologies of eruptive activity. The comparison betweenobservations from ground and from satellite was crucial to recognizetheir features in terms of ash and cloud detection by satellite, duration,intensity of the explosive activity and tephra fallout. By combining thesequalitative and quantitative data, we propose defining five classes ofvolcanic plume (Table 1): 1) degassing plumes, 2) ephemeral plumes, 3)long-lasting and weak intensity plumes, 4) plumes produced bymiddleeruptive intensity, and 5) long-lasting and pulsating plumes.
4.1. Degassing plumes
Degassing plumes are the ordinary type of plume that we havebecome used to seeing over the volcano summit. From a satelliteperspective, an intermittent plume was present throughout the period19–31 July (see Appendix). These plumeswere detected in visible channelimages indicating that theyweremostlycomposedby thevolcanic aerosol(Spinetti et al., 2003; Spinetti and Buongiorno, 2007). The plume waspredominately in the south-east quadrant in 50%of observations,while inthe south-west quadrant it was observed approximately 30% of the time.No ash plume was identified by the BTD method from AVHRR data.
During the 14–24 July 2006 eruption, satellite images clearly showedthe formation of degassingplumes above and away from the summit areaof Etna. These sometimes caused theemissionof tephra falling around the
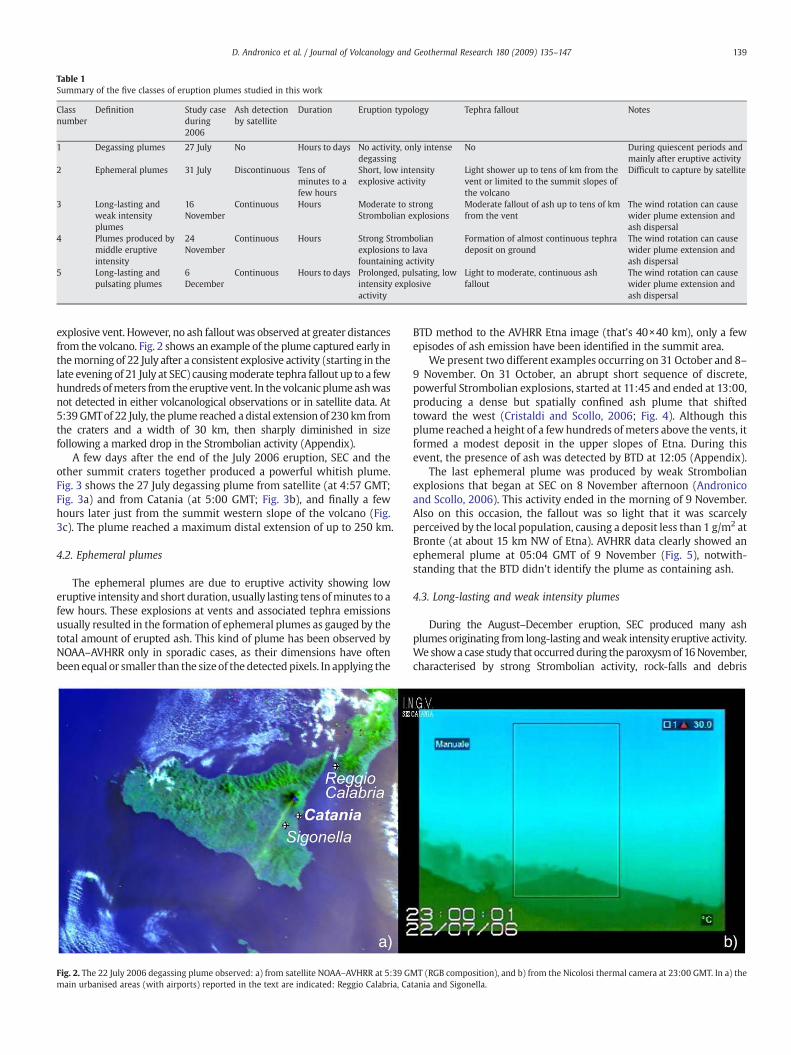
Table 1Summary of the five classes of eruption plumes studied in this work
Classnumber
Definition Study caseduring2006
Ash detectionby satellite
Duration Eruption typology Tephra fallout Notes
1 Degassing plumes 27 July No Hours to days No activity, only intensedegassing
No During quiescent periods andmainly after eruptive activity
2 Ephemeral plumes 31 July Discontinuous Tens ofminutes to afew hours
Short, low intensityexplosive activity
Light shower up to tens of km from thevent or limited to the summit slopes ofthe volcano
Difficult to capture by satellite
3 Long-lasting andweak intensityplumes
16November
Continuous Hours Moderate to strongStrombolian explosions
Moderate fallout of ash up to tens of kmfrom the vent
The wind rotation can causewider plume extension andash dispersal
4 Plumes produced bymiddle eruptiveintensity
24November
Continuous Hours Strong Strombolianexplosions to lavafountaining activity
Formation of almost continuous tephradeposit on ground
The wind rotation can causewider plume extension andash dispersal
5 Long-lasting andpulsating plumes
6December
Continuous Hours to days Prolonged, pulsating, lowintensity explosiveactivity
Light to moderate, continuous ashfallout
The wind rotation can causewider plume extension andash dispersal
139D. Andronico et al. / Journal of Volcanology and Geothermal Research 180 (2009) 135–147
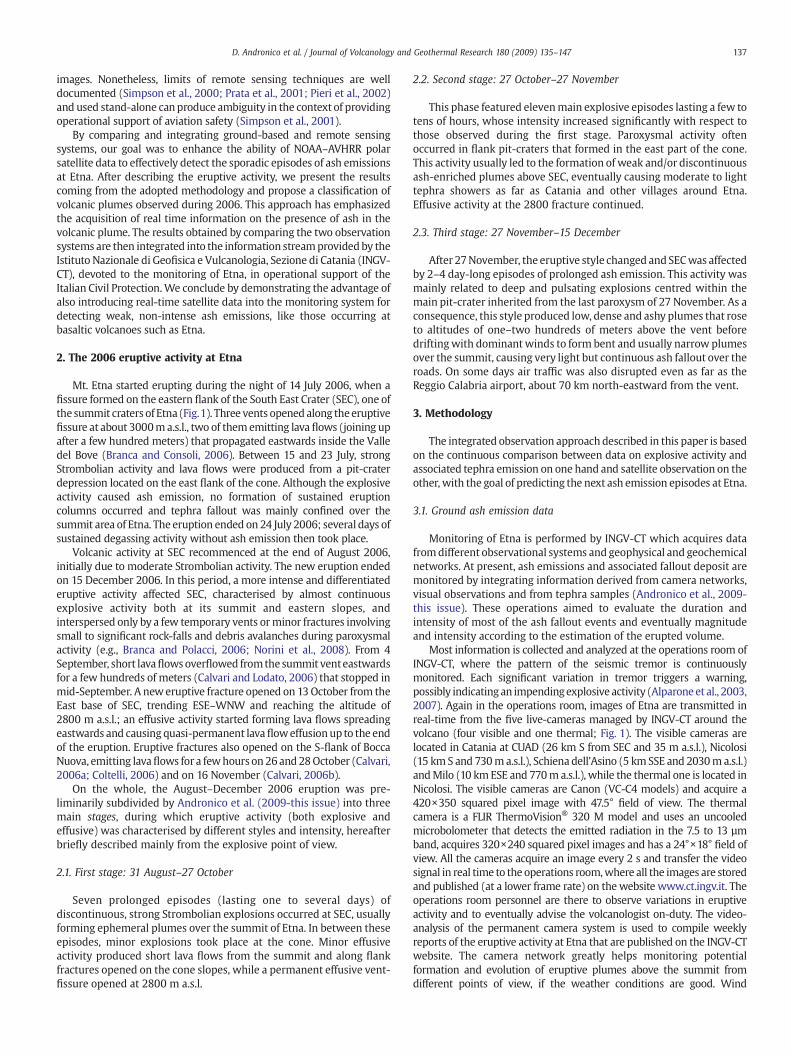
explosive vent. However, no ash falloutwas observed at greater distancesfrom the volcano. Fig. 2 shows an example of the plume captured early inthemorning of 22 July after a consistent explosive activity (starting in thelate evening of 21 July at SEC) causingmoderate tephra fallout up to a fewhundreds ofmeters from the eruptive vent. In the volcanic plumeashwasnot detected in either volcanological observations or in satellite data. At5:39 GMTof 22 July, the plume reached a distal extension of 230 km fromthe craters and a width of 30 km, then sharply diminished in sizefollowing a marked drop in the Strombolian activity (Appendix).
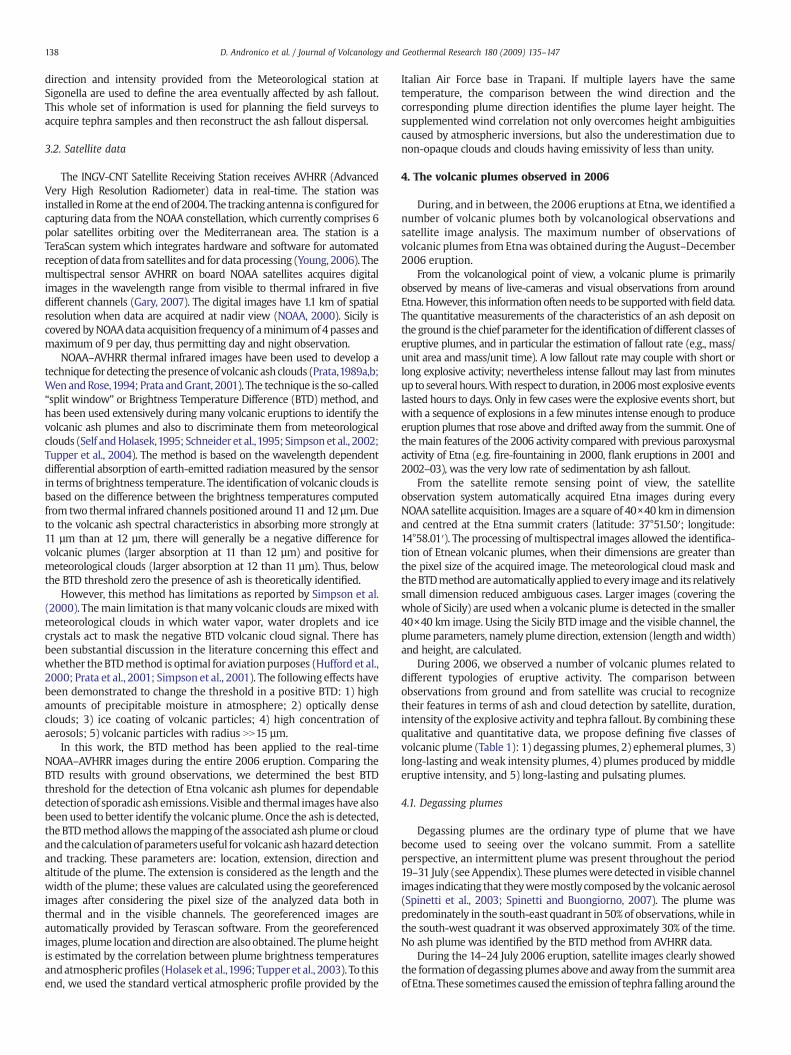
A few days after the end of the July 2006 eruption, SEC and theother summit craters together produced a powerful whitish plume.Fig. 3 shows the 27 July degassing plume from satellite (at 4:57 GMT;Fig. 3a) and from Catania (at 5:00 GMT; Fig. 3b), and finally a fewhours later just from the summit western slope of the volcano (Fig.3c). The plume reached a maximum distal extension of up to 250 km.
4.2. Ephemeral plumes
The ephemeral plumes are due to eruptive activity showing loweruptive intensity and short duration, usually lasting tens ofminutes to afew hours. These explosions at vents and associated tephra emissionsusually resulted in the formation of ephemeral plumes as gauged by thetotal amount of erupted ash. This kind of plume has been observed byNOAA–AVHRR only in sporadic cases, as their dimensions have oftenbeenequal or smaller than the sizeof the detectedpixels. In applying the
Fig. 2. The 22 July 2006 degassing plume observed: a) from satellite NOAA–AVHRR at 5:39 Gmain urbanised areas (with airports) reported in the text are indicated: Reggio Calabria, Ca
BTD method to the AVHRR Etna image (that's 40×40 km), only a fewepisodes of ash emission have been identified in the summit area.
We present two different examples occurring on 31 October and 8–9 November. On 31 October, an abrupt short sequence of discrete,powerful Strombolian explosions, started at 11:45 and ended at 13:00,producing a dense but spatially confined ash plume that shiftedtoward the west (Cristaldi and Scollo, 2006; Fig. 4). Although thisplume reached a height of a few hundreds ofmeters above the vents, itformed a modest deposit in the upper slopes of Etna. During thisevent, the presence of ash was detected by BTD at 12:05 (Appendix).
The last ephemeral plume was produced by weak Strombolianexplosions that began at SEC on 8 November afternoon (Andronicoand Scollo, 2006). This activity ended in the morning of 9 November.Also on this occasion, the fallout was so light that it was scarcelyperceived by the local population, causing a deposit less than 1 g/m2 atBronte (at about 15 km NW of Etna). AVHRR data clearly showed anephemeral plume at 05:04 GMT of 9 November (Fig. 5), notwith-standing that the BTD didn't identify the plume as containing ash.
4.3. Long-lasting and weak intensity plumes
During the August–December eruption, SEC produced many ashplumes originating from long-lasting andweak intensity eruptive activity.We showa case study that occurredduring the paroxysmof 16November,characterised by strong Strombolian activity, rock-falls and debris
MT (RGB composition), and b) from the Nicolosi thermal camera at 23:00 GMT. In a) thetania and Sigonella.
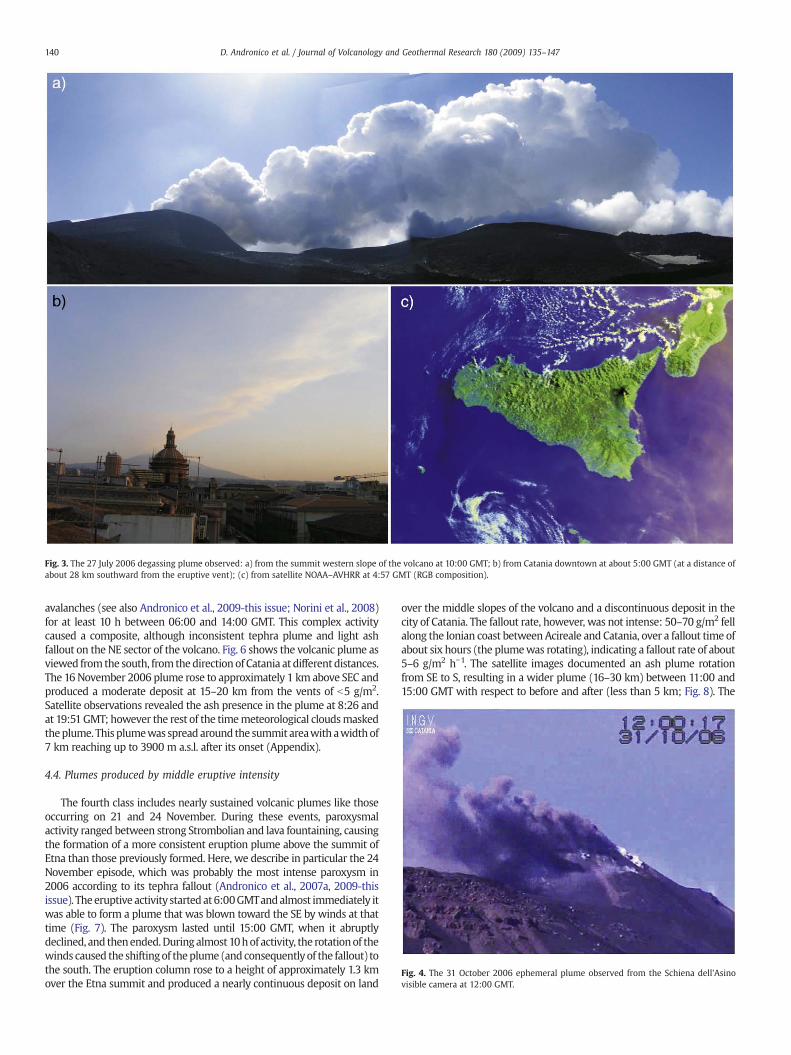
Fig. 3. The 27 July 2006 degassing plume observed: a) from the summit western slope of the volcano at 10:00 GMT; b) from Catania downtown at about 5:00 GMT (at a distance ofabout 28 km southward from the eruptive vent); (c) from satellite NOAA–AVHRR at 4:57 GMT (RGB composition).
Fig. 4. The 31 October 2006 ephemeral plume observed from the Schiena dell'Asinovisible camera at 12:00 GMT.
140 D. Andronico et al. / Journal of Volcanology and Geothermal Research 180 (2009) 135–147
avalanches (see also Andronico et al., 2009-this issue; Norini et al., 2008)for at least 10 h between 06:00 and 14:00 GMT. This complex activitycaused a composite, although inconsistent tephra plume and light ashfallout on the NE sector of the volcano. Fig. 6 shows the volcanic plume asviewed from the south, from thedirectionof Catania at different distances.The 16 November 2006 plume rose to approximately 1 km above SEC andproduced a moderate deposit at 15–20 km from the vents of b5 g/m2.Satellite observations revealed the ash presence in the plume at 8:26 andat 19:51GMT; however the rest of the timemeteorological cloudsmaskedtheplume. Thisplumewas spread around the summit areawith awidthof7 km reaching up to 3900 m a.s.l. after its onset (Appendix).
4.4. Plumes produced by middle eruptive intensity
The fourth class includes nearly sustained volcanic plumes like thoseoccurring on 21 and 24 November. During these events, paroxysmalactivity ranged between strong Strombolian and lava fountaining, causingthe formation of a more consistent eruption plume above the summit ofEtna than those previously formed. Here, we describe in particular the 24November episode, which was probably the most intense paroxysm in2006 according to its tephra fallout (Andronico et al., 2007a, 2009-thisissue). Theeruptive activity startedat 6:00GMTandalmost immediately itwas able to form a plume that was blown toward the SE by winds at thattime (Fig. 7). The paroxysm lasted until 15:00 GMT, when it abruptlydeclined, and thenended.Duringalmost 10hof activity, the rotationof thewinds caused the shiftingof theplume (and consequentlyof the fallout) tothe south. The eruption column rose to a height of approximately 1.3 kmover the Etna summit and produced a nearly continuous deposit on land
over the middle slopes of the volcano and a discontinuous deposit in thecity of Catania. The fallout rate, however, was not intense: 50–70 g/m2 fellalong the Ionian coast between Acireale and Catania, over a fallout time ofabout six hours (the plumewas rotating), indicating a fallout rate of about5–6 g/m2 h−1. The satellite images documented an ash plume rotationfrom SE to S, resulting in a wider plume (16–30 km) between 11:00 and15:00 GMT with respect to before and after (less than 5 km; Fig. 8). The

Fig. 5. The 9 November 2006 ephemeral plume observed from satellite at 05:04 GMT.
141D. Andronico et al. / Journal of Volcanology and Geothermal Research 180 (2009) 135–147
plume altitude was between 4900 to 5400 m a.s.l. from 10:00 to 11:20GMT. The maximum plume length was estimated as 338 km (distal ashidentifiedatupto83kmfromthevent) at 11:20GMT,while themaximumwidth resulted 82 km at 15:15 GMT (ash presence identified up to 30 km)(Appendix).
4.5. Long-lasting and pulsating plumes
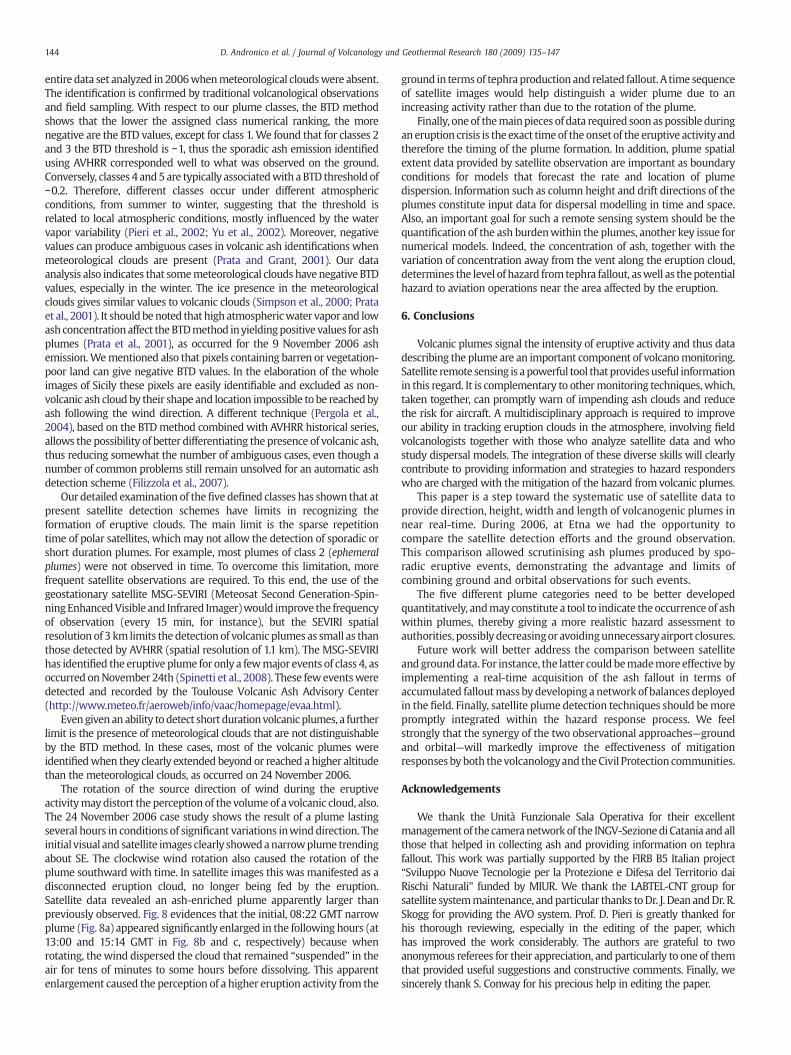
During the 27 November paroxysm, a pit-crater formed in the easternsideof SEC. This pitwas the locationof continuous (although low intensity)explosive activity, that generated bent and narrow plumes during the lastphase of the August–December 2006 eruption (27 November–15December). In this period, however, the presence ofmeteorological cloudslimited the observation both from the ground camera network and fromsatellite. Tephra deposits on landwere very light and discontinuous due tothe continuous shifting of the winds coupled with the low ash content.Fig. 8 shows the volcanic plume as it appeared on 6December. In this case,the plumewas poorly defined, laterallywell dispersed and relatively short,probablynotonlybecauseof the lowlevelof explosiveactivity, butbecauseofweakwinds in themorning (5knots at 3000ma.s.l.). Theplumealtitudewas between 3600 and 4600 m a.s.l. at 5:37 GMT. In other cases, as on 4December, the plume was weaker in the morning and then grew due to
Fig. 6. The 16 November 2006 long-lasting andweak intensity plume observed from Catania dovercomes it and directs towards east on the right of the picture.
increasing intensity of explosions (Appendix). This factor, togetherwith anincrease of wind intensity, caused the formation of an elongated plume inthe evening, resulting in a light shower of fine ash over the town of ReggioCalabria (Fig. 9).
5. Discussion
We have conducted continuous observations of the volcanic plumesformedduringeruptiveactivity fromMt. Etnaby routineuseof live-camerasand traditional volcanological field observations. During 2006, for the firsttime, Etna volcanic plumes were observed in real time both from satelliteand from the ground simultaneously and results from each detectionmethod were compared. In the period July–December 2006, in particular,the introduction of satellite data into the observation systems of Etnawas ofsignificant use to detect the presence of ash clouds in the atmosphere. Inmany cases (but not always), the 2006 plumes contained volcanic ash(Appendix). The main factors on whether or not there was a detectablepresence of ash in the observed volcanic plumeswere the duration and theintensity of the eruptive activity, while the strength and direction of thewinds mostly influenced the areas where ash was dispersed.
5.1. Classification of volcanic plumes
Information on the presence or lack of ash in atmosphere (based onsatellite images and visible and field data) allowed us to identify fiveclasses of volcanic plumes, with the potential to infer the level of eruptivehazard. For ease of reference and identification, in the following sectionand in Appendix, we will define and refer to our five plumes as Class 1through Class 5.
Class 1 includes degassing plumes that are not heavily loadedwith ash.Matsushima and Shinohara (2006) divided such volcanic plumes into twodistinctive categories according to their appearance. The first categoryincludes transparent, invisible plumes that are composed of volcanicgases, while the second class is formed by visible plumes that containaerosols and water droplets in addition to the gases. These authorshighlighted that parameters controlling the visibility of volcanic plumes,including the exit temperature of the volcanic gas, the gas composition(HCl and H2O), atmospheric temperature and humidity. At the sameatmospheric condition the lower exit temperature induces the formationof opaque plumes for lower gas mole ratio (HCl/H2O) and vice versa fortransparent plumes. The degassing transparent-type plume is normallypresent at Etna since it is a quiescent volcano. The distal plume is oftenconfined within a few to tens of km from the summit craters (Spinetti et
owntown at 15:30 GMT. Mt. Etna is covered by themeteorological clouds and the plume
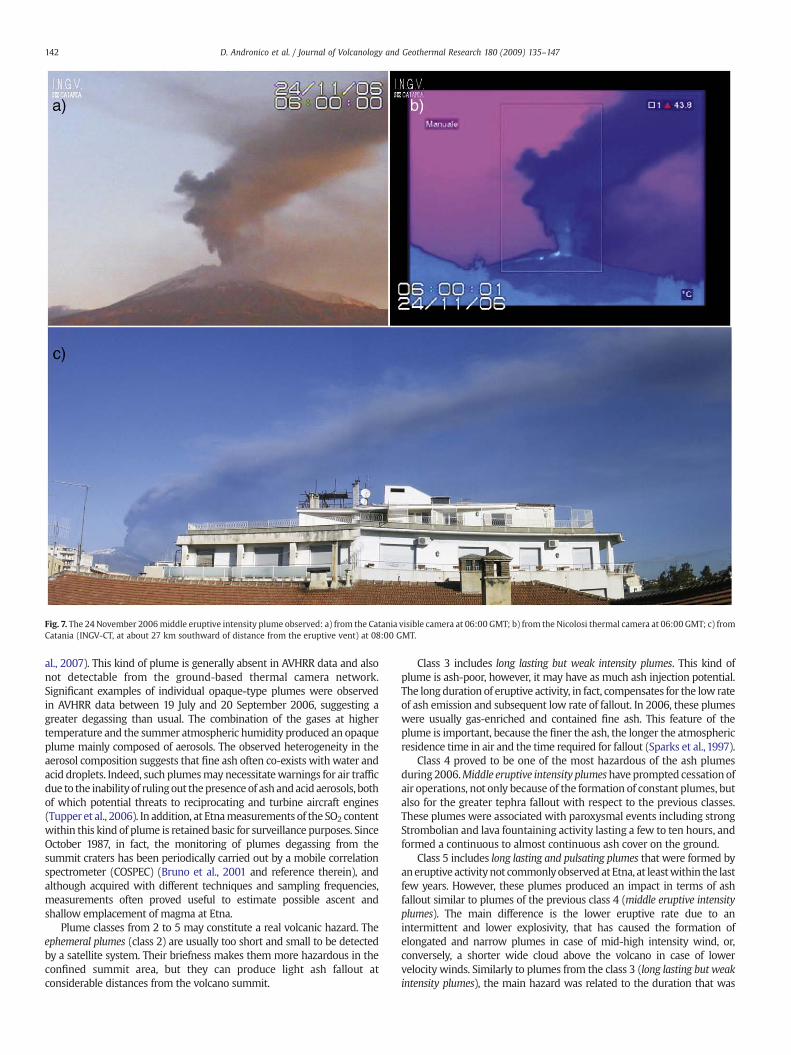
Fig. 7. The 24 November 2006middle eruptive intensity plume observed: a) from the Catania visible camera at 06:00 GMT; b) from the Nicolosi thermal camera at 06:00 GMT; c) fromCatania (INGV-CT, at about 27 km southward of distance from the eruptive vent) at 08:00 GMT.
142 D. Andronico et al. / Journal of Volcanology and Geothermal Research 180 (2009) 135–147
al., 2007). This kind of plume is generally absent in AVHRR data and alsonot detectable from the ground-based thermal camera network.Significant examples of individual opaque-type plumes were observedin AVHRR data between 19 July and 20 September 2006, suggesting agreater degassing than usual. The combination of the gases at highertemperature and the summer atmospheric humidity produced an opaqueplume mainly composed of aerosols. The observed heterogeneity in theaerosol composition suggests that fine ash often co-exists with water andacid droplets. Indeed, such plumesmay necessitatewarnings for air trafficdue to the inabilityof rulingout thepresence of ash andacid aerosols, bothof which potential threats to reciprocating and turbine aircraft engines(Tupper et al., 2006). In addition, at Etnameasurements of the SO2 contentwithin this kind of plume is retained basic for surveillance purposes. SinceOctober 1987, in fact, the monitoring of plumes degassing from thesummit craters has been periodically carried out by a mobile correlationspectrometer (COSPEC) (Bruno et al., 2001 and reference therein), andalthough acquired with different techniques and sampling frequencies,measurements often proved useful to estimate possible ascent andshallow emplacement of magma at Etna.
Plume classes from 2 to 5 may constitute a real volcanic hazard. Theephemeral plumes (class 2) are usually too short and small to be detectedby a satellite system. Their briefness makes them more hazardous in theconfined summit area, but they can produce light ash fallout atconsiderable distances from the volcano summit.
Class 3 includes long lasting but weak intensity plumes. This kind ofplume is ash-poor, however, it may have as much ash injection potential.The longduration of eruptive activity, in fact, compensates for the low rateof ash emission and subsequent low rate of fallout. In 2006, these plumeswere usually gas-enriched and contained fine ash. This feature of theplume is important, because the finer the ash, the longer the atmosphericresidence time in air and the time required for fallout (Sparks et al., 1997).
Class 4 proved to be one of the most hazardous of the ash plumesduring 2006.Middle eruptive intensity plumeshave prompted cessationofair operations, not only because of the formation of constant plumes, butalso for the greater tephra fallout with respect to the previous classes.These plumes were associated with paroxysmal events including strongStrombolian and lava fountaining activity lasting a few to ten hours, andformed a continuous to almost continuous ash cover on the ground.
Class 5 includes long lasting and pulsating plumes that were formed byaneruptive activitynot commonlyobservedat Etna, at leastwithin the lastfew years. However, these plumes produced an impact in terms of ashfallout similar to plumes of the previous class 4 (middle eruptive intensityplumes). The main difference is the lower eruptive rate due to anintermittent and lower explosivity, that has caused the formation ofelongated and narrow plumes in case of mid-high intensity wind, or,conversely, a shorter wide cloud above the volcano in case of lowervelocity winds. Similarly to plumes from the class 3 (long lasting but weakintensity plumes), the main hazard was related to the duration that was
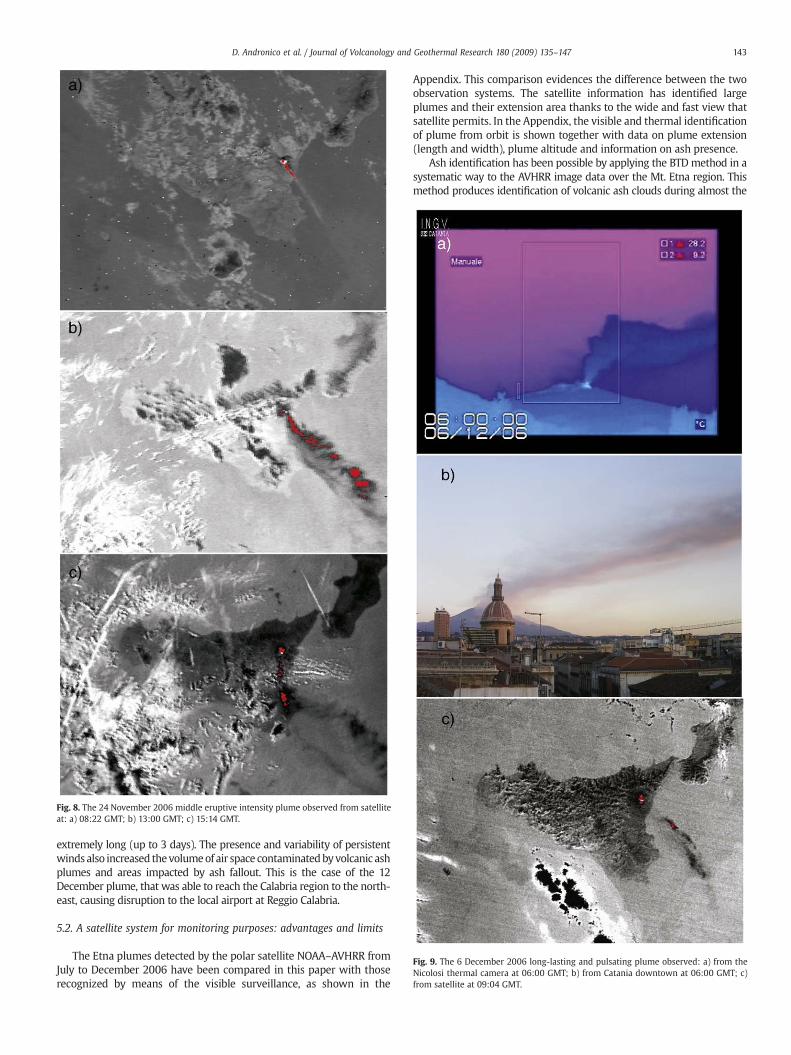
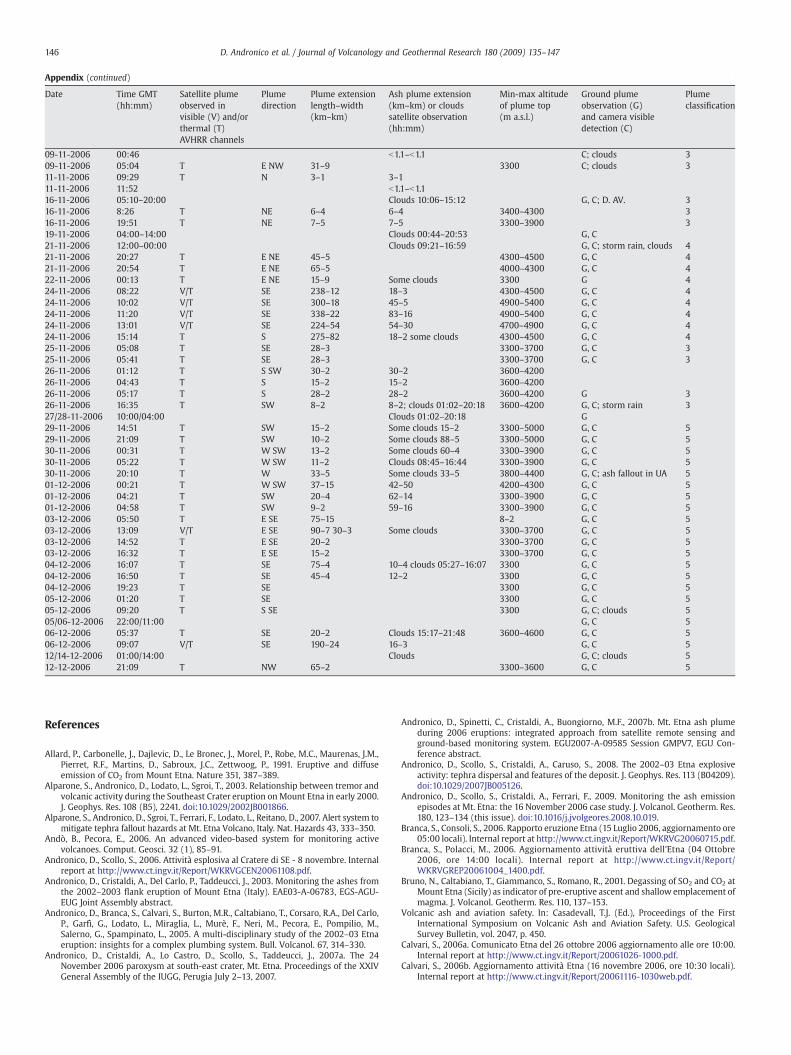
Fig. 8. The 24 November 2006 middle eruptive intensity plume observed from satelliteat: a) 08:22 GMT; b) 13:00 GMT; c) 15:14 GMT.
Fig. 9. The 6 December 2006 long-lasting and pulsating plume observed: a) from theNicolosi thermal camera at 06:00 GMT; b) from Catania downtown at 06:00 GMT; c)from satellite at 09:04 GMT.
143D. Andronico et al. / Journal of Volcanology and Geothermal Research 180 (2009) 135–147
extremely long (up to 3 days). The presence and variability of persistentwinds also increased thevolumeof air space contaminatedbyvolcanic ashplumes and areas impacted by ash fallout. This is the case of the 12December plume, that was able to reach the Calabria region to the north-east, causing disruption to the local airport at Reggio Calabria.
5.2. A satellite system for monitoring purposes: advantages and limits
The Etna plumes detected by the polar satellite NOAA–AVHRR fromJuly to December 2006 have been compared in this paper with thoserecognized by means of the visible surveillance, as shown in the
Appendix. This comparison evidences the difference between the twoobservation systems. The satellite information has identified largeplumes and their extension area thanks to the wide and fast view thatsatellite permits. In the Appendix, the visible and thermal identificationof plume from orbit is shown together with data on plume extension(length and width), plume altitude and information on ash presence.
Ash identification has been possible by applying the BTDmethod in asystematic way to the AVHRR image data over the Mt. Etna region. Thismethod produces identification of volcanic ash clouds during almost the
144 D. Andronico et al. / Journal of Volcanology and Geothermal Research 180 (2009) 135–147
entire data set analyzed in 2006whenmeteorological cloudswere absent.The identification is confirmed by traditional volcanological observationsand field sampling. With respect to our plume classes, the BTD methodshows that the lower the assigned class numerical ranking, the morenegative are the BTD values, except for class 1.We found that for classes 2and 3 the BTD threshold is −1, thus the sporadic ash emission identifiedusing AVHRR corresponded well to what was observed on the ground.Conversely, classes 4 and5 are typically associatedwith aBTD threshold of−0.2. Therefore, different classes occur under different atmosphericconditions, from summer to winter, suggesting that the threshold isrelated to local atmospheric conditions, mostly influenced by the watervapor variability (Pieri et al., 2002; Yu et al., 2002). Moreover, negativevalues can produce ambiguous cases in volcanic ash identifications whenmeteorological clouds are present (Prata and Grant, 2001). Our dataanalysis also indicates that somemeteorological clouds have negative BTDvalues, especially in the winter. The ice presence in the meteorologicalclouds gives similar values to volcanic clouds (Simpson et al., 2000; Prataet al., 2001). It shouldbenoted that high atmosphericwater vapor and lowash concentration affect theBTDmethod inyieldingpositive values for ashplumes (Prata et al., 2001), as occurred for the 9 November 2006 ashemission.Wementioned also that pixels containing barren or vegetation-poor land can give negative BTD values. In the elaboration of the wholeimages of Sicily these pixels are easily identifiable and excluded as non-volcanic ash cloud by their shape and location impossible to be reachedbyash following the wind direction. A different technique (Pergola et al.,2004), based on the BTDmethod combined with AVHRR historical series,allows the possibility of better differentiating the presence of volcanic ash,thus reducing somewhat the number of ambiguous cases, even though anumber of common problems still remain unsolved for an automatic ashdetection scheme (Filizzola et al., 2007).
Our detailed examination of thefive defined classes has shown that atpresent satellite detection schemes have limits in recognizing theformation of eruptive clouds. The main limit is the sparse repetitiontime of polar satellites, which may not allow the detection of sporadic orshort duration plumes. For example, most plumes of class 2 (ephemeralplumes) were not observed in time. To overcome this limitation, morefrequent satellite observations are required. To this end, the use of thegeostationary satellite MSG-SEVIRI (Meteosat Second Generation-Spin-ningEnhancedVisible and Infrared Imager)would improve the frequencyof observation (every 15 min, for instance), but the SEVIRI spatialresolution of 3 km limits the detection of volcanic plumes as small as thanthose detected by AVHRR (spatial resolution of 1.1 km). The MSG-SEVIRIhas identified the eruptive plume for only a fewmajor events of class 4, asoccurred onNovember 24th (Spinetti et al., 2008). These feweventsweredetected and recorded by the Toulouse Volcanic Ash Advisory Center(http://www.meteo.fr/aeroweb/info/vaac/homepage/evaa.html).
Evengiven an ability to detect short durationvolcanic plumes, a furtherlimit is the presence of meteorological clouds that are not distinguishableby the BTD method. In these cases, most of the volcanic plumes wereidentifiedwhen they clearly extended beyond or reached a higher altitudethan the meteorological clouds, as occurred on 24 November 2006.
The rotation of the source direction of wind during the eruptiveactivitymaydistort the perception of the volume of a volcanic cloud, also.The 24 November 2006 case study shows the result of a plume lastingseveral hours in conditions of significant variations inwind direction. Theinitial visual and satellite images clearly showedanarrowplume trendingabout SE. The clockwise wind rotation also caused the rotation of theplume southward with time. In satellite images this was manifested as adisconnected eruption cloud, no longer being fed by the eruption.Satellite data revealed an ash-enriched plume apparently larger thanpreviously observed. Fig. 8 evidences that the initial, 08:22 GMT narrowplume (Fig. 8a) appeared significantly enlarged in the following hours (at13:00 and 15:14 GMT in Fig. 8b and c, respectively) because whenrotating, the wind dispersed the cloud that remained “suspended” in theair for tens of minutes to some hours before dissolving. This apparentenlargement caused the perception of a higher eruption activity from the
ground in termsof tephraproduction and related fallout. A time sequenceof satellite images would help distinguish a wider plume due to anincreasing activity rather than due to the rotation of the plume.
Finally, oneof themainpieces of data required soon aspossible duringan eruption crisis is the exact timeof the onset of the eruptive activityandtherefore the timing of the plume formation. In addition, plume spatialextent data provided by satellite observation are important as boundaryconditions for models that forecast the rate and location of plumedispersion. Information such as column height and drift directions of theplumes constitute input data for dispersal modelling in time and space.Also, an important goal for such a remote sensing system should be thequantification of the ash burdenwithin the plumes, another key issue fornumerical models. Indeed, the concentration of ash, together with thevariation of concentration away from the vent along the eruption cloud,determines the level of hazard fromtephra fallout, aswell as thepotentialhazard to aviation operations near the area affected by the eruption.
6. Conclusions
Volcanic plumes signal the intensity of eruptive activity and thus datadescribing the plume are an important component of volcanomonitoring.Satellite remote sensing is apowerful tool that providesuseful informationin this regard. It is complementary to othermonitoring techniques, which,taken together, can promptly warn of impending ash clouds and reducethe risk for aircraft. A multidisciplinary approach is required to improveour ability in tracking eruption clouds in the atmosphere, involving fieldvolcanologists together with those who analyze satellite data and whostudy dispersal models. The integration of these diverse skills will clearlycontribute to providing information and strategies to hazard responderswho are charged with the mitigation of the hazard from volcanic plumes.
This paper is a step toward the systematic use of satellite data toprovide direction, height, width and length of volcanogenic plumes innear real-time. During 2006, at Etna we had the opportunity tocompare the satellite detection efforts and the ground observation.This comparison allowed scrutinising ash plumes produced by spo-radic eruptive events, demonstrating the advantage and limits ofcombining ground and orbital observations for such events.
The five different plume categories need to be better developedquantitatively, andmayconstitute a tool to indicate the occurrence of ashwithin plumes, thereby giving a more realistic hazard assessment toauthorities, possibly decreasingor avoidingunnecessaryairport closures.
Future work will better address the comparison between satelliteand grounddata. For instance, the latter could bemademore effective byimplementing a real-time acquisition of the ash fallout in terms ofaccumulated falloutmass by developing a network of balances deployedin the field. Finally, satellite plume detection techniques should bemorepromptly integrated within the hazard response process. We feelstrongly that the synergy of the two observational approaches—groundand orbital—will markedly improve the effectiveness of mitigationresponses byboth thevolcanologyand theCivil Protection communities.
Acknowledgements
We thank the Unità Funzionale Sala Operativa for their excellentmanagementof the cameranetworkof the INGV-SezionediCatania andallthose that helped in collecting ash and providing information on tephrafallout. This work was partially supported by the FIRB B5 Italian project“Sviluppo Nuove Tecnologie per la Protezione e Difesa del Territorio daiRischi Naturali” funded by MIUR. We thank the LABTEL-CNT group forsatellite systemmaintenance, andparticular thanks toDr. J. Dean andDr. R.Skogg for providing the AVO system. Prof. D. Pieri is greatly thanked forhis thorough reviewing, especially in the editing of the paper, whichhas improved the work considerably. The authors are grateful to twoanonymous referees for their appreciation, and particularly to one of themthat provided useful suggestions and constructive comments. Finally, wesincerely thank S. Conway for his precious help in editing the paper.

145D. Andronico et al. / Journal of Volcanology and Geothermal Research 180 (2009) 135–147
Appendix
List of the Etna volcanic plumes detected by satellite NOAA–AVHRR with the relative information on plume dimensions and volcanic ashpresence together with ground observations in the period from 1 July – 31 December 2006. The “Plume classification” has been reported whenboth observative systems (from ground and from satellite) contributed to detect the type of plume. The numbers correspond to the followingclassification: 1: Degassing plumes; 2: Ephemeral plumes; 3: Long-lasting and weak intensity plumes; 4: Plumes produced by middle eruptiveintensity; 5: Long-lasting and pulsating plumes. CT = Catania; UA = urbanized areas; D. AV. = debris avalanche.
Date Time GMT(hh:mm)
Satellite plumeobserved invisible (V) and/orthermal (T)AVHRR channels
Plumedirection
Plume extensionlength–width(km–km)
Ash plume extension(km–km) or cloudssatellite observation(hh:mm)
Min-max altitudeof plume top(m a.s.l.)
Ground plumeobservation (G)and camera visibledetection (C)
Plumeclassification
19-07-2006 05:11 V SSE 36–18 Some clouds G, C 120-07-2006 04:31 V SSW–SSE 250–10 G, C 121-07-2006 06:05 V SW 180–10 G, C 121-07-2006 10:02 V SW 50–7 G, C 122-07-2006 05:39 V/T SW 230–30/10–2 3300 G, C 122-07-2006 09:36 V SW 70–3 G, C 122-07-2006 12:36 V/T SW 40–3/ 21–3 3300 G, C 123-07-2006 04:56 V S 70–15 G, C 124-07-2006 04:31 V NNE 30–5 G, C 125-07-2006 04:07 V SE 200–15 G, C 126-07-2006 05:44 V/T ESE 60–25/30–6 3300 G, C 127-07-2006 04:57 V SE–S–SE 250–25 G, C 128-07-2006 04:58 V S 50–15 G, C 129-07-2006 13:01 V SE 60–12 G, C 130-07-2006 05:23 V ESE 150–8 Clouds (05:23–11:14) G, C 130-07-2006 15:32 V SE 120–12 G, C 130-08-2006 05: 12 V ESE 70 7 G, C 101-09-2006 05:08 V SSE 90–30 G, C 102-09-2006 05:39 V SWS 50–7 G, C 103-09-2006 05:16 V SW 50–5 G, C 104-09-2006 15:15 V SSW 15–2 G, C 104-09-2006 16:14 V SW 20–2 G, C 105-09-2006 05:09 V WSW 40–10 G, C 106-09-2006 05:42 V SW 40–7 G, C 107-09-2006 05:21 V S 30–3 G, C 108-09-2006 04:57 V SE 72–5 G, C 120-09-2006 05:11 T SE 50–5 3300–3500 G, C 107-10-2006 05:06 T SE 15–2 3400–3800 G, ash plume 207-10-2006 05:19 T SE 40–4 3400–3800 G, ash plume 210/11-10-2006 22:00/22:00 S SE Clouds 9:29–20:56 G, C; fine ash in Ct12-10-2006 09:16 b1.1–b1.1 212-10-2006 20:42 b1.1–b1.1 213-10-2006 20:30 b1.1–b1.1 222-10-2006 06:00–18:00 Clouds 8:47–20:13 C; plume formation;
discontinuousash emission
23-10-2006 20:00 b1.1–b1.124-10-2006 05:00 T 3.3–3.3 3.3–3.3 3500–390025-10-2006 08:29 Clouds 04:34–16:00 G, C: observation
of plume in summitarea
25-10-2006 21:12 T SE 27–5 3300–360026-10-2006 04:10 b1.1–b1.1 G, C 326-10-2006 09:31 V NW 3–1 330027-10-2006 20:49 b1.1–b1.128-10-2006 05.04 b1.1–b1.128-10-2006 09.10 b1.1–b1.129-10-2006 08.57 b1.1–b1.129-10-2006 15:00–15:30 S SE Clouds 12:25–21:14 G, C; ash fallout in CT 229-10-2006 16:04 T S SE 42–3 3300 Some clouds 230-10-2006 04.11 b1.1–b1.1 Clouds 8:44–15:3030-10-2006 15:31 b1.1–b1.1 Some clouds30-10-2006 20:10 b1.1–b1.131-10-2006 00:38 b1.1–b1.131-10-2006 03:47 b1.1–b1.131-10-2006 11:45–12:15 S SE G, C; ash fallout in CT 231-10-2006 12:05 b1.1–b1.105/06-11-2006 20:00/05:00 E Clouds 20:33–12:44 G, C; ash fallout in UA 206-11-2006 15:58 b1.1–b1.107-11-2006 04:14 b1.1–b1.108/09-11-2006 12:00/08:00 NW G, C; ash fallout in UA 208-11-2006 15:09 b1.1–b1.1 C; clouds 308-11-2006 19:54 T 4–1 4–1 3300 C; clouds 3
(continued on next page)
(continued)
Date Time GMT(hh:mm)
Satellite plumeobserved invisible (V) and/orthermal (T)AVHRR channels
Plumedirection
Plume extensionlength–width(km–km)
Ash plume extension(km–km) or cloudssatellite observation(hh:mm)
Min-max altitudeof plume top(m a.s.l.)
Ground plumeobservation (G)and camera visibledetection (C)
Plumeclassification
09-11-2006 00:46 b1.1–b1.1 C; clouds 309-11-2006 05:04 T E NW 31–9 3300 C; clouds 311-11-2006 09:29 T N 3–1 3–111-11-2006 11:52 b1.1–b1.116-11-2006 05:10–20:00 Clouds 10:06–15:12 G, C; D. AV. 316-11-2006 8:26 T NE 6–4 6–4 3400–4300 316-11-2006 19:51 T NE 7–5 7–5 3300–3900 319-11-2006 04:00–14:00 Clouds 00:44–20:53 G, C21-11-2006 12:00–00:00 Clouds 09:21–16:59 G, C; storm rain, clouds 421-11-2006 20:27 T E NE 45–5 4300–4500 G, C 421-11-2006 20:54 T E NE 65–5 4000–4300 G, C 422-11-2006 00:13 T E NE 15–9 Some clouds 3300 G 424-11-2006 08:22 V/T SE 238–12 18–3 4300–4500 G, C 424-11-2006 10:02 V/T SE 300–18 45–5 4900–5400 G, C 424-11-2006 11:20 V/T SE 338–22 83–16 4900–5400 G, C 424-11-2006 13:01 V/T SE 224–54 54–30 4700–4900 G, C 424-11-2006 15:14 T S 275–82 18–2 some clouds 4300–4500 G, C 425-11-2006 05:08 T SE 28–3 3300–3700 G, C 325-11-2006 05:41 T SE 28–3 3300–3700 G, C 326-11-2006 01:12 T S SW 30–2 30–2 3600–420026-11-2006 04:43 T S 15–2 15–2 3600–420026-11-2006 05:17 T S 28–2 28–2 3600–4200 G 326-11-2006 16:35 T SW 8–2 8–2; clouds 01:02–20:18 3600–4200 G, C; storm rain 327/28-11-2006 10:00/04:00 Clouds 01:02–20:18 G29-11-2006 14:51 T SW 15–2 Some clouds 15–2 3300–5000 G, C 529-11-2006 21:09 T SW 10–2 Some clouds 88–5 3300–5000 G, C 530-11-2006 00:31 T W SW 13–2 Some clouds 60–4 3300–3900 G, C 530-11-2006 05:22 T W SW 11–2 Clouds 08:45–16:44 3300–3900 G, C 530-11-2006 20:10 T W 33–5 Some clouds 33–5 3800–4400 G, C; ash fallout in UA 501-12-2006 00:21 T W SW 37–15 42–50 4200–4300 G, C 501-12-2006 04:21 T SW 20–4 62–14 3300–3900 G, C 501-12-2006 04:58 T SW 9–2 59–16 3300–3900 G, C 503-12-2006 05:50 T E SE 75–15 8–2 G, C 503-12-2006 13:09 V/T E SE 90–7 30–3 Some clouds 3300–3700 G, C 503-12-2006 14:52 T E SE 20–2 3300–3700 G, C 503-12-2006 16:32 T E SE 15–2 3300–3700 G, C 504-12-2006 16:07 T SE 75–4 10–4 clouds 05:27–16:07 3300 G, C 504-12-2006 16:50 T SE 45–4 12–2 3300 G, C 504-12-2006 19:23 T SE 3300 G, C 505-12-2006 01:20 T SE 3300 G, C 505-12-2006 09:20 T S SE 3300 G, C; clouds 505/06-12-2006 22:00/11:00 G, C 506-12-2006 05:37 T SE 20–2 Clouds 15:17–21:48 3600–4600 G, C 506-12-2006 09:07 V/T SE 190–24 16–3 G, C 512/14-12-2006 01:00/14:00 Clouds G, C; clouds 512-12-2006 21:09 T NW 65–2 3300–3600 G, C 5
Appendix (continued)
146 D. Andronico et al. / Journal of Volcanology and Geothermal Research 180 (2009) 135–147
References
Allard, P., Carbonelle, J., Dajlevic, D., Le Bronec, J., Morel, P., Robe, M.C., Maurenas, J.M.,Pierret, R.F., Martins, D., Sabroux, J.C., Zettwoog, P., 1991. Eruptive and diffuseemission of CO2 from Mount Etna. Nature 351, 387–389.
Alparone, S., Andronico, D., Lodato, L., Sgroi, T., 2003. Relationship between tremor andvolcanic activity during the Southeast Crater eruption onMount Etna in early 2000.J. Geophys. Res. 108 (B5), 2241. doi:10.1029/2002JB001866.
Alparone, S., Andronico, D., Sgroi, T., Ferrari, F., Lodato, L., Reitano, D., 2007. Alert system tomitigate tephra fallout hazards at Mt. Etna Volcano, Italy. Nat. Hazards 43, 333–350.
Andò, B., Pecora, E., 2006. An advanced video-based system for monitoring activevolcanoes. Comput. Geosci. 32 (1), 85–91.
Andronico, D., Scollo, S., 2006. Attività esplosiva al Cratere di SE - 8 novembre. Internalreport at http://www.ct.ingv.it/Report/WKRVGCEN20061108.pdf.
Andronico, D., Cristaldi, A., Del Carlo, P., Taddeucci, J., 2003. Monitoring the ashes fromthe 2002–2003 flank eruption of Mount Etna (Italy). EAE03-A-06783, EGS-AGU-EUG Joint Assembly abstract.
Andronico, D., Branca, S., Calvari, S., Burton, M.R., Caltabiano, T., Corsaro, R.A., Del Carlo,P., Garfì, G., Lodato, L., Miraglia, L., Murè, F., Neri, M., Pecora, E., Pompilio, M.,Salerno, G., Spampinato, L., 2005. A multi-disciplinary study of the 2002–03 Etnaeruption: insights for a complex plumbing system. Bull. Volcanol. 67, 314–330.
Andronico, D., Cristaldi, A., Lo Castro, D., Scollo, S., Taddeucci, J., 2007a. The 24November 2006 paroxysm at south-east crater, Mt. Etna. Proceedings of the XXIVGeneral Assembly of the IUGG, Perugia July 2–13, 2007.
Andronico, D., Spinetti, C., Cristaldi, A., Buongiorno, M.F., 2007b. Mt. Etna ash plumeduring 2006 eruptions: integrated approach from satellite remote sensing andground-based monitoring system. EGU2007-A-09585 Session GMPV7, EGU Con-ference abstract.
Andronico, D., Scollo, S., Cristaldi, A., Caruso, S., 2008. The 2002–03 Etna explosiveactivity: tephra dispersal and features of the deposit. J. Geophys. Res. 113 (B04209).doi:10.1029/2007JB005126.
Andronico, D., Scollo, S., Cristaldi, A., Ferrari, F., 2009. Monitoring the ash emissionepisodes at Mt. Etna: the 16 November 2006 case study. J. Volcanol. Geotherm. Res.180, 123–134 (this issue). doi:10.1016/j.jvolgeores.2008.10.019.
Branca, S., Consoli, S., 2006. Rapporto eruzione Etna (15 Luglio 2006, aggiornamento ore05:00 locali). Internal report at http://www.ct.ingv.it/Report/WKRVG20060715.pdf.
Branca, S., Polacci, M., 2006. Aggiornamento attività eruttiva dell'Etna (04 Ottobre2006, ore 14:00 locali). Internal report at http://www.ct.ingv.it/Report/WKRVGREP20061004_1400.pdf.
Bruno, N., Caltabiano, T., Giammanco, S., Romano, R., 2001. Degassing of SO2 and CO2 atMount Etna (Sicily) as indicator of pre-eruptive ascent and shallow emplacement ofmagma. J. Volcanol. Geotherm. Res. 110, 137–153.
Volcanic ash and aviation safety. In: Casadevall, T.J. (Ed.), Proceedings of the FirstInternational Symposium on Volcanic Ash and Aviation Safety. U.S. GeologicalSurvey Bulletin, vol. 2047, p. 450.
Calvari, S., 2006a. Comunicato Etna del 26 ottobre 2006 aggiornamento alle ore 10:00.Internal report at http://www.ct.ingv.it/Report/20061026-1000.pdf.
Calvari, S., 2006b. Aggiornamento attività Etna (16 novembre 2006, ore 10:30 locali).Internal report at http://www.ct.ingv.it/Report/20061116-1030web.pdf.

147D. Andronico et al. / Journal of Volcanology and Geothermal Research 180 (2009) 135–147
Calvari, S., Lodato, L., 2006. Aggiornamento dell'attività eruttiva dell'Etna al 5 settembre2006 - ore 9:30. Internal report n° UFVG2006/103 at http://www.ct.ingv.it/Report/20060905-0930.pdf.
Coltelli, M., 2006. Aggiornamento attività Etna (28 ottobre 2006, ore 17:00 locali).Internal report at http://www.ct.ingv.it/Report/WKRVG20061028-1.pdf.
Cristaldi, A., Scollo, S., 2006. Rapporto sull'emissione di cenere all'Etna nei giorni 29 e 31ottobre 2006. Internal report n. UFVG2006/128 at http://www.ct.ingv.it/Report/rptvgcenere20061102.pdf.
FAA (U.S.A.) Aviation Weather Directorate, 2001. User Needs Analysis Document:Volcanic Activity. Version 1.0, 5 Sept 2001.
Filizzola, C., Lacava, T., Marchese, F., Pergola, N., Scaffidi, I., Tramutoli, V., 2007. AssessingRAT (Robust AVHRR Techniques) performances for volcanic ash cloud detection andmonitoring in near real-time: the 2002 eruption of Mt. Etna (Italy). Rem. Sens.Environ. 107, 440–454.
Francis, P., Rothery, D., 2000. Remote Sensing of active volcanoes. Annu. Rev. EarthPlanet. Sci. 28, 81–106. doi:10.1146/annurev.earth.28.1.81.
Gary, D., 2007. History of the NOAA satellite program. J. Appl. Rem. Sens. 1, (012504).Hufford, G.L., Salinas, L.J., Simpson, J.J., Barske, E.G., Pieri, D.C., 2000. Operational
implications or airborne volcanic ash. Bull. Amer. Meteor. Soc. 81 (4), 745–755.Haulet, R., Zettwoog, P., Sabroux, P.C., 1977. Sulphur dioxide discharge fromMount Etna.
Nature. 268, 715–717.Holasek, R.E., Self, S., Woods, A.W., 1996. Satellite observations and interpretation of the
1991 Mount Pinatubo eruption plumes. J. Geophys. Res. 101, 27635–27665.ICAO, 2004. International civil aviation organisation international handbook on the
International Airways Volcano Watch (IAVW)—operational procedures and contactlist, ICAO Document 9766-AN/968, Second ed.
INGV-STAFF, Sezione di Catania, 2001. Multidisciplinary approach yields insight intoMt.Etna 2001 eruption. EOS Trans. AGU 82 (52), 653–656.
Matsushima, N., Shinohara, H., 2006. Visible and invisible plumes. Geophys. Res. Lett.33, L24309. doi:10.1029/2006GL026506.
Miller, T.P., Casadevall, T.J., 2000. Volcanic ash hazards to aviation. In: Sigurdsson, H. (Ed.),Encyclopedia of Volcanoes. Academic Press, San Diego, California, USA, pp. 915–930.
NOAA, 2000. NOAA KLM User's Guide. Available at http://www2.ncdc.noaa.gov/docs/intro.htm.
Norini, G., De Beni, E., Andronico, D., Polacci, M., Burton, M., Zucca, F., 2008. The 16November 2006 flank collapse of South-East Crater at Mount Etna, Italy: study ofthe deposit and hazard assessment. J. Geophys. Res., in revision.
Pergola, N., Tramutoli, V., Marchese, F., Scaffidi, I., Lacava, T., 2004. Improving volcanicash cloud detection by a robust satellite technique. Rem. Sens. Environ. 90, 1–22.
Pieri, D., Ma, C., Simpson, J.J., Hufford, G., Grindle, T., Grove, C., 2002. Analyses of in-situairborne volcanic ash from the February 2000 eruption of Hekla Volcano, Iceland.Geophys. Res. Lett. 29, 19–1–19-4.
Prata, A.J., 1989a. Observations of volcanic ash clouds in the 10–12 µm window usingAVHRR/2 data. Int. J. Rem. Sens. 10 (4–5), 751–761.
Prata, A.J., 1989b. Infrared Radiative transfer calculations for volcanic ash clouds.Geophys. Res. Lett. 16 (11), 1293–1296.
Prata, A.J., Grant, I.F., 2001. Determination of mass loadings and plume 1 heights ofvolcanic ash clouds from satellite data. CSIRO Atmosph. Res. Tech. Pap. 48,Commonw. Sci. and Ind. res. Organ., Melbourne, Victoria, Australia, p. 39.
Prata, A.J., Bluth, G.J.S., Rose, W.I., Schneider, D.J., Tupper, A.C., 2001. Comments on“Failures in detecting volcanic ash from a satellite-based technique. Rem. Sens.Environ. 78, 341–346.
Schneider, D.J., Rose, W.I., Kelley, L., 1995. Tracking of 1992 eruption clouds from CraterPeak of Mount Spurr Volcano, Alaska, using AVHRR. U. S. Geol. Surv. Bull. (SpurrEruption, edited by T. Keith), vol. 2139, pp. 27–36.
Scollo, S., Del Carlo, P., Coltelli,M., 2007. Tephra falloutof 2001Etnaflankeruption:Analysisof the deposit and plume dispersion. J. Volcanol. Geotherm. Res. 160, 147–164.
Self, S., Holasek, R.E., 1995. GOES weather satellite observations and measurements ofthe May 18, 1980, Mount St. Helens eruption. J. Geophys Res. 100 (B5), 8469–8488.
Simpson, J.J., Hufford, G., Pieri, D., Berg, J.S., 2000. Failures in detecting volcanic ash froma satellite-based technique. Remote Sens. Environ. 72, 191–217.
Simpson, J.J., Hufford, G., Pieri, D., Berg, J.S., 2001. Response to “Comments of Failures indetecting volcanic ash from a satellite-based technique. Remote Sens. Environ. 78,347–357.
Simpson, J.J., Hufford, G., Pieri, D., Servranckx, R., Berg, J., Bauer, C., 2002. The February2001 eruption of Mount Cleveland, Alaska: case study of an aviation hazard.Weather Forecast 17, 691–704.
Sparks, R.S.J., Bursik, M., Carey, S., Gilbert, J., Glaze, L., Sigurdsson, H., Woods, A.W., 1997.Volcanic Plume. John Wiley & Sons, Inc., Chichester, England, p. 574.
Spinetti, C., Buongiorno, M.F., Lombardo, V., Merucci, L., 2003. Retrieval aerosol opticalthickness of volcanic plumes by means of the airborne Multispectral ImageSpectrometer (MIVIS): a case study from Mt. Etna Sicily, June 1997. Ann. Geophys.6 (2), 439–449.
Spinetti, C., Buongiorno, M.F., 2007. Volcanic Aerosol optical characteristics of Mt. Etnatropospheric plume retrieved by means of airborne multispectral images. J. Atm.Sol. Ter. Phys. 69 (9), 981–994. doi:10.1016/j.jastp.2007.03.014.
Spinetti, C., Andronico, D., Taddeucci, J., Cristaldi, A., Buongiorno, M.F., 2007. Ash plumesat MT. Etna during the 2006 eruption: observations from satellite to microscope.Paper presented at the IUGG Conference, Session VS015.
Spinetti, C., Corradini, S., Merucci, L., Silvestri, M., Musacchio, M., Buongiorno, M.F.,2008. Volcanic ash plume at Mt. Etna using polar and geostationary satellite data:the 24 November 2006 eruption event. Paper presented at the IAVCEI Conference,Session VS015.
Tupper, A., Kinoshita, K., Kanagaki, C., Iino, N., Kamada, Y., 2003. Observations ofvolcanic cloud heights and ash–atmosphere interactions. Proc of WMO/ICAO ThirdInternational Workshop on Volcanic Ash, Toulouse, France, September 29–October3, 2003.
Tupper, A., Carn, S., Davey, J., Kamada, Y., Potts, R., Prata, F., 2004. An evaluation ofvolcanic cloud detection techniques during recent significant eruption in thewestern ‘Ring of Fire’. Remote Sens. Environ. 91, 27–46.
Tupper, A., Davey, J., Stewart, P., Stunder, B., Servranckx, R., Prata, F., 2006. Aircraftencounters with volcanic clouds over Micronesia, Oceania, 2002–03. Aust.Meteorol. Mag. 55, 289–299.
Young, T.L., 2006. TeraScan 0.46 m/0.61m/1.2m/1.5m Polar Satellite Tracking AntennaO&M Manual. Seaspace, January 2006.
Yu, T., Rose, W., Prata, A.J., 2002. Atmospheric correction for satellite-based volcanicash mapping and retrievals using “split window” IR data from GOES and AVHRR.J. Geophys Res. 107 (16). doi:10.1029/2001JD000706.
Wen, S., Rose, W.I., 1994. Retrieval of sizes and total masses of particles in volcanicclouds using AVHRR bands 4 and 5. J. Geophys. Res. 99 (D3), 5421–5431.