Estimation of PAR over Northern China from Daily NOAA AVHRR Cloud Cover Classifications
10
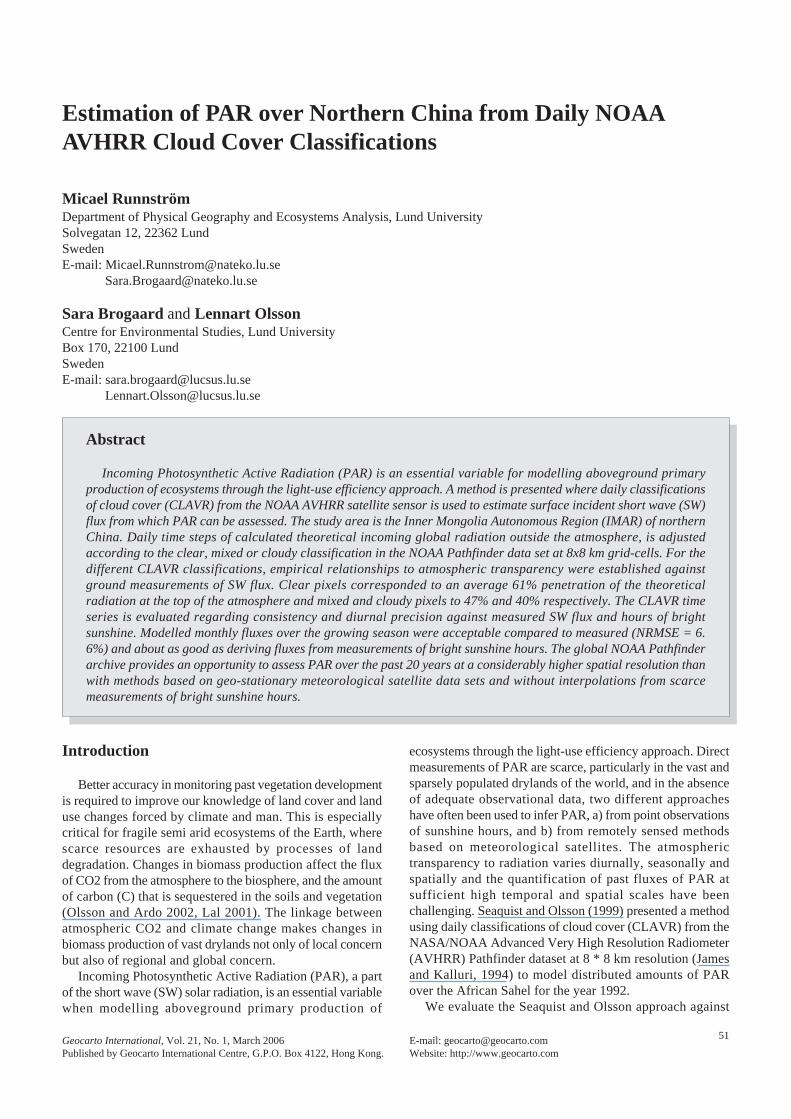
51 Geocarto International, Vol. 21, No. 1, March 2006 E-mail: [email protected] Published by Geocarto International Centre, G.P.O. Box 4122, Hong Kong. Website: http://www.geocarto.com Introduction Better accuracy in monitoring past vegetation development is required to improve our knowledge of land cover and land use changes forced by climate and man. This is especially critical for fragile semi arid ecosystems of the Earth, where scarce resources are exhausted by processes of land degradation. Changes in biomass production affect the flux of CO2 from the atmosphere to the biosphere, and the amount of carbon (C) that is sequestered in the soils and vegetation (Olsson and Ardo 2002, Lal 2001). The linkage between atmospheric CO2 and climate change makes changes in biomass production of vast drylands not only of local concern but also of regional and global concern. Incoming Photosynthetic Active Radiation (PAR), a part of the short wave (SW) solar radiation, is an essential variable when modelling aboveground primary production of ecosystems through the light-use efficiency approach. Direct measurements of PAR are scarce, particularly in the vast and sparsely populated drylands of the world, and in the absence of adequate observational data, two different approaches have often been used to infer PAR, a) from point observations of sunshine hours, and b) from remotely sensed methods based on meteorological satellites. The atmospheric transparency to radiation varies diurnally, seasonally and spatially and the quantification of past fluxes of PAR at sufficient high temporal and spatial scales have been challenging. Seaquist and Olsson (1999) presented a method using daily classifications of cloud cover (CLAVR) from the NASA/NOAA Advanced Very High Resolution Radiometer (AVHRR) Pathfinder dataset at 8 * 8 km resolution (James and Kalluri, 1994) to model distributed amounts of PAR over the African Sahel for the year 1992. We evaluate the Seaquist and Olsson approach against Estimation of PAR over Northern China from Daily NOAA AVHRR Cloud Cover Classifications Micael Runnström Department of Physical Geography and Ecosystems Analysis, Lund University Solvegatan 12, 22362 Lund Sweden E-mail: [email protected] [email protected] Sara Brogaard and Lennart Olsson Centre for Environmental Studies, Lund University Box 170, 22100 Lund Sweden E-mail: [email protected] [email protected] Abstract Incoming Photosynthetic Active Radiation (PAR) is an essential variable for modelling aboveground primary production of ecosystems through the light-use efficiency approach. A method is presented where daily classifications of cloud cover (CLAVR) from the NOAA AVHRR satellite sensor is used to estimate surface incident short wave (SW) flux from which PAR can be assessed. The study area is the Inner Mongolia Autonomous Region (IMAR) of northern China. Daily time steps of calculated theoretical incoming global radiation outside the atmosphere, is adjusted according to the clear, mixed or cloudy classification in the NOAA Pathfinder data set at 8x8 km grid-cells. For the different CLAVR classifications, empirical relationships to atmospheric transparency were established against ground measurements of SW flux. Clear pixels corresponded to an average 61% penetration of the theoretical radiation at the top of the atmosphere and mixed and cloudy pixels to 47% and 40% respectively. The CLAVR time series is evaluated regarding consistency and diurnal precision against measured SW flux and hours of bright sunshine. Modelled monthly fluxes over the growing season were acceptable compared to measured (NRMSE = 6. 6%) and about as good as deriving fluxes from measurements of bright sunshine hours. The global NOAA Pathfinder archive provides an opportunity to assess PAR over the past 20 years at a considerably higher spatial resolution than with methods based on geo-stationary meteorological satellite data sets and without interpolations from scarce measurements of bright sunshine hours.
-
Upload
independent -
Category
Documents
-
view
1 -
download
0
Transcript of Estimation of PAR over Northern China from Daily NOAA AVHRR Cloud Cover Classifications
51Geocarto International, Vol. 21, No. 1, March 2006 E-mail: [email protected] by Geocarto International Centre, G.P.O. Box 4122, Hong Kong. Website: http://www.geocarto.com
Introduction
Better accuracy in monitoring past vegetation developmentis required to improve our knowledge of land cover and landuse changes forced by climate and man. This is especiallycritical for fragile semi arid ecosystems of the Earth, wherescarce resources are exhausted by processes of landdegradation. Changes in biomass production affect the fluxof CO2 from the atmosphere to the biosphere, and the amountof carbon (C) that is sequestered in the soils and vegetation(Olsson and Ardo 2002, Lal 2001). The linkage betweenatmospheric CO2 and climate change makes changes inbiomass production of vast drylands not only of local concernbut also of regional and global concern.
Incoming Photosynthetic Active Radiation (PAR), a partof the short wave (SW) solar radiation, is an essential variablewhen modelling aboveground primary production of
ecosystems through the light-use efficiency approach. Directmeasurements of PAR are scarce, particularly in the vast andsparsely populated drylands of the world, and in the absenceof adequate observational data, two different approacheshave often been used to infer PAR, a) from point observationsof sunshine hours, and b) from remotely sensed methodsbased on meteorological satellites. The atmospherictransparency to radiation varies diurnally, seasonally andspatially and the quantification of past fluxes of PAR atsufficient high temporal and spatial scales have beenchallenging. Seaquist and Olsson (1999) presented a methodusing daily classifications of cloud cover (CLAVR) from theNASA/NOAA Advanced Very High Resolution Radiometer(AVHRR) Pathfinder dataset at 8 * 8 km resolution (Jamesand Kalluri, 1994) to model distributed amounts of PARover the African Sahel for the year 1992.
We evaluate the Seaquist and Olsson approach against
Estimation of PAR over Northern China from Daily NOAAAVHRR Cloud Cover Classifications
Micael RunnströmDepartment of Physical Geography and Ecosystems Analysis, Lund UniversitySolvegatan 12, 22362 LundSwedenE-mail: [email protected]
Sara Brogaard and Lennart OlssonCentre for Environmental Studies, Lund UniversityBox 170, 22100 LundSwedenE-mail: [email protected]
Abstract
Incoming Photosynthetic Active Radiation (PAR) is an essential variable for modelling aboveground primaryproduction of ecosystems through the light-use efficiency approach. A method is presented where daily classificationsof cloud cover (CLAVR) from the NOAA AVHRR satellite sensor is used to estimate surface incident short wave (SW)flux from which PAR can be assessed. The study area is the Inner Mongolia Autonomous Region (IMAR) of northernChina. Daily time steps of calculated theoretical incoming global radiation outside the atmosphere, is adjustedaccording to the clear, mixed or cloudy classification in the NOAA Pathfinder data set at 8x8 km grid-cells. For thedifferent CLAVR classifications, empirical relationships to atmospheric transparency were established againstground measurements of SW flux. Clear pixels corresponded to an average 61% penetration of the theoreticalradiation at the top of the atmosphere and mixed and cloudy pixels to 47% and 40% respectively. The CLAVR timeseries is evaluated regarding consistency and diurnal precision against measured SW flux and hours of brightsunshine. Modelled monthly fluxes over the growing season were acceptable compared to measured (NRMSE = 6.6%) and about as good as deriving fluxes from measurements of bright sunshine hours. The global NOAA Pathfinderarchive provides an opportunity to assess PAR over the past 20 years at a considerably higher spatial resolution thanwith methods based on geo-stationary meteorological satellite data sets and without interpolations from scarcemeasurements of bright sunshine hours.

52
measured time series of short wave (SW) flux and hours ofbright sunshine over northern China, aiming to:i) Evaluate the consistency, precision and bias of the
CLAVR classifications.ii) Establish empirical coefficients for the daily CLAVR
classifications clear, mixed and cloudy, against therelationship between the theoretical amount of globalradiation at the top of the atmosphere and groundmeasurements of SW flux.
iii) Model an 18-year time series of PAR at 64 km2 grid cellsfor Northern China
BackgroundThe flux of PAR reaching the biomes of the Earth is the
primary driving force of photosynthesis and biologicalproduction. The theoretical amount of global radiation (GR)impinging a horizontal plane at the top of the atmospherevaries over the year with day-length, solar-zenith angle andSun-Earth distance, and can be calculated through generaltrigonometric formulas (see below). PAR can be estimatedas a 48% fraction of the GR (Frouin and Pinker, 1995)Through the atmosphere, the solar rays are affected by fivetypes of radiation-damping processes; Rayleigh scattering,aerosol and cloud extinction, ozone absorption, water vapourabsorption, and permanent gas absorption (Yang et al., 2001).On daily level, cloudiness has a significant influence on theamount of radiation that reaches the Earth surface.
The light-use efficiency (LUE) approach (Eq. 1) uses theamount of absorbed photosynthetically active radiation(APAR) and a photosynthetic efficiency factor (ε) thatconsider water accessibility, vegetation type, temperature,nutrients etc to estimate gross primary production (GPP)(Seaquist et al. 2003, Nouvellon et al. 2000, Rasmussen1998a and b, Paruelo et al. 1997 Pinker et al. 1995, Law andWarring 1994, Ruimy and Saugier 1994, Monteith 1977,1972). APAR may be estimated through the fraction ofabsorbed PAR (FPAR) in relation to the available PAR (Eq.2), by scaling a Normalized Difference Vegetation Index(NDVI) linearly between 0% absorption of PAR for baresoil NDVI signals and maximum absorption (~ 100%),determined by the vegetation peak NDVI for irrigated areas(Eq. 3) (Brogaard et al. 2005, Seaquist et al. 2003, Princeand Goward 1995, Goward and Huemmerich 1992).
GPP = ε * APAR Eq. 1
APAR = PAR*FPAR Eq. 2
FPAR = (a*NDVI+b) Eq. 3
where:GPP = Gross Primary Production accumulated over a given
time interval (g/m2)ε = photosynthetic efficiency (g/MJ)APAR = Absorbed Photosynthetic Active Radiation (MJ/m2)PAR = incident flux of Photosynthetic Active Radiation
(MJ/m2)FPAR = the Fraction of absorbed PAR (unitless)
NDVI = the Normalized Difference Vegetation Index(unitless)
a and b = scaling constants.Methods based on top-of-atmosphere solar radiance
measured from meteorological satellites are powerful toolsfor generating global estimates of PAR (Frouin and Pinker1995). A global dataset exists, compiled by NASA (Zhangand Rossow 2002) and spanning the period 1983-2001,where short-wave (SW) radiation reaching the Earth surfacehas been calculated using i) top-of-atmosphere radiation, ii)a complete radiative transfer model and iii) clouds based onthe International Satellite Cloud Climatology Project (ISCCP)dataset. Data were obtained every three hours on a 280 km(2.5 degree) global grid with a 10-20 W/m2 bias and with arms scatter of 10-15 W/m2 for SW down welling radiation(Rossow and Zhang 1995). The main shortcoming of thisapproach is the coarse spatial resolution. For use in highresolution (typically 1-10 km grid size) vegetation modelling,the 280 km grid is often too coarse.
Seaquist and Olsson (1999) used the CLAVR data set andregional Ångström coefficients to adjust calculations of dailyGR on a pixel-by-pixel basis according to the cloud coverclassifications for the single year of 1992 over the Sahel.Ångström coefficients have been computed for many differentsites and are available as global annual mean values, as wellas monthly values for different regions (e.g. Tiba 2001,Suehrcke, 2000, Hoyningen-Huene et al., 1999, Sahin andSen 1998), and the Ångström formula (Ångström 1924,Prescott 1940, Martinez-Lozano et al., 1984), computes adirect and indirect light coefficient based on hours of brightsunshine. Seaquist and Olsson (1999) used the directcoefficient for clear classifications of the CLAVR data set,and the indirect coefficient for cloudy classifications, and astatistical mixture of these two to represent mixed conditions.Errors computed for accumulated monthly PAR values weresatisfactory. No evaluation was presented, however, justifyingthe use of Ångström coefficients that assume that the CLAVRclassification from the single instantaneous afternoonoverpass could represent diurnal cloud conditions, andfurthermore the consistency of the entire time series of datawas not tested.
The CLAVR data set
The NOAA/NASA Pathfinder AVHRR Land (PAL) dataset contains globally distributed observations of the Earthsince mid 1981 at 8x8 km grid-cell resolution, consistentlycorrected geometrically and radiometrically (James andKalluri, 1994). A variety of products are available at daily/10-day/monthly time intervals, e.g. multi-spectral radiances,NDVI, sea-surface temperature etc. An experimental productavailable is the layer of CLAVR classifications from theAVHRR sensor, with global coverage at daily level frommid 1981 through 1999. The CLAVR classifications aredetermined through a series of sequential decision-tree typetests by the five-channel multi-spectral information.

53
Depending on the path through the classification scheme,each pixel is assigned a value between one and thirty, andthen grouped into a cloudy, mixed or clear sky condition at4x4 km resolution. Should, in a 2x2 pixel window, one, twoor three pixels of the four be sensed as cloudy, the four pixelsare re-classed into one 8x8 km pixel receiving a mixedcloudiness label. Otherwise, the pixel is assigned to a clearor cloudy class (Stowe et al. 1995, SMSRC 1994). The cloudcover estimates are restricted to a single daytime overpass,sun synchronically at around 14:00, with some delay in timedue to orbital drift (McGregor and Gorman, 1994).
Stowe et al. (1995 and 1999) concluded, after evaluatingthe CLAVR-1 data set in different combinations of land,ocean, winter and summer conditions and for different partsof the world, that the classification tends to overestimatecloud cover when clouds are small and underestimate themwhen they are large. The overall judgment was however,that the algorithm satisfies the objective of real-timeclassification of the 2x2 pixel arrays into cloudy, mixed andclear. One of the problems identified with the universalCLAVR-1 classification scheme is that the two types ofpixel array classifications, “restored - clear” (uncertain clearpixels due to ocean sun glint, bright and hot land, or snow/ice covered surfaces) and the mixed pixel category may bemis-classified. Vemury et al. (2001) developed the CLAVR-3 algorithm to re-examine these two categories at theindividual pixel level by applying dynamic cloud/no-cloudthresholds that are dependent on viewing angle, surface typeand latitude. The CLAVR-3 algorithm resulted in a 75 %increase in the clear pixel category, globally implying that17.8 % of all uncertain pixels from this day were reclassifiedas clear. According to James McManus at GES DAAC(Goddard Space Flight Center Earth Sciences DistributedActive Archive Center, personal communication) theCLAVR-3 algorithm is presently being tested and, ifimplemented, could improve the quality of the CLAVR dataset further. In this study, however, only CLAVR-1 data thatare globally available have been used.
Site descriptionThe Inner Mongolia Autonomous Region (IMAR)
occupies a major part of China’s north and northeast andthree tiles of NOAA CLAVR data, each 125x125 pixels,covered the IMAR area (figure 1). A major part of the IMARlies in the arid and semi-arid climate zone where annualprecipitation is less than 500 mm and erratic. Naturalresources are unevenly distributed and land cover variesfrom relatively high vegetation cover in good qualitygrasslands or irrigated fields to less vegetated or even baresand dunes in other areas. The dominant land use ispastoralism, but in the agro-pastoral transition zone,cultivation is common. High rates of desertification havebeen reported for parts of this region and the main cause hasbeen recognized as a combination of excessive land use,frequent drought-years and forceful winds in the dry season(e.g. Sun and Yu, 1996; Sheehy, 1992; Zhu et al., 1986). Theclimate of IMAR is continental and experience very cold
and dry winters and warm summers with a marked rainyseason due to the summer monsoon. Two climate stations,from which daily data were available, are both located withinthe semi arid region where about 75 % of the annualprecipitation falls between May and August. Tongliao situatedin the east part of the IMAR (N43.6º; E122.3º, 178 m asl)and receives an annual average of 398 mm of precipitationcompared to 344 mm measured at a research station inWushen County in the drier west (N38.6º; E108.8º, 1268 masl). The location of the two stations is indicated in Figure 1together with a third evaluation site near Beijing at N40.01º,E116.8º. The additional site, Beijing was added to evaluatehow the CLAVR classifications deviated regarding frequencyand time-stability in a more densely vegetated region thatproduce higher rates of evapotranspiration than the drierTongliao and Wushen sites.
Methodology
Calculating theoretical solar irradiance and day lengthSolar irradiance received at the top of the atmosphere can
be calculated using a series of trigonometric formulas andthe ones presented in this section were described by Monteithand Unsworth (1990), Haxeltine (1996) and Seaquist andOlsson (1999).
At mean distance to the Sun and under average solar andcosmic conditions, the irradiance of a surface at the top ofthe Earth atmosphere, perpendicular to the solar beam, isknown as the Solar Constant and is generally agreed to beabout 1372 Wm2. The elliptical orbit around the sun and thetilted polar axis about which the Earth rotates, affects thedaily solar irradiance received at the atmosphere boundary(Ho) due to variance in the Sun-Earth distance (do) and thesolar-zenith angle (ψ). At any location, the solar zenith angleis related to the latitude of position (ϕ) through:
ψ(ϕ) = ϕ − δ Eq 4
where (δ) is the solar declination angle and varies over theyear by:
δ = -23.5º cos [360 (i + 10) / 365] Eq 5
where i is the Julian day. The solar declination also limitsday length by determining the sun elevation at noon. Daylength is used to gather momentary fluxes of solar irradianceinto diurnal accumulations. Day length (So) in seconds fromsunrise to sunset is given by:
24So = –––– cos -1(- tan ϕ tan δ ) Eq 6π
The relative Sun-Earth distance (do) at a given date can beapproximated through:
2πdo = 1 + 0.033 * cos –––––– i Eq 7365

54
Diurnal accumulations of SW irradiance at the top of theatmosphere is estimated using the formula:
doHo = So * cos (ψ) * Qo –––– 2
Eq 8d
where:Ho = Irradiance at the top of the Earth atmosphere (MJm-2
day-1)So = Day length, sunrise to sunset (seconds)Qo = Solar constant (≈ 1372 Wm-2)do = Earth-Sun distance at a particular date (in atmospheric
units, au)d = Average Earth-Sun distance (1 au)ψ = Solar zenith angle
Fluxes of PAR may be approximated as a constant fractionof 48 % of SW irradiance (Frouin and Pinker, 1995), butvaries depending on column water vapour concentrations,aerosol optical thickness (AOT) and aerosol single scatteringalbedo.
Ground measurements of short wave fluxes and brightsunshine hours
Measurements of surface incident SW flux and brightsunshine hours at daily level were available from only twoclimate stations, Wushen and Tongliao, due to the highpurchase cost for daily data in China. SW flux was measuredby pyranometer (DFY-4) and sunshine hours with a cameraobscura heliograph. The time series of measured daily datadiffered between the stations as shown in Table 1.
Atmospheric transparency for CLAVR classificationsThe measured series of SW flux (H) from Tongliao in
1989 was used to establish coefficients of atmospherictransparency for the different CLAVR classifications in thegrowing season. Descriptive statistics for the relationship H/Ho, grouped by the clear, mixed, and cloudy classifications,were calculated to assess average radiation loss in theatmosphere for the different CLAVR categories.
Modelling spatially distributed daily fluxes of PARThe daily CLAVR images at 8x8 km resolution were
used to reduce the calculated cell- and date-specific theoreticaltop-of-atmosphere SW radiation (Ho) according to theCLAVR classification and its established coefficient oftransparency. The daily estimates of ground incident SWflux were then reduced to 48% to achieve PAR (Frouin andPinker 1995).
Results and discussion
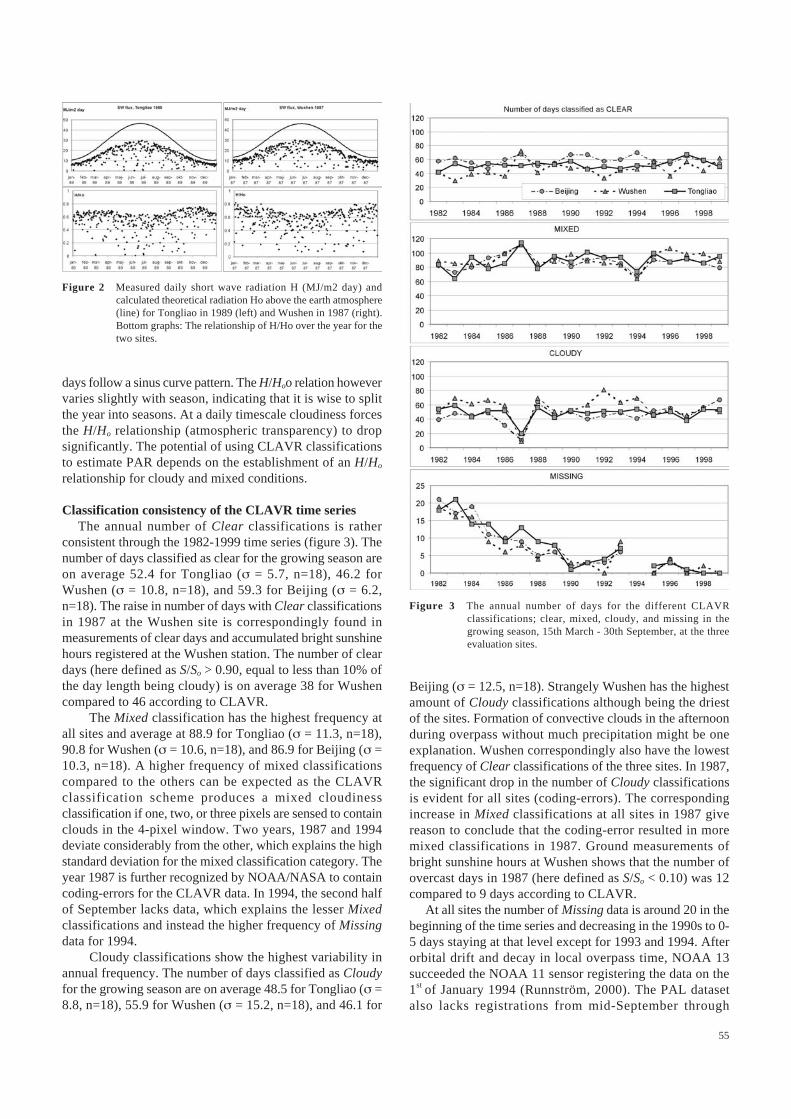
Measured daily incoming SW flux in January 1989 forTongliao, average on clear days just below 10 MJ m-2 day-1
and maximizes at about 30 MJ m-2 day-1 at mid-summer(Figure 2). The fraction of the theoretical radiation thatpenetrates the atmosphere (H/Ho) on clear days drop fromabout 0.70 in the dry winter season, to 0.65 in the summer asmoist air masses are brought in by the monsoon whichreduces the atmospheric transparency. For Wushen, situatedat a higher elevation, SW flux is slightly higher than atTongliao in the wintertime (H/Ho=0.80) and reaches aboutthe same level in summer (H/Ho=0.65). Under normalatmospheric conditions, surface incident SW flux on clear
Table 1 The available time series of ground-measured records of SWradiation and bright sunshine hours at daily level.
Station name Measured shortwave Measured bright sunshine
Tongliao 1987, 1989-1990 1987Wushen 1987 1982-1991
CLAVR - consistency, precision and biasThe potential of using the CLAVR classifications to
estimate incident SW flux rely on i) the long-term stabilityof data, and ii) the possibility of using the three CLAVRclassifications, clear, cloudy and mixed to represent diurnalcloud conditions from a ‘snapshot’ satellite acquisition inthe afternoon.
The long-term consistency of CLAVR classificationsthrough the 18-year time series was evaluated at the threesites. The number of classifications of clear, mixed, cloudyor missing data were extracted for the three pixels, eachcontaining an evaluation site during the growing season (15th
March to 30th September) providing spatial and temporaldifferences, and trends.
The agreement between the instantaneous afternoonCLAVR classification and diurnal fractions of bright sunshinehours to day length (S/So) was evaluated using dailymeasurements of sunshine hours (S) at the Wushen researchstation between 1982 - 1991.
Figure 1 The Inner Mongolia Autonomous Region (IMAR) study areaof northern China and Land Use. The three evaluation sites areindicated. (1 - Wushen, 2 - Tongliao, and 3 - Beijing)
55
days follow a sinus curve pattern. The H/Hoo relation howevervaries slightly with season, indicating that it is wise to splitthe year into seasons. At a daily timescale cloudiness forcesthe H/Ho relationship (atmospheric transparency) to dropsignificantly. The potential of using CLAVR classificationsto estimate PAR depends on the establishment of an H/Ho
relationship for cloudy and mixed conditions.
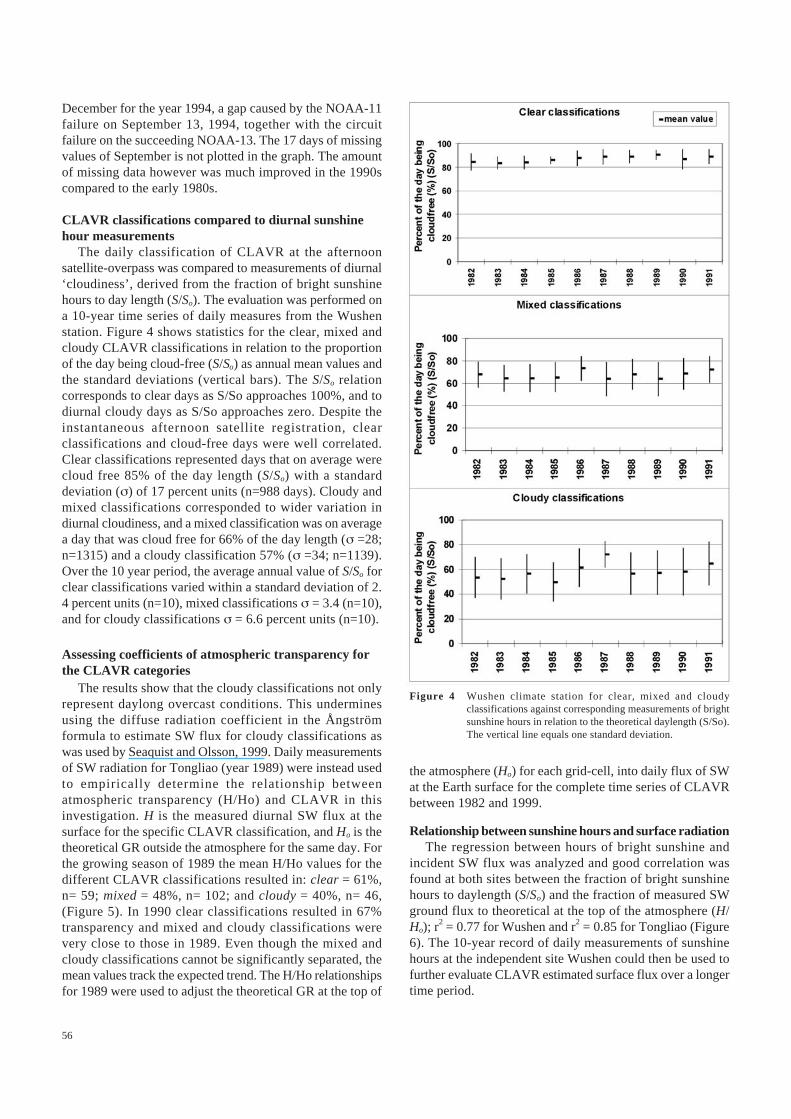
Classification consistency of the CLAVR time seriesThe annual number of Clear classifications is rather
consistent through the 1982-1999 time series (figure 3). Thenumber of days classified as clear for the growing season areon average 52.4 for Tongliao (σ = 5.7, n=18), 46.2 forWushen (σ = 10.8, n=18), and 59.3 for Beijing (σ = 6.2,n=18). The raise in number of days with Clear classificationsin 1987 at the Wushen site is correspondingly found inmeasurements of clear days and accumulated bright sunshinehours registered at the Wushen station. The number of cleardays (here defined as S/So > 0.90, equal to less than 10% ofthe day length being cloudy) is on average 38 for Wushencompared to 46 according to CLAVR.
The Mixed classification has the highest frequency atall sites and average at 88.9 for Tongliao (σ = 11.3, n=18),90.8 for Wushen (σ = 10.6, n=18), and 86.9 for Beijing (σ =10.3, n=18). A higher frequency of mixed classificationscompared to the others can be expected as the CLAVRclassification scheme produces a mixed cloudinessclassification if one, two, or three pixels are sensed to containclouds in the 4-pixel window. Two years, 1987 and 1994deviate considerably from the other, which explains the highstandard deviation for the mixed classification category. Theyear 1987 is further recognized by NOAA/NASA to containcoding-errors for the CLAVR data. In 1994, the second halfof September lacks data, which explains the lesser Mixedclassifications and instead the higher frequency of Missingdata for 1994.
Cloudy classifications show the highest variability inannual frequency. The number of days classified as Cloudyfor the growing season are on average 48.5 for Tongliao (σ =8.8, n=18), 55.9 for Wushen (σ = 15.2, n=18), and 46.1 for
Beijing (σ = 12.5, n=18). Strangely Wushen has the highestamount of Cloudy classifications although being the driestof the sites. Formation of convective clouds in the afternoonduring overpass without much precipitation might be oneexplanation. Wushen correspondingly also have the lowestfrequency of Clear classifications of the three sites. In 1987,the significant drop in the number of Cloudy classificationsis evident for all sites (coding-errors). The correspondingincrease in Mixed classifications at all sites in 1987 givereason to conclude that the coding-error resulted in moremixed classifications in 1987. Ground measurements ofbright sunshine hours at Wushen shows that the number ofovercast days in 1987 (here defined as S/So < 0.10) was 12compared to 9 days according to CLAVR.
At all sites the number of Missing data is around 20 in thebeginning of the time series and decreasing in the 1990s to 0-5 days staying at that level except for 1993 and 1994. Afterorbital drift and decay in local overpass time, NOAA 13succeeded the NOAA 11 sensor registering the data on the1st of January 1994 (Runnström, 2000). The PAL datasetalso lacks registrations from mid-September through
Figure 2 Measured daily short wave radiation H (MJ/m2 day) andcalculated theoretical radiation Ho above the earth atmosphere(line) for Tongliao in 1989 (left) and Wushen in 1987 (right).Bottom graphs: The relationship of H/Ho over the year for thetwo sites.
Figure 3 The annual number of days for the different CLAVRclassifications; clear, mixed, cloudy, and missing in thegrowing season, 15th March - 30th September, at the threeevaluation sites.
56
December for the year 1994, a gap caused by the NOAA-11failure on September 13, 1994, together with the circuitfailure on the succeeding NOAA-13. The 17 days of missingvalues of September is not plotted in the graph. The amountof missing data however was much improved in the 1990scompared to the early 1980s.
CLAVR classifications compared to diurnal sunshinehour measurements
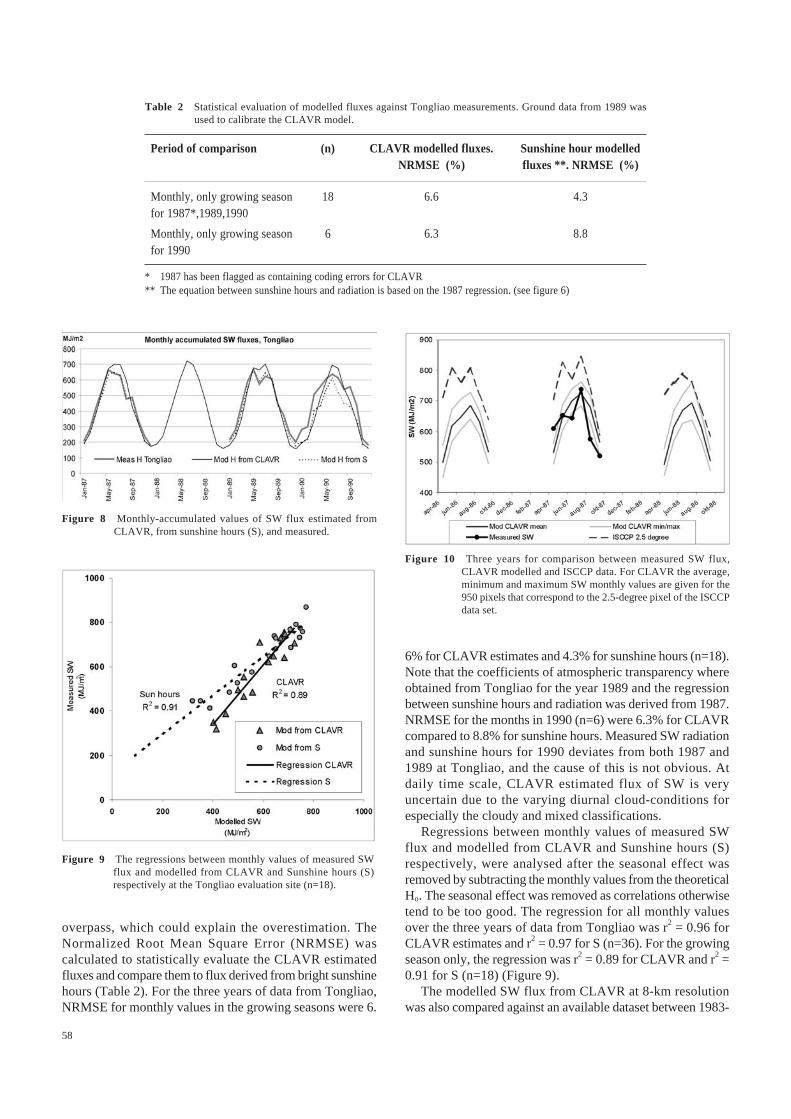
The daily classification of CLAVR at the afternoonsatellite-overpass was compared to measurements of diurnal‘cloudiness’, derived from the fraction of bright sunshinehours to day length (S/So). The evaluation was performed ona 10-year time series of daily measures from the Wushenstation. Figure 4 shows statistics for the clear, mixed andcloudy CLAVR classifications in relation to the proportionof the day being cloud-free (S/So) as annual mean values andthe standard deviations (vertical bars). The S/So relationcorresponds to clear days as S/So approaches 100%, and todiurnal cloudy days as S/So approaches zero. Despite theinstantaneous afternoon satellite registration, clearclassifications and cloud-free days were well correlated.Clear classifications represented days that on average werecloud free 85% of the day length (S/So) with a standarddeviation (σ) of 17 percent units (n=988 days). Cloudy andmixed classifications corresponded to wider variation indiurnal cloudiness, and a mixed classification was on averagea day that was cloud free for 66% of the day length (σ =28;n=1315) and a cloudy classification 57% (σ =34; n=1139).Over the 10 year period, the average annual value of S/So forclear classifications varied within a standard deviation of 2.4 percent units (n=10), mixed classifications σ = 3.4 (n=10),and for cloudy classifications σ = 6.6 percent units (n=10).
Assessing coefficients of atmospheric transparency forthe CLAVR categories
The results show that the cloudy classifications not onlyrepresent daylong overcast conditions. This underminesusing the diffuse radiation coefficient in the Ångströmformula to estimate SW flux for cloudy classifications aswas used by Seaquist and Olsson, 1999. Daily measurementsof SW radiation for Tongliao (year 1989) were instead usedto empirically determine the relationship betweenatmospheric transparency (H/Ho) and CLAVR in thisinvestigation. H is the measured diurnal SW flux at thesurface for the specific CLAVR classification, and Ho is thetheoretical GR outside the atmosphere for the same day. Forthe growing season of 1989 the mean H/Ho values for thedifferent CLAVR classifications resulted in: clear = 61%,n= 59; mixed = 48%, n= 102; and cloudy = 40%, n= 46,(Figure 5). In 1990 clear classifications resulted in 67%transparency and mixed and cloudy classifications werevery close to those in 1989. Even though the mixed andcloudy classifications cannot be significantly separated, themean values track the expected trend. The H/Ho relationshipsfor 1989 were used to adjust the theoretical GR at the top of
the atmosphere (Ho) for each grid-cell, into daily flux of SWat the Earth surface for the complete time series of CLAVRbetween 1982 and 1999.
Relationship between sunshine hours and surface radiationThe regression between hours of bright sunshine and
incident SW flux was analyzed and good correlation wasfound at both sites between the fraction of bright sunshinehours to daylength (S/So) and the fraction of measured SWground flux to theoretical at the top of the atmosphere (H/Ho); r
2 = 0.77 for Wushen and r2 = 0.85 for Tongliao (Figure6). The 10-year record of daily measurements of sunshinehours at the independent site Wushen could then be used tofurther evaluate CLAVR estimated surface flux over a longertime period.
Figure 4 Wushen climate station for clear, mixed and cloudyclassifications against corresponding measurements of brightsunshine hours in relation to the theoretical daylength (S/So).The vertical line equals one standard deviation.

57
Figure 7 The spatial distribution of modelled accumulated PAR over Inner Mongolia and northern China for the growingseason of 1990.
Province. The dry and flat western part of theIMAR shows noticeably higher seasonal amountsof PAR. The amount of PAR also seems to berelated to differences in land use surfaces, e.g.forests and parts of the Yellow River that producemore water vapour through evapotranspiration thatcould lead to increased cloudiness. Such trendswere also identified by Hoyningen-Huene et al.(1999) in Malaysia and Sahin and Sen (1998) forTurkish conditions. Amounts of PAR at extremeelevations, i.e. in the south-west at the border ofthe Tibetan plateau, may be underestimated as nocompensation is made for shorter atmosphericpaths in the model and no evaluations were possibleover these regions. No clear trend of height-dependency for cloud-free conditions was howeverfound for the 29 stations at different elevationsused in Sahin and Sen (1998) over Turkey, asimilar climatic region, but Tiba (2001) found abetter relationship when comparing sites atdifferent elevations in Brazil.
At the evaluation sites, inter-annual variationof PAR through the 18 years was ±10-15% aroundthe mean, reflecting differences in yearly CLAVRclassifications of cloud cover. CLAVR modelledradiation of SW flux was evaluated against 3 yearsof daily measurements at the Tongliao evaluationsite. When accumulated into monthly values,CLAVR estimates follow the measured curvealthough fluxes in June and July are overestimatedand are better estimated from sunshine hours(Figure 8). Rain events in the summer are oftencharacterized by rapidly forming short rain eventsthat may not be present at the time of satellite
Figure 5 The fraction of penetrated radiation for the different CLAVR classificationsat Tongliao in 1989 (left) and 1990 (right). The graphs show the mean valueand the standard deviation (vertical lines) for each category.
Figure 6 The relation between penetrated radiation (H/Ho) and bright sunshinehours to daylength (S/So) at daily scale for the two stations Wushen andTongliao in 1987.
Estimated PAR from CLAVRGrowing-season accumulated PAR (48% of the SW) fluctuated
between 1500 and 2000 MJ/m2 in year 1990 for the IMAR (Figure 7),the spatial variation reflecting differences in CLAVR classificationsand latitude. Mountainous areas receive less amounts of PAR, whichcould result from orographic cloud formations resulting in addedcloudy and mixed CLAVR classifications. This pattern can be noticedalong the Da Hinggan Ling in the northeast, over the mountainousparts around the Yellow River, and over the hilly parts of Shanxi
58
Figure 9 The regressions between monthly values of measured SWflux and modelled from CLAVR and Sunshine hours (S)respectively at the Tongliao evaluation site (n=18).
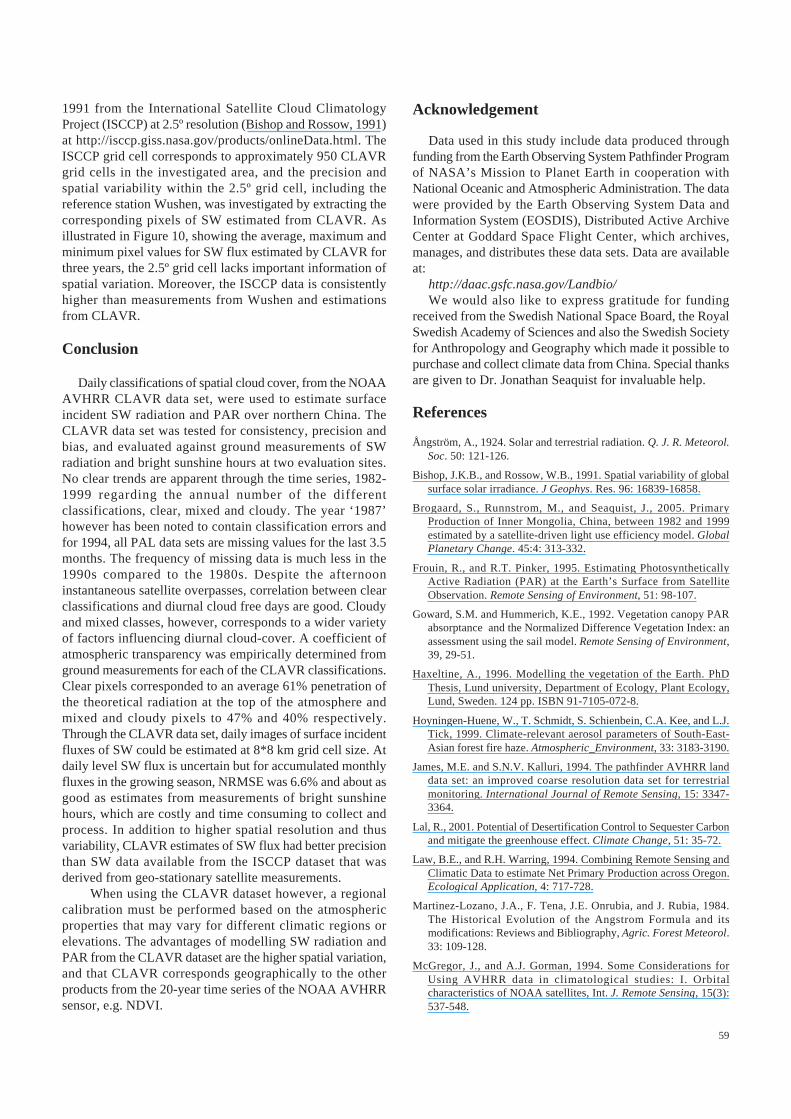
overpass, which could explain the overestimation. TheNormalized Root Mean Square Error (NRMSE) wascalculated to statistically evaluate the CLAVR estimatedfluxes and compare them to flux derived from bright sunshinehours (Table 2). For the three years of data from Tongliao,NRMSE for monthly values in the growing seasons were 6.
Period of comparison (n) CLAVR modelled fluxes. Sunshine hour modelledNRMSE (%) fluxes **. NRMSE (%)
Monthly, only growing season 18 6.6 4.3for 1987*,1989,1990
Monthly, only growing season 6 6.3 8.8for 1990
* 1987 has been flagged as containing coding errors for CLAVR** The equation between sunshine hours and radiation is based on the 1987 regression. (see figure 6)
Table 2 Statistical evaluation of modelled fluxes against Tongliao measurements. Ground data from 1989 wasused to calibrate the CLAVR model.
Figure 8 Monthly-accumulated values of SW flux estimated fromCLAVR, from sunshine hours (S), and measured.
Figure 10 Three years for comparison between measured SW flux,CLAVR modelled and ISCCP data. For CLAVR the average,minimum and maximum SW monthly values are given for the950 pixels that correspond to the 2.5-degree pixel of the ISCCPdata set.
6% for CLAVR estimates and 4.3% for sunshine hours (n=18).Note that the coefficients of atmospheric transparency whereobtained from Tongliao for the year 1989 and the regressionbetween sunshine hours and radiation was derived from 1987.NRMSE for the months in 1990 (n=6) were 6.3% for CLAVRcompared to 8.8% for sunshine hours. Measured SW radiationand sunshine hours for 1990 deviates from both 1987 and1989 at Tongliao, and the cause of this is not obvious. Atdaily time scale, CLAVR estimated flux of SW is veryuncertain due to the varying diurnal cloud-conditions forespecially the cloudy and mixed classifications.
Regressions between monthly values of measured SWflux and modelled from CLAVR and Sunshine hours (S)respectively, were analysed after the seasonal effect wasremoved by subtracting the monthly values from the theoreticalHo. The seasonal effect was removed as correlations otherwisetend to be too good. The regression for all monthly valuesover the three years of data from Tongliao was r2 = 0.96 forCLAVR estimates and r2 = 0.97 for S (n=36). For the growingseason only, the regression was r2 = 0.89 for CLAVR and r2 =0.91 for S (n=18) (Figure 9).
The modelled SW flux from CLAVR at 8-km resolutionwas also compared against an available dataset between 1983-
59
1991 from the International Satellite Cloud ClimatologyProject (ISCCP) at 2.5º resolution (Bishop and Rossow, 1991)at http://isccp.giss.nasa.gov/products/onlineData.html. TheISCCP grid cell corresponds to approximately 950 CLAVRgrid cells in the investigated area, and the precision andspatial variability within the 2.5º grid cell, including thereference station Wushen, was investigated by extracting thecorresponding pixels of SW estimated from CLAVR. Asillustrated in Figure 10, showing the average, maximum andminimum pixel values for SW flux estimated by CLAVR forthree years, the 2.5º grid cell lacks important information ofspatial variation. Moreover, the ISCCP data is consistentlyhigher than measurements from Wushen and estimationsfrom CLAVR.
Conclusion
Daily classifications of spatial cloud cover, from the NOAAAVHRR CLAVR data set, were used to estimate surfaceincident SW radiation and PAR over northern China. TheCLAVR data set was tested for consistency, precision andbias, and evaluated against ground measurements of SWradiation and bright sunshine hours at two evaluation sites.No clear trends are apparent through the time series, 1982-1999 regarding the annual number of the differentclassifications, clear, mixed and cloudy. The year ‘1987’however has been noted to contain classification errors andfor 1994, all PAL data sets are missing values for the last 3.5months. The frequency of missing data is much less in the1990s compared to the 1980s. Despite the afternooninstantaneous satellite overpasses, correlation between clearclassifications and diurnal cloud free days are good. Cloudyand mixed classes, however, corresponds to a wider varietyof factors influencing diurnal cloud-cover. A coefficient ofatmospheric transparency was empirically determined fromground measurements for each of the CLAVR classifications.Clear pixels corresponded to an average 61% penetration ofthe theoretical radiation at the top of the atmosphere andmixed and cloudy pixels to 47% and 40% respectively.Through the CLAVR data set, daily images of surface incidentfluxes of SW could be estimated at 8*8 km grid cell size. Atdaily level SW flux is uncertain but for accumulated monthlyfluxes in the growing season, NRMSE was 6.6% and about asgood as estimates from measurements of bright sunshinehours, which are costly and time consuming to collect andprocess. In addition to higher spatial resolution and thusvariability, CLAVR estimates of SW flux had better precisionthan SW data available from the ISCCP dataset that wasderived from geo-stationary satellite measurements.
When using the CLAVR dataset however, a regionalcalibration must be performed based on the atmosphericproperties that may vary for different climatic regions orelevations. The advantages of modelling SW radiation andPAR from the CLAVR dataset are the higher spatial variation,and that CLAVR corresponds geographically to the otherproducts from the 20-year time series of the NOAA AVHRRsensor, e.g. NDVI.
Acknowledgement
Data used in this study include data produced throughfunding from the Earth Observing System Pathfinder Programof NASA’s Mission to Planet Earth in cooperation withNational Oceanic and Atmospheric Administration. The datawere provided by the Earth Observing System Data andInformation System (EOSDIS), Distributed Active ArchiveCenter at Goddard Space Flight Center, which archives,manages, and distributes these data sets. Data are availableat:
http://daac.gsfc.nasa.gov/Landbio/We would also like to express gratitude for funding
received from the Swedish National Space Board, the RoyalSwedish Academy of Sciences and also the Swedish Societyfor Anthropology and Geography which made it possible topurchase and collect climate data from China. Special thanksare given to Dr. Jonathan Seaquist for invaluable help.
References
Ångström, A., 1924. Solar and terrestrial radiation. Q. J. R. Meteorol.Soc. 50: 121-126.
Bishop, J.K.B., and Rossow, W.B., 1991. Spatial variability of globalsurface solar irradiance. J Geophys. Res. 96: 16839-16858.
Brogaard, S., Runnstrom, M., and Seaquist, J., 2005. PrimaryProduction of Inner Mongolia, China, between 1982 and 1999estimated by a satellite-driven light use efficiency model. GlobalPlanetary Change. 45:4: 313-332.
Frouin, R., and R.T. Pinker, 1995. Estimating PhotosyntheticallyActive Radiation (PAR) at the Earth’s Surface from SatelliteObservation. Remote Sensing of Environment, 51: 98-107.
Goward, S.M. and Hummerich, K.E., 1992. Vegetation canopy PARabsorptance and the Normalized Difference Vegetation Index: anassessment using the sail model. Remote Sensing of Environment,39, 29-51.
Haxeltine, A., 1996. Modelling the vegetation of the Earth. PhDThesis, Lund university, Department of Ecology, Plant Ecology,Lund, Sweden. 124 pp. ISBN 91-7105-072-8.
Hoyningen-Huene, W., T. Schmidt, S. Schienbein, C.A. Kee, and L.J.Tick, 1999. Climate-relevant aerosol parameters of South-East-Asian forest fire haze. Atmospheric_Environment, 33: 3183-3190.
James, M.E. and S.N.V. Kalluri, 1994. The pathfinder AVHRR landdata set: an improved coarse resolution data set for terrestrialmonitoring. International Journal of Remote Sensing, 15: 3347-3364.
Lal, R., 2001. Potential of Desertification Control to Sequester Carbonand mitigate the greenhouse effect. Climate Change, 51: 35-72.
Law, B.E., and R.H. Warring, 1994. Combining Remote Sensing andClimatic Data to estimate Net Primary Production across Oregon.Ecological Application, 4: 717-728.
Martinez-Lozano, J.A., F. Tena, J.E. Onrubia, and J. Rubia, 1984.The Historical Evolution of the Angstrom Formula and itsmodifications: Reviews and Bibliography, Agric. Forest Meteorol.33: 109-128.
McGregor, J., and A.J. Gorman, 1994. Some Considerations forUsing AVHRR data in climatological studies: I. Orbitalcharacteristics of NOAA satellites, Int. J. Remote Sensing, 15(3):537-548.
60
Monteith, J.L., 1972. Solar Radiation and Productivity in TropicalEcosystems. J. of Applied Ecology, 9: 747-766.
Monteith, J.L., 1977. Climate and the efficiency of crop cultivation inBritain. Philosophical Transactions of the Royal Society of London,281: 277-294.
Monteith, J.L., and M. Unsworth, 1990. Principles of EnvironmentalPhysics, Arnold. London, 291 pp.
Nouvellon, Y., D.L. Seen, S. Rambal, A. Bégué, M.S. Moran, Y. Kerr,and Qi Jiaguo, 2000. Time Course of Radiation Use Efficiency in aShortgrass Ecosystem: Consequences for Remotely SensedEstimation of Primary Production. Remote Sens. Environ., 71: 43-45.
Olsson, L. and Ardo, J., 2002. Soil carbon sequestration in degradedsemiarid agro-ecosystems – perils and potentials. Ambio, 31:6:471-477.
Paruelo, J.M., H.E. Epstein, W.K. Lauenroth, and I.C. Burke, 1997.ANPP Estimates from NDVI for the Central Grassland Region ofThe United States. Ecology, 78: 953-958.
Pinker, R.T., R. Frouin, and Z. Li, 1995. A review of satellite methodsto derive surface shortwave irradiance. Remote Sens. Environ., 51:108-124.
Prescott, J.A., 1940. Evaporation from a water surface in relation tosolar radiation. Trans. R. Soc. Sci. Aust., 64: 114-125.
Prince, S.D. and Goward, S.N., 1995. Global Primary Production: aremote sensing approach. Journal of Biogeography, 22, 815-835.
Rasmussen, M.S., 1998a. Developing simple, operational, consistentNDVI-vegetation models by applying environmental and climaticinformation: Part 1. Assessment of Net Primary Production. Int. J.Remote Sensing, 19: 97-117.
Rasmussen, M.S., 1998b. Developing simple, operational, consistentNDVI-vegetation models by applying environmental and climaticinformation: Part 2. Crop Yield Assessment. Int. J. Remote Sensing,19: 119-139.
Rossow, W.B. and Zhang, Y. 1995. Calculation of surface and top-of-atmosphere radiative fluxes from physical quantities based onISCCP datasets, Part II: Validation and first results. Journal ofGeophysical Research, 100:1167-1197
Ruimy, A., and B. Saugier, 1994. Methodology for the estimation ofterrestrial net primary production from remotely sensed data. J. ofGeophysical Research. 99: (No D3) 5263-5283.
Runnstrom, M. C. 2000, Is northern China winning the battle againstdesertification? Ambio 29: 468-476.
Sahin, A.D., and Z. Sen, 1998. Statistical analysis of the Angströmformula coefficients and applications for Turkey. Solar Energy,62: 29-38.
Seaquist, J.W., and L. Olsson, 1999. Rapid estimation ofPhotosynthetically active radiation over the West African Sahelusing the Pathfinder Land Data Set. J. Earth Observation andGeoinformation, 1: 205-213.
Seaquist, J.W., Olsson, L., and J. Ardö, 2003. A remote sensing-basedprimary production model for grassland biomes. EcologicalModelling, 169:1: 131-155.
Sheehy D.P., 1992. A perspective on desertification of grazinglandecosystems in north China. Ambio, 21: 303-307.
SMSRC, 1994. Clouds from AVHRR (“CLAVR”) Phase 1 ProcessingSystem Interface Control Document (ICD). AM systems andResearch Corporation.
Stowe, L.L., P. Davis, and E.P. McClain, 1995. Evaluating the CLAVR(CLouds from AVHRR) phase I cloud cover experimental product.Adv. Space Res. 16(10): 21-24.
Stowe, L.L., P. Davis, and E.P. McClain, 1999. Scientific basis andinitial evaluation of the CLAVR-1 global clear/cloud classificationalgorithm for the advanced very high resolution radiometer. J. ofAtmospheric and Oceanic Technology, 16(6): 656-681.
Suehrcke, A., 2000. On the Relationship Between Duration of Sunshineand solar Radiation of the Earth’s Surface: Ångström’s EquationRevisited. Solar Energy, 68: 417-425.
Sun, X., and Z. Yu, 1996. Grassland degradation in the main pastoralprovinces of China. Chinese J. arid Land Res. 8: 281-285.
Tiba, S., 2001. Solar Radiation in the Brazilian North East. RenewableEnergy, 22: 568-578.
Vemury, S., L.L. Stowe, and V.R. Anne, 2001. AVHRR Pixel LevelClear-Sky Classifiaction Using Dynamic Thresholds (CLAVR-3).J. of Atmospheric and Oceanic Technology. 18: 169-186.
Yang, K., G.W. Huang, and N. Tmai, 2001. A Hybrid Model forEstimating Global Solar Radiation. Solar Energy, 70: 13-22.
Zhang, Y.-C. and W. B. Rossow, 2002. New ISCCP global radiativeflux data products, GEWEX News, 12(4), 7.
Zhu Z., S. Liu, Z. Wu Z., and X. Di, 1986. Deserts in China. Instituteof Desert Research. Academia Sinica Lanzhou. 132pp.