Do environmental stream classifications support flow assessments in Mediterranean basins?
25
This is a pre-copyedited, author-produced PDF version following peer review of the article: O. Belmar, J. Velasco, F. Martínez-Capel, M. Peredo-Parada, T. Snelder. 2012. Do Environmental Stream Classifications Support Flow Assessments in Mediterranean Basins? Water Resources Management (2012) 26(13):3803–3817, DOI 10.1007/s11269-012-0104-3, which has been published in definitive publisher-authenticated form at http://link.springer.com/article/10.1007%2Fs11269-012-0104-3 Article first published online: 19 JUL 2012 by Springer Science+Business Media. All rights reserved. All further use of this material other than for personal research is subject to permission from the publisher.
Transcript of Do environmental stream classifications support flow assessments in Mediterranean basins?

This is a pre-copyedited, author-produced PDF version following peer review of the article: O. Belmar, J. Velasco, F. Martínez-Capel, M. Peredo-Parada, T. Snelder. 2012. Do Environmental Stream Classifications Support Flow Assessments in Mediterranean Basins? Water Resources Management (2012) 26(13):3803–3817, DOI 10.1007/s11269-012-0104-3, which has been published in definitive publisher-authenticated form at http://link.springer.com/article/10.1007%2Fs11269-012-0104-3 Article first published online: 19 JUL 2012 by Springer Science+Business Media. All rights reserved. All further use of this material other than for personal research is subject to permission from the publisher.
Do environmental stream classifications support 1
flow assessments in Mediterranean basins? 2
3
O. Belmar ([email protected]) (Tlf. 0034 868 88 4977) 4
J. Velasco 5
Department of Ecology and Hydrology, Faculty of Biology, University of Murcia, 6 Espinardo Campus, 30100, Murcia, Spain 7
8
F. Martinez-Capel 9
Institut d'Investigació per a la Gestió Integrada de Zones Costaneres, Universitat 10 Politècnica de València. Calle Paranimf nº1, Grao de Gandia 46730, Valencia 11
12
M. Peredo-Parada 13
Plataforma de Investigación en Ecohidrología y Ecohidráulica, EcoHyd, Almirantes 14 Riveros 075, Providencia, Santiago, Chile 15
16
T. Snelder 17
NIWA, 10 Kyle Street, P.O. Box 8602, Riccarton, Christchurch, New Zealand 18 19

1
Abstract 1
Natural flow regimes are of primary interest in designing environmental flows and therefore essential for 2 water management and planning. The present study discriminated natural hydrologic variation using two 3 different environmental classifications (REC-Segura and WFD-ecotypes) and tested their agreement with 4 an a posteriori (hydrologic) classification in a Spanish Mediterranean basin (the Segura River, SE Spain). 5 The REC-Segura was developed as a two-level hierarchical classification based on environmental 6 variables that influence hydrology (climate and source-of-flow). The WFD-ecotypes were developed by 7 the Spanish Ministry for the Environment to implement the Water Framework Directive (WFD) using 8 hierarchical hydrologic, morphologic and physicochemical variables. The climate level in the REC-9 Segura broadly described the hydrologic pattern observed along the NW-SE aridity gradient of the basin. 10 However, source-of-flow (defined by karstic geology) was only able to discriminate variation in flow 11 regimes within one climatic category. The WFD-ecotypes, despite incorporating hydrologic variables, did 12 not fully discriminate hydrologic variation in the basin. Ecotypes in tributary streams located in dry or 13 semiarid climates embrace different flow regimes (both perennial and intermittent). There was little 14 agreement between environmental and hydrologic classifications. Therefore, the authors advise against 15 the use of environmental classifications for the assessment of environmental flows without first testing 16 their ability to discriminate hydrologic patterns. 17
Keywords: Mediterranean rivers; stream classification; environmental flows; Water 18
Framework Directive; ecotypes 19
1 Introduction 20
Characterising stream flows is of prime interest for water resource planning and 21
management as well as for ecohydrologic studies. Many authors have emphasised the 22
need to classify flow regimes at the regional scale to provide typologies that can support 23
the assessment of environmental flows (Arthington et al. 2006; Poff et al. 2006). 24
Hydrologic classification constitutes the first step of a new holistic framework intended 25
to develop regional environmental flow criteria called the “Ecological Limits of 26
Hydrologic Alteration (ELOHA)” (Poff et al. 2006), where the unaltered hydrology of 27
rivers and streams constitutes the basis for assessing the effects of flow alteration and 28
estimating environmental flows. However, the utility of different river classification 29
systems is still being evaluated (Leathwick et al. 2011; Olden et al. 2011). 30
31
There are two basic approaches used to classify rivers according to their natural regimes 32
(Olden et al. 2011): (1) inductive, or a posteriori, and (2) deductive, or a priori. The a 33
posteriori (hydrologic) approach involves analysing at least 15 (Kennard et al. 2010) or 34

2
20 (Richter et al. 1997) years of hydrologic records. Flow series may be obtained from 1
gauging stations or inferred from precipitation-runoff models (Poff et al. 2010; Olden et 2
al. 2011) in order to calculate hydrologic metrics, such as the “Indicators of Hydrologic 3
Alteration” (Mathews and Richter 2007; Richter et al. 1996), that allow clustering rivers 4
and streams according to their similarity in flow regime. This procedure has been 5
applied at different resolutions, from catchments in Mediterranean areas (Alcazar and 6
Palau 2010; Baeza and Garcia de Jalon 2005; Bejarano et al. 2010; Belmar et al. 2011) 7
to countries such as the USA (Mcnamay et al. 2011; Poff 1996), France (Snelder et al. 8
2009) and Australia (Kennard et al. 2010). 9
10
The a priori approach describes and quantifies spatial variation in flow regime attributes 11
across broad spatial scales where the availability of measured (gauged) or modelled 12
hydrologic data is scarce or absent. It embraces three different methodologies (Olden el 13
al. 2011): environmental regionalisation, hydrologic regionalisation and environmental 14
classification. For environmental regionalisation, specific regions are considered 15
homogeneous with respect to certain environmental and hydrologic characteristics at a 16
particular scale (Bryce and Clarke, 1996; Loveland and Merchant, 2004). However, 17
hydrologic regionalisation delineates geographic areas with similar streamflow patterns, 18
uses regression to relate environmental catchment characteristics to hydrologic metrics 19
and assesses model reliability (for an example of a methodological proposal, see 20
Tsakiris et al. 2011). Finally, environmental classification defines classes on the basis of 21
physical and climatic attributes that are assumed to broadly produce similar hydrologic 22
responses in stream systems, often geographically independent and depicted by a spatial 23
mosaic of hydrologic types across the landscape (Detenbeck et al. 2000). 24
25
The River Environment Classification (REC; Snelder and Biggs 2002) has been a 26
landmark for stream environmental classifications. Originally applied in New Zealand, 27
it has also been applied in Chile (Peredo-Parada et al. 2011). Moreover, its ability to 28
detect variations in hydrologic characteristics (Snelder et al. 2005), invertebrate 29
assemblages (Snelder et al. 2004a) and nutrient concentrations (Snelder et al. 2004b) has 30
been demonstrated. The REC is based on a hierarchical scheme of controlling factors (or 31
classification levels) that are assumed to be the dominant causes of variation in the 32
physical and biological characteristics of rivers at a variety of spatial scales. Therefore, 33
different classification solutions are possible using the same schema of controlling 34

3
factors, with the choice of level depending upon the objective. In particular, the first and 1
second levels, “climate” and “source-of-flow” respectively, were those used to 2
discriminate rivers according to their differences in flow regime (Snelder et al. 2005). 3
4
The Water Framework Directive (WFD) proposed two river classification systems (A 5
and B, Annex II) to provide a basis for managing aquatic ecosystems. In Spain, water 6
legislation (ORDER ARM/2656/2008, Ministry for the Environment) includes an 7
environmental classification (WFD-ecotypes) based on the system B, which was 8
developed for river segments considered as management units (i.e those where the 9
definition of environmental flow regimes is mandatory). This hierarchical classification 10
uses seven environmental variables: two hydrologic (annual specific runoff and 11
discharge), three morphologic (mean slope and altitude of the watershed, and stream 12
order) and two physicochemical (mean annual temperature and estimated water 13
conductivity); however, it has not been hydrologically evaluated for use in assessing 14
environmental flows. 15
16
In this study, the ability to discriminate the natural hydrologic variation of the rivers and 17
streams in a Spanish Mediterranean basin (the Segura River) by two environmental 18
classifications (REC-Segura, based on the REC, and WFD-ecotypes) and their 19
agreement with an a posteriori (hydrologic) classification were tested. This study will 20
provide researchers and water managers with useful information regarding if (1) 21
environmental classifications can be used as surrogates of hydrologic methodologies to 22
discriminate distinct natural flow regimes and (2) WFD-ecotypes are management units 23
suitable for defining environmental flows. 24
2 Methods 25
2.1 Study area 26
Located in south eastern Spain, the management area of the Segura River basin (which 27
includes coastal watercourses draining to the Mediterranean Sea) presents a great 28
heterogeneity of flow regimes (Belmar et al. 2011). Despite its small size (18 870 km2), 29
there is a strong climatic and altitudinal gradient from NW to SE. The climate ranges 30
from wet (>1000 mm mean annual precipitation) and cold in the mountains (>1000 31
masl) of the NW to semiarid (<350 mm mean annual precipitation) in the SE lowlands 32

4
(200 mm precipitation near the coast). Mean annual temperatures range between 10 and 1
18 ºC (CHS 2007). The lithology of the plains is characterised by limestone and marls 2
with some volcanic areas, whereas calcites and dolomites dominate the mountain 3
headwaters. 4
5
Seven out of the thirty-two WFD-ecotypes defined in Spain are present in the Segura 6
Basin (Fig. 1): mineralised Mediterranean lowland streams (ecotype 7), mineralised 7
Mediterranean low mountain streams (ecotype 9), Mediterranean limestone mountain 8
streams (ecotype 12), highly mineralised Mediterranean streams (ecotype 13), low 9
altitude Mediterranean mainstems (ecotype 14), mineralised Mediterranean-continental 10
mainstems (ecotype 16) and large Mediterranean mainstems (ecotype 17). 11
12
An a posteriori classification based on hydrologic metrics (Belmar et al. 2011) defined 13
distinct natural flow regime classes in the Segura Basin along the stated aridity gradient. 14
The southeast was characterised by intermittent or ephemeral flow regimes with zero-15
flows for more than 20% and 50% of the year, respectively, and high peaks in autumn 16
associated with typical torrential rains. At the opposite extreme, in the northwest, larger 17
and more stable flows with a soft decrease in summer were found. Rivers in 18
intermediate areas presented bimodal hydrographs, due to seasonal spring and autumn 19
rains, and medium intra- and inter-annual flow variability. 20
2.2 Hydrologic basis 21
The hydrologic network defined in Belmar et al. (2011) (in which all streams have a 22
minimum drainage area of 10 km2) and its associated hydrologic information were used 23
as a baseline to characterise the hydrologic properties of the rivers and streams in the 24
Segura Basin. A summary of the hydrologic methodologies used by the authors is 25
presented below (for further details, see Belmar et al. 2011). 26
27
First, due to the lack of suitable gauged flow data, natural monthly flows were generated 28
for the period 1980/81-2005/06 using the ‘‘Integrated System for Rainfall–Runoff 29
Modelling” (SIMPA), developed by the Centre for Hydrographical Studies (Ministry for 30
the Environment, Spain). Second, 73 monthly and annual hydrologic indices were 31
calculated. These metrics, based on the “Indicators of Hydrologic Alteration” (Mathews 32
and Richter 2007; Richter et al. 1996) among others (Monk et al. 2006; Monk et al. 33
5
2007; Olden and Poff 2003), included measures of flow magnitude (central tendency 1
and dispersion) and drought duration. Third, a Principal Component Analysis (PCA) 2
performed using the PC-ORD software (v 4.41; McCune and Mefford 1999) 3
summarised this hydrological information. The PCA scores of the first three axes, which 4
explained 85% of variance, were weighed by the proportion of variance explained by 5
each and selected as a set of new synthetic, non-intercorrelated hydrologic variables. 6
Finally, a flexible-β clustering technique (Legendre and Legendre 1998; McCune and 7
Grace 2002) grouped streams according to their similarity of natural flow regime using 8
Euclidean distances. 9
10
In the present study, this hydrologic classification (Belmar et al. 2011) was pruned to 11
obtain versions with the same number of classes as each environmental classification, 12
which allowed their agreement to be tested. 13
2.3 REC-Segura classification 14
The present study’s environmental classification (REC-Segura) was built using an 15
approach similar to that applied in New Zealand for the River Environment 16
Classification (Snelder et al. 2005; Snelder and Biggs 2002): two hierarchical levels to 17
discriminate rivers according to their differences in flow regime. Categories were 18
assessed for each stream by spatial integration of variables across its watershed using a 19
Geographic Information System (GIS). 20
21
The first level (climate) comprised categories based on the magnitude and seasonality of 22
precipitation, which has already showed behaviour analogous to that of streamflows in 23
close Mediterranean basins (Nalbantis and Tsakiris 2009). Temperature was discarded 24
due to its strong correlation (Spearman Rank Correlation: -0.86, p = 0.000) with 25
precipitation. Mean monthly watershed precipitation was estimated for all nodes from a 26
1 km grid map created by the Spanish Ministry for the Environment by means of an 27
interpolation using data from the Spanish weather station network. Precipitation 28
categories were based on those in Rivas-Martinez (1983): semiarid, dry and subwet 29
(Table 1). Seasonality was estimated using the Precipitation Concentration Index (PCI; 30
Oliver 1980) calculated for October, as recommended by Pascual et al. (2001), 31
assuming that most precipitation occurs during this month in streams belonging to 32
torrential basins. Three categories were defined: moderately seasonal, seasonal and 33
6
strongly seasonal (Table 1), based on critical values used by Michiels and Gabriels 1
(1996). Within each climate class, flow regimes were expected to have a pattern similar 2
to the precipitation regime, with maximum mean monthly flows in rainy seasons 3
(autumn, winter or spring) and minimum mean monthly flows in summer. 4
5
The second level (source-of-flow) was based on karstic geology due to its effect on 6
ground water storage capacity and transmissivity, and therefore, its major influence on 7
base flow (Snelder and Biggs 2002). Gárfias-Soliz et al. (2010) pointed out the necessity 8
of taking into account the degree of karstification in a priori classifications. In this 9
context, karstic areas were expected to discriminate subtle differences related to the 10
magnitude of flows and their seasonal variation. Using Spain’s Map of Karst 11
1:1.000.000 developed by the Instituto Geológico Minero de España (IGME), two 12
subclasses based on the dominancy of karstic geology in the watershed, ≥50% surface 13
and <50% respectively, were defined for each climate class (Table 1). 14
2.4 Hydrologic discrimination by environmental classifications 15
The discrimination of hydrologic variation by the REC-Segura, both at climate and 16
source-of-flow levels, as well as by the WFD-ecotypes was tested by means of a non-17
parametric Multiple Analysis of Variances (PERMANOVA), using the three new 18
synthetic, non-intercorrelated hydrologic variables from the PCA (Belmar et al. 2011). 19
PERMANOVA analyses were performed using PRIMER (v. 6.1.12; Clarke and Gorley 20
2006). 21
2.5 Agreement between environmental and hydrologic classifications 22
The environmental classifications were compared with hydrologic classifications with 23
the same number of classes through the adjusted Rand index (ARI; Hubert and Arabie 24
1985). This index, a measure of cluster agreement (Steinley 2004), is based on the 25
relationship of each pair of objects and whether they differ between two cluster 26
solutions. It ranges between 0 (indicating that agreement between two clustering 27
solutions is no better than chance) and 1 (indicating perfect agreement). ARI was 28
calculated with the mclust (v. 3.4.8.) package for R (Fraley and Raftery 2010). 29
7
3 Results 1
3.1 REC-Segura classification 2
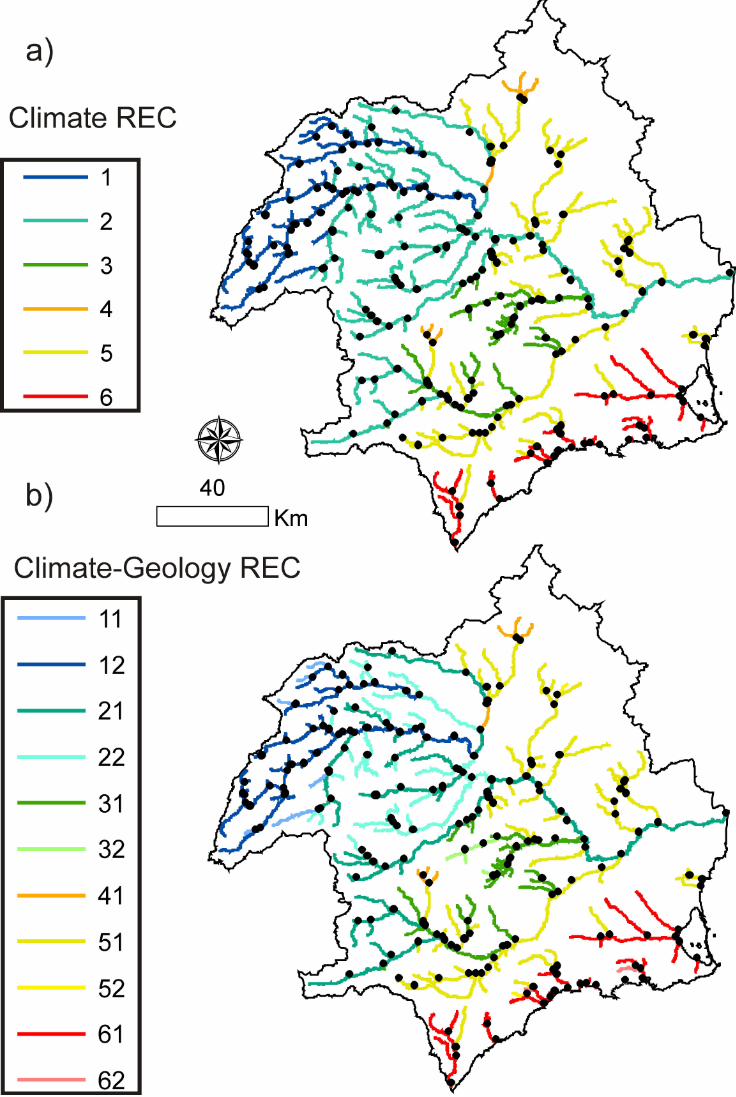
At the first level (climate), the REC-Segura split up the streams and rivers in the Segura 3
Basin into all of the defined classes (Table 1). As expected, there was a match between 4
the geographical distribution of these classes (Fig. 2a) and the increasing aridity 5
gradient from NW to SE reflected by the modelled flows. Moderately seasonal subwet 6
streams (class 1) were composed of upper river segments of the Segura and Mundo 7
rivers which never cease flowing (Fig. 3). Moderately seasonal dry streams (class 2) 8
presented the highest average mean annual flow and also the widest range of values, as 9
they include both the bottom half of the Segura River and some of its tributaries, located 10
mainly on the right bank. Seasonal dry (class 3), moderately seasonal semiarid (class 4), 11
seasonal semiarid (class 5), and strongly seasonal semiarid (class 6) streams represent a 12
gradient of increasing temporality as zero-flow duration increases. These classes were 13
composed of tributaries with inter- and intra-annual coefficients of variation greater than 14
those of classes 1 and 2 and bimodal hydrographs with strong flow peaks in winter and 15
spring. Only class 6 showed a different hydrograph, with flows mainly associated to 16
storm events. 17
18
The second classification level (source-of-flow) defined 11 subclasses (Fig. 2b) out of 19
the 12 possible, because there were no karstic geologic materials in seasonal dry areas. 20
3.2 Discrimination of flow regimes by the REC-Segura 21
PERMANOVA pair-wise comparisons showed significant hydrologic differences 22
(p<0.05) among most REC-Segura climate classes (Table 2a). However, moderately 23
seasonal semiarid streams (class 4) were not different from moderately seasonal subwet 24
(class 1), moderately seasonal dry (class 2) and strongly seasonal semiarid (class 6) 25
streams. In addition, seasonal dry (class 3) and seasonal semiarid (class 5) streams were 26
not different from each other. 27
28
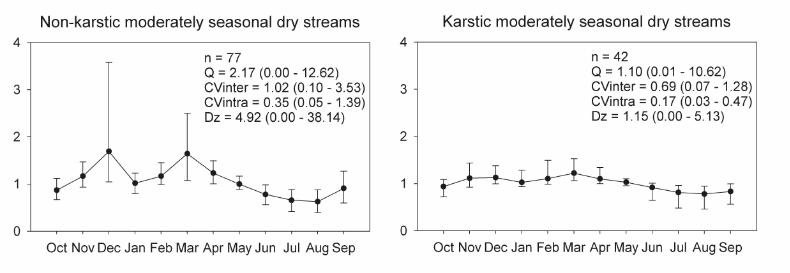
Only the moderately seasonal dry streams (class 2) presented hydrologic differences in 29
karstic areas (Table 2b), showing a softer seasonality (Fig. 4). 30
8
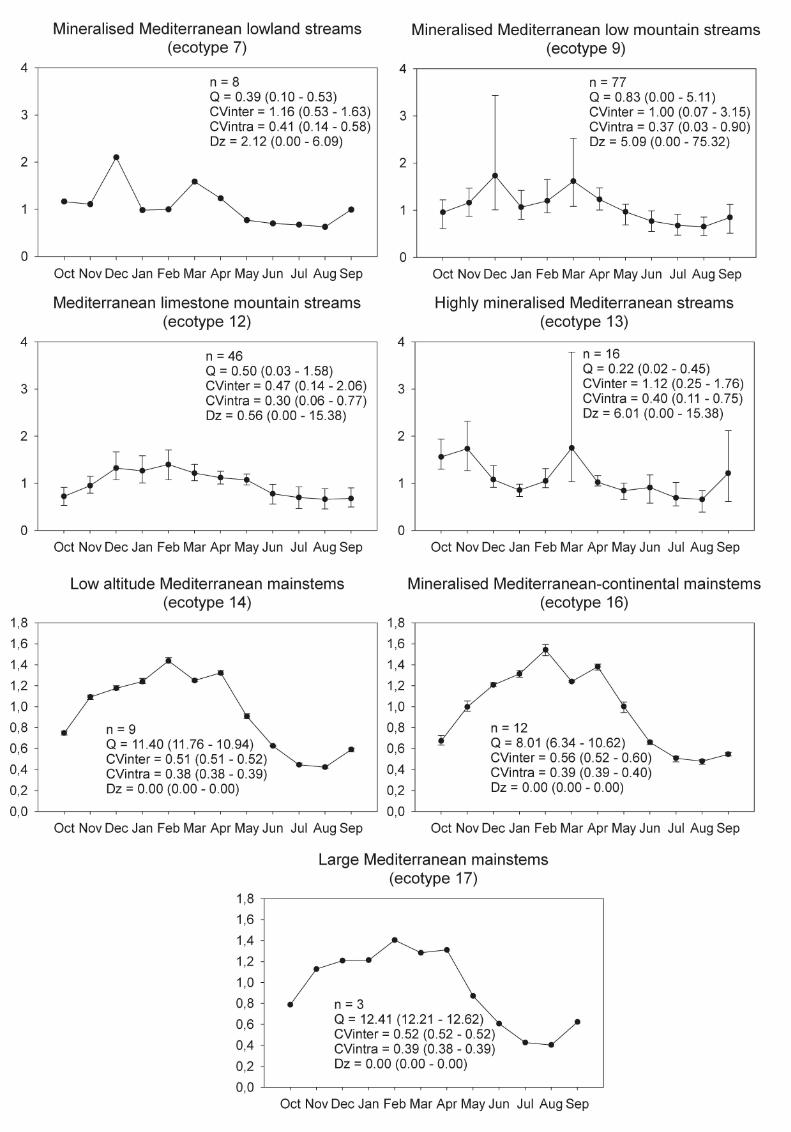
3.3 Discrimination of flow regimes by the WFD-ecotypes 1
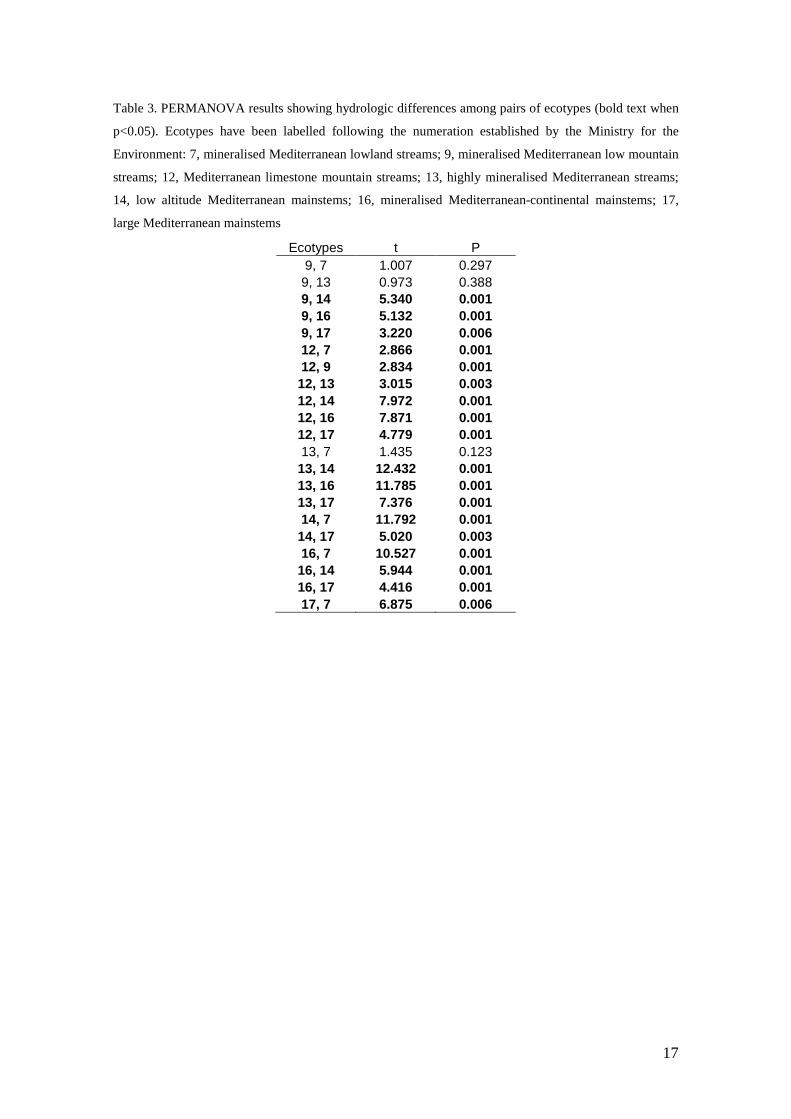
PERMANOVA pair-wise comparisons indicated significant hydrologic differences 2
(p≤0.006) among Mediterranean limestone mountain streams (ecotype 12), low altitude 3
Mediterranean mainstems (ecotype 14), mineralised Mediterranean-continental 4
mainstems (ecotype 16) and large Mediterranean mainstems (ecotype 17) (Table 3). 5
However, there were not significant differences among mineralised Mediterranean 6
lowland streams (ecotype 7), mineralised Mediterranean low mountain streams (ecotype 7
9) and highly mineralised Mediterranean streams (ecotype 13). 8
9
Mediterranean limestone mountain streams (ecotype 12) include highly karstic 10
headwaters located in the upper sector of the Segura Basin characterised by low average 11
mean annual flow and moderate peak flows in winter (Fig. 5). Low altitude 12
Mediterranean mainstems (ecotype 14), mineralised Mediterranean-continental 13
mainstems (ecotype 16) and large Mediterranean mainstems (ecotype 17) comprise 14
perennial sections of the Segura River that differ in flow magnitude, and increases 15
downstream. These ecotypes are characterised by large flows in the winter-spring period 16
and moderate intra- and inter-annual coefficients of variation (Fig. 5). However, 17
mineralised Mediterranean lowland streams (ecotype 7), mineralised Mediterranean low 18
mountain streams (ecotype 9) and highly mineralised Mediterranean streams (ecotype 19
13), all located in the medium and low (dry and semiarid) sectors of the Segura Basin, 20
presented greater zero-flow duration and inter-annual variation as well as bimodal 21
hydrographs with peak flows in autumn and spring. 22
3.4 Agreement among classifications 23
Little agreement was found between environmental and hydrologic classifications. The 24
adjusted Rand Index (ARI) was 0.09 and 0.1, respectively, for the 1st (climate) and 2nd 25
(source-of-flow) levels of the REC-Segura, whereas the WFD-ecotypes presented a 26
value of 0.1. 27
4 Discussion 28
The ability to infer hydrologic variation for river sections where unimpaired flow data 29
are not available is an important issue for water management and planning in 30
Mediterranean rivers, in general, and for developing environmental flow rules, in 31

9
particular. If environmental classifications were able to discriminate the key attributes of 1
the natural flow regime, they could define regional management units (sensu Arthington 2
et al. 2006). These classifications would then be useful for extrapolating hydrologic 3
information from streams in the same class (i.e. from gauged to ungauged streams) and 4
designing environmental flows (Snelder et al. 2005). However, their hydrologic 5
performance in our study area, as well as that of another a priori approach such as the 6
environmental regionalisation in other temperate areas (Deckers et al. 2010), was not 7
enough. 8
9
The agreement between the REC-Segura and the hydrologic classification was very low. 10
Although the first level (climate) broadly matched the NW-SE pattern of hydrologic 11
variation in the Segura Basin, seasonal dry (class 3), moderately seasonal semiarid 12
(class 4), and seasonal semiarid (class 5) streams did not discriminate hydrologic 13
variation, because dry and semiarid areas presented both perennial and intermittent flow 14
regimes. The second level (source-of-flow) only increased performance slightly. The 15
poor discrimination of karstic geology could be due to the homogeneity of the materials 16
(calcites and dolomites in the subwet sector and marls in the semiarid sector) or the 17
resolution of the information available. Therefore, further improvements in our ability to 18
explain and predict hydrologic variation may also be achieved by undertaking these 19
analyses at finer spatial scales (Sanborn and Bledsoe 2006; Stein et al. 2008), as well as 20
considering other factors. Winter (2001) stated that flow regime varies geographically in 21
response to climate (precipitation and temperature), topography, geology, land cover 22
and stream order. All of these factors are present in the REC (Snelder and Biggs 2002), 23
but those factors not considered in this study (land cover and stream order) occupy low 24
hierarchical levels (the forth and fifth, respectively) and were not described as 25
“hydrology drivers” by the author (Snelder et al. 2005; Snelder & Biggs 2002). 26
However, Peredo-Parada et al. (2011) found that the use of stream order in the REC for 27
Chilean rivers improved results. These different outcomes prove that environmental 28
variables do not necessarily reflect only hydrologic variation, which is in accordance 29
with our results, because they usually encompass more general principles concerning the 30
causes of physical variation in streams and rivers (Carlisle et al. 2010; Snelder et al. 31
2005), instead of direct hydrologic measures, and exclude significant local (e. g. reach-32
scale) factors. In any case, the use of land cover, in recognition of the importance of 33
vegetation controlling evapotranspiration and infiltration (Peel et al. 2001), was not 34

10
possible in the study area due to the impossibility of accessing this information under 1
natural conditions. 2
3
Even considering two hydrologic variables (the annual runoff coefficient and mean 4
annual discharge), the WFD-ecotypes did not fully discriminate the variability of flow 5
regimes in the basin. Hydrologic differences were found in four out of the seven 6
analysed ecotypes. Therefore, attributing the same hydrologic reference to ecotypes in 7
dry or semiarid areas (mineralised Mediterranean lowland streams, mineralised 8
Mediterranean low mountain streams and highly mineralised Mediterranean streams; 9
ecotypes 7, 9 and 13, respectively), where perennial and temporary regimes coexist, 10
could lead to the definition of erroneous environmental flow regimes. The low 11
performance of the WFD-ecotypes was not surprising, as this classification does not 12
take into account the variability of flows or the extent of droughts, giving more 13
importance to the altitude and degree of mineralisation. 14
15
In conclusion, although the REC-Segura classes and the WFD-ecotypes were able to 16
detect statistically significant differences in hydrologic regimes, they showed limited 17
discrimination of hydrologic variability and little agreement with the hydrologic 18
classification. Therefore, caution is recommended in the use of environmental 19
classifications for assessing environmental flows in the Segura Basin, as well as in other 20
Mediterranean basins with similar hydrologic characteristics. More systematic methods 21
are needed to validate and improve these classifications (Loveland and Merchant 2004), 22
as they still present uncertainty in the choice of hydrologic drivers. In this context, the 23
use of new emergent techniques, such as generalised dissimilarity modelling (GDM), 24
may optimise the ability to discriminate patterns using parallel sets of data (for a 25
biological example, see Leathwick et al. 2011). 26
Acknowledgements 27
We would like to thank the University of Murcia for its financial support to Óscar Belmar through a pre-28 doctoral grant, the Hydrographic Confederation of the Segura for providing the precipitation data as well 29 as the SIMPA model, and the Euromediterranean Institute of Water for its support to the project 30 “Hydrological classification of the rivers and streams in the Segura Basin and associated 31 macroinvertebrate communities”. 32 33 34
11
References 1 2 Alcazar J, Palau A (2010) Establishing environmental flow regimes in a Mediterranean watershed based 3 on a regional classification. J Hydrol 388:41-51 4 5 Arthington AH, Bunn SE, Poff NL, Naiman RJ (2006) The challenge of providing environmental flow 6 rules to sustain river ecosystems. Ecol Appl 16:1311-1318 7 8 Baeza D, Garcia de Jalon D (2005) Characterisation of streamflow regimes in central Spain, based on 9 relevant hydrobiological parameters. J Hydrol 310:266-279 10 11 Bejarano MD, Marchamalo M, Garcia de Jalon D, Gonzalez del Tanago M (2010) Flow regime patterns 12 and their controlling factors in the Ebro basin (Spain). J Hydrol 385:323-335 13 14 Belmar O, Velasco J, Martinez-Capel F (2011) Hydrological classification of natural flow regimes to 15 support environmental flow assessments in intensively regulated Mediterranean rivers, Segura River 16 basin (Spain). Environ Manage 47:992-1004 17 18 Bryce SA, Clarke SE (1996) Landscape-level ecological regions: linking state level ecoregion 19 frameworks with stream habitat classifications. Environ Manage 20:297-311 20 21 Carlisle DM, Falcone JA, Wolock DM, Meador MR, Norris RH (2010) Predicting the natural flow 22 regime: models for assessing hydrological alteration in streams. River Res Applic 26:118-136 23 24 CHS (2007) Estudio general sobre la Demarcación Hidrográfica del Segura. Confederación Hidrográfica 25 del Segura 26 27 Clarke KR, Gorley RN (2006) PRIMER v6: User Manual/Tutorial. PRIMER-E, Plymouth, United 28 Kingdom 29 30 Deckers DLEH, Booij MJ, Rientjes THM, Krol MS (2010) Catchment variability and parameter 31 estimation in multi-objective regionalisation of a rainfall-runoff model. Water Resour Manage 24:3961-32 3985 33 34 Detenbeck NE, Batterman SL, Brady VJ, Brazner JC, Snarski VM, Taylor DL, Thompson J, Arthur JW 35 (2000) A test of watershed classification systems for ecological risk assessment. Environ Toxicol Chem 36 19:1174-1181 37 38 Fraley C, Raftery A (2010) MCLUST Version 3 for R: Normal Mixture Modelling and Model-Based 39 Clustering. Department of Statistics, University of Washington, Seattle, USA 40
12
1 Gárfias-Soliz J, Llanos-Acebo H, Martel R (2010) Time series and stochastic analyses to study the 2 hydrodynamic characteristics of karstic aquifers. Hydrol Process 24:300-316 3 4 Hubert L, Arabie P (1985) Comparing Partitions. J Classif 2:193-218 5 6 Kennard MJ, Mackay SJ, Pusey BJ, Olden JD, Marsh N (2010) Quantifying Uncertainty in Estimation of 7 Hydrologic Metrics for Ecohydrological Studies. River Res Applic 26:137-156 8 9 Leathwick JR, Snelder T, Chadderton WL, Elith J, Julian K, Ferrier S (2011) Used of generalised 10 dissimilarity modelling to improve the biological discrimination of river and stream classifications. 11 Freshw Biol 56:21-38 12 13 Legendre P, Legendre L (1998) Numerical ecology. Elselvier, Amsterdam 14 15 Loveland TR, Merchant JM (2004) Ecoregions and ecoregionalization: geographical and ecological 16 perspectives. Environ Manage 34:1-13 17 18 Mathews R, Richter BD (2007) Application of the indicators of hydrologic alteration software in 19 environmental flow setting. J Am Water Resour Assoc 43:1400-1413 20 21 McCune B, Grace JB (2002) Analysis of ecological communities. MjM, Gleneden Beach, Oregon, USA 22 23 McCune B, Mefford MJ (1999) PC-ORD. Multivariate Analysis of Ecological Data. Version 4.41. MjM 24 Software, Gleneden Beach, Oregon, USA 25 26 Mcnamay, RA, Orth, DJ, Dolloff, CA, and Frimpong, EA (2011) A regional classification of unregulated 27 stream flows: Spatial resolution and hierarchical frameworks. River Res.Applic. 28 http://onlinelibrary.wiley.com/doi/10.1002/rra.1493/pdf 29 30 Michiels P, Gabriels D (1996) Rain variability indices for the assessment of rainfall erosivity in the 31 Mediterranean region. In: Rubio JL, Calvo A (eds) Soil degradation and desertification in Mediterranean 32 environments, Geoforma Ediciones, Logroño (Spain), pp 49-70 33 34 Monk WA, Wood PJ, Hannah DM, Wilson DA (2007) Selection of river flow indices for the assessment 35 of hydroecological change. River Res Applic 23:113-122 36 37 Monk WA, Wood PJ, Hannah DM, Wilson DA, Extence CA, Chadd RP (2006) Flow variability and 38 macroinvertebrate community response within riverine systems. River Res Applic 22:595-615 39 40
13
Nalbantis J, Tsakiris G (2009) Assessment of hydrological drought revisited. Water Resour Manage 1 23:881-897 2 3 Olden, JD, Kennard, MJ, and Pusey, BJ (2011) A framework for hydrologic classification with a review 4 of methodologies and applications in ecohydrology. Ecohydrology 5 http://onlinelibrary.wiley.com/doi/10.1002/eco.251/pdf 6 7 Olden JD, Poff NL (2003) Redundancy and the choice of hydrologic indices for characterizing 8 streamflow regimes. River Res Applic 19:101-121 9 10 Oliver JE (1980) Monthly Precipitation Distribution - A Comparative Index. Professional Geographer 11 32:300-309 12 13 Pascual JA, Año C, Sanchez-Diaz J, Masia FJ, Arnau E (2001) Valoración de la idoneidad de los índices 14 PCI y MFI para estimar la concentración y agresividad de las precipitaciones en la comunidad valenciana. 15 Revista C&G 15:77-84 16 17 Peel MC, McMahon TA, Finlayson BL, Watson FGR (2001) Identification and explanation of continental 18 differences in variability of annual runnoff. J Hydrol 250:224-240 19 20 Peredo-Parada M, Martinez-Capel F, Quevedo D, Hernandez-Mascarell B (2011) Implementation of an 21 eco-hydrological classification in chilean rivers. Gayana 75:26-38 22 23 Poff NL (1996) A hydrogeography of unregulated streams in the United States and an examination of 24 scale-dependence in some hydrological descriptors. Freshw Biol 36:71-91 25 26 Poff NL, Olden JD, Pepin DM, Bledsoe BP (2006) Placing global stream flow variability in geographic 27 and geomorphic contexts. River Res Applic 22:149-166 28 29 Poff NL, Richter BD, Arthington AH, Bunn SE, Naiman RJ, Kendy E, Acreman M, Apse C, Bledsoe BP, 30 Freeman MC, Henriksen J, Jacobson RB, Kennen JG, Merritt DM, O'Keeffe JH, Olden JD, Rogers K, 31 Tharme RE, Warner A (2010) The ecological limits of hydrologic alteration (ELOHA): a new framework 32 for developing regional environmental flow standards. Freshw Biol 55:147-170 33 34 Richter BD, Baumgartner JV, Powell J, Braun DP (1996) A method for assessing hydrologic alteration 35 within ecosystems. Conserv Biol 10:1163-1174 36 37 Richter BD, Baumgartner JV, Wigington R, Braun DP (1997) How much water does a river need? 38 Freshw Biol 37:231-249 39 40

14
Rivas-Martinez S (1983) Pisos bioclimáticos de España. Lazaroa 5:33-43 1 2 Sanborn SC, Bledsoe BP (2006) Predicting streamflow regime metrics for ungauged streams in Colorado, 3 Washington, and Oregon. J Hydrol 325:241-261 4 5 Snelder TH, Biggs BJF (2002) Multiscale River Environment Classification for water resources 6 management. J Am Water Resour Assoc 38:1225-1239 7 8 Snelder TH, Biggs BJF, Weatherhead MA (2004a) Nutrient concentration criteria and characterization of 9 patterns in trophic state for rivers in heterogeneous landscapes. J Am Water Resour Assoc 40(1):1-13 10 11 Snelder TH, Cattaneo F, Suren AM, Biggs BFJ (2004b) Is the River Environment Classification an 12 improved landscape-scale classification of rivers? J N Am Benthol Soc 23(3):580-598 13 14 Snelder TH, Biggs BJF, Woods RA (2005) Improved eco-hydrological classification of rivers. River Res 15 Applic 21:609-628 16 17 Snelder TH, Lamouroux N, Leathwick JR, Pella H, Sauquet E, Shankar U (2009) Predictive mapping of 18 the natural flow regimes of France. J Hydrol 373:57-67 19 20 Stein JL, Hutchinson MF, Pusey BJ, Kennard MJ (2008) Ecohydrological classification based on 21 landscape and climate data. In: Pusey BJ, Kennard MJ, Stein JL, Olden JD, Mackay SJ, Hutchinson MF, 22 Sheldon F (eds) Ecohydrological Regionalisation of Australia: A Tool for Management and Science. 23 Innovations Project GRU36, Final Report to Land and Water Australia, Appendix 8 24 25 Steinley D (2004) Properties of the Hubert-Arabie adjusted rand index. Psychological Methods 9:386-396 26 27 Tsakiris G, Nalbantis I, Cavadias G (2011) Regionalization of low flows based on Canonical Correlation 28 Analysis. Adv Water Resour 34:865-872 29 30 Winter TC (2001) The concept of hydrologic landscapes. J Am Water Resour Assoc 37:335-349 31
32

15
Table 1. Levels, classes and criteria used to construct the REC-Segura
Classification level Classes Mapping characteristics Category Assignment Criteria
1. Climate 1. Moderately Seasonal Subwet
Mean annual precipitation and Precipitation Concentration Index (PCI) for October
Subwet: Mean annual precipitation ≥ 600 mm
2. Moderately Seasonal Dry Dry: Mean annual precipitation = 350 - 600 mm
3. Seasonal Dry Semiarid: Mean annual precipitation = 200 - 350 mm
4. Moderately Seasonal Semiarid
Strongly Seasonal: Precipitation Concentration Index for October ≥ 20
5. Seasonal Semiarid Seasonal: Precipitation Concentration Index for October = 15 -19
6. Strongly Seasonal Semiarid Moderately Seasonal: Precipitation Concentration Index for October = 10 -14
2. Source-of-flow 1. Non karstic Percentage of karstic surface in the basin
Non karstic: Percentage of karstic surface ≤ 50 %
(geology) 2. Karstic Karstic: Percentage of karstic surface > 50 %

16
Table 2. PERMANOVA results (bold text when p < 0.05) showing hydrologic differences among pairs of
REC-Segura classes at the first (a) and second (b) hierarchical level of classification. Classes are
numbered as shown in Table 1. Note that, for the second level, two digits show the class both for the first
(climate) and the second (source-of-flow) levels, respectively.
a) Classes t P 1, 3 5.962 0.001 1, 5 6.717 0.001 1, 6 4.378 0.001 2, 1 3.238 0.001 2, 3 4.562 0.001 2, 5 5.263 0.001 2, 6 2.792 0.001 3, 6 3.198 0.002 4, 1 1.596 0.076 4, 2 1.098 0.293 4, 3 2.582 0.007 4, 5 1.915 0.037 4, 6 1.355 0.152 5, 3 0.599 0.640 5, 6 2.755 0.005
b) Classes t P
11, 12 1.391 0.141 21, 22 2.505 0.003 31, 32 1.119 0.227 41, 42 - - 51, 52 0.967 0.357 61, 62 0.721 0.530
17
Table 3. PERMANOVA results showing hydrologic differences among pairs of ecotypes (bold text when
p<0.05). Ecotypes have been labelled following the numeration established by the Ministry for the
Environment: 7, mineralised Mediterranean lowland streams; 9, mineralised Mediterranean low mountain
streams; 12, Mediterranean limestone mountain streams; 13, highly mineralised Mediterranean streams;
14, low altitude Mediterranean mainstems; 16, mineralised Mediterranean-continental mainstems; 17,
large Mediterranean mainstems
Ecotypes t P 9, 7 1.007 0.297 9, 13 0.973 0.388 9, 14 5.340 0.001 9, 16 5.132 0.001 9, 17 3.220 0.006 12, 7 2.866 0.001 12, 9 2.834 0.001 12, 13 3.015 0.003 12, 14 7.972 0.001 12, 16 7.871 0.001 12, 17 4.779 0.001 13, 7 1.435 0.123 13, 14 12.432 0.001 13, 16 11.785 0.001 13, 17 7.376 0.001 14, 7 11.792 0.001 14, 17 5.020 0.003 16, 7 10.527 0.001 16, 14 5.944 0.001 16, 17 4.416 0.001 17, 7 6.875 0.006

18
Figure legends
Fig. 1 Location of the Segura Basin and Mediterranean ecotypes present
Fig. 2 REC-Segura classification at the first (a) and second (b) hierarchical level. Classes are numbered as
shown in Table 1. Note that, for the second level, two digits show the class both for the first (climate) and
second (source of flow) levels, respectively
Fig. 3 Mean monthly flows divided by the median annual flows for the REC-Segura classes at the first
hierarchical level (climate). The numeric values correspond to the average (out of the parentheses),
minimum and maximum of the following variables: mean annual flow in m3·s-1 (Q), inter-annual
coefficient of variation (CVinter), intra-annual coefficient of variation (CVintra) and duration of zero-
flows in % (Dz)
Fig. 4 Mean monthly flows divided by the median annual flows for non-karstic and karstic moderately
seasonal dry streams. The numeric values correspond to the average (out of the parentheses), minimum
and maximum of the following variables: mean annual flow in m3·s-1 (Q), inter-annual coefficient of
variation (CVinter), intra-annual coefficient of variation (CVintra) and duration of zero-flows in % (Dz)
Fig. 5 Mean monthly flows divided by the median annual flows for the WFD-ecotypes. The numeric
values correspond to the average (out of the parentheses), minimum and maximum of the following
variables: mean annual flow in m3·s-1 (Q), inter-annual coefficient of variation (CVinter), intra-annual
coefficient of variation (CVintra) and duration of zero-flows in % (Dz)