Top-down estimates of European CH4 and N2O emissions based on four different inverse models
Upload
khangminh22Category
view
2download
0
DETAILED PROJECT REPORT FOR REHABILITATION ANDMODERNISATION OF UPPER VELLAR (VASISTANADHI) SUB BASIN
UNDER IAMWARM PROJECT
INTRODUCTION:
Government of Tamilnadu have resolved to renovate the Irrigation
systems in Tamilnadu by rehabilitating and modernizing the irrigation systems.
This endeavor is for the benefit of farming community and the rural masses.
So, the Government decided to take up this project with World Bank assistance
as an integrated program with the ac tive involvement and participation of 9 line
departments under the co -ordination of Water Resources Organization. This
World Bank assisted program is named as Integrated Agricultural Modernisation
and Water Resources Management (IAMWARM) project. This IAMW ARM
project covers all the river basins in the state except Cauvery basin. Among the
48 sub basins, 9 basins are selected for implementation of this IAMWARM
project in the first year of the project period.
The WRO Sarabanga Basin Division, Namakkal is ent rusted with the task
of preparing the estimates pertaining to the Upper Vellar (Vasistanadhi) sub
basin as a Nodal officer with the following line Department.
1. Agricultural Engineering Department
2. Agriculture Department
3. Agriculture Marketing and Ag ribusiness
4. Animal Husbandry Department
5. Tamil Nadu Agriculture University (TNAU)
6. Horticulture Department
7. Fisheries Department
8. Forest Department
9. Environmental Cell
2
Vellar basin comprises the sub basins of Vasistanadhi, Swedhanadhi,
Gomuki and Perambalur Minor Basin. This Vellar is having 6 Tributaries. They
are 1.Vasistanadhi,2.Swedhanadhi,3.Kallar 4.Chinnar, 5.Manimukthanadhi,
7.Gomuki. The total length of the river is 150km.
SUB BASIN:
Vasistanadhi is one of the sub basins in Vellar B asin. This Vasistanadhi
sub basin comprises the parts of Attur, Salem, Rasipuram and Uthangarai
revenue taluks in Salem district, Veppanthattai, Kunnam taluks in Perambalur
district and Viruthachalam, Thittakudi taluks in Cuddalore district.
Vasistanadhi originates from southern slopes of Kalvarayan hills on the
northern boundary of Attur taluk of Salem district. The initial stretch which is
flowing up to the confluence point of Kariakoil is called as Ammapalayam or
Anaimaduvu River and beyond that it is ca lled as Tumbal River. Another small
tributary which is called as Periyar River, originates in Vellagoundan Village of
Salem District. Periyar and Tumbal River confluence at Periyakrishnapuram
village in Attur taluk, below which it is called as Vasistanadhi
Vasistanadhi joins with Swedha River at 4km west of Chennai -Dindigul
NH 45 near Peraiyur in Perambalur taluk. Beyond this confluence point, the
river is called as Vellar River. Vellar River runs for a distance of 73 km in
Perambalur, Cuddalore districts and then in falls into Bay of Bengal at Pat nova
near Chidambaram in Cuddalore district.
The total length of Vasista River from the point of origin Kalvarayan hills
to the point of confluence of Vasista with Swedha is 76.70 km. The total area of
Vasista river sub basin is 1772Sq.Km.
DESCRIPTION OF THE SUB BASIN:
GENERAL:The Vellar river basin is located in the Northern part of Tamil Nadu State
in South India, between the latitudes 11° 13'N - 12 00' N and longitude 78°
13'E - 79° 47 E. This basin is in be tween Ponnaiar, Paravanar and Cauvery
3
river basins. The total area of the basin is 7520.87Sq.Km. The total length of
the river is about 150km.
The terrain lying in the Kalrayan hills, Attur Taluk of Salem District is
drained by river upper velar, Vasis ta Nadhi known as Upper Vellar joined with
to form the Vellar in the Perambalur Taluk of Permabalur District.
UPPER VELLAR SUB-BASIN
The river Vellar is having 6 tributaries. They are 1.Anaimaduvu
2.Swethanadhi 3.Kallar 4.Chinnar 5.Manimukthanadhi 6.Go mukhi. A portion of
Dharmapuri, Salem, Namakkal, Perambalur, Trichy, Villupuram and Cuddalore
districts are covered in Vellar river basin. Manimukthanadhi, which is the major
tributary, also originates from Kalrayan hills in Villupuram district, traverses
about 111 km and joins Vellar near Srimushnam in Chidambararm taluk of
Cuddalore District. Upper Vellar drains the water from the southern slopes of
the Kalrayan hills
On the northern boundary of Attur Taluk of Salem district. It originates
at an altitude of 1266m about mean sea level. At its starting point, it is known as
Anaimaduvu River and flows southwards for 23km and then south -east wards.
One reservoir constructed across Anaimaduvu River is called Anaimaduvu
reservoir. Just three kilometers below this point another tributary known as
Thumbal River, formed by two drainages viz., Karyakoil river and
Ammapalayam river flowing southwards from Kottaipatti pass on the Kalrayan
hills, joins on the left flank. Another stream called Periyar ori ginating in Jalluthu
Reserve forest 'just 8km east of Salem taluk joins this stream. As Periyar River
approaches Salem - Attur road it bends eastwards and receives on the south,
the Singipuram River. Vasistanadi then flows towards southeast for about 26km
along with boundary between Attur and Perambalur Taluk of Perambalur district
on the one aide and Vridhachalam taluk of Cuddalore district on the other. Near
Peraiyur in the Perambalur taluk, it is joined by Swetanadhi 4km to the west of

4
the Chennai - Trichy National Highway near Tholudur in Cuddalore district. In
the reach between the confluence points of Singipuram and Swetanadhi with
Vasistanadhi, the tributaries Kallar and Saval Odai join the main rive: on the left flank
and Chittar, Koraiyar, Manjani Odai and Ellar Odai on the flank join the Vasistanadhi.
The drainage area up to the confluence with the Swetanadhi is 1772 Sq km. An area
of l0572.00 hectares is irrigated through 70 tanks and 79 anicuts.
HYDROMETEOROLOGICAL CHARACTERISTICSGENERAL
The cultivated are of Tamil Nadu is being served with surface irrigation
and other area being rain fed with irrigation through wells and the remaining as
rain fed. Rainfall is the main input for the agriculture. Rainfall is received during
the two monsoon periods namely southwest and northeast. High intensity of
rainfall during monsoon periods brings heavy floods in the rivers and causes
damages to crops and loss of lives affecting the economy of the state. On the
other hand, failure of monsoon also causes crop l oss which affects livelihood of
cattle and human population
The details of the rainfall over the basin area as well as other hydro
meteorological features are very important for water resources analysis. The
basic factors, which influence agriculture, are climatologically features such as
rainfall, temperature»humidity, wind speed, sunshine and evaporation.
The study now made on the hydro meter® logical characteristics of the
Vellar river basin includes analysis of rainfall, temperature, humidity, wind sp eed
and sunshine. The study of the rainfall pattern, its distribution in time and space
its variability and probability of occurrence is highly useful for water resources
planning and also for management of the resources.
5
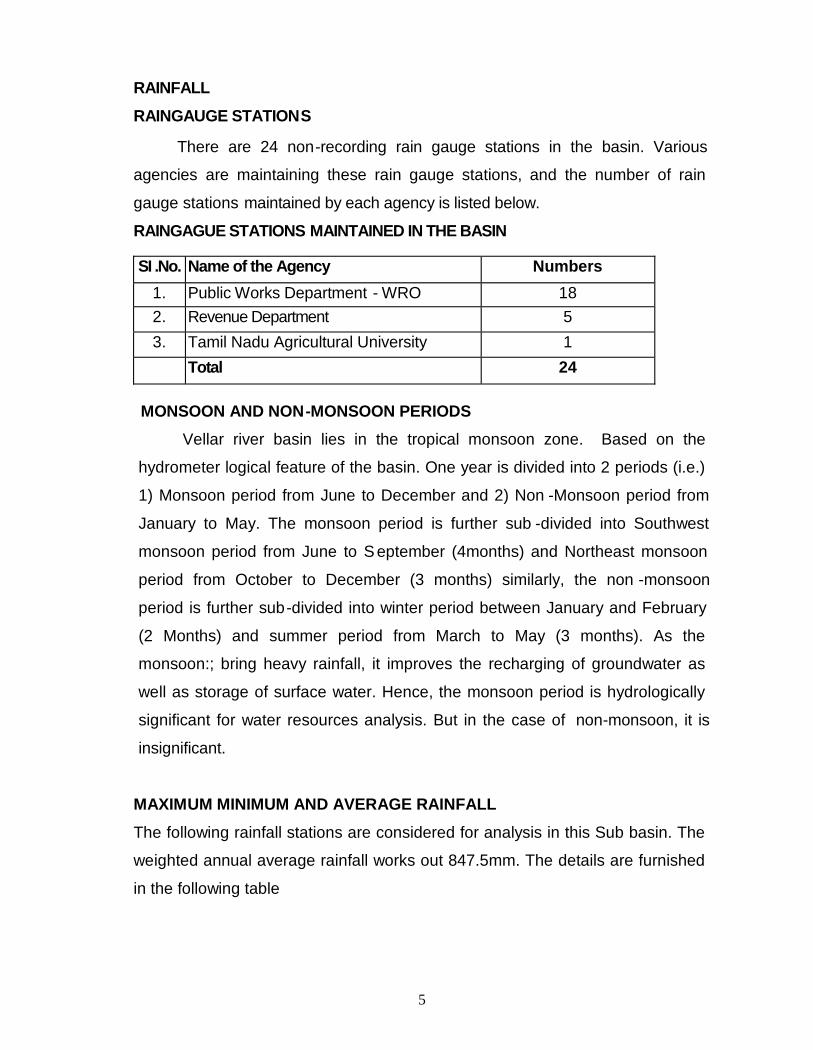
RAINFALLRAINGAUGE STATIONS
There are 24 non-recording rain gauge stations in the basin. Various
agencies are maintaining these rain gauge stations, and the number of rain
gauge stations maintained by each agency is listed below.
RAINGAGUE STATIONS MAINTAINED IN THE BASIN
SI .No. Name of the Agency Numbers1. Public Works Department - WRO 182. Revenue Department 53. Tamil Nadu Agricultural University 1
Total 24
MONSOON AND NON-MONSOON PERIODSVellar river basin lies in the tropical monsoon zone. Based on the
hydrometer logical feature of the basin. One year is divided into 2 periods (i.e.)
1) Monsoon period from June to December and 2) Non -Monsoon period from
January to May. The monsoon period is further sub -divided into Southwest
monsoon period from June to S eptember (4months) and Northeast monsoon
period from October to December (3 months) similarly, the non -monsoon
period is further sub-divided into winter period between January and February
(2 Months) and summer period from March to May (3 months). As the
monsoon:; bring heavy rainfall, it improves the recharging of groundwater as
well as storage of surface water. Hence, the monsoon period is hydrologically
significant for water resources analysis. But in the case of non-monsoon, it is
insignificant.
MAXIMUM MINIMUM AND AVERAGE RAINFALLThe following rainfall stations are considered for analysis in this Sub basin. The
weighted annual average rainfall works out 847.5mm. The details are furnished
in the following table
6
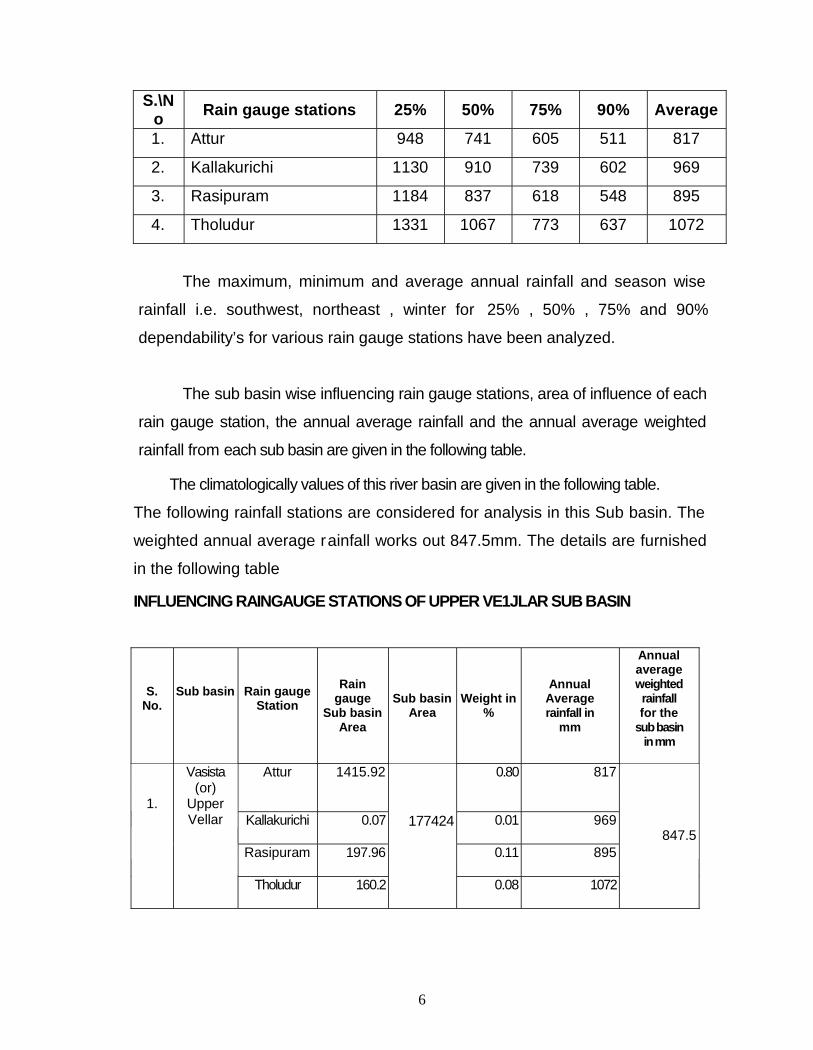
The maximum, minimum and average annual rainfall and season wise
rainfall i.e. southwest, northeast , winter for 25% , 50% , 75% and 90%
dependability’s for various rain gauge stations have been analyzed.
The sub basin wise influencing rain gauge stations, area of influence of each
rain gauge station, the annual average rainfall and the annual average weighted
rainfall from each sub basin are given in the following table.
The climatologically values of this river basin are given in the following table.
The following rainfall stations are considered for analysis in this Sub basin. The
weighted annual average rainfall works out 847.5mm. The details are furnished
in the following table
INFLUENCING RAINGAUGE STATIONS OF UPPER VE1JLAR SUB BASIN
S.\No Rain gauge stations 25% 50% 75% 90% Average
1. Attur 948 741 605 511 817
2. Kallakurichi 1130 910 739 602 969
3. Rasipuram 1184 837 618 548 895
4. Tholudur 1331 1067 773 637 1072
S.No.
Sub basin Rain gaugeStation
Raingauge
Sub basinArea
Sub basinArea
Weight in%
AnnualAveragerainfall in
mm
Annualaverageweightedrainfallfor the
sub basinin mm
Attur 1415.92 0.80 817
Kallakurichi 0.07 0.01 969
Rasipuram 197.96 0.11 895
1.
Vasista(or)
UpperVellar
Tholudur 160.2
177424
0.08 1072
847.5

7
TEMPERATURE
The meteorological features of the basin have been studied from the data
collected from above weather stations. Temperature is one of the basic factors under
climatologically features and it is one of the main parameters to calculate the cr op
water requirement (i.e., evapotranspiration). The average of minimum and maximum
temperature for the above meteorological stations have been computed and
tabulated below.
The maximum and minimum monthly mean temperature observed in the
above climatologically station are given below.
CLIMATOLOGICAL PARAMETERS
S. No. Climatologically Parameter Lekkur Managalapuram
1. Average monthly temperature max./mm.in Celsius 32.30/23.80 32.59/23.78
2. Average mear temperature in ° Celsius 28.88 27.86
3. Average minimum temperature 21.30°c(Nov.86)
23.15° c(Dec.94)
4. Average max. temperature 37.19°c(April,98)
39.98° c(June,90)
5. Average relative humidity in % 61.94 69.22
6. Average wind velocity in km/hour 5.90 4.54
7.Average pan evaporation in mm/month 189.74 179.06
8, Average Sunshine hours / day 7.39 7.41
8
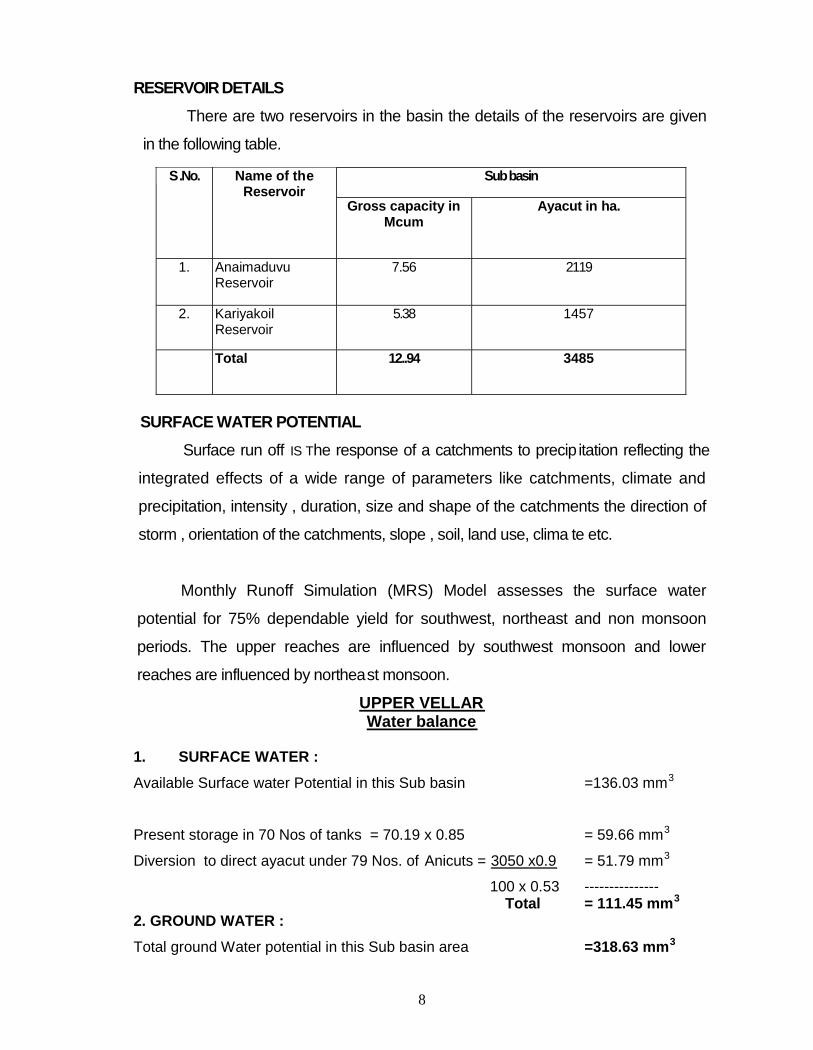
RESERVOIR DETAILSThere are two reservoirs in the basin the details of the reservoirs are given
in the following table.
Sub basinS .No. Name of theReservoir
Gross capacity inMcum
Ayacut in ha.
1. AnaimaduvuReservoir
7.56 2119
2. KariyakoilReservoir
5.38 1457
Total 12..94 3485
SURFACE WATER POTENTIALSurface run off IS The response of a catchments to precip itation reflecting the
integrated effects of a wide range of parameters like catchments, climate and
precipitation, intensity , duration, size and shape of the catchments the direction of
storm , orientation of the catchments, slope , soil, land use, clima te etc.
Monthly Runoff Simulation (MRS) Model assesses the surface water
potential for 75% dependable yield for southwest, northeast and non monsoon
periods. The upper reaches are influenced by southwest monsoon and lower
reaches are influenced by northeast monsoon.
UPPER VELLARWater balance
1. SURFACE WATER :
Available Surface water Potential in this Sub basin =136.03 mm3
Present storage in 70 Nos of tanks = 70.19 x 0.85 = 59.66 mm3
Diversion to direct ayacut under 79 Nos. of Anicuts = 3050 x0.9 = 51.79 mm3
100 x 0.53 --------------- Total = 111.45 mm3
2. GROUND WATER :Total ground Water potential in this Sub basin area =318.63 mm3

9
Consider the important blocks in this Sub basins:
1. Valapady Block = 7.958
2. P.N. palayam Block = 21.756
3. Attur Block = 19.218
4. Thalaivasal Block = 19.653
5. Veppanthattai Block = 5.235
Total = 73.82 mm3
------------Ground Water available in the command area under consideration = 73.82 mm3
Total Surface water + Ground Water Potential = 185.270 mm3
Water Demand
Sl no Description Water Demandwithout Project
Water DemandWith Project
1 Irrigation Water Demand 127.39 111.54
2 Drinking Water Demand 16.96 16.96
3 Live Stock Demand 24.03 24.03
4 Industries Water Demand 15.22 15.22
5 Total Water Demand 183.60 167.75
6 Surplus 1.67 17.52
There are 79 anicuts and 70 tanks in this sub basin, of this, 16 Anicuts
are located in the main river and 63 anicuts located are in tributaries. Out of 70
tanks, 49 tanks are PWD fed by anicuts and 21 Panchayat Union tanks are self
catchment tanks serving the needs of irrigation in the sub basin. The total
irrigated area of this sub basin is 10,572 ha. Details of tanks and Anicuts are
Listed below.
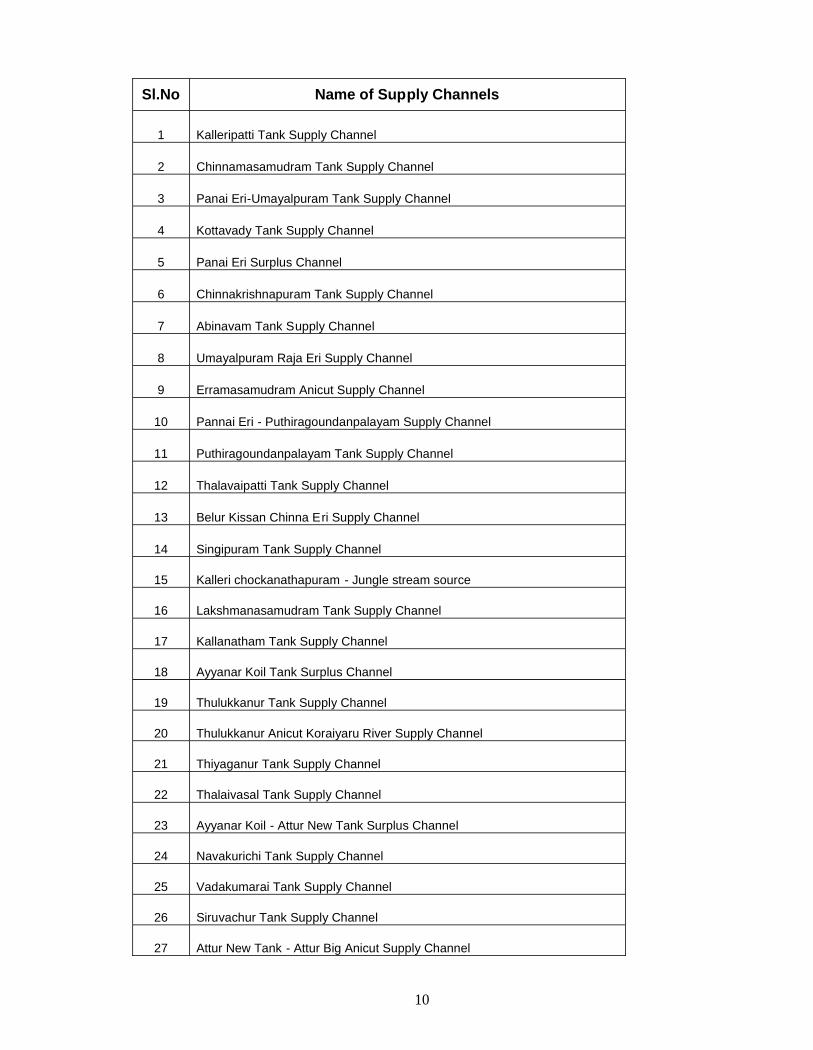
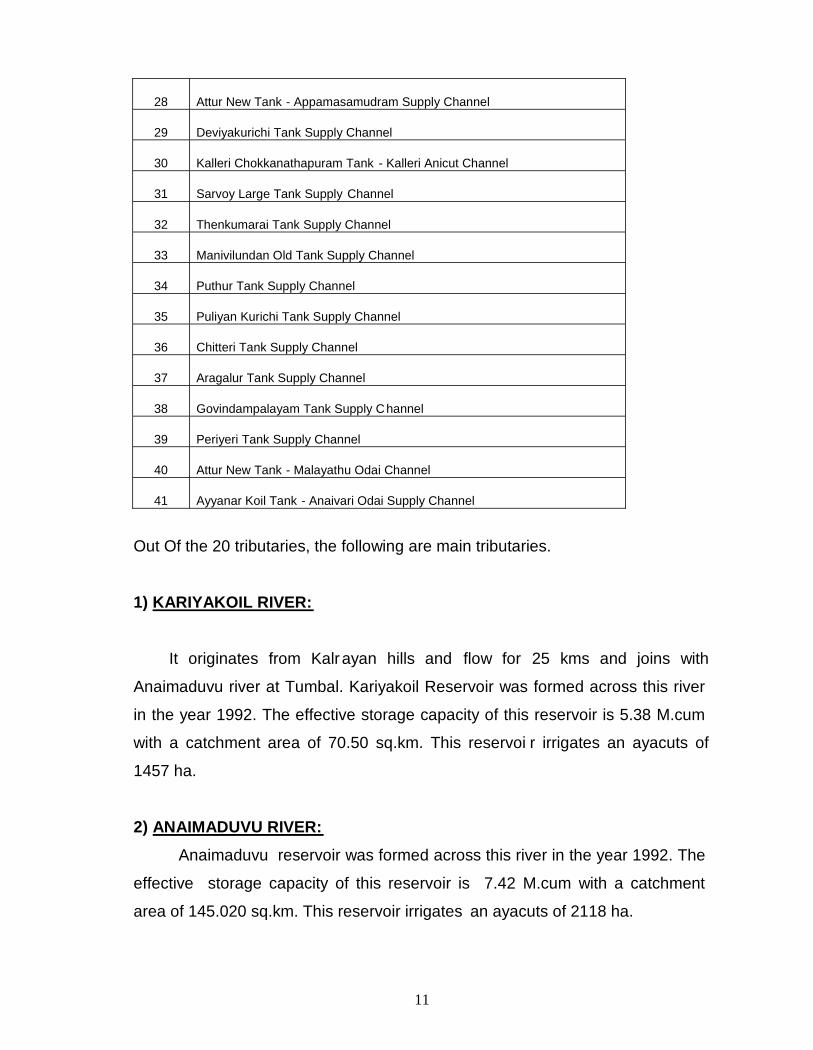
10
Sl.No Name of Supply Channels
1 Kalleripatti Tank Supply Channel
2 Chinnamasamudram Tank Supply Channel
3 Panai Eri-Umayalpuram Tank Supply Channel
4 Kottavady Tank Supply Channel
5 Panai Eri Surplus Channel
6 Chinnakrishnapuram Tank Supply Channel
7 Abinavam Tank Supply Channel
8 Umayalpuram Raja Eri Supply Channel
9 Erramasamudram Anicut Supply Channel
10 Pannai Eri - Puthiragoundanpalayam Supply Channel
11 Puthiragoundanpalayam Tank Supply Channel
12 Thalavaipatti Tank Supply Channel
13 Belur Kissan Chinna Eri Supply Channel
14 Singipuram Tank Supply Channel
15 Kalleri chockanathapuram - Jungle stream source
16 Lakshmanasamudram Tank Supply Channel
17 Kallanatham Tank Supply Channel
18 Ayyanar Koil Tank Surplus Channel
19 Thulukkanur Tank Supply Channel
20 Thulukkanur Anicut Koraiyaru River Supply Channel
21 Thiyaganur Tank Supply Channel
22 Thalaivasal Tank Supply Channel
23 Ayyanar Koil - Attur New Tank Surplus Channel
24 Navakurichi Tank Supply Channel
25 Vadakumarai Tank Supply Channel
26 Siruvachur Tank Supply Channel
27 Attur New Tank - Attur Big Anicut Supply Channel
11
28 Attur New Tank - Appamasamudram Supply Channel
29 Deviyakurichi Tank Supply Channel
30 Kalleri Chokkanathapuram Tank - Kalleri Anicut Channel
31 Sarvoy Large Tank Supply Channel
32 Thenkumarai Tank Supply Channel
33 Manivilundan Old Tank Supply Channel
34 Puthur Tank Supply Channel
35 Puliyan Kurichi Tank Supply Channel
36 Chitteri Tank Supply Channel
37 Aragalur Tank Supply Channel
38 Govindampalayam Tank Supply Channel
39 Periyeri Tank Supply Channel
40 Attur New Tank - Malayathu Odai Channel
41 Ayyanar Koil Tank - Anaivari Odai Supply Channel
Out Of the 20 tributaries, the following are main tributaries.
1) KARIYAKOIL RIVER:
It originates from Kalrayan hills and flow for 25 kms and joins with
Anaimaduvu river at Tumbal. Kariyakoil Reservoir was formed across this river
in the year 1992. The effective storage capacity of this reservoir is 5.38 M.cum
with a catchment area of 70.50 sq.km. This reservoi r irrigates an ayacuts of
1457 ha.
2) ANAIMADUVU RIVER:Anaimaduvu reservoir was formed across this river in the year 1992. The
effective storage capacity of this reservoir is 7.42 M.cum with a catchment
area of 145.020 sq.km. This reservoir irrigates an ayacuts of 2118 ha.
12
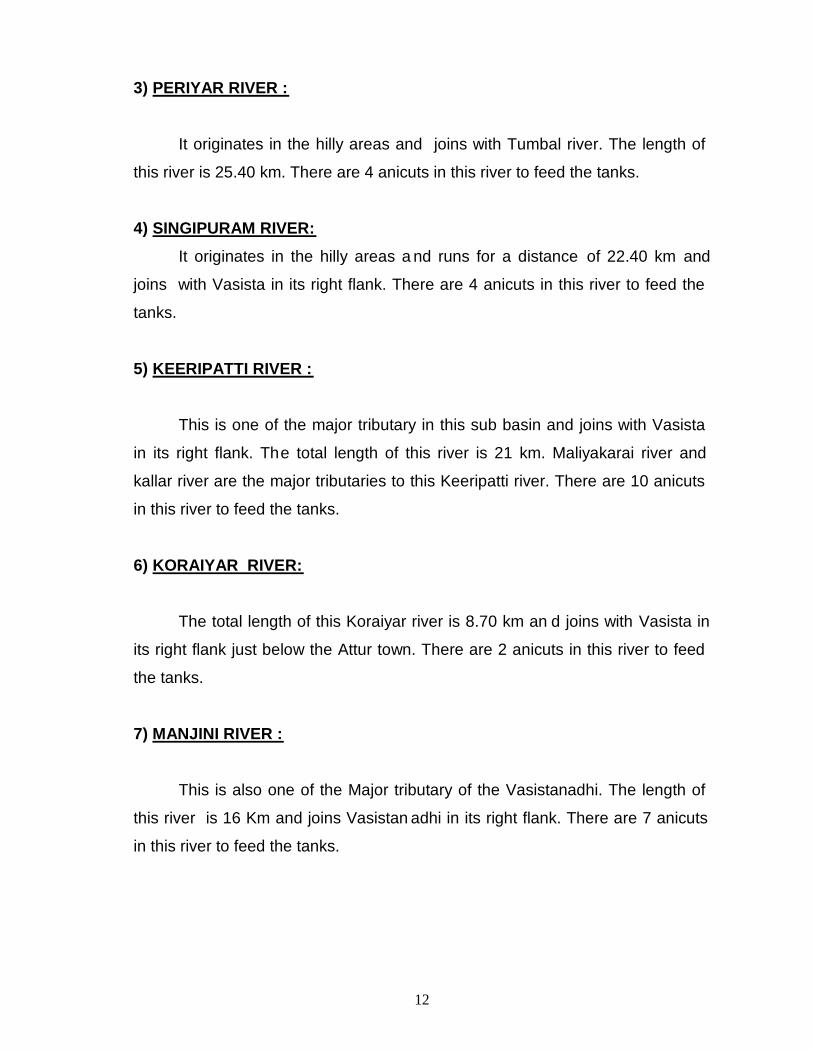
3) PERIYAR RIVER :
It originates in the hilly areas and joins with Tumbal river. The length of
this river is 25.40 km. There are 4 anicuts in this river to feed the tanks.
4) SINGIPURAM RIVER:It originates in the hilly areas a nd runs for a distance of 22.40 km and
joins with Vasista in its right flank. There are 4 anicuts in this river to feed the
tanks.
5) KEERIPATTI RIVER :
This is one of the major tributary in this sub basin and joins with Vasista
in its right flank. The total length of this river is 21 km. Maliyakarai river and
kallar river are the major tributaries to this Keeripatti river. There are 10 anicuts
in this river to feed the tanks.
6) KORAIYAR RIVER:
The total length of this Koraiyar river is 8.70 km an d joins with Vasista in
its right flank just below the Attur town. There are 2 anicuts in this river to feed
the tanks.
7) MANJINI RIVER :
This is also one of the Major tributary of the Vasistanadhi. The length of
this river is 16 Km and joins Vasistan adhi in its right flank. There are 7 anicuts
in this river to feed the tanks.

13
NECESSITY OF THIS PROJECT:
In this Vasistanadhi sub basin, most of the people rely only on the
agricultural and agricultural related activities. Therefore, this irrigation s ystem
play a major role in their life. However at present, this system and its tanks
serve at most 30 to 40% of its potential. This is due to the century old
system, requiring Rehabilitation and Modernisation to attain and utilize its full
potential. Obviously, there is no new source to harness, so the available source
are required to be revamped to utilize it to its optimum. This was very well
replicated in the Micro level studies conducted in this sub basin area by the
IWS, Chennai.
PROPOSALS:
The main focus of this IAMWARM project is for optimum use of the
available water potential by improving and modernizing the existing irrigation
system. In this process of modernization the following works are to be taken up,
by water resources organization with an out lay of Rs 2447.7Lakhs.
1) Rehabilitation and Modernisation of Anicut.
2) Improvements and selective linning to supply channels.
3) Rehabilitation and Modernisation of Irrigation tanks.
4) Construction of check dams for ground water recharge.
5) a) ANICUTS:Upstream and Downstream flood banks are proposed to be strengthened
and standardized. All masonry structures such as body wall, Abutments, wing
walls, Aprons and cutoff walls are proposed to be revamped.

14
b) SUPPLY CHANNELS:Earthen supply channels are proposed to be desilted to attain the
designed carrying capacity. The banks of the supply channels are proposed to
be strengthened and standardized by providing flood banks. It is also proposed
to provide cross masonry works such as bed dam, culvert etc. wherever
necessary and to desilt the supply channels whereever required.
c) TANKS:Some of the tank bunds are below standard. These are proposed to b e
strengthened and standardized by providing Flood banks. Provisions are made
to repair/ reconstruct the sluices and weirs of the tanks. Inside the tanks , the
leading channels are proposed from the deep bed level to inlet of sluices
Necessary Provision for renewel of S.G. Shutters are also made in this
Estimate
D) BEDDAMS:It is proposed to construct 11 nos. of bed dams, 7 nos of Check dams
1nos of percolation pond to charge the ground water in this sub basin area.
In the process of modernization the following works are likely to be taken
up by Water Resources Organisation with an outlay of Rs. 2447.7 lakhs.
1) Water Resources Organisation:
Rehabilitation and Modernisation of Irrigation Tanks
Construction and Reconstruction of Anicuts & Sluices
Improvements to supply channels
Construction of Bed dams And Check Dams for ground water
improvement
Catchment Treatment Works
AGRICULTURAL ENGINNERING DEPARTMENTWill carryout the following works for extending the benefits of irrigation
facility to the farmers, with an outlay of Rs. 980.19 lakhs.
Implementation of On Farm Development Works.
Implementation of Micro Irrigation System.
15
Demonstration & Supply of Farm Machineries.
Augmentation of Ground Water Potential by providing Farm Ponds
Construction of Check dams to conserve soil loss.
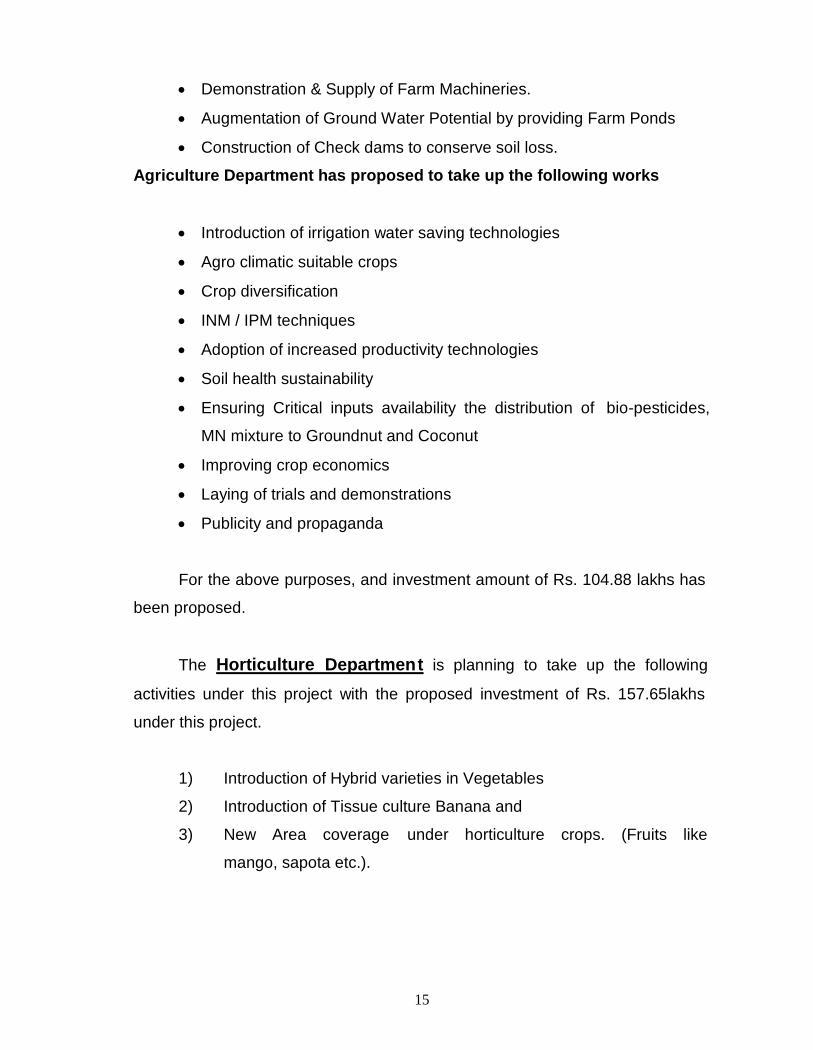
Agriculture Department has proposed to take up the following works
Introduction of irrigation water saving technologies
Agro climatic suitable crops
Crop diversification
INM / IPM techniques
Adoption of increased productivity technologies
Soil health sustainability
Ensuring Critical inputs availability the distribution of bio-pesticides,
MN mixture to Groundnut and Coconut
Improving crop economics
Laying of trials and demonstrations
Publicity and propaganda
For the above purposes, and investment amount of Rs. 104.88 lakhs has
been proposed.
The Horticulture Department is planning to take up the following
activities under this project with the proposed investment of Rs. 157.65lakhs
under this project.
1) Introduction of Hybrid varieties in Vegetables
2) Introduction of Tissue culture Banana and
3) New Area coverage under horticulture crops. (Fruits like
mango, sapota etc.).
16
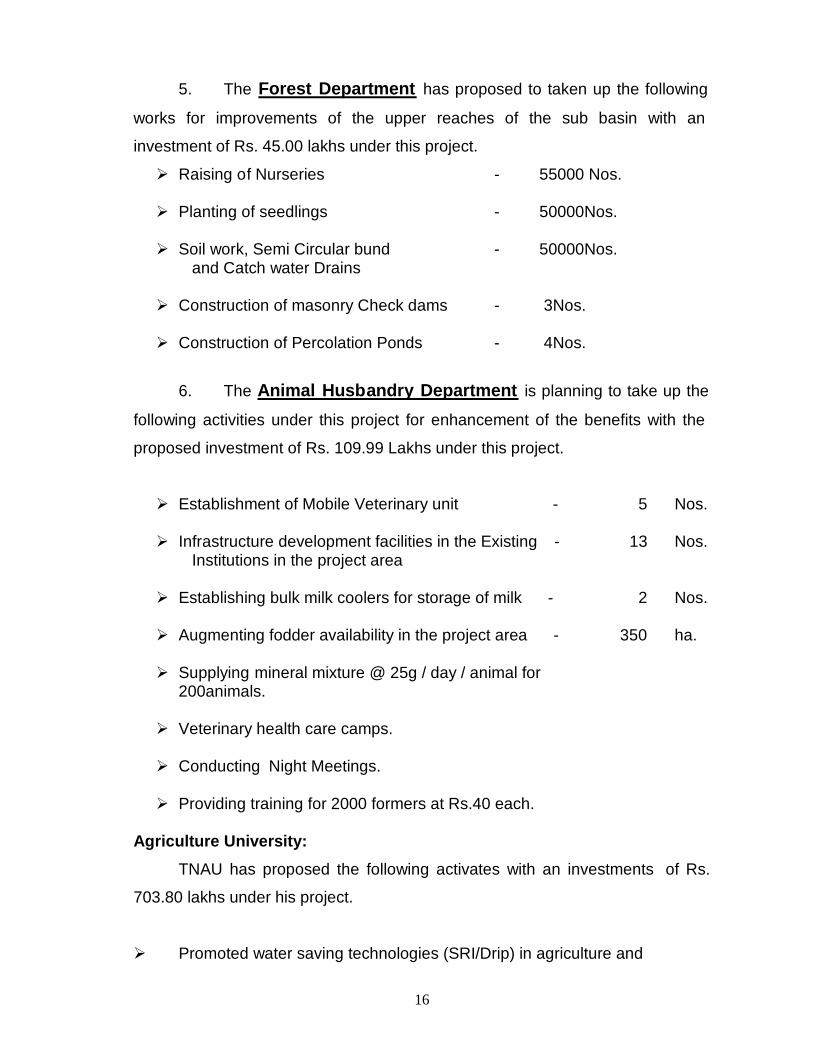
5. The Forest Department has proposed to taken up the following
works for improvements of the upper reaches of the sub basin with an
investment of Rs. 45.00 lakhs under this project.
Raising of Nurseries - 55000 Nos.
Planting of seedlings - 50000Nos.
Soil work, Semi Circular bund - 50000Nos. and Catch water Drains
Construction of masonry Check dams - 3Nos.
Construction of Percolation Ponds - 4Nos.
6. The Animal Husbandry Department is planning to take up the
following activities under this project for enhancement of the benefits with the
proposed investment of Rs. 109.99 Lakhs under this project.
Establishment of Mobile Veterinary unit - 5 Nos.
Infrastructure development facilities in the Existing - 13 Nos. Institutions in the project area
Establishing bulk milk coolers for storage of milk - 2 Nos.
Augmenting fodder availability in the project area - 350 ha.
Supplying mineral mixture @ 25g / day / animal for200animals.
Veterinary health care camps.
Conducting Night Meetings.
Providing training for 2000 formers at Rs.40 each.
Agriculture University:TNAU has proposed the following activates with an investments of Rs.
703.80 lakhs under his project.
Promoted water saving technologies (SRI/Drip) in agriculture and

17
Horticultural crops for large scale adoption.
Increase the crop productivity and area by diversification and
Intensification
Improved production technologies for groundnut by adopting INM
Improved production technologies for maize
Castor improved agro techniques
Mission mode project
System of Rice Intensification and Site specific nutrient management
Mission mode approach in Drip cum fustigation and improved agro
techniques in tapioca
Agricultural Marketing and Agribusiness Department:This department has poised to take up the following activities to promote
marketing activities with an investment of Rs. 80.50 lakhs under this
project.
Construction of thrashing floor - 10 Nos. Storage Go down - 5 Nos. Collection centre - 2 Nos. Pack House - 1 Nos Agri Business Centre - 1 Nos
Fisheries Department:Fisheries Departement has proposed the following activiti es with an
investment of Rs. 29.00 lakhs under this project.
Acuaculture is irrigation tanks for establishing fish seed banks
Acuaculture is Farm ponds and
Fish seed Rearing in cages
Environmental Cell:Under this head, an investment of Rs. 20.00 lakhs ha d been proposed to
carryout the following works.
Environmental and social monitoring Soiled waste management Environmental and social awareness building, The overall efficiency of the system is expected to increase after
implementation of the project with the support of agricultural andallied sectional personal.
18
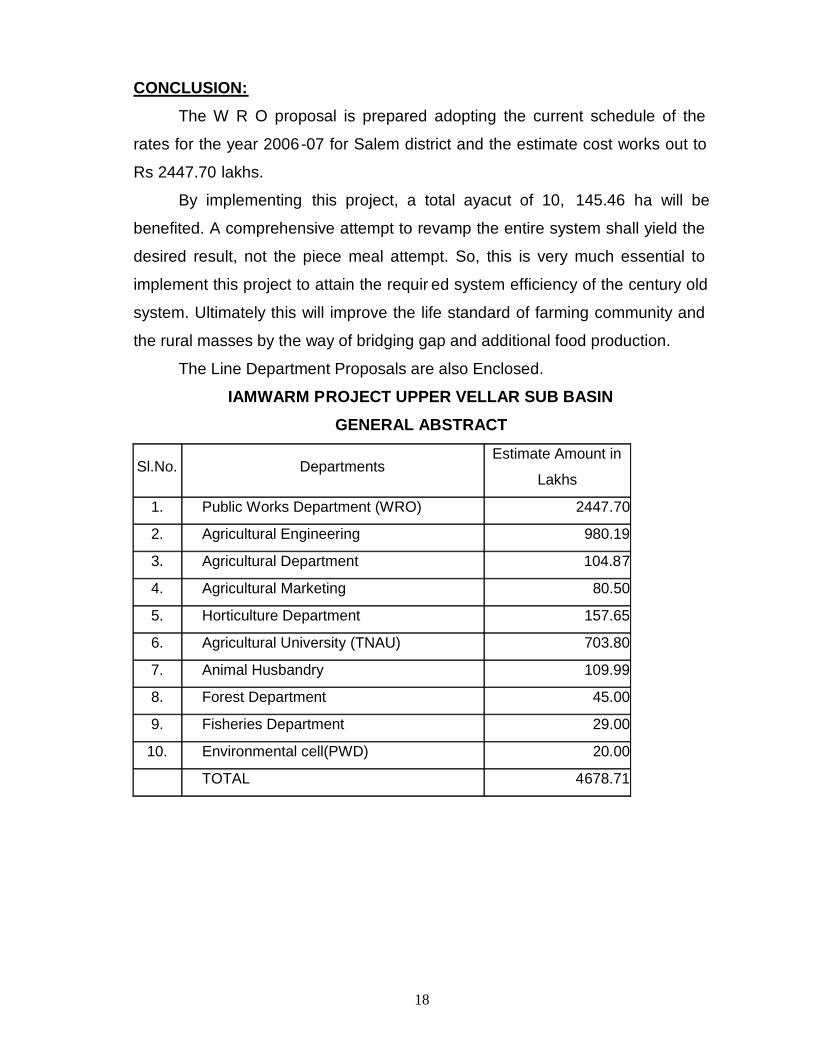
CONCLUSION:The W R O proposal is prepared adopting the current schedule of the
rates for the year 2006-07 for Salem district and the estimate cost works out to
Rs 2447.70 lakhs.
By implementing this project, a total ayacut of 10, 145.46 ha will be
benefited. A comprehensive attempt to revamp the entire system shall yield the
desired result, not the piece meal attempt. So, this is very much essential to
implement this project to attain the requir ed system efficiency of the century old
system. Ultimately this will improve the life standard of farming community and
the rural masses by the way of bridging gap and additional food production.
The Line Department Proposals are also Enclosed.
IAMWARM PROJECT UPPER VELLAR SUB BASINGENERAL ABSTRACT
Sl.No. DepartmentsEstimate Amount in
Lakhs
1. Public Works Department (WRO) 2447.70
2. Agricultural Engineering 980.19
3. Agricultural Department 104.87
4. Agricultural Marketing 80.50
5. Horticulture Department 157.65
6. Agricultural University (TNAU) 703.80
7. Animal Husbandry 109.99
8. Forest Department 45.00
9. Fisheries Department 29.00
10. Environmental cell(PWD) 20.00
TOTAL 4678.71

19
Rupees Forty six crores seventy eight lakhs and seventy onethousand only.
Sl.No.
Contents Page No.
Profiles of Vellar Basin and UpperVellar Sub -Basin
Existing Agriculture Crop Scenario in UpperVellar Sub -Basin
Existing Farm Practices in UpperVellar Sub -Basin
Constraints observed in UpperVellar Sub-Basin
Diversification/Future vision Proposed
Challenges Thrown Up By Diversification/Area Expansion
Solutions and Recommendations
Details and Significance of Work Components
Tankwise Proposed Work Components In Upp erVellar Sub-Basin andAbstract of Work Components of Agricultural Engineering Dept.
Anticipated Benefits
Annexures:
District Map, District-Basin Map Vellar Basin Map,
Upper Vellar Sub-Basin Map, Administrative Maps
Details of Anicuts, Tanks And Ayacut Area,
Area wise Cropping Pattern.
I
II
Index Map Showing The Proposed Work Components of
Agricultural Engineering Department.
20
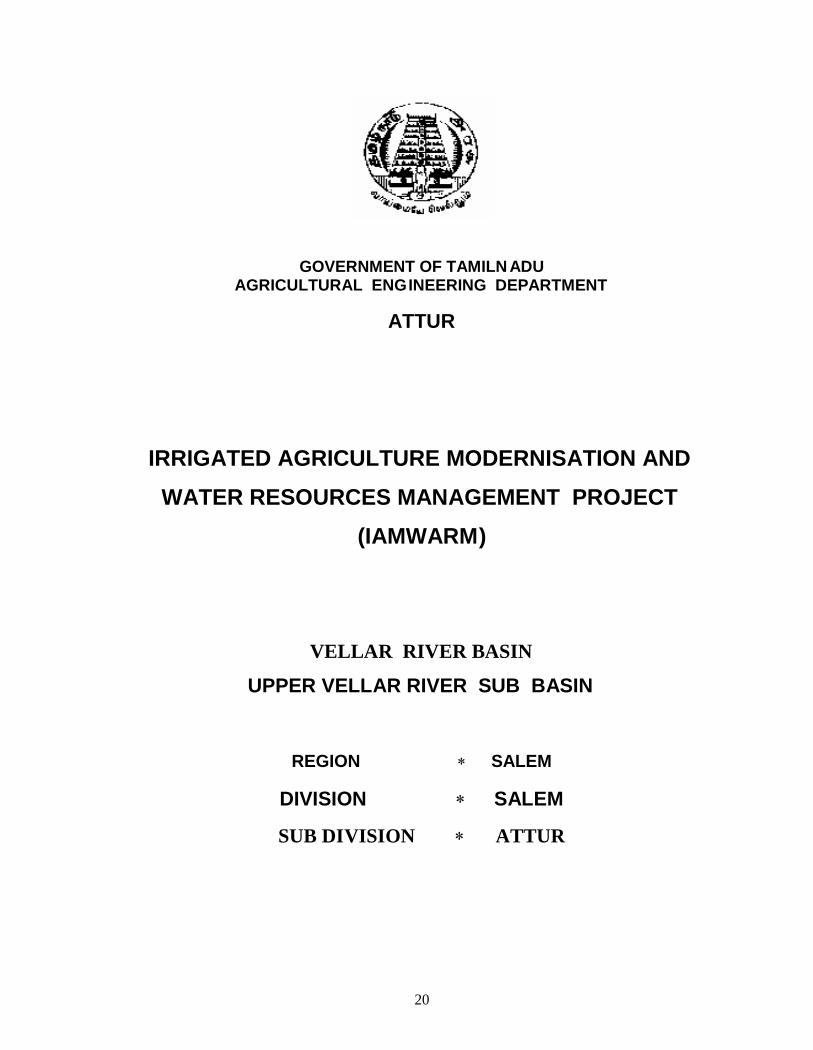
GOVERNMENT OF TAMILN ADUAGRICULTURAL ENGINEERING DEPARTMENT
ATTUR
IRRIGATED AGRICULTURE MODERNISATION ANDWATER RESOURCES MANAGEMENT PROJECT
(IAMWARM)
VELLAR RIVER BASIN
UPPER VELLAR RIVER SUB BASIN
REGION SALEM
DIVISION SALEM
SUB DIVISION ATTUR

21
AGRICULTURAL ENGINEERING DEPARTMENTIAMWARM PROJECT PROPOSALS
UPPER VELLAR SUB BASININTRODUCTION :
Upper Vellar sub-basin is one of the 9 sub-basins selected for 1st phase of
implementation of IAMWARM project in TAMILNADU under WORLD BANK assistance.
This sub-basin has the registered ayacut area of 10572 Ha. 10 years average rainfall
at the basin is 810mm. But during 2005, the sub -basin received 899mm. The important
crops grown in the sub-basin are paddy, sugarcane, tapioc a, maize, cotton,
vegetables, pulses, arecanut, groundnut, coconut etc.
BASIN DETAILS:
VELLAR RIVER BASIN :Vellar River originates in Chitteri hills of Dharmapuri District in Tamilnadu
in the name of Anaimaduvu river and Thumbal river.Singipu ram river originates in
Jalluttu reserve forest area in Salem District joins in this Anaimaduvu River and it
flows in Salem, Perambalur and Cuddalore Districts and it drains into Bay of Bengal.
Main Tributaries are Vasista nadhi , Swetha nadhi, Cinnar, Anaivari
Odai and Manimutha river..Karia koil Reservoir, Anaimaduvu Reservoir and
Gomuki Reservoir are the three Major Reservoirs located in this basin.
The River confluence with Bay of Bengal , In Parankipettai near
Chidambarm in cuddalure District.
UPPER VELLAR SUB BASIN :Upper vellar known as vasista river originates from Kalrayan hills and
confluence with Swetha river near Tholudur in Perambalur and becomes Vellar
river.
Chittar river, Manjini river and Ammampalayam river are major tributaries to
Vasista river. Chittar river and Manjini river are originates from paithur reserve
forest and Ammampalayam river originates from Kalrayan Hills.
Length of the Vasista river is 107km s. Drainage area is 412.80 sq.km.
Vasista river sub basin covers Valapadi, Pethanaickenpalayam , Attur and
Thalaivasal blocks of Salem District.
Attur and Pethanaickenpalayam blocks are over ground water exploited
blocks in this sub basin.
22
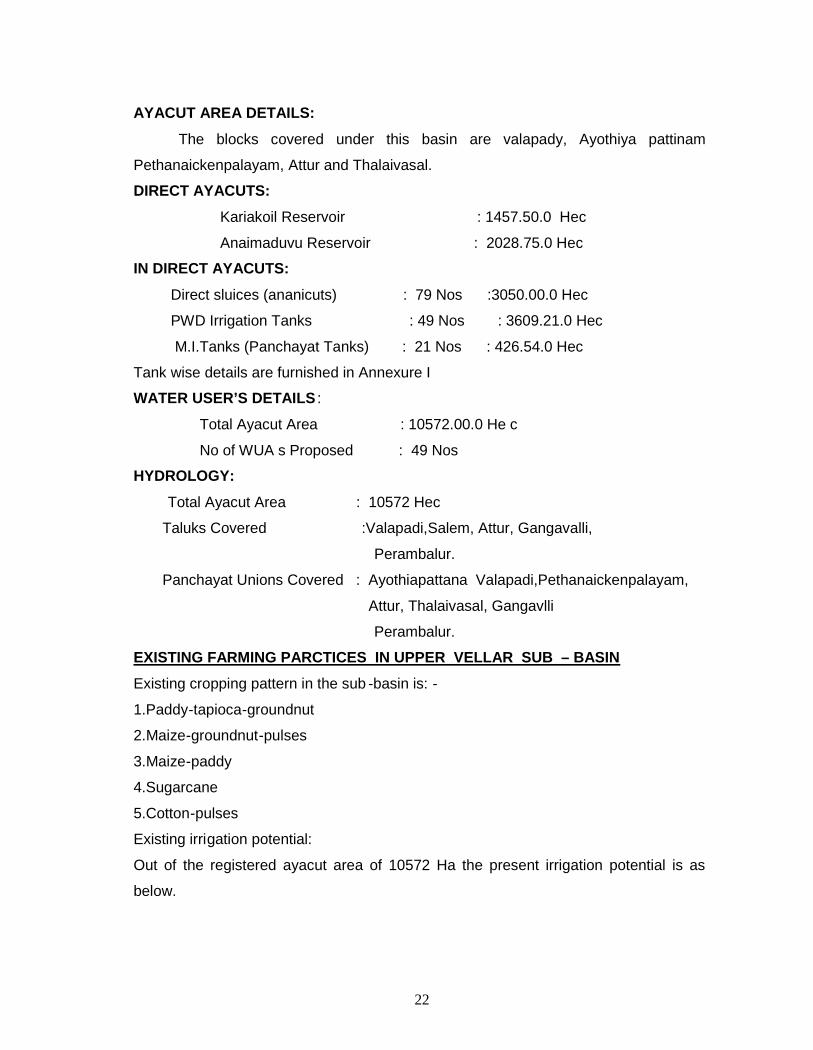
AYACUT AREA DETAILS:
The blocks covered under this basin are valapady, Ayothiya pattinam
Pethanaickenpalayam, Attur and Thalaivasal.
DIRECT AYACUTS:
Kariakoil Reservoir : 1457.50.0 Hec
Anaimaduvu Reservoir : 2028.75.0 Hec
IN DIRECT AYACUTS:
Direct sluices (ananicuts) : 79 Nos :3050.00.0 Hec
PWD Irrigation Tanks : 49 Nos : 3609.21.0 Hec
M.I.Tanks (Panchayat Tanks) : 21 Nos : 426.54.0 Hec
Tank wise details are furnished in Annexure I
WATER USER’S DETAILS :
Total Ayacut Area : 10572.00.0 He c
No of WUA s Proposed : 49 Nos
HYDROLOGY:
Total Ayacut Area : 10572 Hec
Taluks Covered :Valapadi,Salem, Attur, Gangavalli,
Perambalur.
Panchayat Unions Covered : Ayothiapattana Valapadi,Pethanaickenpalayam,
Attur, Thalaivasal, Gangavlli
Perambalur.
EXISTING FARMING PARCTICES IN UPPER VELLAR SUB – BASIN
Existing cropping pattern in the sub -basin is: -
1.Paddy-tapioca-groundnut
2.Maize-groundnut-pulses
3.Maize-paddy
4.Sugarcane
5.Cotton-pulses
Existing irrigation potential:
Out of the registered ayacut area of 10572 Ha the present irrigation potential is as
below.
23
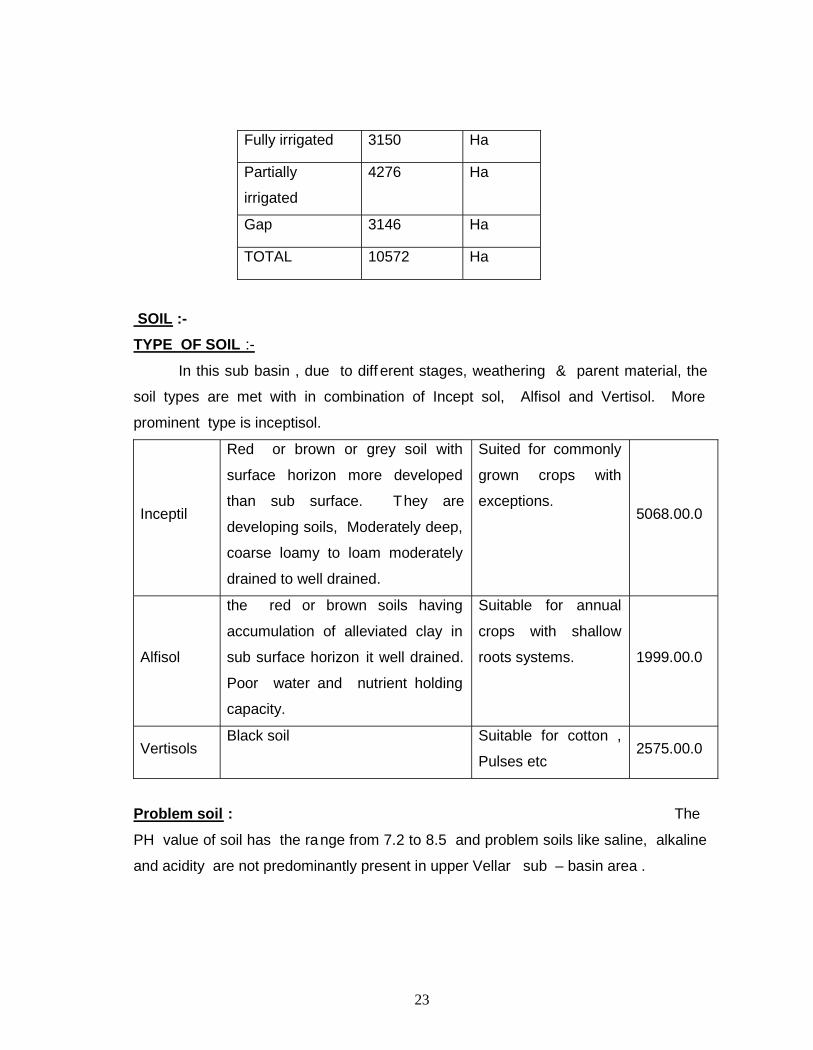
Fully irrigated 3150 Ha
Partially
irrigated
4276 Ha
Gap 3146 Ha
TOTAL 10572 Ha
SOIL :-TYPE OF SOIL :-
In this sub basin , due to diff erent stages, weathering & parent material, the
soil types are met with in combination of Incept sol, Alfisol and Vertisol. More
prominent type is inceptisol.
Inceptil
Red or brown or grey soil with
surface horizon more developed
than sub surface. They are
developing soils, Moderately deep,
coarse loamy to loam moderately
drained to well drained.
Suited for commonly
grown crops with
exceptions.5068.00.0
Alfisol
the red or brown soils having
accumulation of alleviated clay in
sub surface horizon it well drained.
Poor water and nutrient holding
capacity.
Suitable for annual
crops with shallow
roots systems. 1999.00.0
VertisolsBlack soil Suitable for cotton ,
Pulses etc2575.00.0
Problem soil : The
PH value of soil has the range from 7.2 to 8.5 and problem soils like saline, alkaline
and acidity are not predominantly present in upper Vellar sub – basin area .
24
WATER: IRRIGATION PRACTICES :-
The farmers of Upper vellar sub – basin follow flood irrigation method a nd
adopt field to field irrigation while using tank water. During non – seasonal periods,
they use well water for irrigation in furrow systems. In tank ayacut area the adoption
of micro irrigation systems and other type of specialized irrigation ar e in minimum
area. The farmers do not adopt conjunctive usage of surface and ground water.
ON FARM :-The condition of distributor canals, supply channels are below standards.
They are not lined up to standard specifications. There are no flow m easurement
devices. the condi8tion of field channels are in damaged condition and also not in
proper alignment. The irrigation system is being maintained only by PWD / WRO
Department. The Water user Associations are under formation stage and el ection
formalities are to be finalized.
LAND HOLDINGS :-The details of agriculturist (farmers) based on the land holdings of upper
velar sub basin is given below :
Category Size of holdings Numbers Percentage
Marginal Below 1.00 ha 8352 71.47%
Small 1.00 – 2.00 Ha 2590 22.16%
Medium 2.00 – 5.00 ha 545 4.66%
Big 5.0 ha & above 198 1.71%
Total 11685 100%
LEVEL OF MECHANIZATION :The preparatory cultivation is being done by the tractors for wet plugging. The
Level of mechanization in respect of transplanting, seed sowing, inter cultivation is
very poor. There is no awareness among the farmers regarding usage of agricultural
machinery for paddy transplanter, seed drills, weeder etc. In respect of plant
protection, the farmers use knapsack and power sprayers. For harvesting, the
farmers started using combine harvester due to acute labour problems. the farmers
are unaware of reapers, multi crop thrashers etc. The farmers do not have sufficient
thrashing floors and drying ya rds for post harvesting operations. In the upper velar
sub – basin area, there are 750 tractors, 65 Power tillers, 10 Seed drills, 600

25
sprayers and about 2400 bullock carts available for carrying out farm operations,
transport of materials and agricultural produce from villages to the towns.
LABOUR :
As per the 2001 census the total population of Upper velar sub – basin area is
about 3,08,000 among them, about 34% of population is agriculture laborers. In
view of heavy industrialization viz. Sago factories in the Upper velar sub – basin area,
the labour shortage during seasonal period is much acute. The labour force prefers
to go to industries due to higher salaries as compared to farm operations and income.
Migration of labour to other professions like mason, artisans etc due to intermittent
agricultural operations in view of monsoon failures or scanty rainfall.
PRACTICES – GROUND REALITIES :-There is no adoption of proper fertigation operation by the farming community
in upper velar sub – basin . Lot of information on INM/IPM is to be imparted to the
farmers for attaining more farm productivity. There are no proper farm roads for
transporting of harvested produces and the farmers use tank bunds for transpiration.
CONSTRAINTS OBSERVED IN UPPER VELLAR SUB – BASIN:The Walk through surveys have been carried out by the line departments
viz … Agricultural Engineering, Agricultural Department have carried out walk
though survey along with the PWD officials exclusi vely in each tank. During
walkthrough surveys and interactions with the ayacut farmers, the following
constraints have been widely observed.
Lack of efficient on farm water management.
Poor infra structure facilities.
Poor / Nil maintenance of field channels.
No correlation between available water and cropping pattern being followed
Excess water received at a given point of time, not stored and utilized.
Non – adoption of modern micro irrigation methods and new agricultural
practices.
Inadequate farm mechanization.
In adequate coordination of among rural agencies, Government
departments and other financial institution etc.
Lower crop yield.
Low field application efficiency.
26
Traditional method of farming.
Excess use of chemical fertilizers and pesticides.
Inadequate post harvest management facilities.
DIVERSIFICATION / FUTURE VISION PROPOSED IN UPPER VELLAR SUB – BASIN:-
In order to achieve more cropping intensity, water saving technologies and
optimum cropping pattern should be followed in order to achieve the maximum
profitability per unit of water available, by implementing the work components
proposed by PWD, Agricultural Engineering, Agriculture, Horticulture, Animal
Husbandry, Fisheries departments. Thus, integrated development approach is
essential to attain the desired results.
In order to address the problems /grievances evinced by the farming community,
the following features should be incorporated in the project for entire developmen t of
upper vellar sub – basin.
1. Promotion of conjunctive use of surface and ground water.
2. Assuring supply of water at 3R (Right quantity, Right time and Right Place)
3. Devising water saving technologies.
4. Consolidation of fragmented landholdin gs through WUA.
5. Introduction of Micro Irrigation system essentially for the gap areas under Agri/
Horti crops proposed by the respective departments.
6. Augmenting the ground water potential by provision of rainwater harvesting
structures like farm ponds in tail end areas of the M.I. Tanks.
7 .Adoption of optimum cropping pattern to achieve maximum cropping intensity.
8. Promotion of farm mechanization for effective farm operations.
9. Rejuvenation of irrigation wells for augmentation of irrigation potential for second
and subsequent crops.
10. Imparting training and skill development to WUA through adaptive trial research
plots, demonstration plots on water management, irrigation agriculture
technologies, farm machinery, post harvest management, micro irrigation system
maintenance, rain water harvesting etc.
11.Provision of alternative / diversified activities like Fisheries Development, Fodder
development, Livestock management, SHG promotion for sust ained income and
uplift of socio – economic status of the farming community.

27
CHALLENGES THROWN UP BY DIVERSIFICAITON /AREA EXSPANSION ; -
To achieve the diversification, the farmers should be trained and educated to
know the following features:
1. Equity distribution of irrigation water from head reach to tail reach.
2. Rotational water supply system.
3. Measurement of irrigation water at each outlets.
4. Significance of Micro irrigation system implementation.
5. Mechanization of farm operations .
6. Rejuvenation of depleted irrigation wells.
7. Catchments area treatment
8.Consolidation of fragmented land holdings.
9.Maintenance of proposed structures by the line departments.
10. Contribution to be made for the beneficiary oriented work compone nts.
SOLUTIONS AND RECOMMENDATIONS ;-To redress the problems / grievances explained by the ayacut farmers, the
solutions should be arrived, for this, active participation of ayacut farmers who are
water users, is essentially needed. The Water user s Associations are proposed to
be formed on village basis by PWD as per the prescribed rules. 49 WuAs are to be
formed in Upper velar sub – basin.
On the basis of the interactions with the ayacut farmers, the following work
components are recommended by the field personnel of Agricultural Engineering
Department and got oral consent from them. Accordingly, the tank wise work
components are arrived to implement the project.
Suitable cropping pattern to be evolved based on the available water and for
agricultural/horticulture crops, micro irrigation system is to be implemented to enhance
the application efficiency and to fetch more productivity.
Demonstration and supply of farm machineries and equipments like power tiller,
Tranplanter, Weeder, Seed drills, Rotary tillers, Reapers, Multi crop thrashers etc to
save time and labour during farm operations.
Provision of farm ponds in specific areas such as tail end of the ayacut areas
where shortage of irrigation water prevails. Farm ponds are water harvesting
structures which would facilitate supplementary irrigation of crops in lean periods,
augment ground water potential and to facilitate the farmer to undertake fish culture
for additional income .

28
DETAILS OF DEVELOPMENT COMPONENTS PROPOSED:
In the IAMWARM project, the following work components are proposed on the
basis of needs and requirements of water users/beneficiary farmers in view of
achieving the project objectives and uplifting the socio economic status of the farmers
of the upper vellar sub-basin.
MICRO IRRIGATION:
The Micro Irrigation System components are proposed in accordance with
the cropping pattern proposed by the Agriculture and Horticulture Departments in their
DPR for Banana, Mango, Sappota, Coconut, sugar cane, vegetables, Arecanut and
Tapioca, subject to the assurance of cropping by the concerned departments and
availability of water sources. The remaining farmers would be motivated to visit the
adjoining areas to witness the benefits of precision farming components so tha t the
same may be replicated in their fields.
The benefits of MIS are increase in crop yield, productivity, savings in irrigation
water, input items like fertilizer and labour, increase in crop area with available water,
controlled weed growth etc., By imp lementation of MIS, the gap area will be brought
under cultivation. The beneficiaries shalll contribute 10% of the total cost of MIS and
will be deposited as corpus fund for maintenance. TNAU has proposed MIS for 500 Ha
under adaptive research trial demo p lots( i.e 250 Ha in Sugarcane and 250 Ha in
Tapioca )and it is not overlapped with the area proposed by AED under MIS.
29
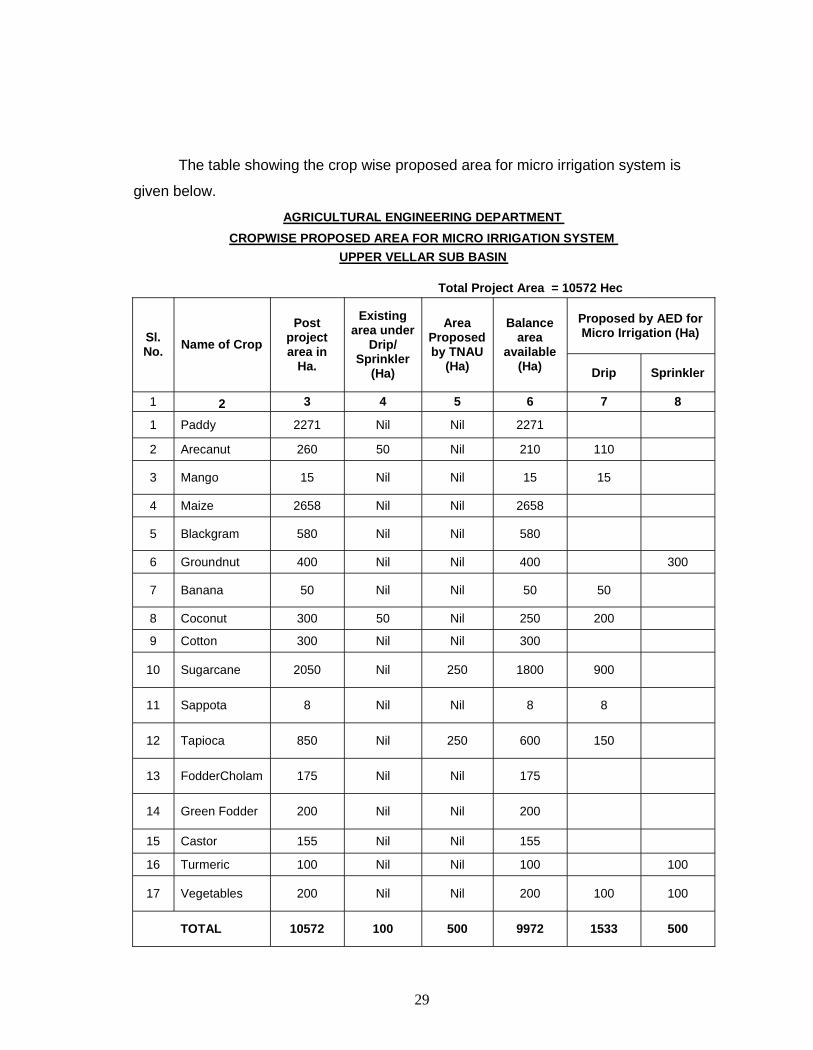
The table showing the crop wise proposed area for micro irrigation system is
given below.
AGRICULTURAL ENGINEERING DEPARTMENTCROPWISE PROPOSED AREA FOR MICRO IRRIGATION SYSTEM
UPPER VELLAR SUB BASIN
Total Project Area = 10572 Hec
Proposed by AED forMicro Irrigation (Ha)Sl.
No. Name of CropPost
projectarea in
Ha.
Existingarea under
Drip/Sprinkler
(Ha)
AreaProposedby TNAU
(Ha)
Balancearea
available(Ha) Drip Sprinkler
1 2 3 4 5 6 7 8
1 Paddy 2271 Nil Nil 2271
2 Arecanut 260 50 Nil 210 110
3 Mango 15 Nil Nil 15 15
4 Maize 2658 Nil Nil 2658
5 Blackgram 580 Nil Nil 580
6 Groundnut 400 Nil Nil 400 300
7 Banana 50 Nil Nil 50 50
8 Coconut 300 50 Nil 250 200
9 Cotton 300 Nil Nil 300
10 Sugarcane 2050 Nil 250 1800 900
11 Sappota 8 Nil Nil 8 8
12 Tapioca 850 Nil 250 600 150
13 FodderCholam 175 Nil Nil 175
14 Green Fodder 200 Nil Nil 200
15 Castor 155 Nil Nil 155
16 Turmeric 100 Nil Nil 100 100
17 Vegetables 200 Nil Nil 200 100 100
TOTAL 10572 100 500 9972 1533 500
30
DRIP IRRIGATION SYSTEM:Drip irrigation system with fertigation component a re proposed over an area 433
Ha for horticultural crops like banana, Sapota, Arecanut, Tapioca, Mango, and
Vegetables and for agricultural crops like coconut, sugarcane to the extent of 1100 ha
and the total extent under Drip Irrigation System would be 1 533 Ha.
Sugarcane is one of the commercial crop with higher water requirement of
2000-2500mm. Unlike surface method of irrigation, the water use efficiency is
extremely higher in drip method of irrigation, as this technology helps to supply the
required quantity of irrigation water directly to root zone besides reducing conveyance
evaporation and distribution losses. The Agriculture Department and TNAU has
recommended latest Pit Method for sugarcane for higher yields. Pit Method is more
effective only with the adoption of Drip Irrigation System. Under Pit method, the yield
will be increased by two to three times of nominal yield obtained from conventional
method. To minimize the usage of groundwater and to save the labor costs, the drip
irrigation system shall be adopted for sustained income to the farmers.
Sugarcane is the major crop next to Paddy grown in an extent of 2050 Ha
which would be increased to 600 Ha in post project period. Out of this, 50% area i.e.
900Ha are proposed under drip irr igation with fertigation. Besides, 80 % of Coconut
area to an extent of 200 Ha. out of 250 Ha. would be brought under drip irrigation with
fertigation. 50 Ha of the Existing area under Drip Irrigation in coconut is now proposed
for Fertigation.
Department of Horticulture & Plantation crops has proposed an increase in area
under Arecanut to 60 Hec with an existing area of200Hec to 260 Hec. To irrigate these
crops, Drip irrigation system is proposed for 110 Ha. for arecanut crop. 50Ha of
Arecanut Crop is already covered under Drip Irrigation System.
Department of Horticulture & Plantation crops has proposed to cover an area of
53 ha. under cultivation of Fruit crops like Mango, Banana & Sapota .Entire area of 53
ha is hence proposed to be irrigated with Drip irrigation system over a period of 3
years.
31
Department of Horticulture & Plantation crops and Agricultural Department have
proposed to cover an area of 850 ha. under cultivation of Tapioca. In this 150 Hec of
area is proposed for drip irrigation under Agricultural Engineering Department and the
balance area is proposed by Tamilnadu Agricultural University.
SPRINKLER IRRIGATION SYSTEM:
Sprinkler irrigation system component is proposed for vegetables,Groundnut,and
Turmeric. Groundnut an importa nt edible oilseed crop is usuallyraised with check
basin method of irrigation consuming about 550 mm of water. The Pulses, cotton and
other vegetables and Flowers consume 350 - 800 mm. Possibility of water saving and
yield enhancement is assured by Micro Irrigation System for these crops. Besides
saving 35 - 40 % of water requirement this Micro Irrigation System enables higher soil
profile moisture content and greater leaf water potential and resulted in better
expression of growth and yield parameters. It has to planned to cover Groundnut (300
Hec), Vegetables (100 Hec) and Turmeric (100 Hes) under sprinkler irrigation. The
benefits of the micro irrigation systems will be demonstrated to the other farmers in
such a way that they realize the benefits, so t hat they will switch over to the micro
irrigation systems in subsequent years. The unit costs adopted are as per Govt. of
India guidelines adding installation cost and earthwork for respective crop spacings.50
% of the cost will be GOI cost and the balance 50 % will be the World Bank cost. 10 %
of the estimate cost will be collected from farmers as Corpus Fund and deposited in
WUA account. Further maintenance of the micro irrigation systems will be done using
the interest accrued from the Corpus Funds.
PRECISION FARMING:
Precision farming is a farm practice, in which, all inputs such as water, seed,
nutrients, fertilizers, plant protection chemicals, other production technologies, are
supplied in optimum quantity at right time in right manner to get the high est possible
yield. Fertigation is a system wherein application of plant nutrients to a crop is done
through drip irrigation. By adopting Fertigation practices through drip irrigation, 25%
savings of fertilizers and complete utilisation of applied nutrie nts by the plants is
32
noticed by farmers as reported by TNAU. The Horticulture Department has proposed
Demos for vegetable crops in Valapadi, Singipuram, Kalicheetiyur,
Ramanaickenpalayam, Appmmasamudram, Ammampalayam, Kammakkapalayam,
Pattuthurai, Sivasankarapuram, Siruvachur and Aragalur Villages. In these Villages
Precision Farming has proposed for 100 Hec of Vegetable crops which will be 100%
funded from the project .. Agricultural Engineering Department will install Drip Irrigation
for the Vegetable crops.
The tank wise/crop wise area proposed under the above components are
furnished in annexure. II
FARM MECHANISATION:
To promote and demonstrate the farm mechanization among the farmers, the
labour and time saving agricultural machinery and implements shall be distributed to
the Water Users’ Associations (WUA) (100% funding) to attain more farm productivity.
These implements are proposed on popularization mode. These implements shall be
hired out to the beneficiaries by the WUA and hire charges will b e prescribed by the
WUA. The collected hire charges will be utilized for maintenance mechanism.
1. Maize and Groundnut are the major crops proposed to be cultivated in 2658
ha. And 1850 Ha respectively in this basin. To introduce Mechanised cultivation
practices among the farmers, the following advanced implement Tractor operated
Seed Drill 25 Nos is proposed at a rate of 1 no for 160 Ha of proposed area and to be
supplied to the progressive Water Users Association. The WUA will hire out the
implements to farmers on nominal charges and meet the maintenance expenditure.
2. Sugar cane is another major crop cultivated in the sub basin. For pitting
cultivation method Post hole Digger 10 Nos is proposed. To de - root the sugarcane
roots Rotavators are used. By usage of Rotavators the soil texture will be maintained
its character. The WUA will hire out the implements to farmers on nominal charges
and meet the maintenance expenditure.
3. Tapioca is a popular crop in Upper Vellar area. B ut the farmers could not get
the knowledge of their produce. In tapioca the water content is the main factor to fix
the cost of tapioca. To measure the correct water content point scales are proposed.
The WUA will hire out the implements to farmers on nom inal charges and meet the
maintenance expenditure.
33
BURRIED PVC PIPE LINES FOR WATER CONVEYANCE AND FOR SPRINKLERIRRIGATION:
Adopting new pattern of irrigation(conjunctive use of surface and ground water)
i.e., linking of all sluices of the tank by PVC pipe lines and construction of sump for
storage of surface water, provision of community well and to store the ground water in
the above said sump in non-season periods and installation of drip/sprinkler irrigation
by utilizing the water stored in the sump using hydrants. As a demonstrative model
Lakshnamasamudram Tank has been selected (where no assured supply of
irrigation water to all the parts of the ayacut areas) for linking of sluices, construction of
sump, provision of community bore well an d to install the drip and sprinkler irrigation.
10 % of the estimate cost will be farmer’s contribution and the balance 90 % will be
World Bank cost. During midterm appraisal the Buried Pipeline system will be
evaluated and based on the results the same wi ll be replicated in other tank
commands.
FARM PONDS:
The Farm Ponds are ideal water harvesting structures, proposed in tail end
areas of the ayacut area. The drained water and surplus irrigation water shall be
stored in the Farm Ponds during monsoon seaso ns. Unexpected heavy run off
received during summer seasons shall also be harvested in these Farm Ponds. During
the critical stage of crops (before harvesting stage) when irrigation water could not be
extended, the water stored in Farm Ponds shall be util ized as life saving irrigation. This
will give assured yield of crops for the farmers.
Besides, the Farm Ponds shall act as Fish ponds for Fish Production giving
additional income to the farmers of the tail end. The Fisheries Department has
proposed Fisheries Development activities in 46 Farm Ponds and Fish Culture would
yield income of Rs.10,000/ - per crop to the farmer. 51 nos. of Farm Ponds are
proposed @ Rs.40,000/-. The Farmers who opted for Farm Ponds would be
motivated for adopting Drip / Sprinkler irrigation for raising their crops.

34
The contribution @ 10% of the total cost shall be collected from the
beneficiaries of the farm pond for works and the remaining 90% will be borne by world
bank.
35
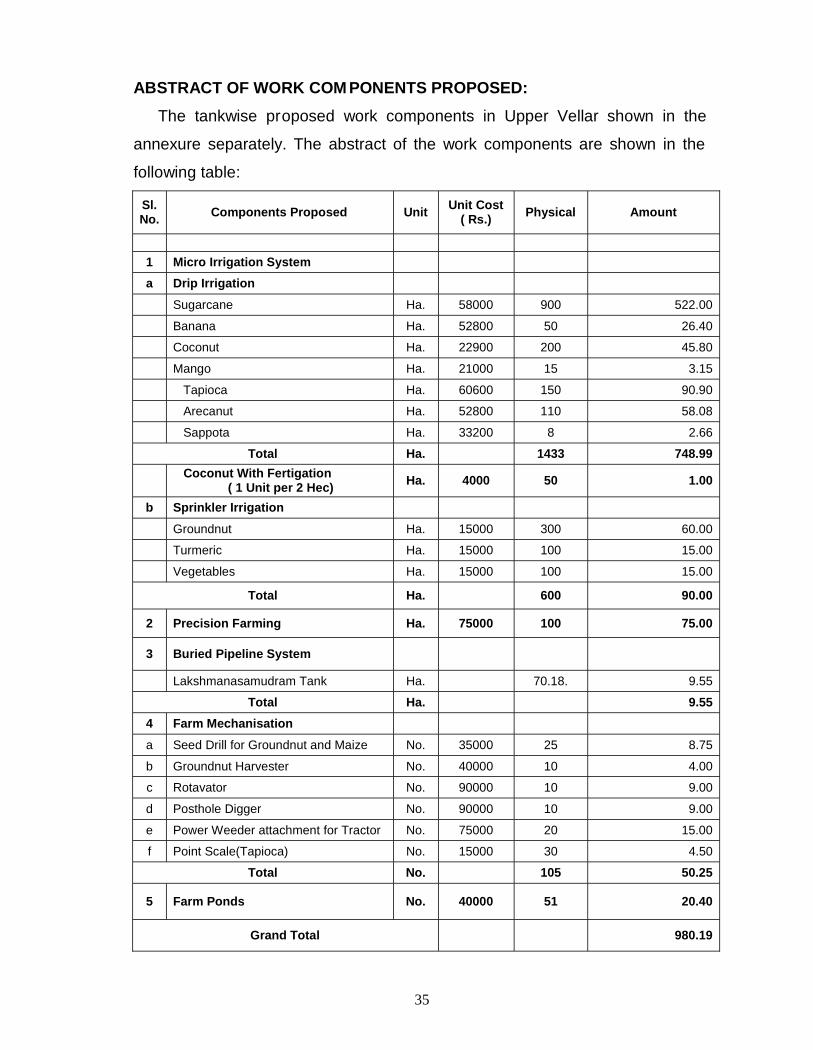
ABSTRACT OF WORK COM PONENTS PROPOSED:The tankwise proposed work components in Upper Vellar shown in the
annexure separately. The abstract of the work components are shown in the
following table:
Sl.No. Components Proposed Unit Unit Cost
( Rs.) Physical Amount
1 Micro Irrigation Systema Drip Irrigation
Sugarcane Ha. 58000 900 522.00
Banana Ha. 52800 50 26.40
Coconut Ha. 22900 200 45.80
Mango Ha. 21000 15 3.15
Tapioca Ha. 60600 150 90.90
Arecanut Ha. 52800 110 58.08
Sappota Ha. 33200 8 2.66
Total Ha. 1433 748.99 Coconut With Fertigation ( 1 Unit per 2 Hec) Ha. 4000 50 1.00
b Sprinkler IrrigationGroundnut Ha. 15000 300 60.00
Turmeric Ha. 15000 100 15.00
Vegetables Ha. 15000 100 15.00
Total Ha. 600 90.00
2 Precision Farming Ha. 75000 100 75.00
3 Buried Pipeline System
Lakshmanasamudram Tank Ha. 70.18. 9.55
Total Ha. 9.554 Farm Mechanisationa Seed Drill for Groundnut and Maize No. 35000 25 8.75
b Groundnut Harvester No. 40000 10 4.00
c Rotavator No. 90000 10 9.00
d Posthole Digger No. 90000 10 9.00
e Power Weeder attachment for Tractor No. 75000 20 15.00
f Point Scale(Tapioca) No. 15000 30 4.50
Total No. 105 50.25
5 Farm Ponds No. 40000 51 20.40
Grand Total 980.19
36
BENEFITS ANTICIPATED:The following benefits will be derived from ayacut area development
works under IAMWARM project:
1.Improved irrigation efficiency resulting in enhanced farm productivity
per unit of irrigation water.
2.The Gap area is bridged.
3.Sustained farm income to the farming community.
4.The farm productivity per unit area is increased.
5.Increase in cropping intensity.
6.Improvement in socio-economic status of the farmers.
CONTRIBUTION BY THE BENEFICIARIES:
The beneficiaries are motivated to contribute for the works component
proposed for their effective participation in the project. The work components like
Micro Irrigation System implementation are individual oriented benefit schemes and so
it was insisted to contribute 50% contribution during WUA/Farmers’ meeting. But, the
farmers expressed that they could only contribute 10% of the total cost in view of their
socio economic status and 5% in the case of SC/ST farmers. Hence, the beneficiary
contribution may be fixed as 10%.in respect of common benefited/community oriented
works such as Bore wells with energisation, 10% contributions shall be collected as
beneficiaries’ contribution which is appraised with the ayacut farmers during WUA
meeting.
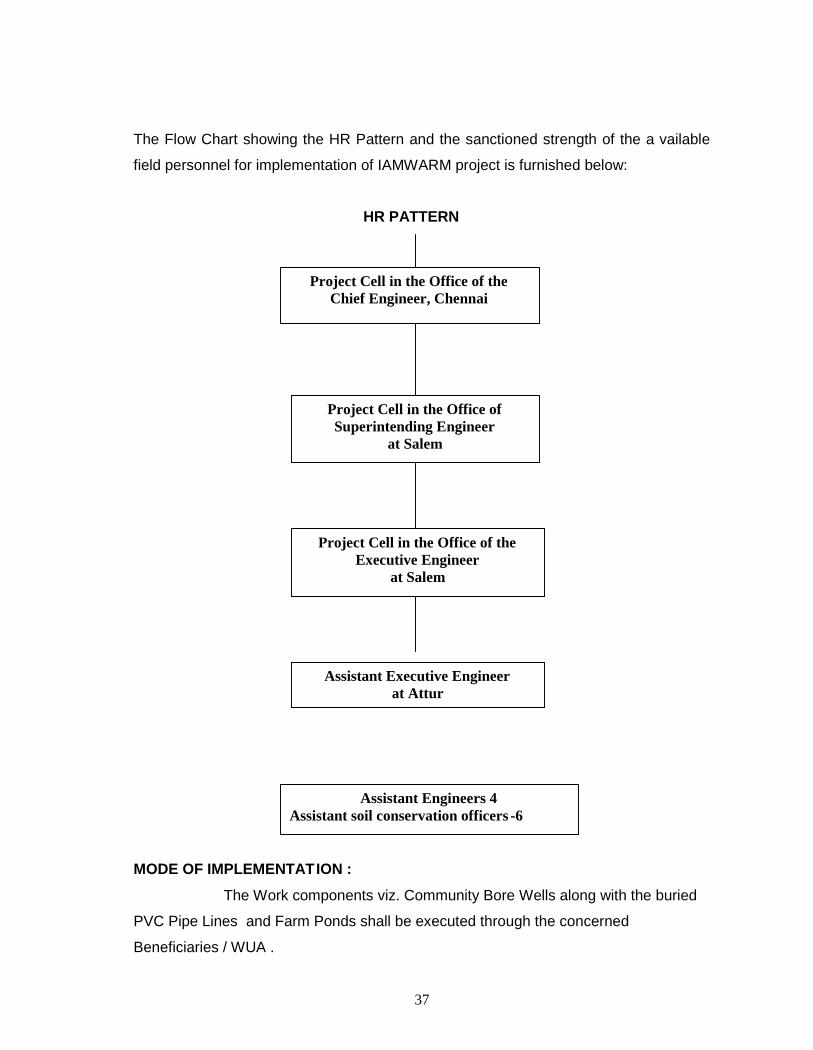
7. IMPLEMENTATION STRATEGY :
The Project Cell for IAMWARM project has been created in the office of Chief
Engineer(AE), Chennai-35 comprising Superintending Engineer (AE), Executive
Engineer(AE), Asst. Executive Engineers (AE) and Assistant Engineers (AE) to
formulate project proposals, to carry out procurement plans,to co -ordinate with the line
departments and to monitor the performance of the district level officers.
The District level Project Cell for IAMWARM project has been formed
comprising the Executive Engineer(AE), Asst.E xecutive Engineers(AE) and Asst.
Engineers(AE) to finalize the DPR, to co -ordinate with the district level line
departments and to monitor the performance of the field personnel.
37
The Flow Chart showing the HR Pattern and the sanctioned strength of the a vailable
field personnel for implementation of IAMWARM project is furnished below:
HR PATTERN
MODE OF IMPLEMENTATION :
The Work components viz. Community Bore Wells along with the buried
PVC Pipe Lines and Farm Ponds shall be executed through the concerned
Beneficiaries / WUA .
Project Cell in the Office of theChief Engineer, Chennai
Project Cell in the Office ofSuperintending Engineer
at Salem
Project Cell in the Office of theExecutive Engineer
at Salem
Assistant Executive Engineerat Attur
Assistant Engineers 4Assistant soil conservation officers -6

38
In respect of Farm Mechanization, the farm implements will be procured by the
Agricultural Engineering Department from the approved suppliers and distributed to
the concerned WUA.
The Work Components viz. Micro Irrigation System Installation and Precision
Farming will be executed by National Shopping, adopting procurement procedures.
The table showing the year wise split up action plan for all work components is
enclosed in annexure.
MODE OF REVIEW OF PROGRESS OF WORK
EE(AE) will review AEE s’ once in a fort night and submit the fort night report to CE.
CE wil lreview AEE,EE every m onth to review the progress and review report will be
sent to PD, MDPU every month.
Upper Vellar Sub Basin-Cropping Pattern
Total Regd. Ayacut - 10572 Ha
Season Pre Project Post ProjectCrops
FI PI GAP TOTAL FI PI GAP TOTAL
Coconut
Without drip --- 250 --- 250
Withdrip --- 50 --- 50 300 300
Sugarcane ---
Without drip 30 1420 --- 1450
Withdrip 20 20 2050 2050
Banana 20 20 50 50
Mango --- 10 10 15 15
Sapota --- 8 8 8 8
Arecanut ---
Without drip 200 200
Withdrip 50 50 260 260
Tapioca --- 400 200 600 850 850
Annual
Total 320 2138 200 2658 3533 3533
(July , Aug
to Nov,Dec)
Paddy 2790 260 3050 2271 2271
Ist crop
Cotton 175 125 300 300 300
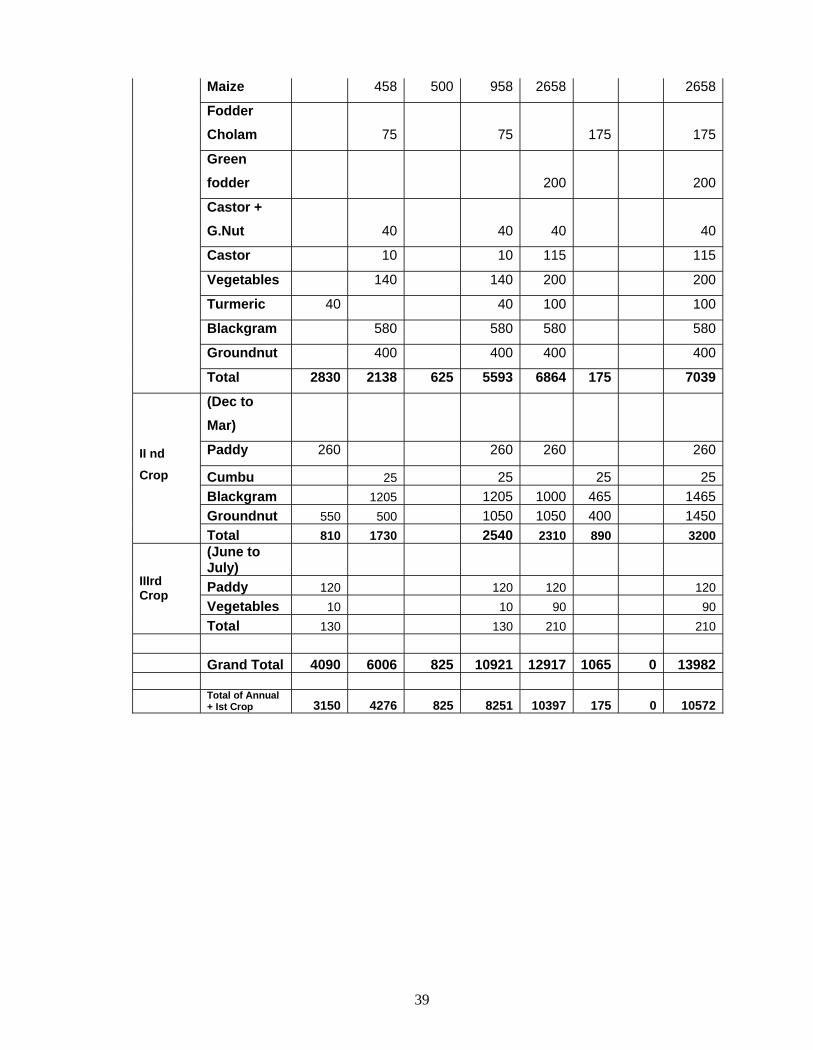
39
Maize 458 500 958 2658 2658
FodderCholam 75 75 175 175
Greenfodder 200 200
Castor +G.Nut 40 40 40 40
Castor 10 10 115 115
Vegetables 140 140 200 200
Turmeric 40 40 100 100
Blackgram 580 580 580 580
Groundnut 400 400 400 400
Total 2830 2138 625 5593 6864 175 7039
(Dec toMar)
Paddy 260 260 260 260
Cumbu 25 25 25 25Blackgram 1205 1205 1000 465 1465Groundnut 550 500 1050 1050 400 1450
II nd
Crop
Total 810 1730 2540 2310 890 3200(June toJuly)Paddy 120 120 120 120Vegetables 10 10 90 90
IIIrdCrop
Total 130 130 210 210
Grand Total 4090 6006 825 10921 12917 1065 0 13982
Total of Annual+ Ist Crop 3150 4276 825 8251 10397 175 0 10572

40
GOVERNMENT OF TAMILN ADUAGRICULTURAL DEPARTMENT
ATTUR
IRRIGATED AGRICULTURE MODERNISATION ANDWATER RESOURCES MANAGEMENT PROJECT
(IAMWARM)
UPPER VELLAR RIVER SUB BASIN
REGION SALEM
DIVISION SALEM
SUB DIVISION ATTUR
41
IAMWARM PROJECTAGRICULTURE
INTRODUCTION:
SUBBASIN :UPPER VELLAR
BASIN :VASISTA
DISTRICT: SALEM
WRO REGION: TRICHY
BLOCK COVERED:
1.VALAPADY 2.PETHANAICKENPALAYAM
3.ATTUR 4.THALAIVASAL 5. AYOTHIYAPATTANAM
Upper Vellar sub-basin is one of the 9 sub-basins selected for 1st year
implementation of IAMWARM project in TAMILNADU under WORLD BANK assistance.
This sub-basin has the registered ayacut area of 10572 Ha. 10 years average rainfall
at the basin is 810mm. But during 2005, the sub -basin received 899mm. The important
crops grown in the sub-basin are paddy, sugarcane, tapioca, maize, cotton,
vegetables, pulses, arecanut, groundnut, coconut etc.
Existing cropping pattern in the sub -basin is: -
1.Paddy-tapioca-groundnut
2.Maize-groundnut-pulses
3.Maize-paddy
4.Sugarcane
5.Cotton-pulses
42
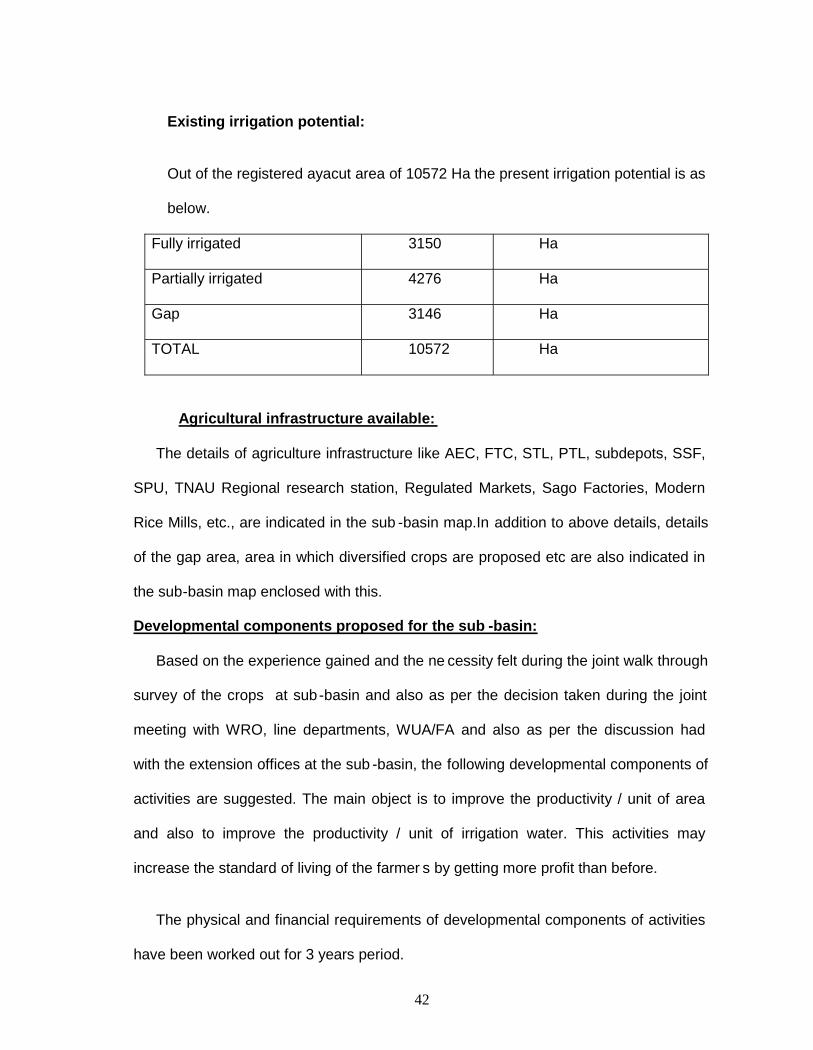
Existing irrigation potential:
Out of the registered ayacut area of 10572 Ha the present irrigation potential is as
below.
Fully irrigated 3150 Ha
Partially irrigated 4276 Ha
Gap 3146 Ha
TOTAL 10572 Ha
Agricultural infrastructure available:
The details of agriculture infrastructure like AEC, FTC, STL, PTL, subdepots, SSF,
SPU, TNAU Regional research station, Regulated Markets, Sago Factories, Modern
Rice Mills, etc., are indicated in the sub -basin map.In addition to above details, details
of the gap area, area in which diversified crops are proposed etc are also indicated in
the sub-basin map enclosed with this.
Developmental components proposed for the sub -basin:
Based on the experience gained and the ne cessity felt during the joint walk through
survey of the crops at sub-basin and also as per the decision taken during the joint
meeting with WRO, line departments, WUA/FA and also as per the discussion had
with the extension offices at the sub -basin, the following developmental components of
activities are suggested. The main object is to improve the productivity / unit of area
and also to improve the productivity / unit of irrigation water. This activities may
increase the standard of living of the farmer s by getting more profit than before.
The physical and financial requirements of developmental components of activities
have been worked out for 3 years period.
43
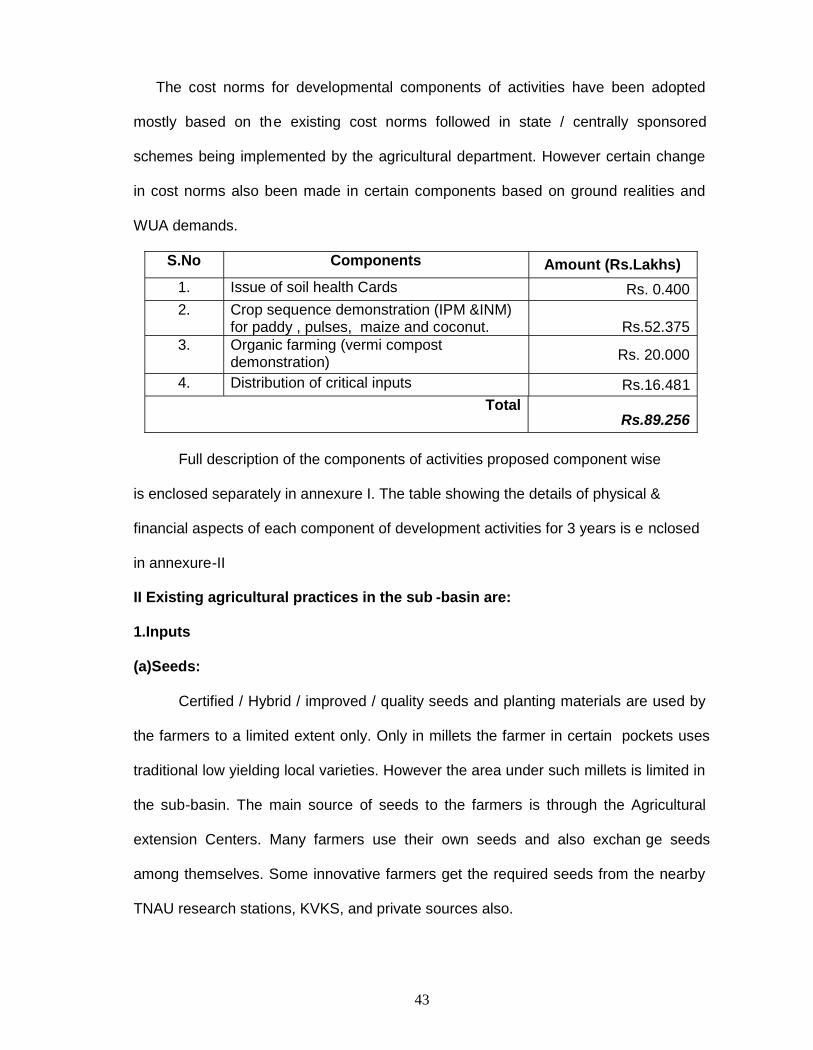
The cost norms for developmental components of activities have been adopted
mostly based on the existing cost norms followed in state / centrally sponsored
schemes being implemented by the agricultural department. However certain change
in cost norms also been made in certain components based on ground realities and
WUA demands.
S.No Components Amount (Rs.Lakhs)1. Issue of soil health Cards Rs. 0.4002. Crop sequence demonstration (IPM &INM)
for paddy , pulses, maize and coconut. Rs.52.3753. Organic farming (vermi compost
demonstration) Rs. 20.000
4. Distribution of critical inputs Rs.16.481Total
Rs.89.256
Full description of the components of activities proposed component wise
is enclosed separately in annexure I. The table showing the details of physical &
financial aspects of each component of development activities for 3 years is e nclosed
in annexure-II
II Existing agricultural practices in the sub -basin are:
1.Inputs
(a)Seeds:
Certified / Hybrid / improved / quality seeds and planting materials are used by
the farmers to a limited extent only. Only in millets the farmer in certain pockets uses
traditional low yielding local varieties. However the area under such millets is limited in
the sub-basin. The main source of seeds to the farmers is through the Agricultural
extension Centers. Many farmers use their own seeds and also exchan ge seeds
among themselves. Some innovative farmers get the required seeds from the nearby
TNAU research stations, KVKS, and private sources also.

44
(b) Soil:
The soil types are as follows:
Farmers testing their soils mostly once in a year through the assistance of the
agricultural extension staff of the area. The soils are mainly tested through the
departmental STL & MSTL available in the district. Farmers rarel y test soil through
TNAU and private sources. In view of large number of soil samples proposed to be
covered, as a result of intensive cropping, private sources like agri. Clinics, SPIC, MFL
etc will be utilized for testing.
(C)Organic Farming:
Organic farming practices are not in practice so for in the sub -basin. Necessary
steps are being taken to educate the farmers through demonstrations & other mass
media channels. But many farmers apply organic manures to their fields along with
chemical fertilizers. However 100% use of only organic manures is not prevalent in the
sub-basin. Slowly farmers aware of the benefits of the use of organic manures and it
may take few more years to adopt significantly. In future, the chance of application of
organic manure is more for Horticulture crops, especially for vegetables, which fetches
special prize through elight consumers.
S.No Soil types
1. Palladam Series
2. Periyanaickanpalayam series and
3. Thulukknoor Series
45
(d)INM &IPM:
Nearly 30 to 40% of the farmers adopt INM & IPM practices.
The percentage of adoption of this practices may increase significantly in
future due to the extension efforts being taken by the agricultural department.
(e)Actual Extension services available for ToT:
For transfer of latest farming techniques many extension techniques are being
adopted. One of the main extension service is existence of AECS in the entire block
Headquarters and sub depots in the needy locations. Through AECS required critical
farm inputs, especially seeds, bio -fertilizer, Micronutrients and bio -pesticides and
implements are distributed to the farmers mostly u nder subsidized cost. Besides
distribution of inputs required technical advices essential for increased productivity are
given to farmers in person. In addition required publicity and propaganda are being
made through various media to educate the farmers i n time to adopt the latest
production technologies to increase the productivity of crops. There is a TNAU
regional research station for Tapioca and castor in Yethapur, which caters the
technical needs of the farmers of the district. There is no Private ext ension centre in
the sub-basin or in the district. As per the T&V norms, there must be one village level
extension worker for every 800 to 1200 farm families. But such norms is not in reality
due to lot of vacancies.
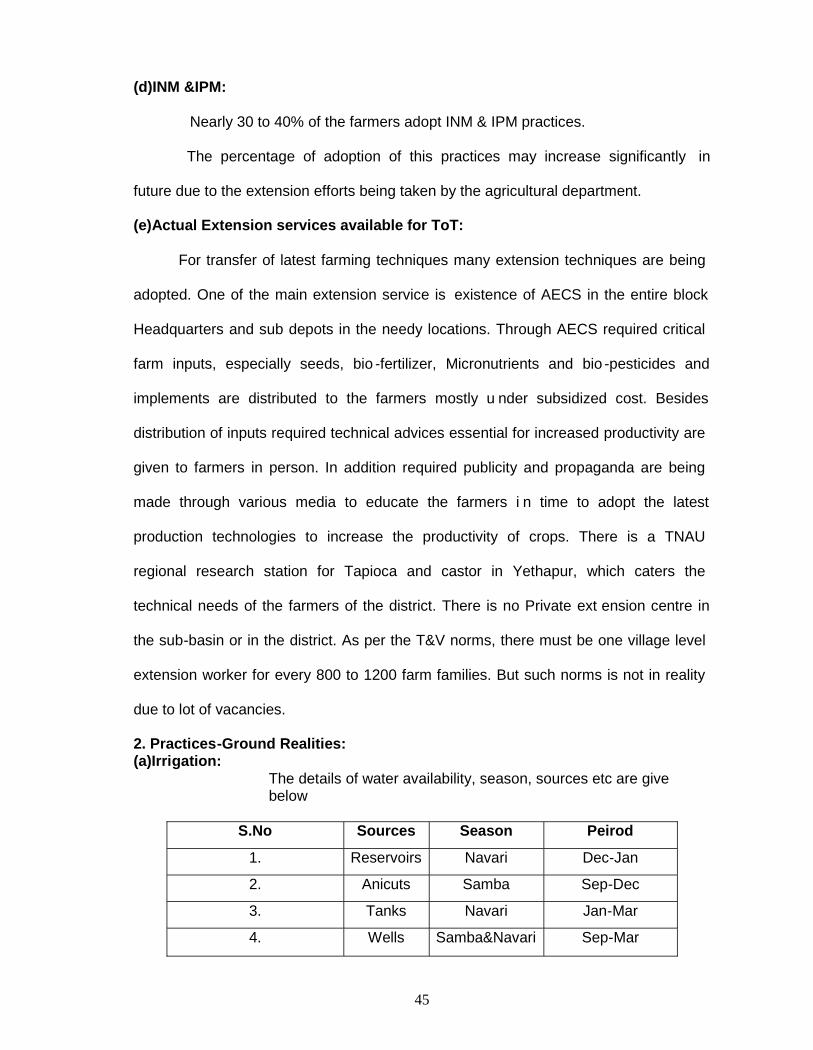
2. Practices-Ground Realities:(a)Irrigation:
The details of water availability, season, sources etc are givebelow
S.No Sources Season Peirod
1. Reservoirs Navari Dec-Jan
2. Anicuts Samba Sep-Dec
3. Tanks Navari Jan-Mar
4. Wells Samba&Navari Sep-Mar
46
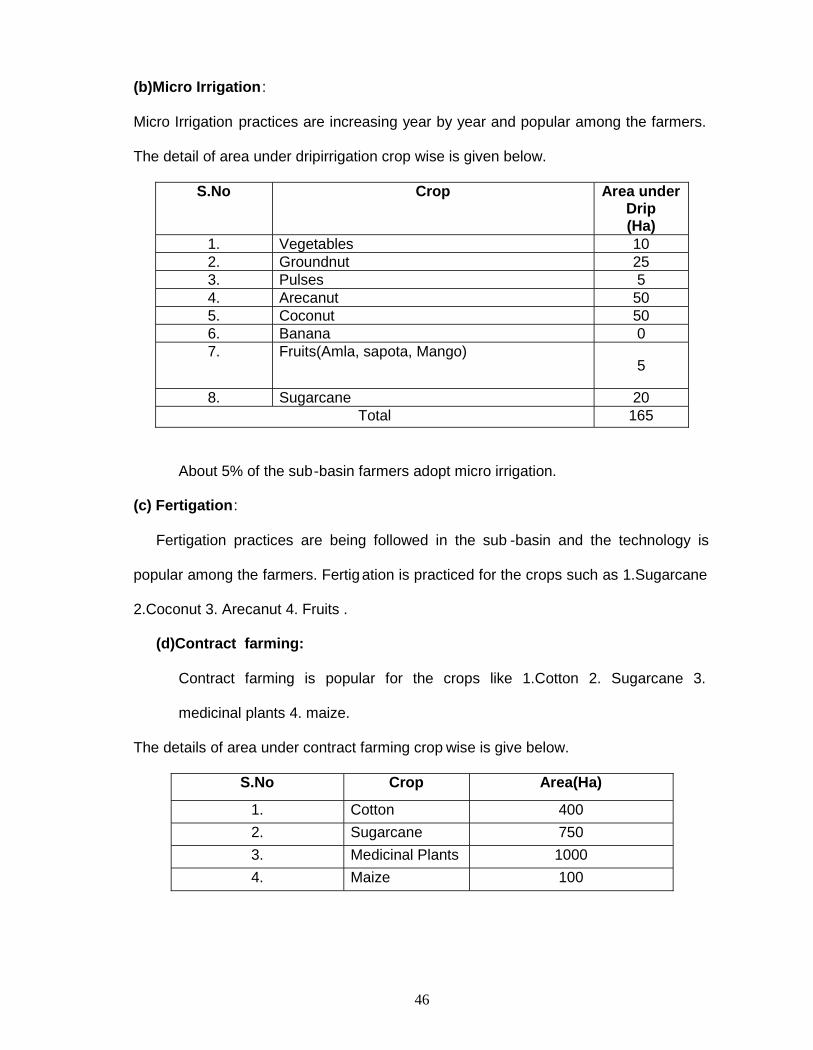
(b)Micro Irrigation :
Micro Irrigation practices are increasing year by year and popular among the farmers.
The detail of area under dripirrigation crop wise is given below.
S.No Crop Area underDrip(Ha)
1. Vegetables 102. Groundnut 253. Pulses 54. Arecanut 505. Coconut 506. Banana 07. Fruits(Amla, sapota, Mango)
5
8. Sugarcane 20Total 165
About 5% of the sub-basin farmers adopt micro irrigation.
(c) Fertigation:
Fertigation practices are being followed in the sub -basin and the technology is
popular among the farmers. Fertig ation is practiced for the crops such as 1.Sugarcane
2.Coconut 3. Arecanut 4. Fruits .
(d)Contract farming:
Contract farming is popular for the crops like 1.Cotton 2. Sugarcane 3.
medicinal plants 4. maize.
The details of area under contract farming crop wise is give below.
S.No Crop Area(Ha)
1. Cotton 4002. Sugarcane 7503. Medicinal Plants 10004. Maize 100
47
(e)Pre & Post harvest practices adopted:
As for as paddy is concerned, only certified seeds are used by many farmers. IPM
and INM practices are also followed considerably. As a post harvest practice, few
farmers dry the produce and store for 2 to 3 months before selling and get good price.
Regarding Tapioca the planting sets are dipped in the copper sulphate solution to
prevent fungal diseases. All most all the Tapioca harvest is used for sago extraction by
the farmers themselves through the number of sago factories available in the district
and get more price for sago than selling the tubers as it is.
As for as Groundnut is concerned, the se ed materials is treated with Biofertilizer to
induce root nodules which helps to fix atmospheric nitrogen in the plants for robust
growth and peg formation. Band application of gypsum also practiced followed by
hoeing and weeding, which also induces peg fo rmation and bold pod formation. Many
farmers stock the harvest for 2 to 3 months to get more price.
(f)Labour Issues:
Labour availability is a problem due to migration to urban areas to get more
wages by doing non agricultural works. Many farmers use farm ing labours in addition
to hired labours by paying over wages. Skilled labours are more scares than the
unskilled labours.
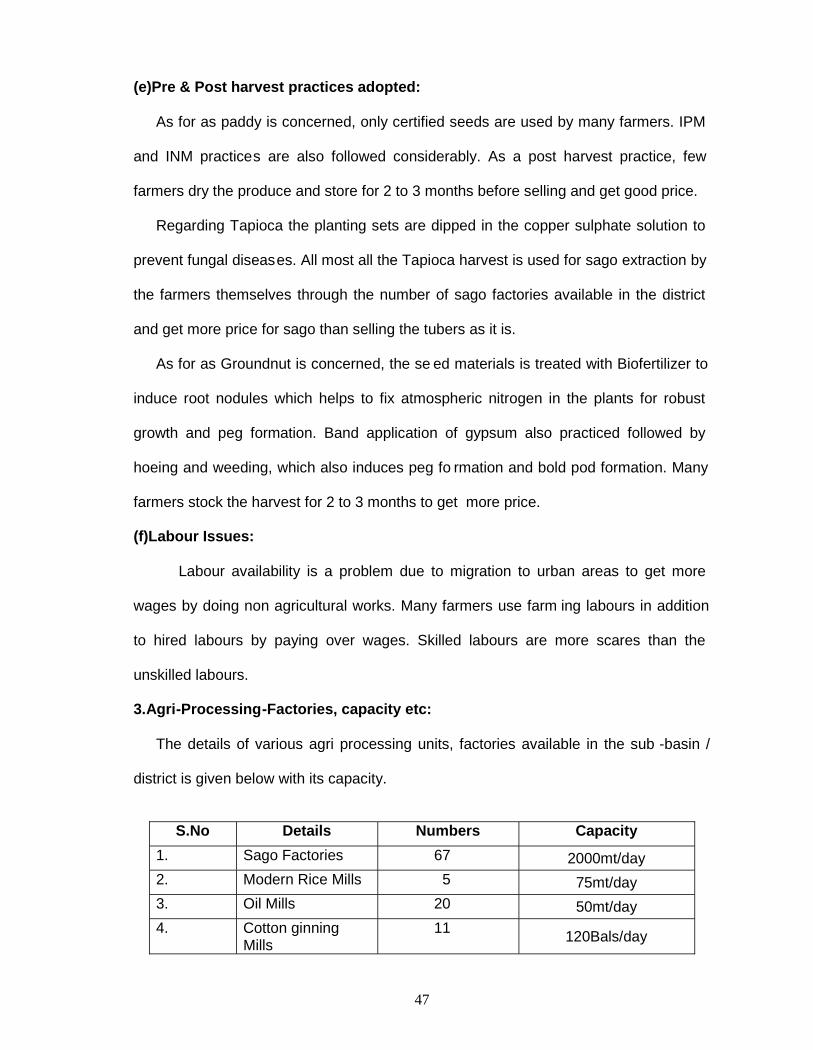
3.Agri-Processing-Factories, capacity etc:
The details of various agri processing units, factories available in the sub -basin /
district is given below with its capacity.
S.No Details Numbers Capacity1. Sago Factories 67 2000mt/day2. Modern Rice Mills 5 75mt/day3. Oil Mills 20 50mt/day4. Cotton ginning
Mills 11 120Bals/day

48
III Constraints:
1. Constraints in existing scenario.
a. Problem soil:
This sub-basin has 5% of problem soils in the total sub -basin area which needs
reclamation. The location of the problem soil area indicated in the sub -basin map.
Required financial provision given in the development component.
b. The temperature is generally high and drought occurs often 2001 -02, 2003-04,drought years.2005-06 flood year.C Low yielding local varieties still prevalent especially in millets. About 5% milletarea under traditional varieties.
d. Certified seeds are stored in the AECS as per the percentage normsprescribed by the departmental only. Hybrid seeds costs more, which is notdistributed through department.
e. Poor yielding varieties still exist in minor millets.
f. Flood irrigation system still exists with many farmers especially for paddyand sugarcane.
g. Extension workers are limited. Hence inadequate extension services.
h. Low price for produces during heavy harvest seasons and lack of intrasupport services.
i. Poor adoption of pre & post harvest technologies. The details are asfollows.

49
J. Getting farm credit through nationalized banks are cumbersomecompared through co-operative.
K. Knowledge of risk aversion is poor with farmers due to non contact ofAECS and departmental officers often, due to lack of training, capacitybuildings, IEC facilities to aware the new technology in cultivation of crops.
L. Required type of processing units for the required crop not available.
M. Labour availability is aqcusite. Farmers have spend over on labour
wages
S.No Crop PRACTICES
1. Paddy
1.More nitrogen fertilizer used.2.Green and green leaf manure not used.3.Flood irrigation still followed.4.closer planting not followed.5.Line planting not followed.
2. Sugarcane1.pit method planting not followed.2.Flood irrigation still exist.3.Drip not adopted.4.Late cutting order by the mill.
3. Millets 1.Local varieties still used especially in minormillets.
4. Groundnut 1.Mostly farmers get sales immediately afterharvest.
5. Tapioca 1.Long duration and local varieties stillcultivated.2.Rainfed tapioca yields less
50
UPPER VELLAR SUB BASIN - CROPPING PATTERNTotal Regd. Ayacut - 10572 Ha.
Pre Project Post ProjectSeason Crops FI PI Gap Total FI PI Gap Total
Coconut 0 300 0 300 300 0 0 300
Sugarcane 50 1420 0 1470 2050 0 0 2050
Banana 20 0 0 20 50 0 0 50
Mango 0 10 0 10 15 0 0 15
Sapota 0 8 0 8 8 0 0 8
Arecanut 250 0 0 250 260 0 0 260
Tapioca 0 400 200 600 850 0 0 850
Annual
Total: 320 2138 200 2658 3533 0 0 3533
Paddy 2790 260 0 3050 2271 0 0 2271
Cotton 0 175 125 300 300 0 0 300
Maize 0 458 500 958 2658 0 0 2658
Fodder Cholam 0 75 0 75 0 175 175
Green Fodder 0 0 0 0 200 0 0 200
Castor + G.Nut 0 40 0 40 40 0 0 40
Castor + G.Nut 0 10 0 10 115 0 0 115
Vegetables 0 140 0 140 200 0 0 200
Turmeric 40 0 0 40 100 0 0 100
Blackgram 0 580 0 580 580 0 0 580
Groundnut 0 400 0 400 400 0 0 400
Ist Crop(July,
August toNov., Dec.)
Total: 2830 2138 625 5593 6864 175 0 7039
Paddy 260 0 0 260 260 0 0 260
Cumbu 0 25 0 25 0 25 0 25
Blackgram 0 1205 0 1205 1000 465 0 1465
IIndCrop(Dec.to March)
Groundnut 550 500 0 1050 1050 400 0 1450
Total: 810 1730 0 2540 2310 890 0 3200
Paddy 120 0 0 120 120 0 0 120
Vegetables 10 0 0 10 90 0 0 90IIIrd Crop(June toAugust)
Total: 130 0 0 130 210 0 0 210
Grand Total: 4090 6006 825 10921 12917 1065 0 13982
Total of Annual + Ist crop 3150 4276 825 8251 10397 175 0 10572

51
1.Post project diversified crops details
Season Crops Area increasing(Ha.) Area decreassing (Ha.)
Coconut 0 0
Sugarcane 600 0
Banana 30 0
Mango 5 0Sapota 0 0
Arecanut 10 0
Tapioca 250 0
Annual
Total: 895 0Paddy 0 779
Cotton 0 0
Maize 1700 0
Fodder Cholam 100 0Green Fodder 200 0
Castor + G.Nut 0 0
Castor 105 0
Vegetables 60 0Turmeric 60 0
Blackgram 0 0
Groundnut 0 0
Ist crop
Total: 2225 779Paddy 0 0
Cumbu 0 0
Blackgram 260 0Iind crop
Groundnut 400 0Total: 660 0Paddy 0 0
Vegetables 80 0IIIrd CropTotal: 80 0
Grand Total: 3860 779

52
REASONS FOR DIVERSIFICATION OF CROPS:
I. MAIZE:The hybrid seeds are available in private shops in enough quantity.
The Maize crop is preferred by the farmers.
Less water required.
Without major pest and disease problem, gives assured yield.
Market demand: The market demand for Maize grain is in increasing trend because all cattle and poultry
feed production units required Maize grain for feed preparation.
The companies like SKM, Suguna Broilers and local poultry un its are having plan to
offer good price to farmers for their produce.
So, an area increase of 1700 ha. Is proposed in the location of Pedhanaickenpalayam,
Attur and Thalaivasal Firka areas.
II. SUGARCANE:An area diversification to Sugarcane about 600 hectares from Paddy area because
there is a proposal to start a new Sugar factory in the sub basin area. Hence, farmers are
interested to go for more area in Sugarcane.
The seed material will be supplied by the Sugar factories.
III. PULSES: Because of the local market demand for pulses, the farmers are interested to
grow Pulses in more area.
The seeds of short duration varieties like T0. Vamban.2, Vamban.3 will be
supplied by the Govt. source and also private agro services to some extent.
IV. GROUNDNUT:
An area increase of Groundnut is proposed in the 2 nd crop duration period. Because of
availability of 20 Oil mills with a capacity of 50 MT./ day. There will be a demand for the
produce.
The new variety seeds will be supplied from department of Agric ulture to some extent.
The farmers from private sources will directly purchase the remaining quantity of seed.
53
V. CASTOR:There is one Tapioca and Castor Research Station located at Yethapur, TNAU also
organizing FLDs and trainings to educate the farm ers in cultivation of castor.
Hence it is a scope to increase the area under Castor crop. Local market is available
for Castor crop.
Fodder Cholam and Green fodder:To meet the demand for fodder requirement by the increased milch animals, the
increased area proposal is given in the project.
HORTICULTURAL CROPS – REASON FOR DIVERSIFICATION:1. MANGO:
Mango production is mainly used for local consumption. The choice variety like
Alphanso, introduced to fetch high yield price.
2. T.C. BANANA:To increase an area of Tissue culture Banana replacing local varieties, T.C. Banana
suckers will be provided to the farmers.
The suckers are available at private sources like Growmore, Spic companies.
The farmers are also directly send the products to the mar ket available at Trichy,
Bangalore where the demand is more.
3. VEGETABLES:The high yielding hybrid seeds are procured from private sources. The local market is
available at Vazhappady, Thalaivasal and Attur area.
4. TURMERIC:The farmers preferred to go for more turmeric area to get more income. The local
market rate is available to purchase the processed turmeric product produced by the farmers.
5. ARECANUT:The farmers preferred to go for more Arecanut area to get more income. The local
market is available to purchase processed Arecanut products produced by the farmers. The
high yielding and hybrid seedlings will be purchased from private sources by tender method.
54
6. TAPIOCA:In the Sub basin Area, there are 67 sago factories with a capac ity of 2000 MT available.
Almost all the Tapioca harvest is used for sago and starch extraction. Because of this demand
by the sago factories, farmers are willing to grow high yielding tapioca in more area.
V. Challenges thrown up by diversification/ area expansion:
1.WRO should ensure quality water availability through out the cropping pattern.
WRO should be flexible in giving water during sowing season so the farmers can get
water in time for doing various cropping operations as and when they need .
2.Proposed cropping pattern for the project is given in the table .The crops are
suggested based on agro –climatic suitability market demand and farmers choice.
3 .Required quality seeds /planting materials will be made available in all the AEC&
Regional research station of TNAU and also through private sources
4.Regarding diversion and introduction of new crops /varieties lengthy discussion
had with the WUA/FA during the joint walk through the joint meetings and the farmers
accepted the new approach .For the mind set of farmers training will be given,
demonstration will be arranged, publicity &propaganda through various media.
5.In addition to the available extension services in the sub -basin the services of
the Agri–clinicis to be set up with unemployed a gri graduates will be utilized if
necessary .The services of NGOS who are already in the agricultural sector will be
utilized as and when needed on contract basis. The services of TNAU/KVK will also be
utilized.
6.Information Education and Communication(IE C) facilities will be strengthened at
AEC level. Required trainings will be imparted both to the farmers and extension
workers periodically with the assistance of TNAU ,agri -clinics to be set up, through
demonstrations trainings available in Block Develo pment office.
7.Based on the necessity and the farmers demand the details of requirement of
micro irrigation system ,hand& power operated sprayers have been worked out. The

55
drips will be supplied by Agricultural engineering department and the sprayers by the
Agricultural department. Required provision are made by the respective department.
8.Solutions and Recommendations
To overcome the constraints and challenges described above ,the issue were
discussed during the joint walk through in the sub -basin and also during the joint
meeting with WRO, Line department offices and WUA/FA etc.
Joint walk through was held on 27.07.2006&17.08.2006.
Joint meeting was held on 27.07.2006& 07.08.2006
The details of WUA/FA demands [development components and activities]
which was finalized during the joint meeting are listed below:
The details of constraints in existing scenario and the counter measures
proposed are given below:
Constraints Counter measures a. Problem soil about 5% of theproblem soils have been identified inthe sub- basin area.
b.Adverse climatic condition –drought
c.Inferior quality of seeds(Low yieldingtraditional varieties still prevalent)
d.Limited availability and distribution ofcertified seeds from Govt sources/private. High cost of hybrid seeds
Necessary provision made in theDevelopmental components of activities.Based on soil test recommendation theseproblem soil will be reclaimed by usingchemistry wing of agricultural departmentand the expertise of TNAU&KVK
Suitable drought resistant varieties inaddition to drought proof /cultural practiceswill be recommended to the needy area.
Low yielding traditional local varieties arethere in the villages under minor millets.Steps will be taken to replace the same withthe improved hybrid varieties.
Required quality certified seeds will bestored in all the AECS as per the norms fordistribution fixed by the department for thecrops. To over come the high cost of hybridseeds, suitable private sources which couldsupply at cheaper cost will be identifie d andrecommended to the farmers in time.

56
e.Improved varieties
f.Improved irrigation practices(Floodirrigation)
g.Inadequate extension services
h. Low price of produce
i Poor adoption of pre& post harvesttechnologies. For (eg) excessive use ofplant protection chemicals.
j. Limited availability of credit facilities
k. Risk aversion
Steps will be taken to replace such varietiesby timely supply of improved variety to thefarmers.Farmers will be suitably educated togo in for improved varieties -through trainingand demonstrations.
Farmers will be trained /educated foreconomic and judicious use of irrigationwater through demonstrations and trainings.Micro irrigation will be introduced for theneedy crop through AED.
If necessary agriclinic will be set up with thehelp of unemployed agri graduates with theassistance of TNAU and the services will beutilized for various extension activitiesincluding collection and testing of soilsamples,laying demonstrations, training tofarmers etc.
T he cost of produce goes low duringharvest periods Hence farmers will besuitably educated and facilities providedthrough agricultural marketing departmentTo store the produce for few months to getthe good price by adoptions post harvesttechnologies, especially value addition.
Farmers will be educated suitably throughtrainings and demonstrations, soil testingpractices, introduction of IPM&INMpractices, micro irrigation practices etc.
Necessary steps will be taken to arrangecredit facilities (Crop loan) through co -opsocieties and nationalized banks. Loan onproduce stock will be arranged throughregulated market.To overcome the risk aversion farmers willbe educated suitably on market demand,yield potential, technology available, price inthe district, outside the distri ct, outside ofstate etc, before choosing particular crop.Recommendation will be made to take up aparticular crop after considering the abovedetails on crop. Training, demonstrations willbe arranged for capacity building. IECfacilities will be given to the farmers throughvarious media and also through internetfacilities available in block developmentoffices.

57
l. Limited processing units
m. Availability of labor
As far as this sub-basin is concerned, theprocessing unit is mainly required for tapiocacrop. Sufficient number of sago factories areavailable in the sub-basin/district. Regardingpaddy number of modern rice mills are there.Cotton ginning factories also there in thesub-basin. Hence there is no processingconstraints in the sub-basin.
Labor is generally scarce in the sub -basin.To overcome labor problem innovation ofmicro irrigation system, labor saving farmequipments, hand and power operatedsprayers will be taken up for whichnecessary physical and financial provisionsare made in the development componentsproposed in consultations w ith the WUA/FA,line departments and WRO.
Challenges thrown up by diversification and area expansion :
Challenges Solution1. Ensuring water availability for extendedarea, flexibility, reliability, quality.
2. Identifying suitable crop/va rietiesaccording to agro climate suitability.
3. Planting materials-quantity / quality.
4. Farmers mind set for new crops.
The issue has been discussed with WRO duringthe joint walk through and joint meetings alongwith line departments and WUA/FA. WROagreed to supply quality irrigat ion waterthroughout the cropping period. WRO ensuredflexibility in giving water as per the need of thefarmer and assured for reliability in giving water.
Proposed cropping pattern for the project is givenin the table .The crops are suggested based onagro –climatic suitability, Market demand andfarmers choice.
Required quality seeds /planting materials will bemade available in all the AEC& Regionalresearch station of TNAU and also throughprivate sources.
Regarding diversion and introduction of n ewcrops /varieties lengthy discussion had with theWUA/FA during the joint walk through the jointmeetings and the farmers accepted the newapproach .For the mind set of farmers trainingwill be given, demonstration will be arranged,publicity &propaganda through various media.

58
5. Pressure on extension services foraddressing needs of newly diversifiedareas.
6. Information, Education andcommunication(IEC).
7. To increase the extent ofMechanizations.
In addition to the available extension services inthe sub-basin the services of the Agrl–clinicis tobe set up with unemployed agrl graduates will beutilized if necessary .The services of NGOS whoare along in the agrl setup will be utilized as andwhen needed on contract basis. The services ofTNAU/KVK will also be utilized.
IEC facilities will be strengthened at AED level.Required trainings will be imported both to thefarmers and extension workers periodically withthe assistance of TNAU ,agrl-clinics to be set up,through demos trainings available in Blockdevelopment office.
Based on the necessity and the farmersdemand the details of requirement of microirrigation system ,hand& power operated sprayershave been worked out. The drips will be suppliedby Agricultural engineering department and thesprayers by the Agricultural department.Required provision are made by the respectivedepartment.
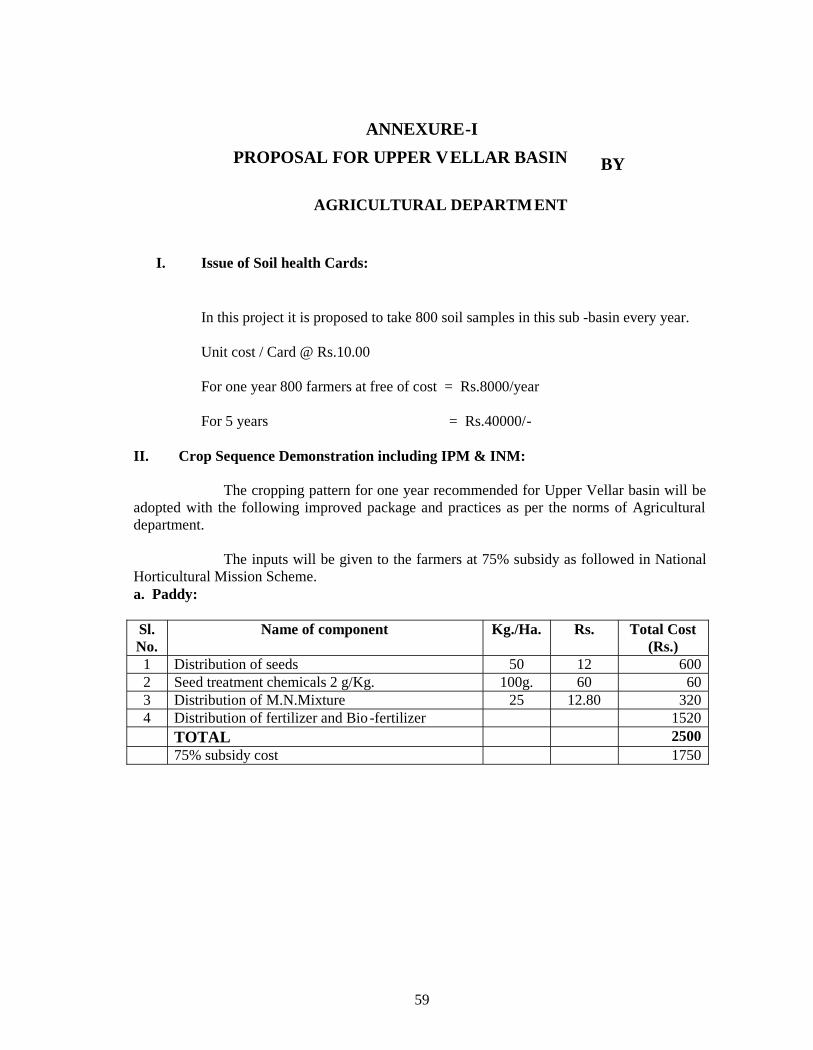
59
ANNEXURE-I
BY
AGRICULTURAL DEPARTM ENT
I. Issue of Soil health Cards:
In this project it is proposed to take 800 soil samples in this sub -basin every year.
Unit cost / Card @ Rs.10.00
For one year 800 farmers at free of cost = Rs.8000/year
For 5 years = Rs.40000/-
II. Crop Sequence Demonstration including IPM & INM:
The cropping pattern for one year recommended for Upper Vellar basin will beadopted with the following improved package and practices as per the norms of Agriculturaldepartment.
The inputs will be given to the farmers at 75% subsidy as followed in NationalHorticultural Mission Scheme.a. Paddy:
Sl.No.
Name of component Kg./Ha. Rs. Total Cost(Rs.)
1 Distribution of seeds 50 12 6002 Seed treatment chemicals 2 g/Kg. 100g. 60 603 Distribution of M.N.Mixture 25 12.80 3204 Distribution of fertilizer and Bio -fertilizer 1520
TOTAL 250075% subsidy cost 1750
PROPOSAL FOR UPPER VELLAR BASIN
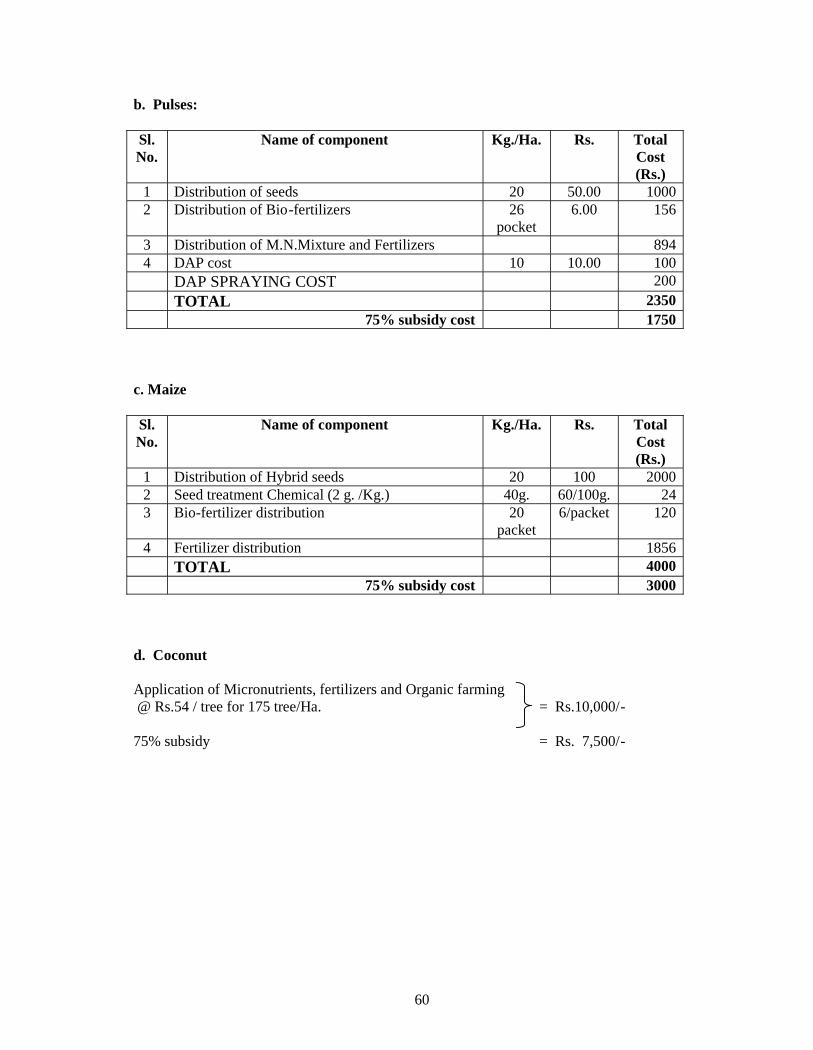
60
b. Pulses:
Sl.No.
Name of component Kg./Ha. Rs. TotalCost(Rs.)
1 Distribution of seeds 20 50.00 10002 Distribution of Bio-fertilizers 26
pocket6.00 156
3 Distribution of M.N.Mixture and Fertilizers 8944 DAP cost 10 10.00 100
DAP SPRAYING COST 200
TOTAL 235075% subsidy cost 1750
c. Maize
Sl.No.
Name of component Kg./Ha. Rs. TotalCost(Rs.)
1 Distribution of Hybrid seeds 20 100 20002 Seed treatment Chemical (2 g. /Kg.) 40g. 60/100g. 243 Bio-fertilizer distribution 20
packet6/packet 120
4 Fertilizer distribution 1856TOTAL 4000
75% subsidy cost 3000
d. Coconut
Application of Micronutrients, fertilizers and Organic farming @ Rs.54 / tree for 175 tree/Ha. = Rs.10,000/-
75% subsidy = Rs. 7,500/-

61
III. Organic Farming – Vermi Compost:
Organic farming practices are not in practi ce so far in the sub-basin. To educate the
farmers vermin compost demonstrations are to be laid out as per the norms of coconut
development board schemes followed in Agriculture department.
Construction of pits and Structuring(6x3x3’) = Rs.20000/-
Construction of Roof = Rs. 7000/-
Purchase of Farm Yard Manure = Rs. 5000/-
Purchase of Earthwarms = Rs. 5000/-
Purchase of Pipes and sieves = Rs. 3000/-
Total: = Rs.40000/-
50% subsidy = Rs.20000/-
V. Distribution of Critical Inputs:
The critical inputs like Bio-pesticides and Micro Nutrient Mixtures are distributed tothe farmers @ 50% subsidy cost as a special case to increase the area of organic farming andalso net income of the farmers.
a. Distribution of Bio-pesticides @ 50% subsidy as per department of
Agriculture norms:
Full cost = Rs.250/litreRecommended dose = 2 litre / Ha.Subsidy per ha. = Rs.250/-

62
b. Distribution of M.N.Mixtures for Groundnut
Recommended dose = 12.5 Kg./Ha.Cost of 1 Kg. M.N.Mixture = Rs.34/-Cost per Ha. = Rs.425/-50% subsidy = Rs.212/Ha.
c. Distribution of M.N. Mixture for Coconut
Recommended dose = 1 Kg./TreeCost of 1 Kg. M.N.Mixture = Rs.35/-Cost per Ha. = Rs.6125/-50% subsidy = Rs.3062/Ha.
ACTIVITIES PROPOSED TO UPPER VELLAR SUB BASINSALEM DISTRICT
Proposal for 5 years (Lakh Rs.)Sl.No. Components
Costperunit(Rs.)
Subsidypattern Unit
(Ha./No.)Govt.share
FarmersShare
Totalcost
1 Issue of Soil health Cards 10 100% 4000 0.400 0 0.400
2 Crop demonstration
a. Paddy 2500 75% 600 11.250 3.750 15.000
b. Pulses 2350 75% 250 4.405 1.470 5.875
c. Maize 4000 75% 600 18.000 6.000 24.000
d. Coconut 1000 75% 75 5.625 1.875 7.500
Total: 39.280 13.095 52.375
3 Organic farming
Vermi Compost 40000 50% 50 10.000 10.000 20.000
4 Distribution of Critical Inputs
a. Distribution of Bio-pesticides 500 50% 200 0.500 0.500 1.000
b. Distribution of M/N.Mixture toGroundnut 425 50% 400 0.850 0.850 1.700
c. Distribution of M.N.Mixture toCoconut 6125 50% 225 6.890 6.891 29.372
Total: 8.240 8.241 32.073
Grand Total: 57.920 31.336 104.881
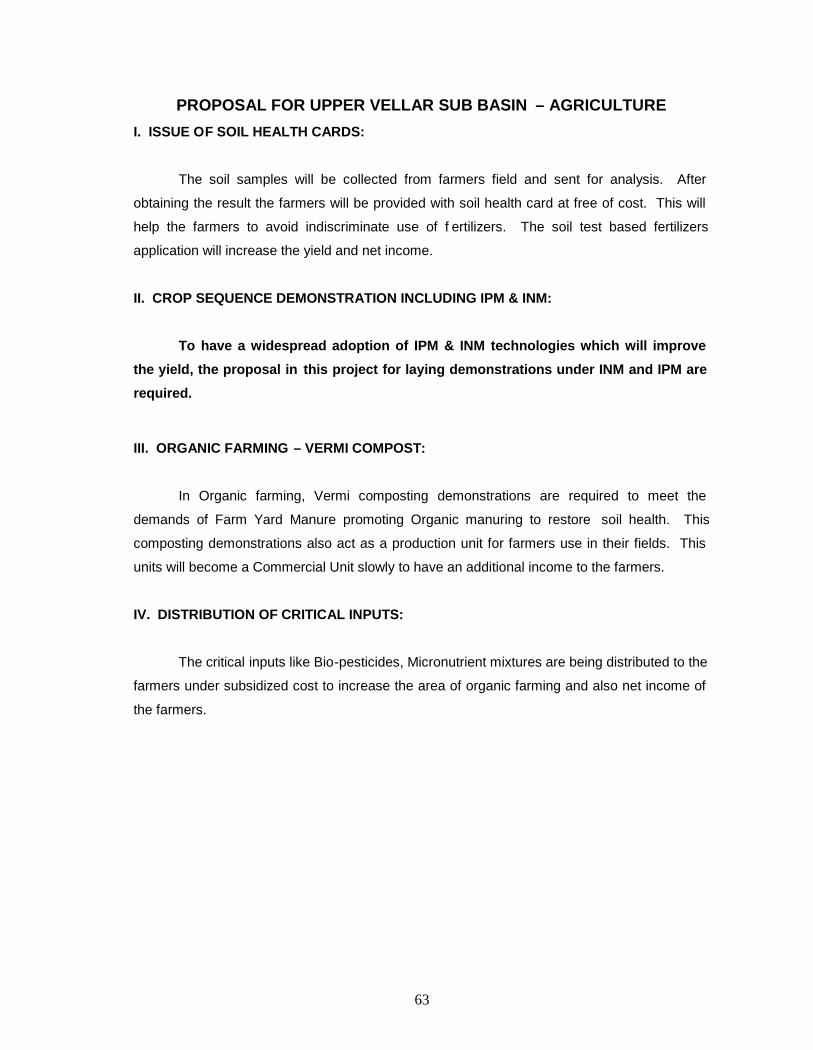
63
PROPOSAL FOR UPPER VELLAR SUB BASIN – AGRICULTUREI. ISSUE OF SOIL HEALTH CARDS:
The soil samples will be collected from farmers field and sent for analysis. After
obtaining the result the farmers will be provided with soil health card at free of cost. This will
help the farmers to avoid indiscriminate use of f ertilizers. The soil test based fertilizers
application will increase the yield and net income.
II. CROP SEQUENCE DEMONSTRATION INCLUDING IPM & INM:
To have a widespread adoption of IPM & INM technologies which will improvethe yield, the proposal in this project for laying demonstrations under INM and IPM arerequired.
III. ORGANIC FARMING – VERMI COMPOST:
In Organic farming, Vermi composting demonstrations are required to meet the
demands of Farm Yard Manure promoting Organic manuring to restore soil health. This
composting demonstrations also act as a production unit for farmers use in their fields. This
units will become a Commercial Unit slowly to have an additional income to the farmers.
IV. DISTRIBUTION OF CRITICAL INPUTS:
The critical inputs like Bio-pesticides, Micronutrient mixtures are being distributed to the
farmers under subsidized cost to increase the area of organic farming and also net income of
the farmers.

64
UPPER VELLAR SUB BASIN - Area, Production, Productivity withou t ProjectSALEM DISTRICT
Fully Irrigated Partially irrigated Gap Area
Sl.No. Crop Area(Ha.)
Production
(MT.)
Productivity
(MT./Ha.)
Area(Ha.)
Production
(MT.)
Productivity
(MT./Ha.)
Area(Ha.)
Production
(MT.)
Productivity
(MT./Ha.)
TotalProduc
tion(MT.)
1 Paddy 3170 15850 5 260 1248 4.8 0 0 0 170982 Groundnut 550 550 1 900 810 0.9 0 0 0 13603 Maize 0 0 0 458 2061 4.5 500 2000 4 4061
4 Sugarcane 50 600 12 1420 15620 11(Gur) 0 0 0 16220
5 Coconut 0 0 0 300 5.95 68(Nuts) 0 0 0 5.95
6 Blackgram 0 0 0 1785 1071 0.6 0 0 0 10717 Cotton 0 0 0 175 175 1 125 125 1 3008 Cumbu 0 0 0 25 25 1 0 0 0 25
9 Fodder Cholam 0 0 0 75 1500 20 0 0 0 150010 Green Fodder 0 0 0 0 0 0 0 0 0 011 Castor 0 0 0 50 40 0.8 0 0 0 4012 Mango 0 0 0 10 100 10 0 0 0 10013 Sapota 0 0 0 8 120 15 0 0 0 12014 T.C.Banana 20 800 40 0 0 0 0 0 0 80015 Tomato 0 0 0 60 2100 35 0 0 0 210016 Bhendi 0 0 0 70 1750 25 0 0 0 175017 Onion 10 150 15 10 150 15 0 0 0 30018 Turmeric 40 800 20 0 0 0 0 0 0 80019 Arecanut 250 750 3 0 0 0 0 0 0 750
Tapioca 0 0 0 400 15200 38 200 7600 38 22800Total: 4090 19500 6006 41976 825 9725 71201
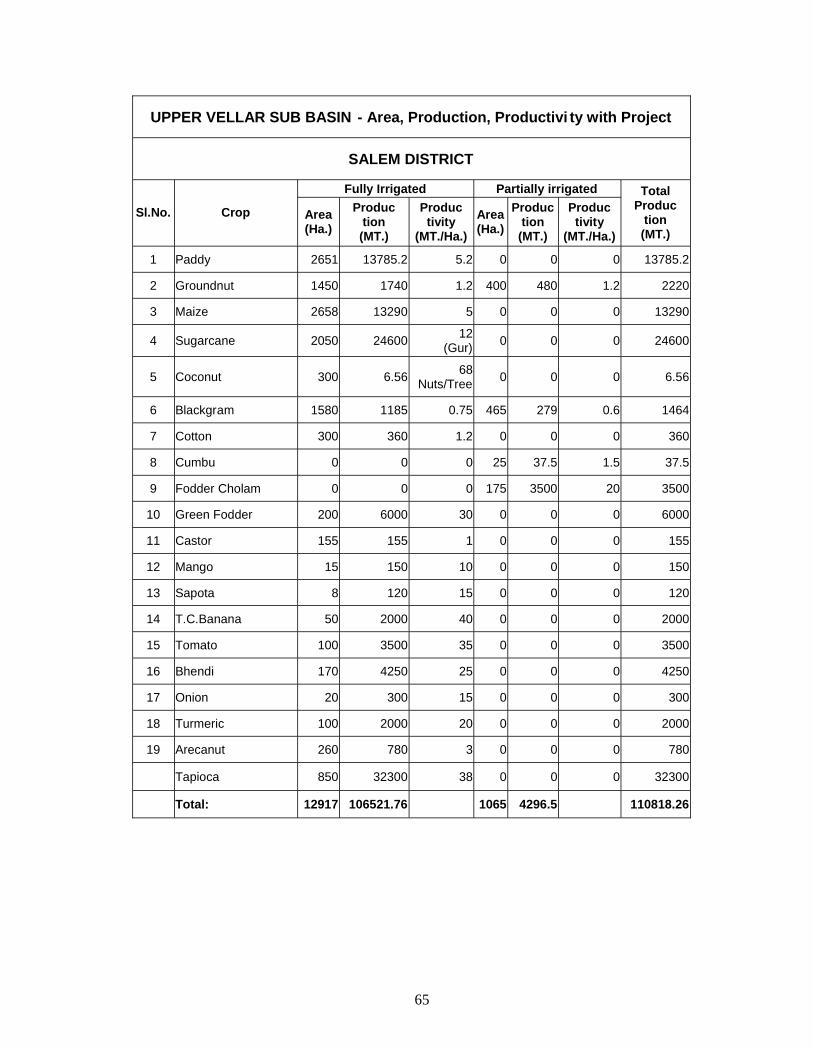
65
UPPER VELLAR SUB BASIN - Area, Production, Productivi ty with Project
SALEM DISTRICT
Fully Irrigated Partially irrigated
Sl.No. Crop Area(Ha.)
Production(MT.)
Productivity
(MT./Ha.)
Area(Ha.)
Production
(MT.)
Productivity
(MT./Ha.)
TotalProduc
tion(MT.)
1 Paddy 2651 13785.2 5.2 0 0 0 13785.2
2 Groundnut 1450 1740 1.2 400 480 1.2 2220
3 Maize 2658 13290 5 0 0 0 13290
4 Sugarcane 2050 24600 12(Gur) 0 0 0 24600
5 Coconut 300 6.56 68Nuts/Tree 0 0 0 6.56
6 Blackgram 1580 1185 0.75 465 279 0.6 1464
7 Cotton 300 360 1.2 0 0 0 360
8 Cumbu 0 0 0 25 37.5 1.5 37.5
9 Fodder Cholam 0 0 0 175 3500 20 3500
10 Green Fodder 200 6000 30 0 0 0 6000
11 Castor 155 155 1 0 0 0 155
12 Mango 15 150 10 0 0 0 150
13 Sapota 8 120 15 0 0 0 120
14 T.C.Banana 50 2000 40 0 0 0 2000
15 Tomato 100 3500 35 0 0 0 3500
16 Bhendi 170 4250 25 0 0 0 4250
17 Onion 20 300 15 0 0 0 300
18 Turmeric 100 2000 20 0 0 0 2000
19 Arecanut 260 780 3 0 0 0 780
Tapioca 850 32300 38 0 0 0 32300
Total: 12917 106521.76 1065 4296.5 110818.26
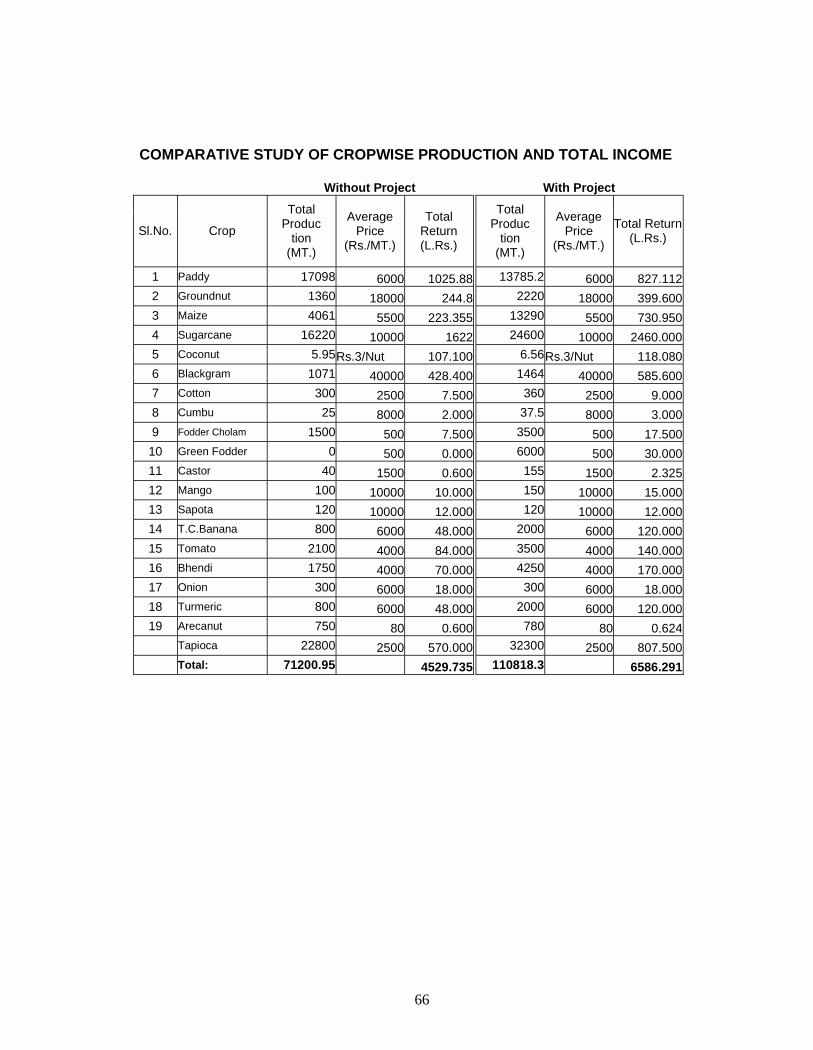
66
COMPARATIVE STUDY OF CROPWISE PRODUCTION AND TOTAL INCOME
Without Project With Project
Sl.No. Crop
TotalProduc
tion(MT.)
AveragePrice
(Rs./MT.)
TotalReturn(L.Rs.)
TotalProduc
tion(MT.)
AveragePrice
(Rs./MT.)
Total Return(L.Rs.)
1 Paddy 17098 6000 1025.88 13785.2 6000 827.1122 Groundnut 1360 18000 244.8 2220 18000 399.6003 Maize 4061 5500 223.355 13290 5500 730.9504 Sugarcane 16220 10000 1622 24600 10000 2460.0005 Coconut 5.95Rs.3/Nut 107.100 6.56Rs.3/Nut 118.0806 Blackgram 1071 40000 428.400 1464 40000 585.6007 Cotton 300 2500 7.500 360 2500 9.0008 Cumbu 25 8000 2.000 37.5 8000 3.0009 Fodder Cholam 1500 500 7.500 3500 500 17.500
10 Green Fodder 0 500 0.000 6000 500 30.00011 Castor 40 1500 0.600 155 1500 2.32512 Mango 100 10000 10.000 150 10000 15.00013 Sapota 120 10000 12.000 120 10000 12.00014 T.C.Banana 800 6000 48.000 2000 6000 120.00015 Tomato 2100 4000 84.000 3500 4000 140.00016 Bhendi 1750 4000 70.000 4250 4000 170.00017 Onion 300 6000 18.000 300 6000 18.00018 Turmeric 800 6000 48.000 2000 6000 120.00019 Arecanut 750 80 0.600 780 80 0.624
Tapioca 22800 2500 570.000 32300 2500 807.500Total: 71200.95 4529.735 110818.3 6586.291
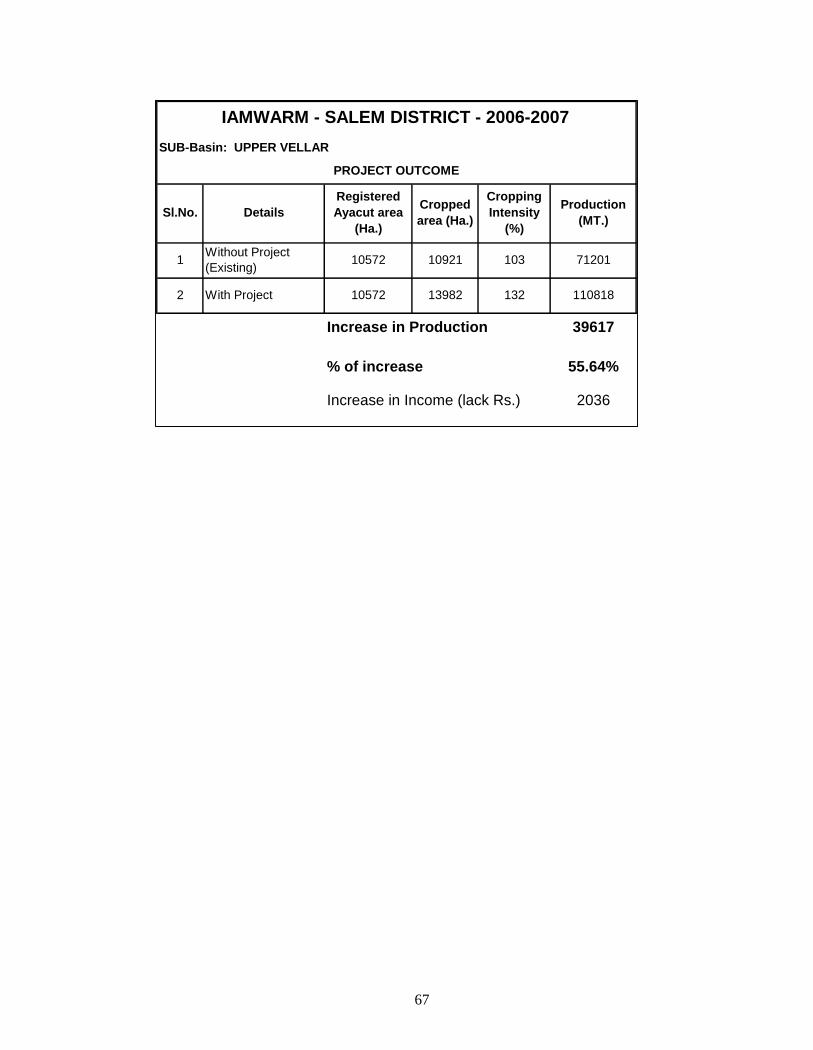
67
SUB-Basin: UPPER VELLAR
Sl.No. DetailsRegisteredAyacut area
(Ha.)
Croppedarea (Ha.)
CroppingIntensity
(%)
Production(MT.)
1 Without Project(Existing) 10572 10921 103 71201
2 With Project 10572 13982 132 110818
Increase in Production 39617
% of increase 55.64%
Increase in Income (lack Rs.) 2036
IAMWARM - SALEM DISTRICT - 2006-2007
PROJECT OUTCOME

68
IRRIGATED AGRICULTURE MODERNISATION
AND
WATER RESOURCES MANAGEMENT
(IAMWARM) PROJECT
AGRICULTURE MARKETING
DETAILED PROJECT REPORT
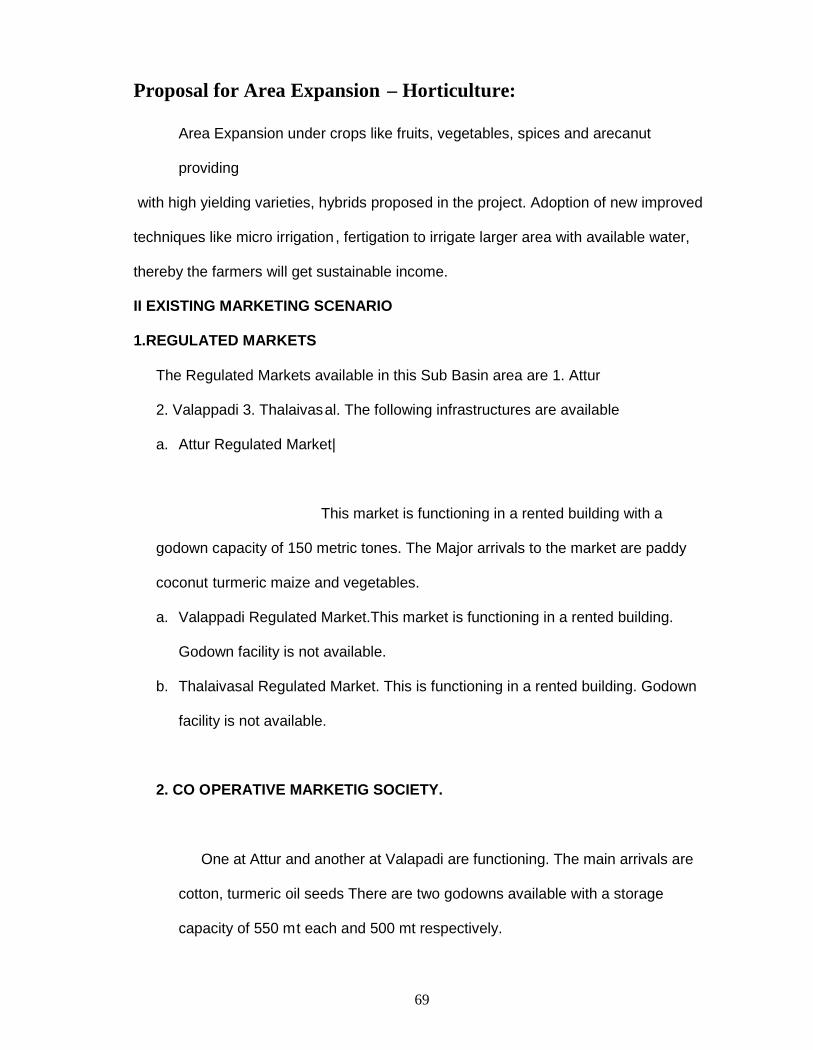
69
Proposal for Area Expansion – Horticulture:
Area Expansion under crops like fruits, vegetables, spices and arecanut
providing
with high yielding varieties, hybrids proposed in the project. Adoption of new improved
techniques like micro irrigation , fertigation to irrigate larger area with available water,
thereby the farmers will get sustainable income.
II EXISTING MARKETING SCENARIO
1.REGULATED MARKETS
The Regulated Markets available in this Sub Basin area are 1. Attur
2. Valappadi 3. Thalaivasal. The following infrastructures are available
a. Attur Regulated Market|
This market is functioning in a rented building with a
godown capacity of 150 metric tones. The Major arrivals to the market are paddy
coconut turmeric maize and vegetables.
a. Valappadi Regulated Market.This market is functioning in a rented building.
Godown facility is not available.
b. Thalaivasal Regulated Market. This is functioning in a rented building. Godown
facility is not available.
2. CO OPERATIVE MARKETIG SOCIETY.
One at Attur and another at Valapadi are functioning. The main arrivals are
cotton, turmeric oil seeds There are two godowns available with a storage
capacity of 550 mt each and 500 mt respectively.
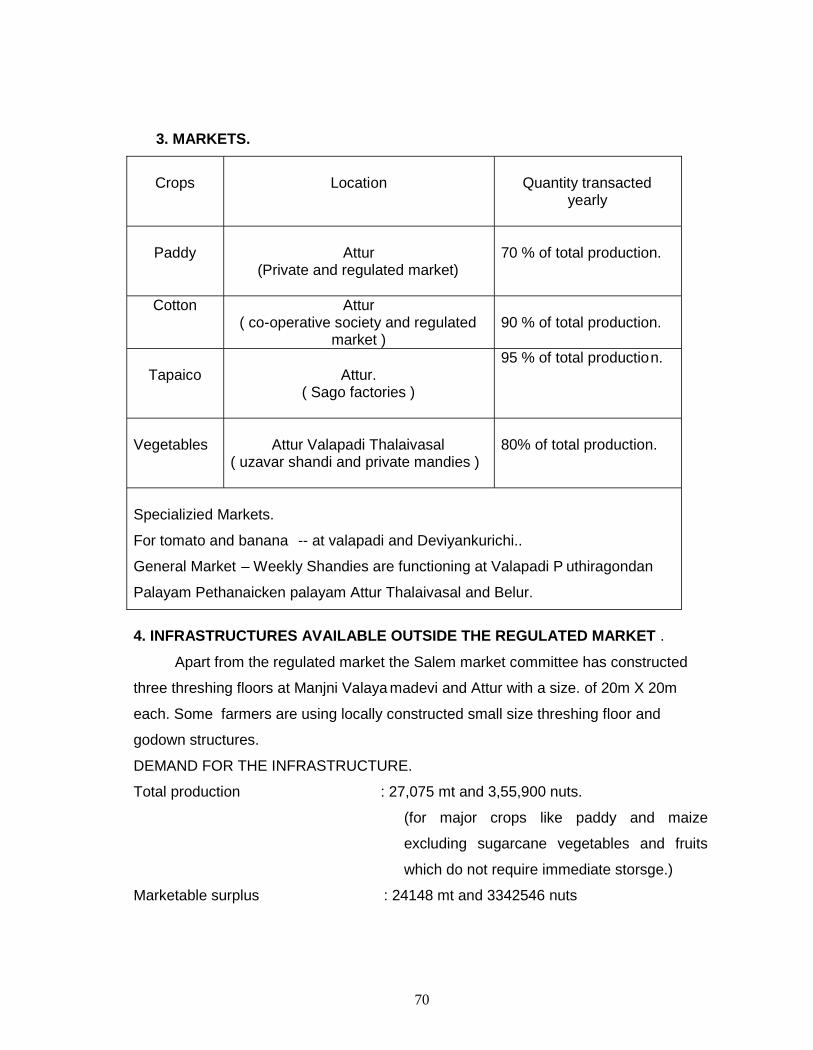
70
3. MARKETS.
Crops Location Quantity transactedyearly
Paddy Attur(Private and regulated market)
70 % of total production.
Cotton Attur( co-operative society and regulated
market )90 % of total production.
Tapaico Attur.( Sago factories )
95 % of total production.
Vegetables Attur Valapadi Thalaivasal( uzavar shandi and private mandies )
80% of total production.
Specializied Markets.
For tomato and banana -- at valapadi and Deviyankurichi..
General Market – Weekly Shandies are functioning at Valapadi P uthiragondan
Palayam Pethanaicken palayam Attur Thalaivasal and Belur.
4. INFRASTRUCTURES AVAILABLE OUTSIDE THE REGULATED MARKET .
Apart from the regulated market the Salem market committee has constructed
three threshing floors at Manjni Valaya madevi and Attur with a size. of 20m X 20m
each. Some farmers are using locally constructed small size threshing floor and
godown structures.
DEMAND FOR THE INFRASTRUCTURE.
Total production : 27,075 mt and 3,55,900 nuts.
(for major crops like paddy and maize
excluding sugarcane vegetables and fruits
which do not require immediate storsge.)
Marketable surplus : 24148 mt and 3342546 nuts
71
(for major crops like paddy and maize
excluding sugarcane vegetables and f ruits
which do not require immediate storsge.)
Total capacity utilized under the Existing System :21500 mt (two Rotations )
Regulated market : 150 mt
Co- operative godowns : 1600 mt
(Small godown structures owned by : 9000 mt.
farmers which are used for storage) Total :10750 mt
Gap in terms of godowns at the rate
of 180 mt / godown in two rotations. : 8 nos.
5. COMMODITY GROUP .
In this sub basin coleus is a medicinal crop which is cultivated in a large
area under contract farming sys tem. A private concern namely M G M is doing this
with a great interest. Nearly 10000 hectare being cultivated by the farmers of the
commodity group formed by M G M. the above members are spread all over
Tamilnadu where as a major portion is covered in th is sub basin.
Regarding the marketing of this coleus a buy back arrangement is made
between the farmers and the organization. When a decline for demand arises these
farmers are advised to go in for other remunerative crops like turmeric and groundnut/
apart from the above commodity group an Ulavazhar Sandhai is functioning in Attur
where vegetable growers fetch remunerative price for there produce without the
exploitations of the middle man.
The Maize growing farmers are increasing in numbers as there p roduce is being
purchased by the leading cattle feeding manufactures like m/s S K M, SUGUNA.
PIONEER. The maize production of this sub basin after the implementation of this
project 13,024 mt is much negligible to meet the increase in demand. The diversifi ed
cropping area to the tune of 1700 hect in addition to the existing area will benefit the
famers positively.
MAIZE PRODUCTION : 13,290 MT
(With project)
MAKETABLE SURPLUS : 13,024 MT
With project)
EXISTING TOTAL DEMAND : 18,00,000 MT
( By the cattle and poultry feed manufactures
72
in and around Namakkal Erode and Coimbatore.)
EXISTIG SUPPLY SOURCE FOR MAIZE : Karnataka 30 %
: Andhra Pradesh 10 %
: Tamilnadu 60 %
5.PRACTICES (PRE-HARVEST AND POST HARVEST)
A. GRADING
In regulated markets for notified crops grading is done by scientific methods
where as in mandies and private markets it is lacking .cotton is graded by measuring
the staple length .and stored quality wise and staple length wise in p olythene gunnies
as well as in gunnies. For Tapioca the traders attached to mills are purchasing the
tubers based on its quality marurity and size and accordingly fix the price for it. Tomato
is graded size wise and baskets and transport it to nearby marke ts. For other crops no
specific grading method is practiced.
B. TRANSPORTATION
No specific difficulty is experienced. The produces are transported generally by
lorries for paddy ground nut Tapioca Tomato etc and by two wheelers for vegetables
to the nearest marketing centers. From Valapadi area tomato is transported by means
of buses to major towns up to Chennai city. For speeding up the transport cargo autos
are suggested from interior localities to whole sale points. ( it is included in the
collection centre component in this project)
C. CONTRACT FARMING :
At present for coleus crop contract farming is in practice. In future it is suggested for
crops like cotton maize.
D. SOURCE OF MARKET INFORMATION .
Local news papers television and telephone are the maj or source of market
information. AGMARKNET is another network based information source for notified
agricultural produces at regulated market level.

73
III CONSTRAINTS:
1. The Existing Scenario
a. Production: Glut/ Shortage: - In the case of tomato and ta pioca often the
farmers are getting bitter experiences. In the case of tomato it is still worse. If the
production increases the price comes down to very low level i.e. even up to Re.1.00 or
below / kg of fruit. If the production decreases the price may go up to even Rs. 20/kg
and even more.
In tomato(for making value addition) proper food processing methods like
Jam/Jelly preparation etc are to be advocated.
IN CASE OF TAPIOCA, THE PRICE IS BASED ON THE DEMAND FOR IT INSAGO FACTORIES. SAGOSERVE ALSO PLAYS A ROLE IN IT.
b) Lack of available market: No Such felt difficulties at present. For Speeding
up the marketing of produces, local collection centres may be arranged in important
places.
c) Poor Post harvest practices: Generally farmers are storing their produces
in their own houses which is facilitating for the attack of stored -product pests and rats
etc. For over coming this problem, village common godowns, may be contructed in
various places. The godowns are to be maintained by Farmers Association s at their
own cost.
Grading/Packing: It is being done informally for some crops like cotton, tomato
etc(not based on Scientific methods).
d) No collective action-Individual farmers go to Market/Whole Saler:
Individual farmers selling at their own locali ty is much reduced at present.
Generally they are selling their produces through Regulated Markets, Co -operative
societies and private mandies. They are very vigilant in knowing present market trends.
However for diversified crops, collective selling is i mportant, to get more
bargaining power.

74
e) Lack of Market Information: At Present market trend is known through
newspapers, Radio, TV, and phones by progressive farmers. For improving further,
internet facility/Computer facility need to be arranged. A sepa rate proposal for this is
being drawn.
IV DIVERSIFICATION PROPOSED
a. Horiticulture
In horticultural crops there is an increase in area to the tune of 875 ha
with the following split up details
Crops Pre Project area Post Project area Increased Area
Sugarcane 1470 2050 580
Banana 20 50 30
Mango 10 15 5
Arecanut 250 260 10
Tapioca 600 850 250
TOTAL 875 ha
After the implementation of the project the sugarcane production will be 690600
MT in addition to the existing production. This increased prod uction will be absorbed
by Mohanur sugar mill and perambalur sugar mill which has a crushing capacity of
2500 MT/day.
For the other crops like Banana, Mango, Areca nut and Tapioca the increase in
production will be negligible which can be absorbed by the existing markets.
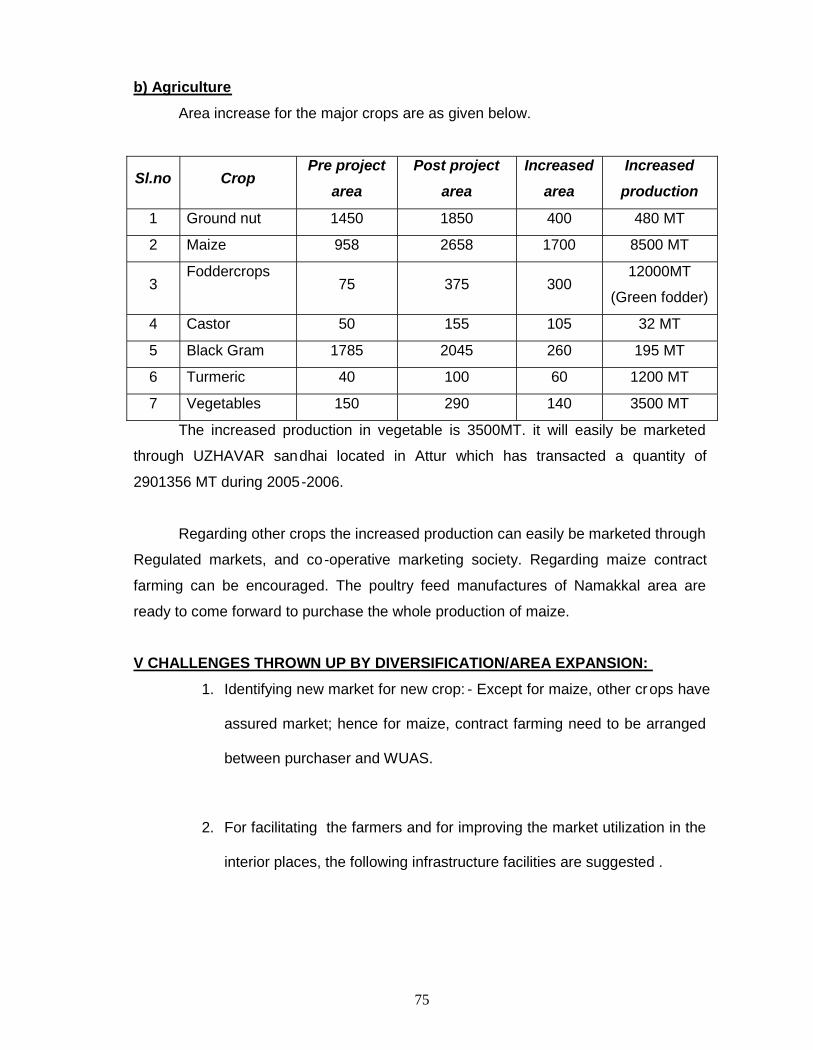
75
b) Agriculture
Area increase for the major crops are as given below.
Sl.no CropPre project
area
Post project
area
Increased
area
Increased
production
1 Ground nut 1450 1850 400 480 MT
2 Maize 958 2658 1700 8500 MT
3Foddercrops
75 375 30012000MT
(Green fodder)
4 Castor 50 155 105 32 MT
5 Black Gram 1785 2045 260 195 MT
6 Turmeric 40 100 60 1200 MT
7 Vegetables 150 290 140 3500 MT
The increased production in vegetable is 3500MT. it will easily be marketed
through UZHAVAR sandhai located in Attur which has transacted a quantity of
2901356 MT during 2005-2006.
Regarding other crops the increased production can easily be marketed through
Regulated markets, and co-operative marketing society. Regarding maize contract
farming can be encouraged. The poultry feed manufactures of Namakkal area are
ready to come forward to purchase the whole production of maize.
V CHALLENGES THROWN UP BY DIVERSIFICATION/AREA EXPANSION:
1. Identifying new market for new crop: - Except for maize, other crops have
assured market; hence for maize, contract farming need to be arranged
between purchaser and WUAS.
2. For facilitating the farmers and for improving the market utilization in the
interior places, the following infrastructure facilities are suggested .

76
a.Constructing thereshing floors in 10 localities as detail below at the cost of Rs. 2.20
lakhs each. and 5 storage godowns at the cost of Rs. 5 lakhs each and 2 collection
centres at the cost of Rs. 10 lakhs each.
Collection Center: - Cost Details:
1.Construction of godowns Rs. 5 lakhs each
2. Two autos for transport at the cost of Rs. 2lakhs each 4 lakhs
3. Crates, Dunnages etc 1 lakhs
Total 10 lakhs
S.No Name of the Place
Threshi
ng
Floors/
Drying
yards
Rural
godowns
Collection
Centre
1 Ramanaikan palayam 1 1 -
2 Kallanathan 1 1 -
3 Ethapur 1 1 -
4 Panamadal 1 1 -
5 Deviakurichi 1 - 1
6 Nathakarai 1 - -
7 Aragalur 1 - -
8 Belur 1 1 -
9 Singipuram 1 - 1
10 Thennan gudipalayam 1 - -
Total 10 5 2
3. At present there is no IT based Mu ltiple market information system to
get the best prices by the farmers. This will be provided by a separate IT
proposal.
4. Ensuring collective bargaining/marketing by WUA sub groups. At present
it is absent. But a sub group of WUA is to be formed for this pu rpose.
77
5. Improving access to market by better transport or collective transport
included under collection center item.
6. Specialized Storage: Storage godowns to cater the needs of paddy,
tapioca, cotton areca nut crops etc. are suggested in 5 places, along wit h
Threshing floors. In 10 places as required by Stake holders.
7. Processing/Agro Processing: With regard to tapioca number of Sago
factories which provides processing facilities are well established. With
regard to other crops drying and storage are recommen ded with the help
of storage godowns and threshing floors / drying yards.
8. New Practices: Product Handling, Grading, packing, On farm
process and quality control :- Collection centres are suggested through
which products like vegetables will be collected, cl eaned, graded, packed
and transported to wholesale points. Suggested places are Devaikurichi
& Singapuram. Quality control aspect will be taken care by the existing
Agmark lab at salem.
9. Information, Education and Communication(IEC): -
Included under training components.
VI Solutions and Recommendations:
1. Consultative process undertaken in the sub basin.
MDPU at district level has been formed with WRO/PWD and Line Departments i.e.
Agriculture, Horticulture, Agricultural Engineering, Agricultural University,
Agricultural Marketing, Animal husbandry, Fisheries, and Forest.
Informal WUAs were formed based on Farmer’s membership.
However, elections are to be conducted within a short period. These
Associations are consulted by the MDPU and walk through surveys

78
have also been made. The meetings were conducted on 27.7.06,
16.08.06 and 23.08.06 and Walk Through Survey on 27.7.06.
During the Walk Through Survey the cross section of sub basin
has been covered through walking and the farmer’s demands were
studied.
Along with this, the topography of the area, cropping, water
availability, life style, transport etc were also observed. This background
facilitated in understanding the stake -holders problems and the solutions
suggested. For marketing, simple solutions like godowns, threshing
floors and collection centres were suggested by which the farmers hope
will go a long way in getting better prices.
2. Stake Holders demands.
The stake holders in different parts of the sub basin repeatedly
requested the following improveme nts.
a. Storage godowns
b. Threshing Floors/Drying Yards
c. Collection Centres.
d. Market Information
e. More knowledge about pre ^ post harvest technologies.
3. Marketing interventions proposed with reference to identified
constraints and challenges.

79
S.NO CROPConstraint
& ChallengesCounter Measures
Tomotta,
tapioca,
maize
Production
glut/shortage
Linkage with traders on contract farming,
Food processing methods.
Lack of availablemarket
No Such difficulty, for Speeding up themarketing collection centres and formationof marketing, sub groups at WUA level forthis purpose are suggested.
Poor post harvest
Practices
Capacity building, village common
godowns and threshing floors are
suggested.
No collective action For diversified crops, collection centres
are suggested
Lack of Market
information
IT methods are suggested
Diversification/Futurevision proposed
10% area under paddy proposed to bediversified to maize. 40% area underHorticulture Crop is to be covered underGap area and about 100 Ha unde r foodercrop. The remaining area will be coveredby agrl crops like maize, groundnut andTapioca.
Identifying new
markets and new
crops
For maize contract farming arrangements
to be made.
Improving existing
market Utilization
Suitable suggestions are made under V(2)
Providing Multiple
Market Information
Separate IT Proposal is suggested
Ensuring Collective
Bargaining/marketing
Sub group of WUA is to be formed for this
purpose.
Improving access to
market by better
transport or collective
Included in collection center item and also
by encouraging private transport
arrangements

80
transport
Processing and Agroprocessing
Suitable recommendations are made forgowowns and threshing floors/dryingyards.
New practices in
quality control Quality control is attended by Agmark lab
Salem.
Information Education
and Communication
Included under training component.
INTRODUCTION
Upper Vellar Sub basin is dependent on non system chain of tanks. The water
use efficiency of the system is around 53% which is sub economic and being
improved by WRO/PWD. The annual average weighted rainfall is around 847 mm. and
below state average.
The sub basin is a deficit one. i.e. 305.548 mm.
The cropping system is dominated by paddy, pulses, sugarcane, tap ioca cotton
and vegetables. Arecanut is the dominant plantation crop. Due to presence of hard
rock sbstrata, deep-rooted horticultural crops are difficult to cultivate.
The marketing infrastructure consists of 3 Regulated Markets 1 Farmer’s
Market, 3 Storage godowns and 3 threshing floors besides number of private mundies.
The transportation is through private vehicles. Grading and quality control are limited,
and one agmark Lab is functioning to cater the needs of private packers. No
specialized storage godown available, IT based market information system and Agro
based industry except sago industry are absent.
The marketing stategy is based on the following 3 items:
1. Survey of existing cropping/ marketing scenario.
2. Stake Holder’s consultation.
3. Deciding on suitable marketing components based on gap area cropping
and diversification.
Thus the following components were decided and included in the project.
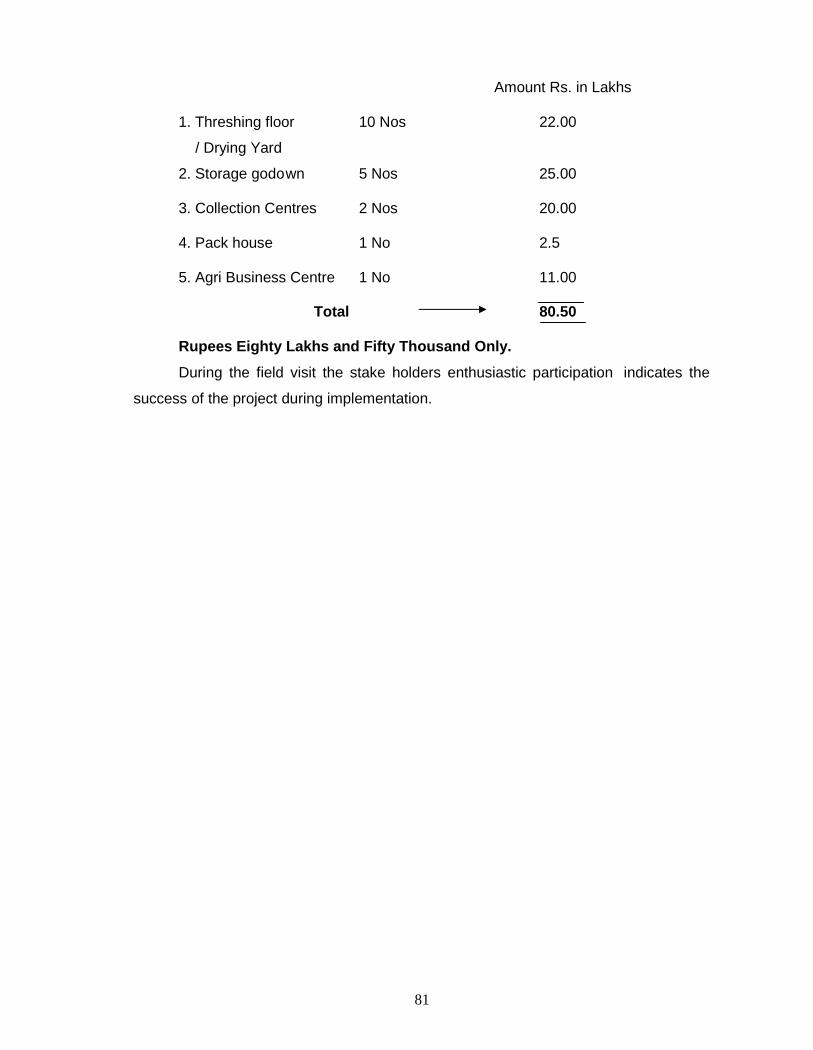
81
Amount Rs. in Lakhs
1. Threshing floor 10 Nos 22.00
/ Drying Yard
2. Storage godown 5 Nos 25.00
3. Collection Centres 2 Nos 20.00
4. Pack house 1 No 2.5
5. Agri Business Centre 1 No 11.00
Total 80.50
Rupees Eighty Lakhs and Fifty Thousand Only.
During the field visit the stake holders enthusiastic participation indicates the
success of the project during implementation.
82
ANIMAL HUSBANDRY COMPONENT
IAMWARM PROJECT
UPPER VELLAR SUB BASIN
Commissionerrate of Animal Husbandry & VeterinaryServices, Chennai 600 006
IAMWARM PROJECT
ANIMAL HUSBANDRY
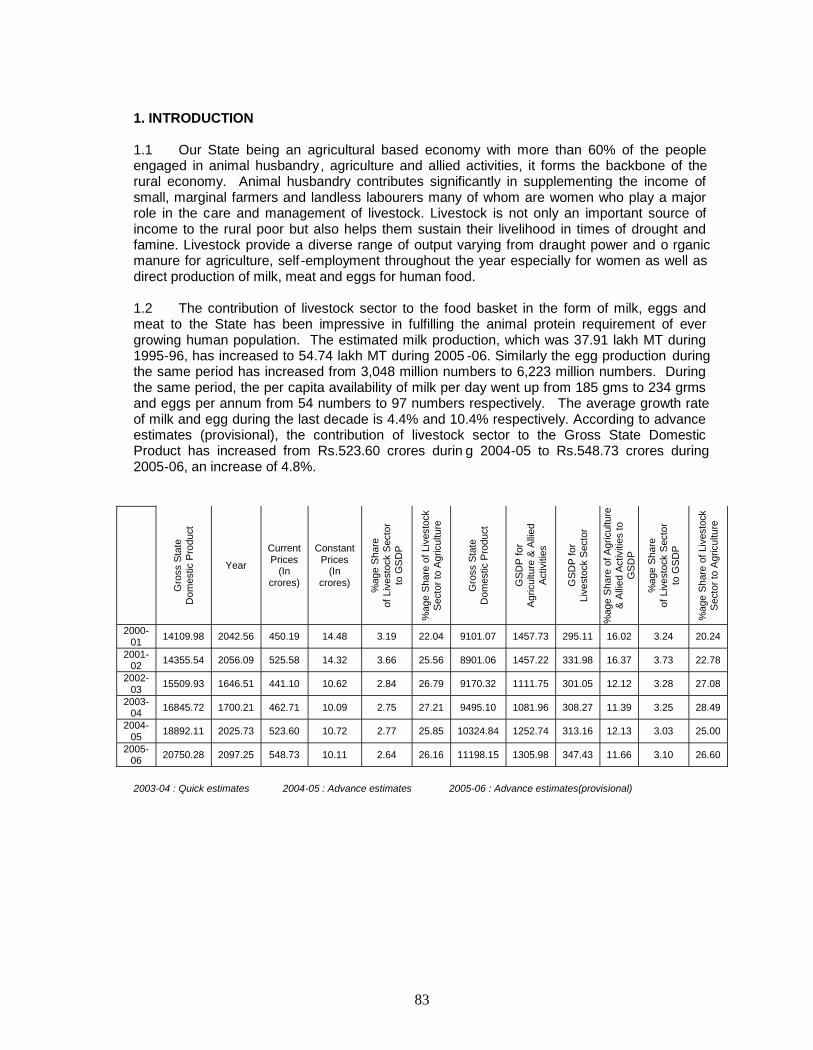
83
1. INTRODUCTION
1.1 Our State being an agricultural based economy with more than 60% of the peopleengaged in animal husbandry, agriculture and allied activities, it forms the backbone of therural economy. Animal husbandry contributes significantly in supplementing the income ofsmall, marginal farmers and landless labourers many of whom are women who play a majorrole in the care and management of livestock. Livestock is not only an important source ofincome to the rural poor but also helps them sustain their livelihood in times of drought andfamine. Livestock provide a diverse range of output varying from draught power and o rganicmanure for agriculture, self -employment throughout the year especially for women as well asdirect production of milk, meat and eggs for human food.
1.2 The contribution of livestock sector to the food basket in the form of milk, eggs andmeat to the State has been impressive in fulfilling the animal protein requirement of evergrowing human population. The estimated milk production, which was 37.91 lakh MT during1995-96, has increased to 54.74 lakh MT during 2005 -06. Similarly the egg production duringthe same period has increased from 3,048 million numbers to 6,223 million numbers. Duringthe same period, the per capita availability of milk per day went up from 185 gms to 234 grmsand eggs per annum from 54 numbers to 97 numbers respectively. The average growth rateof milk and egg during the last decade is 4.4% and 10.4% respectively. According to advanceestimates (provisional), the contribution of livestock sector to the Gross State DomesticProduct has increased from Rs.523.60 crores durin g 2004-05 to Rs.548.73 crores during2005-06, an increase of 4.8%.
Gro
ss S
tate
Dom
estic
Pro
duct
Year
CurrentPrices
(Incrores)
ConstantPrices
(Incrores)
%ag
e Sh
are
of L
ives
tock
Sec
tor
to G
SDP
%ag
e Sh
are
of L
ives
tock
Sect
or to
Agr
icul
ture
Gro
ss S
tate
Dom
estic
Pro
duct
GSD
P fo
rAg
ricul
ture
& A
llied
Activ
ities
GSD
P fo
rLi
vest
ock
Sect
or
%ag
e Sh
are
of A
gric
ultu
re&
Allie
d Ac
tiviti
es to
GSD
P
%ag
e Sh
are
of L
ives
tock
Sec
tor
to G
SDP
%ag
e Sh
are
of L
ives
tock
Sect
or to
Agr
icul
ture
2000-01 14109.98 2042.56 450.19 14.48 3.19 22.04 9101.07 1457.73 295.11 16.02 3.24 20.24
2001-02 14355.54 2056.09 525.58 14.32 3.66 25.56 8901.06 1457.22 331.98 16.37 3.73 22.78
2002-03 15509.93 1646.51 441.10 10.62 2.84 26.79 9170.32 1111.75 301.05 12.12 3.28 27.08
2003-04 16845.72 1700.21 462.71 10.09 2.75 27.21 9495.10 1081.96 308.27 11.39 3.25 28.49
2004-05 18892.11 2025.73 523.60 10.72 2.77 25.85 10324.84 1252.74 313.16 12.13 3.03 25.00
2005-06 20750.28 2097.25 548.73 10.11 2.64 26.16 11198.15 1305.98 347.43 11.66 3.10 26.60
2003-04 : Quick estimates 2004-05 : Advance estimates 2005-06 : Advance estimates(provisional)
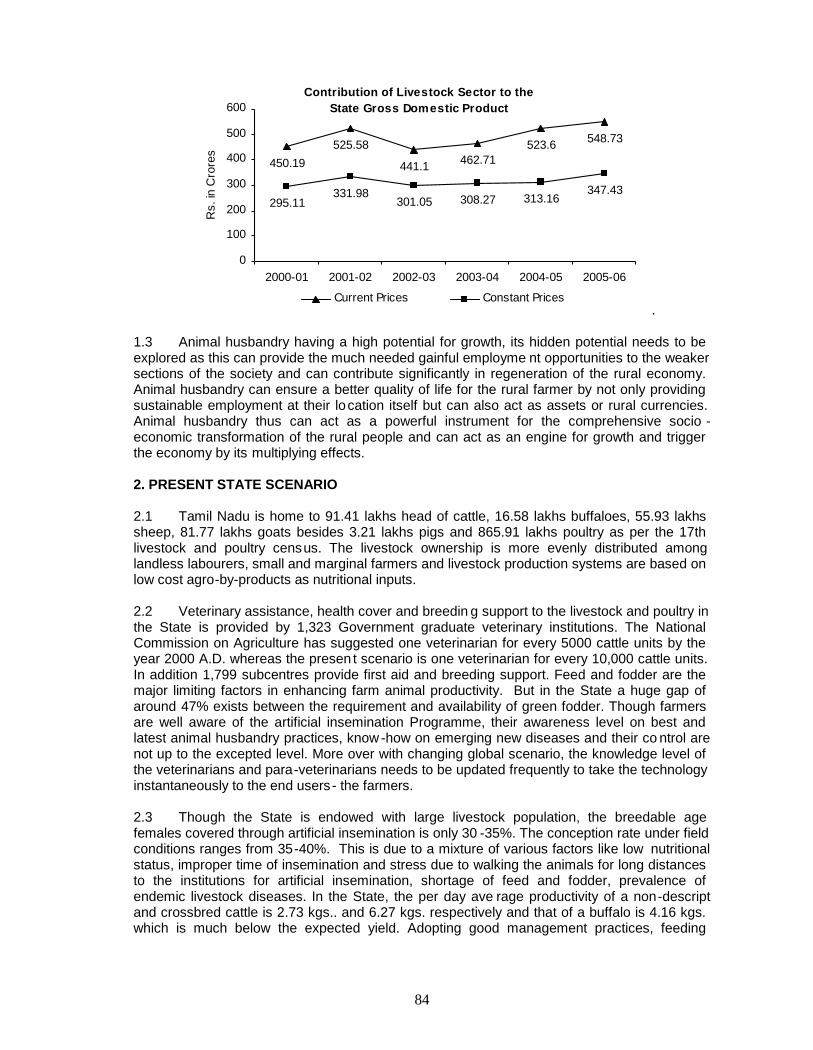
84
Contribution of Livestock Sector to theState Gross Domestic Product
525.58
441.1 462.71523.6 548.73
331.98301.05 308.27 313.16
347.43
450.19
295.11
0
100
200
300
400
500
600
2000-01 2001-02 2002-03 2003-04 2004-05 2005-06
Rs.
in C
rore
s
Current Prices Constant Prices.
1.3 Animal husbandry having a high potential for growth, its hidden potential needs to beexplored as this can provide the much needed gainful employme nt opportunities to the weakersections of the society and can contribute significantly in regeneration of the rural economy.Animal husbandry can ensure a better quality of life for the rural farmer by not only providingsustainable employment at their location itself but can also act as assets or rural currencies.Animal husbandry thus can act as a powerful instrument for the comprehensive socio -economic transformation of the rural people and can act as an engine for growth and triggerthe economy by its multiplying effects.
2. PRESENT STATE SCENARIO
2.1 Tamil Nadu is home to 91.41 lakhs head of cattle, 16.58 lakhs buffaloes, 55.93 lakhssheep, 81.77 lakhs goats besides 3.21 lakhs pigs and 865.91 lakhs poultry as per the 17thlivestock and poultry census. The livestock ownership is more evenly distributed amonglandless labourers, small and marginal farmers and livestock production systems are based onlow cost agro-by-products as nutritional inputs.
2.2 Veterinary assistance, health cover and breedin g support to the livestock and poultry inthe State is provided by 1,323 Government graduate veterinary institutions. The NationalCommission on Agriculture has suggested one veterinarian for every 5000 cattle units by theyear 2000 A.D. whereas the presen t scenario is one veterinarian for every 10,000 cattle units.In addition 1,799 subcentres provide first aid and breeding support. Feed and fodder are themajor limiting factors in enhancing farm animal productivity. But in the State a huge gap ofaround 47% exists between the requirement and availability of green fodder. Though farmersare well aware of the artificial insemination Programme, their awareness level on best andlatest animal husbandry practices, know-how on emerging new diseases and their co ntrol arenot up to the excepted level. More over with changing global scenario, the knowledge level ofthe veterinarians and para-veterinarians needs to be updated frequently to take the technologyinstantaneously to the end users- the farmers.
2.3 Though the State is endowed with large livestock population, the breedable agefemales covered through artificial insemination is only 30 -35%. The conception rate under fieldconditions ranges from 35-40%. This is due to a mixture of various factors like low nutritionalstatus, improper time of insemination and stress due to walking the animals for long distancesto the institutions for artificial insemination, shortage of feed and fodder, prevalence ofendemic livestock diseases. In the State, the per day ave rage productivity of a non-descriptand crossbred cattle is 2.73 kgs.. and 6.27 kgs. respectively and that of a buffalo is 4.16 kgs.which is much below the expected yield. Adopting good management practices, feeding
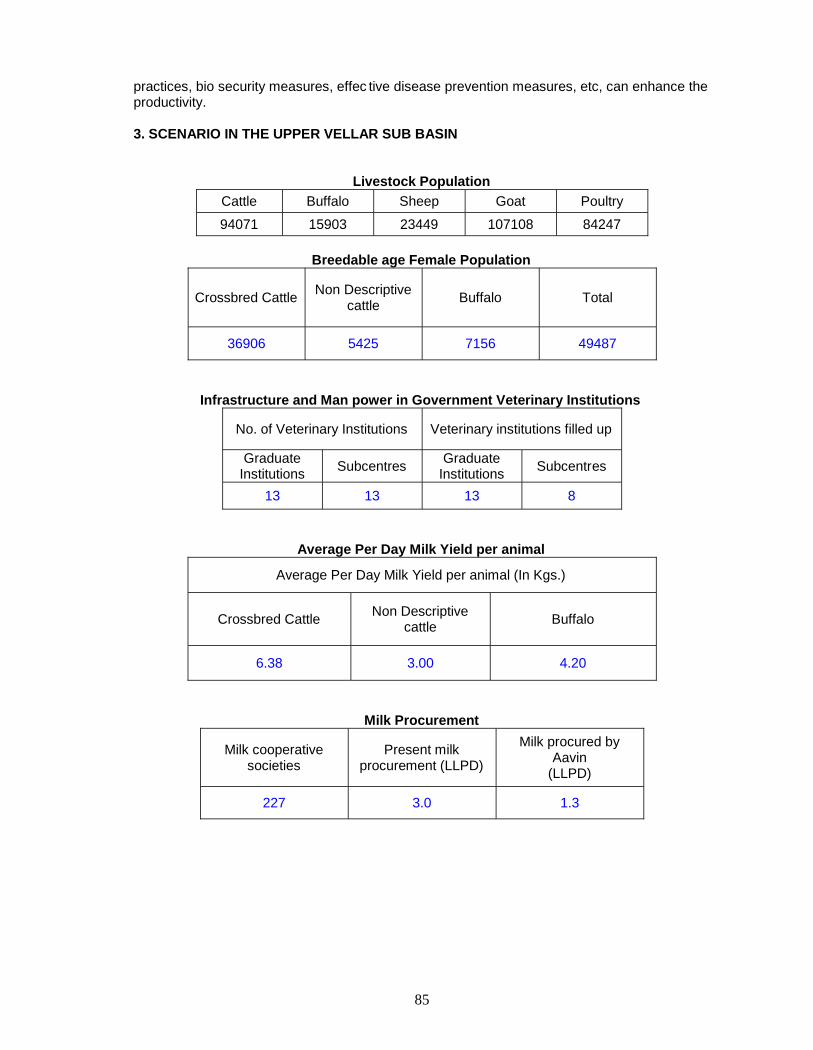
85
practices, bio security measures, effec tive disease prevention measures, etc, can enhance theproductivity.
3. SCENARIO IN THE UPPER VELLAR SUB BASIN
Livestock PopulationCattle Buffalo Sheep Goat Poultry
94071 15903 23449 107108 84247
Breedable age Female Population
Crossbred Cattle Non Descriptivecattle Buffalo Total
36906 5425 7156 49487
Infrastructure and Man power in Government Veterinary Institutions
No. of Veterinary Institutions Veterinary institutions filled up
GraduateInstitutions Subcentres Graduate
Institutions Subcentres
13 13 13 8
Average Per Day Milk Yield per animal
Average Per Day Milk Yield per animal (In Kgs.)
Crossbred Cattle Non Descriptivecattle Buffalo
6.38 3.00 4.20
Milk Procurement
Milk cooperativesocieties
Present milkprocurement (LLPD)
Milk procured byAavin
(LLPD)
227 3.0 1.3
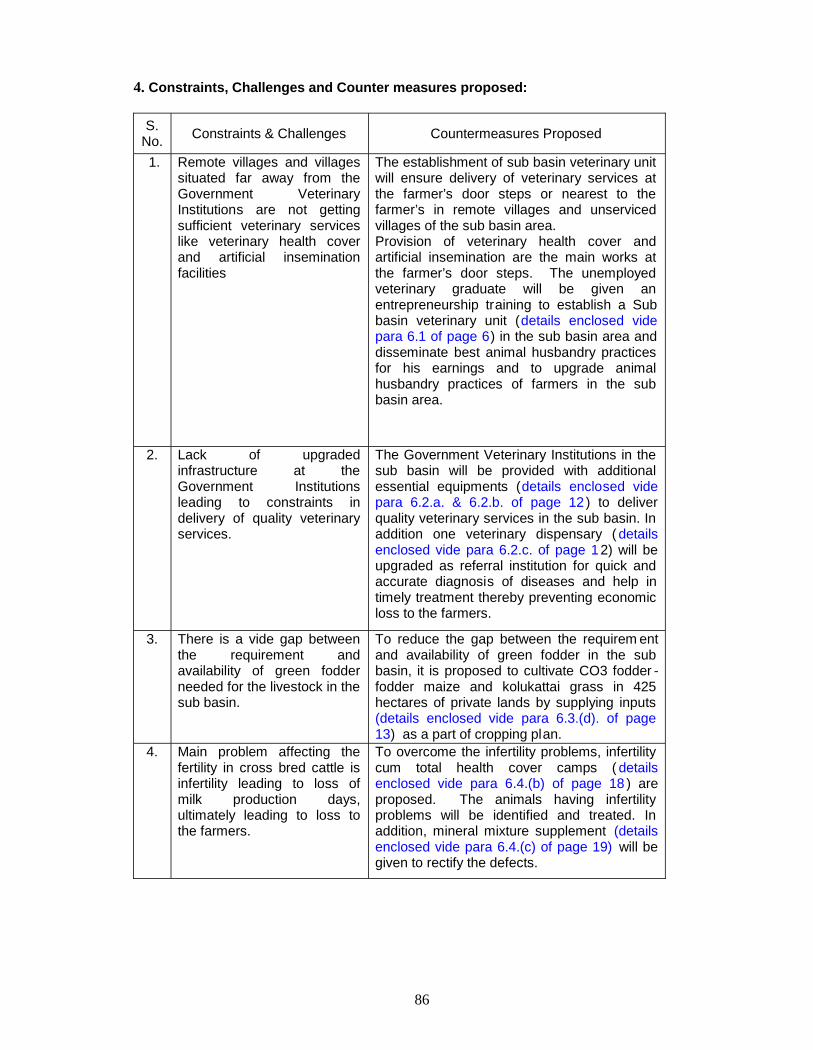
86
4. Constraints, Challenges and Counter measures proposed:
S.No. Constraints & Challenges Countermeasures Proposed
1. Remote villages and villagessituated far away from theGovernment VeterinaryInstitutions are not gettingsufficient veterinary serviceslike veterinary health coverand artificial inseminationfacilities
The establishment of sub basin veterinary unitwill ensure delivery of veterinary services atthe farmer’s door steps or nearest to thefarmer’s in remote villages and unservicedvillages of the sub basin area.Provision of veterinary health cover andartificial insemination are the main works atthe farmer’s door steps. The unemployedveterinary graduate will be given anentrepreneurship training to establish a Subbasin veterinary unit (details enclosed videpara 6.1 of page 6) in the sub basin area anddisseminate best animal husbandry practicesfor his earnings and to upgrade animalhusbandry practices of farmers in the subbasin area.
2. Lack of upgradedinfrastructure at theGovernment Institutionsleading to constraints indelivery of quality veterinaryservices.
The Government Veterinary Institutions in thesub basin will be provided with additionalessential equipments (details enclosed videpara 6.2.a. & 6.2.b. of page 12 ) to deliverquality veterinary services in the sub basin. Inaddition one veterinary dispensary ( detailsenclosed vide para 6.2.c. of page 12) will beupgraded as referral institution for quick andaccurate diagnosis of diseases and help intimely treatment thereby preventing economicloss to the farmers.
3. There is a vide gap betweenthe requirement andavailability of green fodderneeded for the livestock in thesub basin.
To reduce the gap between the requirem entand availability of green fodder in the subbasin, it is proposed to cultivate CO3 fodder -fodder maize and kolukattai grass in 425hectares of private lands by supplying inputs(details enclosed vide para 6.3.(d). of page13) as a part of cropping plan.
4. Main problem affecting thefertility in cross bred cattle isinfertility leading to loss ofmilk production days,ultimately leading to loss tothe farmers.
To overcome the infertility problems, infertilitycum total health cover camps ( detailsenclosed vide para 6.4.(b) of page 18 ) areproposed. The animals having infertilityproblems will be identified and treated. Inaddition, mineral mixture supplement (detailsenclosed vide para 6.4.(c) of page 19) will begiven to rectify the defects.

87
S.No. Constraints & Challenges Countermeasures Proposed
5. Lack of adequate know-howabout the livestockmanagement practices likefeeding, breeding, health careand deworming activities.
The farmers in the sub basin will be giventraining (details enclosed vide para 6.5.a. ofpage 20) on best livestock managementpractices in livestock breeding activities likesigns of oestrum, correct time of artificialinsemination, deworming, feeding scheduleand other health care measures. In addition,IEC materials will be distributed to farmers inthe sub basin. More over hoard ings and wallpaintings depicting signs of commonlyaffecting diseases will be erected in placeswhere people congregate in large numbers.Apart from this, quarterly night meetings willbe conducted to disseminate information tothe farmers in the sub basin. (details enclosedvide para 6.4.(d) of page 19)
6. Lack of update knowledgeand skills of the veterinariansand para-veterinarians in theproject area.
Veterinarians in the project area will be giventrainers training (details enclosed vide para6.5.(d) of page 21) at Veterinary Colleges toupdate and refresh their skills and knowledge.They will inturn train the para-veterinarians.
5. OBJECTIVES OF THE PROJECT
5.1 With this background, the main objective of the Animal Husbandry Department will beto intervene in all possible ways utilising the resources to the maximum to improve theproduction potentialities of the livestock in the sub basin through multi disciplinary approach.
The main interventions will be: Productivity enhancement by improving delivery of veterinary services in the project
area at the Government and private level. Increasing availability of green fodder and other fodder for sustenance. Conducting various out reach programmes to enhance productivity. Enhancing the knowledge level of human resource in the project area.
5.2 With the above interventions, not only the crossbred population in the sub basin isexpected to rise but also the disease outbreaks will be kept under control. Moreoversystematic and periodical deworming will lead to a 10% increase in weight gain, therebyincreasing the total meat yield per animal. More over the various out reach programmes andenhancing the knowledge level in the sub basin area will lead to better animal husbandrypractices. Thus ultimately, the per animal milk yield is expected to increase from 6.38 ts to 10litres in crossbred, from 3.0 lts to 3.60 lts. in indigenous and from 4.20 to 7 litres in buffaloes,leading to increased total farm income.
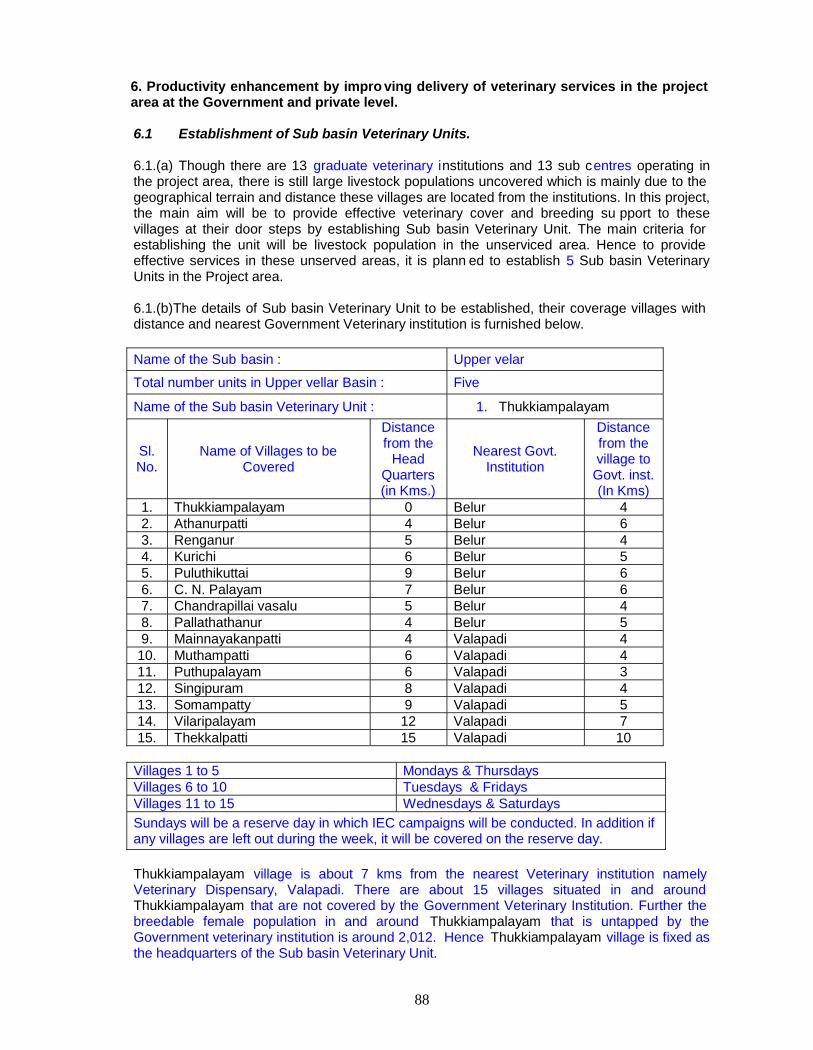
88
6. Productivity enhancement by impro ving delivery of veterinary services in the projectarea at the Government and private level.
6.1 Establishment of Sub basin Veterinary Units.
6.1.(a) Though there are 13 graduate veterinary institutions and 13 sub centres operating inthe project area, there is still large livestock populations uncovered which is mainly due to thegeographical terrain and distance these villages are located from the institutions. In this project,the main aim will be to provide effective veterinary cover and breeding su pport to thesevillages at their door steps by establishing Sub basin Veterinary Unit. The main criteria forestablishing the unit will be livestock population in the unserviced area. Hence to provideeffective services in these unserved areas, it is plann ed to establish 5 Sub basin VeterinaryUnits in the Project area.
6.1.(b)The details of Sub basin Veterinary Unit to be established, their coverage villages withdistance and nearest Government Veterinary institution is furnished below.
Name of the Sub basin : Upper velar
Total number units in Upper vellar Basin : Five
Name of the Sub basin Veterinary Unit : 1. Thukkiampalayam
Sl.No.
Name of Villages to beCovered
Distancefrom the
HeadQuarters(in Kms.)
Nearest Govt.Institution
Distancefrom thevillage to
Govt. inst.(In Kms)
1. Thukkiampalayam 0 Belur 42. Athanurpatti 4 Belur 63. Renganur 5 Belur 44. Kurichi 6 Belur 55. Puluthikuttai 9 Belur 66. C. N. Palayam 7 Belur 67. Chandrapillai vasalu 5 Belur 48. Pallathathanur 4 Belur 59. Mainnayakanpatti 4 Valapadi 4
10. Muthampatti 6 Valapadi 411. Puthupalayam 6 Valapadi 312. Singipuram 8 Valapadi 413. Somampatty 9 Valapadi 514. Vilaripalayam 12 Valapadi 715. Thekkalpatti 15 Valapadi 10
Villages 1 to 5 Mondays & ThursdaysVillages 6 to 10 Tuesdays & FridaysVillages 11 to 15 Wednesdays & SaturdaysSundays will be a reserve day in which IEC campaigns will be conducted. In addition ifany villages are left out during the week, it will be covered on the reserve day.
Thukkiampalayam village is about 7 kms from the nearest Veterinary institution namelyVeterinary Dispensary, Valapadi. There are about 15 villages situated in and aroundThukkiampalayam that are not covered by the Government Veterinary Institution. Further thebreedable female population in and around Thukkiampalayam that is untapped by theGovernment veterinary institution is around 2,012. Hence Thukkiampalayam village is fixed asthe headquarters of the Sub basin Veterinary Unit.
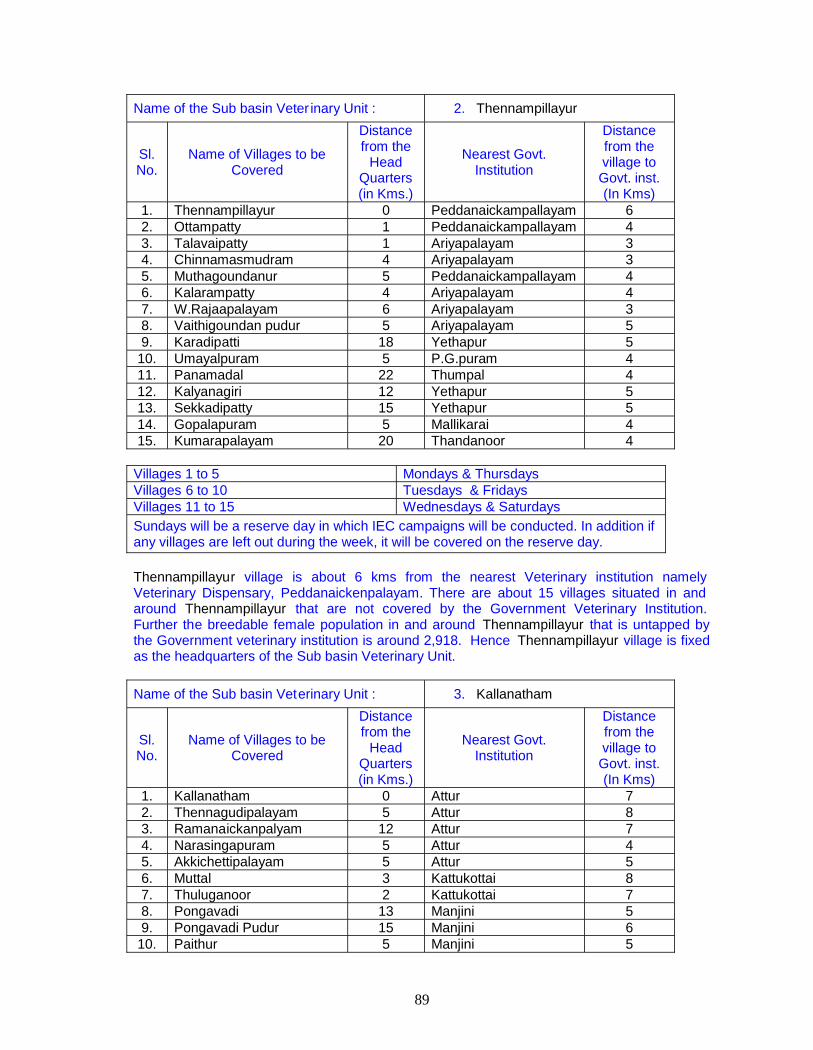
89
Name of the Sub basin Veter inary Unit : 2. Thennampillayur
Sl.No.
Name of Villages to beCovered
Distancefrom the
HeadQuarters(in Kms.)
Nearest Govt.Institution
Distancefrom thevillage toGovt. inst.(In Kms)
1. Thennampillayur 0 Peddanaickampallayam 62. Ottampatty 1 Peddanaickampallayam 43. Talavaipatty 1 Ariyapalayam 34. Chinnamasmudram 4 Ariyapalayam 35. Muthagoundanur 5 Peddanaickampallayam 46. Kalarampatty 4 Ariyapalayam 47. W.Rajaapalayam 6 Ariyapalayam 38. Vaithigoundan pudur 5 Ariyapalayam 59. Karadipatti 18 Yethapur 5
10. Umayalpuram 5 P.G.puram 411. Panamadal 22 Thumpal 412. Kalyanagiri 12 Yethapur 513. Sekkadipatty 15 Yethapur 514. Gopalapuram 5 Mallikarai 415. Kumarapalayam 20 Thandanoor 4
Villages 1 to 5 Mondays & ThursdaysVillages 6 to 10 Tuesdays & FridaysVillages 11 to 15 Wednesdays & SaturdaysSundays will be a reserve day in which IEC campaigns will be conducted. In addition ifany villages are left out during the week, it will be covered on the reserve day.
Thennampillayur village is about 6 kms from the nearest Veterinary institution namelyVeterinary Dispensary, Peddanaickenpalayam. There are about 15 villages situated in andaround Thennampillayur that are not covered by the Government Veterinary Institution.Further the breedable female population in and around Thennampillayur that is untapped bythe Government veterinary institution is around 2,918. Hence Thennampillayur village is fixedas the headquarters of the Sub basin Veterinary Unit.
Name of the Sub basin Veterinary Unit : 3. Kallanatham
Sl.No.
Name of Villages to beCovered
Distancefrom the
HeadQuarters(in Kms.)
Nearest Govt.Institution
Distancefrom thevillage toGovt. inst.(In Kms)
1. Kallanatham 0 Attur 72. Thennagudipalayam 5 Attur 83. Ramanaickanpalyam 12 Attur 74. Narasingapuram 5 Attur 45. Akkichettipalayam 5 Attur 56. Muttal 3 Kattukottai 87. Thuluganoor 2 Kattukottai 78. Pongavadi 13 Manjini 59. Pongavadi Pudur 15 Manjini 6
10. Paithur 5 Manjini 5

90
11. Thandavarayapuram 8 Attur 412. Sokkanathapuram 9 Attur 513. Echempatty 10 Mallikari 414. Seeliyampatty 10 Mallikari 415. Aarsanatham 15 Mallikari 4
Villages 1 to 5 Mondays & ThursdaysVillages 6 to 10 Tuesdays & FridaysVillages 11 to 15 Wednesdays & SaturdaysSundays will be a reserve day in which IEC campaigns will be conducted. In addition ifany villages are left out during the week, it will be covered on the reserve day.
Kallanatham village is about 7 kms from the nearest Veterinary institution namely Veteri naryHospital, Athur. There are about 15 villages situated in and around Kallanatham that are notcovered by the Government Veterinary Institution. Further the breedable female population inand around Kallanatham that is untapped by the Government veterin ary institution is around2,887. Hence Kallanatham village is fixed as the headquarters of the Sub basin VeterinaryUnit.
Name of the Sub basin Veterinary Unit : 4. Manivizulanthan
Sl.No.
Name of Villages to beCovered
Distancefrom the
HeadQuarters(in Kms.)
Nearest Govt.Institution
Distancefrom thevillage toGovt. inst.(In Kms)
1. Manivizulanthan 0 Kattukottai 52. Sadasivapuram 15 Sathapadi 53. Vadakumarai 5 Sathapadi 44. Thenkumari 5 Sathapadi 65. Sarvoipudur 8 Sathapadi 86. Sarvoi 5 Sathapadi 57. Pattudurai 4 Thallaivasal 88. Deveyakurichi 3 Thallaivasal 69. Navakkurichi 6 Thallaivasal 5
10. Nathakarai 8 Thallaivasal 411. Punalvasal 20 Sathapadi 812. Navallur 16 Sathapadi 813. Othiathur 25 Thallaivasal 914. Naduvallur 30 Thallaivasal 1015. Orniyanpatti 35 Thallaivasal 12
Villages 1 to 5 Mondays & ThursdaysVillages 6 to 10 Tuesdays & FridaysVillages 11 to 15 Wednesdays & SaturdaysSundays will be a reserve day in which IEC campaigns will be conducted. In addit ion ifany villages are left out during the week, it will be covered on the reserve day.Manivizulanthan village is about 6 kms from the nearest Veterinary institution namelyVeterinary Dispensary, Arraganur. There are about 15 villages situated in and ar oundManivizulanthan that are not covered by the Government Veterinary Institution. Further thebreedable female population in and around Manivizulanthan that is untapped by the

91
Government veterinary institution is around 2988. Hence Manivizulanthan village is fixed asthe headquarters of the Sub basin Veterinary Unit.
Name of the Sub basin Veterinary Unit : 5. Puliyankurichi
Sl.No.
Name of Villages to beCovered
Distancefrom the
HeadQuarters(in Kms.)
Nearest Govt.Institution
Distancefrom thevillage toGovt. inst.(In Kms)
1. Puliyankurichi 0 Illypanatham 42. Pallipalyam 6 Illypanatham 53. Pakadaipadi 3 Illypanatham 44. Vellaiyur 4 Illypanatham 55. Govindanpalyam 5 Illypanatham 66. Sitheri 5 Aragalur 57. Periari 9 Aragalur 48. Aagrahram 7 Aragalur 49. Thaiyganur 9 Aragalur 5
10. Veppamponndi 5 Aragalur 611. Nattarmangalam 6 Thalaivasal 612. Laddivadi 10 Veeraganur 613. Pillankulam 8 Veeraganur 814. Kamakkapalyam 7 Veeraganur 715. Kaikallathur 5 Veeraganur 5
Villages 1 to 5 Mondays & ThursdaysVillages 6 to 10 Tuesdays & FridaysVillages 11 to 15 Wednesdays & SaturdaysSundays will be a reserve day in which IEC campaigns will be conducted. In addition ifany villages are left out during the week, it will be covered o n the reserve day.
Puliyankurichi village is about 8 kms from the nearest Veterinary institution namely VeterinaryDispensary, Thalaivasal. There are about 15 villages situated in and around Puliyankurichi thatare not covered by the Government Veterinar y Institution. Further the breedable femalepopulation in and around Puliyankurichi that is untapped by the Government veterinaryinstitution is around 2,200. Hence Puliyankurichi village is fixed as the headquarters of theSub basin Veterinary Unit.
6.1.(c) An unemployed Veterinary Graduate who will be designated as Sub basin VeterinaryExtension Officer will Mann each Unit. He will be given one month entrepreneurship trainingat renowned national institutions like IRMA / NDDB. On completion of this tr aining, the AnimalHusbandry Department will give him 5 days orientation training in the nearest veterinaryinstitution. The orientation training will be an over view of the departmental organisation andstructure, duties and role of officers, disease ende micity and farmers know-how in the area.
6.1.(d) On completion of training, the unemployed veterinary graduate selected will be a givena two wheeler. The two-wheeler vehicle will be the property of the Water Users Association.He will be located in the Water Users Association building, which will be his headquarters. Hewill prepare a weekly route map in consultation with Animal Husbandry Department, WaterUsers Association and local village panchayats for providing veterinary services. He will visitthe villages as per the scheduled programme and provide veterinary services like vaccination,deworming, castration and treatment and breeding support like artificial insemination andpregnancy diagnosis. The route will be reviewed and assessed for intake of the veterinary
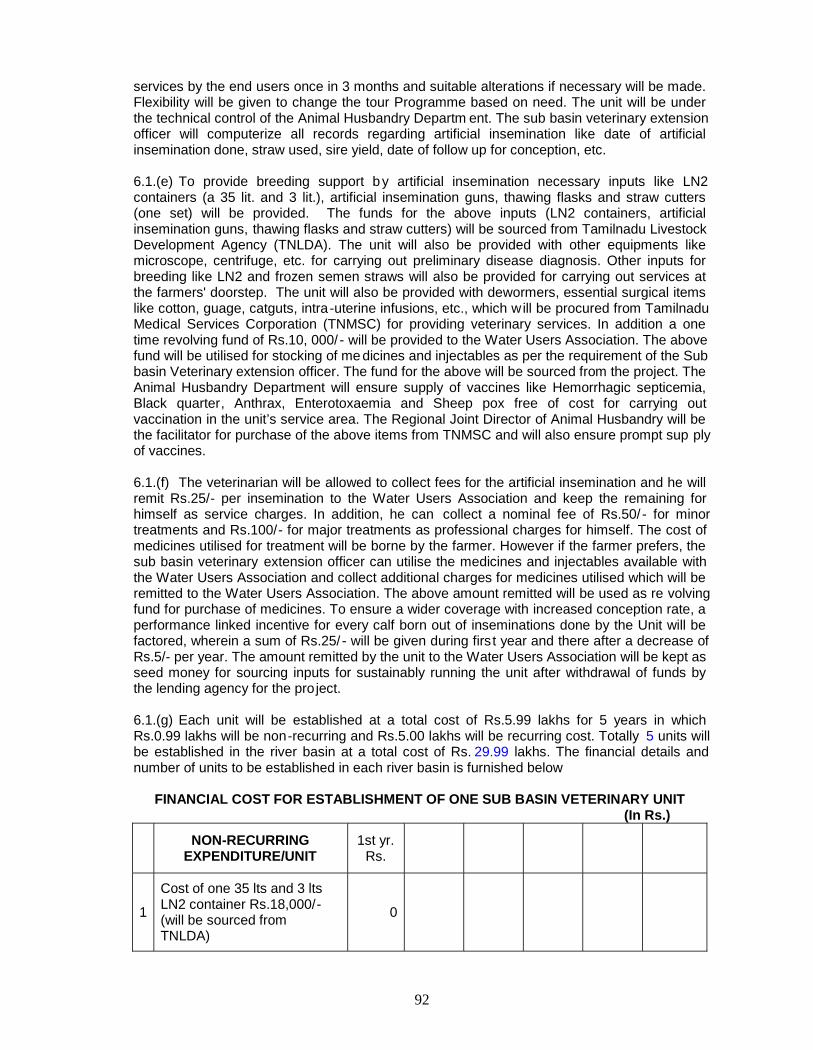
92
services by the end users once in 3 months and suitable alterations if necessary will be made.Flexibility will be given to change the tour Programme based on need. The unit will be underthe technical control of the Animal Husbandry Departm ent. The sub basin veterinary extensionofficer will computerize all records regarding artificial insemination like date of artificialinsemination done, straw used, sire yield, date of follow up for conception, etc.
6.1.(e) To provide breeding support by artificial insemination necessary inputs like LN2containers (a 35 lit. and 3 lit.), artificial insemination guns, thawing flasks and straw cutters(one set) will be provided. The funds for the above inputs (LN2 containers, artificialinsemination guns, thawing flasks and straw cutters) will be sourced from Tamilnadu LivestockDevelopment Agency (TNLDA). The unit will also be provided with other equipments likemicroscope, centrifuge, etc. for carrying out preliminary disease diagnosis. Other inputs forbreeding like LN2 and frozen semen straws will also be provided for carrying out services atthe farmers' doorstep. The unit will also be provided with dewormers, essential surgical itemslike cotton, guage, catguts, intra-uterine infusions, etc., which will be procured from TamilnaduMedical Services Corporation (TNMSC) for providing veterinary services. In addition a onetime revolving fund of Rs.10, 000/ - will be provided to the Water Users Association. The abovefund will be utilised for stocking of me dicines and injectables as per the requirement of the Subbasin Veterinary extension officer. The fund for the above will be sourced from the project. TheAnimal Husbandry Department will ensure supply of vaccines like Hemorrhagic septicemia,Black quarter, Anthrax, Enterotoxaemia and Sheep pox free of cost for carrying outvaccination in the unit’s service area. The Regional Joint Director of Animal Husbandry will bethe facilitator for purchase of the above items from TNMSC and will also ensure prompt sup plyof vaccines.
6.1.(f) The veterinarian will be allowed to collect fees for the artificial insemination and he willremit Rs.25/- per insemination to the Water Users Association and keep the remaining forhimself as service charges. In addition, he can collect a nominal fee of Rs.50/ - for minortreatments and Rs.100/- for major treatments as professional charges for himself. The cost ofmedicines utilised for treatment will be borne by the farmer. However if the farmer prefers, thesub basin veterinary extension officer can utilise the medicines and injectables available withthe Water Users Association and collect additional charges for medicines utilised which will beremitted to the Water Users Association. The above amount remitted will be used as re volvingfund for purchase of medicines. To ensure a wider coverage with increased conception rate, aperformance linked incentive for every calf born out of inseminations done by the Unit will befactored, wherein a sum of Rs.25/ - will be given during firs t year and there after a decrease ofRs.5/- per year. The amount remitted by the unit to the Water Users Association will be kept asseed money for sourcing inputs for sustainably running the unit after withdrawal of funds bythe lending agency for the project.
6.1.(g) Each unit will be established at a total cost of Rs.5.99 lakhs for 5 years in whichRs.0.99 lakhs will be non-recurring and Rs.5.00 lakhs will be recurring cost. Totally 5 units willbe established in the river basin at a total cost of Rs. 29.99 lakhs. The financial details andnumber of units to be established in each river basin is furnished below
FINANCIAL COST FOR ESTABLISHMENT OF ONE SUB BASIN VETERINARY UNIT(In Rs.)
NON-RECURRINGEXPENDITURE/UNIT
1st yr.Rs.
1
Cost of one 35 lts and 3 ltsLN2 container Rs.18,000/-(will be sourced fromTNLDA)
0
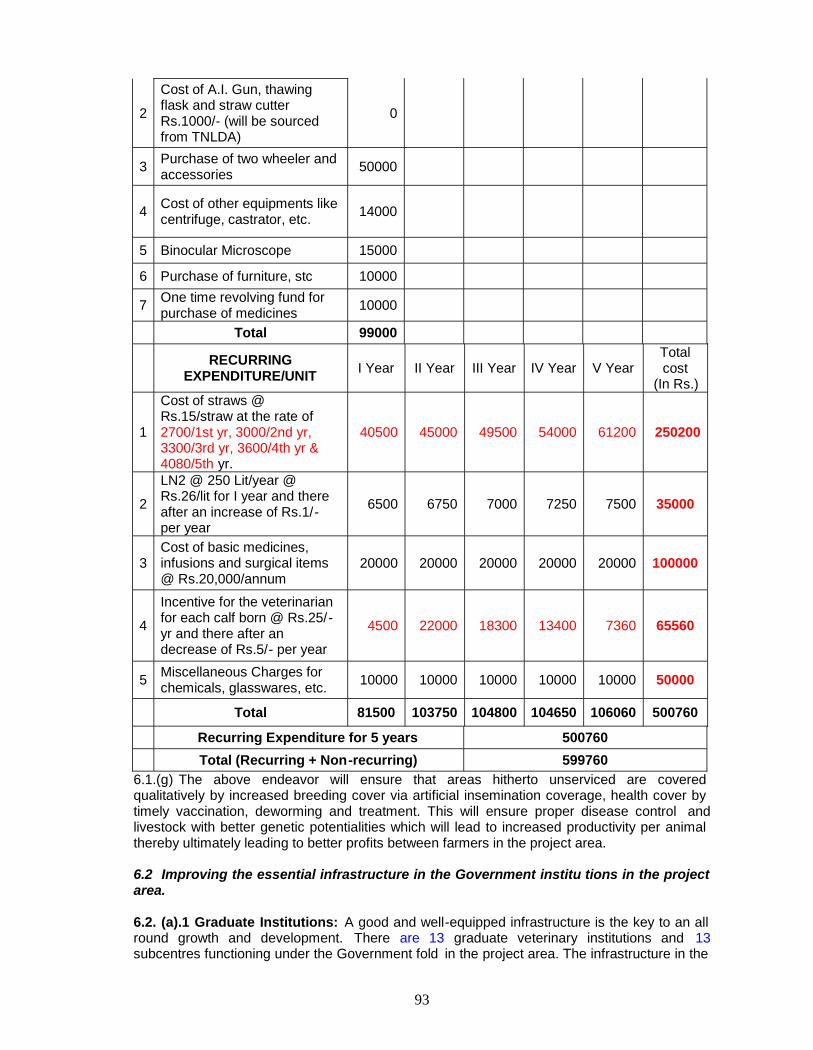
93
2
Cost of A.I. Gun, thawingflask and straw cutterRs.1000/- (will be sourcedfrom TNLDA)
0
3 Purchase of two wheeler andaccessories 50000
4 Cost of other equipments likecentrifuge, castrator, etc. 14000
5 Binocular Microscope 15000
6 Purchase of furniture, stc 10000
7 One time revolving fund forpurchase of medicines 10000
Total 99000
RECURRINGEXPENDITURE/UNIT I Year II Year III Year IV Year V Year
Totalcost
(In Rs.)
1
Cost of straws @Rs.15/straw at the rate of2700/1st yr, 3000/2nd yr,3300/3rd yr, 3600/4th yr &4080/5th yr.
40500 45000 49500 54000 61200 250200
2
LN2 @ 250 Lit/year @Rs.26/lit for I year and thereafter an increase of Rs.1/-per year
6500 6750 7000 7250 7500 35000
3Cost of basic medicines,infusions and surgical items@ Rs.20,000/annum
20000 20000 20000 20000 20000 100000
4
Incentive for the veterinarianfor each calf born @ Rs.25/-yr and there after andecrease of Rs.5/- per year
4500 22000 18300 13400 7360 65560
5 Miscellaneous Charges forchemicals, glasswares, etc. 10000 10000 10000 10000 10000 50000
Total 81500 103750 104800 104650 106060 500760
Recurring Expenditure for 5 years 500760Total (Recurring + Non-recurring) 599760
6.1.(g) The above endeavor will ensure that areas hitherto unserviced are coveredqualitatively by increased breeding cover via artificial insemination coverage, health cover bytimely vaccination, deworming and treatment. This will ensure proper disease control andlivestock with better genetic potentialities which will lead to increased productivity per animalthereby ultimately leading to better profits between farmers in the project area.
6.2 Improving the essential infrastructure in the Government institu tions in the projectarea.
6.2. (a).1 Graduate Institutions: A good and well-equipped infrastructure is the key to an allround growth and development. There are 13 graduate veterinary institutions and 13subcentres functioning under the Government fold in the project area. The infrastructure in the

94
graduate veterinary institutions are being strengthened at a cost of Rs.33,000/ - per GraduateInstitution. The infrastructure that are to be added in each Graduate Institution are Mouth Gag,dentist autoclave and mastitis detector. The 13 institutions will be strengthened at a cost ofRs.4.29 Lakhs.
6.2.(a).2 Mouth gag will help in better diagnosis, dentist autoclave will be handy which can becarried to field for sterilization of equipments, instruments u sed in routine Veterinary practicewhile mastitis detector will be useful for detection of sub clinical and clinical mastitis – adisease that causes reduction in milk yield, loss of productive days and prolonged recoverytime. The animal does not achieve the peak productivity after Mastitis, the early detection ofwhich will prevent huge economic losses to the farmers. All these measures will help ineffective delivery of Veterinary services and early diagnosis and facilitate quality and timelytreatment of ailments for the livestock in the sub basin area.
6.2.(b) Sub-centres: The infrastructure presently available to subcentres was provided 30years back are old and needs replacement. It is proposed to provide essential equipments likecastrators (large and small), dressing tray, scissors, forceps and wash basin to each subcentre in the project area at a cost of Rs.20,000/ - per sub centre. Totally 13 subcentres in theproject area will be provided with essential equipments at a total cost of Rs. 2.60 lakhs.
6.2.(c) Strengthening Diagnostic Facilities in Sub -basin Referral Institution:Strengthening the diagnostic facilities in the sub basin by providing special diagnostic tools totwo sub basin veterinary institutions at a cost of Rs.3.00 lakhs each, is also a part of theproject. The institution will be designated as Referral Institution for the sub basin. TheVeterinary hospital at Attur and Veterinary Dispensary at Pethanaikanpalayam will beupgraded as the referral institutions for the sub basin. In the identified referral institution, semiauto analyzer and accessories will be provided for ensuring complete timely blood analysis.Totally Rs.6.00 lakhs will be required for this component of work.
6.2.(d) Infrastructure improvement in the project area will enhance the quality of delivery inveterinary services and diagnostic facilities contributing to reduction in the incidences ofanimal diseases, thereby increasing the overall productivity, which can contribute significantlyin increasing the farm income of the farmers.
6.3. Increasing availability of green fodder .
6.3.(a) Feed and fodder are the major limiting factors in enhancing farm animal productivity. Inour country, fodder production is still deemed ancillary to agricultural production. The greenfodder resources for livestock are mainly derived from grazing in grasslands and pastures,fodder crops from cropped lands, weeds, bund grasses, tree leaves and mixed forages. Cropresidues mainly sorghum and paddy straws which are poor in nutritiv e value constitute themajor fodder for livestock. The economic viability of livestock husbandry depends on sourcesof feed and fodder, as feeding cost constitutes 65 -70% of the total cost of livestock farming.The availability of green fodder is restri cted to selected areas and seasons. Green foddershould be fed throughout the year not only to maintain milk production but also for improvingthe conception rate. Moreover adequate availability of green fodder will reduce thedependence of farmers on concentrates.
6.3.(b) Generally small ruminants like sheep and goats are not stall -fed. They are allowed forgrazing. Hence for calculation of green fodder, only the bovines are taken into account. In theproject area a considerable gap exists between requi rement and availability of green fodder.
6.3.(c) The requirement, availability and shortage of green fodder for the bovine population inthe project area is furnished below.
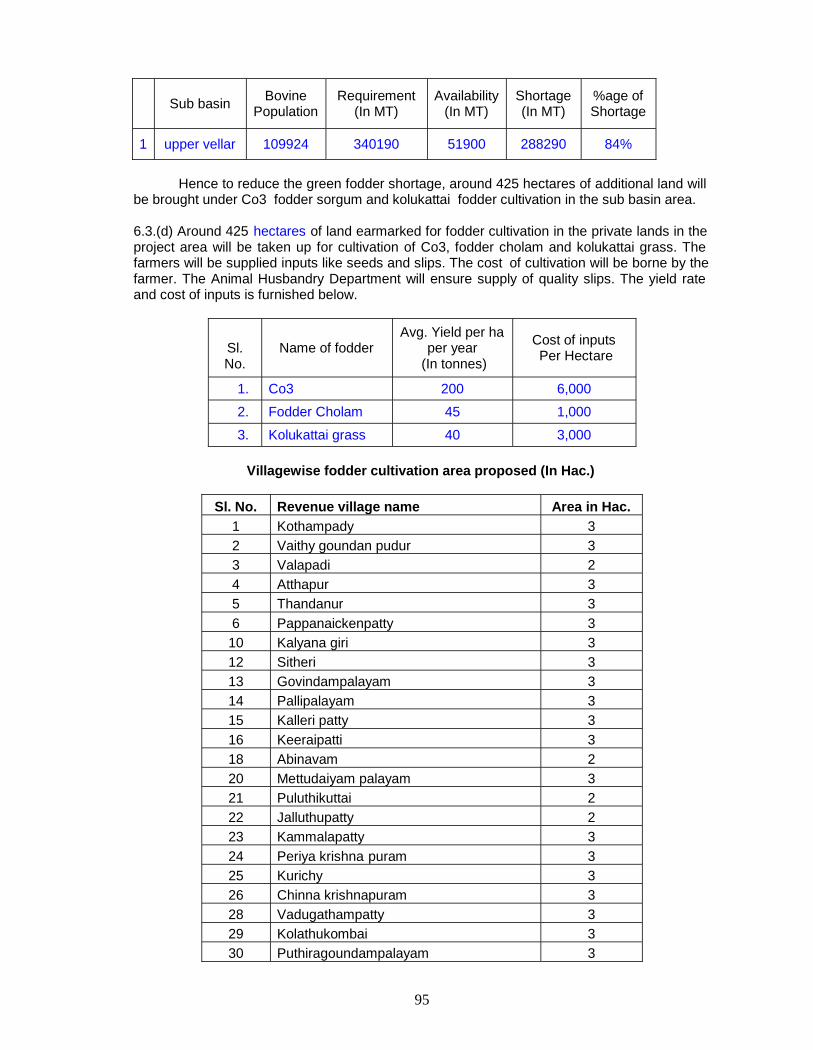
95
Sub basin BovinePopulation
Requirement(In MT)
Availability(In MT)
Shortage(In MT)
%age ofShortage
1 upper vellar 109924 340190 51900 288290 84%
Hence to reduce the green fodder shortage, around 425 hectares of additional land willbe brought under Co3 fodder sorgum and kolukattai fodder cultivation in the sub basin area.
6.3.(d) Around 425 hectares of land earmarked for fodder cultivation in the private lands in theproject area will be taken up for cultivation of Co3, fodder cholam and kolukattai grass. Thefarmers will be supplied inputs like seeds and slips. The cost of cultivation will be borne by thefarmer. The Animal Husbandry Department will ensure supply of quality slips. The yield rateand cost of inputs is furnished below.
Sl.No.
Name of fodderAvg. Yield per ha
per year (In tonnes)
Cost of inputs Per Hectare
1. Co3 200 6,000
2. Fodder Cholam 45 1,000
3. Kolukattai grass 40 3,000
Villagewise fodder cultivation area proposed (In Hac.)
Sl. No. Revenue village name Area in Hac.1 Kothampady 32 Vaithy goundan pudur 33 Valapadi 24 Atthapur 35 Thandanur 36 Pappanaickenpatty 310 Kalyana giri 312 Sitheri 313 Govindampalayam 314 Pallipalayam 315 Kalleri patty 316 Keeraipatti 318 Abinavam 220 Mettudaiyam palayam 321 Puluthikuttai 222 Jalluthupatty 223 Kammalapatty 324 Periya krishna puram 325 Kurichy 326 Chinna krishnapuram 328 Vadugathampatty 329 Kolathukombai 330 Puthiragoundampalayam 3
96
31 Neermullikuttai 233 Umayalpuram 334 Thumbal 336 A.karadi patty 337 Thamayanur 338 Kadambur 339 West rajapalayam 340 Gangavalli 141 Kalarampatty 342 Naduvallur 343 Ariyapalayam 344 Othiyathur 345 Thennam pillaiyur 346 Anayampatty 347 Muthagoundanur 348 Thedavur 149 Errama samudram 150 Veeragoundanur 352 Periagoundapuram 353 Thirumalai nama samudram 255 Chinnama samudram 256 Lathuvadi 357 Petthanaickan palayam 158 Vellaiyur 359 Kalpaganur 360 Nattar agraharam 361 Olapady 362 Illupanatham 363 Odda patty 364 Mettupatty 365 Veppampoondi 366 Thalavaipatty 368 M.perumapalayam 369 Puliyankurichy 370 Mattupalayam 371 Kattuveppilaipatty 372 Pagadapadi 374 Jari kothambadi 375 Cenrayam palayam 376 Palania puram 377 Vellalagundam 378 Edayapatty 380 Thirumanur 381 Akkichettipalayam 382 Udayampatti 2
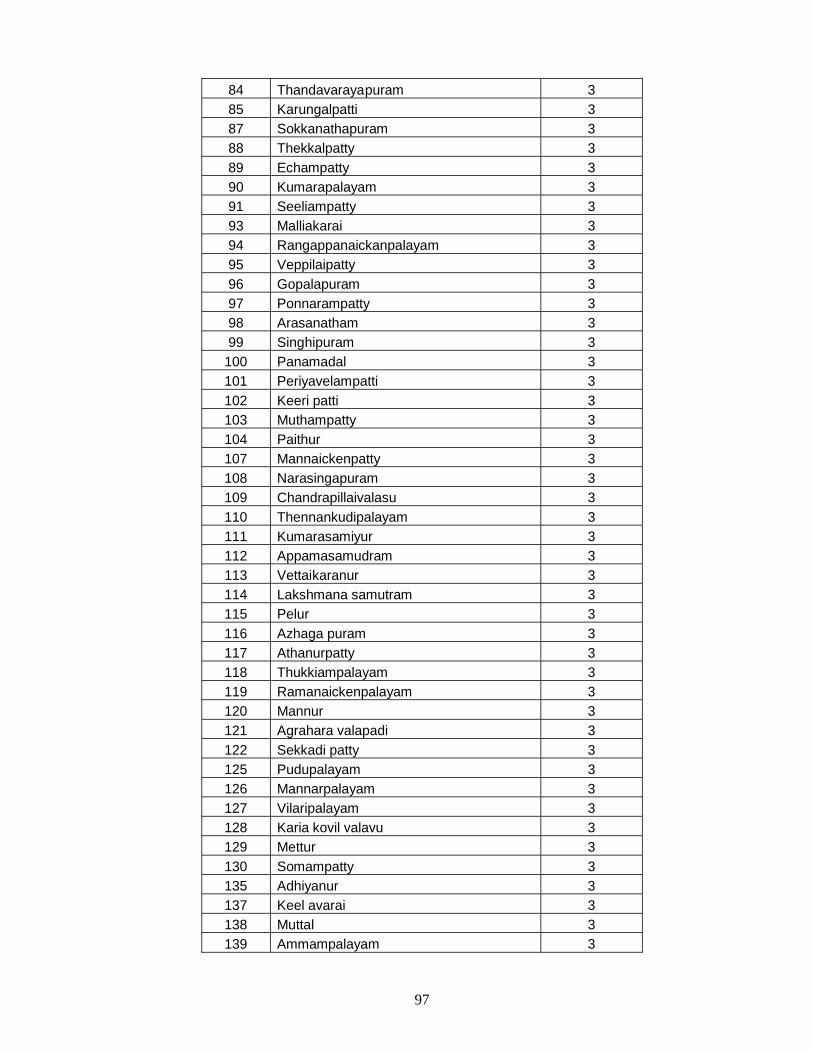
97
84 Thandavarayapuram 385 Karungalpatti 387 Sokkanathapuram 388 Thekkalpatty 389 Echampatty 390 Kumarapalayam 391 Seeliampatty 393 Malliakarai 394 Rangappanaickanpalayam 395 Veppilaipatty 396 Gopalapuram 397 Ponnarampatty 398 Arasanatham 399 Singhipuram 3
100 Panamadal 3101 Periyavelampatti 3102 Keeri patti 3103 Muthampatty 3104 Paithur 3107 Mannaickenpatty 3108 Narasingapuram 3109 Chandrapillaivalasu 3110 Thennankudipalayam 3111 Kumarasamiyur 3112 Appamasamudram 3113 Vettaikaranur 3114 Lakshmana samutram 3115 Pelur 3116 Azhaga puram 3117 Athanurpatty 3118 Thukkiampalayam 3119 Ramanaickenpalayam 3120 Mannur 3121 Agrahara valapadi 3122 Sekkadi patty 3125 Pudupalayam 3126 Mannarpalayam 3127 Vilaripalayam 3128 Karia kovil valavu 3129 Mettur 3130 Somampatty 3135 Adhiyanur 3137 Keel avarai 3138 Muttal 3139 Ammampalayam 3

98
140 Kallanatham 3141 Kumarapalayam 3143 Atthur 3144 Thulukkanur 3145 Valaiyamadevi 3146 Manjini 3147 Pungavadi 3148 Sathasivapuram 3149 Sadasivapuram 3150 Sarvoy 3151 Kattukottai 3152 Manivilunthan 3154 Siruvachur 3155 B.karadi patty 3157 Navakurichy 3158 Pattuthurai 3159 Deviyakurichy 3160 Vadakumarai 3161 Thenkumarai 3162 Sathapady 3163 Kottavadi 3164 Pallikadu 3165 Punavasal 3166 Navalur 3167 Kamakkapalayam 3168 Arathi agraharam 3169 Thiyaganur 3170 Mummudi 3171 Thalaivasal 3172 Nandhakarai 3173 Periyeri 3174 Aragalur 3175 Sarvoy pudur 3176 Vellapatty 3
Total 425
6.3.(e) The new area to be brought under fodder cultivation and the status of green fodder inthe sub basin after implementation of the project is as follows.
Present Fodder Status :
Maize @ yieldrate of 50
tonnes/ha for958 ha (In MT)
FodderCholam @yield rate of
45 tonnes/hafor 75 ha (In
MT)
cumbu @ yield rateof 25 tonnes/ha for
25 ha (In MT)
Total availability(IN MT)
47900 3375 625 51900

99
Fodder Availability Status after the end of project:
Yield to be added (In MT)
Year
Fodder Cholam@ yield rate of45 tonnes/hafor 175 ha @
25 ha for 1st yr,60 ha for 2nd &3rd yr, 20 ha for4th yr & 10 ha
for 5th yr.
Co3fodder@yield
rate of 250tonnes/ha for
200ha @ 70 hafor 2yr, 80 ha
for 3rd yr, 40 hafor 4th yr and 10
ha for 5th yr
Kolukattai grass@ yield rate of
40 tonnes/ha for50 ha @ 5 ha for1st yr, 15 ha for2nd & 3rd yr, 10ha for 4th yr and5 ha for 5th yr.
TotalProposedYield to
be added
Totalfodder
availableduringthe endof theyear
shortageof fodder(In MT)
I Year 1125 0 200 1325 53225 235065
II Year 2700 17500 400 20600 73825 214465
III Year 2700 20000 400 23100 96925 191365
IV Year 900 10000 400 11300 108225 180065
V Year 450 2500 200 3150 111375 176915
Cost of inputs for the cultivation of fodder in the proposed area
YearFodder
Cholam @Rs.1000/ha
Co3fodder@
Rs.6000/ha
Kolukattaigrass @
Rs.3000/ha
Total Cost(In Rs.)
I Year 25000 0 15000 40000II Year 60000 420000 45000 525000III Year 60000 480000 45000 585000IV Year 20000 240000 30000 290000V Year 10000 60000 15000 85000
Total 15250006.3.(f) By the above cropping pattern in the sub basin, the green fodder availability will beincreased from 51,900 MT to 111375 MT. In addition 85,000 MT of green fodder will beavailable after the harvest of maize. Totally 196375 MT of green fodder will be available in thesub basin at the end of the project. Ultimately the shortage will be 1438 15 MT. The aboveshortage will be met by allowing the animals to graze in the tank bunds, Common PropertyResources, etc.
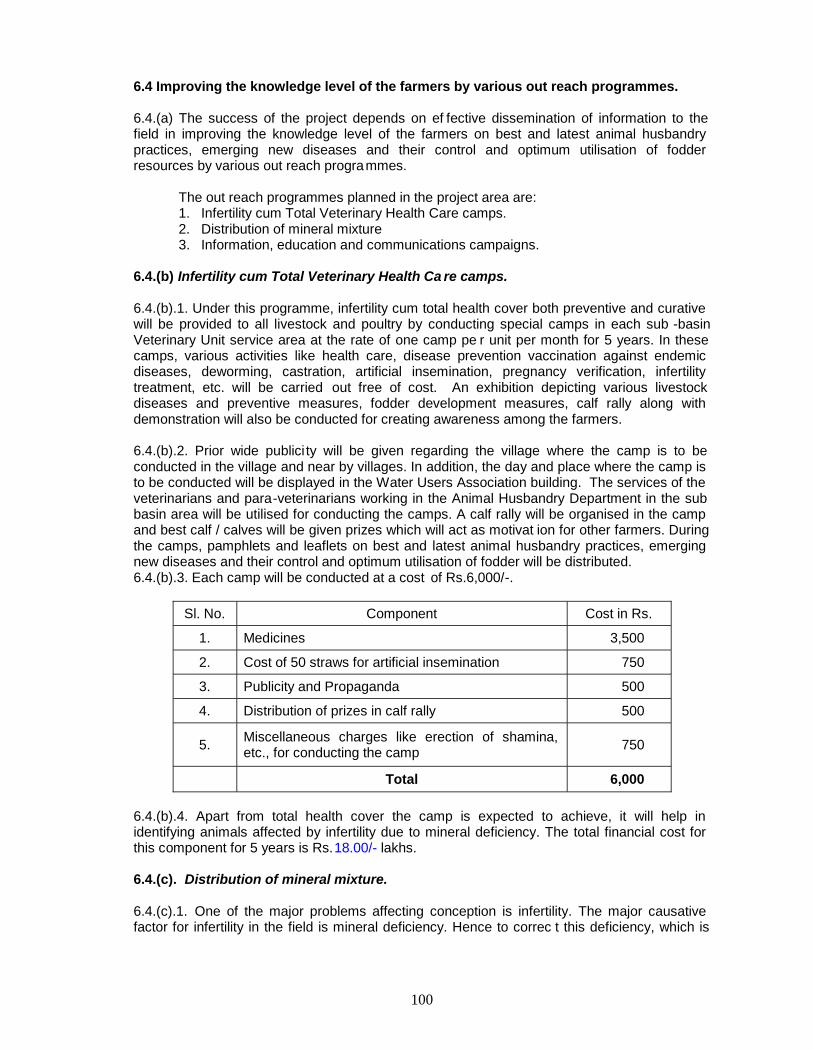
100
6.4 Improving the knowledge level of the farmers by various out reach programmes.
6.4.(a) The success of the project depends on ef fective dissemination of information to thefield in improving the knowledge level of the farmers on best and latest animal husbandrypractices, emerging new diseases and their control and optimum utilisation of fodderresources by various out reach programmes.
The out reach programmes planned in the project area are:1. Infertility cum Total Veterinary Health Care camps.2. Distribution of mineral mixture3. Information, education and communications campaigns.
6.4.(b) Infertility cum Total Veterinary Health Ca re camps.
6.4.(b).1. Under this programme, infertility cum total health cover both preventive and curativewill be provided to all livestock and poultry by conducting special camps in each sub -basinVeterinary Unit service area at the rate of one camp pe r unit per month for 5 years. In thesecamps, various activities like health care, disease prevention vaccination against endemicdiseases, deworming, castration, artificial insemination, pregnancy verification, infertilitytreatment, etc. will be carried out free of cost. An exhibition depicting various livestockdiseases and preventive measures, fodder development measures, calf rally along withdemonstration will also be conducted for creating awareness among the farmers.
6.4.(b).2. Prior wide publici ty will be given regarding the village where the camp is to beconducted in the village and near by villages. In addition, the day and place where the camp isto be conducted will be displayed in the Water Users Association building. The services of theveterinarians and para-veterinarians working in the Animal Husbandry Department in the subbasin area will be utilised for conducting the camps. A calf rally will be organised in the campand best calf / calves will be given prizes which will act as motivat ion for other farmers. Duringthe camps, pamphlets and leaflets on best and latest animal husbandry practices, emergingnew diseases and their control and optimum utilisation of fodder will be distributed.6.4.(b).3. Each camp will be conducted at a cost of Rs.6,000/-.
Sl. No. Component Cost in Rs.
1. Medicines 3,500
2. Cost of 50 straws for artificial insemination 750
3. Publicity and Propaganda 500
4. Distribution of prizes in calf rally 500
5. Miscellaneous charges like erection of shamina,etc., for conducting the camp 750
Total 6,000
6.4.(b).4. Apart from total health cover the camp is expected to achieve, it will help inidentifying animals affected by infertility due to mineral deficiency. The total financial cost forthis component for 5 years is Rs.18.00/- lakhs.
6.4.(c). Distribution of mineral mixture.
6.4.(c).1. One of the major problems affecting conception is infertility. The major causativefactor for infertility in the field is mineral deficiency. Hence to correc t this deficiency, which is

101
the vital factor affecting conception and calving, it is proposed to distribute mineral mixtures toneedy animals in the project area.
6.4.(c).2. The sub basin veterinary extension officer visiting the villages on the scheduledprogramme will select the eligible animals during the visit. In addition animals will also beidentified during the infertility cum total health cover camps. The eligible animals will be givenmineral mixture @ 25 gms per day for 365 days. The sub basin v eterinary extension officer willmaintain the data of eligible animals covered under this programme and ensure examining theanimals regularly for growth parameters. The sub basin wise cost required for distribution of 25gms. of mineral mixture for 365 da ys to 100 animals at a cost of Rs.40/ - kg per sub basinveterinary extension officer for 5 years is 1.825 lakhs. For 5 units, 9.13 lakhs would berequired for this component.
6.4.(c).3. By this the animals will come to estrum early and lead to better conc eption andcalving rates. Moreover this will lead to reduction in inter -calving period there by increasing theproductive life of the animal.
6.4.(d). Information, education and communications campaigns
6.4.(d).1. Printing of Pamphlets and leaflets.
Pamphlets and leaflets on best practices in animal husbandry, biosecurity measures tobe taken to prevent diseases, economic diseases affecting livestock and their prevention andcontrol measures, optimum utilisation of fodder resources with emphasis on i nclusion level ofnon conventional feeds, etc. will be printed in Tamil for distribution to the farmers in the projectarea.
6.4.(d).2. Erection of hoardings and wall paintings in the project area.
Posters, hoardings and banners carrying the activitie s undertaken in the project areawill be displayed in all Sub basin Veterinary Units. The same will also be displayed in allGovernment institutions functioning in the project area. In addition wall paintings depictingsigns of commonly affecting diseases will be painted on walls where people congregate inlarge numbers
6.4.(d).3. Conducting Night meetings
6.4.(d).1.a. Night meetings will be conducted involving the Water Users Association, AnimalHusbandry Department and Sub basin veterinary Extension Of ficer at a common place in thesub basin on a suitable day in each Sub basin Veterinary Unit and Graduate institution area atthe rate of one per quarter. The meeting not only enables participation of all the farmers in thesub basin but also acts as a source of information to other farmers.
6.4.(d).1.b. During the night meetings, village people will be enlightened on benefits of rearinglivestock and will be motivated to take up livestock rearing. Pamphlets and leaflets will bedistributed to the farmers. A small exhibition and method demonstration will be organised forthe benefit of the farmers. The services of link agencies like Tamilnadu Veterinary and AnimalSciences University and Tamilnadu Milk Producers Cooperatives Union will be utilisedwherever necessary. In the night meetings successful animal husbandry entrepreneurs in thevillage and neighboring villages will be requested to share their views on their methodologyfollowed for their success.
6.4.(d).4. All the above Information, education an d communications campaigns will beconducted in the sub basin at a total cost of Rs.9.90 lakhs.
102
6.5. Enhancing the knowledge level of human resource in the project area.
Continuing education is the touchstone of success. The project envisages capacitybuilding at all levels like farmer, veterinarian, para -veterinarian operating in the sub basin toachieve the desired results of increased sustainable productivity at the end of the project.
6.5.(a). Training of Farmers
6.5.(a).1. Farmers generally have a traditional knowledge of breeding and management oflivestock. The existing awareness, knowledge level and skill in profitable rearing of livestockwith latest animal husbandry techniques among majority of farmers are minimum in the projectarea. Hence it is essential to impart training to upgrade the skills and knowledge level forprofitable animal husbandry rearing.
6.5.(a).2. Under this programme, elite farmers interested in animal husbandry activities will beselected and given training on best pra ctices in livestock rearing. They will also be enlightenedon importance of feeding and cultivation of fodder crops. Emphasis will be given to enlightenthe farmers on feeding of unconventional feeds and their inclusion level. Moreover they will bebriefed about the diseases generally affecting the livestock in the basin and their symptomsand control measures. In addition they will be enlightened on the importance of deworming,vaccination and clean milk production. The farmers trained will be utilised for dissemination ofthe above information to their counterparts in the villages.
6.5.(a).3. For the above purpose, progressive farmers @ 400 per year interested in animalhusbandry activities in the sub basin will be selected for 3 day training. They will be dividedinto batches of 25 per batch. Training will be provided in the nearest veterinary institution.They will be given a training incentive of Rs.100/day as they will have to attend the trainingprogramme foregoing their normal daily earning. During the training, each trainee will be givenstudy material worth Rs.50/-. To motivate the trainer, a trainer honorarium of Rs.250/ - per daywill be provided. In addition miscellaneous charges of Rs.500/ - will be provided for each batch.A total cost of Rs.10,000/- will be required for training each batch. During the project period of5 years, a total of 2000 farmers (80 batches of 25 farmers per batch) in the sub basinwill be trained at a cost of Rs.8.00 lakhs.
6.5.(b). Entrepreneurship Training to unem ployed Veterinary Graduates :6 Unemployed Veterinary Graduates are to be trained for the upper vellar Sub basin. 5
River basin veterinary units are proposed in the sub basin area. One unemployed Veterinarygraduate is trained additionally for the future in case there is any drop out. Theentrepreneurship training is given to the unemployed veterinary graduate for sustainableanimal husbandry activities.
6.5.(c). Orientation Training for Rural Veterinary Extension Officers
6.5.(c).1. Though the sub basin veterinary extension officers are basically veterinarians whomay possess a sound theoretical knowledge on animal husbandry and veterinary treatment,their field experiences and exposure may be minimum. To attain the desired field results in ashort term, it is essential to know the terrain and problems faced by the farmers in the basin.Hence 5 days orientation training is proposed for the sub basin veterinary extension officerselected to work in the Sub basin Veterinary Unit.
6.5.(c).2. Training will be provided to each Sub basin Veterinary Extension Officer in thenearest veterinary institution in the sub basin which will be identified by the Regional JointDirector and Assistant Director of Animal Husbandry of the concerned jurisdiction. They will begiven a training incentive of Rs.150/day. During the training, each will be given study material

103
worth Rs.100/-. To motivate the trainer, a trainer honorarium of Rs.500/ - will be provided. Atotal cost of Rs.1,350/- will be required for training each Sub basin Veterinary ExtensionOfficer. Thus in the project area to train 5 Sub basin Veterinary Extension Officers, Rs.0.07/ -lakhs would be required.
6.5.(d). In-service Training for 13 Veterinarians
6.5.(d).1. Veterinarians have an overall knowledge of breeding, management, diagnosis andtreatment of livestock. With advancing science and technology, the techniques followed mayhave become obsolete. Moreover, new and simple techniques have evolved in animalhusbandry management, breeding, diagno sis and treatment. Hence it is essential to updatethe knowledge and skills of the veterinarians in Government institutions in the project area.
6.5.(d).2. The 13 veterinarians working in the Government institutions in the sub -basin will begiven a trainers training at Madras Veterinary College / Namakkal Veterinary College at a costof Rs.2000/- per individual. The total cost for training the 13 veterinarians in the sub-basinwould be Rs.0.26/- lakhs.7. Ensuring marketing tie up for the products.
With the rapid urbanisation, changing life styles and increasing purchasing power ofthe people, the demand for livestock and livestock products is expected to rise steadily. Hencemarketing the livestock and livestock products in the sub basin will not be a major problem.
UPPER VELLAR SUB BASIN
The breedable age female population in the UPPER VELLAR Sub Basin is 109974,which include 82014 crossbred, 12057 indigenous cattle and 15903 buffaloes.
ASSUMPTIONS:
1) Available breedable female population in the basin after reducing for mortality, sterility etc.,at the rate of 15% in crossbred, 5 % in indigenous and 5 % in buffaloes, there will be69712 crossbred, 11454 indigenous and 15108 buffaloes.
2) At present there are 13 Graduate Veterinary Institutions and 13 Sub centres functioningunder Government fold doing artificial insemination work of which 4 subcentres are vacant.
3) The above Government Institutions have carried out an average artificial insemination of24740 in crossbred, 7068 indigenous and 3534 in buffaloes.
4) Assuming 2.8 (35%) inseminations are required for consumption in cattle and 3.3 (30%)inseminations are required for conception in buffaloes, the actual animals covered are8836 crossbred, 2524 indigenous and 1071 buffaloes.
5) Thus the breedable age female population unserved by the Government institutions is60876 crossbred, 8930 indigenous and 14037 buffaloes.
6) For of the above animals unserved, 5 sub basin veterinary units will be established in thesub basin each covering around 15 villages.
7) During the first year 2700, second year 3000, third year 3300, 4th year 3600, 5th year4080 and from then on 4080 artificial inseminations will be done by each sub basinveterinary unit.
8) It is assumed that 50% crossbred (6750), 40% indigenous (5400) and 10% (1350)buffaloes will be targeted by the above 5 units during the first year.
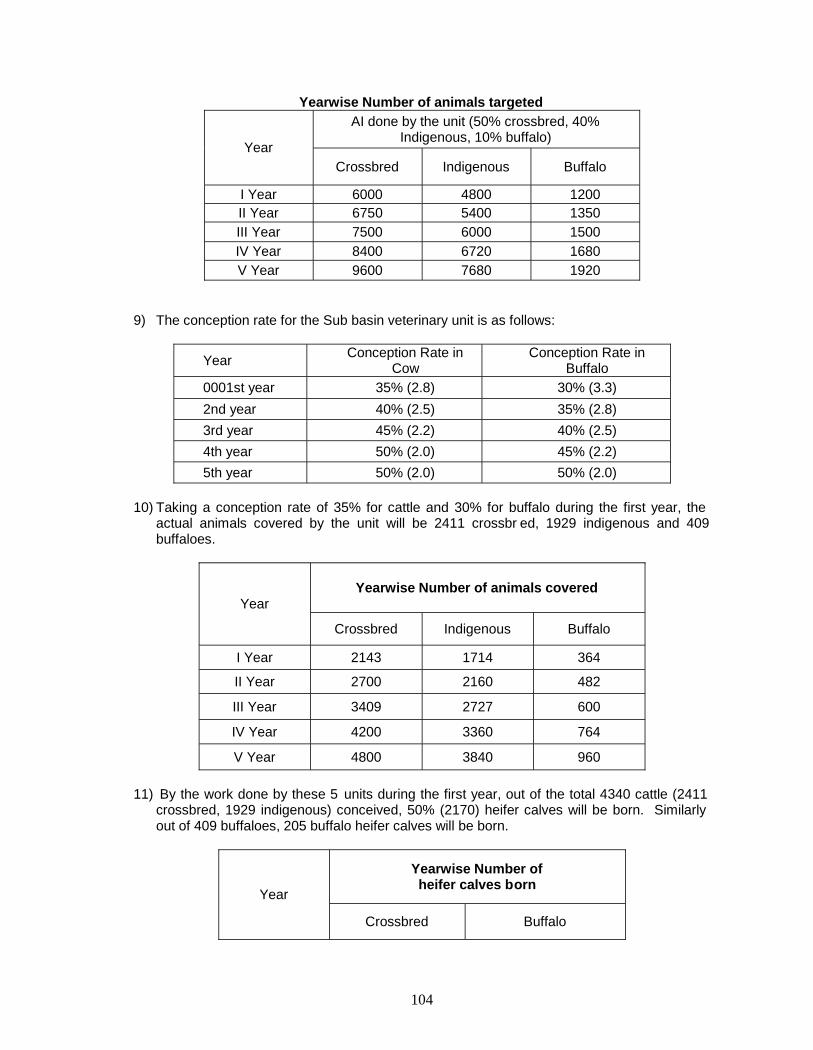
104
Yearwise Number of animals targetedAI done by the unit (50% crossbred, 40%
Indigenous, 10% buffalo)Year
Crossbred Indigenous Buffalo
I Year 6000 4800 1200II Year 6750 5400 1350III Year 7500 6000 1500IV Year 8400 6720 1680V Year 9600 7680 1920
9) The conception rate for the Sub basin veterinary unit is as follows:
Year Conception Rate inCow
Conception Rate inBuffalo
0001st year 35% (2.8) 30% (3.3)2nd year 40% (2.5) 35% (2.8)3rd year 45% (2.2) 40% (2.5)4th year 50% (2.0) 45% (2.2)5th year 50% (2.0) 50% (2.0)
10) Taking a conception rate of 35% for cattle and 30% for buffalo during the first year, theactual animals covered by the unit will be 2411 crossbr ed, 1929 indigenous and 409buffaloes.
Yearwise Number of animals coveredYear
Crossbred Indigenous Buffalo
I Year 2143 1714 364
II Year 2700 2160 482
III Year 3409 2727 600
IV Year 4200 3360 764
V Year 4800 3840 960
11) By the work done by these 5 units during the first year, out of the total 4340 cattle (2411crossbred, 1929 indigenous) conceived, 50% (2170) heifer calves will be born. Similarlyout of 409 buffaloes, 205 buffalo heifer calves will be born.
Yearwise Number ofheifer calves born
Year
Crossbred Buffalo

105
I Year 1929 182
II Year 2340 241
III Year 3068 300
IV Year 3780 382
V Year 4320 480
12) Now calf mortality is taken as 5% for crossbred and 10% for buffaloes. Therefore out ofthe 2170 crossbred heifer calves, 109 will be lost . Similarly out of 205 buffalo calves, 21will be lost during the first year.
Yearwise Number ofheifer calves lost
YearCrossbred Buffalo
I Year 96 18II Year 122 24III Year 153 30IV Year 189 38V Year 216 48
13) The actual crossbred animals in milk created in the sub basin by intervention by theseunits during first year will be 4340 (2411 Crossbred plus 1929 Indigenous cattle). Similarly409 buffaloes will be in the milk.
Yearwise Number of animals in milkYear
Crossbred Indigenous Buffalo
I Year 2143 1714 364II Year 2700 2160 482III Year 3409 2727 600IV Year 4200 3360 764V Year 4800 3840 960
14) The average milk yield in the project area will be increased to 7 litres in crossbred, 800 mlor maximum of 3.6 litres in indigenous and 4.5 litres for buffaloes.
15) During the first year, the total milk yield in the sub basin by intervention by these units willbe 46 lakh litres by crossbred (assuming 6.38 lts. is the average yield), 16 lakh litres(assuming 3 lts. is the average yield) by indi genous and 5 lakh litres (assuming 4.2 lts. isthe average yield) by buffalo.

106
Average Milk Yield/day (In Lts.) Total Milk Yield/ lactation (In lakh Lts.)
YearCrossbred Indigenous Buffalo
Crossbred(300 dayslactation)
Indigenous(280 dayslactation)
Buffalo(300 dayslactation)
I Year 6.38 3.0 4.2 46 16 5II Year 6.5 3.1 4.4 59 21 7III Year 6.7 3.3 4.6 75 28 9IV Year 6.9 3.5 4.8 93 35 12V Year 7.1 3.6 5.0 109 41 15
16) Thus the value of milk in the sub basin will be Rs.608 lakhs (cost of cow mil k is Rs.9/- andbuffalo milk is Rs.10/-).
Value of Milk (In lakh Rs.)Year
Crossbred Indigenous Buffalo Total
I Year 410 146 52 608II Year 527 187 71 785III Year 678 249 91 1018IV Year 838 318 118 1274V Year 978 370 153 1501
17) Thus economic return at the end of the project by way of milk will be Rs.1501 lakhs, anincrease of Rs.893 lakhs.
18) The cattle heifer calves born during the first year is brought into breeding stock during the3rd year. Similarly in buffalo 1st year heifer calves is brough t into 4th year breeding stock.
Yearwise Female Breeding stock createdYear
Crossbred Indigenous Buffalo
I Year 60876 8930 14037II Year 60876 8930 14037III Year 61565 8930 14037IV Year 62537 8930 14092V Year 63931 8930 16178
19) The main advantages of the programme Provides service at the farmer's doorstep or nearest to the farmer's doorstep. Increased coverage Better conception rate Reduced stress to the animals Timely treatment Reduced recovery time from illness

107
Ensuring coverage of animals wi th vaccination and deworming Saving the man hours of the farmers Genetic potential improvement (crossbred) Timely artificial insemination, thereby not only increasing conception and calving rate,
but also reducing the inter-calving period. Timely artificial insemination and calving, leads to more production days during the
productive life cycle of the animal. Reducing scrub bulls born out of natural service. Avoiding diseases like Trichomonosis, brucellosis, etc., affecting the uro -genital tract of
females, leading to abortion, sterility, etc., when the animals are put into natural service. For natural service, the chance of the same bull serving the mother and dam is higher
which may lead to inbreeding, but if frozen semen is used, the semen can be rotatednullifying the chances of inbreeding.
Increasing the per animal milk production potential, leading to a substantial increase inmilk production
Increasing the farmers income through animal husbandry.
OUTCOMES EXPECTED
Sl.No. Project Year I Year II Year III Year IV Year V Year Total
1 Artificial InseminationDone (In Nos.) 13500 15000 16500 18000 20400 83400
2 Calves Born (In Nos.) 4750 5936 7410 8918 10200 37214
3 Heifer calves born(In Nos.) 2111 2581 3368 4162 4800
4 Milk Yield (In lakh Lts.) 67 87 112 140 165 571
5 Income by milk(In Lakh Rs.) 608 785 1018 1274 1501 5186
6 Fodder Production(in Metric Tonnes) 1325 21925 45025 56325 59475 184075
7 Income (In Lakh Rs.) 0.93 15.35 31.52 39.43 41.63 128.86
8Total incomegenerated(In lakh Rs.)
608.93 800.35 1049.52 1313.43 1542.63 5314.9

108
ESTIMATE FOR ANIMAL HUSBANDRY COMPONENT TO BE INCLUDED IN IAMWARMPROJECT REPORT
UPPER VELLAR SUB BASIN
Components
Phy
sica
l
Fina
ncia
l(In
Lak
hs)
1 Productivity enhancement by improving delivery ofveterinary services
a. Establishment of Sub basin Veterinary Units (SBVU) @Rs.5,99,760/- per unit 5 29.99
b. Improving the essential infrastructure in the Governmentinstitutions (graduate institutions) @ Rs.33,000/ -unit 16 5.28
c. Improving the essential infrastructure in the Governmentinstitutions(subcentres) @ Rs.20,000/ -unit 17 3.40
d. Strengthening the diagnostic facilities in the sub basin byproviding special diagnostic tools to sub basin referralinstitutions @ Rs.3,00,000/- per unit
2 6.00
2 Increasing availability of green fodder in private lands (inacres) 15.25
3 Out reach programmes.
a. Infertility cum Total Veterinary Health Care camps @Rs.6,000 per camp per month for each SBVU 300 18.00
b. Distribution of mineral mixture @ Rs.1,82,500 per SBVU 5 9.13
c. Information, education and communications campaigns 21 11.55
4 Enhancing the knowledge level of human resource
a. Training of Farmers 2000 8.00
b. Enterpruneship training to 31 unemployed veterina rygraduates to be placed as Sub basin Veterinary ExtensionOfficer @ Rs.50,000/- per person
6 3.00
b. Orientation Training for Sub basin Veterinary ExtensionOfficers @ Rs.1,350/- trainee 5 0.07
c. In-service Training for Veterinarians @ Rs.2,000/ - per person 13 0.32
109.99

109
Tamil Nadu Agricultural University
Irrigated AgricultureModernization and Water Resource
Management
Sub basin Plan – Upper VellarTNAU component
Nodal Officer (IAMWARM)Director
Water Technology CentreTNAU, Coimbatore-3
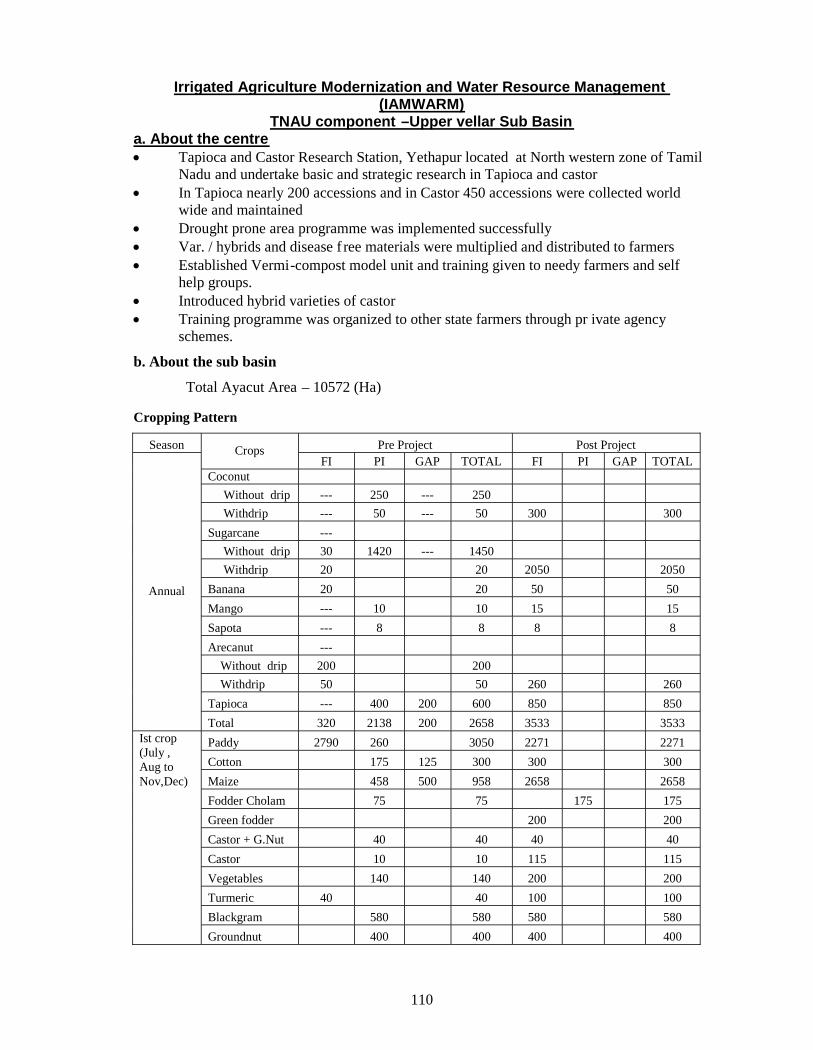
110
Irrigated Agriculture Modernization and Water Resource Management(IAMWARM)
TNAU component –Upper vellar Sub Basina. About the centre Tapioca and Castor Research Station, Yethapur located at North western zone of Tamil
Nadu and undertake basic and strategic research in Tapioca and castor In Tapioca nearly 200 accessions and in Castor 450 accessions were collected world
wide and maintained Drought prone area programme was implemented successfully Var. / hybrids and disease f ree materials were multiplied and distributed to farmers Established Vermi-compost model unit and training given to needy farmers and self
help groups. Introduced hybrid varieties of castor Training programme was organized to other state farmers through pr ivate agency
schemes.
b. About the sub basin
Total Ayacut Area – 10572 (Ha)
Cropping Pattern
Season Pre Project Post ProjectCropsFI PI GAP TOTAL FI PI GAP TOTAL
Coconut
Without drip --- 250 --- 250
Withdrip --- 50 --- 50 300 300
Sugarcane ---
Without drip 30 1420 --- 1450
Withdrip 20 20 2050 2050
Banana 20 20 50 50
Mango --- 10 10 15 15
Sapota --- 8 8 8 8
Arecanut ---
Without drip 200 200
Withdrip 50 50 260 260
Tapioca --- 400 200 600 850 850
Annual
Total 320 2138 200 2658 3533 3533
Paddy 2790 260 3050 2271 2271
Cotton 175 125 300 300 300
Maize 458 500 958 2658 2658
Fodder Cholam 75 75 175 175
Green fodder 200 200
Castor + G.Nut 40 40 40 40
Castor 10 10 115 115
Vegetables 140 140 200 200
Turmeric 40 40 100 100
Blackgram 580 580 580 580
Ist crop(July ,Aug toNov,Dec)
Groundnut 400 400 400 400
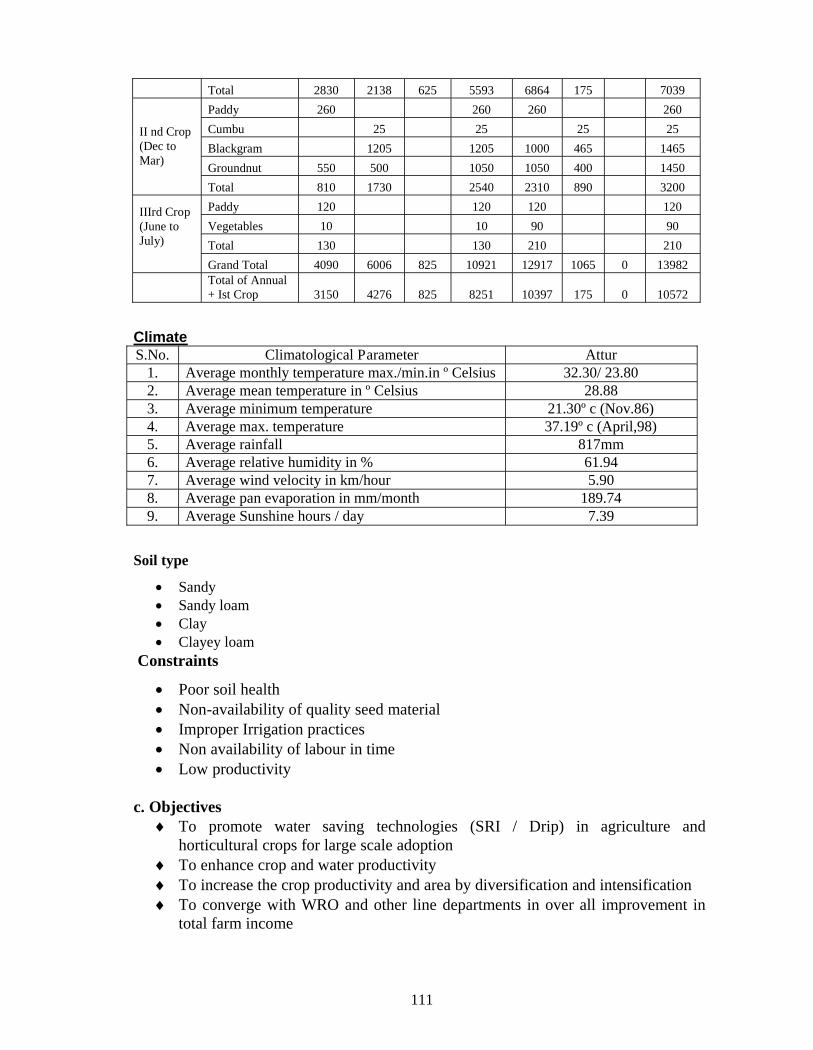
111
Total 2830 2138 625 5593 6864 175 7039
Paddy 260 260 260 260
Cumbu 25 25 25 25
Blackgram 1205 1205 1000 465 1465
Groundnut 550 500 1050 1050 400 1450
II nd Crop(Dec toMar)
Total 810 1730 2540 2310 890 3200
Paddy 120 120 120 120
Vegetables 10 10 90 90
Total 130 130 210 210
IIIrd Crop(June toJuly)
Grand Total 4090 6006 825 10921 12917 1065 0 13982Total of Annual+ Ist Crop 3150 4276 825 8251 10397 175 0 10572
ClimateS.No. Climatological Parameter Attur
1. Average monthly temperature max./min.in º Celsius 32.30/ 23.802. Average mean temperature in º Celsius 28.883. Average minimum temperature 21.30º c (Nov.86)4. Average max. temperature 37.19º c (April,98)5. Average rainfall 817mm6. Average relative humidity in % 61.947. Average wind velocity in km/hour 5.908. Average pan evaporation in mm/month 189.749. Average Sunshine hours / day 7.39
Soil type
Sandy Sandy loam Clay Clayey loam
Constraints
Poor soil health Non-availability of quality seed material Improper Irrigation practices Non availability of labour in time Low productivity
c. Objectives To promote water saving technologies (SRI / Drip) in agriculture and
horticultural crops for large scale adoption To enhance crop and water productivity To increase the crop productivity and area by diversification and intensification To converge with WRO and other line departments in over all improvement in
total farm income
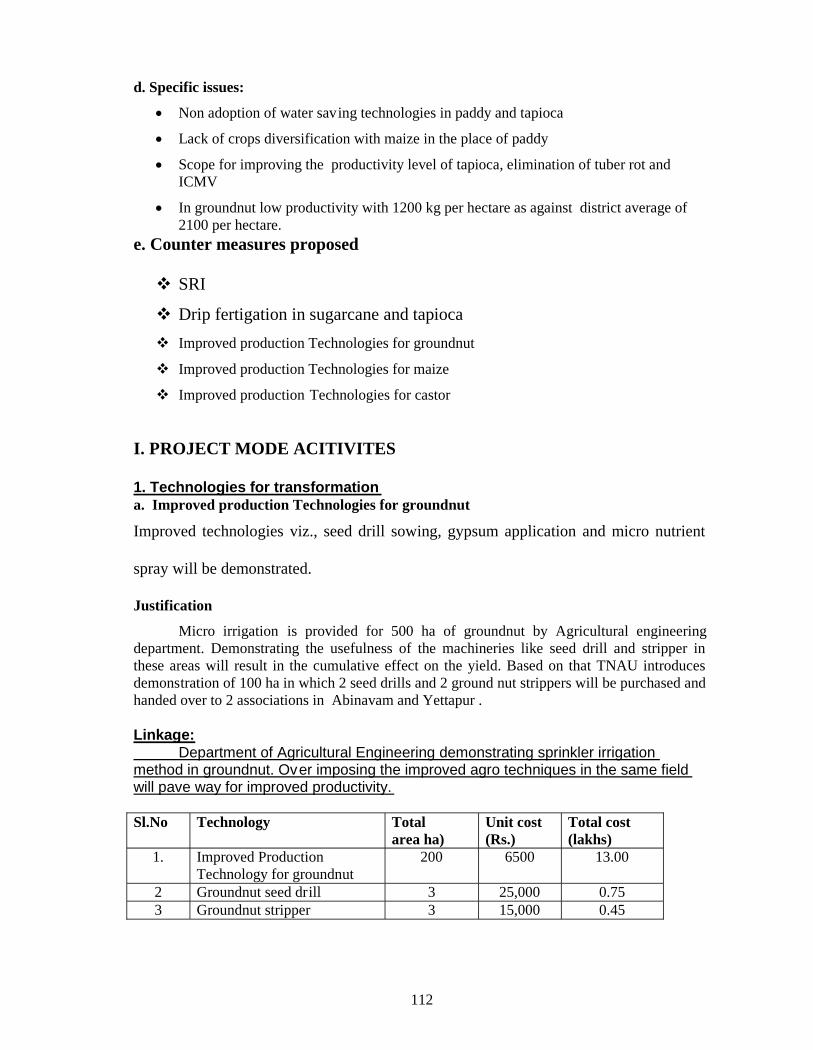
112
d. Specific issues:
Non adoption of water saving technologies in paddy and tapioca
Lack of crops diversification with maize in the place of paddy
Scope for improving the productivity level of tapioca, elimination of tuber rot andICMV
In groundnut low productivity with 1200 kg per hectare as against district average of2100 per hectare.
e. Counter measures proposed
SRI
Drip fertigation in sugarcane and tapioca
Improved production Technologies for groundnut
Improved production Technologies for maize
Improved production Technologies for castor
I. PROJECT MODE ACITIVITES
1. Technologies for transformationa. Improved production Technologies for groundnut
Improved technologies viz., seed drill sowing, gypsum application and micro nutrient
spray will be demonstrated.
Justification
Micro irrigation is provided for 500 ha of groundnut by Agricultural engineeringdepartment. Demonstrating the usefulness of the machineries like seed drill and stripper inthese areas will result in the cumulative effect on the yield. Based on that TNAU introducesdemonstration of 100 ha in which 2 seed drills and 2 ground nut strippers will be purchased andhanded over to 2 associations in Abinavam and Yettapur .
Linkage:Department of Agricultural Engineering demonstrating sprinkler irrigation
method in groundnut. Over imposing the improved agro techniques in the same fieldwill pave way for improved productivity.
Sl.No Technology Totalarea ha)
Unit cost(Rs.)
Total cost(lakhs)
1. Improved ProductionTechnology for groundnut
200 6500 13.00
2 Groundnut seed drill 3 25,000 0.753 Groundnut stripper 3 15,000 0.45
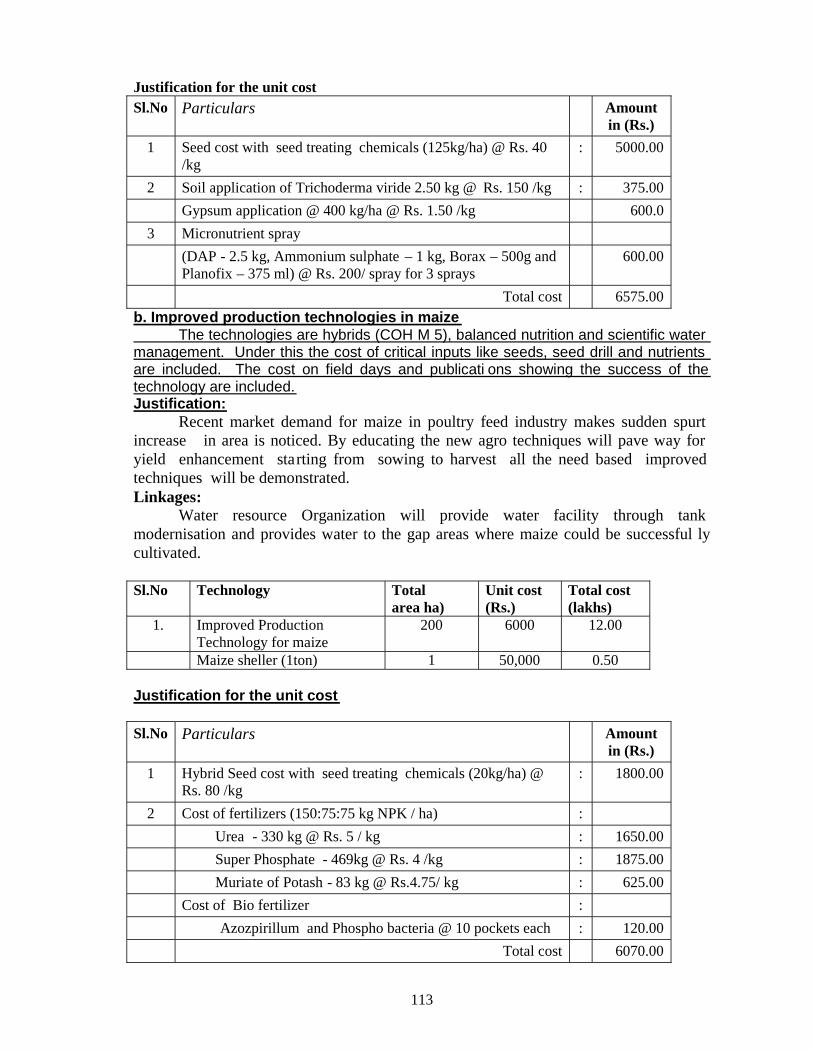
113
Justification for the unit costSl.No Particulars Amount
in (Rs.)
1 Seed cost with seed treating chemicals (125kg/ha) @ Rs. 40/kg
: 5000.00
2 Soil application of Trichoderma viride 2.50 kg @ Rs. 150 /kg : 375.00
Gypsum application @ 400 kg/ha @ Rs. 1.50 /kg 600.0
3 Micronutrient spray
(DAP - 2.5 kg, Ammonium sulphate – 1 kg, Borax – 500g andPlanofix – 375 ml) @ Rs. 200/ spray for 3 sprays
600.00
Total cost 6575.00b. Improved production technologies in maize
The technologies are hybrids (COH M 5), balanced nutrition and scientific watermanagement. Under this the cost of critical inputs like seeds, seed drill and nutrientsare included. The cost on field days and publicati ons showing the success of thetechnology are included.Justification:
Recent market demand for maize in poultry feed industry makes sudden spurtincrease in area is noticed. By educating the new agro techniques will pave way foryield enhancement starting from sowing to harvest all the need based improvedtechniques will be demonstrated.Linkages:
Water resource Organization will provide water facility through tankmodernisation and provides water to the gap areas where maize could be successful lycultivated.
Sl.No Technology Totalarea ha)
Unit cost(Rs.)
Total cost(lakhs)
1. Improved ProductionTechnology for maize
200 6000 12.00
Maize sheller (1ton) 1 50,000 0.50
Justification for the unit cost
Sl.No Particulars Amountin (Rs.)
1 Hybrid Seed cost with seed treating chemicals (20kg/ha) @Rs. 80 /kg
: 1800.00
2 Cost of fertilizers (150:75:75 kg NPK / ha) :
Urea - 330 kg @ Rs. 5 / kg : 1650.00
Super Phosphate - 469kg @ Rs. 4 /kg : 1875.00
Muriate of Potash - 83 kg @ Rs.4.75/ kg : 625.00
Cost of Bio fertilizer :
Azozpirillum and Phospho bacteria @ 10 pockets each : 120.00
Total cost 6070.00
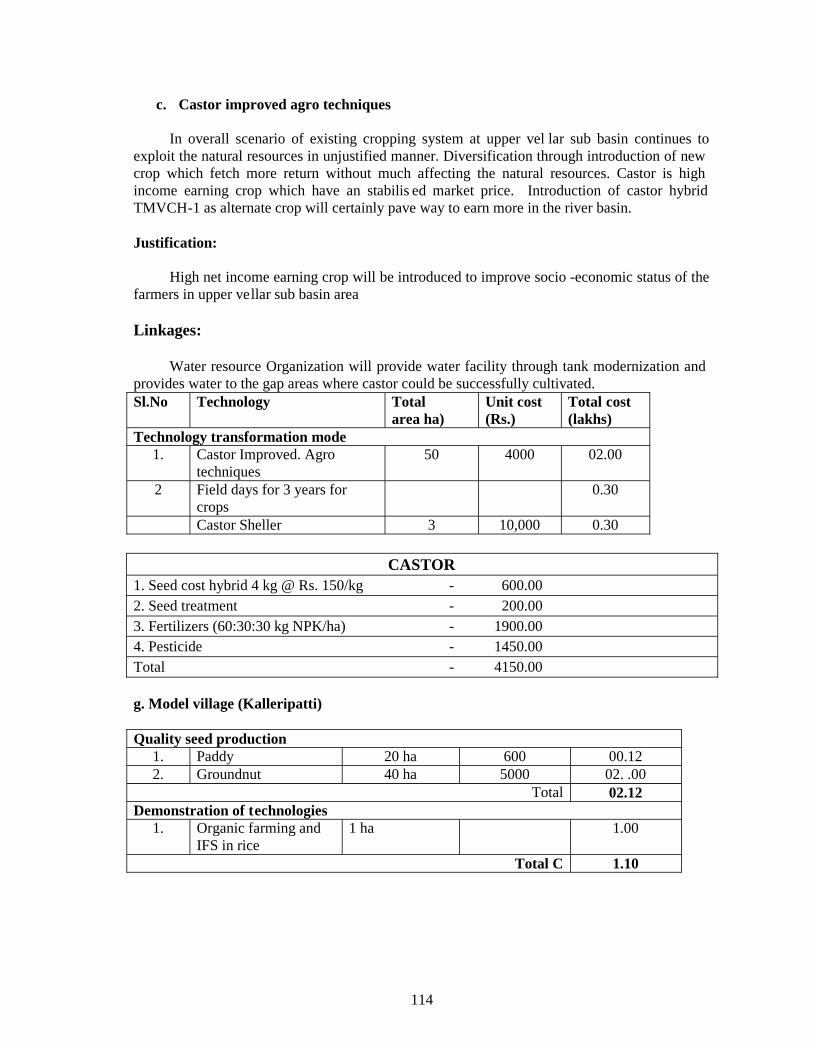
114
c. Castor improved agro techniques
In overall scenario of existing cropping system at upper vel lar sub basin continues toexploit the natural resources in unjustified manner. Diversification through introduction of newcrop which fetch more return without much affecting the natural resources. Castor is highincome earning crop which have an stabilis ed market price. Introduction of castor hybridTMVCH-1 as alternate crop will certainly pave way to earn more in the river basin.
Justification:
High net income earning crop will be introduced to improve socio -economic status of thefarmers in upper vellar sub basin area
Linkages:
Water resource Organization will provide water facility through tank modernization andprovides water to the gap areas where castor could be successfully cultivated.Sl.No Technology Total
area ha)Unit cost(Rs.)
Total cost(lakhs)
Technology transformation mode1. Castor Improved. Agro
techniques50 4000 02.00
2 Field days for 3 years forcrops
0.30
Castor Sheller 3 10,000 0.30
CASTOR1. Seed cost hybrid 4 kg @ Rs. 150/kg - 600.002. Seed treatment - 200.003. Fertilizers (60:30:30 kg NPK/ha) - 1900.004. Pesticide - 1450.00Total - 4150.00
g. Model village (Kalleripatti)
Quality seed production1. Paddy 20 ha 600 00.122. Groundnut 40 ha 5000 02. .00
Total 02.12Demonstration of technologies
1. Organic farming andIFS in rice
1 ha 1.00
Total C 1.10

115
h. On farm demonstration and skill development
Sl.No. DetailsDuration
(days)No/Batch
TotalBatch
Budget /Batch
Total(lacs)
1. SRI techniques 1 50 5 20,000 1.0
2. New improvedAgro techniquesfor groundnut
1 50 2 20,000 0.4
3. New improvedAgro techniquesfor maize
1 50 2 20,000 0.4
4. New improvedAgro techniquesfor castor
1 50 2 20,000 0.4
5. Drip cumfetigation andimproved Agrotechniques inTapioca
1 50 2 20,000 0.4
6. Training forlabours for SRItransplanting
1 100 20 10,000 2.0
Total 4.6Venue – Tapioca and Castor Research Station, Yethapur
i. Project mode budget abstract (lakhs)
Sl.No. Particulars Budget (lakhs)1. Tech. transformation mode : 30.402. Seed village : 2.123. Model village : 1.004. On farm demonstration and skill development : 4.60
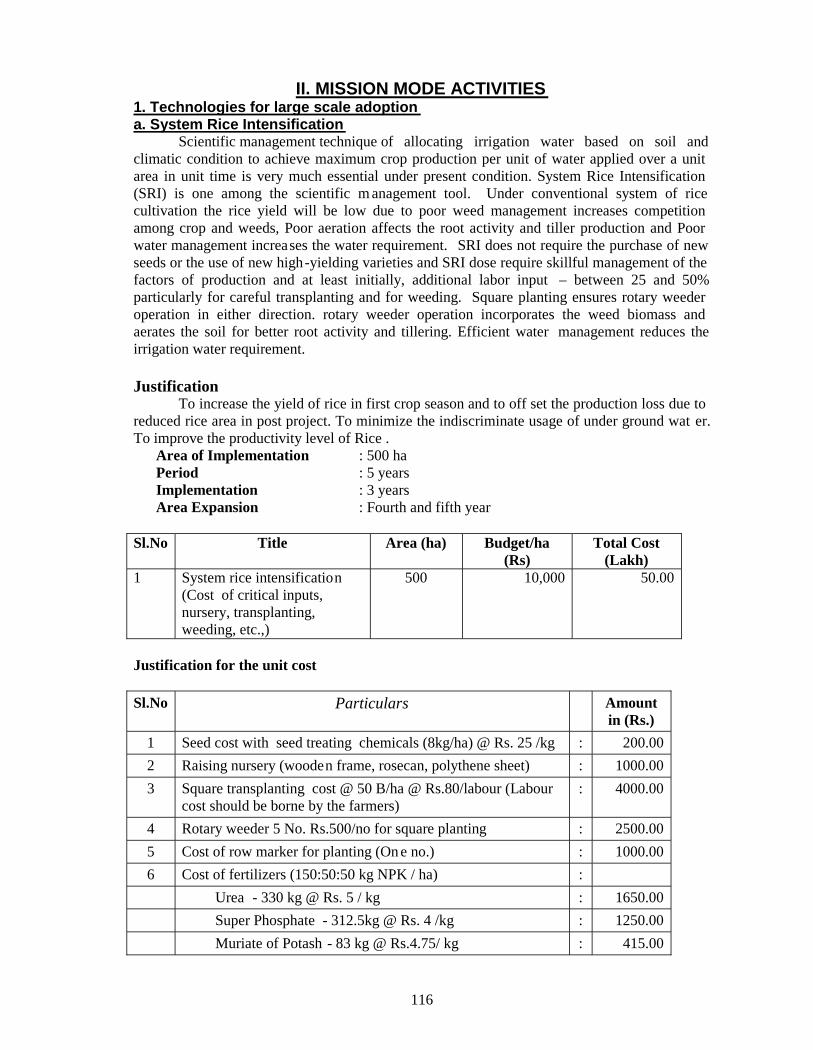
116
II. MISSION MODE ACTIVITIES1. Technologies for large scale adoptiona. System Rice Intensification
Scientific management technique of allocating irrigation water based on soil andclimatic condition to achieve maximum crop production per unit of water applied over a unitarea in unit time is very much essential under present condition. System Rice Intensification(SRI) is one among the scientific m anagement tool. Under conventional system of ricecultivation the rice yield will be low due to poor weed management increases competitionamong crop and weeds, Poor aeration affects the root activity and tiller production and Poorwater management increases the water requirement. SRI does not require the purchase of newseeds or the use of new high-yielding varieties and SRI dose require skillful management of thefactors of production and at least initially, additional labor input – between 25 and 50%particularly for careful transplanting and for weeding. Square planting ensures rotary weederoperation in either direction. rotary weeder operation incorporates the weed biomass andaerates the soil for better root activity and tillering. Efficient water management reduces theirrigation water requirement.
JustificationTo increase the yield of rice in first crop season and to off set the production loss due to
reduced rice area in post project. To minimize the indiscriminate usage of under ground wat er.To improve the productivity level of Rice .
Area of Implementation : 500 haPeriod : 5 yearsImplementation : 3 yearsArea Expansion : Fourth and fifth year
Sl.No Title Area (ha) Budget/ha(Rs)
Total Cost(Lakh)
1 System rice intensification(Cost of critical inputs,nursery, transplanting,weeding, etc.,)
500 10,000 50.00
Justification for the unit cost
Sl.No Particulars Amountin (Rs.)
1 Seed cost with seed treating chemicals (8kg/ha) @ Rs. 25 /kg : 200.00
2 Raising nursery (wooden frame, rosecan, polythene sheet) : 1000.00
3 Square transplanting cost @ 50 B/ha @ Rs.80/labour (Labourcost should be borne by the farmers)
: 4000.00
4 Rotary weeder 5 No. Rs.500/no for square planting : 2500.00
5 Cost of row marker for planting (On e no.) : 1000.00
6 Cost of fertilizers (150:50:50 kg NPK / ha) :
Urea - 330 kg @ Rs. 5 / kg : 1650.00
Super Phosphate - 312.5kg @ Rs. 4 /kg : 1250.00
Muriate of Potash - 83 kg @ Rs.4.75/ kg : 415.00
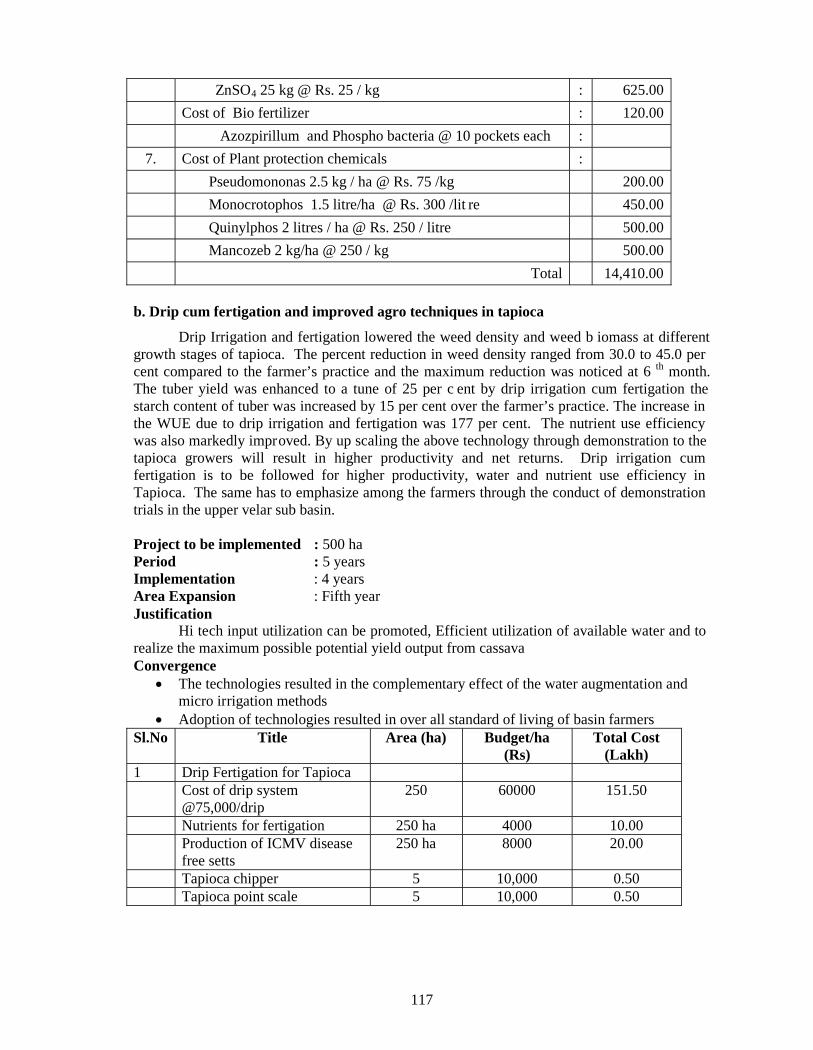
117
ZnSO4 25 kg @ Rs. 25 / kg : 625.00
Cost of Bio fertilizer : 120.00
Azozpirillum and Phospho bacteria @ 10 pockets each :
7. Cost of Plant protection chemicals :
Pseudomononas 2.5 kg / ha @ Rs. 75 /kg 200.00
Monocrotophos 1.5 litre/ha @ Rs. 300 /lit re 450.00
Quinylphos 2 litres / ha @ Rs. 250 / litre 500.00
Mancozeb 2 kg/ha @ 250 / kg 500.00
Total 14,410.00
b. Drip cum fertigation and improved agro techniques in tapioca
Drip Irrigation and fertigation lowered the weed density and weed b iomass at differentgrowth stages of tapioca. The percent reduction in weed density ranged from 30.0 to 45.0 percent compared to the farmer’s practice and the maximum reduction was noticed at 6 th month.The tuber yield was enhanced to a tune of 25 per c ent by drip irrigation cum fertigation thestarch content of tuber was increased by 15 per cent over the farmer’s practice. The increase inthe WUE due to drip irrigation and fertigation was 177 per cent. The nutrient use efficiencywas also markedly improved. By up scaling the above technology through demonstration to thetapioca growers will result in higher productivity and net returns. Drip irrigation cumfertigation is to be followed for higher productivity, water and nutrient use efficiency inTapioca. The same has to emphasize among the farmers through the conduct of demonstrationtrials in the upper velar sub basin.
Project to be implemented : 500 haPeriod : 5 yearsImplementation : 4 yearsArea Expansion : Fifth yearJustification
Hi tech input utilization can be promoted, Efficient utilization of available water and torealize the maximum possible potential yield output from cassavaConvergence
The technologies resulted in the complementary effect of the water augmentation andmicro irrigation methods
Adoption of technologies resulted in over all standard of living of basin farmersSl.No Title Area (ha) Budget/ha
(Rs)Total Cost
(Lakh)1 Drip Fertigation for Tapioca
Cost of drip system@75,000/drip
250 60000 151.50
Nutrients for fertigation 250 ha 4000 10.00Production of ICMV diseasefree setts
250 ha 8000 20.00
Tapioca chipper 5 10,000 0.50Tapioca point scale 5 10,000 0.50
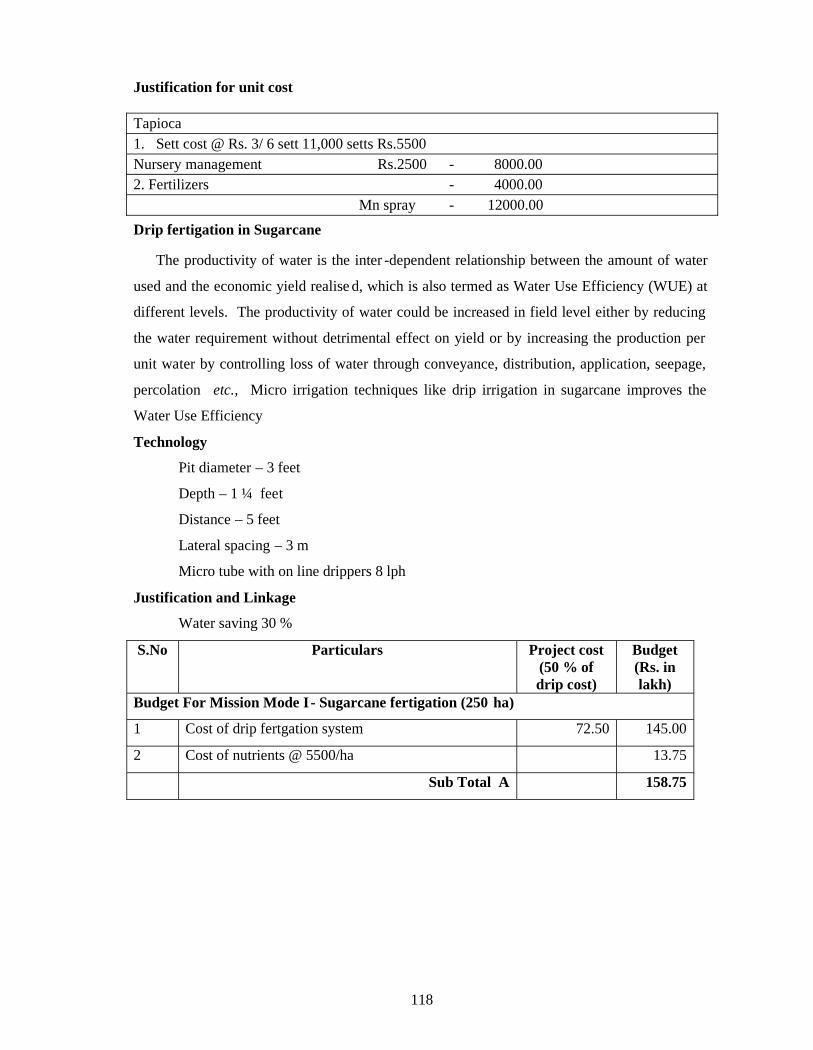
118
Justification for unit cost
Tapioca1. Sett cost @ Rs. 3/ 6 sett 11,000 setts Rs.5500Nursery management Rs.2500 - 8000.002. Fertilizers - 4000.00
Mn spray - 12000.00
Drip fertigation in Sugarcane
The productivity of water is the inter -dependent relationship between the amount of water
used and the economic yield realise d, which is also termed as Water Use Efficiency (WUE) at
different levels. The productivity of water could be increased in field level either by reducing
the water requirement without detrimental effect on yield or by increasing the production per
unit water by controlling loss of water through conveyance, distribution, application, seepage,
percolation etc., Micro irrigation techniques like drip irrigation in sugarcane improves the
Water Use Efficiency
Technology
Pit diameter – 3 feet
Depth – 1 ¼ feet
Distance – 5 feet
Lateral spacing – 3 m
Micro tube with on line drippers 8 lph
Justification and Linkage
Water saving 30 %
S.No Particulars Project cost(50 % ofdrip cost)
Budget(Rs. inlakh)
Budget For Mission Mode I- Sugarcane fertigation (250 ha)
1 Cost of drip fertgation system 72.50 145.00
2 Cost of nutrients @ 5500/ha 13.75
Sub Total A 158.75

119
Justification for the unit cost
Sl.No Particulars Amountin (Rs.)
1 Drip system : 58000.00
2 Fertigation
Urea 598 kg @ Rs. 5 /kg : 3000.00
Super Phosphate - 400 kg @ Rs. 4 /kg 1600.00
Muriate of Potash – 187.4 kg @ Rs.4.75/ kg : 890.00
5490.00
Total 63490.00
IV. YEAR WISE ACTIVITY
Project Mode (ha) Mission Mode (ha)YearGroundnut Maize Castor Seed/Mod
el villageSRI Tapioca Sugarcane
I 70 60 25 20 121 - 100II 100 105 25 20 278 100 100III 30 35 Monitoring
& areaspreading
22 101 100 50
IV Monitoring& areaspreading
Monitoring& areaspreading
Monitoring& areaspreading
Monitoring & areaspreading
Monitoring& areaspreading
50 Monitoring& areaspreading
V Monitoring& areaspreading
Monitoring& areaspreading
Monitoring& areaspreading
Monitoring & areaspreading
Monitoring& areaspreading
Monitoring& areaspreading
Monitoring& areaspreading

120
Finance (Rs. In Lakhs)S.N
oParticulars I II III IV V Total
I Activities1 a.Improved production
technologies in groundnutb. Field days
4.550.10
6.500.10
1.950.10
- --
13.000.30
2. a.Improved productiontechnologies in maizeb. Field days
3.60.1
6.30.1
2.10.1
- - 12.000.30
3 Improved productiontechnologies in castorField days
1.20.1
1.20.1
-0.1
- - 2.400.30
3 Seed production -RiceGroundnut
0.061.00
0.060.50
-0.50
- - 0.122.00
4 Castor Sheller 0.30 - - - - 0.30
5 Demonstration oftechnologiesa. Organic farming andIFS rice
1.000 - - - - 1.00
5 OFD and skilldevelopment
4.60 - - - - 4.60
6 SRI 12.10 27.80 10.10 - - 50.007 Drip fertigation tapioca
with ICMV disease freesetts
72.60 72.60 36.30 - - 181.50
8 Drip fertigation insugarcane
63.50 63.50 31.75 - 158.75
II Out Sourcing 7.20 7.20 7.20 3.60 3.60 28.80III Contingencies 2.00 1.50 1.00 1.00 1.00 6.50IV Equipments 3.00 - - - - 3.00
Total 464.87Expected output
Activity Demonstration Area
(Ha)
Areaspread foradoption
(Ha)
Additionalproductivity
(kg/ha)
Additionalproduction(in tonnes)
Additionalrevenue(Rs. inlakhs)
Watersavingmillion
(m3)
Improvedproductiontechnologies inmaize
200 1000 1000 1000 100.00 -
Improvedproductiontechnologies ingroundnut
200 1500 180 270 54.00 -
System RiceIntensificationin rice
500 2500 1200 3000 150.00 10.00
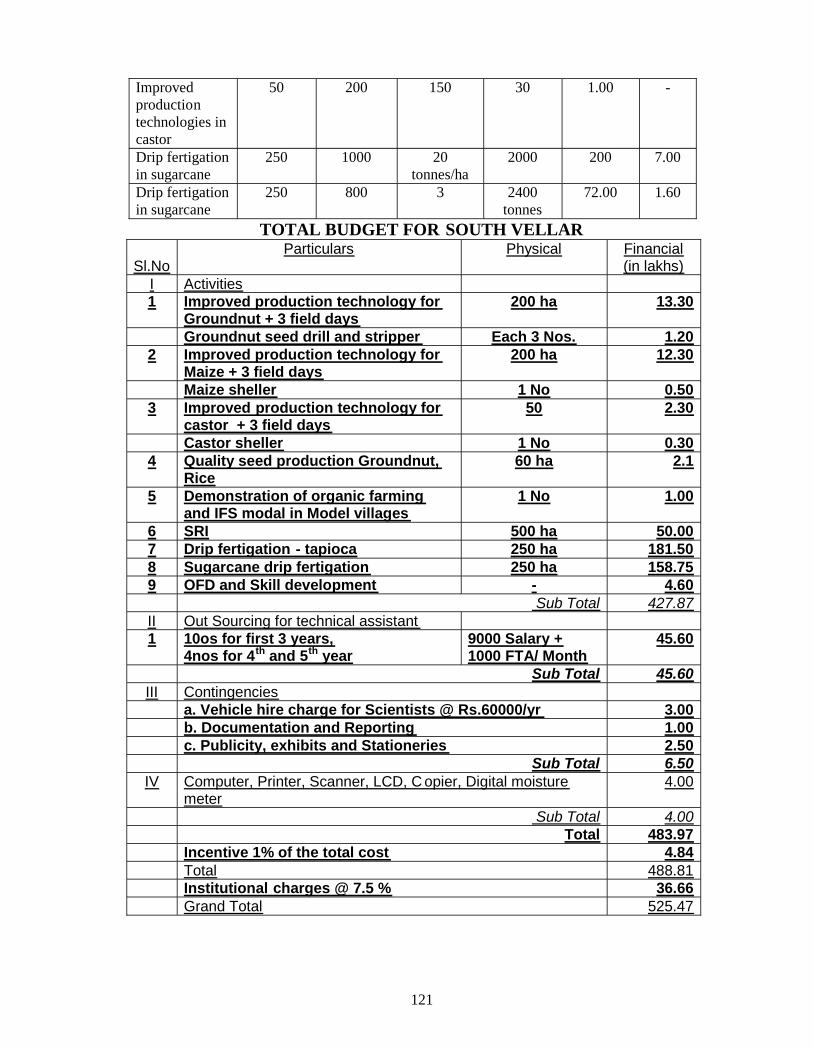
121
Improvedproductiontechnologies incastor
50 200 150 30 1.00 -
Drip fertigationin sugarcane
250 1000 20tonnes/ha
2000 200 7.00
Drip fertigationin sugarcane
250 800 3 2400tonnes
72.00 1.60
TOTAL BUDGET FOR SOUTH VELLAR
Sl.NoParticulars Physical Financial
(in lakhs)I Activities1 Improved production technology for
Groundnut + 3 field days200 ha 13.30
Groundnut seed drill and stripper Each 3 Nos. 1.202 Improved production technology for
Maize + 3 field days200 ha 12.30
Maize sheller 1 No 0.503 Improved production technology for
castor + 3 field days50 2.30
Castor sheller 1 No 0.304 Quality seed production Groundnut,
Rice60 ha 2.1
5 Demonstration of organic farmingand IFS modal in Model villages
1 No 1.00
6 SRI 500 ha 50.007 Drip fertigation - tapioca 250 ha 181.508 Sugarcane drip fertigation 250 ha 158.759 OFD and Skill development - 4.60
Sub Total 427.87II Out Sourcing for technical assistant1 10os for first 3 years,
4nos for 4th and 5th year9000 Salary +1000 FTA/ Month
45.60
Sub Total 45.60III Contingencies
a. Vehicle hire charge for Scientists @ Rs.60000/yr 3.00b. Documentation and Reporting 1.00c. Publicity, exhibits and Stationeries 2.50
Sub Total 6.50IV Computer, Printer, Scanner, LCD, C opier, Digital moisture
meter4.00
Sub Total 4.00Total 483.97
Incentive 1% of the total cost 4.84Total 488.81Institutional charges @ 7.5 % 36.66Grand Total 525.47
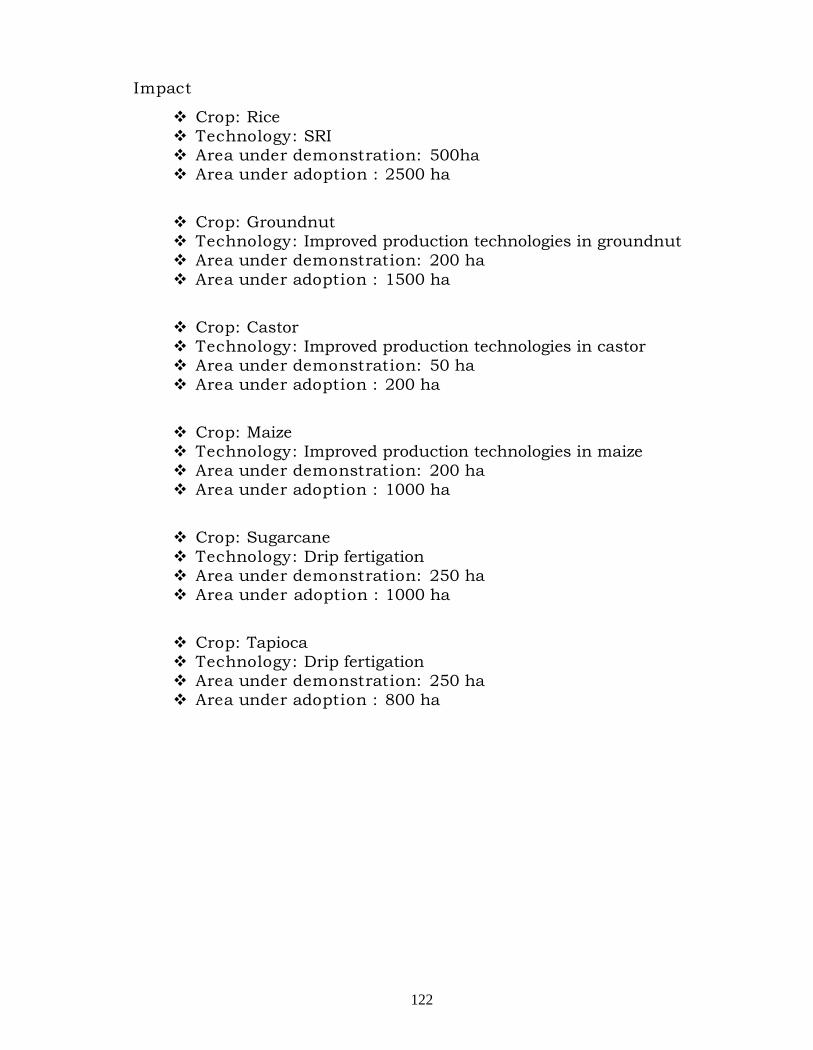
122
Impact
Crop: Rice Technology: SRI Area under demonstration: 500ha Area under adoption : 2500 ha
Crop: Groundnut Technology: Improved production technologies in groundnut Area under demonstration: 200 ha Area under adoption : 1500 ha
Crop: Castor Technology: Improved production technologies in castor Area under demonstration: 50 ha Area under adoption : 200 ha
Crop: Maize Technology: Improved production technologies in maize Area under demonstration: 200 ha Area under adoption : 1000 ha
Crop: Sugarcane Technology: Drip fertigation Area under demonstration: 250 ha Area under adoption : 1000 ha
Crop: Tapioca Technology: Drip fertigation Area under demonstration: 250 ha Area under adoption : 800 ha
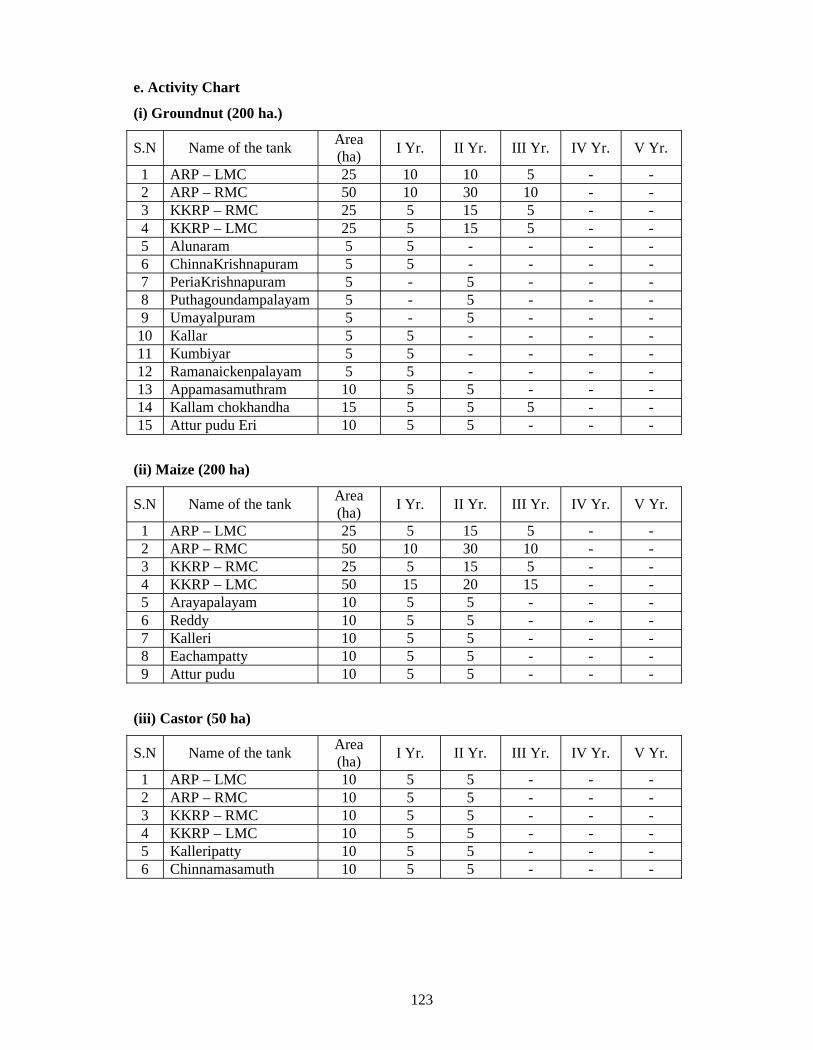
123
e. Activity Chart
(i) Groundnut (200 ha.)
S.N Name of the tankArea(ha)
I Yr. II Yr. III Yr. IV Yr. V Yr.
1 ARP – LMC 25 10 10 5 - -2 ARP – RMC 50 10 30 10 - -3 KKRP – RMC 25 5 15 5 - -4 KKRP – LMC 25 5 15 5 - -5 Alunaram 5 5 - - - -6 ChinnaKrishnapuram 5 5 - - - -7 PeriaKrishnapuram 5 - 5 - - -8 Puthagoundampalayam 5 - 5 - - -9 Umayalpuram 5 - 5 - - -
10 Kallar 5 5 - - - -11 Kumbiyar 5 5 - - - -12 Ramanaickenpalayam 5 5 - - - -13 Appamasamuthram 10 5 5 - - -14 Kallam chokhandha 15 5 5 5 - -15 Attur pudu Eri 10 5 5 - - -
(ii) Maize (200 ha)
S.N Name of the tankArea(ha)
I Yr. II Yr. III Yr. IV Yr. V Yr.
1 ARP – LMC 25 5 15 5 - -2 ARP – RMC 50 10 30 10 - -3 KKRP – RMC 25 5 15 5 - -4 KKRP – LMC 50 15 20 15 - -5 Arayapalayam 10 5 5 - - -6 Reddy 10 5 5 - - -7 Kalleri 10 5 5 - - -8 Eachampatty 10 5 5 - - -9 Attur pudu 10 5 5 - - -
(iii) Castor (50 ha)
S.N Name of the tankArea(ha)
I Yr. II Yr. III Yr. IV Yr. V Yr.
1 ARP – LMC 10 5 5 - - -2 ARP – RMC 10 5 5 - - -3 KKRP – RMC 10 5 5 - - -4 KKRP – LMC 10 5 5 - - -5 Kalleripatty 10 5 5 - - -6 Chinnamasamuth 10 5 5 - - -

124
2. Activity chart
a. Paddy (500 ha)
S.N Name of the tankArea(ha)
I Yr. II Yr. III Yr. IV Yr. V Yr.
1 ARP – LMC 10 2 6 2 - -2 ARP – RMC 25 5 15 5 - -3 KKRP – RMC 25 5 15 5 - -4 KKRP – LMC 25 5 15 5 - -5 Kumarapalayam 6 5 - - - -6 Chinnamasamuthram 15 5 5 5 - -7 Vellalagundam 5 - 5 - - -8 Kalyanagiri 25 5 15 5 - -9 Abunavam 25 5 15 5 - -
10 Puthinagoundampalayam
25 5 15 5 - -
11 Umayalpuram 10 2 6 2 - -12 Erumasamuthiam 10 2 6 2 - -13 Ayyanarkoil 25 5 15 5 - -14 Attu pudubi 25 5 15 5 - -15 Ammampalayam 25 5 15 5 - -16 Ayerpadi 25 5 15 5 - -17 Kattukottai 25 5 15 5 - -18 Marivelanthan 40 10 20 10 - -19 Sarvay large 25 5 15 5 - -20 Sitteri 25 5 15 5 - -21 Devylkurchi 20 5 10 5 - -22 Thenkumarai 10 5 5 - - -23 Thalairasal 15 5 5 5 - -24 Thiyaganur 15 5 5 5 - -25 Aragalur 10 5 5 - - -26 Goundampalayam 10 5 5 - - -
b. Tapioca (250 ha)
S.N Name of the tankArea(ha)
I Yr. II Yr. III Yr. IV Yr. V Yr.
1 ARP – LMC 20 - 5 10 5 -2 ARP – RMC 15 - 5 5 5 -3 KKRP – RMC 25 - 5 15 5 -4 KKRP – LMC 20 - 5 10 5 -5 Kalleripatty 10 - 5 5 - -6 Chinnamasamuth 15 - 5 5 5 -7 Erumasamuth 15 - 5 5 5 -8 Kallchettugu 15 - 5 5 5 -9 Lakshmasamuth 15 - 5 5 5 -
10 Kerripatty 20 - 5 10 5 -11 Kalleri chorkenatha 20 - 5 10 5 -12 Kattanathan 25 - 5 15 5 -13 Ammapalayam 20 - 5 10 5 -14 Kattu kottai 15 - 5 5 5 -
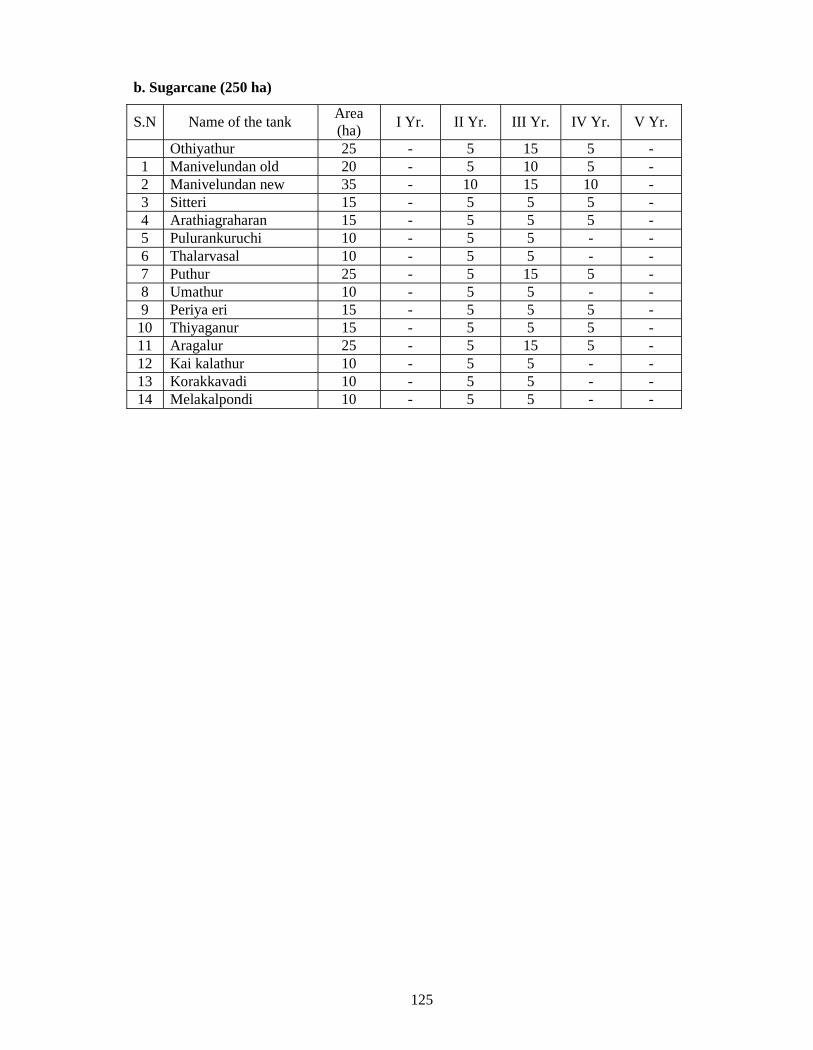
125
b. Sugarcane (250 ha)
S.N Name of the tankArea(ha)
I Yr. II Yr. III Yr. IV Yr. V Yr.
Othiyathur 25 - 5 15 5 -1 Manivelundan old 20 - 5 10 5 -2 Manivelundan new 35 - 10 15 10 -3 Sitteri 15 - 5 5 5 -4 Arathiagraharan 15 - 5 5 5 -5 Pulurankuruchi 10 - 5 5 - -6 Thalarvasal 10 - 5 5 - -7 Puthur 25 - 5 15 5 -8 Umathur 10 - 5 5 - -9 Periya eri 15 - 5 5 5 -
10 Thiyaganur 15 - 5 5 5 -11 Aragalur 25 - 5 15 5 -12 Kai kalathur 10 - 5 5 - -13 Korakkavadi 10 - 5 5 - -14 Melakalpondi 10 - 5 5 - -

126
IRRIGATED AGRICULTURE MODERNIZATIONAND WATER RESOURCES MANAGEMENT
PROJECT
UPPER VELLAR - SUB-BASIN
IAMWARM
PROPOSAL
SALEM DISTRICT
Assistant Director of Horticulture,Salem.
HORTICULTURE
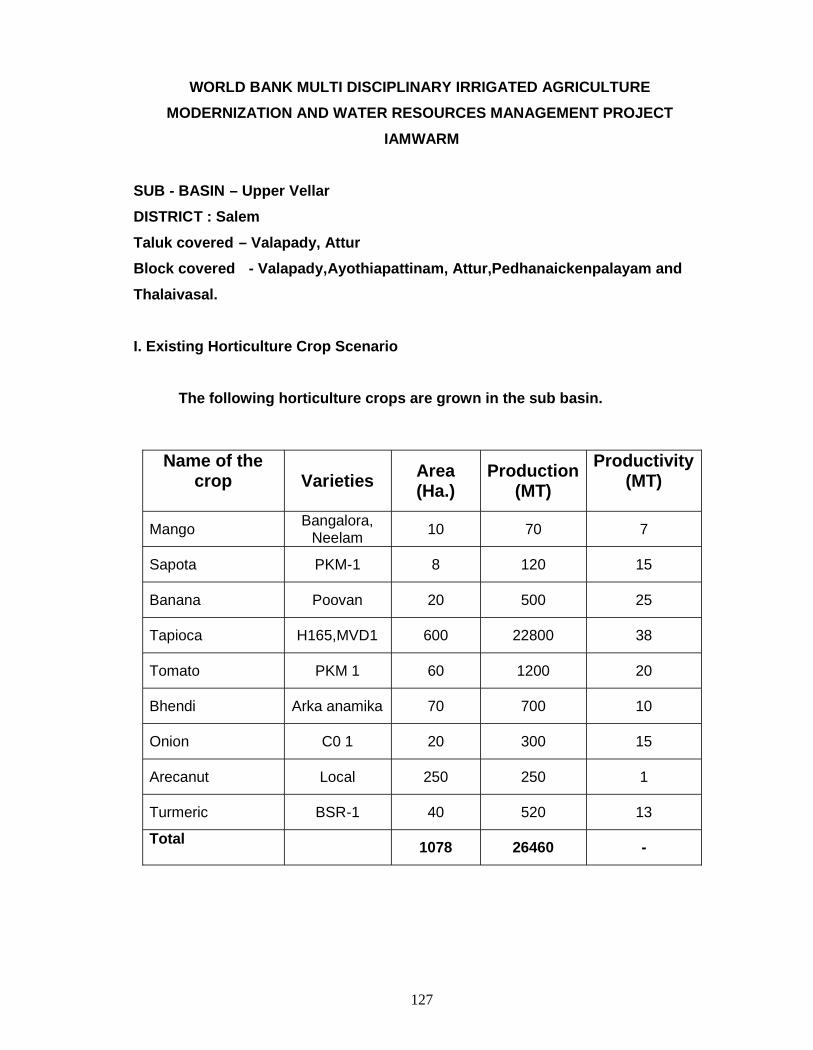
127
WORLD BANK MULTI DISCIPLINARY IRRIGATED AGRICULTUREMODERNIZATION AND WATER RESOURCES MANAGEMENT PROJECT
IAMWARM
SUB - BASIN – Upper VellarDISTRICT : SalemTaluk covered – Valapady, AtturBlock covered - Valapady,Ayothiapattinam, Attur,Pedhanaickenpalayam andThalaivasal.
I. Existing Horticulture Crop Scenario
The following horticulture crops are grown in the sub basin.
Name of thecrop Varieties Area
(Ha.)Production
(MT)Productivity
(MT)
Mango Bangalora,Neelam 10 70 7
Sapota PKM-1 8 120 15
Banana Poovan 20 500 25
Tapioca H165,MVD1 600 22800 38
Tomato PKM 1 60 1200 20
Bhendi Arka anamika 70 700 10
Onion C0 1 20 300 15
Arecanut Local 250 250 1
Turmeric BSR-1 40 520 13
Total 1078 26460 -
128
II. Existing Horticulture Practices:Existing cropping pattern and Season :
1. Mango, Sapota, Arecanut - Perennial
2. Vegetables - June to September, Adipattam
3. Tapioca - June – July to December
4. Turmeric - June – July
Proposed Generic Cropping Pattern
1. Mango, - June - December
2. Banana - November - December
3. Vegetables - June to September, December – February
4. Tapioca - October - December
5. Turmeric - June – July
6. Arecanut - July – December
Existing Irrigation Potential:
Out of the registered Ayacut area of 10572 Ha. the present irrigation potential is
Fully Irrigated 3150 Ha.
Partially Irrigated 4276 Ha.
Gap 3146 Ha.
---------
10572 Ha
---------
Proposed Irrigation Facilities:
Out of 1078 Ha. under Horticulture Crops, an area of 683 Ha. is proposed to
cover micro irrigation with fertigation by the Agricultural Engineering Depar tment (vide
page number-)
INM & IPM :
None of the farmers adopting INM but only few farmers are adopting IPM in pre
project. It is proposed to adopt INM in 30 Ha. under fruits and IPM in 150 Ha. under
vegetables.
1. Inputs:

129
a. Seed:
Certified seeds High Yielding varieties locally available seeds which are used
by farmers. Regarding the Planting materials Plants are available in Government
farms, Horticulture research station and private sources. Sufficient planting material
and seeds are available.
b. Soil :
In Upper Vellar sub-basin mostly the soil is red loam, sandy loam and black
soils with PH- ranges from 7 to 8.9 soil is tested by soil testing laboratory at Salem.
Few farmers are practicing the STL recommendation and mobile soil laboratory at
Salem. The climate is mainly tropical in nature with the temperature ranges from 28 to
34 ºc and relative humidity ranges from 66 to 94%.
C. Prevalence of Organic farming :
Organic farming is practiced by few farmers, less than 5 Hac.
It is proposed to cover 60 Ha. under Organic farming in turmeric.
d. Actual extension service available for TOT - Government / Private.
Available extension officers - Horticulture Officer,Attur - 1No
Assistant Agriculture Officer
1) Valapady - 1no
2) Pedhanaickenpalayam - 3nos
3) Attur - 1no
4) Thalaivasal - 1 no
Available extension officers provide extension service to the farmers which are
inadequate. Need for more extension personnels are required.
For transfer of latest farming techniques, many extension methods are being
adopted. Besides distribution of inputs, required technical advise essential for the
increased productivity are also given to the farmers. As per the Training and Visit
program norms, there must be one Village Extension Worker (VEW) for every 800 to
1000 farm families. But such norms are not followed in reality due to vacancies at all
levels of extension staff.
In view of the above, it is proposed to out source Technical Input Provider for
372 man months for 5 years according to the existing policy.
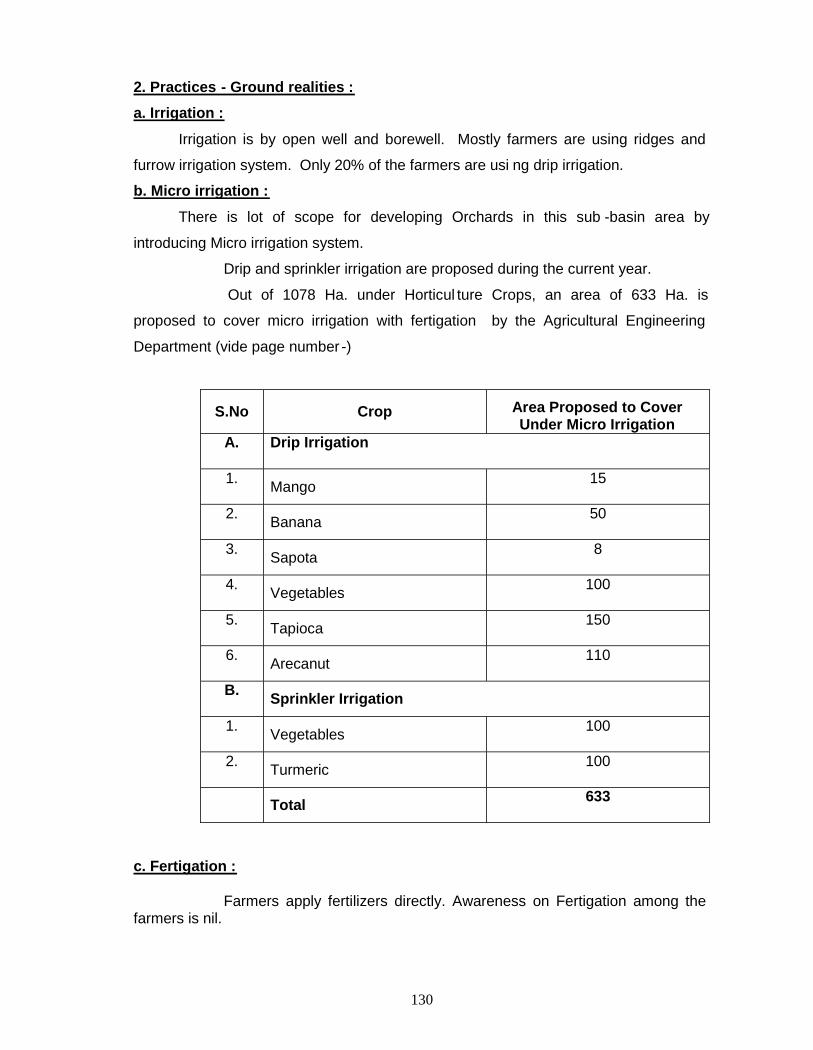
130
2. Practices - Ground realities :a. Irrigation :
Irrigation is by open well and borewell. Mostly farmers are using ridges and
furrow irrigation system. Only 20% of the farmers are usi ng drip irrigation.
b. Micro irrigation :
There is lot of scope for developing Orchards in this sub -basin area by
introducing Micro irrigation system.
Drip and sprinkler irrigation are proposed during the current year.
Out of 1078 Ha. under Horticul ture Crops, an area of 633 Ha. is
proposed to cover micro irrigation with fertigation by the Agricultural Engineering
Department (vide page number -)
S.No Crop Area Proposed to CoverUnder Micro Irrigation
A. Drip Irrigation
1. Mango 15
2. Banana 50
3. Sapota 8
4. Vegetables 100
5. Tapioca 150
6. Arecanut 110
B. Sprinkler Irrigation
1. Vegetables 100
2. Turmeric 100
Total 633
c. Fertigation :
Farmers apply fertilizers directly. Awareness on Fertigation among thefarmers is nil.
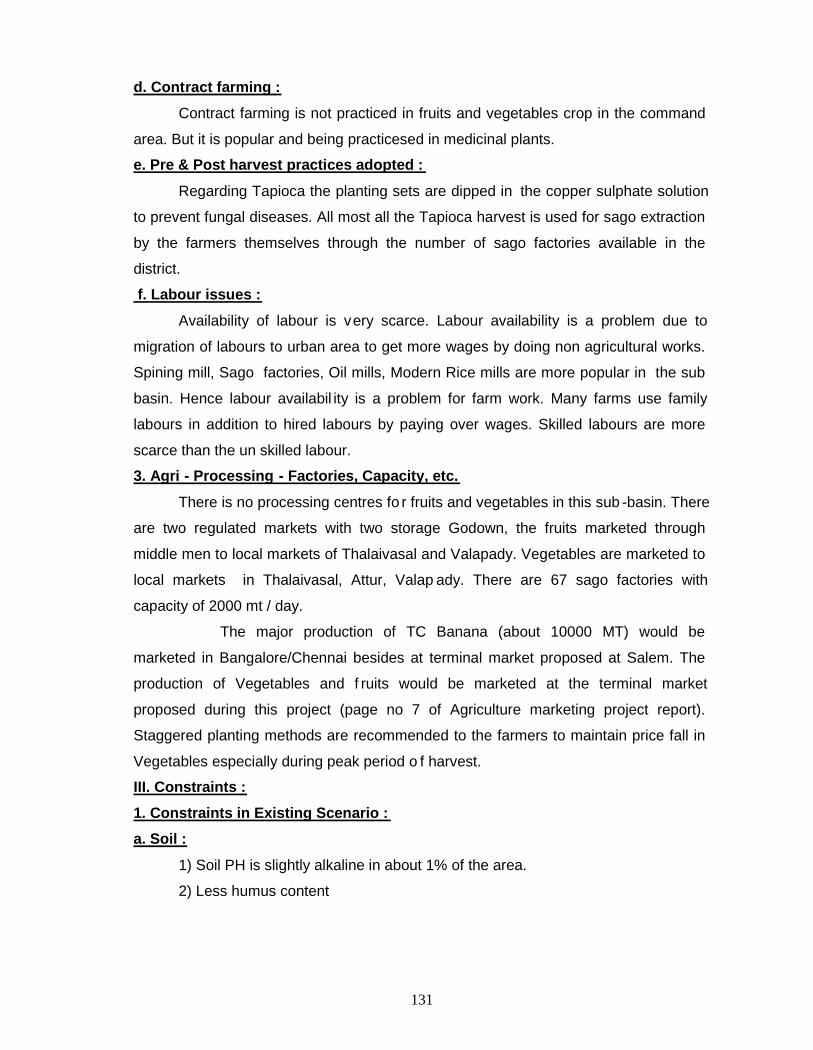
131
d. Contract farming :
Contract farming is not practiced in fruits and vegetables crop in the command
area. But it is popular and being practicesed in medicinal plants.
e. Pre & Post harvest practices adopted :
Regarding Tapioca the planting sets are dipped in the copper sulphate solution
to prevent fungal diseases. All most all the Tapioca harvest is used for sago extraction
by the farmers themselves through the number of sago factories available in the
district.
f. Labour issues :
Availability of labour is very scarce. Labour availability is a problem due to
migration of labours to urban area to get more wages by doing non agricultural works.
Spining mill, Sago factories, Oil mills, Modern Rice mills are more popular in the sub
basin. Hence labour availabil ity is a problem for farm work. Many farms use family
labours in addition to hired labours by paying over wages. Skilled labours are more
scarce than the un skilled labour.
3. Agri - Processing - Factories, Capacity, etc.
There is no processing centres fo r fruits and vegetables in this sub -basin. There
are two regulated markets with two storage Godown, the fruits marketed through
middle men to local markets of Thalaivasal and Valapady. Vegetables are marketed to
local markets in Thalaivasal, Attur, Valap ady. There are 67 sago factories with
capacity of 2000 mt / day.
The major production of TC Banana (about 10000 MT) would be
marketed in Bangalore/Chennai besides at terminal market proposed at Salem. The
production of Vegetables and f ruits would be marketed at the terminal market
proposed during this project (page no 7 of Agriculture marketing project report).
Staggered planting methods are recommended to the farmers to maintain price fall in
Vegetables especially during peak period o f harvest.
III. Constraints :1. Constraints in Existing Scenario :a. Soil :
1) Soil PH is slightly alkaline in about 1% of the area.
2) Less humus content

132
To overcome the problem soil, addition of organic matter has to be done based
on soil test reports. Green manuring composting and application of Farm Yard Manure
have to be increased.
b. Adverse climatic condition :
These blocks are drought prone. Rainfall is not distributed uniformly through
out the year. Maximum rainfall is received durin g South West monsoon.
c. Inferior quality of seed and planting material :
Farmers are using local and poor quality seeds. Truthfull seeds are used by
very few farmers.
Quality planting materials are supplied through Department of Horticulture.
There are four State Horticulture farms located at Kalrayan hills and Mulluvadi to
supply the planting materials.
The Hybrid Seeds are available from the private sources and it will be procured
and supply to the farmers and under Tender acts.
d. Limited planting material available from government sources :
Required quantity of seeds is not available with department of Horticulture.
Seeds are supplied to the farmers by department after procuring the Hybrid
Seeds through tender system.
e. Improper varieties :
Traditional varieties of vegetables are adopted by majority of the farmers. In
some cases varieties of fruit plants were not true to type, hence purchased from
vendors of un known sources.
f. Improper irrigation practices(Ridges and Furrows, Basin irrigation)
Ridges and Furrows system is followed for Vegetables and Basin irrigation is
followed for Fruits. Drip irrigation is going to be introduced by the Agriculture
Engineering Department for 719 Ha.
g. Inadequate extension service :
Available extension officers to provide extension service to the farmers are
inadequate. Apart from this, NGOs provide extension service to the farmers.More
extension personnel are required.Hence to cater the need of Technical Input Providers
for Attur,Peddanaickenpalayam,Thalaivasal and Vazhapady. It is proposed to hire TIP
for 216 man months for 5 years.
133
h. Low price for produce :
There is price fluctuation for fruits and vegetables due to un organized
marketing and inadequate storage facilities, Middleman are taking the major portion of
the profit of the farmers. Farmers are cultivating same vegetables in a particular
season year after year. So produce arrival to the market is heavy during particular
season every year leading to low price.
The staggered planting methods recommended to the farmers will maintain
price fall in Vegetables especially during peak period of harvest. It is recommended to
plant early and late season varieties.
i. Poor adoption of Pre & Post harvest technologies :
Farmers are not following pre and post harvest technologies, this needs more
attention.
1. Banana
The farmers are not following pre harvest technologies to overcome the
problem of seeds in Poovan variety.
Bunch covering
Removal of male flowers
Fruit ripening
Grading
All fruits and vegetables
Grading
Processing
Packing
Refrigerated vans for transport
Awareness should be created among the farmers in pre and post
harvest techniques by giving trainin ATTUR g to the farmers.
j. Limited availability of Credit faci lities :
Credit facilities are available through primary Agriculture Cooperative Banks
and Nationalized banks. However to avail these facilities many formalities has to be
gone through. Hence simplification of procedure and single window system is essentia l.
134
k. Risk aversion
Few farmers have the knowledge of Risk aversion. However many farmers
have poor knowledge on this, due to non visit to Horticulture depots and Departmental
officers often. Due to lack training, lack of capacity building, etc awarenes s of the new
technologies in cultivation of crops and price trend of the produces at various levels
are low.
l. Limited processing units :
Fruits and Vegetables Processing units are not available in the sub -basin area.
But sago factories are available.
m. Availability of labour
Labour availability is in decreasing trend for agriculture works, due to availability
of non agricultural works which pays more wages to the labours.
IV. Diversification / Future vision proposed :
Physical target in Hectares ProductivityMTS.
No Components IYear
IIYear
IIIYear
IVYear
VYear Total
ProductionMT EXISTI
NGPROPOSED
I. AREA EXPANSION
A. Fruit plants1. TC Banana 15 15 - - - 30 1200 25 40B. Vegetable crops1. Hybrid tomato 20 25 - - - 45 1575 20 352. Hybrid Bhendi 35 40 30 - - 100 2500 10 25C. Spices1. Turmeric 30 30 - - 60 1200 13 20D. Plantation Crop1. Arecanut 10 - - - 10 30 1 3E. Tapioca 75 100 75 - - 250 9500 20 38
Total 175 220 105 - - 500 16055
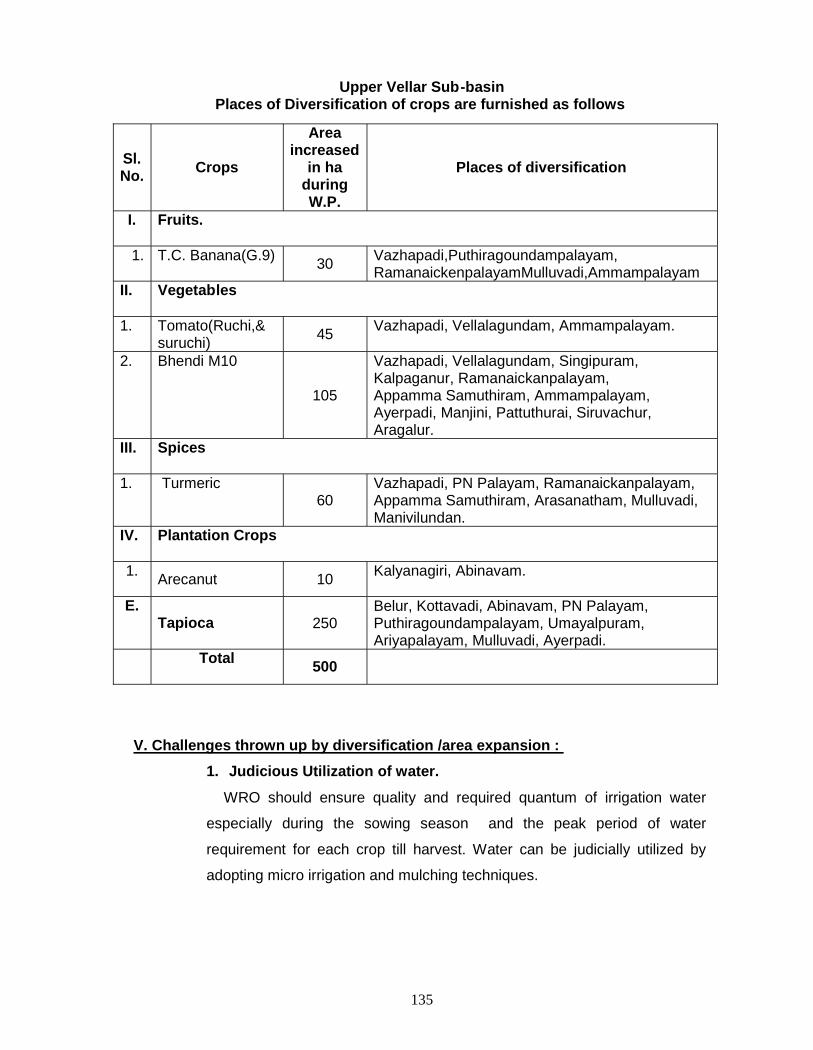
135
Upper Vellar Sub-basinPlaces of Diversification of crops are furnished as follows
V. Challenges thrown up by diversification /area expansion :1. Judicious Utilization of water.
WRO should ensure quality and required quantum of irrigation water
especially during the sowing season and the peak period of water
requirement for each crop till harvest. Water can be judicially utilized by
adopting micro irrigation and mulching techniques.
Sl.No. Crops
Areaincreased
in haduringW.P.
Places of diversification
I. Fruits.
1. T.C. Banana(G.9) 30 Vazhapadi,Puthiragoundampalayam,RamanaickenpalayamMulluvadi,Ammampalayam
II. Vegetables
1. Tomato(Ruchi,&suruchi) 45 Vazhapadi, Vellalagundam, Ammampalayam.
2. Bhendi M10
105
Vazhapadi, Vellalagundam, Singipuram,Kalpaganur, Ramanaickanpalayam,Appamma Samuthiram, Ammampalayam,Ayerpadi, Manjini, Pattuthurai, Siruvachur,Aragalur.
III. Spices
1. Turmeric60
Vazhapadi, PN Palayam, Ramanaickanpalayam,Appamma Samuthiram, Arasanatham, Mulluvadi,Manivilundan.
IV. Plantation Crops
1. Arecanut 10 Kalyanagiri, Abinavam.
E.Tapioca 250
Belur, Kottavadi, Abinavam, PN Palayam,Puthiragoundampalayam, Umayalpuram,Ariyapalayam, Mulluvadi, Ayerpadi.
Total 500
136
2. Identification of suitable crops/ varieties.
The crops, cropping pattern proposed in this project are suggested
based on the micro climatic suitability market trend, soil type and based on
the choice of the farmers(WUA) / FA.
Production of quality / quantity planting materials.
Timely supply of good quality and requi red quantity of pedigree planting
materials that will be made available from the State Horticulture Farms and
quality Hybrid seeds should be made available through the horticulture
depots.
3. Farmers acceptability for new crops.
On farm training at the successful / progressive farmers fields, training,
meetings, motivation campaigns, should be conducted. Publicity and
propaganda to be taken up.
4. Lack of transfer of technology
Transfer of latest farming techniques, distribution of inputs, technical
advice should be given to the farmers through the extension personnel.
Now the existing extension personal is inadequate. Hence out sourcing
technical input provider is the only solution.
6. Strengtherning of Horticulture information centers
Information Education and communication facilities should be
strengthened. Required training should be given to the extension personal
and field level workers. The infra structure facilities should be strengthened
at sub basin level as well as project cell.
VI. Solutions and Recommendations1. Soil reclamation :
i) Soil reclamation will be made as per the recommendations STL.
ii) Mulching, addition of organic manure.
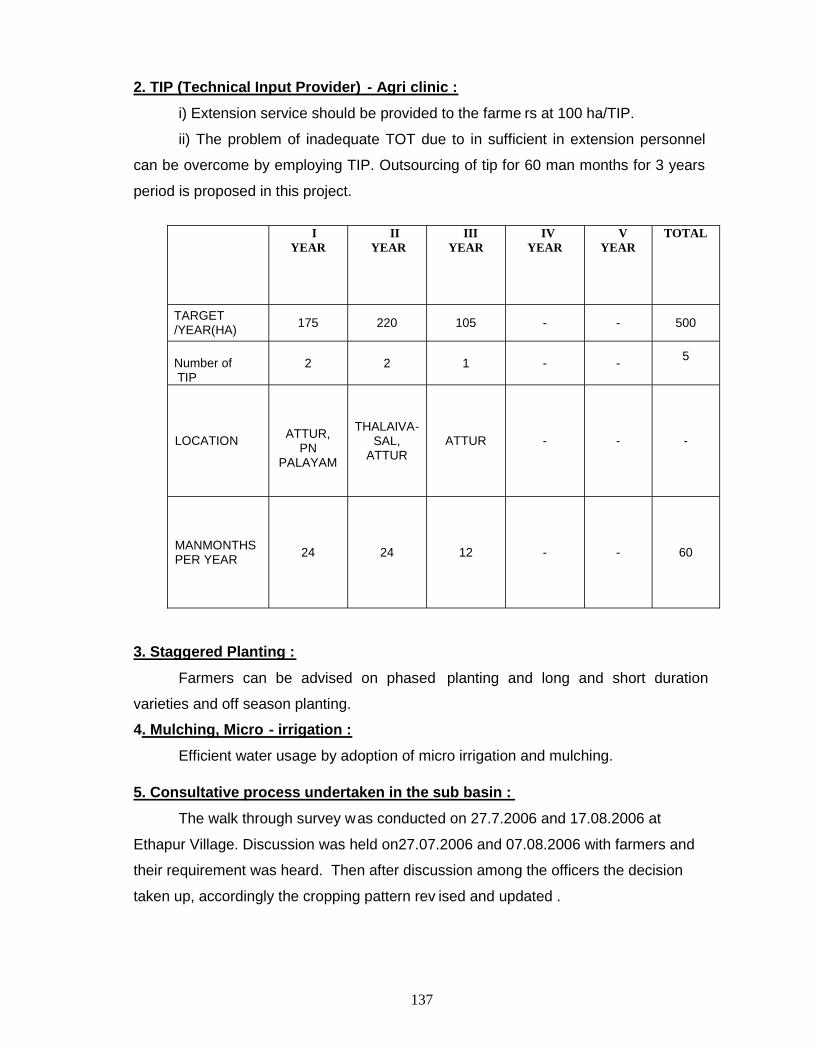
137
2. TIP (Technical Input Provider) - Agri clinic :
i) Extension service should be provided to the farme rs at 100 ha/TIP.
ii) The problem of inadequate TOT due to in sufficient in extension personnel
can be overcome by employing TIP. Outsourcing of tip for 60 man months for 3 years
period is proposed in this project.
IYEAR
II YEAR
IIIYEAR
IVYEAR
VYEAR
TOTAL
TARGET/YEAR(HA) 175 220 105 - - 500
Number of TIP
2 2 1 - - 5
LOCATION ATTUR,PN
PALAYAM
THALAIVA-SAL,
ATTURATTUR - - -
MANMONTHSPER YEAR 24 24 12 - - 60
3. Staggered Planting :
Farmers can be advised on phased planting and long and short duration
varieties and off season planting.
4. Mulching, Micro - irrigation :
Efficient water usage by adoption of micro irrigation and mulching.
5. Consultative process undertaken in the sub basin :
The walk through survey was conducted on 27.7.2006 and 17.08.2006 at
Ethapur Village. Discussion was held on27.07.2006 and 07.08.2006 with farmers and
their requirement was heard. Then after discussion among the officers the decision
taken up, accordingly the cropping pattern rev ised and updated .
138
6. Stakeholders demands (List)
i. Instead of local variety farmers demanded hybrid variety of
vegetables and quality seeds.
ii. Demand for micro irrigation.
iii. Latest technology transfer - production technology and post
harvest technology.
iv. Inputs for organic farming.
v. Credit facilities
vi. Processing unit for preserving vegetables and fruits.
vii. Need technical advise,
viii.Need market information centre.
7. Marketing intervention proposed with reference to identified constraints :
S.No. Constraint & Challenges Counter Measures1. Problem soil To overcome the problem soil, the
farmers are advised to take up soilsampling and soil testing. Measuresto be taken up to augment theorganic content of the soil. The cropslike Mango which can come up in allkinds of soil are suggested in thissub-basin.
2. Adverse climatic condition : Drought resistant and high yieldingcrops of Mango, are suggested inthis sub-basin.
3. Inferior quality of seed and plantingmaterial
Farmers are using local and poorquality seeds. Truthfull seeds areused by the meager farmers
Quality plantingmaterials supplied throughDepartment of Horticulture.There are four StateHorticulture farms available,three at Karumandurai andone at Mulluvadi to supply theplanting materials. The HybridSeeds are available from theprivate sources and it will beprocured and supply to thefarmers and under Tenderacts.
4. Limited planting material availablefrom government sources
Seeds are supplied to thefarmers by department after

139
procuring the Hybrid Seeds throughtender system.
5. Improper irrigation practices(Ridgesand Furrows, Basin irrigation).
Drip irrigation and fertigation is goingto be introduced by the AgricultureEngineering Department for 683 Ha.
6. Inadequate extension service : To cater the need technical inputproviders are proposed to be hiredfor 120 man months for 5 years.Forevery 100 Ha of area increase oneTIP is proposed
7. Low price for produce : Staggered planting methodsrecommended to the farmers willmaintained price fall in Vegetablesespecially during peak period ofharvest. It is recommended to plantearly and late season varieties.
8. Poor adoption of Pre & Post harvesttechnologies :
Awareness should be created amongthe farmers in pre and post harvesttechniques by giving training to thefarmers.
10. Risk aversion Training should be given to thefarmers on new techniques.
11. Limited processing units :Entrepreneurs should be motivatedthrough training and seminars to startnew processing units.
12. Availability of labourFarm mechanization is essential.Providing farm machineries fordrudgery reduction, weeding,spraying, to the WUA is needed.
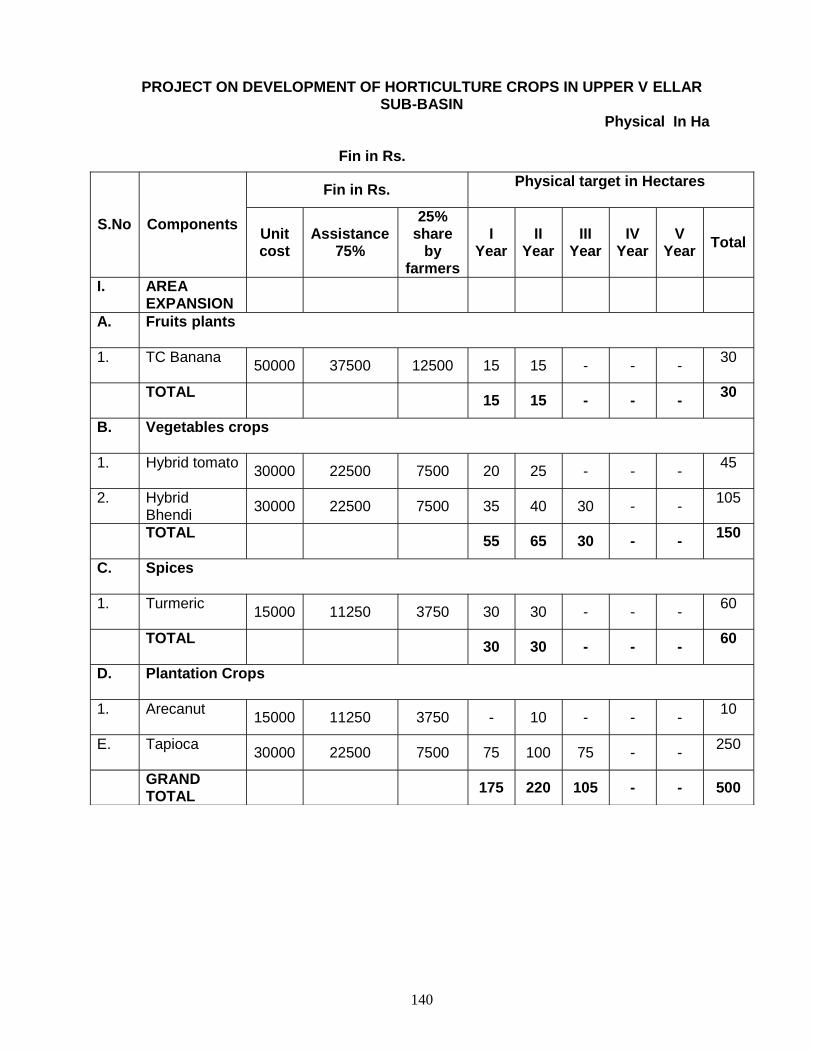
140
PROJECT ON DEVELOPMENT OF HORTICULTURE CROPS IN UPPER V ELLARSUB-BASIN
Physical In Ha
Fin in Rs.
Fin in Rs. Physical target in Hectares
S.No Components Unitcost
Assistance75%
25%share
byfarmers
IYear
IIYear
IIIYear
IVYear
VYear Total
I. AREAEXPANSION
A. Fruits plants
1. TC Banana 50000 37500 12500 15 15 - - - 30
TOTAL 15 15 - - - 30
B. Vegetables crops
1. Hybrid tomato 30000 22500 7500 20 25 - - - 45
2. HybridBhendi 30000 22500 7500 35 40 30 - - 105
TOTAL 55 65 30 - - 150
C. Spices
1. Turmeric 15000 11250 3750 30 30 - - - 60
TOTAL 30 30 - - - 60
D. Plantation Crops
1. Arecanut 15000 11250 3750 - 10 - - - 10
E. Tapioca 30000 22500 7500 75 100 75 - - 250
GRANDTOTAL 175 220 105 - - 500

141
PROJECT ON DRIP IRRIGATION F OR HORTICULTURE CROPS
S.No CropArea Proposedto Cover Under
MicroIrrigation(Ha.)
Implemented by
A. Drip Irrigation1. Mango 152. Banana 503. Sapota 84. Vegetables 1005. Tapioca 1506. Arecanut 110
AGRICULTURALENGINEERINGDEPARTMENT
B. Sprinkler Irrigation1. Vegetables 1002. Turmeric 100
Total 633
AGRICULTURALENGINEERINGDEPARTMENT
PROJECT ON INM / IPM
Fin in Rs. Physical target in HectaresS.No Components Unit
costAssistance
100%I
YearII
YearIII
YearIV
YearV
Year Total
A. Fruits plants1. TC Banana 1000 1000 15 15 - - - 30
TOTAL 15 15 - - - 30B. Vegetables
crops1. Hybrid tomato 1000 1000 20 25 - - - 452. Hybrid
Bhendi 1000 1000 35 40 30 - - 105
TOTAL 55 65 30 - - 150GRANDTOTAL 70 80 30 - - 180
PROJECT ON ORGANIC FARMINGPhysical target in Hectares
S.No ComponentsFin in Rs.
I Year IIYear
IIIYear
IVYear
VYear Total
C. Spices
1.Turmeric
30 30 - - - 60
Total
Financialproposalalreadygiven inareaexpansionprogramme
30 30 - - - 60
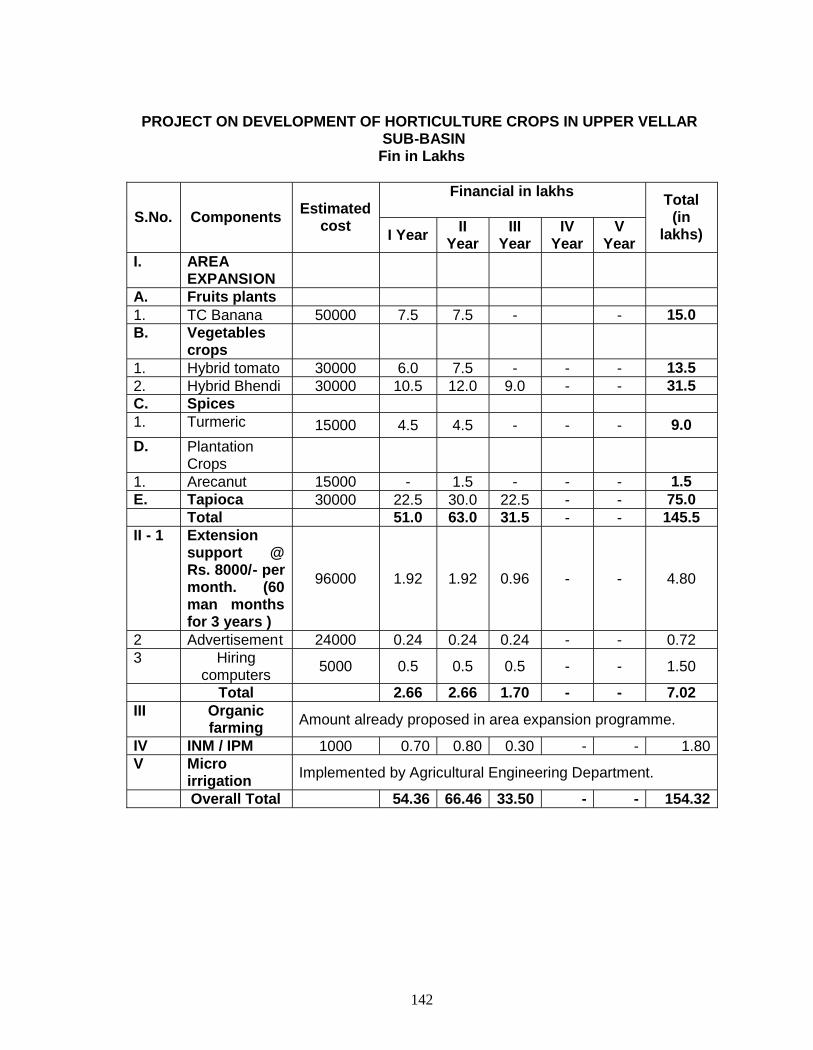
142
PROJECT ON DEVELOPMENT OF HORTICULTURE CROPS IN UPPER VELLAR SUB-BASINFin in Lakhs
Financial in lakhsS.No. Components Estimated
cost I Year IIYear
IIIYear
IVYear
VYear
Total(in
lakhs)
I. AREAEXPANSION
A. Fruits plants1. TC Banana 50000 7.5 7.5 - - 15.0B. Vegetables
crops1. Hybrid tomato 30000 6.0 7.5 - - - 13.52. Hybrid Bhendi 30000 10.5 12.0 9.0 - - 31.5C. Spices1. Turmeric 15000 4.5 4.5 - - - 9.0D. Plantation
Crops1. Arecanut 15000 - 1.5 - - - 1.5E. Tapioca 30000 22.5 30.0 22.5 - - 75.0
Total 51.0 63.0 31.5 - - 145.5II - 1 Extension
support @Rs. 8000/- permonth. (60man monthsfor 3 years )
96000 1.92 1.92 0.96 - - 4.80
2 Advertisement 24000 0.24 0.24 0.24 - - 0.723 Hiring
computers 5000 0.5 0.5 0.5 - - 1.50
Total 2.66 2.66 1.70 - - 7.02III Organic
farming Amount already proposed in area expansion programme.
IV INM / IPM 1000 0.70 0.80 0.30 - - 1.80V Micro
irrigation Implemented by Agricultural Engineering Department.
Overall Total 54.36 66.46 33.50 - - 154.32

143
Upper vellar sub-basin , Salem.Places of Diversification of crops are furnished as follows
Sl.No. Crops
Areaincreased
in haduringW.P.
Places of diversification
I Fruits.1. T.C. Banana(G.9)
30Vazhapadi,Puthiragoundampalayam,RamanaickenpalayamMulluvadi,Ammampalayam
II. Vegetables1. Tomato(Ruchi,&
suruchi) 45 Vazhapadi, Vellalagundam, Ammampalayam.
2. Bhendi M10
105
Vazhapadi, Vellalagundam, Singi puram,Kalpaganur, Ramanaickanpalayam,Appamma Samuthiram, Ammampalayam,Ayerpadi, Manjini, Pattuthurai, Siruvachur,Aragalur.
III. Spices1. Turmeric
60Vazhapadi, PN Palayam, Ramanaickanpalayam,Appamma Samuthiram, Arasanatham,Mulluvadi, Manivilundan.
IV. Plantation crops1. Arecanut 10 Kalyanagiri, Abinavam.E.
Tapioca 250Belur, Kottavadi, Abinavam, PN Palayam,Puthiragoundampalayam, Umayalpuram,Ariyapalayam, Mulluvadi, Ayerpadi.
Total 500
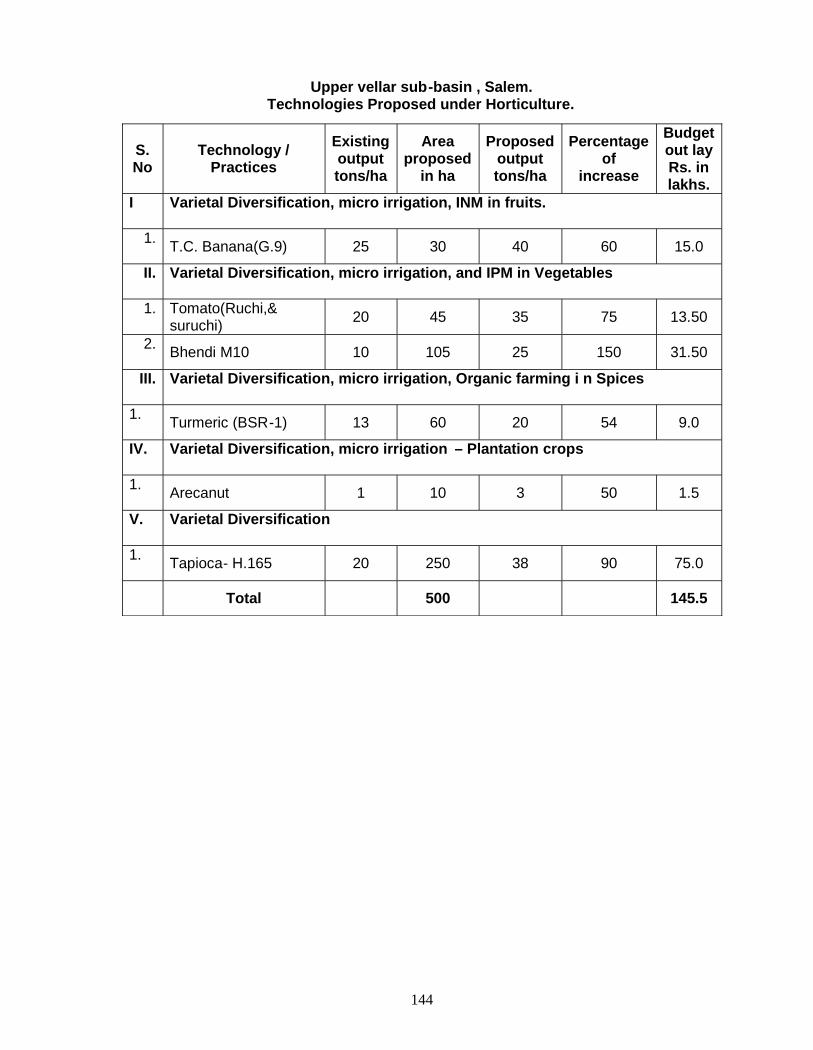
144
Upper vellar sub-basin , Salem.Technologies Proposed under Horticulture.
S.No
Technology /Practices
Existingoutputtons/ha
Areaproposed
in ha
Proposedoutputtons/ha
Percentageof
increase
Budgetout layRs. inlakhs.
I Varietal Diversification, micro irrigation, INM in fruits.
1. T.C. Banana(G.9) 25 30 40 60 15.0
II. Varietal Diversification, micro irrigation, and IPM in Vegetables
1. Tomato(Ruchi,&suruchi) 20 45 35 75 13.50
2. Bhendi M10 10 105 25 150 31.50
III. Varietal Diversification, micro irrigation, Organic farming i n Spices
1. Turmeric (BSR-1) 13 60 20 54 9.0
IV. Varietal Diversification, micro irrigation – Plantation crops
1. Arecanut 1 10 3 50 1.5
V. Varietal Diversification
1. Tapioca- H.165 20 250 38 90 75.0
Total 500 145.5
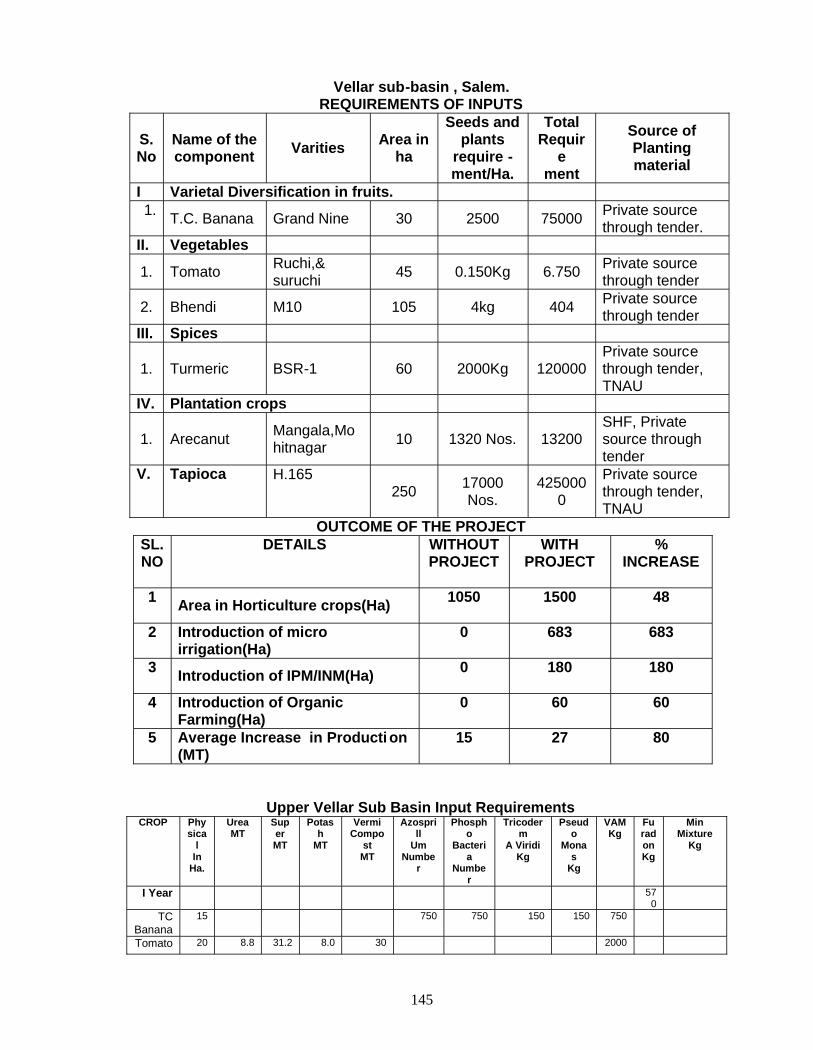
145
Vellar sub-basin , Salem.REQUIREMENTS OF INPUTS
S.No
Name of thecomponent Varities Area in
ha
Seeds andplants
require -ment/Ha.
TotalRequir
ement
Source ofPlantingmaterial
I Varietal Diversification in fruits.1. T.C. Banana Grand Nine 30 2500 75000 Private source
through tender.II. Vegetables
1. Tomato Ruchi,&suruchi 45 0.150Kg 6.750 Private source
through tender
2. Bhendi M10 105 4kg 404 Private sourcethrough tender
III. Spices
1. Turmeric BSR-1 60 2000Kg 120000Private sourcethrough tender,TNAU
IV. Plantation crops
1. Arecanut Mangala,Mohitnagar 10 1320 Nos. 13200
SHF, Privatesource throughtender
V. Tapioca H.165250 17000
Nos.425000
0
Private sourcethrough tender,TNAU
OUTCOME OF THE PROJECTSL.NO
DETAILS WITHOUTPROJECT
WITHPROJECT
%INCREASE
1 Area in Horticulture crops(Ha) 1050 1500 48
2 Introduction of microirrigation(Ha)
0 683 683
3 Introduction of IPM/INM(Ha) 0 180 180
4 Introduction of OrganicFarming(Ha)
0 60 60
5 Average Increase in Producti on(MT)
15 27 80
Upper Vellar Sub Basin Input RequirementsCROP Phy
sical
InHa.
UreaMT
SuperMT
Potash
MT
VermiCompo
stMT
Azosprill
UmNumbe
r
Phospho
Bacteria
Number
Tricoderm
A ViridiKg
Pseudo
Monas
Kg
VAMKg
FuradonKg
MinMixture
Kg
I Year 570
TCBanana
15 750 750 150 150 750
Tomato 20 8.8 31.2 8.0 30 2000
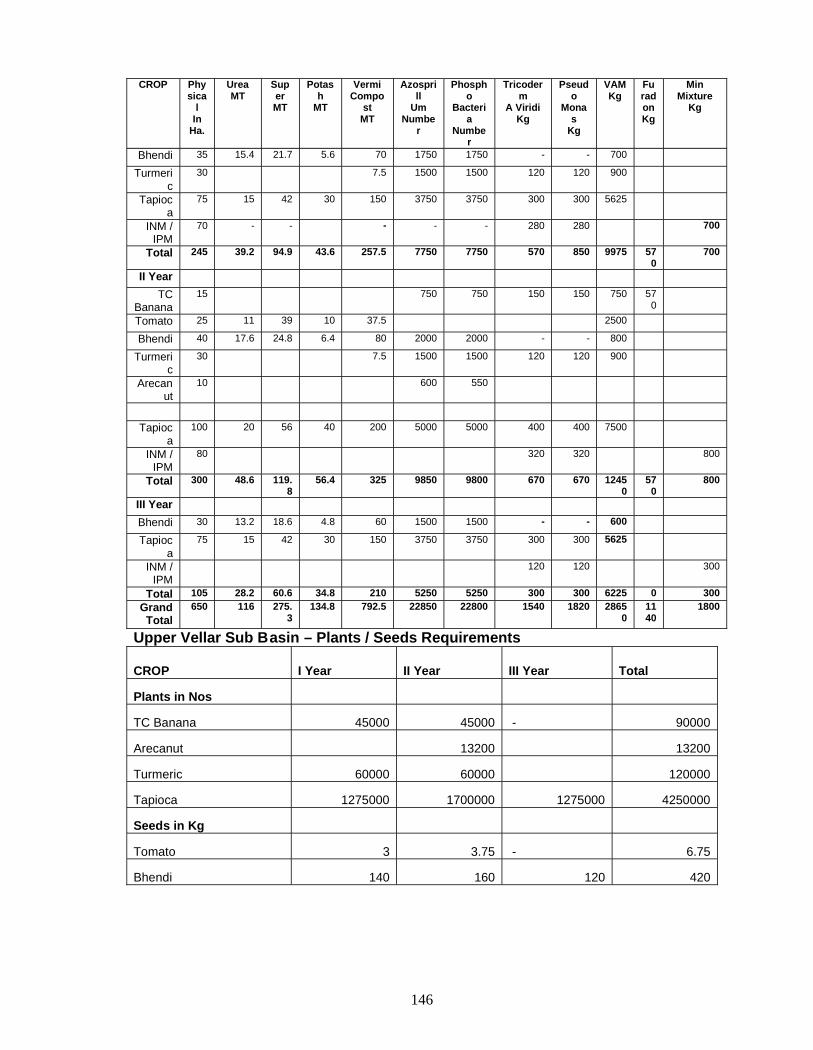
146
CROP Physica
lIn
Ha.
UreaMT
SuperMT
Potash
MT
VermiCompo
stMT
Azosprill
UmNumbe
r
Phospho
Bacteria
Number
Tricoderm
A ViridiKg
Pseudo
Monas
Kg
VAMKg
FuradonKg
MinMixture
Kg
Bhendi 35 15.4 21.7 5.6 70 1750 1750 - - 700
Turmeric
30 7.5 1500 1500 120 120 900
Tapioca
75 15 42 30 150 3750 3750 300 300 5625
INM /IPM
70 - - - - - 280 280 700
Total 245 39.2 94.9 43.6 257.5 7750 7750 570 850 9975 570
700
II YearTC
Banana15 750 750 150 150 750 57
0Tomato 25 11 39 10 37.5 2500
Bhendi 40 17.6 24.8 6.4 80 2000 2000 - - 800
Turmeric
30 7.5 1500 1500 120 120 900
Arecanut
10 600 550
Tapioca
100 20 56 40 200 5000 5000 400 400 7500
INM /IPM
80 320 320 800
Total 300 48.6 119.8
56.4 325 9850 9800 670 670 12450
570
800
III YearBhendi 30 13.2 18.6 4.8 60 1500 1500 - - 600
Tapioca
75 15 42 30 150 3750 3750 300 300 5625
INM /IPM
120 120 300
Total 105 28.2 60.6 34.8 210 5250 5250 300 300 6225 0 300GrandTotal
650 116 275.3
134.8 792.5 22850 22800 1540 1820 28650
1140
1800
Upper Vellar Sub Basin – Plants / Seeds Requirements
CROP I Year II Year III Year Total
Plants in Nos
TC Banana 45000 45000 - 90000
Arecanut 13200 13200
Turmeric 60000 60000 120000
Tapioca 1275000 1700000 1275000 4250000
Seeds in Kg
Tomato 3 3.75 - 6.75
Bhendi 140 160 120 420
147
FISHERIESDEPARTMENT
I AM WARM PROPOSAL
(UPPER VELLAR)
148
FISHERIES DEPARTMENT UPPER VELLAR FISHRIES PROPOSAL
This sub basin with two reservoirs and seventy nine tanks offer good scope for
development of aquaculture. Apart from the natural fisheries (Tilapia, minor carps,
catfishes etc.,) existing in these waters Indian major carps and Exotic carps are also
can be cultured extensively in these tanks. However the culture technology followe d is
stock and capture without any scientific management, or monitoring and hence the unit
production is very low. Another area of concern is lack of extension of scientific
aquaculture practices to the agriculture farmers.
There are no fish seed farms located in this sub basin fish seeds are to be
transported from Mettur Dam. The non -synchronisation of major carp breeding
season (May to July) and receipt of water in the tanks is a major set back which
however can be overcome by establishing fish seed b anks currently the sub basin has
traditional fish marketing facilities which offer reasonable price for the fresh water
fishes.
Considering the above status of the basin the following project proposals
are made.
1. Aquaculture in farm ponds
Farm ponds are been proposed to be excavated in this sub basin by the
Agriculture Engineering Department, primarily as rain water harvesting and storage
tank in the farmers field, without intervening in the irrigation/agriculture activities.
Aquaculture shall be taken up in these ponds in the water retention period of about 4
months Aquaculture input like fish seeds, feed, manure etc., shall be provided to the
farmers and the unit cost is Rs 16,500/ - per pond. By providing a clay layer at the
bottom of the pond, the seepage loss will be minimized. Fish stocking density of 1/m 2
is proposed and the fish seeds will be advanced fingerlings/stock size of 75 g so that
the shorter culture period shall be over comed to get a better production. The
agricultural farmers will get an additional income of about Rs 10,000/ - from this activity
without intervening in the irrigation activity.
In this sub basin it is proposed to excavate 30 Numbers farm ponds in the
farmers field. For this purpose Rs 4.95 lakhs is required, which s hall be spread over
three years.
149
2. Aquaculture in irrigations tanks by establishing fish seed banks
As mentioned earlier the basin do not have any fish seed production center or
seed rearing unit. The tanks in this sub basin shall be supplied with qual ity fish seeds
at the appropriate time if seed banks (fish seed rearing unit) are established in this
basin. The proposed fish seed banks shall rear fish seed from early fry stage to
advanced fingerlings size. The water user Association will own, operat e and maintain
this unit and proposed to supply 3 lakhs fingerlings.
Apart from the direct revenue from sale of fish seeds the fish production of the
basin will substantially increase.
For this purpose An amount of Rs 14.5 lakhs is required.
3. Fish Seed rearing in cages
One unit of cage will consists of 3 cages of different mesh sizes ( p40, P16, P8).Fish seeds will be reared from early fry to advances fingerlings in these cages, that willbe fixed or floated in irrigation tanks having water depth of more than 4 feet in thelakes or in the reservoir. The cages shall be owned operated and maintained by waterusers Association.
One unit of cage shall have an output of about 60,000 numbers of advancesfingerlings worth about Rs 45,000/ - in three operations per season. The fish seed willbe stocked in suitable water bodies of the sub basin for further rearing. For thispurpose , the finance needs is Rs 0.70 lakh.
Fishing Implements.
The fishing implements or fish farm implements will be a supp orting item in fishseeds transport and harvest. The Water Users Association should own theseimplements.
Benefits.
Additional income to the agriculturalists through aquaculture in fish pondswithout intervening in any irrigation (or) agriculture act ivities.
Increase in overall fish production and rate of production.
Timely availability of fish seeds.
Increase in per capita consumption of fish leading to betterhuman health.
150
Herewith enclosed the proforma for Financial requirements, Tem plate, Estimation ofFish seed Bank construction, for the kind perusal and consideration.
UPPER VELLAR - FISHERIES PROPOSAL
S/No Particulars No of
units
1st
year
2nd
year
3rd
year
4th
year
5th
year
Total in
Lakhs
1. Fish seed bank 1 14.50 14.50
Operational 0.58 0.58 1.16
2 Fish seed rearing in
cages
5 0.70 0.70
Operational cost 0.80 0.80
3. Aquaculture in farm
ponds
51 3.30 3.30 1.81 8.41
4 Fishing implement. 5 0.60 0.40 1.00
4. Vehicles hire
charges
0.40 0.40 0.40 0.40 0.40 2.00
5. Documentation 0.10 0.10 0.10 0.10 0.10 0.50
Total 0.50 20.98 4.78 2.31 0.50 29.07
TEMPLATE – FISHERIES
I. EXISTING SCENARIO
1. CULTURE FISHERIES:
(a) Area under culture (WSA) -(b) Production (kg/ha) - 600kg/ha/4-6 months
2. CAPTURE FISHERIES:
(a) Source of exploitation - Tanks in the sub basin.(b) Fish landing per year - 500-1000 kgs/ha/year
II EXISTING AQUACULTURE PARCTICES:
1. INPUTS:
(a) Seed source and species - From Fish seed bank owned byWUA. Indian Major corps andExotic carps.
(b) Manure - Cow dung, super phosphate,urea.
(c) Feed - Ground net oil cake, Rice bran
(d) Extension services available - Government State Fisheries For TOT(Go vt/private)Department.
(e) Quality of water - Good quality of PH 7.5-8.5
(f) No of fisherman co-op.Societies : 16 and No of members ___ : 5752
2. PRACTICES (Area In ha) :
(a) Stock and Capture - 37 PWD lakes
(b) Manure, Stock, Feed, - 3 haMonitor Harvest
(c) Polyculture including scambi(d) Composite fish culture - Compatible Species of
IndianMajor corps and exoticcarps.
(e) Any other type of farming - --
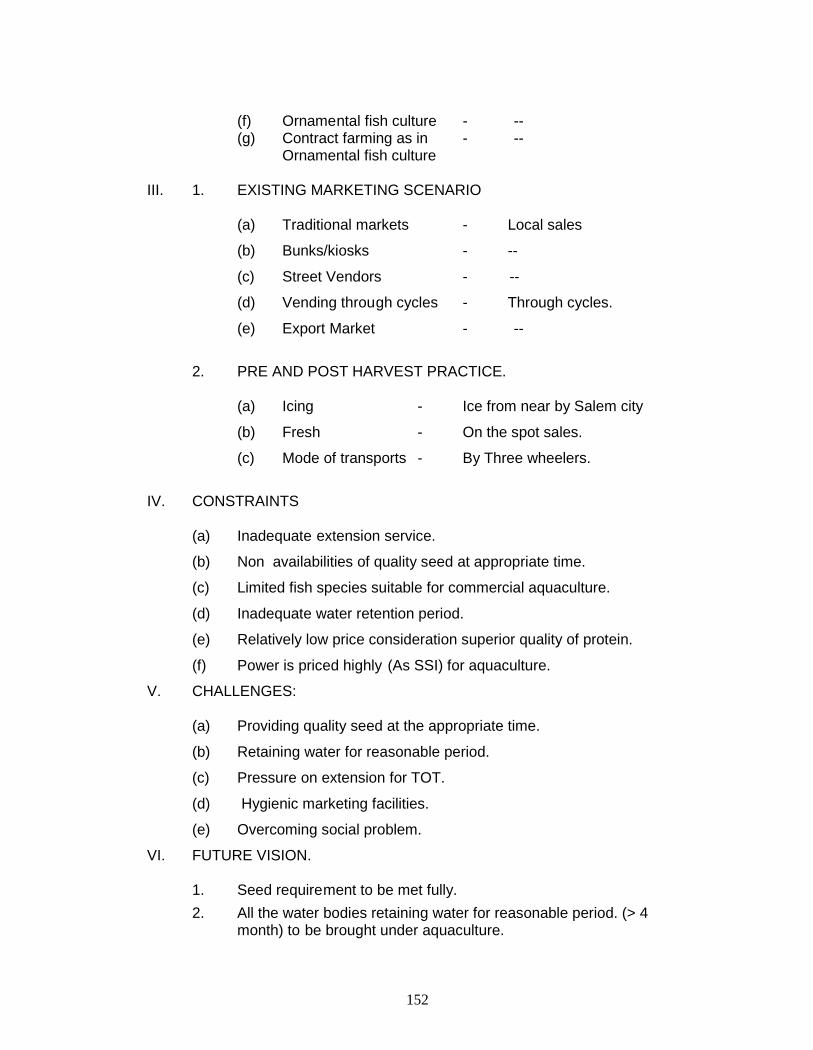
152
(f) Ornamental fish culture - --(g) Contract farming as in - --
Ornamental fish culture
III. 1. EXISTING MARKETING SCENARIO
(a) Traditional markets - Local sales
(b) Bunks/kiosks - --
(c) Street Vendors - --
(d) Vending through cycles - Through cycles.
(e) Export Market - --
2. PRE AND POST HARVEST PRACTICE.
(a) Icing - Ice from near by Salem city
(b) Fresh - On the spot sales.
(c) Mode of transports - By Three wheelers.
IV. CONSTRAINTS
(a) Inadequate extension service.
(b) Non availabilities of quality seed at appropriate time.
(c) Limited fish species suitable for commercial aquaculture.
(d) Inadequate water retention period.
(e) Relatively low price consideration superior quality of protein.
(f) Power is priced highly (As SSI) for aquaculture.
V. CHALLENGES:
(a) Providing quality seed at the appropriate time.
(b) Retaining water for reasonable period.
(c) Pressure on extension for TOT.
(d) Hygienic marketing facilities.
(e) Overcoming social problem.
VI. FUTURE VISION.
1. Seed requirement to be met fully.2. All the water bodies retaining water for reasonable period. (> 4
month) to be brought under aquaculture.
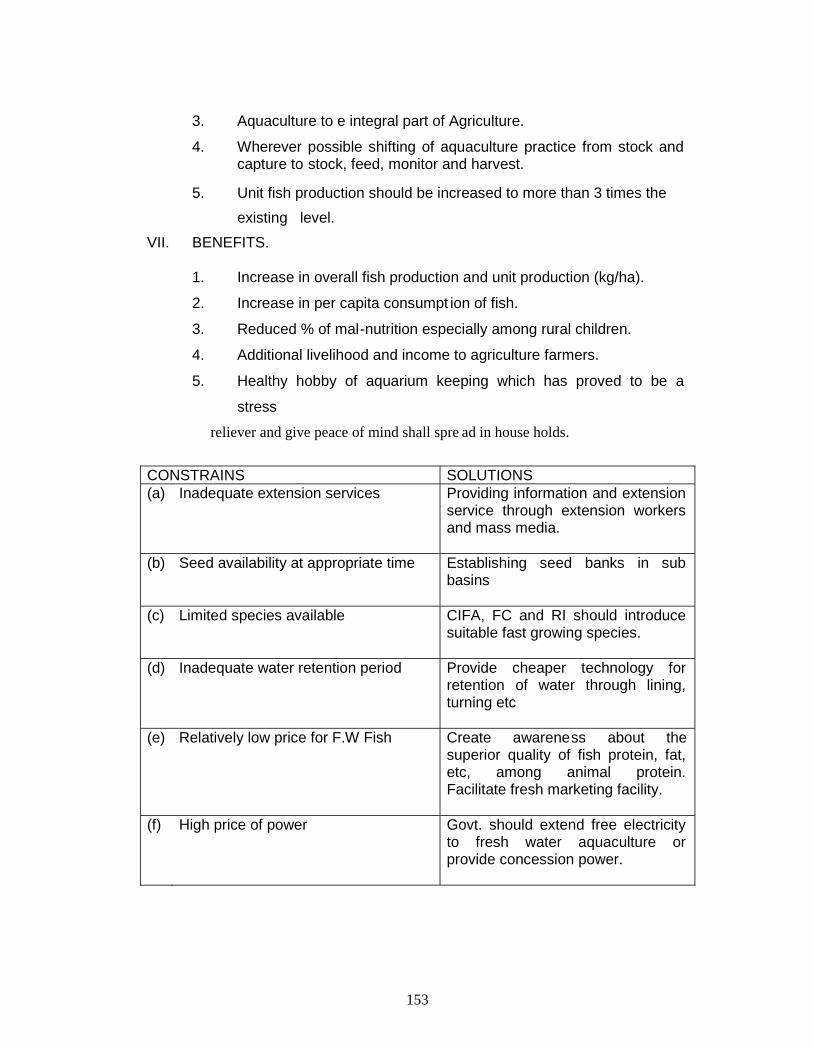
153
3. Aquaculture to e integral part of Agriculture.
4. Wherever possible shifting of aquaculture practice from stock andcapture to stock, feed, monitor and harvest.
5. Unit fish production should be increased to more than 3 times theexisting level.
VII. BENEFITS.
1. Increase in overall fish production and unit production (kg/ha).
2. Increase in per capita consumpt ion of fish.
3. Reduced % of mal-nutrition especially among rural children.
4. Additional livelihood and income to agriculture farmers.
5. Healthy hobby of aquarium keeping which has proved to be a
stress
reliever and give peace of mind shall spre ad in house holds.
CONSTRAINS SOLUTIONS(a) Inadequate extension services Providing information and extension
service through extension workersand mass media.
(b) Seed availability at appropriate time Establishing seed banks in subbasins
(c) Limited species available CIFA, FC and RI should introducesuitable fast growing species.
(d) Inadequate water retention period Provide cheaper technology forretention of water through lining,turning etc
(e) Relatively low price for F.W Fish Create awareness about thesuperior quality of fish protein, fat,etc, among animal protein.Facilitate fresh marketing facility.
(f) High price of power Govt. should extend free electricityto fresh water aquaculture orprovide concession power.
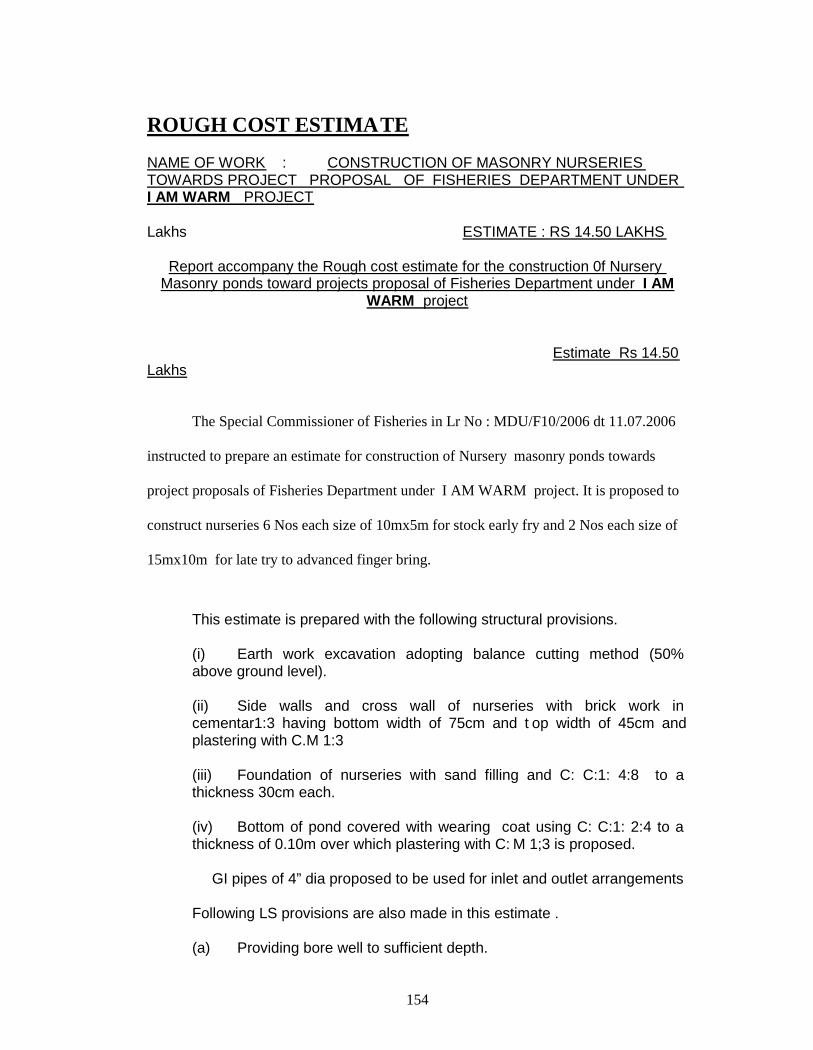
154
ROUGH COST ESTIMATE
NAME OF WORK : CONSTRUCTION OF MASONRY NURSERIESTOWARDS PROJECT PROPOSAL OF FISHERIES DEPARTMENT UNDERI AM WARM PROJECT
Lakhs ESTIMATE : RS 14.50 LAKHS
Report accompany the Rough cost estimate for the construction 0f NurseryMasonry ponds toward projects proposal of Fisheries Department under I AM
WARM project
Estimate Rs 14.50Lakhs
The Special Commissioner of Fisheries in Lr No : MDU/F10/2006 dt 11.07.2006
instructed to prepare an estimate for construction of Nursery masonry ponds towards
project proposals of Fisheries Department under I AM WARM project. It is proposed to
construct nurseries 6 Nos each size of 10mx5m for stock early fry and 2 Nos each size of
15mx10m for late try to advanced finger bring.
This estimate is prepared with the following structural provisions.
(i) Earth work excavation adopting balance cutting method (50%above ground level).
(ii) Side walls and cross wall of nurseries with brick work incementar1:3 having bottom width of 75cm and t op width of 45cm andplastering with C.M 1:3
(iii) Foundation of nurseries with sand filling and C: C:1: 4:8 to athickness 30cm each.
(iv) Bottom of pond covered with wearing coat using C: C:1: 2:4 to athickness of 0.10m over which plastering with C: M 1;3 is proposed.
GI pipes of 4” dia proposed to be used for inlet and outlet arrangements
Following LS provisions are also made in this estimate .
(a) Providing bore well to sufficient depth.
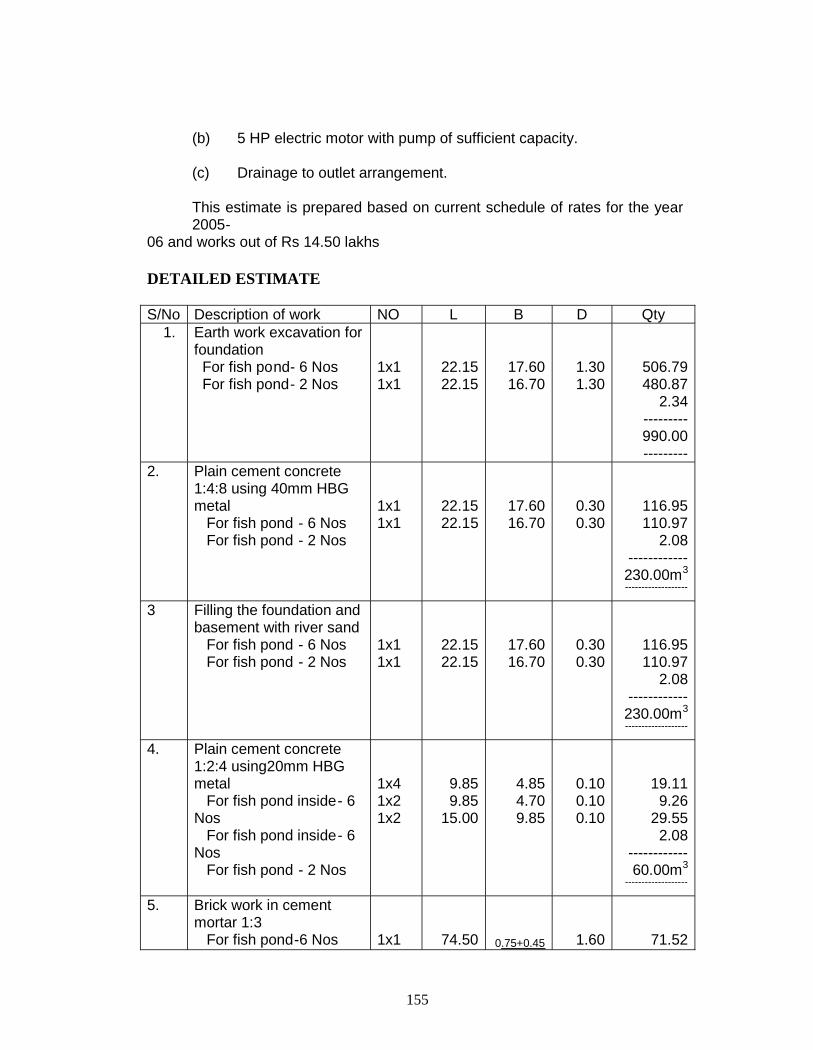
155
(b) 5 HP electric motor with pump of sufficient capacity.
(c) Drainage to outlet arrangement.
This estimate is prepared based on current schedule of rates for the year2005-
06 and works out of Rs 14.50 lakhs
DETAILED ESTIMATE
S/No Description of work NO L B D Qty1. Earth work excavation for
foundation For fish pond- 6 Nos For fish pond- 2 Nos
1x11x1
22.1522.15
17.6016.70
1.301.30
506.79480.87
2.34---------990.00---------
2. Plain cement concrete1:4:8 using 40mm HBGmetal For fish pond - 6 Nos For fish pond - 2 Nos
1x11x1
22.1522.15
17.6016.70
0.300.30
116.95110.97
2.08------------230.00m3
-------------------
3 Filling the foundation andbasement with river sand For fish pond - 6 Nos For fish pond - 2 Nos
1x11x1
22.1522.15
17.6016.70
0.300.30
116.95110.97
2.08------------230.00m3
-------------------
4. Plain cement concrete1:2:4 using20mm HBGmetal For fish pond inside- 6Nos For fish pond inside- 6Nos For fish pond - 2 Nos
1x41x21x2
9.859.85
15.00
4.854.709.85
0.100.100.10
19.119.26
29.552.08
------------60.00m3
-------------------
5. Brick work in cementmortar 1:3 For fish pond-6 Nos 1x1 74.50 0.75+0.45 1.60 71.52

156
outer Alround inner crosswall
-do- For fish pond- 2Nosouter Alround inner crosswall
1x21x3
1x1
1x1
20.455.00
72.30
15.00
2
0.75+0.452
0.75+0.452
0.75+0.452
0.75+0.452
1.60
1.60
1.601.60
39.26
14.40
69.4114.40
3.02------------212.00m3
-------------------
6. Plastering in cementmortar 1:3, 20mm thick For fish pond inside- 6Nos For fish pond inside- 2Nos
1x61x2
30.0050.00
--
1.501.50
270.00150.00
10.00-------------
-330.00m3
--------------------
-
7. Plastering in cementmortar 1:5:12mm thick For fish pond 6 Nos out side & top cross walltop
- do- For fish pond 2 Nos out side & top cross walltop
1x11x21x31x11x1
77.5020.45
5.0075.7015.00
----
0.45
1.750.450.451.75
-
135.6218.40
6.75132.47
6.7510.01
--------------
310.00m3
--------------------
-
8. Floor finishing withC:M:1:3,20mm thick For fish pond -6 Nos For fish pond -2 Nos
1x61x2
10.0015.00
5.0010.00
--
300.00300.00
10.00-------------
-610.00m3
--------------------
-
9. Supplying and fixing of 4”O GI Pipe `B’ class For fish pond 1x8 1.50 - - 12.00
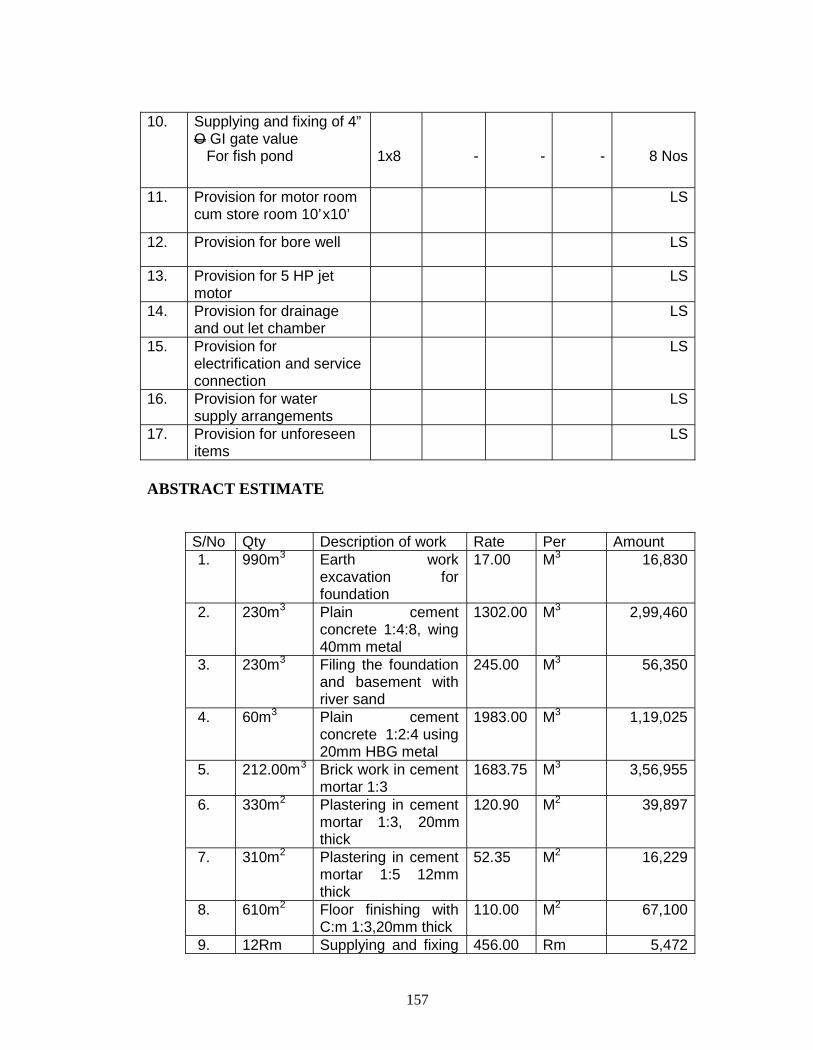
157
10. Supplying and fixing of 4”O GI gate value For fish pond 1x8 - - - 8 Nos
11. Provision for motor roomcum store room 10’x10’
LS
12. Provision for bore well LS
13. Provision for 5 HP jetmotor
LS
14. Provision for drainageand out let chamber
LS
15. Provision forelectrification and serviceconnection
LS
16. Provision for watersupply arrangements
LS
17. Provision for unforeseenitems
LS
ABSTRACT ESTIMATE
S/No Qty Description of work Rate Per Amount1. 990m3 Earth work
excavation forfoundation
17.00 M3 16,830
2. 230m3 Plain cementconcrete 1:4:8, wing40mm metal
1302.00 M3 2,99,460
3. 230m3 Filing the foundationand basement withriver sand
245.00 M3 56,350
4. 60m3 Plain cementconcrete 1:2:4 using20mm HBG metal
1983.00 M3 1,19,025
5. 212.00m3 Brick work in cementmortar 1:3
1683.75 M3 3,56,955
6. 330m2 Plastering in cementmortar 1:3, 20mmthick
120.90 M2 39,897
7. 310m2 Plastering in cementmortar 1:5 12mmthick
52.35 M2 16,229
8. 610m2 Floor finishing withC:m 1:3,20mm thick
110.00 M2 67,100
9. 12Rm Supplying and fixing 456.00 Rm 5,472
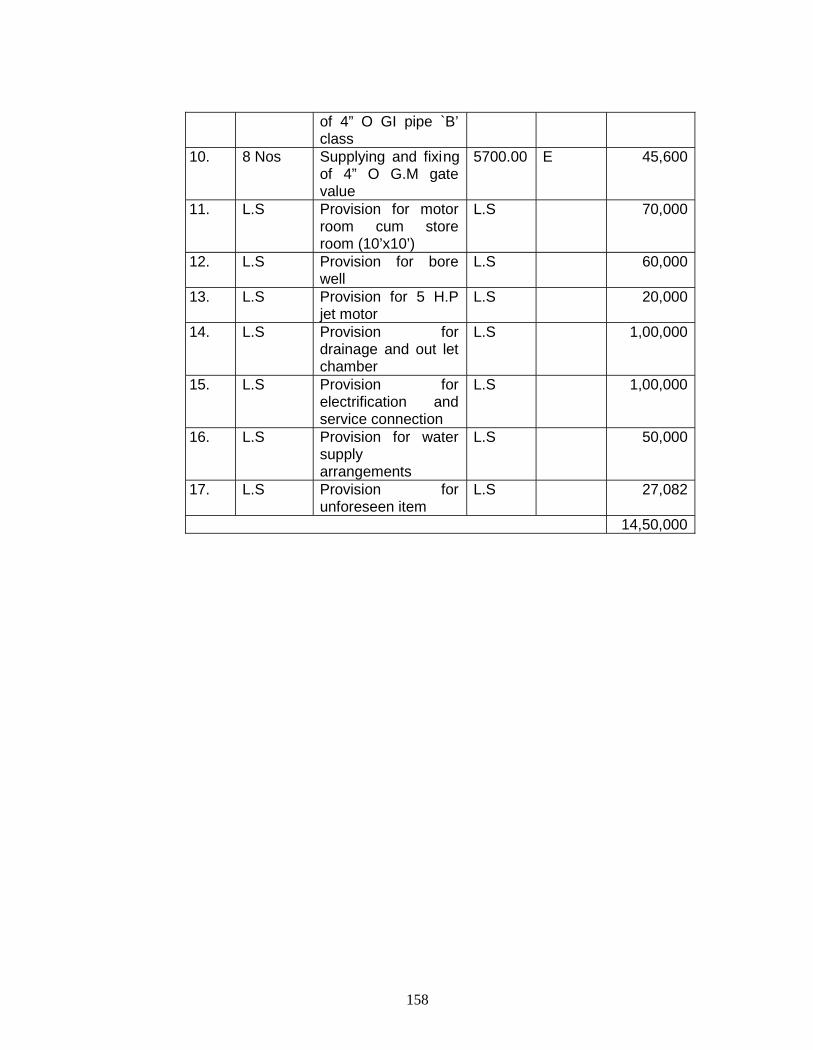
158
of 4” O GI pipe `B’class
10. 8 Nos Supplying and fixingof 4” O G.M gatevalue
5700.00 E 45,600
11. L.S Provision for motorroom cum storeroom (10’x10’)
L.S 70,000
12. L.S Provision for borewell
L.S 60,000
13. L.S Provision for 5 H.Pjet motor
L.S 20,000
14. L.S Provision fordrainage and out letchamber
L.S 1,00,000
15. L.S Provision forelectrification andservice connection
L.S 1,00,000
16. L.S Provision for watersupplyarrangements
L.S 50,000
17. L.S Provision forunforeseen item
L.S 27,082
14,50,000
159
IRRIGATED AGRICULTUREMODERNIZATION AND WATER
RESOURCES MANAGEMENT PROJECT
UPPER VELLAR - SUB-BASIN
IAMWARM
PROPOSAL
SALEM DISTRICT
FOREST DEPARTMENT
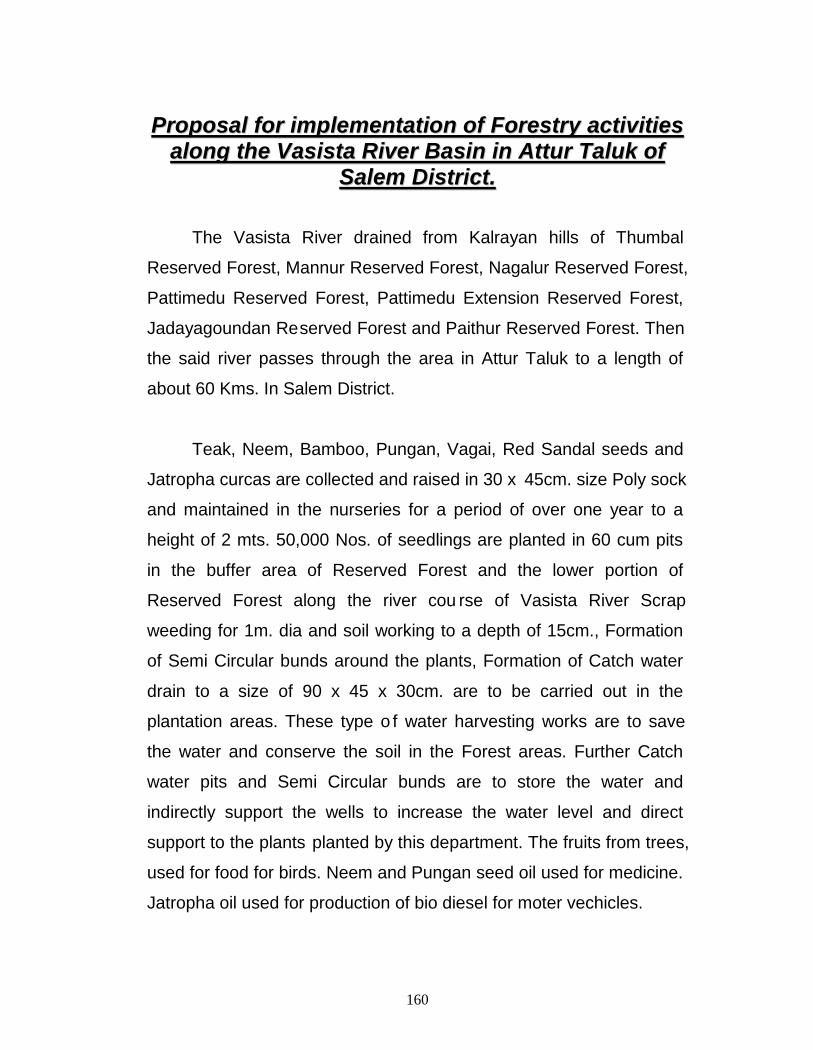
160
PPrrooppoossaall ffoorr iimmpplleemmeennttaattiioonn ooff FFoorreessttrryy aaccttiivviittiieessaalloonngg tthhee VVaassiissttaa RRiivveerr BBaassiinn iinn AAttttuurr TTaalluukk ooff
SSaalleemm DDiissttrriicctt..
The Vasista River drained from Kalrayan hills of Thumbal
Reserved Forest, Mannur Reserved Forest, Nagalur Reserved Forest,
Pattimedu Reserved Forest, Pattimedu Extension Reserved Forest,
Jadayagoundan Reserved Forest and Paithur Reserved Forest. Then
the said river passes through the area in Attur Taluk to a length of
about 60 Kms. In Salem District.
Teak, Neem, Bamboo, Pungan, Vagai, Red Sandal seeds and
Jatropha curcas are collected and raised in 30 x 45cm. size Poly sock
and maintained in the nurseries for a period of over one year to a
height of 2 mts. 50,000 Nos. of seedlings are planted in 60 cum pits
in the buffer area of Reserved Forest and the lower portion of
Reserved Forest along the river cou rse of Vasista River Scrap
weeding for 1m. dia and soil working to a depth of 15cm., Formation
of Semi Circular bunds around the plants, Formation of Catch water
drain to a size of 90 x 45 x 30cm. are to be carried out in the
plantation areas. These type o f water harvesting works are to save
the water and conserve the soil in the Forest areas. Further Catch
water pits and Semi Circular bunds are to store the water and
indirectly support the wells to increase the water level and direct
support to the plants planted by this department. The fruits from trees,
used for food for birds. Neem and Pungan seed oil used for medicine.
Jatropha oil used for production of bio diesel for moter vechicles.
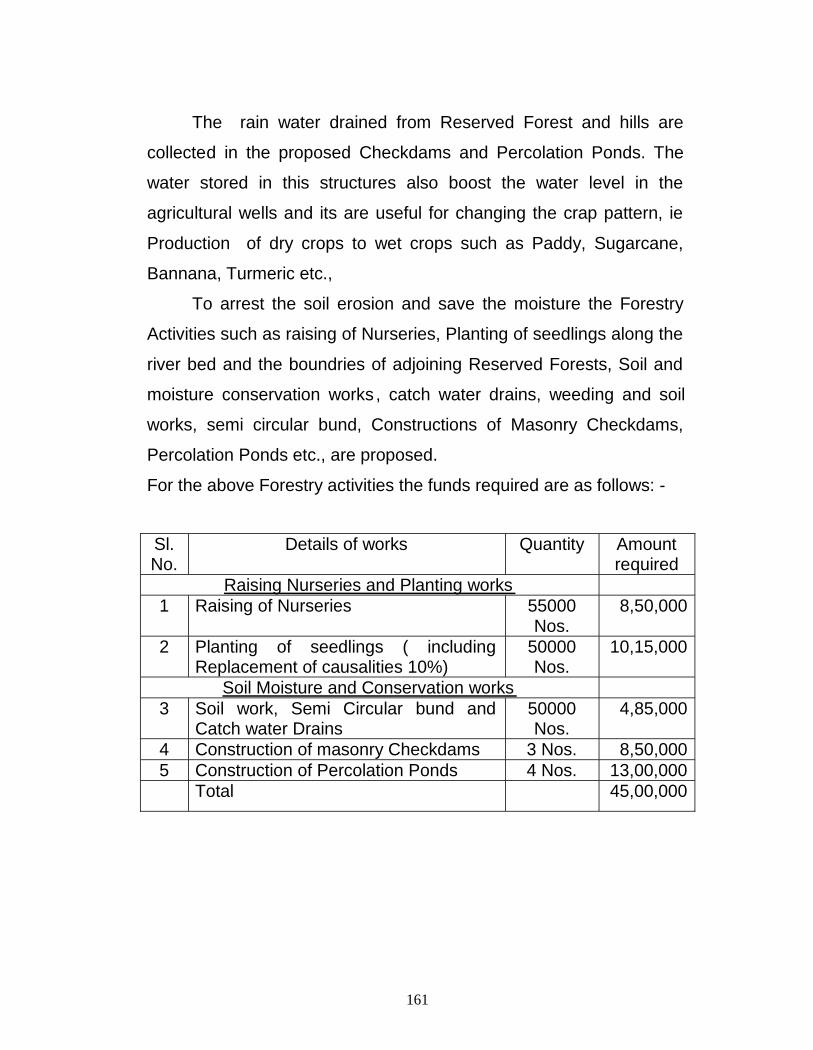
161
The rain water drained from Reserved Forest and hills are
collected in the proposed Checkdams and Percolation Ponds. The
water stored in this structures also boost the water level in the
agricultural wells and its are useful for changing the crap pattern, ie
Production of dry crops to wet crops such as Paddy, Sugarcane,
Bannana, Turmeric etc.,
To arrest the soil erosion and save the moisture the Forestry
Activities such as raising of Nurseries, Planting of seedlings along the
river bed and the boundries of adjoining Reserved Forests, Soil and
moisture conservation works , catch water drains, weeding and soil
works, semi circular bund, Constructions of Masonry Checkdams,
Percolation Ponds etc., are proposed.
For the above Forestry activities the funds required are as follows: -
Sl.No.
Details of works Quantity Amountrequired
Raising Nurseries and Planting works1 Raising of Nurseries 55000
Nos.8,50,000
2 Planting of seedlings ( includingReplacement of causalities 10%)
50000Nos.
10,15,000
Soil Moisture and Conservation works3 Soil work, Semi Circular bund and
Catch water Drains50000Nos.
4,85,000
4 Construction of masonry Checkdams 3 Nos. 8,50,0005 Construction of Percolation Ponds 4 Nos. 13,00,000
Total 45,00,000

162
IRRIGATED AGRICULTUREMODERNIZATION AND WATER
RESOURCES MANAGEMENT PROJECT
UPPER VELLAR - SUB-BASIN
IAMWARM
PROPOSAL
SALEM DISTRICT
ENVIRONMENTAL DEPARTMENT
163
ENVIRONMENTAL COMPONENT OFUPPER VELLAR SUB BASIN FOR IAMWARM PROJECT
INTRODUCTIONThe main activities of the Environmental cell Division, functioning at
Chennai from 1.1.2001 as per the direction of Staff Appraisal Report (SAR)and Mid- Term Review of World Bank are generally classified as below.
1. River Basin Monitoring2. Preparation of Environmental Status Repor t3. Preparation of Environmental Impact Assessment4. Preparation of Environmental Action Plan5. Preparation of Conducting Pilot Studies on Environmental Issues6. Implementing the Eco-restoration works in River Basins7. Conducting Environmental workshops/seminars/m eetings and Public
awareness Programmes
The following river basins are allotted for EAP works for Environmentalcell Division, Chennai which covers 10 districts.
Name of Basin Districts coveredPalar ---- Kancheepuram, Vellore& TiruvannamalaiChennai ---- Chennai, Tiruvallur & KancheepuramPennaiyar ---- Dharmapuri, Tiurvananmalai, Villupuram
& CuddaloreVarahanadhi ---- Kancheepuram, Tiruvannamalai &VillupuramVellar ---- Dharmapuri, Salem, Perambalur,
Villupuram & Cuddalore
Under TNWRCP, with World Bank assistance, special emphasis was givenfor the first time to assess the environmental status and degradation caused forall River basins in Tamilnadu. Accordingly, in these River basins, Environmentalimpact on the quality of surface and Ground water and Soil was studied bycollecting water & soil samples and testing them. Micro level EnvironmentalStatus Reports for all the River basins were prepared and World Bank providedassistance for these works up t o March 2004.
Also few Awareness programs & Workshops were conducted to createawareness on the Environmental issues & remedies among the public, farmers,Govt. officials and NGOs; Seminars and workshops were conducted to find out
164
new techniques and methods developed recently to solve Environmentalproblems.
Now under IAMWARM project, focus is at each sub basin level to identifyand prioritize the requirements for improvements to storage structures,rehabilitation, new schemes for water harvest and diver sification of crops. Forany new schemes or rehabilitation of existing one, consideration of theenvironment issues pertaining to that area and remedial action to overcome theproblems is a must.
DESCRIPTION OF VELLAR RIVER BASIN:1. General
Vellar river basin is a medium river basin of area 7659 sq.km. The Vellar River
originates from the Southern slopes of Kalrayan hills, at the northern boundary of Athur
Taluk of Salem district. In the initial stage, the river is known as Ammapalayam and it
flows in a southwest direction for about 21kms until Kariyakoil joins it. Thereafter the
river attains its name Vellar. The total length of the river is about 150km. The basin
covers partly four districts namely Salem, Perambalur, Villupuram and Cuddalore
districts. Thirty-three blocks are fully or partly covered in this basin. The river Vellar
drains into Bay of Bengal near Porto novo in Chidambaram taluk of Cuddalore district.
The river Vellar is having six tributaries namely Anaimadavu, SwethaNadhi, Kallar, Chinnar, Manimukta nadhi and Gomukhi. There are 7 sub basinsnamely Upper Vellar (or) Vasistanadhi, Gomukhi nadhi, Manimukta nadhi,Swetha nadhi, Chinnar, Anaivari odai and Lower Vellar sub basins.
1.1. Description of Upper Vellar or Vasistanadhi Sub basin:Vasistanadhi originates from the southern slopes of the Kalrayan
hills on the Northern boundary of Athur taluk of Salem district, at analtitude of about 1266 m. At its starting point, it is known as AnaimadavuRiver and flows southwards for 23 km and the n south-eastwards.Anaimadavu reservoir across Anaimadavu River near Valapadi town fallsin this sub basin and its ayacut area is 3980.65 acres. Just three kilometersbelow this point, another tributary known as Thumbal river, formed bytwo drainages Kariyakoil river and Ammapalayam river flowingsouthwards from Kottaipetti pass the Kalrayan hills, joins on the left flank.Another stream called Periyar originating in Javvathu Reserve Forest inSalem taluk joins this stream. As Periyar approaches Salem -Athur road it

165
bends eastwards and receives on the south the Singipuram River.Vasistanadhi then flows towards southeast for about 26 km along theboundary between Attur and Perambalur taluk of Trichy district on theone side and Kallakurichi and Virudhachalam taluks on the other. NearPeraiyur in the Perambalur taluk Swethanadhi joins it 4 km to the west ofthe Chennai Trichy National Highway near Tholudur in VillupuramDistrict. In the reach between the confluence points of Singipuram andSwethanadhi with Vasistanadhi, the tributaries Kallar and Saval Odai onthe left flank and Chittar, Koraiyar, Manjani Odai and Ellar Odai on theright flank join the Vasistanadhi. The drainage area upto the confluencewith the Swethanadhi is 1722 Sq. Km.2. Tanks Polluted by Aquatic Weeds:
An ayacut of 5489 hectare is irrigated in this sub basin through tworeservoirs namely Anaimadavu and Kariyakoil reservoir and 51 tanks.Prosopis Juliflora is found in the tank bunds through out the sub basin andalso found inside the tanks. Some tanks are affected by Ipomoea. The tanksare not severely affected by aquatic weeds.3. Domestic Sewage and Municipal Solid Waste:
Sewage is not being treated by the Municipality or Town Panchayats inthis sub basin. The one and only municipali ty available in this sub basin is Athurand its population is 58150. Athur municipality disposes the sewage at variouspoints in Vasistanadhi in Athur taluk. Solid waste generated is 21 MT / day anddisposed in the land. Panamarathupatti, Belur, Vazhapadi, Yethapur, Keeripatti,Narasingapuram, Pethanaickenpalayam and Thedavur are the town Panchayatsfalling in this sub basin. The sewage is being leached into the ground or directlyinto the nearby drains and streams. Practically there is no sewage dischar ge ofdomestic effluent in the case of villages and they create non point pollution. It isessential to conduct awareness programmes in the sub basin to avoid domesticpollution in the sub basin. It is also essential to give training to make use ofthe waste as worth manure by Vermicomposting techniques.
Overall, the Tanks / River in the sub basin are not severely affected bydomestic pollution.4. Industries:
The major industry found in this sub basin is Sago industry. Out of 262orange small industries, 192 are sago industries. The effluent generated is let outdirectly into the nearby drains which ultimately reach the River or supply
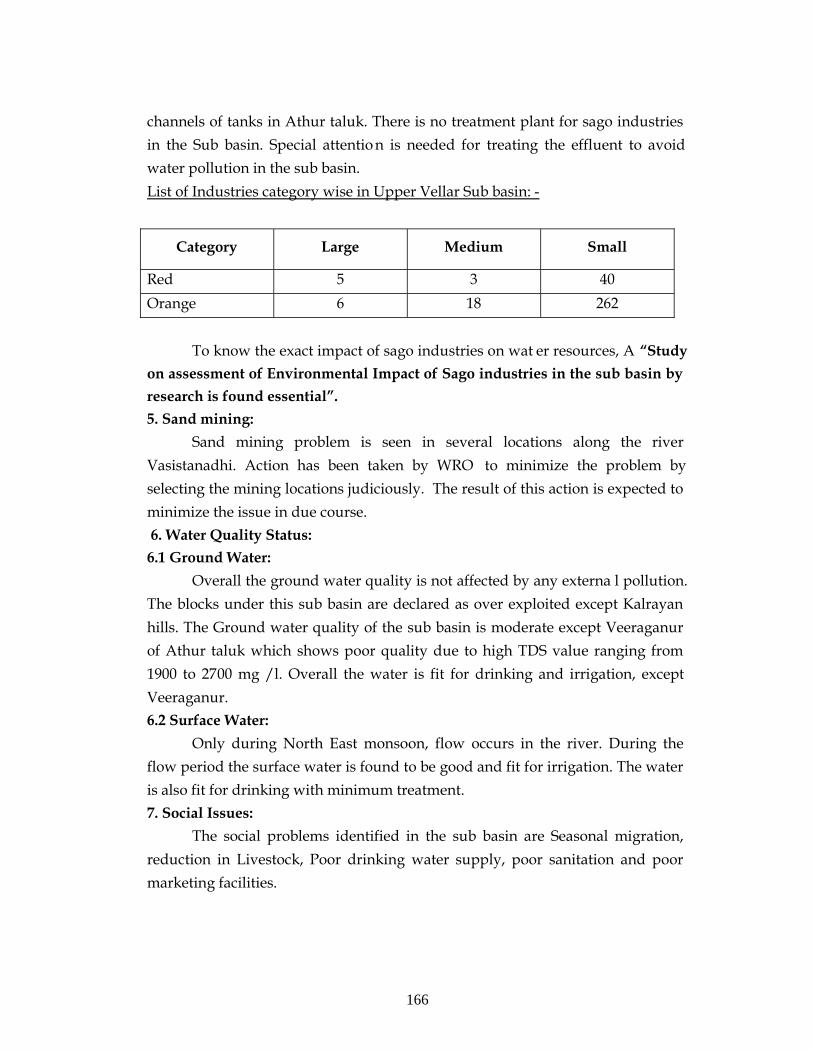
166
channels of tanks in Athur taluk. There is no treatment plant for sago industriesin the Sub basin. Special attentio n is needed for treating the effluent to avoidwater pollution in the sub basin.List of Industries category wise in Upper Vellar Sub basin: -
Category Large Medium Small
Red 5 3 40Orange 6 18 262
To know the exact impact of sago industries on wat er resources, A “Studyon assessment of Environmental Impact of Sago industries in the sub basin byresearch is found essential”.5. Sand mining:
Sand mining problem is seen in several locations along the riverVasistanadhi. Action has been taken by WRO to minimize the problem byselecting the mining locations judiciously. The result of this action is expected tominimize the issue in due course.6. Water Quality Status:
6.1 Ground Water:Overall the ground water quality is not affected by any externa l pollution.
The blocks under this sub basin are declared as over exploited except Kalrayanhills. The Ground water quality of the sub basin is moderate except Veeraganurof Athur taluk which shows poor quality due to high TDS value ranging from1900 to 2700 mg /l. Overall the water is fit for drinking and irrigation, exceptVeeraganur.6.2 Surface Water:
Only during North East monsoon, flow occurs in the river. During theflow period the surface water is found to be good and fit for irrigation. The wateris also fit for drinking with minimum treatment.7. Social Issues:
The social problems identified in the sub basin are Seasonal migration,reduction in Livestock, Poor drinking water supply, poor sanitation and poormarketing facilities.

167
8. ACTIVITIES PROPOSEDTo monitor the quality of water and soil and create database regarding the
environmental status for each sub basin, the following activities are proposed atthe sub basin level.8.1 Collection and testing of water and soil samples:
Water samples were collected and tested in the sub basin at identifiedsampling points regularly from the year 2002. Water samples will be collectedand tested in the identified sampling points and also at polluted tanks in thesub basin. Soil samples will be col lected according to the necessity arising in thesub basin.
Water samples and soil samples were collected in the main river during2005-06. The test results are not received from Ground water and SoilMechanics and Research Division, Chennai due to non -payment of testingcharges.
The Chief Engineer (Plan Formulation) has addressed the Government forthe waiver of testing charges due to Ground Water and SM&R divisions for thesamples taken during 2005-06.
Continuance of collection and testing of wate r samples is essential, asgood and long range data will enable to understand the problems moreprecisely. Hence, now it is proposed to collect and test water samples atidentified points in addition for a period of five years to assess theenvironmental impact on the quality of surface water of this sub basin moreaccurately.
In addition to the above identified locations, water samples will also becollected and tested at regular intervals from tanks and nearby wells to estimatethe level of pollution where sewage is directly let into tanks and channels toassess the impact of pollution on the quality of surface and ground water.
Soil samples are to be collected from the selected locations to assess theimpact on the quality of soil due to various envi ronmental problems like use ofchemical fertilizer and pesticides and using the polluted water. From theselocations, number of samples at regular one year interval has to be collected andtested to determine precisely the impact on the degradation of the quality of thesoil. Therefore testing of soil samples are found essential.
Under this item, following provisions have been made:1. Testing charges for water and soil samples2. Provision of labour charges , purchase of materials, conveyance , hiring
of Jeep driver, computer operator etc.,
168
8.2 Environmental and social knowledge base analysis and developmentVillage level environmental and social data will be collected to dissipate
knowledge amongst villagers for development activities.
8.3Transfer of technical know-how for solid waste management systemincluding source segregation, recycle of dry waste and linkage with useragencies.
Now a new scheme for solid waste management plan is underimplementation in all municipalities and Panchayats. Under thi s scheme,collection tank for disposal and non -disposable garbage have been constructedin most of the local bodies. But recycling the waste and converting the solidwaste into manure and production of energy from them are yet to be come up.
Hence demonstration and action programs are planned with user agenciesand necessary field visits are programmed to transfer of technical know how forsolid waste management system.
8.3 Conducting Environmental and social Awareness meeting, Programme,demonstration and exhibitions on various environmental and social relatedissues including capacity building:
Awareness programmes are essential to create awareness among thepublic about environmental aspects and the action to be taken by them toremove or reduce the impacts due to the environmental problems.
Hence to create and motivate the people, awareness programmes are to beconducted in the villages of the sub basin. It is also proposed to conductawareness meetings in school / institutions and also for WRO officials/ linedepartment officials, conduct workshops at sub basin level and at Region level,provide exposures and field visit to eco friendly practices, during the studyperiod of three years covering the following subjects in addition to placingstickers, tin sheets and pamphlets containing messages about environmentalawareness.
SanitationSolid waste treatmentSewage treatment and converting the same into GasNatural farming ,herbal gardeningConversion of aquatic weeds into manure etc.,
The major problem in the sub basin that requires immediate attention is toavoid industrial pollution mainly due to cluster of sago industries in and aroundAthur.
169
8.4 Total Cost:River basin monitoring and Environmental awareness should be given
throughout the sub basin for conserving the quantity and quality of water. Inorder to achieve this objective, an estimate has been prepared. The estimate costworks out to Rs 20.00 lakhs (Rupees twenty lakhs only).
Copyright © 2022 FDOKUMEN


![Synthesis and Characterization of LiFePO[sub 4] and LiTi[sub 0.01]Fe[sub 0.99]PO[sub 4] Cathode Materials](https://static.fdokumen.com/doc/165x107/631dae063dc6529d5d079742/synthesis-and-characterization-of-lifeposub-4-and-litisub-001fesub-099posub.jpg)