Generalized closed-form models for pull-in analysis of micro cantilever beams subjected to partial...
16
Generalized closed-form models for pull-in analysis of micro cantilever beams subjected to partial electrostatic load Cuong Do*, Maryna Lishchynska, Kieran Delaney, Martin Hill. Department of Electronic Engineering, Cork Institute of Technology, Rossa Avenue, Cork, Ireland * Corresponding author: Tel.: +353 21 43 26180 E-mail: [email protected] Abstract. This work presents a new approach for the pull-in analysis of micro cantilever beams subjected to partial electrostatic actuation. A novel generalized closed-form models for the pull-in instability position and pull-in voltage of a cantilever beam with partial overlap of the beam and fixed actuation electrode is developed. The model benefits from including the effect of non-uniform loading and the fringing field effect into consideration, therefore, no correction factor is required. The accuracy of the model is validated through comparison with Finite Element Method (FEM) simulation results and correlation to within 6.6% error is obtained. The model is also validated against other existing empirical and analytical models and is demonstrated to be of equal accuracy with a more generalized model framework. Keywords: Static pull-in; closed-form; electrostatic actuators; cantilever; partial load. 1. Introduction In microelectromechanical (MEMS) devices electrostatic actuation with large forces available and high energy density is becoming very attractive. It also has better compatibility with integrated circuit (IC) operation than electromagnetic, piezoelectric and electro-thermal actuation. Electrostatic MEMS devices are used in a wide range of application such as switches, sensors and micro-mirrors [1-4]. In an electrostatic actuator, the well-known pull-in phenomenon must be taken into account by device designers. Pull-in results from the quadratic increase in the electrostatic force over the almost linear increase in mechanical restoring force of the beam as the beam-to-electrode gap decreases. The pull-in instability point is the moment at which the attractive electrostatic force exceeds the mechanical restoring force and the stability of the equilibrium is broken. Throughout this paper, the normalized pull-in position is used to describe the tip displacement to initial gap ratio. It is fundamental to the operation of electrostatic MEMS devices as it reduces the stable range of motion in some tuning applications and creates high impact forces for switching applications thus is detrimental to the performance and lifetime reliability of the devices. Modelling and simulation of electrostatic MEMS devices are used in the early design phase to predict the device characteristics including beam deflection and the pull-in instability point. Having a generalized analytical model would provide a clear insight into the physical significance of the design parameters and would be instrumental to an efficient design process. Static pull-in analysis of cantilever beams has been extensively studied in literature. Nathanson et al. [5] simplified a resonant beam as a lumped model and derived the pull-in point at one-third of the gap regardless of the beam structure and the gap distance. The closed-form expression of the pull-in voltage based on the 1/3 (one-third of the gap) was proposed in [5] and is widely used as an example for understanding pull-in instability in MEMS [1]. However, since the general MEMS structure is highly nonlinear, the situation is more complicated than can be described in a simple lumped model. Petersen [3] employed a square-law beam shape to obtain a pull-in position close to 0.5 (half of the gap) under fully distributed electrostatic force. An empirical model presented in [6] was developed by applying data fitting techniques to a large number of datasets. The accuracy within 1.5% of FEM results was obtained for certain conditions. The closed-form model is based on the pull-in point at one-third (1/3) of the gap in accordance with fitting parameters, the real pull-in position was not analysed and the partial electrode was not considered. The model presented in [7] includes the effects of partial electrode configuration into the expression to determine the pull-in voltage for cantilever beams. The obtained results have been compared with ConventorWare simulations with deviation of 3.4% to 11.1% on some cantilever configuration cases. The
Transcript of Generalized closed-form models for pull-in analysis of micro cantilever beams subjected to partial...

Generalized closed-form models for pull-in analysis of micro
cantilever beams subjected to partial electrostatic load
Cuong Do*, Maryna Lishchynska, Kieran Delaney, Martin Hill.
Department of Electronic Engineering, Cork Institute of Technology, Rossa Avenue, Cork, Ireland
* Corresponding author: Tel.: +353 21 43 26180
E-mail: [email protected]
Abstract. This work presents a new approach for the pull-in analysis of micro cantilever beams subjected to partial
electrostatic actuation. A novel generalized closed-form models for the pull-in instability position and pull-in voltage of
a cantilever beam with partial overlap of the beam and fixed actuation electrode is developed. The model benefits from
including the effect of non-uniform loading and the fringing field effect into consideration, therefore, no correction
factor is required. The accuracy of the model is validated through comparison with Finite Element Method (FEM)
simulation results and correlation to within 6.6% error is obtained. The model is also validated against other existing
empirical and analytical models and is demonstrated to be of equal accuracy with a more generalized model
framework.
Keywords: Static pull-in; closed-form; electrostatic actuators; cantilever; partial load.
1. Introduction
In microelectromechanical (MEMS) devices electrostatic actuation with large forces available and high
energy density is becoming very attractive. It also has better compatibility with integrated circuit (IC)
operation than electromagnetic, piezoelectric and electro-thermal actuation. Electrostatic MEMS devices are
used in a wide range of application such as switches, sensors and micro-mirrors [1-4].
In an electrostatic actuator, the well-known pull-in phenomenon must be taken into account by device
designers. Pull-in results from the quadratic increase in the electrostatic force over the almost linear increase
in mechanical restoring force of the beam as the beam-to-electrode gap decreases. The pull-in instability
point is the moment at which the attractive electrostatic force exceeds the mechanical restoring force and the
stability of the equilibrium is broken. Throughout this paper, the normalized pull-in position is used to
describe the tip displacement to initial gap ratio. It is fundamental to the operation of electrostatic MEMS
devices as it reduces the stable range of motion in some tuning applications and creates high impact forces
for switching applications thus is detrimental to the performance and lifetime reliability of the devices.
Modelling and simulation of electrostatic MEMS devices are used in the early design phase to predict the
device characteristics including beam deflection and the pull-in instability point. Having a generalized
analytical model would provide a clear insight into the physical significance of the design parameters and
would be instrumental to an efficient design process.
Static pull-in analysis of cantilever beams has been extensively studied in literature. Nathanson et al. [5]
simplified a resonant beam as a lumped model and derived the pull-in point at one-third of the gap
regardless of the beam structure and the gap distance. The closed-form expression of the pull-in voltage
based on the 1/3 (one-third of the gap) was proposed in [5] and is widely used as an example for
understanding pull-in instability in MEMS [1].
However, since the general MEMS structure is highly nonlinear, the situation is more complicated than
can be described in a simple lumped model. Petersen [3] employed a square-law beam shape to obtain a
pull-in position close to 0.5 (half of the gap) under fully distributed electrostatic force. An empirical model
presented in [6] was developed by applying data fitting techniques to a large number of datasets. The
accuracy within 1.5% of FEM results was obtained for certain conditions. The closed-form model is based
on the pull-in point at one-third (1/3) of the gap in accordance with fitting parameters, the real pull-in
position was not analysed and the partial electrode was not considered.
The model presented in [7] includes the effects of partial electrode configuration into the expression to
determine the pull-in voltage for cantilever beams. The obtained results have been compared with
ConventorWare simulations with deviation of 3.4% to 11.1% on some cantilever configuration cases. The

effective stiffness was approximated based on a uniform load although it is non-uniform for electrostatic
forces. The pull-in position was not analysed but assumed to be 0.45 for all cases of partial lengths.
A capacitance-based analysis was carried out in [8] to analyse the static behaviour of rigid and
deformable electrostatic actuators. Normalized pull-in position and voltage was analysed with partial
electrode on rigid torsion actuators. However, the similar analysis on deformable actuators with partial
electrode was not considered. Normalized pull-in position of the beam with a full length electrode was
reported of around 0.454 to 0.472 for cantilever beams. Furthermore, the pull-in voltage expression for a
deformable cantilever was not explicitly determined due to the presence of a second derivative of a complex
capacitance expression.
Chowdhury et al. [9] developed a simple efficient closed-form model which achieves high accuracy even
for the case of extreme fringing field effect (narrow beams). The approach includes a factor of 0.93 to
compensate the linearization analysis and crude 1/3 pull-in position. However, this compensation factor
might only correct for the fully distributed electrostatic force as it is studied in this case as the effect of
partial electrode was not considered.
It is observed from literature that the existing closed-form models are mainly based on an estimation of
normalized pull-in position, i.e. 1/3 [6, 9] for full electrode or 0.45 [7] for all cases of electrode lengths.
Therefore, correction factors are needed to compensate the final models.
The most accurate model of a specific MEMS device is finite element modelling (FEM) [1]. Numerical
analyses also provide accurate results with faster calculation time than FEM simulation. Many works [10-
13] have been reported using numerical or semi-numerical analysis to calculate the pull-in parameters on a
range of electrostatically actuated cantilever beams with high accuracy. However, these models require some
intensive tools (i.e. Coventor, Matlab), time consuming, and some specific skills. Furthermore, the models
are generally not straightforward compared with a closed-form analytical model.
In this paper, we compare and contrast the use of uniform and non-uniform load for estimating effective
stiffness. The Simpson’s 3/8 rule for integration is employed to derive closed-form model of electrostatically
actuated cantilever beams with partial electrode, with no addition compensation factor. In addition, a
normalized pull-in position versus electrode length is presented. The model takes into account non-uniform
electrostatic load, effects of partial electrodes and fringing field effects.
2. Theoretical study
2.1 Effective stiffness
Cantilever beams with partial electrodes which have been found in many devices [1], for examples MEMS
switches [14, 15]. Accurate modelling of the beam deflection and electrostatic force between the beam and
electrode is the basis for accurate prediction of pull-in behaviour of the devices and this section aims to address
it.
As discussed in the previous section, the approach adopted in the majority of publications has employed a
linear effective stiffness when estimating the pull-in voltage [5-9]. The effective stiffness is considered constant
all over the deflection of the beam. The effective stiffness was generally derived by 2 methods: using an
analytical formula for uniform load [6, 7], or using FEM simulation for small deflections [8]. For both cases,
the effective stiffness is considered to be independent of the deflection of the beam whereas in practice a certain
amount of stiffening occurs and can be a significant factor in beam behaviour. In the former method, the load is
considered uniform, q0, along a partial electrode length le as shown in Fig. 1. The partial load is starting from
the tip.

le
a = le/L
L Electrode
x
y
y(x)y(L)
q0Keff
m
Feg V
+
-
(a) (b)
Fig. 1. (a) Lumped model of a MEMS structure subjected to electrostatic loading. (b) Schematic view of a cantilever beam
under partially distributed uniform load
The effective stiffness for partially distributed uniform load seen at the free-end of the beam is given by [7,
16]
33
3
0linear
eff68
3ˆ
3
2
)(deflection
force
aaL
wtE
Ly
bqK (1)
where w, t are width and thickness of the beam, a is ratio of electrode length (le) over beam length (L). The
effective Young’s modulus E is equal to )1/( 2E , ν is Poisson’s ratio, for wide beams ( tw 5 ), and equal to
E for narrow beams.
For this estimation, at a given value of alpha (a), the effective stiffness is considered constant at any
deflection. However, at deflection y(L), the electrostatic force is non-uniform along the distributed area. This
fact will lead to some level of error in the final approximation of the pull-in voltage which uses equation (1).
The error becomes higher as the gap between the electrode and the beam increases. Hence, including the effect
of non-uniform electrostatic force into the calculation will improve the accuracy of the analytical method. The
schematic of non-uniform distributed loads on a cantilever beam is illustrated in Fig. 2. The start point is from
the beam tip.
L
x
y
qelec(x)y(L)
y(x)
Electrode
dx
g
le
a = le/L
Fig. 2. Schematic view of a cantilever beam under partially distributed non-uniform electrostatic actuation load.
At any position x along the beam and over the electrode, the concentrated load has a magnitude of
xxyg
wVxq d
)(2)(
2
2
0
elec
(2)

where 0 is the permittivity of free space, g is the initial gap, V is the potential between the electrode and the
beam and y(x) is the displacement at location x.
The deflection at the free-end due to this concentrated load is found as [16]
IE
xLxxqLy
ˆ6
3)()(d
2elec
(3)
By integrating over the region of the load, we get the total deflection
L
LL
xxyg
xLx
IE
wVLyLy
a
d
)(
3
ˆ12)(d)(
2
22
0 (4)
where I is the second moment of inertia ( 12/3wtI )
Similarly, integrating equation (2) over the electrode region, the total force is found as
x
xyg
wVxxqF
L
LLl
d)(
1
2d)(
2
2
0
e
elece
a
(5)
The effective stiffness, defined as the total force over the total deflection, at deflection y(L) is derived as
L
LL
L
LL
xxyg
xLx
xxyg
IELy
FLyK
a
a
d)(
3
d)(
1
ˆ6)(deflection
force)(
2
2
2
elinearnon
eff (6)
where y(x) is the shape function of the beam. It is seen in equation (6) that the effective stiffness is non-linear
function of the deflection of the beam.
2.2 Pull-in instability
Equating the electrostatic attractive force with the restoring force due to beam stiffness, the stationary
equilibrium equations of the system can be described as: 0)(effe LyKF . Solving this equation, a static
equilibrium relationship between applied voltage and displacement y(L) can be obtained for both linear and
non-linear effective stiffness as
(i) Linear effective stiffness:
L
LL
xxyg
wL
LIyEV
a
aa d)(
1)68(3
)(ˆ
2
33
0
(7)
(ii) Non-linear effective stiffness:
L
LL
xxyg
xLxw
LIyEV
a
d)(
3
)(ˆ12
2
2
0
(8)
The shape function y(x) of the beam can be approximated by a number functions which have been widely
used in literature, such as:
i) Square-law curvature [3]

)()(
2
LyL
xxy
(9.a)
ii) Cosine trial function [7]
)(2
cos1)( LyL
xxy
(9.b)
iii) FEM extracted function [8]
)(
2786.600185.0/4
127.1656.2)(
2Ly
Lxxy
(9.c)
The order is arranged from low to high accuracy.
Theoretically, taking the derivative of equations (7) and (8) with respect to the beam deflection and setting it
to zero
0
)(d
d
Ly
V, the instability position can be calculated. Substituting this value back into equations (7)
and (8), the pull-in voltage can be found [1, 5].
However, the derivatives are complicated and an explicit solution cannot be found for the shape functions
y(x) listed in equation (9).
As the integrals inside equations (7) and (8) are complicated and cannot be computed analytically for the
shape functions listed in equation (9), a numerical analysis is used to find the voltage and deflection
relationship, as described below.
3. Numerical analysis
A preliminary CoventorWare [17] simulation was carried out to evaluate some shape functions presented in
equations (9). Fig. 3 shows two examples of a =1 and a =0.1. It is seen that at a =0.1, the beam shape from
FEM CoventorWare closes to (9b), while it approaches to (9c) when a =1. Simulation data show that with a full
length electrode (a=1), the shape closes to (9c). The beam shape approaches to (9b) as a is reduced.
0 50 100 150 200-1
-0.8
-0.6
-0.4
-0.2
0
Beam length [µm]
Bea
m d
efle
ctio
n [
µm
]
FEM
Eq. (9c)
Eq. (9b)
Eq. (9a)
0 50 100 150 200-0.8
-0.6
-0.4
-0.2
0
Beam length [µm]
Bea
m d
efle
ctio
n [
µm
]
FEM
Eq. (9c)
Eq. (9b)
Eq. (9a)E=57Gpa
L=200mm
t=3mm
g=2mm
w=50mm
a= 1
V=16V
(a) (b)
E=57Gpa
L=200mm
t=3mm
g=2mm
w=50mm
a= 0.1
V=28V
Fig. 3. Beam shapes comparison between FEM Coventor simulation and 3 shape functions in (9). (a) a =0.1. (b) a =1
Fig. 4 shows the average errors of 2 shape function versus FEM simulations at different values of a. The
errors are calculated as the difference between shape function and FEM over the initial gap (g). It is seen that at
the high value of a (a >0.23), error of shape function in (9c) is smaller than (9b). In general, the error of (9c) is
less than 0.8% for all cases. Therefore, a FEM extracted shape function for a full length electrode (9c) is used as
a general shape function for arbitrary partial electrode. Error is expected due to this assumption. If the structure
is designed with smaller electrode (a <0.23) the shape function shown in (9b) should be used for higher
accuracy

0 0.2 0.4 0.6 0.8 10.2
0.4
0.6
0.8
1
1.2
a
Av
erag
e er
ror
[%]
(9c) vs. FEM Coventor
(9b) vs. FEM Coventor
a=0.23
Fig. 4. Average errors between FEM Coventor simulations and 2 shape functions in (9) versus alpha (a).
Numerical integration is used to compute an approximate solution of the definite integrals in equations (7)
and (8). The trapezoidal rule for numerical integration [18] with a subinterval of 0.01µm is used in this
numerical analysis. Subintervals lower than 0.01µm result in a longer computation time without significant
improvement in accuracy.
To determine the normalized pull-in position, the tip displacement is swept from g to 0 and the voltage
corresponding to that displacement is calculated. The point at which voltage is not increasing anymore and the
solution enters a purely analytical (dashed lines in Fig. 5), not practical, region is the pull-in instability point. It
is the maximum value of the voltage over the tip-gap range. Fig. 5 shows an example of plotting the tip
deflection versus applied voltage at a=1 for both equations (7) and (8) by the described numerical
approximation.
0 1 2 3 4 5 6 70
0.5
1
1.5
2
2.5
Voltage [V]
Gap
hei
ght
[µm
]
Linear Keff
Non-linear Keff
E=80GPa
ν=0.06
L=200µm
w=10µm
t=1µm
g=2.5µm
α= 1
yPI/g=0.442
VPI=4.96
yPI/g=0.535
VPI=5.78
Dashed lines are
unstable region
Fig. 5 . Graph of stable equilibrium voltage versus deflection. Comparison between linear and non-linear effective stiffness
analysis for full load cantilever beams. Properties of the system are shown on the graph.
It is seen in Fig. 5 that the pull-in position (yPI) and voltage (VPI) for linear effective stiffness are higher than
the counterparts for non-linear effective stiffness at a =1. For this full length electrode, the normalized pull-in
position is found as 0.442 with non-linear effective stiffness, whereas, it is 0.535 with linear effective stiffness.
The pull-in voltages are found as 4.96 V and 5.78 V for non-linear and linear stiffness analysis respectively.

A comparisons of the normalized pull-in position and the pull-in voltage using equations (7) and (8) as a
functions of electrode length is shown in Fig. 6 for two different MEMS cantilever designs.
0 0.2 0.4 0.6 0.8 1
60
80
100
120
140
160
0 0.2 0.4 0.6 0.8 1
0.35
0.4
0.45
0.5
0.55
0 0.2 0.4 0.6 0.8 1
0.35
0.4
0.45
0.5
0.55
Pull-in position, linear Keff
Pull-in position, non-linear Keff
Pull-in voltage, linear Keff
Pull-in voltage, non-linear Keff
Pu
ll-i
n v
olt
age
[V]
Pu
ll-i
n p
osi
tio
n [
y PI/g
]
a (a)
0 0.2 0.4 0.6 0.8 14
6
8
10
12
0 0.2 0.4 0.6 0.8 10.3
0.35
0.4
0.45
0.5
0.55
0.6
0 0.2 0.4 0.6 0.8 10.3
0.35
0.4
0.45
0.5
0.55
0.6Pull-in position, linear K
effPull-in position, non-linear K
effPull-in voltage, linear K
effPull-in voltage, non-linear K
eff
Pu
ll-i
n v
olt
age
[V]
Pu
ll-i
n p
osi
tio
n [
y PI/g
]
α (b)
Fig. 6. Comparison between linear and non-linear effective stiffness analysis for different electrode lengths of cantilever
beams. (a) E=57GPa, =0.33, g=1µm, w=50µm, L=100µm, t=6µm. (b) E=80GPa, =0.06, g=2.5µm, w=10µm, L=200µm,
t=1µm.
Fig. 6 shows that the discrepancy between equation (7) with linear Keff and equation (8) with non-linear Keff
is biggest at full load (a =1). As a approaches zero the solution converges to the point load solution, as
expected.
Interesting to note from Fig. 6 is that the normalized pull-in position curve does not change for different
properties of the system. The normalized pull-in positions vary around 0.333 at a ~0 to 0.442 for equation (8)
or 0.535 for equation (7) at a =1 regardless of the beam properties. This result agrees with the explicit solution
for lumped system as described in [1, 5] that the pull-in position is independent of spring stiffness.
Apart from that, as seen on Fig. 6, in both cases, the pull-in voltage drops significantly as a increases from 0
to 0.5. However, from a =0.6 to a =1, the pull-in voltage slightly increases for linear stiffness analysis, while it
is still dropping, gradually, with non-linear stiffness analysis.
In order to evaluate the accuracy of the developed theories, a FEM simulation using CoventorWare software
[17] was carried out. Fig. 7 shows the pull-in position and pull-in voltages calculated by the FEM analysis and
numerical calculation using equations (7) and (8). The pull-in voltages and positions are derived by performing
CoSolve FEA for different electrode lengths. The FEM pull-in position data is not smooth which is believed to
be due to the meshing and resolution of the solver. However, the FEM pull-in position follows the trend of the
non-linear stiffness analysis.

Pull
-in
posi
tion [
y PI/g
]
a0 0.2 0.4 0.6 0.8 1
0.35
0.4
0.45
0.5
0.55FEM CoventorNon-linear K
eff analysis
Linear Keff
analysis
yPI/g=0.3333+0.2125α+0.0623α2
-0.3315α3+0.1672α4
(a)
Pu
ll-i
n v
olt
age
[V]
a0 0.2 0.4 0.6 0.8 115
20
25
30
35
40FEM CoventorNon-linear K
eff analysis
Linear Keff
analysis
(b)
Fig. 7. Comparison between analysis based on proposed models and FEM simulation for different electrode lengths of
cantilever beams, E=57GPa, =0.33, g=2µm, w=50µm, L=200µm, t=3µm. (a) Pull-in position; (b) Pull-in voltage.
It is observed that the largest error is found in the analysis using linear effective stiffness method as a
approaches unity. The drawback of linear effective stiffness approximation is seen clearly in Fig. 7. The
assumption of a linear effective stiffness leads to a physically incorrect perception that, the pull-in voltage at
a=0.5 is lower than the pull-in voltage at a =1. This method also leads to a high error in the prediction of the
pull-in position, especially for the full electrode case.
The calculation using a non-linear effective stiffness agrees well with the FEM data for both position and
voltage analysis. As it improves the model accuracy, a non-linear effective stiffness will be assumed in the
remainder of this work.
A small mismatch found between this analysis and the FEM results is believed to be due to the fringing field
effect [6] which was not included in equation (8). With the fringing field effect neglected, the curve of
normalized pull-in position yPI/g versus a is fixed regardless of beam properties. The fitted curve for non-linear
Keff analysis is:
432PI 1672.03315.00623.02125.03333.0 aaaa g
y (10)
As equation (10) is derived using the FEM extracted shape for a full length electrode (9.c) some error is
expected due to the slight changes in the real shape of cantilever beam with different partial electrode lengths
(a). Furthermore, the fringing field effect also affects the pull-in position [8]. However, equation (10) would
provide a reasonably high approximation of the pull-in position for a device with partial electrode overlap. It is

seen that, at a very short electrode length a0, the pull-in position approaches 1/3 of gap which is similar to
the parallel plate capacitor model [1, 5].
Fringing field effect:
For large w/g ratio, the fringing fields can be neglected. However, when the w/g ratio is below 3 the fringing
field component should be considered. An empirical formula for the capacitance between VLSI on-chip
interconnects as employed in [9] would accurately quantify the fringing field effect between the electrode and
the beam. The expression is too complicated to apply in this analysis and a simplified approximation by
changing the effective beam width is employed in this work.
The fringing field approximation expression is given by [6, 7]
w
ggLyww
/)(165.01
eff (11)
Adding the fringing field effect equation (8) becomes
L
LL
dxxyg
xLxw
LIyEV
a
2
2
eff0
)(
3
)(ˆ12 (12)
An analysis of the effect of the fringing field on pull-in has shown a similar variation to that described in [8].
The w/g ratio variation from 16 to 2 causes 5% variation in pull-in position
4. Generalized closed-form model
As described in the previous section, equation (10) is a good approximation to detect the pull-in position
(yPI) of the cantilever beam with a partial electrode. Using the value for yPI found using equation (10) in
equation (12), the pull-in voltage (VPI) can be found. Solving equation (12) numerically is not a big challenge in
Matlab or any other programming language (C, Fortran, etc.). However, a closed-form expression is desirable to
reduce calculation time, simplify the calculation and give a quick analytical insight in to the influence of design
parameters on the cantilever pull-in.
With the FEM extracted shape function, it is difficult to find an explicit solution for the integral term in
equation (12). On the other hand, this integral can be accurately approximated by using a Simpson’s 3/8 rule,
which is given by [18]
b
a
bfba
fba
fafab
dxxf )()3
2(3)
3
2(3)(
8)( (13)
The error of this approximation depends on the function f(x) and the interval [a, b] [18]. Accordingly, higher
error is expected as the electrode length increases.
Applying the Simpson’s 3/8 rule, equation (13), in equation (12), in addition with yPI found in equation (10),
a closed-form expression for the pull-in voltage of a cantilever beam with partially distributed electrostatic
force can be found as:
)()3
3(3)
3
23(3)(
8
12
eff0
PI
PI
LLfLL
fLL
fLfL
w
IyEV
aaaa
(14)
with
432
PI1672.03315.00623.02125.03333.0 aaaa gy
w
ggyww
)1(65.01 PI
eff

2
2
))((
)3()(
xyg
xLxxf
2786.600185.0/4
127.1656.2)(
2PI
Lxyxy
5. Model validation and discussions
Fig. 8 shows a comparison of the new closed-form model developed in this paper with FEM simulation
using CoventorWare and the model presented in [7] for various lengths of electrode. The comparison shows
that the proposed model agrees very well with the data obtained from Coventor simulation. Both models
converge when the electrode length becomes shorter. However, at the value of a from 0.6 to 1, the model
presented in [7] deviates from FEM simulation. The pull-in voltage gradually reduces as the electrode length
increases from 0.6 to 1, while it is predicted to increase slightly in the model in [7]. A similar issue was
observed in the previous section of this paper for linear effective stiffness analysis. Hence, the calculation of
effective stiffness based on uniform load which was employed in [7] is believed to be the cause of this
deviation.
0.2 0.4 0.6 0.8 115
16
17
18
19
20
21
22FEM CoventorEquation (14)
Ref [7]
Pu
ll-i
n v
olt
age
[V]
a
E=57GPa, ν=0.33
L=200µm, w=50µm
t=3µm, g=2µm
Fig. 8. Pull-in voltage comparison for difference electrode length
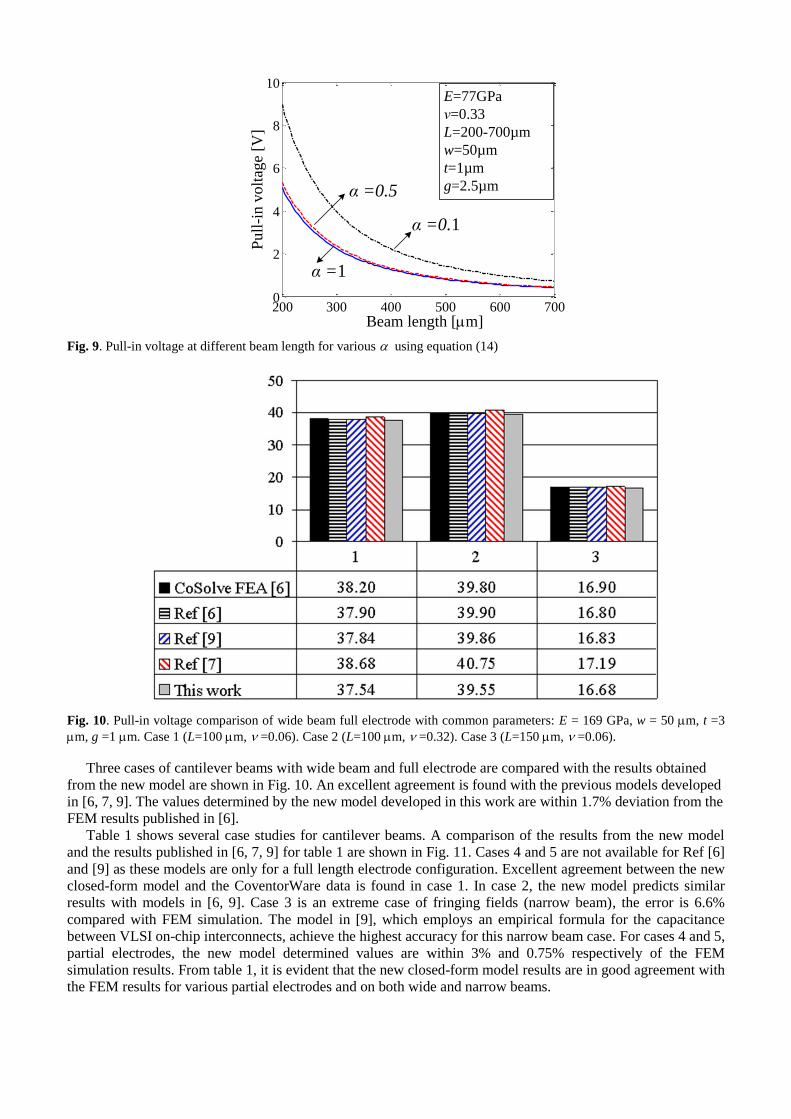
The influence of the beam length on the pull-in voltage at several partial loads is showed in Fig. 9. It is noted
that the pull-in voltage does not increase significantly as the partial electrode size is reduced from full length
(a=1) to half length (a=0.5). Fig. 8 in accordance with Fig. 9 could provide a useful insight for the initial
design phase of MEMS device. The optimal electrode length is around 0.5 to 1 of the beam length over which
range the pull-in voltage does not change significantly. The pull-in voltage increases significantly as a< 0.5
200 300 400 500 600 7000
2
4
6
8
10
Pu
ll-i
n v
olt
age
[V]
Beam length [mm]
E=77GPa
ν=0.33
L=200-700µm
w=50µm
t=1µm
g=2.5µm
α =1
α =0.5
α =0.1
Fig. 9. Pull-in voltage at different beam length for various ausing equation (14)
Fig. 10. Pull-in voltage comparison of wide beam full electrode with common parameters: E = 169 GPa, w = 50 mm, t =3
mm, g =1 mm. Case 1 (L=100 mm, =0.06). Case 2 (L=100 mm, =0.32). Case 3 (L=150 mm, =0.06).
Three cases of cantilever beams with wide beam and full electrode are compared with the results obtained
from the new model are shown in Fig. 10. An excellent agreement is found with the previous models developed
in [6, 7, 9]. The values determined by the new model developed in this work are within 1.7% deviation from the
FEM results published in [6].
Table 1 shows several case studies for cantilever beams. A comparison of the results from the new model
and the results published in [6, 7, 9] for table 1 are shown in Fig. 11. Cases 4 and 5 are not available for Ref [6]
and [9] as these models are only for a full length electrode configuration. Excellent agreement between the new
closed-form model and the CoventorWare data is found in case 1. In case 2, the new model predicts similar
results with models in [6, 9]. Case 3 is an extreme case of fringing fields (narrow beam), the error is 6.6%
compared with FEM simulation. The model in [9], which employs an empirical formula for the capacitance
between VLSI on-chip interconnects, achieve the highest accuracy for this narrow beam case. For cases 4 and 5,
partial electrodes, the new model determined values are within 3% and 0.75% respectively of the FEM
simulation results. From table 1, it is evident that the new closed-form model results are in good agreement with
the FEM results for various partial electrodes and on both wide and narrow beams.

Table 1 Five cases for comparison in Fig. 11 of cantilever beams (wide and narrow beam, partial electrode), with common
parameters E = 77 GPa, =0.33.
Case L(mm) w(mm) t(mm) g(mm) a
1 300 50 1 2.5 1
2 500 50 1 2.5 1
3 300 0.5 1 2.5 1
4 300 50 1 2.5 0.5
5 300 50 1 2.5 0.1
Fig. 11. Pull-in voltage comparison of 5 cases in table 1.
0 5 10 15 200
20
40
60
80
100Ref [7]Ref [9]
This work
Pu
ll-i
n v
olt
age
[V]
g/t
E=57GPa, ν=0.33
L=200µm, w=60µm
t=1µm, a=1
Fig. 12. Pull-in voltage comparison for different ratio of gap space to the beam thickness (g/t).

Fig. 12 shows the comparison of this work with the models in [7, 9] for different gap to beam thickness
ratios. There is negligible difference between the pull-in voltages determined by this work and the model
presented in [9]. As the ratio increases, the results predicted by model [7] begin to deviate from the other two
models.
The shape function y(x) used in (14), which was extracted from FEM simulation in [8], is for full electrode
case (a=1). In the FEM simulations of this work, we observed that the beam shape slightly changes as a
reduces. The shape function closes to Cosine function (9.b) as a closes to 0. Therefore in the case that a is
small, the Cosine function (9.b) can be used y(x) in (14) for a higher accuracy result.
Furthermore, the method to derive (14) can be employed for any other cases that have different beam shapes
under electrostatic actuation. If the beam shape function is known, a normalized pull-in position yPI/g similar to
(10) can be found. Then, equation (14) is changed accordingly for the closed-form solution.
For narrow beams with extreme fringing field effects, higher errors relative to FEM results are found in this
work compared to the model in [9]. This is believed to be due to the employment of an approximation of the
effects of fringing fields in the system as a strip line conductor with zero thickness over infinite ground plane
[6, 7]. A higher approximation of fringing field effects, i.e. the empirical formula used in [9], might be included
to improve the accuracy.
6. Summary
A novel generalized closed-form model for pull-in position and pull-in voltage for the electrostatically
actuated cantilever beam with partial electrode overlap has been derived. The pull-in position is numerically
calculated and interpolated to obtain an empirical formula for normalized pull-in position as a function of
partial electrode length. The closed-form pull-in voltage expression is derived by employing Simpson’s 3/8 rule
for an implicit integral. The model accounts for non-uniform distributed electrostatic force, partial electrode
configuration and fringing field effects. The model is solely an analytical expression with no compensation
factors required as have been used in previous works. The developed model exhibits high accuracy for the pull-
in voltage calculation in wide and narrow beams with partial electrode overlap. Future works will employ the
method used in this work to an analysis of the pull-in instability on partial electrode fixed-fixed beams. A
similar analysis will be utilized to design MEMS devices with high travel range and MEMS switches without
pull-in instability issue.
References [1] G.M. Rebeiz, RF MEMS Theory, Design and Technology, John Wiley and Sons, New Jersey, 2003.
[2] K. Petersen, Silicon as a mechanical material, Proceedings of the IEEE 70(1982) 420-457.
[3] K. Petersen, Dynamic micromechanics on silicon: techniques and devices, IEEE Trans. Electron Dev. 25
(1978) 1241–1250.
[4] J. Bryzek, S. Roundy, B. Bircumshaw, C. Chung, K. Castellino, J.R. Stetter, M. Vestel, Marvelous
MEMS, IEEE Circuits and Devices Magazine 22 (2006) 8-28.
[5] H.C. Nathanson, W.E. Newell, R.A. Wickstrom, J.R. Davis, The resonant gate transistor, IEEE Trans.
Electron Dev. 14 (1967) 117–133.
[6] P.M. Osterberg, S.D. Senturia, M-TEST: a test chip for mems material property measurement using
electrostatically actuated test structures, J. Microelectromech. Syst. 6 (1997) 107–118.
[7] S. Pamidighantam, R. Puers, K. Baert, H.A.C Tilmans, Pull-in voltage analysis of electrostatically actuated
beam structure with fixed-fixed and fixed-free end conditions, J. Micromech. Microeng. 12 (2002) 458-
464.
[8] J. Cheng, J. Zhe, X. Wu, Analytical and finite element model pull-in study of rigid and deformable
electrostatic microactuators, J. Micromech. Microeng. 14 (2004) 57-68.
[9] S. Chowdhury, M. Ahmadi, W.C. Miller, A closed-form model for the pull-in voltage of electrostatically
actuated cantilever beams, J. Micromech. Microeng. 15 (2005) 756-63.
[10] O. Bochobza-Degani, Y. Nemirovaski, Modeling the pull-in parameters electrostatic actuators with a novel
lumped two degrees of freedom pull-in model, Sens. Actuators A 97–98 (2002) 569–578.
[11] Y. Zhang, Y. Zhao, Numerical and analytical study on the pull-in instability of micro-structure under
electrostatic loading, Sens. Actuators A 127 (2006) 366–380.
[12] M. Rahaeifard, M.H. Kahrobaiyan, M. Asghari, M.T. Ahmadian, Static pull-in analysis of microcantilevers
based on the modified couple stress theory, Sensors and Actuators A 171 (2011) 370– 374.

[13] K.S. Ou, K.S Chen, T.S Yang, S.Y. Lee, A Novel Semianalytical Approach for Finding Pull-In Voltages
of Micro Cantilever Beams Subjected to Electrostatic Loads and Residual Stress Gradients, J.
Microelectromech. Syst. 20 (2011) 527-537.
[14] Z.J. Guo, N.E. McGruer, G.G. Adams, Modeling, simulation and measurement of the dynamic
performance of an ohmic contact, electrostatically actuated RF MEMS switch, J. Micromec. Microeng. 17
(2007) 1899-1909.
[15] C. Do, M. Hill, M. Lishchynska, M. Cychowski, K. Delaney, Modeling, simulation and validation of the
dynamic performance of a single-pole single-throw RF-MEMS contact switch, Proc. EurosimE 2011.
[16] J.M. Gere, B.J. Goodno, Mechanics of materials, seventh ed., Cengage Learning, 2008.
[17] CoventorWare version 2010 Coventor, Inc. User Manual.
[18] P.J Davis, P. Rabinowitz, Methods of numerical integration, New York, Academic Press, 1975.

Figure Legends
Fig. 1. (a) Lumped model of a MEMS structure subjected to electrostatic loading. (b) Schematic view of a cantilever beam under
partially distributed uniform load
Fig. 2. Schematic view of a cantilever beam under partially distributed non-uniform electrostatic actuation load.
Fig. 3.
Beam shapes comparison between FEM Coventor simulation and 3 shape functions in (9). (a) a =0.1. (b) a =1
Fig. 4.
Average errors between FEM Coventor simulations and 2 shape functions in (9) versus alpha (a).
Fig. 5 .
Graph of stable equilibrium voltage versus deflection. Comparison between linear and non-linear effective stiffness
analysis for full load cantilever beams. Properties of the system are shown on the graph.
Fig. 6.
Comparison between linear and non-linear effective stiffness analysis for different electrode lengths of cantilever beams.
(a) E=57GPa, =0.33, g=1µm, w=50µm, L=100µm, t=6µm. (b) E=80GPa, =0.06, g=2.5µm, w=10µm, L=200µm, t=1µm.
Fig. 7. Comparison between analysis based on proposed models and FEM simulation for different electrode lengths of cantilever
beams, E=57GPa, =0.33, g=2µm, w=50µm, L=200µm, t=3µm. (a) Pull-in position; (b) Pull-in voltage.
Fig. 8.
Pull-in voltage comparison for difference electrode length
Fig. 9.
Pull-in voltage at different beam length for various ausing equation (14)
Fig. 10.
Pull-in voltage comparison of wide beam full electrode with common parameters: E = 169 GPa, w = 50 mm, t =3 mm, g =1
mm. Case 1 (L=100 mm, =0.06). Case 2 (L=100 mm, =0.32). Case 3 (L=150 mm, =0.06).
Fig. 11.
Pull-in voltage comparison of 5 cases in table 1.
Fig. 12.
Pull-in voltage comparison for different ratio of gap space to the beam thickness (g/t).

Author biographies
Cuong Do received B.Sc. in Electronics and Telecommunication from Hanoi National University, Vietnam in 2004, and
M.Eng. in Electronics from Chungbuk National University, Korea in 2007. He is currently working towards the PhD
degree in Electronics in Cork Institute of Technology, Ireland. His research focuses on design, model and control
methodologies of MEMS devices.
Maryna Lishchynska received a M.Sc. in Applied Mathematics from Lviv Polytechnic State University, Ukraine, in
1993, and was awarded Ph.D. in Technical Sciences (Solid Mechanics) from the Institute of Physics and Mechanics
(Ukraine) in 2000. Dr Lishchynska’s PhD research was in the area of deformable solid mechanics (fatigue fracture).
During 2000-2001 she worked as a research scientist on fracture mechanics problems for the Institute of Physics and
Mechanics (Ukraine) and published a range of papers. During 2003-2008 Dr. Lishchynska worked as a researcher in
Theory, Modelling and Design Centre at Tyndall National Institute (Cork, Ireland). Her research there focused on FEM
modelling and analysis for optimal MEMS design and behavioural modelling of microsystems. During 2008-2010 Maryna
worked as a researcher at NIMBUS Centre for Embedded Systems Research (Cork Institute of Technology, Ireland) where
her research concentrated on computational modelling for smart systems and augmented materials. Dr. Lishchynska has
authored over 20 journal publications and over 30 conference publications. Since 2011 Dr. Lishchynska is a lecturer at the
Department of Mathematics at Cork Institute of Technology (Ireland).
Kieran Delaney received the B.E. (Elec.) and Ph.D. degrees from University College Cork, Cork, Ireland, in 1992 and
1997, respectively. He is the Research Development Manager of the Nimbus Centre for Embedded Systems Research,
based in Cork Institute of Technology, Cork, Ireland. He joined the NMRC in 1996 as a Research Scientist, where his
responsibilities included evaluating novel interconnection technologies. In March 2005, he joined Cork Institute of
Technology (CIT) as a Research Coordinator for the Department of Electronic Engineering. In June 2006, he was
appointed to the role of Director of the TEC Centre and later in 2009, he was appointed to Principal Investigator in the
Nimbus Centre.
Martin Hill received a B.E. in electrical engineering from University College Cork in 1987 and an M.Eng.Sc in
photovoltaics from the National Microelectronics Research Centre (NMRC) in University College Cork in 1989. He has
held a number of posts in private and public research organisations and was Senior Research Scientist in NMRC, leading
MEMS research, prior to taking a lecturing post in Cork Institute of Technology in 2002. He completed his Ph.D. thesis on
“Micromachined CMOs compatible tunable capacitors” in January 2007. He has published over 50 papers in peer-
reviewed journals and conferences and is co-author of patents for MEMS devices. He is Chairman of the steering
committee of the Micromechanics Europe workshop series and is a regular reviewer with the Journal of Micromechanics
and Microengineering. His research interests are in the field of MEMS device design and control and reliability testing of
MEMS devices.