Single-molecule pull-down for studying protein interactions
18
Single molecule pull-down for studying protein interactions Ankur Jain 1,2 , Ruijie Liu 3 , Yang K. Xiang 2,3 , and Taekjip Ha 1,2,4 1 Center for Biophysics and Computational Biology, University of Illinois at Urbana-Champaign, Urbana, Illinois 61801, USA 2 Institute for Genomic Biology, University of Illinois at Urbana-Champaign, Urbana, Illinois 61801, USA 3 Department of Molecular and Integrative Physiology, University of Illinois at Urbana-Champaign, Urbana, Illinois 61801, USA 4 Howard Hughes Medical Institute, University of Illinois at Urbana-Champaign, Urbana, Illinois 61801, USA Abstract This protocol describes a single molecule pull-down (SiMPull) assay for analyzing physiological protein complexes. The assay combines the conventional pull-down assay with single molecule total internal reflection fluorescence microscopy, and allows probing single macromolecular complexes directly from cell or tissue extracts. In this method, antibodies against the protein of interest are immobilized on a passivated microscope slide. When cell extracts are applied, the surface-tethered antibody captures the protein together with its physiological interaction partners. After washing away the unbound components, single molecule fluorescence microscopy is used to probe the pulled down proteins. Captured proteins are visualized through genetically encoded fluorescent protein tags or through antibody labeling. This ultra-sensitive assay requires at least 10-fold less reagents, is significantly faster and provides quantitative data compared to western blot analysis. Furthermore, SiMPull can distinguish between multiple association states of the same protein. SiMPull is generally applicable to proteins from a variety of cellular contexts and to endogenous proteins. Starting with the cell extracts and passivated slides, the assay requires 1.5 – 2.5 hours for data acquisition and analysis. Keywords protein-protein interaction; single molecule; immunoprecipitation; co-immunoprecipitation pull- down Introduction Nearly all vital cellular processes are performed by coordinated action of proteins acting in multimeric assemblies or complexes 1 . Cellular processes are also dynamically regulated by Correspondence should be addressed to T.H. ([email protected]) or Y.K.X. ([email protected]). Phone: +1-217-265-0717. Fax: +1-217-244-7187. Author contributions: A.J., Y.K.X. and T.H. designed the research. R.L. prepared cell extracts. A.J. conducted single molecule experiments and analyzed the data. A.J., Y.K.X. and T.H. wrote the paper. Competing financial interests: The authors declare that they have no competing financial interests. Supplementary Method: Immunoprecipitation of endogenous proteins from mouse tissues NIH Public Access Author Manuscript Nat Protoc. Author manuscript; available in PMC 2013 May 15. Published in final edited form as: Nat Protoc. ; 7(3): 445–452. doi:10.1038/nprot.2011.452. NIH-PA Author Manuscript NIH-PA Author Manuscript NIH-PA Author Manuscript
-
Upload
independent -
Category
Documents
-
view
2 -
download
0
Transcript of Single-molecule pull-down for studying protein interactions

Single molecule pull-down for studying protein interactions
Ankur Jain1,2, Ruijie Liu3, Yang K. Xiang2,3, and Taekjip Ha1,2,4
1Center for Biophysics and Computational Biology, University of Illinois at Urbana-Champaign,Urbana, Illinois 61801, USA2Institute for Genomic Biology, University of Illinois at Urbana-Champaign, Urbana, Illinois 61801,USA3Department of Molecular and Integrative Physiology, University of Illinois at Urbana-Champaign,Urbana, Illinois 61801, USA4Howard Hughes Medical Institute, University of Illinois at Urbana-Champaign, Urbana, Illinois61801, USA
AbstractThis protocol describes a single molecule pull-down (SiMPull) assay for analyzing physiologicalprotein complexes. The assay combines the conventional pull-down assay with single moleculetotal internal reflection fluorescence microscopy, and allows probing single macromolecularcomplexes directly from cell or tissue extracts. In this method, antibodies against the protein ofinterest are immobilized on a passivated microscope slide. When cell extracts are applied, thesurface-tethered antibody captures the protein together with its physiological interaction partners.After washing away the unbound components, single molecule fluorescence microscopy is used toprobe the pulled down proteins. Captured proteins are visualized through genetically encodedfluorescent protein tags or through antibody labeling. This ultra-sensitive assay requires at least10-fold less reagents, is significantly faster and provides quantitative data compared to westernblot analysis. Furthermore, SiMPull can distinguish between multiple association states of thesame protein. SiMPull is generally applicable to proteins from a variety of cellular contexts and toendogenous proteins. Starting with the cell extracts and passivated slides, the assay requires 1.5 –2.5 hours for data acquisition and analysis.
Keywordsprotein-protein interaction; single molecule; immunoprecipitation; co-immunoprecipitation pull-down
IntroductionNearly all vital cellular processes are performed by coordinated action of proteins acting inmultimeric assemblies or complexes1. Cellular processes are also dynamically regulated by
Correspondence should be addressed to T.H. ([email protected]) or Y.K.X. ([email protected]). Phone: +1-217-265-0717. Fax:+1-217-244-7187.
Author contributions:A.J., Y.K.X. and T.H. designed the research. R.L. prepared cell extracts. A.J. conducted single molecule experiments and analyzed thedata. A.J., Y.K.X. and T.H. wrote the paper.
Competing financial interests:The authors declare that they have no competing financial interests.
Supplementary Method: Immunoprecipitation of endogenous proteins from mouse tissues
NIH Public AccessAuthor ManuscriptNat Protoc. Author manuscript; available in PMC 2013 May 15.
Published in final edited form as:Nat Protoc. ; 7(3): 445–452. doi:10.1038/nprot.2011.452.
NIH
-PA Author Manuscript
NIH
-PA Author Manuscript
NIH
-PA Author Manuscript
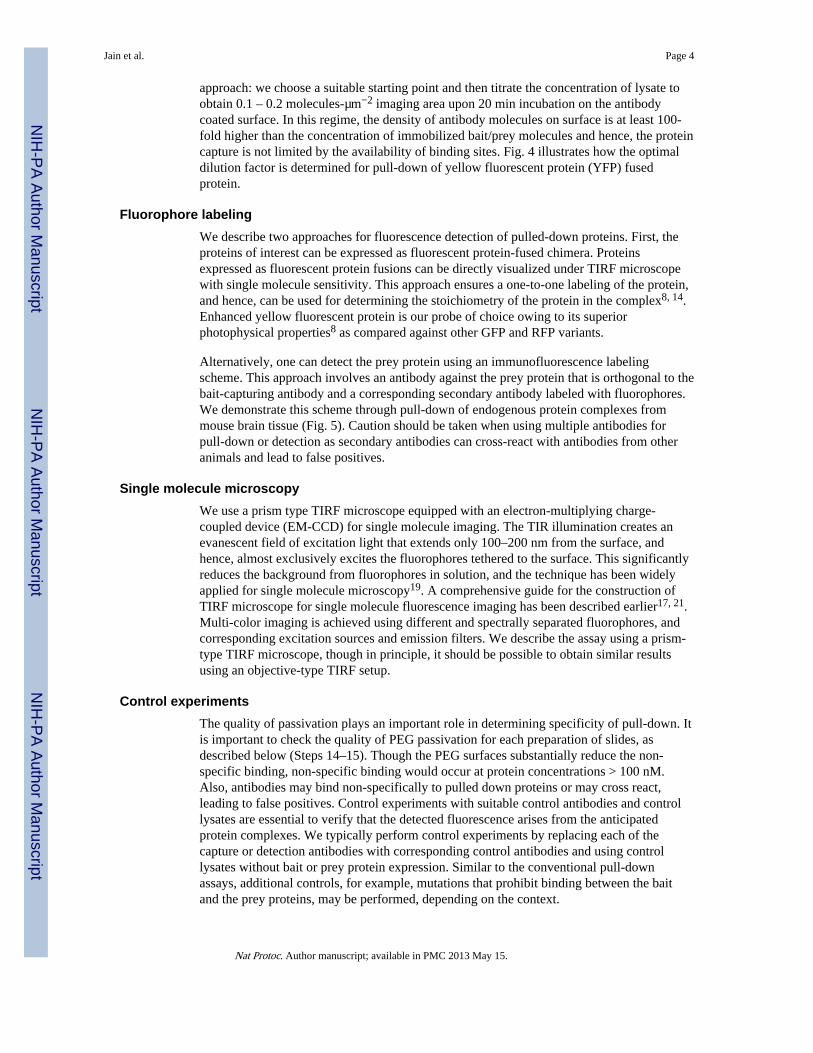
signaling networks, wherein interaction between biomolecules link physical or chemicalstimuli to the effector molecules2, 3. Thus, analysis of protein interactions is central forunderstanding cell function and regulation. One of the most widely used techniques forstudying interacting proteins is the pull-down or the co-immunoprecipitation assay4, 5. In theclassical pull-down assay, the protein of interest or bait is selectively isolated from cell ortissue extracts. The physiological binding partners of the bait protein, or the prey proteins,co-purify with the bait protein. The identity of the prey proteins is determined using westernblot or mass spectrometry.
Many proteins participate in different types of complexes and exhibit diverse functionality.Though instrumental in discovery of new binding partners, the data from ensemble pull-down assays represents an average of protein complexes. The true composition ofphysiological complexes is not easily revealed due to multiplicity in protein interactions5.Furthermore, no information about the stoichiometry of protein interactions is obtained.Similarly, one can determine the pair-wise interacting partners using yeast two hybrid6 orthe complementation assays7, but the physiological assembly of these interactions is notdeciphered. Single molecule experiments can provide additional insight about moleculararchitecture of protein assemblies8, but have been typically limited to reconstitutedcomplexes with purified proteins9–12.
We recently described a single molecule pull-down13 or SiMPull assay that combines theclassical pull-down assay with single molecule fluorescence imaging, and enables directvisualization of cellular protein complexes at the single molecule level. In this paper, wedescribe the detailed procedure for the SiMPull assay. The assay requires a single moleculetotal internal reflection fluorescence (TIRF) microscope, and can be performed using thesame reagents as required for western blot analysis. In one incarnation, an antibody against abait protein is immobilized on a polymer-passivated flow chamber. Cell extracts are made toflow through the chamber so that the bait protein is captured. If the bait is in complex withother proteins or nucleic acids, the antibody will capture these additional biomolecules.After washing out unbound proteins, multi-color fluorescence imaging with singlefluorophore sensitivity is used to analyze the composition of the protein complexes. Wedescribe the assay for pull-down using biotin labeled primary or secondary antibodies. Thepulled down proteins are visualized through fluorescent protein-fused chimeras or throughimmunofluorescence labeling, as depicted in Fig. 1
Several advantages stem from the single molecule imaging of cellular protein complexes.SiMPull can discriminate between multiple association states of a protein. It providesquantitative data on bait and prey protein population. SiMPull also allows us to determinethe stoichiometry of the complexes by using photobleaching step analysis14. The preparedcomplexes may also be used for biochemical analysis of their activities at the singlemolecule level13, 15, 16. Thus, SiMPull can be used as a preparatory tool to study thefunctional activity of protein complexes that are not accessible through recombinantmethods. In addition, SiMPull promises improvement by orders of magnitude in cost, time,and sensitivity over the conventional western blot. The method is generally applicable to awide variety of cellular contexts and can be tailored for any alternative pull-down orfluorophore labeling schemes. Though we describe the assay for detecting prey proteinsusing fluorescent protein tags or using antibodies, other suitable specific labeling schemesshould be compatible with the assay. Of particular note, is the recent demonstration ofspecific labeling of proteins in cell lysates15.
However, unlike western blot analysis, this method does not separate biomolecules based ontheir size, and relies solely on fluorophore-based detection. Hence, appropriate controls arenecessary for correct interpretation of the data. In its current form, SiMPull is applicable
Jain et al. Page 2
Nat Protoc. Author manuscript; available in PMC 2013 May 15.
NIH
-PA Author Manuscript
NIH
-PA Author Manuscript
NIH
-PA Author Manuscript

when one already knows the anticipated binding partners. Lysates are typically diluted toobtain sufficiently low protein concentration for single molecule imaging. Hence, weakinteractions with dissociation rate constants > 0.01 s−1 may not be accessible to themethod13.
Experimental designSurface passivation and construction of flow chambers
The key aspect of the pull-down assays is the selective immobilization of the protein ofinterest or bait on a solid matrix, which will bring along its interaction partners. The baitrecruiting surfaces must specifically bind to the protein of interest while rejecting the non-specific adsorption of biomolecules that exist in cell extracts. We achieve this usingmethoxy polyethylene glycol (mPEG) coated microscope slide and cover slip. The PEGcoating substantially reduces the binding of proteins to the glass surfaces17, 18 asdemonstrated in Fig. 2. A small amount (~2%) of biotinylated PEG is added during the slidepreparation: this functionalizes the surface and allows specific immobilization ofbiotinylated biomolecules using an avidin linker. Flow chambers are constructed using apassivated slide and coverslip for rapid and convenient exchange of contents (Fig. 3). Adetailed protocol for surface passivation with mPEG and construction of flow chambers isalso described in previous publications19, 20.
Sample preparationSiMPull can be performed using the same samples (purified proteins, tissue or cell lysates)as used for a conventional pull-down analysis. Extracts are typically prepared by lysingcultured cells or tissues with detergents. We have tested a variety of detergents and celltypes for SiMPull analysis13. A protocol for lysis of cultured cells is included in ReagentSetup and for preparation of animal tissue extracts is provided as a Supplementary Method.Similar to conventional pull-down assays, it is critical to use non-denaturing conditions inorder to preserve the physiological interactions that may occur. We avoid SDS and otherstrong ionic detergents for lysis as they can potentially denature the immobilized antibodiesor disassemble protein complexes.
Antibody immobilizationThe selective capture of the bait protein is achieved using surface immobilized antibodies.The biotin-doped surfaces are saturated with NeutrAvidin, and biotinylated antibody againstthe bait protein is immobilized at a concentration of 10–20 nM. This should yield a surfacedensity of about 20–40 antibody molecules per µm2.
Often times, it is difficult to label the primary antibody with biotin. Many primaryantibodies are supplied either as sera or in buffer with BSA as stabilizer and are hence, notsuitable for labeling reactions. For immobilizing unlabeled antibodies, we use a biotinylatedsecondary antibody on the surface that can recruit the primary antibody against the baitprotein. Secondary antibodies against one species can often cross-react with other speciesunless they have been specifically adsorbed to minimize cross-reactivity. For assaysinvolving multiple antibodies, we use cross-adsorbed and affinity purified antibodies.
Single molecule pull-downFor imaging single molecules, the protein of interest must be immobilized at sufficiently lowdensity such that the bait molecules are well separated on the slide surface. Cell lysatestypically require dilution to obtain this low density. As the concentration of the protein ofinterest in the lysates is not known a priori, and also varies across preparations, it is difficultto predict the appropriate dilution factor for the lysate. To this end, we use an iterative
Jain et al. Page 3
Nat Protoc. Author manuscript; available in PMC 2013 May 15.
NIH
-PA Author Manuscript
NIH
-PA Author Manuscript
NIH
-PA Author Manuscript
approach: we choose a suitable starting point and then titrate the concentration of lysate toobtain 0.1 – 0.2 molecules-µm−2 imaging area upon 20 min incubation on the antibodycoated surface. In this regime, the density of antibody molecules on surface is at least 100-fold higher than the concentration of immobilized bait/prey molecules and hence, the proteincapture is not limited by the availability of binding sites. Fig. 4 illustrates how the optimaldilution factor is determined for pull-down of yellow fluorescent protein (YFP) fusedprotein.
Fluorophore labelingWe describe two approaches for fluorescence detection of pulled-down proteins. First, theproteins of interest can be expressed as fluorescent protein-fused chimera. Proteinsexpressed as fluorescent protein fusions can be directly visualized under TIRF microscopewith single molecule sensitivity. This approach ensures a one-to-one labeling of the protein,and hence, can be used for determining the stoichiometry of the protein in the complex8, 14.Enhanced yellow fluorescent protein is our probe of choice owing to its superiorphotophysical properties8 as compared against other GFP and RFP variants.
Alternatively, one can detect the prey protein using an immunofluorescence labelingscheme. This approach involves an antibody against the prey protein that is orthogonal to thebait-capturing antibody and a corresponding secondary antibody labeled with fluorophores.We demonstrate this scheme through pull-down of endogenous protein complexes frommouse brain tissue (Fig. 5). Caution should be taken when using multiple antibodies forpull-down or detection as secondary antibodies can cross-react with antibodies from otheranimals and lead to false positives.
Single molecule microscopyWe use a prism type TIRF microscope equipped with an electron-multiplying charge-coupled device (EM-CCD) for single molecule imaging. The TIR illumination creates anevanescent field of excitation light that extends only 100–200 nm from the surface, andhence, almost exclusively excites the fluorophores tethered to the surface. This significantlyreduces the background from fluorophores in solution, and the technique has been widelyapplied for single molecule microscopy19. A comprehensive guide for the construction ofTIRF microscope for single molecule fluorescence imaging has been described earlier17, 21.Multi-color imaging is achieved using different and spectrally separated fluorophores, andcorresponding excitation sources and emission filters. We describe the assay using a prism-type TIRF microscope, though in principle, it should be possible to obtain similar resultsusing an objective-type TIRF setup.
Control experimentsThe quality of passivation plays an important role in determining specificity of pull-down. Itis important to check the quality of PEG passivation for each preparation of slides, asdescribed below (Steps 14–15). Though the PEG surfaces substantially reduce the non-specific binding, non-specific binding would occur at protein concentrations > 100 nM.Also, antibodies may bind non-specifically to pulled down proteins or may cross react,leading to false positives. Control experiments with suitable control antibodies and controllysates are essential to verify that the detected fluorescence arises from the anticipatedprotein complexes. We typically perform control experiments by replacing each of thecapture or detection antibodies with corresponding control antibodies and using controllysates without bait or prey protein expression. Similar to the conventional pull-downassays, additional controls, for example, mutations that prohibit binding between the baitand the prey proteins, may be performed, depending on the context.
Jain et al. Page 4
Nat Protoc. Author manuscript; available in PMC 2013 May 15.
NIH
-PA Author Manuscript
NIH
-PA Author Manuscript
NIH
-PA Author Manuscript
MaterialsReagents
Methanol (Fisher Scientific, cat. no. A412-4) Caution: Methanol is flammable; liquidand vapors are toxic. Wear mask, gloves and chemical safety goggles while handling.
Acetone (Fisher Scientific, cat. no. A18-4) Caution: Acetone is flammable and eye andskin irritant. Wear gloves and chemical safety goggles while handling.
KOH pellets (Fisher Scientific, cat. no. P250-3) Caution: KOH is corrosive and eye andskin irritant. Use under a chemical fume hood.
Acetic acid, Glacial (Fisher Scientific, cat. no. A38-500) Caution: Acetic acid causessevere eye and skin burns. Handle with a glass pipette. Wear gloves and chemical safetygoggles while handling.
Aminosilane (N-(2-Aminoethyl)-3-Aminopropyltrimethoxysilane), (United ChemicalTechnologies, cat. no. A0700) Caution: Aminosilane is potentially toxic and skin andeye irritant. Wear gloves and chemical safety goggles while handling.
Methoxy PEG (Laysan Bio. Inc., cat. no. mPEG-Succinimidyl Valerate, MW 5,000)
Biotin-PEG (Laysan Bio. Inc., cat. no. Biotin-PEG-SVA, MW 5,000)
Sodium bicarbonate (Fisher Scientific, cat. no. S233)
Double sided tape (3M)
Epoxy (Devcon, cat. no. 14250)
Tris-HCl (Fisher Scientific, cat. no. BP153-1)
NaCl (Fisher Scientific, cat. no. S641-212)
EDTA (Sigma, cat. no E9884-1KG)
Bovine serum albumin (BSA) (New England Biolabs, cat. no. B9001S)
NeutrAvidin (Pierce, cat. no. 31000)
Fluorophore labeled protein for testing quality of PEG passivation
Antibodies: Biotinylated anti-Flag (Sigma, cat. no. F9291), Biotinylated anti-rabbit(Santa Cruz Biotech., cat. no. SC2089), Biotinylated anti-GFP (RocklandImmunochemicals, cat. no. 600-106-215), Anti-goat (Rockland Immunochemicals, cat.no. 605-701-125), Rabbit anti-PKARII (Santa Cruz Biotech., cat. no. SC909), Anti-AKAP150 (Santa Cruz Biotech., cat. no. SC6445) Rabbit pre-immune IgG (CellSciences, cat. no. NRI01)
Cell culture media (Dulbecco's modified eagle medium, Hyclone, cat. no. SH30284 orequivalent, supplemented with serum if appropriate)
Transfection reagent (Lipofactamine 2000, Invitrogen, cat. no. 11668019)
NP-40 (United States Biological, cat. no. N3500)
EquipmentRotary drill (Dremel, model no. 395)
Drill bits (0.75 mm) (Kingsley North Inc., cat. no. 1-0500-100)
Quartz slides (G. Finkenbeiner Inc., 1" × 3" × 1 mm thick)
Jain et al. Page 5
Nat Protoc. Author manuscript; available in PMC 2013 May 15.
NIH
-PA Author Manuscript
NIH
-PA Author Manuscript
NIH
-PA Author Manuscript
Coverslips (24 × 40 mm, VWR International, cat. no. 48393230)
Slide holders (Fisher Scientific cat. no. 08-817)
Bath sonicator (Bransonic tabletop ultrasonic cleaner)
Propane torch Caution: Propane is highly flammable.
Single molecule TIRF microscope:
Inverted fluorescence microscope (Olympus cat. no. IX70),
1.2 NA water immersion objective (Olympus cat. no. UPLAPO60XW)
Pellin-Broca prism (EKSPLA, cat. no. 325-3206)
EM-CCD detector (Andor Technologies, cat. no. iXon DV 887-BI)
Laser shutter (Uniblitz electronic shutter, Vincent Associates, cat. no. LS6T2)
Shutter driver (Vincent Associates, cat. no. VMM-D1)
Mirrors to align lasers (Thorlabs cat. no. BB1-E02)
Polarizing beam splitter (Thorlabs, cat. no. PBS3)
XYZ micrometer translation stage (Newport Corp., cat. no. 462-XYZ)
Excitation and emission focusing lenses
Excitation lasers 488 nm (Coherent Inc, cat. no. Sapphire 488 LP-050), 568 nm(Coherent Inc., cat. no. Sapphire 568-50), 633nm (HeNe Laser, Newport Corp. cat. no.R-30995).
Emission filters: YFP (Chroma Technology, cat. no. HQ 535/30m), mCherry (SemrockInc., FF01-607/36-25), Alexa647 (Chroma Technology, cat. no. 640DCLP).
Reagent setupT50: 10 mM Tris-HCl pH 8.0, 50 mM NaCl, can be stored at room temperature, 22–25°C for up to 1 month.
T50-BSA: 10 mM Tris-HCl pH 8.0, 50 mM NaCl, 0.1 mg ml−1 BSA, can be stored at4°C for up to 1 month.
Lysis buffer: 10 mM Tris pH 7.5, 1% vol/vol NP-40, 150 mM NaCl, 1 mM EDTA,with protease inhibitors). It is recommended to prepare fresh lysis buffer for each use.
Sample preparation: A method for lysate preparation from tissues is provided as aSupplementary Method. Here, we describe the method used for lysate preparation fromtransfected cells. The method can be tailored for different lysis conditions or cell types.HEK293 cells are cultured and maintained in Dulbecco’s modified eagle mediumsupplemented with antibiotics and 10% vol/vol fetal bovine serum. Transfect the cellswith suitable transfection reagent following manufacturer’s protocol. For lysis, washcells twice with PBS and add lysis buffer. Incubate at 4°C for 30 min. Pre-clean thelysate by centrifuging at 14,000g for 20 min at 4°C. It is recommended to use freshlysates, within ~12 h after preparation.
Equipment setupTIRF microscope: We use a custom-built prism-type TIRF microscope for single moleculeimaging. An inverted microscope is adapted to hold a trapezoid fused-silica prism on top ofthe flow chamber. The excitation laser beam is directed towards the objective through the
Jain et al. Page 6
Nat Protoc. Author manuscript; available in PMC 2013 May 15.
NIH
-PA Author Manuscript
NIH
-PA Author Manuscript
NIH
-PA Author Manuscript
prism at an incidence angle greater than the critical angle (68°). The prism is index matchedwith the flow chamber using immersion oil, such that the evanescent excitation field iscreated at the quartz-aqueous buffer interface. A 60× water immersion objective (NA = 1.2)is used to collect the fluorescence signal. The scattered light is rejected using suitable filters/dichroic mirrors. The emitted light is imaged onto a 512 × 512 pixel EM-CCD. The finalpixel size in the imaging plane is ~146 nm. The excitation laser intensity is modulated usinga half-wave plate and a polarizing beam splitting cube to achieve 0.5 – 3 µW-µm−2 at thequartz-aqueous buffer interface, so as to obtain a 5–10 fold signal above noise.
Software: Fluorescence signal is recorded using custom software written in Visual C++.The software acquires movies as series of frames at specified time-resolution and dependingon the camera used. Single molecule time trajectories are extracted from the movies usingscripts written in IDL. The program creates an averaged image of the first 10-frames, andidentifies single molecules as intensity maxima greater than a predetermined threshold. Thealgorithm also fits the point-spread function to a Gaussian to avoid including multiplemolecules or aggregations into the analysis. Next, the local background is subtracted andintensities from 7 by 7 pixels surrounding the peak are added to obtain intensities of singlemolecules. The single molecule time trajectories and mean fluorophore count per movie areanalyzed using MATLAB codes. All programs are available from the authors upon request.
ProcedurePEG passivation of microscope slides Timing: 6 – 8 h
1 Drill two holes in quartz slide, about 0.75 mm in diameter, 3–4 mm away fromthe edge (Fig. 3a). This is to create inlet and outlet for the flow channel. Rinsethe slide, and place the slide and a coverslip in the slide holder. We typicallymake 4–5 flow channels per slide.
2 Rinse twice and bath sonicate the slide and the coverslip in MilliQ water for 10min. Repeat the process with methanol followed by acetone, to remove anyorganic residue from the surfaces.
Caution: Methanol is flammable; liquid and vapors are toxic. Acetone isflammable and eye and skin irritant. Wear mask, gloves and chemical safetygoggles while handling.
3 Sonicate in 1 M KOH for 20 min, rinse with MilliQ water. KOH treatmentactivates the surface for silane functionalization (Steps 5–7).
Caution: KOH is corrosive and eye and skin irritant. Use under a chemical fumehood.
4 Burn the slides for about 1 min and the coverslips for 1–2 sec with a propanetorch to dry off any surface moisture. Place the slide and coverslip in a dry slideholder.
Caution: Propane is highly flammable.
5 Mix 95 ml methanol with 5 ml of acetic acid in a conical flask. Add 1 mlaminosilane, mix and immediately pour this solution in the slide holder withslide and coverslip. Incubate in dark for 10 min at room temperature.
Critical step: Aminosilane is photosensitive and hydrolyzes rapidly in water.Store it under nitrogen in dark.
Jain et al. Page 7
Nat Protoc. Author manuscript; available in PMC 2013 May 15.
NIH
-PA Author Manuscript
NIH
-PA Author Manuscript
NIH
-PA Author Manuscript
Caution: Aminosilane is potentially toxic and skin and eye irritant. Acetic acidcauses severe eye and skin burns. Wear appropriate safety equipment whilehandling.
6 Bath sonicate the slide and coverslip for 1 min and then incubate for another 10min at room temperature.
7 Wash the slide and coverslip with methanol and water for 1–2 min each. Dryand place them in a humidified box.
8 Weigh 16 mg of mPEG with 0.3 mg biotin-PEG per slide/coverslip pair.Dissolve in 70 µl freshly prepared sodium bicarbonate buffer (10 mM sodiumbicarbonate, pH 8.5). Mix well, and spin down for 30 s at 10,000g at roomtemperature to remove bubbles.
Critical step: The passivation on the coverslip surface is not required when usingprism type TIRF microscope, but is recommended to prevent sample loss.
Critical step: The half-life of succinimidyl valerate PEG in pH 8.5 buffer is only~10 min. After adding the buffer to PEG, move to Step 9 as soon as possible.
9 Apply this solution to the slide surface and sandwich it immediately with thecoverslip. Store in dark for 3–4 h in the humidified boxes at room temperature.
10 Wash with copious amount of water, blow dry with nitrogen and store the slideand coverslip in vacuum at −20°C in dark. We use a food grade vacuum sealerfor sealing the slides in vacuum.
Pause point: The slides can be stored for up to 2 weeks under these conditions.
Construction of flow chambers Timing ~30 min11 Thaw the slides at room temperature for 10 min.
12 Sandwich a double-sided tape between the slide and cover slip excluding a ~5mm channel with holes (Fig. 3a). Ensure that the tape sticks on both surfaces.
13 Seal the edges with epoxy and allow it to dry for 10 min. Volume of the flowchannel is ~20 µl. Prepare additional chambers for the control experiments asrequired.
Testing quality of PEG slides Timing ~30 min14 Flow 100 µl of T50 buffer in the flow channel (Fig. 3b), and image it under
TIRF microscope. Acquire 10 short movies, at suitable time resolution, anddetermine the average number of fluorescent molecules per unit imaging area.This is the background fluorescence arising likely from impurities duringsurface preparation. Typically, the observed background fluorescence is < 0.02molecules-µm−2 under our experimental conditions.
Troubleshooting
15 Test the slides for the quality of passivation. Flow 100 µl of a 10 nMfluorophore labeled protein to the flow chamber; incubate for 10 min and washby flowing 200 µl T50 twice to remove unbound protein. Image under the TIRFmicroscope, and determine average number of non-specifically boundmolecules. A good passivation should yield < 0.01 molecules-µm−2 non-specifically adsorbed molecules above background spot count (as determined inStep 14).
Jain et al. Page 8
Nat Protoc. Author manuscript; available in PMC 2013 May 15.
NIH
-PA Author Manuscript
NIH
-PA Author Manuscript
NIH
-PA Author Manuscript

Troubleshooting
Immobilizing antibody against bait protein Timing 30 min – 1 h16 Prepare a 0.2 mg/ml solution of NeutrAvidin in T50 buffer. Add 70 µl of this
solution to the flow chamber. Incubate for 5 min. All incubations are performedat room temperature, unless specified.
17 Wash excess NeutrAvidin by flowing in 200 µl T50 twice.
18 For immobilizing biotinylated primary antibody against bait protein, followoption (A). For immobilizing unlabeled bait antibody via a biotinylatedsecondary antibody, follow option (B).
Critical step: The sensitivity and performance of the assay depends on theaffinity of the antibody, and accessibility of the epitope. Like any antibody-based assay, it may be required to test different antibodies for this application.
Option A: immobilizing biotinylated primary antibody against bait protein
i. Dilute the biotinylated antibody to a working concentrationaround 10–20 nM in T50-BSA.
ii. Add 100 µl of this solution to the chamber and incubate for 10min.
iii. Rinse twice with 200 µl T50-BSA.
Option B: using biotinylated secondary antibody to immobilize the primaryantibody against the bait protein
i. Flow 100 µl of 20–40 nM of biotin labeled appropriatesecondary antibody and incubate for 10 min.
ii. Wash twice with T50-BSA.
iii. Flow 100 µl of 10–20 nM unlabeled primary antibody againstthe bait protein. Incubate for 10–20 min.
iv. Wash twice with T50-BSA.
Pull-down of proteins from cell lysates Timing ~30 min19 Flow in 100 µl of an appropriate dilution of cell or tissue lysate on the antibody
coated chambers. Dilutions are typically made in the lysis buffer withoutdetergent, or in T50-BSA. Incubate for 10–20 min and then flush out theunbound extract. If the prey protein bears a fluorescent protein tag, proceeddirectly to Step 22 for imaging. Otherwise, proceed to Step 20 to fluorescentlylabel the prey protein using antibodies.
Critical step: Expression levels of proteins vary significantly depending on the protein beingstudied and across preparations. Hence, this dilution factor needs to be determined for eachexperiment (or sample preparation). As the concentration of the protein of interest in thecrude cell extracts is difficult to estimate, we typically start with a 2,000-fold dilution of cellextract for overexpressed proteins or a 20-fold dilution of cell extract for endogenousproteins, where the lysate is prepared from 103–104 cells µl−1. The concentration of proteinis titrated to obtain 0.1 – 0.2 fluorophores-µm−2 as determined in Step 22.
Jain et al. Page 9
Nat Protoc. Author manuscript; available in PMC 2013 May 15.
NIH
-PA Author Manuscript
NIH
-PA Author Manuscript
NIH
-PA Author Manuscript
Immunofluorescence labeling of pulled down protein Timing ~30 min20 Incubate the pulled down protein with 100 µl of 5–10 nM antibody against the
prey protein for 10–20 min. Wash twice with T50-BSA.
Critical step: When using a secondary antibody for detection, the primaryantibody against bait and prey proteins must be from different organisms.
21 Add 100 µl 1–2 nM of fluorophore labeled secondary antibody against the preyprotein. Incubate for 10 min and flush out the unbound antibody.
Critical step: The secondary antibody against the prey protein can potentiallybind to the antibodies against the bait protein. Appropriate controls arerecommended to rule out false positives.
Single molecule imaging and spot counting Timing 10 min – 1 h22 Image the slide under a prism type TIRF microscope. Acquire 20 or more short
movies (~20 frames each) depending on the statistics desired. Analyze themovies to determine the mean number of fluorophores per unit imaging area.
Critical step: Fluorescent proteins have a short fluorescence photobleachinglifetime, typically a few seconds under our excitation scheme. Turn off theexcitation shutter when not imaging. When imaging organic dyes, throughimmunofluorescence labeling scheme, one can use appropriate oxygenscavenging systems to prolong the fluorescence lifetime of the dyes.
Troubleshooting
23 Titrate the concentration of cell lysate depending on the observed surfacedensity of prey molecules to obtain 0.1 – 0.2 molecules-µm−2 and repeat steps16–22 as necessary.
Critical step: Typically, there is some fluorescent background from the surfacearising due to impurities. The concentration of immobilized molecules due tospecific binding should be kept at least 5 to 10-fold above this background.Under our imaging conditions, the background is ~0.01 molecules-µm−2. Forapplications involving co-localization of multiple fluorophores and forstoichiometry determination via photobleaching analysis, the density ofmolecules should be kept between 0.05 – 0.15 molecules-µm−2.
Troubleshooting
24 Once the optimal concentration of the lysate is determined, perform appropriatecontrol experiments by repeating steps 16–22 with a suitable control antibody(say, control IgG) and with control lysates lacking the bait-prey interaction.
Troubleshooting
TimingSteps 1 – 10, PEG passivation of microscope slides: 6 – 8 h
Steps 11 – 13, Construction of flow chambers: ~30 min
Steps 14 – 15, Testing quality of PEG slides: ~30 min
Steps 16 – 18, Immobilizing antibody against bait protein: 30 min – 1 h
Steps 19, Pull-down of proteins from cell lysates: ~30 min
Steps 20 – 21, Immunofluorescence labeling of pulled down protein: ~30 min
Jain et al. Page 10
Nat Protoc. Author manuscript; available in PMC 2013 May 15.
NIH
-PA Author Manuscript
NIH
-PA Author Manuscript
NIH
-PA Author Manuscript
Steps 22 – 24, Single molecule imaging and spot counting Timing 10 min – 1 h
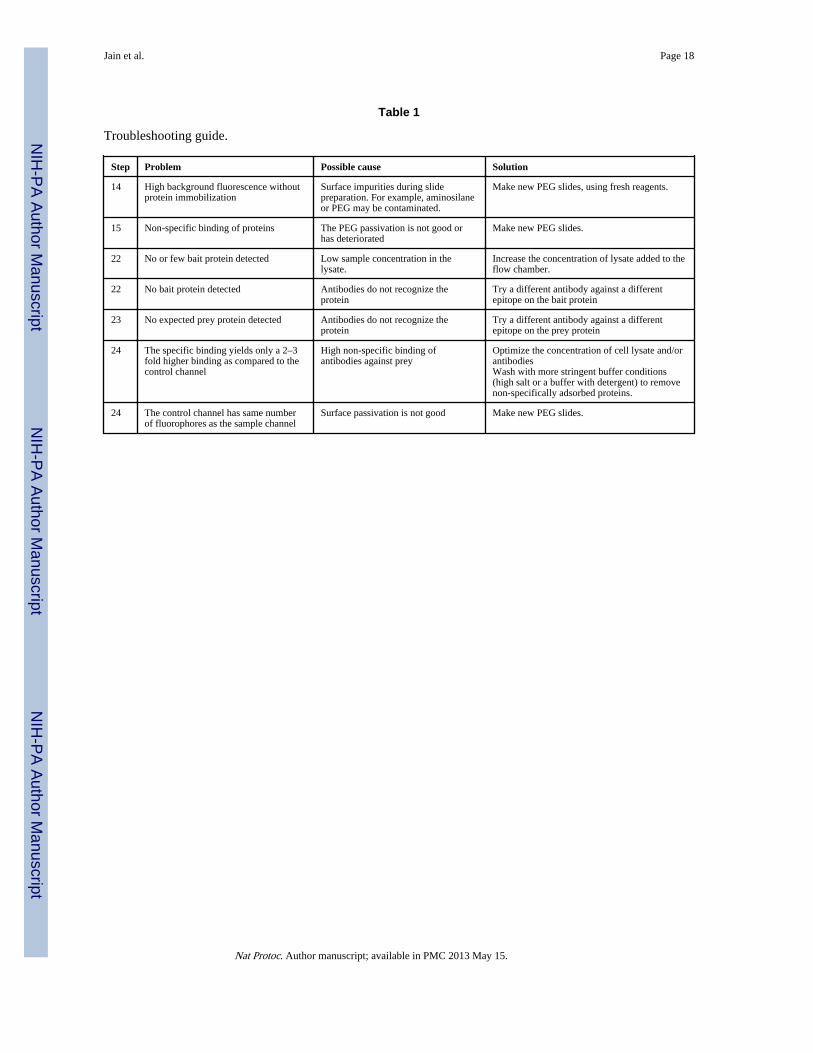
TroubleshootingTroubleshooting advice can be found in Table 1.
Anticipated resultsThe PEG passivated surfaces resist non-specific protein adsorption. Fig. 2 depicts a typicalTIRF image of surface immobilized YFP molecules, pulled down from cell lysate. When thesame amount of lysate was added to a PEG passivated surface without antibodies, it yieldedonly ~5 fluorescent spots on average above the background in a 2500 µm2 imaging area. Onthe other hand, a surface passivated with BSA, yielded substantial non-specific proteinbinding (Fig. 2). Prior to the experiments, the slides should be checked for quality ofpassivation by flowing in ~10 nM of labeled protein.
The lysate concentration is titrated to obtain an optimal fluorescent spot count abovebackground. Protein kinase A (PKA) tagged with YFP and HA tags is pulled down withantibodies against HA tag, and visualized using YFP fluorescence (Fig. 4). As we increasedthe lysate concentration, the number of YFP molecules observed increased. The optimaldensity for single molecule imaging is 0.1 – 0.2 fluorophores-µm−2 imaging area, asdepicted in Fig 4. At higher concentrations, it is not possible to resolve single molecules.
We demonstrate the immunofluorescence labeling strategy through pull down ofendogenous PKA-AKAP complexes from mouse brain extracts. We immobilized 20 nMbiotinylated donkey-anti-rabbit antibody followed by 10 nM rabbit-anti-PKA antibody. Tothese surfaces, we then added a 10-fold dilution of whole brain extract. A detailed protocolfor preparation of tissue samples is included as a Supplementary Method. The pulled downAKAPs are labeled with goat-anti-AKAP antibody (10 nM) followed by 2 nM secondaryantibody against goat labeled with Alexa647. Control experiments excluding the anti-PKAantibody (Fig. 5a, second from left), excluding biotinylated secondary antibody against PKA(Fig. 5a, second from right) and with a control rabbit IgG (Fig. 5a, right) are performed toverify that the observed fluorescence arises from specific binding of prey antibodies toAKAP. Additional controls, by knocking out PKA or AKAP may be performed to confirmthe interaction.
Supplementary MaterialRefer to Web version on PubMed Central for supplementary material.
AcknowledgmentsWe thank Biswarathan Ramani, Yuji Ishitsuka and Kaushik Ragunathan for help with developing the protocol. Thiswork was funded by NIH grants (AI083025, GM065367 to T.H.; HL082846 to Y.K.X.). Additional support wasprovided by NSF grants (0646550, 0822613 to T.H.). T.H. is an investigator with the Howard Hughes MedicalInstitute.
References1. Alberts B. The cell as a collection of protein machines: preparing the next generation of molecular
biologists. Cell. 1998; 92:291–294. [PubMed: 9476889]
2. Barrios-Rodiles M, et al. High-throughput mapping of a dynamic signaling network in mammaliancells. Science. 2005; 307:1621–1625. [PubMed: 15761153]
3. Yamada T, Bork P. Evolution of biomolecular networks: lessons from metabolic and proteininteractions. Nat Rev Mol Cell Biol. 2009; 10:791–803. [PubMed: 19851337]
Jain et al. Page 11
Nat Protoc. Author manuscript; available in PMC 2013 May 15.
NIH
-PA Author Manuscript
NIH
-PA Author Manuscript
NIH
-PA Author Manuscript
4. Puig O, et al. The tandem affinity purification (TAP) method: a general procedure of proteincomplex purification. Methods. 2001; 24:218–229. [PubMed: 11403571]
5. Gingras AC, Gstaiger M, Raught B, Aebersold R. Analysis of protein complexes using massspectrometry. Nat Rev Mol Cell Biol. 2007; 8:645–654. [PubMed: 17593931]
6. Fields S, Song O. A novel genetic system to detect protein-protein interactions. Nature. 1989;340:245–246. [PubMed: 2547163]
7. Kerppola TK. Bimolecular fluorescence complementation (BiFC) analysis as a probe of proteininteractions in living cells. Annu Rev Biophys. 2008; 37:465–487. [PubMed: 18573091]
8. Reyes-Lamothe Rodrigo JSD, Leake MC. Stoichiometry and Architecture of Active DNAReplication Machinery in Escherichia coli. Science. 2010; 328:498–501. [PubMed: 20413500]
9. Li H, Zhou D, Browne H, Balasubramanian S, Klenerman D. Molecule by molecule direct andquantitative counting of antibody-protein complexes in solution. Anal Chem. 2004; 76:4446–4451.[PubMed: 15283586]
10. Taguchi H, Ueno T, Tadakuma H, Yoshida M, Funatsu T. Single-molecule observation of protein-protein interactions in the chaperonin system. Nat Biotechnol. 2001; 19:861–865. [PubMed:11533646]
11. Kapanidis AN, et al. Fluorescence-aided molecule sorting: analysis of structure and interactions byalternating-laser excitation of single molecules. Proc Natl Acad Sci U S A. 2004; 101:8936–8941.[PubMed: 15175430]
12. Blosser TR, Yang JG, Stone MD, Narlikar GJ, Zhuang X. Dynamics of nucleosome remodellingby individual ACF complexes. Nature. 2009; 462:1022–1027. [PubMed: 20033040]
13. Jain A, et al. Probing cellular protein complexes using single-molecule pull-down. Nature. 2011;473:484–488. [PubMed: 21614075]
14. Ulbrich MH, Isacoff EY. Subunit counting in membrane-bound proteins. Nat Methods. 2007;4:319–321. [PubMed: 17369835]
15. Hoskins AA, et al. Ordered and dynamic assembly of single spliceosomes. Science. 2011;331:1289–1295. [PubMed: 21393538]
16. Yeom KH, et al. Single-molecule approach to immunoprecipitated protein complexes: insights intomiRNA uridylation. EMBO Rep. 2011; 12:690–696. [PubMed: 21637296]
17. Roy R, Hohng S, Ha T. A practical guide to single-molecule FRET. Nat Methods. 2008; 5:507–516. [PubMed: 18511918]
18. Fleminger G, Solomon B, Wolf T, Hadas E. Effect of polyethylene glycol on the non-specificadsorption of proteins to Eupergit C and agarose. J Chromatogr. 1990; 510:271–279. [PubMed:2401699]
19. Joo C, Balci H, Ishitsuka Y, Buranachai C, Ha T. Advances in single-molecule fluorescencemethods for molecular biology. Annu Rev Biochem. 2008; 77:51–76. [PubMed: 18412538]
20. Rothenberg E, Ha T. Single-molecule FRET analysis of helicase functions. Methods Mol Biol.2010; 587:29–43. [PubMed: 20225140]
21. Selvin, PR.; Ha, T. Single-molecule techniques : a laboratory manual. Cold Spring Harbor, NY:Cold Spring Harbor Laboratory Press; 2008.
Jain et al. Page 12
Nat Protoc. Author manuscript; available in PMC 2013 May 15.
NIH
-PA Author Manuscript
NIH
-PA Author Manuscript
NIH
-PA Author Manuscript
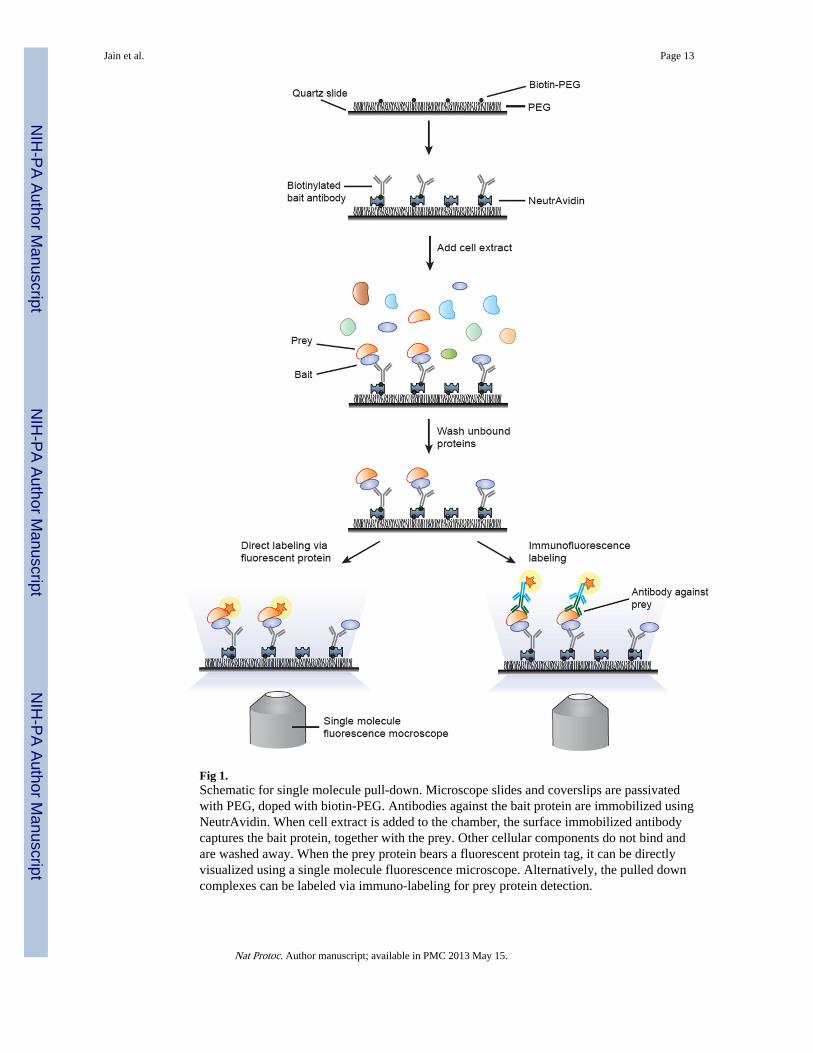
Fig 1.Schematic for single molecule pull-down. Microscope slides and coverslips are passivatedwith PEG, doped with biotin-PEG. Antibodies against the bait protein are immobilized usingNeutrAvidin. When cell extract is added to the chamber, the surface immobilized antibodycaptures the bait protein, together with the prey. Other cellular components do not bind andare washed away. When the prey protein bears a fluorescent protein tag, it can be directlyvisualized using a single molecule fluorescence microscope. Alternatively, the pulled downcomplexes can be labeled via immuno-labeling for prey protein detection.
Jain et al. Page 13
Nat Protoc. Author manuscript; available in PMC 2013 May 15.
NIH
-PA Author Manuscript
NIH
-PA Author Manuscript
NIH
-PA Author Manuscript
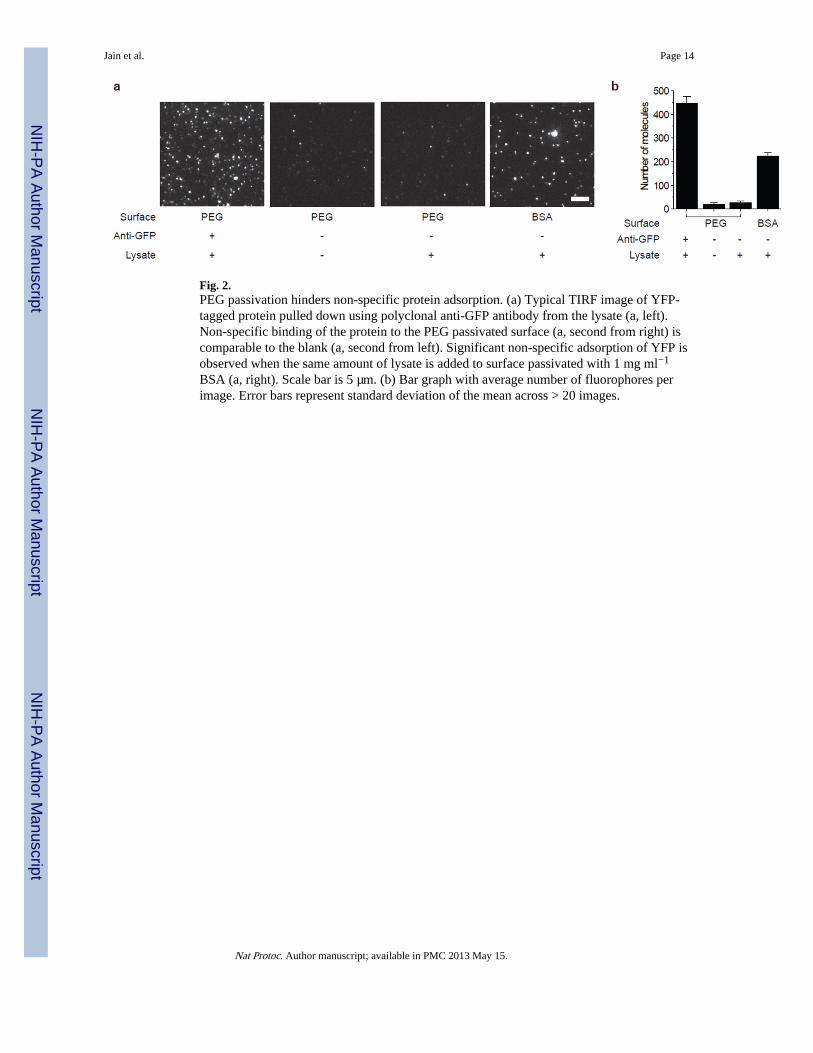
Fig. 2.PEG passivation hinders non-specific protein adsorption. (a) Typical TIRF image of YFP-tagged protein pulled down using polyclonal anti-GFP antibody from the lysate (a, left).Non-specific binding of the protein to the PEG passivated surface (a, second from right) iscomparable to the blank (a, second from left). Significant non-specific adsorption of YFP isobserved when the same amount of lysate is added to surface passivated with 1 mg ml−1
BSA (a, right). Scale bar is 5 µm. (b) Bar graph with average number of fluorophores perimage. Error bars represent standard deviation of the mean across > 20 images.
Jain et al. Page 14
Nat Protoc. Author manuscript; available in PMC 2013 May 15.
NIH
-PA Author Manuscript
NIH
-PA Author Manuscript
NIH
-PA Author Manuscript
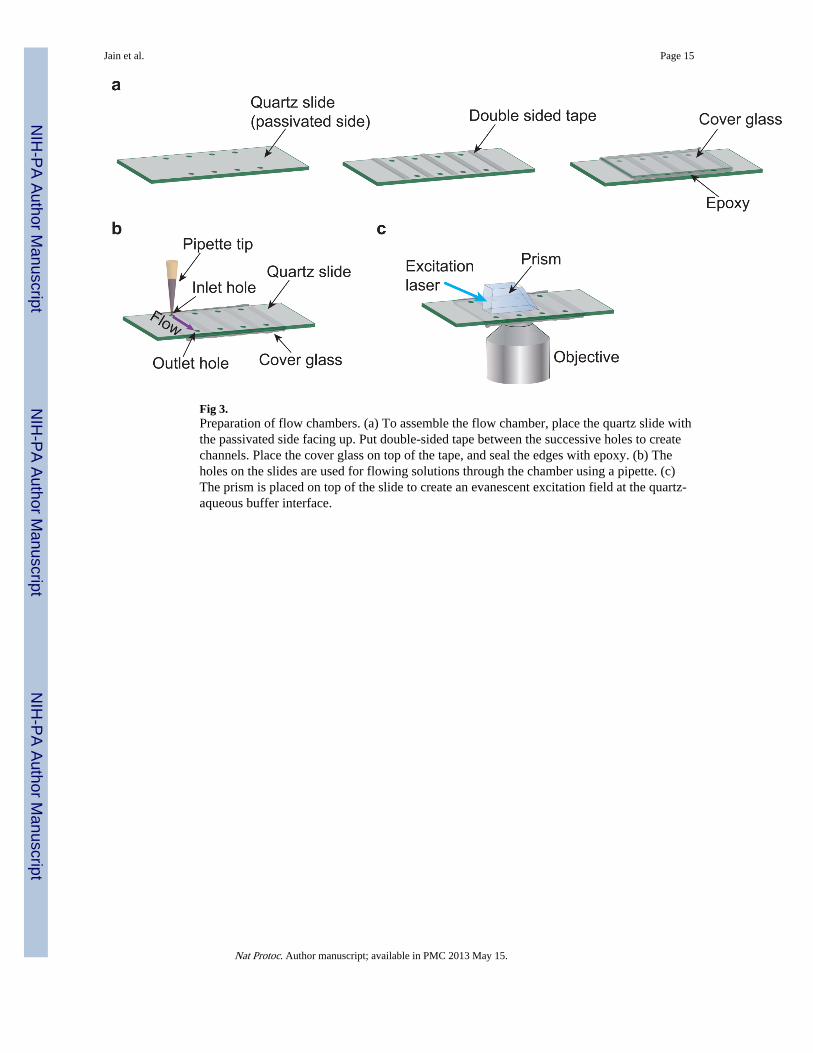
Fig 3.Preparation of flow chambers. (a) To assemble the flow chamber, place the quartz slide withthe passivated side facing up. Put double-sided tape between the successive holes to createchannels. Place the cover glass on top of the tape, and seal the edges with epoxy. (b) Theholes on the slides are used for flowing solutions through the chamber using a pipette. (c)The prism is placed on top of the slide to create an evanescent excitation field at the quartz-aqueous buffer interface.
Jain et al. Page 15
Nat Protoc. Author manuscript; available in PMC 2013 May 15.
NIH
-PA Author Manuscript
NIH
-PA Author Manuscript
NIH
-PA Author Manuscript

Fig. 4.Determination of lysate dilution factor for protein kinase A tagged with YFP and HA tags.The lysate concentration is serially increased starting with a 5,000-fold dilution (secondfrom left), to a 250-fold dilution (right). Image in left depicts background. The optimalfluorophore density for resolving single fluorophores is 0.1 – 0.2 fluorophores per µm2 asdepicted in the center two images. Scale bar is 5 µm.
Jain et al. Page 16
Nat Protoc. Author manuscript; available in PMC 2013 May 15.
NIH
-PA Author Manuscript
NIH
-PA Author Manuscript
NIH
-PA Author Manuscript
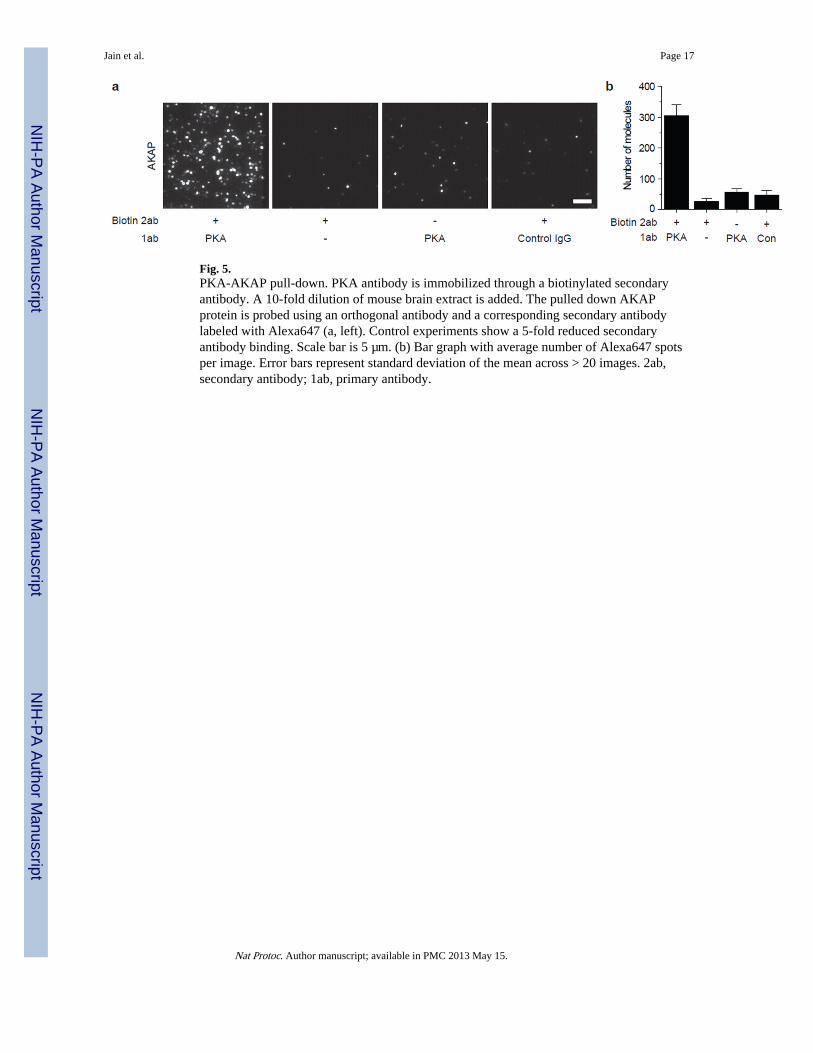
Fig. 5.PKA-AKAP pull-down. PKA antibody is immobilized through a biotinylated secondaryantibody. A 10-fold dilution of mouse brain extract is added. The pulled down AKAPprotein is probed using an orthogonal antibody and a corresponding secondary antibodylabeled with Alexa647 (a, left). Control experiments show a 5-fold reduced secondaryantibody binding. Scale bar is 5 µm. (b) Bar graph with average number of Alexa647 spotsper image. Error bars represent standard deviation of the mean across > 20 images. 2ab,secondary antibody; 1ab, primary antibody.
Jain et al. Page 17
Nat Protoc. Author manuscript; available in PMC 2013 May 15.
NIH
-PA Author Manuscript
NIH
-PA Author Manuscript
NIH
-PA Author Manuscript
NIH
-PA Author Manuscript
NIH
-PA Author Manuscript
NIH
-PA Author Manuscript
Jain et al. Page 18
Table 1
Troubleshooting guide.
Step Problem Possible cause Solution
14 High background fluorescence withoutprotein immobilization
Surface impurities during slidepreparation. For example, aminosilaneor PEG may be contaminated.
Make new PEG slides, using fresh reagents.
15 Non-specific binding of proteins The PEG passivation is not good orhas deteriorated
Make new PEG slides.
22 No or few bait protein detected Low sample concentration in thelysate.
Increase the concentration of lysate added to theflow chamber.
22 No bait protein detected Antibodies do not recognize theprotein
Try a different antibody against a differentepitope on the bait protein
23 No expected prey protein detected Antibodies do not recognize theprotein
Try a different antibody against a differentepitope on the prey protein
24 The specific binding yields only a 2–3fold higher binding as compared to thecontrol channel
High non-specific binding ofantibodies against prey
Optimize the concentration of cell lysate and/orantibodiesWash with more stringent buffer conditions(high salt or a buffer with detergent) to removenon-specifically adsorbed proteins.
24 The control channel has same numberof fluorophores as the sample channel
Surface passivation is not good Make new PEG slides.
Nat Protoc. Author manuscript; available in PMC 2013 May 15.