Investigation into Cracking in Reinforced Concrete Water ...
Upload
khangminh22Category
view
3download
0
Shell Martinez Refinery Energy Strategy Projects Contains Confidential Business Information
Page 1 of 24
This memo details how we will present data for LCFS-qualifying energy improvements installed at the Catalytic Cracking Unit at the Shell Martinez Refinery during the 2018 turnaround. Any numbers used in this memo are based on project design premises.
General Process Description of a Catalytic Cracking Unit A Catalytic Cracking Unit (CCU), is a gasoline producing unit that utilizes fluidized catalyst to crack heavy hydrocarbon molecules called vacuum gas oils into (shorter) gasoline molecules. This reaction is not completely specific; that is, there are many other products such as slurry oil, light cycle oil (LCO), and lighter molecules such as dry gas and C3s/C4s that also must be processed further before they can be blended into salable products. Many refinery processes pass a hydrocarbon feedstock over a fixed bed of catalyst (in the presence of heat and hydrogen), and the reactions produce desired products or intermediates. This scheme is prevalent in processes such as hydrotreating and hydrocracking. The difficulty with these processes is that over time, the catalyst loses its effectiveness (deactivates), which means the process must be shut down, the vessels de-inventoried, so that the catalyst can be replaced with fresh catalyst. This requires advanced planning and a specific selection of feedstock and process conditions to manage the catalyst deactivation rate, therefore limiting the range of feedstocks and the severity of conditions allowed during the lifespan of the catalyst. In the mid-20th century, researchers began to experiment with the idea of a process that continuously regenerated the catalyst so that such change-outs are not necessary, and lower quality feeds can thereby be processed without concern for catalyst life and degradation. Initial designs included conveyer belts that would continuously dump catalyst from the reactor to a regenerator and then back again. Eventually, researchers discovered fluidization, which is the concept that small catalyst fines – think of sand – can be made to act like a liquid if a gas stream of high enough velocity is applied. Once this fluidization occurs, the catalyst can be transported between a reactor and regenerator just by means of applying steam or air as a fluidization stream. This is ultimately how a catalytic cracker works: 1) In the reactor riser, fluidized catalyst contacts the preheated hydrocarbon liquid feed and the reaction
described above - cracking heavy hydrocarbon to gasoline - occurs rapidly. The reaction is endothermic (requires and absorbs heat). The reaction also forms a byproduct, called coke – from the heavy hydrocarbon – depositing carbon solids on the fluidized catalyst.
2) In the upper section of the reactor, entrained catalyst and hydrocarbon vapors are separated by cyclones. 3) The fluidized catalyst acts purely on the pressure differential between the regenerator and reactor, and
the “spent catalyst” flows from the reactor the regenerator 4) In the regenerator, the spent catalyst contacts air, which burns off the coke/carbon to form CO and CO2,
thereby restoring the activity of the catalyst. This combustion reaction is exothermic, generating heat. 5) The hot catalyst flows on pressure balance back to the riser, also transferring its heat to the reactor riser
where the cracking reactions take place, and we begin on step (1) 6) Meanwhile, the hydrocarbon vapors leaving the reactor go to the Main Fractionator, where they separate
out into different fractions: gasoline and lighter, LCO, and slurry. 7) The gasoline and lighter molecules are further separated into various products in the Cat Gas Plant (CGP)
Shell Martinez Refinery Energy Strategy Projects Contains Confidential Business Information
Page 2 of 24
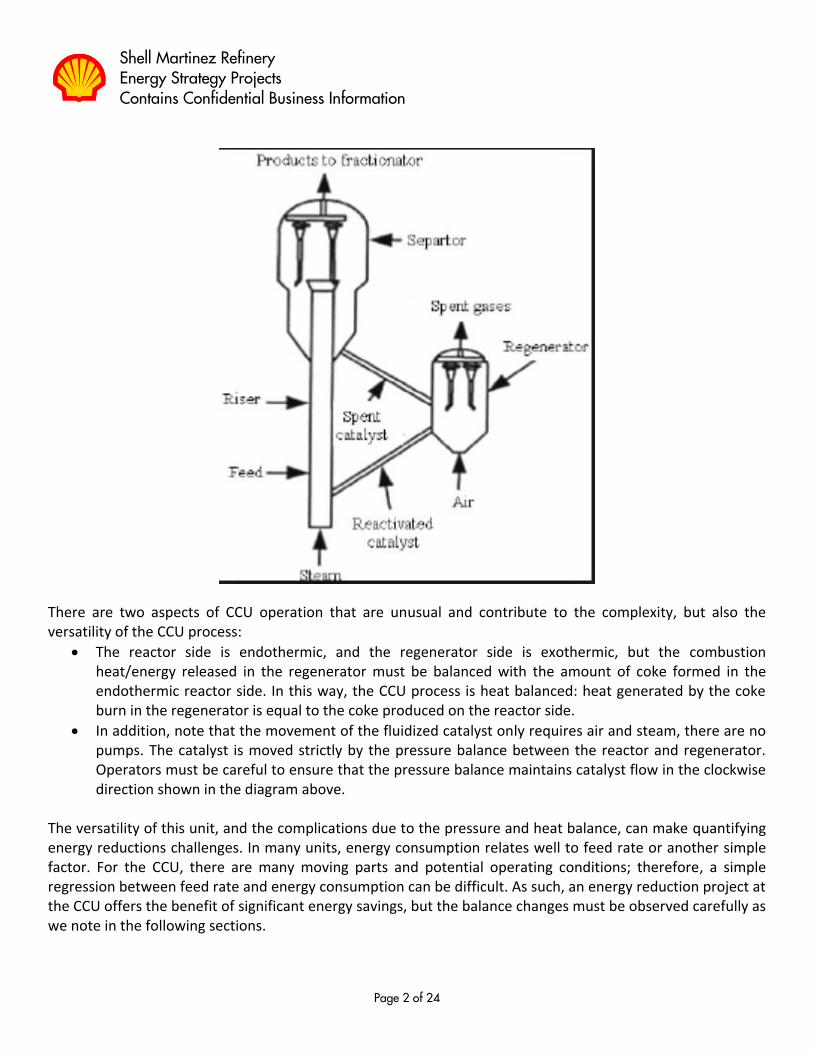
There are two aspects of CCU operation that are unusual and contribute to the complexity, but also the versatility of the CCU process:
• The reactor side is endothermic, and the regenerator side is exothermic, but the combustion heat/energy released in the regenerator must be balanced with the amount of coke formed in the endothermic reactor side. In this way, the CCU process is heat balanced: heat generated by the coke burn in the regenerator is equal to the coke produced on the reactor side.
• In addition, note that the movement of the fluidized catalyst only requires air and steam, there are no pumps. The catalyst is moved strictly by the pressure balance between the reactor and regenerator. Operators must be careful to ensure that the pressure balance maintains catalyst flow in the clockwise direction shown in the diagram above.
The versatility of this unit, and the complications due to the pressure and heat balance, can make quantifying energy reductions challenges. In many units, energy consumption relates well to feed rate or another simple factor. For the CCU, there are many moving parts and potential operating conditions; therefore, a simple regression between feed rate and energy consumption can be difficult. As such, an energy reduction project at the CCU offers the benefit of significant energy savings, but the balance changes must be observed carefully as we note in the following sections.
Shell Martinez Refinery Energy Strategy Projects Contains Confidential Business Information
Page 3 of 24
Process Description of the Martinez Steam Distribution System The steam distribution system at Martinez consists of a 650#, 300#, 160#, 50# and 20# header. The sources of steam are the two Heat Recovery Steam Generators (HRSGs) that are part of the Cogeneration plant, the CO boilers (COBs), and several other waste heat boilers and steam drums associated with the Hydrogen plants and other process units. The methodology to calculate the efficiency of these steam generators is outlined in Appendix A. Turbine drivers and 650#/160# steam pressure letdown stations supply the 160# steam system, as well as several 160# steam generators. There are similar pressure letdown stations for 650#/300#, 160#/50#, and 50#/20#. Most of the swing in the steam system demand is controlled by supplemental (natural gas) firing of the HRSGs and COB heaters; therefore, any energy savings initiative related to steam will ultimately lead to a reduction in supplemental firing and therefore natural gas usage.
Understanding the CCU Process Flow Diagram (PFD) Pre-Project The CCU process at Martinez is shown in the detailed PFD on the next page. The general outline is as follows:
• CCU feed from two feed pre-treatment units (hydrotreaters) is fed to the feed surge drum (FSD)
• From there, the feed is pumped through the feed pre-heat furnace F-66 and into the reactor riser
• The reaction process takes place in the reactor riser as per the previous section discussion
• Separation of catalyst and hydrocarbon takes place in the cyclones at the top of the reactor, and the catalyst goes through the stripper and on to the regenerator
• Hydrocarbon vapors from the reactor move into the bottom of the Main Fractionator (MF) column, where the various products are separated by distillation
o The bottoms product is called slurry, and contains catalyst fines o The next ‘cut’ above this is the light gas oil (LGO), which is Hydrocracker Unit (HCU) feed, and is
diesel range material o The product above this is the overhead naphtha (gasoline) cut that is then processed through
the gas plant
• In the gas plant, the MF overhead feed consists of a mixture of hydrocarbon molecules and other gases that have boiling points of 500 deg F and lower, and the distillation columns in the gas plant serve to separate this mixture into multiple product streams:
o Dry gas consists of N2, CO2, CO, H2, methane, C2 and some C3s. This is the top product from the Rectified Absorber (RA) column
o The bottoms of the RA column go to the debutanizer column to make C3/C4 stream that goes to a C3/C4 splitter and on to other processes to make higher octane gasoline blend components
o The bottoms of the debutanizer go to the Cat Gas Depentanizer (CGDP) that takes C5/C6 molecules as tops product for gasoline blending.
• The bottoms of the CGDP goes to the gasoline column to make a light cat cracked gasoline (LCCG) stream that goes to a hydrotreater, and a heavy cat cracked gasoline (HCCG) stream that goes to another hydrotreater. The HCCG stream is ultimately converted to jet fuel while the LCCG is ultimately converted to gasoline.
Shell Martinez Refinery Energy Strategy Projects Contains Confidential Business Information
Page 4 of 24
CFH
Tk1142
TK1346
TK1347
Tk1132
DCU
FXU
DHT
DHGO
DLGO
FXU HGO
CU/VFU
Tk1144
Tk1143 TK608
J125
F-67
LGO to HCU
Stripping
Steam
Stripping
SteamCutter Stock
IR P/AAlky DIB Reboiler
C-128 Reboiler
CGH Stablizer
Alky Deprop Reboiler
RA ReboilersUCR P/A
Martinez CCU/CGP Simplified Process Flow
Sour Water
to Riser
Reflux
VLO
(Volatile Lean Oil)
E-748
VLO Chiller
C-174
Polywash
Column
C-125
RA
Column
C-126
Sponge
Column
IR from MF
IR to MF
Feed Diversion to
MF Slurry Return
E-749
RLO Chiller
RLO (Recycle Lean Oil)
C-127
Debutanizer
Column
PRT
E-148M/G
SPARE
V-597FSS
F-66
J-123
V-596
Third Stage
Separator
V-593
Regenerator
Cooling
Steam
Catalyst
Fines to
Spent
Catalyst
Hopper
Main
CFN
NC NC
Air
F65
Feed Diversion to
MF Slurry Return
NC
V-594
Stripper
Vessel
V-595
Reactor
Vessel
5HC183
Regen Slide Valve
5HC207
Reactor Slide
Valve
5HC192
Stripper Slide
Valve
CGDP
Bypass
C-14204
CGDP
Amylenes
(C5's)
Heavy Gasoline to HGHT
Delayed
Coking
Dry Gas to treaters and FGBD
C3/C4 to Treater and
then C3/C4 Splitter
CGH FSD
V-692
Light Gasoline
to CGH
C-128
Gasoline
Column
C-119
Main Fractionator
Slurry Return
Slurry Underflow to Riser
Slurry
Underflow NC
Flashed Distillates From VFU
SR XHGO from CU
Hot CFH Product
NC
Hot Flashed
Distillates to
CFH
CFH Cold
Feed
Flashed Distillates to DHT
NC
NO
NC
LS
XLS
XLS or LS
NO
NC
E-739's E-740's
V-598
E-746
E-747A/B
E-859
E-751
V-610
E-757
E-759
E-760A
E-760B
Hydroclones
FP-12041A/B
E-758A-D
To CO Boilers
E-16229A/B
TB-
149
Helper Turbine
650 psig steam ATM
Hot DHT Prod (Added 5/08)
to DCU
Clarif ied Oil
V-589CCU FSD
TK1084
not
heated
E-757
Debut Reboiler
E-744 A/B/C/D
160 psig Steam Generators to TK-22/24
FV-1099
Slurry MF Bottoms Quench
4
PV-171
Regen Pressure
Valve
E-751
E-859
E-1626
E-720
E-759
E-707
E-702
V-599
C-122
C-121
Stripping
Steam
Sour Water
and/or Rerun
28
29
40
37
41
50
E-744 C/D
160 psig Steam Generators
NNF
P-2234/35
P-2236
P-2237
P-2242/43
P-8655
P-2247/48
Large: P-12643/44
Small: P-2249/50
P-2244/45
P-2246
P-2238/39
P-4107/8
P-2260/61
P-2262/2274
P-14218/219
P-16238/239P-14234/235
P-2267/68
P-2271/72
P-14269/270
P-2265
P-12127/128 P-12129/130
P-2270
LCO to MF
via 5FV771
P-2266/59
Blast-off Air
1
2
3
4
5
6
7
8
E-14223
E-20158
HRSG
Water
To
COGEN
9
E-745
10
11
10
12
13 14
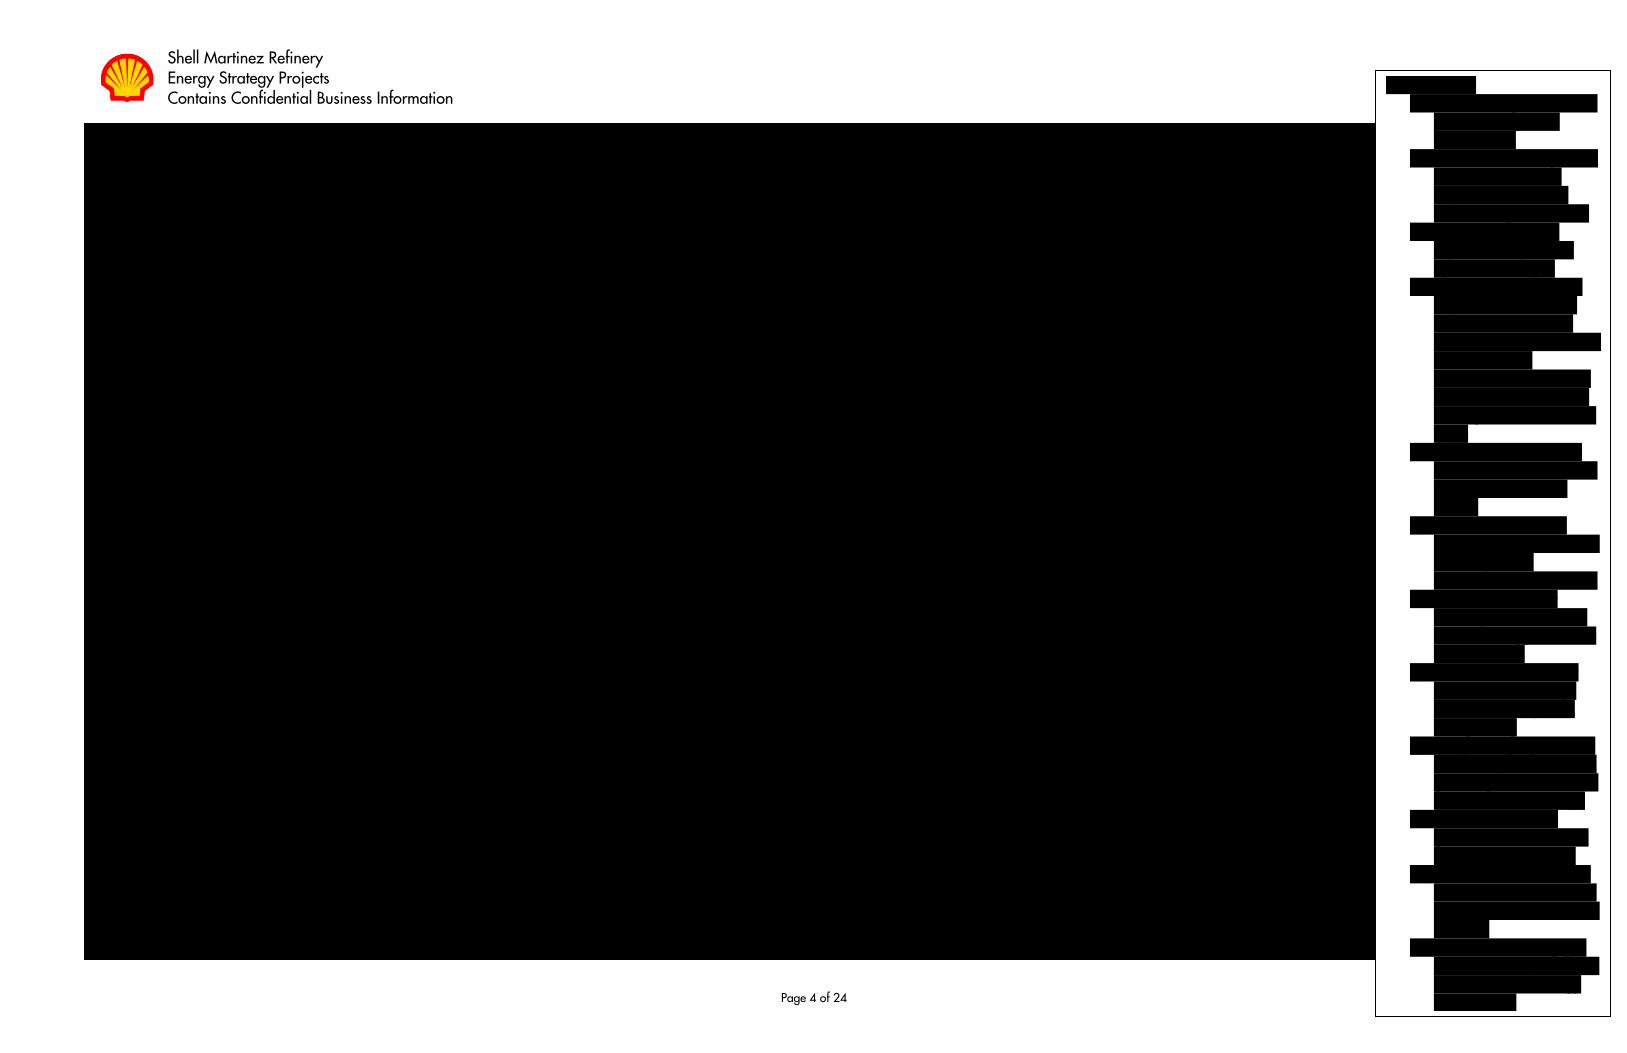
Process Flow:
1) Feed from upstream units
passes through feed
furnace F-66
2) Feed and hot catalyst mix
in the riser, reaction
begins and takes <10
seconds to get to reactor
3) In reactor, cyclones
separate catalyst from
hydrocarbon vapor
4) Catalyst is pressured to
regenerator, where the
coke is burned off the
catalyst by addition of air.
This reaction is
exothermic, and the heat
carried by the catalyst is
used by the reaction back
at (2)
5) The air blower J-123 is
used to burn the coke and
was modified by this
project
6) Overhead line where
hydrocarbon vapors make
their way to the
distillation section of unit
7) A boiler feed water
exchanger E-20158 was
installed to bypass the air
cooler E-1626
8) The Main Fractionator
tower C-119 had trays
removed and replaced
with packing
9) The packing replacement
increases pressure on wet
gas compressor suction J-
125 and reduces energy
10) Additional steam is
generated at 160# steam
generators E-744 A-D
11) HCCG is now drawn off
the middle of the MF and
fed into C-122 rather than
at C-128
12-14) Reduced throughput
in downstream plants will
cause increased energy
consumption
Shell Martinez Refinery Energy Strategy Projects Contains Confidential Business Information
Page 5 of 24
Changes Completed During the 2018 CCU/CGP Turnaround (T/A) During the CCU turnaround (May 4 to July 3, 2018), a major project was implemented in the CCU/CGP that reduces CGP throughput, recovers energy at the CCU Main Fractionator, reduces wet gas compressor energy demand, and reduces regenerator air blower energy demand. These specific changes were involved:
• Added structured packing to the Main Fractionator C-119 (8) to reduce the column pressure drop and therefore wet gas compressor J-125 steam demand (9).
• Added a boiler feed water exchanger, E-20158, on the Main Fractionator C-119 (7) – known as the “HRSG Feedwater Economizer.” This exchanger was installed in parallel with Air Cooler, EA-1626 in the Main Fractionator’s Upper Circulating Reflux (UCR) pump-around.
• Added an HCCG side draw (11) on the Main Fractionator C-119, thereby reducing HCCG flow through the downstream gas plant. This side draw reduces steam demand and reboiler duty in the CGP because less energy is needed for separations.
• Added controls to the air blower J-123 to reduce steam/electricity demand (5).
Steam Reduction at Wet Gas Compressor, J-125
A source of energy reduction for the changes during the T/A focuses on the replacement of several fractionation trays with structured packing in the Main Fractionator (8). This modification reduced the pressure drop on the Main Fractionator which increased the pressure at the top of the column and therefore the suction pressure at the Wet Gas Compressor (WGC), J-125 (9). The required work the compressor must do for the same discharge pressure was reduced, thereby reducing the 650# steam requirement to the turbine driver. The estimated savings from reducing the suction pressure is 18.76 MMBTU/hr based on process modeling. Discussion on Gathering, Monitoring, and Verifying Data: The steam flow to the turbine is calculated based on valve rack positions, which can be used with a valve curve correlation to determine flow rates. This was done because direct steam measurements for this machine have proven to be historically unreliable. The energy savings can be determined using the equations below – see Appendix B for details; the projected savings for the project are used as an example.
Reduced CO2 from the steam savings at J-125: ➔ 18.76 MMBTU/HR x 24 hours/day x 365 days/year x 162.56 lbs CO2/MMBTU[1] x 4.536 x 10-4
MT/lb = 12,122 MT CO2 reduction
Shell Martinez Refinery Energy Strategy Projects Contains Confidential Business Information
Page 6 of 24
Heat Recovery at HRSG Feedwater Economizer, E-20158
Another source of energy reduction for the changes during the T/A focuses on recovering heat by adding a boiler feed water (BFW) pre-heat exchanger, E-20158, (7) on the Main Fractionator’s Upper Column Reflux (UCR) pump-around. The UCR provides cooling in the upper section of the MF column to achieve the desired separation. E-20158 was installed parallel to UCR Air Cooler, EA-1626. The control systems were configured to preferentially route UCR through E-20158 for cooling, rather than through EA-1626, therefore recovering heat energy that had previously been exhausted to the atmosphere. Furthermore, drawing HCCG from the side of the MF column requires less heat removal from the Air Coolers, EA-739A-F, in the overhead reflux section and more heat removal in the UCR section, recovering more exhausted heat as BFW preheat. Like other steam generators, the HRSGs require de-aerated BFW to generate 650# steam, and that 650# steam is in turn used for de-aeration. By pre-heating the BFW, the temperature of the BFW to the de-aeration vessels at the HRSG is increased. This causes the de-aeration steam control (which is pressure-controlled) to reduce 650# steam flow, which will in-turn increase the pressure of the 650# steam system. Because the HRSG/COB firing is pressure-controlled on the 650# system and the above reduction will raise the pressure of the 650# steam system, supplemental firing is estimated to be reduced by ~24.5 MMBTU/hr based on process modeling. Discussion on Gathering, Monitoring, and Verifying Data: The exchanger duty is calculated for the water side based on direct readings of flow and temperature and the specific heat of water, which is a constant. The energy savings can be determined using the equations below – see Appendix C for details; the projected savings for the project are used as an example.
Q = MCpDT Where Q – exchanger duty (MMBTU/hr); M – mass rate (lb/hr); Cp – specific heat (BTU/lb°F); DT – differential temperature across one side of the process
Reduced CO2 from the heat recovery at E-20158: ➔ 24.50 MMBTU/hr / 100% eff x 24 hours/day x 365 days/year x 162.56 lbs CO2/MMBTU[1] x
4.536 x 10-4 MT/lb = 15,825 MT CO2 reduction
Shell Martinez Refinery Energy Strategy Projects Contains Confidential Business Information
Page 7 of 24
Increased 160# Steam Generation
Because drawing HCCG at the Main Fractionator (11) rather than from the Gasoline Column resulted in a reduction in throughput at the CGP, the energy requirement to reboil the distillation columns in the CGP decreases. The CGP reboilers exchange heat in the Main Fractionator’s UCR, IR, and Slurry pumparound (cooling) loops. To make up for the reduced cooling duty provided from the CGP reboilers, the 160# steam generators (E-744A-D) (10) and the HRSG Feedwater Economizer provide the additional cooling. This results in more steam generation at E-744A-D. With C-122 in operation, 160# steam generation is anticipated to increase by 7 Mlbs/hr based on process modeling which equates to 11.64 MMBTU/hr. Ultimately, increasing 160# steam generation decreases 650# steam at the sites main boilers. Discussion on Gathering, Monitoring, and Verifying Data: The 160# steam make is determined from a direct reading of the meter. The energy savings can be determined using the equations below – see Appendix D for details; the projected savings for the project are used as an example.
Reduced CO2 from the steam savings elsewhere by generating more 160# steam through the project: 7.0 mlbs/hr steam x (1280 btu/lb 160# steam) / 77% eff = 11.64 MMBTU/hr ➔ 11.64 MMBTU/HR x 24 hours/day x 365 days/year x 162.56 lbs CO2/MMBTU[1] x 4.536 x 10-4
MT/lb = 7,516 MT CO2 reduction **Divide by 77% efficiency because this is the efficiency of the CO boiler that will likely be reduced when the steam
consumption is reduced.
Shell Martinez Refinery Energy Strategy Projects Contains Confidential Business Information
Page 8 of 24
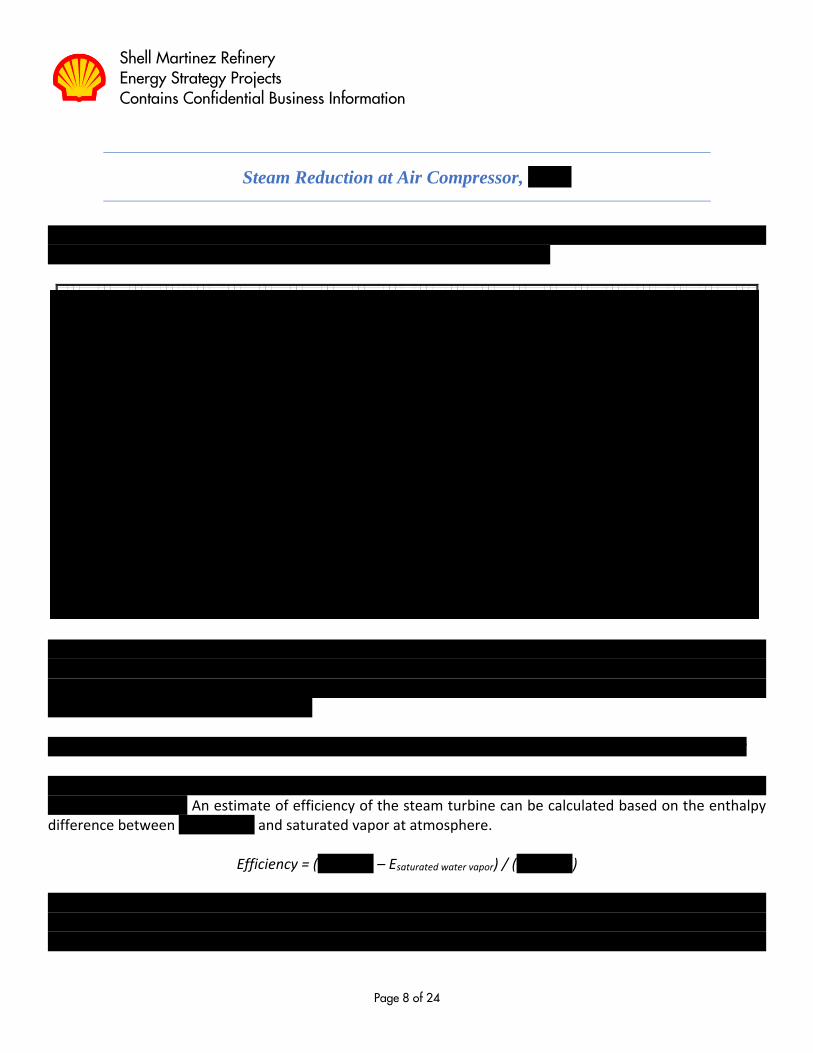
Steam Reduction at Air Compressor, J-123
Another source of energy reduction for the changes during the T/A focuses on automation of the steam controls to the steam turbine (TB-162) on the CCU Air Compressor (J-123) (5).
As shown, the Air Compressor, J-123, is driven by a power recovery turbine, also referred to as the “Expander” (TB-149), a motor/generator (M-6304), and a steam turbine (TB-162). Additional energy not provided by the expander must come from the motor and / or turbine. Overall, the total horsepower requirement of the air compressor can be calculated as follows: Total HP demand on Air Compressor = Expander HP (fixed based on process) + Motor HP + Steam Turbine HP The turbine uses 650# steam and vents to atmosphere across the machine; it is therefore the more inefficient of the two machines. An estimate of efficiency of the steam turbine can be calculated based on the enthalpy difference between 650# steam and saturated vapor at atmosphere.
Efficiency = (E650#steam – Esaturated water vapor) / (E650#steam) Assuming the enthalpy of superheated 650# steam is 1376 btu/lb, and the enthalpy of saturated vapor at atmospheric conditions is 1100 btu/lb, the efficiency of the machine is 20%. It would therefore make sense to utilize the motor, M-6304, which is much higher in efficiency, around 90%. However, this is not possible
1. Demand on Air compressor is
set by process conditions 2. HP recovered by expander is
also set by process conditions
3. So any HP needed to meet air
compressor demand beyond expander
must be made up by motor and steam
Shell Martinez Refinery Energy Strategy Projects Contains Confidential Business Information
Page 9 of 24
because the demands of the air compressor typically exceed what the motor can provide without exceeding the amperage design limits. Therefore, the steam turbine must be used to supplement the horsepower provided by the motor. Prior to the turnaround, the steam to the turbine was adjusted manually to keep the motor M-6304 from breaching limits on the amperage, typically once every other day. This manual method of control led to an overuse of steam and underuse of the motor. The project installed a control valve that remotely controls the steam flow to the turbine to meet the power demands more efficiently (i.e. maximally use the motor and provide the rest from steam) and without requiring manual valve adjustment. This is projected to reduce steam consumption by approximately 20mlbs/hr of 650# steam. Because the HRSG/COB firing is pressure-controlled on the 650# system and the above reduction will raise the pressure of the 650# steam system, supplemental firing will be reduced by ~30 MMBTU/hr. Because usage of the motor was not previously maximized, the electrical consumption is projected to increase by approximately 1.2 MWhrs to offset the decreased steam usage. Discussion on Gathering, Monitoring, and Verifying Data: The CO2 reduction from the J123 modifications is calculated based on direct readings of both the steam meter and the electrical usage. The energy savings can be determined using the equations below – see Appendix E for details; the projected savings for the project are used as an example.
Reduced CO2 from the steam savings: 20 mlbs/hr steam x (1100 BTU/lb Saturated Vapor @ Atm conditions)** / 77% eff = 28.57 MMBTU/hr ➔ 28.57 MMBTU/HR x 24 hours/day x 365 days/year x 162.56 lbs CO2/MMBTU[1] x 4.536 x 10-4
MT/lb = 18,455 MT CO2 reduction
Increased CO2 from increased electricity usage: ➔ 1.172 MW x 24 hrs/day x 365 days/year x 815.5 lbs CO2/MWh[2] x 4.536 x 10-4 MT/lb = 3,797
MT CO2/year increase from electrical consumption In total, that will be 18,455 MT CO2/year – 3,797MT CO2/year = 14,658 MT/year reduction in CO2.
**Taken as the enthalpy of saturated vapor at atmospheric conditions since the steam is vented to atmosphere off the turbine
Shell Martinez Refinery Energy Strategy Projects Contains Confidential Business Information
Page 10 of 24
Reduced Energy Consumption at CGDP
A source of energy reduction for the changes during the T/A focuses on benefits of reduced energy consumption in downstream plants that now see reduced throughput. With less throughput in the plant, there is less heat medium (650# steam) required to heat up the feed. We expect there to be reduced 650# steam consumption in the Cat Gas Depentanizer (CGDP) (12) by an estimated 5.4 Mlbs/hr based on process modeling that was done as part of the project. Because the HRSG/COB firing is pressure-controlled on the 650# system and the above reduction will raise the pressure of the 650# steam system, supplemental firing is estimated to be reduced by ~9.7 MMBTU/hr based on process modeling. Discussion on Gathering, Monitoring, and Verifying Data: The steam usage at the CGDP can be directly measured by steam flow meters. The energy savings can be determined using the equations below – see Appendix F for details; the projected savings for the project are used as an example.
Reduced CO2 from steam savings: 5.4 mlbs/hr steam x (1376 btu/lb 650#) / 99% eff** = 7.50 MMBTU/hr ➔ 7.51 MMBTU/HR x 24 hours/day x 365 days/year x 162.56 lbs CO2/MMBTU[1] x 4.536 x 10-4
MT/lb = 4,848 MT CO2 reduction **The usage of 99% efficiency rather than 77% is location-based (accounting for hydraulic distribution of steam) and is addressed in appendix A
Increased Fired Duty on Downstream Furnaces
A source of energy consumption increase for the changes during the T/A focuses on increased fired duty on the LGO Stripper Reboiler F-67 (13) and the downstream hydrotreater feed furnace F-61 (14) (not explicitly shown on the PFD). The F-67 duty is expected to increase when the HCCG Stripper, C-122, is online because a portion of its fired duty is used for reboiling the stripper column, and the LGO product temperature must be maintained. This is anticipated to increase by 8.9 MMBTU/hr based on process modeling that was done as part of the project. The F-61 furnace is in the Cat Gasoline Hydrotreater plant. Because there will be less olefin feed to the CGH, and the exothermic reaction from cracking this olefin feed is a major source of energy through the plant, the heater must fire harder to compensate for the lower amount of energy released. The firing is anticipated to increase by 3.7 MMBTU/hr based on process modeling that was done as part of the project.
Shell Martinez Refinery Energy Strategy Projects Contains Confidential Business Information
Page 11 of 24
Both reductions can be demonstrated by duty calculations that are part of furnace environmental reporting and are calibrated as such. These are the same duty calculations established in the section “Heat Recovery at HRSG Feedwater Economizer, E-20158.” Discussion on Gathering, Monitoring, and Verifying Data: The CO2 emissions increase at the heaters is calculated based on direct readings of the refinery fuel gas meters. The energy savings can be determined using the equations below – see Appendix G for details; the projected savings for the project are used as an example.
Increased CO2 from increased heater firing at F-67 (LGO furnace): ➔ 8.9 MMBTU/HR x 24 hours/day x 365 days/year x 162.31 lbs CO2/MMBTU[1] x 4.536 x 10-4
MT/lb = 5,749 MT CO2 reduction
Increased CO2 from increased heater firing at F-61 (CGH furnace): ➔ 3.7 MMBTU/HR x 24 hours/day x 365 days/year x 162.31 lbs CO2/MMBTU[1] x 4.536 x 10-4
MT/lb = 2,390 MT CO2 reduction
In total, that will be 8,139 MT CO2/year increase in CO2.
Shell Martinez Refinery Energy Strategy Projects Contains Confidential Business Information
Page 12 of 24
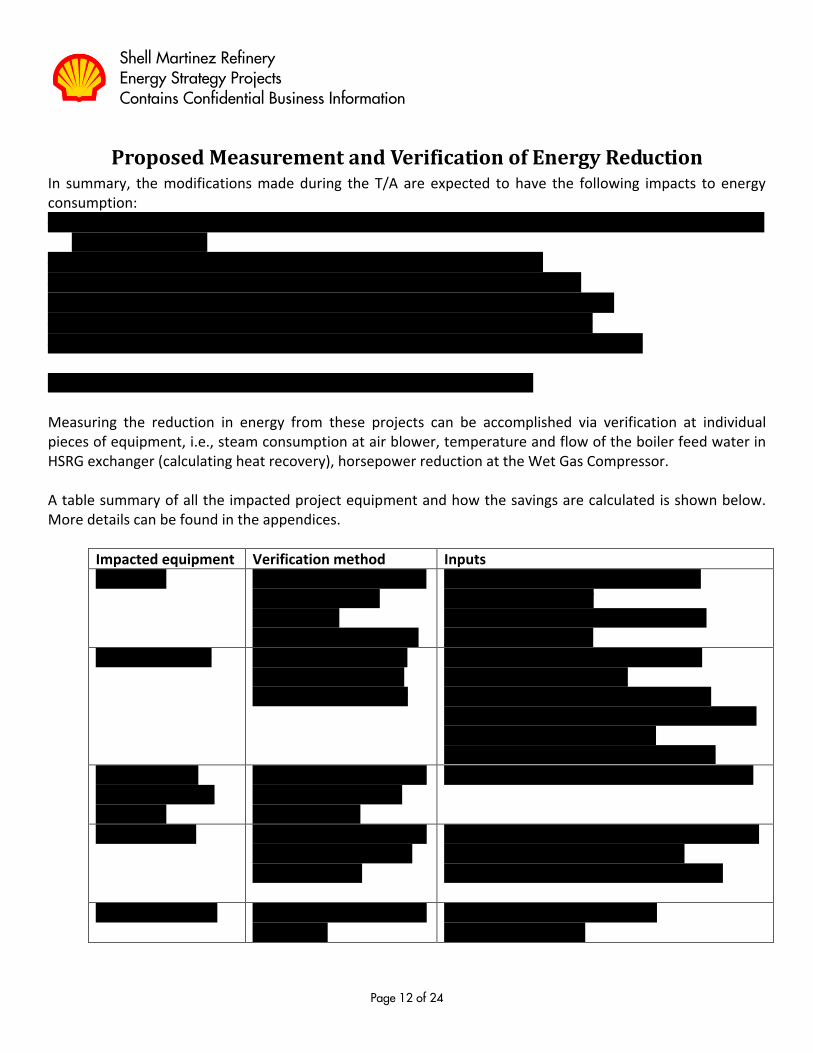
Proposed Measurement and Verification of Energy Reduction In summary, the modifications made during the T/A are expected to have the following impacts to energy consumption:
• Install packing on Main Fractionator to reduce suction pressure and therefore steam consumption on WGC J-125: -12,120 MT/yr
• Recover heat by installing a HRSG Feedwater Economizer: -15,825 MT/yr
• Produce additional 160# steam from existing steam generators: -7,9516 MT/yr
• Modify controls on air blower J-123 and decrease 650# steam usage: -14,658 MT/yr
• Reduce CGDP throughput and therefore 650# steam consumption: -4,848 MT/yr
• Increase in LGO Fired Duty Heater and CGH Fired Duty Heater: +5,749 MT/yr and +2,390 Overall, the net change in CO2 emissions is estimated to be -46,829 MT/yr. Measuring the reduction in energy from these projects can be accomplished via verification at individual pieces of equipment, i.e., steam consumption at air blower, temperature and flow of the boiler feed water in HSRG exchanger (calculating heat recovery), horsepower reduction at the Wet Gas Compressor. A table summary of all the impacted project equipment and how the savings are calculated is shown below. More details can be found in the appendices.
Impacted equipment Verification method Inputs
WGC J-125 Calculation of steam usage based on valve rack positions and manufacturer valve curve
V1 valve positon is measured directly as [5HC1250A.PV@mzrpi] V2 Valve position is measured directly as [5HC1250B.PV@mzrpi]
HRSG economizer Calculation of heat duty based on Q= McpDT on water side of exchanger
M: boiler feed water flow rate based on [66FC114.PV@mzrpi] [GPM] Cp: constant for water, 60 [BTU/lb-deg F] DT: differential temperature based on upstream and downstream thermocouples 5TI1088.PV [deg F] and 5TC148.PV [deg F]
Additional 160# steam from steam generators
Calculated based on steam flow measurements on steam generator
5FI553.PV [Mlbs/hr] steam flow from generator
Air blower J123 Calculated based on steam usage to the turbine and motor amperage
Steam measured directly by 5FI237.PV [Mlbs/hr] and can be verified by steam balance Electricity measured by 5WI984.PV [AMPS]
CGDP steam usage Calculated based on steam flow to unit
Steam flow directly measured by (41FC17.PV)[Mlbs/hr]
Shell Martinez Refinery Energy Strategy Projects Contains Confidential Business Information
Page 13 of 24
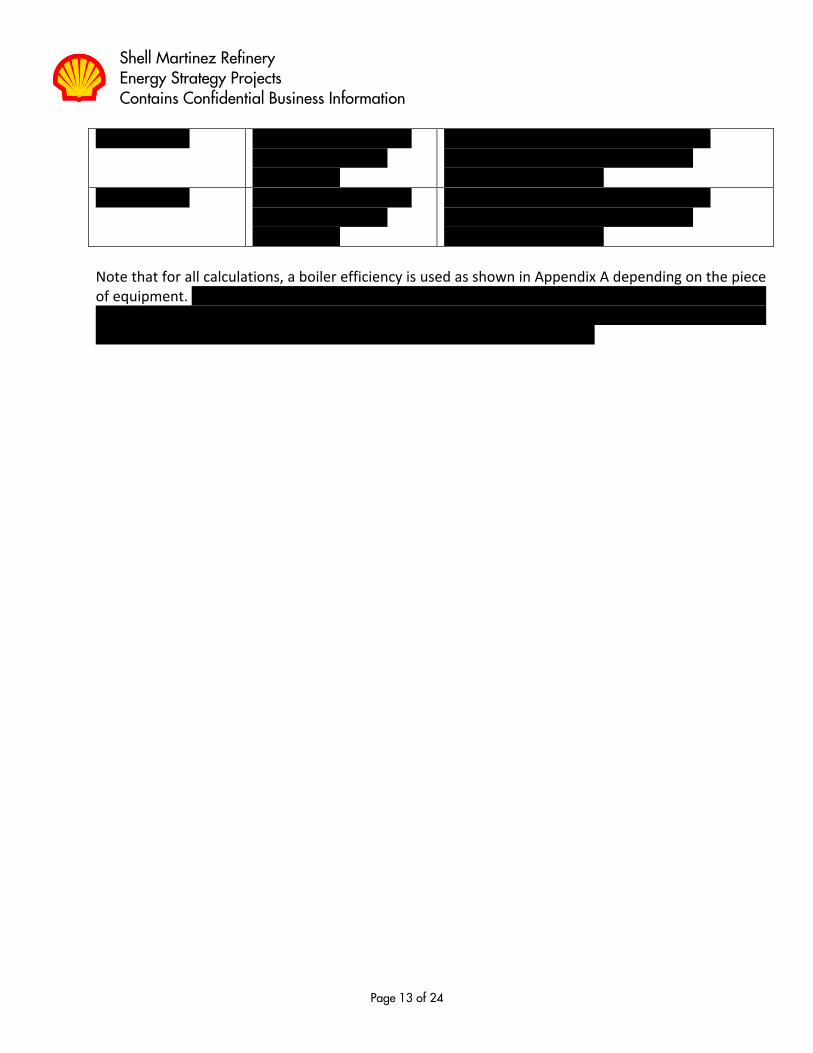
F61 firing duty Calculated based on fuel gas flow and fuel gas heating value
Directly measured by fuel gas flow meter 6FC127.PV (F-61) [MMBTU/hr] used in environmental reporting
F67 firing duty Calculated based on fuel gas flow and fuel gas heating value
Directly measured by fuel gas flow meter 5FC317.PV (F-67) [MMBTU/hr] used in environmental reporting
Note that for all calculations, a boiler efficiency is used as shown in Appendix A depending on the piece of equipment. All 650# steam savings are assumed to be at 1376 BTU/lb and all 160# steam savings are assumed at 1280 BTU/lb. This was determined by using direct temperature and pressure readings on each steam header and using online steam tables to determine the enthalpy.
Shell Martinez Refinery Energy Strategy Projects Contains Confidential Business Information
Page 14 of 24
References 1. Baral, Anil. “RE: thermal factor for natural gas for large and small industrial boilers” Message to Michael
Carr. 9 Apr 2019. E-mail. 2. United States Environmental Protection Agency, 11th edition of the Emissions & Generation Resource
Integrated Database with year 2014 data (eGRID2014v2, released February 27, 2017): https://www.epa.gov/sites/production/files/2017-02/documents/egrid2014_summarytables_v2.pdf
3. Ganapathy, V. “Boiler Efficiency Calculations Simplified.” Steam Generators and Waste Heat Boilers, Feb. 2011, http://vganapathy.tripod.com/efficy.html.
Shell Martinez Refinery Energy Strategy Projects Contains Confidential Business Information
Page 15 of 24
Appendix A: Explanation of Boiler Efficiency Throughout this report, two different boiler efficiencies are used depending on the equipment in question; 77% and 99%, based on the two sources of steam for the refinery; the CO boilers and the HRSGs. The energy savings for this project will be determined based on assumptions about where firing will be reduced for each portion of the project based on equipment location. At the HRSGs, the efficiency is assumed to essentially 100%, meaning that 1 MMBTU/hr of energy savings reduces firing at the HRSG by the same amount. Assuming 100% efficiency is the most conservative assumption since it’s a 1:1 reduction in firing. This efficiency is considered standard for HRSGs because:
• They are fired using high temperature exhaust gas from the gas turbine generators
• The exhaust gas contains excess O2 by design
• Therefore supplemental firing at the HRSG does not require pre-heating of air as would be the case in a standard furnace, which would reduce its efficiency
At the CO Boilers, the efficency is calculated to be 77%, meaning that 1 MMBTU/hr of energy savings reduces firing at the CO Boilers by 1.30 MMBTU/hr. This efficiency calculation is done per Solomon standards, which cites the same source here [3]. Efficiency, %LHV = UAL – (0.001244+0.0216*EA)(Tg-Ta)
• EA = excess air factor -- EA is calculated by taking 0.98*(1+stack O2/(20.9-stack O2)) o Where stack O2 is in mol %, wet basis
• UAL = unaccounted losses -- UAL is calculated by taking 100% - heat loss (as % fired) o Where heat loss is assumed 10% on industrial boilers
• Tg = exit gas air temperature, °F
• Ta = reference air temperature, °F For all the equipment in the CCU area (besides the HRSG economizer), this report assumes that incremental energy savings will come from reduced CO boiler firing since the CO boilers are in the CCU area and therefore provide a large portion of the steam to the CCU. For the HRSG economizer, this report assumes that incremental energy savings will be at the HRSG deaerators, where 650# steam will be reduced directly. For the CGDP savings, this report assumes savings at the HRSGs at ~99% because the HRSGs are the closest primary boilers and would be the mostly likely to adjust to decreased demand at the CGDP.

Shell Martinez Refinery Energy Strategy Projects Contains Confidential Business Information
Page 16 of 24
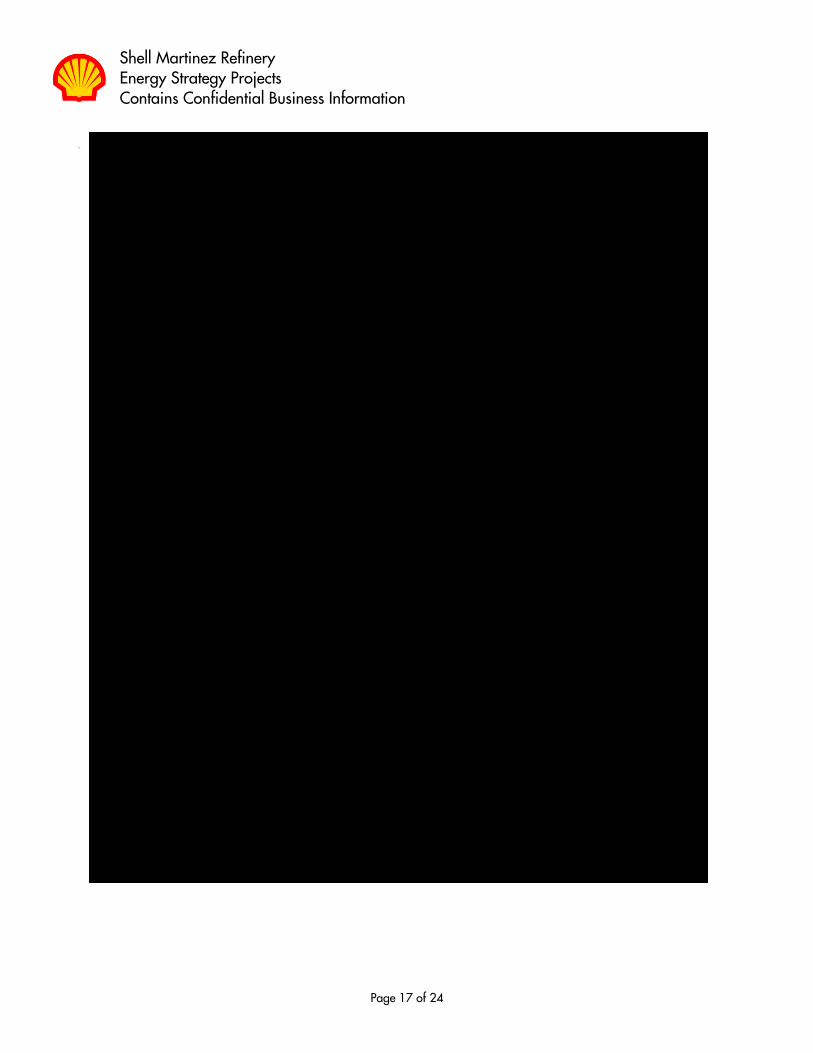
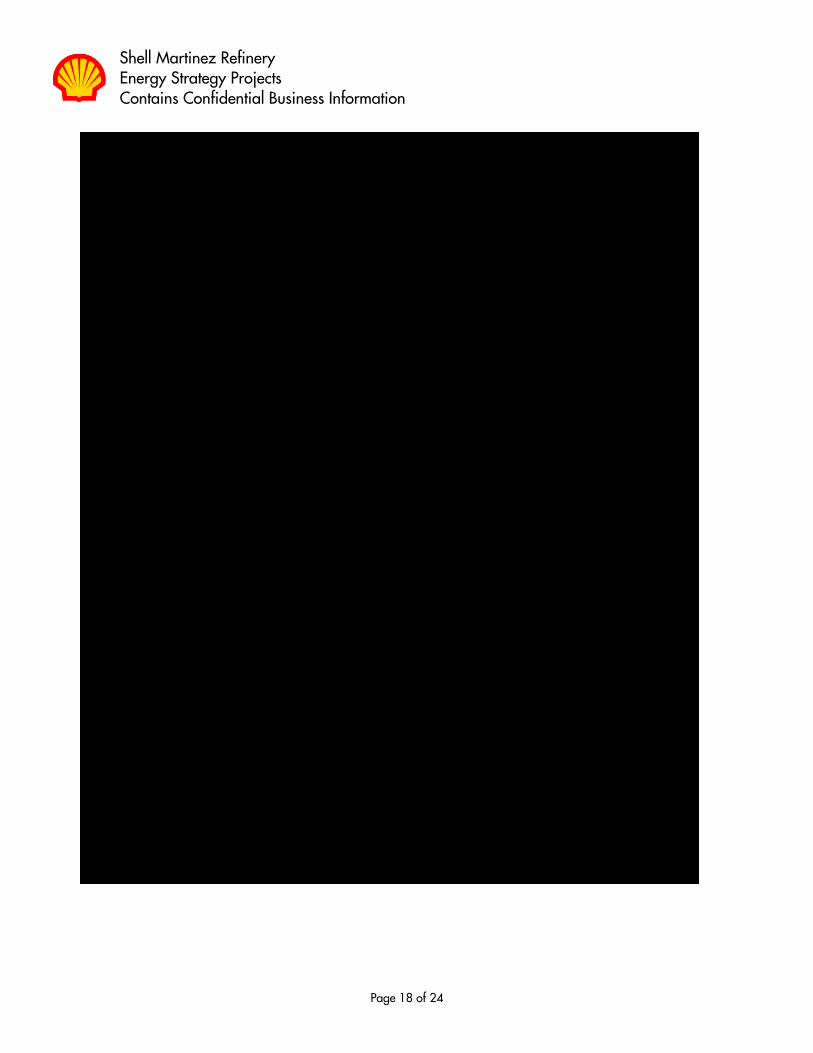
Appendix B: Calculations to Support Savings at Wet Gas Compressor J-125 Historically, there have been issues getting an accurate measurement from the WGC steam. The most accurate way to do this is by using the position of the valve rack that controls steam to the turbine; this valve rack position is finely tuned to allow a certain steam flow. In fact, the site has historically used valve rack position as a way of calculating steam flow to the turbine, and thus horsepower, to limit the valve rack position and prevent an overspeed event and critical failure of the turbine. This is done by measuring the position of the valve rack relative to the valve curves shown below. There are two valves in this system - a V1 valve and V2 valve. The V1 valve is the primary 650# steam valve, while the V2 valve is the valve that lets steam into the turbines secondary chamber and eventually to be condensed completely. What doesn’t get let down to the secondary chamber is exhausted into the 160# steam header for further use eleswhere in the refinery. The position of the valve rack for each valve relative to the valve curves indicates the flow through that valve – these curves are shown below and are provided directly from the manufacturer. With this information, the overall energy consumption of the turbine can be determined as follows: Total energy use [MMBTU/hr] = (650# steam to turbine [Mlbs/hr] x heating value 1 [BTU/lb]) – (160# steam exiting turbine [Mlbs/hr] x heating value 2 [BTU/lb]) Which becomes: Total energy use [MMBTU/hr] = ((V1 valve position [PCT] x steam usage [Mlbs/hr] / position curve output [PCT]) x heating value [BTU/lb]) – ((V2 valve position [PCT] x steam usage [Mlbs/hr] / position curve output [PCT]) x heating value [BTU/lb]))
• V1 valve positon is measured directly as 5HC1250A.PV [PCT]
• V2 Valve position is measured directly as 5HC1250B.PV [PCT]
• Heating value 1 is taken as 160# superheated enthalpy 1280 [BTU/lb]
• Heating value 2 is taken as low pressure steam enthalpy 1050 [BTU/lb] Overall CO2 emissions reduction can be calculated as shown in the body of the report (assuming an 18.76 MMBTU/hr energy reduction as an example): ➔ 18.76 MMBTU/HR x 24 hours/day x 365 days/year x 162.56 lbs CO2/MMBTU[1] x 4.536 x 10-4 MT/lb =
12,122 MT CO2 reduction
Shell Martinez Refinery Energy Strategy Projects Contains Confidential Business Information
Page 17 of 24
V1 valve curve
Shell Martinez Refinery Energy Strategy Projects Contains Confidential Business Information
Page 18 of 24
V2 valve curve
Shell Martinez Refinery Energy Strategy Projects Contains Confidential Business Information
Page 19 of 24
Appendix C: Calculations to Support Savings at HRSG Feedwater Economizer, E-20158 The economizer pre-heats boiler feed water to the HRSG de-aerators. The exchanger duty can be calculated from the oil side (UCR loop) or the water side. Because the specific heat of the oil side will vary with temperature, it is much simpler to use the water side to calculate the duty directly. As such, all metered points used in the calculation are from the water side. The exchanger duty calculation is shown below: Q [MMBTU/hr]= M [lb/hr] x Cp [BTU/lb-deg F] x DT [deg F]
• Water flow rate (M) is measured directly as 66FC114.PV [GPM] and converted to lbs/min using a factor of 8.34
• Delta temperature (DT) is calculated using the direct measurement of the upstream temperature 5TI1088.PV [deg F] and downstream temperature 5TC148.PV [deg F]
• Specific heat (Cp) of water is taken as a constant of 60 [BTU/lb-deg F] Which gives: Total exchanger duty [MMBTU/hr] = 66FC114.PV [GPM] x 8.34 [lb/gal] x 60 [BTU/lb-deg F] x 5TC148.PV [deg F] - 5TI1088.PV [deg F] Overall CO2 emissions reduction can be calculated as shown in the body of the report (assuming 24 MMBTU/hr of heat recovery as an example): ➔ 24.50 MMBTU/hr / 100% eff x 24 hours/day x 365 days/year x 162.56 lbs CO2/MMBTU[1] x 4.536 x 10-4
MT/lb = 15,825 MT CO2 reduction

Shell Martinez Refinery Energy Strategy Projects Contains Confidential Business Information
Page 20 of 24
Appendix D: Calculations to Support Savings through Increasing 160# Steam Make The 160# steam make flow is directly read at the plant through 5FI553.PV [Mlbs/hr]. With this information, the overall energy savings from increased 160# make can be determined as follows: Steam Energy [MMBTU/hr] = Change in steam consumption [Mlbs/hr] x Enthalpy 160# superheated Steam [BTU/lb] / Boiler Efficiency
• Steam production is measured directly as 5FI553.PV [Mlbs/hr]
• Enthalpy of 160# superheated enthalpy is 1280 [BTU/lb] Overall CO2 emissions reduction can be calculated as shown in the body of the report (assuming a 7.0 mlbs/hr steam reduction as an example):
7.0 mlbs/hr steam x (1280 btu/lb 160# steam) / 77% eff = 11.64 MMBTU/hr ➔ 11.64 MMBTU/HR x 24 hours/day x 365 days/year x 162.56 lbs CO2/MMBTU[1] x 4.536 x 10-4
MT/lb = 7,516 MT CO2 reduction
Shell Martinez Refinery Energy Strategy Projects Contains Confidential Business Information
Page 21 of 24
Appendix E: Calculations to Support Savings at Air Compressor J-123 The horsepower required to drive J-123 is provided from the expander (TB-149), a motor/generator (M-6304), and a steam turbine (TB-162). The total energy used by the compressor is shown below: Total HP demand on Air Compressor = Expander HP (fixed based on process) + Motor Amps → HP + Steam Turbine Energy → HP
• Expander HP – not measured, defined by process
• Motor HP – measured directly as 5WI984.PV [AMPS]
• Steam turbine HP – measured directly as 5FI237.PV [Mlbs/hr] Before the turnaround in 2018, the steam meter for the air blower turbine, 5FI237.PV was not reading. This was projected to be fixed during the turnaround; however, for the purposes of comparing pre and post turnaround data, Martinez will use a steam balance calculation. The 650# steam system in the CCU consists of steam to TB-152 (the steam turbine associated with the WGC), steam to CCU slurry pumps, and steam to J116 and J118, two recycle hydrogen compressors in the adjacent units. There is a total 650# steam meter to this part of the plant, and so the steam to TB-152 can be calculated by difference in lieu of a direct reading. Steam used at TB-162 [Mlbs/hr] = Total 650# steam to CCU [Mlbs/hr] – 650# steam to TB-152 [Mlbs/hr] – 650# steam to J-116 [Mlbs/hr] – 650# steam to J-118 [Mlbs/hr] – 650# steam to slurry pumps [Mlbs/hr]
• Steam to CCU is measured directly as 5FI689.PV [Mlbs/hr]
• Steam to TB-152 is measured through the valve 1 rack calculation shown in Appendix B
• Steam to J-116 is measured direclty as 6FI126.PV [Mlbs/hr]
• Steam to J-118 is measured direclty as 6FI359.PV [Mlbs/hr]
• Steam to the slurry pumps is not metered but assumed to be 8.8 Mlbs/hr based on pump curve data Which gives Steam used at TB-162 [Mlbs/hr] = 5FI689.PV [Mlbs/hr] – CEMIS_CCU_V1_Flow [Mlbs/hr] – 6FI126.PV [Mlbs/hr] – 6FI359.PV [Mlbs/hr] – 8.8 After the turnaround, this calculation can be compared to the actual steam meter to TB152 to ensure accuracy. Once this is done, then comparisons of pre and post T/A data will be considered equivalent. With this information, the energy savings from decreased 650# usage can be determined as follows: Steam Energy at TB-162 [MMBTU/hr] = Change in steam consumption [Mlbs/hr] x Enthalpy Saturated vapor at atm. conditions [BTU/lb] / Boiler Efficiency

Shell Martinez Refinery Energy Strategy Projects Contains Confidential Business Information
Page 22 of 24
So overall CO2 emissions reduction can be calculated as shown in the body of the report (assuming a 20 mlbs/hr steam reduction as an example):
Reduced CO2 from the steam savings: 20 mlbs/hr steam x (1100 BTU/lb Saturated Vapor @ Atm conditions)** / 77% eff = 28.57 MMBTU/hr ➔ 28.57 MMBTU/HR x 24 hours/day x 365 days/year x 162.56 lbs CO2/MMBTU[1] x 4.536 x 10-4
MT/lb = 18,455 MT CO2 reduction
Increased CO2 from increased electricity usage: ➔ 1.172 MW x 24 hrs/day x 365 days/year x 815.5 lbs CO2/MWh[2] x 4.536 x 10-4 MT/lb = 3,797
MT CO2/year increase from electrical consumption In total, that will be 18,455 MT CO2/year – 3,797MT CO2/year = 14,658 MT/year reduction in CO2.
Shell Martinez Refinery Energy Strategy Projects Contains Confidential Business Information
Page 23 of 24
Appendix F: Calculations to Support Savings at CGDP The 650# steam usage at CGDP is direclty measured as 41FC17.PV [Mlbs/hr]. With this information, the overall energy savings from decreased throughput and therefore decreased 650# steam usage can be determined as follows: Steam Energy [MMBTU/hr] = Change in steam consumption [Mlbs/hr] x Enthalpy 160# superheated Steam [BTU/lb] / Boiler Efficiency
• Steam production is measured directly as 41FC17.PV [Mlbs/hr]
• Enthalpy of 650# superheated enthalpy is 1376 [BTU/lb] Overall CO2 emissions reduction can be calculated as shown in the body of the report (assuming a 5.4 Mlbs/hr steam reduction as an example):
5.4 mlbs/hr steam x (1376 btu/lb 650#) / 99% eff** = 7.51 MMBTU/hr ➔ 7.51 MMBTU/HR x 24 hours/day x 365 days/year x 162.56 lbs CO2/MMBTU[1] x 4.536 x 10-4
MT/lb = 4,848 MT CO2 reduction
Shell Martinez Refinery Energy Strategy Projects Contains Confidential Business Information
Page 24 of 24
Appendix F: Calculations to Support Increased Firing at F-61 and F-67 The increased usage from increased firing values are calculated directly from fuel gas measurements 6FC127.PV (F-61) [MMBTU/hr] and 5FC317.PV (F-67) [MMBTU/hr]. With this information, the overall energy increase from increased firing can be determined as follows: Furnace Firing Energy Increase [MMBTU/hr] = Change in Firing at F-61 [MMBTU/hr] + Change in Firing at F-67 [MMBTU/hr]
• Change in firing at F-61 is measured as 6FC127.PV [MMBTU/hr]
• Change in firing at F-67 is measured as 5FC317.PV [MMBTU/hr] Overall CO2 emissions increase can be calculated as shown in the body of the report (assuming an 8.9 MMBTU/hr (F-67) and 3.7 MMBTU/hr (F-61) increased firing project premise as an example):
Increased CO2 from increased heater firing at F-67 (LGO furnace): ➔ 8.9 MMBTU/HR x 24 hours/day x 365 days/year x 162.31 lbs CO2/MMBTU[1] x 4.536 x 10-4
MT/lb = 5,749 MT CO2 reduction
Increased CO2 from increased heater firing at F-61 (CGH furnace): ➔ 3.7 MMBTU/HR x 24 hours/day x 365 days/year x 162.31 lbs CO2/MMBTU[1] x 4.536 x 10-4
MT/lb = 2,390 MT CO2 reduction
In total, that will be 8,139 MT CO2/year increase in CO2.
Copyright © 2022 FDOKUMEN