Investigation into Cracking in Reinforced Concrete Water ...
203
Investigation into Cracking in Reinforced Concrete Water-retaining Structures by Christina Helen McLeod March 2013 Thesis presented in fulfilment of the requirements for the degree of Master of Science in Engineering in the Faculty of Engineering at Stellenbosch University Supervisors: Prof JA Wium & Prof JV Retief
-
Upload
khangminh22 -
Category
Documents
-
view
1 -
download
0
Transcript of Investigation into Cracking in Reinforced Concrete Water ...
Investigation into Cracking in Reinforced Concrete
Water-retaining Structures
by
Christina Helen McLeod
March 2013
Thesis presented in fulfilment of the requirements for the degree of
Master of Science in Engineering in the Faculty of Engineering at
Stellenbosch University
Supervisors: Prof JA Wium & Prof JV Retief

ABSTRACT
Durability and impermeability in a water-retaining structure are of prime importance if the
structure is to fulfill its function over its design life. In addition, serviceability cracking tends to
govern the design of water retaining structures. This research concentrates on load-induced
cracking specifically that due to pure bending and to direct tension in South African reinforced
concrete water retaining structures (WRS).
As a South African design code for WRS does not exist at present, South African designers
tend to use the British codes in the design of reinforced concrete water-retaining structures.
However, with the release of the Eurocodes, the British codes have been withdrawn, creating
the need for a South African code of practice for water-retaining structures. In updating the
South African structural design codes, there is a move towards adopting the Eurocodes so that
the South African design codes are compatible with their Eurocode counterparts. The Eurocode
crack model to EN1992 (2004) was examined and compared to the corresponding British
standard, BS8007 (1989). A reliability study was undertaken as the performance of the EN1992
crack model applied to South African conditions is not known. The issues of the influence of the
crack width limit and model uncertainty were identified as being of importance in the reliability
crack model.
Stellenbosch University http://scholar.sun.ac.za

ii
Declaration
By submitting this thesis/dissertation electronically, I declare that the entirety of the work contained therein is my own, original work, that I am the sole author thereof (save to the extent explicitly otherwise stated), that reproduction and publication thereof by Stellenbosch University will not infringe any third party rights and that I have not previously in its entirety or in part submitted it for obtaining any qualification. Date: March 2013
Stellenbosch University http://scholar.sun.ac.za
ismith
Typewritten Text
Copyright 2013 Stellenbosch University All rights reserved
ismith
Typewritten Text

iii
ACKNOWLEDGEMENTS
First, my sincere thanks my supervisors at Stellenbosch University, Professor Jan Wium and
Professor Johan Retief, for their time, guidance and encouragement they always very willingly
gave.
Thank you to all those civil engineers in industry for their input into this research – the list is a
long one.
Thank you to Professor Geoff Pegram, Professor Derek Stretch and to Rod Rankine for their
assistance.
Last but not least, a big thank you to my family and friends for their love, encouragement and
support.
Stellenbosch University http://scholar.sun.ac.za

iv
LIST OF TABLES
Table 3.1: Summary of calculations of SLS ring tension and vertical bending moment using
Reynolds’ et al (2008) Table 2.75 for circular reservoir configuration. 41
Table 3.2: Maximum reinforcement area per face (%As) for minimum 75 mm bar spacing. 43
Table 3.3: Calculation of effective depth of the tension area (mm) for tension cracking. 49
Table 3.4: Comparison between BS8007 and EN1992 for varying crack widths 51
Table 3.5: Limiting crack width to EN1992-3 using hydraulic ratio hD/h. 52
Table 3.6: EN1992 Flexural cracking – Effect of reduction in crack width limit 53
Table 3.7: EN1992 Tension cracking – Effect of reduction in crack width limit (As both faces) 56
Table 3.8: EN1992 flexural load case: Summary of reinforcement requirements. 61
Table 3.9: EN1992 tension load case: Summary of reinforcement requirements
(As both faces) 62
Table 4.1: Relationship between β and pf 67
Table 4.2: Notional design working life to SANS 10160-1 (2011) 73
Table 4.3: Target Reliability Indices for Irreversible SLS to JCSS (2008). 74
Table 4.4: Target reliability levels (β) according to ISO 2394 and EN 1990 (Source: Retief and
Dunaiski, 2009) 75
Table 4.5: Summary of model uncertainty values obtained from literature applicable to EN1992
77
Table 4.6: Summary of basic variables for time-invariant reliability analysis, derived from
Holicky(2009), JCSS-PMC (2001), Fulton’s (2009) & Holicky et al (2009). 81
Table 5.1: Basic variables used in reliability crack model 89
Stellenbosch University http://scholar.sun.ac.za

v
Table 5.2: Flexural cracking: Reinforcement required for reliability & deterministic analyses. 99
Table 5.3: Tension cracking: Reinforcement required for reliability & deterministic analyses. 101
Table 5.4: Calculation of effective depth of the tension area (mm) surrounding the reinforcement
for tension cracking, where hc,eff is lesser of h/2 or 2,5(h-d). 107
Table 6.1: Sensitivity factors for flexural cracking at a β of 1,5. 115
Table 6.2: Sensitivity factors for tension cracking at a β of 1,5. 119
Table 6.3: Partial safety factors for flexural cracking case at β 1,5 123
Table 6.4: Summary of partial safety factors for tension cracking 127
Table 6.5: Influence of basic variables over varying reliability levels
(wlim = 0,2mm, θcov = 0,2) 128
Table 6.6: Partial safety factors for varying reliability levels (wlim = 0,2 mm, θcov = 0,2) 128
Table 7.1: Parameters for reliability calibration of EN1992 crack model 132
Table 7.2: Flexural cracking – Summary of theoretical partial safety factors (β 1,5). 133
Table 7.3: Tension cracking, hc,eff = 2,5(c + φ/2) - Summary of theoretical partial safety factors
(β 1,5). 134
Table 7.4: Tension cracking, hc,eff = h/2 - Summary of theoretical partial safety factors
(β 1,5). 135
Table 7.5: Flexural cracking – Influence of γL and 1/γft on γθ 136
Table A.1.1: ULS reinforcement to SANS10100 156
Table A.2.1: Select SLS flexural cracking results to BS8007: H = 5m 158
Table A.2.2: Select SLS flexural cracking results to BS8007: H = 7m 159
Table A.3.1: SLS Flexural cracking to EN1992 – Data for crack width for given
reinforcement 161
Stellenbosch University http://scholar.sun.ac.za

vi
Table A.3.2: SLS Flexural cracking to EN1992 – Data for crack width cont. 162
Table A.4.1: SLS Flexural cracking to EN1992 – Data - reinforcement for given crack width 164
Table A.5.1: SLS Tension cracking to BS8007 – Data 167
Table A.6.1: SLS Tension cracking to EN1992 – Data - crack width for given reinforcement 170
Table B.1.1: SLS Flexural cracking to EN1992 – FORM analysis data with θCoV 0,2,
wlim 0,2 mm 173
Table B.1.2: SLS Flexural cracking to EN1992 – FORM analysis data with θCoV 0,2,
wlim 0,05 mm 173
Table B.2.1: SLS Flexural cracking to EN1992 – FORM analysis data with θCoV 0,1,
wlim 0,2 mm 174
Table B.2.2: SLS Flexural cracking to EN1992 – FORM analysis data with θCoV 0,1,
wlim 0,05 mm 174
Table C.1.1: CHM reliability model using MH/JVR model 177
Table C.2.1: Tension cracking to EN1992 – θCoV 0,2 178
Table D.1.1: Flexural cracking: Sensitivity analysis using reverse-FORM 181
Table D.2.1: Tension cracking hc,eff = 2,5(c + φ/2): Sensitivity analysis using reverse-FORM 182
Table D.2.2 Tension cracking, hc,eff = h/2: Sensitivity analysis using reverse-FORM 183
Table E.1.1: Flexural cracking – Reliability calibration – reverse-FORM determination of crack
width 185
Table E.2.1: Tension cracking, hc,eff = 2,5(c + φ/2) – Reliability calibration – reverse-FORM
determination of crack width 186
Table E.2.2. Tension cracking, hc,eff = h/2 – Reliability calibration – reverse-FORM determination
of crack width 187
Stellenbosch University http://scholar.sun.ac.za
vii
LIST OF FIGURES
Figure 1.1: Flow chart of the investigation into cracking in WRS in South Africa 4
Figure 2.1: Load-deformation response to steadily increasing load (Source: Narayanan &
Beeby, 2005) 8
Figure 2.2: Crack-deformation response in load-controlled test (Source: Narayanan & Beeby,
2005) 9
Figure 2.3: Distance from surface crack to centre of bar for slab or wall section 10
Figure 2.4: Determination of Act,eff ( Source: Figure 7.1 of EN1992-1-1-1) 15
Figure 2.5: Determination of cracking reinforcement without calculation to EN1992-3 (2004) 17
Figure.2.6: Influence of cover on transfer length to Beeby. (Source: Eurocode 2 Commentary
(2008)) 21
Figure 2.7: Self-healing of cracks to Jones (2008) 25
Figure 2.8: Water tightness test for leakage (Source: Eyethu Consulting Engineers) 26
Figure 2.9: Autogenous healing tests (University of KwaZulu-Natal, 2012) 27
Figure 2.10: Deposition of calcium carbonate over time during testing (Mans (2012)) 27
Figure 2.11: Ofudu water reservoir leakage observed in September 2011(Source: Umgeni
Water) 28
Figure 2.12: Calcium carbonate deposition, Ofudu water reservoir, October 2012. 28
Figure 2.13: Site visit to Ofudu water reservoir, October 2012 29
Figure 2.14: Typical configurations for water reservoirs, KwaZulu-Natal 31
Figure 2.15: Distribution of ring tension and vertical bending moment over height of wall
(Source: Anchor et al (1983)) 33
Figure 2.16: Interior of reservoir – flat slab and column construction (Mucambe (2007)) 35
Stellenbosch University http://scholar.sun.ac.za

viii
Figure 3.1: Rectangular reservoir wall configuration 39
Figure 3.2: Circular reservoir configuration 40
Figure 3.3: Flexure case - Comparison between EN1992 & BS8007
(using ε2 for wlimit = 0,2 mm) 48
Figure 3.4: EN1992-1-1 & BS8007 (ε2 for wlimit = 0,2 mm) tension case crack width 50
Figure 3.5: EN1992 Flexural cracking – variation of reinforcement area with hydraulic ratio. 54
Figure 3.6: EN1992 Flexural cracking - Variation of ratio of As,k to As,0.2 with hydraulic ratio,
hD/h 54
Figure 3.7 EN1992 Tension cracking - Variation of ratio of As,k to As,0.2 with hydraulic ratio,
hD/h 57
Figure 3.8: EN1992 flexure load case – influence of SLS cracking 58
Figure 3.9: EN1992 tension cracking – influence of SLS cracking 59
Figure 4.1: Graphical representation of FORM (Source: Holický (2009)) 68
Figure 4.2: Comparison between test and calculated mean crack widths to EC2, MC90 and
PrEN. (Source: Peiretti et al (2003)) 82
Figure 4.3: Error crack width (Source: Peiretti (2003)) 82
Figure 5.1: Flowchart of EXCEL process to solve for β in reliability crack models 91
Figure 5.2: Initial input values for variables of reliability crack model 93
Figure 5.3 (a): Iteration 1 of FORM algorithm to calculate β 94
Figure 5.3 (b): Iteration 2 of FORM algorithm 95
Figure 5.4: Comparison of reliability models of CHM and MH et al (2009) 96
Figure 5.5: Comparison of reliability models with respect to β 97
Figure 5.6: Flexure - Effect of SLS on variation of with ratio ASLS/AULS 99
Figure 5.7: Tension – Significance of SLS on variation of reliability 100
Stellenbosch University http://scholar.sun.ac.za

ix
Figure 5.8: Flexural cracking - Effect of limiting crack width on variation of with %As 102
Figure 5.9: Tension cracking – Effect of crack width limit on variation of with %As 103
Figure 5.10: Flexure - Effect of model uncertainty on variation of with ratio ASLS/AULS 105
Figure 5.11: Tension Cracking – Effect of model uncertainty on variation of β with ASLS/AULS 106
Figure 5.12: Influence of hc,eff on the reliability of the tension crack model for θcov of 0,1 108
Figure 6.1: Sensitivity factors for Flexural Cracking (β of 1,5) 116
Figure 6.2: Sensitivity factors for Tension Cracking with hc,eff = 2,5(c + φ/2) (β 1,5). 118
Figure 6.3: Sensitivity factors for Tension Cracking with hc,eff = h/2 (β of 1,5) 120
Figure 6.4: Theoretical partial safety factors for flexural cracking (β of 1,5) 122
Figure 6.5 : Theoretical partial safety factors for tension cracking (hc,eff = 2,5(c + φ/2)) 125
Figure 6.6: Theoretical partial safety factors for tension cracking (hc,eff =h/2) 126
Figure 7.1: Flexure load case – variation of γθ with reinforcement (θCoV 0,2, β 1,5) 136
Figure 7.2: Flexure load case – variation of γθ with reinforcement as θCoV varies (β 1,5) 137
Figure 7.3: Tension Cracking (hc,eff =2,5(c + φ/2)) – variation of γθ with reinforcement
(θCoV 0,2, β 1,5) 138
Figure 7.4: Tension load case (hc,eff =2,5(c + φ/2)) - variation of γθ with reinforcement and
θCoV 139
Figure 7.5: Tension load case (hc,eff = h/2) - variation of γθ with reinforcement
(θCoV 0,2, β 1,5) 140
Figure 7.6: Tension load case (hc,eff = h/2) - variation of γθ with reinforcement as θCoV varies 140
Figure A.1.1: ULS reinforcement calculation to SANS10100 156
Figure A.2.1: SLS flexural cracking calculations to BS8007 using EXCEL spreadsheet 157
Figure A.3.1: SLS flexural cracking to EN1992 – calculation of crack width 160
Stellenbosch University http://scholar.sun.ac.za

x
Figure A.4.1: SLS flexural cracking calculations to EN1992 – calculation of reinforcement 163
Figure A.5.1: SLS tension cracking to EN1992 – calculations 166
Figure A.3.1: SLS tension cracking to EN1992 – calculation of crack width 169
Figure B.3.1: EN1992 flexural cracking - Partial differential equations 175
Figure C.3.1: Tension cracking to EN1992 – MATLAB equations for partial differentials 179
Stellenbosch University http://scholar.sun.ac.za

xi
TABLE OF CONTENTS
ABSTRACT ii
DECLARATION iii
ACKNOWLEDGEMENTS iv
LIST OF TABLES v
LIST OF FIGURES viii
CHAPTER 1: INTRODUCTION 1
1.1 Motivation 1
1.2 Objectives 2
1.3 Outline of thesis 2
CHAPTER 2: OVERVIEW OF CRACKING IN CONCRETE WATER RETAINING
STRUCTURES 5
2.1 GENERAL 5
2.2 SCOPE OF DESIGN CODES RELEVANT TO SOUTH AFRICA 6
2.3 CRACK MODELS DUE TO LOADING DEFORMATIONS 6
2.3.1 General 6
2.3.2 BS 8007 Equations 9
2.3.3 EN 1992 Equations 12
2.3.4 Durability and material specifications 19
2.3.5 South African structural codes of practice 21
2.4 LIMITS ON CRACK WIDTHS 22
2.5 CURRENT PRACTICES FOR WATER RETAINING STRUCTURES IN SOUTH AFRICA 29
2.5.1 General 29
2.5.2 General configurations of WRS in South Africa 30
2.5.3 Design practice 30
2.5.4 Material properties specified 35
2.6 SUMMARY 36
Stellenbosch University http://scholar.sun.ac.za

xii
CHAPTER 3: DESIGN ANALYSIS FOR CRACKING TO EN1992-1-1 &3 AND BS 8007 38
3.1 GENERAL 38
3.2 DETERMINISTIC CRACK ANALYSIS MODELS TO BS8007 AND EN1992-1-1 39
3.2.1 Structural configuration and loading 39
3.2.2 Design parameters 41
3.2.3 Ultimate limit state of loading calculations 44
3.2.4 Serviceability limit state of cracking due to loads 45
3.3 RESULTS AND DISCUSSION 47
3.3.1 Comparison of EN1992 and BS8007 – direct tensile and flexural load
cracking 47
3.3.2 Influence of specified maximum crack width limit to EN1992 52
3.3.4 Influence of SLS cracking (using EN1992) 57
3.3.5 Range of parameters for reliability analysis of EN1992 crack width
formulation 60
3.3.5.1 Wall height H 60
3.3.5.2 Section thickness h 60
3.3.5.3 Concrete cover c 62
3.3.5.4 Bar diameter φ 62
3.4 SUMMARY 63
CHAPTER 4: OVERVIEW OF RELIABILITY ANALYSIS w.r.t. MODELLING OF
CRACKING 65
4.1 GENERAL 65
4.2 THE FIRST ORDER RELIABILITY METHOD OF ANALYSIS 66
4.2.1 Limit state function 66
4.2.2 Definition of reliability index, β 67
4.2.3 First Order Reliability analysis (FORM) 67
4.2.4 Sensitivity analysis and calibration of model for design purposes 69
4.3 TARGET RELIABILITY 71
4.4 MODEL UNCERTAINTY 76
4.5 THE LIMIT STATE FUNCTION FOR THE EN1992-1 CRACK MODEL 77
4.6 GENERAL DATA FOR PROBABILISTIC PARAMETERS IN CRACKING MODEL 80
4.7 SUMMARY 83
Stellenbosch University http://scholar.sun.ac.za

xiii
CHAPTER 5: FORM ANALYSIS OF EN1992 CRACK MODEL 85
5.1 GENERAL 85
5.2 FORMULATION OF THE RELIABILITY LOAD-INDUCED CRACKING MODELS 86
5.2.1 Structural configuration for the reliability crack model 86
5.2.2 Formulation of FORM crack model equations 87
5.2.3 Values used for parameters of the reliability crack models 88
5.2.4 Formulation of reliability models using Microsoft EXCEL 90
5.3 VERIFICATION OF THE PROBABILISTIC MODEL 96
5.4 RESULTS AND DISCUSSION 97
5.4.1 Significance of serviceability limit state (SLS) load-induced cracking 98
5.4.2 Effect of the specified crack width limit, wlim, on reliability 101
5.4.3 Effect of Model uncertainty, θ, on reliability 104
5.4.4 Tension cracking: Influence of the effective depth of tension area on
reliability 106
5.5 SUMMARY 109
CHAPTER 6: SENSITIVITY ANALYSIS 111
6.1 GENERAL 111
6.2 FORMULATION OF REVERSE-FORM ANALYSIS CRACK MODELS 111
6.2.1 Structural configuration of the crack model 111
6.2.2 Formulation of reliability crack model for reverse-FORM analysis 112
6.2.3 Choice of values for model parameters 112
6.2.4 Formulation of the reverse-FORM model in Microsoft EXCEL 113
6.3 RESULTS AND DISCUSSION 114
6.3.1 Sensitivity of parameters 114
6.3.2 Theoretical partial safety factors 121
6.3.3 Influence of reliability level, β 127
6.4 SUMMARY 128
CHAPTER 7: RELIABILITY CALIBRATION OF PARTIAL SAFETY FACTORS 130
7.1 GENERAL 130
7.2 FORMULATION OF RELIABILITY CALIBRATION MODEL 130
7.2.1 Limit state function 131
7.2.2 Model parameters 132
Stellenbosch University http://scholar.sun.ac.za

xiv
7.2.3 Theoretical partial safety factors applied to design crack width, wd 133
7.3 RESULTS AND DISCUSSION 135
7.3.1 Model 1 - Flexural cracking 135
7.3.2 Model 2a - Tension cracking with hc,eff = 2,5(c + φ/2) 137
7.3.3 Model 2b - Tension cracking with hc,eff = h/2 139
7.4 SUMMARY 141
CHAPTER 8: FINAL SUMMARY AND CONCLUSIONS 143
8.1 General 143
8.2 Conclusions 145
8.2.1 Crack width limit 145
8.2.2 Reliability of EN1992 crack model 146
8.2.3 Model uncertainty in EN1992 crack model 147
8.3 Recommendations for further research 148
REFERENCES 150
APPENDIX A: SELECT DATA - DETERMINISTIC ANALYSIS for FLEXURAL AND TENSION
CRACKING 155
Appendix A.1: Ultimate Limit State loading calculations for reinforcement. 156
Appendix A.2 SLS cracking calculations and data for Flexural cracking to BS8007 157
Appendix A.3: SLS flexural cracking to EN1992: Crack width calculation 160
Appendix A.4: SLS flexural cracking to EN1992: Reinforcement calculation 163
Appendix A.5: SLS Tension cracking calculations and data to BS8007 166
Appendix A.6: SLS tension cracking to EN1992: Crack width calculation 169
APPENDIX B: SELECT DATA FOR FORM ANALYSIS - FLEXURAL CRACKING .172
Appendix B.1: Flexural cracking to EN1992 - Model Uncertainty Variation of 0,2 173
Appendix B.2: Flexural cracking to EN1992: Model Uncertainty Variation of 0,1 174
Appendix B.3: Flexural cracking to EN1992 – MATLAB equations for partial differentials
.175
Stellenbosch University http://scholar.sun.ac.za

xv
APPENDIX C: SELECT DATA FOR FORM ANALYSIS - TENSION CRACKING 176
Appendix C1: Verification of CHM reliability model – tension cracking model 177
Appendix C.2: Tension cracking to EN1992 178
Appendix C.3: Tension cracking to EN1992 – MATLAB equations for partial differentials
.179
APPENDIX D: SENSITIVITY ANALYSIS USING REVERSE-FORM ANALYSIS 180
Appendix D.1: Sensitivity analysis for flexural cracking 181
Appendix D.2: Sensitivity analysis for tension cracking 182
APPENDIX E: SELECT DATA FOR RELIABILITY CALIBRATION USING REVERSE-FORM
ANALYSIS 184
Appendix E.1: Reliability calibration of flexural cracking model 185
Appendix E.2: Reliability calibration of tension cracking model 186
Stellenbosch University http://scholar.sun.ac.za

1
CHAPTER 1
INTRODUCTION
1.1 Motivation
The aim of this thesis is to investigate serviceability cracking due to loading for small crack
widths, as applied to reinforced concrete water retaining structures (WRS) in a South African
context. Historically, South African design codes for structural concrete have been based on the
British standards. As a South African design code for WRS does not exist at present, South
African designers tend to use the British codes in the design of reinforced concrete water-
retaining structures. However, with the release of the Eurocodes, the British codes have been
withdrawn, creating the need for a South African code of practice for water-retaining structures.
In updating the South African structural design codes, there is a move towards adopting the
Eurocodes so that the South African design codes are compatible with their Eurocode
counterparts. The code of practice for loading of structures, SANS 10160: Basis of structural
design and actions for buildings and industrial structures (2011), has already been released.
The structural design codes for concrete structures, SANS10100-1 and -2, are currently under
revision and will also be compatible with the equivalent Eurocodes, with the likelihood that
Eurocode will be adopted. Motivation was thus created to carry out research to ensure that the
Eurocodes are compatible with South African parameters and practices in the design and
construction of reinforced concrete WRS. The new code for water retaining structures is
proposed as SANS10100-3: Design of concrete water-retaining structures.
Durability and impermeability in a water-retaining structure are of prime importance if the
structure is to fulfill its function over its design life. The control of cracking is therefore important
in the design and construction of this type of structure. This means that the serviceability
requirements for cracking, measured by a limiting maximum crack width, are more arduous for
WRS than in buildings. This study concentrates on load-induced cracking, specifically the load
cases of pure bending and pure tension. As the proposed new code of practice for WRS is to be
compatible with Eurocode, the Eurocode crack model to EN1992 (2004) was examined and
compared to the corresponding British standard, BS8007 (1989). A reliability study was
undertaken as the performance of the EN1992 crack model applied to South African conditions
is not known.
Stellenbosch University http://scholar.sun.ac.za

2
1.2 Objectives
The main objective of this thesis was to investigate cracking with respect to South African water
retaining structures. In the process of the research, three key issues were identified and are
summarised as follows:
(i) Serviceability limit state cracking tends to be dominant over ultimate limit state loading in
the case of WRS. Research using reliability analysis and limit state design has previously
tended to focus on the usually more dominant ultimate limit state of collapse, with limited
research on serviceability. The establishment of an appropriate target reliability was
therefore investigated.
(ii) Eurocode was found to have a more stringent limiting crack width of 0,05mm, as opposed
to the general limit of 0,2mm to BS8007 (BS8007 does allow for a further reduction in the
crack width limit to 0,1 mm for aesthetic reasons). The implications of this on the design
and construction of WRS obviously require further study.
(iii) Crack models have been developed largely empirically with little data available on the
uncertainty in the models and tend to be conservative. An investigation of model
uncertainty with respect to load-induced cracking in WRS would then be undertaken,
leading to possible future improvements in the crack models.
This research investigated these issues as outlined in the next section.
1.3 Outline of thesis
The structure and summary of the thesis is as follows:
Chapter 2: Literature and South African (SA) industry review with respect to cracking.
Chapter 3: Deterministic analysis of the BS8007 and EN1992 design procedures for
cracking.
Chapter 4: Overview of reliability and development of reliability model of the EN1992 crack
model.
Chapter 5: Reliability analysis of the EN1992 crack model using the First Order Reliability
Method (FORM).
Chapter 6: Sensitivity analysis of the EN1992 crack model using reverse-FORM.
Chapter 7: Reliability calibration of EN1992 crack model.
Chapter 8: Final conclusions and summary.
Stellenbosch University http://scholar.sun.ac.za
3
Appendices: Data sheets and graphs not presented in the main text of the thesis.
A summary and the structure of the research is shown in the flow chart presented as Figure 1.1.
The first step of this research was to undertake a literature study and review of the South
African industry with regard to the design and construction of water retaining structures,
presented in Chapter 2. This resulted in the identification of the key issues in the control of
cracking in WRS. Design code formulations and representative structural configurations with
respect to load-induced cracking were also investigated.
A deterministic analysis and comparison of the BS8007 and EN1992 design code crack
formulations, presented in Chapter 3, was undertaken as a first step in exploring the issues of
the degree of importance of serviceability cracking and the implications of using a smaller
limiting crack width. The deterministic analysis also aided in ascertaining representative cases
for use in the reliability crack models.
Reliability analysis using the First Order Reliability Method (FORM), presented over Chapters 4,
5, 6 and 7, was applied to the EN1992 crack models in order to explore all three key issues. A
literature review of reliability analysis was first undertaken, summarised in Chapter 4, along with
the development of the reliability crack models. Chapter 5 presents the investigation of the three
key issues by means of a forward-FORM analysis and is concerned mainly with the implications
of a smaller limiting crack width on the design of a WRS and model uncertainty. Three reliability
crack models were required for load-induced cracking, dependent on the load case and the
formulation of the effective depth of the tension zone in concrete subject to cracking.
A sensitivity analysis was then performed using a reverse-FORM analysis to investigate the
most influential variables of the flexural and tension crack models with respect to the three key
issues identified, presented in Chapter 6. The theoretical partial safety factors of the model
variables for representative cases were also determined. In order to develop a usable design
crack formulation, a calibration of the theoretical partial safety factors is required. This was
outside the scope of this thesis. However, a preliminary exercise in calibrating the load-induced
crack models was carried out and reported on in Chapter 7.
Chapter 8 presents the final summary of results and conclusions to be made from this research.
Stellenbosch University http://scholar.sun.ac.za

4
Review of Cracking in reinforced concrete WRS in SA
SA industry review
Literature review of cracking including BS and Eurocode design codes
Identification of key issues
Bending and tension load cases considered
Deterministic Analysis of BS8007 and EN1992
design equations for cracking
Reliability Analysis of EN1992 crack model w.r.t.
load-induced cracking
Comparison of BS8007 and
EN1992
Identification of implications
of changing from BS8007 to
EN1992 in the design of WRS.
Use of the deterministic analysis in
setting-up the reliability model
Development of representative cases
for reliability analysis
Refinement of key issues in concrete
cracking for reliability model
Review of reliability analysis and FORM
Development of reliability model for EN1992 load-induced
cracking
South African values for variables used.
FORM analysis
Analysis w.r.t. key issues
Reverse FORM analysis
Sensitivity analysis of basic variables of reliability crack model
Calculation of theoretical partial safety factors of basic
variables
Application of theoretical partial safety factors to
representative case using EN1992 crack equation
Final results, conclusions and
summary
Figure 1.1: Flow chart of the investigation into cracking in South African WRS
Stellenbosch University http://scholar.sun.ac.za

5
CHAPTER 2
OVERVIEW OF CRACKING IN CONCRETE WATER RETAINING STRUCTURES
2.1 GENERAL
The serviceability limit state (SLS) of cracking is important in WRS as failure to meet this limit
state would result in a loss of function of the structure. Cracking needs to be controlled to
maintain water-tightness, for durability and corrosion protection of reinforcement, and for
aesthetics. Cracking in concrete has a variety of causes, which in summary, are:
Cracking due to deformations of a structure under applied forces, namely, flexural tensile
and direct tensile cracking in mature concrete.
Cracking in immature concrete due to drying shrinkage and restrained concrete.
Thermal and shrinkage effects in restrained concrete.
Corrosion of reinforcement within concrete, resulting in eventual spalling of the concrete.
Expansive chemical reactions within the concrete.
As stated in the previous chapter, this research focuses on load-induced cracking specifically
that due to pure flexure and direct tension load effects.
In order to identify key issues in the design of reinforced concrete water-retaining structures
(WRS) with respect to load-induced cracking, the relevant British and Eurocode standards were
reviewed. Crack models used by each code for cracking due to load effects were investigated.
The codes concentrated on in investigating SLS cracking are:
BS EN 1992-3: Eurocode 2: Design of Concrete Structures – Part 3: Liquid Retaining and
Containment Structures BSI 2006
BS EN 1992-1-1: Eurocode 2: Design of concrete structures – Part 1: General
requirements BSI 2004
BS8007: British Standards Code of Practice for the Design of Concrete Structures for
Retaining Aqueous Liquid, BSI 1987.
SANS10160: Basis for structural design and actions for buildings and industrial structures
and EN1991: Eurocode 1: Actions on structures referred to for guidance on load factors.
A literature review on research carried out on parameters used in the crack models was
undertaken and presented in this chapter. Any references to water-retaining structures in
existing South African codes were included in this review. In addition, a summary of the design
Stellenbosch University http://scholar.sun.ac.za

6
and construction practices of WRS in South Africa is given here, with emphasis on
configurations and loading cases resulting in tensile and flexural cracking. Information gathered
was used in the design calculations comparing EN1992 and BS8007 for load-induced cracking
in Chapter 3. These calculations were then used in comparing and developing the reliability
models to assess the reliability of the Eurocode crack model.
2.2 SCOPE OF DESIGN CODES RELEVANT TO SOUTH AFRICA
The scope of the following design codes dealing with the design and construction of WRS is
summarised here:
(i) The British standard BS 8007: Design of concrete structures for retaining aqueous liquids
(1987) pertains to aqueous liquid-retaining structures only, that is, tanks, reservoirs and
other vessels constructed in pre-stressed or reinforced concrete. The scope does not
include other liquids, aggressive waters or granular solids, with the water contained
assumed to be at ambient temperatures. BS8007 is read in conjunction with BS 8110:
Structural Use of Concrete (1997).
(ii) The Eurocode standard EN1992-3 (2006): Liquid retaining and containment structures, as
the title describes, pertains to the containment of all liquids and granular solids, so has a
wider scope than BS8007. The scope of the code also includes retaining and containment
structures. Plain, lightly reinforced concrete, reinforced concrete and pre-stressed concrete
are considered. Exclusions are materials at very high temperatures, the storage of
hazardous materials that could pose a major health risk if leakage occurs, design of liners
and coatings, pressurized and floating structures and gas tightness. This code is to be read
in conjunction with EN1992-1: Design of concrete structures – Part 1-1: General rules and
rules for buildings (2004). EN1992-3 allows for stored materials having a temperature range
of -40˚C to +200˚C, a greater range than that of BS8007. EN1992-3 states that for durability
and leakage, mainly aqueous liquids are considered. Specialist literature is to be consulted
for other liquids store in direct contact with structural concrete.
2.3 CRACK MODELS DUE TO LOADING DEFORMATIONS
2.3.1 General
The crack models used by BS8007 and EN1992 respectively assume that the concrete section
Stellenbosch University http://scholar.sun.ac.za

7
considered is cracked and linear elastic theory applies as cracking is a serviceability limit state.
Cracking due to loading is primarily controlled by the provision of reinforcement to obtain less
than a specified maximum expected crack width, assuming proper construction practices and
good quality concrete.
The cracking model for a section under loading to BS 8007 was developed empirically, while the
EN1992 model is based on a limited bond-slip model. The mechanism of the crack formation is
similar in each case. Once the tensile stress induced by the load exceeds the tensile strength of
the concrete, a primary crack develops. The reinforcing at the crack carries the tensile force, as
the stress in the concrete at the crack is zero. Away from the immediate vicinity of the crack,
bond strength transfers and redistributes the tensile stress from the reinforcement into the
concrete over a distance, So. If the tensile capacity of the concrete is again exceeded as load
increases, further cracking results at a distance no less than So from the first crack, thus
defining the minimum crack spacing. The bond strength and thus the rate of transfer of tensile
stress between the reinforcement and the concrete influence the crack spacing. If loading is
increased, the inelastic phase is reached when either the steel yields or the concrete is no
longer elastic. However the loads required for the structural element to reach this phase usually
exceed those of normal service, hence the inelastic phase is not considered for the
serviceability state.
The average stresses and strains are calculated using linear elastic theory, modified for tension
stiffening. Tension-stiffening is the capacity of the uncracked concrete, between two adjacent
cracks, to carry the tensile force which is transferred from the reinforcement to the concrete by
bond stress between the reinforcement and the concrete. Eurocode and the British standards
differ in their determination of the tension stiffening effect on strain and crack spacing and
therefore the calculation of the maximum crack width. This is a point of difference between
many crack models used by other countries. These differences are discussed in the following
paragraphs.
Under increased loading a condition is reached where no additional cracks form. The crack
spacing then remains constant while cracks widen as the load increases further. Eurocode
divides the formation of the crack pattern into two phases: the first, the crack formation phase,
and the second, the stabilised cracking phase. In the crack formation phase, the first crack
occurs when the concrete tensile strength is exceeded at a point. The tensile stresses are
Stellenbosch University http://scholar.sun.ac.za

8
transferred from the concrete to the reinforcement at the crack. This transfer of stresses occurs
up to a distance So (also called the transfer length) away from the crack. A second crack occurs
when the load is increased at the next weakest point, at a distance greater than So. As load
increases, further cracks form until all cracks are a minimum of So apart. In the stabilised crack
phase, no new cracks are formed and the average crack spacing, Sm, remains constant as load
increases. The average crack spacing (Srm ) in the stabilized cracking phase is found to be
between the initial transfer length (S0) after the formation of the first crack and twice that initial
length, i.e., S0 ≤ Srm ≤ 2S0 (Beeby (2005)). Stresses in the concrete are relieved by internal
crack formation and limited bond slip near crack faces.
The cracking mechanism under load described in the previous paragraph is illustrated in Figure
2.1 (Narayanan & Beeby, 2005).
Figure 2.1: Load-deformation response to steadily increasing load (Source: Narayanan & Beeby, 2005)
In a controlled load test (as illustrated in Figure 2.2 overleaf, Narayanan & Beeby, 2005), the
crack widths were found to remain the same in the crack formation phase, whilst the number of
cracks increased. Cracks widened at an approximately linear rate once the stabilised crack
phase was reached with no new cracks developing.
Stellenbosch University http://scholar.sun.ac.za

9
2.3.2 BS 8007 Equations
The crack model for load effects to BS8007 is an empirical model and takes into account the
effect of cover, reinforcement diameter and spacing, and stress in the reinforcement. BS 8007
sets maximum limits for the stresses in the reinforcement and concrete to ensure the structure
remains in the elastic phase under loading. Models developed to calculate crack widths have
been simplified by using parameters specific to the United Kingdom, such as
Figure 2.2: Crack-deformation response in load-controlled test (Source: Narayanan & Beeby,
2005)
climatic parameters. Awareness of the assumptions made in simplifying crack calculations is
necessary to have reliable results for South African conditions. BS8007 differentiates between
cracking resulting from temperature and moisture effects (Appendix A) and that in mature
concrete due to loads (Appendix B).
The maximum surface crack width, w, for flexure is calculated in BS8007 using:
(2.1)
xh
ca21
ε3aw
mincr
mcr
The maximum crack width for tension is calculated from the expression:
w = 3 acr εm (2.2)
Stellenbosch University http://scholar.sun.ac.za

10
where the parameter acr is defined as the distance from the point considered to the nearest
longitudinal bar (position of the crack), εm is mean strain, cmin is the concrete cover, h is the
section depth and x is the depth from the compression face of the section to the neutral axis.
Expressions (2.1) and (2.2) assume that the crack spacing is a function of the distance from a
crack to the nearest reinforcing bar (acr), as illustrated in Figure 2.3 for a slab or wall section
under bending. This distance will be a maximum to a point mid-way between reinforcing bars in
the case of a slab or wall. The crack width is taken to be the smallest at the reinforcing bar,
widening to the surface. For a typical reservoir wall section acr is determined from:
2
φacra
2
2
φc
2
2sa
(2.3)
where a is the distance from the surface crack to the centre of the reinforcing bar, c is cover to
reinforcement, s is spacing of reinforcement and θ is reinforcement diameter
Figure 2.3: Distance from surface crack to centre of bar for slab or wall section
The average strain, εm, is calculated from:
εm = ε1 – ε2 (2.4)
where ε1 is the apparent strain at the surface and ε2 is the tension-stiffening effect of the
concrete in tension.
The apparent strain at the level of the tension reinforcement (εs) is calculated using elastic
theory. The apparent strain at the surface (ε1) for flexure is then determined from:
ε1 = εs (h – x)/ (d – x) (2.5)
where d is the effective depth. The average strain is then calculated by deducting the effect of
the concrete in tension, i.e., tension stiffening from the apparent strain, ε1. In the tension case,
the apparent strain (ε1) is equal to the steel strain (εs).
Stellenbosch University http://scholar.sun.ac.za

11
The equations to calculate tension stiffening strain for flexure were derived empirically and are
dependent on the value chosen for the maximum crack width limit (wlim) as follows:
mm 0,2 wfor
x)(dA3E
xa'xhbε lim
ss
t2
(2.6(a))
or,
mm 0.1 wfor x)(dA3E
a'-xx)-(h1,5bε lim
ss
t2
(2.6(b))
where a‟ is defined as the distance from the compression face to the level at which the crack
width is being considered, and is equal to the depth of section, h, in the case of a reservoir wall
under bending, Es is the steel modulus of elasticity, bt is the width of the section in tension and
As is the area of the tension reinforcement.
Tension stiffening strain for the tension case is
for ( ( ))
for wlim=0,1 ( ( ))
For a limiting crack width of 0,3 mm, equations 2.6(a) and 2.7(a) are used to calculate ε2 for
flexure and tension respectively (Bhatt et al (2006) and Reynolds& Steedman (2008)), while no
guidance is given for limiting crack widths less than 0,1 mm. On giving the equations for tension
stiffening strain relative to the limiting crack width BS8007 states that interpolation or
extrapolation may not be done for other limiting crack widths. According to these equations, ε2
for a wlim of 0,1 mm is 1,5 times that for a wlim of 0,2 mm.
The above expressions for calculating crack width apply if the strain in the tension reinforcement
is limited to 0.8fy/Es where fy is the characteristic yield strength of the reinforcement. The stress
in the concrete is limited to 0.45fcu where fcu is the characteristic compressive strength of
concrete at 28 days (cube). BS8007 (read in conjunction with BS8110) specifies a minimum
tensile reinforcement area, As,min, of 0,35 % for high tensile reinforcement and 0,64 % for mild
steel, with a maximum bar spacing of 300mm. The total reinforcement is to be arranged as
follows:
(i) Walls and suspended slabs with section thickness h ≤ 500 mm: minimum area of
reinforcement required is calculated using the full section depth. Half this area is provided
Stellenbosch University http://scholar.sun.ac.za

12
to each face.
(ii) Walls and suspended slabs with section thickness h > 500 mm: minimum area of
reinforcement required is calculated using the outer 250mm depth of concrete of each face.
Half this area is to be provided to each face.
(iii) Ground slabs with section thickness h < 300 mm: minimum area of reinforcement required
is calculated using the top half of the slab depth only. No reinforcement is to be provided in
the bottom half.
(iv) Ground slabs with section thickness 300 < h ≤ 500 mm: reinforcement is provided in the top
half of the slab as calculated as (iii). Additional reinforcement is provided in the bottom of
the slab, using a depth of 100 mm.
(v) Ground slabs with section thickness h > 500 mm: reinforcement is calculated as in (iv) but
with a maximum depth considered of 250 mm for the top of the slab.
The code does not specifically give guidance on combined flexure and tension crack
calculations. However, elastic stress-strain theory for bending moment and axial tension over
the cross section can be applied to determine the stresses and strains induced. An iterative
process is required to solve the series of equations for combined tension and bending.
It must be noted that the BS8007 equations for load cracking differ from those for cracking due
to thermal and temperature effects in restrained concrete. The latter are similar to those of
Eurocode and are based on bond-slip theory. Eurocode uses the same general formula to
calculate crack widths for loading and restrained shrinkage. Strain is determined using the
appropriate equations.
2.3.3 EN 1992 Equations
The EN1992 crack design equation for cracking was developed from the compatibility
relationship for cracking in the stabilised crack phase,
wm = Srm. εm
where wm is the mean crack width, Srm is average crack spacing (as determined from
experimental data) and εm the mean strain. The mean strain εm is εsm - εcm where εsm is the mean
strain in the reinforcement under loading calculated using linear elastic theory. The mean
concrete strain is calculated from:
( ) ⁄ (2.9)
Stellenbosch University http://scholar.sun.ac.za
13
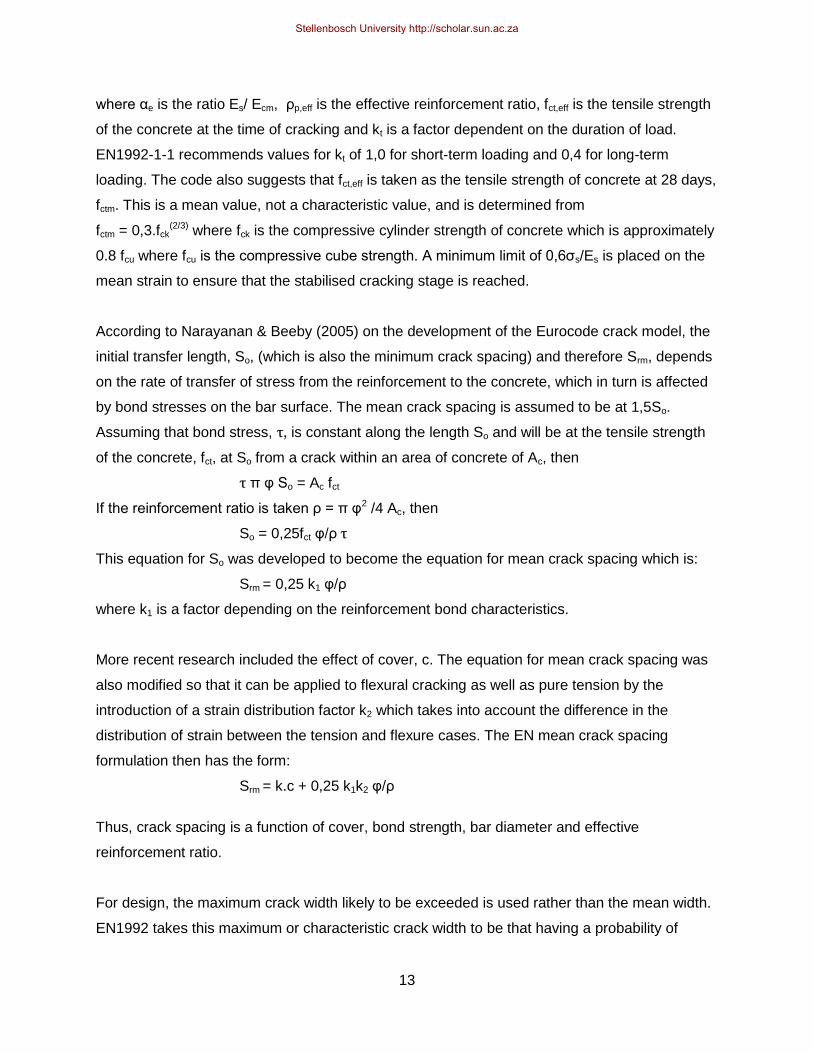
where αe is the ratio Es/ Ecm, ρp,eff is the effective reinforcement ratio, fct,eff is the tensile strength
of the concrete at the time of cracking and kt is a factor dependent on the duration of load.
EN1992-1-1 recommends values for kt of 1,0 for short-term loading and 0,4 for long-term
loading. The code also suggests that fct,eff is taken as the tensile strength of concrete at 28 days,
fctm. This is a mean value, not a characteristic value, and is determined from
fctm = 0,3.fck(2/3) where fck is the compressive cylinder strength of concrete which is approximately
0.8 fcu where fcu is the compressive cube strength. A minimum limit of 0,6ζs/Es is placed on the
mean strain to ensure that the stabilised cracking stage is reached.
According to Narayanan & Beeby (2005) on the development of the Eurocode crack model, the
initial transfer length, So, (which is also the minimum crack spacing) and therefore Srm, depends
on the rate of transfer of stress from the reinforcement to the concrete, which in turn is affected
by bond stresses on the bar surface. The mean crack spacing is assumed to be at 1,5So.
Assuming that bond stress, τ, is constant along the length So and will be at the tensile strength
of the concrete, fct, at So from a crack within an area of concrete of Ac, then
τ π θ So = Ac fct
If the reinforcement ratio is taken ρ = π θ2 /4 Ac, then
So = 0,25fct θ/ρ τ
This equation for So was developed to become the equation for mean crack spacing which is:
Srm = 0,25 k1 θ/ρ
where k1 is a factor depending on the reinforcement bond characteristics.
More recent research included the effect of cover, c. The equation for mean crack spacing was
also modified so that it can be applied to flexural cracking as well as pure tension by the
introduction of a strain distribution factor k2 which takes into account the difference in the
distribution of strain between the tension and flexure cases. The EN mean crack spacing
formulation then has the form:
Srm = k.c + 0,25 k1k2 θ/ρ
Thus, crack spacing is a function of cover, bond strength, bar diameter and effective
reinforcement ratio.
For design, the maximum crack width likely to be exceeded is used rather than the mean width.
EN1992 takes this maximum or characteristic crack width to be that having a probability of
Stellenbosch University http://scholar.sun.ac.za

14
exceedence of 5%.This maximum crack width is related to the mean crack spacing by the
equation:
wk = (βw Srm). εm
where (βw Srm) is the maximum crack spacing, Sr, max.
Borosnyoi and Balázs (2005) checked and compared various models for flexural cracking,
including that used by EN1992-1-1. They found that for crack models of the form
wk = βw wm = (βw Srm). εm
where βw Srm = Sr,max, the ratio Sr,max/ Srm was from 1,33 to 1,54, whilst experimental data
indicated ratios of 1,3 to 2,8. They also stated that experiments on reinforced concrete in flexure
showed that concrete cover, spacing of reinforcement and size effects were influential factors in
determining the average crack spacing. The EN1992-1-1-1 formulation uses a value of 1,7 for
the factor βw. (Narayanan & Beeby (2005) and Holicky& Retief (2010)).
The EN1992 equation for the maximum expected crack width then becomes:
wk = Sr,max. εm (2.10)
The EN1992 maximum crack spacing equation is written as:
Sr,max = k3.c + k1k2k4θ /ρp,eff (2.11)
where θ is the bar diameter (mm), c is the cover to the longitudinal reinforcement and k1 is a
coefficient taking into account of the bond properties of the bonded reinforcement. The
coefficient k1 has a value of 0,8 for high bond bars. The distribution of strain coefficient k2 has a
value of 0,5 for bending and 1,0 for pure tension. For combined tension and bending,
intermediate values of k2 may be calculated from the relation k2 = (ε1 + ε2)/2ε1, where ε1 and ε2
are the greater and lesser tensile strains respectively, at the boundaries of the section
considered, assessed on the basis of a cracked section. The values of k3 and k4 are determined
by individual member countries‟ National Annexes. EN1992-1-1 gives recommended values of
3,4 and 0,425 for k3 and k4, respectively.
The effective reinforcement ratio is calculated as the ratio between the reinforcement area, As,
and the effective area of concrete in tension, Act,eff. The latter is determined following Figure 7.1
of EN1992-1-1, given here as Figure 2.4. In calculating Act,eff, the effective depth of the tension
area hc,eff is taken as the lesser of h/2, 2,5(h - d) and (h – x)/3. The limiting equation depends on
the type of tensile stress as well as the geometry on the section considered. The last term would
Stellenbosch University http://scholar.sun.ac.za
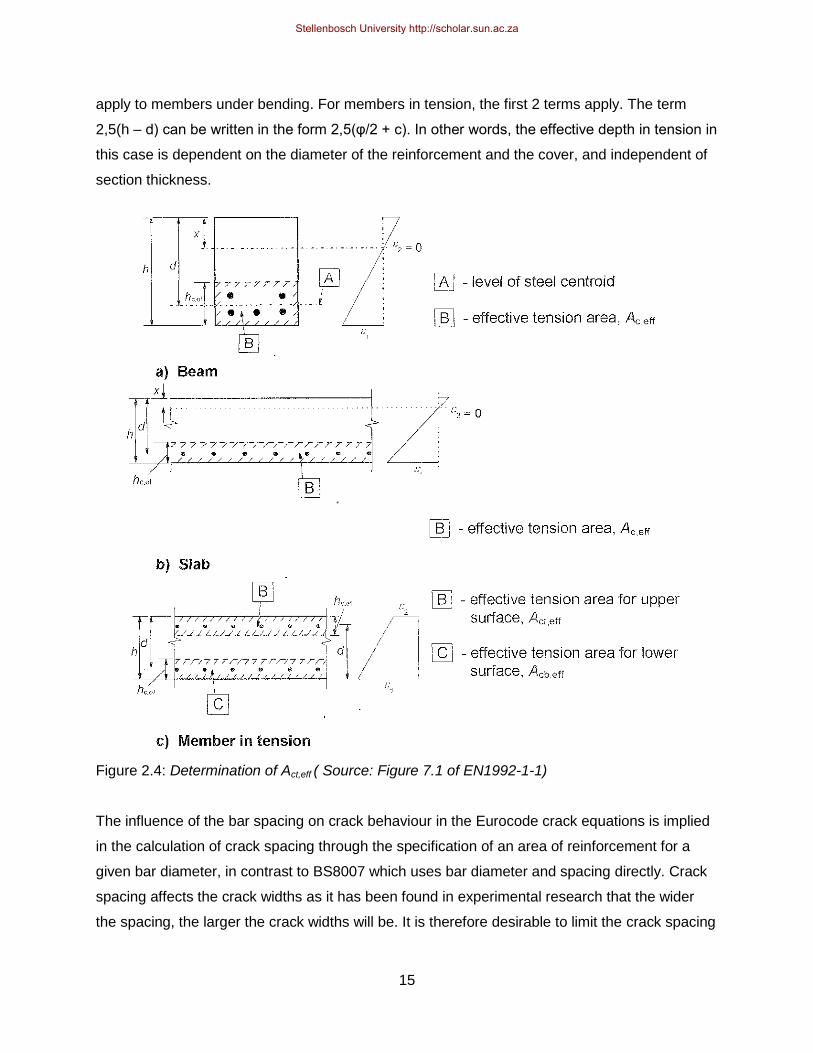
15
apply to members under bending. For members in tension, the first 2 terms apply. The term
2,5(h – d) can be written in the form 2,5(θ/2 + c). In other words, the effective depth in tension in
this case is dependent on the diameter of the reinforcement and the cover, and independent of
section thickness.
Figure 2.4: Determination of Act,eff ( Source: Figure 7.1 of EN1992-1-1)
The influence of the bar spacing on crack behaviour in the Eurocode crack equations is implied
in the calculation of crack spacing through the specification of an area of reinforcement for a
given bar diameter, in contrast to BS8007 which uses bar diameter and spacing directly. Crack
spacing affects the crack widths as it has been found in experimental research that the wider
the spacing, the larger the crack widths will be. It is therefore desirable to limit the crack spacing
Stellenbosch University http://scholar.sun.ac.za

16
to ensure smaller crack widths. Reinforcement of smaller bar diameters and at closer centres is
recommended as this has been found to result in a pattern of finer cracks at a closer spacing.
A minimum area of tension reinforcement is required to ensure that the reinforcement remains
elastic, particularly after the formation of the first crack. Equation 7.1 of EN1992-1-1 defines this
area as:
As, min = kc k fct, eff Act / ζs
where the area of concrete in tension, Act, is that area just before the formation of the first crack,
kc is a coefficient taking into account the stress distribution across the section just before
cracking for different load conditions (recommended as 1,0 for tension and 0,4 for flexure by
Narayanan & Beeby (2005)). The maximum stress in the reinforcement (ζs) is taken as the yield
strength (fy). Non-linear stress distributions resulting in higher tensile stresses at the surface of
the section, and thus a lower cracking load, can occur due to internal non-uniform self-
equilibrating stresses. These stresses occur if shrinkage or temperature change deformations
are restrained. The coefficient k was introduced to account for this effect, with recommended
values varying from1,0 for a section depth less than 300 mm deep, to 0,65 for section depths
greater than 800 mm (Narayanan & Beeby (2005)).
EN1992-3 gives an alternative method to control cracking without directly calculating crack
widths. The appropriate maximum bar diameter and spacing may be obtained from Figures
7.103N and 7.104N of EN1992-3 respectively, for a given maximum crack width and the
calculated steel stress for a cracked section, as shown here in Figure 2.5. The tables apply to
sections under direct tension only. For sections in pure flexure, the maximum bar diameter
obtained from Figure 7.103N must be modified using Equation 7.122 of EN1992-3.
EN1992-1-1 Cl 7.3.4 mentions making provision for the effect of imposed deformations on mean
strain under the relevant combination of loads. The research reported on in this thesis looks at
loading effects for long term loads and mature concrete only, and where the effect of long term
creep is taken into account by the use of the long-term modulus of elasticity of concrete
determined using SANS10100-1 (2004).
Stellenbosch University http://scholar.sun.ac.za

17
Figure 2.5: Determination of cracking reinforcement without calculation to EN1992-3 (2004)
Neither the British nor the Eurocode crack models take the effect of transverse reinforcement
into account, such as the case for walls and slabs in WRS. Dawood & Marouk (2010) proposed
Stellenbosch University http://scholar.sun.ac.za

18
a model predicting crack spacing of orthogonally reinforced concrete plate elements in axial
tension and reinforced concrete slabs in flexure. In their research, experimental results were
compared to various crack spacing equations, including EN1992-1-1. It was found that EN1992-
1-1 underestimated the crack spacing in the slabs tested, but overestimated the crack spacing
in the axially-loaded panels. In general, as the concrete cover and bar spacing were increased,
the crack spacing increased for both design code equations and experiments.
In terms of research into possible future improvements of the EN1992-1-1 crack formulation,
work is being carried out by, amongst others, the members of the CEB Task Group fib TG 4.1:
Serviceability Models (Task Convener Prof. J. Vitek) on the New Model Code (NMC) 2010. The
Model Code (MC) provides the basis of the formulation of EN 1992 -1. From the task groups‟ 1st
draft of MC 2010 (2011) Chapter 7.6 Verification of serviceability (SLS) of RC and PC
structures, the following equation (7.6-3) is proposed to calculate the maximum crack width in
the stabilised cracking phase:
wd = 2ls,max (εsm – εcm – εcs)
where εcs is the strain in the concrete due to shrinkage and ls,max is the maximum length over
which slip between concrete and steel occurs . The latter is used as opposed to the maximum
crack spacing and is calculated using the equation 7.6-4 which is:
= k.c + 0,25fctm
ηbms
ρs,ef
A value of 1 is proposed for k which is the same as used in the current EN1992 formulation for
the maximum crack spacing. τbms is the mean bond strength between the reinforcement and
concrete and is taken as 1,8.fctm for the stabilised cracking phase. Bond strength is allowed for
by the factor k1 in the EN1992-1-1 equation for maximum crack spacing. The mean strain is
calculated as in EN1992.
The following summarises comments made by Eckfeldt (2011), a member of fib TG4.1, on the
proposed MC model:
MC 90 underestimates crack widths but EN 1992 is over- conservative in some cases and
less efficient.
Regarding 2*1.0*c in calculating 2ls,max, it was agreed that c has an important influence on
2ls,max but that 3.4*c (= 1,7.2c) used by EN 1992-1-1 is too conservative. The value of 1 for k
then provides a value in the middle.
2*ls,max is proposed instead of 1.7*Sr, mean because of better theoretical backup.
Stellenbosch University http://scholar.sun.ac.za

19
The final draft of MC2010 (Eckfeldt (2012)) gives the design crack width as an upper fractile, wd,
as:
wd = 2(c + ¼*1/1.8*ϕ/ρ). Δε,
where the max transfer length, ls, max, is
ls,max = 2c +2*1/4*1/1.8* ϕ/ρ
The concrete tensile strength is not expressed explicitly unlike EN1992, but is implicit in the
1/1,8 ratio.
Eckfeldt (2009) in his research on small crack widths in bond-slip experiments, made the
following conclusions:
Concrete cover influences the effective area in tension.
In determining the effective area of concrete in tension (Ac,eff) under a direct tensile force,
hc,eff was found to be between 2,7 and 9 times the bar diameter, with an average value of 5.
The length ls, max correlates better with the crack width than the maximum crack spacing as
currently calculated in EN1992-1-1.
These conclusions are reflected in the proposed equation 7.6-3 of MC 2010.
2.3.4 Durability and material specifications
Exposure of the reinforcement to moisture results in corrosion, compromising the durability of
the structure. The cover to reinforcement and good quality well-compacted concrete, as well as
limiting crack widths, are key in ensuring the durability of the concrete. The general crack width
limit considered to be sufficient for durability in buildings by EN1992-1-1-1 is 0,3 mm.
BS8007 makes recommendations for concrete grade, cement content, and cement-water ratio.
These variables all influence the formation of cracks. A minimum concrete grade (as cube
strength, fcu) of 35 MPa at 28 days is specified. This value is the characteristic cube strength
(probability of exceedence 5%). Eurocodes express concrete strength in terms of cylinder
strength, fck, where fck is approximately 0.8 fcu, and is a characteristic strength (probability of
exceedence of 5%). The corresponding cube strength values may be obtained from EN1992 -1-
1 Table 3.1. BS8007 recommends a maximum cement content (OPC) of 400 kg/m3 to control
the heat of hydration, hence control of the development of cracks due to drying shrinkage.
Guidelines on concrete cover to reinforcement are given in BS8007 and Eurocode for WRS.
Stellenbosch University http://scholar.sun.ac.za
20
Eurocode determination of cover involves a combination of factors to Section 4 of EN1992-1-1.
The two main factors in determining cover are the exposure class and the structural class of the
structure. Exposure classes are defined in EN1992-1-1 (2004), while structure classes are to be
defined by individual member countries. For a given exposure class, a minimum cover is
selected for bond (diameter of reinforcing bar) and the appropriate environmental conditions,
and class of structure. Suggested concrete grades are given in Annex E of EN1992-1-1 for a
given exposure and structure class. The procedure to determine an appropriate cover is more
extensive in EN1992-1-1 than that in the South African and the British standards.
Using EN1992-1-1 for an appropriate exposure class and a S3 structure, a minimum concrete
grade of C30/37 (fck/ fcu) and a minimum cover of 45 mm would be selected for a WRS. These
values are comparable to those specified by the British code. BS 8007 specifies a nominal
minimum cover of 40 mm for durability of the structure. A caution is given on increasing cover,
particularly in sections less than 300 mm thick, although a maximum limit is not specified in BS
8007 Cl. 2.7.6. Crack models for flexure and tension imply that the deeper the cover to
reinforcement, the wider the crack will be at the surface. This is because crack width is taken as
directly proportion to crack spacing which is highly influenced by the cover. Illston & Stevens
(1972) stated that crack spacing was approximately twice the cover. The current Eurocode
formulation has mean crack spacing equal to twice the cover, with the additional effect of the
reinforcement included.
In research aimed at the durability of concrete in beams, Tammo et al (2009) concluded that for
durability, a larger cover is appropriate for severe environmental conditions as the time taken for
chlorides to reach the reinforcement and carbonation to take place is proportional to the square
of the concrete cover. It was also concluded that a better predictor of corrosion was the crack
width at the reinforcement, which was found to be approximately half the surface crack width.
However, the surface crack width was influenced more by cover than the crack width at the
reinforcement. Beeby (2004) proposed that the parameter θ/ρeff (where θ is bar diameter and
ρeff is reinforcement ratio) did not have much influence on crack widths but that cover did,
because of its influence on the crack spacing. This proposition was supported by Eurocode 2
Commentary (2008). Beeby introduced the parameter into the crack spacing equation as the
term „2c‟ based on his research conclusions. Figure 2.6 summarises this research, showing the
effect of cover on the transfer length, lt, (also defined as So).
Stellenbosch University http://scholar.sun.ac.za

21
.
Figure 2.6 Influence of cover on transfer length to Beeby. (Source: Eurocode 2 Commentary
(2008))
The transfer length can be written as crack width/strain and was found to be proportional to
cover. Referring to Figure 2.6, most of the data was obtained for covers of 35 mm and less. At a
cover of 35 mm, there is a notable spread of values for the transfer length from about 90 mm to
180 mm. There is also a gap in the data for cover between 35 and about 57 mm.
The influence of cover in determining crack widths needs further investigation, with balance
between durability requirements and maximum allowable surface crack widths to ensure the
permeability needed is achieved.
2.3.5 South African structural codes of practice
A review of SANS standards for reinforced concrete was done to assess any clauses that may
be relevant to WRS. The scope of SANS 10100 (2000): Structural Use of Concrete: Part 1
(Design) covers the general rules of design for reinforced and pre-stressed concrete buildings.
Crack calculations for members under direct tension or flexure appear in Annex A.3 of SANS
10100-1 and are the same as those found in BS8110 and BS8007. Rules for the minimum area
Stellenbosch University http://scholar.sun.ac.za

22
of reinforcement and maximum spacing of reinforcement are laid out in Clauses 4.11.4 and
4.11.8 respectively, for the control of cracking in buildings. Annex B of SANS 10100-1 provides
general information on movement joints in reinforced concrete buildings. There are no
specifications or clauses that deal explicitly with water-retaining structures.
The South African design codes give some guidance on material specifications for water-
retaining structures which affect cracking. Part 2 of SANS 10100 (1994): Materials and
Execution of Work specifies a cement-water ratio of more than 2,0 (Cl. 10.6.2) for durability and
impermeability. Exposure conditions, as laid out in Cl 3.3, for a water-retaining structure would
be severe or very severe depending on the aggressiveness of the water in contact with
concrete. Minimum concrete cover to reinforcement for normal density concrete for an exposure
condition of severe would be 40mm. Annex A sets out a procedure for determining the
aggressiveness of water in contact with concrete.SANS10160 gives guidance on partial load
factors incidentally for loads applicable to WRS. These are discussed in Section 2.5 on the
current practices for WRS in South Africa.
2.4 LIMITS ON CRACK WIDTHS
In order to limit cracking in a structure, the maximum expected surface crack width and spacing
for a given configuration, material properties and reinforcement quantity are determined and
compared to a maximum crack width limit. The structure is considered to meet the serviceability
limit state (SLS) requirement for cracking if the expected maximum crack width calculated using
the relevant design equation is less than the specified maximum crack width. The specified
crack width limit is taken as the value that has a probability of exceedence of 5%, as determined
from experimental research. Factors influencing the crack width are cover, the position, spacing
and diameter of reinforcement, the type of action resulting in cracking, thus the determination of
stresses in the section, and material properties. The surface crack width gives an indication of
the penetration of any cracks, and therefore the durability and permeability of a structure.
Leakage of a WRS would obviously compromise the function of the structure, therefore crack
width limits are set to control leakage as well as protect the durability of the structure.
There is debate as to what the crack width limit should be, partly because the cracking
mechanism is random, and modelling, testing and measurement of crack widths can be
problematic. Beeby (2004) gave a summary of some problems encountered in comparing
Stellenbosch University http://scholar.sun.ac.za

23
laboratory research, such as recording either the maximum or the average crack widths, but not
both. Historically from research and industry experience (WRC workshop, 2007), it has been
found that that cracks less than 0,2 mm in width will self-heal if the cracked concrete element is
in contact with water that is not flowing or exerting a pressure. The crack limits are therefore set
lower in BS8007 than for buildings (to BS8110), that is from an average value of 0,3 mm to 0,2
mm. BS 8007 specifies a maximum allowable crack width of 0,2mm for severe/very severe
exposure conditions, following the assumption that cracks will generally seal themselves for
crack widths less than 0,2 mm, in structures not subjected to high pressures. Alternatively, a
crack width of 0,1mm for aesthetic considerations may be chosen. Regarding a crack going
through the full section in a wall or a slab under liquid pressure, Reynolds & Steedman (2008)
states some initial seepage would be expected but “it is assumed that such cracks will heal
autogenously within 21 days for a 0,2 mm design crack width, and 7 days for a 0,1 mm design
crack width”.
Eurocode allows for the maximum allowable crack width, wk1, to be defined in individual member
countries‟ National Annexes. Recommendations for maximum crack width limits for water
retaining structures are given in EN1992-3. WRS‟s are first classified according to a tightness
class defined by the requirements for protection against leakage. Table 7.105 of EN 1992-3
defines the tightness classes as follows:
Class 0 Some degree of leakage acceptable, or leakage of liquids irrelevant.
Class 1 Leakage to be limited to a small amount. Some surface staining or damp patches
acceptable.
Class 2 Leakage to be minimal. Appearance not to be impaired by staining.
Class 3 No leakage permitted
Crack width limits are then recommended depending on the tightness class required. For
Tightness Class 0 structures, EN1992-1-1 Cl 7.3.1 may be followed using recommendations for
buildings. Class 0 structures would be those storing dry materials such as silos, thus this class
would not apply to a water retaining structure.
A Tightness Class 1 structure may have some leakage, although crack healing is expected to
occur where the range for service load strain is less than 150 x 10-6. There may be some cracks
through the full section. Cracks are to be assumed to pass through the full section if alternate
Stellenbosch University http://scholar.sun.ac.za

24
actions are applied to the section. The recommended maximum crack width for this class
depends on the ratio of the hydrostatic pressure (hD, expressed as head of water) to wall
thickness (h). The crack width limits as determined by the hydraulic ratio for sections cracked
through the full depth of section are:
hD/ h ≤ 5 wk1 is 0,2 mm
hD/ h ≥ 35 wk1 is 0,05 mm.
Autogenous healing of any cracks is expected to take place if these crack width limits are
adhered to. For intermediate values of hD/ h, crack widths may be interpolated. To relate the
hydraulic ratio to actual wall heights, for a wall height of 5m (water head of 5m and
corresponding water pressure of 50kN/m2), a wall thickness of 1 m would be required to ensure
that a 0,2 mm wide crack would not normally leak. The design wall thickness for a 5m wall
would usually be in the range of 400 to 500 mm for a rectangular reservoir, implying a maximum
crack width limit of 0,16 to 0,175 mm. Wall thicknesses for circular reservoirs are usually less
than this, meaning the maximum crack width limit would be more onerous.
Class 2 and 3 structures are expected to have cracks that do not pass through the full section.
To achieve this, the depth of the compression zone is limited to a recommended value, xmin, the
lesser of 50 mm or 0,2h (h being the section thickness). If class 2 sections do have cracks
passing through the section, then it is expected that appropriate measures are taken, such as
prestressing and using liners. Class 3 structures require that special measures are taken (such
as liners), but no specific guidance is given on the specification of those liners.
A review of available literature was done to attempt to ascertain at what crack width autogenous
healing occurs given that there does not appear to be agreement on this. Jones (2008) referred
to a graph of the variation of crack width with hydraulic ratio illustrating the point at which
autogenous healing was seen to have taken place in research carried out by various
researchers for Tightness Class 1 structures, i.e. through cracking. It was also stated that
“cracks may be expected to heal when a range of strain under service conditions is less than
150 x 10-6”. The graph, shown as Figure 2.7, shows where the crack width limits set by
Eurocode are placed compared to other research.
The graph confirms that autogenous healing does occur for cracks less than 0,2 mm when
subject to low water pressures. The graph shows that Eurocode has hD/ h ratios higher than
those by Lohmeyer and Meichner for crack widths less than about 0,17 mm. This means that for
Stellenbosch University http://scholar.sun.ac.za

25
a given water height, hD, and section thickness, h, EN1992-3 predicts that self-healing of cracks
will occur at a larger crack width limit for crack widths less than 0,17 mm for a given hydraulic
ratio.
Figure 2.7: Self-healing of cracks to Jones (2008)
There are several mechanisms contributing to autogenous healing, such as the precipitation of
calcium carbonate, continued hydration of hardened concrete resulting in the growth of
hydration products and the deposition of debris, amongst others. These mechanisms and their
interactions are not yet fully understood, with research ongoing. The rate decrease of flow
through a crack has been found to depend on the initial flow rate and the crack width. Research
has showed a rapid decrease in the initial flow through a crack within the first stages of testing
(Allen (1983) and Ziari et al (2009(a)& (b)), with mixed results as to when flow ceases
completely and the crack widths at which this occurs.
Ziari & Kianoush (2009a) performed self-healing tests on reinforced concrete panels under
direct tension. One of their requirements was that there was to be a continuous flow of water
through the crack at the start of the test. This occurred for cracks 0,25 mm and larger. It was
found that for 0,25 mm cracks under a constant head of 5m, the flow rate decreased
significantly within the first 7 hours and that self-healing did occur. They did however,
recommend in their conclusions that direct tensile cracks should be avoided in WRS. Their
research on this topic is ongoing.
In testing on panels in flexure where cracks did not go through the depth of section, Ziari &
EN 1992-3
Stellenbosch University http://scholar.sun.ac.za

26
Kianoush (2009b) found that leakage did not occur even for crack widths of 0,6 mm and depths
of 200 mm. They also found that the depth of the compression zone played a key role in
leakage, as well as the crack width. The effective width of the crack internally also influences
the amount of leakage, and is less than the surface crack width. It should be noted that design
codes do not mention the type of cracking relative to a crack limit, when the type of cracking
may influence the crack limit chosen. Flexural cracks do not always go through the full section
due to the compression zone, whilst cracks due to direct tension do go through the section and
are therefore more likely to leak, possibly requiring a more stringent crack limit.
Seong-Tae Yi et al (2011) performed laboratory permeability tests on 50 mm thick sections
cracked through the section, for crack widths of 0,03 mm to 0,1 mm under varying water
pressures. From their results, an allowable crack width of 0,1 mm for a hydraulic pressure of 10
kN/m2, with a reduction in crack width to 0,05 mm for a hydraulic pressure of 25 kN/m2, was
recommended. It was noted that further experimental testing was needed. In all samples tested,
autogenous healing did take place, although not all cracks sealed fully. The effect of the depth
of section was not considered in this study, thus the results could not be expressed in terms of a
hydraulic ratio as defined by EN 1992-3. However, considering the 50 mm thickness of the
samples, this research would suggest that EN1992-3 is on the conservative side for crack
widths in the region of 0,1 mm.
Figure 2.8 shows a 5Ml circular reservoir in northern KwaZulu-Natal undergoing a leakage test,
performed by Eyethu Engineers (2010) before backfilling.
Figure 2.8: Water tightness test for leakage (Source: Eyethu Consulting Engineers)
Stellenbosch University http://scholar.sun.ac.za
27
Slight leakage was apparent at the horizontal construction joint. Staining was evident but self-
healing occurred within 72 hours.
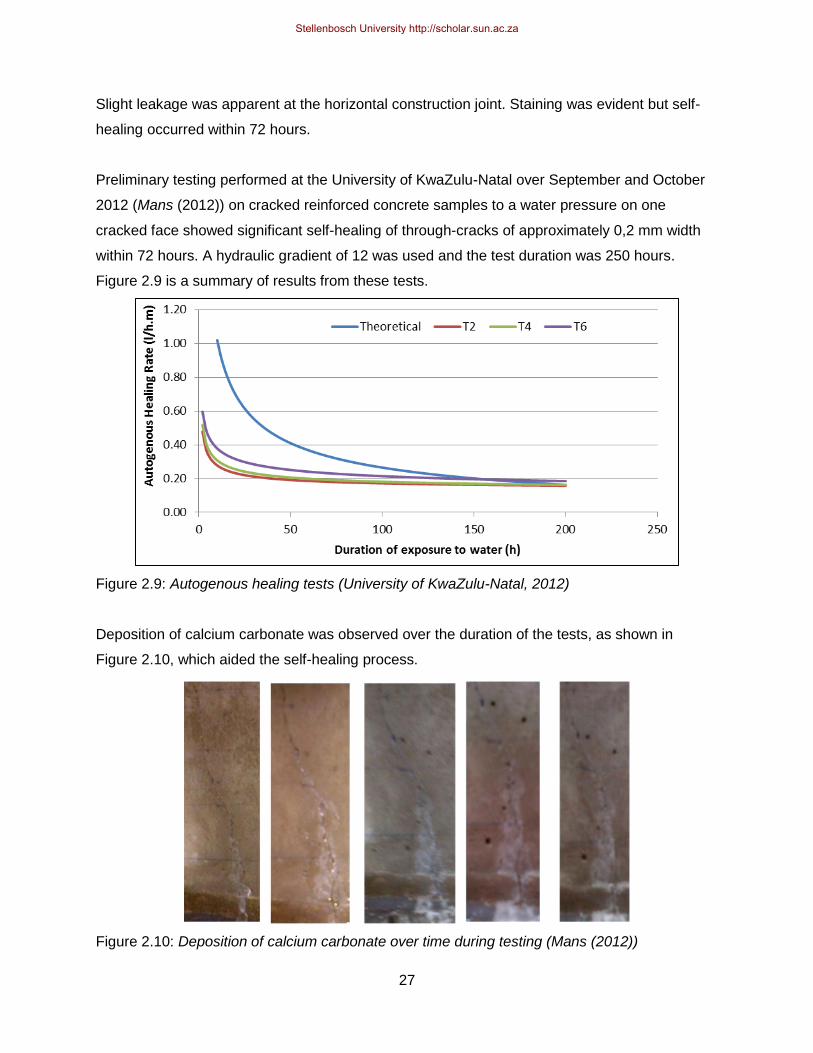
Preliminary testing performed at the University of KwaZulu-Natal over September and October
2012 (Mans (2012)) on cracked reinforced concrete samples to a water pressure on one
cracked face showed significant self-healing of through-cracks of approximately 0,2 mm width
within 72 hours. A hydraulic gradient of 12 was used and the test duration was 250 hours.
Figure 2.9 is a summary of results from these tests.
Figure 2.9: Autogenous healing tests (University of KwaZulu-Natal, 2012)
Deposition of calcium carbonate was observed over the duration of the tests, as shown in
Figure 2.10, which aided the self-healing process.
Figure 2.10: Deposition of calcium carbonate over time during testing (Mans (2012))
Stellenbosch University http://scholar.sun.ac.za

28
A case study of the circular 5Ml reservoir, Ofudu, near Marianhill in KwaZulu-Natal was also
done as part of the research. According to Bowles (2012), the reservoir developed cracks soon
after construction and continued to be active for a period. Surface cracks were found to be from
hairline to up to widths of 0,6mm. Autogenous healing did occur in some of the cracks, evident
by deposits of white calcium carbonate precipitation. Remediation works were done to seal
some of the larger cracks. Figure 2.11 shows the leakage of the reservoir in September 2011.
(Umgeni Water (2012)).
Figure 2.11: Ofudu water reservoir leakage observed in September 2011 (Source: Umgeni
Water)
A site visit was made in October 2012 as part of the case study. Self-healing of cracks that had
previously experienced leakage was observed. Figure 2.12 shows the calcium carbonate
precipitation that had occurred.
Figure 2.12: Calcium carbonate deposition, Ofudu water reservoir, October 2012.
Stellenbosch University http://scholar.sun.ac.za

29
The cracks shown were measured using a crack microscope and were found to be
approximately 0,2mm in width. Self-healing was also found in cracks as large as 0,4 mm.
Self-healing is further demonstrated in Figure 2.13. An interesting observation made on site was
that cracks occurred at a regular spacing of approximately 900 mm in the bottom third of the
wall.
Figure 2.13: Site visit to Ofudu water reservoir, October 2012
It should be noted that when applying any crack model, the effective width of a crack through a
section is not necessarily the crack width on the surface, nor is the crack profile uniform through
the section. The effective crack width may be less than the surface crack width (taken as the
limiting crack width) which then may make it appear that self-healing has taken place at a larger
crack width than is actually the case. A non-uniform profile would not necessarily give the same
results as a more uniform one. Researchers therefore need to take note of this in predicting
crack widths to ensure water-tightness of a structure.
2.5 CURRENT PRACTICES FOR WATER RETAINING STRUCTURES IN SOUTH AFRICA
2.5.1 General
In order to select a structural element in modelling cracking due to loading in water retaining
structures (WRS) appropriate to South African conditions, an investigation into the current
Stellenbosch University http://scholar.sun.ac.za
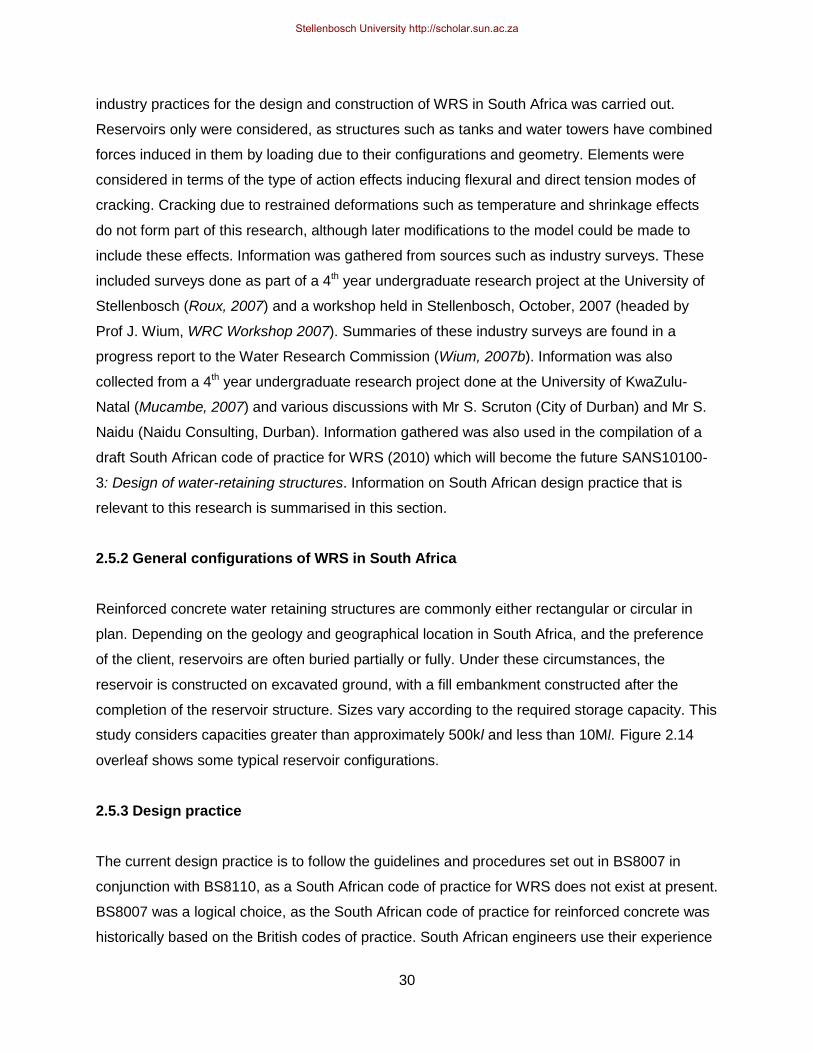
30
industry practices for the design and construction of WRS in South Africa was carried out.
Reservoirs only were considered, as structures such as tanks and water towers have combined
forces induced in them by loading due to their configurations and geometry. Elements were
considered in terms of the type of action effects inducing flexural and direct tension modes of
cracking. Cracking due to restrained deformations such as temperature and shrinkage effects
do not form part of this research, although later modifications to the model could be made to
include these effects. Information was gathered from sources such as industry surveys. These
included surveys done as part of a 4th year undergraduate research project at the University of
Stellenbosch (Roux, 2007) and a workshop held in Stellenbosch, October, 2007 (headed by
Prof J. Wium, WRC Workshop 2007). Summaries of these industry surveys are found in a
progress report to the Water Research Commission (Wium, 2007b). Information was also
collected from a 4th year undergraduate research project done at the University of KwaZulu-
Natal (Mucambe, 2007) and various discussions with Mr S. Scruton (City of Durban) and Mr S.
Naidu (Naidu Consulting, Durban). Information gathered was also used in the compilation of a
draft South African code of practice for WRS (2010) which will become the future SANS10100-
3: Design of water-retaining structures. Information on South African design practice that is
relevant to this research is summarised in this section.
2.5.2 General configurations of WRS in South Africa
Reinforced concrete water retaining structures are commonly either rectangular or circular in
plan. Depending on the geology and geographical location in South Africa, and the preference
of the client, reservoirs are often buried partially or fully. Under these circumstances, the
reservoir is constructed on excavated ground, with a fill embankment constructed after the
completion of the reservoir structure. Sizes vary according to the required storage capacity. This
study considers capacities greater than approximately 500kl and less than 10Ml. Figure 2.14
overleaf shows some typical reservoir configurations.
2.5.3 Design practice
The current design practice is to follow the guidelines and procedures set out in BS8007 in
conjunction with BS8110, as a South African code of practice for WRS does not exist at present.
BS8007 was a logical choice, as the South African code of practice for reinforced concrete was
historically based on the British codes of practice. South African engineers use their experience
Stellenbosch University http://scholar.sun.ac.za

31
(a) Buried rectangular reservoir, Durban, KwaZulu-Natal (Source: Google Earth (2011)
(b) Partially buried circular reservoir, Waterfall, KwaZulu-Natal
Figure 2.14: Typical configurations for water reservoirs, KwaZulu-Natal
to adapt BS8007 to local conditions where necessary. For example, in the check for restrained
cracking, designers use local temperatures, rather than the British values to Table A2 of BS
8007 (WRC Workshop, 2007). A few designers make use of EN1992 at present, but these are
in the minority.
The design life for WRS is taken as 50 years, with the corresponding assumptions of good
design, durable materials and proper construction practices. Reservoirs are designed to resist
the worst ultimate load case or cases by determining the amount of reinforcement required for a
Stellenbosch University http://scholar.sun.ac.za

32
particular configuration. Serviceability checks, such as cracking, are then performed. The
serviceability limit state for cracking tends to dominate the design, with an increase necessary in
the quantity of ultimate limit state reinforcement required.
Actions on WRS in design include self-weight (permanent), imposed loads, geotechnical
actions, seismic actions, liquid loads and temperature and restrained shrinkage effects. Liquid
loads are considered as quasi-permanent by EN1990 and as permanent by BS8007 and
SANS10160, assuming relatively constant water levels and no rapid emptying or filling of the
reservoir so as not to have unwanted secondary load effects. Seismic actions are only allowed
for in seismically-sensitive areas of South Africa and were not considered in this study. The
effect of load actions depends on the configuration and structural element considered. Load
factors used are to SANS 10160 or BS 8110. Ultimate load factors for permanent load (DL) are
1,2, 1,35 and 1,4 for SANS, Eurocode and BS respectively, for the ULS load combination of 1,2
DL + 1,6 LL, where LL is the live load. The alternative ULS load combination of 1,35 DL + 1,0 LL
can also be considered. Note that EN1990 specifies an ultimate load factor of 1,35 for a quasi-
permanent load, such as liquid load. Serviceability load factors for all three codes are commonly
taken as 1,0 for liquid loads. A crack limit of 0,2 mm is specified for serviceability, with a limit of
0,1 mm used if aesthetics are a consideration, as per BS 8007.
Three main structural elements are considered in the design of a WRS:
(i) Walls The load cases and effects are dependent on the shape and proportions of the structure, the
most common being circular and rectangular, and the type of construction. Walls may be either
continuous or jointed vertically. Horizontal joints are generally construction joints. Partially or
fully buried reservoirs will obviously have soil action on the exterior face of walls.
Rectangular reservoir walls tend to be designed as cantilever walls with the top of the wall either
free or propped. The base of the wall is generally fixed. Ignoring the self-weight of the structure,
a cantilever wall (top free) has a bending moment induced about a horizontal axis (max at base
of wall) by the liquid pressure. This is obviously at a maximum when the reservoir is full and
without soil backfill in the case of buried reservoirs. An alternative load case is the reservoir
empty with soil pressure on the exterior face of the wall. Any flexural cracking induced in both
load cases would be perpendicular to the vertical reinforcement provided to resist the ultimate
bending moment. Bending moments in the horizontal plane are induced at the corners along
Stellenbosch University http://scholar.sun.ac.za

33
fixed vertical edges along with a direct tensile force. Any flexural cracking induced would
obviously then be in a vertical direction near the corners. Smaller rectangular reservoir walls act
as vertical slabs restrained on 3 sides, therefore having horizontal and vertical moments
induced. Stability against overturning is also checked.
The dominant force induced in circular reinforced concrete reservoir walls is axial ring tension in
the horizontal plane due to hoop stress from the liquid load. The magnitude of the ring tension
is dependent on the fixity between the wall stem and base, with the top of the wall free. Walls
with sliding joints at the base have the maximum tensile force T = γw r z induced at the base of
the wall, where γw is the unit weight of water, r is the internal radius of the reservoir and z is
depth of water. Any bending moments induced in the vertical direction are neglible (about a
vertical axis). Walls that are pinned or fixed at the base have a distribution of ring tension over
the height of the wall, as shown in Figure 2.15 (a). The ring tension is zero at the base of the
wall for both fixity conditions. The liquid load on the wall will also induce a vertical bending
moment in the wall (about a horizontal axis) due to restraint of the wall by the base, the profile of
this vertical bending moment depending on the type of joint between wall and base (fixed or
pinned), as shown in Figure 2.15 (b).
Figure 2.15: Distribution of ring tension and vertical bending moment over height of wall
(Source: Anchor et al (1983))
The equations for the ring tension and vertical bending moment are derived from the
fundamental equation for the radial displacement at a depth y from the top of the wall, namely,
(a) Ring Tension (b) Vertical Bending Moment
Stellenbosch University http://scholar.sun.ac.za

34
w=γr2
Ety
where E is Young‟s modulus and t is section thickness. Differentiating with regard to y, the
equations for ring tension and vertical bending moment become
T=Et
rw and M = -EI
d2w
dy2
respectively (Bhatt et al (2006)).
The ring tension and the bending moment are thus dependent on the ratio y2/2rh where h is the
depth of water. For easier use, charts have been developed from the equations, such as those
in Reynolds and Steedman (2008). The vertical bending moment for a circular reservoir is
smaller than that in a rectangular reservoir. From the industry survey, it was found that a
representative ratio between the diameter of a circular reservoir and the height was 4 for
reservoirs having a capacity of less than 10Ml. Niehaus, at a WRC industry workshop, stated
that a sliding joint at the base of the wall stem is usually used in pre-stressed concrete circular
reservoirs in South Africa, rather than in reinforced concrete WRS. (Wium (2007(a))).
Shear forces induced at the base of the wall are checked to ensure an adequate depth of
section is used, although shear is usually not a dominant action effect. Shear reinforcement is
not provided to the wall.
(ii) Floor slabs and Foundations
Floor slabs may be cast such that they are discontinuous with the walls (larger reservoirs) or
continuous i.e. no joint at the intersection between floor slab and wall (tanks). For rectangular
reservoirs, reinforced concrete slabs are cast in square panels, whilst a radial casting pattern
may be utilised for circular reservoirs. Panel casting sequence, joints and reinforcement are
used to control the cracking due to the dominant action of serviceability limit state (SLS)
restrained deformations due to temperature and moisture effects. Where required, the ultimate
limit state (ULS) case of uplift due to groundwater is checked.
(iii) Roof slab
Currently, the most common type of construction for the roof slab of a reservoir is a flat slab
supported on columns, with heads if necessary to resist punching shear. Figure 2.16 shows
Stellenbosch University http://scholar.sun.ac.za

35
the interior of a reservoir using this type of construction.
Figure 2.16: Interior of reservoir – flat slab and column construction (Mucambe (2007))
Loads include self-weight, the permanent load of protection materials (stone, soil etc) and
imposed loads due to construction and later maintenance, inducing bending moments in two
directions. Serviceability checks for deflection and cracking are done. Serviceability limit state
restrained deformations due to temperature and moisture effects may occur, although the slab
is usually relatively unrestrained at edges, allowing some movement due to these effects.
2.5.4 Material properties specified
Durability, not strength, is the criterion for the materials chosen for WRS, as durable concrete
will have adequate strength resistance and the impermeability necessary for proper functioning
of the structure over its design life. A characteristic concrete strength (as cube strength at 28
days) of 35MPa is commonly chosen. To limit shrinkage, slagment in cement is generally
avoided, as is rapid-hardening cement. A minimum cement content of 375 kg/m3 of cementious
material is the accepted value for good-quality concrete. The maximum cement content is
however limited to 500kg/m3 to control thermal shrinkage. The water-cement ratio is also key to
ensuring concrete that has the specified strength and impermeability, with a maximum ratio of
0,5 usually specified. To ensure adequate protection of reinforcement, the concrete cover
generally chosen is 40mm, with a 50 mm cover against soil. High-yield reinforcement with a
characteristic strength of 450 MPa is standard in South Africa.
Stellenbosch University http://scholar.sun.ac.za

36
2.6 SUMMARY
The review of cracking models and design codes, and current industry practices in South Africa
for serviceability cracking with respect to reinforced concrete WRS revealed the following:
(i) Cracking is defined a serviceability limit state. Cracking is controlled in design by means of a
limiting crack width which may not be exceeded. The section dimensions and reinforcement
for the structure element considered are then chosen according to that limit. Current design
practice in South Africa is the use of BS8007. The design equations and general parameters
used in industry to calculate SLS load-induced crack widths to EN1992 and BS8007 have
been established.
(ii) The serviceability limit state of cracking is found to be the dominant limit state in design,
rather than the ultimate limit state.
(iii) More onerous crack limits are imposed by Eurocode than those of the British design codes,
specifically, a lower limit of 0,05 mm for EN1992-3 and 0,1 mm for BS8007. This could have
negative economic consequences which need to be investigated, as an increase in
reinforcement would be required as the crack width limit decreases. In addition, there is no
consensus as to the appropriate crack width for sections under water pressure.
(iv) Research done on cracking in concrete tends to be for a specific structural and loading
configuration with crack models largely developed empirically. In addition, as cracking is a
random phenomenon which results in a wide variation in results, it is difficult to generalise a
crack model for all cracking cases. The uncertainty in the crack models is thus not really
known.
(v) The structural configurations resulting in the worst loading case for either tension or bending
were investigated. The wall of a reservoir is subject to water pressure and possible leakage,
therefore is a critical design element. The structural configuration that will result in the
greatest flexural load is a wall section of a large rectangular reservoir under loading due to
water pressure, inducing a bending moment about a horizontal axis. A section of wall in a
circular reservoir under hoop stress due to water pressure will be a critical configuration for
the direct tension load case. Important parameters to consider in the crack model are cover,
section thickness and load due to water pressure.
The issue of serviceability cracking in water retaining structures due to loads under South
African conditions will be investigated in the remainder of this thesis with respect to the following
objectives which have been identified in the literature review:
Stellenbosch University http://scholar.sun.ac.za

37
(i) A comparison between BS8007 and EN1992 design equations for cracking, quantifying the
similarities and differences between the two codes.
(ii) The extent to which serviceability cracking dominates the design of WRS, as opposed to the
ultimate limit state, by performing calculations to BS8007 and EN1992, and by means of a
reliability analysis.
(iii) The effect of the lower crack width limit of 0,05 mm of EN1992 compared to the general limit
of 0,2 mm to BS8007.
(iv) The reliability of the EN1992 crack model. This will be investigated by means of a reliability
analysis.
Stellenbosch University http://scholar.sun.ac.za

38
CHAPTER 3
DESIGN ANALYSIS FOR CRACKING TO EN1992-1-1 &3 AND BS 8007
3.1 GENERAL
The investigation into South African current practices and Eurocode in the design of WRS, to
Chapter 2, identified the following four critical issues with respect to load-induced cracking:
(i) How EN1992 compares to BS8007 when applied to South African conditions.
(ii) The implications of the more onerous crack width limit of EN1992-1-1 compared to that
specified by BS8007. This needed to be assessed to establish whether or not this is a
critical issue.
(iii) The extent to which serviceability cracking governs the design of water retaining structures
(WRS), rather than the ultimate limit state. If the serviceability limit state (SLS) cracking
criteria are not met in a WRS, leakage is likely and therefore a greater loss of function of a
WRS as opposed to a building structure. This makes serviceability the more important
design limit state rather than the ultimate limit state. The motivation for performing a
reliability analysis of the EN1992 crack model is thus strengthened if serviceability
cracking is the dominant state.
(iv) The reliability of the EN1992 crack model with respect to South African conditions.
Design calculations for SLS load-induced cracking were done to BS8007 and EN1992 to
compare the two codes. These are presented in this chapter along with the results and
conclusions. The calculations were also used to assess which limit state is dominant, which
crack modes are critical and to establish a representative physical model for use in the reliability
analysis of the EN1992-1-1 crack model, detailed in Chapters 4 to 7. Certain parameters
needed for the reliability evaluation were investigated, the results of which are presented in this
chapter.
Performing calculations to satisfy a fixed-value SLS load-induced cracking criterion using a
design code in the design of a WRS, in this case BS8007 and EN1992, represents a
deterministic analysis, as opposed to a probabilistic analysis. Provision is made in the design
code to meet the required level of SLS performance by means of a fixed-value limiting crack
width and by using design values for material properties and loads. The deterministic analysis
process was begun by establishing a typical structural configuration and material parameters for
Stellenbosch University http://scholar.sun.ac.za

39
each load cracking case (tension and flexure) using the information gathered in the review of
South African design and construction practices of WRS. The design calculations to calculate
the maximum crack widths to EN1992-1-1 and BS8007 for both the tension and flexural
cracking cases were then set up using Excel spreadsheets. The crack calculation procedures
are summarised in the following section.
3.2 DETERMINISTIC CRACK ANALYSIS MODELS TO BS8007 AND EN1992-1-1
3.2.1 Structural configuration and loading
Typical loading conditions on the main structural elements in circular and rectangular reservoirs
leading to cracking in direct tension or flexure were investigated. The structural configurations of
a representative reservoir resulting in the worst tensile and flexural cracking conditions could
then be chosen for the deterministic analysis models. The wall of a reservoir would be more
critical than other elements in the structure with regard to cracking and leakage. Based on this,
a 1 m length of wall subject to water pressure only over the full height of the wall (H) for both
flexural and tensile load cracking cases was considered. The liquid load was considered as a
quasi-permanent load.
(i) Flexure load case
The worst flexure case would be found in the wall of a rectangular reservoir with bending (M) at
about the vertical axis due to liquid load (Lk), as shown in Figure 3.1.
Figure 3.1: Rectangular reservoir wall configuration
Stellenbosch University http://scholar.sun.ac.za

40
The proportions of the rectangular reservoir were chosen such that the wall acts as a cantilever
wall with a fixed base. The top of the wall is not propped. The liquid load has a triangular
distribution with the maximum bending moment occurring at the base of the wall.
(ii) Tension load case
The worst tension case would be in the wall in a circular reservoir, in the horizontal plane. The
configuration chosen for the tension model was a circular reservoir with a diameter (D) to wall
height (H) ratio in the region of 4, with hoop tension in the horizontal plane due the liquid load,
as shown in Figure 3.2. The wall has a sliding base and is unpropped at the top, such that the
reservoir behaves as a thin walled cylinder under a constant internal pressure due to the liquid
load. This configuration results in the maximum direct tensile force in the wall with no bending. A
ratio of 4 between wall height and diameter was identified from the industry survey as being
representative of circular reservoirs of up to a 10 Ml capacity.
Figure 3.2: Circular reservoir configuration
As the fixity of the base (conditions of pinned, fixed or sliding) influences the magnitude and
position of the hoop tension, the critical condition resulting in the worst tensile force and bending
moment was investigated. The pinned and fixed conditions were compared to the sliding base
condition using Table 2.75 of Reynolds and Steedman (2008) to calculate the tensile forces and
Stellenbosch University http://scholar.sun.ac.za
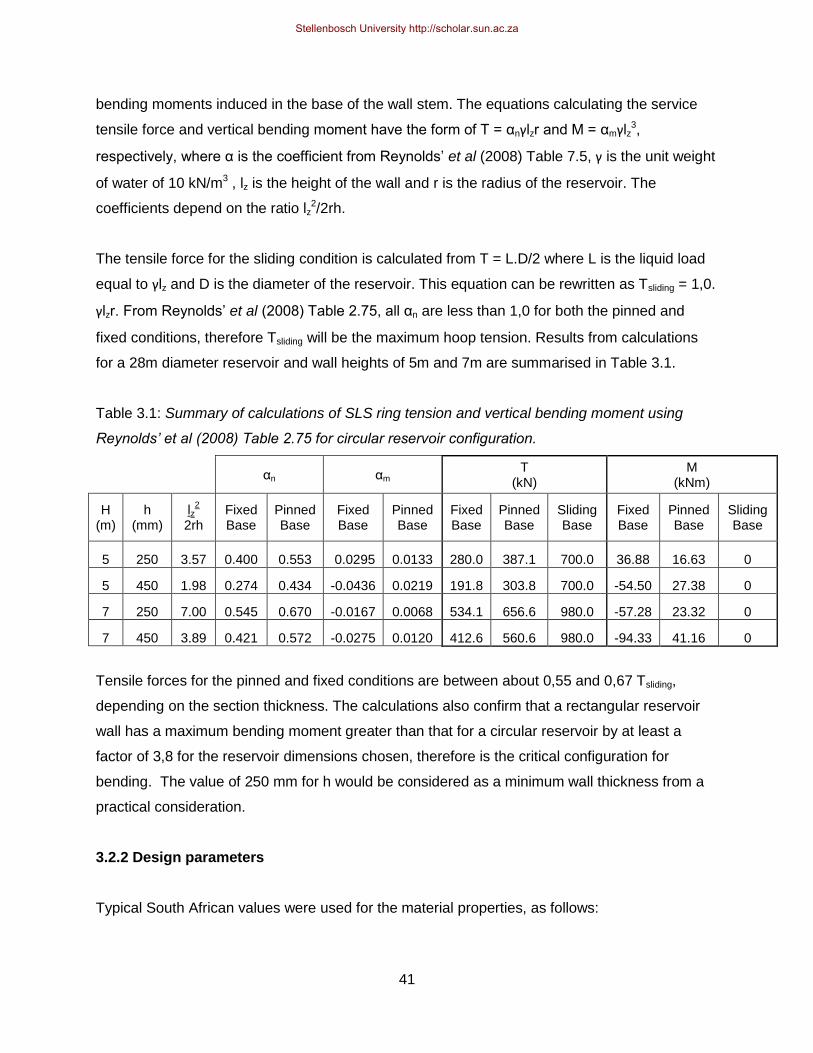
41
bending moments induced in the base of the wall stem. The equations calculating the service
tensile force and vertical bending moment have the form of T = αnγlzr and M = αmγlz3,
respectively, where α is the coefficient from Reynolds‟ et al (2008) Table 7.5, γ is the unit weight
of water of 10 kN/m3 , lz is the height of the wall and r is the radius of the reservoir. The
coefficients depend on the ratio lz2/2rh.
The tensile force for the sliding condition is calculated from T = L.D/2 where L is the liquid load
equal to γlz and D is the diameter of the reservoir. This equation can be rewritten as Tsliding = 1,0.
γlzr. From Reynolds‟ et al (2008) Table 2.75, all αn are less than 1,0 for both the pinned and
fixed conditions, therefore Tsliding will be the maximum hoop tension. Results from calculations
for a 28m diameter reservoir and wall heights of 5m and 7m are summarised in Table 3.1.
Table 3.1: Summary of calculations of SLS ring tension and vertical bending moment using
Reynolds’ et al (2008) Table 2.75 for circular reservoir configuration.
αn αm T
(kN) M
(kNm)
H (m)
h (mm)
lz2
2rh Fixed Base
Pinned Base
Fixed Base
Pinned Base
Fixed Base
Pinned Base
Sliding Base
Fixed Base
Pinned Base
Sliding Base
5 250 3.57 0.400 0.553 0.0295 0.0133 280.0 387.1 700.0 36.88 16.63 0
5 450 1.98 0.274 0.434 -0.0436 0.0219 191.8 303.8 700.0 -54.50 27.38 0
7 250 7.00 0.545 0.670 -0.0167 0.0068 534.1 656.6 980.0 -57.28 23.32 0
7 450 3.89 0.421 0.572 -0.0275 0.0120 412.6 560.6 980.0 -94.33 41.16 0
Tensile forces for the pinned and fixed conditions are between about 0,55 and 0,67 Tsliding,
depending on the section thickness. The calculations also confirm that a rectangular reservoir
wall has a maximum bending moment greater than that for a circular reservoir by at least a
factor of 3,8 for the reservoir dimensions chosen, therefore is the critical configuration for
bending. The value of 250 mm for h would be considered as a minimum wall thickness from a
practical consideration.
3.2.2 Design parameters
Typical South African values were used for the material properties, as follows:
Stellenbosch University http://scholar.sun.ac.za

42
Concrete compressive strength (characteristic value) fck/ fcu 30/37 Mpa
Concrete tensile strength (mean value) fct,eff 2,90 Mpa
Reinforcement yield strength (characteristic value) fy 450 MPa
Modular ratio αe 15
Modulus of elasticity, steel Es 200 GPa
Density of water γ w 9,81 kN/m3
Values of 30/37 for fck/ fcu were chosen so as to be consistent with EN 1992-1-1 tabulated
values. The characteristic strength of a material corresponds to the mean strength, fm, less 1,64
times the standard deviation, s, with the mean and standard deviation for a material determined
from standard materials testing. However, the tensile strength of concrete is an exception as the
mean value is used as opposed to the characteristic value. The concrete tensile strength fct,eff is
taken as fctm (mean value of tensile strength) and was calculated using the EN1992-1-1 formula:
fctm = 0.3 fck2/3
The modular ratio is the ratio Esteel /Econcrete, long term.
The physical parameters of height of wall (H) thus liquid load (Lk), section thickness (h), cover
(c), the diameter (θ) and area of the tension reinforcement were chosen as follows:
(i) A wall height of 5m, being reasonable for a reinforced concrete water retaining reservoir,
was chosen as the reference height for the analyses using BS8007 and EN1992. In the
EN1992 deterministic analysis for later comparison with the reliability analysis, wall
heights corresponding to the depth of water of 5m, 6m and 7m were chosen. The wall
heights of 5, 6 and 7m result in maximum service liquid loads of 50 kN/m2, 60 kN/m2 and
70 kN/m2 respectively and maximum ultimate liquid loads (γ = 1,2) of 60 kN/m2, 72 kN/m2
and 84 kN/m2 for both the rectangular and the circular reservoir configurations.
(ii) For the comparison between BS8007 and EN1992-3, section thicknesses from 250 mm
increasing in 50 mm increments were considered for a wall height of 5m.
(iii) The reinforcement cover was taken as 40 mm in all analyses investigating the effect of
wall thickness and bar diameter, as this is the value most commonly used in practice for
WRS in South Africa. The effect of concrete cover as a parameter was investigated by
carrying out the analyses using a cover of 50 mm and then comparing the crack widths
obtained to those calculated for a cover of 40 mm, using a bar diameter of 20 mm and
section thickness of 450 mm.
(iv) Bar diameters of 16, 20 and 25 mm were chosen as they are those typically used in
Stellenbosch University http://scholar.sun.ac.za

43
reinforced concrete WRS. Diameters larger than 25 mm result in wider cracks forming,
while diameters smaller than 16 mm result in excessively small reinforcement spacings.
(v) In defining a representative range of reinforcement area (As), a maximum feasible limit
was determined by considering a minimum practical spacing of bars, namely, a 75 mm
spacing, given single reinforcing bars. The SANS10100-1 design code rules for minimum
and maximum areas of reinforcement were also observed. SANS10100 Cl. 4.11.5.3
specifies that the total maximum reinforcement area (as ρ% = % As = 100As/Ac) for a
beam is 4% of the gross cross sectional area, Ac for either the tension or the compression
reinforcement. Guidance is not given for the maximum reinforcement to be provided in
the horizontal plane of the wall of a structure such as a circular reservoir under tension.
Using a minimum feasible bar spacing of 75 mm resulted in areas less than 4%, therefore
tended to be the limiting criterion, rather than the maximum reinforcement area. Table 3.2
summarises the total maximum reinforcement that can be specified for a given wall
thickness using bar spacing as the limiting criterion, for one face of the wall.
Table 3.2: Maximum reinforcement area per face (%As) for minimum 75 mm bar spacing.
%As
h Y16 – 75 Y20 – 75 (4189 mm
2)
Y25 – 75 (6545 mm
2) mm (2681 mm
2)
250 1.07 1.68 2.62
300 0.89 1.40 2.18
350 0.77 1.20 1.87
400 0.67 1.05 1.64
450 0.60 0.93 1.45
500 0.54 0.84 1.31
550 0.49 0.76 1.19
600 0.45 0.70 1.09
650 0.41 0.64 1.01
700 0.38 0.60 0.94
750 0.36 0.56 0.87
Note: As is per single layer of reinforcement
Crack width limits over the range of 0,2 to 0,05 mm were considered, as specified by the
BS8007 and EN1992-3 design codes respectively. In the case of EN1992-3, as summarised in
Section 2.4.1 of Chapter 2, the crack width limit for cracks through the section is determined by
the hydraulic ratio of wall height to wall thickness (hD/ h) which results in smaller limiting crack
widths than 0,2 mm. Limiting crack widths are thus as follows:
hD/ h ≤ 5 wk1 is 0,2 mm
hD/ h ≥ 35 wk1 is 0,05 mm.
Stellenbosch University http://scholar.sun.ac.za

44
3.2.3 Ultimate limit state of loading calculations
The ultimate limit state for both the tension and the flexure load cases was calculated. The
section geometry was chosen for given bar diameters and wall heights, given the spacing of
reinforcement that can be practically fixed. ULS reinforcement quantities (AULS) were also
calculated in order to confirm that serviceability is the dominant limit state. The ratio of
serviceability to ultimate reinforcement required, ASLS/AULS, was used to indicate the degree of
dominance. If serviceability cracking is the dominant limit state in the design of WRS, the
ASLS/AULS ratio will be greater than one. The ULS reinforcement for flexural and tension loading
is the same for both BS8007 and Eurocode.
Water pressure on the rectangular reservoir wall in the flexural load case will result in a
triangular load distribution from 0 at the top of the wall to a maximum at the base of γ w H. As
already stated, the partial load factor of 1,2 was used for the quasi-permanent liquid load.
Ultimate maximum bending moments (Mu) for the flexure condition were then calculated using
(
)
The maximum direct tensile force (Tu) for the direct tension case was calculated using
where D is the diameter of the reservoir.
The reinforcement required for the ultimate limit state bending moment at the base of the wall
for the flexure model was calculated using the equations of SANS 10100-1 Cl 4.3.3, which use
the simplified rectangular-parabolic stress block theory for tension reinforcement only. The
procedure is as follows:
1. Calculate the lever arm { √(
)}
where d is the effective depth of section and
For tension reinforcement only, K ≤ K‟ = 0,156 and the redistribution of moments is less than
10%. The width of the section (b) is 1 m.
2. Calculate the tension reinforcement required in the tension face of the wall (i.e. one face)
from:
Stellenbosch University http://scholar.sun.ac.za

45
The ULS reinforcement required for the tension model was calculated using:
Note that As for the tension model is the reinforcement required for both faces as Tu is the total
ultimate tensile force in the wall.
3.2.4 Serviceability limit state of cracking due to loads
The models were set up in order to calculate the crack widths (w) over a range in reinforcement
area for a given bar diameter. Graphs for comparison could then be plotted for the variation of
crack width with reinforcement (as %As, area in mm2 or as ratio ASLS/AULS). The serviceability
bending moments (M) were calculated using:
(
)
with the serviceability tension (T) calculated using:
The SLS crack widths were then calculated using the relevant equations in each code for a
given reinforcement diameter and spacing, hence area of reinforcement, for both the tension
and flexure crack conditions. These equations were presented in 2.3.2 and 2.3.3 of Chapter 2
for BS8007 and EN1992, respectively. Stresses and strains were calculated using linear elastic
theory. In the SLS flexural cracking model, the section was designed to have tension
reinforcement only. In the SLS tension cracking model, a constant tensile stress distribution was
assumed across the full thickness of the wall. The procedures predicting the expected
maximum crack width to each code for a given wall geometry and material properties are as
follows:
BS8007 crack calculations procedure
(i) Flexure
1. Use the SLS bending moment.
2. Assume a bar diameter (θ) and spacing (s).
Stellenbosch University http://scholar.sun.ac.za

46
3. Calculate the depth of the neutral axis (x) based on the principle of equivalent areas and
the lever arm z = d – x/3.
4. Calculate the distance from the crack to the nearest reinforcing bar (acr). For a typical
reservoir wall section acr is determined using equation 2.1.
5. Determine the service steel stress fs = M/ As z and thus the strain at the level of the steel,
εs = fs/ Es. For flexure, the depth of the neutral axis, x, is calculated based on the principle
of equivalent areas and thus, the lever arm, z = d – x/3.
6. Calculate the apparent strain at the surface (ε1) using Equation 2.5.
7. Calculate tension stiffening in the concrete in tension using Equation 2.6(a) or 2.6(b),
depending on the limiting crack width chosen.
8. Determine the mean strain, εm = ε1 – ε2
9. Calculate the expected maximum crack width for flexure using Equation 2.1.
(ii) Tension
1. Use the SLS tensile force.
2. Assume a bar diameter and spacing.
3. Calculate the distance from the crack to the nearest reinforcing bar (acr) as for flexure.
4. Determine the service steel stress fs = T/ As and thus the steel strain εs (= ε1) = fs/ Es.
5. Calculate tension stiffening in the concrete in tension, using Equations 2.7(a) or 2.7(b),
depending on the limiting crack width chosen.
6. Calculate the mean strain, εm = ε1 – ε2.
7. Determine the expected maximum crack width for tension using Equation 2.2.
EN1992-1-1 crack calculation procedure
EN1992 uses the same equations for the crack width and spacing for both tension and flexural
cracking. The procedure used for the analysis is as follows:
1. Use the SLS bending moment or tensile force, as relevant.
2. Use the same bar diameter and spacing as the BS8007 analysis to obtain the area of
tension reinforcement (As) to enter into the crack width equation.
3. Determine the effective depth of the tension area hc,eff, taken as the lesser of h/2, 2,5(h - d)
and (h – x)/3, and so the effective area in tension Act,eff with a section width b of 1m. The
effective depth for the tension case will either be h/2 or 2,5(h-d).
4. Calculate the maximum predicted crack spacing using equation 2.11.
Stellenbosch University http://scholar.sun.ac.za
47
5. Calculate the steel stress which will be ζs = M/ As z for flexure and ζs = T/ As for tension,
as set out in the procedure above to BS8007. Thus the mean steel strain εsm = ζs/ Es is
calculated.
6. Determine mean concrete strain using equation 2.9, where kt = 0,4 for long term loading.
7. Determine the maximum crack width using equation 2.10.
Excel spreadsheets were set up to calculate and record the crack widths for varying parameters
and reinforcement quantities for both crack models. Graphs showing the variation of crack width
with reinforcement area were plotted. The reinforcement area was expressed in terms of
ρ as %As = As/Ac where Ac is the gross cross sectional area of the wall section, and in terms of
the ratio serviceability reinforcement area / ultimate reinforcement area (ASLS/ AULS). Some
representative graphs are presented here. Data sheets and additional graphs are included in
Appendix 1.
3.3 RESULTS AND DISCUSSION
Results of the deterministic analysis of BS8007 and EN1992-3 serviceability limit state crack
equations for flexural and tensile load-induced cracking in WRS are presented in this section
with respect to the following objectives of the deterministic analysis:
(i) A comparison between BS8007 and EN1992 for SLS flexural and tension cracking.
(ii) The implications of the more onerous crack width limits of EN1992-1-1 than BS8007.
(iii) The extent to which serviceability cracking governs the design of WRS, rather than the
ultimate limit state.
(iv) Choice of representative parameters for use in the reliability analyses of the EN1992-1-1
crack model, presented in Chapter 5.
Graphs for comparison were plotted as the variation of crack width with %As or ASLS/AULS. As
stated earlier in this chapter, the %As values given are the tension reinforcement only for
flexural cracking (i.e. one face of wall only) and in the case of tension cracking, for the
reinforcement required in both faces to resist the total tensile force in the wall.
3.3.1 Comparison of EN1992 and BS8007 – direct tensile and flexural load cracking
The reinforcement required to satisfy crack limits of 0,2 mm and 0,1mm for both flexural and
Stellenbosch University http://scholar.sun.ac.za

48
tension cracking is used as the basis of comparison between BS8007 and EN1992.
(i) Flexural cracking
Comparisons of the calculated crack widths for flexural cracking in the rectangular reservoir
configuration considered could be made directly between BS8007 and EN 1992, for a range of
wall thicknesses from 250 to 450 mm, a 20 mm bar diameter and a cover of 40 mm for a wall
height of 5 m. Figure 3.3 shows the variation of crack width with %As for flexural cracking.
Figure 3.3: Flexure case - Comparison between EN1992 & BS8007 (using ε2 for wlimit = 0,2 mm)
From Figure 3.3, the %As to be provided to satisfy a 0,2 mm crack width varies from about 1,0%
to 0,62% for EN1992 and from about 1,03% to 0,56% for BS8007, for section thicknesses from
0.00
0.10
0.20
0.30
0.40
0.20 0.30 0.40 0.50 0.60 0.70 0.80 0.90 1.00 1.10 1.20 1.30 1.40 1.50 1.60 1.70 1.80
w
(mm)
%As
h=250 h=300 h=350 h=400 h=450
w 0.2 mm
0.00
0.10
0.20
0.30
0.40
0.20 0.30 0.40 0.50 0.60 0.70 0.80 0.90 1.00 1.10 1.20 1.30 1.40 1.50 1.60 1.70 1.80
w (mm)
%As
h= 250 h = 300 h = 350 h = 400 h = 450
w 0.2 mm
EN1992
BS8007
Stellenbosch University http://scholar.sun.ac.za

49
350 to 450 mm. It can therefore be concluded that EN1992 is slightly more conservative than
BS8007 for flexural cracking at a crack width of 0,2 mm.
Referring to Figure 3.3, for BS8007, a crack width of 0,2 mm will not be achieved using section
thicknesses less than 300 mm with a single layer of reinforcement.
(ii) Tension cracking
The calculated EN1992 crack width was found to be independent of section thickness when
considering a bar diameter of 20mm and 40 mm cover. This is due to the limiting equation for
the effective depth of the tension zone (hc,eff) in the EN1992 tension cracking calculations, which
was found to be 2,5 (h – d) and can be written as 2,5 (c + θ/2). This means that the effective
area in tension, and thus the effective area of concrete, is constant for this bar diameter and
cover and is independent of h. A summary of the calculations for hc,eff to EN1992 for bar
diameters of 16, 20 and 25 mm is given in Table 3.3. The limiting equation of 2,5(h-d) tends to
dominate for wall thicknesses greater than 300 mm, regardless of the combination of cover, bar
diameter and wall thickness. The variation of crack width with reinforcement area will therefore
be the same for all wall thicknesses in the calculation of EN1992 crack widths.
Table 3.3: Calculation of effective depth of the tension area (mm) for tension cracking.
Cover (mm)
h (mm)
Bar dia 16 mm Bar dia 20 mm Bar dia 25 mm
d h/2 2,5(h-d) d h/2 2,5(h-d) d h/2 2,5(h-d)
40
250 202 125 120 200 125 125 197.5 125 131.25
300 252 150 120 250 150 125 247.5 150 131.25
350 302 175 120 300 175 125 297.5 175 131.25
400 352 200 120 350 200 125 347.5 200 131.25
450 402 225 120 400 225 125 397.5 225 131.25
500 452 250 120 450 250 125 447.5 250 131.25
50
250 192 125 145 190 125 150 187.5 125 156.25
300 242 150 145 240 150 150 237.5 150 156.25
350 292 175 145 290 175 150 287.5 175 156.25
400 342 200 145 340 200 150 337.5 200 156.25
450 392 225 145 390 225 150 387.5 225 156.25
500 442 250 145 440 250 150 437.5 250 156.25
Note that highlighted values given in Table 3.3 are the minimum effective depth of the tension
zone in concrete.
Stellenbosch University http://scholar.sun.ac.za

50
The difference between BS8007 and EN1992 tension cracking in the circular reservoir
configuration considered is illustrated by Figure 3.4 showing the variation of crack width with
%As (both faces) for a 20 mm bar diameter, a cover of 40 mm and a wall height of 5 m over a
range of wall thicknesses from 250 to 450 mm.
Figure 3.4: EN1992-1-1 & BS8007 (ε2 for wlimit = 0,2 mm) tension case crack width
As discussed, the EN1992 calculated crack width is independent of h and is thus represented in
Figure 3.4 by a single curve. Using Figure 3.4, for a crack width of 0,2mm, the reinforcement
area to be provided according to EN1992 is about 5000 mm2 regardless of section thickness
(which is about 2 %As for an h of 250 mm and 1,11 %As for an h of 450 mm)
The corresponding values of %As to BS8007 for tension cracking to meet a crack width of
0,2mm are less than those of EN1992, that is, in the range of 1,45% to 0,69% for h varying from
250 to 450 mm, respectively, corresponding to reinforcement areas of 3625 mm2 and 3100
mm2, respectively. EN1992 is found to be far more severe than BS8007 for tension cracking,
predicting larger reinforcement areas by about 38 to 61% as section thicknesses increases over
a range of 250 to 450 mm at a crack width limit of 0,2 mm.
Table 3.4 is a summary of the reinforcement calculated to both codes in satisfying crack width
limits of 0,2 and 0,1. Values are also given for a 0,05 mm crack width to EN1992. A 40 mm
cover and 20 mm bar diameter for both tension and flexural cracking were used.
0.00
0.10
0.20
0.30
0.40
0.50 1.00 1.50 2.00 2.50 3.00 3.50 4.00 4.50 5.00 5.50 6.00
w (mm)
ASLS/AULS
BS h250 BS h300 BS h350 BS h400 BS h 450 EN
w 0,2 mm
Stellenbosch University http://scholar.sun.ac.za

51
Table 3.4: Comparison between BS8007 and EN1992 for varying crack widths
Load case h
(mm)
Crack
width
(mm)
AULS
(mm2)
BS8007 EN1992
EN/BS ASLS
(mm2)
ASLS/AULS ASLS
(mm2)
ASLS/AULS
Flexure
450 0.2
1680
2520 1.50 2777 1.65 1.1
0.1 4140 2.46 4405 2.62 1.1
0.05 7151 4.26 -
250 0.2
4257
- - 5000 1.17 -
0.1 - - 7500 1.76 -
0.05 - - 11500 2.70 -
Tension
450 0.2
2146
3100 1.48 4999 2.33 1.6
0.1 4120 1.62 7571 3.60 2.2
0.05 11776 5.49 -
250 0.2
2146
3600 1.68 4999 2.33 1.4
0.1 4815 2.24 7571 3.60 1.6
0.05 - - 11776 5.49 -
Note: As exceeding Y20@75 (4189 mm2) highlighted in yellow
As exceeding maximum of 4% highlighted in green
Table 3.4 illustrates that EN1992 is slightly more conservative than BS8007 for flexural cracking
for both 0,2 mm and 0,1 mm crack widths (h 450 mm), requiring about 1,1 times the
reinforcement calculated to BS8007. In the tension case, EN1992 requires about 1,6 times the
reinforcement calculated to BS8007 for a crack width of 0,2 mm (h 450 mm). This ratio
increases as the crack width limit decreases. A crack width of 0,1 mm could not be met using a
section thickness of 250 mm and BS8007.
Referring to Table 3.4 and the As values highlighted in yellow, it must be noted that a maximum
feasible reinforcement area of Y20@75 (4189 mm2) is exceeded in all cases considered, except
when using a section thickness of 450 mm and a crack width of 0,2 mm are used. The diameter
of the reinforcement could in some cases be increased, a double layer of reinforcement may be
used or the section thickness can be increased. The latter two alternatives have obvious
negative economic consequences on the construction of the WRS. The EN1992 As values
highlighted in green on Table 3.4 are those exceeding the maximum allowable area of 4% to
SANS10100-1 (2004), that is 10 000 mm2 for h 250 mm and 18 000 mm2 for h 450 mm.
Stellenbosch University http://scholar.sun.ac.za
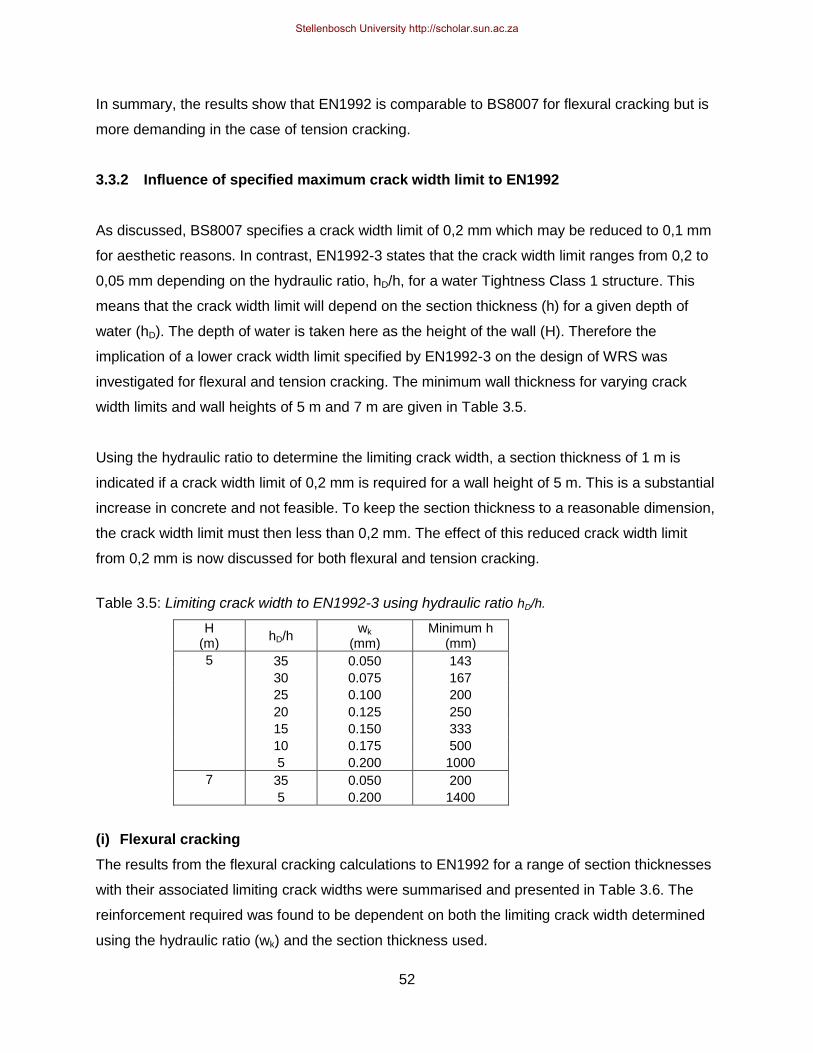
52
In summary, the results show that EN1992 is comparable to BS8007 for flexural cracking but is
more demanding in the case of tension cracking.
3.3.2 Influence of specified maximum crack width limit to EN1992
As discussed, BS8007 specifies a crack width limit of 0,2 mm which may be reduced to 0,1 mm
for aesthetic reasons. In contrast, EN1992-3 states that the crack width limit ranges from 0,2 to
0,05 mm depending on the hydraulic ratio, hD/h, for a water Tightness Class 1 structure. This
means that the crack width limit will depend on the section thickness (h) for a given depth of
water (hD). The depth of water is taken here as the height of the wall (H). Therefore the
implication of a lower crack width limit specified by EN1992-3 on the design of WRS was
investigated for flexural and tension cracking. The minimum wall thickness for varying crack
width limits and wall heights of 5 m and 7 m are given in Table 3.5.
Using the hydraulic ratio to determine the limiting crack width, a section thickness of 1 m is
indicated if a crack width limit of 0,2 mm is required for a wall height of 5 m. This is a substantial
increase in concrete and not feasible. To keep the section thickness to a reasonable dimension,
the crack width limit must then less than 0,2 mm. The effect of this reduced crack width limit
from 0,2 mm is now discussed for both flexural and tension cracking.
Table 3.5: Limiting crack width to EN1992-3 using hydraulic ratio hD/h.
H (m)
hD/h wk
(mm) Minimum h
(mm)
5 35 0.050 143 30 0.075 167 25 0.100 200 20 0.125 250 15 0.150 333 10 0.175 500 5 0.200 1000
7 35 0.050 200
5 0.200 1400
(i) Flexural cracking
The results from the flexural cracking calculations to EN1992 for a range of section thicknesses
with their associated limiting crack widths were summarised and presented in Table 3.6. The
reinforcement required was found to be dependent on both the limiting crack width determined
using the hydraulic ratio (wk) and the section thickness used.
Stellenbosch University http://scholar.sun.ac.za

53
Table 3.6: EN1992 Flexural cracking – Effect of reduction in crack width limit
wk using hD/h w 0.2 mm
H h hD/h ULS As wk SLS As,k
ASLS/ AULS
SLS SLS As,0.2
ASLS/ AULS
SLS As,k/ As,0.2 (m) (mm) Ratio (mm
2) (mm) (mm
2) %As (mm
2) %As
5 250 20.0 4257 0.125 7140 1.68 2.86 4819 1.13 1.93 1.48
300 16.7 2973 0.147 5073 1.71 1.69 3999 1.35 1.33 1.27
350 14.3 2346 0.154 4189 1.79 1.20 3468 1.48 0.99 1.21
400 12.5 1970 0.163 3545 1.80 0.89 3084 1.57 0.77 1.15
450 11.1 1680 0.169 3098 1.84 0.69 2777 1.65 0.62 1.12
500 10.0 1494 0.175 2731 1.83 0.55 2513 1.68 0.50 1.09
550 9.1 1344 0.180 2419 1.80 0.44 2265 1.68 0.41 1.07
600 8.3 1222 0.183 2241 1.83 0.37 2116 1.73 0.35 1.06
7 500 14.0 3964 0.155 7405 1.87 1.48 6104 1.54 1.22 1.21
550 12.7 3857 0.161 6598 1.71 1.20 5635 1.46 1.02 1.17
600 11.7 3441 0.167 5955 1.73 0.99 5249 1.53 0.87 1.13
750 9.3 1659 0.178 4533 2.73 0.60 4189 2.52 0.56 1.08
Note: As exceeding maximum practical reinforcement limit of Y20 @75 (4189) highlighted in yellow
Referring to Table 3.6, reinforcement areas obtained are greater than that of Y20 @ 75 (4189)
have been highlighted yellow. Using 20mm diameter bars, the section thickness required to
achieve the specified crack width limit whilst providing a practical reinforcement quantity must
be at least 350 mm. Increasing the bar diameter to 25 mm would result in an increase in bar
spacing and a reduction in the section thickness to 300 mm. Alternatively, for thicker sections, 2
layers of reinforcement per face could be used, such that minimum spacing of reinforcement
and maximum reinforcement areas are observed. As a comparison, the minimum wall thickness
required by ULS load calculations such that compression reinforcement is not needed is about
250 mm considering a 5 m wall height.
An increasing section thickness for a given wall height (increasing hD/h) results in a
corresponding decrease in the amount of reinforcement required, illustrated by Table 3.6.
However, the decrease in the limiting maximum crack width from 0,2 mm results in an overall
increase in the reinforcement required to meet the specified limit for a given section thickness.
This is also shown in Figure 3.5 which is the variation of the reinforcement area required to
satisfy a given crack width with the hydraulic ratio. As the graphs diverge with increasing
hydraulic ratio, the difference between As,k and As,0.2 increases.
Stellenbosch University http://scholar.sun.ac.za

54
Figure 3.5: EN1992 Flexural cracking – variation of reinforcement area with hydraulic ratio.
This increase was measured by calculating the reinforcement ratio As,k / As,0.2 which is given in
the last column in Table 3.6. As,k / As,0.2 is the ratio of the reinforcement required for wk (As,k)
using the hydraulic ratio (hD/h) to the reinforcement required at a 0,2 mm crack width (As,0.2) as
the hydraulic ratio increases. Figure 3.5, showing the variation of the reinforcement ratio As,k /
As,0.2 with the hydraulic ratio, was then plotted. The figure shows that As,k / As,0.2 increases with
increasing hydraulic ratio, irrespective of the height of the wall.
Figure 3.6: EN1992 Flexural cracking - Variation of ratio of As,k to As,0.2 with hydraulic ratio, hD/h
2000
3000
4000
5000
6000
7000
8000
5 6 7 8 9 10 11 12 13 14 15 16 17 18 19 20
As (mm2)
hD/h
H 7m
H 5m
As,k
As,0.2
As,k
As,0.2
1
1.1
1.2
1.3
1.4
1.5
5 6 7 8 9 10 11 12 13 14 15 16 17 18 19 20
As,k/As,0.2
hD/h
1.12
11.1
H 5m
H 7m
Stellenbosch University http://scholar.sun.ac.za

55
Referring to Table 3.6 and Figure 3.6, the reinforcement area required increases by a factor of
1,12 for a hydraulic ratio of 11,1 (450 mm section and 5 m wall height). The crack width limit for
this ratio is 0,17 mm. Comparing this to the area of reinforcement required of 2520 mm2 to
achieve a 0,2 mm crack width using BS8007 (refer to Table 3.4), the application of EN1992-3
means an increase in reinforcement by a factor of 1,23 to satisfy the reduced crack width limit
from 0,2 mm to 0,169 mm.
It must be noted that in the flexural cracking case, cracks do not always go through the section if
loading is on one face of the wall only. In this case, EN1992-3 Cl 7.3.1 states that the crack
width limit may be taken as 0,2 mm, providing the depth of the compression zone is at least xmin
considering the quasi-permanent combination of loadings. EN1992-3 recommends values of the
smaller of 50 mm and 0,2h for xmin. However, this clause also states that where a section is
subject to alternate actions, then cracks must be considered as passing through the full section
unless it can be proved that some part of the section thickness of at least xmin will remain in
compression. Thus, for the flexural cracking case, the possibility of through-cracks, whilst not as
likely as for direct tension cracking, must still be considered.
(ii) Tension cracking
The reinforcement required to meet the required limiting crack widths to EN1992-3 for tension
cracking is summarised in Table 3.7. Using a 20 mm bar diameter and 40 mm cover, the
EN1992 crack width equation applied to the tension case is independent of section thickness,
as the dominating equation for hc,eff in determining the effective area of concrete in tension is
governed by 2,5(c + θ/2). Referring to Table 3.7, this is shown by the constant area of
reinforcement obtained (SLS As,0.2) to satisfy a 0,2 mm crack width irrespective of the section
thickness. The reinforcement required is thus dependent only on the crack width limit
determined by the hydraulic ratio.
It was noted that a wall thickness of 250 mm for a 7 m wall height results in the maximum
allowable reinforcement of 4% (10 000 mm2) being exceeded as 4,15% (10373 mm2) is
obtained to meet the specified crack width of 0,085 mm. The wall thickness must in this case
then be increased, decreasing the hydraulic ratio and therefore decreasing the specified crack
width limit and the amount of reinforcement needed. Referring to Table 3.7 and considering a 5
m wall height, a wall thickness of 450 mm (hD/h of 11.1) leads to a crack width limit of 0,17 mm.
Stellenbosch University http://scholar.sun.ac.za

56
Table 3.7: EN1992 Tension cracking – Effect of reduction in crack width limit (As both faces)
Reinforcement for wk to hD/h w 0.2 mm
H h hD/h ULS As wk SLS As,k ASLS/
AULS
SLS SLS As,0.2 ASLS/
AULS
SLS As,k/ As,0.2 (m) (mm) Ratio (mm
2) (mm) (mm
2) %As (mm
2) %As
5 250 20.0 2146 0.125 6607 3.08 2.64 4999 2.59 2.23 1.32
300 16.7 2146 0.147 5994 2.79 2.00 4999 2.59 1.85 1.20
350 14.3 2146 0.154 5830 2.72 1.67 4999 2.59 1.59 1.17
400 12.5 2146 0.163 5637 2.63 1.41 4999 2.59 1.39 1.13
450 11.1 2146 0.169 5518 2.57 1.23 4999 2.59 1.24 1.10
500 10.0 2146 0.175 5406 2.52 1.08 4999 2.59 1.11 1.08
550 9.1 2146 0.180 5317 2.48 0.97 4999 2.59 1.01 1.06
600 8.3 2146 0.183 5266 2.45 0.88 4999 2.59 0.93 1.05
7 250 28.0 3004 0.085 *10373 3.45 4.15 6098 2.03 2.44 1.70
300 23.3 3004 0.108 8901 2.96 2.97 6098 2.03 2.03 1.46
350 20.0 3004 0.125 8122 2.70 2.32 6098 2.03 1.74 1.33
400 17.5 3004 0.138 7369 2.45 1.84 6098 2.03 1.52 1.21
450 15.6 3004 0.147 7347 2.45 1.63 6098 2.03 1.36 1.20
500 14.0 3004 0.155 7113 2.37 1.42 6098 2.03 1.22 1.17
550 12.7 3004 0.161 6950 2.31 1.26 6098 2.03 1.11 1.14
600 11.7 3004 0.167 6797 2.26 1.13 6098 2.03 1.02 1.11
Note: As exceeding maximum practical reinforcement limit of Y20 @75 both faces (8378) highlighted in
yellow.
A reinforcement area of 5518 mm2 is obtained which is an increase by a factor of about 1,1 over
that for a 0,2 mm crack width. Comparing to BS8007, reinforcement areas are substantially
larger for EN1992. The area determined by BS8007 requires about 2900 mm2 and 2160 mm2
for 250 and 450 mm wall thicknesses, respectively, at a 0,2 mm crack width.
As with flexural cracking, Figure 3.7 shows the ratio As,k / As,0.2 increases with increasing
hydraulic ratio, irrespective of the height of the wall, although the increase is slightly smaller at
higher hD/h values in the case of tension cracking.
In general for both flexural and tension cracking, there is an increase in the materials required
therefore an increase in costs if a smaller crack width limit is specified. A cost optimisation
analysis would determine the best combination of geometry of section (so determining the
concrete quantity), reinforcement and limiting crack width. The increase in costs is directly
proportional to the increase in materials.
Stellenbosch University http://scholar.sun.ac.za

57
Figure 3.7 EN1992 Tension cracking - Variation of ratio of As,k to As,0.2 with hydraulic ratio, hD/h
3.3.4 Influence of SLS cracking (using EN1992)
From the overview of the design of WRS summarised in Chapter 2, SLS cracking is considered
in industry to be the dominant limit state, rather than the ULS of loading. To investigate the
extent of this dominance, ASLS/AULS ratios were determined for flexural and tension cracking to
EN1992, and graphs were plotted for comparison showing the variation of crack width with
ASLS/AULS It must be noted that the characteristic tensile strength of reinforcement used in the
calculation of the ultimate reinforcement to SANS10100-1 is 450 MPa (Es = 200 GPa) which is
about 89% of the typical value of 500 MPa (Es = 200 GPa) used by Eurocode. This means
calculations for ULS loading to SANS10100-1 result in a higher ULS reinforcement area by
about 11% compared to Eurocode. As the SLS crack width equations are independent of the
steel strength, the enhancement of ultimate reinforcement requirements to meet the
serviceability requirement using the South African value for the steel strength is 11% less than
that strength used by Eurocode. The ASLS/AULS ratio will also be influenced proportionally by the
ULS partial safety load factor considered for the liquid load. A larger ULS load factor will result
in a smaller ASLS/AULS ratio.
(i) Flexure
Considering crack width limits of 0,2 mm and less for flexural cracking, Figure 3.8 (using
1.0
1.1
1.2
1.3
1.4
1.5
1.6
1.7
8 9 10 11 12 13 14 15 16 17 18 19 20 21 22 23 24 25 26 27 28
As,k/As,0.2
hD/h
H 5m
H 7m
Stellenbosch University http://scholar.sun.ac.za

58
EN1992) shows that the serviceability limit state is the dominant state rather than the ultimate
limit state for all wall thicknesses in the deterministic crack width calculations as ASLS/AULS ratios
exceed 1,0. Figure 3.8 also illustrates that the ASLS/AULS ratio determined using EN1992
increases with increasing wall thickness. It was noted that the ULS flexure reinforcement
required decreases as section thickness increases, but at a smaller rate than the increase in
SLS reinforcement required as section thickness increases.
The dominance of SLS increases as the limiting crack width for flexural cracking decreases.
Referring to Table 3.6 and Figure 3.8, for flexural cracking calculations to EN1992 and a section
thickness of 450 mm, a ASLS/AULS ratio of about 1,65 is obtained to satisfy a crack width limit of
0,2 mm. The ratio increases to about 2,6 for a crack width limit of 0,10 mm (determined by the
hydraulic ratio) which is an increase in reinforcement by a factor of about 1,6. A further
reduction in the crack width limit to 0,05 mm results in a ratio of about 3,8, an increase by a
factor of about 2,3. Note that as discussed in the previous Section 3.3.2, for flexural cracking,
these crack width limits will apply to cracking through the full section.
Figure 3.8: EN1992 flexure load case – influence of SLS cracking
(ii) Tension
The serviceability limit state is also found to be the dominant limit state for the tension cracking
condition as illustrated by Figure 3.9 which shows the variation of crack width with ASLS/AULS
ratios using EN1992. In addition, the ratios are higher for tension cracking than for flexural
cracking. This is in part due to the ULS reinforcement calculation for the direct tension case in a
0.00
0.10
0.20
0.30
0.40
0.5 1.0 1.5 2.0 2.5 3.0 3.5 4.0
w (mm)
ASLS/AULS
h 250 h 300 h 350 h 400 h 450
w 0,2 mm
1.65
w 0.1 mm
2.61
Stellenbosch University http://scholar.sun.ac.za

59
wall with a sliding base being dependent on the applied tensile force and steel strength but
independent of wall thickness, whereas the ULS reinforcement calculation for an applied flexure
is not independent of wall thickness. The ULS reinforcement required for flexural loading
therefore decreases as wall thickness increases.
Referring to Table 3.7 and Figure 3.9, EN1992 requires a ratio of about 2,32 for all wall
thicknesses to achieve a 0,2 mm crack width. This is higher than the ratio of 1,65 for flexural
cracking to EN1992 by a factor of about 1,44. As the crack width limit decreases, the Asls/Auls
ratios are found to increase substantially for tension cracking, that is, the dominance of
serviceability increases. Tension cracking is thus more critical than flexural cracking in terms of
the extent to which SLS dominates the design of a WRS. As the crack width limit decreases to
0,1 mm, there is an increase in the ASLS/AULS ratios to 3,5 for EN1992. A further increase in
reinforcement is required at a crack width limit of 0,05 mm, giving a ratio of about 5.7.
Figure 3.9: EN1992 tension cracking – influence of SLS cracking
The ratios obtained from the deterministic analysis of load-induced cracking show that
serviceability is the dominant limit state, therefore highlighting the importance of optimum design
for serviceability cracking in WRS, particularly at smaller crack widths.
0.00
0.10
0.20
0.30
0.40
1.00 1.50 2.00 2.50 3.00 3.50 4.00 4.50 5.00 5.50 6.00
w (mm)
ASLS/AULS
w 0.2 mm
w 0.1 mm
2.32
Stellenbosch University http://scholar.sun.ac.za

60
3.3.5 Range of parameters for reliability analysis of EN1992 crack width formulation
One of the aims of the deterministic analysis was to investigate the relative influence of the
following parameters on the limiting crack width, such that, together with the investigation of
industry practices, a realistic range of values of these parameters for use in the reliability
analysis of the EN1992 crack equation could then be selected. These parameters are:
wall height
section thickness
concrete cover
bar diameter
The reinforcement required to achieve a crack width of 0,2 mm for both ULS and SLS is
summarised in Tables 3.8 and 3.9 for flexural and tension cracking, respectively, for various
representative values for these parameters. The relative importance of wall height, section
thickness, concrete cover and bar diameter is now discussed for both the flexural and tension
cracking conditions.
3.3.5.1 Wall height H
The liquid load onto a reservoir wall is related to the height of the wall. For a wall in tension, the
load is directly proportional to H with the resulting tensile force proportional to H, whereas for a
wall in flexure, the load is proportional to H2 with the resulting bending moment proportional to
H3. A flexural load therefore has a greater influence on the wall than a tension load. On
considering typical configurations of constructed reservoirs, a reference value for wall height of
5m has been used. In increasing the height to 6m and 7m, the load onto the wall is increased
proportionally as is seen in Tables 3.8 and 3.9. There was an increase in both the amount of
reinforcement and the wall thickness required in order to meet the specified crack width. The
wall height and therefore load, is found to be an influential parameter in the calculation of crack
widths.
3.3.5.2 Section thickness h
The resistance of the wall to an applied load is in part dependent on section thickness which is
affected by the magnitude of that load and therefore the wall height. As previously stated, the
ULS reinforcement for flexural loading was calculated such that the section thickness provided
Stellenbosch University http://scholar.sun.ac.za

61
ensures that tension reinforcement only is required (one face of the wall). For a wall height of
5m, a 250 mm section thickness was found to be adequate.
Table 3.8: EN1992 flexural load case: Summary of reinforcement requirements.
H (m)
Bar dia (mm)
Cover (mm)
h (mm)
ULS As SLS As (mm
2)
ASLS/AULS SLS %As (mm)
5m 16 40 250 4191 4614 1.10 1.85 300 2940 3797 1.29 1.27 Max As 350 2327 3269 1.40 0.93 2681 400 1941 2887 1.49 0.72 mm
2 450 1672 2584 1.55 0.57
500 1487 2325 1.56 0.47 550 1339 2086 1.56 0.38 600 1218 1912 1.57 0.32
5m 20 40 250 4257 4819 1.13 1.93
300 2973 3999 1.35 1.33
Max As 350 2346 3468 1.48 0.99 4189 400 1970 3084 1.57 0.77 mm
2 450 1680 2777 1.65 0.62
500 1494 2513 1.68 0.50
550 1344 2265 1.68 0.41
600 1222 2116 1.73 0.35
5m 25 40 250 4311 5067 1.18 2.03
300 3015 4235 1.40 1.41
Max As 350 2370 3699 1.56 1.06 6545 400 1970 3309 1.68 0.83 mm
2 450 1692 2997 1.77 0.67
500 1502 2725 1.81 0.55
550 1351 2508 1.86 0.46
600 1228 2361 1.92 0.39
5m 20 50 250 4481 5962 1.33 2.38 450 1728 3097 1.79 0.69
6m 20 40 450 3031 4471 1.48 0.99
500 2635 4093 1.55 0.82
550 2336 3778 1.62 0.69
600 2112 3466 1.64 0.58
7m 20 40 450 5173 6697 1.29 1.49
500 3964 6104 1.54 1.22
550 3857 5635 1.46 1.02 600 3441 5249 1.53 0.87
Note: Values highlighted in yellow exceed maximum feasible area (for single layer of
reinforcement).
Referring to both Figure 3.3 and Table 3.8, for SLS EN1992 flexural cracking and considering a
practical reinforcement quantity of Y20 at 75 mm spacing, the wall thickness needs to be
greater than 250 mm in order to meet a crack width limit of 0.2 mm. An increase in section
thickness results in a nearly directly proportional decrease in the quantity of reinforcement
required to satisfy SLS flexural cracking crack width criteria. It can then be stated that the
Stellenbosch University http://scholar.sun.ac.za

62
section thickness does have an influence on the crack width for flexural cracking as would be
expected.
For tension cracking, the crack equation is independent of section thickness if a bar diameter of
20 mm is used. Section thickness was not found to be an influential parameter in crack width
calculations for tension loading using 16 and 25 mm bar diameters.
Table 3.9: EN1992 tension load case: Summary of reinforcement requirements (As both faces)
H (m)
Bar dia (mm)
Max Asls
(mm2)
Cover (mm)
ULS As (mm
2)
SLS As (mm
2)
ASLS/AULS SLS %As
5 16 5362 40 2146 4485 2.09 1.00 5 20 8378 40 2146 4999 2.33 1.11 5 20 8378 50 2146 5606 2.61 1.25 5 25 13090 40 2146 5607 2.61 1.25 6 20 8378 40 2575 5564 2.16 1.24 7 20 8378 40 3004 6098 2.03 1.36
3.3.5.3 Concrete cover c
Concrete cover is considered to be an influential parameter in the determination of crack widths,
as discussed in Chapter 2, due to its effect on the effective depth of section and distance to the
crack location, thus on the crack spacing and corresponding crack width. Values of 40 and 50
mm were chosen to assess and compare the influence of cover. The ULS and the SLS
reinforcement quantities required to satisfy a 0,2 mm crack width for a section thickness of 450
mm and 20 mm bar diameter and varying cover are given in Table 3.8 for flexural cracking and
Table 3.9 for tension cracking.
The influence of cover is found to be similar for both flexural cracking and tension cracking.
There is an increase in reinforcement required as cover increases from 40 to 50 mm therefore
decreasing effective depth, as would be expected. This increase was found to be in the order of
a factor of 1,12 for both flexural and tension cracking. Concrete cover does have an influence
on the calculated crack width in the deterministic analysis, although is not dominant.
3.3.5.4 Bar diameter φ
To assess the effect of reinforcement diameter, crack width calculations were done using bar
diameters of 16, 20 and 25 mm. The bar diameter is found to have a lesser influence on the
crack width although its influence is connected to the bar spacing. The bar diameter was chosen
Stellenbosch University http://scholar.sun.ac.za

63
such that the practical limit of providing sufficient reinforcement at a reasonable spacing was
observed.
3.4 SUMMARY
A deterministic analysis of the EN1992 and BS8007 crack formulations was performed with
respect to flexural and tension cracking due to loading. A representative configuration of a
typical WRS was chosen for both load cracking conditions, namely, a rectangular reservoir wall
in the case of flexural cracking and a circular reservoir for the tension cracking condition. Using
the industry review, presented in Chapter 2, values were chosen for the parameters of the crack
width formulations to BS8007 and EN1992. Conclusions from the deterministic analysis of
BS8007 and EN1992-3 are summarised as follows:
It can be concluded that EN1992 is more conservative than BS8007 for flexural cracking,
although reinforcement areas obtained for 0,2 mm crack widths are comparable. However,
for tension cracking, EN1992 is found to be substantially more demanding than BS8007.
This would result in increased costs of construction, proportional to the increase in the
reinforcement required, on moving from the use of BS8007 to EN1992 in the design of
WRS.
EN1992-3 specifies a range of crack width limits from 0,2 mm to 0,05 mm for through-
cracks, depending on the hydraulic ratio which in turn is dependent on the wall geometry.
Decreasing the limiting crack width results in a substantial increase in reinforcement for both
flexural and tension cracking. This is exacerbated by the conservatism of Eurocode
compared to the British standards. In addition, an increase in wall thickness and/or increase
in bar diameter is required in order to obtain a practical reinforcement spacing. There is a
negative effect on the economics of the structure proportional to the decrease in the crack
width limit.
The deterministic analysis shows that the serviceability limit state of cracking dominates the
design of a WRS rather than the ultimate limit state of loading, particularly for tension
cracking. A reliability analysis is therefore justified to investigate the reliability of the crack
models with respect to load-induced cracking, with possible improvement to the efficiency of
the EN1992-1-1 crack design model. Both tension and flexural cracking will be considered in
the reliability analyses, although the tension case is expected to be more critical.
Stellenbosch University http://scholar.sun.ac.za

64
The effect of the parameters of wall height, wall thickness, concrete cover and bar diameter was
investigated and a selection of representative values was made for these parameters in the
reliability crack width model. The conclusions from the deterministic parametric analysis are
summarised as follows:
The height of the wall (corresponding to the depth of water) and corresponding liquid load
have an influence on the deterministic crack models, especially for flexural cracking. A
reference height of 5m will be used in the reliability analysis. Heights of 6 and 7 m will only
be considered to investigate the role of load in the reliability analysis.
The wall thickness h has an influence on the deterministic crack models, particularly in the
flexural cracking model, thus will also be considered in the reliability analysis. This
parameter‟s influence on the tension cracking model is dependent on the limiting equation
for the effective depth of the tension zone in the concrete. Decreasing reinforcement areas
were noted as section thickness increased. Wall thicknesses of 250 and 450 mm will be
used as representative values in the reliability analysis.
Concrete cover needs to be considered in the reliability analysis, although it has a lesser
effect than section thickness. An increase in cover has the expected effect of increasing the
reinforcement required. Thus a cover of 40 mm will be used as the representative value in
the reliability analysis, using a 50 mm cover only selectively to explore its influence.
The diameter of the tension reinforcement does not have a large influence on the variation
in crack width to either design code, except in the way in which it influences reinforcement
spacing. A reference value of 20 mm will be used in the reliability analysis.
The reliability analysis would allow the effect of the design variables to be explored in a
systematic way.
Stellenbosch University http://scholar.sun.ac.za

65
CHAPTER 4
OVERVIEW OF RELIABILITY ANALYSIS w.r.t. MODELLING OF CRACKING
4.1 GENERAL
Following on from the review of the design and construction of water retaining structures (WRS)
presented in Chapter 2 and the deterministic analysis of the BS8007 and EN1992 crack models
presented in Chapter 3, a reliability analysis of the EN1992 crack equation was performed with
respect to the following key issues that have been identified:
(v) The implications of the more onerous crack width limits of EN1992-1 compared to BS8007
on the design of a WRS.
(vi) The reliability of the EN1992-1 crack model.
(vii) The extent to which serviceability cracking governs the design of WRS, rather than the
ultimate limit state. From the deterministic analysis, SLS was found to dominate in both
flexural and tension cracking.
In order to set up the reliability model, presented in Chapter 5, of the EN1992 crack equation for
tension and flexural loading applied to WRS, a review of reliability-based design was carried
out. This chapter is a summary of that investigation. Reliability-based analysis is the basis for
limit state design which, in turn, is the basis of modern structural design codes. Reliability
methods provide a way of determining the performance of a structure while considering safety
and economy of design. The methods aim to determine the reliability or safety of a structure and
achieve reasonable probabilities that the structure designed will not become unfit for the
function of the structure. They also provide a tool to assess and improve existing structural
models which in this case is cracking in reinforced concrete water retaining structures.
To date, most research in reliability-based structural design has been carried out for the ultimate
limit state (ULS) with little done on the serviceability limit state, as the ULS usually governs the
design of the structure. As the ULS is the collapse limit state, higher levels of reliability are
specified than for SLS to ensure an adequate structural safety. However, in the case of WRS,
SLS generally governs the design (more specifically SLS cracking), raising the question of what
would be an appropriate level of reliability applicable to this case. The physical crack models
have been developed mostly through experimental research and tend to be conservative.
Empirical factors are selected and applied to the model with an unspecified degree of
Stellenbosch University http://scholar.sun.ac.za

66
conservatism, based on the judgment of the researcher and possibly moderated by a code
committee.
Therefore the performance of the crack model needs to be assessed in reliability terms and a
reasonable reliability determined. In order to formulate a reliability model for the EN1992-1 crack
equation applied to a reinforced concrete water-retaining structure, a review of the First Order
Reliability Method (FORM) was undertaken and presented here. The development of the
EN1992-1 crack width equation in probabilistic terms is discussed and presented. The
formulation of the FORM crack model used in the reliability analysis is presented in Chapter 5.
The statistical parameters required for the FORM analysis, model uncertainties and target
reliabilities were researched and presented in this chapter.
4.2 THE FIRST ORDER RELIABILITY METHOD OF ANALYSIS
This section summarises the investigation carried out on the reliability method of analysis the
First Order Reliability Method (FORM). A brief background to the method is given and the
FORM algorithm is set out.
4.2.1 Limit state function
In terms of the basis for reliability analysis and limit state design, the structural performance of a
structure or its elements is described in terms of a set of limit states which are conditions that
describe the fitness of the structure in performing its function. The ultimate limit state is
associated with collapse of a structure or any of its elements that affect the safety of human life
whilst the serviceability limit state is associated with the conditions of normal use. The limit state
may be described by means of a limit state function and is generally expressed as:
g(Xi) = R – E
where Xi are the probabilistic basic variables of the limit state function. R is the resistance of the
structural model and E the action effect.
For a serviceability limit state, the limit state (LS) function expressed in SANS 10160-1 (2011)
has the form:
g(Xi) = C - E
where C is the limiting value of the serviceability criterion. The term E is the action effects of the
SLS condition. The LS function defines the boundary between safe and unsafe conditions of the
Stellenbosch University http://scholar.sun.ac.za

67
limit state considered. The function g(Xi) will be greater than zero if the structure is safe, equal
zero at the limit state and less than zero if the structure is unsafe. The development of the limit
state function for the EN1992 crack model is discussed in Section 4.4.
4.2.2 Definition of reliability index, β
To determine the structural reliability as a measure of performance, the probability that the limit
state will be met or exceeded (probability of safety, ps) is assessed using the statistical data for
the parameters (Xi) in a structural model. Conversely, the probability of failure (g < 0) is
pf = 1 – ps. The measure of the level to which the limit state is met is the safety or reliability of
the structure, which can be expressed in terms of the reliability index (β) as defined in SANS
2394:2004 (ISO 2394: 1998)
β = - Φ-1(pf)
where Φ-1 is the inverse standardised normal distribution. The relationship between the
reliability index and the probability of failure is quantified in Table 4.1.
Table 4.1: Relationship between β and pf
pf 10-1
10-2
10-3
10-4
10-5
10-6
10-7
β 1.3 2.3 3.1 3.7 4.2 4.7 5.2
4.2.3 First Order Reliability analysis (FORM)
The First Order Reliability Method provides a recognized suitable method of assessing the
probability that the limit state concerned is met and the degree to which this occurs (i.e. the
reliability thereof) by means of the reliability index, β. The development of the FORM is well-
documented and described in full in literature therefore just a brief summary of the method
following the Ang and Tang (1990) description is given here. Figure 4.1 serves as a graphical
interpretation of FORM. Diagram (a) represents the limit state function at the failure surface and
the joint probability distribution for the original basic variables (not all normal pdf‟s). Diagram (b)
shows the normalised form of the problem to obtain the solution.
The limit state function or performance function is the failure plane on which g(Xi) = 0. The
parameters of the limit state function are expressed as random or basic variables (RV‟s)
described in terms of their probability distribution function (pdf), mean (μ) and variance (ζ).
Stellenbosch University http://scholar.sun.ac.za

68
Figure 4.1: Graphical representation of FORM (Source: Holický (2009))
The equation to find the probability of failure may be written as:
∫ ( ) (4.1)
where Xi are the random variables, fxi(Xi) is the joint pdf of the RV‟s and the integral is over the
unsafe region g(Xi) < 0. In the case of a non-linear limit state or performance function, the failure
plane is non-linear and is approximated by the tangent plane which intersects the actual failure
plane at the most probable failure point or the so-called design point. All non-normal pdf‟s are
converted into equivalent normal distributions in the region of the design point.
Given the difficulties of mathematically solving the numerical integration of the above equation,
the design point and its associated reliability index are found by means of a first-order
approximation of a Taylor series. The mathematical solution is then found through an iterative
process. The reliability index is the shortest distance from the design failure point on the failure
surface to the origin expressed in units of the standard deviation of g(Xi) or ζg and has the
general equation:
∑
(
)
√∑(
)
(4.2)
The FORM algorithm (after Ang & Tang (1990)) in reliability analysis to determine the reliability
index for a given set of variables is summarised as follows:
Stellenbosch University http://scholar.sun.ac.za
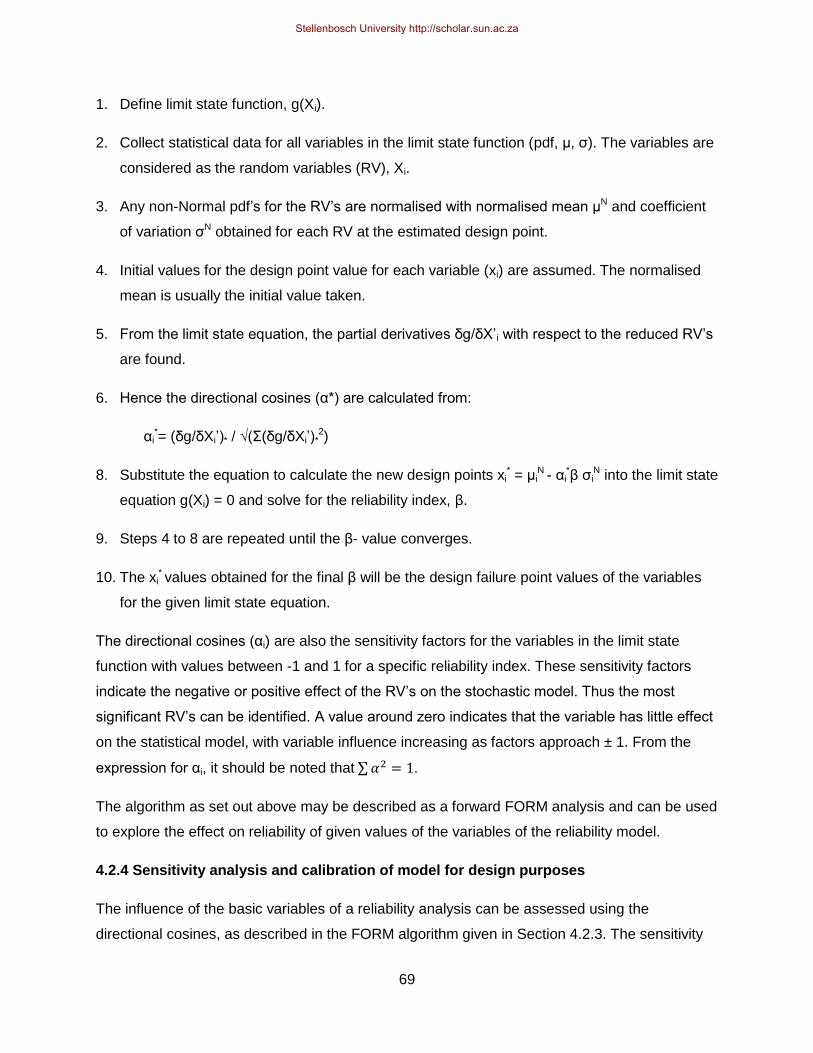
69
1. Define limit state function, g(Xi).
2. Collect statistical data for all variables in the limit state function (pdf, μ, ζ). The variables are
considered as the random variables (RV), Xi.
3. Any non-Normal pdf‟s for the RV‟s are normalised with normalised mean μN and coefficient
of variation ζN obtained for each RV at the estimated design point.
4. Initial values for the design point value for each variable (xi) are assumed. The normalised
mean is usually the initial value taken.
5. From the limit state equation, the partial derivatives δg/δX‟i with respect to the reduced RV‟s
are found.
6. Hence the directional cosines (α*) are calculated from:
αi*= (δg/δXi‟)* / √(Σ(δg/δXi‟)*
2)
8. Substitute the equation to calculate the new design points xi* = μi
N - αi*β ζi
N into the limit state
equation g(Xi) = 0 and solve for the reliability index, β.
9. Steps 4 to 8 are repeated until the β- value converges.
10. The xi* values obtained for the final β will be the design failure point values of the variables
for the given limit state equation.
The directional cosines (αi) are also the sensitivity factors for the variables in the limit state
function with values between -1 and 1 for a specific reliability index. These sensitivity factors
indicate the negative or positive effect of the RV‟s on the stochastic model. Thus the most
significant RV‟s can be identified. A value around zero indicates that the variable has little effect
on the statistical model, with variable influence increasing as factors approach ± 1. From the
expression for αi, it should be noted that ∑ .
The algorithm as set out above may be described as a forward FORM analysis and can be used
to explore the effect on reliability of given values of the variables of the reliability model.
4.2.4 Sensitivity analysis and calibration of model for design purposes
The influence of the basic variables of a reliability analysis can be assessed using the
directional cosines, as described in the FORM algorithm given in Section 4.2.3. The sensitivity
Stellenbosch University http://scholar.sun.ac.za

70
analysis is done using a reverse First Order Reliability method. The procedure for the reverse
FORM analysis is philosophically the same as for the forward FORM analysis algorithm, except
that in solving the algorithm the reliability level is selected first. The iterations on the limit state
equation will then converge at the design point for the chosen reliability level. Thus the values of
the basic variables at that design point for the given target reliability are also calculated. The
effect of reliability on the model and its basic variables can also be investigated by varying the
reliability level. The sensitivity factors of the basic variables obtained for the given target
reliability may also be used in the process of calibrating the parameters of the model for design
purposes.
The theoretical partial safety factor, γx, is the ratio between the theoretical design value obtained
from the reverse FORM analysis (x*) and the mean value of the basic variable considered (μx),
such that:
γ
(4.3)
The theoretical design value of a basic variable is calculated using:
x* = μx – αx β σx (4.4)
where ζx is the standard deviation of the basic variable considered, and αx is the sensitivity
factor of the basic variable associated with the target reliability β. Equation 4.4 can be written
using the CoV (wx) of the basic variable instead of the standard deviation, i.e.:
x* μx (1 – αx β wx) (4.5)
The theoretical partial safety factor for the basic variable considered is then expressed by
substituting and rearranging equations 4.3 and 4.5, such that:
γx = 1 – αx β wx (4.6)
The basic variable considered is normalised if it as a non-normal pdf.
The design equation for serviceability to SANS 10160-1 (2011) is
Cd ≥ Ed
where Cd is the limiting serviceability criterion and Ed is the design value of the effect of actions.
In the case of concrete cracking, Cd is the limiting crack width and Ed the design maximum crack
Stellenbosch University http://scholar.sun.ac.za

71
width calculated using the EN1992 crack formulation. The design Ed is achieved for a given
target reliability by applying design partial safety factors to each of the variables, taken as
characteristic values, in the crack equation. The design partial safety factors and characteristic
values are obtained by means of an optimisation process, starting with the theoretical partial
safety factors and theoretical design values from FORM.
On reviewing previous research, it was stated by Markova et al (2001) that the significant basic
variables influencing the design crack width include loads, concrete cover, the tensile strength
of concrete and the coefficients such as k1 and k2. It was also found that some basic variables
such as cover have varying significance depending on the theoretical model determining the
crack width.
A sensitivity analysis was performed, and is presented in Chapter 6, to assess the influence of
the random variables of the reliability crack model. The theoretical partial safety factors were
also calculated for given target reliabilities as a first step in determining the design partial safety
factors and final design values of the basic variables.
4.3 TARGET RELIABILITY
The failure probabilities obtained from a probabilistic analysis are compared to a desired failure
probability (pf) which is a maximum value. Alternatively, this desired failure probability may be
expressed in terms of the target reliability index (βt), as a minimum value, which is specified for
a given reference period, such that
pf = Ф (- βt)
where Ф is the cumulative normal distribution function. In choosing the required level of
reliability, it is assumed that good quality management practices are followed such that gross
errors are avoided.
SANS 2394:2004 states that “Specified maximum acceptable failure probabilities should depend
on the consequence and the nature of failure, the economic losses, the social inconvenience,
and the amount of expense and effort required to reduce the probability of failure. They should
be calibrated against well-established cases that are known from past experience to have
adequate reliability. Hence, the specified failure probability should depend on the reliability
class.” Target reliability is dependent on the limit state considered as this determines the
severity of the consequence of failure. The target reliability for an ultimate limit state is chosen
Stellenbosch University http://scholar.sun.ac.za

72
using a cost of safety measure which considers human safety, more specifically the cost of
human safety. The target reliability is related to a relative cost of safety and/or the
consequences of failure. The JSCC (2008) defines consequence classes by considering the risk
to life cost as a ratio of the total costs of failure to construction costs. Serviceability limit states
are generally related to performance and loss of use, rather than loss of human life or injury.
The reference period that a failure probability and related reliability index is associated with is
defined by SANS 2394 (2004) as being “a certain a priori specified period of time”. It may be a
one-year period (often given as the standard reference period), or the life of the structure, for
example. The reliability index for a one-year reference period is related to a reference period of
n years by
Φ (βt,n) = [Φ(βt,1)]n
where Φ is the distribution function of a standardized normal distribution. This equation allows a
reliability index corresponding to a reference period of the same duration as the design working
life to be calculated using the reliability index for a 1 year reference period. In this way, the
design working life of a structure can be related to the target reliability.
The design working life of a structure is defined by Holicky (1990) as “the period for which a
structure or part thereof is to be used for its intended purpose with anticipated maintenance but
without major repair being necessary”. The design working life of a structure is categorized in
SANS 10160-1 (2011), reproduced here as Table 4.2 overleaf.
The design working life categories are defined according to the type of structure. EN1990-1 and
ISO 2394 (2004) define similar categories for the design life of a structure. The design working
life of a water retaining structure would generally be taken as 50 years (category 3).
In general, more attention has been given to determining appropriate target reliability levels for
ultimate limit states than to serviceability as the former is the more critical state in structures
such as buildings. Retief & Dunaiski (2009) stated that “no proper reliability assessment is
generally applied to the SLS”. A review of recommended values for the target reliability for the
serviceability limit state given in various standards was therefore undertaken.
SANS 10160-1 (2011) defines reliability classes and corresponding reliability indexes for the
ultimate limit state but not for serviceability. Performance levels for serviceability are
Stellenbosch University http://scholar.sun.ac.za

73
differentiated according to the degree of recovery from the consequence of actions exceeding
the given serviceability criterion. The levels are irreversible, reversible and long-term and
appearance, in order of decreasing severity. A reliability index of 1,5 is recommended by SANS
2394 (2004) for irreversible serviceability states such as cracking in buildings. However, for
water-retaining structures, serviceability cracking has a greater importance due to the
consequences if cracking results in water leakage in the structure, therefore may require a
higher level of target reliability. Retief & Dunaiski (2009) stated that target reliabilities for
serviceability, as given in Table 4.4, are an indication of appropriate levels but that „further
refinement of the scheme of target reliabilities may be feasible‟.
Table 4.2: Notional design working life to SANS 10160-1 (2011)
1 2 3
Design working
life category
Indicative design
working life
years
Description of structures
1 10 Temporary structures.a b
2 25
Replaceable structural parts, for example
bearings, agricultural structures and similar
structures with low consequences of failure.
3 50 Building structures and other common
structures.c
4 100
Building structures designated as essential
facilities such as having post-disaster
functions (hospitals and communication
centres, fire and rescue centres), having high
consequences of failured or having another
reason for an extended design working life. a Structures or parts of structures that can be dismantled with a view to being re-used
should not be considered as temporary.
b Refer to SANS 10160-8 for the assessment of temporary structures during
execution.
c The design working life category applies to the reference reliability class referred to
in 4.5.2.3.
d Consequences of structural failure could be determined in accordance with annex A.
The Joint Committee on Structural Safety (JCSS) (2008) made recommendations for target
reliability index values (βt) for irreversible serviceability limit states such as concrete cracking,
given here as Table 4.3, for a one year reference period along with the corresponding failure
Stellenbosch University http://scholar.sun.ac.za

74
probabilities. Three levels of relative cost of safety are defined as low, normal and high, with
normal being the reference level. As serviceability states are not associated with loss of human
life, the relative cost is associated more with performance and use of the structure. The JCSS
(2008) states that values chosen for target values may vary by about 0,3 from the βt values of
Table 4.3. The JCSS does not give any guidance on target values for reversible serviceability
states, but that irreversible and reversible serviceability states must be distinguished from each
other when setting target reliabilities.
Table 4.3: Target Reliability Indices for Irreversible SLS to JCSS (2008).
Relative Cost of Safety
Measure
SLS Target Index
β
Probability of Failure
pf
High 1,3 10-1
Normal 1,7 5.10-2
Low 2,3 10-2
Target reliability levels to ISO 2394: 1998 (SANS 2394:2004) and EN1990: Eurocode 1: Basis
of structural design were summarized by Retief and Dunaiski (2009) as shown in Table 4.4
(overleaf), for both the ultimate and the serviceability limit states. ISO 2394 recommends βt
levels using a relative safety cost of safety and a consequence of failure. According to SANS
2394:2004, the β-values were derived assuming a normal distribution for permanent load, a
Gumbel distribution for imposed load and log-normal or Weibul distribution for resistance.
EN1990 (2002) defines reliability classes (or consequence classes) RC1 to RC3. Each
consequence class looks at the effects of loss of human life and economic, social and
environmental costs where RC1 has a low consequence, RC2 has a medium consequence and
RC3 has a high consequence. RC2 is taken as the reference class. Target reliabilities of 2,9
and 1,5 are recommended for reference periods of 1 and 50 years, respectively. In this
research, a value of 1,5 was used as the reference target reliability.
A review of any research previously carried out on reliability with respect to serviceability
cracking was carried out. It was found that there has been little research done on reliability of
serviceability cracking, particularly for small crack widths. A summary of relevant research is
now given.
Stellenbosch University http://scholar.sun.ac.za

75
Table 4.4: Target reliability levels (β) according to ISO 2394 and EN 1990 (Source: Retief and
Dunaiski, 2009)
Relative cost of
safety measures
ISO 2394 Minimum values for
Consequences of failure
Small Some Moderate Great
High 0 1,5 (A) 2,3 3,1 (B)
Moderate 1,3 2,3 3,1(C) 3,8 (D)
Low 2,3 3,1 3,8(D) 4,3(E)
A for serviceability limit states = 0 for reversible and = 1,5 for irreversible states
B for fatigue limit states = 2,3 to 3,1 depending on the possibility of inspection
For ultimate limit states the safety classes: C = 3,1 D = 3,8 E = 4,3
Reliability
Class
EN 1990 Minimum values for
Ultimate LS Fatigue Serviceability LS
Reference
period 1 year 50 years 1 year 50 years 1 year 50 years
RC1 4,2 3,3
RC2 4,7 3,8(F) 1,5 to 3,8 2,9 1,5
RC3 5,2 4,3(G)
F With ISO 2394 clause 4.2(b) moderate safety costs & RC2 consequences , but EN 1990 is more conservative;
EN1990 value agrees with ISO 2394 for either low safety cost or great consequences
G The EN1990 value for RC3 agrees with ISO 2394 for low safety cost and great consequences
ISO:
2,3 – 3,1
EN:
1,5 – 3,8
Fatigue: ISO 2394 – restricted range;
EN1990 – range from serviceability LS equivalent to ultimate LS
Holicky et al (2009) presented a reliability analysis of the EN1992 crack model with cracking due
to a direct tensile load as a pilot investigation of cracking in reinforced concrete water-retaining
structures. The validity of using the probability level of 5% of exceeding the specified crack
width limit as the accepted reliability level, as stated in EN1992-1 for verification of serviceability
limit states, was considered rather than the target reliability index, βt. The conclusion was that
this was not an optimum choice of reliability level.
Markova et al (2001) performed a reliability analysis of cracking in a reinforced concrete slab for
various design code crack formulations and found the ENV 1992-1 crack model (precursor of
EN1992-1) was sufficient for a limiting crack width of 0,3 mm (probability of exceedence of 5%).
The reliability index was determined to be above 1,5. However, crack widths less than 0,3 mm
were not considered.
Quan and Gengwei (2001) investigated the calibration of the reliability index for cracking of
reinforced concrete beams by means of an inverse FORM analysis. The crack model used was
that to the Chinese code for reinforced concrete and was found to be of similar formulation to
Stellenbosch University http://scholar.sun.ac.za

76
the Eurocode concrete cracking model. Therefore, some comparisons could be made in
establishing values of the reliability index. For crack widths equal to and greater than 0,2 mm,
the reliability index values determined and evaluated were in the range of 0 to 1,8.
4.4 MODEL UNCERTAINTY
In reliability models, uncertainty will always exist and needs to be quantified as far as possible.
The first step in doing so is to identify sources of uncertainty. Two main types of uncertainty can
be defined, that is, inherent random variability and that due to incomplete knowledge including
statistical uncertainty as defined in literature such as that by König et al (1985), Ang & Tang
(1990) and the JCSS – PMC (2001).
Inherent random variability may or may not be affected by human activities. The uncertainties in
strength values of materials is an example of inherent random variability affected by human
activity, while uncertainty of load due to precipitation is an example of those not affected by
human activity. Uncertainties are influenced by the level of production (e.g. of steel) and quality
control during design and construction. Summarising from the literature, uncertainty due to
random variability is generally dealt with by means of the coefficients of variation of the random
variables in the probabilistic model.
There is also uncertainty due to mathematical simplifications of physical and probabilistic
models. In this case, the former would be in the formulation of the deterministic crack model
from experimental research, and the latter in the stochastic model on normalizing non-normal
distributions and in the first order approximation using FORM for the mathematical solution of
the failure probability integral. The statistical parameters of the material, load and geometric
properties applying to the crack model are known and available in literature, and are discussed
further in Section 4.6 and summarised as Table 4.6.
It is accepted to treat model uncertainty as a random variable having commonly either a normal
or log-normal PDF (JCSS- PMC (2001 and 2008)). The CoV would be chosen to reflect the
degree of uncertainty expected. Table 4.5 gives typical values of model uncertainty as a random
variable. The load effect and resistance factors for the general structural model have been
included as a comparison to a value that would be appropriate for the crack model.
A review of research into model uncertainty with respect to concrete cracking was done. Quan
and Gengwei (2002) investigated the reliability of cracking in reinforced concrete beams in
Stellenbosch University http://scholar.sun.ac.za

77
buildings with respect to the Chinese structural concrete code and considered limiting crack
widths equal and greater than 0,2 mm.
Table 4.5: Summary of model uncertainty values from literature applicable to EN1992
Variable Symbol Units PDF Mean
μx Std Dev.
ζx
Model uncertainty, general θ - LN 1 0,10 - 0,3
Load effect factor (Holický (2009)) θE - N 1 0.05 - 0.1
Resistance factor (Holický (2009)) θR - N 1-1.25 0.05 - 0.2
Model uncertainty-cracking (Holicky et al (2009)) θw -
LN 1 0.1
The limit state equation used had the same form as Equation 4.11 of Section 4.4 to be used in
this investigation, with model uncertainty allowed for as a random variable. The Chinese crack
model used is similar enough to the Eurocode to be able to draw some comparison for the
model uncertainty. On analyzing experimental data on cracking in beams, they concluded that
the model uncertainty had a log-normal distribution with a mean of 1,05 and a cov of about 0,3,
based on experimental data.
Holicky et al (2009) presented a reliability study of the EN1992 crack model with cracking due to
a direct tensile load. The model uncertainty was applied as a random variable having a mean of
1,0 and a CoV of 0,1 as an initial value. This is the general value recommended for use in
structural models.
It was concluded that model uncertainty would be treated as a random variable, and is further
discussed in Section 4.6.
4.5 THE LIMIT STATE FUNCTION FOR THE EN1992-1 CRACK MODEL
The FORM procedure begins with the formulation of the limit state function for the particular
model to be analysed as discussed in Section 4.2.3, in this case the SLS of load-induced
cracking to EN1992. As cracking is a serviceability limit state, the limit state function for the
EN1992 crack width equation has the form:
g(Xi) = C - E
as expressed in Section 4.2. C will be the limiting crack width desired, wlim. As the action effects
in this case are due to load-induced cracking, the effect of actions, E, will be the calculated
crack width, wcalc. Considering the formulation of the EN1992 crack width calculation, it would be
Stellenbosch University http://scholar.sun.ac.za

78
difficult to separate the resistance (R) from the actions (E) and therefore a limit state function in
the form of g(Xi) = R – E would not be feasible.
Crack width, in general, may be expressed in terms of the compatibility relationship, as given in
Section 2.3.3 of Chapter 2, where
w = Sr. εm
where Sr is crack spacing and εm is nett strain, i.e. steel tensile strain less concrete tensile
strain.
However, the EN1992 design crack width equation, as given in Section 2.3.3 of Chapter 2, gives
the maximum or characteristic crack width, wk,
w = Sr,max . εm
where Sr,max is the maximum crack spacing. In the case of concrete cracking due to load effects,
εm is the nett strain due to loading. The characteristic crack width is taken as the width having a
probability of exceedence of 5%. The derivation of the EN1992 crack width equation is therefore
examined to obtain the equation for crack spacing (Sr) and thus the equation for crack width (w)
to be applied in the reliability model.
The equation for the net strain εm which will be used in the calculation of the crack width in the
limit state function, as given in Chapter 2, is:
εsm- εcm= ( )
(4.8)
where εsm is the strain in the reinforcement, εcm is the concrete strain, ζs is the stress in the
tension reinforcement at the cracked section, kt is a factor to account for the duration of the
load, fct,eff is the concrete tensile strength and αe is the modular ratio. In applying this equation to
the reliability model, the stresses and strains will be expressed in terms of their basic variables
with in turn, their probability distribution functions.
The EN1992 characteristic crack width, wk, which must not exceed the specified limiting crack
width has been found experimentally to correspond to a maximum crack width, Sr,max, such that
the ratio βw = Sr,max/ Sr is 1,7. Thus the maximum crack spacing may be written as:
Sr,max = 1,7Sr
The characteristic crack width then becomes:
wk = (1,7Srm) . εm = 1,7 w
Stellenbosch University http://scholar.sun.ac.za

79
Note that this ratio βw must be distinguished from the FORM reliability index β. The use of the
same symbol is coincidental as this ratio is not related to the reliability index.
To obtain the equation for the crack spacing distribution, the EN1992 equation (given as
equation 2.11 in Chapter 2) for the maximum crack spacing (Sr,max) is considered:
Sr,max = k3c + k1k2k4θ /ρp,eff
where θ is the bar diameter (mm), c is the cover to the longitudinal reinforcement and k1 is a
coefficient taking into account of the bond properties of the bonded reinforcement. The factors
k3 and k4 are given the values of 3,4 and 0,425 respectively by EN1992-1. Using the ratio βw, the
maximum crack width can then be expressed as:
Sr,max = 1,7 (2c + 0,25k1k2θ /ρp,eff)
Thus the crack spacing distribution may be written as:
Sr = 2c + 0,25 k1k2 θ/ ρp,eff (4.9)
The calculated crack width equation is then:
wcalc = Sr . εm (4.10)
such that Sr is calculated using equation (4.9) and εm is calculated using equation (4.8).
The SLS limit state function for the reliability crack model may then be expressed as:
g(X) = wlim – θ. wcalc (4.11)
where θ is the model uncertainty applied as a random basic variable.
Further to the discussion on model uncertainty in Section 4.4, uncertainty in the crack model, as
allowed for by means of the model uncertainty basic variable, exists in the following:
The determination of strain as the model for strain is based partly on experimental research
and observation.
The factors k1 and k2 appearing in Equation (4.9) taken as deterministic values. They have
been derived from experimental research in developing the EN1992 crack equation and
therefore may have some degree of uncertainty associated with them which is not known.
Uncertainty in the crack model itself which is not actually known at present. As cracking is a
random phenomenon, the crack model is an approximation of cracking behaviour and is
investigated parametrically in the probabilistic analyses.
In order to perform the reliability analysis, the parameters of the crack width equation 4.10 are
expressed as random basic variables. In this way, the deterministic design function is converted
Stellenbosch University http://scholar.sun.ac.za

80
into the reliability performance function. An investigation into the available statistical data for the
basic variables of equation 4.10 for crack width, wcalc, was carried out and presented in the
following Section 4.6.
4.6 GENERAL DATA FOR PROBABILISTIC PARAMETERS IN CRACKING MODEL
An investigation into the probabilistic parameters of the variables used in the calculation of
EN1992-1 crack widths was carried out with the resulting values summarized in Table 4.6
overleaf. These general values were sourced mainly from Holicky (2009), the Joint Committee
on Structural Safety JCSS – PMC (2001), Fulton‟s (2009) and Holicky, Retief & Wium (2009).
Data is given in terms of the probability distribution type (pdf), the characteristic value, mean (μx)
and coefficient of variation (CoV). South African values were found to correspond with the
values given in Table 4.6.
Variables which have very small coefficients of variation are taken as deterministic values, for
example, geometric properties which generally have small variations compared to actions and
material properties. Geometric properties such as section thickness tend to have a normal
probability distribution function (pdf).
The statistical data for material properties are determined from standard testing. Material
properties tend to have normal or log-normal distributions. The characteristic value of the
material property concerned is generally used in design and corresponds to the 5% lower
fractile (Cl. 5.6 of SANS 10160-1(2011)), taken as 1,64 x standard deviation for a normal pdf.
The target design strength of concrete (not to exceed the characteristic strength by 1,64 the
standard deviation) is also related to a degree of quality control (EN1990-1). Fulton‟s (2009)
defines 3 degrees of control, namely, poor, average and good with their associated standard
deviations. This research assumes a good degree of quality control as would be expected for
special classes of structures such as water-retaining structures.
Permanent actions or loads tend to have normal distribution which is the case for the liquid load
on the wall of a WRS. Note that the coefficients k1 and k2 appearing in Equation (4.2) are have
deterministic values and therefore have not been included in Table 4.6. A search was made to
find data on the statistical parameters for measured crack widths compared to values calculated
using EN1992-1, particularly for small crack widths. Such data would aid in establishing the
reliability in probabilistic terms of the EN1992-1 crack model in terms of the model uncertainty.
Stellenbosch University http://scholar.sun.ac.za

81
Table 4.6: Summary of basic variables for time-invariant reliability analysis, derived from
Holicky(2009), JCSS-PMC (2001), Fulton’s (2009) & Holicky et al (2009).
Variable Symbol Units PDF Mean
μx CoV
Permanent Load Gk kN/m2 N Gk 0.03 – 0.10
Liquid Load Lk kN/m2 N Lk 0.03 – 0.10
Steel yield point fy MPa LN fyk+2ζ 0.07 – 0.10
Concrete compressive strength fc MPa LN fck+ 2ζ 0.10 – 0.18
Concrete tensile strength fc,t MPa LN fctk+ 2ζ 0.10 – 0.18
Steel modulus Es GPa Det
Concrete modulus Ec GPa Det
Reinforcement diameter Φ mm Det
Reinforcement area As, As' mm2 Det
Concrete c/s geometry b, h m N bk, hk 0.005 – 0.01
Cover c m BETA / Γ ck 0.005 – 0.015
Distance to centre of bar a m BETA / Γ c + θ/2 0.005 – 0.015
Limiting Crack width (average) wlim mm Det 0.05 – 0.2
Model factor for crack width θw mm N/ LN 1.0 0.1 – 0.3
Note: LN = log-normal, N = normal, Det = deterministic, Γ = gamma
It was concluded in Eurocode 2 commentary (2008) that from a first analysis, the maximum
crack width has a normal PDF and relates to the applied stress level. A comparison between
test data for mean crack widths (wm,exp) and those calculated (wm,calc) was made. The crack
models from the CEB model code MC90, PrEN (ENV1992, previous version to EN1992) and
EC2 (EN1992) were compared. Results were plotted, as shown in Figure 4.2. Any analyses
were related to crack widths of 0,3 mm and larger. Figure 4.2 shows a wide variation in test and
model crack widths was obtained PrEN was indicated as correlating well with test crack widths,
while EC2 predicted values slightly less than test values. MC90 underestimates the crack width
when compared to test values.
The error in the mean crack width (wm,calc – wm,exp) was then plotted against the measured crack
width, shown in Figure 4.3. The mean and standard deviation for the error was determined and
expressed in mm. However, the error was not related in the text to any particular crack width.
Figure 4.3 (overleaf) does indicate that there is a wide scatter in the test results compared to the
calculated crack widths. On plotting the distribution and density functions of the error, it was
concluded that the error had an approximately normal distribution for EN1992.
Stellenbosch University http://scholar.sun.ac.za

82
Figure 4.2: Comparison between test and calculated mean crack widths to EC2, MC90 and
PrEN. (Source: Eurocode commentary (2008))
Figure 4.3: Error crack width (Source: Eurocode commentary (2008))
wm, calc (mm)
wm, exp (mm)
• EC2
□ PrEN
Δ MC90
― calc = test
--- Lineal (EC2)
−∙−∙ (PREN)
…….. (MC90)
wm, exp (mm)
• EC2
□ PrEN
Δ MC90
― calc = test
--- Lineal (EC2)
−∙−∙ (PREN)
…….. (MC90)
wm
, cal
c –
wm
,exp
(mm
)
Stellenbosch University http://scholar.sun.ac.za

83
Research carried out by Borosnyoi et al (2005) on comparing models for flexural cracking found
that the distribution of experimental crack widths was log-normal. This conclusion agreed with
that reached by Quan et al (2001) in carrying out FORM analyses for cracking in reinforced
concrete beams. The limit state function used had the same form as that of Equation 4.11 with a
deterministic value for wlim used. As there appears to be little more statistical data on measured
crack widths, it can be concluded that further research is required on predicted versus actual
crack widths. In this research, the limiting crack width in the limit state function for the EN1992
crack reliability model is accepted as a deterministic value. It is recognized that the limiting
crack width will result in some uncertainty in the reliability model which will be included in the
model uncertainty. However, insufficient data is available at present for the limiting crack width
to be modelled as a random variable. This is a topic for further research. Model uncertainty is
treated as a random variable in the determination of the crack width, wcalc, as discussed in
Section 4.4.
The concrete cover to reinforcement is seen as an influential parameter in the calculation of
crack widths, as discussed in Chapter 2. Research shows that the variability of concrete cover
depends on the quality control during construction (JCSS (2008)). Variability obviously
decreases with an increasing level of quality control. Suggested coefficients of variation (CoV)
for typical British construction for the standards of control were defined as near - laboratory
precision, good, moderate and poor, associated with CoV values of 10%, 15%, 20% and 30%
respectively (Ronné (2006)). Ronné (2006) reviewed local and international cover data and
found that variability also decreased with increasing cover. He also stated that South African
construction has a higher absolute variability for concrete cover. However, structures such as
bridges have a significantly higher quality control therefore a lower variability of cover. It can be
concluded that a CoV of 0,15% would be a reasonable representation for the variable of
concrete cover in the probabilistic crack model, assuming a good level of quality control. Holicky
et al (2009) concluded that for cover, limited beta or gamma pdf‟s, a log-normal distribution
would be a reasonable approximation. In this research, the parameters of load, section
thickness, concrete cover and concrete tensile strength of the EN1992 crack formulation are
modelled as random variables, each with their own pdf. All other material and physical
parameters are considered as deterministic values.
4.7 SUMMARY
In order to properly formulate the reliability model for the EN1992 crack equation, the First Order
Stellenbosch University http://scholar.sun.ac.za

84
Reliability Method of analysis (FORM) was investigated and the requirements for this method of
analysis were determined with respect to the EN1992 crack model. The FORM algorithm is
summarised and was used in the reliability analysis presented in the next chapter. The
requirements to set up the FORM analysis model are as follows:
The limit function for the crack model is defined in equation (4.11) as g(X) = wlim – θ.wcalc,
where wlim is the specified crack width, wcalc is the calculated crack width and θ is the model
uncertainty.
The crack width is determined using the following equations which are expressed in terms of
their basic variables in the FORM analysis:
Crack width wcalc = Sr.εm
Crack spacing Sr = 2c + 0,25 k1k2 θ/ ρp,eff
Strain εs- εc= ( )
The statistical values of the material and geometric parameters of the crack model were
established for the crack model. A set of appropriate basic variables was chosen for
application in the reliability analysis with general values summarised in Table 4.5. The
parameters of load, section thickness, concrete cover and concrete tensile strength of the
EN1992 crack formulation will be modelled as random variables, each with its own PDF,
with all other parameters taken as deterministic values. The actual values used for the
variables of the reliability model are presented in Chapter 5 with the reliability analysis.
Data on uncertainty of the crack model is limited, therefore needs further investigation. In
this study, it is allowed for by means of a random variable θ having a log-normal distribution
with a mean of 1, applied to the calculated crack width. The CoV will be varied from 0,1 to
0,3 to investigate the effect of model uncertainty on the reliability of the crack model.
The limiting crack width is taken as a deterministic value corresponding to the limits set by
EN1992, applied to a representative WRS, namely the range from 0,05 mm to 0,2 mm.
A SLS reliability β of 1,5 for a reference period of 50 years is used as the reference level in
the reliability study in keeping with SANS10160-1.
The reliability of the EN1992-1 crack equation has not been assessed with respect to water-
retaining structures in South Africa, providing motivation for the probabilistic analysis in this
research. In addition, as SLS cracking is generally the dominant limit state, an appropriate
level of reliability for the crack width calculation needs to be determined. Therefore, the
effect of varying the reliability index on the crack model will be investigated.
Stellenbosch University http://scholar.sun.ac.za

85
CHAPTER 5
FORM ANALYSIS OF EN1992 CRACK MODEL
5.1 GENERAL
This chapter presents the reliability analysis performed on the EN1992 crack models for flexural
and tension cracking. The reliability analysis was used to investigate the EN1992 crack model
applied to the design of reinforced concrete water retaining structures (WRS) in South Africa,
leading to possible improvements in performance of the crack model. With this objective in
mind, the reliability study focused on the following issues:
(viii) The reliability of the EN1992-1-1 crack model and therefore the associated level of
reliability for serviceability cracking.
(ix) The extent to which serviceability cracking governs the design of WRS, rather than the
ultimate limit state.
(x) The implications of the more severe limiting crack widths less than 0,2 mm specified by
EN1992-3.
(xi) The model uncertainty of the EN1992 crack model.
The EN1992 crack model was developed semi-empirically with limited research having
previously been done in reliability terms. This study attempts to extend the understanding of
modelling the EN1992 crack model in reliability terms. As in the deterministic analysis, cracking
is assumed to be through the section.
The serviceability limit state (SLS) is generally concerned with a loss of function or comfort
rather than a failure of the structure leading to possible harm to life. Therefore it has a lower
general level of reliability than ultimate limit states (ULS). From the deterministic analysis, SLS
was found to dominate in both flexural and tension cracking, making serviceability the critical
limiting state in the design of WRS. The reliability study will then consider the requirements
needed to meet the serviceability cracking criteria for the general reliability level of 1,5 applied to
irreversible serviceability states such as cracking, as laid out by SANS10160-1. In addition, the
level of reliability for serviceability has been developed for buildings, not the special class of
structure of WRS where leakage of the structure is more critical. Therefore, both the reliability of
the EN1992 crack equation and the effect of changing the level of reliability for load-induced
cracking in a WRS are investigated in this chapter.
Stellenbosch University http://scholar.sun.ac.za

86
The deterministic analysis showed that the use of limiting crack widths less than 0,2 mm had a
negative effect on the economics of the structure for both tension and flexural cracking. The
effect of a more severe crack width limit on the reliability of the crack model is therefore
investigated.
From the literature review on probabilistic analysis presented in Chapter 4, the model
uncertainty for cracking is not really known. Therefore it was investigated to determine its
influence on the EN1992 crack equation, the results of which are presented in this chapter.
Model uncertainty is treated as a random variable in the reliability analysis, as discussed in
Chapter 4.
Reliability analyses using the First Order Reliability method (FORM) were then performed to
explore these objectives with respect to both the tension and flexural cracking models.
5.2 FORMULATION OF THE RELIABILITY LOAD-INDUCED CRACKING MODELS
The structural configurations used in the reliability analysis of the flexural and tension cracking
models were the same as those of the deterministic analysis presented in Chapter 3
investigating the flexure and tension cracking cases to EN1992 (illustrated by Figures 3.1 and
3.2). The representative values used for the parameters of the crack model were taken from the
deterministic analysis. The formulation of the limit state function and general values of variables
were obtained from the literature review presented in Chapter 4.
5.2.1 Structural configuration for the reliability crack model
A summary of the structural configuration and the physical parameters is given for both tension
and flexural cracking cases as follows:
(i) In the flexure case, a 1 m section of wall of a rectangular reinforced concrete water-
retaining structure was considered. The wall is subject to flexure due to water pressure
about the horizontal axis of the cross section.
(ii) For the tension case, a 1 m section of wall in a cylindrical reservoir was considered. The wall
is subject to hoop tension due to water pressure in the horizontal plane. A representative
reservoir diameter was taken as 28 m.
Stellenbosch University http://scholar.sun.ac.za

87
5.2.2 Formulation of FORM crack model equations
Summarising from Chapter 4, the limit state equation for the FORM analysis is:
g = wlim – θ. wcalc (5.1)
where θ is the model uncertainty, modelled as a random variable.
The crack width is determined from the basic compatibility equation,
wcalc = Sr . εm. (5.2)
The crack spacing Srm considered in the probabilistic model is determined from:
Sr = 2c + 0,25k1k2θ /ρp,eff (5.3)
EN1992-1-1 recommends a value of 0,8 for the coefficient k1 for high tensile reinforcement
bond. The coefficient k2 is given a value of 0,5 for bending stress distribution and 1,0 for tension.
Both coefficients are deterministic.
The mean strain equation as given by EN1992 is:
εm= εsm
- εcm=ζs- ktfct, eff (1+ eρ eff
) /ρ eff
Es
(5.4)
The coefficient kt has a value of 0,4 for long-term loading. The modular ratio, αe, is the ratio
Es/Ec. The parameters in the reliability limit state function are either modelled as random
variables or taken as deterministic values, as summarised in Table 4.5 of Chapter 4.
For the reliability models for the flexural and tension load cases, the equations (5.1) to (5.4) are
expressed in terms of the basic random variables, which are considered here to be section
thickness (h), concrete cover (c), liquid load (Lk) and concrete tensile strength (fct,eff ),
summarised as follows:
(i) Flexural load case
In the determination of the mean strain, the steel stress ζs, and therefore the effective depth of
section, lever arm z, bending moment M, and the effective reinforcement ratio ρp,eff (using first
principle equations of elastic linear theory) are expressed in terms of the basic random variables
h, c and Lk as follows:
Effective depth of section, d = h – c – θ/2
The depth to the neutral axis, x :
Stellenbosch University http://scholar.sun.ac.za
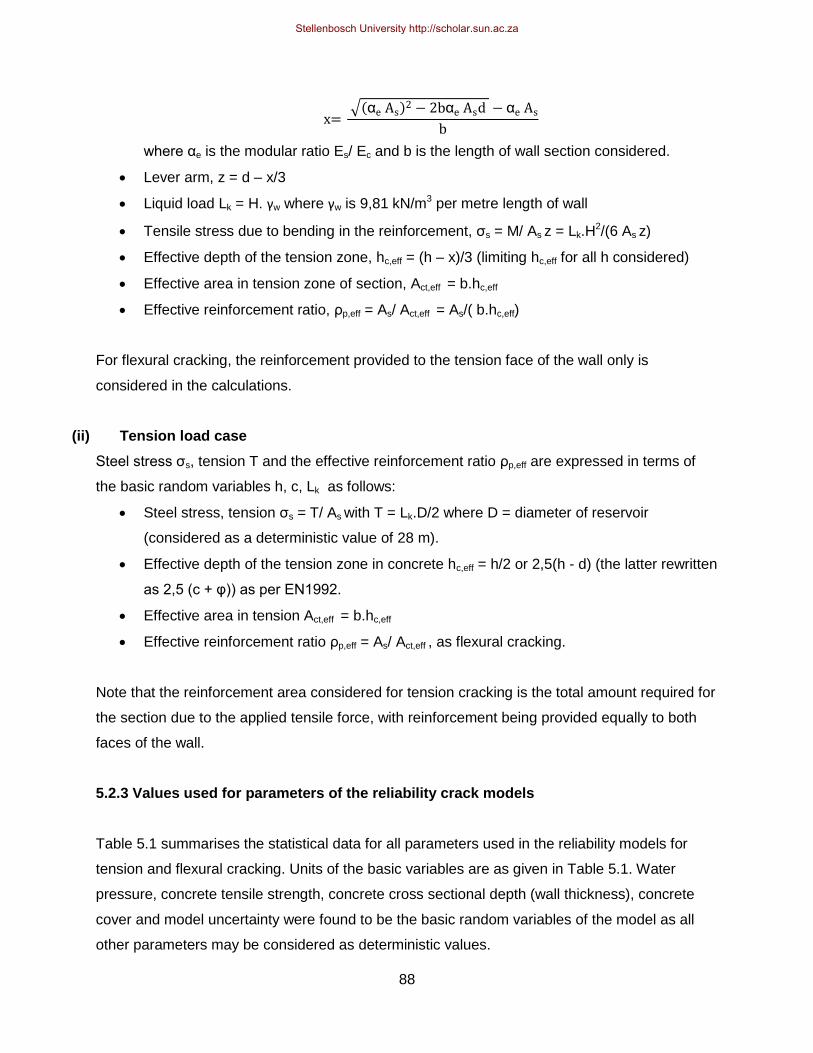
88
√(α )
α α
where αe is the modular ratio Es/ Ec and b is the length of wall section considered.
Lever arm, z = d – x/3
Liquid load Lk = H. γw where γw is 9,81 kN/m3 per metre length of wall
Tensile stress due to bending in the reinforcement, ζs = M/ As z = Lk.H2/(6 As z)
Effective depth of the tension zone, hc,eff = (h – x)/3 (limiting hc,eff for all h considered)
Effective area in tension zone of section, Act,eff = b.hc,eff
Effective reinforcement ratio, ρp,eff = As/ Act,eff = As/( b.hc,eff)
For flexural cracking, the reinforcement provided to the tension face of the wall only is
considered in the calculations.
(ii) Tension load case
Steel stress ζs, tension T and the effective reinforcement ratio ρp,eff are expressed in terms of
the basic random variables h, c, Lk as follows:
Steel stress, tension ζs = T/ As with T = Lk.D/2 where D = diameter of reservoir
(considered as a deterministic value of 28 m).
Effective depth of the tension zone in concrete hc,eff = h/2 or 2,5(h - d) (the latter rewritten
as 2,5 (c + θ)) as per EN1992.
Effective area in tension Act,eff = b.hc,eff
Effective reinforcement ratio ρp,eff = As/ Act,eff , as flexural cracking.
Note that the reinforcement area considered for tension cracking is the total amount required for
the section due to the applied tensile force, with reinforcement being provided equally to both
faces of the wall.
5.2.3 Values used for parameters of the reliability crack models
Table 5.1 summarises the statistical data for all parameters used in the reliability models for
tension and flexural cracking. Units of the basic variables are as given in Table 5.1. Water
pressure, concrete tensile strength, concrete cross sectional depth (wall thickness), concrete
cover and model uncertainty were found to be the basic random variables of the model as all
other parameters may be considered as deterministic values.
Stellenbosch University http://scholar.sun.ac.za

89
Table 5.1: Basic variables used in reliability crack model
Variable
Symbol
Units
Characteristic Value
Mean μx
Std Dev. ζx
Height of wall H m Det 5 5 0
Liquid load, Lk Lk kN/m2 N 50 49.05 2.45
Concrete tensile strength fc,t MPa LN 2.00 2.89 0.55
Steel modulus Es GPa Det 200 200 0
Concrete modulus (long term) Ec,eff GPa Det 13.7 13.7 0
Reinforcement diameter ϕ mm Det 20 0.02 0
Reinforcement area As mm2 Det 3500 3500 0
Concrete c/s depth h mm N 450 450 4.5
Concrete c/s width b mm Det 1000 1.0 0
Concrete cover c mm LN 40 40 6
Concrete modulus Ec GPa Det 27.4 27.4 0
Concrete creep factor φ - Det 1 1 0
Limiting crack width wlim mm Det 0.2 0.2 0
Model Uncertainty θw - LN 1 1 0.2
Note: LN = log-normal pdf, N = normal pdf, Det = deterministic value.
The depth of water is taken as the height of the wall, H, and is modelled as a deterministic
parameter as its variation is considered to be small, as other section dimensions (depth and
width). However, as a permanent load, liquid load is modelled as having a normal pdf.
A bar diameter of 20 mm was used and considered as a deterministic value in the reliability
analysis as it has been found to have a very small variation. Therefore any influence it has will
be proportional directly to the change in the value chosen, rather than due to any statistical
variation. The influence of bar diameter on the crack calculations was determined by the
deterministic analysis to be of lesser influence on the crack model, further validating treating this
variable as deterministic.
The area of reinforcement was taken as a deterministic value and used as the basis of
comparison in the analysis. As in the deterministic analysis, the minimum practical spacing of
reinforcement was taken as 75 mm. For a given bar diameter, this gave the maximum practical
area of reinforcement which will be 4198 mm2 for a 20 mm bar diameter. Mean values used for
concrete cover and wall height were 40 mm and 5 m, respectively. All other values of the
parameters such as material properties are summarised in Table 5.1.
Stellenbosch University http://scholar.sun.ac.za

90
The model uncertainty was investigated by considering this parameter as a random variable
with a log-normal distribution, mean of 1 and coefficient of variation (CoV) of 0,2 as a reference
level, in keeping with the findings of the literature review. A general value used for model
uncertainty CoV is 0,1 in structural reliability models, as used by Holicky et al (2009), and was
taken to be the lower limit for the CoV in the case of concrete cracking. A value of 0,3 has been
suggested in research as being appropriate to cracking in reinforced concrete beams (Quan et
al (2002)) and was therefore taken to be the maximum limit in this study. It was judged that a
value of 0,1 would be too low for cracking as the uncertainty for cracking is greater than for
general structural models, whilst a value of 0,3 is possibly too conservative for the models
considered here. A value of 0,2 for the model uncertainty CoV was therefore considered to be
reasonable for use as the reference level. In addition, to consider the effect of model uncertainty
variation on the cracking models, reliability analyses were performed for a range of values from
0,1 to 0,3 for the model uncertainty variation (θcov).
The effect of crack width on the reliability model was investigated for crack width limits (wlim) of
0,3, 0,2, 0,1 and 0,05 mm, in keeping with EN1992 for buildings and water retaining structures.
5.2.4 Formulation of reliability models using Microsoft EXCEL
Analyses following the FORM algorithm (as summarised in the previous chapter) were
performed using Microsoft EXCEL to determine the level of reliability for a given set of variables
and area of reinforcement for both flexural and tension cracking.
For tension cracking, the formulation of the crack equation in terms of the basic variables
depends on the limiting equation for the effective depth of the tension zone, hc,eff. Therefore two
reliability models were required in the case of tension cracking. Thus the reliability models
evaluated using EXCEL were:
(i) Model 1 - Flexural cracking
(ii) Model 2(a) - Tension cracking, hc,eff = 2,5(c + θ/2)
(iii) Model 2(b) - Tension cracking, hc,eff = h/2
The formulation of the reliability models using EXCEL for the tension and flexural cracking
cases is illustrated by the flow chart given in Figure 5.1 overleaf and is described as follows:
Stellenbosch University http://scholar.sun.ac.za

91
Figure 5.1: Flowchart of EXCEL process to solve for β in reliability crack models
RELIABILITY MODELS USING EXCEL & FORM ALGORITHM
Flexural cracking
Tension cracking, hc,eff = 2.5(c + θ/2)
Tension cracking, hc,eff = h/2
Express LS equation in terms of basic
variables c, h, Lk, fct and θ.
Set up table in EXCEL and enter values for
variables in LS equation
Determine the partial differential equations
of LS equation w.r.t. basic variables c, h, Lk,
fct and θ using MATLAB.
STEP 1
Convert Non-N pdf’s to N pdf’s
STEP 2
Calculate α’s using partial differentials
w.r.t. basic variables.
ITERATIVE PROCESS TO DETERMINE β
STEP 3
Use EXCEL Solver to calculate β and
design point values of basic variables
for given reinforcement area.
Has β value
converged?
Yes
No
FINAL SOLUTION FOR β
Repeat iteration
steps 1 to 3
Stellenbosch University http://scholar.sun.ac.za

92
The limit state equation was written in terms of the basic variables. The partial differential
equations of the limit state equation with respect to each of the basic variables were
calculated using MATLAB.
A table was set up in EXCEL for each crack model for the variables appearing in the limit
state equation, as shown in Figure 5.2. Units of the variables of the model were all
expressed in kN and m. The basic variables that were not deterministic were identified as
section thickness, concrete cover, liquid load, concrete tensile strength and model
uncertainty. The reinforcement area, As, was parametrically chosen for a representative
range selected from the results of the deterministic analysis.
The FORM algorithm, as summarised in Chapter 4, was then set up for each crack model in
EXCEL. As the FORM algorithm is an iterative process, the EXCEL spreadsheet was set up
with sufficient iterations to allow the reliability index value to converge, as shown in Figures
5.3(a) and 5.3(b). For Step 1 of the first iteration, and referring to Figure 5.3(a), the non-
normal mean and variation were converted to the equivalent normal parameters. In Step 2,
the normalised mean and variation were then entered for ζi and μi. The initial mean value of
each basic variable was taken as the assumed design point value (assumed xi*) for that
variable. The partial differentials and thus the directional cosines were then calculated. In
the final step of the first iteration (Step 3), the new failure point (new design point) and β
were calculated. Referring to Figure 5.2(b), Iteration 2 used the failure point calculated in
Iteration 1 as the new assumed design point. Steps 1 to 3 were repeated to find the new
failure point for Iteration 2. Generally, 5 iterations were performed to ensure convergence of
β.
The software add-in EXCEL Solver was used to calculate β at each iteration step by
satisfying the limit state function g = 0. Solver uses a Generalized Reduced Gradient (GRG)
nonlinear method for problems that are smooth non-linear to find an optimal value (in this
case zero) for a formula in one cell (the objective cell) subject to constraints on the values of
other formula cells on the worksheet. In the reliability model this is the limit state function, g.
The decision variable cell for each iteration step, set as the reliability index, β, participates in
computing the formulas in the objective cell. Solver then adjusts the values in the decision
variable cells to satisfy any limits set on the constraint cells and produces the result required
for the objective cell. In this case, there were no constraints set. The reliability index was
determined using the FORM algorithm for a given quantity of reinforcement.
The final data generated by each analysis was copied to a data worksheet in EXCEL.
Graphs of the variation of the reliability index β with reinforcement required could then be
plotted.
Stellenbosch University http://scholar.sun.ac.za
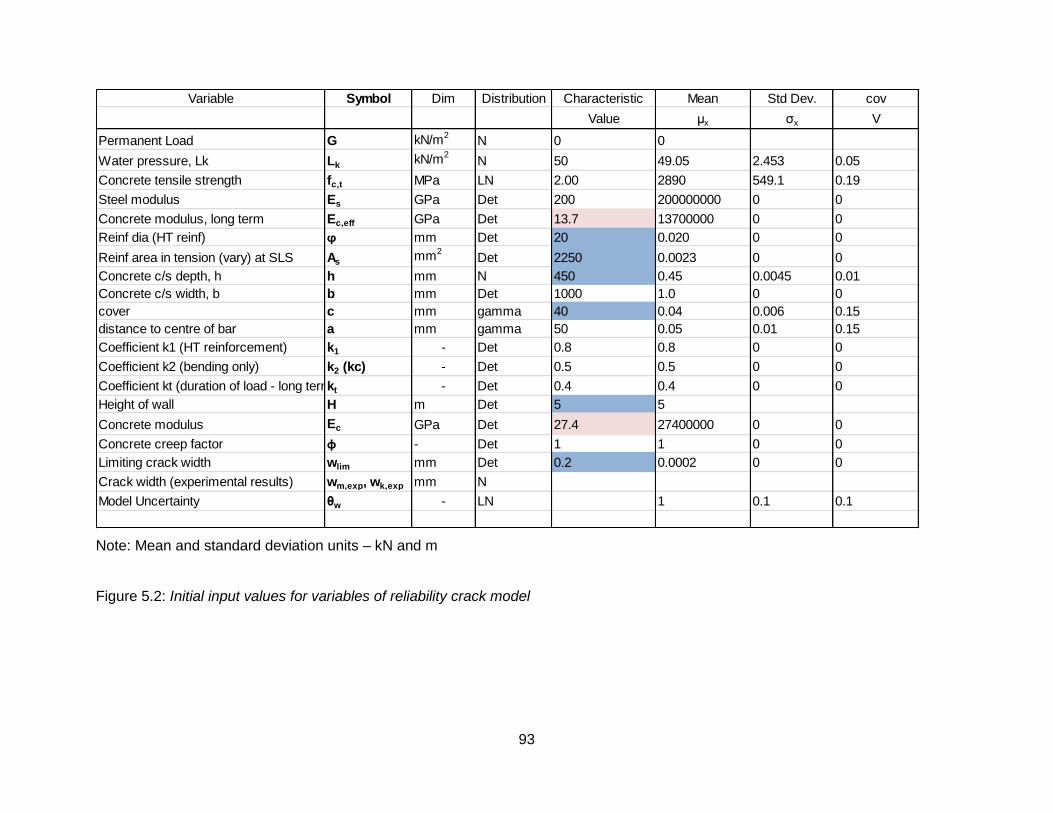
93
Note: Mean and standard deviation units – kN and m
Figure 5.2: Initial input values for variables of reliability crack model
Variable Symbol Dim Distribution Characteristic Mean Std Dev. cov
Value μx ζx V
Permanent Load G kN/m2N 0 0
Water pressure, Lk LkkN/m2
N 50 49.05 2.453 0.05
Concrete tensile strength fc,t MPa LN 2.00 2890 549.1 0.19
Steel modulus Es GPa Det 200 200000000 0 0
Concrete modulus, long term Ec,eff GPa Det 13.7 13700000 0 0
Reinf dia (HT reinf) ϕ mm Det 20 0.020 0 0
Reinf area in tension (vary) at SLS Asmm2
Det 2250 0.0023 0 0
Concrete c/s depth, h h mm N 450 0.45 0.0045 0.01
Concrete c/s width, b b mm Det 1000 1.0 0 0
cover c mm gamma 40 0.04 0.006 0.15
distance to centre of bar a mm gamma 50 0.05 0.01 0.15
Coefficient k1 (HT reinforcement) k1 - Det 0.8 0.8 0 0
Coefficient k2 (bending only) k2 (kc) - Det 0.5 0.5 0 0
Coefficient kt (duration of load - long term)kt - Det 0.4 0.4 0 0
Height of wall H m Det 5 5
Concrete modulus Ec GPa Det 27.4 27400000 0 0
Concrete creep factor φ - Det 1 1 0 0
Limiting crack width wlim mm Det 0.2 0.0002 0 0
Crack width (experimental results) wm,exp, wk,exp mm N
Model Uncertainty θw - LN 1 0.1 0.1
Stellenbosch University http://scholar.sun.ac.za

94
Figure 5.3 (a): Iteration 1 of FORM algorithm to calculate β
Variable Symbol Dim Distribution Characteristic Mean Std Dev. cov
Value μx ζx V
Crack width θw - LN 1 0.1 0.1
mod ratio, αe = 14.6
Crack limit wm,lim = 0.0002 m
FORM Reliability Analysis
Non-linear Limit State Eq
g(X) = wl im - wm,calc
Iteration 1
Step 1. Convert nonnormal distributions to N.
PDF ξ λ y* μN ζN LN → N-pdf
Model Uncertainty, θ LN 0.10 -0.01 1.00 1.00 0.10 Check pdf ξ = Ω λ = lnμ - 0.5Ω2
Concrete tensile strength, fct LN 0.19 7.95 2890 2837.84 549.1 ζN = y*ξ μN = y*(1-lny*+λ)
Cover, c - approx. LN pdf LN 0.15 -3.23 0.04 0.0396 0.006
Step 2: Numerical algorithm: Iteration 1
Uncorrelated variables c, h, Lk, fct, θ Xi
Assumed
x*i μXi ζXi (δg/δX'i) *
Directional
Cosines
α*xi
Failure
Point,
x*iD.F's
cover c 0.04 0.040 0.0060 -7.691E-06 -0.0425 0.040 eq 1 0.17
section thickness h 0.45 0.450 0.0045 -2.844E-06 -0.0157 0.450 eq 2 0.04
water pressure Lk 49.05 49.050 2.4525 -1.795E-04 -0.9929 50.728 eq 3 0.40
concrete tensile strength fct 2890.00 2837.836 549.1000 1.178E-05 0.0651 2813.180 eq 4 0.07
model uncertainity θ 1.00 0.99500 0.1000 -1.602E-05 -0.0886 1.00
√Σ((δg/δX'i)2 *) = 1.808E-04 β = 0.68925
Step 3. Optimisation of β Using Excel Solver for g(X) = 0
SUMMARISED FOR ALL ITERATIONS
Equations for New Failure Points (assuming β value)
x* = μNx - α*xβζNx input
Solver Iteration β c* h* L* ft* θ* d x hc Sr (m) ε (-) wm calc (m) g = 0 %As
1 0.6893 0.0397 0.4500 50.728 2813.18 1.00 0.4003 0.13261 0.1058 0.1735 9.7224E-04 1.687E-04 3.1124E-05 0.500
2 0.6834 0.0397 0.4501 50.721 2814.99 1.00 0.4003 0.13261 0.1058 0.1735 9.7184E-04 1.686E-04 3.1118E-05 As (mm2)
3 0.6835 0.0397 0.4501 50.721 2814.97 1.00 0.4003 0.13261 0.1058 0.1735 9.7185E-04 1.686E-04 3.1118E-05 2250.000
4 0.6835 0.0397 0.4501 50.721 2814.97 1.00 0.4003 0.13261 0.1058 0.1735 9.7185E-04 1.686E-04 3.1118E-05
5 0.6835 0.0397 0.4501 50.721 2814.97 1.00 0.4003 0.13261 0.1058 0.1735 9.7185E-04 1.686E-04 3.1118E-05
Step 1
Step 2
Step 3
Stellenbosch University http://scholar.sun.ac.za

95
Figure 5.3 (b): Iteration 2 of FORM algorithm.
Variable Symbol Dim Distribution Characteristic Mean Std Dev. cov
Value μx ζx V
Crack width θw - LN 1 0.1 0.1
mod ratio, αe = 14.6
Crack limit wm,lim = 0.0002 m
FORM Reliability Analysis
Non-linear Limit State Eq
g(X) = wl im - wm,calc
Iteration 1
Step 1. Convert nonnormal distributions to N.
PDF ξ λ y* μN ζN LN → N-pdf
Model Uncertainty, θ LN 0.10 -0.01 1.00 1.00 0.10 Check pdf ξ = Ω λ = lnμ - 0.5Ω2
Concrete tensile strength, fct LN 0.19 7.95 2890 2837.84 549.1 ζN = y*ξ μ
N = y*(1-lny*+λ)
Cover, c - approx. LN pdf LN 0.15 -3.23 0.04 0.0396 0.006
Step 2: Numerical algorithm: Iteration 1
Uncorrelated variables c, h, Lk, fct, θ Xi
Assumed
x*i μXi ζXi (δg/δX'i) *
Directional
Cosines
α*xi
Failure
Point,
x*iD.F's
cover c 0.04 0.040 0.0060 -7.691E-06 -0.0425 0.040 eq 1 0.17
section thickness h 0.45 0.450 0.0045 -2.844E-06 -0.0157 0.450 eq 2 0.04
water pressure Lk 49.05 49.050 2.4525 -1.795E-04 -0.9929 50.728 eq 3 0.40
concrete tensile strength fct 2890.00 2837.836 549.1000 1.178E-05 0.0651 2813.180 eq 4 0.07
model uncertainity θ 1.00 0.99500 0.1000 -1.602E-05 -0.0886 1.00
√Σ((δg/δX'i)2 *) = 1.808E-04 β = 0.68925
Iteration 2
PDF ξ λ y* μN ζN
Model Uncertainty, θ LN 0.100 -0.01 1.001 0.995 0.1001
Concrete tensile strength, fct LN 0.19 7.95 2813.18 2838.192 534.504
Cover, c - approx. LN pdf LN 0.15 -3.23 0.04 0.040 0.006
Uncorrelated variables c, h, Lk, fct, θ Xi
Assumed
x*i μXi ζXi (δg/δX'i) *
Directional
Cosines
α*xi
Failure
Point,
x*i D.F's from Matlab eq's
cover c 0.040 0.040 0.0060 -8.190E-06 -0.0455 0.040 eq 1 1.655E-01
section thickness h 0.450 0.450 0.0045 -2.985E-06 -0.0166 0.450 eq 2 4.420E-02
water pressure Lk 50.728 49.050 2.4525 -1.796E-04 -0.9968 50.721 eq 3 4.003E-01
concrete tensile strength fct 2813.180 2838.192 534.5042 1.144E-05 0.0635 2814.986 eq 4 6.617E-02
model uncertainity θ 1.00 0.995 0.1001 -1.68862E-05 -0.0937 1.001
√Σ((δg/δX'i)2 *) = 1.801E-04 β = 0.68345
Step 3. Optimisation of β Using Excel Solver for g(X) = 0
SUMMARISED FOR ALL ITERATIONS
Equations for New Failure Points (assuming β value)
x* = μNx - α*xβζNx input
Solver Iteration β c* h* L* ft* θ* d x hc Sr (m) ε (-) wm calc (m) g = 0 %As
1 0.6893 0.0397 0.4500 50.728 2813.18 1.00 0.4003 0.13261 0.1058 0.1735 9.7224E-04 1.687E-04 3.1124E-05 0.500
2 0.6834 0.0397 0.4501 50.721 2814.99 1.00 0.4003 0.13261 0.1058 0.1735 9.7184E-04 1.686E-04 3.1118E-05 As (mm2)
3 0.6835 0.0397 0.4501 50.721 2814.97 1.00 0.4003 0.13261 0.1058 0.1735 9.7185E-04 1.686E-04 3.1118E-05 2250.000
4 0.6835 0.0397 0.4501 50.721 2814.97 1.00 0.4003 0.13261 0.1058 0.1735 9.7185E-04 1.686E-04 3.1118E-05
5 0.6835 0.0397 0.4501 50.721 2814.97 1.00 0.4003 0.13261 0.1058 0.1735 9.7185E-04 1.686E-04 3.1118E-05
Step 1
Step 2
Step 3
Stellenbosch University http://scholar.sun.ac.za
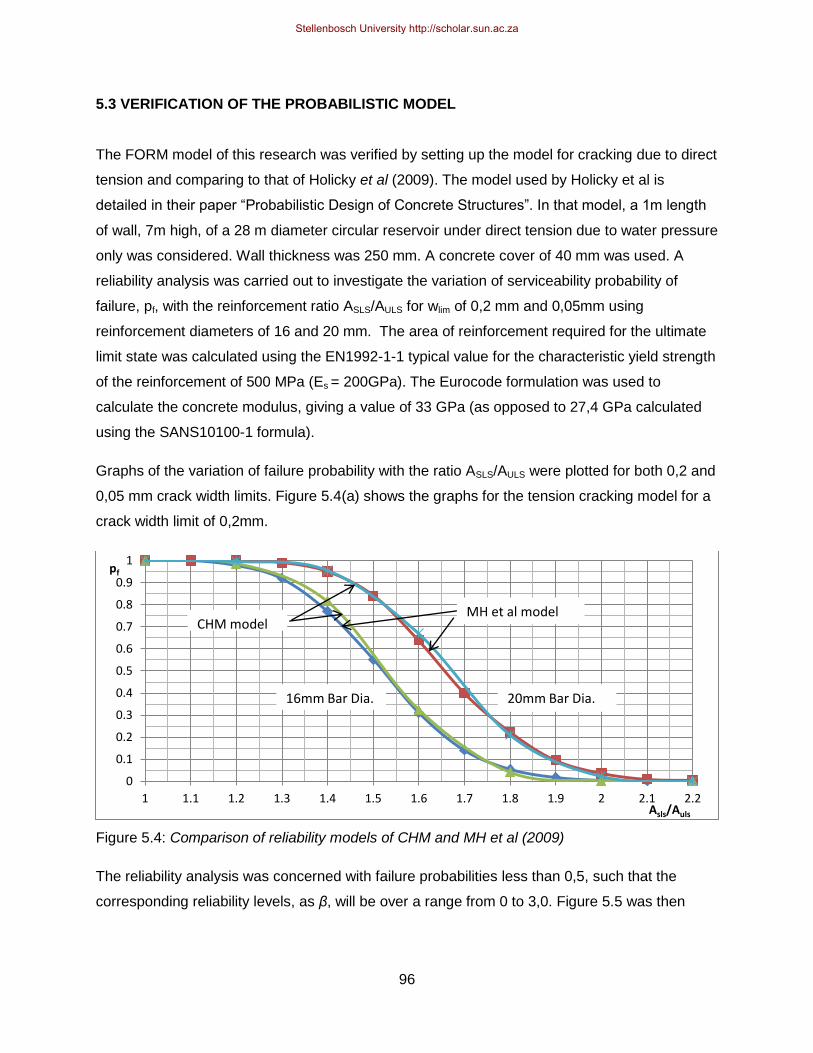
96
5.3 VERIFICATION OF THE PROBABILISTIC MODEL
The FORM model of this research was verified by setting up the model for cracking due to direct
tension and comparing to that of Holicky et al (2009). The model used by Holicky et al is
detailed in their paper “Probabilistic Design of Concrete Structures”. In that model, a 1m length
of wall, 7m high, of a 28 m diameter circular reservoir under direct tension due to water pressure
only was considered. Wall thickness was 250 mm. A concrete cover of 40 mm was used. A
reliability analysis was carried out to investigate the variation of serviceability probability of
failure, pf, with the reinforcement ratio ASLS/AULS for wlim of 0,2 mm and 0,05mm using
reinforcement diameters of 16 and 20 mm. The area of reinforcement required for the ultimate
limit state was calculated using the EN1992-1-1 typical value for the characteristic yield strength
of the reinforcement of 500 MPa (Es = 200GPa). The Eurocode formulation was used to
calculate the concrete modulus, giving a value of 33 GPa (as opposed to 27,4 GPa calculated
using the SANS10100-1 formula).
Graphs of the variation of failure probability with the ratio ASLS/AULS were plotted for both 0,2 and
0,05 mm crack width limits. Figure 5.4(a) shows the graphs for the tension cracking model for a
crack width limit of 0,2mm.
Figure 5.4: Comparison of reliability models of CHM and MH et al (2009)
The reliability analysis was concerned with failure probabilities less than 0,5, such that the
corresponding reliability levels, as β, will be over a range from 0 to 3,0. Figure 5.5 was then
0
0.1
0.2
0.3
0.4
0.5
0.6
0.7
0.8
0.9
1
1 1.1 1.2 1.3 1.4 1.5 1.6 1.7 1.8 1.9 2 2.1 2.2
pf
Asls/Auls
MH et al model CHM model
16mm Bar Dia. 20mm Bar Dia.
Stellenbosch University http://scholar.sun.ac.za

97
plotted showing this limited range of reliability to assess the correlation between the reliability
models.
Figure 5.5: Comparison of reliability models with respect to β
As the analysis in this research was done using EXCEL which is not the same software used by
Holicky et al and values for the Holicky et al model were interpolated from graphs presented in
their paper, a small difference in values was expected, particularly at very small probabilities of
failure (that is, as β increases). It was found that the graphs for the two models at a 0,2 mm and
0,05 mm crack widths corresponded sufficiently well enough to conclude that the tension
cracking model, and by inference, the flexural cracking model, would be accurate. In addition,
hand calculations were carried out to verify both models. Graphs for a crack width of 0,05 mm
can be found in Appendix B.
5.4 RESULTS AND DISCUSSION
The results of the FORM analysis for the flexural and tension cracking models are presented
and discussed under this heading with respect to the issues set out at the beginning of the
chapter, summarised as follows:
(i) The extent to which SLS cracking governs the design of a WRS.
(ii) The effect of the specified crack width limit on the level of reliability.
0.00
1.00
2.00
3.00
1 1.1 1.2 1.3 1.4 1.5 1.6 1.7 1.8 1.9 2 2.1 2.2 2.3 2.4 2.5 2.6 2.7 2.8 2.9 3
β
A SLS/A ULS
16 mm Bar Dia.
20 mm Bar Dia.
CHM model
MH et al model
Stellenbosch University http://scholar.sun.ac.za

98
(iii) The influence of model uncertainty on the reliability of the crack model.
In the case of tension cracking, hc,eff = 2,5(c + θ/2) is limiting for most combinations of concrete
cover, diameter and section thickness considered. Therefore Model 2(a) using this equation for
hc,eff was taken as the general model for tension cracking. However, for smaller section
thicknesses, either hc,eff = h/2 is limiting (Model 2(b)) or both equations for hc,eff apply. Thus,
reliability analyses were performed using both equations for hc,eff and comparisons made; the
results of which are presented in Section 5.4.4.
As satisfaction of the serviceability cracking condition is dependent on an adequate amount of
reinforcement being supplied such that the limiting crack width specified is not exceeded. The
quantity of reinforcement required as % reinforcement (or ρ as %As = As/Ac where Ac is the
gross cross sectional area of the wall section) was therefore used as the basis of comparison in
the analysis of the results from the probability analyses. It was anticipated, based on the results
of the deterministic analysis, that the reinforcement requirements to satisfy the serviceability
cracking requirements would be more severe than for the ultimate load case, with possible
economic consequences. The degree to which this was the case was therefore investigated, by
expressing results in terms of the ASLS/AULS ratios. Results obtained were also compared to the
corresponding deterministic values. As in the deterministic analysis, a maximum limit was
considered for the reinforcement area, determined by a minimum practical spacing of bars, as
given in Table 3.2 of Chapter 3.
Selected graphs only are presented here. The data sheets generated by the analyses may be
found in Appendix B.
5.4.1 Significance of serviceability limit state (SLS) load-induced cracking
To assess the influence of the SLS of cracking compared to the ULS, graphs were plotted for
the variation of reliability with the ASLS/AULS ratio. As discussed in the deterministic analysis,
ratios larger than 1,0 indicate that the SLS dominates the design. The data from both the
flexural and tension cracking reliability analyses was analysed for a reference value of 0,2 for
θcov and is discussed, as follows:
(i) Flexural cracking (Model 1)
The influence of SLS for flexural cracking is illustrated by Figure 5.6 showing the variation of
reliability with the ratio ASLS/AULS as the limiting crack width decreases from 0,3 to 0,05 mm for a
450 mm wall thickness. An ASLS/AULS ratio of approximately 2,5 was calculated to be the upper
Stellenbosch University http://scholar.sun.ac.za

99
limit corresponding to the maximum feasible area of reinforcement considered in terms of a
practical bar spacing (As = 4189 mm2 for a 20 mm bar diameter). Referring to Figure 5.6, SLS is
not dominant for a crack width of 0,3 mm, with ASLS/AULS ratios just below 1 for a reliability level
of 1,5. However, as the crack limit decreases, SLS cracking is increasing dominant, with
ASLS/AULS ratios above 1.
Figure 5.6: Flexure - Effect of SLS on variation of with ratio ASLS/AULS
Table 5.2 is a summary of the reinforcement (as % As and as the ratio ASLS/AULS) satisfying crack
width criteria for flexural cracking at a reliability index (β) of 1,5.
Table 5.2: Flexural cracking: Reinforcement required for reliability and deterministic analyses.
Reliability Analysis β = 1,5
Deterministic Analysis
Ratio of Deterministic/
Reliability Load Case
w (mm)
θCoV %As ASLS/AULS %As ASLS/AULS
Flexure 0.30
0.10 0.36 0.96 0.48 1.28
1.33
(Model 1) 0.20 0.37 0.99 1.29
0.20
0.10 0.469 1.26
0.62 1.65
1.31
AULS 0.15 0.472 1.26 1.31
1680 mm2
0.20 0.476 1.28 1.29
0.25 0.482 1.29 1.28
0.30 0.489 1.31 1.26
0.10
0.10 0.74 1.98 0.98 2.62
1.32
0.15 0.75 2.00 1.31 0.20 0.76 2.04 1.28
0.05
0.10 1.21 3.24
1.59 4.26
1.32
0.15 1.23 3.29 1.29
0.20 1.25 3.35 1.27
0.00
0.50
1.00
1.50
2.00
2.50
3.00
0.50 1.00 1.50 2.00 2.50 3.00 3.50
β
ASLS/AULS
w 0.3 w 0.2 w 0.1 w 0.05
β 1.5
Stellenbosch University http://scholar.sun.ac.za
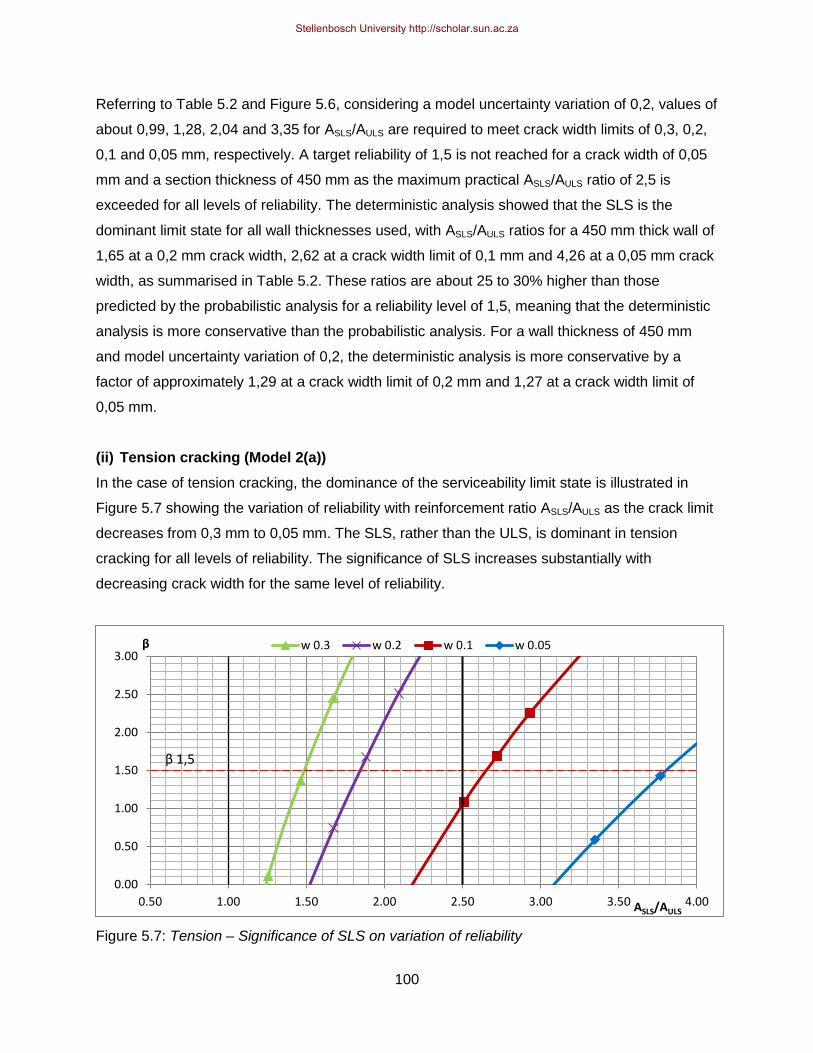
100
Referring to Table 5.2 and Figure 5.6, considering a model uncertainty variation of 0,2, values of
about 0,99, 1,28, 2,04 and 3,35 for ASLS/AULS are required to meet crack width limits of 0,3, 0,2,
0,1 and 0,05 mm, respectively. A target reliability of 1,5 is not reached for a crack width of 0,05
mm and a section thickness of 450 mm as the maximum practical ASLS/AULS ratio of 2,5 is
exceeded for all levels of reliability. The deterministic analysis showed that the SLS is the
dominant limit state for all wall thicknesses used, with ASLS/AULS ratios for a 450 mm thick wall of
1,65 at a 0,2 mm crack width, 2,62 at a crack width limit of 0,1 mm and 4,26 at a 0,05 mm crack
width, as summarised in Table 5.2. These ratios are about 25 to 30% higher than those
predicted by the probabilistic analysis for a reliability level of 1,5, meaning that the deterministic
analysis is more conservative than the probabilistic analysis. For a wall thickness of 450 mm
and model uncertainty variation of 0,2, the deterministic analysis is more conservative by a
factor of approximately 1,29 at a crack width limit of 0,2 mm and 1,27 at a crack width limit of
0,05 mm.
(ii) Tension cracking (Model 2(a))
In the case of tension cracking, the dominance of the serviceability limit state is illustrated in
Figure 5.7 showing the variation of reliability with reinforcement ratio ASLS/AULS as the crack limit
decreases from 0,3 mm to 0,05 mm. The SLS, rather than the ULS, is dominant in tension
cracking for all levels of reliability. The significance of SLS increases substantially with
decreasing crack width for the same level of reliability.
Figure 5.7: Tension – Significance of SLS on variation of reliability
0.00
0.50
1.00
1.50
2.00
2.50
3.00
0.50 1.00 1.50 2.00 2.50 3.00 3.50 4.00
β
ASLS/AULS
w 0.3 w 0.2 w 0.1 w 0.05
β 1,5
Stellenbosch University http://scholar.sun.ac.za

101
Table 5.3 is a summary of the reinforcement (% As and ASLS/AULS) satisfying crack width criteria
for tension cracking at a reliability index (β) of 1,5 for crack widths from 0,05 to 0,3 mm.
Table 5.3: Tension cracking - Reinforcement required for reliability and deterministic analyses
Reliability Analysis β = 1,5
Deterministic Analysis
Ratio of Deterministic/
Reliability Load Case
w (mm)
θCoV %As ASLS/AULS %As ASLS/AULS
Tension 0.30
0.10 0.68 1.42 0.88 1.85
1.30
(Model 0.20 0.71 1.49 1.24
2(a))
0.20
0.10 0.84 1.76
1.11 2.33
1.32
0.15 0.86 1.80 1.29
AULS 0.20 0.88 1.84 1.27
2150 mm2
0.25 0.90 1.88 1.24 0.30 0.93 1.95 1.19
0.10
0.10 1.22 2.55 1.68 3.60
1.41
0.15 1.24 2.60 1.38 0.20 1.27 2.68 1.34
0.05
0.10 1.76 3.68 2.62 5.49
1.49
0.15 1.78 3.73 1.47 0.20 1.82 3.81 1.44
Referring to Figure 5.7 and Table 5.3, considering a model uncertainty variation of 0,2, ratios of
about 1,49, 1,84, 2,68 and 3,81 are required for crack widths of 0,3, 0,2, 0,1 and 0,05 mm at a
reliability level of 1,5.
On comparing the probabilistic analysis at a β of 1,5 using a model uncertainty variation of 0,2,
with the deterministic analysis for tension cracking, the design analysis is more demanding than
the probabilistic analysis with increasing conservatism as the crack width limit decreases. Ratios
for deterministic to reliability analysis of about 1,27 and 1,44 for crack widths of 0,2 mm and
0,05 mm respectively. The results from the reliability analyses for both tension and flexural
cracking therefore suggest that there are possible improvements that can be made in the design
crack model.
5.4.2 Effect of the specified crack width limit, wlim, on reliability
Reliability analyses were performed for crack width limits of 0,3 mm, 0,2 mm, 0,1 mm and 0,05
mm, for varying reinforcement quantities. For both the flexural and tensile cracking models, the
Stellenbosch University http://scholar.sun.ac.za

102
level of reliability was found to decrease considerably with a decreasing crack width limit for a
given reinforcement quantity and model uncertainty variation, as discussed as follows:
(i) Flexural cracking (Model 1)
The influence of crack width limit for the flexural cracking case is illustrated in Figure 5.8 which
shows the variation of reliability as the crack width limit is varied for a model uncertainty
variation of 0,2 and section thickness of 450 mm. Referring to Figure 5.8 and Table 5.3,
increasing %As values (obtained at β 1,5 and θcov 0,2) of about 0,37, 0,48, 0,76 and 1,25 for
decreasing flexural crack widths of 0,3, 0,2, 0,1 and 0,05 mm, respectively, illustrates this point.
Considering the maximum practical limit on the reinforcement required of 0,93% (4189 mm2) for
a wall thickness of 450 mm and 20 mm bar diameter, the target reliability of 1.5 will be met for
crack widths down to and including 0,1 mm, for flexural cracking. However, as also predicted by
the deterministic analysis, a limiting crack width of 0,05 mm will not be met for the wall
configuration considered as the maximum feasible reinforcement area (0,93% As) is exceeded
for all β. The section thickness and/or bar diameter will need to be increased. Alternatively, for
thicker sections, a double layer of bars may be used.
Figure 5.8: Flexural cracking - Effect of limiting crack width on variation of with %As
The graphs for each crack width limit are approximately linear at the larger crack widths, with
gradients decreasing as the crack width limit decreases. This means that a small change in %As
will result in a larger change in reliability for a crack width limit of 0.3 and 0.2 mm than for a
0.00
0.50
1.00
1.50
2.00
2.50
3.00
0.30 0.40 0.50 0.60 0.70 0.80 0.90 1.00 1.10 1.20 1.30 1.40
β
%ASLS
w 0.3 w 0.2 w 0.1 w 0.05
β 1.5
Stellenbosch University http://scholar.sun.ac.za

103
crack width limit of 0.05 mm. Therefore, a smaller limiting crack width will require a greater
increase in reinforcement to achieve the same increase in reliability as for a larger crack width
limit, that is, at a greater cost. To increase reliability from 1,5 to 2,0, for example, at a 0,2 mm
crack width limit, requires an increase in reinforcement from about 0,48% to 0,49%, which is
very small. To achieve the same increase in reliability at a 0,05 mm crack width limit, a greater
increase in reinforcement from about 1,25% to 1,37% is required.
(ii) Tension cracking (Model 2(a))
The influence of the crack width on reliability for tension cracking is illustrated by Figure 5.9
showing the variation of reliability with %As for a 450 mm wall thickness and a decreasing crack
width limit from 0,3 mm to 0,05 mm.
Referring to Figure 5.9 and Table 5.3, a target reliability of 1,5 requires increasing %As of about
0,71%, 0,88%, 1,24% and 1,82% to satisfy decreasing crack width limits of 0.3, 0.2, 0.1 and
0.05 mm, respectively, for tension cracking. Considering the maximum practical limit on the total
reinforcement (%As for both faces of wall) required of 1,86% ( 8370 mm2) for a wall thickness of
450 mm, reliabilities greater than the SLS target reliability of 1,5 for all limiting crack widths
considered can be achieved in the case of an applied direct tension.
Figure 5.9: Tension cracking – Effect of crack width limit on variation of with %As
0.00
0.50
1.00
1.50
2.00
2.50
3.00
0.60 0.70 0.80 0.90 1.00 1.10 1.20 1.30 1.40 1.50 1.60 1.70 1.80 1.90 2.00
β
%As
w 0.3 w 0.2 w 0.1 w 0.051.86 %As
β 1.5
Stellenbosch University http://scholar.sun.ac.za

104
The graphs for each crack width are approximately linear, with the gradient decreasing as the
crack width decreases, as in the case of flexural cracking, meaning that the reinforcement
required increases to achieve the same level of reliability as the limiting crack width decreases.
For example, referring to Figure 5.9, to increase reliability from 1,5 to 2,0 at a 0,02 mm crack
width, an increase in reinforcement from about 0,88% to 0,94% is required (corresponding to a
gradient of 8,33), whereas an increase from 1,82% to 1,95% is required at a 0,05 mm crack
width (corresponding to a gradient of 3,85). Hence, the cost of increasing reliability at smaller
crack widths is greater.
It can be concluded that the crack width limit has a substantial influence on the level of reliability
for both flexural and tension cracking. Reducing the crack width limit from 0,2 mm to the more
demanding value of 0,05 mm set by EN1992-3 (a decrease by a factor of 4) will result in an
increase in the reinforcement required by a factor of about 2,0 for flexural cracking and about
2,6 for tension cracking, at a reliability level of 1,5 and model uncertainty variation of 0,2.
5.4.3 Effect of Model uncertainty, θ, on reliability
The statistical values considered for the model uncertainty were estimated as there is little
available data in literature, thus providing motivation to examine the effect of this variable. From
the conclusions of the literature review of reliability, presented in Chapter 4, model uncertainty in
the crack model was treated as a variable with a mean of 1 and log-normal probability
distribution. The θcov was varied from 0,1 to 0,3 for both flexural and tension cracking, with the
resulting reinforcement required and corresponding level of reliability noted. The influence of
model uncertainty on reliability for flexural and tensile cracking is discussed as follows:
(i) Flexural cracking (Model 1)
To assess the effect of the model uncertainty, Figure 5.10 was plotted showing the variation of
with reinforcement ratio for flexural cracking. A section thickness of 450 mm and a 0,2 mm crack
width were used.
Figure 5.10 shows a decreasing gradient for each graph with increasing θcov, which means that
a greater increase in reinforcement will be required to achieve the same increase in the
reliability, as the model uncertainty variation increases. The graphs are roughly linear and
intersect at a β of about 0,65 and a ASLS/AULS of about 1,21 (0,45 %As) for a section thickness of
Stellenbosch University http://scholar.sun.ac.za

105
450 mm. It follows that reliability decreases as the model uncertainty variance increases, as was
expected, for a given reinforcement above a β of about 0,65.
Figure 5.10: Flexure - Effect of model uncertainty on variation of with ratio ASLS/AULS
The values for reinforcement required at a reliability of 1,5, as summarised in Table 5.2, suggest
that model uncertainty has a small influence for a wall thickness of 450 mm, as the ASLS/AULS
ratio increases only slightly with increasing CoV, for flexural cracking and a limiting crack width
of 0,2 mm. Using a model uncertainty CoV of 0,1 results in a ASLS/AULS of about 1,26 (0,47 %As),
while a value of 0,2 results in a ASLS/AULS of about 1,28 (0,48 %As) which is a small increase.
Referring to Table 5.2, a greater increase in reinforcement is observed for crack width limits less
than 0,2 mm, although this increase is still relatively small. For a crack width limit of 0,05 mm, a
ASLS/AULS of about 3,24 (1,21 %As) is obtained using a CoV of 0,1 and about 3,35 (1,25 %As) for
a CoV of 0,2. It can be concluded that model uncertainty appears to have some influence on
flexural cracking.
(ii) Tension cracking (Model 2(a))
For the tension cracking model, the graph gradients are flatter than for flexure and thus the
relative decrease in β is greater for a given %As with increasing model uncertainty variation, as is
shown in Figure 5.11. The graphs intersect at a β of about 0,30 and a ASLS/AULS of about 1,57
(0,75%As) for a section thickness of 450 mm. The influence of model uncertainty increases as
the level of reliability increases above a value of about 0,30.
0.00
0.50
1.00
1.50
2.00
2.50
3.00
1.00 1.10 1.20 1.30 1.40 1.50 1.60 1.70 1.80
β
ASLS/AULS
COV 0.1 COV 0.15 COV 0.2 COV 0.25 COV 0.3
β 1.5
Stellenbosch University http://scholar.sun.ac.za
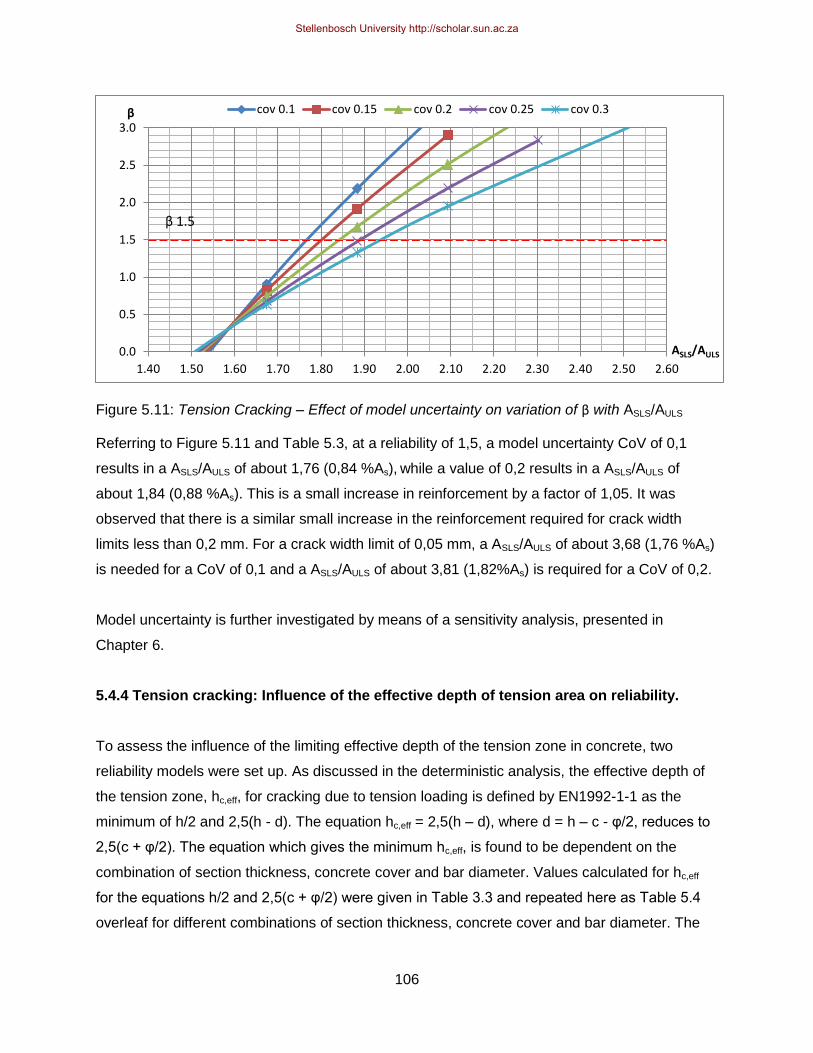
106
Figure 5.11: Tension Cracking – Effect of model uncertainty on variation of β with ASLS/AULS
Referring to Figure 5.11 and Table 5.3, at a reliability of 1,5, a model uncertainty CoV of 0,1
results in a ASLS/AULS of about 1,76 (0,84 %As), while a value of 0,2 results in a ASLS/AULS of
about 1,84 (0,88 %As). This is a small increase in reinforcement by a factor of 1,05. It was
observed that there is a similar small increase in the reinforcement required for crack width
limits less than 0,2 mm. For a crack width limit of 0,05 mm, a ASLS/AULS of about 3,68 (1,76 %As)
is needed for a CoV of 0,1 and a ASLS/AULS of about 3,81 (1,82%As) is required for a CoV of 0,2.
Model uncertainty is further investigated by means of a sensitivity analysis, presented in
Chapter 6.
5.4.4 Tension cracking: Influence of the effective depth of tension area on reliability.
To assess the influence of the limiting effective depth of the tension zone in concrete, two
reliability models were set up. As discussed in the deterministic analysis, the effective depth of
the tension zone, hc,eff, for cracking due to tension loading is defined by EN1992-1-1 as the
minimum of h/2 and 2,5(h - d). The equation hc,eff = 2,5(h – d), where d = h – c - θ/2, reduces to
2,5(c + θ/2). The equation which gives the minimum hc,eff, is found to be dependent on the
combination of section thickness, concrete cover and bar diameter. Values calculated for hc,eff
for the equations h/2 and 2,5(c + θ/2) were given in Table 3.3 and repeated here as Table 5.4
overleaf for different combinations of section thickness, concrete cover and bar diameter. The
0.0
0.5
1.0
1.5
2.0
2.5
3.0
1.40 1.50 1.60 1.70 1.80 1.90 2.00 2.10 2.20 2.30 2.40 2.50 2.60
β
ASLS/AULS
cov 0.1 cov 0.15 cov 0.2 cov 0.25 cov 0.3
β 1.5
Stellenbosch University http://scholar.sun.ac.za

107
highlighted values in Table 5.4 are the limiting effective depths to be used in calculating the
effective area of the tension zone around the reinforcement.
In terms of the reliability analysis of the EN1992 crack equation for tension loading, section
thickness, h, and concrete cover, c, are basic random variables whilst bar diameter is taken as a
deterministic value. The effective depth of the tension zone determined by h/2 is independent of
concrete cover and bar diameter. Bar diameter and concrete cover only appear directly in the
equation for the maximum crack width. However, if the effective depth is determined using
2,5(c + θ/2), the effective depth of the tension zone is expressed in terms of concrete cover as a
random variable and bar diameter (deterministic value) and is independent of h. The crack width
is also then independent of h. The reliability model is then influenced by which equation is used
for the effective depth of the tension zone.
Table 5.4: Calculation of effective depth of the tension area (mm) surrounding the reinforcement
for tension cracking, where hc,eff is lesser of h/2 or 2,5(h-d).
Bar dia 16 mm Bar dia 20 mm Bar dia 25 mm
Concrete cover (mm) h d h/2 2,5(h-d) d h/2 2,5(h-d) d h/2 2,5(h-d)
40
250 202 125 120 200 125 125 197.5 125 131.25
300 252 150 120 250 150 125 247.5 150 131.25
350 302 175 120 300 175 125 297.5 175 131.25
400 352 200 120 350 200 125 347.5 200 131.25
450 402 225 120 400 225 125 397.5 225 131.25
500 452 250 120 450 250 125 447.5 250 131.25
50
250 192 125 145 190 125 150 187.5 125 156.25
300 242 150 145 240 150 150 237.5 150 156.25
350 292 175 145 290 175 150 287.5 175 156.25
400 342 200 145 340 200 150 337.5 200 156.25
450 392 225 145 390 225 150 387.5 225 156.25
500 442 250 145 440 250 150 437.5 250 156.25
Note: highlighted values are the limiting effective depth of the tension zone in concrete
For most combinations of section thickness, concrete cover and bar diameter, only one equation
results the minimum hc,eff . The reliability analysis is then performed using the appropriate
equation for hc,eff. However, there are some combinations of section thickness, concrete cover
and bar diameter which result in the same value for hc,eff calculated by both equations. Referring
to Table 5.4, this occurs for the combination of a 250 mm section thickness, a 20 mm bar
diameter and 40 mm concrete cover, giving an hc,eff of 125 mm for both equations. FORM
Stellenbosch University http://scholar.sun.ac.za

108
analyses were performed using these values to assess the effect of the way in which hc,eff is
determined on the reliability of the crack width model. A crack width limit of 0,2 mm was used.
The results of these analyses are illustrated by Figure 5.12 showing the variation of the
reliability index with %As for hc,eff determined using h/2 and 2,5(c + θ/2) using model uncertainty
variations of 0,2 and 0,1, respectively.
(a) θcov of 0,2
(b) θcov of 0,1
Figure 5.12: Influence of hc,eff on the reliability of the tension cracking model.
0.00
0.50
1.00
1.50
2.00
2.50
3.00
1.00 1.10 1.20 1.30 1.40 1.50 1.60 1.70 1.80 1.90 2.00
β
%As
Model 2(b) hceff=h/2
Model 2(a) hceff = 2.5(c+φ/2)
0.00
0.50
1.00
1.50
2.00
2.50
3.00
1.00 1.10 1.20 1.30 1.40 1.50 1.60 1.70 1.80 1.90 2.00
β
%As
Model 2(b) hceff=h/2
Model 2(a) hceff = 2.5(c+φ/2)
Stellenbosch University http://scholar.sun.ac.za

109
Figure 5.12(a) shows that hc,eff determined using 2,5(c + θ/2) results in a higher reliability for a
given reinforcement area than hc,eff as h/2, the difference in reliability increasing as the supplied
reinforcement area increases. For example, for 1,5%As of, reliability levels of about 1,05 and
0,91 are obtained for hc,eff determined using 2,5(c + θ/2) and h/2, respectively. Conversely, for a
given reliability, using hc,eff = 2,5(c + θ/2) requires slightly less reinforcement than if hc,eff = h/2 is
used. At a β of 1,5, values of about 1,57% for hc,eff = 2,5(c + θ/2) and 1,63% for hc,eff = h/2 are
obtained. Thus, using 2,5(c + θ/2) results in the crack width model being marginally less
conservative by a factor of 1,04 than using h/2 at this reliability level. If a lower model
uncertainty was considered, it was noted that for a given %As, using 2,5(c + θ/2) results in a
lower reliability than when using h/2, for a given amount of reinforcement.
Referring to Figure 5.12(b), considering a model uncertainty variation of 0,1 and 1,5%As,
reliability levels of 1,35 and 1,15 are obtained using 2,5(c + θ/2) and h/2, respectively. As model
uncertainty variation decreases from 0,2 to 0,1, the %As required to meet a particular reliability
level decreases for both formulations of hc,eff. It can be concluded that reliability in tension
cracking is dependent on the relationship between the formulation of hc,eff, more specifically the
basic variables of concrete cover and model uncertainty. This is investigated further in the
sensitivity analysis presented in Chapter 6.
5.5 SUMMARY
The influence of the specified crack width limit, the reliability of the EN1992-1-1 model and the
influence of SLS cracking were explored by means of the reliability FORM analysis. The effects
of model uncertainty were also studied. Summarising from the results and discussion:
The crack width limit has a significant effect on the probabilistic model, namely, an
increase in reinforcement required and a decrease in reliability, that is, a decrease in the
performance of the structure, as the crack width limit reduces. A cost optimisation
analysis, as future research, is recommended to obtain the best reliability to cost ratio.
The SLS dominates the design of a WRS at a reliability level of 1,5 for crack widths less
than and equal to 0,2 mm for flexural cracking and all crack widths for tension cracking.
This emphasizes the importance of optimizing the design of a WRS for serviceability.
Model uncertainty has a limited effect on the reliability of the model, particularly for the
tension cracking case. However, the actual model uncertainty at this point is not known.
Stellenbosch University http://scholar.sun.ac.za

110
A comparison of the probabilistic analysis to experimental data on flexural and tension
cracking needs to be done to improve the statistical data for crack models and their
related model uncertainty. A sensitivity analysis was done and reported on in Chapter 6
to better assess the influence of model uncertainty on the reliability crack models.
The deterministic analysis is more conservative than the probabilistic analysis for both
flexural and tension crack models at a reliability levelof 1,5 which suggests that there
are potential savings to be made for load-induced cracking conditions if this level of
reliability is used. This supports the conclusion that Holicky et al (2009) made from their
investigation into tension cracking to EN1992.
The reliability model for tension load cracking is influenced by the geometry of the
member considered, in particular, the combination of section thickness, bar diameter
and concrete cover chosen. This is turn affects which equation is used to calculate the
effective depth of the tension zone, hc,eff, either h/2 or 2,5(c + θ/2). When both equations
apply for a particular combination of concrete cover, bar diameter and section thickness,
the reliability obtained using h/2 was less than that using 2,5(c + θ/2).
Stellenbosch University http://scholar.sun.ac.za

111
CHAPTER 6
SENSITIVITY ANALYSIS
6.1 GENERAL
This chapter presents the sensitivity analysis performed at given levels of reliability on the
EN1992 flexural and tension crack models, as detailed in Chapter 5, by means of the reverse-
FORM procedure, namely:
(i) Model 1 - Flexural cracking
(ii) Model 2(a) - Tension cracking, hc,eff = 2,5(c + θ/2)
(iii) Model 2(b) - Tension cracking, hc,eff = h/2
The purpose of the sensitivity analysis was as follows:
(i) In order to determine the influence of the basic variables of cover, section thickness, load,
concrete tensile strength and model uncertainty on the statistical model, the sensitivity
factors for these variables were determined for a given level of reliability.
(ii) Given the importance of serviceability cracking in water retaining structures (WRS), the
reliability level was varied to assess the influence of reliability on the crack models.
The level of reliability (measured by the reliability index, β) was chosen, as well as the mean
values of the basic variables. The reverse-FORM analysis was then performed with the result
being the quantity of reinforcement required for a given reliability level and chosen values of the
basic variables. Sensitivity factors for each variable were determined for a given reliability level
in the process of the analysis.
Theoretical partial safety factors for the basic variables of the crack models were also calculated
for a given reliability level as a first step in calibrating the crack model for design purposes. It
should be noted that the optimisation process of determining the final design model factors is
beyond the scope of this thesis.
6.2 FORMULATION OF REVERSE-FORM ANALYSIS CRACK MODELS
6.2.1 Structural configuration of the crack model
The structural configuration used was as that used for the forward- FORM analysis presented in
Chapter 5, summarised here as follows:
Stellenbosch University http://scholar.sun.ac.za

112
(iii) In the flexure case, a 1 m section of wall of a rectangular reinforced concrete water-retaining
structure was considered. The wall is subject to flexure due to water pressure about the
horizontal axis of the cross section.
(iv) For the tension case, a 1 m section of wall in a circular reservoir was considered. The wall is
subject to hoop tension due to water pressure in the horizontal plane. The reservoir
diameter was taken as 28 m.
6.2.2 Formulation of reliability crack model for reverse-FORM analysis
The limit state equation used in the reverse-FORM analysis was the same as that of the
forward-FORM analysis presented in Chapters 4 and 5. The model equations are summarised
as follows:
Limit state equation g = wlim – θ. wcalc
Crack width wcalc = Sr . εm
Crack spacing Sr = 2c + 0,25k1k2θ /ρp,eff
Mean strain εm= εsm
- εcm=ζs- ktfct, eff(1+ eρ eff)/ρ eff
Es
The crack width equation is expressed in terms of the basic variables of concrete cover, section
thickness, concrete tensile strength, liquid load and model uncertainty. The parameters in the
limit state function are either modelled as random variables or taken as deterministic values.
6.2.3. Choice of values for model parameters
The target level of reliability chosen was 1,5 for a reference period of 50 years, corresponding to
that defined by SANS10160 for serviceability cracking in buildings (irreversible state). Given the
importance of serviceability in WRS, reverse FORM analysis were performed over a range of
values for the reliability index, β, that is, 0.5, 1.5 and 2.0 as a means of investigating the effect
of reliability on the crack model and the basic variables of concrete cover, section thickness,
load, concrete tensile strength and model uncertainty. A β of 0,5 is the value specified for
reversible serviceability limit states whilst a β of 2,0 was taken as a reasonable upper limit for
serviceability cracking.
Stellenbosch University http://scholar.sun.ac.za

113
The influence of the basic random variables of cover, section thickness, load, concrete tensile
strength and model uncertainty on the crack model was investigated by means of the sensitivity
factors. The following mean values were chosen for the initial values of the basic random
variables:
Section thickness, h 250 and 450 mm
Cover, c 40 mm
Load, Lk 49,05 kN/m2
Concrete tensile strength, fct 2,89 MPa
Model uncertainty 1,0
The CoV of model uncertainty (θcov) was varied over the range of 0,1 to 0,3 to assess the
influence of this parameter on reliability.
Analyses were performed for crack width limits (wlim) of 0,05, 0,1 and 0,2 mm to assess the
effect of the crack width limit on the sensitivity factors. All other parameters were the same as
the forward FORM analysis as summarised in Table 5.1 of Chapter 5.
6.2.4 Formulation of the reverse-FORM model in Microsoft EXCEL
Step 1 of the reverse-FORM algorithm was set up in Microsoft EXCEL in much the same way as
for the forward FORM analysis presented in Chapter 5. The main difference is that in the
reverse-FORM process, the reliability index (β) is defined first. Then the design point values of
the basic variables (RV‟s) with their sensitivity factors (directional cosines, αi) are then
calculated using the FORM algorithm as summarised in Chapter 4. The process to determine
the design point values (x*i) of the RV‟s and their sensitivity factors for a given β is as follows:
Select β
Select initial values for basic variables
Perform FORM algorithm iterations with known β, calculating the reinforcement area until
convergence is reached.
Use Microsoft EXCEL Solver to determine the reinforcement area set as the decision
variable cell, with the limit state function set as the objective cell.
The final iteration gives the reinforcement area required and the design point values of the
basic variables for the chosen β. Sensitivity factors (being the directional cosines), αi, are
calculated in executing the FORM algorithm.
Stellenbosch University http://scholar.sun.ac.za

114
Copy results to a spreadsheet.
Generate the theoretical partial safety factors (γi) for each RV at the design point using the
equation:
γx = 1 – αx β wx
Generate graphs for γi and αi.
Analyses were performed for the flexural cracking and both tension cracking models.
6.3 RESULTS AND DISCUSSION
The results of the reverse-FORM analyses for each of the EN1992 crack models are presented
in terms of the following:
(i) Sensitivity factors (αi) indicating the influence of the RV‟s of section thickness, concrete
cover, load, concrete tensile strength and model uncertainty on the crack models.
(ii) Theoretical partial safety factors (γi) for each of the RV‟s.
(iii) Influence of reliability on the crack models.
For clarity, sensitivity factors and theoretical partial safety factors for each of the crack model
basic variables are defined as follows:
Sensitivity factor Partial Safety Factor
Liquid Load, L αL γL
Concrete cover, c αc γc
Concrete tensile strength, fct,eff αfct γfct
Section thickness, h αh γh
Model uncertainty, θ αθ γθ
6.3.1 Sensitivity of parameters
The influence of the basic variables of cover, section thickness, load, concrete tensile strength
and model uncertainty was assessed by means of the sensitivity factors (αi) generated by the
FORM analysis for given reliability index levels for both flexural and direct tension cracking. The
following was observed:
(i) Flexural Cracking
In the case of flexural cracking, the sensitivity factors indicate that load dominates over all other
variables, irrespective of the coefficient of variation of the model uncertainty, the reliability level
Stellenbosch University http://scholar.sun.ac.za

115
chosen and the crack width limit, with αL values about -0,84 to -0.99 over all β values, crack
width limits and model uncertainty CoV values chosen. Considering the physical model for
cracking, the liquid load (in units of kN) is proportional to H2 where H is the water depth, taken
as the height of the wall. Therefore it would be expected that this parameter would be of
significance. Load has a negative influence on the model, as expected. Figure 6.1 (overleaf)
showing the variation of the sensitivity factors with crack width limit and model uncertainty CoV
for a β of 1,5, illustrates the dominance of loading on the flexural cracking model. Table 6.1
below is a summary of the sensitivity factors of the basic variables obtained at a β of 1,5 for
crack width limits of 0,2 and 0,05mm and model uncertainty CoV of 0,1 and 0,3, for flexural
cracking and further illustrates the influence of loading.
Table 6.1: Sensitivity factors for flexural cracking at a β of 1,5.
wlim
(mm) θCoV αc αh αL αft αθ
0.2
0.1 -0.044 -0.017 -0.993 0.060 -0.095
0.2 -0.044 -0.017 -0.979 0.060 -0.188
0.3 -0.045 -0.016 -0.957 0.060 -0.280
0.05
0.1 -0.144 -0.029 -0.966 0.128 -0.170
0.2 -0.143 -0.028 -0.924 0.127 -0.331
0.3 -0.139 -0.027 -0.860 0.125 -0.474
Referring to Figure 6.1 and Table 6.1, model uncertainty, although less dominant than load, has
a negative influence on the flexural cracking model. This negative influence increases as crack
width limit decreases and as the model uncertainty CoV increases. The crack width, in
particular, is sensitive to model uncertainty with model uncertainty sensitivity factors increasing
by a factor of about 1,75 as the crack width decreases from 0,2 to 0,05mm.
There is little variation in each of the sensitivity factors for section thickness, concrete tensile
strength, load and cover. Concrete tensile strength has little to small influence as the crack
width limit decreases from 0,2mm to 0,05mm, with a maximum value of 0,133 at the lower crack
width limit and θCoV of 0,3. The effect of concrete cover is also small for the upper crack width
limit of 0,2mm. This parameter‟s influence increases marginally as the crack width decreases to
0,05mm. The reliability crack model is not influenced by the section thickness (taken as 450
mm) as all sensitivity factors are less than 0,1. .
Stellenbosch University http://scholar.sun.ac.za

116
(a) Concrete cover, c
(b) Liquid load, Lk
(c) Model Uncertainty, θCoV
(d) Section thickness, h
(e) Effective Concrete Tensile Strength, fct,eff
Figure 6.1: Sensitivity factors for Flexural Cracking (β of 1,5)
0.00
0.20
0.40
0.60
0.80
1.00
0.10 0.15 0.20 0.25 0.30
I α I
θcov
0.05 0.1 0.2
0.00
0.20
0.40
0.60
0.80
1.00
0.10 0.15 0.20 0.25 0.30
I α I
θcov
0.05 0.1 0.2
0.00
0.20
0.40
0.60
0.80
1.00
0.10 0.15 0.20 0.25 0.30
I α I
θcov
0.05 0.1 0.2
0.00
0.20
0.40
0.60
0.80
1.00
0.10 0.15 0.20 0.25 0.30
I α I
θcov
0.05 0.1 0.2
0.00
0.20
0.40
0.60
0.80
1.00
0.10 0.15 0.20 0.25 0.30
I α I
θcov
0.05 0.1 0.2
Stellenbosch University http://scholar.sun.ac.za

117
The sensitivity factors for section thickness and load are consistent irrespective of the limiting
crack width. Those for concrete cover and tensile strength, as well as model uncertainty,
increase as the limiting crack width decreases.
(ii) Tension cracking
In the case of tension cracking, the reliability model is found to be influenced by the geometry of
the physical model, specifically, the combination of section thickness, bar diameter and cover.
This decides the equation used to determine depth of the effective tension zone, namely, h/2 or
2,5(c + θ/2). The former tends to be limiting for thinner wall thicknesses. For a 20mm bar and a
40mm cover, 2,5(c + θ/2) is limiting for all section thicknesses greater than 250mm. As
discussed in Chapter 5, the effective depth of the tension zone, and thus the crack width, is
independent of section thickness using this equation for hc,eff. However, if the section thickness
is 250mm, combined with a 20mm bar diameter and 40mm cover, both 2,5(c + θ/2) and h/2
apply. Reverse reliability analyses were thus performed using h/2 and 2,5(c + θ/2), for a section
thickness of 250mm, 40mm cover and 20mm bar diameter.
Figures 6.2 (overleaf) and 6.3 (page 118) illustrate the variation of the sensitivity factors with
model uncertainty CoV for crack widths of 0,05, 0,1 and 0,2 mm at a reliability level of 1,5, using
hc,eff of 2,5(c + θ/2) and h/2,respectively. Table 6.2 is a summary of the sensitivity factors of the
basic variables obtained at a β of 1,5 for crack width limits of 0,2 and 0,05mm and model
uncertainty CoV of 0,1 and 0,3, for tension cracking using both equations for the effective depth
of the tension zone.
Referring to Figure 6.2 and Table 6.2 for hc,eff = 2,5(c + θ/2), the dominant variable for tension
cracking in this case is concrete cover, followed by concrete tensile strength which has a
positive influence (as expected). Model uncertainty is the next most influential variable, having a
negative effect which increases as θCoV increases.
Stellenbosch University http://scholar.sun.ac.za

118
(a) Concrete cover, c
(b) Liquid load, Lk
(c) Effective concrete tensile strength, fct,eff
(d) Model uncertainty, θCoV
Figure 6.2: Sensitivity factors for Tension Cracking with hc,eff = 2,5(c + φ/2) (β 1,5).
0.00
0.20
0.40
0.60
0.80
1.00
0.10 0.15 0.20 0.25 0.30
l αc l
θcov
0.05 0.1 0.2
0.00
0.20
0.40
0.60
0.80
1.00
0.10 0.15 0.20 0.25 0.30
l αL l
θcov
0.05 0.1 0.2
0.00
0.20
0.40
0.60
0.80
1.00
0.10 0.15 0.20 0.25 0.30
l αfct l
θcov
0.05 0.1 0.2
0.00
0.20
0.40
0.60
0.80
1.00
0.10 0.15 0.20 0.25 0.30
l αθ l
θcov
0.05 0.1 0.2
Stellenbosch University http://scholar.sun.ac.za

119
Table 6.2: Sensitivity factors for tension cracking at a β of 1,5.
hc,eff
(mm) wlim
(mm) θCoV αc αh αL αft αθ
Model 2(a)
2,5(c + θ/2)
0.2
0.1 -0.715 - -0.298 0.542 -0.324
0.2 -0.662 - -0.262 0.481 -0.561
0.3 -0.525 - -0.224 0.416 -0.708
0.05
0.1 -0.666 - -0.299 0.622 -0.284
0.2 -0.592 - -0.270 0.570 -0.501
0.3 -0.514 - -0.238 0.513 -0.645
Model 2(b)
h/2
0.2
0.1 -0.197 -0.011 -0.427 0.692 -0.539
0.2 -0.142 -0.006 -0.325 0.542 -0.762
0.3 -0.110 -0.003 -0.253 0.439 -0.855
0.05
0.1 -0.266 0.001 -0.406 0.757 -0.437
0.2 -0.206 0.003 -0.327 0.639 0.666
0.3 -0.163 0.004 -0.268 0.546 -0.777
The basic variable of load has some influence, with values between 0,22 and 0,30. Section
thickness obviously does not have any effect as it does not appear in the crack width equation
for this formulation of hc,eff. The crack model is sensitive to model uncertainty with the sensitivity
factor for model uncertainty increasing by a factor of about 2,2 as the model uncertainty
variation increases from 0,1 to 0,3.
It was also noted that the limiting crack width chosen has little effect on the sensitivity factors of
concrete cover and load. There is an increase in the sensitivity factors of concrete tensile
strength as crack width decreases, with a corresponding decrease in the sensitivity factors for
model uncertainty.
Referring to Figure 6.3 and Table 6.2 with hc,eff as h/2, the dominant variable for tension
cracking in this case depends on the value considered for the model uncertainty CoV. At the
lower limit considered for θCoV of 0,1, concrete tensile strength is the dominant variable, with
sensitivity factors greater than about 0,7. As θCoV increases to the maximum value considered of
0,3, model uncertainty becomes more influential than the concrete tensile strength. The
sensitivity factors for model uncertainty increase as the model uncertainty variation increases,
while the factors for concrete tensile strength decrease proportionately.
Stellenbosch University http://scholar.sun.ac.za

120
(a) Concrete cover, c
(b) Liquid load, Lk
(c) Model Uncertainty, θ
(d) Section thickness, h
(e) Effective concrete tensile strength, fct,eff
Figure 6.3: Sensitivity factors for Tension Cracking with hc,eff = h/2 (β of 1,5)
0.00
0.20
0.40
0.60
0.80
1.00
0.1 0.15 0.2 0.25 0.3
l αc l
θcov
0.05 0.1 0.2
0.00
0.20
0.40
0.60
0.80
1.00
0.1 0.15 0.2 0.25 0.3
l αL l
θcov
0.05 0.1 0.2
0.00
0.20
0.40
0.60
0.80
1.00
0.1 0.15 0.2 0.25 0.3
l αθ l
θcov
0.05 0.1 0.2
-0.20
0.00
0.20
0.40
0.60
0.80
1.00
0.1 0.15 0.2 0.25 0.3
l αh l
θcov
0.05 0.1 0.2
0.00
0.20
0.40
0.60
0.80
1.00
0.1 0.15 0.2 0.25 0.3
l αfct l
θcov
0.05 0.1 0.2
Stellenbosch University http://scholar.sun.ac.za

121
Referring to Figure 6.3, Load has a moderate effect on the model, depending on the value
considered for the model uncertainty variation. Concrete cover has a small influence as
sensitivity factors are between 0,11 and 0,27. Section thickness sensitivity factors are around
zero therefore this variable has a negligible influence on the reliability crack model. It was also
noted that the limiting crack width did not have any effect on the sensitivity factors of section
thickness and load. The sensitivity factors for concrete cover and tensile strength increase as
the limiting crack width decreases. Those for model uncertainty decrease as the limiting crack
width decreases.
Comparing the two formulations for hc,eff of the tension cracking model, concrete cover is
substantially more influential on the crack model using 2,5(c + θ/2) than h/2 by a factor of about
2,5 at a crack width limit of 0,05mm, and by about 3,6 at a crack width limit of 0,2mm (θCoV of
0,1). This relative influence increases as the model uncertainty variation increases. The
sensitivity factors obtained for section thickness confirm the conclusion made in Chapter 5 that
section thickness has little influence on the reliability model for tension cracking, irrespective of
the formulation of hc,eff. The conclusion that the influence of cover depends on the formulation of
the effective tension zone in concrete is also confirmed. Model uncertainty is more influential on
the tension cracking model when hc,eff is determined using h/2. However, the increase in the
influence of model uncertainty as model uncertainty variation increases is greater using hc,eff =
2,5(c + θ/2).
6.3.2 Theoretical partial safety factors
The theoretical partial safety factors for the basic variables of concrete cover, section thickness,
load, concrete tensile strength and model uncertainty were calculated for flexural and tension
load cracking using equation 4.3 of Chapter 4. The following was observed:
(i) Flexural cracking
Figure 6.4 shows the partial safety factors obtained for flexural cracking at β 1,5. In the case of
flexural cracking, although the sensitivity factors indicated that load was the most influential
basic variable, the partial safety factors for load were found to have a maximum value of 1,1 at a
β of 2,0. As shown by Figure 6.4, the values obtained for load remain relatively constant as
model uncertainty increases. The partial safety factors for cover and section thickness were
found to be about 1,0, irrespective of the β value chosen, indicating that these variables do not
require any adjustment to achieve the required reliability level.
Stellenbosch University http://scholar.sun.ac.za

122
(a) Concrete cover, c
(b) Liquid load, Lk
(c) Model uncertainty, θ
(d) Section thickness, h
(e) Effective concrete tensile strength, fct,eff
Figure 6.4: Theoretical partial safety factors for flexural cracking (β of 1,5)
0.90
1.00
1.10
1.20
1.30
0.10 0.15 0.20 0.25 0.30
γ
θcov
0.05 0.1 0.2
0.90
1.00
1.10
1.20
1.30
0.10 0.15 0.20 0.25 0.30
γ
θcov
0.05 0.1 0.2
0.90
1.00
1.10
1.20
1.30
0.10 0.15 0.20 0.25 0.30
γ
θcov
0.05 0.1 0.2
0.90
1.00
1.10
1.20
1.30
0.10 0.15 0.20 0.25 0.30
γ
θcov
0.05 0.1 0.2
0.90
1.00
1.10
1.20
1.30
0.10 0.15 0.20 0.25 0.30
γ
θcov
0.05 0.1 0.2
Stellenbosch University http://scholar.sun.ac.za

123
Within the range of crack width limits, model uncertainty CoV and β levels chosen, concrete
tensile strength, fct,eff, has a minimum partial safety factor, γfct of 0,934, where the factored value
is fct,eff. γfct. As concrete tensile strength constitutes a resistance effect on the crack model, the
factored or design value used is conventionally expressed as fct,eff. (1/γfct), that is, fct,eff/ 1,07.
The partial safety factors determined for model uncertainty increase as the variation of this
variable increases, following the trend of increasing sensitivity factors as model uncertainty
increases. At a CoV of 0,1, the partial safety factor is about 1,0, irrespective of the reliability
level and crack width limit chosen. The factor increases to 1,29 at a CoV of 0,3 (β of 2,0 and
wlim of 0,05mm). Figure 6.2(c) shows the partial safety factor increasing as model uncertainty
increases. It was also observed that the partial safety factors for model uncertainty are sensitive
to the crack width limit chosen. The smaller crack width of 0,05mm requires a higher partial
safety factor than a crack width limit of 0,2mm, namely 1,18 and 1,08, respectively for β 1,5 and
θCoV of 0,2. Specifying a more stringent crack width limit of 0,05mm therefore results in a more
conservative design than at a 0,2mm crack width limit. It appears that the crack with limit does
not have a significant effect on the other basic variables. The partial safety factors indicate that
the most influential variable on the flexural cracking model is model uncertainty.
Table 6.3 provides a summary of partial safety factors (psf) obtained for flexural cracking for
varying crack width and uncertainty variation, and further illustrates the dominant variables of
model uncertainty and liquid load.
Table 6.3: Partial safety factors for flexural cracking case at β 1,5
Theoretical partial safety factors
Load case Crack width
limit (mm)
θCoV γc γh γL γft 1/γft γθ
Flexure
0.05 0.1 1.02 1.00 1.07 0.95 1.05 1.02
0.05 0.2 1.02 1.00 1.07 0.95 1.05 1.08
0.05 0.3 1.02 1.00 1.07 0.95 1.05 1.18
0.20 0.1 1.00 1.00 1.07 0.97 1.03 1.01
0.20 0.2 1.00 1.00 1.07 0.97 1.03 1.04
0.20 0.3 1.00 1.00 1.07 0.97 1.03 1.08
Stellenbosch University http://scholar.sun.ac.za

124
With the exception of model uncertainty, it was noted that there was little or no variation in the
psf‟s of all the variables as the model uncertainty variation increased from 0,1 to 0,3. This trend
is illustrated in Table 6.3 and Figure 6.4.
(ii) Tension cracking
For the tension cracking model, Figures 6.5 and 6.6 show the partial safety factors determined
using hc,eff of 2,5(c + θ/2) and h/2, respectively, with increasing model uncertainty variation and
for crack widths of 0,2, 0,1 and 0,05 mm. Following the trend indicated by the sensitivity factors,
the magnitude of the partial safety factors for cover are influenced by the equation used for the
effective depth of the concrete tension zone. When using 2,5(c + θ/2), a maximum value of 1,23
(at β 2,0 and model uncertainty CoV of 0,1) is obtained for the partial safety factor for cover
which is larger than the maximum value of 1,05 obtained using h/2. This means that to achieve
the same reliability, the EN1992 crack model with h/2 limiting will result in a more conservative
design. Figures 6.5(a) and 6.6 (a) show the partial safety factors at a β of 1,5 using 2,5(c + θ/2)
and h/2 for hc,eff, respectively. From Figure 6.5(a) (hc,eff = 2,5(c + θ/2)), the maximum value for γc
is 1,16 whereas Figure 6.6(a) (hc,eff = h/2) shows that the maximum value for γc is 1,03. It is also
noted that γc decreases with increasing model uncertainty and is not sensitive to the crack width
limit.
The partial safety factors for load are about 1,03 for both formulations of hc,eff and is not
sensitive to increasing model uncertainty or the crack width limit. Using h/2, the safety factors
obtained for section thickness are about 1,0, following the conclusion from the sensitivity
analysis that this variable does not influence the reliability model.
The partial safety factors obtained for the concrete tensile strength, which has a positive effect
on the model, are similar for both formulations of hc,eff , such that 1/γft has values in the range of
1,0 to about 1,3. The partial safety factors for concrete tensile strength increase as model
uncertainty increases, that is, 1/γft decreases as model uncertainty increases.
Model uncertainty partial factors for tension cracking using hc,eff of 2,5(c + θ/2) are only just
greater than 1,0 for θcov of 0,1 for all crack widths, being about 1,04. The factors increase as θcov
and reliability increase, with a 0,2mm crack width requiring a slightly higher value factor
(maximum value of 1,46 at a θcov of 0,3 and β of 2,0) than the smaller crack widths of 0,1 and
Stellenbosch University http://scholar.sun.ac.za

125
(a) Concrete cover, c
(b) Liquid load, Lk
(c) Effective concrete tensile strength, fct,eff
(d) Model uncertainty, θ
Figure 6.5 : Theoretical partial safety factors for tension cracking (hc,eff = 2,5(c + φ/2)) (β 1,5)
0,05mm (maximum value of 1,44 at a θcov of 0,3 and β of 2,0). The partial safety factors
obtained using hc,eff of h/2 are marginally higher than those obtained using 2,5(c + θ) by about a
maximum of 10%. These factors are higher than those obtained for flexure as model uncertainty
is more influential for tension cracking than for flexural cracking.
The crack width limit does not have a significant effect on the partial safety factors for tension
cracking.
0.90
1.00
1.10
1.20
1.30
1.40
0.10 0.15 0.20 0.25 0.30
ϒc
θ cov
0.05 0.1 0.2
0.90
1.00
1.10
1.20
1.30
1.40
0.10 0.15 0.20 0.25 0.30
ϒL
θ cov
0.05 0.1 0.2
0.80
0.90
1.00
1.10
1.20
1.30
1.40
0.10 0.15 0.20 0.25 0.30
ϒfct
θ cov
0.05 0.1 0.2
0.90
1.00
1.10
1.20
1.30
1.40
0.10 0.15 0.20 0.25 0.30
ϒθ
θ cov
0.05 0.1 0.2
Stellenbosch University http://scholar.sun.ac.za

126
(a) Concrete cover, c
(b) Liquid load, Lk
(c) Model uncertainty, θ
(d) Section thickness, h
(e) Effective concrete tensile strength, fct,eff
Figure 6.6: Theoretical partial safety factors for tension cracking (hc,eff =h/2) (β 1,5)
0.90
1.00
1.10
1.20
1.30
1.40
0.1 0.15 0.2 0.25 0.3
γc
θcov
0.05 0.1 0.2
0.90
1.00
1.10
1.20
1.30
1.40
0.1 0.15 0.2 0.25 0.3
γL
θcov
0.05 0.1 0.2
0.90
1.00
1.10
1.20
1.30
1.40
0.1 0.15 0.2 0.25 0.3
γθ
θcov
0.05 0.1 0.2
0.90
1.00
1.10
1.20
1.30
1.40
0.1 0.15 0.2 0.25 0.3
γh
θcov
0.05 0.1 0.2
0.80
0.90
1.00
1.10
1.20
1.30
1.40
0.1 0.15 0.2 0.25 0.3
γfct
θcov
0.05 0.1 0.2
Stellenbosch University http://scholar.sun.ac.za

127
Table 6.4 provides a summary of the partial safety factors obtained at a reliability level of 1,5 for
tension cracking. The table illustrates the significant variables for tension cracking with respect
to the reliability model, namely, concrete cover, concrete tensile strength and model uncertainty.
Section thickness and liquid load are not influential in this load case, regardless of the limiting
equation for hc,eff.
Table 6.4: Summary of partial safety factors for tension cracking (β 1,5).
6.3.3 Influence of reliability level, β
The influence of the basic variables remains relatively stable over the reliability levels of 0,5, 1,5
and 2 for both flexure and tension load cases. Table 6.5, showing the sensitivity factors for
given reliability index values for a 0,2 mm crack width, illustrates this trend.
The partial safety factors obtained for flexural cracking display the same lack of variation as the
sensitivity factors as the reliability index increased from 0,5 to 2,0, as shown by the values
summarised in Table 6.6. This means that the reliability can be increased at a low cost to the
structure. The greater influence was found to be the model uncertainty, more specifically the
variation thereof.
Theoretical partial safety factors
Load case Crack
width limit (mm)
θCoV γc γh γL γft 1/γft γθ
Tension hc,eff = 2.5(c + θ)
0.05 0.1 1.15 - 1.02 0.82 1.22 1.04
0.05 0.2 1.14 - 1.02 0.84 1.19 1.14
0.05 0.3 1.11 - 1.02 0.85 1.18 1.28
0.20 0.1 1.16 - 1.02 0.84 1.19 1.05
0.20 0.2 1.14 - 1.02 0.86 1.16 1.16
0.20 0.3 1.11 - 1.02 0.87 1.15 1.32
Tension
hc,eff = h /2
0.05 0.1 1.05 1.00 1.03 0.79 1.27 1.06
0.05 0.2 1.04 1.00 1.02 0.82 1.22 1.20
0.05 0.3 1.03 1.00 1.02 0.84 1.19 1.34
0.20 0.1 1.03 1.00 1.03 0.81 1.23 1.08
0.20 0.2 1.02 1.00 1.02 0.84 1.19 1.23
0.20 0.3 1.01 1.00 1.02 0.87 1.15 1.41
Stellenbosch University http://scholar.sun.ac.za

128
Table 6.5: Influence of basic variables over varying reliability levels (wlim = 0,2mm, θcov = 0,2)
Load Case β αc αh αL αft αθ
Flexure 0.5 -0.037 -0.015 -0.983 0.058 -0.169
1.5 -0.044 -0.017 -0.979 0.060 -0.188
2.0 -0.048 -0.017 -0.977 0.061 -0.199
Tension hc,eff = 2,5(c + θ/2)
0.5 -0.617 - -0.267 0.493 -0.555
1.5 -0.662 - -0.262 0.481 -0.561
2.0 -0.624 - -0.260 0.476 -0.563
Tension hc,eff = h/2
0.5 -0.118 -0.002 -0.334 0.598 -0.719
1.5 -0.142 -0.006 -0.325 0.542 -0.762
2.0 -0.155 -0.007 -0.321 0.519 -0.777
Table 6.6: Partial safety factors for varying reliability levels (wlim = 0,2 mm, θcov = 0,2)
Load Case β γc γh γL γft 1/γft γθ
Flexure 0.5 0.992 1.000 1.025 0.977 1.024 0.997
1.5 0.999 1.000 1.073 0.966 1.035 1.037
2.0 1.003 1.000 1.098 0.960 1.041 1.061
Tension hc,eff = 2,5(c + θ/2)
0.5 1.035 - 1.007 0.937 1.067 1.036
1.5 1.137 - 1.020 0.856 1.168 1.160
2.0 1.192 - 1.026 0.820 1.220 1.228
Tension hc,eff = h/2
0.5 0.998 1.000 1.008 0.928 1.078 1.053
1.5 1.021 1.000 1.024 0.842 1.188 1.232
2.0 1.036 1.000 1.032 0.806 1.241 1.338
In the case of tension cracking, the factor for model uncertainty increases as the reliability
increases whilst that for concrete tensile strength decreases. The remainder of the basic
variables display little or no variation in the values obtained for the theoretical partial safety
factors. Model uncertainty for the tension cracking model requires further investigation to
improve the accuracy of the model.
6.4 SUMMARY
The sensitivity factors and partial safety factors were determined for each of the basic variables.
The following conclusions could be made from the reverse- FORM reliability analysis:
Stellenbosch University http://scholar.sun.ac.za

129
The sensitivity factors obtained for flexural cracking indicated that load is the dominant
variable, dominating the model with values close to 1, followed by model uncertainty.
However, when considering the partial safety factors, the most influential variable was found
to be model uncertainty with factors increasing in value as the model uncertainty variation
increased. The factors for load were about 1,03 to 1,1 for β 0,5 to 2,0.
Model uncertainty was found to be the most influential variable for tension cracking,
indicated by both the sensitivity factors and the partial safety factors. Both sensitivity factors
and partial safety factors increased with increasing model uncertainty variation. Model
uncertainty is also dependent on the limiting crack width, particularly for flexural cracking,
and the model uncertainty variation.
Section thickness has no or little effect on the crack model for both flexural and tension
cracking. This variable could therefore be considered as deterministic. Load was found to
have a small influence on the tension crack models. Concrete tensile strength was found to
be a positive influence on the crack models.
Concrete cover was found to have little influence for flexural cracking with partial safety
factors around 1,0 to 1,04. For tension cracking, the influence of cover was in turn
influenced by the limiting equation for the effective depth of the tension zone as this
determined the variables appearing in the limit state function. Using hc,eff of h/2, values of
about 1,05 to 1,0, as model uncertainty increases, were obtained for the partial safety
factors for cover. Cover was found to be more influential for tension cracking using 2,5(c +
θ/2), with higher values obtained for the partial safety factors of about 1,15 to 1,1 as model
uncertainty increases.
Higher partial safety factors for model uncertainty were required for smaller crack widths for
the flexural cracking case. However, the crack width limit did not appear to have much
influence on the partial safety factors for model uncertainty in the case of tension cracking.
For flexural cracking, the theoretical partial safety factors were not sensitive to the level of
reliability, meaning that the reliability of the crack models could be increased at a low cost to
the structure. In the case of tension cracking, the model uncertainty factor increased with
increasing level of reliability, whilst the partial safety factors for concrete tensile strength
decreased. It was established that model uncertainty requires further investigation.
Select theoretical partial safety factors calculated from the sensitivity analysis will be used in the
reliability calibration, presented in the following Chapter 7.
Stellenbosch University http://scholar.sun.ac.za
130
CHAPTER 7
RELIABILITY CALIBRATION OF PARTIAL SAFETY FACTORS
7.1. GENERAL
In formulating a design code equation from a reliability assessment basis, any design partial
safety factors to be applied and the design values of the model parameters need to be
determined and calibrated for use in that design equation such that the required structural
reliability is met. This is an optimisation process. As a first step in obtaining an optimal design
format for the EN1992 crack models, a reliability calibration analysis using theoretical partial
safety factors, determined in the reverse-FORM analysis as presented in Chapter 6, was
performed on the EN1992 crack model for the tension and flexural load cases. In this way, an
indication of possible safety factors for each of the variables of the model could be obtained.
The full optimisation process to obtain the final design format is beyond the scope of this thesis.
7.2. FORMULATION OF RELIABILITY CALIBRATION MODEL
The calibration analysis consists of a reverse- FORM analysis and was performed on the
EN1992 crack equation for the tension and flexural load cases by using the theoretical partial
safety factors (psf) determined from the reverse-FORM analyses presented in Chapter 6. The
calibration was carried out for a given level of reliability (measured as reliability index, β) and set
of values for the crack model parameters and their psf‟s. The limit state function (or
performance function) was first defined. The level of reliability and the set of values of the model
variables were then chosen. The reverse-FORM analysis was performed using Microsoft
EXCEL, in a similar manner to the reliability analyses presented in Chapter 6, for the following
models:
(iv) Model 1 - Flexural cracking
(v) Model 2(a) - Tension cracking with hc,eff = 2,5(c + θ/2)
(vi) Model 2(b) - Tension cracking with hc,eff = h/2
The analyses for each model were performed by determining the partial safety factor for model
uncertainty for given values for the remaining partial safety factors and reinforcement area. A
target level of reliability of 1,5 was used, which is the reference serviceability level considered in
this research.
Stellenbosch University http://scholar.sun.ac.za

131
The representative structural configurations used in the calibration analysis were the same as
those used in the forward and reverse-FORM analyses presented in Chapters 5 and 6.
7.2.1 Limit state function
As discussed in Chapter 4, in a design code format, partial safety factors are applied to nominal
or characteristic values of the parameters to obtain design values which are then applied in the
relevant design equation. In the case of serviceability cracking, this would be the design crack
width. The theoretical partial safety factors (γx) of the crack model variables were evaluated by
determining the probability that the design crack width, wd(Xk, γx), would be exceeded by the
random crack width, w(X), for a given reliability. The limit state function may then be written as:
g(X) = θ.w(X) - wd(Xk, γx) (7.1)
where θ is the model uncertainty modelled as a random variable.
Both the design crack width and the random crack width were determined using the basic
compatibility equation for cracking, as presented in Chapter 4, namely:
w = Sr . εm.
The crack spacing, Sr, is calculated using:
Sr = 2c + 0,25k1k2θ /ρp,eff,
The mean strain equation as given by EN1992 is:
εm= εsm
- εcm=ζs- ktfct, eff (1+ eρ eff
) /ρ eff
Es
The values for the deterministic coefficients k1, k2 and kt were as used in the previous reliability
analyses, presented in Chapters 5 and 6, that is:
k1 = 0,8 for high tensile reinforcement bond
k2 = 0,5 for bending stress distribution and 1,0 for tension
kt = 0,4 for long-term loading.
The design crack width was determined using nominal values for the parameters of the crack
width equation with safety partial factors applied. The random crack width was expressed in
terms of the basic random variables, namely, section thickness (h), concrete cover (c), liquid
load (Lk) and concrete tensile strength (fct,eff ).
Stellenbosch University http://scholar.sun.ac.za

132
7.2.2 Model parameters
In determining the random crack width, the variables of section thickness (h), concrete cover (c),
liquid load (Lk) and concrete tensile strength (fct,eff ) were modelled using their respective
probability distribution functions and mean values, as summarised in Table 7.1. All other
variables were considered as deterministic values.
With the design crack width, the design value of the effective concrete tensile strength, fct,eff, is
taken as a mean value, not characteristic, as specified by EN1992-1-1. All other parameters
were assigned nominal values, as summarised in in Table 7.1.
Values of 450 mm and 250 mm were used for section thickness for flexural and tension
cracking, respectively. Concrete cover was taken as 40mm. The wall height considered was 5m,
corresponding to the water depth, resulting in a nominal liquid load of 49,05 kN/m2.
Table 7.1: Parameters for reliability calibration of EN1992 crack model
Variable Symbol Dim PDF Characteristic Mean Std Dev.
Value μx ζx
Height of wall H m Det 5 5 0
Water pressure, Lk Lk kN/m2 N 49.05 49.05 2.453
Concrete tensile strength fc,t MPa LN 2.00 2.89 0.549
Steel modulus Es GPa Det 200 200 0
Concrete modulus, short term Ec GPa Det 27.4 27.4 0
Concrete creep factor θ - Det 1 1 0
Concrete modulus, long term Ec,eff GPa Det 13.7 13.7 0
Concrete c/s depth h mm N 450/250 450/250 4.5/2.5
Concrete c/s width b mm Det 1000 1000 0
Concrete cover c mm LN 40 40 6
Reinforcement diameter ϕ mm Det 20 0.02 0
Reinforcement area As mm2 Det Varied Varied 0
Model uncertainty θ - LN
1 0.1 – 0.3
Model uncertainty was modelled as a random variable with a lognormal distribution, mean of 1,0
and variation of 0,2. To investigate the influence of model uncertainty, its partial safety factor
was determined using a mean of 1,0 and coefficient of variation values of 0,1 and 0,3, in
additional to the reference level of 0,2.
Stellenbosch University http://scholar.sun.ac.za
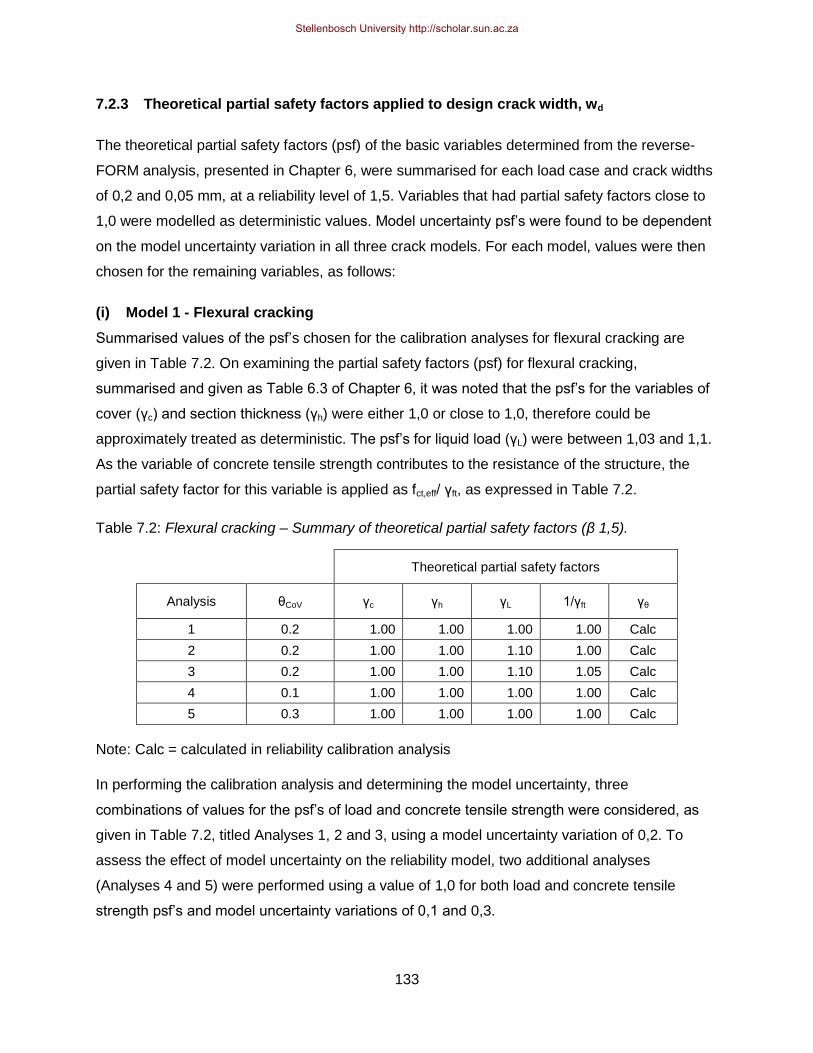
133
7.2.3 Theoretical partial safety factors applied to design crack width, wd
The theoretical partial safety factors (psf) of the basic variables determined from the reverse-
FORM analysis, presented in Chapter 6, were summarised for each load case and crack widths
of 0,2 and 0,05 mm, at a reliability level of 1,5. Variables that had partial safety factors close to
1,0 were modelled as deterministic values. Model uncertainty psf‟s were found to be dependent
on the model uncertainty variation in all three crack models. For each model, values were then
chosen for the remaining variables, as follows:
(i) Model 1 - Flexural cracking
Summarised values of the psf‟s chosen for the calibration analyses for flexural cracking are
given in Table 7.2. On examining the partial safety factors (psf) for flexural cracking,
summarised and given as Table 6.3 of Chapter 6, it was noted that the psf‟s for the variables of
cover (γc) and section thickness (γh) were either 1,0 or close to 1,0, therefore could be
approximately treated as deterministic. The psf‟s for liquid load (γL) were between 1,03 and 1,1.
As the variable of concrete tensile strength contributes to the resistance of the structure, the
partial safety factor for this variable is applied as fct,eff/ γft, as expressed in Table 7.2.
Table 7.2: Flexural cracking – Summary of theoretical partial safety factors (β 1,5).
Theoretical partial safety factors
Analysis θCoV γc γh γL 1/γft γθ
1 0.2 1.00 1.00 1.00 1.00 Calc
2 0.2 1.00 1.00 1.10 1.00 Calc
3 0.2 1.00 1.00 1.10 1.05 Calc
4 0.1 1.00 1.00 1.00 1.00 Calc
5 0.3 1.00 1.00 1.00 1.00 Calc
Note: Calc = calculated in reliability calibration analysis
In performing the calibration analysis and determining the model uncertainty, three
combinations of values for the psf‟s of load and concrete tensile strength were considered, as
given in Table 7.2, titled Analyses 1, 2 and 3, using a model uncertainty variation of 0,2. To
assess the effect of model uncertainty on the reliability model, two additional analyses
(Analyses 4 and 5) were performed using a value of 1,0 for both load and concrete tensile
strength psf‟s and model uncertainty variations of 0,1 and 0,3.
Stellenbosch University http://scholar.sun.ac.za

134
(ii) Model 2(a) – Tension cracking with hc,eff = 2,5(c + φ/2)
The summarised values for tension cracking using hc,eff = 2,5(c + θ/2) are given in Table 7.3. As
the psf‟s obtained for liquid load were close to 1,0, this variable was considered as deterministic.
Section thickness does not appear in the crack width equation therefore does not have any
influence on the model. Three combinations of values for the psf‟s of concrete cover and
concrete tensile strength were considered, namely, Analyses 1, 2 and 3 as summarised in Table
7.4 for a model uncertainty variation of 0,2.
Two additional analyses (Analyses 4 and 5) were performed using a value of 1,0 for both
concrete cover and concrete tensile strength and model uncertainty variations of 0,1 and 0,3 to
assess the effect of model uncertainty, as with flexural cracking.
Table 7.3: Tension cracking, hc,eff = 2,5(c + φ/2) - Summary of theoretical partial safety factors (β 1,5).
Theoretical partial safety factors
Analysis θCoV γc γh γL 1/γft γθ
1 0.2 1.00 - 1.00 1.00 Calc
2 0.2 1.10 - 1.00 1.15 Calc
3 0.2 1.10 - 1.00 1.25 Calc
4 0.1 1.00 - 1.00 1.00 Calc
5 0.3 1.00 - 1.00 1.00 Calc
Note: Calc = calculated in reliability calibration analysis
(iii) Model 2(b) - Tension cracking with hc,eff = h/2
The summarised values for tension cracking using hc,eff = h/2 are given in Table 7.4. As the psf‟s
obtained for liquid load and section thickness were close to 1,0, these variables were
considered as deterministic. In performing the calibration analysis and determining the model
uncertainty, three combinations of values for the psf‟s of concrete cover and concrete tensile
strength were considered (Analyses 1, 2 and 3 given in Table 7.4) for a model uncertainty
variation of 0,2.
To assess the effect of model uncertainty, two additional analyses (Analyses 4 and 5) were
performed using a value of 1,0 for both concrete cover and concrete tensile strength partial
safety factors and values of 0,1 and 0,3 for the model uncertainty variation.
Stellenbosch University http://scholar.sun.ac.za
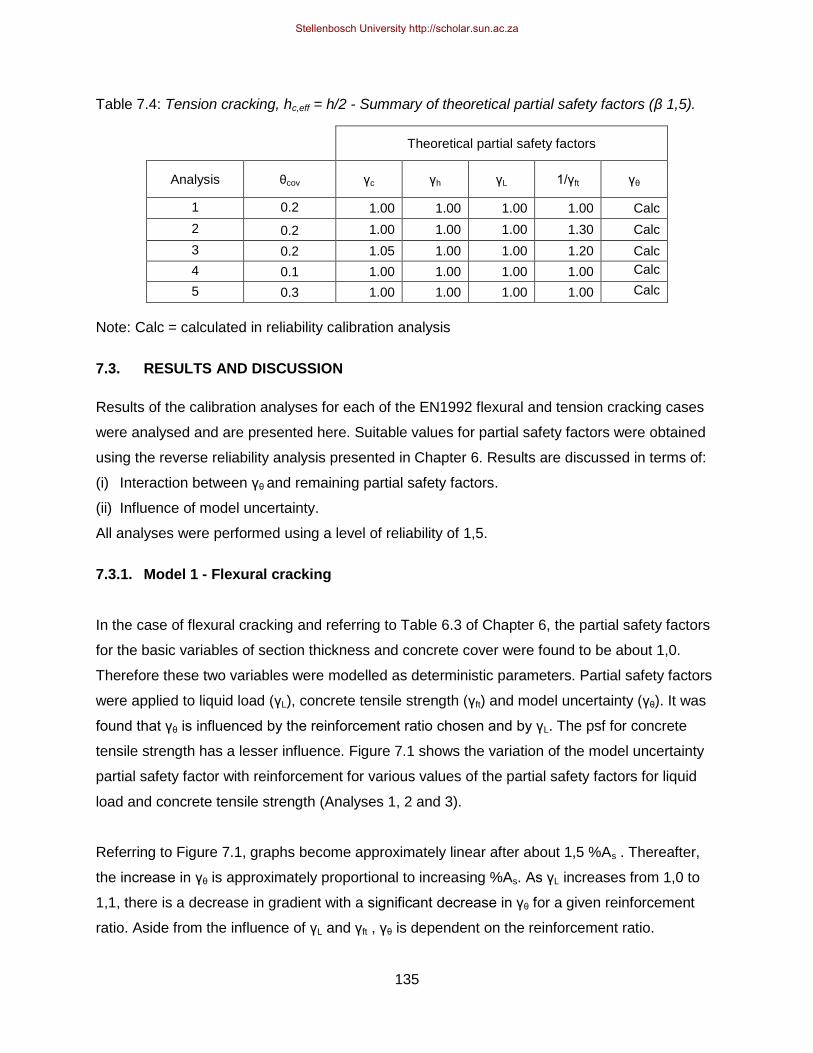
135
Table 7.4: Tension cracking, hc,eff = h/2 - Summary of theoretical partial safety factors (β 1,5).
Theoretical partial safety factors
Analysis θcov γc γh γL 1/γft γθ
1 0.2 1.00 1.00 1.00 1.00 Calc
2 0.2 1.00 1.00 1.00 1.30 Calc
3 0.2 1.05 1.00 1.00 1.20 Calc
4 0.1 1.00 1.00 1.00 1.00 Calc
5 0.3 1.00 1.00 1.00 1.00 Calc
Note: Calc = calculated in reliability calibration analysis
7.3. RESULTS AND DISCUSSION
Results of the calibration analyses for each of the EN1992 flexural and tension cracking cases
were analysed and are presented here. Suitable values for partial safety factors were obtained
using the reverse reliability analysis presented in Chapter 6. Results are discussed in terms of:
(i) Interaction between γθ and remaining partial safety factors.
(ii) Influence of model uncertainty.
All analyses were performed using a level of reliability of 1,5.
7.3.1. Model 1 - Flexural cracking
In the case of flexural cracking and referring to Table 6.3 of Chapter 6, the partial safety factors
for the basic variables of section thickness and concrete cover were found to be about 1,0.
Therefore these two variables were modelled as deterministic parameters. Partial safety factors
were applied to liquid load (γL), concrete tensile strength (γft) and model uncertainty (γθ). It was
found that γθ is influenced by the reinforcement ratio chosen and by γL. The psf for concrete
tensile strength has a lesser influence. Figure 7.1 shows the variation of the model uncertainty
partial safety factor with reinforcement for various values of the partial safety factors for liquid
load and concrete tensile strength (Analyses 1, 2 and 3).
Referring to Figure 7.1, graphs become approximately linear after about 1,5 %As . Thereafter,
the increase in γθ is approximately proportional to increasing %As. As γL increases from 1,0 to
1,1, there is a decrease in gradient with a significant decrease in γθ for a given reinforcement
ratio. Aside from the influence of γL and γft , γθ is dependent on the reinforcement ratio.
Stellenbosch University http://scholar.sun.ac.za
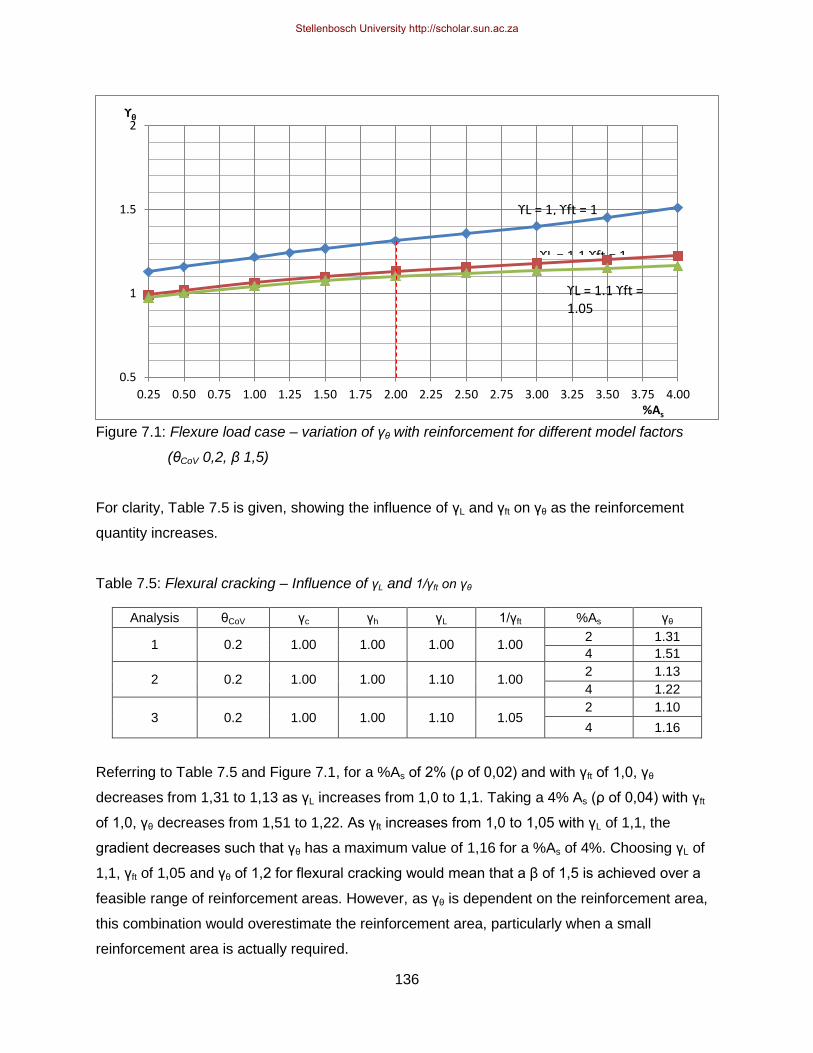
136
Figure 7.1: Flexure load case – variation of γθ with reinforcement for different model factors
(θCoV 0,2, β 1,5)
For clarity, Table 7.5 is given, showing the influence of γL and γft on γθ as the reinforcement
quantity increases.
Table 7.5: Flexural cracking – Influence of γL and 1/γft on γθ
Analysis θCoV γc γh γL 1/γft %As γθ
1 0.2 1.00 1.00 1.00 1.00 2 1.31
4 1.51
2 0.2 1.00 1.00 1.10 1.00 2 1.13
4 1.22
3 0.2 1.00 1.00 1.10 1.05 2 1.10
4 1.16
Referring to Table 7.5 and Figure 7.1, for a %As of 2% (ρ of 0,02) and with γft of 1,0, γθ
decreases from 1,31 to 1,13 as γL increases from 1,0 to 1,1. Taking a 4% As (ρ of 0,04) with γft
of 1,0, γθ decreases from 1,51 to 1,22. As γft increases from 1,0 to 1,05 with γL of 1,1, the
gradient decreases such that γθ has a maximum value of 1,16 for a %As of 4%. Choosing γL of
1,1, γft of 1,05 and γθ of 1,2 for flexural cracking would mean that a β of 1,5 is achieved over a
feasible range of reinforcement areas. However, as γθ is dependent on the reinforcement area,
this combination would overestimate the reinforcement area, particularly when a small
reinforcement area is actually required.
0.5
1
1.5
2
0.25 0.50 0.75 1.00 1.25 1.50 1.75 2.00 2.25 2.50 2.75 3.00 3.25 3.50 3.75 4.00
ϒθ
%As
ϒL = 1, ϒft = 1
ϒL = 1.1 ϒft = 1
ϒL = 1.1 ϒft = 1.05
Stellenbosch University http://scholar.sun.ac.za

137
Figure 7.2 shows the variation of γθ with %As as model uncertainty variation increases from 0,1
to 0,3 (Analyses 3, 4 and 5). Values of 1,0 for all partial safety factors except model uncertainty
were used. Model uncertainty variations of 0,1, 0,2 and 0,3 were chosen. The values thus
obtained for γθ indicate the degree of uncertainty in the reliability crack model over and above
that dealt with by means of the variation of each of the basic variables. Figure 7.2 shows that as
model uncertainty variation increases, γθ increases substantially for a given %As, as would be
expected, and as %As increases. Conversely, it can be stated that the reinforcement area is
significantly influenced by uncertainty in the crack model. Referring to Figure 7.2, increasing
values of 1,43, 1,51 and 1,64 were obtained for model uncertainty variations of 0,1, 0,2 and 0,3,
respectively, at a reinforcement area of 4%.
Figure 7.2: Flexure load case – variation of γθ with reinforcement as θCoV varies and model
factors of 1,0 (β 1,5)
7.3.2. Model 2a - Tension cracking with hc,eff = 2,5(c + φ/2)
For tension cracking such that hc,eff = 2,5(c + θ/2), and referring to Table 6.4 of Chapter 6, the
partial safety factors for liquid load were found to be about 1,0. Liquid load was therefore
modelled as a deterministic parameter. Partial safety factors were applied to concrete cover,
concrete tensile strength and model uncertainty. Figure 7.3 shows the variation of γθ with %As
for various combinations of γc and γft for tension cracking using hc,eff = 2,5(c + θ/2). The partial
safety factors for both concrete cover (γc) and concrete tensile strength (γft) were found to
0.5
1
1.5
2
0.25 0.50 0.75 1.00 1.25 1.50 1.75 2.00 2.25 2.50 2.75 3.00 3.25 3.50 3.75 4.00
ϒθ
%As
cov 0.2
cov 0.1
cov 0.3
Stellenbosch University http://scholar.sun.ac.za

138
influence the values obtained for γθ. For γc = 1.1 with γ
ft = 1.15, γθ varies between 1,22 and 1,29
for reinforcement areas of 0,25% to 4%. When γc = 1.1 and γ
ft = 1.25, γθ is fairly constant at a
value of about 1,15 over the same %As range, and is thus is nearly independent of the
reinforcement ratio. When γc and γ
ft are 1,0, γθ is has a greater value, namely,1,39 at %As of
0.25%, increasing with increasing %As.
Figure 7.3: Tension Cracking (hc,eff =2,5(c + φ/2)) – variation of γθ with reinforcement for different
model factors (θCoV 0,2, β 1,5)
To assess the influence of model uncertainty, γc and γ
ft were taken as 1,0 for model uncertainty
variations (θCoV) of 0,1, 0,2 and 0,3, as in the case of flexural cracking. Figure 7.4 shows the
variation of γθ with reinforcement as θCoV varies. For all values of model uncertainty variation, γθ
increases at a similar rate with increasing %As. As model uncertainty variation increases, a
significant increase in γθ is required to achieve the reliability level of 1,5. Referring to Figure 7.4,
considering a %As of 0,25%, γθ has values of 1,27, 1,37 and 1,54 for θCoV of 0,1, 0,2 and 0,3,
respectively. These values increase to 1,56, 1,65 and 1,78 for θCoV of 0,1, 0,2 and 0,3,
respectively, as %As increases to 4%. The values required for γθ are all greater than 1,27 and
thus indicate that the influence of model uncertainty is significant for tension cracking with hc,eff =
2,5(c + θ/2).
0.50
1.00
1.50
2.00
0.25 0.5 0.75 1 1.25 1.5 1.75 2 2.25 2.5 2.75 3 3.25 3.5 3.75 4
ϒθ
%As
ϒc = 1, ϒft = 1
ϒc = 1.1, ϒft = 1.15
ϒc= 1.1, ϒft = 1.25
1.65
1.22 1.29
1.16 1.14
1.39
Stellenbosch University http://scholar.sun.ac.za

139
Figure 7.7: Tension cracking (hc,eff =2,5(c + φ/2)) - variation of γθ with reinforcement and θCoV,
model factors of 1,0.
7.3.3. Model 2b - Tension cracking with hc,eff = h/2
As in the case of tension cracking with hc,eff = 2,5(c + θ/2), liquid load was taken as a
deterministic parameter as the partial safety factors obtained for liquid load were found to be
about 1,0 (refer to Table 6.4 of Chapter 6). The partial safety factors obtained for concrete cover
were less when using hc,eff as h/2 than 2,5(c + θ/2), whilst those for concrete tensile strength
were found to be higher. Figure 7.5 shows the variation of γθ with %As for various combinations
of γc and γft for tension cracking using h/2 for hc,eff.
Considering γc of 1 and γft of 1,3, γθ is nearly constant at about 1,28 as %As increases. This
combination of psf‟s could be therefore applied to tension cracking (hc,eff of h/2) for β 1,5 as this
is independent of the reinforcement area. When γc is increased to 1,05 and γft is 1,2, γθ
decreases to about 1,23 for a %As of 0,25% with a further small decrease to about 1,19 as %As
increases to 4%. Considering γc and γft of 1, γθ increases from 1,44 to 1,75 as the reinforcement
area increases from 0,25% to 4%.
When the calibration analysis was performed for model uncertainty variations of 0,1, 0,2 and
0,3, as in the two previous crack models, and γc and γft equal to 1, γθ increases with increasing
model uncertainty variation and %As. This trend is illustrated by Figure 7.6, showing the
variation of γθ with %As as model uncertainty variation increases.
0.5
1
1.5
2
0.25 0.5 0.75 1 1.25 1.5 1.75 2 2.25 2.5 2.75 3 3.25 3.5 3.75 4
ϒθ
%As
θcov 0.2 θcov 0.1
θcov 0.3 1.78
1.65
1.56 1.54
1.39
1.27
Stellenbosch University http://scholar.sun.ac.za

140
Figure 7.5: Tension cracking (hc,eff = h/2) - variation of γθ with reinforcement for different model
factors (θCoV 0,2, β 1,5)
Figure 7.6: Tension cracking (hc,eff = h/2) - variation of γθ with reinforcement as θCoV varies,
model factors of 1,0.
Referring to Figure 7.6, at a %As of 0,25%, γθ increases from 1,31 to1,6 as model uncertainty
variation increases from 0,1 to 0,3. For a %As of 4%, γθ increases from 1,64 to1,89 as model
uncertainty variation increases from 0,1 to 0,3. The values obtained for γθ are higher when
hc,eff is h/2 than when 2,5(c + θ/2) is limiting. All values obtained for γθ, irrespective of model
uncertainty variation, are greater than about 1,3, indicating that model uncertainty has a
significant influence on the crack model.
0.5
1
1.5
2
0.25 0.50 0.75 1.00 1.25 1.50 1.75 2.00 2.25 2.50 2.75 3.00 3.25 3.50 3.75 4.00
ϒθ
%As
ϒc = 1, ϒft = 1
ϒc = 1, ϒft = 1.3
ϒc = 1.05, ϒft = 1.2
1.75
1.44
1.23 1.19
1.28 1.28
0.5
1
1.5
2
0.25 0.50 0.75 1.00 1.25 1.50 1.75 2.00 2.25 2.50 2.75 3.00 3.25 3.50 3.75 4.00
ϒθ
%As
θcov 0.2
θcov 0.1
θcov 0.3 1.6
1.31
1.8
1.64
Stellenbosch University http://scholar.sun.ac.za

141
Comparing the two models for tension cracking, referring to Figures 7.3 and 7.5, the following
combinations of partial safety factors are independent of reinforcement area (θCoV of 0,2):
(i) hc,eff = 2,5(c + θ/2): γft = 1,30 γc = 1,0 γθ = 1,28
(ii) hc,eff = h/2: γft = 1,25 γc = 1,0 γθ = 1,15
Values for these partial safety factors are similar enough to be refined to obtain one scheme for
tension cracking without introducing undue conservatism into the design equation.
To compare flexural and tension cracking models, consider a value of 1,0 for all partial safety
factors except model uncertainty, as the influencing variables in each load case are not the
same. Referring to Table 7.5 and Figures 7.3 and 7.5, the following values for model uncertainty
partial safety factors were thus determined for a reinforcement area of 4% (θCoV of 0,2):
(i) Flexural cracking γθ = 1,51
(ii) Tension cracking, hc,eff = 2,5(c + θ/2) γθ = 1,65
(iii) Tension cracking, hc,eff = h/2 γθ = 1,75
Given the differences in γθ between tension and flexural cracking, further research is required if
one partial safety factor scheme is to be applied to all load cases, such that undue conservatism
is not introduced into the design model.
Effectively applying a psf to model uncertainty only (such that all other psf‟s are equal to 1)
equates to a single model factor being applied to the crack equation. The γθ obtained above can
be compared to the empirical factor of 1,7 applied to the crack width equation to obtain the
EN1992 design characteristic crack width (as discussed in Section 4.5). For a model uncertainty
variation of 0,2 and 4% As, the EN1992 design equation leads to overdesign when considering
flexural cracking. For tension cracking, there is a better correlation, depending on the
formulation of the crack model.
7.4. SUMMARY
The aim of the calibration analysis presented in this chapter was not to produce the final partial
safety factors to be applied to the design crack width, but to investigate different feasible
combinations of partial safety factors (psf) applied to the basic variables to access their effect on
the crack models. Feasible partial safety factors for model uncertainty, indicating the influence
of this variable, were of particular interest. As in the previous reliability analyses presented in
Chapters 5 and 6, model uncertainty was modelled as a basic variable, with a lognormal
Stellenbosch University http://scholar.sun.ac.za

142
probability distribution function, mean of 1,0 and variation of 0,1 to 0,3. A β of 1,5 was chosen
as the level of reliability.
The following conclusions were made:
Model uncertainty is more critical for tension cracking than flexural cracking, having a
significant influence on the tension crack model, with psf‟s obtained greater than about 1,1
for a model uncertainty variation of 0,2. For flexural cracking, model uncertainty partial
safety factors were found to be around 1,0 for smaller reinforcement areas. However, as
noted in Chapter 6, the values obtained for the partial safety factors depend on the model
uncertainty variation chosen, with values increasing as uncertainty increased. Further
research is required to improve the data on model uncertainty of the crack model applied to
South African conditions.
If all other partial safety factors are assigned values of 1,0, the model uncertainty partial
safety factor and the reinforcement required are interdependent, irrespective of the load
case. The model uncertainty partial safety factor for flexural cracking was influenced
significantly by both model uncertainty variation and reinforcement area.
The partial safety factors obtained for the basic variables of concrete cover, concrete tensile
strength and liquid load are different for each load case using the same general EN1992
crack equation, as the influence of each variable on the crack model is dependent on the
particular load case. One partial safety factor scheme applied to all crack models would then
by necessity be conservative if the desired reliability level is to be achieved. Further
research, applied using South African design values, is required to refine the crack models
and devise a reasonable combination of partial safety factors that to be applied to the design
equation for crack width, irrespective of the load case.
The flexural cracking model is dominated by liquid load, depending on the model uncertainty
variation. A partial safety factor of 1,1 for liquid load appears to be reasonable to achieve the
required reliability, resulting in a maximum partial safety factor of 1,23 (for γft of 1,0) although
further research is required to refine this value.
Tension cracking with hc,eff as h/2 is more conservative case than when 2,5(c + θ/2) is
limiting in that a higher γθ is required in the former to achieve the same level of reliability.
However, values obtained for the partial safety factors are similar enough that a common
partial safety factor scheme could be developed for tension cracking.
Stellenbosch University http://scholar.sun.ac.za

143
CHAPTER 8
FINAL SUMMARY AND CONCLUSIONS
8.1 General
A summary of the findings over the course of this research is presented in this chapter. The
research was initially conducted to investigate concrete cracking in South African reinforced
concrete water retaining structures (WRS), in particular, load-induced cracking (flexure and
direct tension). As the updating of South African structural design codes of practice is currently
being done such that they are compatible with Eurocode standards, the focus of the research
was on current practices in South Africa regarding WRS and on the relevant Eurocode
standards that may be used.
In the process of the research, three main issues were identified, namely:
(i) The importance and dominance of the serviceability limit state of cracking over ultimate
limit state loading in the case of WRS. This is of significance in establishing an
appropriate level of reliability for serviceability cracking.
(ii) Eurocode was found to have a more stringent limiting crack width of 0,05mm, as
opposed to 0,1mm to BS8007. The implications of this on the design and construction of
WRS in South Africa was then researched.
(iii) Model uncertainty with respect to load-induced cracking in WRS was not well
established.
Research into these three key issues identified took the form of:
(i) A literature and industry review on cracking and related topics in reinforced concrete.
(ii) A deterministic analysis of the load-induced cracking models to BS8007 (1987) and
EN1992-3 (2006).
(iii) A reliability study of the load-induced cracking models to EN1992-3, consisting of a FORM
analysis, a sensitivity analysis and a reliability calibration.
Chapter 2 presented the literature review and investigation into current industry practices in
South Africa for serviceability cracking with respect to reinforced concrete WRS. This confirmed
Stellenbosch University http://scholar.sun.ac.za

144
that current design practice in South Africa is the use of BS8007. The design equations and
general parameters used in industry to calculate SLS load-induced crack widths to EN1992 and
BS8007 were established. The structural configurations resulting in the worst loading case for
either direct tension or flexural cracking were investigated. The wall of a reservoir was identified
as a critical design element. The structural configuration that results in the greatest flexural load
was found to be a wall section of a large rectangular reservoir under loading due to water
pressure, inducing a bending moment about a horizontal axis. In the direct tension load case, a
section of wall in a circular reservoir under hoop stress due to water pressure was ascertained
to be a critical configuration. Important parameters considered in the crack model were found to
be cover, section thickness and load due to water pressure. The limiting crack width was found
to be 0,05 mm for Eurocode which is more stringent than BS8007 (having a general 0,2 mm
limit which may be reduced to 0,1 mm).
A deterministic analysis, presented in Chapter 3, of the EN1992 and BS8007 crack formulations
was performed with respect to flexural and tension cracking due to loading. A representative
configuration of a typical WRS was chosen for both load cracking conditions, namely, a
rectangular reservoir wall in the case of flexural cracking and a circular reservoir for the tension
cracking condition. In addition to comparing BS8007 and EN1992, the deterministic analysis
was used in aiding the selection of a representative set of values for the reliability analyses.
Parameters considered were section thickness, wall height, concrete cover and reinforcement
bar diameter.
The reliability analysis of the EN1992 crack model made use of the First Order Reliability
Method (FORM) and consisted of three sets of analysis. This took the form of:
(i) A literature review of reliability analysis with emphasis on load-induced reinforced
concrete cracking.
(ii) A FORM analysis
(iii) A sensitivity analysis using reverse-FORM
(iv) Calibration of the reliability crack model
The literature review, as summarised by Chapter 4, was first done to properly formulate the
reliability model of the EN1992 crack equation using available knowledge. Using the information
gathered from the literature review, model uncertainty in the model was treated as a random
variable. The FORM analysis, presented in Chapter 5, was then performed. The influence of the
Stellenbosch University http://scholar.sun.ac.za

145
specified crack width limit, the reliability of the EN1992-1-1 model and the influence of SLS
cracking were explored. Model uncertainty in the crack model was also investigated.
Using reverse-FORM, a sensitivity analysis was done (Chapter 6) to assess the influence of the
basic variables of liquid load, concrete cover, concrete tensile strength, section thickness and
model uncertainty on the crack model. The theoretical partial safety factors for each of the
variables were calculated for a given set of values for the parameters of the crack model. In
addition, the influence of the reliability level was investigated. The calibration analysis presented
in Chapter 7 looked at different feasible combinations of partial safety factors applied to a given
set of values for the basic variables. A β of 1,5 was chosen as the level of reliability.
8.2 Conclusions
Final conclusions are now discussed with respect to the crack width limit, model uncertainty of
the EN1992 crack model and the reliability of the EN1992 crack model.
8.2.1 Crack width limit
EN1992-3 specifies a range of crack width limits from 0,2 mm to 0,05 mm for through-cracks,
depending on the hydraulic ratio which in turn is dependent on the wall geometry. A decreasing
limiting crack width results in a substantial increase in reinforcement and increase in section
geometry for both flexural and tension cracking, with a negative effect on the cost to structure
on moving from the use of BS8007 to EN1992 in the design of WRS. One of the findings of the
deterministic analysis (Chapter 3) was that EN1992 was more conservative than BS8007 by a
factor of about 1,1 for flexural cracking and about 1,6 for tension cracking, for a crack width limit
of 0,2 mm. This conservatism is exacerbated by the negative effects of a more stringent crack
width limit in the case of tension cracking. EN1992 was found to be more demanding than
BS8007 at a crack width limit of 0,1 mm by a factor of about 2,2. Comparisons could not be
made for a crack width limit of 0,05 mm as BS8007 does not make provision for this crack width
limit.
On performing the FORM analysis, as discussed in Chapter 5, it was found that the crack width
limit has a significant effect on the probabilistic models for both flexural and tension cracking,
namely, an increase in reinforcement required and a decrease in reliability, that is, a decrease in
the performance of the structure, as the crack width limit reduces.
Stellenbosch University http://scholar.sun.ac.za

146
Higher partial safety factors for model uncertainty were required for smaller crack widths for the
flexural cracking case, as reported in Chapter 6. However, the crack width limit did not appear to
have much influence on the partial safety factors for model uncertainty in the case of tension
cracking.
8.2.2 Reliability of EN1992 crack model
The deterministic and the reliability analyses showed that the serviceability limit state of
cracking dominates the design of a WRS rather than the ultimate limit state of loading,
particularly for tension cracking and smaller crack widths. This emphasizes the importance of
optimizing the design of a WRS for serviceability cracking. The EN1992-1 crack model had not
previously been examined in reliability terms with respect to WRS in South Africa, providing
motivation for the probabilistic analysis component of this research. A SLS reliability β of 1,5 for
a reference period of 50 years was used as the reference level in the reliability study in keeping
with SANS10160-1.
The deterministic analysis was found to be more conservative than the probabilistic analysis for
both flexural and tension crack models at a reliability level of 1,5 (Chapter 5) by factors of 1,29
to 1,27 for flexural cracking and 1,27 to 1,44 for tension cracking, using a model uncertainty
variation of 0,2 and limiting crack widths from 0,2 mm to 0,05 mm, respectively. This suggests
that there are potential savings to be made for load-induced cracking conditions using reliability
design at this level of reliability. This supports the conclusion that Holicky et al (2009) made
from their investigation into the tension cracking case.
On performing the sensitivity analysis (Chapter 6), it was found that in the case of flexural
cracking, except for model uncertainty, the partial safety factors (psf) of the basic variables were
relatively insensitive to a changing reliability level. This means that the level of reliability can be
increased at a low cost to structure, depending on the model uncertainty variation. For tension
cracking, the level of reliability influenced the psf‟s for model uncertainty and concrete tensile
strength
It was discovered (Chapter 5) that the reliability model for tension load cracking is influenced by
the geometry of the member considered, in particular, the combination of section thickness (h),
bar diameter (θ) and concrete cover (c) chosen. This in turn affects which equation is limiting in
calculating the effective depth of the tension zone, hc,eff, being either h/2 or 2,5(c + θ/2). When
Stellenbosch University http://scholar.sun.ac.za

147
both equations apply for a particular combination of cover, bar diameter and section thickness,
the reliability obtained using h/2 was less than when using 2,5(c + θ/2). On undertaking the
sensitivity analysis (Chapter 6), a higher model uncertainty psf (γθ) was required when hc,eff of
h/2 is limiting to achieve the same level of reliability. However, values obtained for the psf‟s
were similar enough that a common partial safety factor scheme could be developed for tension
cracking.
The partial safety factors obtained from the sensitivity analysis (Chapter 6) for the basic
variables of concrete cover, concrete tensile strength and liquid load were different for each load
case using the same general EN1992 crack equation, as the influence of each variable on the
crack model is dependent on the particular load case. One partial safety factor scheme applied
to all crack models would then, by necessity, be conservative. The reliability analysis showed
that the flexural cracking model is dominated by liquid load. A partial safety factor of 1,1 for
liquid load appeared to be reasonable to achieve the required reliability level of β 1,5, resulting
in a maximum partial safety factor of about 1,22 (for γft of 1,0) although further research is
required to refine this value.
For tension cracking, the influence of concrete cover was dependent on the limiting equation for
the effective depth of the tension zone as this determined the variables appearing in the limit
state function. Using hc,eff of h/2, values of about 1,05 to 1,0 were obtained for the partial safety
factors for cover as model uncertainty variation increased. Concrete cover was found to be
more influential in the model for tension cracking using 2,5(c + θ/2), with higher values obtained
for the partial safety factors of about 1,15 to 1,1 as model uncertainty increases.
8.2.3. Model uncertainty in EN1992 crack model
Previous research done on cracking in concrete tended to be for a specific structural and
loading configuration with crack models having been largely developed empirically. In addition,
as cracking is a random phenomenon which results in a wide variation in results, it is difficult to
generalise a crack model for all cracking cases. The uncertainty in the crack models is thus not
really known with limited data available. From the FORM analysis (Chapter 5), model
uncertainty was found to have some effect on the reliability of the model, particularly for the
tension cracking case. Further investigation by means of the sensitivity analysis (Chapter 6)
indicated that in the case of flexural cracking, load is the most influential variable, dominating
the model with sensitivity factors close to 1, followed by model uncertainty. When considering
Stellenbosch University http://scholar.sun.ac.za

148
the partial safety factors, the dominant variable was found to be load at a lower model
uncertainty variation. As model uncertainty variation increased, model uncertainty became
dominant with factors increasing in value as the model uncertainty variation increased. The
factors for load had values of about 1,02 to a maximum value of 1,1.
Model uncertainty was found to be the most influential variable for tension cracking, shown in
both the FORM analysis and the sensitivity analysis. Both the sensitivity factors and partial
safety factors increased with increasing model uncertainty variation. Partial safety factors
obtained for model uncertainty had values greater than 1,15. Model uncertainty was found to be
dependent on the limiting crack width, particularly for flexural cracking, and the model
uncertainty variation chosen.
On performing the reliability calibration, (Chapter 7), it was noted that if all other partial safety
factors are assigned values of 1,0, the model uncertainty partial safety factor (γθ) and the
reinforcement area obtained are interdependent, irrespective of the load case. The model
uncertainty variation was found to affect γθ, with values increasing as uncertainty increased. The
model uncertainty partial safety factor for flexural cracking was influenced significantly by both
model uncertainty variation and reinforcement area.
In summary, model uncertainty as a basic variable in the reliability model is interdependent with
the reliability level, the coefficient of variation used for model uncertainty, and to a lesser extent
the crack width chosen.
8.3 Recommendations for further research
From this research, several recommendations for further research can be made, as discussed
as follows:
The crack width limit has a significant influence on the reliability and design of a WRS. Given
the difference in the lower limit used by EN1992 as determined by the hydraulic ratio, further
research is suggested to determine an appropriate limiting crack width, in particular on the
topic of autogenous healing.
The model uncertainty in the EN1992 currently has been dealt with empirically rather than in
reliability terms, and has thus not really been quantified. A comparison of the probabilistic
Stellenbosch University http://scholar.sun.ac.za

149
analysis to experimental data on flexural and tension cracking would be useful in improving
statistical data for crack models and their related model uncertainty.
A cost optimisation analysis is recommended to obtain the best reliability to cost ratio for
serviceability cracking.
Further research using South African design values, would refine the crack models and aid
in devising a reasonable combination of partial safety factors that could be applied to the
design equation for crack width, irrespective of the load case.
Stellenbosch University http://scholar.sun.ac.za

150
REFERENCES
1. Allen AH (1983). Autogenous healing. Seminar on design of concrete water
retaining structures to BS 5337 held by the Division of Hydraulic and Water
Engineering of the South African Institution of Civil Engineers in association with
the Concrete Society of South Africa.
2. Anchor RD, Hill AW, Hughes BP. (1983). Handbook on BS 5337:1976 (The
structural use of concrete for retaining aqueous liquids. 2nd Edition. Viewpoint
Publications.
3. Ang AH-S, Tang WT (1990). Probability concepts in engineering planning and
design. Volume II – Decision, risk and reliability. John Wiley & Sons. ISBN 0-
471-03201-8
4. Batty I, Westbrook W (1991). The design of water-retaining structures.
Longman.
5. Beeby, AW (2004). The influence of the parameter φ/ρeff on crack widths.
Structural Concrete (2004) 5 No.2, pgs 71 – 83.
6. Beeby AW, Narayanan RS (1993). Designer’s handbook to Eurocode 2: Part1.1
Design of concrete structures. Thomas Telford.
7. Bhatt P, MacGinley TJ, Choo BS (2006). Reinforced concrete design theory and
examples. (3rd Edition). Taylor and Francis.
8. Borosnyoi A, Balazs GL (2005). Models for flexural cracking in concrete: the
state of the art. Structural Concrete 2005 Vol 6 No.2 pgs 53 – 62.
9. Bowles L (2012). Personal communication. Umgeni Water, Durban, KwaZulu-
Natal, South Africa.
10. BS EN 1990: Eurocode 0: Basis of structural design. BSI 2002.
11. BS EN 1992-1: Eurocode 2: Design of concrete structures – Part 1: General
requirements. BSI 2004.
12. BS EN 1992-3: Eurocode 2: Design of Concrete Structures – Part 3: Liquid
Retaining and Containment Structures, BSI 2006.
13. BS8007: British Standards Code of Practice for the Design of Concrete
Structures for Retaining Aqueous Liquids, BSI 1987.
14. Eckfeldt, L (2009). Answers on open questions from Innesbruck and small crack
width research – what could be of importance for the NMC? Presentation, fib
TG4.1 Serviceability models, Kassel April 2009. Civil Engineering Institute of
Concrete Structures.
Stellenbosch University http://scholar.sun.ac.za

151
15. Eckfeldt, L (2011). E-mail personal communication, March 2011, subject fib
Journal outline and MC 2010 information. Academic staff, Faculty 2
Architecture, Civil Engineering and Urban Planning, BTU Cottbus, Germany,
24 March 2010.
16. Eckfeldt, L (2012). E-mail personal communication, November 2011, subject fib
Journal outline and MC 2010 information.
17. Eurocode 2 Commentary (2008). European Concrete Platform ASBL 2008.
Editor J-P Jacobs.
18. Faber M, Vrouwenvelder ACWM (2000). Probabilistic model code. 12th Draft.
Joint Committee of Structural Safety.
19. Faber M, Vrouwenvelder ACWM (2008). Interpretation of uncertainties and
probabilities in civil engineering decision analysis. Background documents on
risk assessment in engineering. Document No.2. Joint Committee of Structural
Safety.
20. Gulvanessian H, Holický M (2005). Eurocodes: using reliability analysis to
combine action effects. Proceedings of the Institute of Civil Engineers.
Structures and Buildings 158. August 2005, Issue SB4, pgs 243 – 252.
21. Handbook 1: Basis of structural design. Guide to interpretive documents for
essential requirements, to EN1990 and to application and use of Eurocodes.
Leonardo da Vinci pilot project CZ/02/B/F/PP-134007.
22. Holický M (2009). Reliability analysis for structural design. Sun Press.
Stellenbosch, South Africa. ISBN 978-1-920338-11-4.
23. Holický M, Retief JV (2005). Reliability assessment of alternative Eurocode and
South African load combination schemes for structural design. Journal of the
South African Institute of Civil Engineering. Vol 47 No. 1, 2005, pgs 15 – 20.
24. Holický M, Retief JV & Wium JA (2009). Probabilistic design for cracking of
concrete structures. Proceedings of the 7th International Probabilistic Workshop,
Delft 2009. Van Gelder, Proske & Vrijling.
25. Holický M, Retief JV & Wium JA (2010). Partial factors for selected reinforced
concrete members: Background to a revision of SANS 10100-1. Journal of the
South African Institute of Civil Engineering. Vol 52 No.1, 2010, pgs 36 – 44.
26. Hughes BP (1980), Limit state theory for reinforced concrete design (3rd Edition),
Pitman.
27. Illston JM, Stevens RF (1972). Long-term cracking in reinforced concrete
beams. Proceedings of the Institute of Civil Engineers, Vol 53, Dec 1972, pp 445
– 459.
Stellenbosch University http://scholar.sun.ac.za

152
28. Joint Committee on Structural Safety (2001). Probabilistic model code. JCSS,
Zurich 2001. http://www.jcss.ethz.ch/.
29. Joint Committee on Structural Safety (2008). Interpretation of Uncertainties and
Probabilities in Civil Engineering Decision Analysis. Background documents on
risk assessment in engineering. Document No. 2. JCSS, Zurich 2008.
http://www.jcss.ethz.ch/.
30. Jones A. (2008) Eurocode 2 – Design of concrete structures: Part 3. Liquid-
retaining and Containment Structures. Dissemination of information workshop,
Brussels February 2008.
31. König G, Hosser D & Wittke B (1985). Basic note on model uncertainties.
Bulletin d‟ Information No. 170. Comite Euro International du Beton.
32. Lane JW (1983) Concrete specification for local conditions. Seminar on design
of concrete water retaining structures to BS 5337, held by the Division of
Hydraulic and Water Engineering of the South African Institution of Civil
Engineers in association with the Concrete Society of South Africa.
33. Mans R (2012). Will autogenous healing Seal a Concrete Crack with a Surface
Width of 0.2mm? 4th yr undergraduate dissertation in partial fulfillment for the
degree of Bachelor of Science in Engineering, University of KwaZulu-Natal.
Supervisor: C.H. McLeod
34. Markova J, Holický M (2001). Credibility of design procedures (for limit states
design of cracking in reinforced concrete). Acta Polytechnica Vol 41, No. 4-5/
2001.
35. Mosley B, Bungley J, Hulse R (2007). Reinforced concrete design to Eurocode
2. 6th Edition. Palgrave Macmillan.
36. Mucambe, ESD (2007). Permeability and durability of concrete water retaining
structures in South Africa. 4th yr undergraduate dissertation in partial fulfillment
for the degree of Bachelor of Science in Engineering, University of KwaZulu-
Natal. Supervisor: C.H. McLeod
37. Naidu, S (2008, 2009). Personal communication. Naidu & Assoc Consulting
Engineers, Durban, KwaZulu-Natal, South Africa.
38. Narayanan RS, Beeby AW (2005). Designer’s guide to EN1992-1-1 and
EN1992-1-2: Design of concrete structures. General rules and rules for
buildings and structural fire design. Thomas Telford.
39. Nowak AS, Collins KR (2000). Reliability of structures. McGraw-Hill.
40. Owens G (Ed) (2009). Fulton’s concrete technology (9th Ed). Cement and
Concrete Institute, SA.
Stellenbosch University http://scholar.sun.ac.za

153
41. Quan Q, Gengwei Z (2002). Calibration of reliability index of RC beams for
serviceability limit state of maximum crack width. Journal of Reliability
Engineering and System Safety. No. 75 (2002), pages 359 – 366.
42. Retief JV, Dunaiski PE (2009). Background to SANS 10160. Basis of structural
design and actions for buildings and industrial structures. Sun Press.
Stellenbosch, South Africa.
43. Reynolds CE, Steedman JC, Threlfall AJ. (2008) Reynolds’s reinforced concrete
designer’s handbook, 11th Edition. Taylor and Francis
44. Ronné PD (2006). Variation in cover to reinforcement: local and international
trends. CSSA.
45. Roux WR (2007). Thesis No. 3-36. South African practice for the design of water
retaining concrete structures. 4th yr undergraduate dissertation in partial
fulfillment for the degree of Bachelor of Science in Engineering, Stellenbosch
University. Supervisor: Prof. JA Wium.
46. SANS 10100 -1: The structural use of concrete: Part 1: Design. South African
Bureau of Standards. Pretoria 2000.
47. SANS 10100 -2: The structural use of concrete: Part 2: Materials and execution,
South African Bureau of Standards. Pretoria 1984.
48. SANS 10100 Part 3 (Draft) – Design of concrete water retaining structures.
WRC Project group with the Institute of Structural Engineering. 2010
49. SANS 10160 General procedures for loading in buildings and industrial
structures. DRAFT. South African Institute for Civil Engineers 2006.
50. SANS 2394: 2004 Edition 1 (ISO 2394: 1998 Edition 2): General principles on
reliability for structures. South African Bureau of Standards. Pretoria. 2004.
51. Scruton, S (2007, 2008, 2009, 2010). Personal communications. Umgeni Water,
Durban, KwaZulu-Natal, South Africa.
52. Seong-Tae Yi, Tae-Yang Hyan & Jin-Keun Kim (2011). The effects of hydraulic
pressure and crack width on water permeability of penetration crack-induced
concrete. Journal of Construction and Building Structures 25 (2011) Pages 2576
– 2583.
53. Sundararajan C (Ed) (1995) Probabilistic structural mechanics handbook –
Theory and industrial applications. Chapman and Hall.
54. Tammo K, Lundgren K, Thelandersson S (2009). Non-linear analysis of crack
widths in reinforced concrete. Magazine of Concrete Research 2009, Vol 61, No.
1 Feb, pp 23 - 34.
Stellenbosch University http://scholar.sun.ac.za

154
55. Vitek, J (Task convener) (2011). MC 2010 Improved 1st draft, Ch 7.6 Verification
of serviceability (SLS) of RC and PC Structures. Fib TG 4.1: Serviceability
models. February 2011.
56. Wium, JA (2007a), project leader. A code for the design of water retaining
structures in South Africa. Workshop held at University of Stellenbosch, October
2007.
57. Wium, JA (2007b). Interim report December 2007: The development and
calibration of South Africa’s National Standards for water retaining structures.
WRC Project No. K5/1764, Water Research Commission of South Africa,
Pretoria, SA.
58. Wium, JA (2008). Report April 2008: Basis of design and materials. The
development and calibration of South Africa’s National Standards for water
retaining structures. WRC Project No. K5/1764, Water Research Commission of
South Africa, Pretoria, SA
59. Ziari A, Reza Kianoush M (2009a). Investigation of direct tension cracking and
leakage in RC elements. Journal of Engineering Structures 31 (2009) pp 406 –
474.
60. Ziari A, Reza Kianoush M (2009b). Investigation of flexural cracking and leakage
in RC liquid containing structures. Journal of Engineering Structures 31 (2009)
pp 1056 – 1067.
Stellenbosch University http://scholar.sun.ac.za

155
APPENDIX A
DETERMINISTIC ANALYSIS
for
FLEXURAL AND TENSION CRACKING
Stellenbosch University http://scholar.sun.ac.za

156
Asuls, req to SANS, fy = 450MPa Max As = 4%
H (m) MULS (kNm) cover (mm) h (mm) θ = 16 mm % As θ = 20 mm % As θ = 25 mm % As
5 250 40 250 4191.0 1.68 4257.1 1.70 4311.02 1.72
300 2940.3 0.98 2973.0 0.99 3015.05 1.01
350 2326.8 0.66 2345.8 0.67 2370.06 0.68
400 1940.9 0.49 1969.8 0.49 1969.85 0.49
450 1672.1 0.37 1680.4 0.37 1691.73 0.38
500 1487.1 0.30 1493.7 0.30 1502.07 0.30
550 1339.0 0.24 1344.4 0.24 1351.11 0.25
600 1217.7 0.20 1222.1 0.20 1227.72 0.20
50 250 4481.2 1.79
300 3150.5 1.05
350 2446.4 0.70
400 2020.3 0.51
450 1728.0 0.38
6 432 40 450 3030.5 0.67
400 3588.4 0.90
350 4465.2 1.28
300 5885.1 1.96
250 req compression reinf.
7 686 40 750 1659.3 0.22
700 2843.0 0.41
650 3111.5 0.48
600 3440.8 0.57
550 3856.8 0.70
500 3963.9 0.79
450 5172.8 1.15
400 6386.5 1.60
350 7787.7 2.23
300 require compression reinf.
250 require compression reinf.
Appendix A.1: Ultimate Limit State loading calculations for reinforcement.
Figure A.1.1: Ultimate limit state reinforcement calculation to SANS10100
Table A.1.1: ULS reinforcement to SANS010
Red – highlighted cells: reinforcement spacing exceeds minimum feasible.
Cantilever Wall. Water pressure only considered
Concrete, fck = 30 MPa
Concrete fcu = 37 MPa
Reinf. fy = 450 MPa
mod ratio αe = 15
overall depth of section h = 750 mm
effective depth d = 700 mm
Length of section b = 1000 mm
For Wall, H wall = 7 m
Reinf. Es = 200 kN/mm2
cover to reinf., c = 40 mm
Dia reinf = 20 mm
SANS
Mu = 432.0 kNm
Muc= 2828.3 kNm
Mu/Muc = 0.153
z /d= 0.97
As, req = 1659.3 mm2
Stellenbosch University http://scholar.sun.ac.za

157
Appendix A.2 SLS cracking calculations and data for Flexural cracking to BS8007
Figure A.2.1: SLS Flexural cracking calculation to BS 8007 using EXCEL spreadsheet
INPUT
Concrete fcu = 37 MPa
Reinf. fy = 450 MPamod ratio αe = 15
overall depth of section h = 750 mm
effective depth d = 700 mm
Length of section b = 1000 mm
Area of Tension reinf for bending As = 2513 mm2/m wall
Reinf dia, Φ = 20 mm
Reinf. Spacing s = 125.0 mm
For Wall, H wall = 7 mReinf. Es = 200 kN/mm
2
cover to reinf., c = 40 mm
Bending Moment M = 571.7 kNm/m
1. Flexural Cracking Only (SLS, Elastic Theory, Steel yields, T = C)
(i) NA Depth x = 195.1 mm
Lever arm z = 635.0 mm
(ii) Stresses in Steel & Concrete
fs = 358.26 MPa Max fs =0.8*fy 360.0
fc = 9.23 MPa Max fc = 0.45*fcu 16.7
(iii) Strain at steel level
εs = 1.79E-03 Max εs = 0.8fy/Es 1.8E-03
(iv) Apparent strain at surface
ε1 = 1.97E-03
(v)Tension stiffening effect 0.2mm 0.1mm
ε2 = 4.04E-04 6.07E-04 Note: a' = h
(vi) Average strain
εm = ε1- ε2 1.56E-03 1.36E-03
(vii) Calc acr
a = 80.0 mm
acr = 70.0 mm
(viii) Width of Crack (mm)
w = 0.297 0.258
Stress/ Strain Theory: BS 8007/ 8110: Cracked Section: Bending: Singly Reinforced Section
Stellenbosch University http://scholar.sun.ac.za

158
Table A.2.1: SLS flexural cracking results to BS8007: H = 5m
dia (mm) 20
s 125.0 spacing of reinf
Area reinf 2513 0.2mm 0.1mmh (mm) 750 0.297 0.258
H = 5m Cover = 40mm h 250 too small!!! H = 5m Cover = 40mm
Dia = 20 mm Crack width (mm) Dia = 20 mm too small too small
h %As As (mm2) Asls/Auls s (mm) w = 0.2 mm w = 0.1 mm h %As As (mm2) Asls/Auls s w = 0.2 mm w = 0.1 mm
250 1.676 4189 0.984 75.0 0.383 0.374 300 1.396 4189 1.409 75.0 0.217 0.210
Auls 1.257 3142 0.738 100.0 0.405 0.396 Auls 1.047 3142 1.057 100.0 0.297 0.287
4257 1.005 2513 0.590 125.0 0.519 0.507 2973 0.838 2513 0.845 125.0 0.388 0.374
0.838 2094 0.492 150.0 0.641 0.626 0.698 2094 0.704 150.0 0.485 0.4670.718 1795 0.422 175.0 0.770 0.751 0.598 1795 0.604 175.0 0.590 0.567
0.628 1571 0.369 200.0 0.904 0.881 0.524 1571 0.528 200.0 0.700 0.672
0.558 1395 0.328 225.0 1.044 1.017 0.465 1395 0.469 225.0 0.816 0.782
0.503 1257 0.295 250.0 1.186 1.154 0.419 1257 0.423 250.0 0.933 0.894
H = 5m Cover = 40mm H = 5m Cover = 40mm
Dia = 20 mm too small Dia = 20 mm too small
h %As As (mm2) Asls/Auls s w = 0.2 mm w = 0.1 mm h %As As (mm2) Asls/Auls s w = 0.2 mm w = 0.1 mm
350 1.197 4189 1.786 75.0 0.166 0.159 400 1.047 4189 2.126 75.0 0.132 0.124
Auls 0.898 3142 1.340 100.0 0.231 0.220 Auls 0.786 3142 1.595 100.0 0.186 0.172
2345 0.718 2513 1.072 125.0 0.305 0.288 1970 0.628 2513 1.276 125.0 0.246 0.227
0.598 2094 0.893 150.0 0.385 0.364 0.524 2094 1.063 150.0 0.314 0.2880.513 1795 0.765 175.0 0.472 0.444 0.449 1795 0.911 175.0 0.387 0.354
0.449 1571 0.670 200.0 0.564 0.530 0.393 1571 0.797 200.0 0.465 0.425
0.399 1395 0.595 225.0 0.662 0.621 0.349 1395 0.708 225.0 0.548 0.499
0.359 1257 0.536 250.0 0.762 0.713 0.314 1257 0.638 250.0 0.633 0.576
H = 5m Cover = 40mm H = 5m Cover = 40mm
Dia = 20 mm Dia = 20 mm
h %As As (mm2) Asls/Auls s w = 0.2 mm w = 0.1 mm h %As As (mm2) Asls/Auls s w = 0.2 mm w = 0.1 mm
450 0.931 4189 2.493 75.0 0.108 0.098 500 0.838 4189 2.804 75.0 0.089 0.078
Auls 0.698 3142 1.870 100.0 0.152 0.137 Auls 0.628 3142 2.103 100.0 0.126 0.109
1680 0.558 2513 1.496 125.0 0.203 0.181 1494.0 0.503 2513 1.682 125.0 0.168 0.144
0.465 2094 1.246 150.0 0.259 0.230 0.419 2094 1.402 150.0 0.216 0.1830.399 1795 1.068 175.0 0.321 0.284 0.359 1795 1.201 175.0 0.268 0.225
0.349 1571 0.935 200.0 0.387 0.341 0.314 1571 1.052 200.0 0.324 0.271
0.310 1395 0.830 225.0 0.458 0.401 0.279 1395 0.934 225.0 0.344 0.288
0.279 1257 0.748 250.0 0.531 0.464
H = 5m Cover = 40mm H = 5m Cover = 40mm
Dia = 16(mm) h 250 too small Dia = 16(mm) too small too small
h %As As (mm2) Asls/Auls s w = 0.2 mm w = 0.1 mm h %As As (mm2) Asls/Auls s w = 0.2 mm w = 0.1 mm
250 1.072 2681 0.640 75.0 0.427 0.417 300 0.894 2681 0.912 75.0 0.312 0.301
0.804 2011 0.480 100.0 0.584 0.570 0.670 2011 0.684 100.0 0.435 0.418
Auls 0.643 1608 0.384 125.0 0.757 0.738 Auls 0.536 1608 0.547 125.0 0.572 0.549
4191 0.536 1340 0.320 150.0 0.944 0.918 2940 0.447 1340 0.456 150.0 0.722 0.691
0.460 1149 0.274 175.0 1.140 1.109 0.383 1149 0.391 175.0 0.882 0.843
0.402 1005 0.240 200.0 1.346 1.308 0.335 1005 0.342 200.0 1.051 1.004
0.298 894 0.304 225.0 1.226 1.170
0.268 804 0.273 250.0 1.410 1.343
H = 5m Cover = 40mm H = 5m Cover = 40mm
Dia = 16(mm) too small too small Dia = 16(mm) too small
h %As As (mm2) Asls/Auls s w = 0.2 mm w = 0.1 mm h %As As (mm2) Asls/Auls s w = 0.2 mm w = 0.1 mm
350 0.766 2681 1.153 75.0 0.242 0.229 400 0.670 2681 1.381 75.0 0.193 0.178
0.575 2011 0.865 100.0 0.340 0.321 0.503 2011 1.036 100.0 0.274 0.251
Auls 0.459 1608 0.691 125.0 0.452 0.425 Auls 0.402 1608 0.828 125.0 0.366 0.335
2326 0.383 1340 0.576 150.0 0.575 0.539 1941 0.335 1340 0.690 150.0 0.469 0.427
0.328 1149 0.494 175.0 0.708 0.662 0.287 1149 0.592 175.0 0.581 0.527
0.287 1005 0.432 200.0 0.850 0.793 0.251 1005 0.518 200.0 0.700 0.633
0.255 894 0.384 225.0 0.998 0.929 0.224 894 0.461 225.0 0.826 0.745
0.230 804 0.346 250.0 1.153 1.073 0.201 804 0.414 250.0 0.959 0.863
H = 5m Cover = 40mm H = 5m Cover 50
Dia = 16(mm) too small Dia = 20 mm
h %As As (mm2) Asls/Auls s w = 0.2 mm w = 0.1 mm h %As As (mm2) Asls/Auls s (mm) w = 0.2 mm w = 0.1 mm
450 0.596 2681 1.603 75.0 0.157 0.141 450 0.931 4189 2.493 75.0 0.136 0.124
0.447 2011 1.203 100.0 0.224 0.199 Auls 0.698 3142 1.870 100.0 0.186 0.168
Auls 0.357 1608 0.962 125.0 0.301 0.265 1680 0.558 2513 1.496 125.0 0.243 0.217
1672 0.298 1340 0.801 150.0 0.387 0.339 0.465 2094 1.246 150.0 0.305 0.272
0.255 1149 0.687 175.0 0.481 0.419 0.399 1795 1.068 175.0 0.373 0.330
0.223 1005 0.601 200.0 0.582 0.505 0.349 1571 0.935 200.0 0.445 0.393
0.199 894 0.535 225.0 0.689 0.596 0.310 1395 0.830 225.0 0.522 0.459
0.179 804 0.481 250.0 0.802 0.691 0.279 1257 0.748 250.0 0.601 0.528
0.233 1047 0.623 300.0 0.771 0.673
Stellenbosch University http://scholar.sun.ac.za

159
Table A.2.2: SLS flexural cracking results to BS8007: H = 7m
H= 7m Cover = 40mm H= 7m Cover = 40mm
Dia = 20 mm Dia = 20 mm
h %As As (mm2) Asls/Auls s (mm) w = 0.2 mm w = 0.1 mm h %As As (mm2) Asls/Auls s (mm) w = 0.2 mm w = 0.1 mm
450 0.8378 4189 0.810 75.0 1.177 1.129 500 0.8378 4189 1.2 75.0 0.530 0.505
Auls 0.6284 3142 0.607 100.0 1.304 1.251 Auls 0.6284 3142 0.9 100.0 0.587 0.560
5173 0.5026 2513 0.486 125.0 1.437 1.378 3441 0.5026 2513 0.7 125.0 0.647 0.618
0.4188 0.4188 2094 0.6 150.0 0.707 0.674
H= 7m Cover = 40mm
Dia = 20 mm
h %As As (mm2) Asls/Auls s (mm) w = 0.2 mm w = 0.1 mm
750.0 0.5585333 4189.0 2.5 75.0 0.14948384 0.1326
Auls 0.4189333 3142.0 1.9 100.0 0.21681189 0.1903
1659.0 0.3350667 2513.0 1.5 125.0 0.29656388 0.2582
Stellenbosch University http://scholar.sun.ac.za

160
For given As, calc wlim
INPUT
Concrete, 28 days fck = 30 MPa
Concrete, 3 days fck,3 = MPa
Reinf. fyk = 500 MPa
mod ratio αe = 15.0
overall depth of section h = 450 mm
effective depth d = 400 mm
Length of section b = 1000 mm
Area of Tension reinf for bending As = 2700 mm2/m wall/face
Reinf dia, = 20 mm
Reinf. Spacing s = mm
H wall = 6 m
Reinf. Es = 200 GPa
cover to reinf., c = 40 mm
Service Bending Moment M = 360.00 kNm
Service Applied tensile force N = 0 kN
Mean axial tensile strength conc.
fct,ef f (Table 3.1, = fctm) 2.896 MPa
Ecm = 32.84 MPa
Coefficients
Bond prop's reinf. Coeff k1 = 0.8 High bond
Distribution strain coeff , bending k2 = 0.5 Bending = 0.5
Coeff (recommended) k3 = 3.4
Coeff (recommended) k4 = 0.425
Duration of load factor kt = 0.4 Long term
1. Imposed Load Cracking Only (EN2-1 Cl 7.3)
(i) Check As,min %As
k = 1
sc = 0 MPa
kc, k1 = 1,5
h* = 450
kc, bending = 0.4 2.5(h-d) h/2 (h-x)/3bt = 125.0 125 225
depth tension area = 125.0 225
Act = 102000.0 mm2/m 225
Min As,min = 236.4 mm2/m
(ii) sr,max for reinf spacing <= 5(c+dia./2) Check: s (reinf) = 250 mm ok
rp,eff = 0.02647
Max crack spacing sr,max = 264.4 mm ≤ 5(c+θ/2)
Mean crack spacing β = 1,7 srm = 155.6 mm
(iii) Strain (esm - ecm)
depth to neutral axis x = 144.00 mm
z= 352.00 mm
ss = 378.8 MPa 2.5(h-d) (h-x)/3 h/2
depth of tension area h,eff = 102.0 depth T- zone 125 102 225
Act,eff = 102000.0 mm2
Tension stiffening due to Concrete, εcm = 0.000306
Steel strain = 0.001894
Max crack width wk = 0.420 mm
Mean crack width, wm = 0.247 mm
Appendix A.3: SLS flexural cracking to EN1992: Crack width calculation
Figure A 3.1: SLS flexural cracking to EN1992 – Calculation of crack width
Stellenbosch University http://scholar.sun.ac.za

161
Table A.3.1: SLS Flexural cracking to EN1992 – Data for crack width for given reinforcement
dia (mm) 20
%As 0.6 wk (mm) es ecm Sr (mm)
h (mm) 450 0.4200 0.00189 0.00031 264.4
H = 5m c = 40 mm H = 5m c = 40 mm
Dia = 25 mm
Dia = 25
mm
%As h Asls Asls/Auls wk (mm) es ecm Sr (mm) h Asls/Auls wk (mm) es ecm Sr (mm)
0.2 250 500 0.115982 6.2111 0.01132 0.00087 594.4 450 900 0.531915 1.3372 0.00313 0.00086 587.7
0.3 750 0.173974 3.0327 0.00767 0.00058 428.0 1350 0.797872 0.6532 0.00212 0.00058 422.6
0.4 Auls 1000 0.231965 1.8674 0.00583 0.00045 346.9 Auls 1800 1.06383 0.4014 0.00161 0.00044 342.2
0.5 4311 1250 0.289956 1.3022 0.00472 0.00037 299.3 1692 2250 1.329787 0.2789 0.00130 0.00036 295.2
0.6 1500 0.347947 0.9806 0.00397 0.00031 268.2 2700 1.595745 0.2090 0.00110 0.00031 264.4
0.8 2000 0.463929 0.6398 0.00303 0.00025 230.3 3600 2.12766 0.1347 0.00084 0.00024 227.1
1.0 2500 0.579912 0.4673 0.00245 0.00021 208.3 4500 2.659574 0.0970 0.00068 0.00021 205.4
1.2 3000 0.695894 0.3653 0.00207 0.00019 194.0 5400 3.191489 0.0745 0.00057 0.00018 191.4
1.4 3500 0.811877 0.2987 0.00179 0.00017 184.0 6300 3.723404 0.0599 0.00049 0.00016 181.6
1.6 4000 0.927859 0.2520 0.00158 0.00016 176.8 7200 4.255319 0.0495 0.00044 0.00015 174.5
1.8 4500 1.043841 0.2176 0.00142 0.00015 171.2 8100 4.787234 0.0419 0.00039 0.00014 169.1
2.0 5000 1.159824 0.1912 0.00129 0.00014 166.9 9000 5.319149 0.0360 0.00035 0.00014 164.9
2.4 6000 1.391788 0.1535 0.00109 0.00013 160.6
2.8 7000 1.623753 0.1279 0.00094 0.00012 156.2
Note: reinforcement chosen such that spacing in range of 75 to 300/400 mmm
H = 5m c = 40 mm H = 5m c = 40 mm
Dia = 20 (mm) Dia = 20 (mm)
%As h Asls Asls/Auls wk (mm) es ecm Sr (mm) h Asls Asls/Auls wk (mm) es ecm Sr (mm)
0.2 250 500 0.117454 6.2111 0.01132 0.00087 594.4 300 600 0.201816 3.9477 0.00753 0.00086 591.8
0.3 750 0.17618 3.0327 0.00767 0.00058 428.0 900 0.302725 1.9267 0.00510 0.00058 425.9
0.4 Auls 1000 0.234907 1.8674 0.00583 0.00045 346.9 Auls 1200 0.403633 1.1856 0.00388 0.00044 345.1
0.5 4257 1250 0.293634 1.3022 0.00472 0.00037 299.3 2973 1500 0.504541 0.8262 0.00314 0.00036 297.7
0.6 1500 0.352361 0.9806 0.00397 0.00031 268.2 1800 0.605449 0.6216 0.00264 0.00031 266.8
0.7 1750 0.411088 0.7776 0.00343 0.00027 246.4 2100 0.706357 0.4924 0.00228 0.00027 245.1
0.8 2000 0.469814 0.6398 0.00303 0.00025 230.3 2400 0.807265 0.4047 0.00201 0.00025 229.1
0.9 2250 0.528541 0.5411 0.00271 0.00023 218.0 2700 0.908174 0.3419 0.00180 0.00022 216.8
1.0 2500 0.587268 0.4673 0.00245 0.00021 208.3 3000 1.009082 0.2949 0.00163 0.00021 207.2
1.1 2750 0.645995 0.4104 0.00224 0.00020 200.4 3300 1.10999 0.2587 0.00149 0.00019 199.4
1.2 3000 0.704722 0.3653 0.00207 0.00019 194.0 3600 1.210898 0.2300 0.00138 0.00018 193.0
1.3 3250 0.763448 0.3288 0.00192 0.00018 188.6 3900 1.311806 0.2067 0.00128 0.00017 187.7
1.4 3500 0.822175 0.2987 0.00179 0.00017 184.0 4200 1.412714 0.1875 0.00119 0.00017 183.1
1.5 3750 0.880902 0.2734 0.00168 0.00016 180.1
1.6 4000 0.939629 0.2520 0.00158 0.00016 176.8
1.7 4250 0.998356 0.2336 0.00150 0.00015 173.8
2.0 5000 1.174536 0.1912 0.00129 0.00014 166.9
1.9 4800 1.127555 0.2010 0.00134 0.00014 168.5
H = 5m c = 40 mm H = 5m c = 40 mm
Dia = 20 (mm) Dia = 20 (mm)
h Asls Asls/Auls wk (mm) es ecm Sr (mm) h Asls Asls/Auls wk (mm) es ecm Sr (mm)
350 700 0.29838 2.6642 0.00538 0.00086 590.0 400 800 0.406091 1.8666 0.00403 0.00086 588.7
1050 0.44757 1.3003 0.00364 0.00058 424.5 1200 0.609137 0.9113 0.00273 0.00058 423.4
Auls 1400 0.59676 0.7997 0.00277 0.00044 343.9 Auls 1600 0.812183 0.5602 0.00207 0.00044 343.0
2346 1750 0.745951 0.5568 0.00224 0.00036 296.6 1970 2000 1.015228 0.3897 0.00168 0.00036 295.8
2100 0.895141 0.4185 0.00188 0.00031 265.8 2400 1.218274 0.2925 0.00141 0.00031 265.0
2450 1.044331 0.3311 0.00163 0.00027 244.1 2800 1.42132 0.2311 0.00122 0.00027 243.5
2800 1.193521 0.2718 0.00143 0.00024 228.2 3200 1.624365 0.1893 0.00107 0.00024 227.6
3150 1.342711 0.2292 0.00128 0.00022 216.0 3600 1.827411 0.1594 0.00096 0.00022 215.4
3500 1.491901 0.1974 0.00116 0.00021 206.4 4000 2.030457 0.1370 0.00087 0.00021 205.8
3850 1.641091 0.1729 0.00106 0.00019 198.7 4400 2.233503
4200 1.790281 0.1534 0.00098 0.00018 192.3 4800 2.436548 0.1060 0.00073 0.00018 191.8
4550 1.939471 0.1377 0.00091 0.00017 187.0 5200 2.639594
Stellenbosch University http://scholar.sun.ac.za

162
Table A.3.2: SLS Flexural cracking to EN1992 – Data for crack width continued
H = 5m c = 40 mm
Dia = 20 (mm)
h Asls Asls/Auls wk (mm) es ecm Sr (mm)
450 900 0.535714 1.3372 0.00313 0.00086 587.7
1350 0.803571 0.6532 0.00212 0.00058 422.6
Auls 1800 1.071429 0.4014 0.00161 0.00044 342.2
1680 2250 1.339286 0.2789 0.00130 0.00036 295.2
2700 1.607143 0.2090 0.00110 0.00031 264.4
3150 1.875 0.1648 0.00095 0.00027 242.9
3600 2.142857 0.1347 0.00084 0.00024 227.1
4050 2.410714 0.1131 0.00075 0.00022 214.9
4500 2.678571 0.0970 0.00068 0.00021 205.4
4950 2.946429 0.0845 0.00062 0.00019 197.7
5400 3.214286 0.0745 0.00057 0.00018 191.4
5850 3.482143 0.0665 0.00053 0.00017 186.1
6300 3.75 0.0599 0.00049 0.00016 181.6
6750 4.017857
7200 4.285714 0.0495 0.00044 0.00015 174.5
H = 5m c = 40 mm H = 5m c = 40 mm
Dia = 16 (mm) Dia = 16 (mm)
%As h Asls Asls/Auls wk (mm) es ecm Sr (mm) h Asls Asls/Auls wk (mm) es ecm Sr (mm)
0.2 250 500 0.119303 6.2111 0.01132 0.00087 594.4 450 900 0.538278 1.3372 0.00313 0.00086 587.7
0.3 750 0.178955 3.0327 0.00767 0.00058 428.0 1350 0.807416 0.6532 0.00212 0.00058 422.6
0.4 Auls 1000 0.238607 1.8674 0.00583 0.00045 346.9 Auls 1800 1.076555 0.4014 0.00161 0.00044 342.2
0.5 4191 1250 0.298258 1.3022 0.00472 0.00037 299.3 1672 2250 1.345694 0.2789 0.00130 0.00036 295.2
0.6 1500 0.35791 0.9806 0.00397 0.00031 268.2 2700 1.614833 0.2090 0.00110 0.00031 264.4
0.7 1750 0.417561 0.7776 0.00343 0.00027 246.4 3150 1.883971 0.1648 0.00095 0.00027 242.9
0.8 2000 0.477213 0.6398 0.00303 0.00025 230.3 3600 2.15311 0.1347 0.00084 0.00024 227.1
0.9 2250 0.536865 0.5411 0.00271 0.00023 218.0
1.0 2500 0.596516 0.4673 0.00245 0.00021 208.3
1.1 2750 0.656168 0.4104 0.00224 0.00020 200.4
1.2 3000 0.71582 0.3653 0.00207 0.00019 194.0
Section too small
H = 5m Cover = 50 H=7m Cover =40
Dia = 20mm Dia 20mm
%As h Asls Asls/Auls wk (mm) es ecm Sr (mm) %As h Asls Asls/Auls wk (mm) es ecm Sr (mm)
0.2 450 900 0.520833 1.4684 0.00322 0.00086 623.3 0.2 450 900 0.17398 4.5471 0.00859 0.00086 587.7
0.3 1350 0.78125 0.7328 0.00218 0.00058 457.9 0.4 1800 0.347961 1.3631 0.00442 0.00044 342.2
0.4 Auls 1800 1.041667 0.4582 0.00165 0.00044 377.4 0.6 Auls 2700 0.521941 0.7145 0.00301 0.00031 264.4
0.5 1728 2250 1.302083 0.3230 0.00134 0.00036 330.2 0.8 5173 3600 0.695921 0.4655 0.00229 0.00024 227.1
0.6 2700 1.5625 0.2450 0.00113 0.00031 299.4 1 4500 0.869901 0.3395 0.00186 0.00021 205.4
0.7 3150 1.822917 0.1951 0.00097 0.00027 277.8 1.2 5400 1.043882 0.2651 0.00157 0.00018 191.4
0.8 3600 2.083333 0.1609 0.00086 0.00024 261.9 1.4 6300 1.217862 0.2164 0.00136 0.00016 181.6
0.9 4050 2.34375 0.1362 0.00077 0.00022 249.7 1.6 7200 1.391842 0.1823 0.00120 0.00015 174.5
1.0 4500 2.604167 0.1175 0.00070 0.00021 240.1 1.8 8100 1.565823 0.1572 0.00107 0.00014 169.1
2 9000 1.739803 0.1379 0.00097 0.00014 164.9
Stellenbosch University http://scholar.sun.ac.za

163
Appendix A.4: SLS flexural cracking to EN1992: Reinforcement calculation
Figure A.4.1: SLS Flexural cracking to EN1992 – Calculation of reinforcement
Bending Only To compare to P&R analysis: calculate As for given wk
SLS Reinforcement check using prEN2-1
Input prEN 2-1 Equations for Cracking
Units
Concrete, fck = 30 MPa
Concrete fcu = 37 MPa
Reinf. fy = 450 MPa
mod ratio αe = 15
overall depth of section h = 750 mm
Length of section b = 1000 mm
For Wall, H wall = 7 m
Reinf. Es = 200 kN/mm2
cover to reinf., c = 40 mm
Dia reinf = 20 mm
k1 0.8
k2 0.5 Bending
kt 0.4
k3 3.4
k4 0.425
Water p = 70 kN/m2
SLS M = 571.7 kNm
wk max = 0.3 mm
Calcs
effective depth d = 700 mm
x = 247.94 mm h/2 (h-x)/3 2.5(h-d)
heff 125.0 mm 375 167.352 125
Ac,eff = 125000.00 mm2
z = 617.35 mm
fctm = 2.896 MPa
ρ eff = 0.0363
Use Excel Solver to optimise As for given wk
As Sr, max εs εc ε ε final wk = Sr.ε Min strain
(mm2) (mm) (mm) 0.6*ζs/Es
4533 229.75 0.001021 0.000247 0.00077 0.0008 0.17800 0.0006128
) - ( s ,w cmmsrmcalcm ee
s
eff,c2143rm
A
Akkkcks
Stellenbosch University http://scholar.sun.ac.za
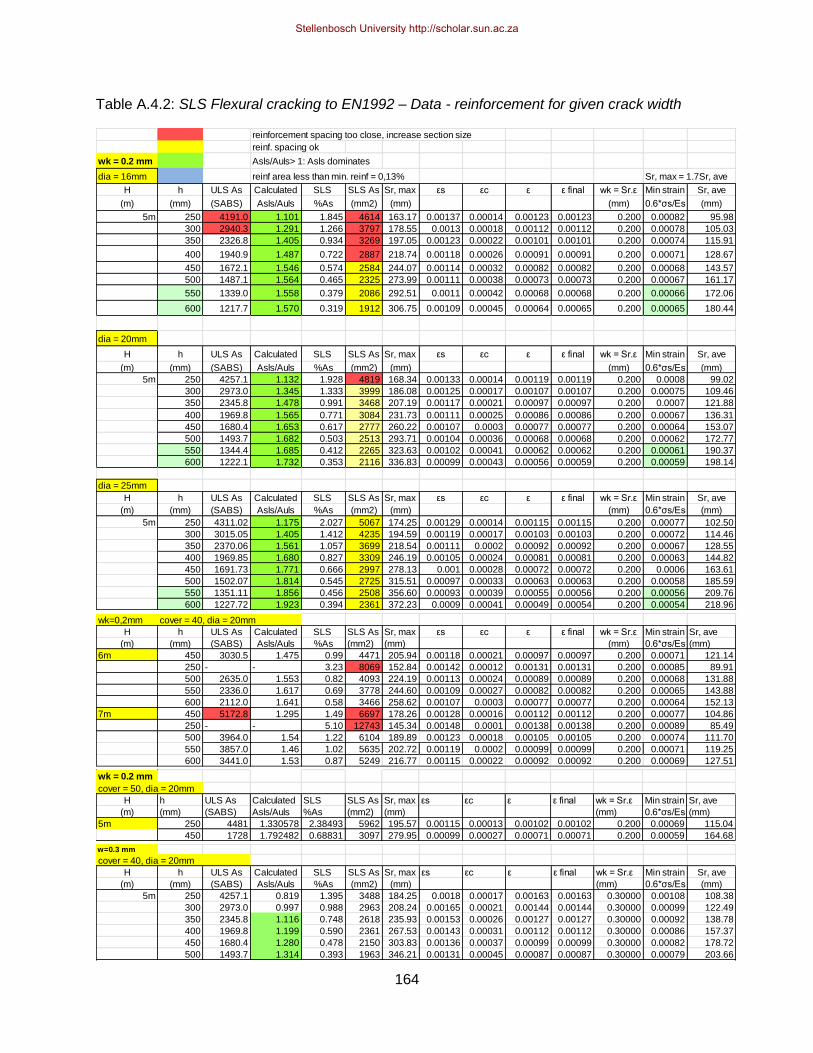
164
Table A.4.2: SLS Flexural cracking to EN1992 – Data - reinforcement for given crack width
reinforcement spacing too close, increase section size
reinf. spacing ok
wk = 0.2 mm Asls/Auls> 1: Asls dominates
dia = 16mm reinf area less than min. reinf = 0,13% Sr, max = 1.7Sr, ave
H h ULS As Calculated SLS SLS As Sr, max εs εc ε ε final wk = Sr.ε Min strain Sr, ave
(m) (mm) (SABS) Asls/Auls %As (mm2) (mm) (mm) 0.6*ζs/Es (mm)
5m 250 4191.0 1.101 1.845 4614 163.17 0.00137 0.00014 0.00123 0.00123 0.200 0.00082 95.98
300 2940.3 1.291 1.266 3797 178.55 0.0013 0.00018 0.00112 0.00112 0.200 0.00078 105.03
350 2326.8 1.405 0.934 3269 197.05 0.00123 0.00022 0.00101 0.00101 0.200 0.00074 115.91
400 1940.9 1.487 0.722 2887 218.74 0.00118 0.00026 0.00091 0.00091 0.200 0.00071 128.67
450 1672.1 1.546 0.574 2584 244.07 0.00114 0.00032 0.00082 0.00082 0.200 0.00068 143.57
500 1487.1 1.564 0.465 2325 273.99 0.00111 0.00038 0.00073 0.00073 0.200 0.00067 161.17
550 1339.0 1.558 0.379 2086 292.51 0.0011 0.00042 0.00068 0.00068 0.200 0.00066 172.06
600 1217.7 1.570 0.319 1912 306.75 0.00109 0.00045 0.00064 0.00065 0.200 0.00065 180.44
dia = 20mm
H h ULS As Calculated SLS SLS As Sr, max εs εc ε ε final wk = Sr.ε Min strain Sr, ave
(m) (mm) (SABS) Asls/Auls %As (mm2) (mm) (mm) 0.6*ζs/Es (mm)
5m 250 4257.1 1.132 1.928 4819 168.34 0.00133 0.00014 0.00119 0.00119 0.200 0.0008 99.02
300 2973.0 1.345 1.333 3999 186.08 0.00125 0.00017 0.00107 0.00107 0.200 0.00075 109.46
350 2345.8 1.478 0.991 3468 207.19 0.00117 0.00021 0.00097 0.00097 0.200 0.0007 121.88
400 1969.8 1.565 0.771 3084 231.73 0.00111 0.00025 0.00086 0.00086 0.200 0.00067 136.31
450 1680.4 1.653 0.617 2777 260.22 0.00107 0.0003 0.00077 0.00077 0.200 0.00064 153.07
500 1493.7 1.682 0.503 2513 293.71 0.00104 0.00036 0.00068 0.00068 0.200 0.00062 172.77
550 1344.4 1.685 0.412 2265 323.63 0.00102 0.00041 0.00062 0.00062 0.200 0.00061 190.37
600 1222.1 1.732 0.353 2116 336.83 0.00099 0.00043 0.00056 0.00059 0.200 0.00059 198.14
dia = 25mm
H h ULS As Calculated SLS SLS As Sr, max εs εc ε ε final wk = Sr.ε Min strain Sr, ave
(m) (mm) (SABS) Asls/Auls %As (mm2) (mm) (mm) 0.6*ζs/Es (mm)
5m 250 4311.02 1.175 2.027 5067 174.25 0.00129 0.00014 0.00115 0.00115 0.200 0.00077 102.50
300 3015.05 1.405 1.412 4235 194.59 0.00119 0.00017 0.00103 0.00103 0.200 0.00072 114.46
350 2370.06 1.561 1.057 3699 218.54 0.00111 0.0002 0.00092 0.00092 0.200 0.00067 128.55
400 1969.85 1.680 0.827 3309 246.19 0.00105 0.00024 0.00081 0.00081 0.200 0.00063 144.82
450 1691.73 1.771 0.666 2997 278.13 0.001 0.00028 0.00072 0.00072 0.200 0.0006 163.61
500 1502.07 1.814 0.545 2725 315.51 0.00097 0.00033 0.00063 0.00063 0.200 0.00058 185.59
550 1351.11 1.856 0.456 2508 356.60 0.00093 0.00039 0.00055 0.00056 0.200 0.00056 209.76
600 1227.72 1.923 0.394 2361 372.23 0.0009 0.00041 0.00049 0.00054 0.200 0.00054 218.96
wk=0,2mm cover = 40, dia = 20mm
H h ULS As Calculated SLS SLS As Sr, max εs εc ε ε final wk = Sr.ε Min strain Sr, ave
(m) (mm) (SABS) Asls/Auls %As (mm2) (mm) (mm) 0.6*ζs/Es (mm)
6m 450 3030.5 1.475 0.99 4471 205.94 0.00118 0.00021 0.00097 0.00097 0.200 0.00071 121.14
250 - - 3.23 8069 152.84 0.00142 0.00012 0.00131 0.00131 0.200 0.00085 89.91
500 2635.0 1.553 0.82 4093 224.19 0.00113 0.00024 0.00089 0.00089 0.200 0.00068 131.88
550 2336.0 1.617 0.69 3778 244.60 0.00109 0.00027 0.00082 0.00082 0.200 0.00065 143.88
600 2112.0 1.641 0.58 3466 258.62 0.00107 0.0003 0.00077 0.00077 0.200 0.00064 152.13
7m 450 5172.8 1.295 1.49 6697 178.26 0.00128 0.00016 0.00112 0.00112 0.200 0.00077 104.86
250 - - 5.10 12743 145.34 0.00148 0.0001 0.00138 0.00138 0.200 0.00089 85.49
500 3964.0 1.54 1.22 6104 189.89 0.00123 0.00018 0.00105 0.00105 0.200 0.00074 111.70
550 3857.0 1.46 1.02 5635 202.72 0.00119 0.0002 0.00099 0.00099 0.200 0.00071 119.25
600 3441.0 1.53 0.87 5249 216.77 0.00115 0.00022 0.00092 0.00092 0.200 0.00069 127.51
wk = 0.2 mm
cover = 50, dia = 20mm
H h ULS As Calculated SLS SLS As Sr, max εs εc ε ε final wk = Sr.ε Min strain Sr, ave
(m) (mm) (SABS) Asls/Auls %As (mm2) (mm) (mm) 0.6*ζs/Es (mm)
5m 250 4481 1.330578 2.38493 5962 195.57 0.00115 0.00013 0.00102 0.00102 0.200 0.00069 115.04
450 1728 1.792482 0.68831 3097 279.95 0.00099 0.00027 0.00071 0.00071 0.200 0.00059 164.68
w=0.3 mm
cover = 40, dia = 20mm
H h ULS As Calculated SLS SLS As Sr, max εs εc ε ε final wk = Sr.ε Min strain Sr, ave
(m) (mm) (SABS) Asls/Auls %As (mm2) (mm) (mm) 0.6*ζs/Es (mm)
5m 250 4257.1 0.819 1.395 3488 184.25 0.0018 0.00017 0.00163 0.00163 0.30000 0.00108 108.38
300 2973.0 0.997 0.988 2963 208.24 0.00165 0.00021 0.00144 0.00144 0.30000 0.00099 122.49
350 2345.8 1.116 0.748 2618 235.93 0.00153 0.00026 0.00127 0.00127 0.30000 0.00092 138.78
400 1969.8 1.199 0.590 2361 267.53 0.00143 0.00031 0.00112 0.00112 0.30000 0.00086 157.37
450 1680.4 1.280 0.478 2150 303.83 0.00136 0.00037 0.00099 0.00099 0.30000 0.00082 178.72
500 1493.7 1.314 0.393 1963 346.21 0.00131 0.00045 0.00087 0.00087 0.30000 0.00079 203.66
Stellenbosch University http://scholar.sun.ac.za

165
wk = 0.1 mm
dia = 16mm Sr, max = 1.7Sr, ave
H h ULS As Calculated SLS SLS As Sr, max εs εc ε ε final wk = Sr.ε Min strain Sr, ave
(m) (mm) (SABS) Asls/Auls %As (mm2) (mm) (mm) 0.6*ζs/Es (mm)
5m 250 4191.0 2.002 3.356 8390 148.71 0.00079 0.00011 0.00067 0.00067 0.100 0.00047 87.48
300 2940.3 2.266 2.221 6663 156.99 0.00077 0.00013 0.00064 0.00064 0.100 0.00046 92.35
350 2326.8 2.385 1.586 5550 167.70 0.00075 0.00015 0.0006 0.0006 0.100 0.00045 98.65
400 1940.9 2.455 1.191 4764 180.92 0.00074 0.00018 0.00055 0.00055 0.100 0.00044 106.42
450 1672.1 2.491 0.925 4164 196.92 0.00072 0.00022 0.00051 0.00051 0.100 0.00043 115.84
500 1487.1 2.470 0.735 3673 216.27 0.00072 0.00026 0.00046 0.00046 0.100 0.00043 127.22
550 1339.0 2.475 0.602 3314 234.50 0.00071 0.0003 0.00041 0.00043 0.100 0.00043 137.94
600 1217.7 2.531 0.514 3082 241.90 0.00069 0.00031 0.00038 0.00041 0.100 0.00041 142.30
dia = 20mm
H h ULS As Calculated SLS SLS As Sr, max εs εc ε ε final wk = Sr.ε Min strain Sr, ave
(m) (mm) (SABS) Asls/Auls %As (mm2) (mm) (mm) 0.6*ζs/Es (mm)
5m 250 4257.1 2.029 3.456 8639 151.43 0.00077 0.00011 0.00066 0.00066 0.100 0.00046 89.08
300 2973.0 2.322 2.301 6902 161.22 0.00075 0.00013 0.00062 0.00062 0.100 0.00045 94.83
350 2345.8 2.468 1.654 5790 173.70 0.00073 0.00015 0.00058 0.00058 0.100 0.00044 102.18
400 1969.8 2.541 1.251 5006 188.95 0.00071 0.00018 0.00053 0.00053 0.100 0.00042 111.14
450 1680.4 2.622 0.979 4405 207.22 0.00069 0.00021 0.00048 0.00048 0.100 0.00041 121.90
500 1493.7 2.618 0.782 3911 229.16 0.00068 0.00025 0.00044 0.00044 0.100 0.00041 134.80
550 1344.4 2.667 0.652 3586 251.60 0.00066 0.00028 0.00038 0.0004 0.100 0.0004 148.00
600 1222.1 2.756 0.561 3368 262.18 0.00064 0.0003 0.00033 0.00038 0.100 0.00038 154.22
dia = 25mm
H h ULS As Calculated SLS SLS As Sr, max εs εc ε ε final wk = Sr.ε Min strain Sr, ave
(m) (mm) (SABS) Asls/Auls %As (mm2) (mm) (mm) 0.6*ζs/Es (mm)
5m 250 4311.02 2.075 3.579 8947 154.64 0.00076 0.00011 0.00065 0.00065 0.100 0.00046 90.96
300 3015.05 2.385 2.397 7191 166.11 0.00073 0.00013 0.0006 0.0006 0.100 0.00044 94.83
350 2370.06 2.562 1.735 6073 180.58 0.0007 0.00015 0.00055 0.00055 0.100 0.00042 102.18
400 1969.85 2.683 1.322 5286 198.05 0.00068 0.00017 0.0005 0.0005 0.100 0.00041 111.14
450 1691.73 2.768 1.040 4682 218.82 0.00066 0.0002 0.00046 0.00046 0.100 0.00039 121.90
500 1502.07 2.784 0.836 4182 243.59 0.00064 0.00023 0.00041 0.00041 0.100 0.00039 134.80
550 1351.11 2.858 0.702 3861 268.43 0.00062 0.00027 0.00035 0.00037 0.100 0.00037 148.00
600 1227.72 3.025 0.619 3714 286.21 0.00058 0.00029 0.00029 0.00035 0.100 0.00035 154.22
wk=0,1mm cover = 40, dia = 20mm Vary H
H h ULS As Calculated SLS SLS As Sr, max εs εc ε ε final wk = Sr.ε Min strain Sr, ave
(m) (mm) (SABS) Asls/Auls %As (mm2) (mm) (mm) 0.6*ζs/Es (mm)
6m 450 3030.5 2.465 1.66 7471 172.77 0.00073 0.00015 0.00058 0.00058 0.100 0.00044 101.63
250 Mu>Muc 6.03 15071 143.51 0.0008 1E-04 0.0007 0.0007 0.100 0.00048 84.42
7m 450 5172.8 2.266 2.60 11720 156.46 0.00076 0.00012 0.00064 0.00064 0.100 0.00046 92.04
250 Mu>Muc 9.72 24311 140.04 0.00081 9.4E-05 0.00071 0.00071 0.100 0.00048 82.37
wk = 0.05mm cover = 40, dia = 20mm
H h ULS As Calculated SLS SLS As Sr, max εs εc ε ε final wk = Sr.ε Min strain Sr, ave
(m) (mm) (SABS) Asls/Auls %As (mm2) (mm) (mm) 0.6*ζs/Es (mm)
5m 250 4257.1 3.65 6.210 15526 143.22 0.00045 9.9E-05 0.00035 0.00035 0.050 0.00027 84.25
450 1680.4 4.26 1.589 7151 174.88 0.00044 0.00015 0.00029 0.00029 0.050 0.00026 102.87
500 1493.7 4.16 1.243 6213 188.71 0.00044 0.00018 0.00026 0.00026 0.050 0.00026 111.00
550 1344.4 4.35 1.064 5855 199.64 0.00042 0.00020 0.00022 0.00025 0.050 0.00025 117.43
600 1222.1 4.56 0.929 5576 211.00 0.00039 0.00021 0.00018 0.00024 0.050 0.00024 124.12
650 1120.3 4.66 0.803 5220 217.42 0.00038 0.00023 0.00016 0.00023 0.050 0.00023 127.89
700 1034.1 4.74 0.700 4897 222.78 0.00037 0.00023 0.00014 0.00022 0.050 0.00022 131.05
750 960.3 4.81 0.616 4621 227.98 0.00037 0.00024 0.00012 0.00022 0.050 0.00022 134.10
wk = 0.05mm cover = 40, dia = 25mm
H h ULS As Calculated SLS SLS As Sr, max εs εc ε ε final wk = Sr.ε Min strain Sr, ave
(m) (mm) (SABS) Asls/Auls %As (mm2) (mm) (mm) 0.6*ζs/Es (mm)
5m 650 1012.5 5.61 0.873 5677 234.26 0.00036 0.00022 0.00013 0.00021 0.050 0.00021 137.80
700 934.3 5.71 0.762 5335 240.55 0.00035 0.00023 0.00012 0.00021 0.050 0.00021 141.50
750 867.3 5.81 0.672 5041 246.65 0.00034 0.00024 0.0001 0.0002 0.050 0.0002 145.09
Stellenbosch University http://scholar.sun.ac.za
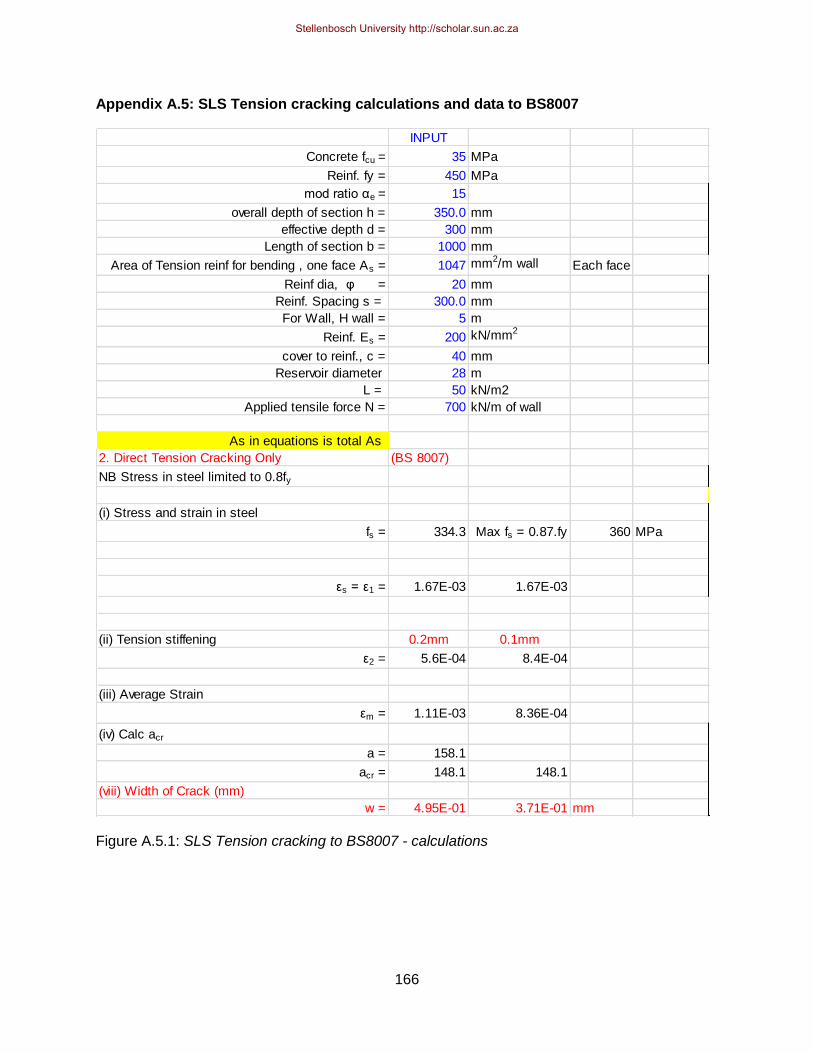
166
Appendix A.5: SLS Tension cracking calculations and data to BS8007
Figure A.5.1: SLS Tension cracking to BS8007 - calculations
INPUT
Concrete fcu = 35 MPa
Reinf. fy = 450 MPa
mod ratio αe = 15
overall depth of section h = 350.0 mm
effective depth d = 300 mm
Length of section b = 1000 mm
Area of Tension reinf for bending , one face As = 1047 mm2/m wall Each face
Reinf dia, θ = 20 mm
Reinf. Spacing s = 300.0 mm
For Wall, H wall = 5 m
Reinf. Es = 200 kN/mm2
cover to reinf., c = 40 mm
Reservoir diameter 28 m
L = 50 kN/m2
Applied tensile force N = 700 kN/m of wall
As in equations is total As
2. Direct Tension Cracking Only (BS 8007)
NB Stress in steel limited to 0.8fy
(i) Stress and strain in steel
fs = 334.3 Max fs = 0.87.fy 360 MPa
εs = ε1 = 1.67E-03 1.67E-03
(ii) Tension stiffening 0.2mm 0.1mm
ε2 = 5.6E-04 8.4E-04
(iii) Average Strain
εm = 1.11E-03 8.36E-04
(iv) Calc acr
a = 158.1
acr = 148.1 148.1
(viii) Width of Crack (mm)
w = 4.95E-01 3.71E-01 mm
Stellenbosch University http://scholar.sun.ac.za

167
Table A.5.1: SLS Tension cracking to BS8007 – data
H = 5m c = 40 mm H = 5m c = 40 mm
Dia 20 Reinf one face Total reinf (both Faces) Crack width (mm) Dia 20 Reinf one face Total reinf (both Faces) Crack width (mm)
h s (mm) As (mm2) As Both Asls/Auls %As Both w = 0.2 mm w = 0.1 mm h s As (mm2) As both Asls/Auls %As w = 0.2 mm w = 0.1 mm
250 75.0 4189 8378 3.904 3.351 0.0501 0.0423 300 75.0 4189 8378 3.904 2.793 0.0470 0.0376
Auls 100.0 3142 6284 2.928 2.514 0.0773 0.0652 Auls 100.0 3142 6284 2.928 2.095 0.0725 0.0580
2146 125.0 2513 5026 2.342 2.010 0.1115 0.0941 2146 125.0 2513 5026 2.342 1.675 0.1045 0.0836
150.0 2094 4188 1.952 1.675 0.1531 0.1292 150.0 2094 4188 1.952 1.396 0.1435 0.1148
175.0 1795 3590 1.673 1.436 0.2023 0.1707 175.0 1795 3590 1.673 1.197 0.1896 0.1517
200.0 1571 3142 1.464 1.257 0.2592 0.2187 200.0 1571 3142 1.464 1.047 0.2430 0.1944
225.0 1395 2790 1.300 1.116 0.3243 0.2737 225.0 1395 2790 1.300 0.930 0.3041 0.2432
250.0 1257 2514 1.171 1.006 0.3966 0.3346 250.0 1257 2514 1.171 0.838 0.3718 0.2974
300.0 1047 2094 0.976 0.838 0.5659 0.4774 300.0 1047 2094 0.976 0.698 0.5305 0.4244
H = 5m c = 40 mm H = 5m c = 40 mm
Dia 20 Reinf one face Total reinf (both Faces) Crack width (mm) Dia 20 Reinf one face Total reinf (both Faces) Crack width (mm)
h s As (mm2) As both Asls/Auls %As both w = 0.2 mm w = 0.1 mm h s As (mm2) As both Asls/Auls %As w = 0.2 mm w = 0.1 mm
350 75.0 4189 8378 3.904 2.394 0.0439 0.0329 400 75.0 4189 8378 3.904 2.095 0.0407 0.0282
Auls 100.0 3142 6284 2.928 1.795 0.0676 0.0507 Auls 100.0 3142 6284 2.928 1.571 0.0628 0.0435
2146 125.0 2513 5026 2.342 1.436 0.0975 0.0732 2146 125.0 2513 5026 2.342 1.257 0.0906 0.0627
150.0 2094 4188 1.952 1.197 0.1339 0.1005 150.0 2094 4188 1.952 1.047 0.1244 0.0861
175.0 1795 3590 1.673 1.026 0.1770 0.1328 175.0 1795 3590 1.673 0.898 0.1644 0.1138
200.0 1571 3142 1.464 0.898 0.2268 0.1701 200.0 1571 3142 1.464 0.786 0.2106 0.1458
225.0 1395 2790 1.300 0.797 0.2838 0.2128 225.0 1395 2790 1.300 0.698 0.2635 0.1824
250.0 1257 2514 1.171 0.718 0.3470 0.2603 250.0 1257 2514 1.171 0.629 0.3222 0.2231
300.0 1047 2094 0.976 0.598 0.4951 0.3713 300.0 1047 2094 0.976 0.524 0.4598 0.3183
H = 5m c = 40 mm
Dia 20 Reinf one face Total reinf (both Faces) Crack width (mm)
h s As (mm2) As both Asls/Auls %As w = 0.2 mm w = 0.1 mm
450 75.0 4189 8378 3.904 1.862 0.0376 0.0235
Auls 100.0 3142 6284 2.928 1.396 0.0580 0.0362
2146 125.0 2513 5026 2.342 1.117 0.0836 0.0523
150.0 2094 4188 1.952 0.931 0.1148 0.0718
175.0 1795 3590 1.673 0.798 0.1517 0.0948
200.0 1571 3142 1.464 0.698 0.1944 0.1215
225.0 1395 2790 1.300 0.620 0.2432 0.1520
250.0 1257 2514 1.171 0.559 0.2974 0.1859
300.0 1047 2094 0.976 0.465 0.4244 0.2652
H = 5m c = 40 mm H = 5m c = 40 mm
Dia = 16(mm) Reinf one face Total reinf (both Faces) Crack width (mm) Dia = 16(mm) Reinf one face Total reinf (both Faces) Crack width (mm)
h s As (mm2) As both Asls/Auls %As w = 0.2 mm w = 0.1 mm h s As (mm2) As both Asls/Auls %As w = 0.2 mm w = 0.1 mm
250 75.0 2681 5362 2.499 2.145 0.0789 0.0666 300 75.0 2681 5362 2.499 1.787 0.0740 0.0592
100.0 2011 4022 1.874 1.609 0.1220 0.1029 100.0 2011 4022 1.874 1.341 0.1143 0.0915
Auls 125.0 1608 3216 1.499 1.286 0.1761 0.1486 Auls 125.0 1608 3216 1.499 1.072 0.1651 0.1321
2146 150.0 1340 2680 1.249 1.072 0.2419 0.2041 2146 150.0 1340 2680 1.249 0.893 0.2268 0.1814
175.0 1149 2298 1.071 0.919 0.3196 0.2697 175.0 1149 2298 1.071 0.766 0.2996 0.2397
200.0 1005 2010 0.937 0.804 0.4096 0.3456 200.0 1005 2010 0.937 0.670 0.3840 0.3072
225.0 894 1788 0.833 0.715 0.5115 0.4315 225.0 894 1788 0.833 0.596 0.2397 0.1918
250.0 804 1608 0.749 0.643 0.6264 0.5285 250.0 804 1608 0.749 0.536 0.2936 0.2349
300.0 670 1340 0.624 0.536 0.7437 0.6275 300.0 670 1340 0.624 0.447 0.4184 0.3347
H = 5m c = 40 mm
Reinf one face Total reinf (both Faces) Crack width (mm) Dia = 16(mm)Reinf one face Total reinf (both Faces) Crack width (mm)
As (mm2) As both Asls/Auls %As (Total) w = 0.2 mm w = 0.1 mm h s As (mm2) As total Asls/Auls %As w = 0.2 mm w = 0.1 mm
2681 5362 2.499 1.532 0.0691 0.0518 400 75.0 2681 5362 2.499 1.341 0.0641 0.0444
2011 4022 1.874 1.149 0.1067 0.0800 100.0 2011 4022 1.874 1.006 0.0991 0.0686
1608 3216 1.499 0.919 0.1541 0.1156 Auls 125.0 1608 3216 1.499 0.804 0.1431 0.0991
1340 2680 1.249 0.766 0.2117 0.1588 2146 150.0 1340 2680 1.249 0.670 0.1966 0.1361
1149 2298 1.071 0.657 0.2796 0.2097 175.0 1149 2298 1.071 0.575 0.2597 0.1798
1005 2010 0.937 0.574 0.3584 0.2688 200.0 1005 2010 0.937 0.503 0.3328 0.2304
894 1788 0.833 0.511 0.4475 0.3356 225.0 894 1788 0.833 0.447 0.4156 0.2877
804 1608 0.749 0.459 0.5481 0.4111 250.0 804 1608 0.749 0.402 0.5089 0.3523
670 1340 0.624 0.383 0.7809 0.5857 300.0 670 1340 0.624 0.335 0.7252 0.5020
H = 5m c = 40 mm
Dia = 16(mm)Reinf one face Total reinf (both Faces) Crack width (mm)
h s As (mm2) As total Asls/Auls %As w = 0.2 mm w = 0.1 mm
450 75.0 2681 5362 2.499 1.192 0.0592 0.0370
100.0 2011 4022 1.874 0.894 0.0915 0.0572
Auls 125.0 1608 3216 1.499 0.715 0.1321 0.0826
2146 150.0 1340 2680 1.249 0.596 0.1814 0.1134
175.0 1149 2298 1.071 0.511 0.2397 0.1498
200.0 1005 2010 0.937 0.447 0.3072 0.1920
225.0 894 1788 0.833 0.397 0.3836 0.2397
250.0 804 1608 0.749 0.357 0.4698 0.2936
300.0 670 1340 0.624 0.298 0.6694 0.4184
Stellenbosch University http://scholar.sun.ac.za
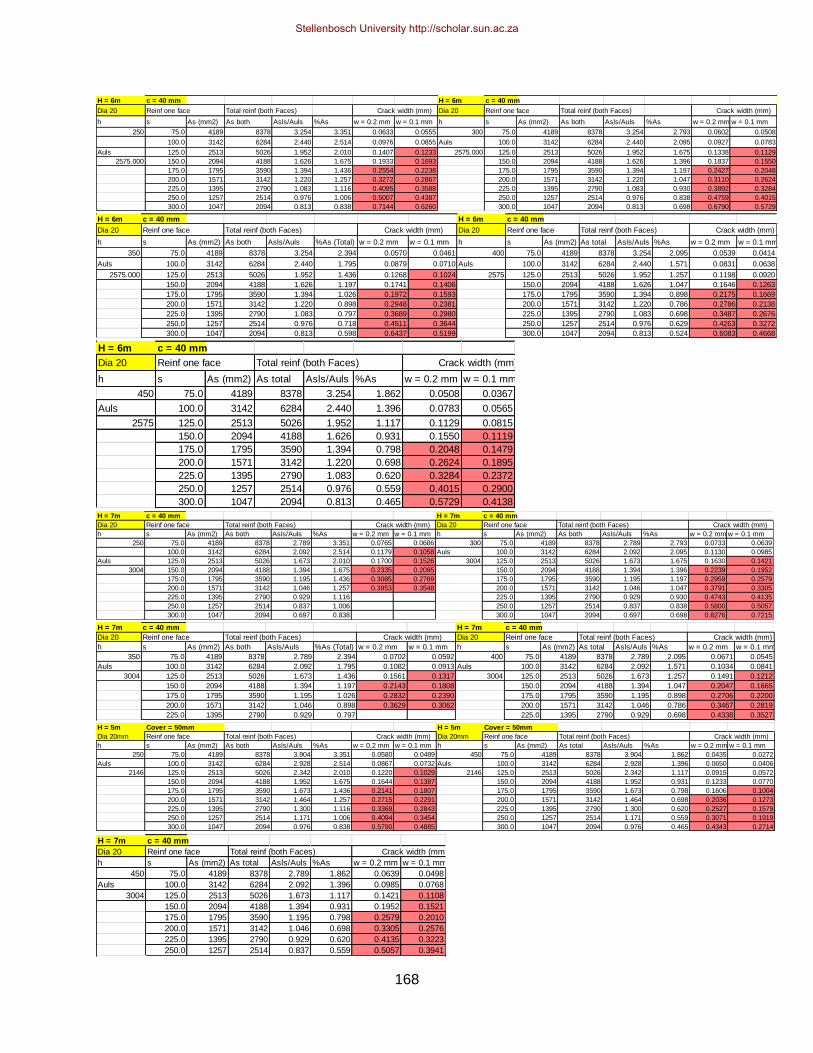
168
H = 6m c = 40 mm H = 6m c = 40 mm
Dia 20 Reinf one face Total reinf (both Faces) Crack width (mm) Dia 20 Reinf one face Total reinf (both Faces) Crack width (mm)
h s As (mm2) As both Asls/Auls %As w = 0.2 mm w = 0.1 mm h s As (mm2) As both Asls/Auls %As w = 0.2 mm w = 0.1 mm
250 75.0 4189 8378 3.254 3.351 0.0633 0.0555 300 75.0 4189 8378 3.254 2.793 0.0602 0.0508
100.0 3142 6284 2.440 2.514 0.0976 0.0855 Auls 100.0 3142 6284 2.440 2.095 0.0927 0.0783
Auls 125.0 2513 5026 1.952 2.010 0.1407 0.1233 2575.000 125.0 2513 5026 1.952 1.675 0.1338 0.1129
2575.000 150.0 2094 4188 1.626 1.675 0.1933 0.1693 150.0 2094 4188 1.626 1.396 0.1837 0.1550
175.0 1795 3590 1.394 1.436 0.2554 0.2238 175.0 1795 3590 1.394 1.197 0.2427 0.2048
200.0 1571 3142 1.220 1.257 0.3272 0.2867 200.0 1571 3142 1.220 1.047 0.3110 0.2624
225.0 1395 2790 1.083 1.116 0.4095 0.3588 225.0 1395 2790 1.083 0.930 0.3892 0.3284
250.0 1257 2514 0.976 1.006 0.5007 0.4387 250.0 1257 2514 0.976 0.838 0.4759 0.4015
300.0 1047 2094 0.813 0.838 0.7144 0.6260 300.0 1047 2094 0.813 0.698 0.6790 0.5729
H = 6m c = 40 mm H = 6m c = 40 mm
Dia 20 Reinf one face Total reinf (both Faces) Crack width (mm) Dia 20 Reinf one face Total reinf (both Faces) Crack width (mm)
h s As (mm2) As both Asls/Auls %As (Total) w = 0.2 mm w = 0.1 mm h s As (mm2) As total Asls/Auls %As w = 0.2 mm w = 0.1 mm
350 75.0 4189 8378 3.254 2.394 0.0570 0.0461 400 75.0 4189 8378 3.254 2.095 0.0539 0.0414
Auls 100.0 3142 6284 2.440 1.795 0.0879 0.0710 Auls 100.0 3142 6284 2.440 1.571 0.0831 0.0638
2575.000 125.0 2513 5026 1.952 1.436 0.1268 0.1024 2575 125.0 2513 5026 1.952 1.257 0.1198 0.0920
150.0 2094 4188 1.626 1.197 0.1741 0.1406 150.0 2094 4188 1.626 1.047 0.1646 0.1263
175.0 1795 3590 1.394 1.026 0.1972 0.1593 175.0 1795 3590 1.394 0.898 0.2175 0.1669
200.0 1571 3142 1.220 0.898 0.2948 0.2381 200.0 1571 3142 1.220 0.786 0.2786 0.2138
225.0 1395 2790 1.083 0.797 0.3689 0.2980 225.0 1395 2790 1.083 0.698 0.3487 0.2676
250.0 1257 2514 0.976 0.718 0.4511 0.3644 250.0 1257 2514 0.976 0.629 0.4263 0.3272
300.0 1047 2094 0.813 0.598 0.6437 0.5199 300.0 1047 2094 0.813 0.524 0.6083 0.4668
H = 6m c = 40 mm
Dia 20 Reinf one face Total reinf (both Faces) Crack width (mm)
h s As (mm2) As total Asls/Auls %As w = 0.2 mm w = 0.1 mm
450 75.0 4189 8378 3.254 1.862 0.0508 0.0367
Auls 100.0 3142 6284 2.440 1.396 0.0783 0.0565
2575 125.0 2513 5026 1.952 1.117 0.1129 0.0815
150.0 2094 4188 1.626 0.931 0.1550 0.1119
175.0 1795 3590 1.394 0.798 0.2048 0.1479
200.0 1571 3142 1.220 0.698 0.2624 0.1895
225.0 1395 2790 1.083 0.620 0.3284 0.2372
250.0 1257 2514 0.976 0.559 0.4015 0.2900
300.0 1047 2094 0.813 0.465 0.5729 0.4138
H = 7m c = 40 mm H = 7m c = 40 mm
Dia 20 Reinf one face Total reinf (both Faces) Crack width (mm) Dia 20 Reinf one face Total reinf (both Faces) Crack width (mm)
h s As (mm2) As both Asls/Auls %As w = 0.2 mm w = 0.1 mm h s As (mm2) As both Asls/Auls %As w = 0.2 mm w = 0.1 mm
250 75.0 4189 8378 2.789 3.351 0.0765 0.0686 300 75.0 4189 8378 2.789 2.793 0.0733 0.0639
100.0 3142 6284 2.092 2.514 0.1179 0.1058 Auls 100.0 3142 6284 2.092 2.095 0.1130 0.0985
Auls 125.0 2513 5026 1.673 2.010 0.1700 0.1526 3004 125.0 2513 5026 1.673 1.675 0.1630 0.1421
3004 150.0 2094 4188 1.394 1.675 0.2335 0.2095 150.0 2094 4188 1.394 1.396 0.2239 0.1952
175.0 1795 3590 1.195 1.436 0.3085 0.2769 175.0 1795 3590 1.195 1.197 0.2959 0.2579
200.0 1571 3142 1.046 1.257 0.3953 0.3548 200.0 1571 3142 1.046 1.047 0.3791 0.3305
225.0 1395 2790 0.929 1.116 225.0 1395 2790 0.929 0.930 0.4743 0.4135
250.0 1257 2514 0.837 1.006 250.0 1257 2514 0.837 0.838 0.5800 0.5057
300.0 1047 2094 0.697 0.838 300.0 1047 2094 0.697 0.698 0.8276 0.7215
H = 7m c = 40 mm H = 7m c = 40 mm
Dia 20 Reinf one face Total reinf (both Faces) Crack width (mm) Dia 20 Reinf one face Total reinf (both Faces) Crack width (mm)
h s As (mm2) As both Asls/Auls %As (Total) w = 0.2 mm w = 0.1 mm h s As (mm2) As total Asls/Auls %As w = 0.2 mm w = 0.1 mm
350 75.0 4189 8378 2.789 2.394 0.0702 0.0592 400 75.0 4189 8378 2.789 2.095 0.0671 0.0545
Auls 100.0 3142 6284 2.092 1.795 0.1082 0.0913 Auls 100.0 3142 6284 2.092 1.571 0.1034 0.0841
3004 125.0 2513 5026 1.673 1.436 0.1561 0.1317 3004 125.0 2513 5026 1.673 1.257 0.1491 0.1212
150.0 2094 4188 1.394 1.197 0.2143 0.1808 150.0 2094 4188 1.394 1.047 0.2047 0.1665
175.0 1795 3590 1.195 1.026 0.2832 0.2390 175.0 1795 3590 1.195 0.898 0.2706 0.2200
200.0 1571 3142 1.046 0.898 0.3629 0.3062 200.0 1571 3142 1.046 0.786 0.3467 0.2819
225.0 1395 2790 0.929 0.797 225.0 1395 2790 0.929 0.698 0.4338 0.3527
H = 5m Cover = 50mm H = 5m Cover = 50mm
Dia 20mm Reinf one face Total reinf (both Faces) Crack width (mm) Dia 20mm Reinf one face Total reinf (both Faces) Crack width (mm)
h s As (mm2) As both Asls/Auls %As w = 0.2 mm w = 0.1 mm h s As (mm2) As total Asls/Auls %As w = 0.2 mm w = 0.1 mm
250 75.0 4189 8378 3.904 3.351 0.0580 0.0489 450 75.0 4189 8378 3.904 1.862 0.0435 0.0272
Auls 100.0 3142 6284 2.928 2.514 0.0867 0.0732 Auls 100.0 3142 6284 2.928 1.396 0.0650 0.0406
2146 125.0 2513 5026 2.342 2.010 0.1220 0.1029 2146 125.0 2513 5026 2.342 1.117 0.0915 0.0572
150.0 2094 4188 1.952 1.675 0.1644 0.1387 150.0 2094 4188 1.952 0.931 0.1233 0.0770
175.0 1795 3590 1.673 1.436 0.2141 0.1807 175.0 1795 3590 1.673 0.798 0.1606 0.1004
200.0 1571 3142 1.464 1.257 0.2715 0.2291 200.0 1571 3142 1.464 0.698 0.2036 0.1273
225.0 1395 2790 1.300 1.116 0.3369 0.2843 225.0 1395 2790 1.300 0.620 0.2527 0.1579
250.0 1257 2514 1.171 1.006 0.4094 0.3454 250.0 1257 2514 1.171 0.559 0.3071 0.1919
300.0 1047 2094 0.976 0.838 0.5790 0.4885 300.0 1047 2094 0.976 0.465 0.4343 0.2714
H = 7m c = 40 mm
Dia 20 Reinf one face Total reinf (both Faces) Crack width (mm)
h s As (mm2) As total Asls/Auls %As w = 0.2 mm w = 0.1 mm
450 75.0 4189 8378 2.789 1.862 0.0639 0.0498
Auls 100.0 3142 6284 2.092 1.396 0.0985 0.0768
3004 125.0 2513 5026 1.673 1.117 0.1421 0.1108
150.0 2094 4188 1.394 0.931 0.1952 0.1521
175.0 1795 3590 1.195 0.798 0.2579 0.2010
200.0 1571 3142 1.046 0.698 0.3305 0.2576
225.0 1395 2790 0.929 0.620 0.4135 0.3223
250.0 1257 2514 0.837 0.559 0.5057 0.3941
Stellenbosch University http://scholar.sun.ac.za

169
Appendix A.6: SLS tension cracking to EN1992: Crack width calculation
Figure A.6.1: SLS Tension cracking to EN1992 – Calculation of crack width
Tension OnlySLS Reinforcement check using prEN2-1
Input prEN 2-1 Equations for Cracking
Units
fck 30 MPa
Concrete fcu = 37 MPa
Reinf. fy = 450 MPa
mod ratio αe = 15
overall depth of section h = 450 mm
Length of section b = 1000 mm
For Wall, H wall = 5 m
Reinf. Es = 200 kN/mm2
cover to reinf., c = 40 mm
Dia reinf = 20 mm
k1 0.8
k2 1 Tension
kt 0.4
k3 3.4
k4 0.425
Water p = 50 kN/m2
Tension axial force 700.0 kN total
wk max = 0.2 mm
Calcs
effective depth d = 400 mm
h/2 2.5(h-d)
heff 125.0 mm 225 125 per face 125
Ac,eff = 250000.00 mm2 total
As = 5013.00 total
fctm = 2.896 MPa
ρ eff = 0.0201 total reinf
Use Excel Solver to calculate As for given wk
As (Total) Sr, max εs εc ε ε final wk = Sr.ε Min strain
(mm2) (mm) (mm) 0.6*ζs/Es
5013 475.12 0.00070 0.000376 0.00032 0.00042 0.19903 0.0004189
) - ( s ,w cmmsrmcalcm ee
s
eff,c2143rm
A
Akkkcks
Stellenbosch University http://scholar.sun.ac.za

170
Table A.6.1: SLS Tension cracking to EN1992 – Data - crack width for given reinforcement
H 5m
cover 40
Dia = 16 (mm) NOTE for cover = 40mm, hc,eff is independent of h for dia =16 mm. %As varies with h, but As (mm2) for given w the same.
%As per face h Asls Asls total % As total Asls/Auls wk (mm) es ecm Sr (mm) h Asls %As Asls/Auls wk (mm)
0.2 450 900 1800 0.4 0.8387698 1.0049 0.00194 0.00086 861.3 250 1800 0.72 0.83877 1.0049
0.3 1350 2700 0.6 1.25815471 0.4819 0.00130 0.00060 619.6 2700 1.08 1.258155 0.4819
0.4 Auls 1800 3600 0.8 1.67753961 0.2909 0.00097 0.00047 498.7 3600 1.44 1.67754 0.2909
0.5 2146 2250 4500 1 2.09692451 0.1989 0.00078 0.00040 426.1 4500 1.8 2.096925 0.1989
0.6 2700 5400 1.2 2.51630941 0.1469 0.00065 0.00034 377.8 5400 2.16 2.516309 0.1469
0.7 3150 6300 1.4 2.93569432 0.1144 0.00056 0.00031 343.2 6300 2.52 2.935694 0.1144
0.8 3600 7200 1.6 3.35507922 0.0926 0.00049 0.00028 317.3 7200 2.88 3.355079 0.0926
0.9 4050 8100 1.8 3.77446412 0.0770 0.00043 0.00026 297.2 8100 3.24 3.774464 0.0770
1.0 4500 9000 2 4.19384902 0.0656 0.00039 0.00024 281.1 9000 3.6 4.193849 0.0656
1.1 4950 9900 2.2 4.61323392 0.0568 0.00035 0.00023 267.9 9900 3.96 4.613234 0.0568
H 5m
cover 40
Dia = 20 (mm) NOTE for cover = 40mm, hc,eff is independent of h for dia = 20mm. %As varies with h, but As (mm2) for given w the same. Total reinf
%As per face h Asls Asls total % As total Asls/Auls wk (mm) es ecm Sr (mm) h Asls %As Asls/Auls wk (mm)
0.2 450 900 1800 0.40 0.839 1.2605 0.00194 0.00089 1080.4 250 1800 0.72 0.839 1.2605
0.3 1350 2700 0.60 1.258 0.5955 0.00130 0.00062 765.6 2700 1.08 1.258 0.5955
0.4 Auls 1800 3600 0.80 1.678 0.3548 0.00097 0.00049 608.2 3600 1.44 1.678 0.3548
0.5 2146 2250 4500 1.00 2.097 0.2398 0.00078 0.00041 513.8 4500 1.8 2.097 0.2398
0.6 2700 5400 1.20 2.516 0.1753 0.00065 0.00036 450.8 5400 2.16 2.516 0.1753
0.7 3150 6300 1.40 2.936 0.1353 0.00056 0.00032 405.8 6300 2.52 2.936 0.1353
0.8 3600 7200 1.60 3.355 0.1085 0.00049 0.00029 372.1 7200 2.88 3.355 0.1085
0.9 4050 8100 1.80 3.774 0.0897 0.00043 0.00027 345.9 8100 3.24 3.774 0.0897
1.0 4500 9000 2.00 4.194 0.0758 0.00039 0.00025 324.9 9000 3.6 4.194 0.0758
1.1 4950 9900 2.20 4.613 0.0653 0.00035 0.00023 307.7 9900 3.96 4.613 0.0653
1.5 6750 13500 3.00 6.291 0.0407 0.00026 0.00019 261.9
H 5m
cover 40
Dia = 25 mm NOTE for cover = 40mm, hc,eff is independent of h for dia =25 mm and h > 250 mm. %As varies with h, but As (mm2) for given w the same.
%As per face h Asls Asls total %As total Asls/Auls wk (mm) es ecm Sr (mm) h Asls Asls total %As total Asls/Auls wk (mm) es ecm Sr (mm)
0.2 250 500 1000 0.40 0.46598322 450 900 1800 0.4 0.83877
0.3 750 1500 0.60 0.69897484 2.1737 0.00233 0.00105 1552.7 1350 2700 0.6 1.258155 1.6048 0.00194 0.00093 1375.6
0.4 Auls 1000 2000 0.80 0.93196645 1.2584 0.00175 0.00081 1198.5 Auls 1800 3600 0.8 1.67754 0.7485 0.00130 0.00065 962.4
0.5 2146 1250 2500 1.00 1.16495806 0.8282 0.00140 0.00067 986.0 2146 2250 4500 1 2.096925 0.4409 0.00097 0.00051 755.8
0.6 1500 3000 1.20 1.39794967 0.5910 0.00117 0.00057 844.3 2700 5400 1.2 2.516309 0.2949 0.00078 0.00042 631.8
0.7 1750 3500 1.40 1.63094129 0.4459 0.00100 0.00050 743.1 3150 6300 1.4 2.935694 0.2136 0.00065 0.00037 549.2
0.8 2000 4000 1.60 1.8639329 0.3503 0.00088 0.00045 667.3 3600 7200 1.6 3.355079 0.1634 0.00056 0.00033 490.2
0.9 2250 4500 1.80 2.09692451 0.2838 0.00078 0.00041 608.2 4050 8100 1.8 3.774464 0.1301 0.00049 0.00030 445.9
1.0 2500 5000 2.00 2.32991612 0.2356 0.00070 0.00038 561.0 4500 9000 2 4.193849 0.1067 0.00043 0.00027 411.5
1.1 2750 5500 2.20 2.56290774 0.1994 0.00064 0.00035 522.4 4950 9900 2.2 4.613234 0.0896 0.00039 0.00026 383.9
1.2 3000 6000 2.40 2.79589935 0.1716 0.00058 0.00033 490.2 5400 10800 2.4 5.032619 0.0767 0.00035 0.00024 361.4
1.3 3250 6500 2.60 3.02889096 0.1496 0.00054 0.00031 462.9 5850 11700 2.6 5.452004 0.0666 0.00032 0.00023 342.6
1.4 3500 7000 2.80 3.26188257 0.1319 0.00050 0.00029 439.6 6525 13050 2.9 6.081081 0.0586 0.00030 0.00022 326.7
1.6 4000 8000 3.20 3.7278658 0.1054 0.00044 0.00027 401.6 0.0494 0.00027 0.00020 307.0
1.8 4500 9000 3.60 4.19384902 0.0868 0.00039 0.00025 372.1
2 5000 10000 4 4.65983225 0.0732 0.00035 0.00023 348.5
H 5mcover50
Dia = 20 (mm) NOTE for cover = 50mm, hc,eff is independent of h for dia = 20mm and h >250 mm. %As varies with h, but As (mm2) for given w the same.
%As per face h Asls Asls total % As total Asls/Auls wk (mm) es ecm Sr (mm) h Asls As total % As total Asls/Auls
0.2 250 500 1000 0.40 0.4660 3.9270 0.00350 0.00154 1870.0 450 900 1800 0.40 0.839 wk (mm) es ecm Sr (mm)
0.3 750 1500 0.60 0.6990 1.8247 0.00233 0.00105 1303.3 1350 2700 0.60 1.258
0.4 Auls 1000 2000 0.80 0.9320 Auls 1800 3600 0.80 1.678 0.7199 0.00130 0.00073 925.6
0.5 2146 1250 2500 1.00 1.1650 0.7140 0.00140 0.00067 850.0 2146 2250 4500 1.00 2.097 0.4297 0.00097 0.00057 736.7
0.6 1500 3000 1.20 1.3979 0.5157 0.00117 0.00057 736.7 2700 5400 1.20 2.516 0.2909 0.00078 0.00047 623.3
0.7 1750 3500 1.40 1.6309 0.3934 0.00100 0.00050 655.7 3150 6300 1.40 2.936 0.2130 0.00065 0.00041 547.8
0.8 2000 4000 1.60 1.8639 0.3124 0.00088 0.00045 595.0 3600 7200 1.60 3.355 0.1646 0.00056 0.00036 493.8
0.9 2250 4500 1.80 2.0969 0.2556 0.00078 0.00041 547.8 4050 8100 1.80 3.774 0.1322 0.00049 0.00033 453.3
1.0 2500 5000 2.00 2.3299 0.2142 0.00070 0.00038 510.0 4500 9000 2.00 4.194 0.1094 0.00043 0.00030 421.9
1.1 2750 5500 2.20 2.5629 0.1829 0.00064 0.00035 479.1 4950 9900 2.20 4.613 0.0926 0.00039 0.00028 396.7
1.2 3000 6000 2.40 2.7959 0.1587 0.00058 0.00033 453.3 5400 10800 2.40 5.033 0.0798 0.00035 0.00026 376.1
1.3 3250 6500 2.60 3.0289 0.1394 0.00054 0.00031 431.5 5850 11700 2.60 5.452
1.4 3500 7000 2.80 3.2619 0.1239 0.00050 0.00029 412.9 6300 12600 2.80 5.871
1.5 3750 7500 3.00 3.4949 0.1111 0.00047 0.00028 396.7
1.6 4000 8000 3.20 3.7279 0.1004 0.00044 0.00027 382.5
1.8 4500 9000 3.60 4.1938 0.0837 0.00039 0.00025 358.9
Stellenbosch University http://scholar.sun.ac.za

171
Key
w > 0.2
0,1<w<0.2
0.05<w<0.1
w<0.05
H7m
cover 40
Dia = 20 (mm)
%As per face h Asls Asls total % As total Asls/Auls wk (mm) es ecm Sr (mm)
0.2 450 900 1800 0.40 0.599
0.3 1350 2700 0.60 0.899 2.8107 0.00327 0.00105 1269.3
0.4 Auls 1800 3600 0.80 1.198
0.5 3004 2250 4500 1.00 1.498 1.0558 0.00196 0.00067 816.0
0.55 2475 4950 1.10 1.648
0.6 2700 5400 1.20 1.798 0.7474 0.00163 0.00057 702.7
0.7 3150 6300 1.40 2.097 0.5591 0.00140 0.00050 621.7
0.8 3600 7200 1.60 2.397 0.4354 0.00123 0.00045 561.0
0.9 4050 8100 1.80 2.696 0.3495 0.00109 0.00041 513.8
1.0 4500 9000 2.00 2.996 0.2872 0.00098 0.00038 476.0
1.1 4950 9900 2.20 3.296 0.2407 0.00089 0.00035 445.1
Stellenbosch University http://scholar.sun.ac.za

172
APPENDIX B
SELECT DATA FOR
FORM ANALYSIS
FLEXURAL CRACKING
Stellenbosch University http://scholar.sun.ac.za
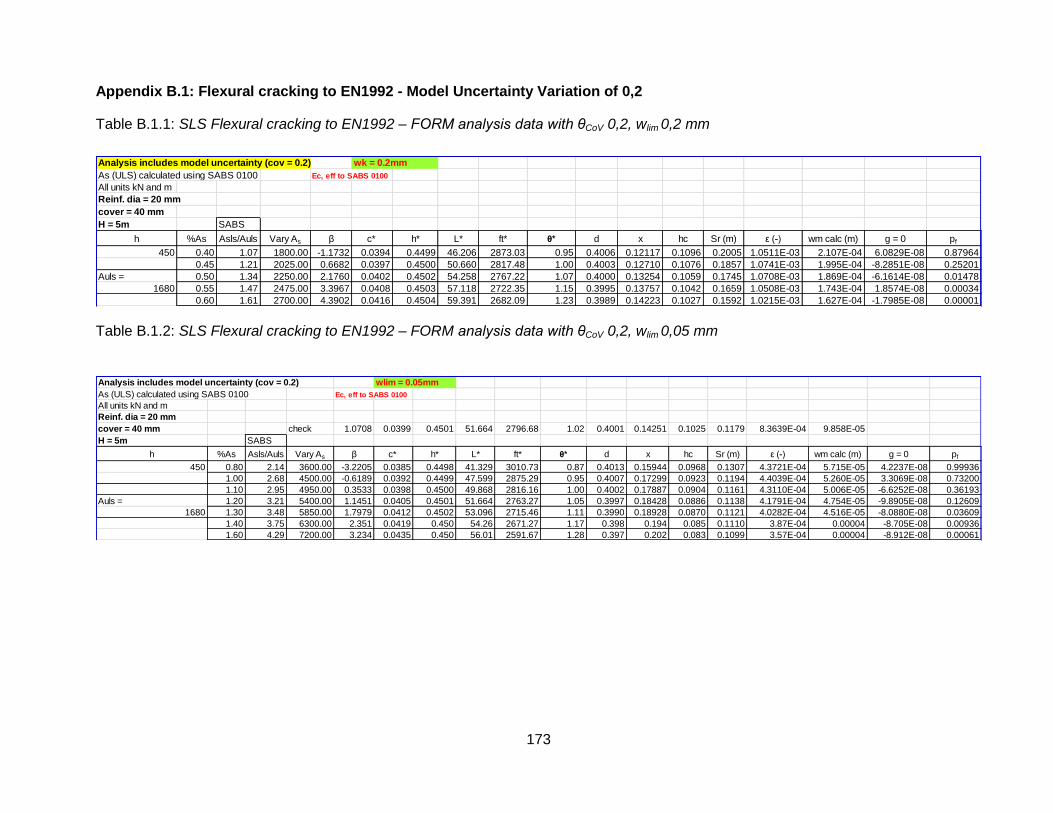
173
Appendix B.1: Flexural cracking to EN1992 - Model Uncertainty Variation of 0,2
Table B.1.1: SLS Flexural cracking to EN1992 – FORM analysis data with θCoV 0,2, wlim 0,2 mm
Table B.1.2: SLS Flexural cracking to EN1992 – FORM analysis data with θCoV 0,2, wlim 0,05 mm
Analysis includes model uncertainty (cov = 0.2) wk = 0.2mm
As (ULS) calculated using SABS 0100 Ec, eff to SABS 0100
All units kN and m
Reinf. dia = 20 mm
cover = 40 mm
H = 5m SABS
h %As Asls/Auls Vary As β c* h* L* ft* θ* d x hc Sr (m) ε (-) wm calc (m) g = 0 pf
450 0.40 1.07 1800.00 -1.1732 0.0394 0.4499 46.206 2873.03 0.95 0.4006 0.12117 0.1096 0.2005 1.0511E-03 2.107E-04 6.0829E-08 0.87964
0.45 1.21 2025.00 0.6682 0.0397 0.4500 50.660 2817.48 1.00 0.4003 0.12710 0.1076 0.1857 1.0741E-03 1.995E-04 -8.2851E-08 0.25201
Auls = 0.50 1.34 2250.00 2.1760 0.0402 0.4502 54.258 2767.22 1.07 0.4000 0.13254 0.1059 0.1745 1.0708E-03 1.869E-04 -6.1614E-08 0.01478
1680 0.55 1.47 2475.00 3.3967 0.0408 0.4503 57.118 2722.35 1.15 0.3995 0.13757 0.1042 0.1659 1.0508E-03 1.743E-04 1.8574E-08 0.00034
0.60 1.61 2700.00 4.3902 0.0416 0.4504 59.391 2682.09 1.23 0.3989 0.14223 0.1027 0.1592 1.0215E-03 1.627E-04 -1.7985E-08 0.00001
Analysis includes model uncertainty (cov = 0.2) wlim = 0.05mm
As (ULS) calculated using SABS 0100 Ec, eff to SABS 0100
All units kN and m
Reinf. dia = 20 mm
cover = 40 mm check 1.0708 0.0399 0.4501 51.664 2796.68 1.02 0.4001 0.14251 0.1025 0.1179 8.3639E-04 9.858E-05
H = 5m SABS
h %As Asls/Auls Vary As β c* h* L* ft* θ* d x hc Sr (m) ε (-) wm calc (m) g = 0 pf
450 0.80 2.14 3600.00 -3.2205 0.0385 0.4498 41.329 3010.73 0.87 0.4013 0.15944 0.0968 0.1307 4.3721E-04 5.715E-05 4.2237E-08 0.99936
1.00 2.68 4500.00 -0.6189 0.0392 0.4499 47.599 2875.29 0.95 0.4007 0.17299 0.0923 0.1194 4.4039E-04 5.260E-05 3.3069E-08 0.73200
1.10 2.95 4950.00 0.3533 0.0398 0.4500 49.868 2816.16 1.00 0.4002 0.17887 0.0904 0.1161 4.3110E-04 5.006E-05 -6.6252E-08 0.36193
Auls = 1.20 3.21 5400.00 1.1451 0.0405 0.4501 51.664 2763.27 1.05 0.3997 0.18428 0.0886 0.1138 4.1791E-04 4.754E-05 -9.8905E-08 0.12609
1680 1.30 3.48 5850.00 1.7979 0.0412 0.4502 53.096 2715.46 1.11 0.3990 0.18928 0.0870 0.1121 4.0282E-04 4.516E-05 -8.0880E-08 0.03609
1.40 3.75 6300.00 2.351 0.0419 0.450 54.26 2671.27 1.17 0.398 0.194 0.085 0.1110 3.87E-04 0.00004 -8.705E-08 0.00936
1.60 4.29 7200.00 3.234 0.0435 0.450 56.01 2591.67 1.28 0.397 0.202 0.083 0.1099 3.57E-04 0.00004 -8.912E-08 0.00061
Stellenbosch University http://scholar.sun.ac.za

174
Appendix B.2: Flexural cracking to EN1992: Model Uncertainty Variation of 0,1
Table B.2.1: SLS Flexural cracking to EN1992 – FORM analysis data with θCoV 0,1, wlim 0,2 mm
Table B.2.2: SLS Flexural cracking to EN1992 – FORM analysis data with θCoV 0,1, wlim 0,05 mm
Analysis includes model uncertainty (cov = 0.10) wlim = 0.2mm
As (ULS) calculated using SABS 0100 Ec, eff to SABS 0100
All units kN and m
Reinf. dia = 20 mm
cover = 40 mm
H = 5m SABS
h %As Asls/Auls Vary As β c* h* L* ft* θ* d x hc Sr (m) ε (-) wm calc (m) g = 0 pf
450 0.40 1.07 1800.00 -1.6095 0.0393 0.4499 45.119 2886.62 0.98 0.4006 0.12118 0.1096 0.2004 1.0140E-03 2.032E-04 1.9693E-08 0.94625
0.45 1.21 2025.00 0.6861 0.0397 0.4500 50.722 2816.69 1.00 0.4003 0.12710 0.1076 0.1857 1.0760E-03 1.999E-04 -5.2771E-08 0.24633
Auls = 0.50 1.34 2250.00 2.7863 0.0404 0.4502 55.820 2746.79 1.03 0.3998 0.13251 0.1059 0.1750 1.1146E-03 1.951E-04 7.2105E-09 0.00267
1680 0.55 1.47 2475.00 4.6332 0.0415 0.4505 60.265 2680.19 1.06 0.3989 0.13746 0.1043 0.1674 1.1324E-03 1.895E-04 -3.7088E-08 0.00000
Analysis includes model uncertainty (cov = 0.10)
As (ULS) calculated using SABS 0100 Ec, eff to SABS 0100 wlim = 0.05mm
All units kN and m cov = 0.1
Reinf. dia = 20 mm
cover = 40 mm corrected feb2013
H = 5m SABS
h %As Asls/Auls Vary As β c* h* L* ft* θ* d x hc Sr (m) ε (-) wm calc (m) g = 0 pf
450 0.80 2.14 3600.00 -4.0460 0.0383 0.4497 39.224 3063.37 0.96 0.4014 0.15947 0.0968 0.1304 3.9771E-04 5.187E-05 7.3358E-08 0.99997
too small! 1.00 2.68 4500.00 -0.9408 0.0390 0.4499 46.787 2896.56 0.98 0.4009 0.17303 0.0923 0.1191 4.2774E-04 5.093E-05 -7.8889E-08 0.82660
Auls = 1.20 3.21 5400.00 1.4383 0.0408 0.4502 52.459 2741.42 1.02 0.3994 0.18420 0.0887 0.1144 4.2873E-04 4.906E-05 -8.9207E-09 0.07517
1680 1.40 3.75 6300.00 3.1757 0.0433 0.4505 56.440 2608.21 1.06 0.3972 0.19355 0.0856 0.1137 4.1394E-04 4.708E-05 -4.0623E-08 0.00075
Stellenbosch University http://scholar.sun.ac.za

175
APPENDIX B.3: Flexural cracking to EN1992 – MATLAB equations for partial differentials
Figure B.3.1: EN1992 flexural cracking - Partial differential equations
Symbols used in MATLAB routine MATLAB
Cover c c
Section thickness h h
Liquid load Lk L
Concrete tensile strength fct ft
Crack width limit wl im wl
Width of section b b
Area of reinf. (tension) As A
Bar diameter θ phi
Modular ratio αe alfa
Height of wall/water H H
Elastic modulus steel Es E
Strain ε e
Model Uncertainty θ th
Effective depth d d
Depth to neutral axis x x
Effective depth of tension zone hc,eff hc
Crack spacing Sr s
Strain e e
Limit state function g g
NB: ALL UNITS TO BE IN kN & m
Mathlab Routine to find Partial Derivatives
syms c h L ft wl b A phi alfa H E k1 k2 kt th
d=h-phi/2-c
x=(-alfa*A+(alfa 2̂*A 2̂+2*b*alfa*A*d) 0̂.5)/b
hc=(h-x)/3
s=2*c+0.25*k1*k2*b*phi*hc/A
e=((H 2̂*L/A/(d-x/3)/6)*10 6̂-kt*(1+alfa*A/b/hc)*b*hc*ft/A)/E
g=wl-th*s*e
dc=diff(g,c)
dh=diff(g,h)
dL=diff(g,L)
dth=diff(g,th)
Equations
d = h-1/2*phi-c
x = (-alfa*A+(alfa 2̂*A 2̂+2*b*alfa*A*(h-1/2*phi-c)) (̂1/2))/b
hc =1/3*h-1/3*(-alfa*A+(alfa 2̂*A 2̂+2*b*alfa*A*(h-1/2*phi-c)) (̂1/2))/b
s = 2*c+1/4*k1*k2*b*phi*(1/3*h-1/3*(-alfa*A+(alfa 2̂*A 2̂+2*b*alfa*A*(h-1/2*phi-c)) (̂1/2))/b)/A
e = (1/6*H 2̂*L/A/(h-1/2*phi-c-1/3*(-alfa*A+(alfa 2̂*A 2̂+2*b*alfa*A*(h-1/2*phi-c)) (̂1/2))/b)-
kt*(1+alfa*A/b/(1/3*h-1/3*(-alfa*A+(alfa 2̂*A 2̂+2*b*alfa*A*(h-1/2*phi-c)) (̂1/2))/b))*b*(1/3*h-1/3*(-alfa*A+(alfa 2̂*A 2̂+2*b*alfa*A*(h-1/2*phi-c)) (̂1/2))/b)*ft/A)/E
g = wl-th*(2*c+1/4*k1*k2*b*phi*(1/3*h-1/3*(-alfa*A+(alfa 2̂*A 2̂+2*b*alfa*A*(h-1/2*phi-c)) (̂1/2))/b)/A)*(1/6*H 3̂*L/A/(h-1/2*phi-c-1/3*(-
alfa*A+(alfa 2̂*A 2̂+2*b*alfa*A*(h-1/2*phi-c)) (̂1/2))/b)-kt*(1+alfa*A/b/(1/3*h-1/3*(-alfa*A+(alfa 2̂*A 2̂+2*b*alfa*A*(h-1/2*phi-c)) (̂1/2))/b))*b*(1/3*h-1/3*(-
alfa*A+(alfa 2̂*A 2̂+2*b*alfa*A*(h-1/2*phi-c)) (̂1/2))/b)*ft/A)/E
Partial Derivatives using MATLAB
dg/dc = -th*(2+1/12*k1*k2*b*phi/(alfa 2̂*A 2̂+2*b*alfa*A*(h-1/2*phi-c)) (̂1/2)*alfa)*(1/6*H 2̂*L/A/(h-1/2*phi-c-1/3*(-alfa*A+(alfa 2̂*A 2̂+2*b*alfa*A*(h-1/2*phi-
c)) (̂1/2))/b)-kt*(1+alfa*A/b/(1/3*h-1/3*(-alfa*A+(alfa 2̂*A 2̂+2*b*alfa*A*(h-1/2*phi-c)) (̂1/2))/b))*b*(1/3*h-1/3*(-alfa*A+(alfa 2̂*A 2̂+2*b*alfa*A*(h-1/2*phi-
c)) (̂1/2))/b)*ft/A)/E-(2*c+1/4*k1*k2*b*phi*(1/3*h-1/3*(-alfa*A+(alfa 2̂*A 2̂+2*b*alfa*A*(h-1/2*phi-c)) (̂1/2))/b)/A)*(-1/6*H 2̂*L/A/(h-1/2*phi-c-1/3*(-
alfa*A+(alfa 2̂*A 2̂+2*b*alfa*A*(h-1/2*phi-c)) (̂1/2))/b) 2̂*(-1+1/3/(alfa 2̂*A 2̂+2*b*alfa*A*(h-1/2*phi-c)) (̂1/2)*alfa*A)+1/3*kt*alfa 2̂*A/(1/3*h-1/3*(-
alfa*A+(alfa 2̂*A 2̂+2*b*alfa*A*(h-1/2*phi-c)) (̂1/2))/b)/(alfa 2̂*A 2̂+2*b*alfa*A*(h-1/2*phi-c)) (̂1/2)*ft-1/3*kt*(1+alfa*A/b/(1/3*h-1/3*(-
alfa*A+(alfa 2̂*A 2̂+2*b*alfa*A*(h-1/2*phi-c)) (̂1/2))/b))*b/(alfa 2̂*A 2̂+2*b*alfa*A*(h-1/2*phi-c)) (̂1/2)*alfa*ft)/E)
dg/dh =th*(-1/4*k1*k2*b*phi*(1/3-1/3/(alfa 2̂*A 2̂+2*b*alfa*A*(h-1/2*phi-c)) (̂1/2)*alfa*A)/A*(1/6*H 2̂*L/A/(h-1/2*phi-c-1/3*(-alfa*A+(alfa 2̂*A 2̂+2*b*alfa*A*(h-
1/2*phi-c)) (̂1/2))/b)-kt*(1+alfa*A/b/(1/3*h-1/3*(-alfa*A+(alfa 2̂*A 2̂+2*b*alfa*A*(h-1/2*phi-c)) (̂1/2))/b))*b*(1/3*h-1/3*(-alfa*A+(alfa 2̂*A 2̂+2*b*alfa*A*(h-1/2*phi-
c)) (̂1/2))/b)*ft/A)/E-(2*c+1/4*k1*k2*b*phi*(1/3*h-1/3*(-alfa*A+(alfa 2̂*A 2̂+2*b*alfa*A*(h-1/2*phi-c)) (̂1/2))/b)/A)*(-1/6*H 2̂*L/A/(h-1/2*phi-c-1/3*(-
alfa*A+(alfa 2̂*A 2̂+2*b*alfa*A*(h-1/2*phi-c)) (̂1/2))/b) 2̂*(1-1/3/(alfa 2̂*A 2̂+2*b*alfa*A*(h-1/2*phi-c)) (̂1/2)*alfa*A)+kt*alfa/(1/3*h-1/3*(-
alfa*A+(alfa 2̂*A 2̂+2*b*alfa*A*(h-1/2*phi-c)) (̂1/2))/b)*(1/3-1/3/(alfa 2̂*A 2̂+2*b*alfa*A*(h-1/2*phi-c)) (̂1/2)*alfa*A)*ft-kt*(1+alfa*A/b/(1/3*h-1/3*(-
alfa*A+(alfa 2̂*A 2̂+2*b*alfa*A*(h-1/2*phi-c)) (̂1/2))/b))*b*(1/3-1/3/(alfa 2̂*A 2̂+2*b*alfa*A*(h-1/2*phi-c)) (̂1/2)*alfa*A)*ft/A)/E)
dg/dL =th*(-1/6*(2*c+1/4*k1*k2*b*phi*(1/3*h-1/3*(-alfa*A+(alfa 2̂*A 2̂+2*b*alfa*A*(h-1/2*phi-c)) (̂1/2))/b)/A)*H 2̂/A/(h-1/2*phi-c-1/3*(-
alfa*A+(alfa 2̂*A 2̂+2*b*alfa*A*(h-1/2*phi-c)) (̂1/2))/b)/E)
dg/d ft = th*(2*c+1/4*k1*k2*b*phi*(1/3*h-1/3*(-alfa*A+(alfa 2̂*A 2̂+2*b*alfa*A*(h-1/2*phi-c)) (̂1/2))/b)/A)*kt*(1+alfa*A/b/(1/3*h-1/3*(-
alfa*A+(alfa 2̂*A 2̂+2*b*alfa*A*(h-1/2*phi-c)) (̂1/2))/b))*b*(1/3*h-1/3*(-alfa*A+(alfa 2̂*A 2̂+2*b*alfa*A*(h-1/2*phi-c)) (̂1/2))/b)/A/E)
dg/d th = -(2*c+1/4*k1*k2*b*phi*(1/3*h-1/3*(-alfa*A+(alfa 2̂*A 2̂+2*b*alfa*A*(h-1/2*phi-c)) (̂1/2))/b)/A)*(1/6*H 2̂*L/A/(h-1/2*phi-c-1/3*(-
alfa*A+(alfa 2̂*A 2̂+2*b*alfa*A*(h-1/2*phi-c)) (̂1/2))/b)-kt*(1+alfa*A/b/(1/3*h-1/3*(-alfa*A+(alfa 2̂*A 2̂+2*b*alfa*A*(h-1/2*phi-c)) (̂1/2))/b))*b*(1/3*h-1/3*(-
alfa*A+(alfa 2̂*A 2̂+2*b*alfa*A*(h-1/2*phi-c)) (̂1/2))/b)*ft/A)/E
Stellenbosch University http://scholar.sun.ac.za

176
APPENDIX C
SELECT DATA FOR
FORM ANALYSIS
TENSION CRACKING
Stellenbosch University http://scholar.sun.ac.za

177
Analysis includes model uncertainty (cov = 0.10) Tension Case
As (ULS) calculated using EN & SABS 0100 Ec = 33
All units kN and m All values as MH/JR model
wk = 0.05 mm fy = 500MPa
cover = 40 mm
H = 7m SABS
Reinf. dia = 16 mm SANS EN
h Asls/Auls Asls/Auls %As Vary As β c* h* L* ft* θ* hc Sr (m) ε (-) wm calc (m) g = 0 pf
250 1.98 2.20 2.38 5940.00 -2.5943 0.0377 0.2501 66.687 4413.32 0.94 0.2501 0.2102 2.5292E-04 5.317E-05 7.7850E-08 0.99526
A uls = 2.34 2.60 2.81 7020.00 -1.6175 0.0378 0.2500 67.785 3679.69 0.95 0.2500 0.1896 2.7931E-04 5.295E-05 -8.3162E-08 0.94712
2700 2.7 3.00 3.24 8100.00 -0.6014 0.0386 0.2500 69.141 3103.41 0.97 0.2500 0.1760 2.9253E-04 5.150E-05 -3.9468E-08 0.72623
3000 3.06 3.40 3.67 9180.00 0.4096 0.0404 0.2500 70.592 2684.09 1.01 0.2500 0.1679 2.9400E-04 4.935E-05 -2.8104E-08 0.34105
3.42 3.80 4.10 10260.00 1.3698 0.0428 0.2500 71.963 2388.16 1.06 0.2500 0.1636 2.8731E-04 4.701E-05 -4.1458E-08 0.08537
3.78 4.20 4.54 11340.00 2.2551 0.0458 0.2500 73.172 2175.41 1.12 0.2500 0.1622 2.7625E-04 4.481E-05 -5.9926E-08 0.01206
4.14 4.60 4.97 12420.000 3.0606 0.0492 0.2500 74.209 2015.62 1.17 0.2500 0.1628 2.6343E-04 4.288E-05 -8.0589E-08 0.00110
4.5 5.00 5.40 13500.00 0.50000
SANS
Asls/Auls Asls/Auls %As Vary As β c* h* L* ft* θ* hc Sr (m) ε (-) wm calc (m) g = 0 pf
1.98 2.20 2.38 5940.00 -2.8934 0.0381 0.2502 66.452 4691.49 0.94 0.2502 0.2447 2.1652E-04 5.297E-05 2.3212E-08 0.99809
Reinf. dia = 20 mm 2.34 2.60 2.81 7020.00 -2.0210 0.0379 0.2501 67.338 3976.37 0.94 0.2501 0.2184 2.4285E-04 5.304E-05 -5.0826E-08 0.97836
h 2.70 3.00 3.24 8100.00 -1.0863 0.0383 0.2500 68.487 3366.84 0.96 0.2500 0.2001 2.6098E-04 5.221E-05 -4.9807E-08 0.86132
250 3.06 3.40 3.67 9180.00 -0.1224 0.0394 0.2500 69.824 2889.51 0.99 0.2500 0.1877 2.6945E-04 5.057E-05 -5.8183E-08 0.54870
A uls = 3.42 3.80 4.10 10260.00 0.8239 0.0412 0.2500 71.193 2538.58 1.03 0.2500 0.1798 2.6924E-04 4.840E-05 -4.6841E-08 0.20500
2700 3.78 4.20 4.54 11340.00 1.7236 0.0436 0.2500 72.477 2282.91 1.08 0.2500 0.1753 2.6329E-04 4.616E-05 -6.1538E-08 0.04239
3000 4.14 4.60 4.97 12420.00 2.5564 0.0464 0.2500 73.613 2093.36 1.14 0.2500 0.1734 2.5410E-04 4.405E-05 -5.7027E-08 0.00529
4.50 5.00 5.40 13500.00 3.3214 0.0496 0.2501 74.600 1947.20 1.19 0.2501 0.1733 2.4352E-04 4.221E-05 -6.4052E-08 0.00045
As (ULS) calculated using EN & SABS 0100 Ec = 33 (phi = 2) α = 18.3
All units kN and m All values as MH/JR model
wk = 0.2mm fy =500 MPa in calc of Tu
cover = 40 mm
H = 7m 0.9 NBB h=250mm hceff = h/2
0.2
Reinf. dia = 16 mm SANS EN check -3.7668 0.0385 0.2502 65.250 5448.73 0.93 0.2502 0.4476 4.8261E-04 2.160E-04 2.9335E-08
h Asls/Auls Asls/Auls %As Vary As β c* h* L* ft* θ* hc Sr (m) ε (-) wm calc (m) g = 0 pf
250 0.90 1.00 1.08 2700.00 -3.3731 0.0381 0.2502 65.496 5012.56 0.92 0.2502 0.3726 5.8601E-04 2.184E-04 7.0282E-08 0.99963
A uls = (EN) 1.08 1.20 1.30 3240.00 -2.2241 0.0378 0.2500 66.7048 3999.80 0.9145 0.2500 0.3226 0.0007 0.0002 0.0000 0.98693
2700 1.26 1.40 1.51 3780.00 -0.9018 0.0385 0.2500 68.586 3205.78 0.95 0.2500 0.2886 7.2895E-04 2.104E-04 -3.0532E-08 0.81641
Auls (SANS) 1.44 1.60 1.73 4320.00 0.4580 0.0403 0.2500 70.723 2689.54 1.02 0.2500 0.2658 7.3637E-04 1.957E-04 -1.5398E-08 0.32349
3000 1.62 1.80 1.94 4860.00 1.7529 0.0431 0.2501 72.714 2363.48 1.11 0.2501 0.2508 7.1770E-04 1.800E-04 -1.6407E-08 0.03981
1.80 2.00 2.16 5400.00 2.9350 0.0467 0.2502 74.413 2147.25 1.20 0.2502 0.2416 6.8720E-04 1.660E-04 5.2953E-08 0.00167
1.98 2.20 2.38 5940.00 4.0015 0.0510 0.2502 75.824 1995.15 1.29 0.2502 0.2369 6.5255E-04 1.546E-04 -2.4955E-08 0.00003
2.16 2.40 2.59 6480.00 4.9481 0.0560 0.2502 76.966 1892.74 1.38 0.2502 0.2356 6.1607E-04 1.451E-04 4.3542E-08 0.00000
Reinf. dia = 20 mm SABS EN
h Asls/Auls Asls/Auls %As Vary As β c* h* L* ft* θ* hc Sr (m) ε (-) wm calc (m) g = 0 pf
250 0.90 1.00 1.08 2700.00 -3.7670 0.0385 0.2502 65.250 5448.98 0.93 0.2502 0.4476 4.8255E-04 2.160E-04 5.1826E-08 0.99992
A uls = (EN) 1.08 1.20 1.30 3240.00 -2.8151 0.0381 0.2501 66.065 4499.66 0.91 0.2501 0.3849 5.6826E-04 2.187E-04 -6.8595E-09 0.99756
2700 1.26 1.40 1.51 3780.00 -1.6834 0.0382 0.2500 67.445 3645.19 0.93 0.2500 0.3409 6.3360E-04 2.160E-04 -8.8520E-08 0.95386
Auls (SANS) 1.44 1.60 1.73 4320.00 -0.4436 0.0390 0.2500 69.301 3008.63 0.97 0.2500 0.3095 6.6477E-04 2.058E-04 -9.2071E-10 0.67133
3000 1.62 1.80 1.94 4860.00 0.8100 0.0408 0.2500 71.279 2582.93 1.04 0.2500 0.2874 6.6649E-04 1.915E-04 -1.6940E-08 0.20898
1.80 2.00 2.16 5400.00 2.0043 0.0433 0.2501 73.113 2299.84 1.13 0.2501 0.2720 6.5067E-04 1.769E-04 -1.5132E-08 0.02252
1.98 2.20 2.38 5940.00 3.1087 0.0466 0.2502 74.709 2102.59 1.22 0.2502 0.2616 6.2646E-04 1.639E-04 -1.2097E-08 0.00094
2.16 2.40 2.59 6480.00 4.1136 0.0505 0.2502 76.059 1960.22 1.31 0.2502 0.2554 5.9859E-04 1.529E-04 2.7679E-08 0.00002
Appendix C1: Verification of CHM reliability model – tension cracking model
Table C.1.1: CHM reliability model using MH/JVR model
Stellenbosch University http://scholar.sun.ac.za

178
Appendix C.2: Tension cracking to EN1992
Table C.2.1: Tension cracking to EN1992 – θCoV 0,2
Analysis includes model uncertainty (cov = 0.20) Tension Case to compare to bending
As (ULS) calculated using SABS 0100 Ec = 27.4
All units kN and m All material values as MH/JR model except Ec
wk = 0.2mm fy = 450 Mpa affects Auls but not Asls
cover = 40 mm
H 5m
SANS SANS -0.5475 0.0392 0.2500 49.389 3112.60 0.89 0.2500 0.4117 5.4274E-04 2.234E-04 3.7287E-08
Reinf. dia = 20 mm Asls/Auls %As Vary As β c* h* L* ft* θ* hc Sr (m) ε (-) wm calc (m) g = 0 pf
h 1.16 1.00 2500.00 -1.6352 0.0390 0.2501 47.672 3628.00 0.83 0.2501 0.4780 5.0312E-04 2.405E-04 6.49E-08 0.94900
250 1.40 1.20 3000.00 -0.5799 0.0392 0.2500 48.563 3059.82 0.91 0.2500 0.4118 5.3380E-04 2.198E-04 -7.60E-08 0.71901
A uls = 1.63 1.40 3500.00 0.4442 0.0399 0.2500 49.415 2697.72 1.04 0.2500 0.3654 5.2414E-04 1.915E-04 -6.90E-08 0.32845
2150 1.86 1.60 4000.00 1.3873 0.0407 0.2500 50.160 2457.08 1.21 0.2500 0.3315 4.9890E-04 1.654E-04 -3.16E-08 0.08267
h/2 2.09 1.80 4500.00 2.2430 0.0417 0.2500 50.802 2284.35 1.39 0.2500 0.3057 4.6970E-04 1.436E-04 -1.75E-08 0.01245
2.33 2.00 5000.00 3.0168 0.0429 0.2501 51.358 2152.35 1.59 0.2501 0.2859 4.4088E-04 1.260E-04 2.17E-08 0.00128
H = 5m Asls/Auls %As Vary As β c* L* ft* θ* hc Sr (m) ε (-) wm calc (m) g = 0 pf h 250 %As
Reinf. dia = 20 mm 1.26 0.60 2700.00 -1.5296 0.0345 48.006 3315.27 0.834 0.2224 0.3983 6.0177E-04 2.397E-04 6.3598E-09 0.93694
h 1.47 0.70 3150.00 -0.3195 0.0384 48.838 2926.86 0.947 0.2421 0.3842 5.4997E-04 2.113E-04 -9.2531E-09 0.62534 1.08
450 1.67 0.80 3600.00 0.7391 0.0423 49.531 2649.82 1.064 0.2617 0.3755 5.0042E-04 1.879E-04 -8.7950E-09 0.22993 1.26
A uls = 1.88 0.90 4050.00 1.6738 0.0462 50.121 2437.31 1.183 0.2812 0.3702 4.5668E-04 1.691E-04 -3.3466E-09 0.04708 1.44
2150 2.09 1.00 4500.00 2.5076 0.0501 50.631 2266.05 1.300 0.3003 0.3671 4.1894E-04 1.538E-04 -2.0342E-09 0.00608 1.62
2.5(c+phi/2) 2.30 1.10 4950.00 3.2579 0.0538 51.079 2122.66 1.415 0.3192 0.3656 3.8663E-04 1.413E-04 6.8897E-09 0.00056 1.80
h Asls/Auls %As Vary As β c* h* L* ft* θ* hc Sr (m) ε (-) wm calc (m) g = 0 pf
250 1.16 1.00 2500.00 -1.6352 0.0390 0.2501 47.672 3628.000 0.8313 0.2501 4.7802E-01 5.031E-04 2.4050E-04 6.49E-08 0.94900
A uls = 1.16 1.00 2500.00 -1.6354 0.0390 0.2501 47.672 3628.130 0.8313 0.2501 4.7802E-01 5.031E-04 2.4049E-04 8.00E-08 0.94902
2150 1.40 1.20 3000.00 -0.5799 0.0392 0.2500 48.563 3059.818 0.9101 0.2500 4.1182E-01 5.338E-04 2.1983E-04 -7.60E-08 0.71901
hceff = h/2 1.63 1.40 3500.00 0.4442 0.0399 0.2500 49.415 2697.721 1.0445 0.2500 3.6544E-01 5.241E-04 1.9154E-04 -6.90E-08 0.32845
cov 0,2 1.86 1.60 4000.00 1.3873 0.0407 0.2500 50.160 2457.080 1.2097 0.2500 3.3146E-01 4.989E-04 1.6536E-04 -3.16E-08 0.08267
2.09 1.80 4500.00 2.2430 0.0417 0.2500 50.802 2284.345 1.3928 0.2500 3.0575E-01 4.697E-04 1.4361E-04 -1.75E-08 0.01245
2.33 2.00 5000.00 3.0168 0.0429 0.2501 51.358 2152.351 1.5867 0.2501 2.8586E-01 4.409E-04 1.2603E-04 2.17E-08 0.00128
Analysis includes model uncertainty (cov = 0.20) Tension Case
As (ULS) calculated using SABS 0100 Ec =
All units kN and m All material values as MH/JR model except Ec
wk = 0.05mm fy = 450 Mpa affects Auls but not Asls
cover = 40 mm h250 hc = h/2 same as 2.5(h-d) = 2.5(c+phi)
H = 5m h450 hc=2.5(h-d)
Reinf. dia = 20 mm SANS SANS
h Asls/Auls %As Vary As β c* L* ft* θ* hc Sr (m) ε (-) wm calc (m) g = 0 pf
450 2.93 1.40 6300.00 -0.3542 0.0384 48.808 2956.83 0.948 0.2418 0.2302 2.2903E-04 5.273E-05 6.7142E-10 0.63842
A uls = 3.35 1.60 7200.00 0.5881 0.0417 49.445 2658.48 1.038 0.2583 0.2268 2.1238E-04 4.816E-05 6.5494E-10 0.27824
2150 3.77 1.80 8100.00 1.4257 0.0449 49.995 2431.43 1.131 0.2744 0.2253 1.9630E-04 4.423E-05 -4.5567E-10 0.07697
4.19 2.00 9000.00 2.1744 0.0480 50.474 2250.49 1.222 0.2902 0.2251 1.8174E-04 4.090E-05 -7.3654E-10 0.01484
hc=2.5(h-d) 4.60 2.20 9900.00 2.8483 0.0511 50.897 2100.45 1.312 0.3054 0.2256 1.6895E-04 3.811E-05 -3.3836E-10 0.00220
Stellenbosch University http://scholar.sun.ac.za

179
Appendix C.3: Tension cracking to EN1992 – MATLAB equations for partial differentials
Figure C.3.1: Tension cracking to EN1992 – MATLAB equations for partial differentials
Symbols used Mathlab
cover c c
thickness section h h
liquid load Lk L
concrete tensile strength fct ft
crack width limit wlim wl
width of section b b
area of reinf. (tension) As A
dia. of reinf. θ phi
modular ratio αe alfa
height of wall H H
Elastic modulus steel Es E
Strain ε e
Model Uncertainty θ th
Tensile load Ns N
Diameter of reservoir D D
NB: ALL UNITS IN kN and m
Mathlab Routine to find Partial Derivatives
syms c h L ft wl b A phi alfa E k1 k2 kt th D
s=k3*c+k4*k1*k2*b*h*phi/A
e=((D*L/A/2)-kt*(1+alfa*A/b/h)*b*h*ft/A)/E
g=wl-th*s*e
dc=diff(g,c)
dh=diff(g,h)
dL=diff(g,L)
dth=diff(g,th)
Equations
g = wl - th*(k3*c+k4*k1*k2*b*h*phi/A)*(D*L/2/A- kt*b*h*ft*A-kt*ft*alfa)
Partial Derivatives (all to be x relevant std dev)
dg/dc = -th/E*k3*(D*L/2/A-kt*b*h*ft*A-kt*ft*alfa)
dg/dh = th/E(k3*c*kt*b*ft*A-k4/2*k1*k2*b*phi*h*D*L/A^2-2*k4*k1*k2*b^2*h*phi*ft*kt/A^2-k4*k1*k2*b*phi*kt*ft*alfa/A)
= th/E*(k3*c*kt*b*ft*A-k4*k1*k2*b*phi/A*(D*L/A+2*bb*h*ft/A+kt*ft*alfa))
dg/dL = -th/E*(k3*c*D/2/A+k4/2*k1*k2*b*phi*h*D/A^2)
dg/dth = -1/E*(k3*c+k4+k1*k2*b*h*phi/A)*(D*L/2/A-kt*ft*b*h/A+kt*ft*alfa)
dg/dft = th/E*(k3*c*kt*(b*h/A-alfa)+k4*k1*k2*b*h*phi*kt/A*(b*h/A-alfa))
= th/E*(k3*c*kt+k4*k1*k2*b*h*phi*kt/A)*(b*h/A-alfa)
Stellenbosch University http://scholar.sun.ac.za

180
APPENDIX D
SENSITIVITY ANALYSIS
using
REVERSE-FORM ANALYSIS
Stellenbosch University http://scholar.sun.ac.za

181
Appendix D.1: Sensitivity analysis for flexural cracking
Table D.1.1: Flexural cracking: Sensitivity analysis using reverse-FORM
Note:
1 variable changed and g solved for target beta to find As
Fixed variables solution stable gen after 3 iterations
Fct = 2.89
h = 450
dia = 20
H5m
This run: wlim = 0.2 mm
θ cov β c* h* L* ft* θ* d x hc Sr (m) ε (-) wm calc (m) g = 0 As %As α*xi c α*xi h α*xi L α*xi ft α*xi θ γ wlim γ c γ h γ L γ ft γ θ
0.10 0.5 0.039663 0.450034 50.26868 2822.609 0.999 0.4004 0.126635 0.1078 0.186777 0.001071579 0.000200147 -3.5302E-11 2006.481581 0.445885 -0.037159936 0.037159936 -0.0152295 0.01522953 -0.99382974 0.99382974 0.0583668 -0.08534 0.08534 1.001 0.994 1.000 1.025 0.975 1.001
0.15 0.5 0.0397 0.4500 50.263 2822.69 0.998 0.4004 0.12660 0.1078 0.1869 1.0721E-03 2.003E-04 9.5031E-11 2005.1 0.446 -0.03694 0.036943406 -0.01515 0.01515228 -0.98935 0.989350265 0.05808 -0.12735 0.12735 1.002 0.992 1.000 1.025 0.977 0.998
0.20 0.5 0.0397 0.4500 50.256 2822.79 0.997 0.4004 0.12655 0.1078 0.1870 1.0730E-03 2.006E-04 2.9982E-10 2003.0 0.445 -0.03664 0.036642611 -0.01505 0.0150457 -0.98320 0.983199135 0.05767 -0.16859 0.16859 1.003 0.992 1.000 1.025 0.977 0.997
0.25 0.5 0.0397 0.4500 50.246 2822.93 0.995 0.4004 0.12648 0.1079 0.1872 1.0741E-03 2.010E-04 5.8764E-10 2000.2 0.444 -0.03626 0.036259891 -0.01491 0.01491129 -0.97549 0.975491111 0.05717 -0.20884 0.20884 1.005 0.992 1.000 1.024 0.977 0.995
0.30 0.5 0.0397 0.4500 50.235 2823.09 0.992 0.4004 0.12638 0.1079 0.1874 1.0757E-03 2.016E-04 9.6990E-10 1996.5 0.444 -0.03580 0.035798233 -0.01475 0.01475089 -0.96637 0.966366392 0.05656 -0.24787 0.24787 1.008 0.991 1.000 1.024 0.977 0.992
Target Beta 1.5
θ cov β c* h* L* ft* θ* d x hc Sr (m) ε (-) wm calc (m) g = 0 As %As α*xi c α*xi h α*xi L α*xi ft α*xi θ γ wlim γ c γ h γ L γ ft γ θ
0.10 1.5 0.0399 0.4501 52.702 2790.28 1.009 0.4002 0.12919 0.1070 0.1813 1.0930E-03 1.982E-04 3.4693E-09 2109.5 0.469 -0.04370 0.043701063 -0.01673 0.01672594 -0.99262 0.992619995 0.05988 -0.09450 0.09450 0.991 0.999 1.000 1.074 0.965 1.009
0.15 1.5 0.0399 0.4501 52.681 2790.31 1.021 0.4002 0.12954 0.1069 0.1805 1.0853E-03 1.959E-04 -5.8372E-10 2123.8 0.472 -0.04389 0.043894977 -0.01669 0.01669012 -0.98701 0.987008914 0.05984 -0.14152 0.14152 0.980 0.999 1.000 1.074 0.966 1.021
0.20 1.5 0.0399 0.4501 52.652 2790.35 1.037 0.4002 0.13003 0.1067 0.1794 1.0747E-03 1.928E-04 4.0737E-10 2143.9 0.476 -0.04416 0.044161491 -0.01664 0.01663906 -0.97916 0.979164631 0.05978 -0.18824 0.18824 0.964 0.999 1.000 1.073 0.966 1.037
0.25 1.5 0.0400 0.4501 52.615 2790.42 1.058 0.4002 0.13066 0.1065 0.1781 1.0613E-03 1.890E-04 1.3622E-09 2169.7 0.482 -0.04449 0.04449281 -0.01657 0.01657152 -0.96910 0.969104986 0.05970 -0.23456 0.23456 0.945 0.999 1.000 1.073 0.966 1.058
0.30 1.5 0.0400 0.4501 52.570 2790.51 1.085 0.4002 0.13143 0.1062 0.1764 1.0453E-03 1.844E-04 1.3289E-09 2201.4 0.489 -0.04488 0.044879782 -0.01649 0.01648622 -0.95686 0.956861487 0.05959 -0.28032 0.28032 0.922 0.999 1.000 1.072 0.966 1.085
Target beta 2.0
θ cov β c* h* L* ft* θ* d x hc Sr (m) ε (-) wm calc (m) g = 0 As %As α*xi c α*xi h α*xi L α*xi ft α*xi θ γ wlim γ c γ h γ L γ ft γ θ
0.10 2.0 0.0401 0.4502 53.915 2773.63 1.015 0.4000 0.13047 0.1066 0.1788 1.1023E-03 1.971E-04 -3.6350E-09 2162.8 0.481 -0.04726 0.047255037 -0.01750 0.01750166 -0.99193 0.991929004 0.06065 -0.09929 0.09929 0.985 1.003 1.000 1.099 0.960 1.015
0.15 2.0 0.0401 0.4502 53.885 2773.51 1.034 0.4000 0.13106 0.1064 0.1775 1.0896E-03 1.934E-04 -3.3500E-09 2187.1 0.486 -0.04775 0.047745351 -0.01749 0.01749485 -0.98566 0.985656203 0.06077 -0.14901 0.14901 0.967 1.003 1.000 1.099 0.960 1.034
0.20 2.0 0.0401 0.4502 53.841 2773.34 1.061 0.4000 0.13188 0.1061 0.1758 1.0721E-03 1.884E-04 -4.0402E-09 2221.6 0.494 -0.04843 0.048428327 -0.01748 0.0174828 -0.97679 0.976792384 0.06093 -0.19878 0.19878 0.942 1.003 1.000 1.098 0.960 1.061
0.25 2.0 0.0401 0.4502 53.785 2773.13 1.098 0.4000 0.13295 0.1057 0.1736 1.0500E-03 1.822E-04 -8.5885E-09 2266.9 0.504 -0.04930 0.049298438 -0.01746 0.01746286 -0.96527 0.965265862 0.06113 -0.24858 0.24858 0.911 1.004 1.000 1.097 0.960 1.098
0.30 2.0 0.0402 0.4502 53.715 2772.89 1.143 0.4000 0.13427 0.1053 0.1709 1.0233E-03 1.749E-04 -8.7572E-10 2323.8 0.516 -0.05035 0.05035114 -0.01743 0.01743221 -0.95100 0.950996551 0.06136 -0.29833 0.29833 0.875 1.004 1.000 1.095 0.959 1.143
This run: wlim = 0.1
θ cov β c* h* L* ft* θ* d x hc Sr (m) ε (-) wm calc (m) g = 0 As %As α*xi c α*xi h α*xi L α*xi ft α*xi θ γ wlim γ c γ h γ L γ ft γ θ
0.10 0.5 0.0398 0.4500 50.261 2816.44 1.001 0.4003 0.15076 0.0998 0.1435 6.9654E-04 9.994E-05 -9.8352E-09 3119.7 0.693 -0.07092 0.070924113 -0.01968 0.01967721 -0.98743 0.987433 0.08139 -0.11373 0.11373 0.999 0.994 1.000 1.025 0.974547 1.00068653
0.15 0.5 0.0398 0.4500 50.251 2816.61 1.001 0.4003 0.15078 0.0998 0.1435 6.9609E-04 9.986E-05 1.0358E-10 3120.8 0.694 -0.07037 0.070366121 -0.01952 0.01951883 -0.97955 0.979545849 0.08077 -0.16921 0.16921 0.999 0.994 1.000 1.024 0.974605 1.00144211
0.20 0.5 0.0398 0.4500 50.238 2816.84 1.002 0.4003 0.15080 0.0997 0.1434 6.9561E-04 9.977E-05 3.0178E-10 3121.7 0.694 -0.06959 0.069589797 -0.01930 0.01930142 -0.96883 0.968826494 0.07991 -0.22310 0.22310 0.998 0.994 1.000 1.024 0.974684 1.00231275
0.25 0.5 0.0398 0.4500 50.222 2817.13 1.003 0.4003 0.15081 0.0997 0.1434 6.9515E-04 9.969E-05 5.7961E-10 3122.3 0.694 -0.06861 0.068613946 -0.01903 0.01903071 -0.95557 0.955570516 0.07884 -0.27495 0.27495 0.997 0.994 1.000 1.024 0.974784 1.0031241
0.30 0.5 0.0398 0.4500 50.203 2817.47 1.004 0.4003 0.15081 0.0997 0.1434 6.9478E-04 9.963E-05 9.4453E-10 3122.1 0.694 -0.06745 0.067454261 -0.01871 0.01871266 -0.94013 0.940128098 0.07757 -0.32441 0.32441 0.996 0.994 1.000 1.024 0.974901 1.00366828
Target Beta 1.5
θ cov β c* h* L* ft* θ* d x hc Sr (m) ε (-) wm calc (m) g = 0 As %As α*xi c α*xi h α*xi L α*xi ft α*xi θ γ wlim γ c γ h γ L γ ft γ θ
0.10 1.5 0.0403 0.4501 52.672 2770.96 1.014 0.3998 0.15422 0.0986 0.1401 7.0387E-04 9.861E-05 -1.7655E-09 3316.4 0.737 -0.08343 0.083431959 -0.02173 0.0217287 -0.98455 0.984553377 0.08425 -0.12698 0.12698 0.986 1.008 1.000 1.074 0.959 1.014
0.15 1.5 0.0403 0.4501 52.635 2771.04 1.032 0.3998 0.15486 0.0984 0.1393 6.9558E-04 9.691E-05 -9.3615E-10 3353.0 0.745 -0.08365 0.083653567 -0.02162 0.02162437 -0.97441 0.974412722 0.08415 -0.18966 0.18966 0.969 1.008 1.000 1.073 0.959 1.032
0.20 1.5 0.0403 0.4501 52.583 2771.16 1.06 0.3998 0.15576 0.0981 0.1383 6.8426E-04 9.461E-05 3.2790E-10 3404.2 0.756 -0.08393 0.083929416 -0.02148 0.02147577 -0.96035 0.96034555 0.08400 -0.25135 0.25135 0.946 1.008 1.000 1.072 0.959 1.057
0.25 1.5 0.0403 0.4501 52.517 2771.33 1.089 0.3998 0.15689 0.0978 0.1370 6.7022E-04 9.179E-05 1.4303E-09 3469.9 0.771 -0.08423 0.084225705 -0.02128 0.02128085 -0.94251 0.942508017 0.08379 -0.31163 0.31163 0.918 1.008 1.000 1.071 0.959 1.089
0.30 1.5 0.0403 0.4501 52.439 2771.56 1.129 0.3998 0.15824 0.0973 0.1354 6.5382E-04 8.856E-05 7.3151E-10 3549.9 0.789 -0.08450 0.08450061 -0.02104 0.02103773 -0.92113 0.921134017 0.08349 -0.37008 0.37008 0.886 1.008 1.000 1.069 0.959 1.129
Target beta 2.0
θ cov β c* h* L* ft* θ* d x hc Sr (m) ε (-) wm calc (m) g = 0 As %As α*xi c α*xi h α*xi L α*xi ft α*xi θ γ wlim γ c γ h γ L γ ft γ θ
0.10 2.0 0.0406 0.4502 53.871 2747.29 1.022 0.3996 0.15599 0.0981 0.1386 7.0598E-04 9.785E-05 -5.2027E-09 3421.8 0.760 -0.09033 0.090331147 -0.02281 0.02280909 -0.98285 0.982851971 0.08577 -0.13404 0.13404 0.978 1.016 1.000 1.098 0.950619 1.02204694
0.15 2.0 0.0406 0.4502 53.814 2747.03 1.050 0.3996 0.15703 0.0977 0.1374 6.9291E-04 9.523E-05 -4.5184E-09 3482.0 0.774 -0.09113 0.091129152 -0.02275 0.02274518 -0.97134 0.971341624 0.08602 -0.20069 0.20069 0.952 1.016 1.000 1.097 0.950529 1.0501738
0.20 2.0 0.0407 0.4502 53.735 2746.69 1.091 0.3995 0.15847 0.0972 0.1358 6.7506E-04 9.170E-05 -4.5858E-09 3567.8 0.793 -0.09219 0.09218713 -0.02265 0.0226476 -0.95518 0.955177427 0.08634 -0.26678 0.26678 0.917 1.017 1.000 1.096 0.950411 1.09058069
0.25 2.0 0.0407 0.4502 53.633 2746.29 1.144 0.3995 0.16032 0.0966 0.1339 6.5291E-04 8.740E-05 -9.3999E-09 3680.0 0.818 -0.09344 0.093438283 -0.02251 0.02250865 -0.93438 0.934377306 0.08673 -0.33193 0.33193 0.874 1.017 1.000 1.093 0.950272 1.14421268
0.30 2.0 0.0407 0.4502 53.509 2745.85 1.212 0.3995 0.16257 0.0959 0.1316 6.2699E-04 8.250E-05 -1.4579E-09 3820.5 0.849 -0.09481 0.094809784 -0.02232 0.02232145 -0.90904 0.909041509 0.08715 -0.39568 0.39568 0.825 1.017 1.000 1.091 0.950121 1.21216404
This run: wlim = 0.05
θ cov β c* h* L* ft* θ* d x hc Sr (m) ε (-) wm calc (m) g = 0 As %As α*xi c α*xi h α*xi L α*xi ft α*xi θ γ wlim γ c γ h γ L γ ft γ θ
0.10 0.5 0.0399 0.4501 50.243 2805.76 1.003 0.4001 0.17966 0.0901 0.1158 4.3078E-04 4.988E-05 -5.8253E-09 5013.7 1.114 -0.12237 0.122369575 -0.02566 0.02565517 -0.97312 0.973116712 0.12141 -0.15057 0.15057 0.998 0.998 1.000 1.024 0.97085 1.00253173
0.15 0.5 0.0399 0.4501 50.227 2806.15 1.005 0.4001 0.17976 0.0901 0.1157 4.2982E-04 4.973E-05 -5.8423E-09 5021.8 1.116 -0.12079 0.120785549 -0.02531 0.02530963 -0.95956 0.959559934 0.11991 -0.22279 0.22279 0.995 0.998 1.000 1.024 0.970988 1.00547429
0.20 0.5 0.0399 0.4501 50.204 2806.69 1.009 0.4001 0.17990 0.0901 0.1156 4.2854E-04 4.954E-05 4.5553E-09 5032.6 1.118 -0.11867 0.118666224 -0.02485 0.02484804 -0.94147 0.94147179 0.11791 -0.29160 0.29160 0.991 0.998 1.000 1.024 0.971172 1.00920185
0.25 0.5 0.0399 0.4501 50.178 2807.35 1.013 0.4002 0.18003 0.0900 0.1155 4.2725E-04 4.934E-05 -3.3560E-09 5042.9 1.121 -0.11604 0.116038313 -0.02428 0.02428296 -0.91966 0.919663231 0.11542 -0.35615 0.35615 0.987 0.997 1.000 1.023 0.971402 1.0133571
0.30 0.5 0.0399 0.4501 50.147 2808.11 1.018 0.4002 0.18017 0.0900 0.1154 4.2586E-04 4.914E-05 1.6873E-09 5053.8 1.123 -0.11303 0.113033706 -0.02364 0.02363977 -0.89496 0.8949585 0.11258 -0.41598 0.41598 0.983 0.997 1.000 1.022 0.971664 1.01754942
Target Beta 1.5 0
θ cov β c* h* L* ft* θ* d x hc Sr (m) ε (-) wm calc (m) g = 0 As %As α*xi c α*xi h α*xi L α*xi ft α*xi θ γ wlim γ c γ h γ L γ ft γ θ
0.10 1.5 0.0409 0.4502 52.604 2737.01 1.021 0.3993 0.18451 0.0886 0.1143 4.2841E-04 4.899E-05 -1.0228E-09 5428.0 1.206 -0.14433 0.144332548 -0.02857 0.02857381 -0.96604 0.966044924 0.12750 -0.16986 0.16986 0.980 1.021 1.000 1.072 0.947064 1.0206897
0.15 1.5 0.0409 0.4502 52.538 2737.29 1.046 0.3993 0.18558 0.0882 0.1137 4.2032E-04 4.778E-05 -4.3124E-10 5518.1 1.226 -0.14365 0.143646308 -0.02827 0.02827031 -0.94811 0.948109081 0.12716 -0.25197 0.25197 0.956 1.021 1.000 1.071 0.947158 1.04649065
0.20 1.5 0.0408 0.4502 52.449 2737.69 1.082 0.3993 0.18703 0.0877 0.1128 4.0954E-04 4.619E-05 7.0657E-09 5642.9 1.254 -0.14261 0.142610668 -0.02785 0.02785018 -0.92383 0.923834974 0.12664 -0.33072 0.33072 0.924 1.021 1.000 1.069 0.947296 1.08243865
0.25 1.5 0.0408 0.4502 52.339 2738.26 1.128 0.3994 0.18881 0.0871 0.1117 3.9671E-04 4.432E-05 2.9534E-09 5798.8 1.289 -0.14113 0.14112998 -0.02732 0.02731567 -0.89411 0.894109394 0.12591 -0.40503 0.40503 0.886 1.021 1.000 1.067 0.947495 1.12821566
0.30 1.5 0.0408 0.4502 52.214 2739.01 1.183 0.3994 0.19086 0.0864 0.1105 3.8236E-04 4.226E-05 -1.9923E-09 5983.5 1.330 -0.13918 0.139180619 -0.02668 0.02667988 -0.86001 0.860007884 0.12495 -0.47402 0.47402 0.845 1.020 1.000 1.065 0.947754 1.18330022
Target beta 2.0
θ cov β c* h* L* ft* θ* d x hc Sr (m) ε (-) wm calc (m) g = 0 As %As α*xi c α*xi h α*xi L α*xi ft α*xi θ γ wlim γ c γ h γ L γ ft γ θ
0.10 2.0 0.0415 0.4503 53.767 2700.59 1.032 0.3988 0.18707 0.0877 0.1139 4.2560E-04 4.848E-05 -9.1084E-09 5660.3 1.258 -0.15653 0.156529406 -0.03014 0.0301434 -0.96174 0.961743523 0.13089 -0.18030 0.18030 0.970 1.036 1.001 1.096 0.934459 1.03154723
0.15 2.0 0.0415 0.4503 53.666 2700.13 1.072 0.3988 0.18874 0.0872 0.1129 4.1318E-04 4.666E-05 1.9083E-09 5808.1 1.291 -0.15651 0.15650995 -0.02988 0.02987755 -0.94107 0.941068217 0.13133 -0.26787 0.26787 0.933 1.036 1.001 1.094 0.9343 1.07155482
0.20 2.0 0.0415 0.4503 53.528 2699.60 1.128 0.3988 0.19102 0.0864 0.1116 3.9689E-04 4.431E-05 1.0114E-09 6013.8 1.336 -0.15620 0.156198484 -0.02949 0.0294901 -0.91290 0.912901004 0.13185 -0.35208 0.35208 0.886 1.036 1.001 1.091 0.934119 1.1284357
0.25 2.0 0.0414 0.4503 53.358 2699.08 1.203 0.3988 0.19382 0.0855 0.1101 3.7759E-04 4.158E-05 -5.9225E-09 6276.7 1.395 -0.15541 0.155412228 -0.02898 0.02897876 -0.87819 0.878187751 0.13236 -0.43160 0.43160 0.832 1.036 1.001 1.088 0.933938 1.2026751
0.30 2.0 0.0414 0.4503 53.162 2698.61 1.294 0.3988 0.19709 0.0844 0.1084 3.5625E-04 3.863E-05 -5.4332E-09 6595.1 1.466 -0.15400 0.153998689 -0.02835 0.02834989 -0.83825 0.838248399 0.13281 -0.50515 0.50515 0.773 1.036 1.001 1.084 0.933777 1.29445919
Sensitivity Factors Partial safety factors
Target beta 0.5
VARY θ COV
Target beta 0.5
VARY θ COV
Reverse FORM
VARY θ COV
Target beta 0.5
Stellenbosch University http://scholar.sun.ac.za
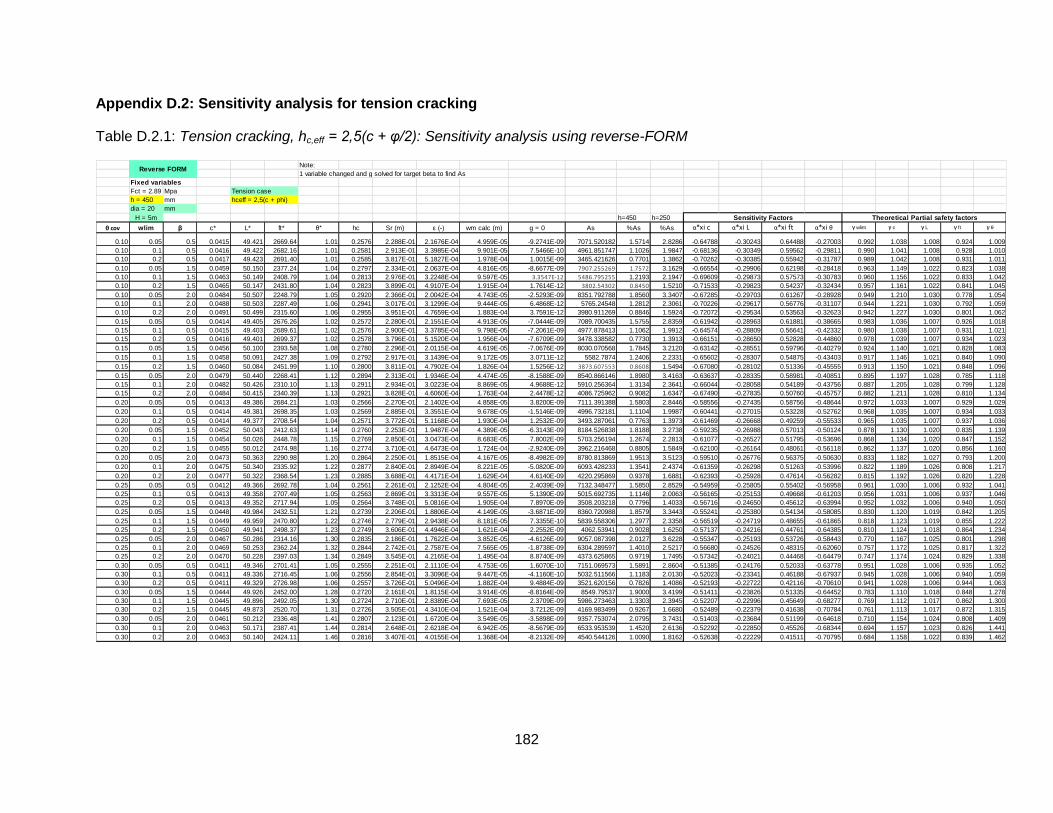
182
Appendix D.2: Sensitivity analysis for tension cracking
Table D.2.1: Tension cracking, hc,eff = 2,5(c + φ/2): Sensitivity analysis using reverse-FORM
Note:
1 variable changed and g solved for target beta to find As
Fixed variables
Fct = 2.89 Mpa Tension case
h = 450 mm hceff = 2,5(c + phi)
dia = 20 mm
H = 5m h=450 h=250
θ cov wlim β c* L* ft* θ* hc Sr (m) ε (-) wm calc (m) g = 0 As %As %As α*xi c α*xi L α*xi ft α*xi θ γ wlim γ c γ L γ ft γ θ
0.10 0.05 0.5 0.0415 49.421 2669.64 1.01 0.2576 2.288E-01 2.1676E-04 4.959E-05 -9.2741E-09 7071.520182 1.5714 2.8286 -0.64788 -0.30243 0.64488 -0.27003 0.992 1.038 1.008 0.924 1.009
0.10 0.1 0.5 0.0416 49.422 2682.16 1.01 0.2581 2.913E-01 3.3985E-04 9.901E-05 7.5466E-10 4961.851747 1.1026 1.9847 -0.68136 -0.30349 0.59562 -0.29811 0.990 1.041 1.008 0.928 1.010
0.10 0.2 0.5 0.0417 49.423 2691.40 1.01 0.2585 3.817E-01 5.1827E-04 1.978E-04 1.0015E-09 3465.421626 0.7701 1.3862 -0.70262 -0.30385 0.55942 -0.31787 0.989 1.042 1.008 0.931 1.011
0.10 0.05 1.5 0.0459 50.150 2377.24 1.04 0.2797 2.334E-01 2.0637E-04 4.816E-05 -8.6677E-09 7907.255269 1.7572 3.1629 -0.66554 -0.29906 0.62198 -0.28418 0.963 1.149 1.022 0.823 1.038
0.10 0.1 1.5 0.0463 50.149 2408.79 1.04 0.2813 2.976E-01 3.2248E-04 9.597E-05 3.3547E-12 5486.795255 1.2193 2.1947 -0.69609 -0.29873 0.57573 -0.30783 0.960 1.156 1.022 0.833 1.042
0.10 0.2 1.5 0.0465 50.147 2431.80 1.04 0.2823 3.899E-01 4.9107E-04 1.915E-04 1.7614E-12 3802.54302 0.8450 1.5210 -0.71533 -0.29823 0.54237 -0.32434 0.957 1.161 1.022 0.841 1.045
0.10 0.05 2.0 0.0484 50.507 2248.79 1.05 0.2920 2.366E-01 2.0042E-04 4.743E-05 -2.5293E-09 8351.792788 1.8560 3.3407 -0.67285 -0.29703 0.61267 -0.28928 0.949 1.210 1.030 0.778 1.054
0.10 0.1 2.0 0.0488 50.503 2287.49 1.06 0.2941 3.017E-01 3.1299E-04 9.444E-05 6.4868E-12 5765.24548 1.2812 2.3061 -0.70226 -0.29617 0.56776 -0.31107 0.944 1.221 1.030 0.792 1.059
0.10 0.2 2.0 0.0491 50.499 2315.60 1.06 0.2955 3.951E-01 4.7659E-04 1.883E-04 3.7591E-12 3980.911269 0.8846 1.5924 -0.72072 -0.29534 0.53563 -0.32623 0.942 1.227 1.030 0.801 1.062
0.15 0.05 0.5 0.0414 49.405 2676.26 1.02 0.2572 2.280E-01 2.1551E-04 4.913E-05 -7.0444E-09 7089.700435 1.5755 2.8359 -0.61942 -0.28963 0.61881 -0.38665 0.983 1.036 1.007 0.926 1.018
0.15 0.1 0.5 0.0415 49.403 2689.61 1.02 0.2576 2.900E-01 3.3785E-04 9.798E-05 -7.2061E-09 4977.878413 1.1062 1.9912 -0.64574 -0.28809 0.56641 -0.42332 0.980 1.038 1.007 0.931 1.021
0.15 0.2 0.5 0.0416 49.401 2699.37 1.02 0.2578 3.796E-01 5.1520E-04 1.956E-04 -7.6709E-09 3478.338582 0.7730 1.3913 -0.66151 -0.28650 0.52828 -0.44860 0.978 1.039 1.007 0.934 1.023
0.15 0.05 1.5 0.0456 50.100 2393.58 1.08 0.2780 2.296E-01 2.0115E-04 4.619E-05 -7.0676E-09 8030.070568 1.7845 3.2120 -0.63142 -0.28551 0.59796 -0.40279 0.924 1.140 1.021 0.828 1.083
0.15 0.1 1.5 0.0458 50.091 2427.38 1.09 0.2792 2.917E-01 3.1439E-04 9.172E-05 3.0711E-12 5582.7874 1.2406 2.2331 -0.65602 -0.28307 0.54875 -0.43403 0.917 1.146 1.021 0.840 1.090
0.15 0.2 1.5 0.0460 50.084 2451.99 1.10 0.2800 3.811E-01 4.7902E-04 1.826E-04 1.5256E-12 3873.607553 0.8608 1.5494 -0.67080 -0.28102 0.51336 -0.45555 0.913 1.150 1.021 0.848 1.096
0.15 0.05 2.0 0.0479 50.440 2268.41 1.12 0.2894 2.313E-01 1.9346E-04 4.474E-05 -8.1588E-09 8540.866146 1.8980 3.4163 -0.63637 -0.28335 0.58981 -0.40851 0.895 1.197 1.028 0.785 1.118
0.15 0.1 2.0 0.0482 50.426 2310.10 1.13 0.2911 2.934E-01 3.0223E-04 8.869E-05 4.9688E-12 5910.256364 1.3134 2.3641 -0.66044 -0.28058 0.54189 -0.43756 0.887 1.205 1.028 0.799 1.128
0.15 0.2 2.0 0.0484 50.415 2340.39 1.13 0.2921 3.828E-01 4.6060E-04 1.763E-04 2.4478E-12 4086.725962 0.9082 1.6347 -0.67490 -0.27835 0.50760 -0.45757 0.882 1.211 1.028 0.810 1.134
0.20 0.05 0.5 0.0413 49.386 2684.21 1.03 0.2566 2.270E-01 2.1402E-04 4.858E-05 3.8200E-09 7111.391388 1.5803 2.8446 -0.58556 -0.27435 0.58756 -0.48644 0.972 1.033 1.007 0.929 1.029
0.20 0.1 0.5 0.0414 49.381 2698.35 1.03 0.2569 2.885E-01 3.3551E-04 9.678E-05 -1.5146E-09 4996.732181 1.1104 1.9987 -0.60441 -0.27015 0.53228 -0.52762 0.968 1.035 1.007 0.934 1.033
0.20 0.2 0.5 0.0414 49.377 2708.54 1.04 0.2571 3.772E-01 5.1168E-04 1.930E-04 1.2532E-09 3493.287061 0.7763 1.3973 -0.61469 -0.26668 0.49259 -0.55533 0.965 1.035 1.007 0.937 1.036
0.20 0.05 1.5 0.0452 50.043 2412.63 1.14 0.2760 2.253E-01 1.9487E-04 4.389E-05 -6.3143E-09 8184.526838 1.8188 3.2738 -0.59235 -0.26988 0.57013 -0.50124 0.878 1.130 1.020 0.835 1.139
0.20 0.1 1.5 0.0454 50.026 2448.78 1.15 0.2769 2.850E-01 3.0473E-04 8.683E-05 7.8002E-09 5703.256194 1.2674 2.2813 -0.61077 -0.26527 0.51795 -0.53696 0.868 1.134 1.020 0.847 1.152
0.20 0.2 1.5 0.0455 50.012 2474.98 1.16 0.2774 3.710E-01 4.6473E-04 1.724E-04 -2.9240E-09 3962.216468 0.8805 1.5849 -0.62100 -0.26164 0.48061 -0.56118 0.862 1.137 1.020 0.856 1.160
0.20 0.05 2.0 0.0473 50.363 2290.98 1.20 0.2864 2.250E-01 1.8515E-04 4.167E-05 -8.4982E-09 8780.813869 1.9513 3.5123 -0.59510 -0.26776 0.56375 -0.50630 0.833 1.182 1.027 0.793 1.200
0.20 0.1 2.0 0.0475 50.340 2335.92 1.22 0.2877 2.840E-01 2.8949E-04 8.221E-05 -5.0820E-09 6093.428233 1.3541 2.4374 -0.61359 -0.26298 0.51263 -0.53996 0.822 1.189 1.026 0.808 1.217
0.20 0.2 2.0 0.0477 50.322 2368.54 1.23 0.2885 3.688E-01 4.4171E-04 1.629E-04 4.6140E-09 4220.295869 0.9378 1.6881 -0.62393 -0.25928 0.47614 -0.56282 0.815 1.192 1.026 0.820 1.228
0.25 0.05 0.5 0.0412 49.366 2692.78 1.04 0.2561 2.261E-01 2.1252E-04 4.804E-05 2.4039E-09 7132.348477 1.5850 2.8529 -0.54959 -0.25805 0.55402 -0.56958 0.961 1.030 1.006 0.932 1.041
0.25 0.1 0.5 0.0413 49.358 2707.49 1.05 0.2563 2.869E-01 3.3313E-04 9.557E-05 5.1390E-09 5015.692735 1.1146 2.0063 -0.56165 -0.25153 0.49668 -0.61203 0.956 1.031 1.006 0.937 1.046
0.25 0.2 0.5 0.0413 49.352 2717.94 1.05 0.2564 3.748E-01 5.0816E-04 1.905E-04 7.8970E-09 3508.203218 0.7796 1.4033 -0.56716 -0.24650 0.45612 -0.63994 0.952 1.032 1.006 0.940 1.050
0.25 0.05 1.5 0.0448 49.984 2432.51 1.21 0.2739 2.206E-01 1.8806E-04 4.149E-05 -3.6871E-09 8360.720988 1.8579 3.3443 -0.55241 -0.25380 0.54134 -0.58085 0.830 1.120 1.019 0.842 1.205
0.25 0.1 1.5 0.0449 49.959 2470.80 1.22 0.2746 2.779E-01 2.9438E-04 8.181E-05 7.3355E-10 5839.558306 1.2977 2.3358 -0.56519 -0.24719 0.48655 -0.61865 0.818 1.123 1.019 0.855 1.222
0.25 0.2 1.5 0.0450 49.941 2498.37 1.23 0.2749 3.606E-01 4.4946E-04 1.621E-04 2.2552E-09 4062.53941 0.9028 1.6250 -0.57137 -0.24216 0.44761 -0.64385 0.810 1.124 1.018 0.864 1.234
0.25 0.05 2.0 0.0467 50.286 2314.16 1.30 0.2835 2.186E-01 1.7622E-04 3.852E-05 -4.6126E-09 9057.087398 2.0127 3.6228 -0.55347 -0.25193 0.53726 -0.58443 0.770 1.167 1.025 0.801 1.298
0.25 0.1 2.0 0.0469 50.253 2362.24 1.32 0.2844 2.742E-01 2.7587E-04 7.565E-05 -1.8738E-09 6304.289597 1.4010 2.5217 -0.56680 -0.24526 0.48315 -0.62060 0.757 1.172 1.025 0.817 1.322
0.25 0.2 2.0 0.0470 50.228 2397.03 1.34 0.2849 3.545E-01 4.2165E-04 1.495E-04 8.8740E-09 4373.625865 0.9719 1.7495 -0.57342 -0.24021 0.44468 -0.64479 0.747 1.174 1.024 0.829 1.338
0.30 0.05 0.5 0.0411 49.346 2701.41 1.05 0.2555 2.251E-01 2.1110E-04 4.753E-05 1.6070E-10 7151.069573 1.5891 2.8604 -0.51385 -0.24176 0.52033 -0.63778 0.951 1.028 1.006 0.935 1.052
0.30 0.1 0.5 0.0411 49.336 2716.45 1.06 0.2556 2.854E-01 3.3096E-04 9.447E-05 -4.1160E-10 5032.511566 1.1183 2.0130 -0.52023 -0.23341 0.46188 -0.67937 0.945 1.028 1.006 0.940 1.059
0.30 0.2 0.5 0.0411 49.329 2726.98 1.06 0.2557 3.726E-01 5.0496E-04 1.882E-04 9.4884E-09 3521.620156 0.7826 1.4086 -0.52193 -0.22722 0.42116 -0.70610 0.941 1.028 1.006 0.944 1.063
0.30 0.05 1.5 0.0444 49.926 2452.00 1.28 0.2720 2.161E-01 1.8115E-04 3.914E-05 -8.8164E-09 8549.79537 1.9000 3.4199 -0.51411 -0.23826 0.51335 -0.64452 0.783 1.110 1.018 0.848 1.278
0.30 0.1 1.5 0.0445 49.896 2492.05 1.30 0.2724 2.710E-01 2.8389E-04 7.693E-05 2.3709E-09 5986.273463 1.3303 2.3945 -0.52207 -0.22996 0.45649 -0.68277 0.769 1.112 1.017 0.862 1.300
0.30 0.2 1.5 0.0445 49.873 2520.70 1.31 0.2726 3.505E-01 4.3410E-04 1.521E-04 3.7212E-09 4169.983499 0.9267 1.6680 -0.52489 -0.22379 0.41638 -0.70784 0.761 1.113 1.017 0.872 1.315
0.30 0.05 2.0 0.0461 50.212 2336.48 1.41 0.2807 2.123E-01 1.6720E-04 3.549E-05 -3.5898E-09 9357.753074 2.0795 3.7431 -0.51403 -0.23684 0.51199 -0.64618 0.710 1.154 1.024 0.808 1.409
0.30 0.1 2.0 0.0463 50.171 2387.41 1.44 0.2814 2.648E-01 2.6218E-04 6.942E-05 -8.5679E-09 6533.953539 1.4520 2.6136 -0.52292 -0.22850 0.45526 -0.68344 0.694 1.157 1.023 0.826 1.441
0.30 0.2 2.0 0.0463 50.140 2424.11 1.46 0.2816 3.407E-01 4.0155E-04 1.368E-04 -8.2132E-09 4540.544126 1.0090 1.8162 -0.52638 -0.22229 0.41511 -0.70795 0.684 1.158 1.022 0.839 1.462
Reverse FORM
Sensitivity Factors Theoretical Partial safety factors
Stellenbosch University http://scholar.sun.ac.za

183
Table D.2.2 Tension cracking, hc,eff = h/2: Sensitivity analysis using reverse-FORM
Note:
1 variable changed and g solved for target beta to find As
Fixed variables
Fct = 2.89 Mpa
h = 250 mm
dia = 20 mm
H = 5m
hceff = h/2 cover = 40mm, dia=20mm, h=250mm
θ cov wlim β c* h* L* ft* θ* hc Sr (m) ε (-) wm calc (m) g = 0 As %As α*xi c α*xi h α*xi L α*xi ft α*xi θ γ wlim γ c γ h γ L γ ft γ θ
0.1 0.05 0.5 0.0402 0.2500 49.535 2626.69 1.01 0.2500 0.2201 2.2445E-04 4.940E-05 -7.5760E-08 7153 2.86 -0.2026 0.0068 -0.3958 0.8156 -0.3702 0.988 1.004 1.000 1.010 0.909 1.014
0.1 0.05 1.5 0.0420 0.2500 50.542 2287.25 1.06 0.2500 0.2068 2.2726E-04 4.700E-05 6.9939E-08 8143 3.26 -0.2663 0.0011 -0.4055 0.7574 -0.4371 0.940 1.050 1.000 1.030 0.791 1.062
0.1 0.05 2 0.0432 0.2500 51.046 2151.52 1.09 0.2500 0.2024 2.2666E-04 4.587E-05 -7.6687E-08 8627 3.45 -0.2970 -0.0010 -0.4069 0.7290 -0.4633 0.917 1.081 1.000 1.041 0.744 1.092
0.15 0.05 0.5 0.0401 0.2500 49.498 2641.20 1.03 0.2500 0.2197 2.2191E-04 4.875E-05 -7.1746E-08 7171 2.87 -0.1855 0.0066 -0.3654 0.7576 -0.5080 0.975 1.003 1.000 1.009 0.914 1.027
0.15 0.05 1.5 0.0417 0.2500 50.390 2327.62 1.12 0.2500 0.2042 2.1759E-04 4.443E-05 2.2380E-08 8277 3.31 -0.2340 0.0021 -0.3642 0.6960 -0.5729 0.889 1.042 1.000 1.027 0.805 1.125
0.15 0.05 2 0.0427 0.2500 50.824 2201.07 1.18 0.2500 0.1985 2.1343E-04 4.236E-05 -8.6264E-08 8848 3.54 -0.2567 0.0006 -0.3617 0.6691 -0.5962 0.847 1.068 1.000 1.036 0.762 1.182
0.2 0.05 0.5 0.0401 0.2500 49.459 2656.59 1.04 0.2500 0.2192 2.1922E-04 4.805E-05 -7.3598E-08 7190 2.88 -0.1679 0.0064 -0.3337 0.6964 -0.6127 0.961 1.001 1.000 1.008 0.919 1.042
0.2 0.05 1.5 0.0414 0.2500 50.251 2366.10 1.20 0.2500 0.2014 2.0763E-04 4.181E-05 -4.7278E-08 8437 3.37 -0.2055 0.0029 -0.3265 0.6385 -0.6660 0.836 1.036 1.000 1.024 0.819 1.197
0.2 0.05 2 0.0423 0.2500 50.632 2246.32 1.29 0.2500 0.1942 1.9987E-04 3.882E-05 -1.4406E-08 9121 3.65 -0.2233 0.0018 -0.3225 0.6156 -0.6835 0.776 1.057 1.000 1.032 0.777 1.288
0.25 0.05 0.5 0.0400 0.2500 49.423 2671.28 1.06 0.2500 0.2185 2.1626E-04 4.726E-05 5.9443E-08 7218 2.89 -0.1517 0.0061 -0.3038 0.6384 -0.6907 0.945 1.000 1.000 1.008 0.924 1.057
0.25 0.05 1.5 0.0412 0.2500 50.133 2400.15 1.27 0.2500 0.1984 1.9789E-04 3.927E-05 -5.9487E-08 8618 3.45 -0.1821 0.0035 -0.2945 0.5883 -0.7307 0.785 1.030 1.000 1.022 0.831 1.275
0.25 0.05 2 0.0420 0.2500 50.474 2285.41 1.41 0.2500 0.1902 1.8726E-04 3.561E-05 -3.9576E-08 9412 3.76 -0.1968 0.0028 -0.2902 0.5702 -0.7429 0.712 1.049 1.000 1.029 0.791 1.405
0.3 0.05 0.5 0.0400 0.2500 49.390 2684.78 1.07 0.2500 0.2182 2.1416E-04 4.674E-05 8.4937E-10 7229 2.89 -0.1372 0.0058 -0.2770 0.5853 -0.7495 0.935 0.999 1.000 1.007 0.929 1.070
0.3 0.05 1.5 0.0410 0.2500 50.035 2429.55 1.36 0.2500 0.1955 1.8867E-04 3.689E-05 -3.3222E-08 8812 3.52 -0.1631 0.0039 -0.2677 0.5456 -0.7772 0.738 1.026 1.000 1.020 0.841 1.356
0.3 0.05 2 0.0417 0.2500 50.345 2318.36 1.53 0.2500 0.1862 1.7544E-04 3.266E-05 -5.6211E-09 9727 3.89 -0.1758 0.0034 -0.2640 0.5325 -0.7848 0.653 1.042 1.000 1.026 0.802 1.531
0.1 0.1 0.5 0.0401 0.2500 49.559 2635.02 1.02 0.2500 0.2796 3.5207E-04 9.844E-05 -5.6897E-08 5015 2.01 -0.1836 0.0014 -0.4150 0.7823 -0.4268 0.984 1.003 1.000 1.010 0.912 1.016
0.1 0.1 1.5 0.0417 0.2500 50.609 2311.66 1.07 0.2500 0.2614 3.5722E-04 9.338E-05 -8.0956E-08 5620 2.25 -0.2372 -0.0052 -0.4238 0.7201 -0.4955 0.934 1.043 1.000 1.032 0.800 1.072
0.1 0.1 2 0.0428 0.2500 51.134 2182.74 1.10 0.2500 0.2544 3.5611E-04 9.059E-05 -6.0797E-08 5926 2.37 -0.2635 -0.0076 -0.4248 0.6911 -0.5219 0.906 1.070 1.000 1.042 0.755 1.104
0.15 0.1 0.5 0.0400 0.2500 49.509 2652.93 1.03 0.2500 0.2788 3.4770E-04 9.695E-05 -6.7054E-08 5032 2.01 -0.1643 0.0017 -0.3743 0.7110 -0.5722 0.969 1.001 1.000 1.009 0.918 1.032
0.15 0.1 1.5 0.0414 0.2500 50.416 2360.08 1.14 0.2500 0.2572 3.4069E-04 8.763E-05 7.7304E-08 5735 2.29 -0.2040 -0.0031 -0.3712 0.6474 -0.6336 0.876 1.035 1.000 1.028 0.817 1.140
0.15 0.1 2 0.0423 0.2500 50.856 2242.24 1.20 0.2500 0.2486 3.3445E-04 8.314E-05 -7.8544E-08 6098 2.44 -0.2231 -0.0048 -0.3682 0.6203 -0.6556 0.831 1.057 1.000 1.037 0.776 1.204
0.2 0.1 0.5 0.0400 0.2500 49.460 2670.76 1.05 0.2500 0.2780 3.4324E-04 9.543E-05 -7.5224E-08 5049 2.02 -0.1458 0.0020 -0.3347 0.6404 -0.6757 0.954 1.000 1.000 1.008 0.924 1.049
0.2 0.1 1.5 0.0412 0.2500 50.250 2404.05 1.22 0.2500 0.2529 3.2489E-04 8.218E-05 -6.7671E-08 5861 2.34 -0.1765 -0.0015 -0.3261 0.5826 -0.7232 0.822 1.029 1.000 1.024 0.832 1.218
0.2 0.1 2 0.0419 0.2500 50.628 2294.42 1.32 0.2500 0.2424 3.1318E-04 7.592E-05 -1.7956E-08 6304 2.52 -0.1916 -0.0026 -0.3218 0.5598 -0.7392 0.759 1.047 1.000 1.032 0.794 1.317
0.25 0.1 0.5 0.0399 0.2500 49.417 2686.97 1.06 0.2500 0.2773 3.3915E-04 9.403E-05 -8.4208E-08 5066 2.03 -0.1295 0.0021 -0.2993 0.5768 -0.7490 0.940 0.998 1.000 1.007 0.930 1.064
0.25 0.1 1.5 0.0410 0.2500 50.114 2441.62 1.30 0.2500 0.2485 3.0979E-04 7.699E-05 -9.4543E-08 6002 2.40 -0.1549 -0.0004 -0.2894 0.5282 -0.7831 0.770 1.024 1.000 1.022 0.845 1.300
0.25 0.1 2 0.0416 0.2500 50.448 2338.18 1.44 0.2500 0.2363 2.9353E-04 6.938E-05 -1.2570E-08 6529 2.61 -0.1677 -0.0011 -0.2849 0.5101 -0.7940 0.694 1.040 1.000 1.028 0.809 1.442
0.3 0.1 0.5 0.0399 0.2500 49.380 2701.14 1.08 0.2500 0.2765 3.3542E-04 9.275E-05 6.8611E-09 5083 2.03 -0.1156 0.0022 -0.2690 0.5214 -0.8015 0.927 0.997 1.000 1.007 0.935 1.078
0.3 0.1 1.5 0.0408 0.2500 50.005 2473.27 1.39 0.2500 0.2442 2.9577E-04 7.221E-05 -6.2304E-08 6152 2.46 -0.1378 0.0004 -0.2595 0.4830 -0.8248 0.722 1.020 1.000 1.019 0.856 1.386
0.3 0.1 2 0.0414 0.2500 50.304 2374.54 1.57 0.2500 0.2305 2.7553E-04 6.350E-05 -3.2214E-09 6768 2.71 -0.1493 -0.0001 -0.2557 0.4695 -0.8318 0.635 1.034 1.000 1.026 0.822 1.575
0.1 0.2 0.5 0.0400 0.2500 49.576 2641.67 1.02 0.2500 0.3657 5.3696E-04 1.964E-04 -4.3964E-08 3500 1.40 -0.1542 -0.0037 -0.4292 0.7557 -0.4699 0.982 1.000 1.000 1.011 0.914 1.019
0.1 0.2 1.5 0.0413 0.2500 50.659 2330.18 1.08 0.2500 0.3402 5.4506E-04 1.854E-04 -6.7785E-08 3883 1.55 -0.1966 -0.0111 -0.4374 0.6921 -0.5393 0.927 1.034 1.000 1.033 0.806 1.079
0.1 0.2 2 0.0422 0.2501 51.200 2206.10 1.11 0.2501 0.3299 5.4423E-04 1.795E-04 -4.2045E-08 4076 1.63 -0.2174 -0.0139 -0.4384 0.6631 -0.5662 0.898 1.055 1.000 1.044 0.763 1.114
0.15 0.2 0.5 0.0400 0.2500 49.516 2662.11 1.04 0.2500 0.3645 5.2989E-04 1.932E-04 -5.2527E-08 3514 1.41 -0.1355 -0.0027 -0.3800 0.6746 -0.6182 0.966 0.999 1.000 1.009 0.921 1.036
0.15 0.2 1.5 0.0411 0.2500 50.432 2384.75 1.15 0.2500 0.3343 5.1981E-04 1.738E-04 -8.2638E-08 3966 1.59 -0.1662 -0.0079 -0.3757 0.6109 -0.6767 0.869 1.026 1.000 1.028 0.825 1.151
0.15 0.2 2 0.0418 0.2500 50.877 2273.21 1.22 0.2500 0.3215 5.1048E-04 1.641E-04 -6.8764E-08 4203 1.68 -0.1813 -0.0097 -0.3725 0.5842 -0.6978 0.821 1.044 1.000 1.037 0.787 1.219
0.2 0.2 0.5 0.0399 0.2500 49.460 2681.50 1.05 0.2500 0.3632 5.2297E-04 1.900E-04 -6.9902E-08 3528 1.41 -0.1184 -0.0019 -0.3343 0.5982 -0.7186 0.950 0.998 1.000 1.008 0.928 1.053
0.2 0.2 1.5 0.0408 0.2500 50.246 2432.31 1.23 0.2500 0.3278 4.9527E-04 1.624E-04 -1.3611E-08 4063 1.63 -0.1424 -0.0056 -0.3251 0.5416 -0.7620 0.812 1.021 1.000 1.024 0.842 1.232
0.2 0.2 2 0.0414 0.2500 50.623 2330.15 1.34 0.2500 0.3126 4.7841E-04 1.496E-04 -5.6892E-08 4352 1.74 -0.1545 -0.0068 -0.3206 0.5191 -0.7770 0.748 1.036 1.000 1.032 0.806 1.338
0.25 0.2 0.5 0.0399 0.2500 49.412 2698.43 1.07 0.2500 0.3619 5.1657E-04 1.870E-04 5.6918E-08 3543 1.42 -0.1040 -0.0013 -0.2952 0.5320 -0.7868 0.935 0.997 1.000 1.007 0.934 1.069
0.25 0.2 1.5 0.0407 0.2500 50.098 2471.93 1.32 0.2500 0.3213 4.7268E-04 1.519E-04 7.0752E-11 4168 1.67 -0.1242 -0.0039 -0.2850 0.4849 -0.8174 0.759 1.017 1.000 1.021 0.855 1.317
0.25 0.2 2 0.0412 0.2500 50.426 2376.87 1.47 0.2500 0.3038 4.4901E-04 1.364E-04 1.0940E-09 4516 1.81 -0.1347 -0.0047 -0.2806 0.4669 -0.8277 0.682 1.030 1.000 1.028 0.822 1.466
0.3 0.2 0.5 0.0398 0.2500 49.372 2712.81 1.08 0.2500 0.3610 5.1142E-04 1.846E-04 -1.7551E-09 3555 1.42 -0.0920 -0.0009 -0.2626 0.4760 -0.8342 0.923 0.996 1.000 1.007 0.939 1.083
0.3 0.2 1.5 0.0405 0.2500 49.981 2504.73 1.40 0.2500 0.3149 4.5210E-04 1.424E-04 1.3072E-09 4277 1.71 -0.1101 -0.0027 -0.2532 0.4387 -0.8552 0.712 1.014 1.000 1.019 0.867 1.405
0.3 0.2 2 0.0410 0.2500 50.273 2415.19 1.60 0.2500 0.2953 4.2240E-04 1.247E-04 7.4678E-09 4689 1.88 -0.1197 -0.0032 -0.2493 0.4248 -0.8620 0.624 1.025 1.000 1.025 0.836 1.604
Reverse FORM
Sensitivity Factors Theoretical Partial safety factors
Stellenbosch University http://scholar.sun.ac.za

184
APPENDIX E
SELECT DATA FOR
RELIABILITY CALIBRATION
using
REVERSE-FORM ANALYSIS
Stellenbosch University http://scholar.sun.ac.za

185
Appendix E.1: Reliability calibration of flexural cracking model
Table E.1.1: Flexural cracking – Reliability calibration – reverse-FORM determination of crack width
COV 0.2
ϒL ϒft %As ϒθ β c* h* L* ft* θ* d x hc Sr (m) ε (-) wm calc (m) wd g = 0 As α*xi c α*xi h α*xi L α*xi ft α*xi θ
1 1 0.25 1.128536 1.5 0.039672263 0.4500768 52.6975619 2806.981 1.0169555 0.400404494 0.0994287 0.116882686 0.287135968 0.00199196 0.000571963 0.000515412 -1.85615E-16 1125 -0.01343 -0.01137 -0.99152 0.038937 -0.12271
0.50 1.158091 1.5 0.039978118 0.4501154 52.6467133 2788.706 1.0390078 0.400137318 0.13257789 0.105845849 0.174041436 0.00102571 0.000178516 0.000160169 -1E-08 2250 -0.04757 -0.0171 -0.9777 0.061856 -0.19422
1.00 1.215875 1.5 0.040589324 0.4501677 52.5173825 2754.763 1.0707672 0.399578418 0.1726655 0.092500747 0.122290092 0.00051719 6.32475E-05 5.57075E-05 -1E-08 4500 -0.115 -0.02485 -0.94254 0.104824 -0.29458
1.25 1.242158 1.5 0.040838613 0.4501877 52.4496256 2737.954 1.0822743 0.39934908 0.18682502 0.087787559 0.11289058 0.00041091 4.63873E-05 4.04166E-05 4.14572E-16 5625 -0.14222 -0.02781 -0.92413 0.1263 -0.33022
1.50 1.267261 1.5 0.041045974 0.4502052 52.3840638 2721.088 1.0915584 0.399159198 0.19874183 0.083821115 0.106927835 0.00033862 3.62082E-05 3.11959E-05 -1E-08 6750 -0.16473 -0.0304 -0.9063 0.147982 -0.35869
2.00 1.312764 1.5 0.041350121 0.450235 52.2645648 2687.113 1.1048872 0.398884856 0.21801114 0.077407944 0.099902007 0.00024619 2.45949E-05 2.07003E-05 9.35429E-17 9000 -0.19754 -0.03481 -0.87382 0.192067 -0.39914
2.50 1.356376 1.5 0.041536414 0.45026 52.1623559 2652.882 1.1129425 0.398723582 0.23318342 0.07235886 0.095936626 0.00018935 1.81653E-05 1.49051E-05 -3.90618E-17 11250 -0.21752 -0.03852 -0.84604 0.237052 -0.42336
3.00 1.40121 1.5 0.041634345 0.4502816 52.0755143 2618.586 1.1171223 0.398647257 0.24560659 0.068225003 0.093376098 0.00015077 1.40781E-05 1.12238E-05 3.92217E-16 13500 -0.22798 -0.04172 -0.82243 0.282709 -0.43585
3.50 1.451943 1.5 0.041665078 0.4503005 52.0006846 2584.473 1.1183348 0.398635428 0.25605708 0.06474781 0.091552101 0.00012285 1.12472E-05 8.66984E-06 -1E-08 15750 -0.23126 -0.04452 -0.80209 0.328719 -0.43947
4.00 1.510606 1.5 0.041643464 0.4503171 51.9345165 2550.817 1.1171911 0.398673626 0.26502542 0.06176389 0.090149582 0.00010171 9.16931E-06 6.78792E-06 -1E-08 18000 -0.22896 -0.04698 -0.7841 0.374712 -0.43606
1.1 1 0.25 0.991475 1.5 0.039672263 0.4500768 52.6975619 2806.981 1.0169555 0.400404494 0.0994287 0.116882686 0.287135968 0.00199196 0.000571963 0.000586662 3.58437E-16 1125 -0.01343 -0.01137 -0.99152 0.038937 -0.12271
0.50 1.016965 1.5 0.039978118 0.4501154 52.6467133 2788.706 1.0390078 0.400137318 0.13257789 0.105845849 0.174041436 0.00102571 0.000178516 0.000182386 3.70065E-16 2250 -0.04757 -0.0171 -0.9777 0.061856 -0.19422
1.00 1.062547 1.5 0.040589324 0.4501677 52.5173825 2754.763 1.0707672 0.399578418 0.1726655 0.092500747 0.122290092 0.00051719 6.32475E-05 6.37368E-05 -3.63004E-16 4500 -0.115 -0.02485 -0.94254 0.104824 -0.29458
1.50 1.099387 1.5 0.041045974 0.4502052 52.3840638 2721.088 1.0915584 0.399159198 0.19874183 0.083821115 0.106927835 0.00033862 3.62082E-05 3.59504E-05 3.8105E-16 6750 -0.16473 -0.0304 -0.9063 0.147982 -0.35869
2.00 1.129317 1.5 0.041350121 0.450235 52.2645648 2687.113 1.1048872 0.398884856 0.21801114 0.077407944 0.099902007 0.00024619 2.45949E-05 2.40717E-05 -1E-08 9000 -0.19754 -0.03481 -0.87382 0.192067 -0.39914
2.50 1.153762 1.5 0.041536414 0.45026 52.1623559 2652.882 1.1129425 0.398723582 0.23318342 0.07235886 0.095936626 0.00018935 1.81653E-05 1.75226E-05 2.8047E-17 11250 -0.21752 -0.03852 -0.84604 0.237052 -0.42336
3.00 1.1772 1.5 0.041634345 0.4502816 52.0755143 2618.586 1.1171223 0.398647257 0.24560659 0.068225003 0.093376098 0.00015077 1.40781E-05 1.33681E-05 -1E-08 13500 -0.22798 -0.04172 -0.82243 0.282709 -0.43585
3.50 1.200078 1.5 0.041665078 0.4503005 52.0006846 2584.473 1.1183348 0.398635428 0.25605708 0.06474781 0.091552101 0.00012285 1.12472E-05 1.04894E-05 -1E-08 15750 -0.23126 -0.04452 -0.80209 0.328719 -0.43947
4.00 1.22498 1.5 0.041643464 0.4503171 51.9345165 2550.817 1.1171911 0.398673626 0.26502542 0.06176389 0.090149582 0.00010171 9.16931E-06 8.37064E-06 -1E-08 18000 -0.22896 -0.04698 -0.7841 0.374712 -0.43606
1.1 1.05 0.25 0.975847 1.5 0.039672263 0.4500768 52.6975619 2806.981 1.0169555 0.400404494 0.0994287 0.116882686 0.287135968 0.00199196 0.000571963 0.000596048 1E-08 1125 -0.01343 -0.01137 -0.99152 0.038937 -0.12271
0.50 1.000765 1.5 0.039978118 0.4501154 52.6467133 2788.706 1.0390078 0.400137318 0.13257789 0.105845849 0.174041436 0.00102571 0.000178516 0.000185338 -9.15338E-17 2250 -0.04757 -0.0171 -0.9777 0.061856 -0.19422
1.00 1.043536 1.5 0.040589324 0.4501677 52.5173825 2754.763 1.0707672 0.399578418 0.1726655 0.092500747 0.122290092 0.00051719 6.32475E-05 6.49076E-05 -1E-08 4500 -0.115 -0.02485 -0.94254 0.104824 -0.29458
1.50 1.076084 1.5 0.041045974 0.4502052 52.3840638 2721.088 1.0915584 0.399159198 0.19874183 0.083821115 0.106927835 0.00033862 3.62082E-05 3.67289E-05 5.95091E-17 6750 -0.16473 -0.0304 -0.9063 0.147982 -0.35869
2.00 1.100568 1.5 0.041350121 0.450235 52.2645648 2687.113 1.1048872 0.398884856 0.21801114 0.077407944 0.099902007 0.00024619 2.45949E-05 2.46914E-05 3.00148E-16 9000 -0.19754 -0.03481 -0.87382 0.192067 -0.39914
2.50 1.119476 1.5 0.041536414 0.45026 52.1623559 2652.882 1.1129425 0.398723582 0.23318342 0.07235886 0.095936626 0.00018935 1.81653E-05 1.80593E-05 -3.02669E-16 11250 -0.21752 -0.03852 -0.84604 0.237052 -0.42336
3.00 1.135854 1.5 0.041634345 0.4502816 52.0755143 2618.586 1.1171223 0.398647257 0.24560659 0.068225003 0.093376098 0.00015077 1.40781E-05 1.38547E-05 -1E-08 13500 -0.22798 -0.04172 -0.82243 0.282709 -0.43585
3.50 1.150332 1.5 0.041665078 0.4503005 52.0006846 2584.473 1.1183348 0.398635428 0.25605708 0.06474781 0.091552101 0.00012285 1.12472E-05 1.0943E-05 -1E-08 15750 -0.23126 -0.04452 -0.80209 0.328719 -0.43947
4.00 1.163731 1.5 0.041643464 0.4503171 51.9345165 2550.817 1.1171911 0.398673626 0.26502542 0.06176389 0.090149582 0.00010171 9.16931E-06 8.80109E-06 1.77185E-09 18000 -0.22896 -0.04698 -0.7841 0.374712 -0.43606
cov 0.1
ϒL ϒft %As ϒθ β c* h* L* ft* θ* d x hc Sr (m) ε (-) wm calc (m) wd g = 0 As α*xi c α*xi h α*xi L α*xi ft α*xi θ
0.25 1.115056 1.5 0.039673033 0.4500772 52.7183269 2806.805 1.0042699 0.400404203 0.09942866 0.116882859 0.287137815 0.00199305 0.00057228 0.000515412 1E-08 1125 -0.01352 -0.01144 -0.99717 0.039156 -0.06174
1 1 0.50 1.127216 1.5 0.039985036 0.4501173 52.6986324 2788.006 1.0098464 0.400132224 0.13257688 0.105846794 0.174056112 0.00102716 0.000178784 0.000160169 1.5084E-16 2250 -0.04834 -0.01737 -0.99181 0.062736 -0.09865
1.00 1.160998 1.5 0.040629795 0.450174 52.635537 2752.025 1.0180946 0.399544228 0.17265608 0.092505981 0.12237336 0.00051904 6.3517E-05 5.57075E-05 -1E-08 4500 -0.11943 -0.02578 -0.97466 0.108314 -0.15289
1.50 1.197886 1.5 0.041142765 0.4502178 52.5712125 2714.85 1.0238711 0.399075014 0.19871392 0.083834619 0.107125416 0.00034079 3.65077E-05 3.11959E-05 1E-08 6750 -0.17445 -0.03213 -0.95309 0.155368 -0.18979
2.00 1.235392 1.5 0.041497084 0.4502529 52.4879428 2677.333 1.0276728 0.398755831 0.21796262 0.077430098 0.100200856 0.00024834 2.48843E-05 2.07003E-05 9.35497E-17 9000 -0.21239 -0.03731 -0.93055 0.203986 -0.21439
2.50 1.274193 1.5 0.04172291 0.4502824 52.4062678 2639.613 1.0300627 0.398559516 0.23311561 0.072388938 0.096314964 0.00019143 1.84377E-05 1.49051E-05 -3.90618E-17 11250 -0.23641 -0.04166 -0.90844 0.253559 -0.22981
3.00 1.316697 1.5 0.041846641 0.4503074 52.327324 2602.212 1.0313593 0.398460779 0.24552357 0.068261285 0.093806064 0.00015275 1.4329E-05 1.12238E-05 3.92217E-16 13500 -0.24952 -0.04535 -0.88707 0.303417 -0.23816
3.50 1.366733 1.5 0.041889642 0.4503285 52.2506233 2565.595 1.0317886 0.398438896 0.25596409 0.064788151 0.092006352 0.00012472 1.14746E-05 8.66984E-06 -1E-08 15750 -0.25406 -0.04846 -0.86631 0.352929 -0.24093
4.00 1.42577 1.5 0.04186848 0.4503462 52.1752016 2530.156 1.0315173 0.398477716 0.26492787 0.061806107 0.090604305 0.00010345 9.37261E-06 6.78792E-06 -1E-08 18000 -0.25183 -0.05107 -0.8459 0.401525 -0.23918
cov 0.3
ϒL ϒft %As ϒθ β c* h* L* ft* θ* d x hc Sr (m) ε (-) wm calc (m) wd g = 0 As α*xi c α*xi h α*xi L α*xi ft α*xi θ
0.25 1.15136288 1.5 0.039671524 0.4500763 52.6793197 2807.134 1.0380483 0.400404784 0.09942874 0.116882523 0.2871342 0.001991 0.000571685 0.000515412 1E-08 1125 -0.01329 -0.01126 -0.98235 0.038581 -0.1822
1 1 0.50 1.208043 1.5 0.039967338 0.4501126 52.5654652 2789.8 1.0863759 0.400145253 0.13257947 0.105844375 0.174018564 0.00102344 0.000178097 0.000160169 -1E-08 2250 -0.04637 -0.01668 -0.95561 0.060479 -0.28411
1.00 1.302071 1.5 0.040531492 0.4501587 52.3467214 2758.73 1.1537645 0.399627246 0.17267896 0.092493259 0.122171099 0.00051452 6.28596E-05 5.57075E-05 -1E-08 4500 -0.10867 -0.02352 -0.89615 0.099776 -0.41784
1.50 1.37307 1.5 0.040926693 0.4501896 52.1516218 2728.863 1.1952108 0.399262882 0.19877619 0.083804461 0.106684338 0.00033593 3.58382E-05 3.11959E-05 -1.6839E-16 6750 -0.15179 -0.02809 -0.84312 0.13797 -0.49627
2.00 1.430147 1.5 0.04117621 0.4502136 51.9962798 2698.94 1.220378 0.39903739 0.2180685 0.077381701 0.099548353 0.0002436 2.42502E-05 2.07003E-05 -1E-08 9000 -0.17881 -0.03164 -0.80089 0.176657 -0.54258
2.50 1.47956 1.5 0.041322509 0.450234 51.8769312 2668.57 1.2349023 0.398911508 0.23326107 0.072324315 0.095502673 0.00018691 1.785E-05 1.49051E-05 -1E-08 11250 -0.19457 -0.03467 -0.76845 0.216364 -0.56887
3.00 1.526337 1.5 0.041395922 0.4502522 51.7858798 2637.671 1.2420455 0.39885632 0.24569966 0.068184196 0.092893206 0.00014848 1.37929E-05 1.12238E-05 3.92217E-16 13500 -0.20246 -0.03737 -0.7437 0.257228 -0.58169
3.50 1.577879 1.5 0.041415916 0.4502689 51.7159232 2606.322 1.2437314 0.398853024 0.25616001 0.064702975 0.091048082 0.00012072 1.09911E-05 8.66984E-06 -1E-08 15750 -0.2046 -0.03984 -0.72468 0.299181 -0.5847
4.00 1.636266 1.5 0.041394951 0.4502844 51.6611867 2574.689 1.2411388 0.398889454 0.26513286 0.061717181 0.089647366 9.9734E-05 8.94085E-06 6.78792E-06 -1E-08 18000 -0.20235 -0.04213 -0.7098 0.342027 -0.5800652
Stellenbosch University http://scholar.sun.ac.za

186
Appendix E.2: Reliability calibration of tension cracking model
Table E.2.1: Tension cracking, hc,eff = 2,5(c + φ/2) – Reliability calibration – reverse-FORM determination of crack width
cov 0.2
ϒc ϒft %As ϒθ β c* L* ft* θ* hc Sr (m) ε (-) w calc (m) wd g = 0 α*xi c α*xi L α*xi ft α*xi θ
1 1 0.25 1.38752 1.5 0.045607315 49.985266 2526.515694 1.17581545 0.278036573 1.870648699 0.0032767 0.006129552 0.00519432 -1E-08 -0.6330607 -0.254235 0.4082995 -0.60654
0.50 1.39656 1.5 0.045593092 49.99039682 2516.774342 1.172829333 0.277965459 0.980675652 0.00160666 0.00157561 0.001323207 -1.000E-08 -0.6316745 -0.255629 0.4218542 -0.598064
1.00 1.41678 1.5 0.045551637 50.00068516 2497.39697 1.166887896 0.277758185 0.535516371 0.00077216 0.000413507 0.000340578 -1E-08 -0.6276316 -0.258426 0.4489738 -0.581134
1.50 1.44044 1.5 0.045494786 50.01080729 2478.215574 1.160937059 0.277473931 0.386961766 0.00049444 0.000191328 0.00015421 -1E-08 -0.6220812 -0.261178 0.4760271 -0.564092
2.00 1.46830 1.5 0.045424294 50.02056915 2459.292396 1.154934764 0.277121469 0.312545763 0.00035587 0.000111227 8.74957E-05 -1E-08 -0.6151894 -0.263831 0.5029222 -0.546813
2.50 1.50134 1.5 0.045341481 50.02981654 2440.685124 1.148853902 0.276707403 0.267775699 0.00027296 7.30919E-05 5.59378E-05 -1E-08 -0.6070793 -0.266345 0.5295708 -0.529216
3.00 1.54057 1.5 0.045247396 50.03842426 2422.447232 1.142677875 0.276236981 0.237821182 0.00021785 5.18097E-05 3.84285E-05 4.29724E-16 -0.5978474 -0.268685 0.5558883 -0.511249
3.50 1.58843 1.5 0.045142919 50.04628931 2404.628175 1.136397759 0.275714597 0.216326798 0.00017862 3.86406E-05 2.76506E-05 -1E-08 -0.5875733 -0.270823 0.5817935 -0.492878
4.00 1.64594 1.5 0.045028822 50.0533265 2387.273457 1.130010399 0.27514411 0.20011529 0.0001493 2.98778E-05 2.05125E-05 -1.1882E-16 -0.5763259 -0.272736 0.6072088 -0.47409
1.1 1.25 0.25 1.159123173 1.5 0.045607315 49.98526604 2526.515694 1.17581545 0.27803657 1.870648699 0.0032767 0.006129552 0.006217814 1E-08 -0.6330607 -0.254235 0.4082995 -0.60654
0.50 1.156703551 1.5 0.045593092 49.99039682 2516.774342 1.172829333 0.27796546 0.980675652 0.00160666 0.00157561 0.001597576 6.20164E-17 -0.6316745 -0.255629 0.4218542 -0.598064
1.00 1.152352732 1.5 0.045551637 50.00068516 2497.39697 1.166887896 0.277758185 0.535516371 0.00077216 0.000413507 0.000418722 -3.2564E-16 -0.6276316 -0.258426 0.4489738 -0.581134
1.50 1.148700521 1.5 0.045494786 50.01080729 2478.215574 1.160937059 0.277473931 0.386961766 0.00049444 0.000191328 0.000193366 3.02492E-16 -0.6220812 -0.261178 0.4760271 -0.564092
2.00 1.1457271 1.5 0.045424294 50.02056915 2459.292396 1.154934764 0.277121469 0.312545763 0.00035587 0.000111227 0.000112112 1E-08 -0.6151894 -0.263831 0.5029222 -0.546813
2.50 1.143652133 1.5 0.045341481 50.02981654 2440.685124 1.148853902 0.276707403 0.267775699 0.00027296 7.30919E-05 7.34156E-05 1E-08 -0.6070793 -0.266345 0.5295708 -0.529216
3.00 1.142724867 1.5 0.045247396 50.03842426 2422.447232 1.142677875 0.276236981 0.237821182 0.00021785 5.18097E-05 5.18076E-05 3.64699E-17 -0.5978474 -0.268685 0.5558883 -0.511249
3.50 1.142724867 1.5 0.045142919 50.04628931 2404.628175 1.136397759 0.275714597 0.216326798 0.00017862 3.86406E-05 3.84256E-05 1.2399E-09 -0.5875733 -0.270823 0.5817935 -0.492878
4.00 1.144044739 1.5 0.045028822 50.0533265 2387.273457 1.130010399 0.275144112 0.20011529 0.0001493 2.98778E-05 2.95113E-05 2.82712E-16 -0.5763259 -0.272736 0.6072088 -0.47409
1.1 1.15 0.25 1.2234347 1.5 0.045607315 49.98526604 2526.515694 1.17581545 0.278036573 1.870648699 0.0032767 0.006129552 0.005890983 -1E-08 -0.6330607 -0.254235 0.4082995 -0.60654
0.50 1.224512356 1.5 0.045593092 49.99039682 2516.774342 1.172829333 0.277965459 0.980675652 0.00160666 0.00157561 0.001509108 -1.9776E-16 -0.6316745 -0.255629 0.4218542 -0.598064
1.00 1.227702895 1.5 0.045551637 50.00068516 2497.39697 1.166887896 0.277758185 0.535516371 0.00077216 0.000413507 0.000393032 -1E-08 -0.6276316 -0.258426 0.4489738 -0.581134
1.50 1.232380544 1.5 0.045494786 50.01080729 2478.215574 1.160937059 0.277473931 0.386961766 0.00049444 0.000191328 0.000180245 -1E-08 -0.6220812 -0.261178 0.4760271 -0.564092
2.00 1.238665962 1.5 0.045424294 50.02056915 2459.292396 1.154934764 0.277121469 0.312545763 0.00035587 0.000111227 0.000103708 2.4278E-16 -0.6151894 -0.263831 0.5029222 -0.546813
2.50 1.247113508 1.5 0.045341481 50.02981654 2440.685124 1.148853902 0.276707403 0.267775699 0.00027296 7.30919E-05 6.7341E-05 -1E-08 -0.6070793 -0.266345 0.5295708 -0.529216
3.00 1.25755336 1.5 0.045247396 5.004E+01 2.422E+03 1.14267788 0.276236981 0.237821182 0.00021785 5.18097E-05 4.7077E-05 -3.1548E-16 -0.5978474 -0.268685 0.5558883 -0.511249
3.50 1.27084736 1.5 0.045142919 5.005E+01 2.405E+03 1.13639776 0.275714597 0.216326798 0.00017862 3.86406E-05 3.45526E-05 1.29616E-16 -0.5875733 -0.270823 0.5817935 -0.492878
4.00 1.28737646 1.5 0.045028822 5.005E+01 2.387E+03 1.1300104 0.275144112 0.20011529 0.0001493 2.98778E-05 2.62256E-05 -2.6365E-16 -0.5763259 -0.272736 0.6072088 -0.47409
1.15 1.2 0.25 1.173306656 1.5 0.045607315 49.98526604 2526.515694 1.17581545 0.27803657 1.870648699 0.0032767 0.006129552 0.00614265 1E-08 -0.6330607 -0.254235 0.4082995 -0.60654
0.50 1.172652954 1.5 0.045593092 49.99039682 2516.774342 1.172829333 0.27796546 0.980675652 0.00160666 0.00157561 0.001575838 1E-08 -0.6316745 -0.255629 0.4218542 -0.598064
1.00 1.172223022 1.5 0.045551637 50.00068516 2497.39697 1.166887896 0.277758185 0.535516371 0.00077216 0.000413507 0.000411616 1E-08 -0.6276316 -0.258426 0.4489738 -0.581134
1.50 1.173136334 1.5 0.045494786 50.01080729 2478.215574 1.160937059 0.277473931 0.386961766 0.00049444 0.000191328 0.000189347 -1E-08 -0.6220812 -0.261178 0.4760271 -0.564092
2.00 1.175378692 1.5 0.045424294 50.02056915 2459.292396 1.154934764 0.277121469 0.312545763 0.00035587 0.000111227 0.000109301 -1E-08 -0.6151894 -0.263831 0.5029222 -0.546813
2.50 1.17902163 1.5 0.045341481 50.02981654 2440.685124 1.148853902 0.276707403 0.267775699 0.00027296 7.30919E-05 7.12216E-05 -8.8037E-17 -0.6070793 -0.266345 0.5295708 -0.529216
3.00 1.184498378 1.5 0.045247396 50.03842426 2422.447232 1.142677875 0.276236981 0.237821182 0.00021785 5.18097E-05 4.99805E-05 3.2316E-17 -0.5978474 -0.268685 0.5558883 -0.511249
3.50 1.191986708 1.5 0.045142919 50.04628931 2404.628175 1.136397759 0.275714597 0.216326798 0.00017862 3.86406E-05 3.68386E-05 -4.7133E-16 -0.5875733 -0.270823 0.5817935 -0.492878
4.00 1.201828727 1.5 0.045028822 50.0533265 2387.273457 1.130010399 0.275144112 0.20011529 0.0001493 2.98778E-05 2.80924E-05 2.17254E-16 -0.5763259 -0.272736 0.6072088 -0.47409
1.15 1.15 0.25 1.209319728 1.5 0.045607315 49.98526604 2526.515694 1.17581545 0.278036573 1.870648699 0.0032767 0.006129552 0.005959725 1E-08 -0.6330607 -0.254235 0.4082995 -0.60654
0.50 1.210672043 1.5 0.045593092 49.99039682 2516.774342 1.172829333 0.277965459 0.980675652 0.00160666 0.00157561 0.00152636 3.15286E-16 -0.6316745 -0.255629 0.4218542 -0.598064
1.00 1.214587067 1.5 0.045551637 50.00068516 2497.39697 1.166887896 0.277758185 0.535516371 0.00077216 0.000413507 0.000397268 -2.3766E-16 -0.6276316 -0.258426 0.4489738 -0.581134
1.50 1.220308877 1.5 0.045494786 50.01080729 2478.215574 1.160937059 0.277473931 0.386961766 0.00049444 0.000191328 0.000182028 -1E-08 -0.6220812 -0.261178 0.4760271 -0.564092
2.00 1.227985445 1.5 0.045424294 50.02056915 2459.292396 1.154934764 0.277121469 0.312545763 0.00035587 0.000111227 0.000104619 -1E-08 -0.6151894 -0.263831 0.5029222 -0.546813
2.50 1.237929794 1.5 0.045341481 50.02981654 2440.685124 1.148853902 0.276707403 0.267775699 0.00027296 7.30919E-05 6.78406E-05 -1E-08 -0.6070793 -0.266345 0.5295708 -0.529216
3.00 1.25051403 1.5 0.045247396 5.004E+01 2.422E+03 1.14267788 0.276236981 0.237821182 0.00021785 5.18097E-05 4.735E-05 -1E-08 -0.5978474 -0.268685 0.5558883 -0.511249
3.50 1.26592871 1.5 0.045142919 5.005E+01 2.405E+03 1.13639776 0.275714597 0.216326798 0.00017862 3.86406E-05 3.46868E-05 -2.9207E-16 -0.5875733 -0.270823 0.5817935 -0.492878
4.00 1.28527807 1.5 0.045028822 5.005E+01 2.387E+03 1.1300104 0.275144112 0.20011529 0.0001493 2.98778E-05 2.62684E-05 3.21486E-16 -0.5763259 -0.272736 0.6072088 -0.47409
Stellenbosch University http://scholar.sun.ac.za

187
Table E.2.2 Tension cracking, hc,eff = h/2 – Reliability calibration – reverse-FORM determination of crack width
COV 0.2
ϒc ϒft %As Asls ϒθ β c* h* L* ft* θ* hc Sr (m) ε (-) wm calc (m) wd (m) g = 0 α*xi c α*xi h α*xi L α*xi ft α*xi θ
1 1 0.25 625 1.4444 1.5 3.982E-02 0.250061 50.227012 2491.410844 1.25697615 0.25006096 1.680021502 0.003559069 0.005979 0.00520333 1E-07 -0.02947 -0.0162568 -0.319949 0.4573941 -0.82903
0.50 1250 1.4545 1.5 4.005E-02 0.250052 50.232224 2480.055678 1.25286018 0.25005234 0.880272597 0.001748364 0.001539 0.00132565 1E-07 -0.05584 -0.0139573 -0.321366 0.4734227 -0.818097
1.00 2500 1.4782 1.5 4.045E-02 0.250037 50.239915 2458.231511 1.2439171 0.25003698 0.480967968 0.000843225 0.000406 0.00034129 -3.5237E-15 -0.1002 -0.0098615 -0.323456 0.504436 -0.794218
1.50 3750 1.5065 1.5 4.077E-02 0.250024 50.245016 2437.394457 1.2343909 0.25002385 0.348236562 0.000541725 0.000189 0.000154574 -1.0872E-15 -0.13499 -0.00636 -0.324843 0.5343046 -0.768592
2.00 5000 1.5399 1.5 4.102E-02 0.250013 50.24833 2417.388976 1.22455724 0.25001261 0.28204908 0.000391145 0.00011 8.77297E-05 2.20895E-15 -0.16186 -0.0033613 -0.325744 0.5632225 -0.741931
2.50 6250 1.5792 1.5 4.121E-02 0.250003 50.250306 2398.126458 1.21457106 0.25000294 0.242417715 0.000300933 7.3E-05 5.61073E-05 -2.6405E-15 -0.18223 -0.0007837 -0.326281 0.5912934 -0.714637
3.00 7500 1.6256 1.5 4.135E-02 0.249995 50.251175 2379.56353 1.20451667 0.24999459 0.216024935 0.000240901 5.2E-05 3.85608E-05 2.28802E-15 -0.19723 0.0014423 -0.326517 0.6185589 -0.686928
3.50 8750 1.6807 1.5 4.145E-02 0.249987 50.25104 2361.685612 1.19443898 0.24998735 0.197170841 0.000198107 3.91E-05 2.77591E-05 -2.0708E-15 -0.20777 0.0033734 -0.32648 0.6450201 -0.658922
4.00 10000 1.7471 1.5 4.151E-02 0.249981 50.249933 2344.495366 1.18436194 0.24998104 0.183010488 0.000166081 3.04E-05 2.06047E-05 -1.6551E-16 -0.21459 0.005056 -0.32618 0.6706531 -0.630681
1 1.3 0.25 625 1.2256 1.5 3.982E-02 0.250061 50.227012 2491.410844 1.25697615 0.25006096 1.680021502 0.003559069 0.005979 0.006132388 3.73746E-15 -0.02947 -0.0162568 -0.319949 0.4573941 -0.82903
0.50 1250 1.2222 1.5 4.005E-02 0.250052 50.232224 2480.055678 1.25286018 0.25005234 0.880272597 0.001748364 0.001539 0.001577542 1E-07 -0.05584 -0.0139573 -0.321366 0.4734227 -0.818097
1.00 2500 1.2166 1.5 4.045E-02 0.250037 50.239915 2458.231511 1.2439171 0.25003698 0.480967968 0.000843225 0.000406 0.000414661 -2.6991E-15 -0.1002 -0.0098615 -0.323456 0.504436 -0.794218
1.50 3750 1.2119 1.5 4.077E-02 0.250024 50.245016 2437.394457 1.2343909 0.25002385 0.348236562 0.000541725 0.000189 0.000192151 1.24632E-15 -0.13499 -0.00636 -0.324843 0.5343046 -0.768592
2.00 5000 1.2078 1.5 4.102E-02 0.250013 50.24833 2417.388976 1.22455724 0.25001261 0.28204908 0.000391145 0.00011 0.000111856 -1.6596E-15 -0.16186 -0.0033613 -0.325744 0.5632225 -0.741931
2.50 6250 1.2041 1.5 4.121E-02 0.250003 50.250306 2398.126458 1.21457106 0.25000294 0.242417715 0.000300933 7.3E-05 7.35856E-05 -5.0882E-16 -0.18223 -0.0007837 -0.326281 0.5912934 -0.714637
3.00 7500 1.1989 1.5 4.135E-02 0.249995 50.251175 2379.56353 1.20451667 0.24999459 0.216024935 0.000240901 5.2E-05 5.22E-05 1E-07 -0.19723 0.0014423 -0.326517 0.6185589 -0.686928
3.50 8750 1.1989 1.5 4.145E-02 0.249987 50.25104 2361.685612 1.19443898 0.24998735 0.197170841 0.000198107 3.91E-05 3.89465E-05 -3.7739E-08 -0.20777 0.0033734 -0.32648 0.6450201 -0.658922
4.00 10000 1.1922 1.5 4.151E-02 0.249981 50.249933 2344.495366 1.18436194 0.24998104 0.183010488 0.000166081 3.04E-05 3.0112E-05 1E-07 -0.21459 0.005056 -0.32618 0.6706531 -0.630681
1.05 1.2 0.25 625 1.2764 1.5 3.982E-02 0.250061 50.227012 2491.410844 1.25697615 0.25006096 1.680021502 0.003559069 0.005979 0.005888303 -1E-07 -0.02947 -0.0162568 -0.319949 0.4573941 -0.82903
0.50 1250 1.2732 1.5 4.005E-02 0.250052 50.232224 2480.055678 1.25286018 0.25005234 0.880272597 0.001748364 0.001539 0.001514425 -2.2963E-16 -0.05584 -0.0139573 -0.321366 0.4734227 -0.818097
1.00 2500 1.2689 1.5 4.045E-02 0.250037 50.239915 2458.231511 1.2439171 0.25003698 0.480967968 0.000843225 0.000406 0.000397566 -2.6366E-15 -0.1002 -0.0098615 -0.323456 0.504436 -0.794218
1.50 3750 1.2663 1.5 4.077E-02 0.250024 50.245016 2437.394457 1.2343909 0.25002385 0.348236562 0.000541725 0.000189 0.00018381 1E-07 -0.13499 -0.00636 -0.324843 0.5343046 -0.768592
2.00 5000 1.2663 1.5 4.102E-02 0.250013 50.24833 2417.388976 1.22455724 0.25001261 0.28204908 0.000391145 0.00011 0.000106656 3.23585E-08 -0.16186 -0.0033613 -0.325744 0.5632225 -0.741931
2.50 6250 1.2680 1.5 4.121E-02 0.250003 50.250306 2398.126458 1.21457106 0.25000294 0.242417715 0.000300933 7.3E-05 6.9876E-05 -2.8712E-15 -0.18223 -0.0007837 -0.326281 0.5912934 -0.714637
3.00 7500 1.2710 1.5 4.135E-02 0.249995 50.251175 2379.56353 1.20451667 0.24999459 0.216024935 0.000240901 5.2E-05 4.9319E-05 1.1139E-15 -0.19723 0.0014423 -0.326517 0.6185589 -0.686928
3.50 8750 1.2756 1.5 4.145E-02 0.249987 50.25104 2361.685612 1.19443898 0.24998735 0.197170841 0.000198107 3.91E-05 3.65767E-05 1.18196E-15 -0.20777 0.0033734 -0.32648 0.6450201 -0.658922
4.00 10000 1.2855 1.5 4.151E-02 0.249981 50.249933 2344.495366 1.18436194 0.24998104 0.183010488 0.000166081 3.04E-05 2.80815E-05 -1E-07 -0.21459 0.005056 -0.32618 0.6706531 -0.630681
COV 0.1
ϒc ϒft %As Asls ϒθ β c* h* L* ft* θ* hc Sr (m) ε (-) wm calc (m) wd (m) g = 0 α*xi c α*xi h α*xi L α*xi ft α*xi θ
1 1 0.25 625 1.3112 1.5 3.995E-02 0.250103 50.747499 2372.918545 1.09265847 0.25010321 1.680561747 0.003715319 0.006244 0.00520333 -1.6896E-15 -0.04451 -0.0275224 -0.461434 0.6283714 -0.624091
0.50 1250 1.3230 1.5 4.030E-02 0.250089 50.733443 2363.395852 1.09010562 0.25008909 0.880890763 0.001826373 0.001609 0.00132565 -1E-07 -0.08352 -0.0237579 -0.457613 0.6424806 -0.608497
1.00 2500 1.3503 1.5 4.088E-02 0.250064 50.699747 2346.545276 1.0847592 0.25006427 0.481859291 0.000881651 0.000425 0.00034129 -3.5237E-15 -0.14653 -0.017138 -0.448453 0.6675872 -0.57572
1.50 3750 1.3823 1.5 4.130E-02 0.250044 50.663119 2331.678786 1.0794071 0.25004368 0.349320336 0.000566689 0.000198 0.000154574 -1.0872E-15 -0.19253 -0.0116493 -0.438497 0.6898876 -0.542746
2.00 5000 1.4194 1.5 4.161E-02 0.250027 50.626589 2318.071527 1.07424484 0.25002673 0.283236293 0.000409259 0.000116 8.77297E-05 2.20898E-15 -0.22511 -0.0071289 -0.428567 0.7104242 -0.510786
2.50 6250 1.4621 1.5 4.182E-02 0.250013 50.591469 2305.325977 1.06934318 0.25001276 0.243639719 0.00031488 7.67E-05 5.61073E-05 -2.6405E-15 -0.24731 -0.0034028 -0.41902 0.7297698 -0.480297
3.00 7500 1.5117 1.5 4.195E-02 0.250001 50.558168 2293.240889 1.06471175 0.25000119 0.217232876 0.000252037 5.48E-05 3.85608E-05 2.28801E-15 -0.26149 -0.0003173 -0.409968 0.7482121 -0.451361
3.50 8750 1.5734 1.5 4.202E-02 0.249992 50.526667 2281.72363 1.0603342 0.24999155 0.198331442 0.000207214 4.11E-05 2.77591E-05 -1E-07 -0.26947 0.0022531 -0.401405 0.7658784 -0.423894
4.00 10000 1.6387 1.5 0.0420543 0.249983 50.496772 2270.738192 1.05618565 0.24998347 0.184102019 0.000173649 3.2E-05 2.06047E-05 -1.6552E-16 -0.27259 0.0044078 -0.393278 0.7828124 -0.39776
COV 0.3
ϒft %As Asls ϒθ β c* h* L* ft* θ* hc Sr (m) ε (-) wm calc (m) wd (m) g = 0 α*xi c α*xi h α*xi L α*xi ft α*xi θ
1 1 0.25 625 1.6056 1.5 0.0397434 0.250041 49.92981 2567.203458 1.4362461 0.25004063 1.67974693 0.003463087 0.005817 0.00520333 1E-07 -0.0214012 -0.01083563 -0.23915997 0.3522433 -0.904517
0.50 1250 1.6148 1.5 0.0399164 0.250034 49.939354 2556.394409 1.43156823 0.25003446 0.879943096 0.001699266 0.001495 0.00132565 -1E-07 -0.0407 -0.0091899 -0.241754 0.3670479 -0.897268
1.00 2500 1.6361 1.5 0.0402143 0.250023 49.957429 2534.931698 1.42119937 0.25002339 0.480466035 0.000817762 0.000393 0.00034129 -3.5237E-15 -0.07375 -0.0062371 -0.246668 0.3966309 -0.881114
1.50 3750 1.6621 1.5 0.0404568 0.250014 49.974442 2513.649635 1.40977899 0.25001377 0.347594946 0.000524293 0.000182 0.000154574 -1.0872E-15 -0.10047 -0.0036721 -0.251292 0.4262131 -0.863184
2.00 5000 1.6932 1.5 0.0406527 0.250005 49.99059 2492.544044 1.39753656 0.25000536 0.281309775 0.000377834 0.000106 8.77297E-05 2.20895E-15 -0.12194 -0.0014291 -0.255682 0.4557984 -0.843803
2.50 6250 1.7302 1.5 0.0408094 0.249998 50.005952 2471.634709 1.38460706 0.24999795 0.241617454 0.000290173 7.01E-05 5.61073E-05 -2.6405E-15 -0.13903 0.0005455 -0.259858 0.4853566 -0.823148
3.00 7500 1.7744 1.5 0.0409325 0.249991 50.020534 2450.958555 1.37107075 0.24999139 0.215193811 0.000231906 4.99E-05 3.85608E-05 2.28802E-15 -0.15243 0.0022948 -0.263822 0.514832 -0.801316
3.50 8750 1.8276 1.5 0.0410269 0.249986 50.034296 2430.56452 1.35697788 0.24998555 0.196332869 0.000190428 3.74E-05 2.77591E-05 -2.0708E-15 -0.16266 0.0038531 -0.267563 0.5441497 -0.778357
4.00 10000 1.8923 1.5 0.0410962 0.24998 50.047171 2410.509719 1.34236391 0.24998032 0.182184525 0.000159434 2.9E-05 2.06047E-05 -1.6552E-16 -0.17016 0.0052478 -0.271062 0.5732205 -0.754295
Stellenbosch University http://scholar.sun.ac.za