Maintenance Actions to Address Fatigue Cracking in Steel ...
Upload
khangminh22Category
view
1download
0
American Journal of Engineering, Science and Technology (AJEST) Volume 15, 2022
1
COMPARATIVE ANALYSIS OF CRACKING MODELS FOR
REINFORCED CONCRETE BEAMS
Yeganeh Arablousabet
Vilnius Tech (VGTU), Lithuania
Abstract
Reinforced concrete (RC) is a composite material that compensates for its comparatively low
resistance and ductile strength with the addition of reinforcement with a greater tensile resistance
or ductility. Steel bars (rebar) are commonly used as reinforcement, and are normally buried
passively in the concrete before it hardens. Serviceability limit states (SLS) are often used to
assure the functioning and structural integrity of reinforced concrete (RC) constructions under
service loading situations. Current design regulations (EC2 EN 1992) establish serviceability
limit states by giving three control parameters: (1) material stress limitation, (2) crack width and
spacing control, and (3) deflection (short and long term) inspections. It is understood that
cracking in reinforced concrete members can take two forms: (1) cracking caused by the
structure's limitation on volume change, and (2) cracking caused by applied stresses. The
approach used by different Building codes (i.e. Eurocode 2, 2004, Fib Model Code, 2010 and SP
52-101, 2003 for determining breakage design merely by the use of loads is detailed in this
research. The majority of the crack width prediction rules for reinforced concrete buildings may
be found in various building codes. The thesis aimed to compare the accuracy of crack width
predictions of RC beams by three design codes: Eurocode 2, Model Code 2010 and Russian
Code (SP 52-101-2003). Test results on mean and maximum crack width of 20 reinforced
concrete beams from two experimental programs were collected. Predictions of both maximum
and mean crack widths were performed by Eurocode 2 and Model Code 2010, whereas only
maximum values were predicted by the Russian Code. A comparison of the predicted versus test
crack widths was performed using the normalized crack width values (theory/experiment).
Keywords: crack width; Eurocode 2; 2004, Fib Model Code; 2010 and SP 52-101; the accuracy
of crack width predictions.
1. Introduction
Reinforced concrete (RC) is a composite material that adjusts for its weak resistance and
ductility by adding reinforcement with higher tensile resistance or ductility. Steel bars (rebar) are
often utilized as reinforcement and are typically buried passively in the concrete prior to
hardening. Serviceability limit states (SLS) are frequently utilized to ensure the proper operation
and structural integrity of reinforced concrete (RC) structures under service loading conditions.
Current design standards (EC2 EN 1992) include three control parameters to determine
serviceability limit states: (1) material stress limitations, (2) crack width and spacing control, and
(3) deflection (short and long term) inspection. Cracking in reinforced concrete members is

American Journal of Engineering, Science and Technology (AJEST) Volume 15, 2022
2
known to have two forms: (1) cracking induced by the structure's volume change limits, and (2)
cracking due by applied forces. This study delves into the technique employed by several
building codes (e.g., Eurocode 2, 2004, Fib Model Code, 2010, and SP 52-101, 2003) for
assessing breakage design only by the usage of loads.
1.1. Cracking of concrete
Concrete cracking is one of the most challenging components of analyzing Reinforced Concrete
(RC) buildings. Crack width forecasts sometimes have inaccuracies of up to several hundred
percent (GL. Balazs et al., 2013). Such disparities are related to a variety of physical and
mechanical aspects of RC structure behavior, such as different mechanical properties of concrete
and reinforcement bars, creep and shrinkage of concrete, bond-slip action, tension stiffening and
tension-softening effects, and the stochastic nature of crack formation.
One of the most difficult aspects of Reinforced Concrete (RC) construction analysis is concrete
cracking. In most cases, errors in crack width estimates might surpass several hundred percent
(Balazs et al., 2013). Different mechanical characteristics of concrete and reinforcing bars, creep
and shrinkage of concrete, bond-slip action, tension stiffening and tension-softening effects, and
the stochastic nature of crack development all contribute to such differences in RC structure
performance.
Cracking in RC structures has been investigated since the early twentieth century. There are two
types of cracking models:
Empirical models: The majority of early experimental investigations dating back to the turn of
the twentieth century fall under this group. Based on extensive experimental data, Gergely and
Lutz (1968) developed a maximum crack width model that took into account the reinforcing
stress, cover, and effective area surrounding the reinforcing bar. Broms (1965) presented an
alternative theory, noting that concrete cover is the single most important component controlling
crack spacing. In various arguments, Beeby (2004), who questioned another renowned technique
based on classical bond theory, maintained the concept of cover as the most important parameter
in cracking analysis.
Concrete cracking or fracture occurs in three stages. It is critical to distinguish the method of
crack initiation and how it occurs at the microscopic level from the subsequent paths of
propagation and the eventual macroscopic fracture pattern at the engineering level. Following are
the Stages of Concrete Cracking:
Stage I: Prior to loading the inherently changed volume in the concrete, shrinkage or thermal
movement may cause stress concentrations on the aggregate-composite interface. The most
significant concentration of tensile strain at this stage is localized cracking at the microscopic
level at irregular locations in the material. This shows that the cracks are stable and do not
propagate at this load level.

American Journal of Engineering, Science and Technology (AJEST) Volume 15, 2022
3
Stage II: As the applied force grows beyond stage I, stable cracks begin to propagate. Because
the stable beginning of the crack is likely to overlap the propagation of the crack and gradually
shift from stage to stage, there will be no discernible difference between Stages I and II. During
stage II, it grows and spreads slowly and steadily, stopping the load and keeping the stress level
continuously spread. The duration of the stable crack propagation stage is largely dependent on
the applied state of stress, being relatively short for 'brittle' fractures under mostly tensile stress
levels and significantly longer for more 'plastic' fractures under primarily compressive stress
levels.
Stage III: When the crack system has progressed to the point where it is unstable under load and
the release of strain energy causes the cracks to self-propagate until full disruption and collapse
occurs. Failure will occur after Stage III is reached, regardless of whether the stress is increased.
This stage occurs at 70–90% of ultimate stress and is characterized by broad structural expansion
as well as a reversal in volume change behavior. As previously stated, the load stage at which
this occurs closely correlates to the long-term strength of concrete (Saliger 1936).
1.2. Design Code Approaches for calculations of crack width
1.2.1. Crack width Equation according to Eurocode 2
The cracking of a reinforced concrete prism reinforced with a central bar exposed to pure tension
is practically universally used to explain the basic cracking behavior of reinforced concrete.
Bending has an influence on the issue, although the Eurocode accommodates for it by modifying
the coefficients empirically. According to Eurocode (EC2 EN 1992), the design crack width may
be computed using the following formula:
𝑤𝑘= 𝑠𝑟,𝑚𝑎𝑥(𝜀𝑠𝑚− 𝜀𝑐𝑚) (1)
(2)
(3)
And σ𝑠 represents the stress in the tension reinforcement assuming a cracked section; 𝜌𝑝 ,𝑒𝑓𝑓 = (𝐴𝑠 +
𝜉1𝐴𝑝´ )/𝐴𝑐 ,𝑒𝑓𝑓 , this is the ratio of the tension reinforcement area (𝐴𝑠) to the effective tension area of the
concrete around the steel (𝐴𝑐 ,𝑒𝑓𝑓 ).However, 𝐴𝑐 ,𝑒𝑓𝑓 is mostly dependent on the concrete cover provided on
the tension face. Also, 𝜙is the bar diameter; c is the cover of concrete; andk1, k2 are the coefficients
based on the steel-concrete bond characteristics and loading type, respectively.

American Journal of Engineering, Science and Technology (AJEST) Volume 15, 2022
4
1.2.2. Crack width Equation according to Model Code 2010
Correspondent Model Code (MC EN 2010), crack width estimates are based on a prismatic
reinforced concrete bar with an axial stress. For all cracking stage, the design crack width w (d)
could be defined:
𝑊𝑑 = 2𝑙𝑠𝑚𝑎𝑥 (ε𝑠𝑚 − ε𝑐𝑚 − ε𝑐𝑠) (4)
𝑙𝑠𝑚𝑎𝑥 = 𝑘 ∗ 𝑐 +1
4∗𝑓𝑐𝑡𝑚𝜏𝑏𝑚𝑠
∗𝜑𝑠
𝜌𝑠,𝑒𝑓𝑓
(5)
ε𝑠𝑚 − ε𝑐𝑚 − ε𝑐𝑠 =𝜎𝑠 − 𝛽 ∗ 𝜎𝑠𝑟
𝐸𝑠− 𝜂𝑟 ∗ ε𝑠ℎ
(6)
The length over which slip across concrete and steel occurs is indicated by 𝑙𝑠𝑚𝑎𝑥 ; ε𝑠𝑚 is the
average steel strain over the length lsmax; ε𝑐𝑚 is the average concrete strain over the length
lsmax; and cs is the strain of the concrete due to (free) shrinkage.Also, 𝜎𝑠 is the steel stress in a
crack;𝜎𝑠𝑟 is the maximum steel stress in a crack during the crack formation; 𝜀𝑠ℎ is the shrinkage
strain.
1.2.3. Crack Width Equation according to Russian Code (SP 52-101-2003)
According to Russian code, the width of cracks opening due to a longitudinal axis of an element
is calculated using the method below:
𝑎𝑐𝑟𝑐 = 𝜑1𝜑2𝜑3𝜓𝑠
𝜎𝑠𝐸𝑠
𝑙𝑠 (7)
𝜎𝑠 =𝑀(ℎ0 − 𝑦𝑐)
𝐼𝑟𝑒𝑑𝛼𝑠1
(8)
𝜎𝑠denotes the stress in the longitudinally tensioned reinforcement in the normal section;𝑙𝑠 is the
distance between two adjacent typical cracks; Ѱ𝑠 is the coefficient that takes into account the
non-uniform distribution of relative deformations of tensioned reinforcement between cracks;
φ1 is the coefficient that takes into account the length of the load action;φ
2 is the coefficient
when a longitudinal reinforcement profile is taken into account; φ3
is the coefficient that takes
into account the load attribute; 𝐼𝑟𝑒𝑑 is the moment of inertia; 𝑦𝑐 is the distance from the
compressed side to the center of gravity of the element's decreased cross section; and α𝑠1 is the
coefficient of reduction of reinforcement to concrete.

American Journal of Engineering, Science and Technology (AJEST) Volume 15, 2022
5
1.3. Cracking in reinforced concrete members under short-term loads: an experimental
and theoretical investigation based on previous studies
1.3.1. Experimental test data by Gilbert
Gilbert and Nejadi (2004) experimented with six prismatic single reinforced concrete specimens
(6 beams) with cross-sections that were cast and damp cured for 28 days. All of the specimens
were simply supported over 3.5 m and subjected to two equal point loads at the third points of
the span with an increasing load until failure. The geometrical data of experimental study of
cracking in reinforced concrete members has given in table 1.
Table 1Geometrical data of experimental study of cracking in reinforced concrete members (Gilbert and Nejadi,
2004)
1.3.2. Experimental test data by Calderón
The beams were rectangular 0.25 m width, 0.50 depth, and 6.50 m length, and supported 1.25 m
from either end, according to other laboratory investigations. (2008, Calderón) Tables 2 provide
details on the parameters.

American Journal of Engineering, Science and Technology (AJEST) Volume 15, 2022
6
Table 2: Geometrical data of experimental study of cracking in reinforced concrete members (Calderon, 2008)
2. Prediction of Mean and Maximum Crack Widths by Different Codes Using
Test Data of RC Beams
This section compares cracking models for reinforced concrete components using three different
building codes. A total of 20 prismatic singly reinforced concrete examples were extracted (from
two articles). According to Gibert and Nejadi (2004), a series of short-term load tests on
reinforced concrete flexural elements were conducted, with all specimens simply supported on a
3.5 m span and tested to failure using two equal point loads applied at the span's third points.
According to Gibert and Nejadi (2004), a series of short-term load tests on reinforced concrete
flexural components were performed, with all specimens simply supported on a 3.5 m span and
tested to failure using two equal point loads applied at the span's third points. 14 reinforced
concrete members measuring 25 cm width by 50 cm depth and 6.50 m length (with a 4.00m span
between supports) were subjected to pure bending in accordance with the test plan developed by
Calderón (2008), using reinforcing bars of three different diameters (fine (10), medium (16), and
thick (25).
For each reinforced concrete beam, two diagrams are shown, one with the horizontal axis
representing the bending moment (KNm) and the other with the vertical axis representing the
crack width (mm). The criteria for the current study include the specifics of each beam, such as
cross sectional area, bar diameter, reinforcement ratio, and the value of concrete cover, which are
given in the chart title for each diagram.The same scale has been assumed for all of the diagrams.
American Journal of Engineering, Science and Technology (AJEST) Volume 15, 2022
7
The first diagram showed (1) the experimental mean crack width, (2) the Eurocode mean crack
width, and (3) the Model Code mean crack width. The second graph depicts: (1) maximum
experimental crack width (2) maximum Eurocode crack width (3) maximum Model Code crack
width (4) maximum Russian Code crack width.
2.1. Mean and maximum crack width based on tests reported by Gilbert and Nejadi (2004)
As already mentioned before, according to Gilbert and Nejadi (2004), the experimental data from
six reinforced concrete specimens collected. According to fig. 1, the vertical axis of the graphs
indicates crack width in mm and the horizontal axis indicates bending moment in KNm. The
cross sectional area of each beam, number of bars, the diameter of bar, cover of concrete and the
reinforcement ratio indicated in each graph. The crack width was calculated at 10 different load
levels same as experiment. The fig. 2.3a represents mean crack width which were calculated
according to EC2 EN 1992, Model Code EN 2010 and compared to the experimental values
(crack width calculations based on SP 52-101-2003 are not included). The mean crack width
estimated using EC2 EN 1992, Model Code EN 2010, and compared to the experimental values
(crack width calculations based on SP 52-101-2003 are not included).

American Journal of Engineering, Science and Technology (AJEST) Volume 15, 2022
8
Figure 1 Mean and maximum crack width based on tests reported by Gilbert and Nejadi
American Journal of Engineering, Science and Technology (AJEST) Volume 15, 2022
9
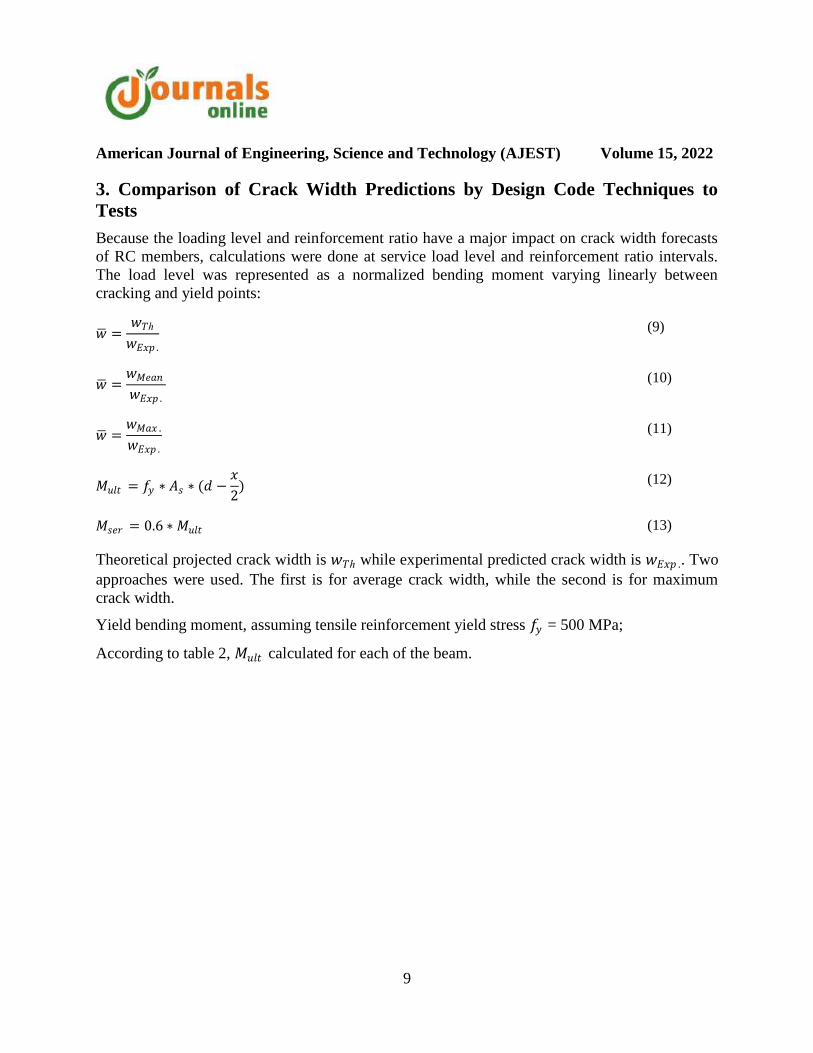
3. Comparison of Crack Width Predictions by Design Code Techniques to
Tests
Because the loading level and reinforcement ratio have a major impact on crack width forecasts
of RC members, calculations were done at service load level and reinforcement ratio intervals.
The load level was represented as a normalized bending moment varying linearly between
cracking and yield points:
𝑤 =𝑤𝑇ℎ
𝑤𝐸𝑥𝑝 .
(9)
𝑤 =𝑤𝑀𝑒𝑎𝑛
𝑤𝐸𝑥𝑝 .
(10)
𝑤 =𝑤𝑀𝑎𝑥 .
𝑤𝐸𝑥𝑝 .
(11)
𝑀𝑢𝑙𝑡 = 𝑓𝑦 ∗ 𝐴𝑠 ∗ (𝑑 −𝑥
2)
(12)
𝑀𝑠𝑒𝑟 = 0.6 ∗ 𝑀𝑢𝑙𝑡 (13)
Theoretical projected crack width is 𝑤𝑇ℎ while experimental predicted crack width is 𝑤𝐸𝑥𝑝 .. Two
approaches were used. The first is for average crack width, while the second is for maximum
crack width.
Yield bending moment, assuming tensile reinforcement yield stress 𝑓𝑦 = 500 MPa;
According to table 2, 𝑀𝑢𝑙𝑡 calculated for each of the beam.

American Journal of Engineering, Science and Technology (AJEST) Volume 15, 2022
10
Table 3 Normalized crack width by design codes
Figure 2 and figure 3 demonstrates predictions were expressed in terms of the normalized crack width
using 3 building codes for all 20 reinforced concrete beams.

American Journal of Engineering, Science and Technology (AJEST) Volume 15, 2022
11
Figure 2 Normalized mean crack width according to EC2 and MC2010
Figure 3 Normalized maximum crack width according to EC2, MC2010 AND SP 52-101-2003
To assess the amount of variation of mean crack width:
𝜎 =∑(𝑥𝑖 − µ)2
𝑁
(14)
American Journal of Engineering, Science and Technology (AJEST) Volume 15, 2022
12
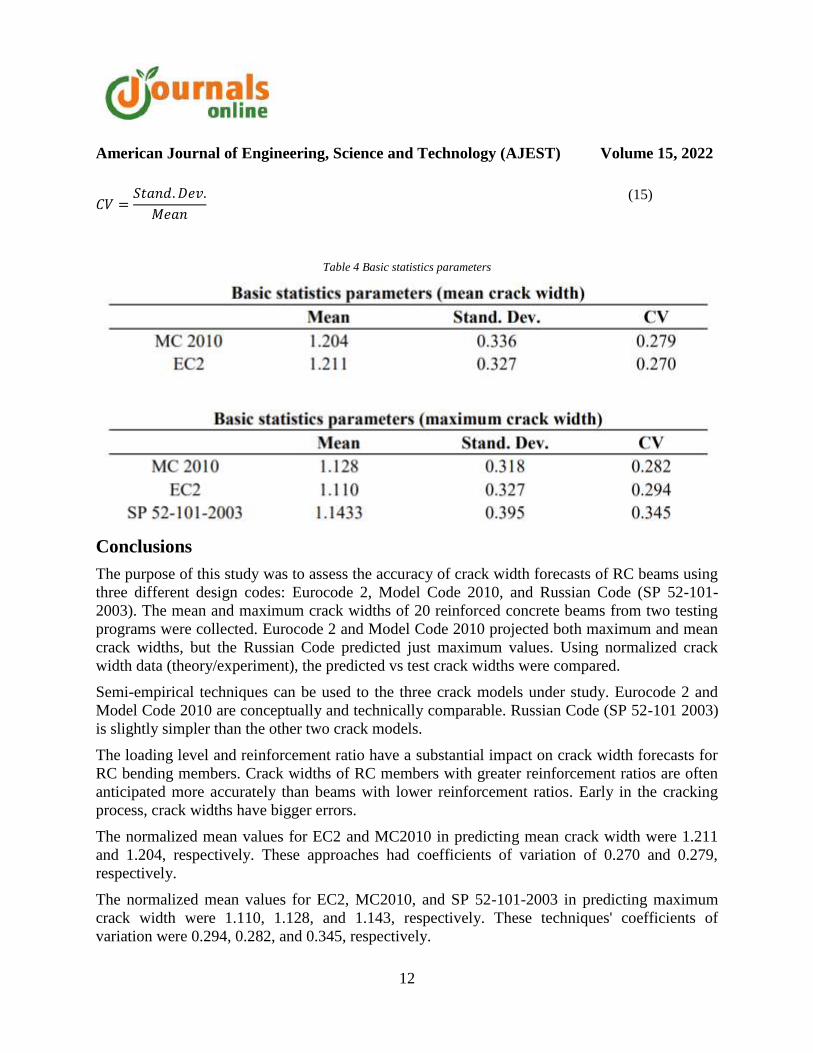
𝐶𝑉 =𝑆𝑡𝑎𝑛𝑑.𝐷𝑒𝑣.
𝑀𝑒𝑎𝑛
(15)
Table 4 Basic statistics parameters
Conclusions
The purpose of this study was to assess the accuracy of crack width forecasts of RC beams using
three different design codes: Eurocode 2, Model Code 2010, and Russian Code (SP 52-101-
2003). The mean and maximum crack widths of 20 reinforced concrete beams from two testing
programs were collected. Eurocode 2 and Model Code 2010 projected both maximum and mean
crack widths, but the Russian Code predicted just maximum values. Using normalized crack
width data (theory/experiment), the predicted vs test crack widths were compared.
Semi-empirical techniques can be used to the three crack models under study. Eurocode 2 and
Model Code 2010 are conceptually and technically comparable. Russian Code (SP 52-101 2003)
is slightly simpler than the other two crack models.
The loading level and reinforcement ratio have a substantial impact on crack width forecasts for
RC bending members. Crack widths of RC members with greater reinforcement ratios are often
anticipated more accurately than beams with lower reinforcement ratios. Early in the cracking
process, crack widths have bigger errors.
The normalized mean values for EC2 and MC2010 in predicting mean crack width were 1.211
and 1.204, respectively. These approaches had coefficients of variation of 0.270 and 0.279,
respectively.
The normalized mean values for EC2, MC2010, and SP 52-101-2003 in predicting maximum
crack width were 1.110, 1.128, and 1.143, respectively. These techniques' coefficients of
variation were 0.294, 0.282, and 0.345, respectively.

American Journal of Engineering, Science and Technology (AJEST) Volume 15, 2022
13
Eurocode 2 and Model Code 2010 give more accurate forecasts in terms of mean value and
coefficient of variance than the Russian Code.
References
1) Balázs GL, Bisch P, Borosnyói A, Burdet O, Burns C, Ceroni F, et al. Design for SLS
according to fib Model Code 2010. StructConcr 2013;14(2):99–123.
2) Gergely, P., and Lutz, L. A. (1968). Maximum crack width in reinforced concrete
flexural members. Causes, mechanism, and control of cracking in concrete, American
Concrete Institute, Detroit, 87–117.
3) Broms, B. B. (1965). “Crack width and crack spacing in reinforced concrete members.”
ACI J., 62(10), 1237–1256
4) Beeby, A. W. (2004). “The influence of the parameter ϕ=ρeff on crack widths.” Struct.
Concr., 5(2), 71–83
5) Saliger, R. (1936). “High grade steel in reinforced concrete.” Proc., 2nd Congress of Int.
Association for Bridge and Structural Engineering, Vol. 2, IABSE Publications, Berlin,
293–315.
6) Fib (International Federation for Structural Concrete). (2013). Model code for concrete
structures 2010, Wiley, Berlin, 434.
7) Enrique Calderón Bello, 2008, Experimental study of cracking in reinforced concrete
pieces subjected to pure bending.
8) R. Gilbert, S. Nejadi, (2004) An experimental study of flexural cracking members under
short term loads.
9) EN 1992-1-1. Eurocode 2: Design of concrete structures.
10) Russian_standard-SP_52-101-2003_Concrete_structures (1)
Copyright © 2022 FDOKUMEN