Nucleolar Localization Elements of Xenopus laevis U3 Small Nucleolar RNA
Gene expression screening inXenopusidentifies molecular pathways, predictsgene function and provides a global view of embryonic patterning
Volker Gawantka1a, Nicolas Pollet1a, Hajo Deliusb, Martin Vingronc, Ralf Pfistera,Rebecca Nitscha, Claudia Blumenstocka, Christof Niehrsa,*
aDivision of Molecular Embryology, Deutsches Krebsforschungszentrum, Im Neuenheimer Feld 280, D-69120 Heidelberg, GermanybDivision of Tumorvirology, Deutsches Krebsforschungszentrum, Im Neuenheimer Feld 280, D-69120 Heidelberg, Germany
cDivision of Theoretical Bioinformatics, Deutsches Krebsforschungszentrum, Im Neuenheimer Feld 280, D-69120 Heidelberg, Germany
Received 18 May 1998; revised version received 8 July 1998; accepted 9 July 1998
Abstract
In a large-scale gene expression screen 1765 randomly picked cDNAs were analyzed by whole-mount in situ hybridization inXenopusembryos. Two hundred and seventy three unique, differentially expressed genes were identified, 204 of which are novel inXenopus. PartialDNA sequences and expression patterns were documented and assembled into a database, ‘AXelDB’. Approximately 30% of cDNAsanalyzed represent differentially expressed genes and about 5% show highly regionalized expression. Novel marker genes and potentialdevelopmental regulators were found. Differential expression of mitochondrial genes was observed. Marker genes were used to studyregionalization of the entire gastrula as well as the tail forming region and the epidermis of the tailbud embryo. Four ‘synexpression’ groupsrepresenting genes with shared, complex expression pattern that predict molecular pathways involved in patterning and differentiation wereidentified. According to their probable functional significance these groups are designated as Delta1, Bmp4, ER-import and Chromatingroup. Within synexpression groups, a likely function of genes without sequence similarity can be predicted. The results indicate thatsynexpression groups have strong prognostic value. A cluster analysis was made by comparing gene expression patterns to derive a novelparameter, ‘tissue relatedness’. In conclusion, this study describes a semi-functional approach to investigate genes expressed during earlydevelopment and provides global insight into embryonic patterning. 1998 Elsevier Science Ireland Ltd. All rights reserved
Keywords: Chromatin; Delta; Endoplasmic reticulum; Bmp4; Functional genomics; Gene expression; Genome; Regionalization;Synexpression;Xenopus laevis; Screening; In situ hybridization; Expressed sequence tags; Partial cDNA sequencing; Earlydevelopment; Epidermis; Tailbud; Gastrula; Embryology; Developmental biology; Database; Differentiation; cDNA sequencing; Expres-sion profiles; Neurula; Pattern formation; Mesoderm; Ectoderm; Endoderm; Mitochondria; Tissue relatedness; Gastrulation; Transcrip-tional regulation; Amphibian
1. Introduction
It is generally accepted that a major mechanism in cellu-lar differentiation and development is based on differentialgene expression. Therefore, description of gene expressionis now considered an essential part of the characterization ofnovel genes. The expression pattern often gives importantclues about the function of a gene and makes readily testablepredictions. In addition, analysis of gene expression has ledto spectacular discoveries regarding embryonic patterning
which had not been revealed by morphology or experimen-tal embryology (Levin, 1997). Moreover, mechanisms ofembryonic patterning as well as evolutionary relationshipsbetween seemingly unrelated structures in different animalscan be derived by such analysis. Despite this utility, thenumber of genes whose embryonic expression pattern hasbeen documented by in situ hybridization is relatively small,on the order of a few hundreds in mouse,Xenopusandzebrafish compared with the estimated 100 000 genes ex-pressed in vertebrates, with many of them being orthologs.
In invertebrates such asDrosophilaandCaenorhabditiselegans, large-scale mutagenesis screens have been instru-mental in the understanding of the mechanisms underlying
Mechanisms of Development 77 (1998) 95–141
0925-4773/98/$ - see front matter 1998 Elsevier Science Ireland Ltd. All rights reservedPII S0925-4773(98)00115-4
* Corresponding author.1 These authors contributed equally to the study.
pattern formation and morphogenesis. In vertebrates a num-ber of projects in mouse and zebrafish are concerned with thedirect identification of gene function by large-scale mutagen-esis. These studies have yielded impressive results and pro-vided an invaluable basis for the understanding of embryonicdevelopment (Friedrich and Soriano, 1991; Wurst et al.,1995; Driever et al., 1996; Forrester et al., 1996; Haffter etal., 1996; Miklos and Rubin, 1996). However, theseapproaches have certain limitations including the difficultyto move from mutant to gene in random mutagenesis as wellas limits of throughput. More importantly, functional generedundancy may pose a severe problem that may precludeidentification of entire classes of genes. For example, tar-geted disruption in yeast showed that disruption of 70% ofthe genes does not lead to overt phenotypes (Goebl and Petes,1986). In a zebrafish screen approaching saturation, 85 non-allelic mutants were identified in which pigmentation or pig-ment cell development are affected but only 8 genes werefound to be essential for early dorso-ventral axis formation(Haffter et al., 1996). In a mouse promoter-trap pilot screen15 of the 24 homozygous mutant strains did not exhibit anovert phenotype (Friedrich and Soriano, 1991).
Gene expression screens via enhancer- or promoter-trapscan identify differentially expressed developmental regula-tors regardless of functional redundancy. However, enhan-cer-trap screens have three major disadvantages. First, thelacZ pattern observed may not faithfully reflect the expres-sion of the endogenous gene. Second, detection of verydynamic expression patterns may be difficult becauseb-galactosidase protein is relatively long-lived. Third, thegene is not readily accessible.
An alternative approach to the study of embryonic pattern-ing at large-scale is to use randomly isolated cDNAs andanalyze the expression pattern of mRNAs by in situ hybridi-zation which allows direct access to the DNA sequence andreflects endogenous gene expression (Bettenhausen andGossler, 1995; Gawantka et al., 1995). Here we describe alarge-scale expression screen of 1765 cDNAs by a whole-mount in situ hybridization inXenopusembryos. We presentan overview of global gene expression and describe expres-sion patterns and partial sequences of 273 unique, differen-tially expressed genes.
2. Results
2.1. Statistical overview
1765 cDNA clones were randomly picked from a neurulacDNA library (Gawantka et al., 1995) and expression pat-terns were analyzed by whole-mount in situ hybridization.We sought to identify genes whose expression would beindicative of both early mesodermal as well as neural differ-entiation. Since the genes expressed during early gastrulationare commonly still expressed at early neurula but manyneural genes are not yet expressed at early gastrula, we
chose a neurula stage cDNA library (stage 13). To find acompromise between large-scale throughput and depth ofanalysis we had to limit the number of embryonic stagesto gastrula (stage 10+ ), neurula (stage 13) and tailbud(stage 30), and to restrict scoring to major tissues. cDNAscorresponding to differentially expressed genes at anyof the examined stages were partially sequenced fromboth ends. Sequence data were used to eliminate redun-dant clones and compared against DNA and protein sequencedatabases. Expression and sequence data are compiled in alocal database and publically accessible via the Internet(http://www.dkfz-heidelberg.de/abt0135/axeldb.htm). DNAsequences are also deposited in the EMBL database (seeTable 4 for accession numbers). All clones are availableupon request from the Resource Centre of the GermanHuman Genome Project, reference library 546 plate A(RZPD, Heubnerweg 6, D-14059 Berlin; email: [email protected]).
Of all genes analyzed 26% are differentially expressed(Fig. 1). Genes thus classified either show strong regionaldifferences in expression in at least one of the examinedstages or a strong decrease in expression during embryogen-esis. Constant or increasing, non-regionalized expression wasscored ubiquitous (51%). A substantial 23% of clones do notshow any staining. Five of sixteen such clones analyzed dis-play homology to known sequences (not shown), suggestingthat lack of staining is due to technical limitations of thewhole-mount in situ hybridization procedure and not due tocloning artefacts.
Further analysis was confined to the 449 differentiallyexpressed genes. Sequence cluster analysis revealed thatthey represent 273 unique, non-allelicXenopusgenes, 75%(204) of these represent novelXenopusgenes. Among the176 redundant cDNAs the most represented areHmg2(×14), histone H3 (×10), and 16s mitochondrial rRNA (×10).
Although necessarily subjective, we attempted a functionalclassification of the 208 cDNAs with attributable function:strikingly, 27% of all unique cDNAs with attributable func-tion represent genes with a potential regulatory role in devel-opment (growth factors and receptors, signal transductioncomponents and transcription factors). Among these wefind genes with an established function as developmentalregulators, e.g.Xanf1(Zaraisky et al., 1992),XFKHI (Dirksenand Jamrich, 1992; Kno¨chel et al., 1992; Ruiz i Altaba andJessell, 1992),brachyury (Smith et al., 1991),myf5 (Hop-wood et al., 1991),otx2 (Blitz and Cho, 1995; Xu et al.,1995), HoxD1 (Blumberg et al., 1991) andfrzb (Leyns etal., 1997) suggesting that expression screening allows iden-tification of functionally relevant genes. Two novel homeo-box genes identified in this screen have already been shownto be involved in dorso-ventral axis formation (Gawantka etal., 1995; Onichtchouk et al., 1996). An additional 14% of thegenes identified are similar to genes regulating housekeepingfunctions such as cell cycle and global control of geneexpression. An interesting part of the 273 unique genes iden-tified are those that do not show any significant sequence
96 V. Gawantka et al. / Mechanisms of Development 77 (1998) 95–141
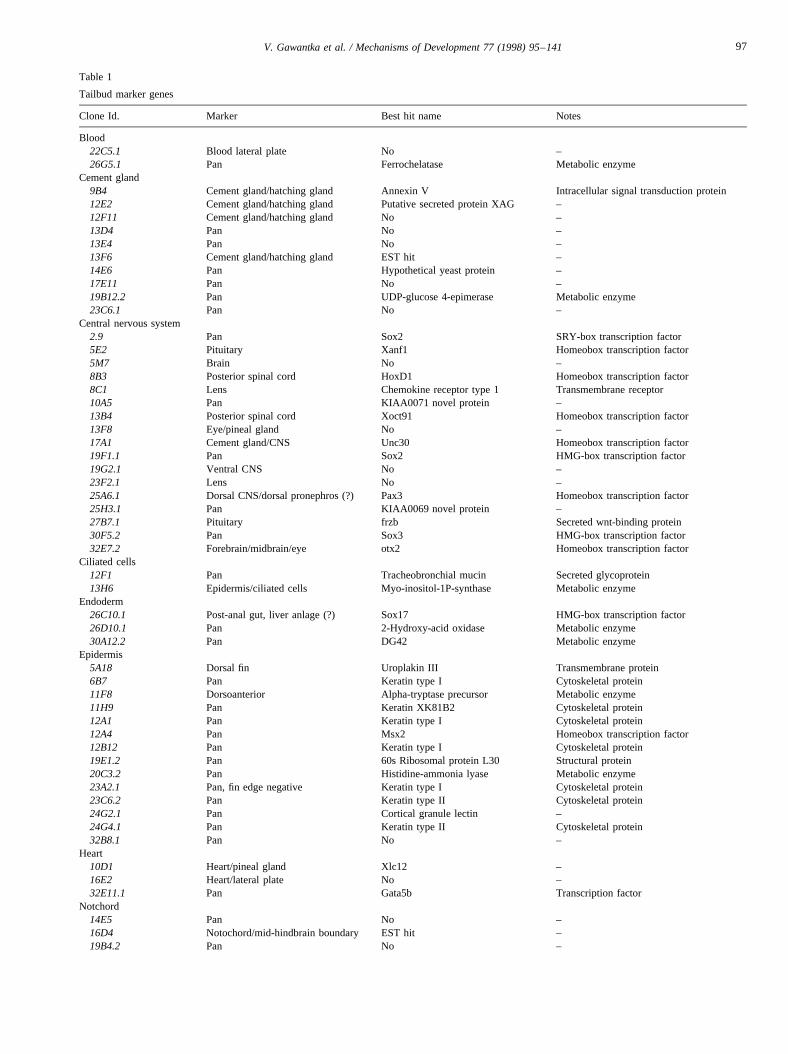
Table 1
Tailbud marker genes
Clone Id. Marker Best hit name Notes
Blood22C5.1 Blood lateral plate No –26G5.1 Pan Ferrochelatase Metabolic enzyme
Cement gland9B4 Cement gland/hatching gland Annexin V Intracellular signal transduction protein12E2 Cement gland/hatching gland Putative secreted protein XAG –12F11 Cement gland/hatching gland No –13D4 Pan No –13E4 Pan No –13F6 Cement gland/hatching gland EST hit –14E6 Pan Hypothetical yeast protein –17E11 Pan No –19B12.2 Pan UDP-glucose 4-epimerase Metabolic enzyme23C6.1 Pan No –
Central nervous system2.9 Pan Sox2 SRY-box transcription factor5E2 Pituitary Xanf1 Homeobox transcription factor5M7 Brain No –8B3 Posterior spinal cord HoxD1 Homeobox transcription factor8C1 Lens Chemokine receptor type 1 Transmembrane receptor10A5 Pan KIAA0071 novel protein –13B4 Posterior spinal cord Xoct91 Homeobox transcription factor13F8 Eye/pineal gland No –17A1 Cement gland/CNS Unc30 Homeobox transcription factor19F1.1 Pan Sox2 HMG-box transcription factor19G2.1 Ventral CNS No –23F2.1 Lens No –25A6.1 Dorsal CNS/dorsal pronephros (?) Pax3 Homeobox transcription factor25H3.1 Pan KIAA0069 novel protein –27B7.1 Pituitary frzb Secreted wnt-binding protein30F5.2 Pan Sox3 HMG-box transcription factor32E7.2 Forebrain/midbrain/eye otx2 Homeobox transcription factor
Ciliated cells12F1 Pan Tracheobronchial mucin Secreted glycoprotein13H6 Epidermis/ciliated cells Myo-inositol-1P-synthase Metabolic enzyme
Endoderm26C10.1 Post-anal gut, liver anlage (?) Sox17 HMG-box transcription factor26D10.1 Pan 2-Hydroxy-acid oxidase Metabolic enzyme30A12.2 Pan DG42 Metabolic enzyme
Epidermis5A18 Dorsal fin Uroplakin III Transmembrane protein6B7 Pan Keratin type I Cytoskeletal protein11F8 Dorsoanterior Alpha-tryptase precursor Metabolic enzyme11H9 Pan Keratin XK81B2 Cytoskeletal protein12A1 Pan Keratin type I Cytoskeletal protein12A4 Pan Msx2 Homeobox transcription factor12B12 Pan Keratin type I Cytoskeletal protein19E1.2 Pan 60s Ribosomal protein L30 Structural protein20C3.2 Pan Histidine-ammonia lyase Metabolic enzyme23A2.1 Pan, fin edge negative Keratin type I Cytoskeletal protein23C6.2 Pan Keratin type II Cytoskeletal protein24G2.1 Pan Cortical granule lectin –24G4.1 Pan Keratin type II Cytoskeletal protein32B8.1 Pan No –
Heart10D1 Heart/pineal gland Xlc12 –16E2 Heart/lateral plate No –32E11.1 Pan Gata5b Transcription factor
Notchord14E5 Pan No –16D4 Notochord/mid-hindbrain boundary EST hit –19B4.2 Pan No –
97V. Gawantka et al. / Mechanisms of Development 77 (1998) 95–141
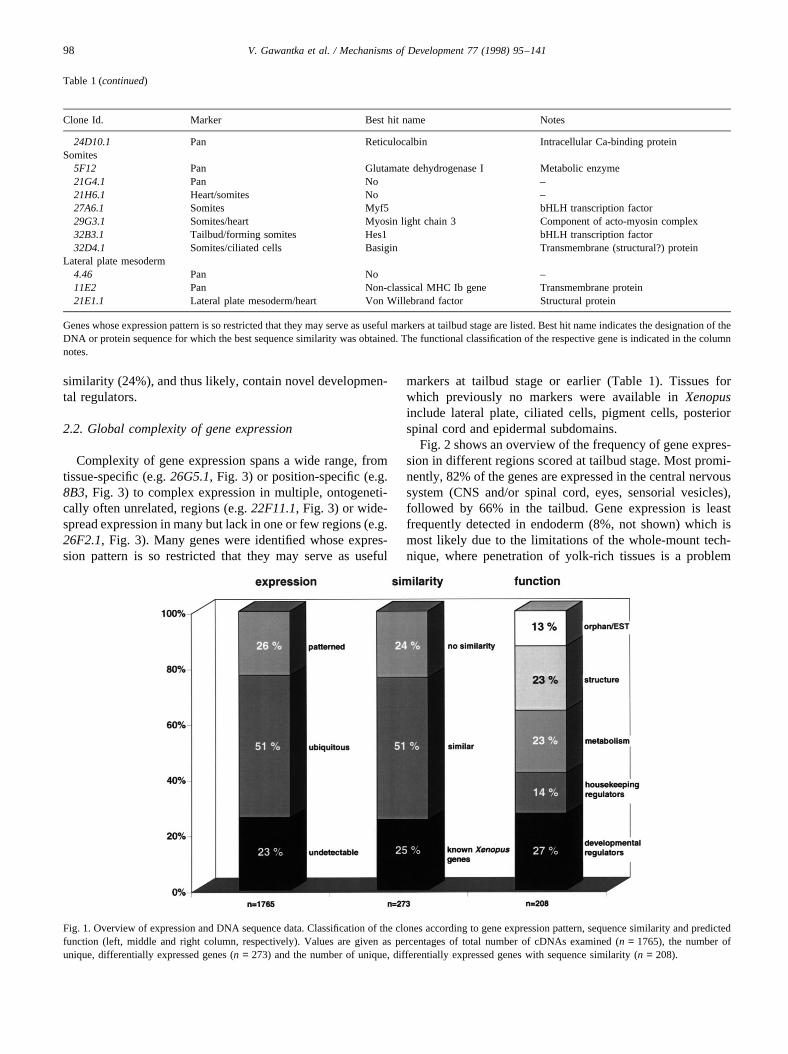
similarity (24%), and thus likely, contain novel developmen-tal regulators.
2.2. Global complexity of gene expression
Complexity of gene expression spans a wide range, fromtissue-specific (e.g.26G5.1, Fig. 3) or position-specific (e.g.8B3, Fig. 3) to complex expression in multiple, ontogeneti-cally often unrelated, regions (e.g.22F11.1, Fig. 3) or wide-spread expression in many but lack in one or few regions (e.g.26F2.1, Fig. 3). Many genes were identified whose expres-sion pattern is so restricted that they may serve as useful
markers at tailbud stage or earlier (Table 1). Tissues forwhich previously no markers were available inXenopusinclude lateral plate, ciliated cells, pigment cells, posteriorspinal cord and epidermal subdomains.
Fig. 2 shows an overview of the frequency of gene expres-sion in different regions scored at tailbud stage. Most promi-nently, 82% of the genes are expressed in the central nervoussystem (CNS and/or spinal cord, eyes, sensorial vesicles),followed by 66% in the tailbud. Gene expression is leastfrequently detected in endoderm (8%, not shown) which ismost likely due to the limitations of the whole-mount tech-nique, where penetration of yolk-rich tissues is a problem
Table 1
Clone Id. Marker Best hit name Notes
24D10.1 Pan Reticulocalbin Intracellular Ca-binding proteinSomites
5F12 Pan Glutamate dehydrogenase I Metabolic enzyme21G4.1 Pan No –21H6.1 Heart/somites No –27A6.1 Somites Myf5 bHLH transcription factor29G3.1 Somites/heart Myosin light chain 3 Component of acto-myosin complex32B3.1 Tailbud/forming somites Hes1 bHLH transcription factor32D4.1 Somites/ciliated cells Basigin Transmembrane (structural?) protein
Lateral plate mesoderm4.46 Pan No –11E2 Pan Non-classical MHC Ib gene Transmembrane protein21E1.1 Lateral plate mesoderm/heart Von Willebrand factor Structural protein
Genes whose expression pattern is so restricted that they may serve as useful markers at tailbud stage are listed. Best hit name indicates the designation of theDNA or protein sequence for which the best sequence similarity was obtained. The functional classification of the respective gene is indicated in the columnnotes.
Fig. 1. Overview of expression and DNA sequence data. Classification of the clones according to gene expression pattern, sequence similarity and predictedfunction (left, middle and right column, respectively). Values are given as percentages of total number of cDNAs examined (n = 1765), the number ofunique, differentially expressed genes (n = 273) and the number of unique, differentially expressed genes with sequence similarity (n = 208).
(continued)
98 V. Gawantka et al. / Mechanisms of Development 77 (1998) 95–141
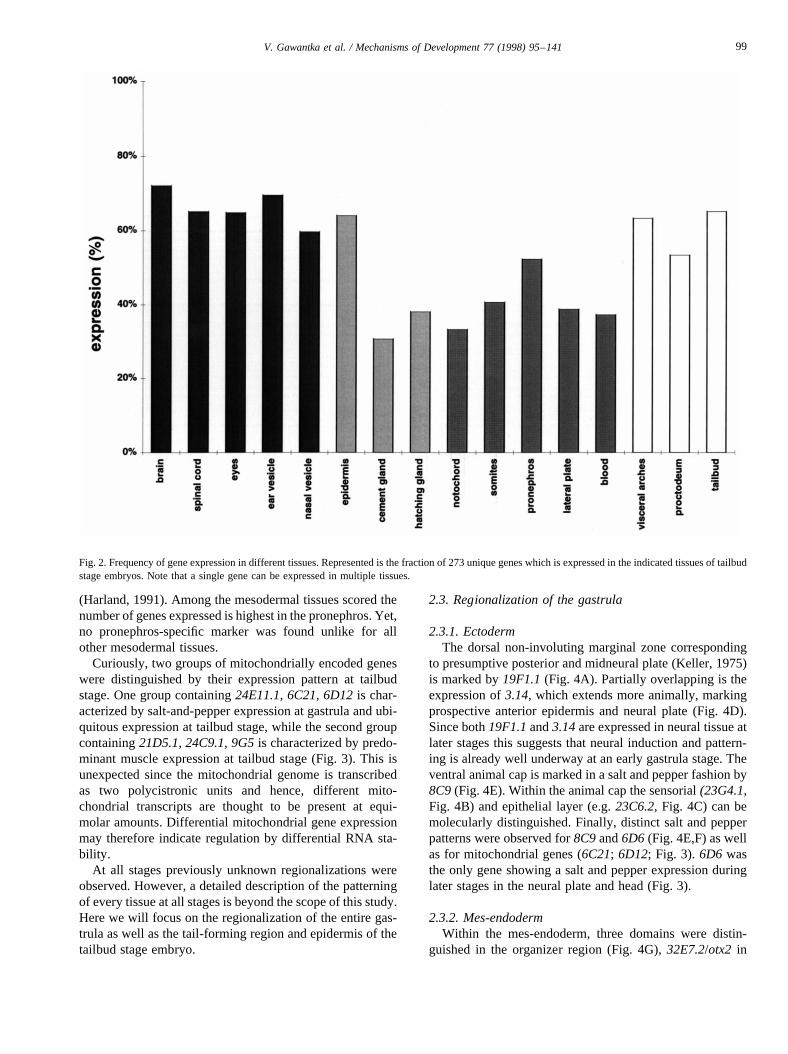
(Harland, 1991). Among the mesodermal tissues scored thenumber of genes expressed is highest in the pronephros. Yet,no pronephros-specific marker was found unlike for allother mesodermal tissues.
Curiously, two groups of mitochondrially encoded geneswere distinguished by their expression pattern at tailbudstage. One group containing24E11.1, 6C21, 6D12is char-acterized by salt-and-pepper expression at gastrula and ubi-quitous expression at tailbud stage, while the second groupcontaining21D5.1, 24C9.1, 9G5is characterized by predo-minant muscle expression at tailbud stage (Fig. 3). This isunexpected since the mitochondrial genome is transcribedas two polycistronic units and hence, different mito-chondrial transcripts are thought to be present at equi-molar amounts. Differential mitochondrial gene expressionmay therefore indicate regulation by differential RNA sta-bility.
At all stages previously unknown regionalizations wereobserved. However, a detailed description of the patterningof every tissue at all stages is beyond the scope of this study.Here we will focus on the regionalization of the entire gas-trula as well as the tail-forming region and epidermis of thetailbud stage embryo.
2.3. Regionalization of the gastrula
2.3.1. EctodermThe dorsal non-involuting marginal zone corresponding
to presumptive posterior and midneural plate (Keller, 1975)is marked by19F1.1(Fig. 4A). Partially overlapping is theexpression of3.14, which extends more animally, markingprospective anterior epidermis and neural plate (Fig. 4D).Since both19F1.1and3.14are expressed in neural tissue atlater stages this suggests that neural induction and pattern-ing is already well underway at an early gastrula stage. Theventral animal cap is marked in a salt and pepper fashion by8C9(Fig. 4E). Within the animal cap the sensorial(23G4.1,Fig. 4B) and epithelial layer (e.g.23C6.2, Fig. 4C) can bemolecularly distinguished. Finally, distinct salt and pepperpatterns were observed for8C9and6D6 (Fig. 4E,F) as wellas for mitochondrial genes (6C21; 6D12; Fig. 3). 6D6 wasthe only gene showing a salt and pepper expression duringlater stages in the neural plate and head (Fig. 3).
2.3.2. Mes-endodermWithin the mes-endoderm, three domains were distin-
guished in the organizer region (Fig. 4G),32E7.2/otx2 in
Fig. 2. Frequency of gene expression in different tissues. Represented is the fraction of 273 unique genes which is expressed in the indicated tissuesof tailbudstage embryos. Note that a single gene can be expressed in multiple tissues.
99V. Gawantka et al. / Mechanisms of Development 77 (1998) 95–141
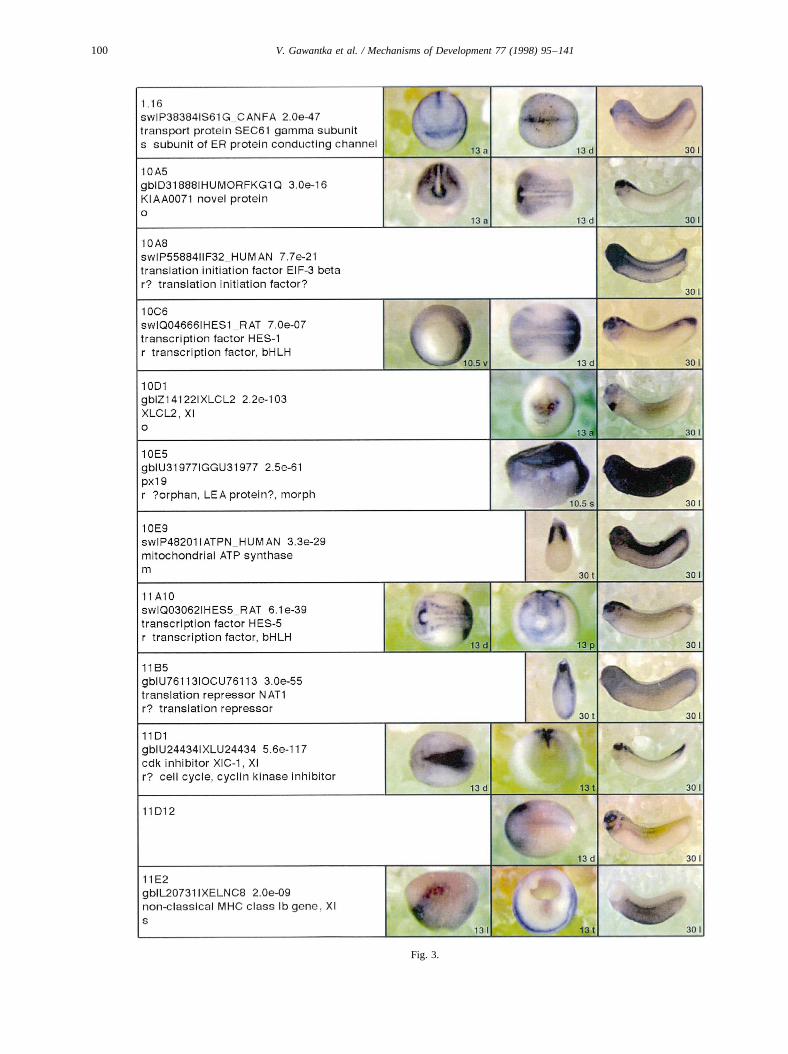
Fig. 3.
100 V. Gawantka et al. / Mechanisms of Development 77 (1998) 95–141
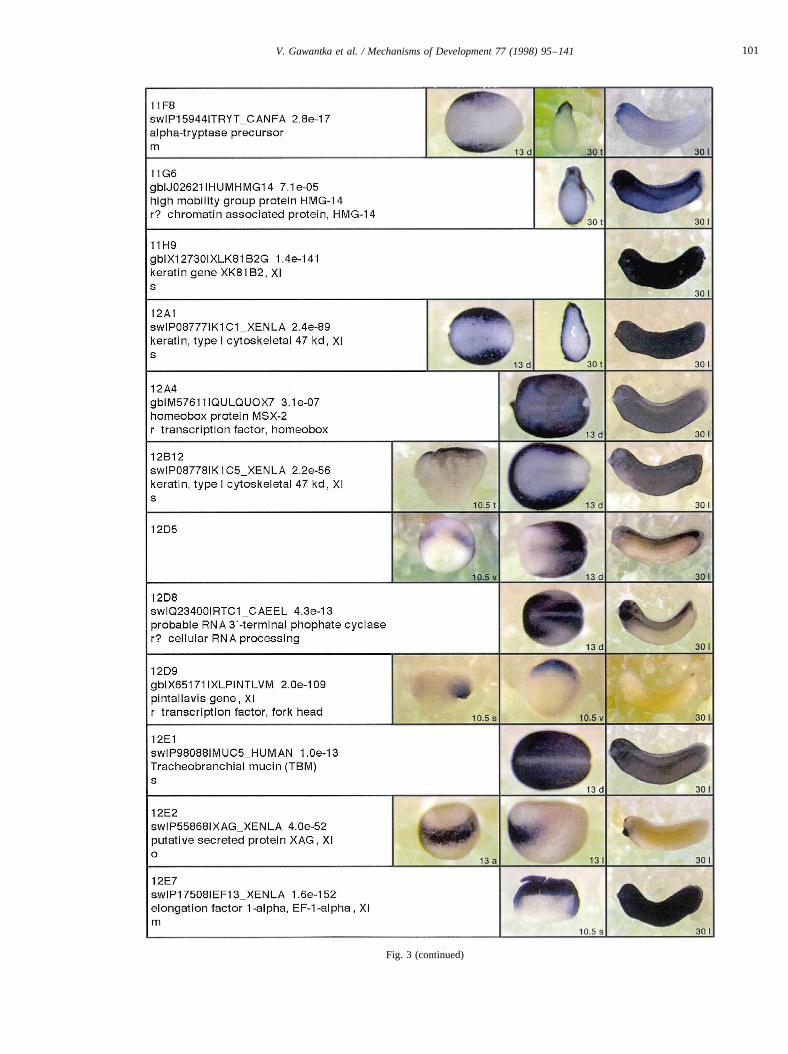
Fig. 3 (continued)
101V. Gawantka et al. / Mechanisms of Development 77 (1998) 95–141
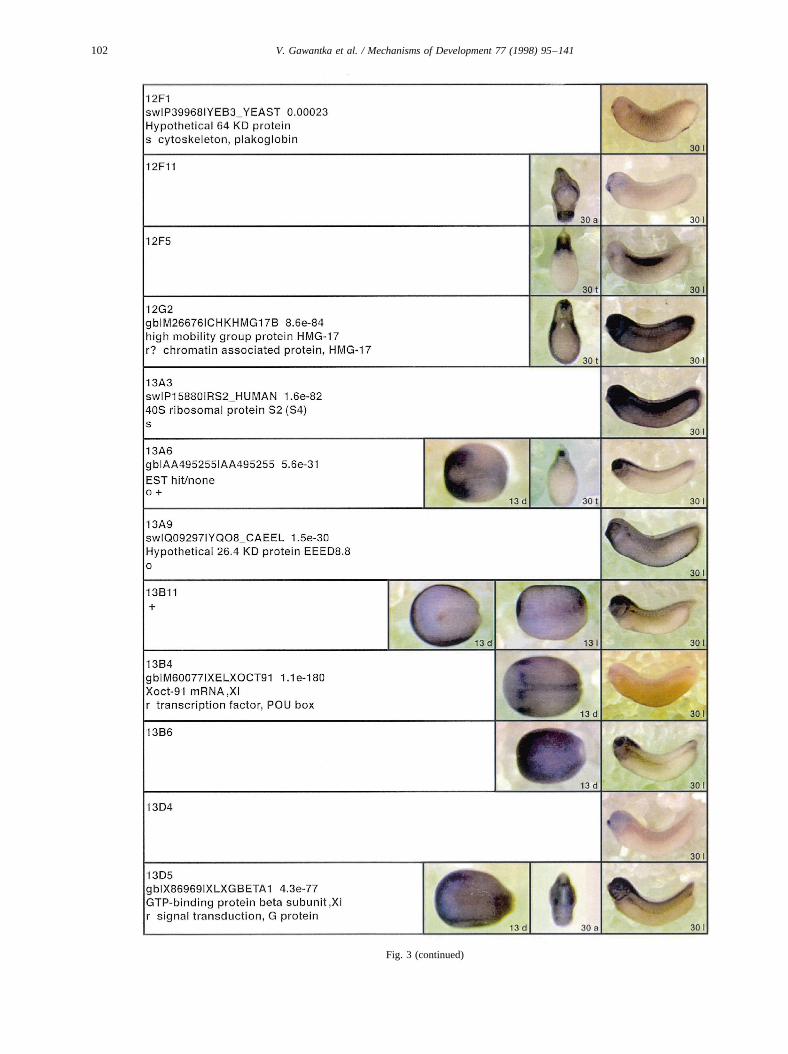
Fig. 3 (continued)
102 V. Gawantka et al. / Mechanisms of Development 77 (1998) 95–141
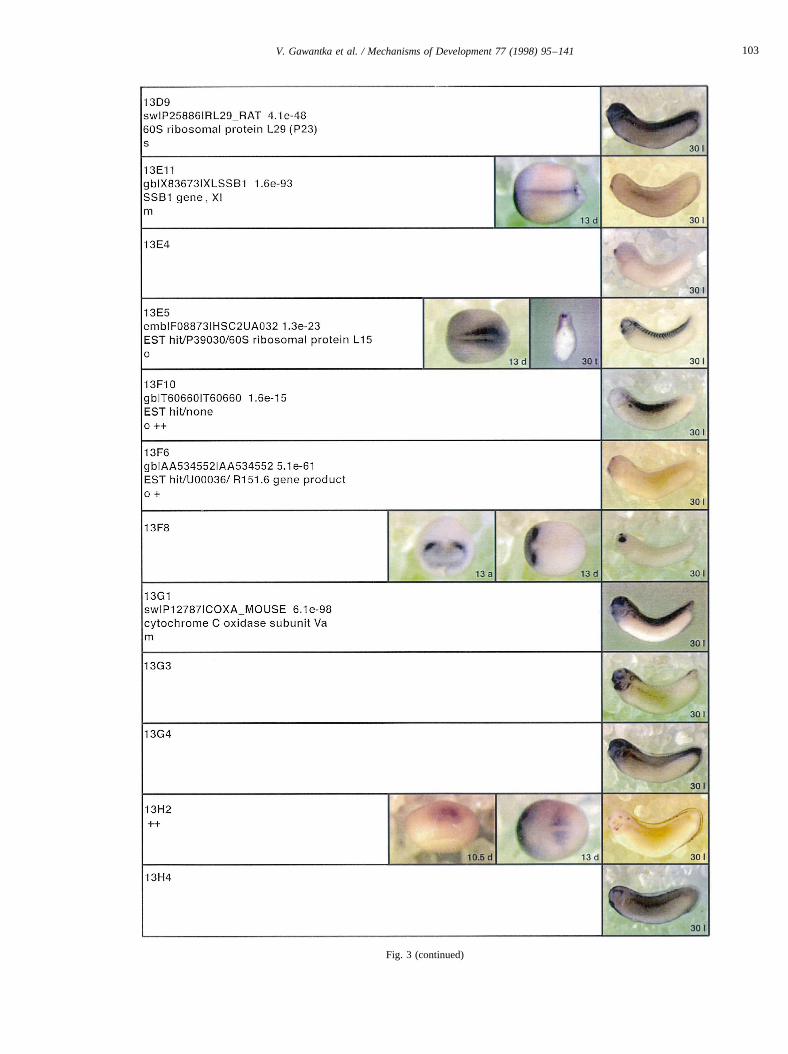
Fig. 3 (continued)
103V. Gawantka et al. / Mechanisms of Development 77 (1998) 95–141
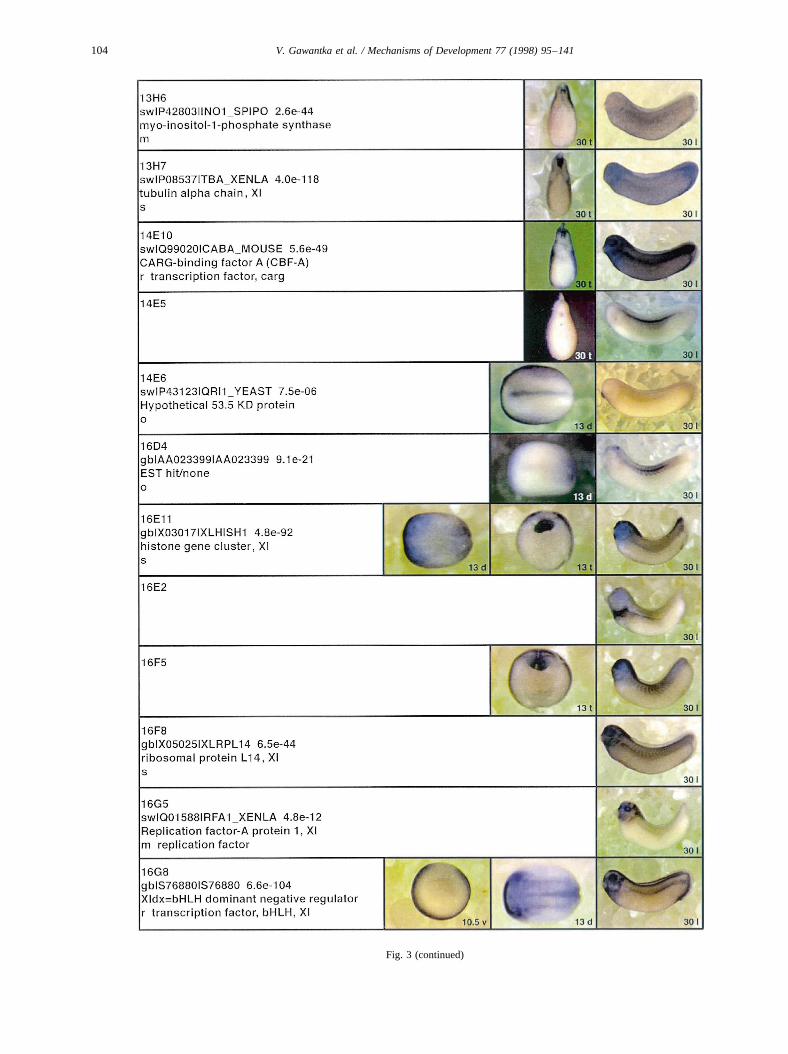
Fig. 3 (continued)
104 V. Gawantka et al. / Mechanisms of Development 77 (1998) 95–141
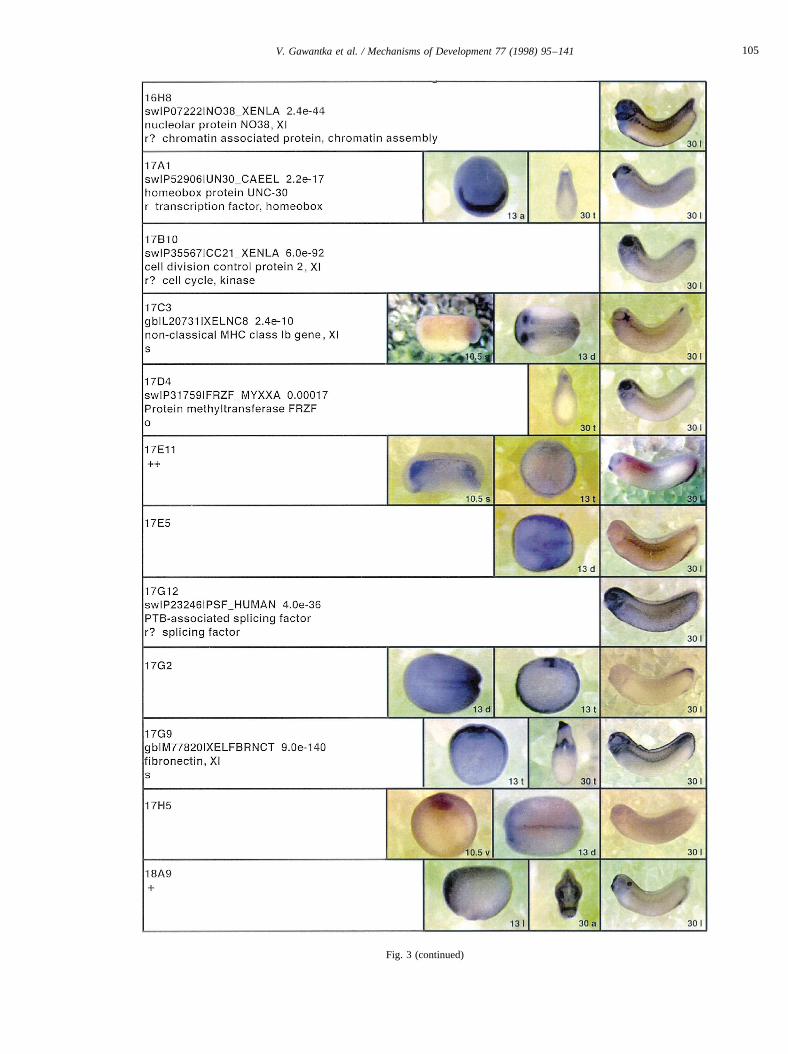
Fig. 3 (continued)
105V. Gawantka et al. / Mechanisms of Development 77 (1998) 95–141
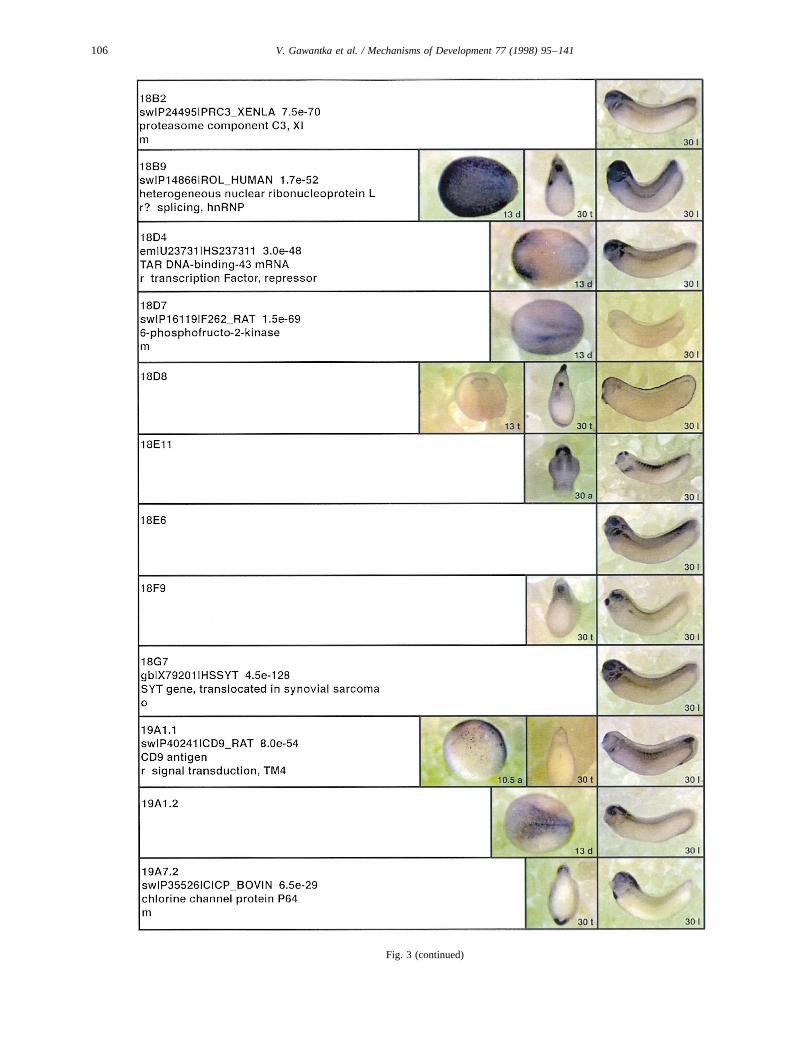
Fig. 3 (continued)
106 V. Gawantka et al. / Mechanisms of Development 77 (1998) 95–141
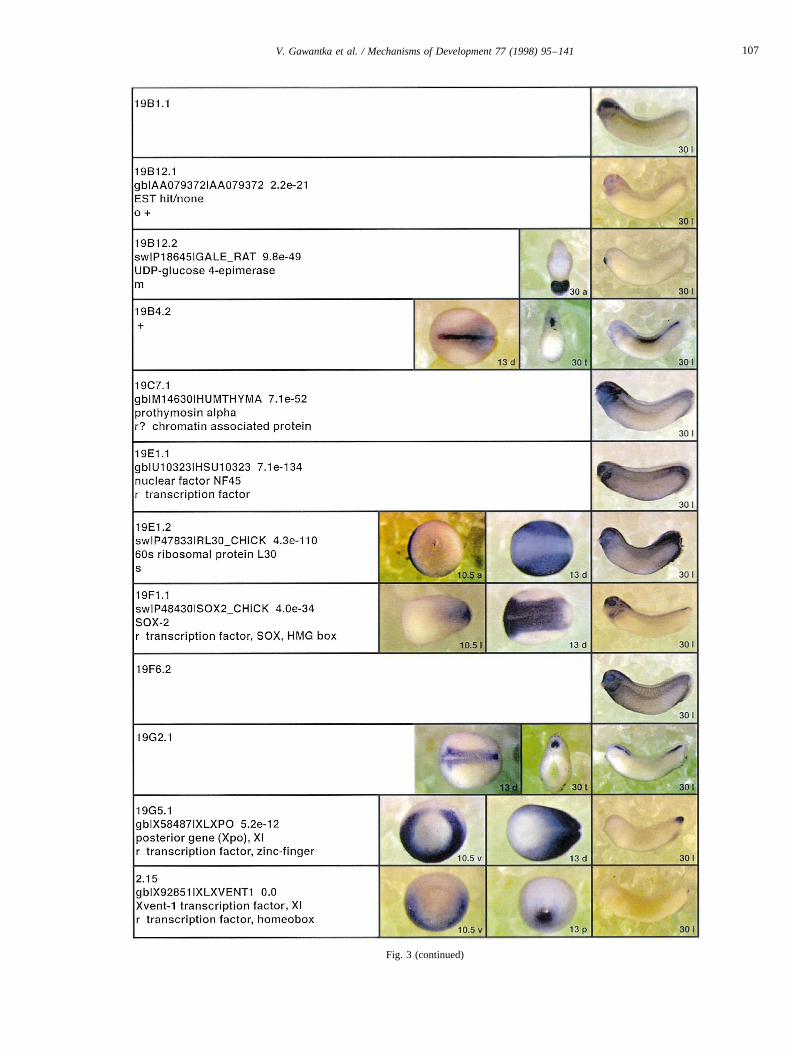
Fig. 3 (continued)
107V. Gawantka et al. / Mechanisms of Development 77 (1998) 95–141
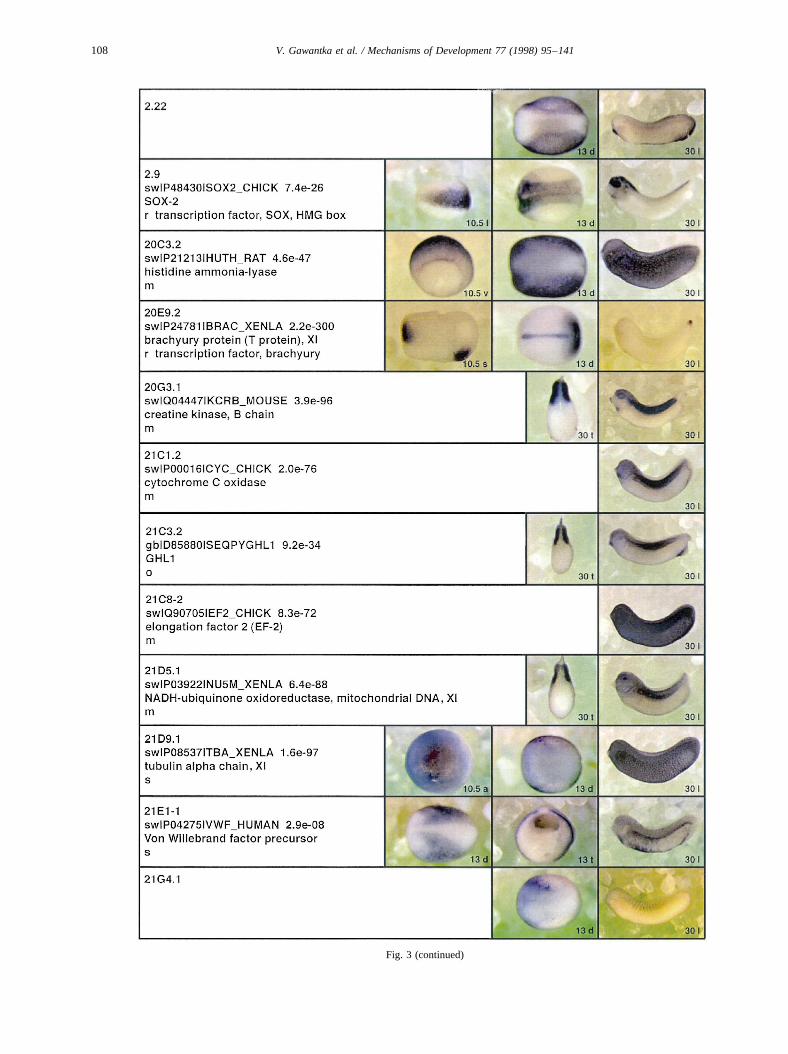
Fig. 3 (continued)
108 V. Gawantka et al. / Mechanisms of Development 77 (1998) 95–141
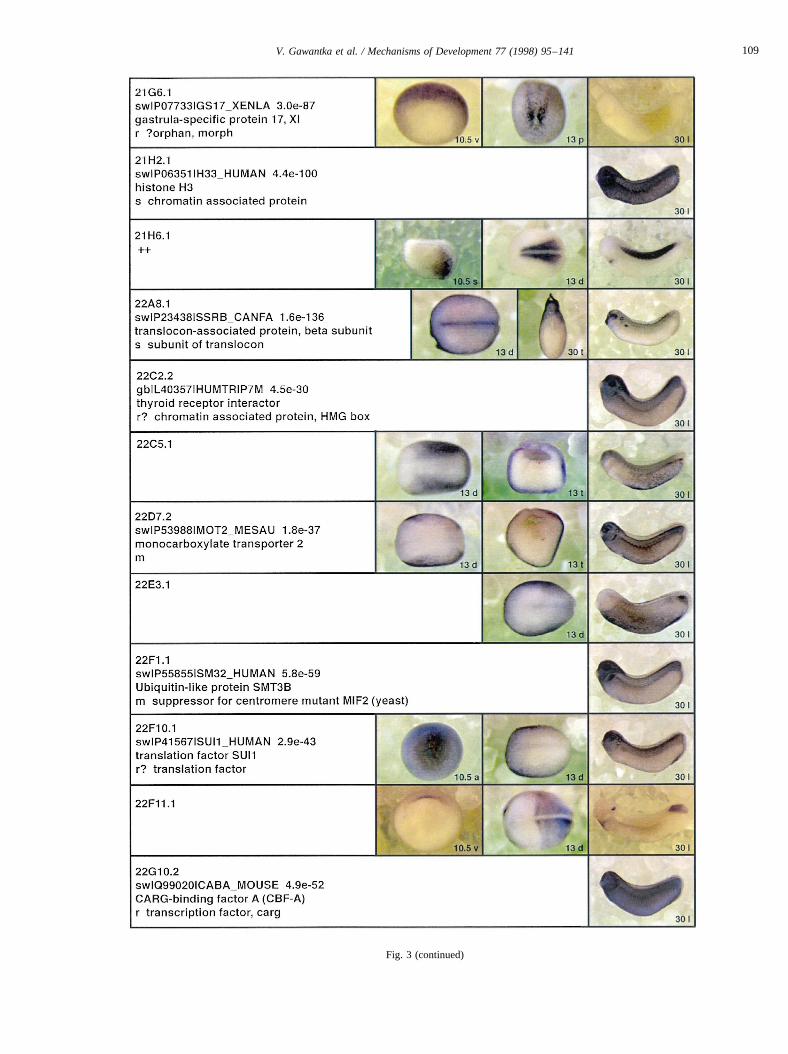
Fig. 3 (continued)
109V. Gawantka et al. / Mechanisms of Development 77 (1998) 95–141
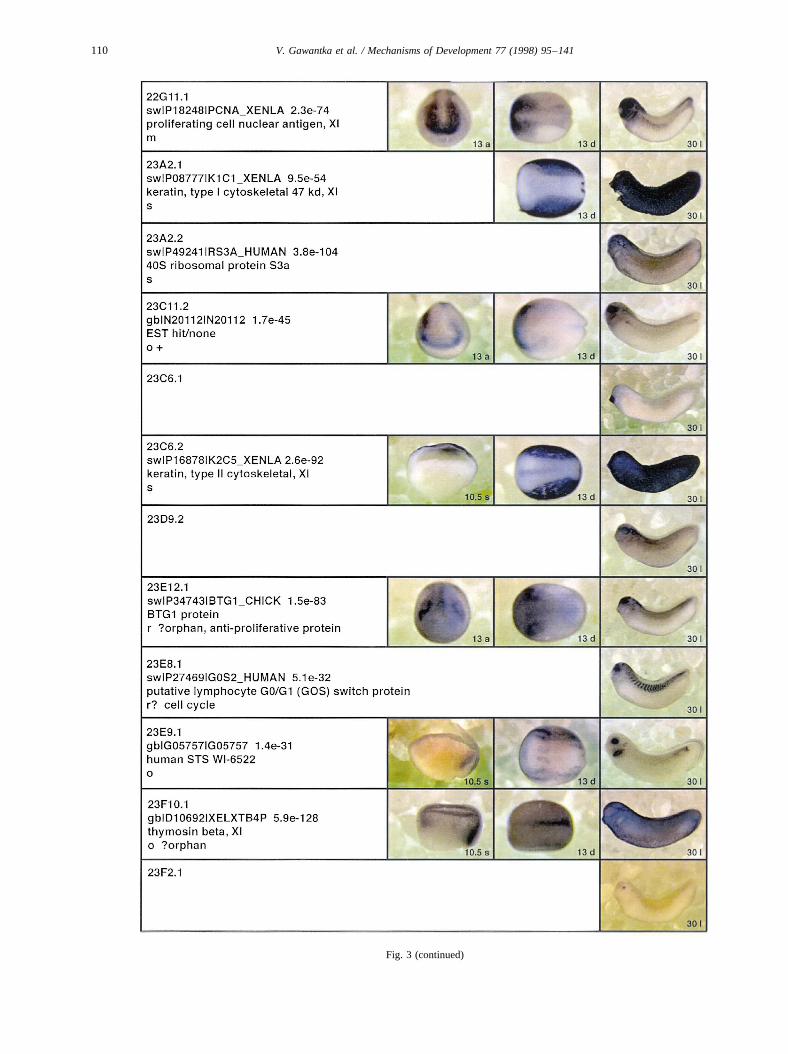
Fig. 3 (continued)
110 V. Gawantka et al. / Mechanisms of Development 77 (1998) 95–141
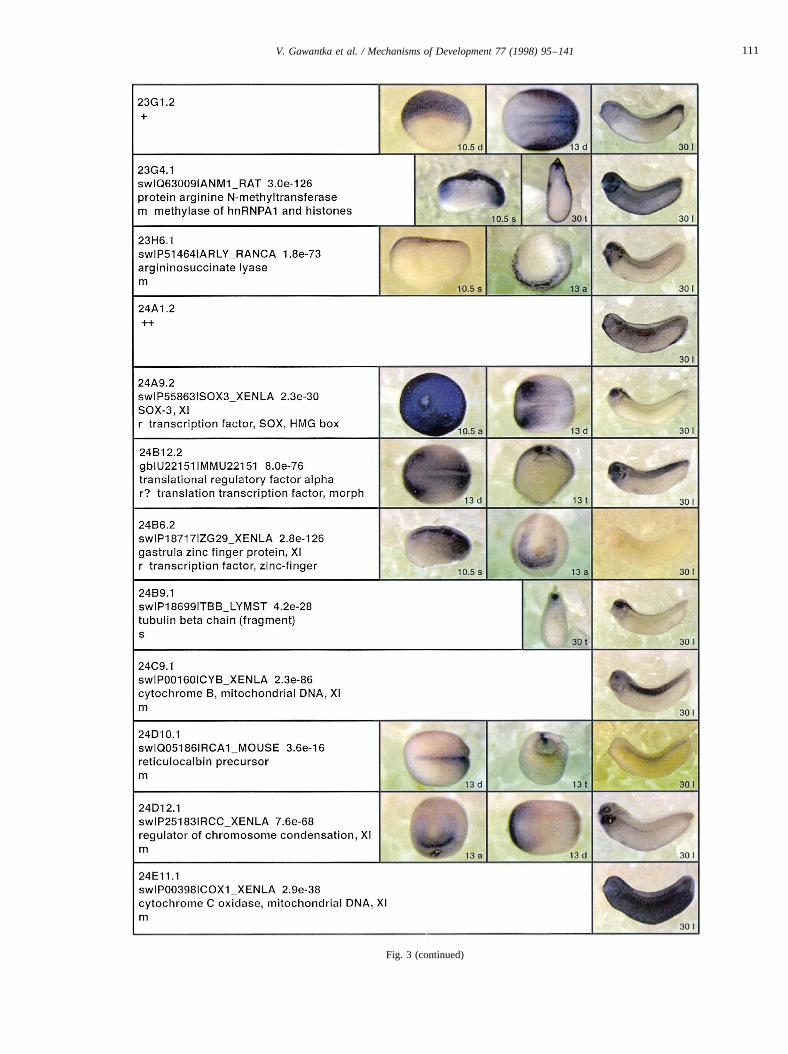
Fig. 3 (continued)
111V. Gawantka et al. / Mechanisms of Development 77 (1998) 95–141

Fig. 3 (continued)
112 V. Gawantka et al. / Mechanisms of Development 77 (1998) 95–141
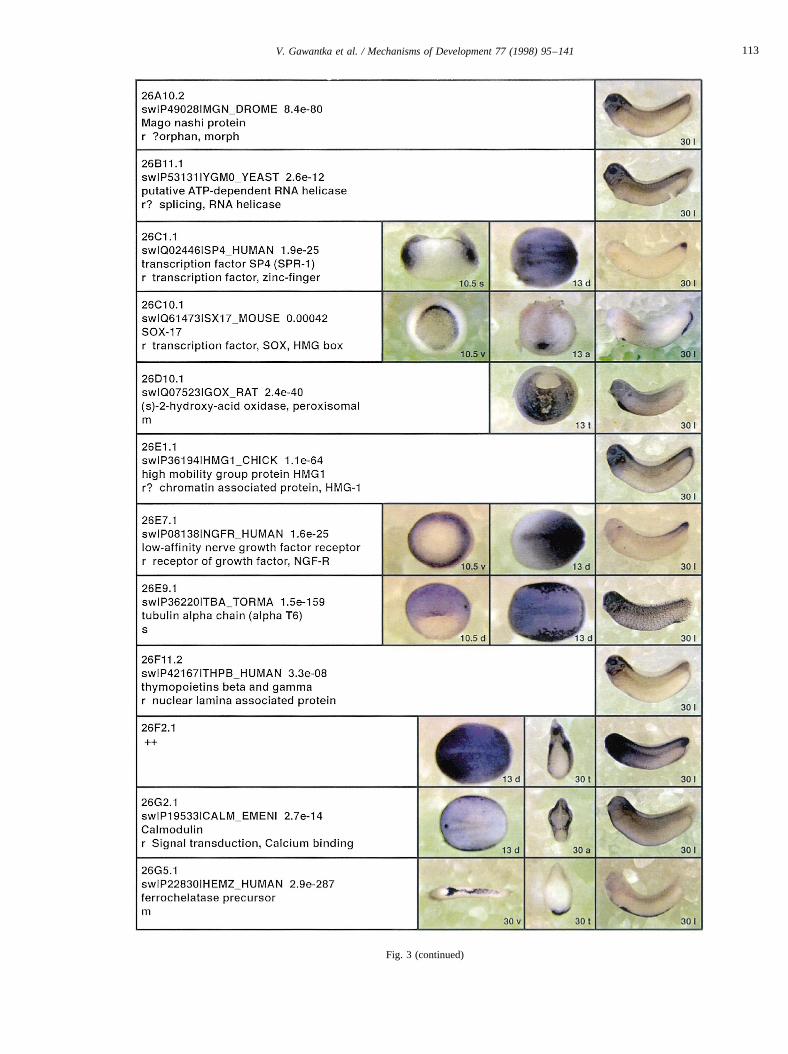
Fig. 3 (continued)
113V. Gawantka et al. / Mechanisms of Development 77 (1998) 95–141
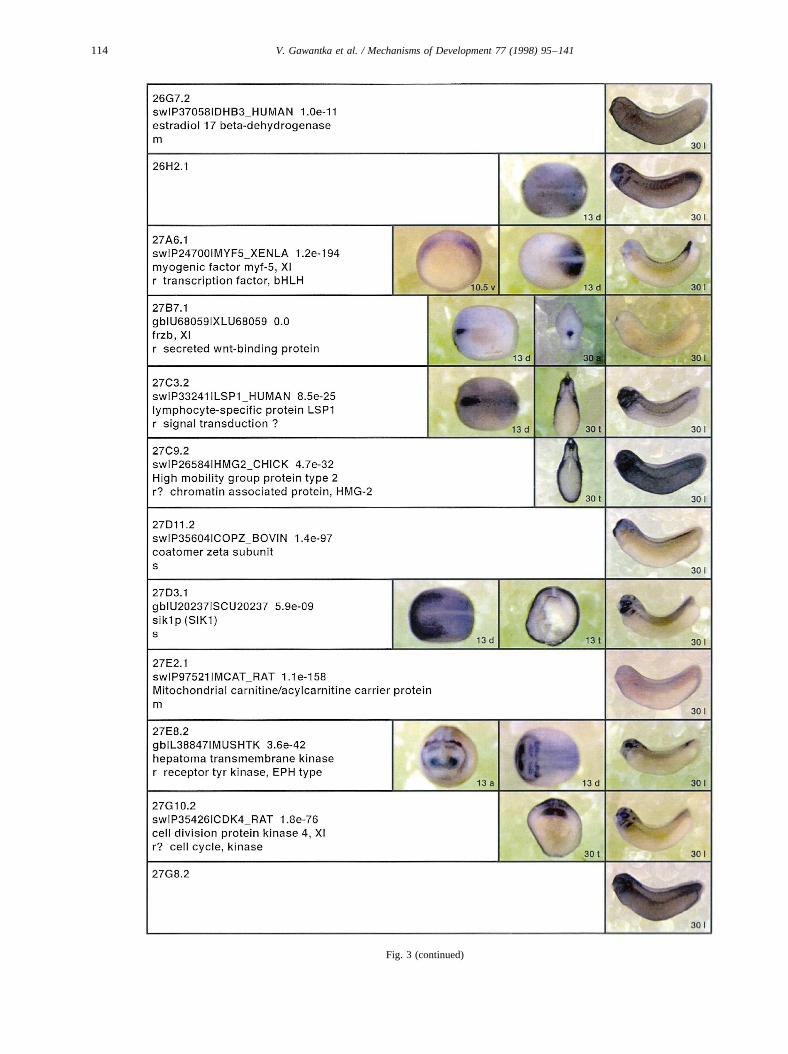
Fig. 3 (continued)
114 V. Gawantka et al. / Mechanisms of Development 77 (1998) 95–141
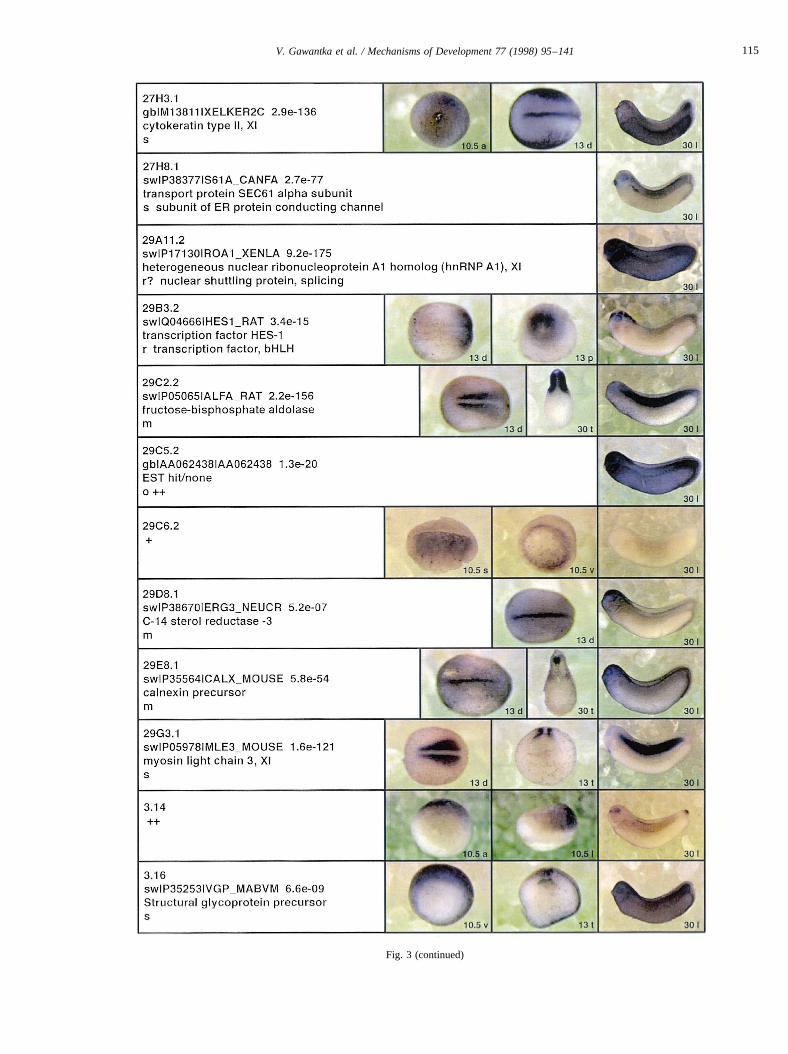
Fig. 3 (continued)
115V. Gawantka et al. / Mechanisms of Development 77 (1998) 95–141
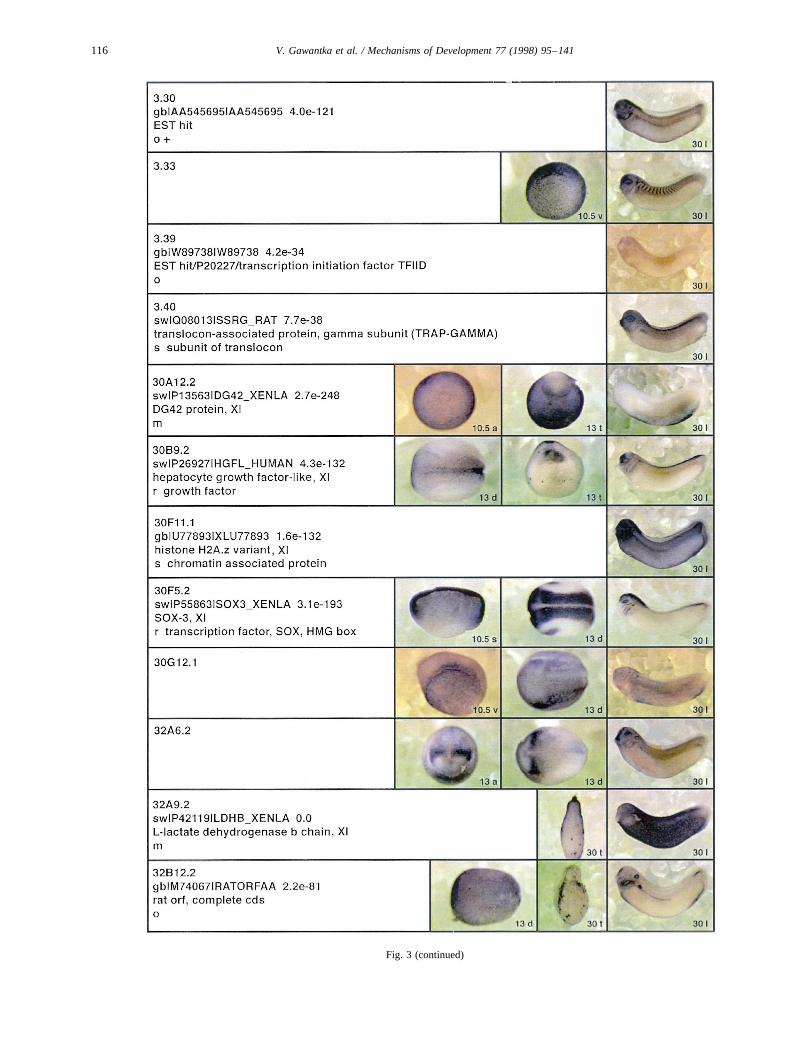
Fig. 3 (continued)
116 V. Gawantka et al. / Mechanisms of Development 77 (1998) 95–141
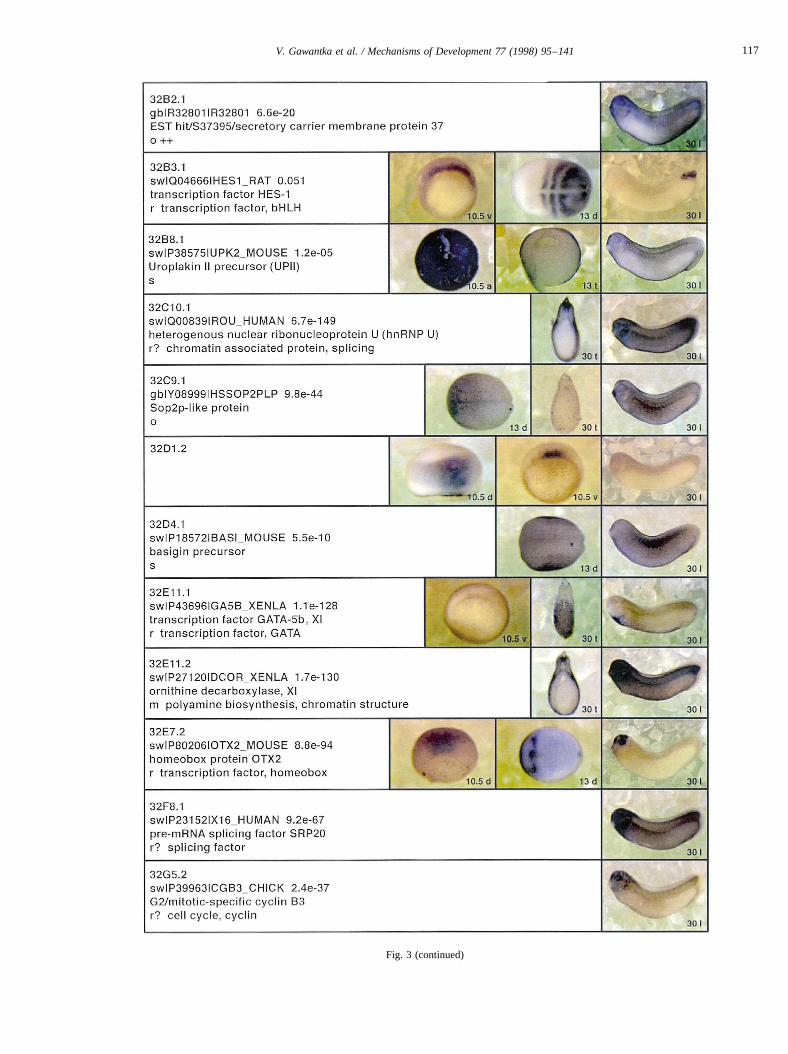
Fig. 3 (continued)
117V. Gawantka et al. / Mechanisms of Development 77 (1998) 95–141
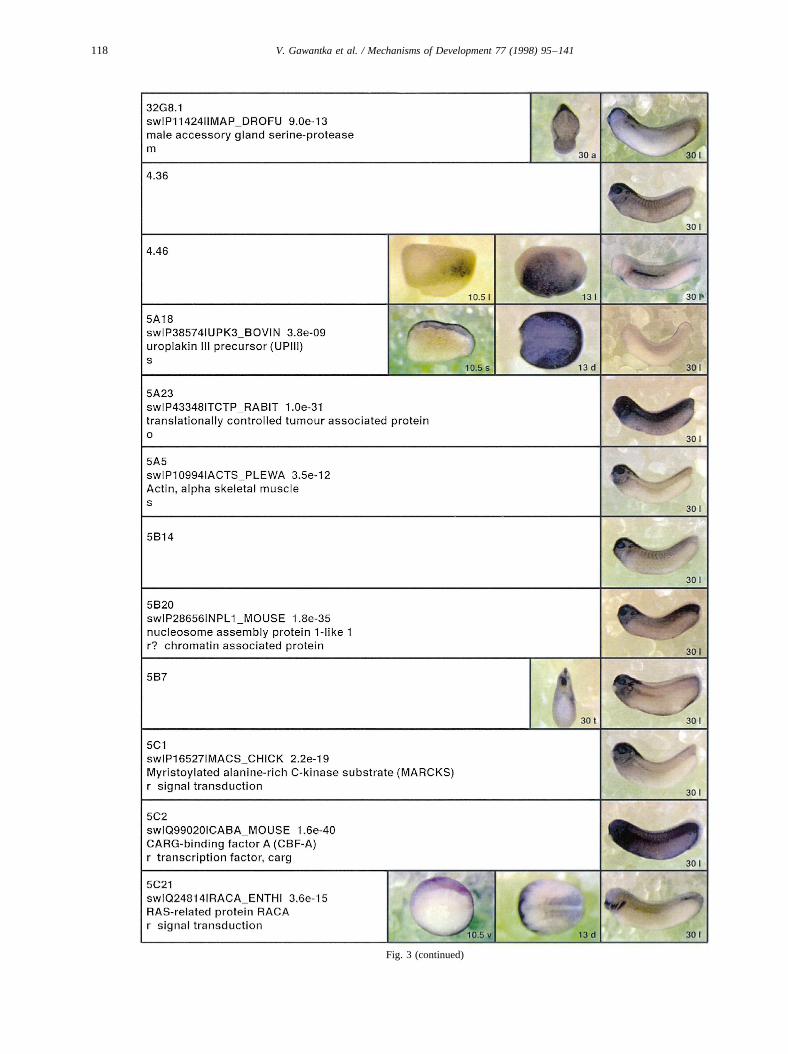
Fig. 3 (continued)
118 V. Gawantka et al. / Mechanisms of Development 77 (1998) 95–141
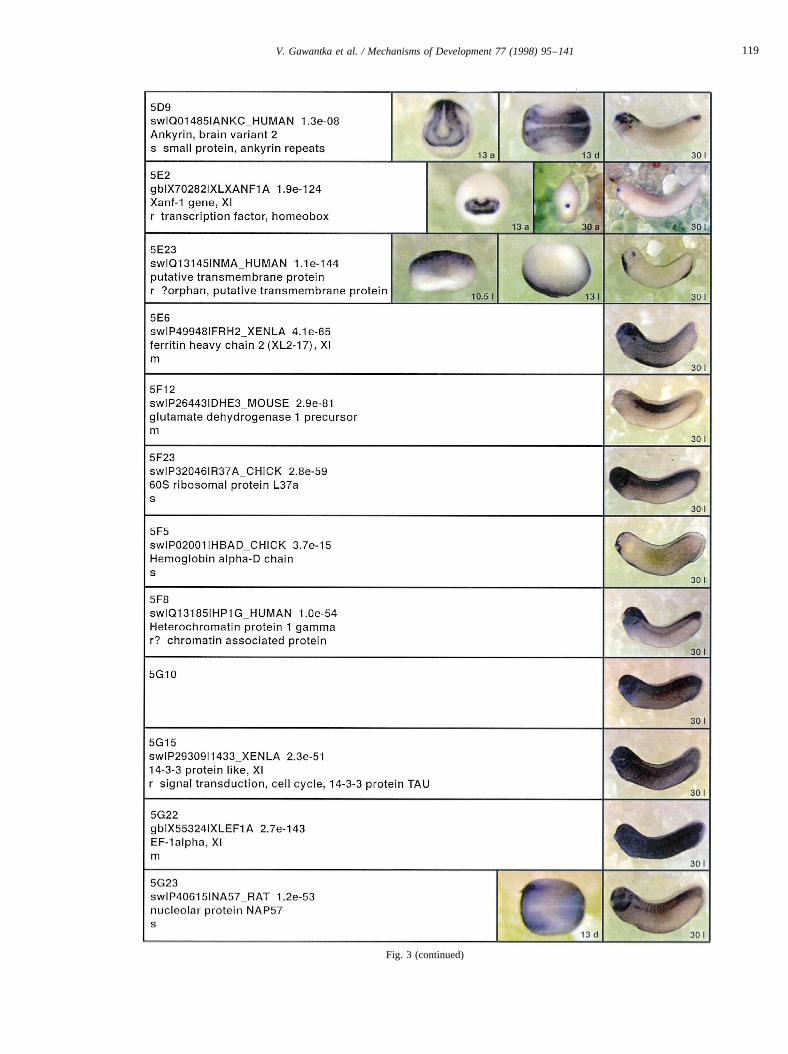
Fig. 3 (continued)
119V. Gawantka et al. / Mechanisms of Development 77 (1998) 95–141
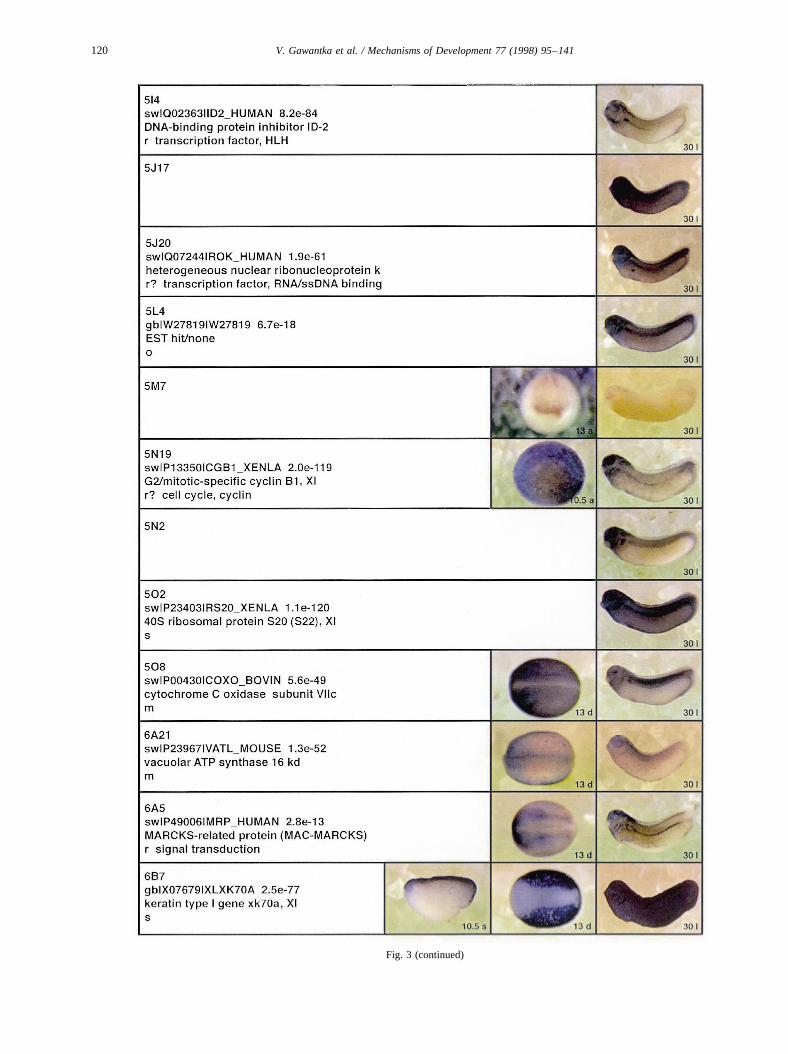
Fig. 3 (continued)
120 V. Gawantka et al. / Mechanisms of Development 77 (1998) 95–141
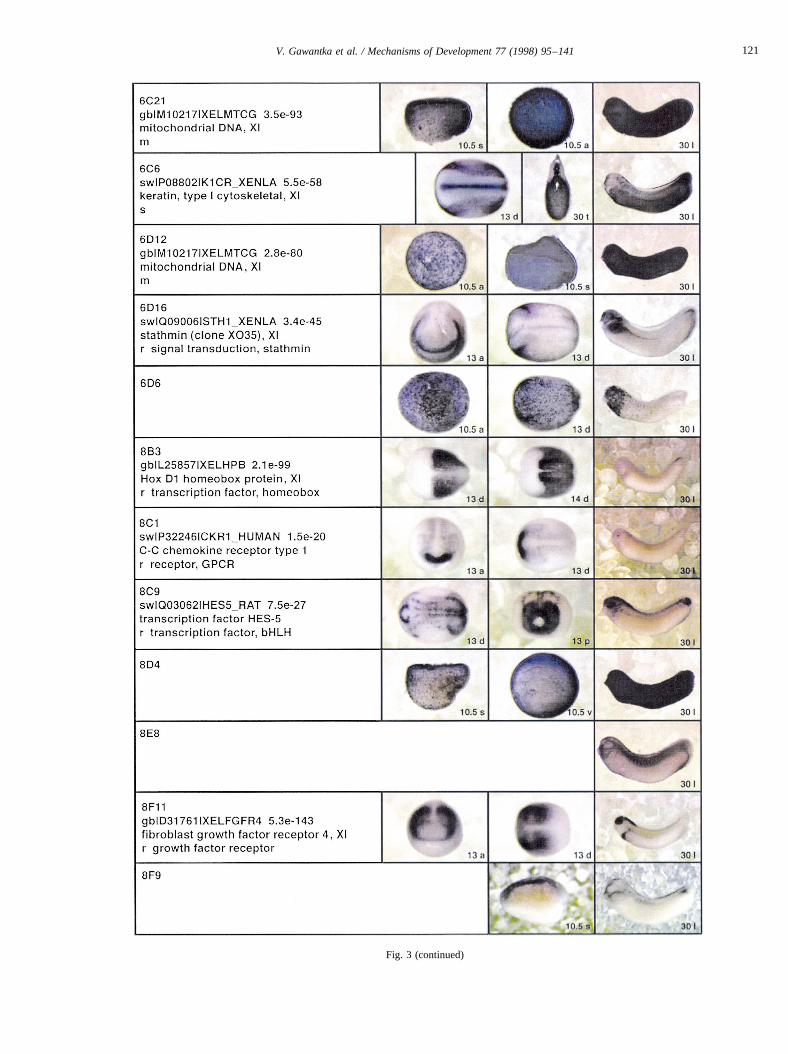
Fig. 3 (continued)
121V. Gawantka et al. / Mechanisms of Development 77 (1998) 95–141
the deep cells,23E9.1in prospective head-endomesodermalcells similar tocerberus(Bouwmeester et al., 1996), and32B3.1 predominantly in the involuting marginal zonecells. 2.15/Xvent1 marks the lateroventral (Fig. 4H)(Gawantka et al., 1995) and27A6.1/Xmyf5 the dorsolateralmesoderm (Fig. 4I) (Dosch et al., 1997), respectively.26E7.1is a novel pan-mesoderm specific gene (Fig. 4J). Superficial
cells of the dorsal lip differentially express26E9.1(Fig. 4K).An endoderm-specific gastrula marker is29C6.2(Fig. 4L).
Differentially expressed genes in the mes-endoderm withnuclear staining were observed, including23G1.2in the mar-ginal zone,29C6.2in the blastopore lip and vegetal cells, aswell as 4.46, expressed in nuclei of ventral marginal zonecells (Fig. 3).
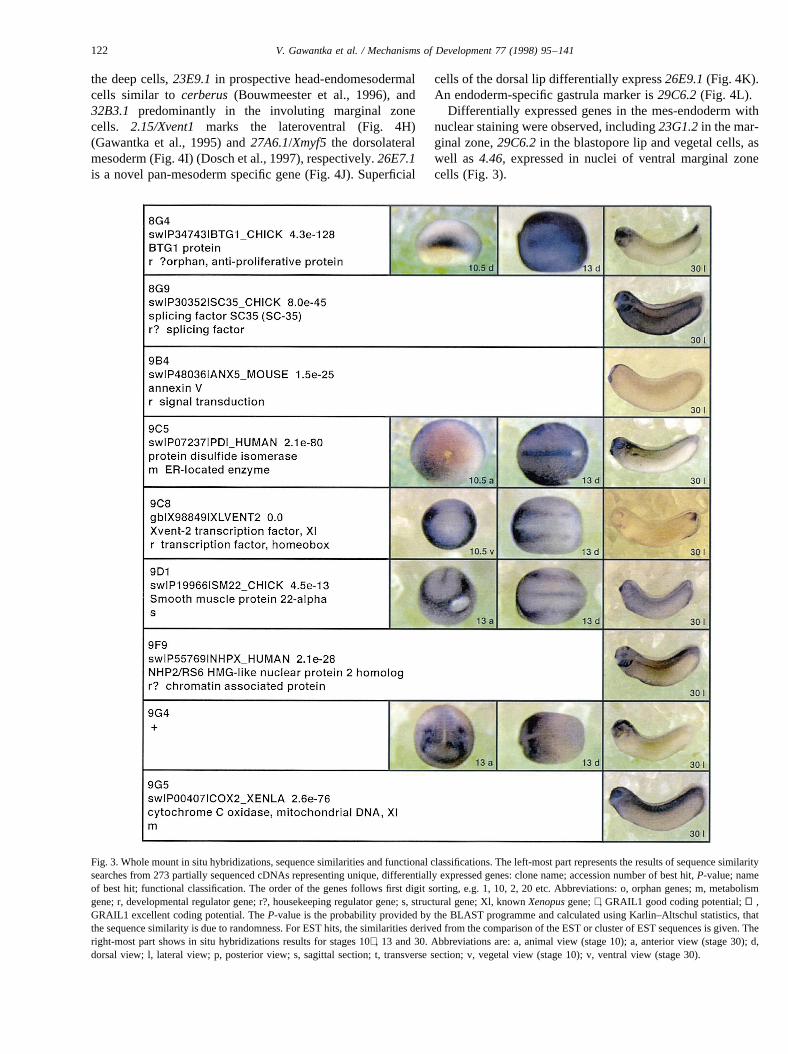
Fig. 3. Whole mount in situ hybridizations, sequence similarities and functional classifications. The left-most part represents the results of sequence similaritysearches from 273 partially sequenced cDNAs representing unique, differentially expressed genes: clone name; accession number of best hit,P-value; nameof best hit; functional classification. The order of the genes follows first digit sorting, e.g. 1, 10, 2, 20 etc. Abbreviations: o, orphan genes; m, metabolismgene; r, developmental regulator gene; r?, housekeeping regulator gene; s, structural gene; Xl, knownXenopusgene;+, GRAIL1 good coding potential;++,GRAIL1 excellent coding potential. TheP-value is the probability provided by the BLAST programme and calculated using Karlin–Altschul statistics, thatthe sequence similarity is due to randomness. For EST hits, the similarities derived from the comparison of the EST or cluster of EST sequences is given. Theright-most part shows in situ hybridizations results for stages 10+, 13 and 30. Abbreviations are: a, animal view (stage 10); a, anterior view (stage 30); d,dorsal view; l, lateral view; p, posterior view; s, sagittal section; t, transverse section; v, vegetal view (stage 10); v, ventral view (stage 30).
122 V. Gawantka et al. / Mechanisms of Development 77 (1998) 95–141

2.4. Regionalization of the tail-forming region
Tail formation is thought to be a continuation of gastrula-tion, involving at least three different cell populations in thetailbud. These domains, defined by comparing the expres-sion ofXnot2andXbra, are the chordoneural hinge (CNH),posterior wall and ventral spinal cord (Gont et al., 1993) (seealso Fig. 5C,F). Recently, as many as seven distinct domainsin the developing tailbud have been described (Beck andSlack, 1998). Here we used genes isolated in the screenwhich are expressed in distinct domains of the tail to defineten tail territories, shown in Fig. 5 and summarized in Table2.
The posterior spinal cord is subdivided into a roof and afloor domain. This double layer is best seen in the tailexpression pattern of17C3 and 8B3 (Fig. 5A,D), whosesagittal sections show labelling in the roof but not the
floor of the spinal cord. The spinal cord floor is labelledby Xnot2and17G2(Fig. 5C,H).
Within the CNH-notochord axis at least four domains canbe distinguished. Three domains are observed within theCNH, an anterior, middle and posterior region. The differ-ence between the anterior and the posterior domains is bestseen in comparing the expression of17C3 with 12D9 orXnot2 (Fig. 5A–C). The third, middle domain in the CNHexpresses11D1 in form of a stripe in continuity with thespinal cord floor (Fig. 5G, see sagittal and frontal sections).The fourth domain corresponds to posterior notochord, justanterior of the chordoneural hinge:17C3can be seen in thesagittal section to specifically label this region, unlikeXnot2(Fig. 5A,C).
Within the posterior wall, three domains can be distin-guished. Expression of32B3.1 (Fig. 5J) labels the entireposterior wall, while3.14 (Fig. 5E) marks the very tip, the
Fig. 4. Gastrula regionalization. Whole-mount in situ hybridizations of gastrula embryos are shown. Expression in ectodermal and mes-endodermal domainsis shown in upper and lower panel, respectively.(A,D,K) Dorsal view with animal pole facing up; (B,C,G,L), mid-sagittal sections, dorsal facing right, animalpole facing up; (E,F) animal view, dorsal facing up. (H,I,J) Vegetal view, dorsal facing up. bp, Dorsal blastopore lip; dac, dorsal animal cap; dNIMZ,dorsalnon-involuting marginal zone; eac, epithelial layer of animal cap; sac, sensorial layer of animal cap; vac, ventral animal cap.
123V. Gawantka et al. / Mechanisms of Development 77 (1998) 95–141
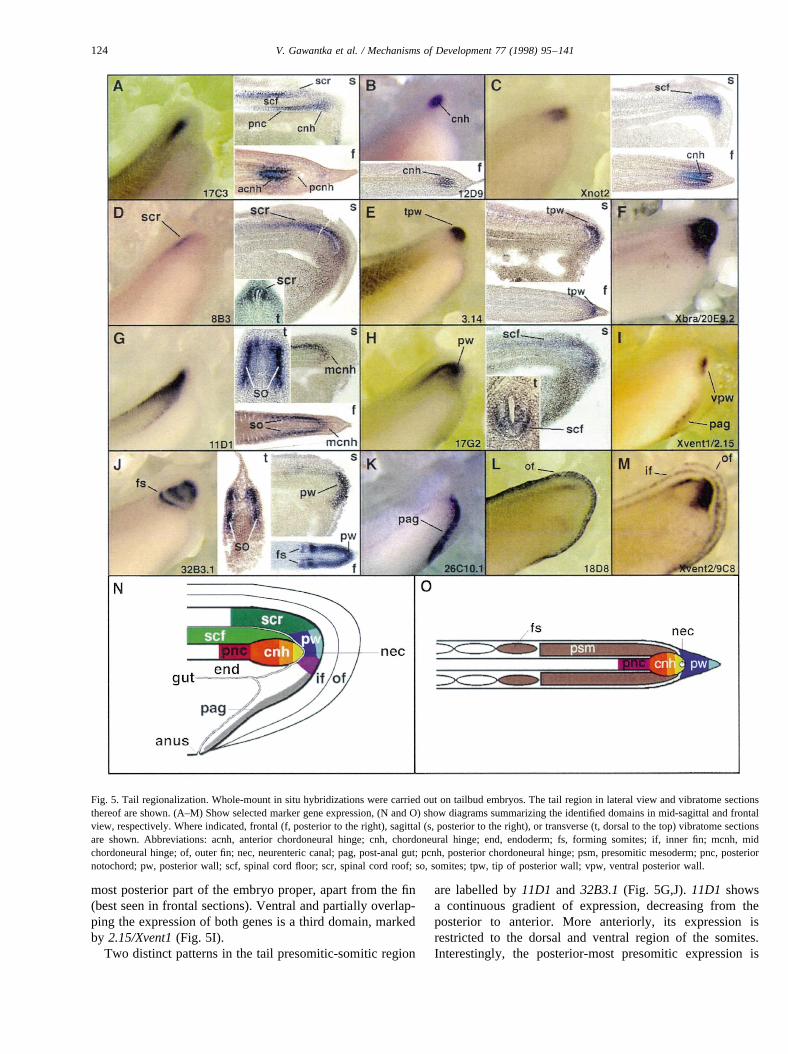
most posterior part of the embryo proper, apart from the fin(best seen in frontal sections). Ventral and partially overlap-ping the expression of both genes is a third domain, markedby 2.15/Xvent1(Fig. 5I).
Two distinct patterns in the tail presomitic-somitic region
are labelled by11D1 and 32B3.1(Fig. 5G,J).11D1 showsa continuous gradient of expression, decreasing from theposterior to anterior. More anteriorly, its expression isrestricted to the dorsal and ventral region of the somites.Interestingly, the posterior-most presomitic expression is
Fig. 5. Tail regionalization. Whole-mount in situ hybridizations were carried out on tailbud embryos. The tail region in lateral view and vibratome sectionsthereof are shown. (A–M) Show selected marker gene expression, (N and O) show diagrams summarizing the identified domains in mid-sagittal and frontalview, respectively. Where indicated, frontal (f, posterior to the right), sagittal (s, posterior to the right), or transverse (t, dorsal to the top) vibratome sectionsare shown. Abbreviations: acnh, anterior chordoneural hinge; cnh, chordoneural hinge; end, endoderm; fs, forming somites; if, inner fin; mcnh, midchordoneural hinge; of, outer fin; nec, neurenteric canal; pag, post-anal gut; pcnh, posterior chordoneural hinge; psm, presomitic mesoderm; pnc, posteriornotochord; pw, posterior wall; scf, spinal cord floor; scr, spinal cord roof; so, somites; tpw, tip of posterior wall; vpw, ventral posterior wall.
124 V. Gawantka et al. / Mechanisms of Development 77 (1998) 95–141
continuous with expression of the gene in the roof of thespinal cord. In contrast,32B3.1 shows a discontinuousexpression, resulting in a striped pattern in the formingsomites.
Additional domains in the tail are the postanal gut expres-sing26C10.1(Fig. 5K), and an outer and inner layer of the
fin, differentially expressing18D8 and 9C8/Xvent2(Fig.5L,M).
Diagrams of sagittal and frontal tailbud sections summar-ize these expression domains (Fig. 5N,O). These resultsindicate an unexpected degree of organization and mosai-cism within the tailbud.
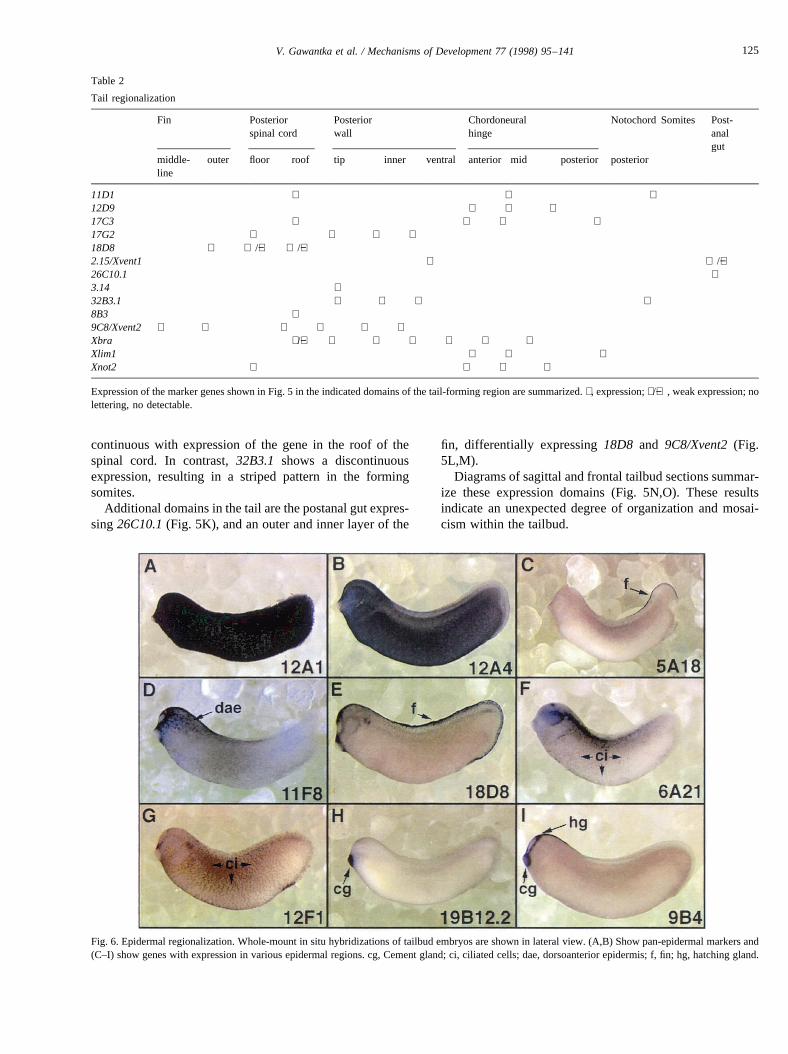
Fig. 6. Epidermal regionalization. Whole-mount in situ hybridizations of tailbud embryos are shown in lateral view. (A,B) Show pan-epidermal markers and(C–I) show genes with expression in various epidermal regions. cg, Cement gland; ci, ciliated cells; dae, dorsoanterior epidermis; f, fin; hg, hatching gland.
Table 2
Tail regionalization
Fin Posteriorspinal cord
Posteriorwall
Chordoneuralhinge
Notochord Somites Post-analgut
middle-line
outer floor roof tip inner ventral anterior mid posterior posterior
11D1 + + +12D9 + + +17C3 + + + +17G2 + + + +18D8 + +/+− +/+−2.15/Xvent1 + +/+−26C10.1 +3.14 +32B3.1 + + + +8B3 +9C8/Xvent2 + + + + + +Xbra +/+− + + + + + +Xlim1 + + +Xnot2 + + + +
Expression of the marker genes shown in Fig. 5 in the indicated domains of the tail-forming region are summarized.+, expression;+/+−, weak expression; nolettering, no detectable.
125V. Gawantka et al. / Mechanisms of Development 77 (1998) 95–141
2.5. Regionalization of the epidermis
In man it is well known that the skin is regionalized andresponds in a domain-like fashion to certain physiopatholo-gical conditions. Domains such as Blaschko’s lines or der-matome-related patterns are thought to arise during
embryogenesis as result of distinct epidermal precursors, pat-terns of gastrulation movements as well as region-specificinfluence of underlying dermis (Haake and Goldsmith,1997). However, molecular correlates for these domains areunknown. In zebrafish, three skin mutants show general skindegeneration while thepennermutant shows predominant
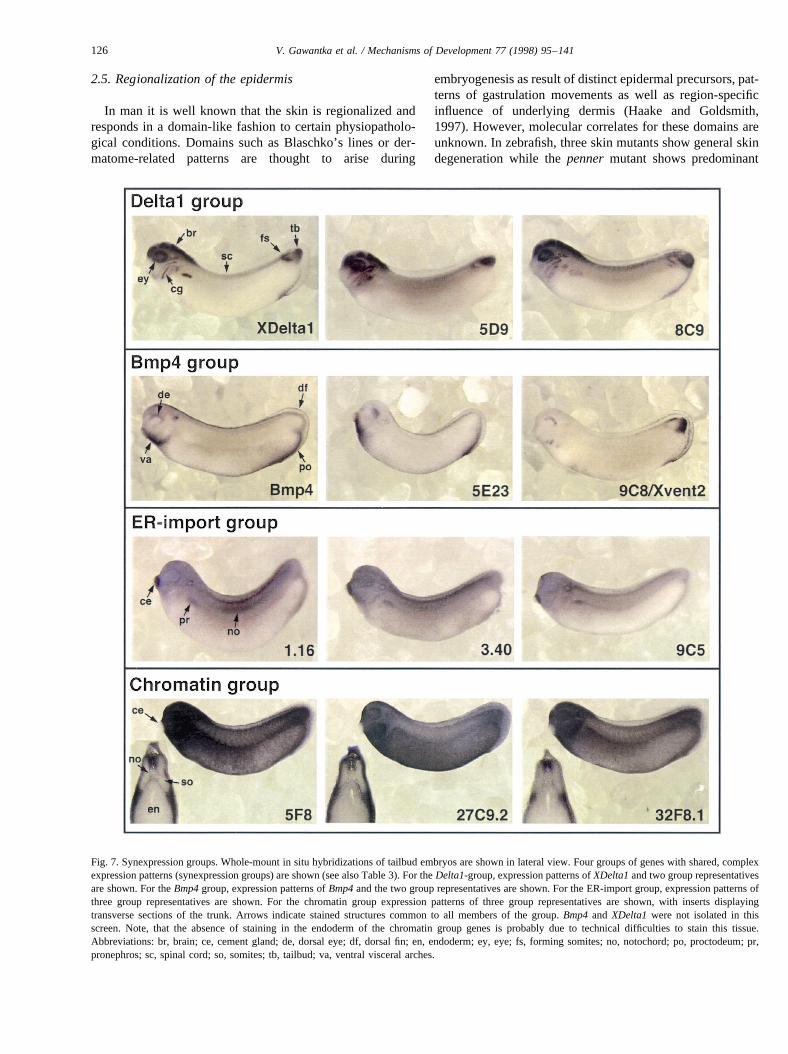
Fig. 7. Synexpression groups. Whole-mount in situ hybridizations of tailbud embryos are shown in lateral view. Four groups of genes with shared, complexexpression patterns (synexpression groups) are shown (see also Table 3). For theDelta1-group, expression patterns ofXDelta1and two group representativesare shown. For theBmp4group, expression patterns ofBmp4and the two group representatives are shown. For the ER-import group, expression patterns ofthree group representatives are shown. For the chromatin group expression patterns of three group representatives are shown, with inserts displayingtransverse sections of the trunk. Arrows indicate stained structures common to all members of the group.Bmp4and XDelta1 were not isolated in thisscreen. Note, that the absence of staining in the endoderm of the chromatin group genes is probably due to technical difficulties to stain this tissue.Abbreviations: br, brain; ce, cement gland; de, dorsal eye; df, dorsal fin; en, endoderm; ey, eye; fs, forming somites; no, notochord; po, proctodeum;pr,pronephros; sc, spinal cord; so, somites; tb, tailbud; va, ventral visceral arches.
126 V. Gawantka et al. / Mechanisms of Development 77 (1998) 95–141
effects in the skin region below the visceral arches (vanEeden et al., 1996a). In addition, the vertebrate skin ispatterned by the differential distribution of glands,hair follicles and scales. In earlyXenopus embryosmonoclonal antibodies were previously used to defineouter epidermal cells containing small and large gran-ules, inner epidermis as well as ciliated cells (Itoh et al.,1988).
The entireXenopusskin is labelled by expression of12A1and 12A4with different intensity (Fig. 6A,B). Most inter-
esting were genes expressed in epidermal subdomains. Fin-specific expression was found, e.g. in 5A18and18D8 (Fig.6C,E).11F8is predominantly expressed in the dorsoanteriorepidermis. Scattered cells expressing6A21and12F1 mostlikely represent ciliated cells (Fig. 6F,G), known to be rela-tively evenly distributed and strongly expressing alphatubulin (21D9.1, Fig. 3). Finally, two epidermal glands,the hatching and cement gland can be distinguished andnumerous markers for them were found, e.g.19B12.2and9B4 (Fig. 6H,I).
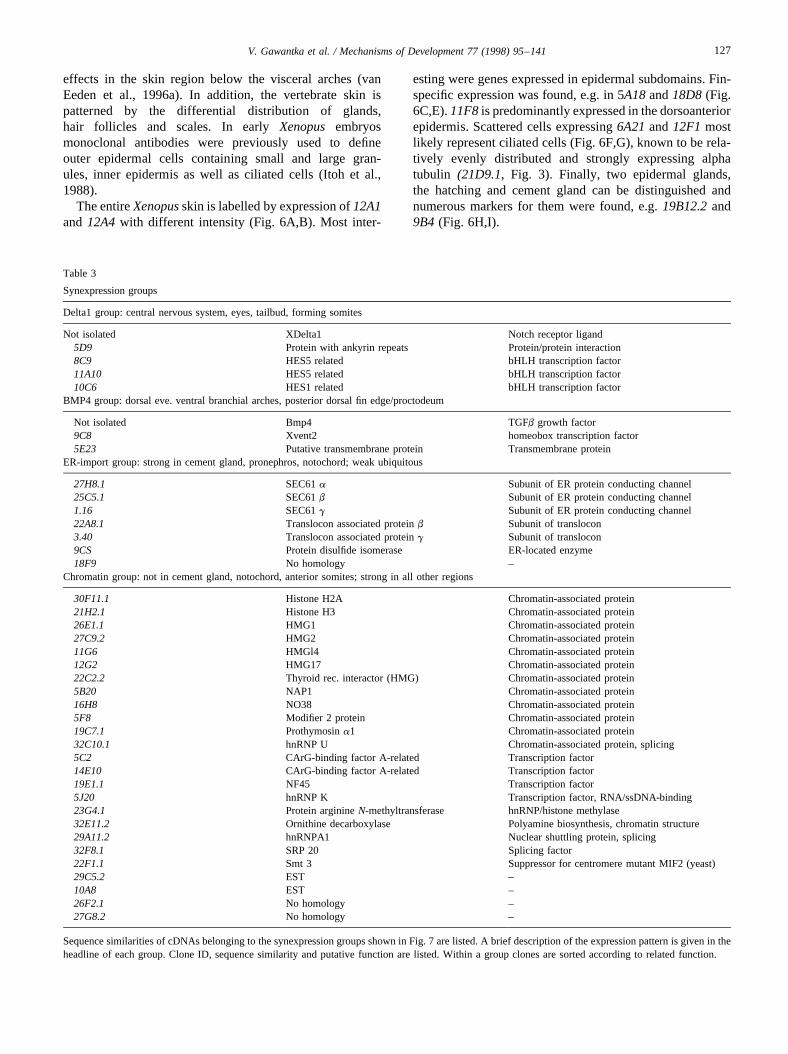
Table 3
Synexpression groups
Delta1 group: central nervous system, eyes, tailbud, forming somites
Not isolated XDelta1 Notch receptor ligand5D9 Protein with ankyrin repeats Protein/protein interaction8C9 HES5 related bHLH transcription factor11A10 HES5 related bHLH transcription factor10C6 HES1 related bHLH transcription factor
BMP4 group: dorsal eve. ventral branchial arches, posterior dorsal fin edge/proctodeum
Not isolated Bmp4 TGFb growth factor9C8 Xvent2 homeobox transcription factor5E23 Putative transmembrane protein Transmembrane protein
ER-import group: strong in cement gland, pronephros, notochord; weak ubiquitous
27H8.1 SEC61a Subunit of ER protein conducting channel25C5.1 SEC61b Subunit of ER protein conducting channel1.16 SEC61g Subunit of ER protein conducting channel22A8.1 Translocon associated proteinb Subunit of translocon3.40 Translocon associated proteing Subunit of translocon9CS Protein disulfide isomerase ER-located enzyme18F9 No homology –
Chromatin group: not in cement gland, notochord, anterior somites; strong in all other regions
30F11.1 Histone H2A Chromatin-associated protein21H2.1 Histone H3 Chromatin-associated protein26E1.1 HMG1 Chromatin-associated protein27C9.2 HMG2 Chromatin-associated protein11G6 HMGl4 Chromatin-associated protein12G2 HMG17 Chromatin-associated protein22C2.2 Thyroid rec. interactor (HMG) Chromatin-associated protein5B20 NAP1 Chromatin-associated protein16H8 NO38 Chromatin-associated protein5F8 Modifier 2 protein Chromatin-associated protein19C7.1 Prothymosina1 Chromatin-associated protein32C10.1 hnRNP U Chromatin-associated protein, splicing5C2 CArG-binding factor A-related Transcription factor14E10 CArG-binding factor A-related Transcription factor19E1.1 NF45 Transcription factor5J20 hnRNP K Transcription factor, RNA/ssDNA-binding23G4.1 Protein arginineN-methyltransferase hnRNP/histone methylase32E11.2 Ornithine decarboxylase Polyamine biosynthesis, chromatin structure29A11.2 hnRNPA1 Nuclear shuttling protein, splicing32F8.1 SRP 20 Splicing factor22F1.1 Smt 3 Suppressor for centromere mutant MIF2 (yeast)29C5.2 EST –10A8 EST –26F2.1 No homology –27G8.2 No homology –
Sequence similarities of cDNAs belonging to the synexpression groups shown in Fig. 7 are listed. A brief description of the expression pattern is given in theheadline of each group. Clone ID, sequence similarity and putative function are listed. Within a group clones are sorted according to related function.
127V. Gawantka et al. / Mechanisms of Development 77 (1998) 95–141
2.6. Synexpression groups
The most interesting finding of this screen is that groups ofgenes with shared, complex expression pattern, identifygenes with shared function. We found four such groups thatwe refer to as synexpression groups(Fig. 7, Table 3).
The ‘Delta1 group’ (four genes) is characterized by theexpression in CNS, eyes, tailbud and varying domains offorming somites (Fig. 7). All genes also show shared expres-sion domains at earlier stages (not shown). This expressionpattern is similar to expression ofXDelta1, a transmembraneligand for theNotchreceptor, involved in neurogenesis (Chit-nis et al., 1995). Three members of the group encode novelbHLH genes, a class of transcription factors involved inDelta–Notchsignalling, one member encodes a novel proteinwith ankyrin repeats, a regulatory motif also present in theNotchreceptor (Artavanis-Tsakonas et al., 1995). The sharedexpression pattern withXDelta1 and the type of genesencoded, strongly suggests that these genes are part of theDelta–Notch signalling pathway and lends support to thenotion thatDelta–Notchsignalling is also involved in somi-togenesis (Yamaguchi, 1997). Indeed,8C9 and5D9 can beactivated by constitutively activeNotch1(E. Bellefroid, V.Gawantka and C. Niehrs, unpublished data).
The ‘Bmp4 group’ (two genes) is characterized by theexpression in ventral visceral arches, dorsal eyes and thedorsoposterior region of the fin/proctodeum. Shared expres-sion domains are also observed at earlier stages (not shown).This expression pattern is similar to the expression ofBmp4,a TGF-b signal involved in dorso-ventral patterning inXeno-pus(Hogan, 1996).9C8/Xvent2functions in theBmp4path-way (Ladher et al., 1996; Onichtchouk et al., 1996;Papalopulu and Kintner, 1996; Schmidt et al., 1996) andBmp4 is both necessary and sufficient for5E23 expression(R. Dosch and C. Niehrs, data not shown). Two other geneswhich function in theBmp4pathway,Bmp7(Hawley et al.,1995) andXbmprII (Frisch and Wright, 1998), are alsoexpressed in this particular pattern. Thus, this group repre-sents components of theBmp4pathway.
The ‘ER-import group’ (seven genes) is characterized bythe weak ubiquitous expression, moderate expression in thenotochord and pronephros and strong expression in thecement gland. Six of the seven genes belonging to thisgroup encode proteins involved in protein import into theendoplasmic reticulum (ER) (Rothblatt et al., 1994). Thecement gland is strongly engaged in secreting mucous,while notochord copiously secretes extracellular matrix(Lyerla and Pelizzari, 1973). Expression in the pronephrosmay relate to its synthesizing membrane proteins for abun-dant microvilli (Tahara et al., 1993). The prevalence of ER inthe cement gland was confirmed by immunostaining for theER-marker calnexin (Rothblatt et al., 1994), which stronglylabels this tissue (data not shown). This group, thus, repre-sents genes involved in ER-function and suggests that tissue-specific regulation of secretion, a yet unstudied issue, occursby common transcriptional control of ER-import compo-
nents. The results further predict that the unknown gene,18F9,also functions in the ER.
Genes of the ‘Chromatin group’ (25 genes) are stronglyand ubiquitously expressed in the neurula. In the tailbudembryo expression becomes low or undetectable in the ante-rior and trunk somites, notochord and cement gland, and inmany cases also the floorplate (visible at high magnification;data not shown), which gives rise to motoneurons. Commonto these tissues is that they become postmitotic in the lateneurula. Of the 21 genes with sequence similarity, 18 encodeproteins interacting, directly or indirectly, with chromatin.Most of these are structural components of chromatin (his-tones and HMG-box proteins) or transcription factors. Theabsence of the expression of this group of genes probablyreflects their lower requirement in the non-dividing cell thathas no need to rebuild the nucleus. Indeed, many of thesegenes are known to be downregulated during cell differentia-tion (Minoo et al., 1989; Begum et al., 1990; Stein et al.,1994). The data strongly suggest that the four unknowngenes also interact with chromatin.
These synexpression groups were identified without priorknowledge of DNA sequence. Yet, they also cluster whenanalyzed with respect to function predicted by sequence simi-larity. We conclude that the clustering of complex expressionpatterns reflects genes with linked function in signalling ordifferentiation.
2.7. Tissue relatedness
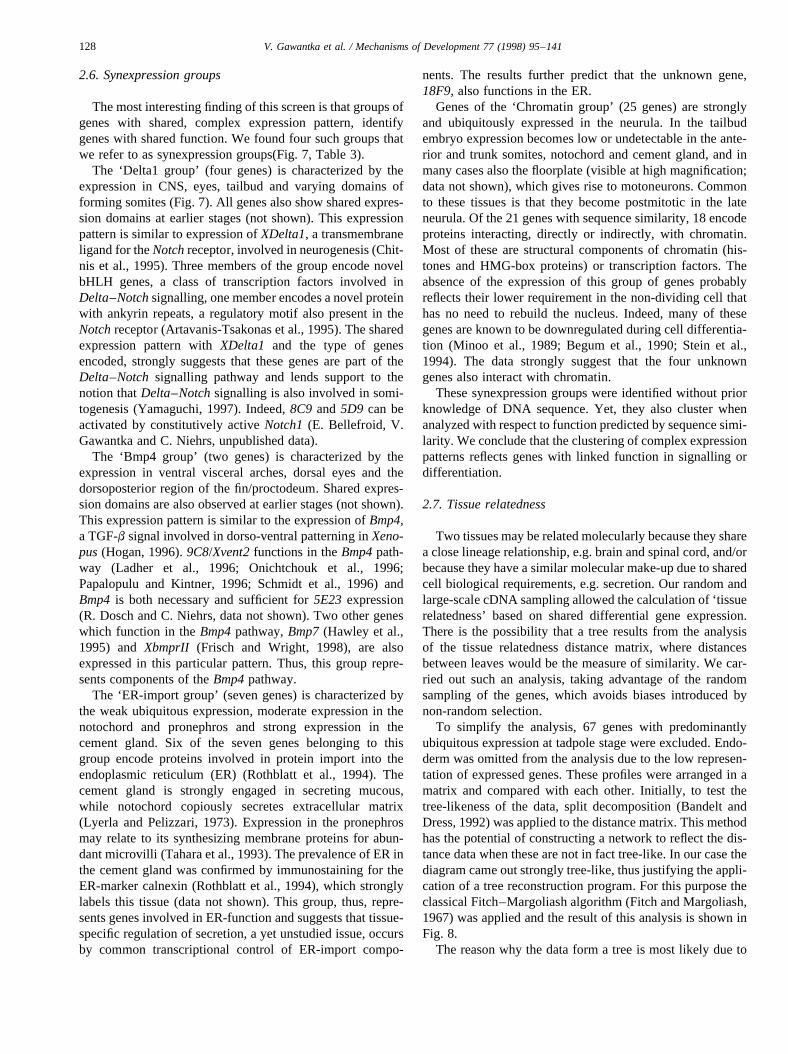
Two tissues may be related molecularly because they sharea close lineage relationship, e.g. brain and spinal cord, and/orbecause they have a similar molecular make-up due to sharedcell biological requirements, e.g. secretion. Our random andlarge-scale cDNA sampling allowed the calculation of ‘tissuerelatedness’ based on shared differential gene expression.There is the possibility that a tree results from the analysisof the tissue relatedness distance matrix, where distancesbetween leaves would be the measure of similarity. We car-ried out such an analysis, taking advantage of the randomsampling of the genes, which avoids biases introduced bynon-random selection.
To simplify the analysis, 67 genes with predominantlyubiquitous expression at tadpole stage were excluded. Endo-derm was omitted from the analysis due to the low represen-tation of expressed genes. These profiles were arranged in amatrix and compared with each other. Initially, to test thetree-likeness of the data, split decomposition (Bandelt andDress, 1992) was applied to the distance matrix. This methodhas the potential of constructing a network to reflect the dis-tance data when these are not in fact tree-like. In our case thediagram came out strongly tree-like, thus justifying the appli-cation of a tree reconstruction program. For this purpose theclassical Fitch–Margoliash algorithm (Fitch and Margoliash,1967) was applied and the result of this analysis is shown inFig. 8.
The reason why the data form a tree is most likely due to
128 V. Gawantka et al. / Mechanisms of Development 77 (1998) 95–141
the importance of lineage relationships during differentia-tion. This is highlighted by the fact that the tree resembles aclassical germ layer division although with major imperfec-tions. In particular, two ectodermal derivatives, cementgland and epidermis are closer to mesodermal tissues thanto the neuroectodermal cluster. Also, mesodermal deriva-tives do not form a single cluster but show a split betweenventro-lateral (blood, lateral plate, pronephros) and dorsalmesodermal tissues (somites, notochord). We inspected thegenes with attributable function which are responsible forthe ectoderm/neuroectoderm split. Keratins represent half ofthe genes expressed in epidermis but not in neuroectoderm.Likewise, genes implicated in secretion make up half of thegenes expressed in cement gland but not in neuroectoderm(data not shown). Thus, the split in ectodermal derivatives isdue to expression of differentiation markers. We concludethat gene expression profiles can be used to calculate atissue relatedness tree that reflects the superimposition oflineage and differentiation relationships.
3. Discussion
3.1. Complexity of expression patterns
About one third of the genes identified in this random
screen show a regionalized expression. This may indicatethat the vertebrate genome encodes a large amount of spa-tio-temporal information. It needs to be kept in mind,though, that this conclusion is based on analysis of genesexpressed in neurulae, the stage at which RNA for thecDNA library analyzed was sampled. Expression complex-ity may be lower at later stages, when cell differentiation isunderway. Not surprisingly, gene expression complexityincreases dramatically between gastrula and neurula, in par-ticular in neuroectoderm, and its detailed analysis willrequire a separate investigation.
The nervous system is the organ were most genes areexpressed (82%). This may to some degree be due to theuse of a neurula stage cDNA library in which many neuralgenes are expected to be represented. However, a very highproportion (62%) of neural expression is also found inenhancer trap lines inDrosophila (Bier et al., 1989), sug-gesting that the large number of expressed genes reflects ahigh degree of complexity in this tissue.
Due to the polycistronic transcription of the mitochon-drial genome it was unexpected to observe differential mito-chondrial gene expression. At tailbud stage eitherubiquitous or predominantly muscle expression wasfound, likely indicating a differential RNA stability. Thismay represent a novel mechanism for respiratory regulation.
Partial sequencing identified sequence homologies for76% of all cDNAs and thus generating ESTs is an efficientcompromise in a large-scale approach to assign potentialfunction without having to sequence full inserts. Despiteour simplistic approach of not prescreening, normalizingor subtracting the cDNA library we were able to identifymany transcripts that are considered rare potential develop-mental regulators. This is again indicative of a high com-plexity of gene expression in the neurula cDNA library andis consistent with the relatively low redundancy of 30%encountered.
3.2. Progressive regionalization
3.2.1. GastrulaIn gastrula ectoderm distinct gene expression in the
epithelial and the sensorial layer is observed and this maycorrelate with the fact that both layers have a different fate(Hartenstein, 1989) and respond differently to neural(Grunz, 1985) and mesodermal inducers (Grunz andTacke, 1989). Remarkably, already at the early gastrulastage the dorsal ectoderm is a-p patterned as marked bythe differential expression of3.14and19F1.1, when migra-tion of inducing mesoderm has hardly begun. This mayindicate either a maternal specification, e.g. by the Wntsignal known to set up dorsal from ventral animal cap(Sokol and Melton, 1991) or be indicative of early postzy-gotic planar induction and patterning by the organizer(Doniach et al., 1992).
It is interesting that of the 18 genes with significant dif-ferential dorsoventral expression in gastrula mesoderm, 12
Fig. 8. Analysis of tissue relatedness. Expression profiles of 206 cDNAsexpressed in more than one tissue were selected. These profiles werearranged in a matrix and compared among each other using Fitch–Margoliash algorithm to compute a tree using the implementation fromthe Phylip package. Length of lines corresponds relative distance betweentissues (‘tissue relatedness’). Mesodermal and ectodermal derivatives arecoloured in red and blue, respectively.
129V. Gawantka et al. / Mechanisms of Development 77 (1998) 95–141
are of the dorsal type, expressed in the organizer and 6expressed in lateroventral mesoderm. In contrast, in the zeb-rafish mutant screen six genes regulating ventral and only twogenes regulating dorsal development were found (Haffter etal., 1996). This may suggest a high degree of functionalredundancy in dorsally expressed genes. However, some ofthe zebrafish mutants affecting notochord and prechordalplate may also represent genes expressed in the organizer.
The significance of the novel ‘salt and pepper’ expressionpatterns is unclear. Mitochondrial genes can give this patternin the animal cap, which may reflect heterogeneity in meta-bolic state of the cells. However, other genes, such as6D6which continue to exhibit a salt and pepper expression patternalso at later stages, are not mitochondrial genes and expres-sion may correlate with other dynamic cell properties such ascertain stages of the cell cycle.
3.2.2. Tail-forming regionThe mechanism of the formation of the vertebrate tail is
likely to be closely related to body axis formation, as it con-tains all axial tissues including neural tube, notochord andsomites. Indeed, tail formation has been shown to be a con-tinuation of gastrulation (Gont et al., 1993; Tucker and Slack,1995). Using molecular markers the tailbud was shown tocontain at least three cell populations (Gont et al., 1993).Tissue extirpation and transplantation indicate that tail for-mation results from the interaction of three regions in theneurula, a neural (N), presomitic (M) and posterior notochor-dal (C) region (NMC-model, Tucker and Slack, 1995).Recently molecular correlates for posterior notochordal andpresomitic fate have been proposed in the tail forming regionof theXenopusneurula (Beck and Slack, 1998). In addition,using known molecular markers these authors have describedseven domains in the developing tailbud.
Here we show that the amphibian tailbud is a highlycomplex structure in which at least 13 domains can be distin-guished by marker genes. The most remarkable regionaliza-tions are displayed by the chordoneural hinge, which isdivided in three a-p domains and the posterior wall, dividedinto three d-v and a-p domains. It has been shown that theposterior wall gives rise to somites (Gont et al., 1993; Tuckerand Slack, 1995). The expression of11D1shows a continuitybetween the middle domain of the CNH and both somites aswell as spinal cord. This suggests that in addition to posteriorwall, cells of the CNH may give rise to somites. Unlike11D1,32B3.1shows a striped expression in the forming somites andpresomitic mesoderm. This expression closely resembles thatof c-hairy1, which is regulated in a clock-and-wave-frontfashion (Palmeirim et al., 1997). Distinct regulation of11D1and 32B3.1 expression is indicative of different molecularpathways operating during somitogenesis.
Our results using novel markers confirm the seven domainsdescribed by Beck and Slack (1998). In addition we definetwo additional domains in the developing tailbud proper,namely the ventral posterior wall (2.15/Xvent1positive)and the mid-chordoneural hinge (11D1positive).
How is this remarkable tailbud pattern set up? Being acontinuation of gastrulation, it is likely that the same genesregulating organizer function will continue to regulate tailformation, and continued expression ofBmp4 (Fainsod etal., 1994) andchordin (Sasai et al., 1994) in the tailbud isconsistent with this. Consequently, some marker genesexpressed in the novel domains defined here may be regu-lated by different doses of the BMP4 morphogen, which isknown to pattern the gastrula marginal zone into at least threedomains (Dosch et al., 1997).
The NMC model of tail formation is based on experimentsperformed at the neurula stage (Tucker and Slack, 1995).While the same tissue interactions may be operating also attailbud stages, the tissue topology has changed so much inbetween stages that it is difficult to match the expressiondomains of the tailbud markers to the NMC domains of theneurula.
As recently shown (Beck and Slack, 1998) the novel mar-kers described here will be very useful to study tail pattern-ing, e.g. in misexpression experiments.
3.3. Synexpression groups
One of the most interesting aspects of the in situ screen isthat the grouping of genes according to their shared, complexexpression pattern is paralleled by a remarkable functionalcorrelation displayed by them. While groups of enhancer traplines with common expression have been identified (Bier etal., 1989) the lack of sequence data had not revealed the closefunctional relationship between the genes seen here. Genes ofa synexpression group probably share common regulatoryelements. In the case of the Delta1 and Bmp4 groups theseregulatory elements are likely the respective cytokine-responsive elements. Also in the case of the ER-import andchromatin groups a common global regulator can be pre-dicted.
The Delta1 and Bmp4 synexpression groups are consistentwith the concept of gene cassettes, i.e. signalling pathwayswhich are used at multiple embryonic stages and regionsduring development (Jan and Jan, 1993; Ruohola Baker etal., 1994). In contrast, the ER-import and chromatin groupseem to reflect the physiological status of a cell, i.e. secretionand terminal differentiation. Fifteen percent of the differen-tially expressed genes analyzed in this study could beassembled in synexpression groups. However, the percentageof groupable genes is likely to increase if more groupsbecome established.
The Delta1 and chromatin groups bear interesting parallelsto groups of mutants identified in the zebrafish screens. First,a number of somite mutants were identified that showedadditional phenotypes in CNS development (van Eeden etal., 1996b). The Delta1 group genes are expressed both informing somites and the CNS and evidence is mounting thattheDelta-Notchpathway is regulating the morphogenesis ofboth tissues (Yamaguchi, 1997). Genes of the Delta 1 groupare therefore good candidates for these somite mutants. Sec-
130 V. Gawantka et al. / Mechanisms of Development 77 (1998) 95–141
ond, the large class of zebrafish early arrest mutants arecharacterized by early lysis of cells. However, upon trans-plantation mutant cells are able to survive if they populatetwo major tissues, notochord and muscle as well as in rarecases motoneurons. Common to these cell types is theirearly onset of differentiation. Together with the ratherunspecific phenotype this led to the suggestion that theearly arrest mutants may affect genes with a role in cellcycle progression (Kane et al., 1996). Genes of theXenopuschromatin group become downregulated in the same post-mitotic tissues and many of them function in maintenance ofthe nuclear architecture, which is closely linked to progres-sion through the cell cycle. Hence, the chromatin groupgenes appear good candidates for genes affected in theearly arrest mutants.
The correlation between pattern and function implies thatlarge-scale gene expression screening goes beyond the clon-ing of potential developmental regulators: It allows toassemble genes in groups that define molecular pathwaysand to make strong predictions about the function of con-stituent members. Of particular interest is the possibility topredict gene function for members without sequence simi-larity. This will become an important issue in the postge-nomic era. While assembly into synexpression groupscannot replace experimental verification of gene function,it will allow to focus the analysis.
3.4. Tissue relatedness
Our random and large-scale cDNA sampling allowed forthe calculation of tissue relatedness based on shared differ-ential gene expression. At this point the interpretation oftissue relatedness is still preliminary due to a single stageof analysis and still relatively small number of expressionprofiles analyzed. The observed tree represents an averageover all possible metabolic, structural and differentiationprocesses that may lead to shared differential gene expres-sion either because of lineage relationships or because ofcell biological constraints. Therefore, it cannot be inter-preted solely as an ontogenetic tree, i.e. a representationof lineage relationships. Interpretation of individual clustersrequires the analysis of the kind of individual genes thatcontribute to clustering. For example, differentiation typegenes (keratins, secretion-related genes) override lineage-relationships of the epidermis and cement gland with neu-roectoderm. The closer relationship between the epidermis/cement gland with mesoderm than with neuroectoderm mayindicate a shared differentiation programme. If tissue clus-ters were predominantly made up of Hox genes, this mightindicate common positional information. In general, largesynexpression groups are likely to contribute to clustering.
It will be interesting to compare trees derived fromcDNAs sampled at stages other than the neurula and toanalyze whether the tissue clusters are static or dynamic.Furthermore, tissue relatedness may be calculated by con-sidering only certain functional classes of genes, e.g. Hox or
cytoskeletal genes, to derive tissue clusters specific for posi-tional information or architecture.
3.5. Limits and strengths of in situ screening
Many genes with interesting expression patterns can beidentified in an in situ screen whose DNA sequence homol-ogy suggests a regulatory function in the respective regions.However, this is just a correlation and test of physiologicalrelevance requires further gain- or loss-of-function experi-ments. In this respect, mutant screens are much more strin-gent. Many genes with important regulatory functions thatwould be missed in an in situ screen are those that show noparticular patterned expression. Furthermore, expressionpattern of a gene may not reveal the true spatial expand ofits function. In Kruppel mutants, for example, a largerregion is deleted from the segmentation pattern thanwould be expected from its domain of expression (Scottand O’Farrell, 1986). Finally, the screen is biased by thecDNA library chosen which is a constrain when globalgene expression is to be analyzed. This may, however,also be advantageous if one wants to focus analysis on cer-tain tissues.
A great advantage of the in situ screen is the immediateavailability of the cloned cDNA, which readily allows again-of-function test by microinjection of syntheticmRNA in Xenopus. By this approach two novel homeoboxgenes discovered in this screen could be implicated in d-vmesoderm patterning (Gawantka et al., 1995; Onichtchouket al., 1996).
Thus far, the most successful approach in identifyinggenes underlying the mutants identified in the zebrafishscreens is by educated guessing, based on expression patternof already known genes (Talbot et al., 1995). The genes andespecially the synexpression groups identified here maytherefore be of help in matching mutants to genes.
Unlike to gene expression screens, functionally redundantgenes will be largely inaccessible to mutant screens. A semi-functional approach to overcome this limitation may thus beidentification of more synexpression groups to functionallyclassify unknown genes. Using filter-arrayed cDNAlibraries, robotic processing of DNA and RNA probes andautomated whole-mount in situ hybridization, gene expres-sion screening can be largely automated (our unpublishedresults). Hence, there is the perspective of carrying out asaturating analysis of embryonic gene expression.
4. Experimental procedures
4.1. Whole-mount in situ hybridization
Bacterial colonies of an oriented stage 13 cDNA libraryin pBSKS+ vector (Gawantka et al., 1995) were grown in96-well plates and DNA inserts were PCR-amplifieddirectly from bacteria using T3 and T7 primers. Digoxi-
131V. Gawantka et al. / Mechanisms of Development 77 (1998) 95–141

genin-labelled antisense RNA probes were synthesized fromPCR-amplified templates using T7 RNA polymerase. Plas-mids may be linearized withNotI and SalI for synthesis ofsense and antisense RNA, respectively. Whole-mount in situhybridization (Harland, 1991) was performed in 24-wellhybridization chambers using basket wells to allow parallelsample processing. For each cDNA tested, four albinoembryos each of stages 10.5, 13 and 30 were used. Theembryos cut into halves before hybridization were used toallow for adequate staining and analysis of internal anatomi-cal structures (stage 10, cut sagitally; stage 13, cut mid-trans-versally; stage 30, cut twice transversally, at the level of theotic vesicle and in the medial trunk). For the analysis of thetail-forming region 40mm vibratome sections were cut fromwhole-mount stained embryos as described (Bellefroid et al.,1996).
Images of stained embryos were acquired with a 3-CCDcamera (Sony DXC-930P), digitalized using a DT2255 imageboard and processed using Adobe-Photoshop. Tailbud stagestaining patterns were analyzed semiquantitatively by scor-ing colour intensity using an intensity scale from 0 (no stain-ing) to 4 (very strong staining). Seventeen different regionswere routinely scored in tailbud embryos: brain, spinal cord,eyes, ear vesicles, nasal vesicles, epidermis, cement gland,hatching gland, notochord, somites, pronephros, lateral plate,blood, endoderm, visceral arches, proctodeum, tailbud. Addi-tional details were noted separately. These data were com-piled in a database (AXelDB). Expression data and imagesare accessible via Internet (http://www.dkfz-heidelberg.de/abt0135/axeldb.htm).
4.2. DNA sequence analysis
5′ and 3′ cDNA ends were sequenced by either manualor automated Sanger sequencing (ABI 377, Perkin Elmerand LI-COR 4000L DNA sequencer). The average lengthread was 385 bp. Sequences were assembled and analyzedfor redundant clones using the DeCypher II PC boardand accompanying software (Time Logic). Unique se-quences were masked for repetitive elements and com-pared against databases (SWISSPROT, GenBank, dbEST;release date: 21.10.97), using BLASTN and BLASTX pro-grams.
4.3. Quality control
To rule out the possible mix-up of expression patterns andDNA sequences, it was verified that the length of PCR-ampli-fied inserts from plasmid used for sequencing, and from bac-teria used for synthesis of the DIG-riboprobe were identical.Every clone was thus assayed on an agarose gel and noinconsistencies were found. In addition, in a rescreen of125 clones in whole-mount in situ hybridizations madewith DIG-labelled riboprobes prepared from plasmids usedfor sequencing, all clones reproduced the pattern that wasfound in the primary screen.
4.4. Calculation of tissue relatedness
Programs to compute phylogenetic trees require distancedata as input. For the tissues the distance data were computedbased on weighted counts of genes with equal expressionstrength. Each gene contributed with the probability of obser-ving this match of expression strength given the scope ofexpression levels of the particular gene in the studied tissues.Two methods were applied to these distance data. Split ana-lysis (Bandelt and Dress, 1992) generally produces a networkdisplaying the distances of the objects, with the networkbeing strongly ‘tree-like’ when the data allow for this.Since the network computed for the distances of the tissueswas indeed tree-like we proceeded to apply the Fitch–Mar-goliash algorithm (Fitch and Margoliash, 1967) to compute atree using the implementation from the Phylip package (Fel-senstein, 1989).
Acknowledgements
We thank E. Bellefroid and B. Dobberstein for reagentsand H. Schmidt for invaluable help with the Web interface toAxeldb. We are grateful to S. Cohen, W. Franke and G.Schutz for critically reading the manuscript. This study wassupported by grant from the DFG to C.N. and a Pierre etMarie Curie Fellowship to N.P.
Appendix A
AXelDB: A Xenopus laevis database
To facilitate access to clone information, gene expressionpatterns, pictures, partial cDNA sequences and results ofsimilarity searches we build a database. We chose theobject oriented ACeDB software (ACaenorhabditis elegansdatabase) because of its flexibility, its usefulness to modelbiological data as well as for its user interface which isboth user-friendly and graphical. While the originalACeDB database was developed to meet the needs of theworm genome project, it is now in use for many other gen-ome projects and to compile all kinds of biological informa-tion. The graphical user interface enables the user to browsethe database by pointing and clicking a mouse. The queryinterface enables complex questions to be asked in simpleterms.
In ACeDB, data belong to a class of objects which corre-sponds to biological entities such as a cDNA clone, a DNAsequence or an expression pattern. We incorporated modifi-cations in the original description of these classes in ACeDBto meet our special needs. The class calledexpression-pat-tern, in which the gene expression patterns are described,was modified to include the semi-quantitative analysis. Wedevised a new class to store the information relevant to theconcept of synexpression groups. A class entitledexpres-
132 V. Gawantka et al. / Mechanisms of Development 77 (1998) 95–141

sion-domainwas described to represent the expression pat-terns of marker genes.
Access to AXelDB can be made in two ways. First, aweb interface is available at the URL: http://www.dkfz-heidelberg.de/abt0135/axeldb.htm. Second, data (including
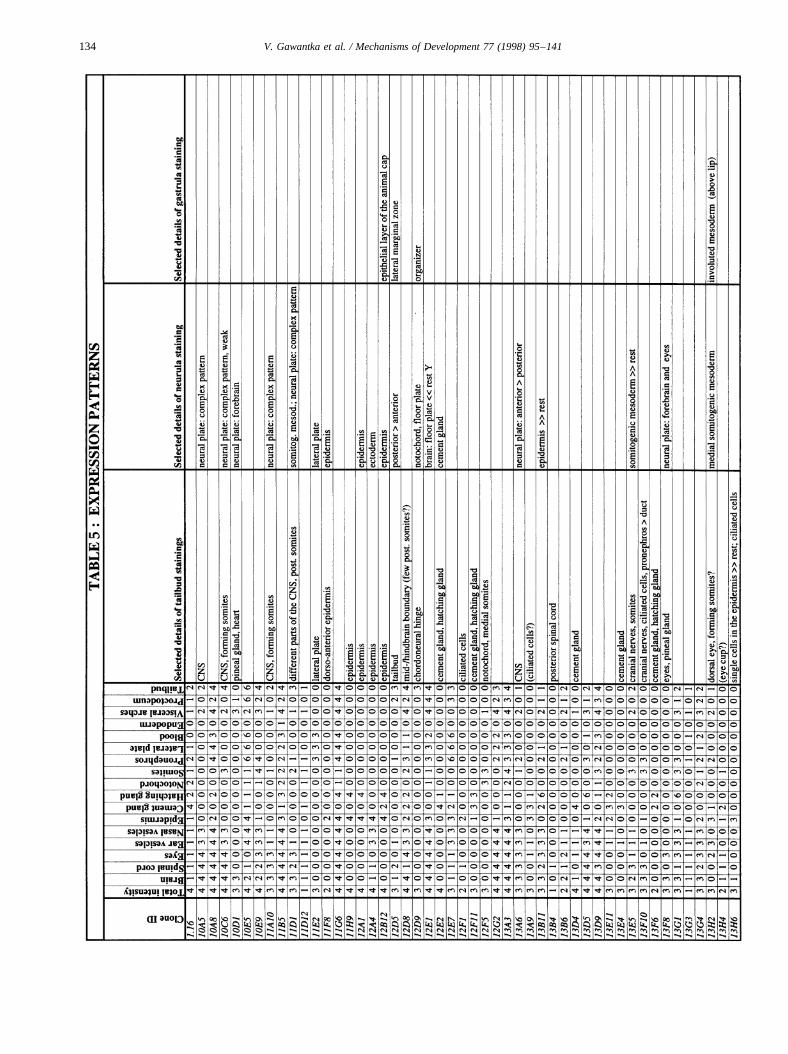
pictures) and models for the UNIX version of ACeDB areavailable at the ftp server ftp.dkfz-heidelberg.de in out-going/abt0135/axeldb. Table 4 shows the accession num-bers of DNA sequences. Table 5 gives a decription of geneexpression patterns.
133V. Gawantka et al. / Mechanisms of Development 77 (1998) 95–141
134 V. Gawantka et al. / Mechanisms of Development 77 (1998) 95–141
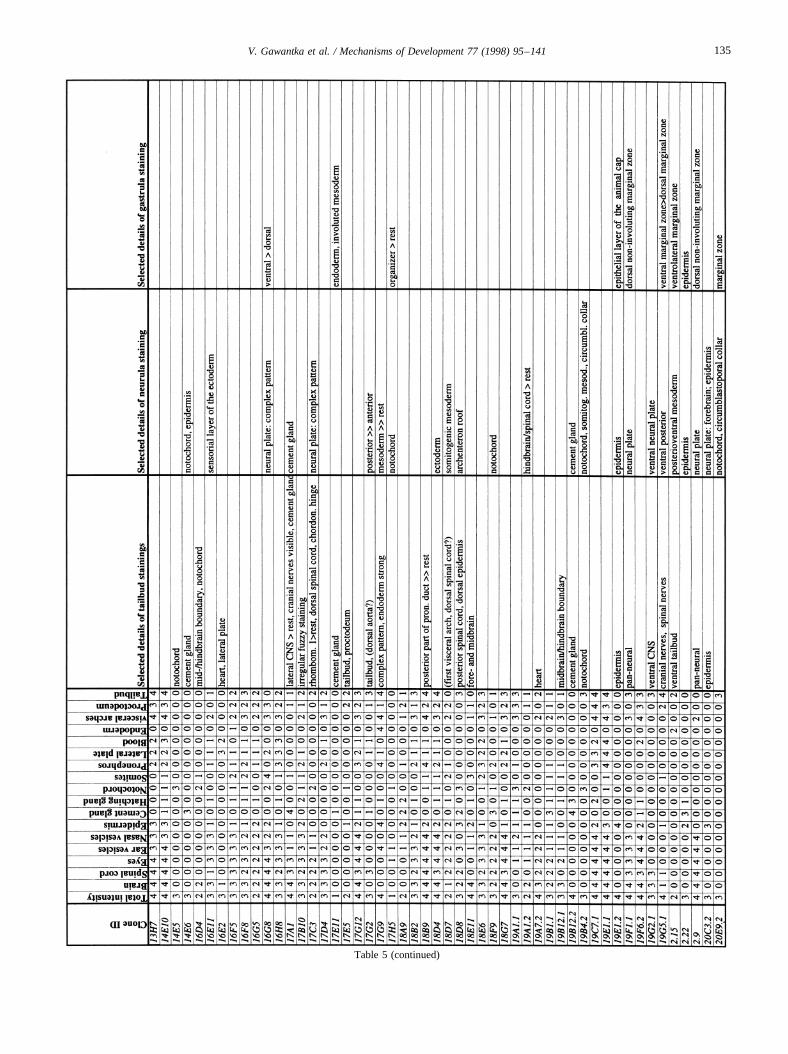
Table 5 (continued)
135V. Gawantka et al. / Mechanisms of Development 77 (1998) 95–141
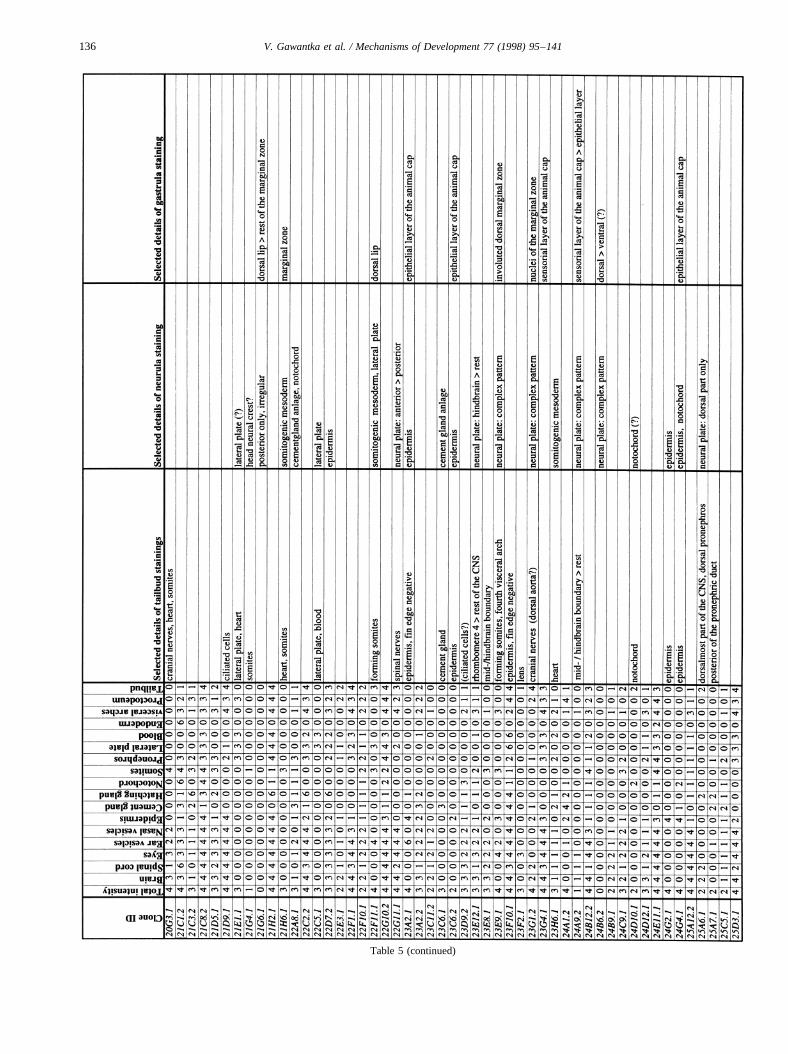
Table 5 (continued)
136 V. Gawantka et al. / Mechanisms of Development 77 (1998) 95–141
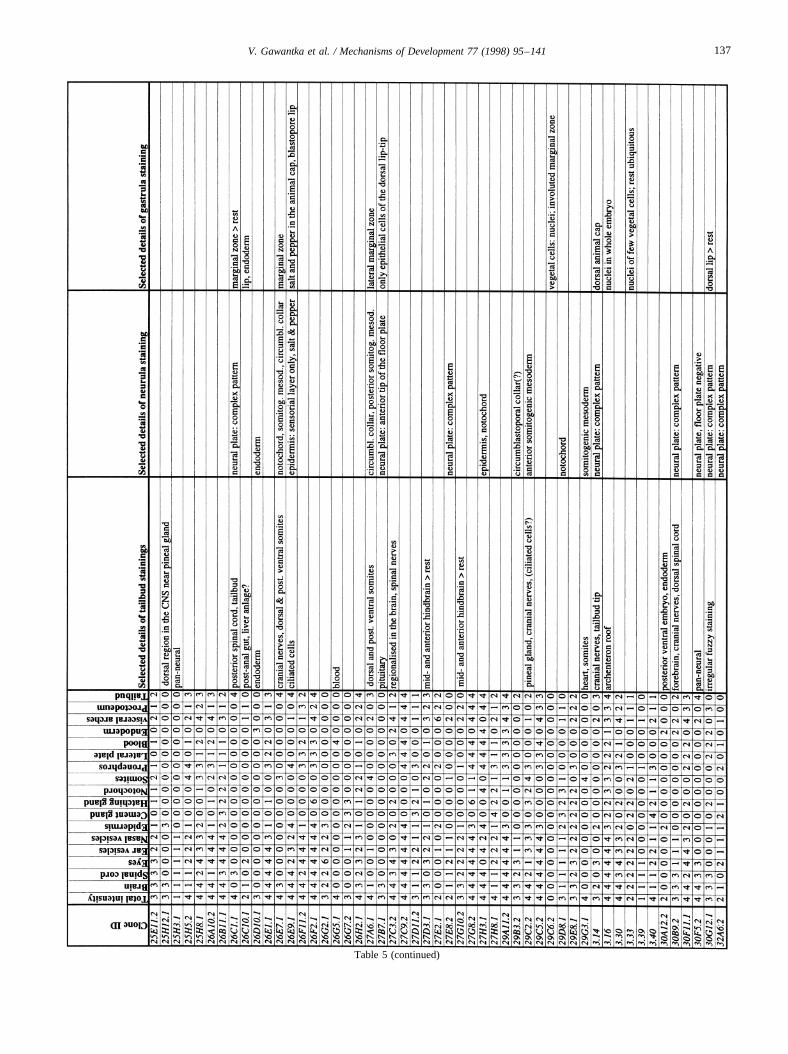
Table 5 (continued)
137V. Gawantka et al. / Mechanisms of Development 77 (1998) 95–141
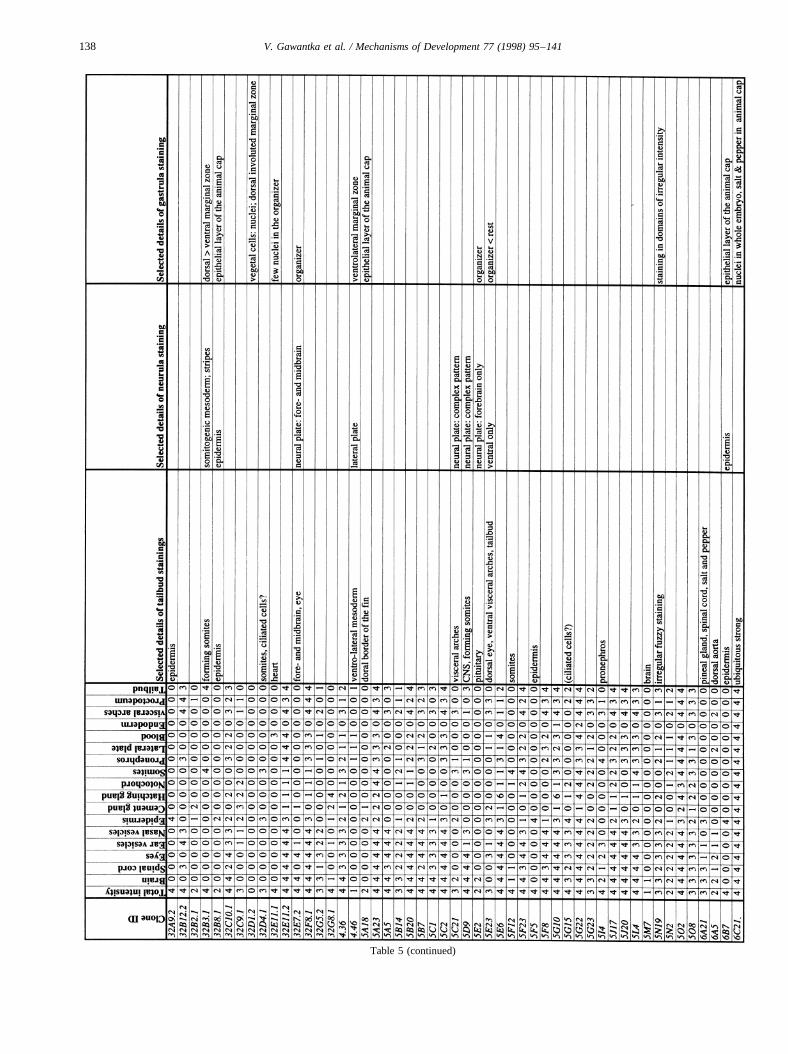
Table 5 (continued)
138 V. Gawantka et al. / Mechanisms of Development 77 (1998) 95–141
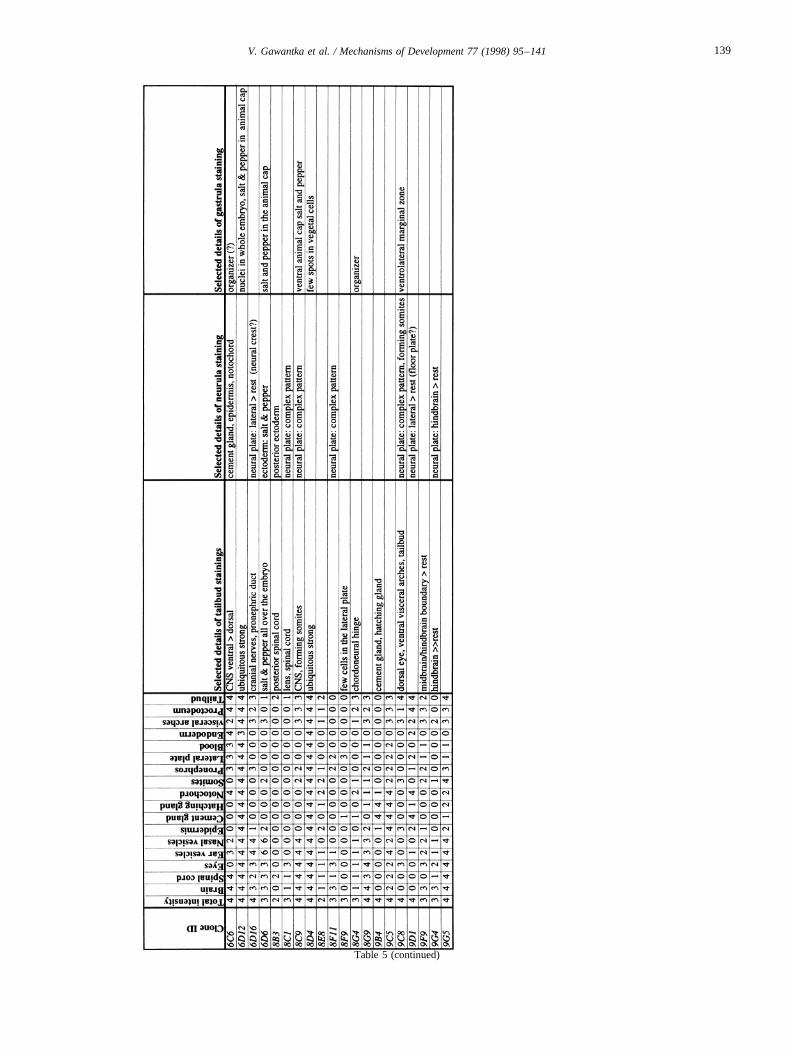
Table 5 (continued)
139V. Gawantka et al. / Mechanisms of Development 77 (1998) 95–141
The list contains for each clone a semiquantitative descrip-tion pattern in the tailbud. Scored regions are listed on top;numbers indicate intensities of staining on a scale from 0 (nostaining) to 4 (strong staining); 6: not scored. In addition,selected, striking details of expression patterns in the gas-trula, neurula and tailbud stage are listed. The order of thegenes follows first digit sorting, e.g. 1, 10, 2, 20 etc.
References
Artavanis-Tsakonas, S., Matsuno, K., Fortini, M.E., 1995. Notch signaling.Science 268, 225–232.
Bandelt, H.J., Dress, A.W.M., 1992. Split decomposition: a new and usefulapproach to phylogenetic analysis of distance data. Mol. Phylogenet.Evol. 1, 242–252.
Beck, C.W., Slack, J.M.W., 1998. Analysis of the developingXenopustailbud reveals separate phases of gene expression during determination andoutgrowth. Mech. Dev. 72, 41–52.
Begum, N., Pash, J.M., Bhorjee, J.S., 1990. Expression and synthesis of highmobility group chromosomal proteins in different rat skeletal cell linesduring myogenesis. J. Biol. Chem. 265, 11936–11941.
Bellefroid, E.J., Bourguignon, C., Hollemann, T., Ma, Q., Anderson, D.J.,Kintner, C., Pieler, T., 1996. X-MyT1, aXenopusC2HC-type zinc fingerprotein with a regulatory function in neuronal differentiation. Cell 87,1191–1202.
Bettenhausen, B., Gossler, A., 1995. Efficient isolation of novel mousegenes differentially expressed in early postimplantation embryos.Genomics 28, 436–441.
Bier, E., Vaessin, H., Shepherd, S., Lee, K., McCall, K., Barbel, S.,Ackerman, L., Carretto, R., Uemura, T., Grell, E. et al. , 1989. Searchingfor pattern and mutation in the Drosophila genome with a P-lacZ vector.Genes Dev 3, 1273–1287.
Blitz, I.L., Cho, K.W.Y., 1995. Anterior neuroectoderm is progressivelyinduced during gastrulation: the role of theXenopushomeobox geneorthodenticle. Development 121, 993–1004.
Blumberg, B., Wright, C.V., De Robertis, E.M., Cho, K.W., 1991. Organi-zer-specific homeobox genes inXenopus laevisembryos. Science 253,194–196.
Bouwmeester, T., Kim, S.-H., Sasai, Y., Lu, B., De Robertis, E.M., 1996.Cerberus is a head-inducing secreted factor expressed in the anteriorendoderm of Spemann’s organizer. Nature 382, 595–601.
Chitnis, A., Henrique, D., Lewis, J., Ish, H.D., Kintner, C., 1995. Primaryneurogenesis inXenopusembryos regulated by a homologue of theDro-sophilaneurogenic gene Delta. Nature 375, 761–766.
Dirksen, M.L., Jamrich, M., 1992. A novel, activin-inducible, blastopore lip-specific gene ofXenopus laeviscontains a fork head DNA-bindingdomain. Genes Dev. 6, 599–608.
Doniach, T., Phillips, C.R., Gerhart, J.C., 1992. Planar induction of ante-roposterior pattern in the developing central nervous system ofXenopuslaevis. Science 257, 542–545.
Dosch, R., Gawantka, V., Delius, H., Blumenstock, C., Niehrs, C., 1997.Bmp-4 acts as a morphogen in dorsoventral mesoderm patterning inXenopus. Development 124, 2325–2334.
Driever, W., Solnica-Krezel, L., Schier, A.F., Neuhauss, S.C.F., Malicki, J.,Stemple, D.L., Stainier, D.Y.R., Zwartkruis, F., Abedelilah, S., Rangini,Z., Belak, J., Boggs, C., 1996. A genetic screen for mutations affectingembryogenesis in zebrafish. Development 123, 37–46.
Fainsod, A., Steinbeisser, H., De Robertis, E.M., 1994. On the function ofBMP-4 in patterning the marginal zone of theXenopusembryo. EMBO J.13, 5015–5025.
Felsenstein, J., 1989. PHYLIP, phylogeny inference package. Cladistics 5,164–166.
Fitch, W.M., Margoliash, E., 1967. Construction of phylogenetic trees.Science 155, 279–284.
Forrester, L.M., Nagy, A., Sam, M., Watt, A., Stevenson, L., Bernstein, A.,Joyner, A.L., Wurst, W., 1996. An induction gene trap screen in embryo-nic stem cells: identification of genes that respond to retinoic acid in vitro.Proc. Natl. Acad. Sci. USA 93, 1677–1682.
Friedrich, G., Soriano, P., 1991. Promoter traps in embryonic stem cells: agenetic screen to identify and mutate developmental genes in mice. GenesDev. 5, 1513–1523.
Frisch, A., Wright, C.V.E., 1998. XBMPRII, a novelXenopustype II recep-tor mediating BMP signaling in embryonic tissues. Development 125,431–442.
Gawantka, V., Delius, H., Hirschfeld, K., Blumenstock, C., Niehrs, C., 1995.Antagonizing the Spemann’s organizer: role of the homeobox geneXvent-l. EMBO J. 14, 6268–6279.
Goebl, M.G., Petes, T.D., 1986. Most of the yeast genomic sequences arenot essential for cell growth and division. Cell 46, 983–992.
Gont, L.K., Steinbeisser, H., Blumberg, B., De Robertis, E.M., 1993. Tailformation as a continuation of gastrulation: the multiple cell populationsof the Xenopustailbud derive from the late blastopore lip. Development119, 991–1004.
Grunz, H., 1985. Effect of Concanavalin A and vegetalizing factor on theouter and inner ectoderm layers of early gastrulae ofXenopus laevisaftertreatment with cytochalasin B. Cell. Diff. 16, 83–92.
Grunz, H., Tacke, L., 1989. Neural differentiation ofXenopus laevisecto-derm takes place after disaggregation and delayed reaggregation withoutinducer. Cell Diff. Dev. 28, 211–218.
Haake, A.R., Goldsmith, L.A., 1997. The skin. In: Thorogodd, P. (Ed.),Embryos Genes and Birth Defects . Wiley, Chichester, pp. 251–280.
Haffter, P., Granato, M., Brand, M., Mullins, M.C., Hammerschmidt, M.,Kane, D.A., Odenthal, J., van Eeden, F.J., Jiang, Y.J., Heisenberg, C.P.,Kelsh, R.N., Furutani, S.M., Vogelsang, E., Beuchle, D., Schach, U.,Fabian, C., Nu¨sslein-Volhard, C., 1996. The identification of genes withunique and essential functions in the development of the zebrafish. Daniorerio. Development 123, 1–36.
Harland, R.M., 1991. In situ hybridization: an improved whole-mountmethod forXenopusembryos. Methods Cell. Biol. 36, 685–695.
Hartenstein, V., 1989. Early neurogenesis inXenopus; The spatio-temporalpattern of proliferation and cell lineages in the embryonic spinal cord.Neuron 3, 399–411.
Hawley, S.H., Wunnenberg, S.K., Hashimoto, C., Laurent, M.N., Watabe,T., Blumberg, B.W., Cho, K.W., 1995. Disruption of BMP signals inembryonic Xenopusectoderm leads to direct neural induction. GenesDev. 9, 2923–2935.
Hogan, B, 1996. Bone morphogenetic proteins: multifunctional regulators ofvertebrate development. Genes Dev. 10, 1580–1594.
Hopwood, N.D., Pluck, A., Gurdon, J.B., 1991.XenopusMyf-5 marks earlymuscle cells and can activate muscle genes ectopically in early embryos.Development 111, 551–560.
Itoh, K., Yamashita, A., Kubota, H.Y., 1988. The expression of epidermalantigens inXenopus laevis. Development 104, 1–14.
Jan, Y.N., Jan, L.Y., 1993. Functional gene cassettes in development. Proc.Natl. Acad. Sci. USA 90, 8305–8307.
Kane, D.A., Maischein, H.-M., Brand, M., vanEden, F.J.M., Furutani-Seiki,M., Granato, M. et al. , 1996. The zebrafish early arrest mutants.Development 123, 57–66.
Keller, R.E., 1975. Vital dye mapping of the gastrula and neurula ofXeno-pus laevis. I. Prospective areas and morphogenetic movements of thesuperficial layer. Dev. Biol. 42, 222–241.
Knochel, S., Lef, J., Clement, J., Klocke, B., Hille, S., Koster, M., Kno¨chel,W., 1992. Activin A induced expression of a fork head related gene inposterior chordamesoderm (notochord) ofXenopus laevisembryos. Mech.Dev. 38, 157–165.
Ladher, R., Mohun, T.J., Smith, J.C., Snape, A.M., 1996. Xom: aXenopushomeobox gene that mediates the early effects of BMP-4. Development122, 2385–2394.
Levin, M., 1997. Left-right asymmetry in vertebrate embryogenesis.Bioessays 19, 287–296.
Leyns, L., Bouwmeester, T., Kim, S.-H., Piccolo, S., De Robertis, E.M.,
140 V. Gawantka et al. / Mechanisms of Development 77 (1998) 95–141
1997. Frzb-l is a secreted antagonist of wnt-signals expressed in theSpemann’s organizer. Cell 88, 747–756.
Lyerla, T.A., Pelizzari, J.J., 1973. Histological development of the cementgland in Xenopus laevis: a light microscopic study. J. Morphol. 141,491–501.
Miklos, G.L., Rubin, G.M., 1996. The role of the genome project in deter-mining gene function: insights from model organisms. Cell 86, 521–529.
Minoo, P., Sullivan, W., Solomon, L.R., Martin, T.E., Toft, D.O., Scott,R.E., 1989. Loss of proliferative potential during terminal differentiationcoincides with the decreased abundance of a subset of heterogeneousribonuclear proteins. J. Cell Biol. 109, 1937–1946.
Onichtchouk, D., Gawantka, V., Dosch, R., Delius, H., Hirschfeld, K.,Blumenstock, C., Niehrs, C., 1996. The Xvent-2 homeobox gene ispart of the BMP-4 signaling pathway controling dorsoventral patterningof Xenopusmesoderm. Development 122, 3045–3053.
Palmeirim, I., Henrique, D., Ish-Horowicz, D., Pourquie, O., 1997. Avianhairy gene expression identifies a molecular clock linked to vertebratesegmentation and somitogenesis. Cell 91, 639–648.
Papalopulu, N., Kintner, C., 1996. AXenopusgene, Xbr-l, defines a novelclass of homeobox genes and is expressed in the dorsal ciliary margin ofthe eye. Dev. Biol. 174, 104–114.
Rothblatt, J., Novick, P. and Stevens, T. 1994. Guidebook to the SecretoryPathway. Oxford University Press, New York.
Ruiz i Altaba, A., Jessell, T.M., 1992. Pintallavis, a gene expressed in theorganizer and midline cells of frog embryos: involvement in the devel-opment of the neural axis. Development 116, 81–93.
Ruohola Baker, H., Jan, L.Y., Jan, Y.N., 1994. The role of gene cassettesin axis formation during Drosophila oogenesis. Trends Genet. 10, 89–94.
Sasai, Y., Lu, B., Steinbeisser, H., Geissert, D., Gont, L.K., De Robertis,E.M., 1994.Xenopuschordin: a novel dorsalizing factor activated byorganizer-specific homeobox genes. Cell 79, 779–790.
Schmidt, J.E., von Dassow, G., Kimelman, D., 1996. Regulation of dorsal-ventral patterning: the ventralizing effects of the novelXenopushomeo-box gene Vox. Development 122, 1711–1721.
Scott, M.P., O’Farrell, P.H., 1986. Spatial programming of gene expres-sion in early Drosophila embryogenesis. Ann. Rev. Cell Biol. 2, 49–80.
Smith, J.C., Price, B.M., Green, J.B., Weigel, D., Herrmann, B.G., 1991.Expression of aXenopushomolog of Brachyury (T) is an immediate-early response to mesoderm induction. Cell 67, 79–87.
Sokol, S., Melton, D.A., 1991. Pre-existent pattern inXenopusanimal polecells revealed by induction with activin. Nature 351, 409–411.
Stein, G.S., Stein, J.L., van Wijnen, A.J., Lian, J.B., 1994. Histone genetranscription: a model for responsiveness to an integrated series of reg-ulatory signals mediating cell cycle control and proliferation/differentia-tion interrelationships. J. Cell Biochem. 54, 393–404.
Tahara, T., Ogawa, K., Taniguchi, K., 1993. Ontogeny of the pronephrosand mesonephros in the South African clawed frog,Xenopus laevisDaudin, with special reference to the appearance and movement ofthe renin-immunopositive cells. Jikken Dobutsu 42, 601–610.
Talbot, W.S., Trevarrow, B., Halpern, M.E., Melby, A.E., Farr, G.,Postlethwait, J.H., Jowett, T., Kimmel, C.B., Kimelman, D., 1995. Ahomeobox gene essential for zebrafish notochord development. Nature378, 150–156.
Tucker, A.S., Slack, J.M., 1995. Tail bud determination in the vertebrateembryo. Curr. Biol. 5, 807–813.
van Eeden, F.J., Granato, M., Schach, U., Brand, M., Furutani-Seiki, M.,Haffter, P., Hammerschmidt, M., Heisenberg, C.P., Jiang, Y.J., Kane,D.A., Kelsh, R.N., Mullins, M.C., Odenthal, J., Warga, R.M., Nu¨sslein-Volhard, C., 1996. Genetic analysis of fin formation in the zebrafish.Danio rerio. Development 123, 255–262.
van Eeden, F.J.M., Granato, M., Schach, U., Brand, M., Furutani-Seiki,M., Haffter, P., Hammerschmidt, M., Heisenberg, C.-P., Jiang, Y.-J.,Kane, D.A., Kelsh, R.N., Mullins, M., Odenthal, J., Warga, R.,Allende, M.L., Weinberg, E.S., Nu¨ssleinVolhard, C., 1996. Mutationsaffecting somite formation and patterning in the zebrafish. Danio rerio.Development 123, 153–164.
Wurst, W., Rossant, J., Prideaux, V., Kownacka, M., Joyner, A., Hill, D.P.,Guillemot, F., Gasca, S., Cado, D., Auerbach, A. et al. , 1995. A large-scale gene-trap screen for insertional mutations in developmentallyregulated genes in mice. Genetics 139, 889–899.
Xu, R.H., Kim, J., Taira, M., Zhan, S., Sredni, D., Kung, H.F., 1995. Adominant negative bone morphogenetic protein 4 receptor causes neur-alization inXenopusectoderm. Biochem. Biophys. Res. Commun. 212,212–219.
Yamaguchi, T.P., 1997. New insights into segmentation and patterningduring vertebrate somitogenesis. Curr. Opin. Genet. Dev. 7, 513–518.
Zaraisky, A.G., Lukyanov, S.A., Vasiliev, O.L., Smirnov, Y.V.,Belyavsky, A.V., Kazanskaya, O.V., 1992. A novel homeobox geneexpressed in the anterior neural plate of theXenopusembryo. Dev.Biol. 152, 373–382
141V. Gawantka et al. / Mechanisms of Development 77 (1998) 95–141
Copyright © 2022 FDOKUMEN