Using the Structure of Inhibitory Networks to Unravel Mechanisms of Spatiotemporal Patterning
14
Neuron Article Using the Structure of Inhibitory Networks to Unravel Mechanisms of Spatiotemporal Patterning Collins Assisi, 1, * Mark Stopfer, 2 and Maxim Bazhenov 1 1 Department of Cell Biology and Neuroscience, University of California, Riverside, Riverside, CA 92521, USA 2 National Institutes of Health, Eunice Kennedy Shriver National Institute of Child Health and Human Development, Bethesda, MD 20892-2425, USA *Correspondence: [email protected] DOI 10.1016/j.neuron.2010.12.019 SUMMARY Neuronal networks exhibit a rich dynamical reper- toire, a consequence of both the intrinsic properties of neurons and the structure of the network. It has been hypothesized that inhibitory interneurons corral principal neurons into transiently synchronous ensembles that encode sensory information and subserve behavior. How does the structure of the inhibitory network facilitate such spatiotemporal patterning? We established a relationship between an important structural property of a network, its colorings, and the dynamics it constrains. Using a model of the insect antennal lobe, we show that our description allows the explicit identification of the groups of inhibitory interneurons that switch, during odor stimulation, between activity and quiescence in a coordinated manner determined by features of the network structure. This description optimally matches the perspective of the down- stream neurons looking for synchrony in ensembles of presynaptic cells and allows a low-dimensional description of seemingly complex high-dimensional network activity. INTRODUCTION Coordinated spiking of neuronal populations underlies the perception of sensory stimuli (Gray and Singer, 1989), the plan- ning of movement (Bouyer et al., 1987), and the acquisition of new memories (Cheng and Frank, 2008). A number of studies have shown that such patterning, to a large extent, depends on the temporal and the spatial distribution of inhibition (Buzsa ´ ki and Chrobak, 1995). For example, in hippocampal networks, GABAergic interneurons form the hubs of a network that selec- tively synchronizes subpopulations of pyramidal cells (Bonifazi et al., 2009). The back-and-forth interaction between inhibitory granule cells and excitatory mitral cells in the mouse olfactory bulb leads to synchronous spiking in mitral cells (Schoppa, 2006). Synchrony extends across mitral cells that are electrically uncoupled and affiliated with different glomeruli. Feedback inhibition mediated by local interneurons synchronizes cortical pyramidal cells in the gamma frequency band underlying cogni- tive processing and provides a mechanism for the temporal binding of sensory stimuli (Joliot et al., 1994; Llina ´ s and Ribary, 1993; Singer and Gray, 1995). In vertebrates (Grillner, 2003) and invertebrates (Marder and Bucher, 2007), coordinated movement is achieved by interneuron networks that work in concert to generate appropriate phases of spiking in motor neurons. The antennal lobe (AL), the insect equivalent of the olfactory bulb in mammals, provides an ideal system where the effects of inhibitory networks can be examined. Local inhibitory inter- neurons (LNs) extend extensive connections to each other and excitatory projection neurons (PNs) in the AL (Leitch and Laurent, 1996). Odor-driven activity of PNs in the AL evolves over multiple spatial and temporal scales (Laurent, 2002). The collective spiking activity of PNs generates an oscillatory local field poten- tial (LFP) (Laurent and Davidowitz, 1994). The composition of synchronized groups of PNs contributing to the LFP oscillation changes on a cycle-by-cycle basis (Laurent and Davidowitz, 1994; Laurent et al., 1996; Wehr and Laurent, 1996). PNs receive input from local LNs. Blocking fast LN-mediated inhibition by the application of the GABA-activated chloride channel blocker picrotoxin leads to the desynchronization of PNs and conse- quently abolishes the oscillatory output of the AL (Ito et al., 2009; MacLeod and Laurent, 1996; Stopfer et al., 1997; Tanaka et al., 2009). Since dynamic changes in collective PN activity during odor stimulation exceed changes in input to the network, they must be attributed to the network interactions within the AL (Raman et al., 2010). Previously, we proposed that competitive inhibitory interactions between LNs generate alternately spiking groups of neurons. These groups entrain different populations of PNs, shaping their spike timings and generating a spatiotemporal representation of an odor (Bazhenov et al., 2001b). The basic cause of transient synchrony in PNs, recovery from concerted inhibition, is well understood in insect (MacLeod and Laurent, 1996; Stopfer et al., 1997)(Bazhenov et al., 2001b) and mamma- lian (Schoppa, 2006) olfactory circuits. However, a clear relation- ship between the global structure of the inhibitory network and the collective dynamics of PNs and LNs is not known. An understanding of structure-dynamics relationships in a network is often challenging because of the formidable dimensionality of the system and the inherent nonlinear properties of neurons and synapses that constitute the network. Recent approaches have been restricted to two broad classes (Boccaletti et al., 2006). The first class examines complex dynamics, albeit in relatively simple networks. These networks Neuron 69, 373–386, January 27, 2011 ª2011 Elsevier Inc. 373
-
Upload
independent -
Category
Documents
-
view
0 -
download
0
Transcript of Using the Structure of Inhibitory Networks to Unravel Mechanisms of Spatiotemporal Patterning
Neuron
Article
Using the Structure of Inhibitory Networksto Unravel Mechanisms of Spatiotemporal PatterningCollins Assisi,1,* Mark Stopfer,2 and Maxim Bazhenov11Department of Cell Biology and Neuroscience, University of California, Riverside, Riverside, CA 92521, USA2National Institutes of Health, Eunice Kennedy Shriver National Institute of Child Health and Human Development, Bethesda,
MD 20892-2425, USA*Correspondence: [email protected]
DOI 10.1016/j.neuron.2010.12.019
SUMMARY
Neuronal networks exhibit a rich dynamical reper-toire, a consequence of both the intrinsic propertiesof neurons and the structure of the network. It hasbeen hypothesized that inhibitory interneuronscorral principal neurons into transiently synchronousensembles that encode sensory information andsubserve behavior. How does the structure of theinhibitory network facilitate such spatiotemporalpatterning? We established a relationship betweenan important structural property of a network, itscolorings, and the dynamics it constrains. Usinga model of the insect antennal lobe, we show thatour description allows the explicit identification ofthe groups of inhibitory interneurons that switch,during odor stimulation, between activity andquiescence in a coordinated manner determined byfeatures of the network structure. This descriptionoptimally matches the perspective of the down-stream neurons looking for synchrony in ensemblesof presynaptic cells and allows a low-dimensionaldescription of seemingly complex high-dimensionalnetwork activity.
INTRODUCTION
Coordinated spiking of neuronal populations underlies the
perception of sensory stimuli (Gray and Singer, 1989), the plan-
ning of movement (Bouyer et al., 1987), and the acquisition of
new memories (Cheng and Frank, 2008). A number of studies
have shown that such patterning, to a large extent, depends
on the temporal and the spatial distribution of inhibition (Buzsaki
and Chrobak, 1995). For example, in hippocampal networks,
GABAergic interneurons form the hubs of a network that selec-
tively synchronizes subpopulations of pyramidal cells (Bonifazi
et al., 2009). The back-and-forth interaction between inhibitory
granule cells and excitatory mitral cells in the mouse olfactory
bulb leads to synchronous spiking in mitral cells (Schoppa,
2006). Synchrony extends across mitral cells that are electrically
uncoupled and affiliated with different glomeruli. Feedback
inhibition mediated by local interneurons synchronizes cortical
pyramidal cells in the gamma frequency band underlying cogni-
tive processing and provides a mechanism for the temporal
binding of sensory stimuli (Joliot et al., 1994; Llinas and Ribary,
1993; Singer and Gray, 1995). In vertebrates (Grillner, 2003)
and invertebrates (Marder and Bucher, 2007), coordinated
movement is achieved by interneuron networks that work in
concert to generate appropriate phases of spiking in motor
neurons.
The antennal lobe (AL), the insect equivalent of the olfactory
bulb in mammals, provides an ideal system where the effects
of inhibitory networks can be examined. Local inhibitory inter-
neurons (LNs) extend extensive connections to each other and
excitatory projection neurons (PNs) in the AL (Leitch and Laurent,
1996). Odor-driven activity of PNs in the AL evolves over multiple
spatial and temporal scales (Laurent, 2002). The collective
spiking activity of PNs generates an oscillatory local field poten-
tial (LFP) (Laurent and Davidowitz, 1994). The composition of
synchronized groups of PNs contributing to the LFP oscillation
changes on a cycle-by-cycle basis (Laurent and Davidowitz,
1994; Laurent et al., 1996; Wehr and Laurent, 1996). PNs receive
input from local LNs. Blocking fast LN-mediated inhibition by the
application of the GABA-activated chloride channel blocker
picrotoxin leads to the desynchronization of PNs and conse-
quently abolishes the oscillatory output of the AL (Ito et al.,
2009; MacLeod and Laurent, 1996; Stopfer et al., 1997; Tanaka
et al., 2009). Since dynamic changes in collective PN activity
during odor stimulation exceed changes in input to the network,
they must be attributed to the network interactions within the AL
(Raman et al., 2010). Previously, we proposed that competitive
inhibitory interactions between LNs generate alternately spiking
groups of neurons. These groups entrain different populations of
PNs, shaping their spike timings andgenerating a spatiotemporal
representation of an odor (Bazhenov et al., 2001b). The basic
cause of transient synchrony in PNs, recovery from concerted
inhibition, is well understood in insect (MacLeod and Laurent,
1996; Stopfer et al., 1997) (Bazhenov et al., 2001b) and mamma-
lian (Schoppa, 2006) olfactory circuits. However, a clear relation-
ship between the global structure of the inhibitory network and
the collective dynamics of PNs and LNs is not known.
An understanding of structure-dynamics relationships in
a network is often challenging because of the formidable
dimensionality of the system and the inherent nonlinear
properties of neurons and synapses that constitute the network.
Recent approaches have been restricted to two broad classes
(Boccaletti et al., 2006). The first class examines complex
dynamics, albeit in relatively simple networks. These networks
Neuron 69, 373–386, January 27, 2011 ª2011 Elsevier Inc. 373

C
500 ms
10 n
euro
ns
D0 0 0 0 1 1 1 1 1 1 1 10 0 0 0 1 1 1 1 1 1 1 10 0 0 0 1 1 1 1 1 1 1 10 0 0 0 1 1 1 1 1 1 1 11 1 1 1 0 0 0 1 1 1 1 11 1 1 1 0 0 0 1 1 1 1 11 1 1 1 0 0 0 1 1 1 1 11 1 1 1 1 1 1 0 0 0 0 01 1 1 1 1 1 1 0 0 0 0 01 1 1 1 1 1 1 0 0 0 0 01 1 1 1 1 1 1 0 0 0 0 01 1 1 1 1 1 1 0 0 0 0 0
BA
100 ms
50 m
V
[Ca]
0.0
5 m
M
1s
in v
ivo
mo
del
50 m
V0.
1 m
M
200 ms
[Ca]
2+
E
Figure 1. Clustering in Inhibitory Networks
as a Function of Graph Coloring
(A) A reciprocally connected pair of inhibitory
neurons is an example of a graph with chromatic
number two. Left traces: An alternating pattern of
bursts is generated in response to a constant
external stimulus to both neurons. A Ca2+-depen-
dent potassium current (shown in red) causes
spike frequency adaptation. Right traces: In the
absence of a Ca2+-dependent potassium current,
only one neuron produces spikes and the other
is quiescent. Blue trace at the bottom: Spike
frequency adaptation in a local inhibitory inter-
neuron recorded in vivo from locust AL.
(B) A coloring generated for a random network of
20 neurons with connection probability 0.5.
(C) A graph with chromatic number three and its
corresponding adjacency matrix.
(D) Raster plot showing the activity of a network of
30 neurons with chromatic number three. Ten
neurons are associated with each color.
(E) The role of Ca2+ concentration on the timing of
LN bursts. The bottom traces show the Ca2+
concentration in three LNs (top three traces) asso-
ciated with three different colors. The neuron with
the lowest concentration of Ca2+ tends to spike
first.
Neuron
Structure-Dynamics Relationship in Neural Networks
(often consisting of a few [<10] neurons) (Shilnikov et al., 2008)
are designed to resemble the characteristic building blocks of
networks known as motifs that recur with considerable
frequency in neuroanatomical data sets (Milo et al., 2002; Sporns
et al., 2004; Sporns and Kotter, 2004). Another commonly
studied example of the same class is a large network with simple
connectivity (all-to-all, or nearest neighbor) that can also demon-
strate a rich repertoire of dynamical patterns (Assisi et al., 2005).
A second class of studies examines simple dynamics in
networks with arbitrarily complex topologies (Arenas et al.,
2008). These studies have been largely limited to the analysis
of the stability of completely synchronized states (Pecora and
Carroll, 1998) and have been applied to a variety of systems
(see Boccaletti et al., 2006 for a review).
Our approach is a departure from these two classes. Here we
establish a relationship between a structural property of the
network, its colorings, and the dynamics it constrains. Further-
more, we show that the description of network dynamics
based on its coloring comes with a fortuitous benefit. It helps
us define a low-dimensional space in which the seemingly high-
dimensional dynamics of networks of excitatory and inhibitory
neurons reliably forms a series of orthogonally propagating
374 Neuron 69, 373–386, January 27, 2011 ª2011 Elsevier Inc.
waves, a predictable and simple pattern
where synchronous ensembles of excit-
atory projecting cells are successively
recruited.
RESULTS
Dynamics of Inhibitory NetworksA ‘‘coloring’’ of a network (or graph) is an
assignment of colors to the nodes of the
graph so that nodes (such as neurons) that are directly con-
nected to each other are assigned different colors (see Supple-
mental Information for a detailed example). Graph coloring
problems first emerged as interesting mathematical curiosities
(Biggs et al., 1986; Kubale, 2004), but have since been applied
to resolving scheduling conflicts, reinterpreting the Sudoku
puzzle (Herzberg and Murty, 2007) and, most prominently,
coloring maps (see Appel and Haken, 1989 for a proof of the
famous four-color theorem; Appel and Haken, 1977 and Biggs
et al., 1986 describe the colorful history). We found that antago-
nistic interactions in a network of inhibitory neurons can be
usefully related to its coloring. To illustrate, consider the simplest
possible inhibitory network, one consisting of two reciprocally
connected inhibitory interneurons. Since these neurons are
directly connected to each other, by definition, we must assign
a different color to each neuron. A general property of such
a network is that neurons inhibiting each other via fast
GABAergic synapses tend to spike asynchronously. This simple
network may burst in rhythmic alternation (see Figure 1A) (Shpiro
et al., 2007), or act as a flip-flop (Kleinfeld et al., 1990; Lu et al.,
2006) (see Van Vreeswijk et al., 1994 for exceptions to the
desynchronizing effects of inhibition). Antagonistic interactions

Neuron
Structure-Dynamics Relationship in Neural Networks
explain why only one neuron remains active at any given time.
But how does switching take place?
In addition to the fast timescale of spiking (�10s of millisec-
onds), responses of inhibitory interneurons in the locust AL can
vary on a slow timescale (�100ms) over which spiking frequency
gradually declines. As the example in Figure 1A shows, once
below a threshold frequency, the quiescent neuron was released
from inhibition and generated a burst of spikes that, in turn,
silenced the other neuron of the pair. In the absence of spike
frequency adaptation, one of the neurons remained in an active
state while the other was constantly inhibited (Figure 1A, right).
This slow timescale resulted from a hyperpolarizing Ca2+-depen-
dent potassium current (red trace) that was activated by Ca2+
spikes in the inhibitory neuron (see Supplemental Information)
(Bazhenov et al., 2001b). Spike frequency adaptation is common
in different classes of spiking interneurons (McCormick, 2004)
and may be achieved through a variety of mechanisms (Benda
and Herz, 2003).
In this two-neuron network, neurons associated with different
colors tend to spike in alternating bursts. In larger, more realistic
networks, we hypothesize that neurons associated with the
same color will not directly compete and, assuming they receive
similar external inputs, will tend to burst together. A simple
strategy to verify this hypothesis would be to generate a random
network, characterize its coloring, and compare the coloring with
the dynamics. However, this strategy is impractical for two
reasons. First, one would like to query the dynamics of the
network after systematically varying its coloring-based proper-
ties like the number of neurons associated with a particular color
or the number of colors. It is not clear how to achieve this with
a random network (Figure 1B). A second difficulty is to generate
all possible colorings of the network as the size of the network
grows. Thus, we chose instead to construct a set of networks
that each posses properties of interest. For example, to
construct a network with three colors, we generated three
groups of nodes and connected every pair belonging to different
groups. No within-group connections were implemented. The
resulting adjacency matrix consisted of diagonal blocks of zeros
with all other elements set to unity (Figure 1C). Our simulations of
activity in this network showed that neurons associated with the
same color tended to fire in synchronous bursts. The period
between bursts in one group was occupied by similar bursting
patterns generated by neurons associated with other colors
(Figure 1D). This simple model showed that the coloring of the
network was closely related to the dynamics of its constituent
neurons. The temporal sequence of these bursts can be deter-
mined by a number of factors. Asymmetries in the intrinsic
properties of individual LNs and directed connections between
neurons can ensure that specific sequences of spiking are stabi-
lized. In addition to changes in the intrinsic and synaptic param-
eters, a neuron’s Ca2+ concentration can also influence the
ordering of LN bursts (Ahn et al., 2010). The larger the Ca2+ level
in a cell, the less likely it is to generate a spike in the next cycle,
because of the negative impact of Ca2+-dependent potassium
currents. In Figure 1E note that the ordering of bursts in
a three-color network can be predicted by the level of Ca2+.
Network geometry also influenced other attributes of indi-
vidual bursts. In a network with chromatic number two
(a minimum of two colors was required to color the network),
the burst duration of neurons associated with a color depended
on the number of neurons in the group. Asymmetries in the
network’s structure were manifest as asymmetries in burst
duration: larger groups dominated the dynamics (Figure 2A).
The average duration of a burst was a nonlinear function of the
number of neurons associated with the group and showed
a sharp transition as the group size grew (Figure 2B). For a given
network, as the number of separate groups increased, the
number of neurons associated with each color decreased and
thus exerted diminished inhibitory influence upon other groups.
And as this influence diminished, strict coloring-based dynamics
tended to break down (Figure 2C, compare top and bottom
panels). We quantified this loss of structure as the amount of
overlap in activity between different groups (Figure 2D). For
a selected network with 100 inhibitory cells, this overlap showed
an abrupt transition when the number of colors increased from
four to five. We simulated a larger network consisting of 200
neurons to see if this transition was determined by the size of
the network. A similar abrupt increase in variability was also
evident in this larger network. Increasing the time constant of
recovery from adaptation, however, shifted the transition point
to the right (not shown). This transition was also seen in the distri-
bution of burst lengths across all groups (Figure 2E). For a chro-
matic number below four, the burst length for all groups was very
narrowly distributed. When the number of colors exceeded four,
the standard deviation of the distribution increased abruptly (Fig-
ure 2E). This suggests that below a threshold level of inhibition,
neurons showed very low within-group variability. In addition,
the simple periodic sequences observed in networks with few
colors were replaced by more complex sequences of activity
when the number of colors increased. However, even for
networks with high chromatic numbers (�8–10) (bottom panel
of Figure 2C), the influence of graph coloring continued to be
evident in the network’s dynamics.
Dynamical Consequences of Multiple ColoringsThe example inhibitory networks shown thus far possess
a unique coloring (Figure 3A); in such a network neurons associ-
ated with a particular color can spike synchronously only with
those neurons that share the same color. However, in the AL indi-
vidual PNs, and therefore, by necessity, inhibitory interneurons,
may switch allegiance between different synchronously spiking
groups (Wehr and Laurent, 1996). Similar dynamic changes in
the composition of synchronous groups of neurons have also
been observed in other systems (Riehle et al., 1997). Networks
that possess a unique coloring do not permit such dynamics.
To circumvent this difficulty we constructed networks with
multiple colorings. For example, the graph in Figure 3B
possesses chromatic number three. One of the four nodes is
not connected to either the red or the blue node. Therefore,
two colorings, one where this group is colored red and the other
where it is colored blue, are permissible colorings of the graph.
A dynamical consequence of this ‘‘structural ambiguity’’ is
shown in Figure 3C. The group that may be colored either red
or blue is able to switch allegiance to spike synchronously with
both the red and the blue group while remaining silent when
the green group of neurons is activated. Based on our formalism,
Neuron 69, 373–386, January 27, 2011 ª2011 Elsevier Inc. 375
100 ms
50 n
euro
ns
A
D
10
time (ms)
nu
mb
er o
f co
lor
100 200 300 400 5002
3
4
5
6
7
8
9
E
500 ms
50 n
euro
ns
C
0.0
0.1
0.2
0.3
0.4
0.5
0.6
0.7
0.8
0.9
1.0
[50 50]
[55 45]
[60 40]
[65 35]
[70 30]
[75 25]
[80 20]
[85 15]
[90 10]
number of neurons in [group 1 group 2]
frac
tio
n o
f tim
e in
act
ive
stat
e
B
2 3 4 5 6 7 8 9 100
1
2
3
4
5
6
7
8
N = 200N = 100
number of colors
mea
n o
verl
ap %
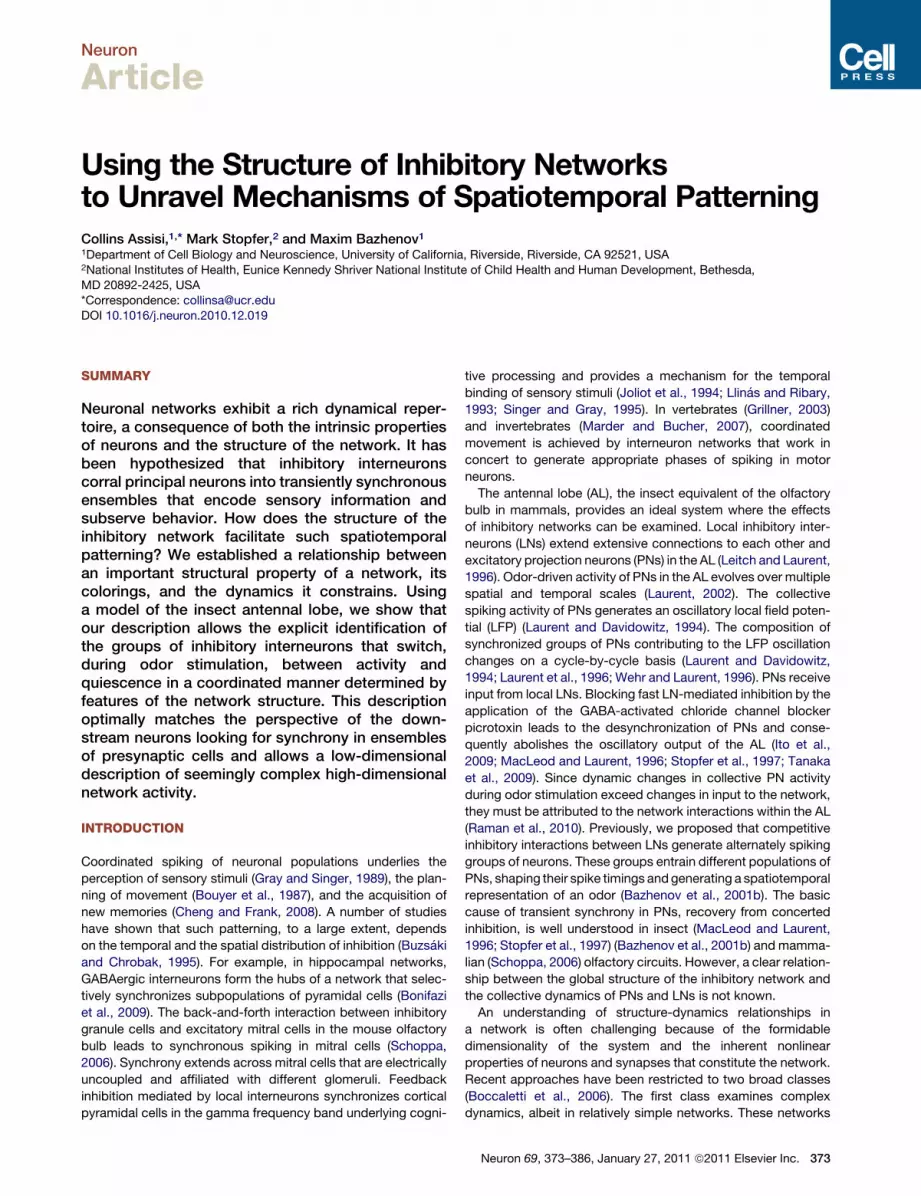
Figure 2. Dynamical Properties of Networks Based on Graph Coloring
(A and B) Influence of the number of neurons associated with a particular color in a network with chromatic number two. In symmetrical networks (each group has
the same number of neurons), both groups spend equal time in the active state (top panel of A and the point [50 50] in B). As the asymmetry in network structure
increases, the larger group increasingly dominates (B and bottom panel of A).
(C–E) Influence of the number of colors. As the number of colors increased, the switching pattern became more noisy (compare top and bottom panels of C). (D)
Mean overlap time for networks consisting of 100 or 200 neurons. The percentage of time during which multiple groups are simultaneously active increases with
chromatic number. (E) Burst length distribution as a function of chromatic number. The width of the distribution increased abruptly when the chromatic number of
the graph exceeded four.
Neuron
Structure-Dynamics Relationship in Neural Networks
complex dynamics observed in vivo in the insect AL (Laurent
et al., 1996) and other neuronal networks can thus be attributed
to its structure—a network with multiple colorings permits
transient synchrony in overlapping groups of neurons.
Excitation Does Not Disrupt Coloring-Based DynamicsThe coloring of a purely inhibitory network provides a strong
constraint on its dynamics. However, many biological networks,
including the olfactory system, include populations of excitatory
neurons as well. To explore the consequences of implementing
excitatory neurons, we constructed a network containing excit-
atory and inhibitory neurons with random connections between
376 Neuron 69, 373–386, January 27, 2011 ª2011 Elsevier Inc.
them (connection probability = 0.5) (Bazhenov et al., 2001b) (Fig-
ure 4A). This network was previously proposed as a model of
locust AL dynamics (Assisi et al., 2007; Bazhenov et al., 2001a,
2001b, 2005).
We found that the coloring-based dynamics was not compro-
mised by the addition of excitatory neurons (Figure 4B), but was
rather strengthened. The spike coherence within individual
cycles of the oscillatory field potential (mean activity) increased
significantly when excitation was added (Figure 4C).
The mechanism of synchronization of PNs and LNs can be
understood by considering a single reciprocally connected
pair. When reciprocally coupled, the LNs and PNs oscillate in
A
0 0 0 0 1 1 1 1 1 1 1 1 1 1 10 0 0 0 1 1 1 1 1 1 1 1 1 1 10 0 0 0 1 1 1 1 1 1 1 1 1 1 10 0 0 0 1 1 1 1 1 1 1 1 1 1 11 1 1 1 0 0 0 1 1 1 1 1 1 1 11 1 1 1 0 0 0 1 1 1 1 1 1 1 11 1 1 1 0 0 0 1 1 1 1 1 1 1 11 1 1 1 1 1 1 0 0 0 0 0 1 1 11 1 1 1 1 1 1 0 0 0 0 0 1 1 11 1 1 1 1 1 1 0 0 0 0 0 1 1 11 1 1 1 1 1 1 0 0 0 0 0 1 1 11 1 1 1 1 1 1 0 0 0 0 0 1 1 11 1 1 1 1 1 1 1 1 1 1 1 0 0 01 1 1 1 1 1 1 1 1 1 1 1 0 0 01 1 1 1 1 1 1 1 1 1 1 1 0 0 0
500 ms
20 n
euro
ns
C
B
0 0 0 0 1 1 1 1 1 1 1 1 0 0 00 0 0 0 1 1 1 1 1 1 1 1 0 0 00 0 0 0 1 1 1 1 1 1 1 1 0 0 00 0 0 0 1 1 1 1 1 1 1 1 0 0 01 1 1 1 0 0 0 1 1 1 1 1 1 1 11 1 1 1 0 0 0 1 1 1 1 1 1 1 11 1 1 1 0 0 0 1 1 1 1 1 1 1 11 1 1 1 1 1 1 0 0 0 0 0 0 0 01 1 1 1 1 1 1 0 0 0 0 0 0 0 01 1 1 1 1 1 1 0 0 0 0 0 0 0 01 1 1 1 1 1 1 0 0 0 0 0 0 0 01 1 1 1 1 1 1 0 0 0 0 0 0 0 00 0 0 0 1 1 1 0 0 0 0 0 0 0 00 0 0 0 1 1 1 0 0 0 0 0 0 0 00 0 0 0 1 1 1 0 0 0 0 0 0 0 0
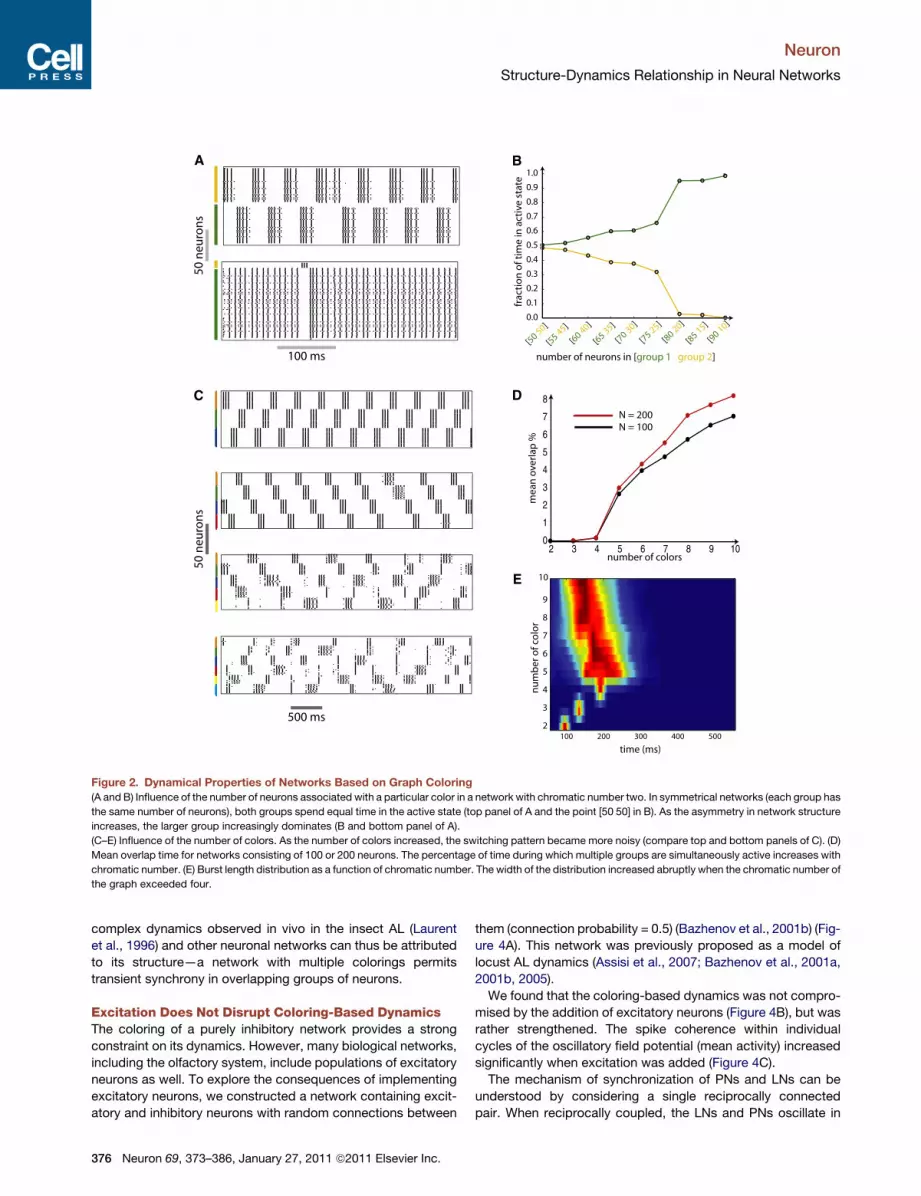
Figure 3. Networks Can Have Unique or
Multiple Colorings
(A) A network with a chromatic number four and
a single coloring, and (B) a network with a chro-
matic number three and two different colorings.
The neuron that may be colored either red
or blue is shown with both colors. Bottom
panels: Adjacency matrices corresponding to the
networks above. (C) The dynamics of a network
of 40 neurons with connectivity like the network
in (B). The bars on the side of the panel correspond
to the red, green, and blue groups of 10 neurons.
Note that the neuron colored red or blue switches
allegiance between the red and the blue groups.
The bars on top of the panel indicate the intervals
of time in which this group of neurons synchro-
nizes with the red or the blue groups.
Neuron
Structure-Dynamics Relationship in Neural Networks
antiphase. A Na+ spike generated by a PN elicits an EPSP in the
LN, which in turn generates a spike that delays the onset of
a subsequent PN spike. The frequency of the resulting oscilla-
tions is controlled by the duration and the amplitude of the
IPSP (see Bazhenov et al., 2001b, Figure 2). When a single LN
projects to many postsynaptic PNs, it equally delays and
synchronizes spikes in those PNs. This mechanism, a classic
example of feedback inhibition (Bazhenov and Stopfer, 2010),
is also referred to as Pyramidal Interneuronal Network Gamma
(PING) (Borgers et al., 2005; Borgers and Kopell, 2003, 2005)
and implicated as a prominent mechanism in the generation of
cortical and hippocampal gamma oscillations.
Properties of Follower Neurons Define an Orderingof the Network NodesThe distance between neuronal network nodes has often been
defined as the shortest synaptic path length between them.
This measure of distance is particularly relevant to networks of
excitatory neurons that act as threshold units that generate
a spike whenever a predetermined number of presynaptic
neurons fire a spike. A path in such a network (a physical chain
of neurons connected with excitatory synapses) therefore often
translates into a temporal sequence of spikes (Abeles et al.,
1993; Diesmann et al., 1999). Neurons located in close proximity
(in a metric defined by the number of synapses separating
them) would commonly spike within a short temporal interval,
providing common drive to their postsynaptic targets. However,
in networks consisting of excitatory and inhibitory units, each
Neuron 69, 373–386,
capable of acting over multiple time-
scales and interacting nonlinearly, this
measure of distance may not provide
a complete account of the network’s
possible dynamical states. Feedback
inhibition from a single inhibitory neuron
can induce complex patterns of spiking
(Ermentrout, 1992). Sequences of spikes
need not result from physically con-
nected synaptic paths in the network. Is
there another ‘‘hiddenmetric’’ that under-
lies the observable network (Boguna
et al., 2009)—a measure of distance between nodes that takes
account of relevant biological variables? An answer to this ques-
tion comes from understanding how neurons that follow the AL
network in the olfactory processing hierarchy read their presyn-
aptic input. Kenyon cells (KCs) of the mushroom body (MB)
receive convergent input from excitatory PNs of the AL and are
known to be sensitive to the synchrony of presynaptic input
(Perez-Orive et al., 2002, 2004). Only when a population of
presynaptic excitatory PNs fire in synchrony does it provide suffi-
cient input to activate a postsynaptic KC. Similar properties have
also been described in the thalamocortical system and the
hippocampal formation (Pouille and Scanziani, 2001). Therefore
we sought to construct a space in which synchronously active
PNs could be readily identified. To do this, we considered how
inhibition affects the responses of excitatory PNs. Greater inhib-
itory input was always accompanied by increased synchrony in
the firing of PNs (Figure 5A) (Bazhenov et al., 2001b). In addition,
PNs that received similar inhibitory input tended to spike
together in a highly correlated manner. Therefore, a space that
places PNs receiving similar inhibitory input close together
would be a useful candidate for defining the network’s internodal
distances. In what follows, we demonstrate how knowledge of
the coloring of the inhibitory subnetwork can be effectively
employed to achieve this goal.
To illustrate the construction of this space we used an inhib-
itory subnetwork with two colors. These groups (LN1 and LN2)
generated alternating patterns of activity as described above.
We located each PN within a 2D plane with x and y coordinates
January 27, 2011 ª2011 Elsevier Inc. 377
0.1 0.2 0.3 0.4 0.5 0.6 0.7 0.8 0.9 10
5
10
15
20
25
30
35
coherence
num
ber
of c
ycle
s
with PNswithout PNs
C
500 ms
20 n
euro
ns
B
wit
ho
ut
PNs
wit
h P
Ns
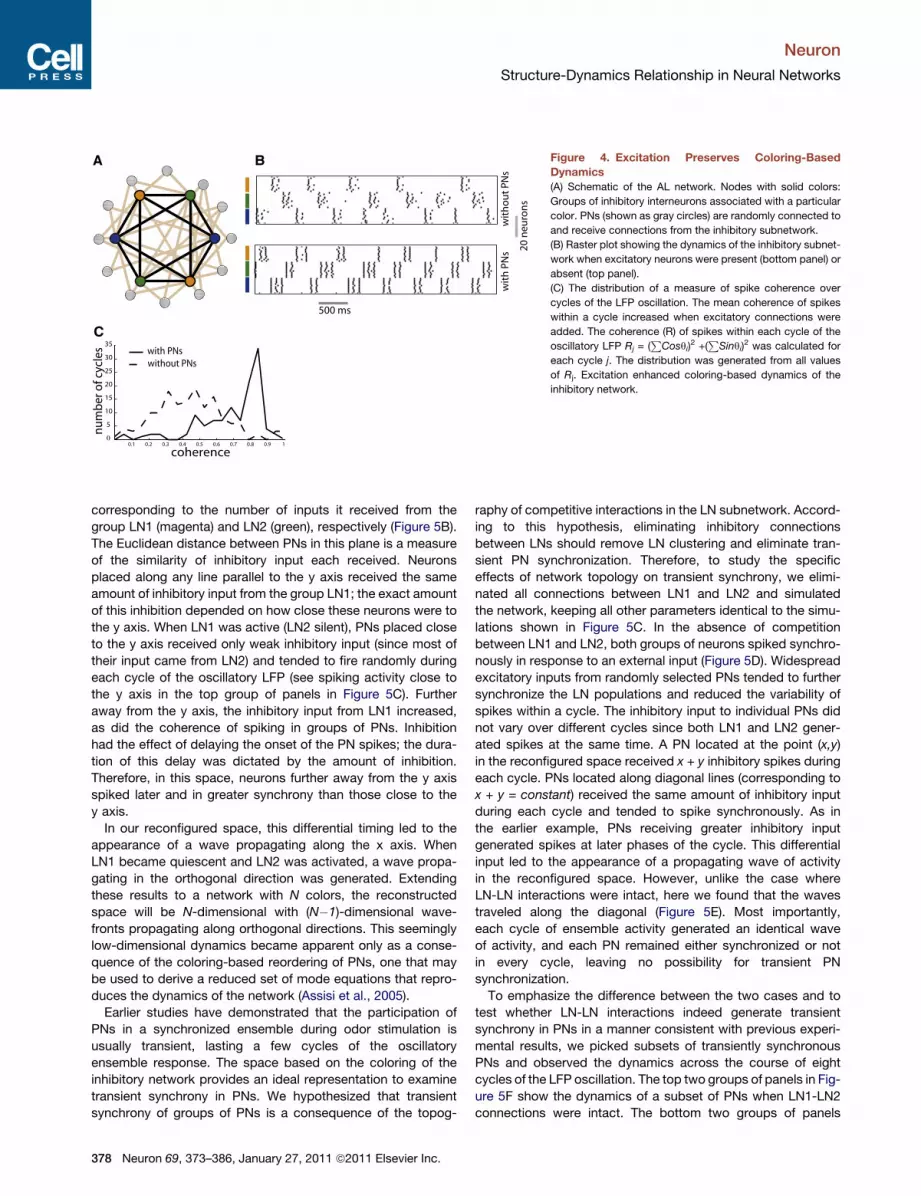
A Figure 4. Excitation Preserves Coloring-Based
Dynamics
(A) Schematic of the AL network. Nodes with solid colors:
Groups of inhibitory interneurons associated with a particular
color. PNs (shown as gray circles) are randomly connected to
and receive connections from the inhibitory subnetwork.
(B) Raster plot showing the dynamics of the inhibitory subnet-
work when excitatory neurons were present (bottom panel) or
absent (top panel).
(C) The distribution of a measure of spike coherence over
cycles of the LFP oscillation. The mean coherence of spikes
within a cycle increased when excitatory connections were
added. The coherence (R) of spikes within each cycle of the
oscillatory LFP Rj = (P
Cosqi)2 +(
PSinqi)
2 was calculated for
each cycle j. The distribution was generated from all values
of Rj. Excitation enhanced coloring-based dynamics of the
inhibitory network.
Neuron
Structure-Dynamics Relationship in Neural Networks
corresponding to the number of inputs it received from the
group LN1 (magenta) and LN2 (green), respectively (Figure 5B).
The Euclidean distance between PNs in this plane is a measure
of the similarity of inhibitory input each received. Neurons
placed along any line parallel to the y axis received the same
amount of inhibitory input from the group LN1; the exact amount
of this inhibition depended on how close these neurons were to
the y axis. When LN1 was active (LN2 silent), PNs placed close
to the y axis received only weak inhibitory input (since most of
their input came from LN2) and tended to fire randomly during
each cycle of the oscillatory LFP (see spiking activity close to
the y axis in the top group of panels in Figure 5C). Further
away from the y axis, the inhibitory input from LN1 increased,
as did the coherence of spiking in groups of PNs. Inhibition
had the effect of delaying the onset of the PN spikes; the dura-
tion of this delay was dictated by the amount of inhibition.
Therefore, in this space, neurons further away from the y axis
spiked later and in greater synchrony than those close to the
y axis.
In our reconfigured space, this differential timing led to the
appearance of a wave propagating along the x axis. When
LN1 became quiescent and LN2 was activated, a wave propa-
gating in the orthogonal direction was generated. Extending
these results to a network with N colors, the reconstructed
space will be N-dimensional with (N�1)-dimensional wave-
fronts propagating along orthogonal directions. This seemingly
low-dimensional dynamics became apparent only as a conse-
quence of the coloring-based reordering of PNs, one that may
be used to derive a reduced set of mode equations that repro-
duces the dynamics of the network (Assisi et al., 2005).
Earlier studies have demonstrated that the participation of
PNs in a synchronized ensemble during odor stimulation is
usually transient, lasting a few cycles of the oscillatory
ensemble response. The space based on the coloring of the
inhibitory network provides an ideal representation to examine
transient synchrony in PNs. We hypothesized that transient
synchrony of groups of PNs is a consequence of the topog-
378 Neuron 69, 373–386, January 27, 2011 ª2011 Elsevier Inc.
raphy of competitive interactions in the LN subnetwork. Accord-
ing to this hypothesis, eliminating inhibitory connections
between LNs should remove LN clustering and eliminate tran-
sient PN synchronization. Therefore, to study the specific
effects of network topology on transient synchrony, we elimi-
nated all connections between LN1 and LN2 and simulated
the network, keeping all other parameters identical to the simu-
lations shown in Figure 5C. In the absence of competition
between LN1 and LN2, both groups of neurons spiked synchro-
nously in response to an external input (Figure 5D). Widespread
excitatory inputs from randomly selected PNs tended to further
synchronize the LN populations and reduced the variability of
spikes within a cycle. The inhibitory input to individual PNs did
not vary over different cycles since both LN1 and LN2 gener-
ated spikes at the same time. A PN located at the point (x,y)
in the reconfigured space received x + y inhibitory spikes during
each cycle. PNs located along diagonal lines (corresponding to
x + y = constant) received the same amount of inhibitory input
during each cycle and tended to spike synchronously. As in
the earlier example, PNs receiving greater inhibitory input
generated spikes at later phases of the cycle. This differential
input led to the appearance of a propagating wave of activity
in the reconfigured space. However, unlike the case where
LN-LN interactions were intact, here we found that the waves
traveled along the diagonal (Figure 5E). Most importantly,
each cycle of ensemble activity generated an identical wave
of activity, and each PN remained either synchronized or not
in every cycle, leaving no possibility for transient PN
synchronization.
To emphasize the difference between the two cases and to
test whether LN-LN interactions indeed generate transient
synchrony in PNs in a manner consistent with previous experi-
mental results, we picked subsets of transiently synchronous
PNs and observed the dynamics across the course of eight
cycles of the LFP oscillation. The top two groups of panels in Fig-
ure 5F show the dynamics of a subset of PNs when LN1-LN2
connections were intact. The bottom two groups of panels

Neuron
Structure-Dynamics Relationship in Neural Networks
show the dynamics of the same subset of PNs when LN1-LN2
connections were removed. We picked two different subsets
of neurons. In the topmost panel PNs that received exactly seven
inputs from LN1 were selected. These PNs were synchronized
only when the group LN1 was activated (last four cycles).
When LN2 was activated (first four cycles), the phase at which
these neurons spiked was distributed across the oscillatory
cycle. In the next group of panels (second row), we picked
neurons that received exactly seven inputs from LN2 and fired
in synchrony only when LN2 was active (first four cycles). This
population desynchronized during subsequent cycles. In
contrast, when LN1-LN2 connections were removed (Figure 5F,
bottom two rows), each group of PNs was either synchronized
(third row) or not (fourth row) across all cycles of the oscillatory
LFP. A comparison with recordings made in vivo from the locust
AL (Laurent et al., 1996) shows that this form of constant
synchrony is not observed in a majority of PNs, suggesting that
the topography of LN-LN interactions plays a crucial role in tran-
sient synchrony in the AL.
These traveling waves of activity are evident only in the
abstract space defined by the coloring of the inhibitory network.
Our incomplete knowledge of the detailed connectivity of the
locust’s LN subnetwork and limitations on sizes of the sets of
simultaneously recorded neurons preclude the possibility of
directly observing these waves in recordings made in vivo
from the locust AL. However, knowledge of the existence of
these relatively low-dimensional patterns of activity provides
a general way to understand how information propagates
from the AL to their followers, the KCs of the MB. KCs are sensi-
tive to coincidence in presynaptic input (Perez-Orive et al.,
2002, 2004). If KCs receive identical synchronized input from
PNs during every cycle of the oscillation, the same set of KCs
will be activated repeatedly over the duration of the odor
presentation. However, experimental recordings show that
KCs generate very few spikes (�2–3) during the odor presenta-
tion. The absence of LN-LN interactions would therefore
compromise the temporal sparseness of the odor representa-
tion by KCs.
Application to Realistic Networks of NeuronsA number of algorithms to color random graphs exist. However,
except under special circumstances, these algorithms do not
guarantee that the coloring will always be minimal or that all
possible colorings of the networkwill be obtained in a reasonable
length of time (Kubale, 2004). Given the complexity of the graph
coloring problem, using random graphs as our starting point
would have been impractical. Hence we chose to construct
graphs in which neurons associated with a particular color
were connected to all neurons associated with other colors.
How well do these constructed networks emulate the dynamics
of realistic random networks? In the networks constructed thus
far, each neuron received an equal number of connections as
all other neurons that were affiliated with the same color. In real-
istic random networks this assumption is not true in general.
Variability in input across LNs can cause the dynamics of the
network to deviate from the dynamics predicted by the networks
we simulated. To test the effect of perturbations to the network
structure, we simulated a network consisting of two groups of
fifteen neurons that were reciprocally connected to each other
(Figure 6A). Neurons in each group extended 1–14 connections
to neurons belonging to the other group. This is the widest
possible variability in connections that can be achieved in this
network while ensuring that no neuron is isolated from the
network. In addition a network constructed in this manner is
also guaranteed to possess a chromatic number two. First, we
reordered the rows and columns of the adjacency matrix of the
network such that neurons affiliated with the same color were
grouped together (Figure 6B). As in previous examples, the adja-
cency matrix of the random network consisted of diagonal
blocks of zeros. However, all elements of the off-diagonal blocks
are not uniformly one. Does this variability in the number of
connections per neuron alter the coloring-based dynamics of
the network? We found that, while variability in the network
connectivity perturbed the network dynamics, the coloring struc-
ture still clearly defined the neuron responses (Figure 6C, top
panel).
Furthermore, we could reduce the effect of these perturba-
tions by incorporating connections between excitatory PNs
and the inhibitory LNs (Figure 6C, bottom panel) that would
mimic a typical biological network like the insect AL consisting
of interacting excitatory and inhibitory neurons. The back-and-
forth interaction between excitation and inhibition tends to
promote synchrony in both sets of neurons. Each group of LNs
spiked in alternation, thus respecting the coloring of the network
as a constraint. (Borgers and Kopell, 2003) have also demon-
strated that increasing the strength of excitatory to inhibitory
neurons tends to mitigate the influence of heterogeneity due to
random connectivity. This synchronization mechanism has
been demonstrated in the olfactory bulb of rats where the inter-
action between mitral cells and granule cells results in the emer-
gence of rapid synchrony in the network (Schoppa, 2006) (but
see Galan et al., 2006).
In previous simulations we had introduced small variations in
the excitability of individual neurons to ensure that the solutions
would be robust to parameter noise. We also added a small
amplitude noise term (approximately 10% of the amplitude of
the DC input to each neuron) (see Supplemental Information
for details). The role of the coloring of the network on the
dynamics remained robustly evident in spite of these variations.
However we kept a key parameter, the timescale of adaptation,
constant across all neurons. Adaptation allows the LNs to switch
from a spiking to a quiescent state (Figure 1). The timescale
of adaptation affects the duration that a neuron spends in each
state. In a realistic network the timescale of adaptation may
be distributed across the population of LNs. We sought to
determine if such variation can compromise the coloring-based
dynamics of the inhibitory subnetwork. We simulated the
dynamics of the network with broad variability consistent
with the timescale of the Ca2+-dependent potassium current.
A parameter tx was added to the timescale tm of the Ca2+-
dependent potassium current (see equation for m in the section
Ca2+-dependent potassium current IKCa in the Supplemental
Information). Its value tx was picked from a uniform random
distribution with values extending from�0.02 to 0.01 (Figure 6D).
The range of this distribution was adjusted to generate a
large variation in the oscillatory switching frequency of two
Neuron 69, 373–386, January 27, 2011 ª2011 Elsevier Inc. 379

mV-50 40
10
1
1010
1
10
1
10
1
10
1
0.0 ms 2.4 ms 3.6 ms 6.0 ms 7.2 ms
10
1
10 10
1
10
1
10
1
10
1
0.0 ms 3.2 ms 4.8 ms 7.2 ms 8.6 ms
C
LN1
is a
ctiv
eLN
2 is
act
ive
(1,1) (2,1) (3,1) (9,10) (10,10)
B LN1 LN2
PNs
−5
−4
−3
−2
−1
0 0..5 1.0 1..5 2.0 2..5 3.0
0
1
Δφ
inh
ibit
ory
inp
ut
(nA
)
(radians)
A
0.0ms
10
1
10
3.6ms
10
1
6.4ms
10
1
8.8ms
10
1500 ms
1
1
10
D E
F
Figure 5. Coloring-Based Reordering Generates Low-Dimensional Dynamics
(A) Distribution of spikes within each cycle of the oscillatory LFP as a function of presynaptic inhibitory input. For each interval of presynaptic inhibitory input
(0.5 nA intervals), neurons that produce spikes within a particular cycle were picked and the deviation of spike phase from the mean was calculated. The spread
of the distribution narrowed as the inhibitory input increased (from top to bottom).
(B) PNs were ordered in a 2D space depending on the number of inputs each received from a particular group of inhibitory neurons.
(C) PN spikes form traveling waves in the reconstructed space. Top panel shows the activity when LN1 is active and themiddle panel shows the activity when LN2
is active.
(D) Raster plot of LN activity when interactions between LN1 and LN2 were removed.
(E) The pattern of wave propagation by PNs in the network with no lateral inhibition between LNs.
Neuron
Structure-Dynamics Relationship in Neural Networks
380 Neuron 69, 373–386, January 27, 2011 ª2011 Elsevier Inc.
0 0 0 0 0 0 0 0 0 0 0 0 0 0 0 0 0 0 0 0 0 0 0 0 0 0 0 0 0 0 0 0 0 0 0 0 0 0 1 0 1 1 1 1 0 0 0 0 0 0 0 0 0 0 0 0 0 0 0 1 1 0 1 1 1 1 0 0 0 0 0 0 0 0 0 0 0 0 0 0 0 0 0 0 1 0 1 0 0 0 0 0 0 0 0 0 0 0 0 0 0 0 0 1 1 1 1 1 1 1 0 0 0 0 0 0 0 0 0 0 0 0 0 0 0 0 1 0 1 1 1 1 0 0 0 0 0 0 0 0 0 0 0 0 0 0 0 0 0 0 0 0 0 0 0 0 0 0 0 0 0 0 0 0 0 0 0 0 0 0 0 0 0 0 0 0 0 0 0 0 0 0 0 0 0 0 0 0 0 0 0 0 0 0 1 0 0 0 0 0 0 0 0 0 0 0 0 0 0 0 0 0 0 1 1 1 1 1 1 1 0 0 0 0 0 0 0 0 0 0 0 0 0 0 0 0 0 0 1 0 1 0 0 0 0 0 0 0 0 0 0 0 0 0 0 0 0 0 1 0 1 0 1 1 0 0 0 0 0 0 0 0 0 0 0 0 0 0 0 1 1 1 1 1 1 1 0 0 0 0 0 0 0 0 0 0 0 0 0 0 0 1 1 0 1 1 1 1 0 0 0 0 0 0 0 0 0 0 0 0 0 0 0 0 0 0 1 0 1 1 0 0 1 0 1 0 0 0 0 1 0 0 1 1 0 0 0 0 0 0 0 0 0 1 1 0 1 1 0 0 0 1 0 1 1 1 0 0 0 0 0 0 0 0 0 0 0 0 1 0 0 0 0 1 0 0 1 0 0 0 0 0 0 0 0 0 0 1 1 1 1 1 0 0 1 1 1 1 1 1 1 0 0 0 0 0 0 0 0 1 1 0 1 1 0 0 0 1 0 0 1 1 0 0 0 0 0 0 0 0 0 1 1 1 1 1 0 0 0 1 1 1 1 1 1 0 0 0 0 0 0 0 0 1 1 0 1 1 0 0 0 1 0 1 1 1 1 0 0 0 0 0 0 0 0 0 0 0 0 0 0 0 0 1 0 0 0 0 0 0 0 0 0 0 0 0 0 1 1 1 1 1 0 0 0 1 0 1 1 1 1 0 0 0 0 0 0 0 0 0 0 0 1 0 0 0 0 1 0 0 0 0 0 0 0 0 0 0 0 0 1 1 1 1 1 1 0 0 1 1 1 1 1 1 1 0 0 0 0 0 0 0 1 1 1 1 1 1 0 1 1 1 1 1 1 1 1 0 0 0 0 0 0 0 0 0 1 0 1 1 0 0 0 1 0 0 1 1 0 0 0 0 0 0 0 0 0 0 0 0 1 0 0 0 0 1 0 0 1 1 0 0 0 0 0 0 0 0 1 1 1 1 1 1 1 1 1 1 1 1 1 1 1 0 0 0 0 0 0 0
0 0 0 1 1 0 0 1 0 1 0 1 1 0 0 1 0 1 0 1 1 1 0 1 0 1 0 1 1 0 0 1 0 1 1 1 1 1 1 1 0 1 0 1 1 1 0 1 0 0 0 0 0 0 0 1 0 0 0 0 1 0 0 1 0 0 0 1 1 0 0 1 1 1 1 1 1 1 1 1 0 0 0 1 1 0 0 1 0 1 0 1 1 0 0 1 0 1 0 1 1 1 1 1 0 1 0 1 1 1 1 1 0 1 0 1 1 0 0 1 0 0 0 0 0 0 0 0 0 0 0 0 0 0 0 0 0 0 0 0 0 0 0 0 0 0 0 0 0 0 0 0 0 0 0 0 0 0 0 0 0 0 0 0 0 0 0 0 0 0 0 0 0 0 0 0 0 0 0 0 0 0 0 0 0 0 0 0 0 0 0 0 0 0 0 0 0 0 0 0 0 0 0 0 0 0 0 0 0 0 0 0 0 0 0 0 0 0 0 0 0 0 0 0 0 0 0 0 0 0 0 0 0 0 0 0 0 0 0 0
15 N
euro
ns
500 ms
A B
C
010010100111000000010100010011
100001010000101100001001100000
000101011000011111001000000100
001010100101000000010010010001
100101011000001111001000000100
011010100101000000010110011011
100101011000100011001001100100
011010100101000000010110011001
001010100001000000100010010010
100101010000111111001001100100
100000000000110111001001100100
100101011000111011000000000100
010000100111000000010000010011
001000000111000000000100010001
011010000101000000110010011011
011010000110000000100110001011
001010100111000000000010011011
001010100111000000010010011010
000000001000001100001001100100
100101010000101001001001000000
011010100110000000110100000000
100001010000010100001000100100
000101011000001111000001100100
010000100110000000110010011011
010000100110000000100110011001
100101011000111011000001100100
000001010000001111000001100000
001010100111000000100110010011
100001001000101111000001000100
100101010000111110000001100100
40m
V
500ms−0.02 0.01
1
2
3
4
5
6
10 n
euro
ns
1000ms
D E
F
τx
nu
mb
er o
f neu
ron
s
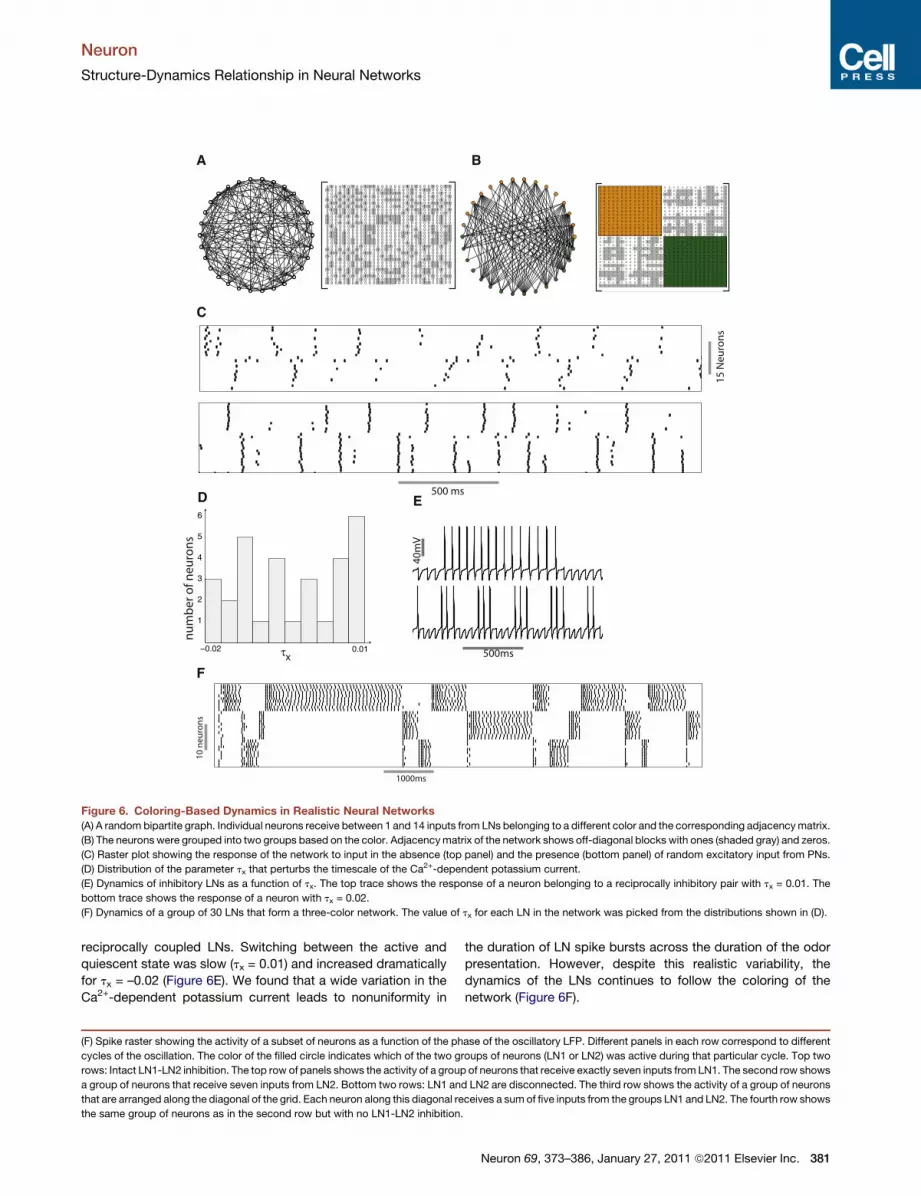
Figure 6. Coloring-Based Dynamics in Realistic Neural Networks
(A) A random bipartite graph. Individual neurons receive between 1 and 14 inputs from LNs belonging to a different color and the corresponding adjacencymatrix.
(B) The neurons were grouped into two groups based on the color. Adjacencymatrix of the network shows off-diagonal blocks with ones (shaded gray) and zeros.
(C) Raster plot showing the response of the network to input in the absence (top panel) and the presence (bottom panel) of random excitatory input from PNs.
(D) Distribution of the parameter tx that perturbs the timescale of the Ca2+-dependent potassium current.
(E) Dynamics of inhibitory LNs as a function of tx. The top trace shows the response of a neuron belonging to a reciprocally inhibitory pair with tx = 0.01. The
bottom trace shows the response of a neuron with tx = 0.02.
(F) Dynamics of a group of 30 LNs that form a three-color network. The value of tx for each LN in the network was picked from the distributions shown in (D).
Neuron
Structure-Dynamics Relationship in Neural Networks
reciprocally coupled LNs. Switching between the active and
quiescent state was slow (tx = 0.01) and increased dramatically
for tx = –0.02 (Figure 6E). We found that a wide variation in the
Ca2+-dependent potassium current leads to nonuniformity in
(F) Spike raster showing the activity of a subset of neurons as a function of the ph
cycles of the oscillation. The color of the filled circle indicates which of the two g
rows: Intact LN1-LN2 inhibition. The top row of panels shows the activity of a group
a group of neurons that receive seven inputs from LN2. Bottom two rows: LN1 an
that are arranged along the diagonal of the grid. Each neuron along this diagonal re
the same group of neurons as in the second row but with no LN1-LN2 inhibition
the duration of LN spike bursts across the duration of the odor
presentation. However, despite this realistic variability, the
dynamics of the LNs continues to follow the coloring of the
network (Figure 6F).
ase of the oscillatory LFP. Different panels in each row correspond to different
roups of neurons (LN1 or LN2) was active during that particular cycle. Top two
of neurons that receive exactly seven inputs from LN1. The second row shows
d LN2 are disconnected. The third row shows the activity of a group of neurons
ceives a sum of five inputs from the groups LN1 and LN2. The fourth row shows
.
Neuron 69, 373–386, January 27, 2011 ª2011 Elsevier Inc. 381

Neuron
Structure-Dynamics Relationship in Neural Networks
DISCUSSION
Transient Synchrony and InhibitionIn this study we demonstrated that inhibition mediated by a local
interneuron population may generate transiently synchronous
spiking in evolving populations of excitatory neurons, and we
constructed a space in which this transient synchrony could be
easily identified. In agreement with our previous studies (Bazhe-
nov et al., 2001a, 2001b), our model predicts that during odor
stimulation the sequence of transitions between synchronized
and desynchronized states (with respect to the oscillatory
mean activity) of the excitatory neurons in the insect AL should
match the sequence of alternations between active and quies-
cent states in the inhibitory subnetwork that shapes the timing
of spikes in excitatory cells. In this new study we further estab-
lished a link between a structural characteristic of every inhibi-
tory network, its colorings, and the resulting collective dynamics
of that network and, as a result, the information flow through this
system. We showed that lateral inhibition between local inter-
neurons is required to transiently synchronize PNs in the AL;
and that graph coloring provides a useful description of compet-
itive lateral inhibition between inhibitory interneurons that also
allows a low-dimensional description of the complex AL network
dynamics in amanner consistent with the perspective of follower
neurons. Our approach allowed us to rank excitatory neurons not
by their distance in physical space, but rather, by the strength of
inhibition they receive, thus providing a natural way to group
together the neurons that act together (fire in synchrony)—
a necessary condition to activate postsynaptic neurons given
a coincidence detection type of information coding.
The neurons receiving the strongest inhibitory input also spike
with the largest delay; therefore, in the reconfigured space, this
differential timing led to the appearance of waves of activity
propagating in directions defined by dynamics of inhibitory inter-
neurons. In the absence of this reordering, the dynamics of PNs
would appear as randomly occurring patterns of activity corre-
lated with the dynamics of LNs. The traveling wave-like
dynamics only observed in the reconfigured space represents
a dramatic reduction in the dimensionality of the description.
This simplified description of the network’s behavior provides
a foundation for generating more tractable models of spatiotem-
poral patterning in coupled networks of excitatory and inhibitory
neurons.
Locust AL DynamicsIn the locust AL, a typical PN displays a rather simple pattern of
transitions between synchronized and desynchronized states
while responding to an odor (Laurent and Davidowitz, 1994; Lau-
rent et al., 1996). This pattern of synchrony must be driven by
contiguous bursts of spikes in inhibitory interneurons alternating
with silence. Such activity is in fact typical of inhibitory inter-
neuron firing patterns during odor stimulation. Recordings
made in vivo from the locust AL demonstrate that inhibitory inter-
neurons tend to show rather simple activity patterns consisting
of a single burst of activity during a particular odor presentation.
Many inhibitory interneurons display tonic activation over the
entire duration of odor stimulation in contrast to others that
remain hyperpolarized (Figure 7A, bottom). Such patterns of
382 Neuron 69, 373–386, January 27, 2011 ª2011 Elsevier Inc.
activity are well described by our model (Figure 7A, top). In this
example, for the network with nonunique coloring, one group
of LN neurons remained active during the entire duration of stim-
ulation while the two other groups of neurons switched between
active and silent states.
Why do LNs in the AL exhibit only a subset of the broad reper-
toire of patterns that the networks simulated here are capable of
generating? The formalism we developed in our manuscript
points us toward several possibilities. These dynamical patterns
are likely to result from an intrinsic asymmetry within the AL
subnetwork that gets activated in response to a specific odor.
If only a subset of neurons receives strong activation during
a particular odor stimulation, these neurons will dominate the
response. Asymmetries in coupling strength can also result in
the predominance of one group that would prevent switching
between groups to occur. In addition, if the number of colors is
large, a trajectory may never recur during odor stimulation.
Hence the same LN may not generate multiple bursts of spikes.
We have shown that fast GABAergic inhibition mediated by
GABAA receptors transiently synchronizes PN activity over
a few cycles of the ensemble oscillatory response. A second
important form of inhibition found in the AL mediated by slow
GABAB receptors acts over a timescale in the range of hundreds
of milliseconds (Wilson and Laurent, 2005). Experiments (Ma-
cLeod and Laurent, 1996) and models (Bazhenov et al., 2001a)
have demonstrated that this type of interaction leads to lengthy
epochs of timewherein individual PNs are hyperpolarized and do
not spike at all. Picrotoxin applied to the AL spares patterning
caused by slow inhibition while abolishing oscillatory synchroni-
zation on a fast timescale. The timescales separating the two
forms of inhibition differ by approximately an order of magnitude.
To explore how network structure leads to transient synchrony,
a key dynamical variable involved in fine discrimination in the
olfactory system (Stopfer et al., 1997), we focus here on fast inhi-
bition while minimizing the effects of slow inhibition in the model.
The repertoire of patterns generated by the inhibitory subnet-
work in the locust AL forms a subset of the full range of patterns
that can be generated by the networks simulated here. Feedfor-
ward architecture and coincidence detection mechanisms like
those illustrated here are not unique to the insect olfactory
system. Presynaptic synchrony allows feedforward thalamic
input caused by sensory stimulation in various modalities to be
faithfully transmitted to the cortex in spite of the inability of indi-
vidual thalamocortical projections to drive cortical activity (Bruno
and Sakmann, 2006). Similarities in structure have also occa-
sioned comparisons between the function of the olfactory bulb
and the thalamus (Kay and Sherman, 2007). In the mammalian
spinal cord it has been shown that genetically silencing certain
groups of neurons can have profound behavioral consequences
(Gosgnach et al., 2006; Lanuza et al., 2004; Zhang et al., 2008).
For example, silencing excitatory V3a interneurons compro-
mises the rhythmicity and stability of locomotor outputs (Zhang
et al., 2008). The coherence of spiking activity in our model
network was also similarly compromised by the removal of excit-
atory interactions.
The sequence of bursts generated by the networks con-
structed here qualitatively resembles the kind of dynamics
seen in networks that exhibit a form of competition termed

40m
V
−60
−40
−20
0
20
40
dT
t = 68ms t = 72ms t = 76ms t = 80ms
C
in v
ivo
1s
A
B
dx
inputs from LN1 (x)inp
uts
fro
m L
N2
(y)
(xi,yi)
PN m
emb
ran
e p
ote
nti
al
PN index
LN1 LN2
(4,1) (6,3) (7,4) (8,5) (9,6) (10,7)(5,2)
(3,6) (4,7) (5,8) (6,9) (7,10)(2,5)(1,4)
sim
ula
tio
ns
Figure 7. Model Simulations and Construction of
a Segmental Swimming Pattern Generator
(A) Example traces of local inhibitory interneuron activity
from model simulations (top two traces) and in vivo intra-
cellular recordings from locust local interneurons (bottom
two traces). In the left and central panel, traces show
responses of a single LN to multiple presentations of the
same odor. In the rightmost panel, the two traces show
the responses of different neurons to the same odor. The
green lines below the traces show the duration over which
the stimulus was presented.
(B and C) Coloring-basedmodel of a segmental swimming
pattern generator. Two groups of neurons along off-diag-
onal lines in the plot (B, top panels) were picked. The
perpendicular distance between them is marked dx.
Waves of activity generated by the network (B, top panels)
were seen in these subgroups of neurons (B, bottom
panels). The time difference between the peaks of the trav-
eling waves is marked dT. The subnetwork that generates
traveling waves along these lines of neurons is shown in
(C). Each neuron is marked by two coordinates (xi,yi).
The x coordinate shows the number of inhibitory inputs
received by a given PN from the group LN1. The y coordi-
nate shows the number of inhibitory inputs received from
the group LN2.
Neuron
Structure-Dynamics Relationship in Neural Networks
winnerless competition (WLC) (Rabinovich et al., 2001). These
patterns of activity have been hypothesized to be heteroclinic
orbits that connect saddle fixed points or saddle limit cycles in
the system’s state space (Rabinovich, 2006). The stability of
these sequences and the capacity of the network to generate
sequential patterns have been analyzed in detail. However, the
relationship between the structure of the network and the result-
ing patterns of activation are not yet known. Ahn et al. (2010)
derive a computationally efficient and analytically tractable
discrete time dynamical system that accurately replicates the
dynamics of a more complex Hodgkin-Huxley-type neuronal
network. The discrete time model predicts which group of
neurons will spike next given that a specific group of neurons
spiked during a previous epoch. The constraints imposed on
the model include the Ca2+ concentration in the cells, the ionic
conductances, the neuronal thresholds, and the number of
inputs each neuron receives from a group that spiked in
a preceding epoch. Our approach is complementary to that of
Ahn et al. (2010).We use a global descriptor of the network struc-
ture (its colorings) to deduce the set of all possible solutions of
Neuron 69, 37
the system (a solution is valid only if it respects
the coloring of the network). Additional
constraints such as the directed connections
between neurons, asymmetries in intrinsic
parameters, and Ca2+ concentration in the cell
(Ahn et al., 2010) can make specific solutions
stable.
Constructing Networks that GeneratePrespecified Temporal Relationshipsamong ComponentsIn this study we used the insect olfactory system
to derive a structure-dynamics relationship in
neuronal networks. This relationship can be tested in other
well-charted networks such as central pattern generators
(Marder and Calabrese, 1996). In the stomatogastric ganglion,
where reciprocal inhibition is ubiquitous and implicated in gener-
ating periodic patterns (Getting, 1989; Marder and Calabrese,
1996), alternating bursts are produced by a number of different
mechanisms. The pyloric rhythm of the crustacean stomatogas-
tric ganglion is generated by a combination of intrinsic bursting
and postinhibitory rebound in the same circuit, producing
a rhythmic pattern of alternation that is consistent with the
coloring of the underlying network (see Figures 4A and 4B in
Marder and Bucher, 2007). The AB neuron entrains the PD
neuron via gap junction coupling. These neurons together inhibit
the other neurons in the network. The alternating triphasic
pattern is generated by groups of neurons that are associated
with different colors. The output from central pattern generators
drives motor neurons that synapse onto muscles to generate
rhythmic patterns of movement. The temporal ordering of
different components of the system is crucial to the generation
of appropriate movement. Using an inhibitory network as
3–386, January 27, 2011 ª2011 Elsevier Inc. 383

Neuron
Structure-Dynamics Relationship in Neural Networks
a nucleus, we can generate spiking in excitatory neurons that
obeys specific temporal relationships.
In Figures 7B and 7C we illustrate the construction of
a segmental swimming pattern generator using a subnetwork
extracted from the network defined in Figure 5. We chose two
groups of inhibitory interneurons (identified as LN1 and LN2 in
Figure 7C) that were reciprocally coupled to each other. The re-
sulting dynamics of the inhibitory network produced an alter-
nating pattern of bursts that provided input to a set of PNs.
The number of inputs that each PN received from a particular
group is marked (x,y) where x is the number of inputs from group
LN1 and y is the number of inputs from group LN2. Our goal was
to choose two sets of PNs, each of which could generate a trav-
eling wave, one following the other with a time difference dT. The
dynamics of this subnetwork could emulate the swimming
pattern in an organism like the lamprey that swims forward as
a wave of muscular activity courses along two sides of its length
(Wallen and Williams, 1984). Inhibitory input from LNs tends to
delay the onset of the following PN spike. The extent of the delay
in the PN spikes increased with increasing values of inhibition.
A traveling wave could, therefore, be generated by choosing
PNs that received an increasing number of inputs from either
one of the inhibitory neuron groups, LN1 or LN2, and arranging
them linearly (see Figure 7B). When the inhibitory group LN1
was active, a wave of excitatory activity propagated parallel to
the y axis (top panels of Figure 7B). The peak of this wave inter-
sected with the lines of neurons marked by the filled circles and
generated traveling waves of activity in each of these two groups
(Figure 7B, bottom panels) (see Supplemental Information and
Movie S1 available online). The dT between these two waves
(Figure 7B, bottom panel) increased with increasing the perpen-
dicular distance (marked dx in Figure 7B, top panel) between the
two groups of excitatory neurons. Thus, by extracting these
groups of excitatory neurons and adjusting the dx between
them, we could generate a pair of traveling waves with a desired
dT between them. The leading and the following wave could be
switched by switching the active inhibitory group from LN1 to
LN2. This can be achieved by the autonomous dynamics of the
inhibitory network or by applying an external perturbation. Other
phase relationships between neurons can be obtained by
choosing appropriate groups of PNs from the 2D ordering of
excitatory neurons shown in Figure 5 and Figure 7B (top panels).
More complex phase relationships can be generated by using
a larger number of colors and multiple colorings of the network.
This simple example illustrates that knowing the coloring struc-
ture of the inhibitory network, we can predict the dynamics of
the excitatory principal cells despite the complex and seemingly
random synaptic structure between excitatory and inhibitory
neurons.
ConclusionThe ultimate goal of exploring sensory network dynamics is to
understand the spatiotemporal activity of excitatory principal
neurons since this activity is what typically drives the responses
of neurons at downstream levels of processing. In many circuits
where information processing is based on the detection of coin-
cidence between spikes (for example, between insect the AL and
MB), a property important for understanding information flow is
384 Neuron 69, 373–386, January 27, 2011 ª2011 Elsevier Inc.
synchrony between excitatory neurons. In this study we showed
a relationship between the connectivity structure of the inhibitory
subnetwork and synchronization properties of excitatory
neurons. Furthermore, we used the coloring of the inhibitory
subnetwork as a tool to construct a space in which the distance
between excitatory neurons is defined not by the length of the
synaptic path connecting those neurons, but by the similarity
of the inhibitory input they receive. This description optimally
matches the perspective of the downstream neurons looking
for synchrony in ensembles of presynaptic cells and, therefore,
allows a low-dimensional description of seemingly complex
high-dimensional network activity.
EXPERIMENTAL PROCEDURES
Network Model
Individual PNs and LNs were modeled by a single compartment that included
voltage- and Ca2+-dependent currents described by Hodgkin-Huxley kinetics
(Hodgkin and Huxley, 1990). Since the biophysical makeup of insects’ olfac-
tory neurons has not yet been completely characterized, we used parameters
drawn fromwell-described cell types while following two guiding principles: (1)
minimize the number of currents and their complexity in each cell type; (2)
generate realistic (though simplified) firing profiles. Our LN model includes
a transient Ca2+ current (Laurent et al., 1993), a calcium-dependent potassium
current (Sloper and Powell, 1979), a fast potassium current (Traub and Miles,
1991), and a potassium leak current, thus producing profiles devoid of Na+
action potentials but capable of Ca2+-dependent active responses, as
observed experimentally (Laurent and Davidowitz, 1994). Our PN model
includes a fast sodium current (Traub and Miles, 1991), a fast potassium
current (Traub and Miles, 1991), a transient K+ A-current (Huguenard et al.,
1991) and a potassium leak current IKL. Equations for all intrinsic currents in
locust LNs and PNs can be found in Bazhenov et al. (2001a, 2001b).
In the model, isolated PNs displayed overshooting Na+ spikes at a fixed
frequency throughout DC stimulation. Local neurons, in contrast, fired low-
amplitude Ca2+ spikes and displayed spike frequency adaptation caused by
Ca2+-dependent potassium currents. Fast GABA (LN-PN and LN-LN connec-
tions) and nicotinic cholinergic synaptic currents (PN-LN connections) were
modeled by first order activation schemes. The equations for all intrinsic and
synaptic currents are given in the Supplemental Information and are based
on Bazhenov et al. (2001a, 2001b).
In Figures 1–3we simulated isolated networks of LNs. The population of LNs
and the specific connectivity are shown in the respective figures. In the
following figures we simulated networks including both excitatory PNs and
inhibitory LNs. Drawing from the basic anatomy of the insect AL, the PNs
received inputs from LNs and projected random connections back to LNs.
The AL model simulated in Figure 5 included 20 LNs and 100 PNs.
LN-PN connectionswere determined such that each PN occupied a position
on the grid in Figure 5. We tested the network with a larger population of LNs
and PNs with random connectivity to obtain the same result (propagating
waves of activity in the 2D plane). With random connections the population
of PNs simulated did not cover all points on the 2D grid. However, the waves
of activity could be clearly seen despite gaps in the grid of PNs. We also simu-
lated a network with chromatic number three and were able to generate 2D
wave-fronts that propagated along orthogonal directions.
Electrophysiology
Intracellular recordings (Figures 1 and 7) weremade from local neurons in adult
locusts (Schistocerca americana) obtained from a crowded colony. Animals
were immobilized and stabilized with wax with one antenna secured. The brain
was exposed, desheathed, and superfused with locust saline as previously
described (Laurent and Davidowitz, 1994). Intracellular electrodes were sharp
glass micropipettes (O.D = 1.0 mm, Warner Instruments, 80–230 MU,
Sutter P97 horizontal puller, Sutter Instruments) and were filled with 0.5 M
potassium acetate and 5% neurobiotin (Vector Laboratories). Data were digi-
tally acquired (5 kHz sampling rate, LabView software and PCI-6602 DAQ and

Neuron
Structure-Dynamics Relationship in Neural Networks
PCI- MIO-16E-4 hardware, National Instruments), stored on a PC hard drive,
and analyzed off-line using MATLAB (The MathWorks, Inc.). Odor puffs were
dilute grass volatiles delivered as described in Brown et al. (2005).
SUPPLEMENTAL INFORMATION
Supplemental Information for this article includes one figure, one movie, and
supplemental text and can be found with this article online at doi:10.1016/
j.neuron.2010.12.019.
ACKNOWLEDGMENTS
This work was supported by grants from the US National Institute of Deafness
and other Communication Disorders (C.A. and M.B.), the US National Institute
of Neurological Disorders and Stroke (M.B.) and a USNational Institute of Child
Health and Human Development intramural award (M.S.). The authors would
like to thank Professor Gilles Laurent for many stimulating discussions and
insightful suggestions and Stacey Brown Daffron for providing examples of
recordings from LNs made in vivo. C.A and M.B. would also like to thank
Professor Terrence Sejnowski and members of the Computational Neurobi-
ology Laboratory at the Salk Institute for Biological Studies for hospitality
and a number of fruitful discussions. C.A. would like to thank Dr. Suhita Nad-
karni for discussions and comments about the manuscript.
Accepted: November 15, 2010
Published: January 26, 2011
REFERENCES
Abeles, M., Bergman, H., Margalit, E., and Vaadia, E. (1993). Spatiotemporal
firing patterns in the frontal cortex of behaving monkeys. J. Neurophysiol.
70, 1629–1638.
Ahn, S., Smith, B.H., Borisyuk, A., and Terman, D. (2010). Analyzing neuronal
networks using discrete-time dynamics. Physica D 239, 515–528.
Appel, K., and Haken, W. (1977). Solution of the four color map problem.
Scientific American 237, 108–121.
Appel, K., and Haken, W. (1989). Every Planar Map Is Four Colorable.
Contemporary Mathematics, Volume 98 (Providence, Rhode Island:
American Mathematical Society).
Arenas, A., Diaz-Guilera, A., Kurths, J., Moreno, Y., and Zhou, C. (2008).
Synchronization in complex networks. Physics Reports 469, 93–153.
Assisi, C.G., Jirsa, V.K., and Kelso, J.A.S. (2005). Synchrony and clustering in
networks with global coupling and parameter dispersion. Phys. Rev. Lett. 94,
018106.
Assisi, C.G., Stopfer, M., Laurent, G., and Bazhenov, M. (2007). Adaptive
regulation of sparseness by feedforward inhibition. Nat. Neurosci. 10,
1176–1184.
Bazhenov, M., and Stopfer, M. (2010). Forward and back: motifs of inhibition in
olfactory processing. Neuron 67, 357–358.
Bazhenov, M., Stopfer, M., Rabinovich, M., Abarbanel, H.D.I., Sejnowski, T.J.,
and Laurent, G. (2001a). Model of cellular and network mechanisms for odor-
evoked temporal patterning in the locust antennal lobe. Neuron 30, 569–581.
Bazhenov, M., Stopfer, M., Rabinovich, M., Huerta, R., Abarbanel, H.D.,
Sejnowski, T.J., and Laurent, G. (2001b). Model of transient oscillatory
synchronization in the locust antennal lobe. Neuron 30, 553–567.
Bazhenov, M., Stopfer, M., Sejnowski, T.J., and Laurent, G. (2005). Fast odor
learning improves reliability of odor responses in the locust antennal lobe.
Neuron 46, 483–492.
Benda, J., and Herz, A.V.M. (2003). A universal model for spike-frequency
adaptation. Neural Comput. 15, 2523–2564.
Biggs, N.L., Lloyd, E.K., and Wilson, R.J. (1986). Graph Theory 1736–1936
(New York: Oxford University Press).
Boccaletti, S., Latora, V., Moreno, Y., Chavez, M., and Hwang, D. (2006).
Complex networks: Structure and dynamics. Physics Reports 424, 175–308.
Boguna, M., Krioukov, D., and Claffy, K.C. (2009). Navigability of complex
networks. Nature Physics 5, 74–80.
Bonifazi, P., Goldin, M., Picardo, M.A., Jorquera, I., Cattani, A., Bianconi, G.,
Represa, A., Ben-Ari, Y., and Cossart, R. (2009). GABAergic hub neurons
orchestrate synchrony in developing hippocampal networks. Science 326,
1419–1424.
Borgers, C., and Kopell, N. (2003). Synchronization in networks of excitatory
and inhibitory neurons with sparse, random connectivity. Neural Comput.
15, 509–538.
Borgers, C., and Kopell, N. (2005). Effects of noisy drive on rhythms in
networks of excitatory and inhibitory neurons. Neural Comput. 17, 557–608.
Borgers, C., Epstein, S., and Kopell, N.J. (2005). Background gamma rhyth-
micity and attention in cortical local circuits: a computational study. Proc.
Natl. Acad. Sci. USA 102, 7002–7007.
Bouyer, J.J., Montaron, M.F., Vahnee, J.M., Albert, M.P., and Rougeul, A.
(1987). Anatomical localization of cortical beta rhythms in cat. Neuroscience
22, 863–869.
Brown, S.L., Joseph, J., and Stopfer, M. (2005). Encoding a temporally struc-
tured stimulus with a temporally structured neural representation. Nat.
Neurosci. 8, 1568–1576.
Bruno, R.M., and Sakmann, B. (2006). Cortex is driven by weak but synchro-
nously active thalamocortical synapses. Science 312, 1622–1627.
Buzsaki, G., and Chrobak, J.J. (1995). Temporal structure in spatially orga-
nized neuronal ensembles: a role for interneuronal networks. Curr. Opin.
Neurobiol. 5, 504–510.
Cheng, S., and Frank, L.M. (2008). New experiences enhance coordinated
neural activity in the hippocampus. Neuron 57, 303–313.
Diesmann, M., Gewaltig, M.O., and Aertsen, A. (1999). Stable propagation of
synchronous spiking in cortical neural networks. Nature 402, 529–533.
Ermentrout, B. (1992). Complex dynamics in winner–take–all neural nets with
slow inhibition. Neural Networks 5, 415–431.
Galan, R.F., Fourcaud-Trocme, N., Ermentrout, G.B., and Urban, N.N. (2006).
Correlation-induced synchronization of oscillations in olfactory bulb neurons.
J. Neurosci. 26, 3646–3655.
Getting, P.A. (1989). Emerging principles governing the operation of neural
networks. Annu. Rev. Neurosci. 12, 185–204.
Gosgnach, S., Lanuza, G.M., Butt, S.J., Saueressig, H., Zhang, Y., Velasquez,
T., Riethmacher, D., Callaway, E.M., Kiehn, O., and Goulding, M. (2006). V1
spinal neurons regulate the speed of vertebrate locomotor outputs. Nature
440, 215–219.
Gray, C.M., and Singer, W. (1989). Stimulus-specific neuronal oscillations in
orientation columns of cat visual cortex. Proc. Natl. Acad. Sci. USA 86,
1698–1702.
Grillner, S. (2003). The motor infrastructure: from ion channels to neuronal
networks. Nat. Rev. Neurosci. 4, 573–586.
Herzberg, A.M., and Murty, M.R. (2007). Sudoku squares and chromatic poly-
nomials. Notices of the AMS 54, 708–717.
Hodgkin, A.L., andHuxley, A.F. (1990). A quantitative description of membrane
current and its application to conduction and excitation in nerve. 1952
[classical article]. Bull. Math. Biol. 52, 25–71; discussion 25–23.
Huguenard, J.R., Coulter, D.A., and Prince, D.A. (1991). A fast transient potas-
sium current in thalamic relay neurons: kinetics of activation and inactivation.
J. Neurophysiol. 66, 1304–1315.
Ito, I., Bazhenov, M., Ong, R.C., Raman, B., and Stopfer, M. (2009). Frequency
transitions in odor-evoked neural oscillations. Neuron 64, 692–706.
Joliot, M., Ribary, U., and Llinas, R. (1994). Human oscillatory brain activity
near 40 Hz coexists with cognitive temporal binding. Proc. Natl. Acad. Sci.
USA 91, 11748–11751.
Kay, L.M., and Sherman, S.M. (2007). An argument for an olfactory thalamus.
Trends Neurosci. 30, 47–53.
Neuron 69, 373–386, January 27, 2011 ª2011 Elsevier Inc. 385

Neuron
Structure-Dynamics Relationship in Neural Networks
Kleinfeld, D., Raccuia-Behling, F., and Chiel, H.J. (1990). Circuits constructed
from identified Aplysia neurons exhibit multiple patterns of persistent activity.
Biophys. J. 57, 697–715.
Kubale, M. (2004). Graph Colorings, Contemporary Mathematics, Volume 352
(Providence, Rhode Island: American Mathematical Society).
Lanuza, G.M., Gosgnach, S., Pierani, A., Jessell, T.M., and Goulding, M.
(2004). Genetic identification of spinal interneurons that coordinate left-right
locomotor activity necessary for walking movements. Neuron 42, 375–386.
Laurent, G. (2002). Olfactory network dynamics and the coding of multidimen-
sional signals. Nat. Rev. Neurosci. 3, 884–895.
Laurent, G., and Davidowitz, H. (1994). Encoding of olfactory information with
oscillating neural assemblies. Science 265, 1872–1875.
Laurent, G., Seymour-Laurent, K.J., and Johnson, K. (1993). Dendritic excit-
ability and a voltage-gated calcium current in locust nonspiking local interneu-
rons. J. Neurophysiol. 69, 1484–1498.
Laurent, G., Wehr, M., and Davidowitz, H. (1996). Temporal representations of
odors in an olfactory network. J. Neurosci. 16, 3837–3847.
Leitch, B., and Laurent, G. (1996). GABAergic synapses in the antennal lobe
and mushroom body of the locust olfactory system. J. Comp. Neurol. 372,
487–514.
Llinas, R., and Ribary, U. (1993). Coherent 40-Hz oscillation characterizes
dream state in humans. Proc. Natl. Acad. Sci. USA 90, 2078–2081.
Lu, J., Sherman, D., Devor, M., and Saper, C.B. (2006). A putative flip-flop
switch for control of REM sleep. Nature 441, 589–594.
MacLeod, K., and Laurent, G. (1996). Distinct mechanisms for synchronization
and temporal patterning of odor-encoding neural assemblies. Science 274,
976–979.
Marder, E., and Bucher, D. (2007). Understanding circuit dynamics using the
stomatogastric nervous system of lobsters and crabs. Annu. Rev. Physiol.
69, 291–316.
Marder, E., and Calabrese, R.L. (1996). Principles of rhythmic motor pattern
generation. Physiol. Rev. 76, 687–717.
McCormick, D.A. (2004). Membrane properties and neurotransmitter actions.
In The Synaptic Organization of the Brain, G.M. Shepherd, ed. (New York:
Oxford University Press).
Milo, R., Shen-Orr, S., Itzkovitz, S., Kashtan, N., Chklovskii, D., and Alon, U.
(2002). Network motifs: simple building blocks of complex networks.
Science 298, 824–827.
Pecora, L.M., and Carroll, T.L. (1998). Master stability functions for synchro-
nized coupled systems. Phys. Rev. Lett. 80, 2109–2112.
Perez-Orive, J., Mazor, O., Turner, G.C., andCassenaer, S. (2002). Oscillations
and sparsening of odor representations in the mushroom body. Science 297,
359–365.
Perez-Orive, J., Bazhenov, M., and Laurent, G. (2004). Intrinsic and circuit
properties favor coincidence detection for decoding oscillatory input.
J. Neurosci. 24, 6037–6047.
Pouille, F., and Scanziani, M. (2001). Enforcement of temporal fidelity in pyra-
midal cells by somatic feed-forward inhibition. Science 293, 1159–1163.
386 Neuron 69, 373–386, January 27, 2011 ª2011 Elsevier Inc.
Rabinovich, M.I. (2006). Dynamical principles in Neuroscience. Rev. Mod.
Phys. 78, 1213–1265.
Rabinovich, M., Volkovskii, A., Lecanda, P., Huerta, R., Abarbanel, H.D., and
Laurent, G. (2001). Dynamical encoding by networks of competing neuron
groups: winnerless competition. Phys. Rev. Lett. 87, 068102.
Raman, B., Joseph, J., Tang, J., and Stopfer, M. (2010). Temporally diverse
firing patterns in olfactory receptor neurons underlie spatiotemporal neural
codes for odors. J. Neurosci. 30, 1994–2006.
Riehle, A., Grun, S., Diesmann, M., and Aertsen, A. (1997). Spike synchroniza-
tion and rate modulation differentially involved in motor cortical function.
Science 278, 1950–1953.
Schoppa, N.E. (2006). Synchronization of olfactory bulb mitral cells by
precisely timed inhibitory inputs. Neuron 49, 271–283.
Shilnikov, A., Gordon, R., and Belykh, I. (2008). Polyrhythmic synchronization
in bursting network motifs. Chaos 18, 037120.
Shpiro, A., Curtu, R., Rinzel, J., and Rubin, N. (2007). Dynamical characteris-
tics common to neuronal competition models. J. Neurophysiol. 97, 462–473.
Singer, W., and Gray, C.M. (1995). Visual feature integration and the temporal
correlation hypothesis. Annu. Rev. Neurosci. 18, 555–586.
Sloper, J.J., and Powell, T.P. (1979). Ultrastructural features of the sensori-
motor cortex of the primate. Philos. Trans. R. Soc. Lond. B Biol. Sci. 285,
124–139.
Sporns, O., and Kotter, R. (2004). Motifs in brain networks. PLoS Biol. 2, e369.
Sporns, O., Chialvo, D.R., Kaiser, M., and Hilgetag, C.C. (2004). Organization,
development and function of complex brain networks. Trends Cogn. Sci. 8,
418–425.
Stopfer, M., Bhagavan, S., Smith, B.H., and Laurent, G. (1997). Impaired odour
discrimination on desynchronization of odour-encoding neural assemblies.
Nature 390, 70–74.
Tanaka, N.K., Ito, K., and Stopfer, M. (2009). Odor-evoked neural oscillations
in Drosophila are mediated by widely branching interneurons. J. Neurosci. 29,
8595–8603.
Traub, R.D., and Miles, R. (1991). Neuronal Networks of the Hippocampus
(Cambridge: Cambridge University Press).
Van Vreeswijk, C., Abbott, L.F., and Ermentrout, G.B. (1994). When inhibition
not excitation synchronizes neural firing. J. Comput. Neurosci. 1, 313–321.
Wallen, P., and Williams, T.L. (1984). Fictive locomotion in the lamprey spinal
cord in vitro compared with swimming in the intact and spinal animal.
J. Physiol. 347, 225–239.
Wehr, M., and Laurent, G. (1996). Odour encoding by temporal sequences of
firing in oscillating neural assemblies. Nature 384, 162–166.
Wilson, R.I., and Laurent, G. (2005). Role of GABAergic inhibition in shaping
odor-evoked spatiotemporal patterns in the Drosophila antennal lobe.
J. Neurosci. 25, 9069–9079.
Zhang, Y., Narayan, S., Geiman, E., Lanuza, G.M., Velasquez, T., Shanks, B.,
Akay, T., Dyck, J., Pearson, K., Gosgnach, S., et al. (2008). V3 spinal neurons
establish a robust and balanced locomotor rhythm during walking. Neuron 60,
84–96.