Gene Expression Profiling of Hairy Cell Leukemia Reveals a Phenotype Related to Memory B Cells with...
10
The Journal of Experimental Medicine J. Exp. Med. The Rockefeller University Press • 0022-1007/2004/01/59/10 $8.00 Volume 199, Number 1, January 5, 2004 59–68 http://www.jem.org/cgi/doi/10.1084/jem.20031175 59 Gene Expression Profiling of Hairy Cell Leukemia Reveals a Phenotype Related to Memory B Cells with Altered Expression of Chemokine and Adhesion Receptors Katia Basso, 1 Arcangelo Liso, 5 Enrico Tiacci, 5 Roberta Benedetti, 5 Alessandro Pulsoni, 6 Robin Foa, 6 Francesco Di Raimondo, 7 Achille Ambrosetti, 8 Andrea Califano, 4 Ulf Klein, 1 Riccardo Dalla Favera, 1,2,3 and Brunangelo Falini 5 1 Institute for Cancer Genetics, 2 Department of Pathology, and 3 Department of Genetics and Development and 4 Center for Computational Biology and Biochemistry, Columbia University, New York, NY 10032 5 Institute of Hematology, University of Perugia, Perugia 06100, Italy 6 Institute of Hematology, University “La Sapienza,” Rome 00100, Italy 7 Institute of Hematology, University of Catania, Catania 95100, Italy 8 Institute of Hematology, Policlinico “Borgo Roma,”Verona 37100, Italy Abstract Hairy cell leukemia (HCL) is a chronic B cell malignancy characterized by the diffuse infiltration of bone marrow and spleen by cells displaying a typical “hairy” morphology. However, the nature of the HCL phenotype and its relationship to normal B cells and to other lymphoma subtypes remains unclear. Using gene expression profiling, we show here that HCL displays a homogeneous pattern of gene expression, which is clearly distinct from that of other B cell non-Hodgkin lymphomas. Comparison with the gene expression profiles of purified normal B cell subpopulations, including germinal center (GC), pre-GC (naive), and post-GC (memory) B cells, shows that HCL cells are more related to memory cells, suggesting a derivation from this B cell population. Notably, when compared with memory cells, HCL cells displayed a remark- able conservation in proliferation, apoptosis, and DNA metabolism programs, whereas they appeared significantly altered in the expression of genes controlling cell adhesion and response to chemokines. Finally, these analyses have identified several genes that are specifically expressed in HCL and whose expression was confirmed at the protein level by immunocytochemical analysis of primary HCL cases. These results have biological implications relevant to the pathogenesis of this malignancy as well as clinical implications for its diagnosis and therapy. Key words: DNA microarray • germinal center • hairy morphology • marrow fibrosis • homing Introduction Hairy cell leukemia (HCL) is a chronic B cell lymphopro- liferative disorder characterized by marked splenomegaly, pancytopenia, a low number of circulating tumor cells and diffuse infiltration of the spleen, liver, and BM by tumor cells exhibiting a hairy appearance and a phenotype different from that of other B cell lymphomas (1–4). HCL is highly sensitive to interferon and purine analogue–based treat- ments (5). Despite the important advances in diagnosis and therapy, the origin, biological characteristics, and patho- genesis of HCL remain obscure. Phenotypically, HCL cells do not clearly resemble any of the known B cell subpopulation. In the majority of the cases, leukemic hairy cells bear somatic point mutations in their Ig variable genes (6, 7), indicating that the cell giving rise to HCL has transited through the germinal center (GC) of peripheral lymphoid organs, where it has been exposed to the hypermutation mechanism (8). Because HCL does not display significant ongoing somatic hypermutation (6, 7), it has been suggested an origin from a post-GC B cell A. Liso and E. Tiacci contributed equally to this work. The online version of this article includes supplemental material. Address correspondence to Brunangelo Falini, Institute of Hematology, Policlinico Monteluce, Perugia 06100, Italy. Phone: 39-075-5731103; Fax: 39-075-5783834; email: [email protected] Abbreviations used in this paper: APAAP, alkaline phosphatase antialkaline phosphatase; B-CLL, B cell chronic lymphocytic leukemia; B-NHL, B cell non-Hodgkin lymphoma; BL, Burkitt lymphoma; DLBCL, diffuse large B cell lymphoma; FL, follicular lymphoma; Gas, growth arrest– specific; GC, germinal center; HCL, hairy cell leukemia; LCL, lympho- blastic cell line; MCL, mantle cell lymphoma; MM, multiple myeloma.
Transcript of Gene Expression Profiling of Hairy Cell Leukemia Reveals a Phenotype Related to Memory B Cells with...

The
Journ
al o
f Exp
erim
enta
l M
edic
ine
J. Exp. Med.
The Rockefeller University Press • 0022-1007/2004/01/59/10 $8.00Volume 199, Number 1, January 5, 2004 59–68http://www.jem.org/cgi/doi/10.1084/jem.20031175
59
Gene Expression Profiling of Hairy Cell Leukemia Reveals a Phenotype Related to Memory B Cells with Altered Expression of Chemokine and Adhesion Receptors
Katia Basso,
1
Arcangelo Liso,
5
Enrico Tiacci,
5
Roberta Benedetti,
5
Alessandro Pulsoni,
6
Robin Foa,
6
Francesco Di Raimondo,
7
Achille Ambrosetti,
8
Andrea Califano,
4
Ulf Klein,
1
Riccardo Dalla Favera,
1,2,3
and Brunangelo Falini
5
1
Institute for Cancer Genetics,
2
Department of Pathology, and
3
Department of Genetics and Development and
4
Center for Computational Biology and Biochemistry, Columbia University, New York, NY 10032
5
Institute of Hematology, University of Perugia, Perugia 06100, Italy
6
Institute of Hematology, University “La Sapienza,” Rome 00100, Italy
7
Institute of Hematology, University of Catania, Catania 95100, Italy
8
Institute of Hematology, Policlinico “Borgo Roma,” Verona 37100, Italy
Abstract
Hairy cell leukemia (HCL) is a chronic B cell malignancy characterized by the diffuse infiltrationof bone marrow and spleen by cells displaying a typical “hairy” morphology. However, thenature of the HCL phenotype and its relationship to normal B cells and to other lymphomasubtypes remains unclear. Using gene expression profiling, we show here that HCL displays ahomogeneous pattern of gene expression, which is clearly distinct from that of other B cellnon-Hodgkin lymphomas. Comparison with the gene expression profiles of purified normalB cell subpopulations, including germinal center (GC), pre-GC (naive), and post-GC (memory)B cells, shows that HCL cells are more related to memory cells, suggesting a derivation fromthis B cell population. Notably, when compared with memory cells, HCL cells displayed a remark-able conservation in proliferation, apoptosis, and DNA metabolism programs, whereas theyappeared significantly altered in the expression of genes controlling cell adhesion and responseto chemokines. Finally, these analyses have identified several genes that are specifically expressedin HCL and whose expression was confirmed at the protein level by immunocytochemicalanalysis of primary HCL cases. These results have biological implications relevant to thepathogenesis of this malignancy as well as clinical implications for its diagnosis and therapy.
Key words: DNA microarray • germinal center • hairy morphology • marrow fibrosis • homing
Introduction
Hairy cell leukemia (HCL) is a chronic B cell lymphopro-liferative disorder characterized by marked splenomegaly,pancytopenia, a low number of circulating tumor cells anddiffuse infiltration of the spleen, liver, and BM by tumorcells exhibiting a hairy appearance and a phenotype differentfrom that of other B cell lymphomas (1–4). HCL is highlysensitive to interferon and purine analogue–based treat-ments (5). Despite the important advances in diagnosis andtherapy, the origin, biological characteristics, and patho-genesis of HCL remain obscure.
Phenotypically, HCL cells do not clearly resemble any ofthe known B cell subpopulation. In the majority of thecases, leukemic hairy cells bear somatic point mutations intheir Ig variable genes (6, 7), indicating that the cell givingrise to HCL has transited through the germinal center (GC)of peripheral lymphoid organs, where it has been exposedto the hypermutation mechanism (8). Because HCL doesnot display significant ongoing somatic hypermutation (6,7), it has been suggested an origin from a post-GC B cell
A. Liso and E. Tiacci contributed equally to this work.The online version of this article includes supplemental material.Address correspondence to Brunangelo Falini, Institute of Hematology,
Policlinico Monteluce, Perugia 06100, Italy. Phone: 39-075-5731103;Fax: 39-075-5783834; email: [email protected]
Abbreviations used in this paper:
APAAP, alkaline phosphatase antialkalinephosphatase; B-CLL, B cell chronic lymphocytic leukemia; B-NHL, Bcell non-Hodgkin lymphoma; BL, Burkitt lymphoma; DLBCL, diffuselarge B cell lymphoma; FL, follicular lymphoma; Gas, growth arrest–specific; GC, germinal center; HCL, hairy cell leukemia; LCL, lympho-blastic cell line; MCL, mantle cell lymphoma; MM, multiple myeloma.

Gene Expression Profiling of Hairy Cell Leukemia
60
(4). However, an origin within the GC has also been sug-gested based on the recent finding that a fraction of casesexpress multiple and clonally related surface Ig isotypes (6,7), which is consistent with an arrest at the stage of Ig iso-type switch (7), which occurs in the GC. Thus, the cell oforigin of HCL is still uncertain.
The uncertainty about the phenotype of HCL is furtherfueled by several distinctive properties of these cells, in-cluding their consistent association with marrow fibrosis,their hairy appearance, their selective homing to BM, liver,and spleen with sparing of lymph nodes, and their highsensitivity to treatment with interferons and purine ana-logues (1–4). These features suggest that the transformedphenotype of HCL may involve a complex dependencefrom the microenvironment.
To gain insight into these issues, we investigated thegene expression profiles of 14 cases of HCL using oli-gonucleotide-based DNA microarrays representative of
�
12,000 genes. The gene expression profiles of HCLhave been comparatively analyzed with normal and neo-plastic B cell populations to: (a) identify the cell of originof HCL; (b) determine its relationship with other B cellmalignancies; (c) dissect the cellular programs that are al-tered as a consequence of malignant transformation; and(d) identify genes and proteins that are specifically ex-pressed in HCL.
Materials and Methods
Cases.
The clinico-pathological features of the 14 HCL casesincluded in this work are shown in Table SI (available at http://www.jem.org/cgi/content/full/jem.20031175/DC1). At thetime of sample collection, 10 cases were at diagnosis, whereas theothers had been treated previously with different modalities (Ta-ble SI), but were off therapy for at least 1 yr (supplemental Mate-rials and Methods contains a detailed description of sample collec-tion and preparation, available at http://www.jem.org/cgi/content/full/jem.20031175/DC1).
This analysis also included 10 cases of B cell chronic lympho-cytic leukemia (B-CLL) and 36 cases of B cell non-Hodgkin lym-phomas (B-NHLs), which were classified as follicular lymphomas(FLs;
n
�
6), mantle cell lymphomas (MCLs;
n
�
10), Burkittlymphomas (BLs;
n
�
4), and diffuse large B cell lymphomas(DLBCLs;
n
�
16), according to the REAL and WHO classifica-tions (3, 4). Except for MCLs, the detailed characterization ofthese cases has been reported previously (9). The normal B cellsubpopulations have also been described previously (9, 10). In-formed consent was obtained from the patients, and the tissuecollection was approved by each institutional ethical committee.The analyses include the gene expression profiles of four cell linesderived from multiple myeloma (MM; F24, JJN3, SKMM1, andSKMM2) and five lymphoblastoid cell lines (CB33, RD, Daikiki,IARC304, and NC6).
Generation of Gene Expression Profiles.
Total RNA was ex-tracted using the TRIzol reagent (Invitrogen and Life Technolo-gies) and purified using the Rneasy Kit (QIAGEN). Double-strandcDNA was generated from 5
�
g of total RNA using the Super-Script Choice System (Invitrogen and Life Technologies) and apoly-dT oligonucleotide that contains a T7 RNA polymerase ini-tiation site. The double-strand cDNA was used as template to gen-
erate biotinylated cRNA by in vitro transcription using MEGA-script T7 High Yield Transcription kit (Ambion), biotin-11-CTP,and biotin-11-UTP (PerkinElmer). The biotinylated cRNA waspurified by the Rneasy Kit (QIAGEN) and fragmented accordingto the Affymetrix, Inc. protocol. 15
�
g of fragmented cRNA washybridized to U95Av2 microarrays (Affymetrix, Inc.). The geneexpression values were determined by software using the GlobalScaling option (Microarray Suite 5.0; Affymetrix, Inc.).
Gene Expression Profiles Analysis.
The dendrogram (see Fig.1) is generated using a hierarchical clustering algorithm based onthe average-linkage method (11, 12). Only genes displaying a
�
twofold average change in the expression level across the wholepanel were chosen to generate the hierarchical clustering. The ex-pression value of each selected gene is normalized to have a zeromean value and unit standard deviation. The distance betweentwo individual samples is calculated by Pearson distance with thenormalized expression values. To perform the supervised gene ex-pression analysis (see Fig. 2 A–D, and Figs. 3 and 4), we used theGenes@Work software platform, which is a gene expression anal-ysis tool based on the pattern discovery algorithm structural pat-tern localization analysis by sequential histograms (13, 14). Theclassification method used for the cell type classification (see Fig. 2E) was described previously (9). In brief, the classifier is a scoringfunction based on the values of a set of genes (gene cluster), whichare differentially expressed in two sets of cell types and, thus, canbe used for cell type classification. The higher the score, the morelikely it is that a cell type is related to the phenotype set.
Immunohistological Stainings.
Immunophenotype was estab-lished in all cases at the time of diagnosis (Table SII, available athttp://www.jem.org/cgi/content/full/jem.20031175/DC1), andin most cases, immunohistochemical studies were directly per-formed on paraffin sections from BM trephines (supplementalMaterials and Methods contains detailed information about theantibodies used).
Immunostaining procedures were performed as follows. BMparaffin sections (3–5
�
m thick) were attached on silane-coatedslides, dewaxed in three changes of xylene, dehydrated, and sub-jected to microwaving (750 W
�
three cycles of 5 min each) us-ing 1 mmol/L EDTA buffer, pH 8.0, as antigen retrieval solution(15). After microwave heating, sections were allowed to cool atroom temperature for
�
20 min, washed with Tris-buffered sa-line, and stained by the three-stage alkaline phosphatase antialka-line phosphatase (APAAP) technique (for mAb detection) or thefour-stage APAAP procedure (for polyclonal antibody detection;references 15, 16). The same staining procedures were used to la-bel acetone-fixed frozen sections from undecalcified BM tre-phines or cytospin preparations (17, 18). In all instances, slideswere counterstained for 5 min in hematoxylin and mounted inKaiser’s glycerol gelatin.
Online Supplemental Material.
Online supplemental materialis available at http://www.jem.org/cgi/content/full/jem.20031175/DC1. The supplemental material provides: (a) description of theclinical and pathological features of the HCL cases (Table S1); (b)immunophenotypical characterization of the cases (Table S2); and(c) details on sample processing, isolation of CD19
+
B cells fromperipheral blood and antibodies used (supplemental Materials andMethods).
Results
Gene expression profile analysis was performed on 16HCL samples obtained from 14 different patients: 11 sam-
Basso et al.
61
ples were represented by BM biopsies, 3 by CD19
�
puri-fied B cells from peripheral blood (for 2 samples, the BMbiopsy is also depicted), and 2 by mononucleated cells fromperipheral blood and spleen, respectively. 6 cases of FL, 4cases of BL, 16 cases of DLBCL, 10 cases of MCL, and 10cases of B-CLL were included in the comparative analysis.
HCL Cells Display a Homogeneous Phenotype Distinct fromOther B Cell Malignancies.
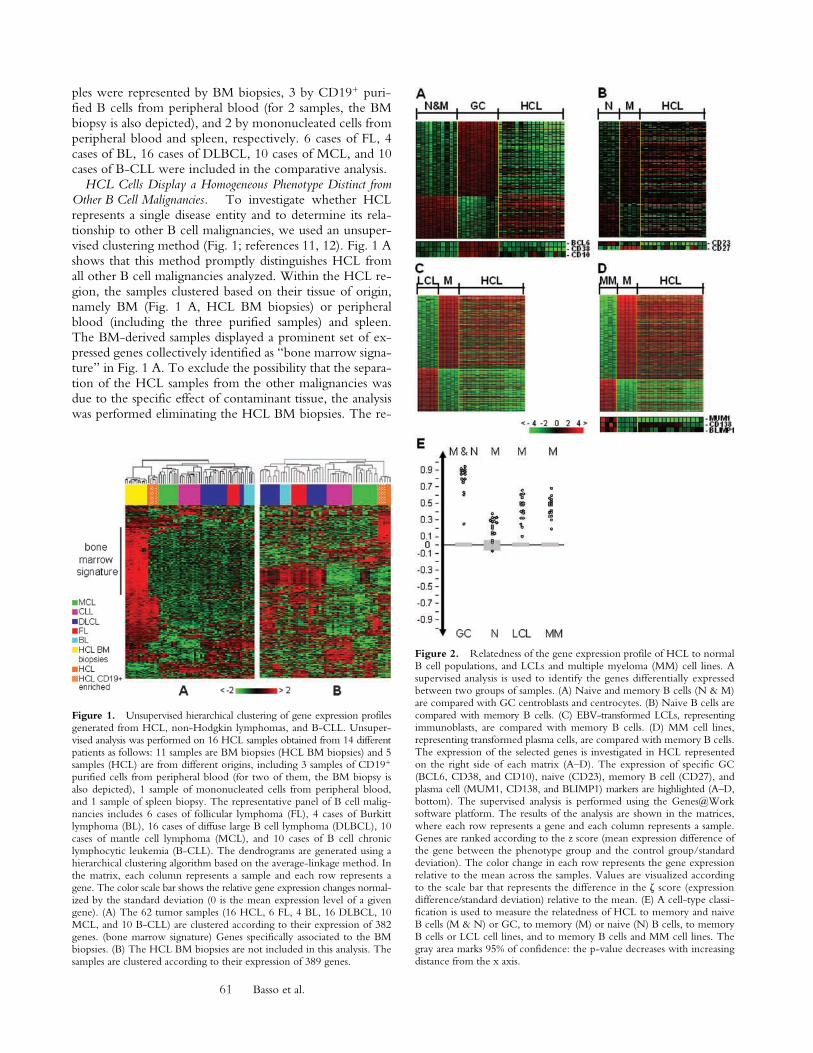
To investigate whether HCLrepresents a single disease entity and to determine its rela-tionship to other B cell malignancies, we used an unsuper-vised clustering method (Fig. 1; references 11, 12). Fig. 1 Ashows that this method promptly distinguishes HCL fromall other B cell malignancies analyzed. Within the HCL re-gion, the samples clustered based on their tissue of origin,namely BM (Fig. 1 A, HCL BM biopsies) or peripheralblood (including the three purified samples) and spleen.The BM-derived samples displayed a prominent set of ex-pressed genes collectively identified as “bone marrow signa-ture” in Fig. 1 A. To exclude the possibility that the separa-tion of the HCL samples from the other malignancies wasdue to the specific effect of contaminant tissue, the analysiswas performed eliminating the HCL BM biopsies. The re-
Figure 1. Unsupervised hierarchical clustering of gene expression profilesgenerated from HCL, non-Hodgkin lymphomas, and B-CLL. Unsuper-vised analysis was performed on 16 HCL samples obtained from 14 differentpatients as follows: 11 samples are BM biopsies (HCL BM biopsies) and 5samples (HCL) are from different origins, including 3 samples of CD19�
purified cells from peripheral blood (for two of them, the BM biopsy isalso depicted), 1 sample of mononucleated cells from peripheral blood,and 1 sample of spleen biopsy. The representative panel of B cell malig-nancies includes 6 cases of follicular lymphoma (FL), 4 cases of Burkittlymphoma (BL), 16 cases of diffuse large B cell lymphoma (DLBCL), 10cases of mantle cell lymphoma (MCL), and 10 cases of B cell chroniclymphocytic leukemia (B-CLL). The dendrograms are generated using ahierarchical clustering algorithm based on the average-linkage method. Inthe matrix, each column represents a sample and each row represents agene. The color scale bar shows the relative gene expression changes normal-ized by the standard deviation (0 is the mean expression level of a givengene). (A) The 62 tumor samples (16 HCL, 6 FL, 4 BL, 16 DLBCL, 10MCL, and 10 B-CLL) are clustered according to their expression of 382genes. (bone marrow signature) Genes specifically associated to the BMbiopsies. (B) The HCL BM biopsies are not included in this analysis. Thesamples are clustered according to their expression of 389 genes.
Figure 2. Relatedness of the gene expression profile of HCL to normalB cell populations, and LCLs and multiple myeloma (MM) cell lines. Asupervised analysis is used to identify the genes differentially expressedbetween two groups of samples. (A) Naive and memory B cells (N & M)are compared with GC centroblasts and centrocytes. (B) Naive B cells arecompared with memory B cells. (C) EBV-transformed LCLs, representingimmunoblasts, are compared with memory B cells. (D) MM cell lines,representing transformed plasma cells, are compared with memory B cells.The expression of the selected genes is investigated in HCL representedon the right side of each matrix (A–D). The expression of specific GC(BCL6, CD38, and CD10), naive (CD23), memory B cell (CD27), andplasma cell (MUM1, CD138, and BLIMP1) markers are highlighted (A–D,bottom). The supervised analysis is performed using the Genes@Worksoftware platform. The results of the analysis are shown in the matrices,where each row represents a gene and each column represents a sample.Genes are ranked according to the z score (mean expression difference ofthe gene between the phenotype group and the control group/standarddeviation). The color change in each row represents the gene expressionrelative to the mean across the samples. Values are visualized accordingto the scale bar that represents the difference in the � score (expressiondifference�standard deviation) relative to the mean. (E) A cell-type classi-fication is used to measure the relatedness of HCL to memory and naiveB cells (M & N) or GC, to memory (M) or naive (N) B cells, to memoryB cells or LCL cell lines, and to memory B cells and MM cell lines. Thegray area marks 95% of confidence: the p-value decreases with increasingdistance from the x axis.

Gene Expression Profiling of Hairy Cell Leukemia
62
sults (Fig. 1 B) show that the remaining HCL samples, in-cluding the purified samples, still cluster separately from theother B cell malignancies, indicating that the BM signatureis not responsible for the separate HCL clustering. Thenon-HCL B cell malignancies are split into two mainbranches according to their GC (FL, BL, and DLBCL) ornon-GC (MCL and B-CLL) origin (9, 19, 20). Overall, thisanalysis demonstrates that HCL cases show a largely homo-geneous phenotype distinct from other B cell malignancies.
HCL Are Related to Memory B Cells.
To investigatethe cellular derivation, we analyzed HCL for the expressionof genes that are differentially expressed in purified tonsillarGC (centroblasts and centrocytes) versus non-GC B cells(naive and memory), as defined previously by supervisedanalysis (10). The analysis indicated that the HCL cases aresignificantly more related to memory and naive B cells thanto GC B cells (Fig. 2, A and E). An analogous analysis per-formed using a profile of genes differentially expressed be-tween naive and memory B cells showed that hairy leuke-mic cells are more related to memory B cells than to naiveB cells (Fig. 2, B and E). To further dissect their post-GCphenotype, we analyzed the HCL profile for genes that aredifferentially expressed between EBV-transformed lym-phoblastic cell lines (LCLs) and MM cell lines as represen-tative of immunoblasts and plasma cells, respectively. Theresults indicate that HCL is more related to LCLs than toMM cell lines (unpublished data). When the comparisonwas performed between LCLs or MM cell lines and mem-ory B cells, HCL proved to be more related to memory Bcells (Fig. 2, C–E). The expression of specific GC (CD10,BCL-6, and CD38), naive (CD23), memory B cell(CD27), and plasma cell (MUM-1, CD138, and BLIMP-1)
markers (Fig. 2 A, B and D, bottom) confirmed the ab-sence in HCL of GC and plasma cell markers as reported inprevious immunohistochemical papers (3, 4, 21, 22). Thememory B cell marker CD27 (23) is present in most of theHCL samples, although the expression levels are heteroge-neous and lower than in memory B cells. Together, theseresults indicate that HCL is more related to memory B cellsthan to other types of known B cell subpopulations. Thus,this malignancy may derive from the transformation andclonal expansion of a memory B cell.
HCL Cells Differ from Memory B Cells in the Expression ofCytokines and Chemokine and Adhesion Receptors.
To fur-ther investigate the transformed phenotype of HCL vis avis the expression of genes that characterize normal matureB cells, we examined the difference in the pattern of ex-pression of those genes that are differentially expressed innaive, memory, and GC cells during the GC transit. Thesegenes were classified according to relevant functional oroperational categories (10). Consistent with their related-ness (Fig. 2), HCL showed a gene expression profile largelysuperimposable to that of memory B cells in the prolifera-tion, activation, apoptosis, and DNA metabolism programs(Fig. 3). Within the proliferation program, the exceptionsof cyclin D1 and CHC1L are notable, which were clearlyup-regulated in HCL. CHC1L, which encodes for a gua-nine nucleotide exchange factor, and cyclin D1 were alsoidentified among the genes specifically overexpressed inHCL cells (see Fig. 4). HCL cells differed from memory Bcells in the expression of various genes encoding signalingmolecules and transcription factors.
Notably, the major differences between HCL and mem-ory B cells involved the expression of genes encoding cyto-
Figure 3. Analysis in HCL of genes asso-ciated in normal B cells to the GC transitions.The genes that are differentially expressedin naive, memory, and GC B cells duringthe GC transit were identified by supervisedanalysis. The genes were classified accordingto functional categories. The expression ofthe transition genes is investigated in HCL(right, both matrices). For description of thematrix, see Fig. 2. Genes that show differentexpression (at least threefold) between mem-ory B cells and HCL are indicated. For thecomplete list of the genes, GenBank/EMBL/DDBJ accession nos., and Affymetrix codes,see Table S3 (available at http://www.jem.org/cgi/content/full/jem.20031175/DC1).

Basso et al.
63
kines and chemokines and their receptors, as well as genesencoding adhesion molecules. In particular, HCL cells donot express the TNSF11 gene (known as RANKL) that isexpressed in memory B cells, and it is known to be in-volved in lymphocyte development and lymph node orga-nogenesis (24). HCL cells also showed relatively low ex-pression of the CCR7 gene, which encodes a chemokinereceptor involved in B cell homing (25). Several genes en-coding adhesion molecules absent in memory B cells areexpressed in HCL cells (GARP, CD9, CD103, andPCDH9), whereas RNA species expressed in memory Bcells are not expressed in HCL (CD1c and ICAM3), sug-
gesting the acquisition of peculiar adhesion property byHCL (see Discussion).
Identification of Genes Specifically Expressed in HCL.
Toidentify genes whose expression is specifically associatedwith HCL, we used a supervised analysis comparing HCLversus various normal B cell subpopulations (naive, GC,and memory) and major subtypes of B cell malignancies(6 FL, 4 BL, 16 DLBCL, 10 MCL, and 10 B-CLL). Weused 10 samples of HCL, including 5 BM biopsies and 5non-BM biopsies (cases 1–4, 6, 8, 11, 12, and the CD19
�
enriched samples of cases 13 and 14). The analysis identi-fied 89 genes (7 down-regulated and 82 up-regulated)
Figure 4. Identification ofHCL-specific genes. A super-vised analysis is performed using10 samples of HCL (five BMbiopsies and five non-BM samples)versus the normal B cell subpop-ulations (CB, CC, N, and M),different types of B-NHL (FL,BL, DLBCL, and MCL), andB-CLL. The B-NHL and B-CLLtumor samples are the same asthose used in the unsupervisedanalysis (Fig. 1). The supportvalue for the analysis was chosenas n � no 2 (no, number ofsamples in the phenotype set).The analysis identified 89 genesthat are differentially expressed inHCL versus all the other samples.Gene names are indicated, andsome genes appear more thanonce (repeat). For GenBank/EMBL/DDBJ accession nos. andAffymetrix codes, see Table S4(available at http://www.jem.org/cgi/content/full/jem.20031175/DC1).

Gene Expression Profiling of Hairy Cell Leukemia
64
that are differentially expressed in HCL cells comparedwith the other samples (Fig. 4). Some of these genes werealready known to be expressed in HCL (cyclin D1, FGF2,and IL-3R
; references 26–28) and served as internalcontrols to validate our approach. We observed overex-pression of cyclin D1 also in MCLs, as a reported hall-mark of this type of lymphoma. Other known HCLmarkers (CD11c, CD68, CD85j, and CD103; references29–32) were not identified by this type of analysis becausetheir level of expression in HCL cells were not homoge-neous and/or they were also expressed in other samplesacross the panel.
The expression of only seven genes was found decreasedin HCL cells compared with all the other samples. Thesegenes included the chemokine receptor CXCR5, involvedin B cell homing (33), and the TNF receptor–associatedfactor 5, involved in the signal transduction of TNF-typereceptors, including CD40 and CD27 (34).
Among the newly identified genes that are notably over-expressed in HCL are (also see Discussion): (a) GAS7, agrowth arrest–specific (Gas) gene (35) that is essential forneurite outgrowth in cultured cerebellar neurons (overex-
pression of GAS7 in HCL may explain the characteristicprojections of the hairy cells); (b) the FGFR1 receptor that,together with the previously reported overexpression of itsligand (FGF2; reference 27), suggests the presence in HCLof an autocrine loop; (c) the receptor tyrosine kinase FLT3that is reported to function as a growth factor receptor forhematopoietic stem and/or progenitor cells (36); and (d)three different inhibitors of matrix metalloproteinases:TIMP1 and TIMP4, two secreted tissue inhibitors of me-talloproteinases, and RECK, a membrane-anchored glyco-protein that represses synthesis and secretion of metallopro-teinases (37).
Immunocytochemical Validation.
To investigate whetherthe up-regulated mRNA levels of HCL-specific genes cor-respond to elevated levels of the corresponding proteins,we stained fresh cytospins and/or BM paraffin sectionsfrom patients with HCL (including the cases subjected tomicroarray and six additional HCL cases) using monoclonaland polyclonal antibodies directed against the proteins en-coded by 22 of the HCL-specific genes.
The expression in HCL cells was confirmed for the fol-lowing proteins: FGF2 (bFGF), annexin 1, CD135 (FLT3),
Figure 5. (top left, DBA44) BM biopsy from patient5 showing massive infiltration by DBA44� hairy cells;the arrow indicates rare residual hemopoietic precursors.(T) A bone trabecula (APAAP; 800�). (top middle,DBA44) Cytocentrifuge preparation (patient 3) showingstrong surface positivity of HCL cells for DBA44 (arrow,APAAP; 800�). (Na� CP, I) Cytospin (patient 3).Positivity for Na� channel, type I, is mainly seen onthe surface membrane (arrow). A negative lymphoidcell (arrowhead, APAAP; 800�). (FLT3) Cytospin(patient 3). Labeling of leukemic cells for FLT3 ismainly seen on the cell surface (arrow). A negativenormal residual lymphocyte (arrowhead, APAAP;800�). (CD63 and SYND-3) Cytospins (patient 3).Expression of CD63 and Syndecan-3 expression aremainly cytoplasmic (arrow, microgranular) and perinu-clear (arrow), respectively (APAAP; 800�). (FGF2)BM biopsy (paraffin section) from patient 4. HCL cellsshow strong nuclear and cytoplasmic positivity forFGF2 (arrow, bFGF), whereas residual hemopoieticprecursors are negative (arrowhead, APAAP; 800�).(Annexin I) BM biopsy (patient 4). Leukemic cells arestrongly positive for annexin I (arrow). Positivity ismainly seen in the cytoplasm and surface, whereas nucleiare negative or faintly positive. An island of annexin1–negative residual erythroid precursors is shown(APAAP; 800�). (TIMP1) Liver biopsy (paraffin section)from patient 3 showing typical infiltration of hepaticsinusoids by TIMP1� leukemic hairy cells (APAAP;800�).

Basso et al.
65
Na
�
CP type I (SCN1B), CD63, Syndecan-3, TIMP1(Fig. 5) as well as IL-3R
, cyclin D1, FGFR1, GAS7,EPB4.1L2,
�
-actin, CPVL,
�
-arrestin-2, insulin-likegrowth factor binding protein (IGFBP3), MYF6 (Hercu-lin), protein tyrosine phosphatase receptor
�
(PTPR
�
),Synaptotagmin 1, plexin-C1, TIMP4, and
�
-2-microglob-ulin (not depicted). Thus, these results indicate that theHCL-specific overexpression of genes detected by gene ex-pression profiling is associated with the overexpression ofthe corresponding protein for all genes tested.
Discussion
This paper has addressed critical questions regarding thecell of origin and pathogenesis of HCL using gene expres-sion profiling technology in a panel of 14 cases. This panelis relatively large considering the difficulties in collectingHCL samples suitable for gene expression profiling, due tothe very limited availability of HCL cells from the BM (dif-ficult extraction due to the reticulin fibers), from the pe-ripheral blood (scarce presence of malignant cells), andfrom the spleen (decreasing use of the splenectomy as ther-apeutic approach; Materials and Methods). Nevertheless,the panel used here was sufficient to confirm the distinctphenotype of this disease, to identify its putative cell of ori-gin, and to discover alterations in cellular programs thatcould be of biological and clinical relevance.
The Distinct Phenotype of HCL.
HCL has been recog-nized for a long time as a chronic B cell malignancy withclinical, morphological, and phenotypic features clearly dis-tinct from those of other types of B cell lymphomas (3, 4).The gene expression profile analysis performed here sub-stantiates this concept by dramatically increasing the num-ber of traits that characterize the unique HCL phenotype.In contrast to other B cell malignancies, where the geneexpression profiling has identified unrecognized subsets ofthe disease (38), the phenotype of HCL appears to be ho-mogeneous, suggesting that HCL is a single disease entityconsistent with its homogeneous morphology and clinicalbehavior. The characteristic gene expression profile ofHCL may be due to a distinct cellular origin and/or to adistinct mechanism of transformation.
The Cellular Derivation of HCL.
Since its first descrip-tion, the distinct HCL morphology and phenotype couldnot be assigned to a normal B cell developmental stage.The gene expression analysis shown here indicates thatHCL is more related to memory B cells than to GCs ornaive B cells. Recent findings that draw a relationship be-tween a tonsillar B cell subset, identified by the phab V-3antibody, and HCL (39) may be in accordance with therelationship between HCL cells and memory B cells wereport here. In fact, phab V-3
�
B cells do not express GCB cell markers and CD23, a marker of naive B cells,whereas they express the memory B cell marker CD27and display mutated IgV sequences (39), thus, suggestingthat they are memory B cells. As an additional similarity,the phab V-3
�
tonsillar B cells and HCL cells are both
characterized by high level of expression of the CD11cmolecule. Overall, the gene expression profiles togetherprevious immunophenotypic observations suggest thatHCL cells derive from memory B cells, possibly from asubset of this population characterized by phab V-3 andCD11c expression.
Pathogenetic Implications.
The notion that HCL mayderive from memory B cells has direct implications for thepathogenesis of this malignancy. HCL cells typically lackreciprocal balanced chromosomal translocations, which arethe hallmark of all lymphoid malignancies, with the notableexception of B-CLLs (40). Intriguingly, B-CLLs also re-semble memory B cells based on gene expression profiles(9). Thus, the only two lymphoid malignancies that lackchromosomal translocations are also both related to mem-ory B cells. This observation further supports our previ-ously proposed hypothesis that the lack of chromosomaltranslocations may be due to the fact the mechanism thatcan generate these aberrations (i.e., Ig VDJ recombination,class switching, and somatic hypermutation) are switchedoff in memory B cells (9). Thus, the pathogenesis of CLLand HCL may involve genetic lesions, such as the nonran-dom deletions and amplifications found in these diseasesthat do not derive from mistakes of immunoglobulin genesremodeling mechanism.
Functional Alterations in HCL.
This analysis providesseveral insights into the functional alterations of HCL. Acareful comparison of HCL with memory B cells revealed asurprisingly conserved pattern of expression of genes thatregulate functions typically damaged in malignant cells,such as proliferation and apoptosis. Similarly to memory Bcells, HCL cells appear as largely quiescent cells expressinggenes coding both anti- and proapoptotic molecules. Con-versely, most of the differences between HCL and memoryB cells involved the expression pattern of cytokines, che-mokine receptors, and adhesion molecules.
Adhesion and Homing of HCL Cells.
Several findings inthis analysis may explain the unique dissemination patternof HCL (i.e., involvement of BM, peripheral blood, andspleen red pulp with sparing of lymph nodes). The ten-dency of HCL to remain confined in blood-related com-partments could be at least in part explained by the signifi-cant up-regulation of three genes (TIMP-1, TIMP-4, andRECK), all known to counteract the activity of matrixmetalloproteinases, which promote local invasion, extrava-sation from blood vessels, and metastasis in all types of hu-man neoplasms (41). Furthermore, the lack of spreading ofHCL cells to lymph nodes can be explained by the down-regulation of CCR7 (sixfold compared with memory Bcells), a chemokine receptor whose deficiency hampers theability of B cells to enter lymph nodes (25). Consistentwith previous immunocytochemical findings (42), our re-sults show that HCL cells fail to express CXCR5, a che-mokine receptor required for B cells homing to follicles ofperipheral lymphoid organs (33).
Hairy Morphology.
Although recognized as the hall-mark of HCL, the “hairy” appearance of leukemic cells still
Gene Expression Profiling of Hairy Cell Leukemia
66
remains a feature for which no definitive explanation hasbeen found. Interaction of the cytoskeleton-binding pro-tein pp52 (LSP1) with F-actin–rich cytoskeletal arrays inthe surface projections of HCL cells has been proposed as amechanism for this property (43). Our results highlightother HCL-specific molecules that may contribute to thehairy phenotype, possibly interacting with
�
-actin (also up-regulated in HCL). These molecules are as follows: (a)Gas7 (Fig. 4), whose ectopic expression induces the forma-tion of extended cellular processes and dramatic changes incell shape by interacting with F-actin (44); and (b)EPB4.1L2 (Fig. 4), known to play a role in the mainte-nance of the shape of neuronal cells by interacting with
�
-actin underneath the plasma membrane (45).
Phagocytosis and Macrophage-like Features.
It has beenrecognized for a long time that HCL cells have the capacityto phagocytose latex particles, zymosan,
Staphylococcus au-reus
, and
Pseudomonas aeroginosa
(46, 47), leading to the hy-pothesis that HCL cells were either B lymphocytes withphagocytic capabilities (48) or malignant cells of monocyticorigin (49). This phagocytic properties of HCL cells maybe explained by specific up-regulation of annexin 1 (re-quired for the phagocytic uptake of
Brucella suis
by humanmonocytes; reference 50), as well as CD63 (51) and CPVL(52), two macrophage-associated lysosomal molecules (Fig.4). We speculate that phagocytosis and expression by HCLof several macrophage markers (CD11c, CD68, CD63, andCPVL) may be explained by the apparently abnormal up-regulation of c-Maf (Fig. 4), a transcription factor whosederegulated expression can induce macrophage differentia-tion (53, 54).
Marrow Fibrosis.
Another distinctive feature of HCL isthe fine reticulin marrow fibrosis (1–4), which is responsi-ble for the frequent “dry-tap” at aspiration. This feature islikely due to the ability of HCL cells to synthesize and bindto a fibronectin matrix (55, 56), whose production rate isunder control of the autocrine FGF2 secreted by HCL cells(57). The overexpression of IL-3R
and FLT3 by HCLcells (Fig. 4) might play a role in the fibrosis because theligands for these two receptors (physiologically present inthe BM stroma microenvironment) are important for adhe-sion of B cells to fibronectin through activation of the fi-bronectin receptors VLA4 and VLA5 (58), both known tobe expressed in hairy cells (55, 59).
Clinical Implications.
The results herein identify severalantibodies that recognize HCL-specific molecules and,therefore, may be useful for the diagnosis of HCL. For in-stance, these reagents may help in the differential diagnosisbetween HCL and other borderline B cell chronic lympho-proliferative disorders (splenic lymphoma with villous lym-phocytes), and in better defining the nature of the so-calledHCL variant (60). These distinctions have therapeutic im-plications because HCL and splenic lymphoma with villouslymphocytes are sensitive to distinct therapeutic regimens(61). The selective sensitivity of HCL to IFN as comparedwith other B cell lymphomas may be explained by the up-regulation of the TNF receptor, TNFR1, which is likely to
potentiate the apoptotic effect of IFN-
–induced TNF-
secretion by HCL cells (62). Finally, HCL-specific cell sur-face molecules, such as IL-3R
, may represent potentialtargets for antibody-mediated immunotherapy, whereas theabnormal expression of the FLT3 tyrosine kinase receptorwarrants further investigation on the sensitivity of HCLcells to the currently available inhibitors of FLT3.
We thank R. Pacini, A. Tabarrini, F. Frenguelli, and F.Brachelente for help with the immunostainings and V. Miljkovicand A. Babiac for help with the microarray hybridization. We arealso grateful to G. Stolovitzky and Y. Tu for their constant input inour joint gene expression profiling projects and to Mrs. C. Tibidofor the secretarial assistance.
K. Basso is supported by a fellowship from the American-ItalianCancer Foundation; E. Tiacci is supported by a grant from LiviaBenedetti; R. Benedetti was a recipient of a fellowship granted bythe Federazione Italiana per la Ricerca sul Cancro; U. Klein was arecipient of a fellowship granted by the Human Frontiers ScienceProgram. This work was supported by the Associazione Italiana perla Ricerca sul Cancro.
Submitted: 15 July 2003Accepted: 11 November 2003
References
1. Burke, J.S. 1978. The value of the bone-marrow biopsy inthe diagnosis of hairy cell leukemia.
Am. J. Clin. Pathol.
70:876–884.
2. Brunning, M., and R.W. McKenna. 1994.
Atlas of Tumor Pa-thology: Tumors of the Bone Marrow.
Armed Forces Institute ofPathology. Washington, D.C.: Universities Associated forResearch and Education in Pathology.
3. Harris, N.L., E.S. Jaffe, H. Stein, P.M. Banks, J.K. Chan,M.L. Cleary, G. Delsol, C. De Wolf-Peeters, B. Falini, andK.C. Gatter. 1994. A revised European-American classifica-tion of lymphoid neoplasms: a proposal from the Interna-tional Lymphoma Study Group.
Blood.
84:1361–1392.4. Jaffe, E.S., N.L. Harris, H. Stein, and J.W. Vardiman. 2001.
World Health Organization Classification of Tumours: Pa-thology and Genetics of Tumours of Haematopoietic andLymphoid Tissues. IARC Press, Lyon, France. 351 pp.
5. Mey, U., J. Strehl, M. Gorschluter, C. Ziske, A. Glasmacher,H. Pralle, and I. Schmidt-Wolf. 2003. Advances in the treat-ment of hairy-cell leukaemia.
Lancet. Oncol. 4:86–94.6. Maloum, K., C. Magnac, Z. Azgui, C. Cau, F. Charlotte, J.L.
Binet, H. Merle-Beral, and G. Dighiero. 1998. VH gene ex-pression in hairy cell leukaemia. Br. J. Haematol. 101:171–178.
7. Forconi, F., S.S. Sahota, D. Raspadori, C.I. Mockridge, F.Lauria, and F.K. Stevenson. 2001. Tumor cells of hairy cellleukemia express multiple clonally related immunoglobulinisotypes via RNA splicing. Blood. 98:1174–1181.
8. Rajewsky, K. 1996. Clonal selection and learning in the anti-body system. Nature. 381:751–758.
9. Klein, U., Y. Tu, G.A. Stolovitzky, M. Mattioli, G. Cattor-etti, H. Husson, A. Freedman, G. Inghirami, L. Cro, L. Bal-dini, et al. 2001. Gene expression profiling of B cell chroniclymphocytic leukemia reveals a homogeneous phenotype re-lated to memory B cells. J. Exp. Med. 194:1625–1638.
10. Klein, U., Y. Tu, G.A. Stolovitzky, J.L. Keller, J. Haddad,

Basso et al.67
Jr., V. Miljkovic, G. Cattoretti, A. Califano, and R. Dalla-Favera. 2003. Transcriptional analysis of the B cell germinalcenter reaction. Proc. Natl. Acad. Sci. USA. 100:2639–2644.
11. Hartigan, J.A. 1975. Clustering Algorithms. John Wiley &Sons, Inc., New York. 351 pp.
12. Eisen, M.B., P.T. Spellman, P.O. Brown, and D. Botstein.1998. Cluster analysis and display of genome-wide expressionpatterns. Proc. Natl. Acad. Sci. USA. 95:14863–14868.
13. Califano, A., G. Stolovitzky, and Y. Tu. 2000. Analysis ofgene expression microarrays for phenotype classification. Proc.Int. Conf. Intell. Syst. Mol. Biol. 8:75–85.
14. Califano, A. 2000. SPLASH: structural pattern localizationanalysis by sequential histograms. Bioinformatics. 16:341–357.
15. Falini, B., M. Fizzotti, A. Pucciarini, B. Bigerna, T. Marafi-oti, M. Gambacorta, R. Pacini, C. Alunni, L. Natali-Tanci,B. Ugolini, et al. 2000. A monoclonal antibody (MUM1p)detects expression of the MUM1/IRF4 protein in a subset ofgerminal center B cells, plasma cells, and activated T cells.Blood. 95:2084–2092.
16. Cordell, J.L., B. Falini, W.N. Erber, A.K. Ghosh, Z. Abdu-laziz, S. MacDonald, K.A. Pulford, H. Stein, and D.Y. Ma-son. 1984. Immunoenzymatic labeling of monoclonal anti-bodies using immune complexes of alkaline phosphatase andmonoclonal anti-alkaline phosphatase (APAAP complexes). J.Histochem. Cytochem. 32:219–229.
17. Falini, B., M.F. Martelli, F. Tarallo, D.J. Moir, J.L. Cordell,K.C. Gatter, G. Loreti, H. Stein, and D.Y. Mason. 1984. Im-munohistological analysis of human bone marrow trephinebiopsies using monoclonal antibodies. Br. J. Haematol. 56:365–386.
18. Falini, B., D.Y. Mason, H. Stein, D.J. Moir, M. Zuccaccia,F. Grignani, and M.F. Martelli. 1984. The immunohistologi-cal analysis of undecalcified human bone marrow trephine bi-opsies. Technical and diagnostic aspects. Haematologica. 69:346–376.
19. Pascual, V., Y.J. Liu, and J. Banchereau. 1997. Normal hu-man B cell sub-populations and their malignant counterparts.Baillieres Clin. Haematol. 10:525–538.
20. Kuppers, R., U. Klein, M.L. Hansmann, and K. Rajewsky.1999. Cellular origin of human B-cell lymphomas. N. Engl.J. Med. 341:1520–1529.
21. Falini, B., R. Schwarting, W. Erber, D.N. Posnett, M.F.Martelli, F. Grignani, M. Zuccaccia, K.C. Gatter, C. Cer-netti, H. Stein, et al. 1985. The differential diagnosis of hairycell leukemia with a panel of monoclonal antibodies. Am. J.Clin. Pathol. 83:289–300.
22. Flenghi, L., B. Bigerna, M. Fizzotti, S. Venturi, L. Pas-qualucci, S. Pileri, B.H. Ye, M. Gambacorta, R. Pacini, C.D.Baroni, et al. 1996. Monoclonal antibodies PG-B6a and PG-B6p recognize, respectively, a highly conserved and a formol-resistant epitope on the human BCL-6 protein amino-termi-nal region. Am. J. Pathol. 148:1543–1555.
23. Klein, U., K. Rajewsky, and R. Kuppers. 1998. Human im-munoglobulin (Ig)M�IgD� peripheral blood B cells express-ing the CD27 cell surface antigen carry somatically mutatedvariable region genes: CD27 as a general marker for somati-cally mutated (memory) B cells. J. Exp. Med. 188:1679–1689.
24. Kong, Y.Y., H. Yoshida, I. Sarosi, H.L. Tan, E. Timms, C.Capparelli, S. Morony, A.J. Oliveira-dos-Santos, G. Van, A.Itie, et al. 1999. OPGL is a key regulator of osteoclastogene-sis, lymphocyte development and lymph-node organogenesis.Nature. 397:315–323.
25. Forster, R., A. Schubel, D. Breitfeld, E. Kremmer, I. Ren-
ner-Muller, E. Wolf, and M. Lipp. 1999. CCR7 coordinatesthe primary immune response by establishing functional mi-croenvironments in secondary lymphoid organs. Cell. 99:23–33.
26. Bosch, F., E. Campo, P. Jares, S. Pittaluga, J. Munoz, I. Nay-ach, M.A. Piris, C. Dewolf-Peeters, E.S. Jaffe, C. Rozman,et al. 1995. Increased expression of the PRAD-1/CCND1gene in hairy cell leukaemia. Br. J. Haematol. 91:1025–1030.
27. Gruber, G., J.D. Schwarzmeier, M. Shehata, M. Hilgarth,and R. Berger. 1999. Basic fibroblast growth factor is ex-pressed by CD19/CD11c-positive cells in hairy cell leuke-mia. Blood. 94:1077–1085.
28. Munoz, L., J.F. Nomdedeu, O. Lopez, M.J. Carnicer, M.Bellido, A. Aventin, S. Brunet, and J. Sierra. 2001. Interleu-kin-3 receptor alpha chain (CD123) is widely expressed inhematologic malignancies. Haematologica. 86:1261–1269.
29. Falini, B., K. Pulford, W.N. Erber, D.N. Posnett, G. Palle-sen, R. Schwarting, L. Annino, A. Cafolla, S. Canino, A.Mori, et al. 1986. Use of a panel of monoclonal antibodiesfor the diagnosis of hairy cell leukaemia. An immunocy-tochemical study of 36 cases. Histopathology. 10:671–687.
30. Falini, B., L. Flenghi, S. Pileri, M. Gambacorta, B. Bigerna,H. Durkop, F. Eitelbach, J. Thiele, R. Pacini, A. Cavaliere,et al. 1993. PG-M1: a new monoclonal antibody directedagainst a fixative-resistant epitope on the macrophage-restricted form of the CD68 molecule. Am. J. Pathol. 142:1359–1372.
31. Banham, A.H., M. Colonna, M. Cella, K.J. Micklem, K.Pulford, A.C. Willis, and D.Y. Mason. 1999. Identificationof the CD85 antigen as ILT2, an inhibitory MHC class I re-ceptor of the immunoglobulin superfamily. J. Leukoc. Biol.65:841–845.
32. Flenghi, L., F. Spinozzi, H. Stein, M. Krushwitz, S. Pileri,and B. Falini. 1990. LF61: a new monoclonal antibody di-rected against a trimeric molecule (150 kDa, 125 kDa, 105kDa) associated with hairy cell leukaemia. Br. J. Haematol. 76:451–459.
33. Forster, R., A.E. Mattis, E. Kremmer, E. Wolf, G. Brem, andM. Lipp. 1996. A putative chemokine receptor, BLR1, di-rects B cell migration to defined lymphoid organs and specificanatomic compartments of the spleen. Cell. 87:1037–1047.
34. Nakano, H., S. Sakon, H. Koseki, T. Takemori, K. Tada, M.Matsumoto, E. Munechika, T. Sakai, T. Shirasawa, H. Akiba,et al. 1999. Targeted disruption of Traf5 gene causes defectsin CD40- and CD27-mediated lymphocyte activation. Proc.Natl. Acad. Sci. USA. 96:9803–9808.
35. Ju, Y.T., A.C. Chang, B.R. She, M.L. Tsaur, H.M. Hwang,C.C. Chao, S.N. Cohen, and S. Lin-Chao. 1998. gas7: Agene expressed preferentially in growth-arrested fibroblastsand terminally differentiated Purkinje neurons affects neuriteformation. Proc. Natl. Acad. Sci. USA. 95:11423–11428.
36. Maroc, N., R. Rottapel, O. Rosnet, S. Marchetto, C.Lavezzi, P. Mannoni, D. Birnbaum, and P. Dubreuil. 1993.Biochemical characterization and analysis of the transformingpotential of the FLT3/FLK2 receptor tyrosine kinase. Onco-gene. 8:909–918.
37. Oh, J., R. Takahashi, S. Kondo, A. Mizoguchi, E. Adachi,R.M. Sasahara, S. Nishimura, Y. Imamura, H. Kitayama,D.B. Alexander, et al. 2001. The membrane-anchored MMPinhibitor RECK is a key regulator of extracellular matrix in-tegrity and angiogenesis. Cell. 107:789–800.
38. Alizadeh, A.A., M.B. Eisen, R.E. Davis, C. Ma, I.S. Lossos,A. Rosenwald, J.C. Boldrick, H. Sabet, T. Tran, X. Yu, et

Gene Expression Profiling of Hairy Cell Leukemia68
al. 2000. Distinct types of diffuse large B-cell lymphomaidentified by gene expression profiling. Nature. 403:503–511.
39. van Der Vuurst De Vries, A.R., and T. Logtenberg. 1999. Aphage antibody identifying an 80-kDa membrane glycoproteinexclusively expressed on a subpopulation of activated B cellsand hairy cell leukemia B cells. Eur. J. Immunol. 29:3898–3907.
40. Tam, W., and R. Dalla-Favera. 2001. Proto-oncogenes andtumor suppressor genes in hematopoietic malignancies. InNeoplastic Hematopathology. D.M. Knowles, editor. Lip-pincott Williams & Wilkins, New York. 329–363.
41. Yoon, S.O., S.J. Park, C.H. Yun, and A.S. Chung. 2003.Roles of matrix metalloproteinases in tumor metastasis andangiogenesis. J. Biochem. Mol. Biol. 36:128–137.
42. Durig, J., U. Schmucker, and U. Duhrsen. 2001. Differentialexpression of chemokine receptors in B cell malignancies.Leukemia. 15:752–756.
43. Miyoshi, E.K., P.L. Stewart, P.W. Kincade, M.B. Lee, A.A.Thompson, and R. Wall. 2001. Aberrant expression and lo-calization of the cytoskeleton-binding pp52 (LSP1) protein inhairy cell leukemia. Leuk. Res. 25:57–67.
44. She, B.R., G.G. Liou, and S. Lin-Chao. 2002. Association ofthe growth-arrest-specific protein Gas7 with F-actin inducesreorganization of microfilaments and promotes membraneoutgrowth. Exp. Cell Res. 273:34–44.
45. Kontrogianni-Konstantopoulos, A., C.S. Frye, E.J. Benz, Jr.,and S.C. Huang. 2001. The prototypical 4.1R-10-kDa do-main and the 4.1g-10-kDa paralog mediate fodrin-actincomplex formation. J. Biol. Chem. 276:20679–20687.
46. Jansen, J., C.J. Meijer, P. van der Valk, W.C. de Bruyn, P.C.Leijh, G.J. den Ottolander, and R. van Furth. 1979. Phago-cytic potential of hairy cells. Scand. J. Haematol. 23:69–79.
47. Rosner, M.C., and H.M. Golomb. 1982. Phagocytic capacityof hairy cells from seventeen patients. Virchows Arch. B CellPathol. Incl. Mol. Pathol. 40:327–337.
48. Utsinger, P.D., W.J. Yount, C.R. Fuller, M.J. Logue, andE.P. Orringer. 1977. Hairy cell leukemia: B-lymphocyte andphagocytic properties. Blood. 49:19–27.
49. Scheinberg, M., A.I. Brenner, A.L. Sullivan, E.S. Cathcart,and I. Katayama. 1976. The heterogeneity of leukemic retic-uloendotheliosis, “hairy cell leukemia.” Evidence for itsmonocytic origin. Cancer. 37:1302–1307.
50. Kusumawati, A., C. Cazevieille, F. Porte, S. Bettache, J.P.Liautard, and J. Sri Widada. 2000. Early events and implica-tion of F-actin and annexin I associated structures in thephagocytic uptake of Brucella suis by the J-774A.1 murine cellline and human monocytes. Microb. Pathog. 28:343–352.
51. Fukuda, M. 1991. Lysosomal membrane glycoproteins.
Structure, biosynthesis, and intracellular trafficking. J. Biol.Chem. 266:21327–21330.
52. Mahoney, J.A., B. Ntolosi, R.P. DaSilva, S. Gordon, andA.J. McKnight. 2001. Cloning and characterization ofCPVL, a novel serine carboxypeptidase, from human macro-phages. Genomics. 72:243–251.
53. Hedge, S.P., A. Kumar, C. Kurschner, and L.H. Shapiro.1998. c-Maf interacts with c-Myb to regulate transcription ofan early myeloid gene during differentiation. Mol. Cell. Biol.18:2729–2737.
54. Hegde, S.P., J. Zhao, R.A. Ashmun, and L.H. Shapiro. 1999.c-Maf induces monocytic differentiation and apoptosis in bi-potent myeloid progenitors. Blood. 94:1578–1589.
55. Burthem, J., and J.C. Cawley. 1994. The bone marrow fibro-sis of hairy-cell leukemia is caused by the synthesis and assem-bly of a fibronectin matrix by the hairy cells. Blood. 83:497–504.
56. Aziz, K.A., K.J. Till, M. Zuzel, and J.C. Cawley. 2000. In-volvement of CD44-hyaluronan interaction in malignant cellhoming and fibronectin synthesis in hairy cell leukemia.Blood. 96:3161–3167.
57. Aziz, K.A., K.J. Till, H. Chen, J.R. Slupsky, F. Campbell,J.C. Cawley, and M. Zuzel. 2003. The role of autocrineFGF-2 in the distinctive bone marrow fibrosis of hairy-cellleukaemia (HCL). Blood. 10:10.
58. Shibayama, H., N. Anzai, A. Ritchie, S. Zhang, C. Mantel,and H.E. Broxmeyer. 1998. Interleukin-3 and Flt3-ligand in-duce adhesion of Baf3/Flt3 precursor B-lymphoid cells to fi-bronectin via activation of VLA-4 and VLA-5. Cell. Immunol.187:27–33.
59. Angelopoulou, M.K., F.N. Kontopidou, and G.A. Pangalis.1999. Adhesion molecules in B-chronic lymphoproliferativedisorders. Semin. Hematol. 36:178–197.
60. Sainati, L., E. Matutes, S. Mulligan, M.P. de Oliveira, S.Rani, I.A. Lampert, and D. Catovsky. 1990. A variant form ofhairy cell leukemia resistant to alpha-interferon: clinical andphenotypic characteristics of 17 patients. Blood. 76:157–162.
61. Hermine, O., F. Lefrere, J.P. Bronowicki, X. Mariette, K.Jondeau, V. Eclache-Saudreau, B. Delmas, F. Valensi, P. Ca-coub, C. Brechot, et al. 2002. Regression of splenic lym-phoma with villous lymphocytes after treatment of hepatitisC virus infection. N. Engl. J. Med. 347:89–94.
62. Baker, P.K., A.R. Pettitt, J.R. Slupsky, H.J. Chen, M.A.Glenn, M. Zuzel, and J.C. Cawley. 2002. Response of hairycells to IFN-alpha involves induction of apoptosis throughautocrine TNF-alpha and protection by adhesion. Blood. 100:647–653.