Gene Expression Profiling of Dendritic Cells Reveals Important Mechanisms Associated with...
14
Gene Expression Profiling of Dendritic Cells Reveals Important Mechanisms Associated with Predisposition to Staphylococcus Infections Mehdi Toufeer 1,2 , Ce ´ cile M. D. Bonnefont 1,2,3 , Eliane Foulon 1,2 , Ce ´ cile Caubet 1,2 , Christian Tasca 1,2 , Marie-Rose Aurel 4 , Christe ` le Robert-Granie ´ 3 , Rachel Rupp 3 , Gilles Foucras 1,2 * 1 Universite ´ de Toulouse, INP, ENVT; UMR 1225, IHAP, Toulouse, France, 2 INRA, UMR1225, IHAP, Toulouse, France, 3 INRA, UR631, SAGA, Castanet-Tolosan, France, 4 INRA, UE321, Roquefort, France Abstract Background: Staphylococcus aureus is a major pathogen of humans and animals and emerging antibiotic-resistant strains have further increased the concern of this health issue. Host genetics influence susceptibility to S. aureus infections, and the genes determining the outcome of infections should be identified to find alternative therapies to treatment with antibiotics. Here, we used outbred animals from a divergent selection based on susceptibility towards Staphylococcus infection to explore host immunogenetics. Methodology/Principal Findings: We investigated how dendritic cells respond to heat-inactivated S. aureus and whether dendritic cells from animals showing different degrees of susceptibility had distinct gene expression profiles. We measured gene expression levels of in vitro S. aureus-stimulated bone marrow-derived dendritic cells at three different time points (0, 3 and 8 hrs) by using 15 k ovine Agilent microarrays. Furthermore, differential expression of a selected number of genes was confirmed by RT-qPCR. Gene signatures of stimulated DCs were obtained and showed that genes involved in the inflammatory process and T helper cell polarization were highly up-regulated upon stimulation. Moreover, a set of 204 genes were statistically differentially expressed between susceptible and resistant animals, and grouped them according to their predisposition to staphylococcal infection. Interestingly, over-expression of the C1q and Ido1 genes was observed in the resistant line and suggested a role of classical pathway of complement and early regulation of inflammation pathways, respectively. On the contrary, over expression of genes involved in the IL1R pathway was observed in susceptible animals. Furthermore, the leucocyte extravasation pathway was also found to be dominant in the susceptible line. Conclusion/Significance: We successfully obtained Staphylococcus aureus associated gene expression of ovine BM-DC in an 8-hour kinetics experiment. The distinct transcriptional profiles of dendritic cells obtained from resistant and susceptible animals may explain susceptibility towards S. aureus infections in a broader context. Citation: Toufeer M, Bonnefont CMD, Foulon E, Caubet C, Tasca C, et al. (2011) Gene Expression Profiling of Dendritic Cells Reveals Important Mechanisms Associated with Predisposition to Staphylococcus Infections. PLoS ONE 6(8): e22147. doi:10.1371/journal.pone.0022147 Editor: T. Mark Doherty, Statens Serum Institute, Denmark Received October 6, 2010; Accepted June 19, 2011; Published August 12, 2011 Copyright: ß 2011 Toufeer et al. This is an open-access article distributed under the terms of the Creative Commons Attribution License, which permits unrestricted use, distribution, and reproduction in any medium, provided the original author and source are credited. Funding: Studies were supported by Action Concerte ´e Incitative (ACI) Microbiologie 2003, ANR Ge ´nanimal 2005 Genoma II, APIS-GENE, and European Network of Excellence(EADGENE). MT was supported by Higher Education Commission, Pakistan. The funders had no role in study design, data collection and analysis, decision to publish, or preparation of the manuscript. Competing Interests: The authors have declared that no competing interests exist. * E-mail: [email protected] Introduction Staphylococcus aureus is a common bacterium causing diseases in a wide range of host species [1–4]. In contrast to its commensal status, S. aureus is also a very frequent pathogen causing infections of the skin and soft tissues, and sepsis. In humans and animals, it is a problem further compounded by the recent appearance of strains with broad antibiotic resistance, including methicillin- resistant S. aureus strains (MRSA) [5]. The duality of S. aureus interactions with the hosts, from apparently innocuous coloniza- tion to highly pathogenic invasion, emphasizes the need to better understand the host response to Staphylococci. Despite the huge health issues related to S. aureus, it is not yet known which immune mechanisms control the susceptibility of an organism to this kind of bacteria. To date, most efforts have been focused on advancing knowledge on the pathogen and its remarkable repertoire of virulence factors. Less work has been carried out on host predisposition to S. aureus infections [6–8]. In humans, few studies have focused on the comparison of the transcriptional signatures of peripheral blood mononuclear cells from patients with S. aureus infections with those of healthy individuals [9]. Nevertheless, S. aureus infection has been examined in mouse strains that show varying degrees of resistance to infection, and innate immune mechanisms were thought to be linked with genetic control [10]. Several studies have been conducted on zebrafish, and phagocyte- dependent resistance was associated with a favorable outcome. Moreover, Caenorhabditis elegans and drosophila have also been exploited as invertebrate models to decipher the mechanisms of response to S. aureus [11–13]. The necessarily retrospective design PLoS ONE | www.plosone.org 1 August 2011 | Volume 6 | Issue 8 | e22147
-
Upload
independent -
Category
Documents
-
view
0 -
download
0
Transcript of Gene Expression Profiling of Dendritic Cells Reveals Important Mechanisms Associated with...

Gene Expression Profiling of Dendritic Cells RevealsImportant Mechanisms Associated with Predisposition toStaphylococcus InfectionsMehdi Toufeer1,2, Cecile M. D. Bonnefont1,2,3, Eliane Foulon1,2, Cecile Caubet1,2, Christian Tasca1,2,
Marie-Rose Aurel4, Christele Robert-Granie3, Rachel Rupp3, Gilles Foucras1,2*
1 Universite de Toulouse, INP, ENVT; UMR 1225, IHAP, Toulouse, France, 2 INRA, UMR1225, IHAP, Toulouse, France, 3 INRA, UR631, SAGA, Castanet-Tolosan, France, 4 INRA,
UE321, Roquefort, France
Abstract
Background: Staphylococcus aureus is a major pathogen of humans and animals and emerging antibiotic-resistant strainshave further increased the concern of this health issue. Host genetics influence susceptibility to S. aureus infections, and thegenes determining the outcome of infections should be identified to find alternative therapies to treatment with antibiotics.Here, we used outbred animals from a divergent selection based on susceptibility towards Staphylococcus infection toexplore host immunogenetics.
Methodology/Principal Findings: We investigated how dendritic cells respond to heat-inactivated S. aureus and whetherdendritic cells from animals showing different degrees of susceptibility had distinct gene expression profiles. We measuredgene expression levels of in vitro S. aureus-stimulated bone marrow-derived dendritic cells at three different time points (0, 3and 8 hrs) by using 15 k ovine Agilent microarrays. Furthermore, differential expression of a selected number of genes wasconfirmed by RT-qPCR. Gene signatures of stimulated DCs were obtained and showed that genes involved in theinflammatory process and T helper cell polarization were highly up-regulated upon stimulation. Moreover, a set of 204genes were statistically differentially expressed between susceptible and resistant animals, and grouped them according totheir predisposition to staphylococcal infection. Interestingly, over-expression of the C1q and Ido1 genes was observed inthe resistant line and suggested a role of classical pathway of complement and early regulation of inflammation pathways,respectively. On the contrary, over expression of genes involved in the IL1R pathway was observed in susceptible animals.Furthermore, the leucocyte extravasation pathway was also found to be dominant in the susceptible line.
Conclusion/Significance: We successfully obtained Staphylococcus aureus associated gene expression of ovine BM-DC in an8-hour kinetics experiment. The distinct transcriptional profiles of dendritic cells obtained from resistant and susceptibleanimals may explain susceptibility towards S. aureus infections in a broader context.
Citation: Toufeer M, Bonnefont CMD, Foulon E, Caubet C, Tasca C, et al. (2011) Gene Expression Profiling of Dendritic Cells Reveals Important MechanismsAssociated with Predisposition to Staphylococcus Infections. PLoS ONE 6(8): e22147. doi:10.1371/journal.pone.0022147
Editor: T. Mark Doherty, Statens Serum Institute, Denmark
Received October 6, 2010; Accepted June 19, 2011; Published August 12, 2011
Copyright: � 2011 Toufeer et al. This is an open-access article distributed under the terms of the Creative Commons Attribution License, which permitsunrestricted use, distribution, and reproduction in any medium, provided the original author and source are credited.
Funding: Studies were supported by Action Concertee Incitative (ACI) Microbiologie 2003, ANR Genanimal 2005 Genoma II, APIS-GENE, and European Networkof Excellence(EADGENE). MT was supported by Higher Education Commission, Pakistan. The funders had no role in study design, data collection and analysis,decision to publish, or preparation of the manuscript.
Competing Interests: The authors have declared that no competing interests exist.
* E-mail: [email protected]
Introduction
Staphylococcus aureus is a common bacterium causing diseases in a
wide range of host species [1–4]. In contrast to its commensal
status, S. aureus is also a very frequent pathogen causing infections
of the skin and soft tissues, and sepsis. In humans and animals, it is
a problem further compounded by the recent appearance of
strains with broad antibiotic resistance, including methicillin-
resistant S. aureus strains (MRSA) [5]. The duality of S. aureus
interactions with the hosts, from apparently innocuous coloniza-
tion to highly pathogenic invasion, emphasizes the need to better
understand the host response to Staphylococci. Despite the huge
health issues related to S. aureus, it is not yet known which immune
mechanisms control the susceptibility of an organism to this kind
of bacteria.
To date, most efforts have been focused on advancing
knowledge on the pathogen and its remarkable repertoire of
virulence factors. Less work has been carried out on host
predisposition to S. aureus infections [6–8]. In humans, few studies
have focused on the comparison of the transcriptional signatures of
peripheral blood mononuclear cells from patients with S. aureus
infections with those of healthy individuals [9]. Nevertheless, S.
aureus infection has been examined in mouse strains that show
varying degrees of resistance to infection, and innate immune
mechanisms were thought to be linked with genetic control [10].
Several studies have been conducted on zebrafish, and phagocyte-
dependent resistance was associated with a favorable outcome.
Moreover, Caenorhabditis elegans and drosophila have also been
exploited as invertebrate models to decipher the mechanisms of
response to S. aureus [11–13]. The necessarily retrospective design
PLoS ONE | www.plosone.org 1 August 2011 | Volume 6 | Issue 8 | e22147

of studies in humans means that it is particularly difficult to use
them to identify immune mechanisms associated with protection
against S. aureus. Moreover, in the other interaction models listed
above, poor genetic variability limits their usefulness to study the
genetic control of immune responsiveness.
Therefore, in the present study we have designed and
implemented a new outbred animal model to explore the immune
response of mammals to S. aureus infections. For this purpose, we
used sheep from a divergent selection based on the susceptibility to
staphylococcal infections of the mammary gland, a spontaneous
and frequent infectious disease in this species [14]. Our initial
experiments conducted on this animal resource clearly indicated
that the two genetic lines showed a varying degree of natural
resistance towards mammary infections and responded differently
to staphylococcal infections [14]. The initial characterization of
these animals supported the hypothesis that the immune outcome
of such infections was different in the two lines, and therefore that
this trait is probably under genetic control. Previous studies also
suggest the involvement of genetic factors in the response to
mammary infections [15].
It is generally considered that the mechanisms underlying
resistance or susceptibility traits, which by essence are multifac-
torial, to staphylococcal infections are complex and therefore
difficult to understand. A comprehensive study of the trait in in vivo
infections seemed unwise at this stage due to the complexity and
dynamic aspects of interactions and mediation in immune cells.
Therefore, as a first step to identify what underlies the differences
of predisposition to staphylococcal infection, we conducted an in
vitro study of the interactions between dendritic cells (DCs) and
Staphylococcus. DCs were our first choice due to their corner stone
position between innate and adaptive immune responses [16].
Moreover, they share a large gene repertoire in common with
other cell types such as macrophages, due to their myeloid
precursor origin [17]. Previous studies have shown that DCs
contribute to the various degrees of susceptibility towards several
bacterial and parasitic pathogens, and their response on pathogen
contact is of highly variable nature [18–21]. Hence, we
hypothesized that DCs from animals showing different degrees
of susceptibility to staphylococcal infections may have distinct
transcriptional profiles upon infection.
Gene expression profiling has recently found applications in
diagnosis, prognosis and exploring host-pathogen interactions in
infectious diseases [9,22]. Similarly, the identification of gene
expression signatures indicative of disease subtypes through
microarray technology has improved our understanding of the
molecular basis of disease [23]. Moreover, transcriptome analysis
has already been successfully applied to DCs, and provided new
insights into immune responses [22,24].
Therefore, we used gene expression profiling with an ovine-
specific 15 k Agilent microarray to identify transcriptomic
differences in ovine DCs from susceptible and resistant animals,
in relation to staphylococcal immunity. Here, we show that the
comparison of DC gene expression between both animal groups
reveals striking differences and provides a basis for possible
mechanisms involved in immune protection against Staphylococci.
Results
Characterization of ovine bone marrow-derived dendriticcell response to heat-killed Staphylococcus aureus
In order to explore the response of dendritic cells from resistant
and susceptible animals, we generated bone marrow-derived
dendritic cells (BM-DCs) from sheep with known susceptibility
according to their line and to results obtained from a previous
infectious challenge (data not shown). After 6–7 days of culture,
BM-DCs purity (.90%) and phenotype were assessed by flow
cytometry. No difference was observed at this stage with available
markers (data not shown). BM-DCs were stimulated with a
commercial preparation (Pansorbin, Calbiochem) of heat-killed S.
aureus (HK-Sa; 20 mg/ml) for 3 and 8 hrs. Following stimulation of
BM-DCs, no differences were observed between the cells from
both lines and their activation status as determined by flow
cytometry was very similar. Based on data accumulated on DCs
biology, the expression of a number of cytokine genes was
quantified after 3 and 8 hrs of incubation (Fig. 1A). The transcripts
of the pro-inflammatory cytokines il1a, -1b, -6 and tnfa were
considerably up-regulated 3 hrs post-stimulation, and high levels
were maintained for all these cytokines after 8 hrs. Il8 and il15,
potent recruiters and activators of neutrophil granulocytes and NK
cells respectively, were also highly expressed. Among T helper-
polarizing cytokines, il10, -12 and -23, mRNA expression was up-
regulated (Fig. 1D). Interestingly, the transcription of the il23
coding gene continued to increase as late as 8 hrs post-stimulation
as compared to il10 and il12. The expression of several Toll-like
receptors (TLRs) was also measured, and a 2-fold increase in the
transcription of tlr2 and tlr4 was observed, whereas the expression
of tlr6 showed little change and did not change much after
stimulation.
Besides validating our in vitro assay and cell activation
conditions, these data indicate that ovine BM-DCs are highly
responsive to HK-Sa, since it induced the expression of a set of pro-
inflammatory cytokine genes.
Transcriptional analysis of DCs upon HK-Sa stimulationthrough microarray profiling
To further examine DC gene expression upon HK-Sa stimulation,
all three experimental conditions described above (time points: 0, 3
and 8 hrs) were compared in a dye-swap experimental design.
Firstly, probe levels from the non-stimulated time-point (0 hr)
and after stimulation with HK-Sa (3 and 8 hrs) were compared.
Globally, ANOVA of microarray data revealed that a large
number of genes were mobilized after HK-Sa stimulation (.3,000,
with a corrected Benjamini-Hochberg (BH) false discovery rate p-
value inferior to 0.01).
When considering only genes showing at least a 2-fold
difference in expression at one of the three conditions (T3 vs
T0, T8 vs T0 and T8 vs T3), a total number of 419 genes (Table
S1) were found. Unsupervised hierarchical clustering of these
genes indicated that they could be grouped into at least 4 subsets
based on their mode of expression after stimulation (Fig. 2).
Expression changes peaked at 3 hrs post-stimulation as compared
to 8 hrs. Moreover, the number of up-regulated genes was higher
than the number of down-regulated genes in the kinetics. The
expression of most of the genes (n = 176) peaked at the 3-hr time-
point and then decreased. The expression of 120 genes was
increased at both post-stimulation time-points i.e 3 and 8 hrs,
whereas 60 genes were down-regulated at these same time-points.
The expression of a few genes (n = 63) tended to increase later on
at 8 hrs. Fold changes (FC) for the differences in gene expression
when comparing the three time-points (T3 vs. T0, T8 vs. T0 and
T8 vs. T3) ranged from 9 to 27, 15 to 210 and 4 to 23,
respectively. A list of the most differentially up- and down-
regulated genes observed in the kinetics experiment is presented in
the Table 1.
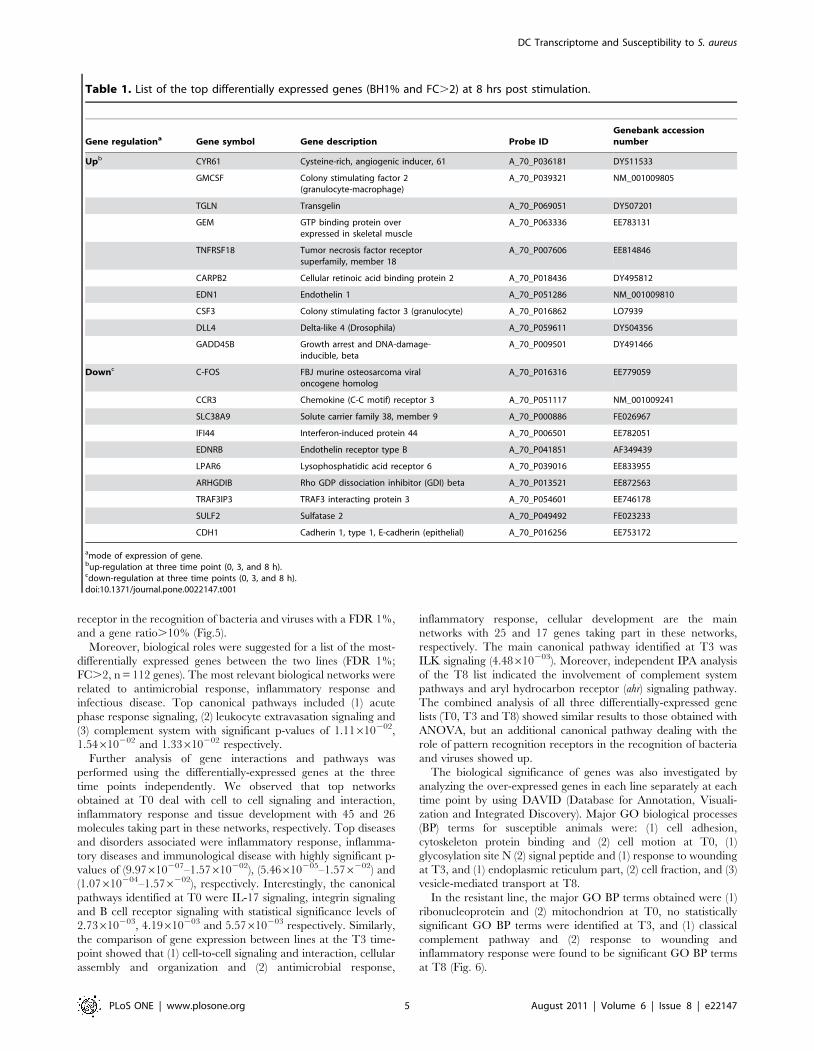
Globally, stimulation with HK-Sa modulated the gene expres-
sion of DCs and a number of genes involved in the pro-
inflammatory response were over-expressed such as il1a, 21b, 26
and tnfa, as previously indicated by the pre-microarray analysis by
DC Transcriptome and Susceptibility to S. aureus
PLoS ONE | www.plosone.org 2 August 2011 | Volume 6 | Issue 8 | e22147

RT-qPCR. Nfkb was highly expressed at 3 hrs and as late as 8 hrs
post-stimulation. Cd40 and cd83, important markers of dendritic
cell maturation were also up-regulated upon stimulation. Colony
stimulating factors (csf1, 22 and 23) involved in the production,
differentiation and function of granulocytes and macrophages
were among the most strongly up-regulated genes after interaction
with HK-Sa. The expression of a few chemokines (cxcl10 and cxcl16)
and chemokine receptors (cxcr5 and ccr7) was also up-regulated.
On the other hand, staphylococcal exposure of dendritic cells also
negatively modulated the expression of various genes, such as
adora3, ccr3, cfos, cdh1 and sulf2 which all showed lower expression 3
and 8 hrs post-stimulation.
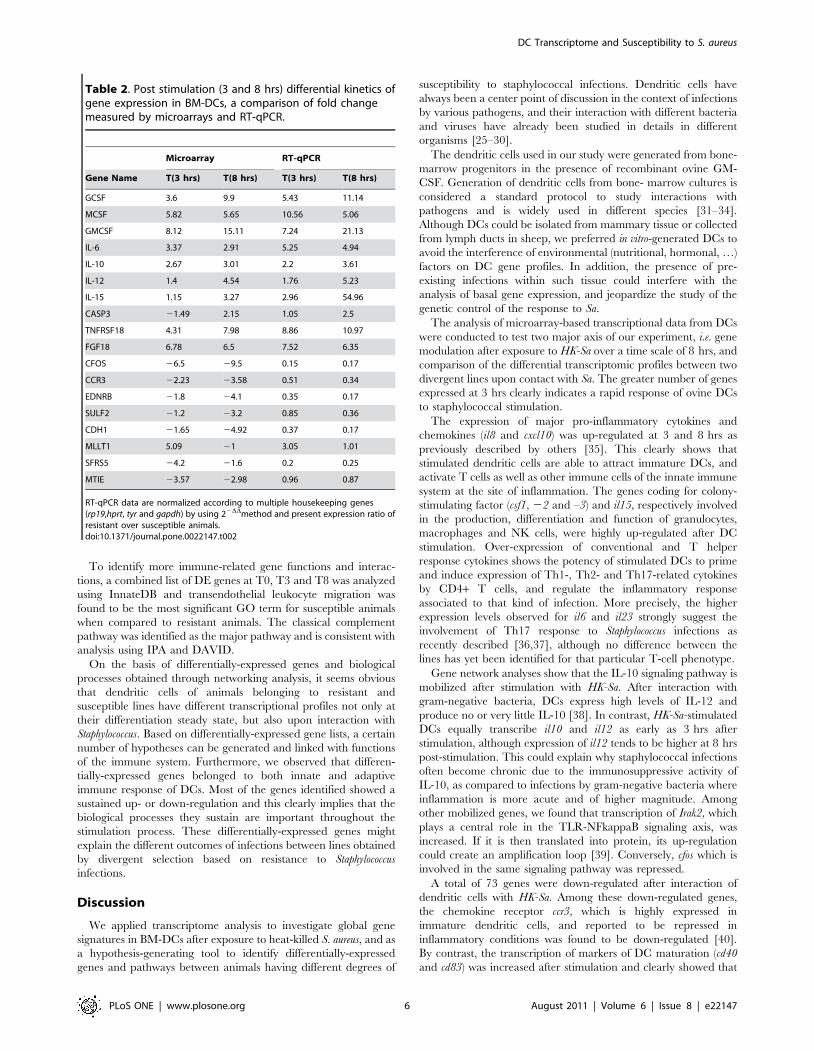
In order to validate our microarray results, the expression of 18
differentially-expressed genes (FDR p,0.01; FC.2) was measured
using RT-qPCR. Microarray and RT-qPCR results are compared
in table 2, which also shows a Pearson coefficient correlation of 0.9
between both methods (except for il-15 that was found to be
hugely up-regulated by RT-qPCR (54 fold) and much less so with
the microarray (3.27 fold). Statistical Mann-Whitney tests were
conducted on expression data and a minimum significance of
p,0.05 was observed for all quantified genes.
In conclusion, ovine BM-DCs responded strongly to the stimulus
and present a novel transcriptional profile upon stimulation with S.
aureus. The scale of the gene mobilization observed 3 and 8 hrs post-
stimulation revealed that gene reprogramming of dendritic cells
occurs after exposure to HK-Sa. The gene profiles obtained are
mostly associated with pro-inflammatory conditions.
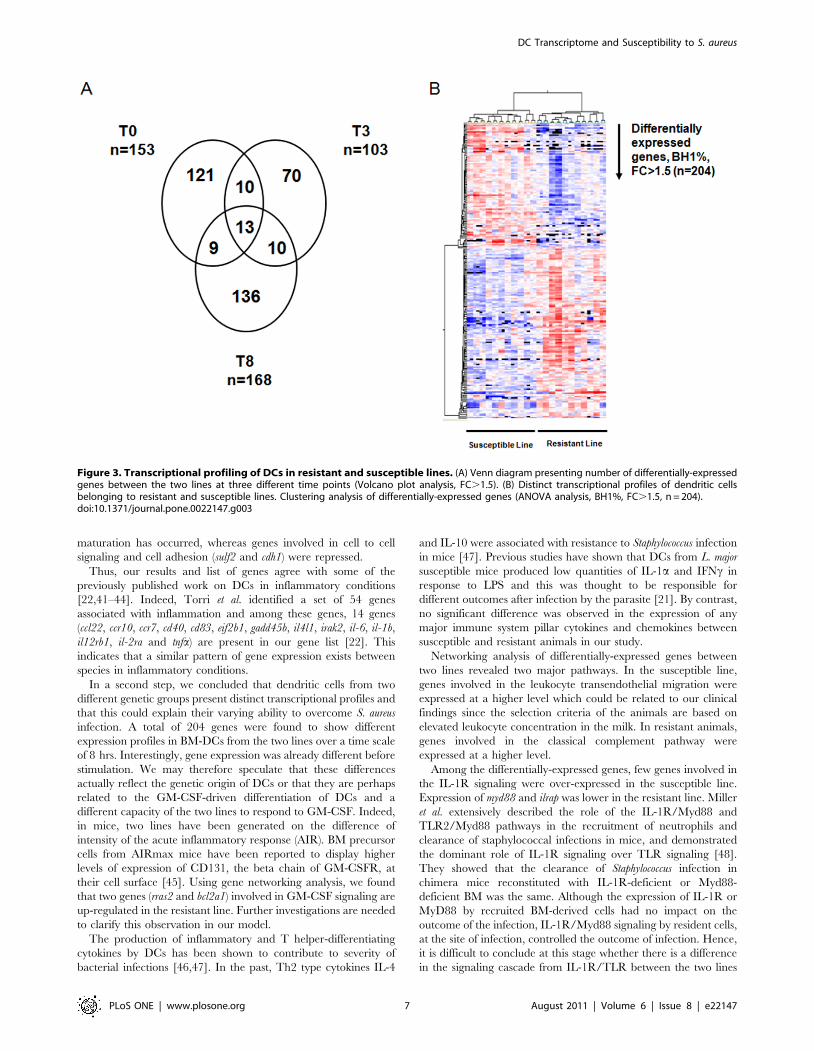
Comparison of transcriptional profiles of DCs fromsusceptible and resistant animals
Using the same ANOVA, the gene expression between genetic
lines was compared. Statistical analysis showed that 204 genes
were differentially-expressed between DCs of the two lines (BH
1%, FC.1.5) in at least one of the three time points (Table S2).
Overall, a FC.22 to 3 in the expression of differentially-
expressed genes was observed, with some quite important
differences in expression (several genes showed FCs of 27 or
+8). Moreover, animals belonging to susceptible and resistant lines
could be grouped perfectly on the basis of this differentially-
expressed gene list using Pearson-centered unsupervised hierar-
chical clustering (Fig. 3B). Furthermore, independent analysis
using a volcano plot (p,0.01; FC.1.5) was performed to identify
which genes were differentially expressed between the lines at each
of the three time points (Table S3). Indeed, 153 genes were found
to be differentially-expressed between both lines at T0. Among
these differentially-expressed genes at T0, 72 and 81 genes were
expressed at a higher level in the resistant and the susceptible line,
respectively. Moreover, 103 genes (respectively 44 and 59 genes in
resistant and susceptible animals) were modulated at T3, whereas
168 (respectively 95 and 73 in resistant and susceptible lines) genes
were found to show different levels of expression at T8.
Interestingly, only 13 genes were found in all three lists (Fig. 3A).
Although the majority of the genes identified with this statistical
method are on the ANOVA list, it provides additional information
about differentially-expressed genes at each time point instead of
Figure 1. Pre-microarray validation of DC activation by RT-qPCR. Relative expression of mRNAs of different cytokines at three time points (0,3 and 8 hrs post-stimulation) normalized by common reference genes (rp19, hprt, tyr and gapdh) by using 22DDmethod. Data was combined fromboth resistant and susceptible animals in this experiment (A) Pro inflammatory cytokines (Il1a, 21b, 26 and tnfa). (B) il8 (C) il15 (D) T helper polarizingcytokines (il10, 212 and 223p19) (E) Toll like receptors (tlr2, 24 and 26).doi:10.1371/journal.pone.0022147.g001
DC Transcriptome and Susceptibility to S. aureus
PLoS ONE | www.plosone.org 3 August 2011 | Volume 6 | Issue 8 | e22147

variations in gene expression between the lines over the 8-hr time
interval.
Among the ANOVA list of differentially-expressed genes, 106
genes showed higher expression levels in the resistant line, whereas
96 genes showed higher expression levels in the susceptible line.
Table 3 presents a list of the most differentially-expressed genes
between the lines at 8 hrs. Two genes (Irf4 and hook1) showed a
complex expression pattern over time and their expression varied
in both cell lines at both 3 and 8 hrs post-stimulation. Among the
differentially-expressed genes, a proportion of genes are known to
have immune system-related functions. Expression of some other
important immune genes (ilrap, myd88, ido1, fabp7, and il12rb1) was
also found to be different between animals of the two lines. Genes
coding for proteins involved in the classical complement pathway
were also found to be differentially expressed between the lines
upon HK-Sa stimulation (for example, c1qa, b and c were expressed
at higher levels in the resistant line). Furthermore, expression of
cd59, which is a regulator of the complement, was also found to be
up-regulated at T8 in the resistant line. Expression of MHC 1 was
higher in the resistant animals as compared to susceptible animals.
Genes belonging and related to the TRAF family (traf4, traf7,
and traf3ip2) were found to be differentially expressed between the
lines, as were a few genes coding for matrix metalloproteinase
family members (mmp9 and mmp12). Among differentially-
expressed genes, a number of genes belonged to the tripartite
motif family (trim2, trim39 and trim45). Several molecules involved
in cell to cell adhesion were also differentially expressed between
the lines, such as cdh3 which was expressed at a higher level in the
resistant animals, and icam1 and icam3 which were down-regulated
in the same line. Ssrp1, prg3, lama3, and gjb2 were among the most
over-expressed genes in the resistant line whereas postn, tmem87b,
olfml3, naga and tnc were the least expressed genes in that line.
Fifteen differentially-expressed genes were selected and their
quantification was done through RT-qPCR. For most of
differentially-expressed genes between lines, a strong correlation
(r = 0.7–0.9) existed between microarray and RT-qPCR results.
Statistical Mann-Whitney tests were conducted on expression data
and a minimum significance of p,0.05 was observed, validating at
the same time the microarray results on a panel of genes. Data are
presented as a ratio of genes of the resistant over the susceptible
line (Fig. 4).
Gene Network Analysis of differentially-expressed genelists
Systemic identification and grouping of differentially-expressed
genes into biological networks was performed using three data
mining software packages (Ingenuity Pathway Analysis, Database
for Annotation, Visualization and Integrated Discovery and Innate
immune DataBase). Ingenuity Pathway Analysis (IPA) was
conducted using human ortholog names (HUGO terms).
We first analyzed the networking of genes showing time-
dependent expression after staphylococcal stimulation. Immuno-
logical disease and inflammatory processes were among the top
biological functions that came up with highly significant p-values
of (5.25610216–2.18610206) and (9.11610216–1.94610206) re-
spectively. Moreover, 112 and 105 molecules belong to these
networks and most of the genes from the initial 419-gene list were
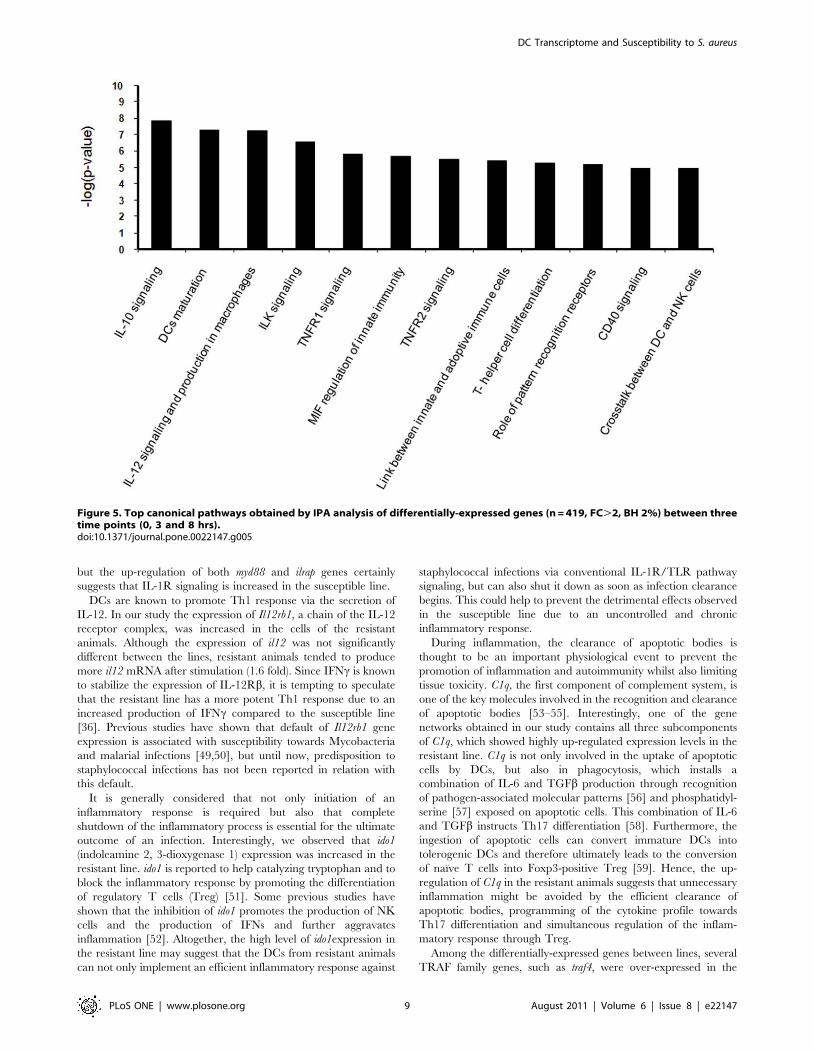
found in link with immune system pathways. IPA also gave a list of
top canonical pathways such as IL-10 signaling, dendritic cell
maturation, IL-12 signaling and production in macrophages, ILK
signaling, TNFR1 signaling, MIF regulation of innate immunity,
communication between innate and adaptive immune cells, T
helper cell differentiation and the role of pattern recognition
Figure 2. DC gene signature upon Staphylococcus aureus interaction at three different time points (0, 3 and 8 hrs). (A) Clusteringanalysis of differentially expressed genes (BH1%, FC.2, n = 419) at 0, 3 and 8 hrs post stimulation. (B) Rapidly exhausted genes subset (n = 176) (C)Post-stimulation up-regulated genes subset (n = 120) (D) Down-regulated genes at 3 hrs but up-regulated at 8 hrs post-stimulation (n = 63) (E) Poststimulation down-regulated genes (n = 60).doi:10.1371/journal.pone.0022147.g002
DC Transcriptome and Susceptibility to S. aureus
PLoS ONE | www.plosone.org 4 August 2011 | Volume 6 | Issue 8 | e22147
receptor in the recognition of bacteria and viruses with a FDR 1%,
and a gene ratio.10% (Fig.5).
Moreover, biological roles were suggested for a list of the most-
differentially expressed genes between the two lines (FDR 1%;
FC.2, n = 112 genes). The most relevant biological networks were
related to antimicrobial response, inflammatory response and
infectious disease. Top canonical pathways included (1) acute
phase response signaling, (2) leukocyte extravasation signaling and
(3) complement system with significant p-values of 1.11610202,
1.54610202 and 1.33610202 respectively.
Further analysis of gene interactions and pathways was
performed using the differentially-expressed genes at the three
time points independently. We observed that top networks
obtained at T0 deal with cell to cell signaling and interaction,
inflammatory response and tissue development with 45 and 26
molecules taking part in these networks, respectively. Top diseases
and disorders associated were inflammatory response, inflamma-
tory diseases and immunological disease with highly significant p-
values of (9.97610207–1.57610202), (5.46610205–1.576202) and
(1.07610204–1.576202), respectively. Interestingly, the canonical
pathways identified at T0 were IL-17 signaling, integrin signaling
and B cell receptor signaling with statistical significance levels of
2.73610203, 4.19610203 and 5.57610203 respectively. Similarly,
the comparison of gene expression between lines at the T3 time-
point showed that (1) cell-to-cell signaling and interaction, cellular
assembly and organization and (2) antimicrobial response,
inflammatory response, cellular development are the main
networks with 25 and 17 genes taking part in these networks,
respectively. The main canonical pathway identified at T3 was
ILK signaling (4.48610203). Moreover, independent IPA analysis
of the T8 list indicated the involvement of complement system
pathways and aryl hydrocarbon receptor (ahr) signaling pathway.
The combined analysis of all three differentially-expressed gene
lists (T0, T3 and T8) showed similar results to those obtained with
ANOVA, but an additional canonical pathway dealing with the
role of pattern recognition receptors in the recognition of bacteria
and viruses showed up.
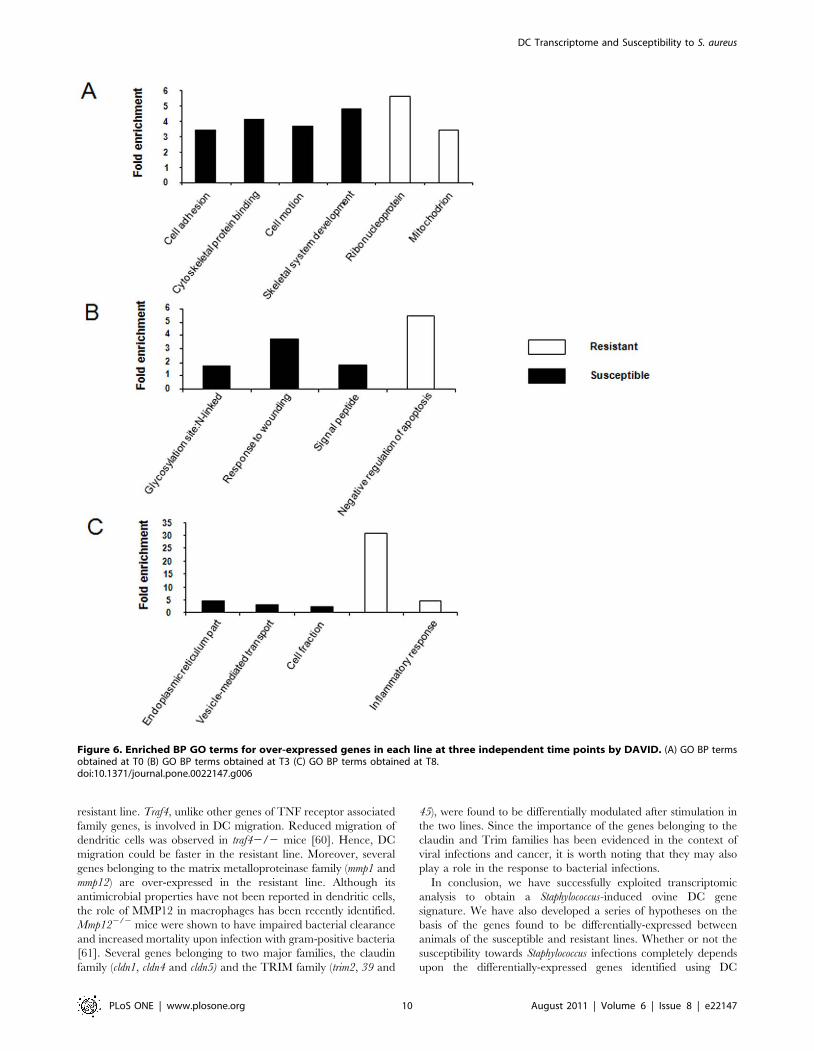
The biological significance of genes was also investigated by
analyzing the over-expressed genes in each line separately at each
time point by using DAVID (Database for Annotation, Visuali-
zation and Integrated Discovery). Major GO biological processes
(BP) terms for susceptible animals were: (1) cell adhesion,
cytoskeleton protein binding and (2) cell motion at T0, (1)
glycosylation site N (2) signal peptide and (1) response to wounding
at T3, and (1) endoplasmic reticulum part, (2) cell fraction, and (3)
vesicle-mediated transport at T8.
In the resistant line, the major GO BP terms obtained were (1)
ribonucleoprotein and (2) mitochondrion at T0, no statistically
significant GO BP terms were identified at T3, and (1) classical
complement pathway and (2) response to wounding and
inflammatory response were found to be significant GO BP terms
at T8 (Fig. 6).
Table 1. List of the top differentially expressed genes (BH1% and FC.2) at 8 hrs post stimulation.
Gene regulationa Gene symbol Gene description Probe IDGenebank accessionnumber
Upb CYR61 Cysteine-rich, angiogenic inducer, 61 A_70_P036181 DY511533
GMCSF Colony stimulating factor 2(granulocyte-macrophage)
A_70_P039321 NM_001009805
TGLN Transgelin A_70_P069051 DY507201
GEM GTP binding protein overexpressed in skeletal muscle
A_70_P063336 EE783131
TNFRSF18 Tumor necrosis factor receptorsuperfamily, member 18
A_70_P007606 EE814846
CARPB2 Cellular retinoic acid binding protein 2 A_70_P018436 DY495812
EDN1 Endothelin 1 A_70_P051286 NM_001009810
CSF3 Colony stimulating factor 3 (granulocyte) A_70_P016862 LO7939
DLL4 Delta-like 4 (Drosophila) A_70_P059611 DY504356
GADD45B Growth arrest and DNA-damage-inducible, beta
A_70_P009501 DY491466
Downc C-FOS FBJ murine osteosarcoma viraloncogene homolog
A_70_P016316 EE779059
CCR3 Chemokine (C-C motif) receptor 3 A_70_P051117 NM_001009241
SLC38A9 Solute carrier family 38, member 9 A_70_P000886 FE026967
IFI44 Interferon-induced protein 44 A_70_P006501 EE782051
EDNRB Endothelin receptor type B A_70_P041851 AF349439
LPAR6 Lysophosphatidic acid receptor 6 A_70_P039016 EE833955
ARHGDIB Rho GDP dissociation inhibitor (GDI) beta A_70_P013521 EE872563
TRAF3IP3 TRAF3 interacting protein 3 A_70_P054601 EE746178
SULF2 Sulfatase 2 A_70_P049492 FE023233
CDH1 Cadherin 1, type 1, E-cadherin (epithelial) A_70_P016256 EE753172
amode of expression of gene.bup-regulation at three time point (0, 3, and 8 h).cdown-regulation at three time points (0, 3, and 8 h).doi:10.1371/journal.pone.0022147.t001
DC Transcriptome and Susceptibility to S. aureus
PLoS ONE | www.plosone.org 5 August 2011 | Volume 6 | Issue 8 | e22147
To identify more immune-related gene functions and interac-
tions, a combined list of DE genes at T0, T3 and T8 was analyzed
using InnateDB and transendothelial leukocyte migration was
found to be the most significant GO term for susceptible animals
when compared to resistant animals. The classical complement
pathway was identified as the major pathway and is consistent with
analysis using IPA and DAVID.
On the basis of differentially-expressed genes and biological
processes obtained through networking analysis, it seems obvious
that dendritic cells of animals belonging to resistant and
susceptible lines have different transcriptional profiles not only at
their differentiation steady state, but also upon interaction with
Staphylococcus. Based on differentially-expressed gene lists, a certain
number of hypotheses can be generated and linked with functions
of the immune system. Furthermore, we observed that differen-
tially-expressed genes belonged to both innate and adaptive
immune response of DCs. Most of the genes identified showed a
sustained up- or down-regulation and this clearly implies that the
biological processes they sustain are important throughout the
stimulation process. These differentially-expressed genes might
explain the different outcomes of infections between lines obtained
by divergent selection based on resistance to Staphylococcus
infections.
Discussion
We applied transcriptome analysis to investigate global gene
signatures in BM-DCs after exposure to heat-killed S. aureus, and as
a hypothesis-generating tool to identify differentially-expressed
genes and pathways between animals having different degrees of
susceptibility to staphylococcal infections. Dendritic cells have
always been a center point of discussion in the context of infections
by various pathogens, and their interaction with different bacteria
and viruses have already been studied in details in different
organisms [25–30].
The dendritic cells used in our study were generated from bone-
marrow progenitors in the presence of recombinant ovine GM-
CSF. Generation of dendritic cells from bone- marrow cultures is
considered a standard protocol to study interactions with
pathogens and is widely used in different species [31–34].
Although DCs could be isolated from mammary tissue or collected
from lymph ducts in sheep, we preferred in vitro-generated DCs to
avoid the interference of environmental (nutritional, hormonal, …)
factors on DC gene profiles. In addition, the presence of pre-
existing infections within such tissue could interfere with the
analysis of basal gene expression, and jeopardize the study of the
genetic control of the response to Sa.
The analysis of microarray-based transcriptional data from DCs
were conducted to test two major axis of our experiment, i.e. gene
modulation after exposure to HK-Sa over a time scale of 8 hrs, and
comparison of the differential transcriptomic profiles between two
divergent lines upon contact with Sa. The greater number of genes
expressed at 3 hrs clearly indicates a rapid response of ovine DCs
to staphylococcal stimulation.
The expression of major pro-inflammatory cytokines and
chemokines (il8 and cxcl10) was up-regulated at 3 and 8 hrs as
previously described by others [35]. This clearly shows that
stimulated dendritic cells are able to attract immature DCs, and
activate T cells as well as other immune cells of the innate immune
system at the site of inflammation. The genes coding for colony-
stimulating factor (csf1, 22 and –3) and il15, respectively involved
in the production, differentiation and function of granulocytes,
macrophages and NK cells, were highly up-regulated after DC
stimulation. Over-expression of conventional and T helper
response cytokines shows the potency of stimulated DCs to prime
and induce expression of Th1-, Th2- and Th17-related cytokines
by CD4+ T cells, and regulate the inflammatory response
associated to that kind of infection. More precisely, the higher
expression levels observed for il6 and il23 strongly suggest the
involvement of Th17 response to Staphylococcus infections as
recently described [36,37], although no difference between the
lines has yet been identified for that particular T-cell phenotype.
Gene network analyses show that the IL-10 signaling pathway is
mobilized after stimulation with HK-Sa. After interaction with
gram-negative bacteria, DCs express high levels of IL-12 and
produce no or very little IL-10 [38]. In contrast, HK-Sa-stimulated
DCs equally transcribe il10 and il12 as early as 3 hrs after
stimulation, although expression of il12 tends to be higher at 8 hrs
post-stimulation. This could explain why staphylococcal infections
often become chronic due to the immunosuppressive activity of
IL-10, as compared to infections by gram-negative bacteria where
inflammation is more acute and of higher magnitude. Among
other mobilized genes, we found that transcription of Irak2, which
plays a central role in the TLR-NFkappaB signaling axis, was
increased. If it is then translated into protein, its up-regulation
could create an amplification loop [39]. Conversely, cfos which is
involved in the same signaling pathway was repressed.
A total of 73 genes were down-regulated after interaction of
dendritic cells with HK-Sa. Among these down-regulated genes,
the chemokine receptor ccr3, which is highly expressed in
immature dendritic cells, and reported to be repressed in
inflammatory conditions was found to be down-regulated [40].
By contrast, the transcription of markers of DC maturation (cd40
and cd83) was increased after stimulation and clearly showed that
Table 2. Post stimulation (3 and 8 hrs) differential kinetics ofgene expression in BM-DCs, a comparison of fold changemeasured by microarrays and RT-qPCR.
Microarray RT-qPCR
Gene Name T(3 hrs) T(8 hrs) T(3 hrs) T(8 hrs)
GCSF 3.6 9.9 5.43 11.14
MCSF 5.82 5.65 10.56 5.06
GMCSF 8.12 15.11 7.24 21.13
IL-6 3.37 2.91 5.25 4.94
IL-10 2.67 3.01 2.2 3.61
IL-12 1.4 4.54 1.76 5.23
IL-15 1.15 3.27 2.96 54.96
CASP3 21.49 2.15 1.05 2.5
TNFRSF18 4.31 7.98 8.86 10.97
FGF18 6.78 6.5 7.52 6.35
CFOS 26.5 29.5 0.15 0.17
CCR3 22.23 23.58 0.51 0.34
EDNRB 21.8 24.1 0.35 0.17
SULF2 21.2 23.2 0.85 0.36
CDH1 21.65 24.92 0.37 0.17
MLLT1 5.09 21 3.05 1.01
SFRS5 24.2 21.6 0.2 0.25
MTIE 23.57 22.98 0.96 0.87
RT-qPCR data are normalized according to multiple housekeeping genes(rp19,hprt, tyr and gapdh) by using 22DDmethod and present expression ratio ofresistant over susceptible animals.doi:10.1371/journal.pone.0022147.t002
DC Transcriptome and Susceptibility to S. aureus
PLoS ONE | www.plosone.org 6 August 2011 | Volume 6 | Issue 8 | e22147
maturation has occurred, whereas genes involved in cell to cell
signaling and cell adhesion (sulf2 and cdh1) were repressed.
Thus, our results and list of genes agree with some of the
previously published work on DCs in inflammatory conditions
[22,41–44]. Indeed, Torri et al. identified a set of 54 genes
associated with inflammation and among these genes, 14 genes
(ccl22, ccr10, ccr7, cd40, cd83, eif2b1, gadd45b, il4l1, irak2, il-6, il-1b,
il12rb1, il-2ra and tnfa) are present in our gene list [22]. This
indicates that a similar pattern of gene expression exists between
species in inflammatory conditions.
In a second step, we concluded that dendritic cells from two
different genetic groups present distinct transcriptional profiles and
that this could explain their varying ability to overcome S. aureus
infection. A total of 204 genes were found to show different
expression profiles in BM-DCs from the two lines over a time scale
of 8 hrs. Interestingly, gene expression was already different before
stimulation. We may therefore speculate that these differences
actually reflect the genetic origin of DCs or that they are perhaps
related to the GM-CSF-driven differentiation of DCs and a
different capacity of the two lines to respond to GM-CSF. Indeed,
in mice, two lines have been generated on the difference of
intensity of the acute inflammatory response (AIR). BM precursor
cells from AIRmax mice have been reported to display higher
levels of expression of CD131, the beta chain of GM-CSFR, at
their cell surface [45]. Using gene networking analysis, we found
that two genes (rras2 and bcl2a1) involved in GM-CSF signaling are
up-regulated in the resistant line. Further investigations are needed
to clarify this observation in our model.
The production of inflammatory and T helper-differentiating
cytokines by DCs has been shown to contribute to severity of
bacterial infections [46,47]. In the past, Th2 type cytokines IL-4
and IL-10 were associated with resistance to Staphylococcus infection
in mice [47]. Previous studies have shown that DCs from L. major
susceptible mice produced low quantities of IL-1a and IFNc in
response to LPS and this was thought to be responsible for
different outcomes after infection by the parasite [21]. By contrast,
no significant difference was observed in the expression of any
major immune system pillar cytokines and chemokines between
susceptible and resistant animals in our study.
Networking analysis of differentially-expressed genes between
two lines revealed two major pathways. In the susceptible line,
genes involved in the leukocyte transendothelial migration were
expressed at a higher level which could be related to our clinical
findings since the selection criteria of the animals are based on
elevated leukocyte concentration in the milk. In resistant animals,
genes involved in the classical complement pathway were
expressed at a higher level.
Among the differentially-expressed genes, few genes involved in
the IL-1R signaling were over-expressed in the susceptible line.
Expression of myd88 and ilrap was lower in the resistant line. Miller
et al. extensively described the role of the IL-1R/Myd88 and
TLR2/Myd88 pathways in the recruitment of neutrophils and
clearance of staphylococcal infections in mice, and demonstrated
the dominant role of IL-1R signaling over TLR signaling [48].
They showed that the clearance of Staphylococcus infection in
chimera mice reconstituted with IL-1R-deficient or Myd88-
deficient BM was the same. Although the expression of IL-1R or
MyD88 by recruited BM-derived cells had no impact on the
outcome of the infection, IL-1R/Myd88 signaling by resident cells,
at the site of infection, controlled the outcome of infection. Hence,
it is difficult to conclude at this stage whether there is a difference
in the signaling cascade from IL-1R/TLR between the two lines
Figure 3. Transcriptional profiling of DCs in resistant and susceptible lines. (A) Venn diagram presenting number of differentially-expressedgenes between the two lines at three different time points (Volcano plot analysis, FC.1.5). (B) Distinct transcriptional profiles of dendritic cellsbelonging to resistant and susceptible lines. Clustering analysis of differentially-expressed genes (ANOVA analysis, BH1%, FC.1.5, n = 204).doi:10.1371/journal.pone.0022147.g003
DC Transcriptome and Susceptibility to S. aureus
PLoS ONE | www.plosone.org 7 August 2011 | Volume 6 | Issue 8 | e22147
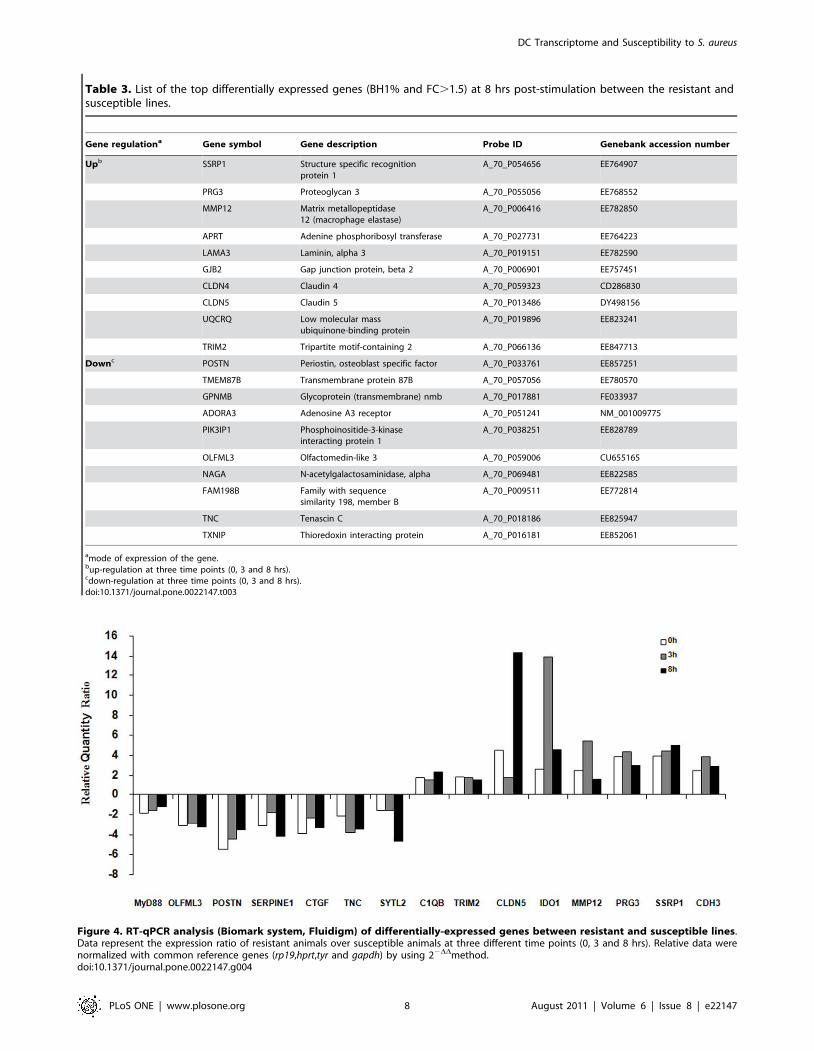
Table 3. List of the top differentially expressed genes (BH1% and FC.1.5) at 8 hrs post-stimulation between the resistant andsusceptible lines.
Gene regulationa Gene symbol Gene description Probe ID Genebank accession number
Upb SSRP1 Structure specific recognitionprotein 1
A_70_P054656 EE764907
PRG3 Proteoglycan 3 A_70_P055056 EE768552
MMP12 Matrix metallopeptidase12 (macrophage elastase)
A_70_P006416 EE782850
APRT Adenine phosphoribosyl transferase A_70_P027731 EE764223
LAMA3 Laminin, alpha 3 A_70_P019151 EE782590
GJB2 Gap junction protein, beta 2 A_70_P006901 EE757451
CLDN4 Claudin 4 A_70_P059323 CD286830
CLDN5 Claudin 5 A_70_P013486 DY498156
UQCRQ Low molecular massubiquinone-binding protein
A_70_P019896 EE823241
TRIM2 Tripartite motif-containing 2 A_70_P066136 EE847713
Downc POSTN Periostin, osteoblast specific factor A_70_P033761 EE857251
TMEM87B Transmembrane protein 87B A_70_P057056 EE780570
GPNMB Glycoprotein (transmembrane) nmb A_70_P017881 FE033937
ADORA3 Adenosine A3 receptor A_70_P051241 NM_001009775
PIK3IP1 Phosphoinositide-3-kinaseinteracting protein 1
A_70_P038251 EE828789
OLFML3 Olfactomedin-like 3 A_70_P059006 CU655165
NAGA N-acetylgalactosaminidase, alpha A_70_P069481 EE822585
FAM198B Family with sequencesimilarity 198, member B
A_70_P009511 EE772814
TNC Tenascin C A_70_P018186 EE825947
TXNIP Thioredoxin interacting protein A_70_P016181 EE852061
amode of expression of the gene.bup-regulation at three time points (0, 3 and 8 hrs).cdown-regulation at three time points (0, 3 and 8 hrs).doi:10.1371/journal.pone.0022147.t003
Figure 4. RT-qPCR analysis (Biomark system, Fluidigm) of differentially-expressed genes between resistant and susceptible lines.Data represent the expression ratio of resistant animals over susceptible animals at three different time points (0, 3 and 8 hrs). Relative data werenormalized with common reference genes (rp19,hprt,tyr and gapdh) by using 22DDmethod.doi:10.1371/journal.pone.0022147.g004
DC Transcriptome and Susceptibility to S. aureus
PLoS ONE | www.plosone.org 8 August 2011 | Volume 6 | Issue 8 | e22147
but the up-regulation of both myd88 and ilrap genes certainly
suggests that IL-1R signaling is increased in the susceptible line.
DCs are known to promote Th1 response via the secretion of
IL-12. In our study the expression of Il12rb1, a chain of the IL-12
receptor complex, was increased in the cells of the resistant
animals. Although the expression of il12 was not significantly
different between the lines, resistant animals tended to produce
more il12 mRNA after stimulation (1.6 fold). Since IFNc is known
to stabilize the expression of IL-12Rb, it is tempting to speculate
that the resistant line has a more potent Th1 response due to an
increased production of IFNc compared to the susceptible line
[36]. Previous studies have shown that default of Il12rb1 gene
expression is associated with susceptibility towards Mycobacteria
and malarial infections [49,50], but until now, predisposition to
staphylococcal infections has not been reported in relation with
this default.
It is generally considered that not only initiation of an
inflammatory response is required but also that complete
shutdown of the inflammatory process is essential for the ultimate
outcome of an infection. Interestingly, we observed that ido1
(indoleamine 2, 3-dioxygenase 1) expression was increased in the
resistant line. ido1 is reported to help catalyzing tryptophan and to
block the inflammatory response by promoting the differentiation
of regulatory T cells (Treg) [51]. Some previous studies have
shown that the inhibition of ido1 promotes the production of NK
cells and the production of IFNs and further aggravates
inflammation [52]. Altogether, the high level of ido1expression in
the resistant line may suggest that the DCs from resistant animals
can not only implement an efficient inflammatory response against
staphylococcal infections via conventional IL-1R/TLR pathway
signaling, but can also shut it down as soon as infection clearance
begins. This could help to prevent the detrimental effects observed
in the susceptible line due to an uncontrolled and chronic
inflammatory response.
During inflammation, the clearance of apoptotic bodies is
thought to be an important physiological event to prevent the
promotion of inflammation and autoimmunity whilst also limiting
tissue toxicity. C1q, the first component of complement system, is
one of the key molecules involved in the recognition and clearance
of apoptotic bodies [53–55]. Interestingly, one of the gene
networks obtained in our study contains all three subcomponents
of C1q, which showed highly up-regulated expression levels in the
resistant line. C1q is not only involved in the uptake of apoptotic
cells by DCs, but also in phagocytosis, which installs a
combination of IL-6 and TGFb production through recognition
of pathogen-associated molecular patterns [56] and phosphatidyl-
serine [57] exposed on apoptotic cells. This combination of IL-6
and TGFb instructs Th17 differentiation [58]. Furthermore, the
ingestion of apoptotic cells can convert immature DCs into
tolerogenic DCs and therefore ultimately leads to the conversion
of naıve T cells into Foxp3-positive Treg [59]. Hence, the up-
regulation of C1q in the resistant animals suggests that unnecessary
inflammation might be avoided by the efficient clearance of
apoptotic bodies, programming of the cytokine profile towards
Th17 differentiation and simultaneous regulation of the inflam-
matory response through Treg.
Among the differentially-expressed genes between lines, several
TRAF family genes, such as traf4, were over-expressed in the
Figure 5. Top canonical pathways obtained by IPA analysis of differentially-expressed genes (n = 419, FC.2, BH 2%) between threetime points (0, 3 and 8 hrs).doi:10.1371/journal.pone.0022147.g005
DC Transcriptome and Susceptibility to S. aureus
PLoS ONE | www.plosone.org 9 August 2011 | Volume 6 | Issue 8 | e22147
resistant line. Traf4, unlike other genes of TNF receptor associated
family genes, is involved in DC migration. Reduced migration of
dendritic cells was observed in traf42/2 mice [60]. Hence, DC
migration could be faster in the resistant line. Moreover, several
genes belonging to the matrix metalloproteinase family (mmp1 and
mmp12) are over-expressed in the resistant line. Although its
antimicrobial properties have not been reported in dendritic cells,
the role of MMP12 in macrophages has been recently identified.
Mmp122/2 mice were shown to have impaired bacterial clearance
and increased mortality upon infection with gram-positive bacteria
[61]. Several genes belonging to two major families, the claudin
family (cldn1, cldn4 and cldn5) and the TRIM family (trim2, 39 and
45), were found to be differentially modulated after stimulation in
the two lines. Since the importance of the genes belonging to the
claudin and Trim families has been evidenced in the context of
viral infections and cancer, it is worth noting that they may also
play a role in the response to bacterial infections.
In conclusion, we have successfully exploited transcriptomic
analysis to obtain a Staphylococcus-induced ovine DC gene
signature. We have also developed a series of hypotheses on the
basis of the genes found to be differentially-expressed between
animals of the susceptible and resistant lines. Whether or not the
susceptibility towards Staphylococcus infections completely depends
upon the differentially-expressed genes identified using DC
Figure 6. Enriched BP GO terms for over-expressed genes in each line at three independent time points by DAVID. (A) GO BP termsobtained at T0 (B) GO BP terms obtained at T3 (C) GO BP terms obtained at T8.doi:10.1371/journal.pone.0022147.g006
DC Transcriptome and Susceptibility to S. aureus
PLoS ONE | www.plosone.org 10 August 2011 | Volume 6 | Issue 8 | e22147

transcriptomics remains unknown at this stage. But the differences
observed for genes with immune-related functions lead us to
speculate on a central role for dendritic cells in the context of
staphylococcal infections. Hence, the differentially-expressed genes
identified in this study should be further investigated using
laboratory models to confirm our hypothesis. To our knowledge,
this the first study investigating immunity against S. aureus in an
outbred animal model of such genetic variability. Our study has
opened some new avenues which will need further exploration and
lead to a better understanding staphylococcal immunity and
resistance.
Materials and Methods
AnimalsTwo-year old ewes (Lacaune breed) from resistant (n = 4) and
susceptible lines (n = 4) were issued from a divergent selection on
the basis of estimated breeding values for the somatic cell score, an
indicator of intra-mammary infections; they had no parental links.
Previous studies conducted on these genetic lines indicated a
significant difference of susceptibility to intramammary infections
by Staphylococci [14]. Since these infections are principally due to
Staphylococcus spp, the genetic trait is highly related to the
susceptibility to this bacteria genus. Moreover, the ewes used in
that study were challenged twice with two different species
(Staphylococcus epidermidis and S. aureus) and the results of
bacteriology, disease severity and abscess formation indicated a
significant difference of susceptibility between the groups (EF, RR,
GF, manuscript in preparation). The ewes were thus chosen as
representative of their genetic lines. Animals were sacrificed in
accordance with local regulations (Agreement number Nu31-2010-
67). This study was approved by the INRA animal ethics
committee (France).
Generation and stimulation of bone marrow-deriveddendritic cells
The DCs used in this study were generated from bone-marrow
progenitors following a protocol previously described by our group
[62]. Briefly, bone marrow was prepared from the sternum after
longitudinal section in two halves and scraping of the red marrow.
Bone marrow cells were released by crushing the marrow in a
100 mm Petri dish filled with 10 ml HBSS medium (Invitrogen).
Cells were suspended by carefully pipetting up and down, and
were then passed through a 100-mm nylon mesh to remove small
pieces of bone and debris. Red blood cells were lysed by ACK
treatment for 2–3 min at room temperature. Cells were then
suspended in complete RPMI medium and cultured in 100 mm
bacteriological dishes at 37uC, 5% CO2 for 7 days. Complete
medium was RPMI 1640 (Invitrogen) containing 2 mM gluta-
mine, 25 mM HEPES, 10% FCS, 1% penicillin/streptomycin,
1% sodium pyruvate, 1% essential amino acids, 50 mM b-
mercaptoethanol. cRPMI medium was supplemented with
20 ng/ml ovine recombinant GM-CSF. Fresh medium containing
the same concentration of recombinant cytokine was added every
3 days. After seven days of culture, cells were characterized by flow
cytometry. BM-DCs were seeded in cell culture plates at a
concentration of 1.5x10⁶ cell/ml and stimulated with 20 mg/ml
Pansorbin for 3 and 8 hrs.
RNA extraction, amplification and labelingTotal RNA was extracted using the classical extraction method
with phenol/chloroform (TRIzol, Invitrogen). Extracted RNA was
further purified on RNeasy columns (Qiagen). Quantification was
performed using a spectrophotometer (NanoDrop Technologies)
and RNA quality was assessed using an Agilent Bioanalyzer 2100
slide. A RNA Integrity Number (RIN) index above 9 was
measured for all samples. 200 ng of RNA was converted into
double-stranded cDNA and amplified with the Amino Allyl
Message Amp II aRNA amplification procedure (Ambion kit) and
then labelled with Cy3 and Cy5 for hybridization in a two-colour
dye-swap experimental design.
Hybridization, scanning and raw data storageThree ovine 019921 slides (Agilent Technologies), with eight
microarrays each containing 15,008 probes were used. The chips
were hybridized with labeled RNA at 65uC for 17 hrs and then
washed according to the manufacturer’s protocol. Intensity values
were collected with a 4000B Axon scanner. Two channel images
were imported into the Agilent’s Feature Extraction software for
feature (spot) finding and alignment. Features were flagged as
present/absent, saturated/unsaturated, uniform/non-uniform and
pixel intensities for features and background were recorded.
Pearson correlation coefficients taken from plotting signal
intensity values of dye-swap chips across all genes validated that
duplicate experiments were nearly similar. Output Feature
Extraction result (.txt) files were transferred into GeneSpring
GX 11. LOESS-normalized data were imported as a single
channel data to perform probe by probe analysis and a percentile
shift to the median was performed for normalization across arrays.
Data were filtered to remove spots that were of very low intensity,
saturated, or not uniform. In order to keep only genes that were
very representative of one condition, only genes that were
positively flagged in all samples for at least one condition (resistant
line at T0, T3, and T8, and susceptible line at T0, T3, and T8)
were conserved for further analysis.
Annotation of ovine microarrayOn the ovine array, 15,208 different probes are present, but
only 8,847 of these are annotated with the Human ortholog
HUGO Gene Nomenclature Committee (HGNC) (http://www.
sigenae.org/, sheep oligo annotation version 6 of 2010/06/14).
More genes were annotated using GeneBank and Basic Local
Alignment Search Tool program on the NCBI website (http://
blast.ncbi.nlm.nih.gov/Blast.cgi). A threshold value of 80% hit
score was considered as a minimum criterion.
Statistical analysis of microarray dataStatistical analysis of microarray data was carried out using the
commercially available software package GenespringH. Two-way
ANOVA by Line and Time was performed to select genes that
were differentially expressed between different conditions with a p-
value corrected by Benjamini Hochberg false discovery rate. The
interaction between Line and Time was tested, but it was not
significant and was removed from the statistical model. The
expression profiles for these genes were clustered over the line or
over the time using the hierarchical clustering of GeneSpring
based on the Pearson-centered gene distance. Information about
this experiment has been deposited in NCBI Gene Expression
Omnibus (GEO) with accession number (GSE24448). All data is
Minimum Information About a Microarray Experiment (MIAME)
compliant.
Gene networking analysisThree freely available software packages were used to interpret
the biological functions of the gene lists. Initially networking
analyses were conducted using Ingenuity Pathway Analysis,
version 7.5 (http://www.Ingenuity.com). In addition to generating
DC Transcriptome and Susceptibility to S. aureus
PLoS ONE | www.plosone.org 11 August 2011 | Volume 6 | Issue 8 | e22147
biological networks from a list of selected genes, this software
provides biological functions and canonical pathways from
HUGO ortholog names of the genes that were imported into
the program. A network of genes is created when a gene regulates
the function of another one. To generate a network, the IPA
software adds other genes and/or different molecules that are
linked with two focus genes. Gene Ontology (GO) Term analyses
were performed with DAVID (Database for Annotation, Visual-
ization and Integrated Discovery) (http://david.abcc.ncifcrf.gov/)
by using an independent list of differentially-expressed genes at
three time points (T0, T3 and T8) separately. Transcription factor
binding sites (TFBS) over-represented in differentially-expressed
gene list were identified using InnateDB (http://www.innatedb.
com).
Reverse transcription quantitative polymerase chainreaction (RT-qPCR)
cDNAs were generated from 300 ng of clean total RNA of 24
samples using the Superscript III First Strand Synthesis System Kit
(Invitrogen), and random hexamer primers, following the
manufacturer’s instructions.
The relative mRNA expression levels were verified using the
same RNA samples that had been analyzed in microarrays. For
quantification of mRNA transcripts, primer pairs were designed
using Primer3 [63] based on the relevant ovine mRNA sequences
and synthesized commercially (Eurogentec). The specificity of
designed primers was checked with other tools (BLAST, http://
blast.ncbi.nlm.nih.gov/) and Primer Express. For some genes for
which ovine sequence was not available, a comparative gene
alignment of bovine, human, rat and mouse sequences was
preformed, and primers were then designed on the most conserved
regions between these species. Optimal annealing temperatures
were determined for each primer pair, and the primers were
checked for absence of primer dimers and efficiency before use.
Primers used in RT-qPCR experiments are listed in Table S4.
RT-qPCR was performed following two different protocols
according to the number of genes to be tested. Expression of few
genes was tested in pre-microarray experiments and RT-qPCR
reactions were carried out on a 7300 machine (Applied
Biosystems). All assays were carried out in duplicate and each
reaction contained 5 ml of diluted cDNA with 2.5 ml (0.5 mM) of
each forward and reverse primer along with 12.5 ml of Power
Syber Green PCR Master Mix (Applied Biosystems).
The high-throughput microfluidic qPCR platform BioMarkTM
(Fluidigm) was used for post-microarray qPCR analysis running
the 48.48 dynamic-array. Pre-amplification of cDNA for all
samples was done with a pool of forward and reverse primers. Five
ml pre-amplification reaction contains 1.25 ml of pool of primers
with 2.5 ml TaqMANHPreAmp Master Mix and 1.3 ml cDNA. Pre
amplification of cDNA was carried out on an ABI thermocycler
with an initial step of activation (95uC for 10 min) followed by 14
cycles of two steps (95uC for 15 sec and 60uC for 4 min).
The sample reaction mixtures had a final volume of 6.7 ml and
made of 1.7 ml of diluted pre-amplified cDNA and 5 ml of sample
pre-mix containing 20x EvaGreen, 20x DNA Binding Dye Sample
loading reagent and 2x Taqman Gene Expression Master mix.
The primer reaction mixtures had also a final volume of 6.7 ml and
were made up of 5 ml of 2X Assay Loading reagent (Fluidigm) and
TE 1X and 1.7 ml of a mixture of reverse and forward primers
(20 mM). Empty dynamic array was first primed with oil solution
in the NanoFlexTM 4-IFC Controller (Fluidigm) to fill its control
valves for 20 min.
Five ml of sample reaction mixtures were then loaded into the
sample wells carefully avoiding any bubbles, and 5 ml of primer
reaction mixtures were loaded into the assay wells. The dynamic
array was then placed again into the NanoFlexTM 4-IFC
Controller for loading and mixing. The mixing takes place by
diffusion between the reaction chambers filled with sample reagent
and adjacent containers filled with the appropriate primers mix for
90 min. Loaded dynamic array was then transferred to the
BioMarkTM. The BioMarkTM qPCR cycling program was 50uCfor 2 min for amplification phase and 10 min at 95uC for
activation of the hot-start enzyme, followed by 35 cycles of
denaturation at 95uC for 15 s, annealing at 60uC for 1 min, and
elongation at 72uC for 20 s. Melting curve analysis was performed
after completion of the qPCR collecting fluorescence intensities
between 60 and 95uC.
RT-qPCR data analysis and normalizationSpecific amplification of each targeted cDNA was confirmed by
melt curve analysis. Measured Ct values were exported from the
BioMarkTM software to Excel for data analysis. qPCR technical
replicates of samples were averaged and expression ratios were
calculated by the delta delta Ct method normalized to the multiple
housekeeping genes [64]. Statistical significance of analysis was
calculated using Mann-Whitney tests. Beforehand the stability of
10 house keeping genes, previously mentioned in the literature,
was checked in our 24 samples and data obtained was then
analyzed by GeNorm, a software package freely available for
research use. Hence, RT-qPCR data were normalized against the
four most stable genes (rp19, hprt, tyr and gapdh) found by GeNorm
analysis.
Supporting Information
Table S1 List of the differentially expressed genes inthe time course identified by ANOVA of microarray data(FC.2, BH1%, n = 419) at 0, 3 and 8 hrs.(XLS)
Table S2 List of the differentially-expressed genesbetween resistant and susceptible lines at 0, 3 and8 hrs by ANOVA of microarray data (FC.1.5, BH1%).(XLS)
Table S3 List of the differentially-expressed genesbetween the two lines by Volcano plot analysis(FC.1.5) at 0, 3 and 8 h independently.(XLS)
Table S4 List of primer sequences used in RT-qPCR.(XLS)
Acknowledgments
The authors would like to thank Olivier Boucher for technical support in
RT-qPCR experiments and Lidwine Trouilh for microarray experiments
at the Genomic platform GenoToul Toulouse-Midi-Pyrenees. We also
appreciate Philippe Bardou’s assistance when submitting microarray data
to Gene Expression Omnibus (GEO). The authors especially thank the
INRA and ENVT staff members in charge of animal breeding and care.
Author Contributions
Conceived and designed the experiments: MT CB EF RR GF. Performed
the experiments: MT CB EF CC CT. Analyzed the data: MT CB CRG
RR GF. Contributed reagents/materials/analysis tools: MRA. Wrote the
paper: MT GF.
DC Transcriptome and Susceptibility to S. aureus
PLoS ONE | www.plosone.org 12 August 2011 | Volume 6 | Issue 8 | e22147
References
1. Cohn LA, Middleton JR (2010) A veterinary perspective on methicillin-resistantstaphylococci. J Vet Emerg Crit Care (San Antonio) 20: 31–45. doi:10.1111/
j.1476-4431.2009.00497.x.
2. Catry B, Van Duijkeren E, Pomba MC, Greko C, Moreno MA, et al. (2010)Reflection paper on MRSA in food-producing and companion animals:
epidemiology and control options for human and animal health.Epidemiol Infect 138: 626–644. doi:10.1017/S0950268810000014.
3. Bogaerts A, Beets I, Temmerman L, Schoofs L, Verleyen P (2010) Proteome
changes of Caenorhabditis elegans upon a Staphylococcus aureus infection.Biol Direct 5: 11. doi:10.1186/1745-6150-5-11.
4. DeLeo FR, Diep BA, Otto M (2009) Host defense and pathogenesis inStaphylococcus aureus infections Infect Dis Clin North Am 23: 17–34.
doi:10.1016/j.idc.2008.10.003.
5. Deleo FR, Otto M, Kreiswirth BN, Chambers HF (2010) Community-associatedmeticillin-resistant Staphylococcus aureus. Lancet 375: 1557–1568.
doi:10.1016/S0140-6736(09)61999-1.
6. Ben Zakour NL, Sturdevant DE, Even S, Guinane CM, Barbey C, et al. (2008)Genome-wide analysis of ruminant Staphylococcus aureus reveals diversification
of the core genome. J Bacteriol 190: 6302–6317. doi:10.1128/JB.01984-07.
7. O’Riordan K, Lee JC (2004) Staphylococcus aureus capsular polysaccharides.Clin Microbiol Rev 17: 218–234.
8. Herron-Olson L, Fitzgerald JR, Musser JM, Kapur V (2007) Molecularcorrelates of host specialization in Staphylococcus aureus. PLoS ONE 2: e1120.
doi:10.1371/journal.pone.0001120.
9. Ardura MI, Banchereau R, Mejias A, Di Pucchio T, Glaser C, et al. (2009)Enhanced monocyte response and decreased central memory T cells in children
with invasive Staphylococcus aureus infections. PLoS ONE 4: e5446.
doi:10.1371/journal.pone.0005446.
10. von Kockritz-Blickwede M, Rohde M, Oehmcke S, Miller LS, Cheung AL, et al.
(2008) Immunological mechanisms underlying the genetic predisposition tosevere Staphylococcus aureus infection in the mouse model. Am J Pathol 173:
1657–1668. doi:10.2353/ajpath.2008.080337.
11. Prajsnar TK, Cunliffe VT, Foster SJ, Renshaw SA (2008) A novel vertebratemodel of Staphylococcus aureus infection reveals phagocyte-dependent
resistance of zebrafish to non-host specialized pathogens. Cell Microbiol 10:
2312–2325. doi:10.1111/j.1462-5822.2008.01213.x.
12. Wu K, Conly J, McClure J, Elsayed S, Louie T, et al. (2010) Caenorhabditis
elegans as a host model for community-associated methicillin-resistantStaphylococcus aureus. Clin Microbiol Infect 16: 245–254. doi:10.1111/
j.1469-0691.2009.02765.x.
13. Ayres JS, Schneider DS (2008) A signaling protease required for melanization inDrosophila affects resistance and tolerance of infections. PLoS Biol 6:
2764–2773. doi:10.1371/journal.pbio.0060305.
14. Rupp R, Bergonier D, Dion S, Hygonenq MC, Aurel MR, et al. (2009)Response to somatic cell count-based selection for mastitis resistance in a
divergent selection experiment in sheep. J Dairy Sci 92: 1203–1219.doi:10.3168/jds.2008-1435.
15. Sordillo LM, Streicher KL (2002) Mammary gland immunity and mastitis
susceptibility. J Mammary Gland Biol Neoplasia 7: 135–146.
16. Banchereau J, Briere F, Caux C, Davoust J, Lebecque S, et al. (2000)
Immunobiology of dendritic cells. Annu Rev Immunol 18: 767–811.
doi:10.1146/annurev.immunol.18.1.767.
17. Geissmann F, Manz MG, Jung S, Sieweke MH, Merad M, et al. (2010)
Development of monocytes, macrophages, and dendritic cells. Science 327:656–661. doi:10.1126/science.1178331.
18. Liu T, Matsuguchi T, Tsuboi N, Yajima T, Yoshikai Y (2002) Differences in
expression of toll-like receptors and their reactivities in dendritic cells in BALB/cand C57BL/6 mice. Infect Immun 70: 6638–6645.
19. Picard C, Puel A, Bonnet M, Ku C, Bustamante J, et al. (2003) Pyogenic
bacterial infections in humans with IRAK-4 deficiency. Science 299:2076–2079. doi:10.1126/science.1081902.
20. Filippi C, Hugues S, Cazareth J, Julia V, Glaichenhaus N, et al. (2003) CD4+ T
cell polarization in mice is modulated by strain-specific major histocompatibilitycomplex-independent differences within dendritic cells. J Exp Med 198:
201–209. doi:10.1084/jem.20021893.
21. Von Stebut E, Ehrchen JM, Belkaid Y, Kostka SL, Molle K, et al. (2003)
Interleukin 1alpha promotes Th1 differentiation and inhibits disease progression
in Leishmania major-susceptible BALB/c mice. J Exp Med 198: 191–199.doi:10.1084/jem.20030159.
22. Torri A, Beretta O, Ranghetti A, Granucci F, Ricciardi-Castagnoli P, et al.
(2010) Gene expression profiles identify inflammatory signatures in dendriticcells. PLoS ONE 5: e9404. doi:10.1371/journal.pone.0009404.
23. Thuong NTT, Dunstan SJ, Chau TTH, Thorsson V, Simmons CP, et al. (2008)Identification of tuberculosis susceptibility genes with human macrophage gene
expression profiles. PLoS Pathog 4: e1000229. doi:10.1371/journal.ppat.1000229.
24. Jurkin J, Schichl YM, Koeffel R, Bauer T, Richter S, et al. (2010) miR-146a isdifferentially expressed by myeloid dendritic cell subsets and desensitizes cells to
TLR2-dependent activation. J Immunol 184: 4955–4965. doi:10.4049/jimmu-nol.0903021.
25. Wang Y, Gorvel J, Chu Y, Wu J, Lei H (2010) Helicobacter pylori impairs
murine dendritic cell responses to infection. PLoS ONE 5: e10844. doi:10.1371/journal.pone.0010844.
26. Balboa L, Romero MM, Yokobori N, Schierloh P, Geffner L, et al. (2010)
Mycobacterium tuberculosis impairs dendritic cell response by altering CD1b,
DC-SIGN and MR profile. Immunol Cell Biol 88: 716–726. doi:10.1038/
icb.2010.22.
27. Nanda SK, Baron J, Royall E, Robinson L, Falciani F, et al. (2009) Infection of
bovine dendritic cells by rinderpest or measles viruses induces different changes
in host transcription. Virology 395: 223–231. doi:10.1016/j.virol.2009.09.031.
28. Langelaar MFM, Weber CN, Overdijk MB, Muller KE, Koets AP, et al. (2005)
Cytokine gene expression profiles of bovine dendritic cells after interaction with
Mycobacterium avium ssp. paratuberculosis (M.a.p.), Escherichia coli (E. coli) or
recombinant M.a.p. heat shock protein 70. Vet Immunol Immunopathol 107:
153–161. doi:10.1016/j.vetimm.2005.04.009.
29. Wu L, KewalRamani VN (2006) Dendritic-cell interactions with HIV: infection
and viral dissemination. Nat Rev Immunol 6: 859–868. doi:10.1038/nri1960.
30. Huang Q, Liu D, Majewski P, Schulte LC, Korn JM, et al. (2001) The plasticity
of dendritic cell responses to pathogens and their components. Science 294:
870–875. doi:10.1126/science.294.5543.870.
31. Hope JC, Werling D, Collins RA, Mertens B, Howard CJ (2000) Flt-3 ligand, in
combination with bovine granulocyte-macrophage colony-stimulating factor and
interleukin-4, promotes the growth of bovine bone marrow derived dendritic
cells. Scand J Immunol 51: 60–66.
32. Wu Z, Rothwell L, Young JR, Kaufman J, Butter C, et al. (2010) Generation
and characterization of chicken bone marrow-derived dendritic cells. Immu-
nology 129: 133–145. doi:10.1111/j.1365-2567.2009.03129.x.
33. Talmor M, Mirza A, Turley S, Mellman I, Hoffman LA, et al. (1998)
Generation or large numbers of immature and mature dendritic cells from rat
bone marrow cultures. Eur J Immunol 28: 811–817. doi:10.1002/(SICI)1521-
4141(199803)28:03<811::AID-IMMU811>3.0.CO; 2-S.
34. Inaba K, Swiggard WJ, Steinman RM, Romani N, Schuler G, et al. (2009)
Isolation of dendritic cells. Curr Protoc Immunol Chapter 3: Unit 3.7.
doi:10.1002/0471142735.im0307s86.
35. Blanco P, Palucka AK, Pascual V, Banchereau J (2008) Dendritic cells and
cytokines in human inflammatory and autoimmune diseases. Cytokine Growth
Factor Rev 19: 41–52. doi:10.1016/j.cytogfr.2007.10.004.
36. Lin L, Ibrahim AS, Xu X, Farber JM, Avanesian V, et al. (2009) Th1-Th17 cells
mediate protective adaptive immunity against Staphylococcus aureus and
Candida albicans infection in mice. PLoS Pathog 5: e1000703. doi:10.1371/
journal.ppat.1000703.
37. Cho JS, Pietras EM, Garcia NC, Ramos RI, Farzam DM, et al. (2010) IL-17 is
essential for host defense against cutaneous Staphylococcus aureus infection in
mice. J Clin Invest 120: 1762–1773. doi:10.1172/JCI40891.
38. Jakob T, Walker PS, Krieg AM, Udey MC, Vogel JC (1998) Activation of
cutaneous dendritic cells by CpG-containing oligodeoxynucleotides: a role for
dendritic cells in the augmentation of Th1 responses by immunostimulatory
DNA. J Immunol 161: 3042–3049.
39. Keating SE, Maloney GM, Moran EM, Bowie AG (2007) IRAK-2 participates
in multiple toll-like receptor signaling pathways to NFkappaB via activation of
TRAF6 ubiquitination. J Biol Chem 282: 33435–33443. doi:10.1074/
jbc.M705266200.
40. Nimura F, Zhang LF, Okuma K, Tanaka R, Sunakawa H, et al. (2006) Cross-
linking cell surface chemokine receptors leads to isolation, activation, and
differentiation of monocytes into potent dendritic cells. Exp Biol Med (Maywood)
231: 431–443.
41. Rescigno M, Granucci F, Ricciardi-Castagnoli P (2000) Molecular events of
bacterial-induced maturation of dendritic cells. J Clin Immunol 20: 161–166.
42. Joffre O, Nolte MA, Sporri R, Reis e Sousa C (2009) Inflammatory signals in
dendritic cell activation and the induction of adaptive immunity. Immunol Rev
227: 234–247. doi:10.1111/j.1600-065X.2008.00718.x.
43. Jin P, Han TH, Ren J, Saunders S, Wang E, et al. (2010) Molecular signatures of
maturing dendritic cells: implications for testing the quality of dendritic cell
therapies. J Transl Med 8: 4. doi:10.1186/1479-5876-8-4.
44. Jiang H, van de Ven C, Baxi L, Satwani P, Cairo MS (2009) Differential gene
expression signatures of adult peripheral blood vs cord blood monocyte-derived
immature and mature dendritic cells. Exp Hematol 37: 1201–1215.
doi:10.1016/j.exphem.2009.07.010.
45. Ribeiro OG, Maria DA, Adriouch S, Pechberty S, Cabrera WHK, et al. (2003)
Convergent alteration of granulopoiesis, chemotactic activity, and neutrophil
apoptosis during mouse selection for high acute inflammatory response.
J Leukoc Biol 74: 497–506. doi:10.1189/jlb.0103039.
46. Marino S, Myers A, Flynn JL, Kirschner DE (2010) TNF and IL-10 are major
factors in modulation of the phagocytic cell environment in lung and lymph
node in tuberculosis: a next-generation two-compartmental model. J Theor Biol
265: 586–598. doi:10.1016/j.jtbi.2010.05.012.
47. Sasaki S, Nishikawa S, Miura T, Mizuki M, Yamada K, et al. (2000) Interleukin-
4 and interleukin-10 are involved in host resistance to Staphylococcus aureus
infection through regulation of gamma interferon. Infect Immun 68:
2424–2430.
48. Miller LS, O’Connell RM, Gutierrez MA, Pietras EM, Shahangian A, et al.
(2006) MyD88 mediates neutrophil recruitment initiated by IL-1R but not
TLR2 activation in immunity against Staphylococcus aureus. Immunity 24:
79–91. doi:10.1016/j.immuni.2005.11.011.
DC Transcriptome and Susceptibility to S. aureus
PLoS ONE | www.plosone.org 13 August 2011 | Volume 6 | Issue 8 | e22147
49. Kusuhai K (2010) [Genetic susceptibility to infectious diseases: immunogenetical
approaches to mycobacterial infections and subacute sclerosing panencephalitis].J UOEH 32: 177–194.
50. Zhang L, Prather D, Vanden Eng J, Crawford S, Kariuki S, et al. (2010)
Polymorphisms in genes of interleukin 12 and its receptors and their associationwith protection against severe malarial anaemia in children in western Kenya.
Malar J 9: 87. doi:10.1186/1475-2875-9-87.51. Katz JB, Muller AJ, Prendergast GC (2008) Indoleamine 2,3-dioxygenase in T-
cell tolerance and tumoral immune escape. Immunol Rev 222: 206–221.
doi:10.1111/j.1600-065X.2008.00610.x.52. Liu X, Shin N, Koblish HK, Yang G, Wang Q, et al. (2010) Selective inhibition
of IDO1 effectively regulates mediators of antitumor immunity. Blood 115:3520–3530. doi:10.1182/blood-2009-09-246124.
53. Reis ES, Barbuto JAM, Isaac L (2007) Complement components, regulators andreceptors are produced by human monocyte-derived dendritic cells. Immuno-
biology 212: 151–157. doi:10.1016/j.imbio.2006.11.010.
54. Taylor PR, Carugati A, Fadok VA, Cook HT, Andrews M, et al. (2000) Ahierarchical role for classical pathway complement proteins in the clearance of
apoptotic cells in vivo. J Exp Med 192: 359–366.55. Castellano G, Woltman AM, Schlagwein N, Xu W, Schena FP, et al. (2007)
Immune modulation of human dendritic cells by complement. Eur J Immunol
37: 2803–2811. doi:10.1002/eji.200636845.56. Medzhitov R (2007) Recognition of microorganisms and activation of the
immune response. Nature 449: 819–826. doi:10.1038/nature06246.
57. Serhan CN, Savill J (2005) Resolution of inflammation: the beginning programs
the end. Nat Immunol 6: 1191–1197. doi:10.1038/ni1276.58. Torchinsky MB, Garaude J, Martin AP, Blander JM (2009) Innate immune
recognition of infected apoptotic cells directs T(H)17 cell differentiation. Nature
458: 78–82. doi:10.1038/nature07781.59. Kushwah R, Wu J, Oliver JR, Jiang G, Zhang J, et al. (2010) Uptake of
apoptotic DC converts immature DC into tolerogenic DC that inducedifferentiation of Foxp3+ Treg. Eur J Immunol 40: 1022–1035. doi:10.1002/
eji.200939782.
60. Cherfils-Vicini J, Vingert B, Varin A, Tartour E, Fridman W, et al. (2008)Characterization of immune functions in TRAF4-deficient mice. Immunology
124: 562–574. doi:10.1111/j.1365-2567.2008.02810.x.61. Houghton AM, Hartzell WO, Robbins CS, Gomis-Ruth FX, Shapiro SD (2009)
Macrophage elastase kills bacteria within murine macrophages. Nature 460:637–641. doi:10.1038/nature08181.
62. Foulon E, Foucras G (2008) Two populations of ovine bone marrow-derived
dendritic cells can be generated with recombinant GM-CSF and separated onCD11b expression. J Immunol Methods 339: 1–10. doi:10.1016/
j.jim.2008.07.012.63. Rozen S, Skaletsky H (2000) Primer3 on the WWW for general users and for
biologist programmers. Methods Mol Biol 132: 365–386.
64. Vandesompele J, De Preter K, Pattyn F, Poppe B, Van Roy N, et al. (2002)Accurate normalization of real-time quantitative RT-PCR data by geometric
averaging of multiple internal control genes. Genome Biol 3: RESEARCH0034.
DC Transcriptome and Susceptibility to S. aureus
PLoS ONE | www.plosone.org 14 August 2011 | Volume 6 | Issue 8 | e22147