Gene expression patterns unveil a new level of molecular heterogeneity in colorectal cancer
14
Journal of Pathology J Pathol 2013 Published online in Wiley Online Library (wileyonlinelibrary.com) DOI: 10.1002/path.4212 ORIGINAL PAPER Gene expression patterns unveil a new level of molecular heterogeneity in colorectal cancer Eva Budinska, 1,2 * Vlad Popovici, 1,2 Sabine Tejpar, 3 Giovanni D’Ario, 1 Nicolas Lapique, 1 Katarzyna Otylia Sikora, 1 Antonio Fabio Di Narzo, 1 Pu Yan, 4 John Graeme Hodgson, 5 Scott Weinrich, 5 Fred Bosman, 5 Arnaud Roth 6,7 and Mauro Delorenzi 1,8 1 Bioinformatics Core Facility, Swiss Institute of Bioinformatics (SIB), Lausanne, 1015, Switzerland 2 Institute of Biostatistics and Analyses, Masaryk University, Brno, Czech Republic 3 Department of Oncology, University Hospital Gasthuisberg, Katholik Universiteit Leuven, Belgium 4 University Institute of Pathology, Lausanne University Medical Centre, Switzerland 5 Pfizer Inc., Worldwide Research and Development, Oncology Research Unit, La Jolla, CA, USA 6 Oncosurgery, Geneva University Hospital, Switzerland 7 Swiss Group for Clinical Cancer Research (SAKK), Bern, Switzerland 8 D´ epartement de Formation et Recherche, Lausanne University Medical Centre, Switzerland *Correspondence to: Eva Budinska, Institute of Biostatistics and Analyses, Masaryk University, Kotlarska 2, 611 37 Brno, Czech Republic e-mail: [email protected] Abstract The recognition that colorectal cancer (CRC) is a heterogeneous disease in terms of clinical behaviour and response to therapy translates into an urgent need for robust molecular disease subclassifiers that can explain this heterogeneity beyond current parameters (MSI, KRAS , BRAF ). Attempts to fill this gap are emerging. The Cancer Genome Atlas (TGCA) reported two main CRC groups, based on the incidence and spectrum of mutated genes, and another paper reported an EMT expression signature defined subgroup. We performed a prior free analysis of CRC heterogeneity on 1113 CRC gene expression profiles and confronted our findings to established molecular determinants and clinical, histopathological and survival data. Unsupervised clustering based on gene modules allowed us to distinguish at least five different gene expression CRC subtypes, which we call surface crypt-like, lower crypt-like, CIMP-H-like, mesenchymal and mixed. A gene set enrichment analysis combined with literature search of gene module members identified distinct biological motifs in different subtypes. The subtypes, which were not derived based on outcome, nonetheless showed differences in prognosis. Known gene copy number variations and mutations in key cancer-associated genes differed between subtypes, but the subtypes provided molecular information beyond that contained in these variables. Morphological features significantly differed between subtypes. The objective existence of the subtypes and their clinical and molecular characteristics were validated in an independent set of 720 CRC expression profiles. Our subtypes provide a novel perspective on the heterogeneity of CRC. The proposed subtypes should be further explored retrospectively on existing clinical trial datasets and, when sufficiently robust, be prospectively assessed for clinical relevance in terms of prognosis and treatment response predictive capacity. Original microarray data were uploaded to the ArrayExpress database (http://www.ebi.ac.uk/arrayexpress/) under Accession Nos E-MTAB-990 and E-MTAB-1026. 2013 Swiss Institute of Bioinformatics. Journal of Pathology published by John Wiley & Sons Ltd on behalf of Pathological Society of Great Britain and Ireland. Keywords: colorectal cancer; histopathology; gene expression; molecular heterogeneity Received 3 February 2013; Revised 10 May 2013; Accepted 14 May 2013 Conflict of interest: ST and FTB have received research funds from Pfizer; and AR is a compensated consultant for Pfizer. Introduction Current classifications of sporadic colorectal cancer take into consideration stage, histological type and grade [1]. Colorectal cancer (CRC) is a highly het- erogeneous disease, with clinicopathologically simi- lar tumours differing strikingly in treatment response and patient survival. These differences are only partly explained by current concepts regarding the molecular events leading to CRC. In recent years, microsatellite instability (MSI) emerged as an important classifier with significant prognostic impact and potential for patient stratification for therapy [2,3]. Some molecu- lar markers, as well as the mutation status of BRAF or KRAS genes (predictive for anti-EGFR [4]), are in use for treatment decisions and patient stratification. However, patient groups defined by these molecular markers still differ remarkably in behaviour and ther- apy response [5,6]. Several approaches to further sub- type CRC have been proposed, based on combinations 2013 Swiss Institute of Bioinformatics. Journal of Pathology published by John Wiley & Sons Ltd on behalf of Pathological Society of Great Britain and Ireland. This is an open access article under the terms of the Creative Commons Attribution License, which permits use, distribution and reproduction in any medium, provided the original work is properly cited.
Transcript of Gene expression patterns unveil a new level of molecular heterogeneity in colorectal cancer
Journal of PathologyJ Pathol 2013Published online in Wiley Online Library(wileyonlinelibrary.com) DOI: 10.1002/path.4212
ORIGINAL PAPER
Gene expression patterns unveil a new level of molecularheterogeneity in colorectal cancerEva Budinska,1,2* Vlad Popovici,1,2 Sabine Tejpar,3 Giovanni D’Ario,1 Nicolas Lapique,1 Katarzyna Otylia Sikora,1Antonio Fabio Di Narzo,1 Pu Yan,4 John Graeme Hodgson,5 Scott Weinrich,5 Fred Bosman,5 Arnaud Roth6,7 andMauro Delorenzi1,8
1 Bioinformatics Core Facility, Swiss Institute of Bioinformatics (SIB), Lausanne, 1015, Switzerland2 Institute of Biostatistics and Analyses, Masaryk University, Brno, Czech Republic3 Department of Oncology, University Hospital Gasthuisberg, Katholik Universiteit Leuven, Belgium4 University Institute of Pathology, Lausanne University Medical Centre, Switzerland5 Pfizer Inc., Worldwide Research and Development, Oncology Research Unit, La Jolla, CA, USA6 Oncosurgery, Geneva University Hospital, Switzerland7 Swiss Group for Clinical Cancer Research (SAKK), Bern, Switzerland8 Departement de Formation et Recherche, Lausanne University Medical Centre, Switzerland
*Correspondence to: Eva Budinska, Institute of Biostatistics and Analyses, Masaryk University, Kotlarska 2, 611 37 Brno, Czech Republice-mail: [email protected]
AbstractThe recognition that colorectal cancer (CRC) is a heterogeneous disease in terms of clinical behaviour andresponse to therapy translates into an urgent need for robust molecular disease subclassifiers that can explain thisheterogeneity beyond current parameters (MSI, KRAS, BRAF). Attempts to fill this gap are emerging. The CancerGenome Atlas (TGCA) reported two main CRC groups, based on the incidence and spectrum of mutated genes,and another paper reported an EMT expression signature defined subgroup. We performed a prior free analysis ofCRC heterogeneity on 1113 CRC gene expression profiles and confronted our findings to established moleculardeterminants and clinical, histopathological and survival data. Unsupervised clustering based on gene modulesallowed us to distinguish at least five different gene expression CRC subtypes, which we call surface crypt-like,lower crypt-like, CIMP-H-like, mesenchymal and mixed. A gene set enrichment analysis combined with literaturesearch of gene module members identified distinct biological motifs in different subtypes. The subtypes, whichwere not derived based on outcome, nonetheless showed differences in prognosis. Known gene copy numbervariations and mutations in key cancer-associated genes differed between subtypes, but the subtypes providedmolecular information beyond that contained in these variables. Morphological features significantly differedbetween subtypes. The objective existence of the subtypes and their clinical and molecular characteristics werevalidated in an independent set of 720 CRC expression profiles. Our subtypes provide a novel perspective onthe heterogeneity of CRC. The proposed subtypes should be further explored retrospectively on existing clinicaltrial datasets and, when sufficiently robust, be prospectively assessed for clinical relevance in terms of prognosisand treatment response predictive capacity. Original microarray data were uploaded to the ArrayExpress database(http://www.ebi.ac.uk/arrayexpress/) under Accession Nos E-MTAB-990 and E-MTAB-1026. 2013 Swiss Institute of Bioinformatics. Journal of Pathology published by John Wiley & Sons Ltd on behalf of Pathological Societyof Great Britain and Ireland.
Keywords: colorectal cancer; histopathology; gene expression; molecular heterogeneity
Received 3 February 2013; Revised 10 May 2013; Accepted 14 May 2013
Conflict of interest: ST and FTB have received research funds from Pfizer; and AR is a compensated consultant for Pfizer.
Introduction
Current classifications of sporadic colorectal cancertake into consideration stage, histological type andgrade [1]. Colorectal cancer (CRC) is a highly het-erogeneous disease, with clinicopathologically simi-lar tumours differing strikingly in treatment responseand patient survival. These differences are only partlyexplained by current concepts regarding the molecularevents leading to CRC. In recent years, microsatellite
instability (MSI) emerged as an important classifierwith significant prognostic impact and potential forpatient stratification for therapy [2,3]. Some molecu-lar markers, as well as the mutation status of BRAFor KRAS genes (predictive for anti-EGFR [4]), are inuse for treatment decisions and patient stratification.However, patient groups defined by these molecularmarkers still differ remarkably in behaviour and ther-apy response [5,6]. Several approaches to further sub-type CRC have been proposed, based on combinations
2013 Swiss Institute of Bioinformatics. Journal of Pathology published by John Wiley & Sons Ltd on behalf of Pathological Society of Great Britain and Ireland.This is an open access article under the terms of the Creative Commons Attribution License, which permits use, distribution and reproduction in any medium,provided the original work is properly cited.

2 E Budinska et al
of clinical, histopathological, gene expression, CNV,epigenetic and single gene parameters [7–13]. Each ofthese different modalities provides its own perspectiveon the same underlying biological reality. The CpGisland methylator phenotype (CIMP) status is emergingas important molecular determinant of CRC hetero-geneity [11]. The cancer genome atlas (TCGA) analysisidentified a hypermutant group not entirely capturedby MSI status [13]. Several studies have addressedCRC subtyping using genome-wide gene expressionprofiling of relatively large patient cohorts [12,14].One study used unsupervised clustering of stage II andIII CRCs to identify three stage-independent subtypes,with BRAF mutation and MSI status dominating oneof the subtypes [14]. A study of stage I–IV CRC sam-ples segregated CRC into two prognostic subtypes withepithelial–mesenchymal transition (EMT) as a maindeterminant [12]. Another study on 88 stage I–IV sam-ples identified four subtypes, one correlated with MSI,BRAF mutation and mucinous histology, two with stro-mal component and one with high nuclear β-cateninexpression [15].
We recently reported CRC expressing a BRAF -mutated signature [6], which strongly overlaps withthe methylation-based group of Hinoue [11], and aMSI-like gene expression group that captures thehypermutant tumours of TCGA [13], indicating thepotential for identification of robust biological sub-groups. We now describe CRC subtypes based uponunsupervised clustering of genome-wide expressionpatterns. We characterized these subtypes in termsof biological motifs, common clinical variables,association with known CRC molecular markersand morphological patterns. A key element in ourapproach was the use of a system of unsupervised genemodules—groups of genes with correlated expression.They are more resistant to noise and have a higherchance of having at least a few members representedon various platforms. In addition, as each gene moduleis represented by its median expression, the moduleswith fewer genes contribute equally to the subtypedefinition. We and others have successfully used sim-ilar strategies previously [16–18]. We validated theexistence of the subtypes and their respective clinicaland molecular marker characteristics in an independentdataset. Ultimately, it will be mandatory to integratethe various sources of information on CRC hetero-geneity into an integrative, robust and reproduciblesubclassifier that can become a tool for clinical use.
Materials and methods
A detailed description of all the datasets and analysisprocedures is given in Supplementary methods andresults (see Supplementary material).
Data acquisition and processingWe have built two non-overlapping data collec-tions: a discovery collection, comprising four publicly
available (425 samples) and two previously unpub-lished datasets (688 samples with 10 year follow-up ina clinical trial setting and 64 normal samples) withknown stage status, and a validation collection ofeight publicly available datasets (720 CRC samples)(see Supplementary material, Supplementary methodsand results). Observations derived from the analysisof 64 normal samples were further validated on fivepublicly available datasets, with both carcinoma andnormal samples available in one batch (totalling 205normal/adenoma/carcinoma samples). Copy numberdata was available for 154 of the PETACC3, as in [19].Our analysis included a total of 2102 samples.
The discovery collection contained the previouslyunpublished 688 CRC formalin-fixed, paraffin-embedded (FFPE) samples of PETACC3 [6] and64 FFPE normal colon tissue samples from CentreHospitalier Universitaire Vaudois’s Biobank, whichwere uploaded to ArrayExpress (http://www.ebi.ac.uk/arrayexpress/), under Accession Nos E-MTAB-990and E-MTAB-1026, respectively. Gene expressiondata were processed by standard tools to obtainnormalized, probeset-level expression data. For eachEntrezID in the datasets, the probeset with thehighest variability was selected as representative andthe number of EntrezIDs entering the analysis wasreduced to 3025 by applying non-specific filtering.For PETACC3 and normal colon samples, patientssigned an informed consent form in which the use oftissue specimens was included, and all marker studyproposals were subjected to the approval of the trialsteering committee.
Subtype definition and validationFor model development (gene modules and subtypedefinition, classifier training, identification of subtype-specific genes) only the 1113 CRC samples of thediscovery set were used, no sample in the validationcollection being used for any model tuning. Hierarchi-cal clustering (complete linkage, Pearson correlationsimilarity measure) and dynamic cut tree [20] wereused to produce gene modules (groups of genes withcorrelated expression), from which non-robust modules(see Supplementary material, Supplementary methodsand results) and a gender-related module were dis-carded. Each expression profile was then reduced toa vector of meta-genes by taking the median of thevalues of genes in each gene module. The meta-geneswere then further grouped into clusters using hierarchi-cal clustering.
The subtypes were defined in terms of core sam-ples —those samples from the discovery collection thatwere assigned to clusters by hierarchical clustering,using a consensus distance [21] followed by prun-ing of the dendrogram (see Supplementary material,Supplementary methods and results). The clusters towhich the core samples were assigned were called
2013 Swiss Institute of Bioinformatics. Journal of Pathology published by John Wiley & Sons Ltd J Pathol 2013on behalf of Pathological Society of Great Britain and Ireland. www.pathsoc.org.uk www.thejournalofpathology.com

Gene expression heterogeneity in colorectal cancer 3
subtypes . The rest of the samples from the discov-ery collection, not assigned to subtypes by this pro-cedure, were called non-core samples . This approachallowed the reduction of noise in subtype-defining sam-ples, and thus a higher consistency of the resultingsubtypes defining the ground truth for downstreamanalyses. The stability of the obtained clusters wasassessed under different perturbations of the processingpipeline (different parameters and clustering methods)to ensure that the results were not simple artefacts(see Supplementary material, Supplementary methodsand results). A multiclass linear discriminant (LDA)[22] was trained on core samples with meta-genes asvariables to assign new samples to one of the sub-types. Minimal gene sets characteristic to each subtypewere identified using ElasticNet [23] on gene-leveldata.
In order to validate the existence of subtypes (andtheir independence on data selection) and the mod-elling choices in subtype discovery, we applied thesame subtyping procedure (including parameters) to thevalidation collection. The clusters identified in the val-idation collection were put in correspondence with thesubtypes in the training set by LDA predictions andcorrelations of subtype-specific moderated t statistic[24] values, corresponding to the gene-wise compar-ison of the respective subtype with the other subtypes(one-versus-all comparison). A simple classifier appli-cation would have led the validation samples to beclassified as one of the subtypes, but it would have notinformed us of possible over-fitting of the data in thediscovery procedure.
Subtype characterizationIf not specified differently, all the reported p valueswere adjusted for multiple hypothesis testing, usingthe Benjamini–Hochberg procedure. Significance levelwas set at 0.1. Pathway analysis for each set ofgene modules was carried out using the Databasefor Annotation, Visualization and Integrated Discov-ery (DAVID) [25]. Gene set enrichment analysis ofgene signatures was performed using the mygsea2tool, in each subtype and normal samples, on aver-age expression-ordered median-centred lists of genes.Differential expression analysis was performed usinglimma [24] and sign test using BSDA [26]. TheCox proportional hazards model was used to anal-yse the prognostic value of interquartile range (IQR)-standardized values of meta-genes, for overall survival(OS), relapse-free survival (RFS) and survival afterrelapse (SAR), stratified by dataset. The Wald test wasused to assess the global significance of the models.Pairwise differences in survival were assessed using thelog-rank test. For subtype comparison, the survival wastruncated at 7 years. Subtype enrichment for clinical ormolecular markers was assessed by the Fisher test tothe baseline, defined as the proportion of the marker inthe whole dataset. Morphological pattern differenceswere assessed pairwise by Fisher test.
HistologyThe identified subtypes were characterized histologi-cally in terms of six different architectural patterns:complex tubular; solid/trabecular; mucinous; papillary;desmoplastic; and serrated (Figure 4A), which werecalled dominant or secondary depending on their pres-ence in the histology slides (for details on immunohis-tochemistry, see Supplementary material, Supplemen-tary methods and results).
Results
Gene modules and subtype definitionWe identified 54 gene modules, reproducible acrossall datasets in the discovery collection, comprising658 genes from an initial list of 3025 identifiedas the most variable. The assignment of genes togene modules and gene module clusters is listed inTable S1 (see Supplementary material); meta-geneexpression profiles for the discovery set are shown inFigure 1A; and between meta-gene correlations inFigure S1C (see Supplementary material). Based ongene modules, we identified five major subtypes:surface crypt-like (A), lower crypt-like (B), CIMP-H-like (C), mesenchymal (D) and mixed (E), totalling 765samples (69% of discovery data; see Supplementarymaterial, Supplementary methods and results).
Subtype reproducibility in an independentvalidation setIn the validation set of 720 CRC samples we identifieda set of subtypes comprising 602 samples (83.6%of the validation set) and associated them with ourdiscovery subtypes using the subtype classifier (seeSupplementary material, Table S2) and correlationsof subtype-specific patterns based on moderated tstatistic (see Supplementary material, Table S3). Allfive major subtypes reappeared in the validation set,confirming the robustness of our approach. Figure S2(see Supplementary material) presents gene expressionprofiles of both discovery and validation sets. Twonotable differences were observed: (i) subtype B in thevalidation set was split into two subgroups (B1, B2),as observed in the discovery set too, but only at lowerpruning height; (ii) another cluster passed the minimalsize criteria, corresponding to the small subtype (F)which, in the discovery set, was not considered forfurther characterization because of small sample size.Validation of other subtype characteristics (to the extentof available information) is described in each of therespective sections.
Subtypes are characterized by distinct biologicalcomponentsWe set out to assign biological labels to gene modulesthat define the subtypes (Table 1; see also Supple-mentary material, Table S1). Of the 54 meta-genes,
2013 Swiss Institute of Bioinformatics. Journal of Pathology published by John Wiley & Sons Ltd J Pathol 2013on behalf of Pathological Society of Great Britain and Ireland. www.pathsoc.org.uk www.thejournalofpathology.com
4 E Budinska et al
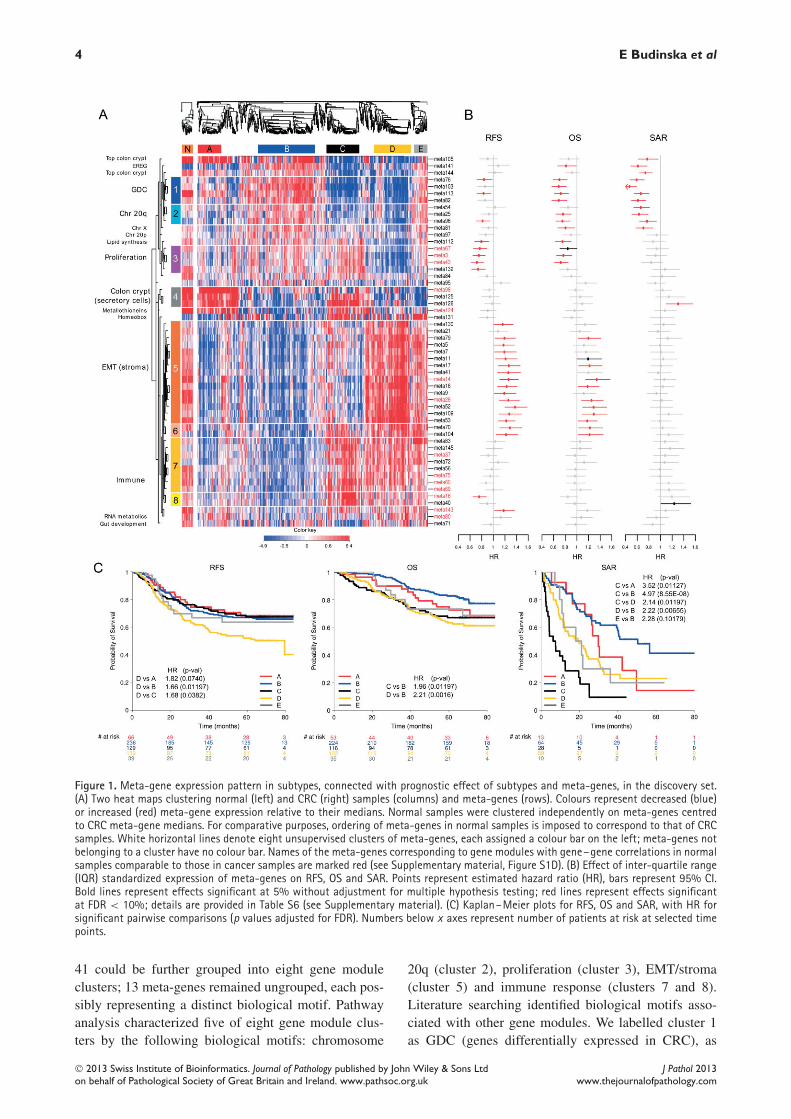
Figure 1. Meta-gene expression pattern in subtypes, connected with prognostic effect of subtypes and meta-genes, in the discovery set.(A) Two heat maps clustering normal (left) and CRC (right) samples (columns) and meta-genes (rows). Colours represent decreased (blue)or increased (red) meta-gene expression relative to their medians. Normal samples were clustered independently on meta-genes centredto CRC meta-gene medians. For comparative purposes, ordering of meta-genes in normal samples is imposed to correspond to that of CRCsamples. White horizontal lines denote eight unsupervised clusters of meta-genes, each assigned a colour bar on the left; meta-genes notbelonging to a cluster have no colour bar. Names of the meta-genes corresponding to gene modules with gene–gene correlations in normalsamples comparable to those in cancer samples are marked red (see Supplementary material, Figure S1D). (B) Effect of inter-quartile range(IQR) standardized expression of meta-genes on RFS, OS and SAR. Points represent estimated hazard ratio (HR), bars represent 95% CI.Bold lines represent effects significant at 5% without adjustment for multiple hypothesis testing; red lines represent effects significantat FDR < 10%; details are provided in Table S6 (see Supplementary material). (C) Kaplan–Meier plots for RFS, OS and SAR, with HR forsignificant pairwise comparisons (p values adjusted for FDR). Numbers below x axes represent number of patients at risk at selected timepoints.
41 could be further grouped into eight gene moduleclusters; 13 meta-genes remained ungrouped, each pos-sibly representing a distinct biological motif. Pathwayanalysis characterized five of eight gene module clus-ters by the following biological motifs: chromosome
20q (cluster 2), proliferation (cluster 3), EMT/stroma(cluster 5) and immune response (clusters 7 and 8).Literature searching identified biological motifs asso-ciated with other gene modules. We labelled cluster 1as GDC (genes differentially expressed in CRC), as
2013 Swiss Institute of Bioinformatics. Journal of Pathology published by John Wiley & Sons Ltd J Pathol 2013on behalf of Pathological Society of Great Britain and Ireland. www.pathsoc.org.uk www.thejournalofpathology.com

Gene expression heterogeneity in colorectal cancer 5
Table 1. Biological identification of gene modules
Cluster nameNumber of
genes
Pathway analysis result(number of overlapping
genes, p value) OR descriptionbased on literature search Selected genes
1. GDC 27 Genes involved in differentiation of coloncrypt and/or whose expression wasreported to be affected in colorectal cancerand/or with prognostic effect in CRC
Intestinal differentiation genes: CDX2[45], IHH[46],VAV3[47], ASCL2[35], PLAGL2[48]
Genes reported altered in colorectal cancer withprognostic effect: PITX2[49], DDC [50], PRLR[51],SPINK1[52]
Other genes connected to CRC:GGH –connected to CIMP+ phenotype [53]NR1I2–connected to chemoresistance [54]
2. Chromosome 20qgenes
33 Chromosome 20 (26 genes, 9.2E-34) Other, non-20q genes: TP53RK , ANO9, NEU1, CLDN3,PRSS8
3. Proliferation 83 Cell cycle (36 genes, 3.0E-33)Mitosis (26 genes, 1.4E-29)Chromosome (26 genes, 2.5E-17)DNA metabolic process (20 genes, 4.9E-10)Lipid synthesis (4 genes, 5.0E-2)
Mitotic checkpoint kinases: BUB1, BUB1BCyclins: CCNA2, CCNB2 Centromere proteins: CENPA,
CENPE , CENPNKinesins: KIF11, KIF23, KIF4ATopoisomerase II (TOP2A)Cell division cycle 2 CDC2
4. Colon crypt markers(secretory cells)
16 AGR2[55], AGR3, MUC2, SPINK4[56], RETNLB[57],REG4[58]
5. EMT/stroma 310 Extracellular region part (90 genes) 2.7E-36Cell adhesion (57 genes) 1.2E-17Extracellular matrix (44 genes) 5.3E-30Collagen (16 genes) 1.2E-15EGF-like domain (26 genes) 1.6E-12Cell motion (33 genes) 7.2E-8Blood vessel development (25 genes) 1.1E-8Growth factor binding (6 genes) 6.0E-5Frizzled related (5 genes) 6.7E-3Cell junction organization (7 genes) 1.8E-2WNT receptor signalling pathway (8 genes)
1.4E-1
Inhibitors of β-catenin-dependent canonical WNT:SFRP1, SFRP2, SFRP4, DKK3, FZD1,7 , PRICKLE1, NXN
Mesenchymal markers: N-cadherin, OB cadherin, SPARC ,DDR2
EMT inducers(TFs): SNAI2, ZEB1, ZEB2, TWIST1, CDH11ECM remodelling and invasion: MMP14, VIM ECM
proteins: fibronectin 1, collagensAngiogenesis: PLAT , PLAU, NRP1, NRP2, THBS1, THBS2,
THBS4TGFs, their receptors and binding proteins: IGF1, IGFBP5,
IGFBP7 ,TGFB, LTBP1, LTBP2, PDGFRA, PDGFRB
6. Unidentified 14 DUSP1, EGR2, SERPINE17 and 8. Immune
response103 Immune response (42 genes) 2.0E-28
Positive regulation of immune system process(16 genes) 4.0E-9
Antigen processing and presentation via MHCclass II (6 genes) 7.5E-5
Defence response (31 genes) 3.3E-17Chemokine signalling pathway (9 genes)
2.2E-3Lymphocyte activation (11 genes) 2.1E-5Regulation of programmed cell death
(14 genes) 2.1E-2
Cytokines: CCL3, CXCL5, CXCL9,CXCL10, CXCL11, SPP1,LTB
MHC class II: HLA-DMB, HLA-DPA1, HLA-DRA, CD74MHC class I: HLA-F , TAP1, TAP2Anti-apoptotic: BCL2A1, CD74, BIRC3, IFI6, TNFAIP3,
TNFAIP3Apoptotic: STAT1, XAF1Interferon-induced proteins: IFI30, IFI16, IFI44, IFI16,
IFIH1, IFIT3
Cluster-unassigned meta-genes with colon crypt cell markers (enterocytes/top of the crypt)Meta-gene 105 6 Top of the crypt genes FAM55A, FAM55D, MUC12 and CEACAM7[59],
SLC26A2[59], SLC26A3[59]Meta-gene 144 5 Enterocytes, goblet cells markers LOC644844, NGEF , HEPH, KRT20[59], MUC20[59]Cluster-unassigned meta-genes associated with chromosomal location 0Meta-gene 81 7 Chromosome X (7 genes) 1.1E-8 CXorf15, EIF1AX , HDHD1A, MED14, PNPLA4, SCML1,
SMC1AMeta-gene 97 6 Chromosome 20p (5 genes) 5.0E-11 CDC25B, CSNK2A1, MRPS26, PTPRA, RP5-1022P6.2,
SNRPBMeta-gene 84 7 Chromosome 8 (7 genes) 5.4E-9 AGPAT5, FDFT1, GTF2E2, LONRF1, MTUS1, VPS37A,
ZNF395Other cluster-unassigned meta-genesMeta-gene 141 5 EREG AK3L1, ARID3A, EREG, LDLRAD3, ZBTB10Meta-gene 112 6 Lipid synthesis (4 genes) 5.0E-2 DHCR7 , FASN, FGFBP1, HMGCS1, IDI1, PCSK9Meta-gene 95 6 Homeobox genes HOXA10, HOXA11, HOXA13, HOXA5, HOXA7 , HOXA9Meta-gene 124 5 Metallothioneins MT1E , MT1F , MT1G, MT1M, MT1XMeta-gene 131 5 Disulphide bonds (5 genes) 1.7E-02 CXCL5, IL6, MMP1, MMP3, PTGS2Meta-gene 143 5 Unidentified DUSP5, ERRFI1, KLF6, MXD1, PLAURMeta-gene 80 7 Regulation of RNA metabolic process
(6 genes) 4.9E-2ATF3, C8orf4, FOS, JUNB, NR4A1, SIK1, ZFP36
Meta-gene 71 8 Gut development (3 genes) 3.5E-2 CCL11, CH25H, EDNRB, F2RL2, FOXF1, FOXF2, PCDH18,WNT5A
2013 Swiss Institute of Bioinformatics. Journal of Pathology published by John Wiley & Sons Ltd J Pathol 2013on behalf of Pathological Society of Great Britain and Ireland. www.pathsoc.org.uk www.thejournalofpathology.com

6 E Budinska et al
Table 2. Subtype-specific minimal gene set as identified by Elastic netMinimal gene sets specifying a subtype
SubtypeUp-regulated frompopulation mean
Down-regulated frompopulation mean
A. Surface crypt-like ADTRP , B3GNT7 , CLCA1, MUC2, NR3C2, PADI2, RETNLB, STYK1 CHI3L1, FNDC1, TIMP3, SULF1B. Lower crypt-like CCDC113, CDHR1, FARP1, GPSM2, GRM8, HNF4A, IHH, KCNK5,
KIAA0226L, MYRIP , PLAGL2, PRR15, QPRT , RNF43, RPS6KA3,SLC5A6, TP53RK , TSPAN6, VAV3, YAE1D1
ALOX5, BASP1, CREB3L1, CXCR4,EPB41L3, FSCN1, GFPT2, GPX8,ITPRIP , KCNMA1, KCTD12,MT1E ,RARRES3, RNASE1, SGK1, SOCS3
C. CIMP-H-like ANP32E , EGLN3, IDO1, PLK2, RAB27B, RARRES3, RPL22L1, TFAP2A ATP9A, C10orf99, CXCL14, KIAA0226LD. Mesenchymal ANK2, BOC , C7 , CRYAB, DCHS1, DDR2, GEM, PRICKLE1, TAGLN HOOK1, RBM47E. Mixed CEACAM6, CXCL5, HSD11B1, IL1B, IL6, MRPS31, PI15, RAP2A, UQCC AGR3, RAB27B, REG4
it consisted of a number of genes significantly associ-ated with CRC. The analysis of pairwise intra-genemodule correlations in normal samples of both dis-covery and validation set identified as cancer-specificgene modules of chromosome 20q, several immuneresponse, EMT/stroma and GDC gene modules, home-obox genes and gut development (see Supplementarymaterial, Figure S1D). The relationship between sub-types and meta-genes is illustrated by the heat map(Figure 1A), in which the major molecular motifsand their role in subtype definition stand out. TableS4 (see Supplementary material) contains median sub-type values per meta-gene and the results of differ-ential meta-gene expression testing between subtypes.Subtypes are not determined by individual biologi-cal components but each of them contributes to themolecular identity of the subtypes. The EMT/stromacluster stands out in subtypes A + B (low expression)and D + E (high expression), while subtype C notablycontained a high expression of immunity-associatedcluster. High expression of meta-genes representingupper colon crypt cells in subtypes A and B, cor-related with serrated and papillary (A) and complextubular (B) morphological patterns (see below). Giventhe enterocyte-like morphology and retained polarityof the neoplastic cells in these patterns, they are con-sidered as well differentiated. Subtype C is associatedwith the mucinous phenotype. Interestingly, subtypesA and C show high expression of metallothioneins,subtypes C and E show high expression of the home-obox gene module, while subtypes E and B stronglyexpress a gene module containing the EREG gene(Table 1). The high expression of chromosome 20qcluster in subtype B was correlated with a significantlyhigher copy number gain/amplification of all of 20q inthis subtype (see Supplementary material, Figure S8).The low expression of lipid synthesis genes is strikingfor subtype D and low expression of the gut devel-opment gene module for subtype C. A refined pictureof differences is given by a quantitative comparisonof (meta-)gene expression between subtype pairs (seeSupplementary material, Tables S4 and S5, Figure S4).For each subtype we also identified a minimum setof characteristic genes (Table 2; for more details, seeSupplementary material, Supplementary methods andresults).
Normal colon mucosa in the context of subtypesWhen applied to the 64 normal samples, the LDA clas-sifier assigned them all to subtype A, with posteriorprobability > 0.99, supporting the observation that A iswell differentiated and closest to normal colonic epithe-lium in terms of gene expression pattern. For valida-tion, we analysed five public datasets comprising 205profiles of normal/adenoma/carcinoma samples. Mostof the normal and adenoma samples were classified byLDA as subtype A (74.5% of 51 and 69.0% of 71,respectively) or subtype B (28.2% and 21.6%, respec-tively), confirming subtype A as the most normal-like.The 80 carcinoma samples were distributed over allsubtypes (26.2% A, 30.0% B, 11.3% C, 18.7% D and13.8% E).
Subtypes and patient survivalWe assessed whether subtypes differ in survival, as ageneral read-out of biological significance, and thentested the association of each meta-gene with progno-sis, using the complete discovery set of 1113 patients(Figure 1B-C see also Supplementary material, TableS6). Kaplan–Meier curves for RFS, OS, SAR, haz-ard ratios (HRs) and p values of pairwise differencesbetween subtypes are shown in Figure 1C. The resultsindicate that subtypes C and D are associated with poorOS. For subtype D, this is primarily due to early relapsecorrelated with high expression of EMT genes and lowexpression of proliferation-associated genes. For sub-type C it is the result of short SAR, correlated withlow expression of GDC, top colon crypt, EREG andChr 20q genes and high expression of meta-gene 126(see Supplementary material, Table S1). For subtype Ethe trend towards poorer OS and RFS was not statisti-cally significant, although borderline significant poorerSAR was found relative to subtype B. Subtypes A andB had better prognosis than D for all three endpoints,although for OS in subtype A this was not significant.
The analysis of clinical and molecular markers(below) showed that subtype C is enriched for MSItumours and BRAF mutant tumours, the latter presentalso in subtype D. The literature indicates that MSIis associated with better RFS, while BRAF mutationis an indicator of worse SAR [27]. To analyse howthese two contradictory components affect survival in
2013 Swiss Institute of Bioinformatics. Journal of Pathology published by John Wiley & Sons Ltd J Pathol 2013on behalf of Pathological Society of Great Britain and Ireland. www.pathsoc.org.uk www.thejournalofpathology.com
Gene expression heterogeneity in colorectal cancer 7
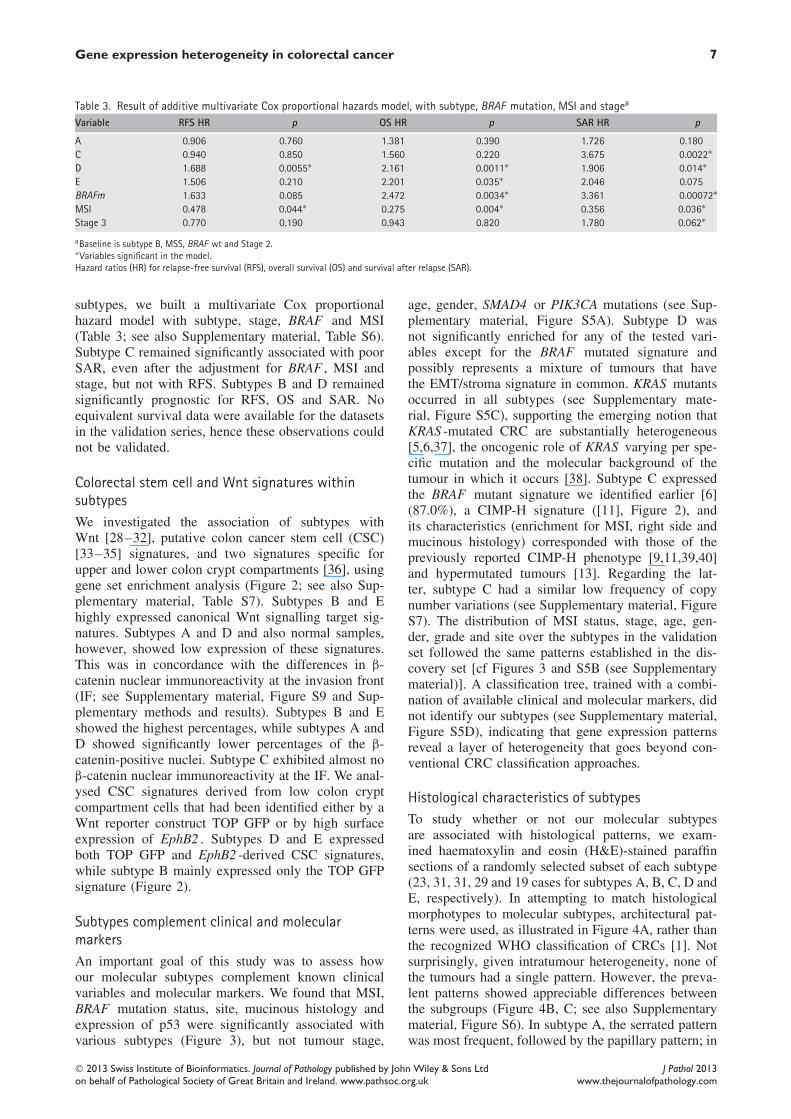
Table 3. Result of additive multivariate Cox proportional hazards model, with subtype, BRAF mutation, MSI and stagea
Variable RFS HR p OS HR p SAR HR p
A 0.906 0.760 1.381 0.390 1.726 0.180C 0.940 0.850 1.560 0.220 3.675 0.0022∗
D 1.688 0.0055∗ 2.161 0.0011∗ 1.906 0.014∗
E 1.506 0.210 2.201 0.035∗ 2.046 0.075BRAFm 1.633 0.085 2.472 0.0034∗ 3.361 0.00072∗
MSI 0.478 0.044∗ 0.275 0.004∗ 0.356 0.036∗
Stage 3 0.770 0.190 0.943 0.820 1.780 0.062∗
aBaseline is subtype B, MSS, BRAF wt and Stage 2.∗Variables significant in the model.Hazard ratios (HR) for relapse-free survival (RFS), overall survival (OS) and survival after relapse (SAR).
subtypes, we built a multivariate Cox proportionalhazard model with subtype, stage, BRAF and MSI(Table 3; see also Supplementary material, Table S6).Subtype C remained significantly associated with poorSAR, even after the adjustment for BRAF , MSI andstage, but not with RFS. Subtypes B and D remainedsignificantly prognostic for RFS, OS and SAR. Noequivalent survival data were available for the datasetsin the validation series, hence these observations couldnot be validated.
Colorectal stem cell and Wnt signatures withinsubtypesWe investigated the association of subtypes withWnt [28–32], putative colon cancer stem cell (CSC)[33–35] signatures, and two signatures specific forupper and lower colon crypt compartments [36], usinggene set enrichment analysis (Figure 2; see also Sup-plementary material, Table S7). Subtypes B and Ehighly expressed canonical Wnt signalling target sig-natures. Subtypes A and D and also normal samples,however, showed low expression of these signatures.This was in concordance with the differences in β-catenin nuclear immunoreactivity at the invasion front(IF; see Supplementary material, Figure S9 and Sup-plementary methods and results). Subtypes B and Eshowed the highest percentages, while subtypes A andD showed significantly lower percentages of the β-catenin-positive nuclei. Subtype C exhibited almost noβ-catenin nuclear immunoreactivity at the IF. We anal-ysed CSC signatures derived from low colon cryptcompartment cells that had been identified either by aWnt reporter construct TOP GFP or by high surfaceexpression of EphB2 . Subtypes D and E expressedboth TOP GFP and EphB2 -derived CSC signatures,while subtype B mainly expressed only the TOP GFPsignature (Figure 2).
Subtypes complement clinical and molecularmarkersAn important goal of this study was to assess howour molecular subtypes complement known clinicalvariables and molecular markers. We found that MSI,BRAF mutation status, site, mucinous histology andexpression of p53 were significantly associated withvarious subtypes (Figure 3), but not tumour stage,
age, gender, SMAD4 or PIK3CA mutations (see Sup-plementary material, Figure S5A). Subtype D wasnot significantly enriched for any of the tested vari-ables except for the BRAF mutated signature andpossibly represents a mixture of tumours that havethe EMT/stroma signature in common. KRAS mutantsoccurred in all subtypes (see Supplementary mate-rial, Figure S5C), supporting the emerging notion thatKRAS -mutated CRC are substantially heterogeneous[5,6,37], the oncogenic role of KRAS varying per spe-cific mutation and the molecular background of thetumour in which it occurs [38]. Subtype C expressedthe BRAF mutant signature we identified earlier [6](87.0%), a CIMP-H signature ([11], Figure 2), andits characteristics (enrichment for MSI, right side andmucinous histology) corresponded with those of thepreviously reported CIMP-H phenotype [9,11,39,40]and hypermutated tumours [13]. Regarding the lat-ter, subtype C had a similar low frequency of copynumber variations (see Supplementary material, FigureS7). The distribution of MSI status, stage, age, gen-der, grade and site over the subtypes in the validationset followed the same patterns established in the dis-covery set [cf Figures 3 and S5B (see Supplementarymaterial)]. A classification tree, trained with a combi-nation of available clinical and molecular markers, didnot identify our subtypes (see Supplementary material,Figure S5D), indicating that gene expression patternsreveal a layer of heterogeneity that goes beyond con-ventional CRC classification approaches.
Histological characteristics of subtypesTo study whether or not our molecular subtypesare associated with histological patterns, we exam-ined haematoxylin and eosin (H&E)-stained paraffinsections of a randomly selected subset of each subtype(23, 31, 31, 29 and 19 cases for subtypes A, B, C, D andE, respectively). In attempting to match histologicalmorphotypes to molecular subtypes, architectural pat-terns were used, as illustrated in Figure 4A, rather thanthe recognized WHO classification of CRCs [1]. Notsurprisingly, given intratumour heterogeneity, none ofthe tumours had a single pattern. However, the preva-lent patterns showed appreciable differences betweenthe subgroups (Figure 4B, C; see also Supplementarymaterial, Figure S6). In subtype A, the serrated patternwas most frequent, followed by the papillary pattern; in
2013 Swiss Institute of Bioinformatics. Journal of Pathology published by John Wiley & Sons Ltd J Pathol 2013on behalf of Pathological Society of Great Britain and Ireland. www.pathsoc.org.uk www.thejournalofpathology.com

8 E Budinska et al
Figure 2. Subtypes and biological motifs. Subtype-specific fingerprints of biological motifs, represented either as mean values of gene setenrichment scores of gene sets from corresponding gene modules (EMT/stroma, immune, secretory cells, proliferation, GDC, chromosome20q, top of the crypt—meta105 and meta144) or composed gene set enrichment scores of particular signatures (canonical Wnt targets,CSC-TopGFP, CSC-EphB2, colon crypt bottom and CIMP-H). The gene set enrichment scores represent whether the genes from the gene setshow statistically significant enrichment between the down-regulated (negative scores, light blue area) or up regulated (positive scores)genes of a given subtype; details of score calculation can be found in the Supplementary material (Supplementary methods and resultsand Table S7.).
Figure 3. Clinical and mutational characterization of subtypes. Columns represent variables and rows subtypes. Horizontal bar plotsrepresent proportions of the corresponding variable in each of the subtypes and non-core samples. Non-core samples were tested as onegroup to ensure that they did not share a common characteristic that would set them apart. Numbers in brackets adjacent to subtypename represent overall number of samples in the subtype. Under the title of each variable we denote the percentage representing baselineproportion in the population, with available information, and N denotes the number of patients for which the information on the respectivefeature was available. Bars in red represent significant enrichment and bars in blue significant depletion of a feature in the subtype incomparison to baseline, at the 5% significance level. Adjacent to each bar is the percentage of samples in the subtype with the specificfeature and in brackets the overall number of samples in the subtype with the information available. We can read that, for instance,subtype C, comprising 154 samples, is enriched for microsatellite-unstable (MSI) tumours, where 60.4% of 91 samples with availableinformation are MSI.
2013 Swiss Institute of Bioinformatics. Journal of Pathology published by John Wiley & Sons Ltd J Pathol 2013on behalf of Pathological Society of Great Britain and Ireland. www.pathsoc.org.uk www.thejournalofpathology.com

Gene expression heterogeneity in colorectal cancer 9
Figure 4. Morphological CRC patterns. (A) morphological CRC patterns scored in subtypes. (B, C) Distribution of dominant (B) and secondary(C) histological patterns in subtypes. Columns represent subtypes and widths are proportional to subtype frequency (numbers of samplesin each subtype); rows represent dominant (B) or secondary (C) patterns and heights are proportional to pattern frequency. Boxes showadjusted p values of pairwise statistical testing of morphological pattern distribution between subtypes.
subtypes B and E, complex tubular dominated; in sub-type C the solid pattern dominated, with mucinous asthe second; most striking was the presence of a strongstromal reaction in subtype D.
Discussion
Our approach, using gene modules on a large panel ofsamples, allowed us to identify five main CRC geneexpression subtypes (Table 4). It is relevant to notethat subtyping can be performed on FFPE tissues, animportant prerequisite for wide clinical applications.An example is the hypermutated group identified inthe TCGA study by whole exome sequencing [13], butaccording to our data also by gene expression profilingon routinely processed tissues (CIMP-H-like subtype).
The combination of gene expression, clinical, muta-tional, survival and morphological data contributes newinsight into the heterogeneity of CRC. While the vali-dation confirmed the robustness of our findings acrossdifferent platforms (ALMAC versus Affymetrix), sam-ple preparation methods (FFPE versus fresh-frozen)and dataset collections, larger datasets are necessaryto assess and characterize the relevance of lower fre-quency subtypes (eg F, or further segregation of Binto B1 and B2). Our data indicate that several majorbiological processes are key determinants of a com-plex subtype structure of CRC. Therefore our sub-types defined by gene expression do not substitutebut complement groups defined by current clinico-pathological variables and molecular markers. Notably,morphological subclassification of CRC has clearlyreached its limits, given the often striking intratumour
2013 Swiss Institute of Bioinformatics. Journal of Pathology published by John Wiley & Sons Ltd J Pathol 2013on behalf of Pathological Society of Great Britain and Ireland. www.pathsoc.org.uk www.thejournalofpathology.com

10 E Budinska et al
Tabl
e4.
Sum
mar
yof
subt
ype
char
acte
ristic
sCR
Cm
arke
rsan
dm
utat
ions
His
topa
thol
ogy
IHC
Med
ian
surv
ival
(mon
ths)
Clin
ical
Gene
expr
essi
on
Subt
ype
MSI
BRAF
KRAS
P53
Dom
inan
tN
ucle
arβ-c
aten
inat
IFO
SRF
SSA
RSi
teGr
ade
Up-r
egul
ated
Dow
n-re
gula
ted
A:Su
rfac
ecr
ypt-
like
–+
Papi
llary
orse
rrat
ed–
NA
NA
28.9
Top
colo
ncr
ypt,
secr
etor
yce
ll,m
etal
loth
ione
ins
EMT/
stro
ma,
Wnt
,CSC
,Ch
r20q
,pr
olife
ratio
nB:
Low
ercr
ypt-
like
––
Com
plex
tubu
lar
+N
AN
A50
.4Le
ft2
Top
colo
ncr
ypt,
prol
ifera
tion,
Wnt
EMT/
stro
ma,
imm
une,
secr
etor
yce
llC:
CIM
P-H
-lik
e+
+–
Solid
/tra
becu
laro
rm
ucin
ous
–N
AN
A6.
9Ri
ght
3Pr
olife
ratio
n,im
mun
e,m
etal
loth
ione
ins
GDC
,top
colo
ncr
ypt,
Chr2
0qD:
Mes
ench
ymal
Desm
opla
stic
–N
A79
.519
.8EM
T/st
rom
a,CS
C,im
mun
ePr
olife
ratio
n,se
cret
ory
cell,
top
colo
ncr
ypt,
GDC
,Wnt
,Chr
20q
E:M
ixed
––
+Co
mpl
extu
bula
r+
NA
NA
19.6
Left
EMT/
stro
ma,
imm
une,
top
colo
ncr
ypt,
Chr2
0q,
GDC
,CSC
Secr
etor
yce
ll
+,si
gnifi
cant
lyen
riche
d;–
,sig
nific
antly
depl
eted
;IF,
inva
sion
fron
t;N
A,no
tat
tain
ed;n
ova
lue,
nosi
gnifi
cant
enric
hmen
tin
com
paris
onto
popu
latio
nba
selin
e.
heterogeneity, which made us use a (primary andsecondary) architectural pattern approach rather thanthe canonized histological subtypes (WHO). Profilingof microdissected patterns within a single tumour mightreveal molecular mechanisms responsible for thesemorphotypes. This additional heterogeneity within thesubtypes may reflect tumour polyclonality, similar tobreast cancer [41]. Ultimately, aggregating clinical,pathological and further detailed molecular character-istics (including CNV, miRNA and methylation) willcontribute to a more detailed perception of CRC hetero-geneity and it is likely that more subtypes will emerge.This, however, would need more detailed molecularannotation of larger clinically well documented CRCs.
A striking association was found between the stro-mal subtype D and the EMT signature. The previouslydiscovered EMT [12] also emerged from our analy-sis as the largest cluster of meta-genes associated withpoor RFS (subtype D). Our histological assessmentsuggests that the EMT signature is the reflection ofa strong mesenchymal stromal reaction, and this his-tological characteristic deserves to be tested for itscapacity to predict resistance to therapy, in view of itsstrong association with poor survival. Studies requiringhigh tumour cell content as sample inclusion criteria(eg [13]) could miss this poor prognosis subtype. Iden-tification of this subtype in cell lines or xenograft mod-els is less straightforward and would benefit from theanalysis of gene expression patterns between microdis-sected tumour and stromal cells.
EMT, however important, only partly explainsCRC heterogeneity, as even subtypes with similarexpression of EMT-associated genes (A–C or D–E)differ in survival, mutational, clinical and gene expres-sion characteristics. Additional biological components,such as differentiation, immune response, proliferation,chromosome 20q or cluster of genes deregulated inCRCs, are important co-determinants that underpin aneed for further subdivision of CRCs. The findingsfrom the analysis of CSC and WNT signatures supportthe recently suggested hypothesis that the colon stemcell signature under the condition of silenced canon-ical WNT targets is associated with higher risk ofrecurrence (subtype D) [33]. This is consistent withsubtype D showing a significantly lower percentageof β-catenin-positive nuclei than subtype B, with itsWnt-associated gene expression and better survival.
MSI tumours represent a subclass in most unsu-pervised analyses and can be recognized at the geneexpression level [42]. The more recent gene expressionstudies [14,15] suggest that MSI and BRAF share dis-tinct gene expression patterns. Subtype C was enrichedfor both MSI and BRAF mutants and had one of thebest outcomes for RFS, but the worse outcome in SAR,in concordance with previously reported results [43].Subtype C retained its poor SAR prognostic value, evenin the population of MSS and BRAF wild-type patients.Our data suggest that subtype C represents tumourswith a common biology and a gene expression pattern
2013 Swiss Institute of Bioinformatics. Journal of Pathology published by John Wiley & Sons Ltd J Pathol 2013on behalf of Pathological Society of Great Britain and Ireland. www.pathsoc.org.uk www.thejournalofpathology.com

Gene expression heterogeneity in colorectal cancer 11
that might best characterize a group of tumours resis-tant to chemotherapy, once metastatic. In this sense,our work not only agrees with the current known mark-ers (BRAF mutation status and MSI) but clearly addsnew insight, putting together these previously unre-lated clusters into one biologically meaningful group.This observation is in line with recently publishedwork [6].
Our observations show that gene expression profil-ing contributes substantially to our insight into CRCheterogeneity in confirming and complementing datafrom sequencing, CNV and promoter methylationanalysis. Our subtypes can be further functionallyinterrogated for driving oncogenes/events by in vitrofunctional screens. High-risk subtypes D and C mightcontribute to therapeutic decision making in eitheradjuvant or metastatic settings. Retrospective analysisof clinical trial series may identify drug sensitivityassociated with particular subtypes, and might opennew treatment optimization strategies to be tested inclinical trials with stratified cohorts, similar to theI-SPY2 trial for breast cancer [44].
In conclusion, our unsupervised approach usinggene modules resulted in the identification of dis-tinct molecularly defined CRC subtypes, which addsa new layer of complexity to CRC heterogeneity andopens new opportunities for understanding the dis-ease. The challenge is now to assimilate conventionaland these new molecular approaches into a compre-hensive consensus classification, which might then beused in further clinical studies for patient stratificationand experimental studies to further elucidate mecha-nisms involved in the development and progressionof CRC.
Acknowledgements
We thank all the clinicians who enrolled patients andparticipated in the PETACC-3 trial (see Appendixat: http://jco.ascopubs.org/content/27/19/3117.long), inparticular the coordinators D Cunningham, R Labi-anca and E Van Cutsem. We thank F Schutz, T Sen-gstag and A Wirapati for providing analytical toolsfor clustering and gene set enrichment analysis. Thiswork was supported in part by the Swiss NationalScience Foundation (SNF; http://www.snf.ch/E/; GrantNo. 320030_135421, to AR and MD); KrebsforschungSchweiz (KFS; http://www.krebsforschung.ch/; GrantNo. 02697-08-2010, to AR and MD); FondationMedic (to EB and MD); and the Swiss NationalCentre for Competence in Research Molecular Biol-ogy (http://www.nccr-oncology.ch/; to VP and MD).ST is a Senior Clinical Investigator of the Fundfor Scientific Research Flanders (FWO-Vlaanderen)and has received research grants from the BelgianNational Cancer Plan (Nationaal Kankerplan). Wethank the TCGA research network for the availabilityof data.
Author contributions
EB and MD designed the study; YP, FTB, ST, JGH andSW conceived and carried out microarray experiments;YP and FTB performed histopathological experimentsand β-catenin scoring; EB, VP, GD, NL and AFNanalysed the data, EB, VP, ST, FTB, KOS, NL, JGH,SW, MD and AR performed data interpretation; EB,NL and KOS performed the literature search; and EBgenerated figures and conceived the first manuscriptdraft. All authors were involved in writing the paperand had final approval of the submitted and publishedversions.
References1. Bosman FT, World Health Organization, International Agency
for Research on Cancer. WHO Classification of Tumours of the
Digestive System , 4th edn. International Agency for Research onCancer (IARC): Lyons, 2010.
2. Tejpar S, Saridaki Z, Delorenzi M, et al . Microsatellite instability,prognosis and drug sensitivity of stage II and III colorectal cancer:more complexity to the puzzle. J Natl Cancer Inst 2011; 103:841–844.
3. Sinicrope FA, Sargent DJ. Molecular pathways: microsatellite insta-bility in colorectal cancer: prognostic, predictive, and therapeuticimplications. Clin Cancer Res 2012; 18: 1506–1512.
4. Vecchione L, Jacobs B, Normanno N, et al . EGFR-targeted therapy.Exp Cell Res 2011; 317: 2765–2771.
5. Martini M, Vecchione L, Siena S, et al . Targeted therapies: howpersonal should we go? Nat Rev Clin Oncol 2011; 9: 87–97.
6. Popovici V, Budinska E, Tejpar S, et al . Identification of a poor-prognosis BRAF-mutant-like population of patients with coloncancer. J Clin Oncol 2012; 30: 1288–1295.
7. Jass JR. Classification of colorectal cancer based on correlationof clinical, morphological and molecular features. Histopathology
2007; 50: 113–130.8. Shen L, Toyota M, Kondo Y, et al . Integrated genetic and epigenetic
analysis identifies three different subclasses of colon cancer. Proc
Natl Acad Sci USA 2007; 104: 18654–18659.9. Ogino S, Goel A. Molecular classification and correlates in colorec-
tal cancer. J Mol Diagn 2008; 10: 13–27.10. Furlan D, Carnevali IW, Bernasconi B, et al . Hierarchical clustering
analysis of pathologic and molecular data identifies prognosticallyand biologically distinct groups of colorectal carcinomas. Mod
Pathol 2011; 24: 126–137.11. Hinoue T, Weisenberger DJ, Lange CP, et al . Genome-scale
analysis of aberrant DNA methylation in colorectal cancer. Genome
Res 2012; 22: 271–282.12. Loboda A, Nebozhyn MV, Watters JW, et al . EMT is the dominant
program in human colon cancer. BMC Med Genom 2011; 4: 9.13. TCGA CGAN. Comprehensive molecular characterization of
human colon and rectal cancer. Nature 2012; 487: 330–337.14. Salazar R, Roepman P, Capella G, et al . Gene expression signature
to improve prognosis prediction of stage II and III colorectal cancer.J Clin Oncol 2011; 29: 17–24.
15. Perez Villamil B, Romera Lopez A, Hernandez Prieto S, et al .Colon cancer molecular subtypes identified by expression profilingand associated to stroma, mucinous type and different clinicalbehavior. BMC Cancer 2012; 12: 260.
16. Wirapati P, Sotiriou C, Kunkel S, et al . Meta-analysis ofgene expression profiles in breast cancer: toward a unified
2013 Swiss Institute of Bioinformatics. Journal of Pathology published by John Wiley & Sons Ltd J Pathol 2013on behalf of Pathological Society of Great Britain and Ireland. www.pathsoc.org.uk www.thejournalofpathology.com

12 E Budinska et al
understanding of breast cancer subtyping and prognosis signatures.Breast Cancer Res 2008; 10: R65.
17. Farmer P, Bonnefoi H, Becette V, et al . Identification of molecularapocrine breast tumours by microarray analysis. Oncogene 2005;24: 4660–4671.
18. Shedden K, Taylor JM, Enkemann SA, et al . Gene expression-basedsurvival prediction in lung adenocarcinoma: a multi-site, blindedvalidation study. Nat Med 2008; 14: 822–827.
19. Xie T, G DA, Lamb JR, et al . A comprehensive characterization ofgenome-wide copy number aberrations in colorectal cancer revealsnovel oncogenes and patterns of alterations. PLoS One 2012; 7:e42001.
20. Langfelder P, Zhang B, Horvath S. Defining clusters from ahierarchical cluster tree: the Dynamic Tree Cut package for R.Bioinformatics 2008; 24: 719–720.
21. Monti S, Tamayo P, Mesirov J, et al . Consensus clustering: aresampling-based method for class discovery and visualization ofgene expression microarray data. Machine Learning 2003; 52:91–118.
22. Hastie T, Tibshirani R, Friedman JH. The Elements of Statisti-
cal Learning: Data Mining, Inference, and Prediction , 2nd edn.Springer: New York, 2009.
23. Zou H, Hastie T. Regularization and variable selection via theelastic net. J R Stat Soc B 2005; 67: 301–320.
24. Smyth GK. Linear models and empirical bayes methods forassessing differential expression in microarray experiments. Stat
Appl Genet Mol Biol 2004; 3: Article 3.25. Huang DW, Sherman BT, Lempicki RA. Systematic and integrative
analysis of large gene lists using DAVID bioinformatics resources.Nat Protoc 2009; 4: 44–57.
26. Arnholt AT. BSDA: Basic statistics and data analysis. R pack-age v 1.01, 2012; http://cran.r-project.org/web/packages/BSDA/index.html
27. Tejpar S, Bertagnolli M, Bosman F, et al . Prognostic and predictivebiomarkers in resected colon cancer: current status and futureperspectives for integrating genomics into biomarker discovery.Oncologist 2010; 15: 390–404.
28. Mokry M, Hatzis P, de Bruijn E, et al . Efficient double fragmenta-tion ChIP-seq provides nucleotide resolution protein-DNA bindingprofiles. PLoS One 2010; 5: e15092.
29. Hatzis P, van der Flier LG, van Driel MA, et al . Genome-widepattern of TCF7L2/TCF4 chromatin occupancy in colorectal cancercells. Mol Cell Biol 2008; 28: 2732–2744.
30. Van der Flier LG, Sabates-Bellver J, Oving I, et al . The intestinalWnt/TCF signature. Gastroenterology 2007; 132: 628–632.
31. Sansom OJ, Reed KR, Hayes AJ, et al . Loss of APC in vivo
immediately perturbs Wnt signaling, differentiation, and migration.Genes Dev 2004; 18: 1385–1390.
32. Fevr T, Robine S, Louvard D, et al . Wnt/β-catenin is essential forintestinal homeostasis and maintenance of intestinal stem cells. Mol
Cell Biol 2007; 27: 7551–7559.33. de Sousa EMF, Colak S, Buikhuisen J, et al . Methylation of
cancer stem-cell-associated Wnt target genes predicts poor prog-nosis in colorectal cancer patients. Cell Stem Cell 2011; 9:476–485.
34. Merlos-Suarez A, Barriga FM, Jung P, et al . The intestinal stemcell signature identifies colorectal cancer stem cells and predictsdisease relapse. Cell Stem Cell 2011; 8: 511–524.
35. van der Flier LG, van Gijn ME, Hatzis P, et al . Transcription factorachaete scute-like 2 controls intestinal stem cell fate. Cell 2009;136: 903–912.
36. Kosinski C, Stange DE, Xu C, et al . Indian hedgehog reg-ulates intestinal stem cell fate through epithelial–mesenchymalinteractions during development. Gastroenterology 2010; 139:893–903.
37. Faris JE, Ryan DP. Trees, forests, and other implications of a BRAF
mutant gene signature in patients with BRAF wild-type disease. J
Clin Oncol 2012; 30: 1255–1257.38. Singh A, Sweeney MF, Yu M, et al . TAK1 inhibition promotes
apoptosis in KRAS -dependent colon cancers. Cell 2012; 148:639–650.
39. Tanaka H, Deng G, Matsuzaki K, et al . BRAF mutation, CpGisland methylator phenotype and microsatellite instability occurmore frequently and concordantly in mucinous than non-mucinouscolorectal cancer. Int J Cancer 2006; 118: 2765–2771.
40. Hawkins N, Norrie M, Cheong K, et al . CpG island methylationin sporadic colorectal cancers and its relationship to microsatelliteinstability. Gastroenterology 2002; 122: 1376–1387.
41. The Cancer Genome Atlas. Comprehensive molecular portraits ofhuman breast tumours. Nature 2012; 490: 61–70.
42. Tian S, Roepman P, Popovici V, et al . A robust genomic signaturefor the detection of colorectal cancer patients with microsatelliteinstability phenotype and high mutation frequency. J Pathol 2012;228: 586–595.
43. Dahlin AM, Palmqvist R, Henriksson ML, et al . The role of theCpG island methylator phenotype in colorectal cancer prognosisdepends on microsatellite instability screening status. Clin Cancer
Res 2010; 16: 1845–1855.44. Barker AD, Sigman CC, Kelloff GJ, et al . I-SPY 2: an adaptive
breast cancer trial design in the setting of neoadjuvant chemother-apy. Clin Pharmacol Ther 2009; 86: 97–100.
45. Moskaluk CA, Zhang H, Powell SM, et al . Cdx2 protein expressionin normal and malignant human tissues: an immunohistochemicalsurvey using tissue microarrays. Mod Pathol 2003; 16: 913–919.
46. van den Brink GR, Bleuming SA, Hardwick JC, et al . IndianHedgehog is an antagonist of Wnt signaling in colonic epithelialcell differentiation. Nat Genet 2004; 36: 277–282.
47. Liu JY, Seno H, Miletic AV, et al . Vav proteins are necessaryfor correct differentiation of mouse cecal and colonic enterocytes.J Cell Sci 2009; 122: 324–334.
48. Zheng H, Ying H, Wiedemeyer R, et al . PLAGL2 regulates Wntsignaling to impede differentiation in neural stem cells and gliomas.Cancer Cell 2010; 17: 497–509.
49. Hirose H, Ishii H, Mimori K, et al . The significance of PITX2overexpression in human colorectal cancer. Ann Surg Oncol 2011;18: 3005–3012.
50. Kontos CK, Papadopoulos IN, Fragoulis EG, et al . Quantitativeexpression analysis and prognostic significance of L-DOPA decar-boxylase in colorectal adenocarcinoma. Br J Cancer 2010; 102:1384–1390.
51. Bhatavdekar J, Patel D, Ghosh N, et al . Interrelationship ofprolactin and its receptor in carcinoma of colon and rectum: apreliminary report. J Surg Oncol 1994; 55: 246–249.
52. Gaber A, Johansson M, Stenman UH, et al . High expression oftumour-associated trypsin inhibitor correlates with liver metastasisand poor prognosis in colorectal cancer. Br J Cancer 2009; 100:1540–1548.
53. Kawakami K, Ooyama A, Ruszkiewicz A, et al . Low expressionof gamma-glutamyl hydrolase mRNA in primary colorectal cancerwith the CpG island methylator phenotype. Br J Cancer 2008; 98:1555–1561.
54. Chen Y, Tang Y, Guo C, et al . Nuclear receptors in the multidrugresistance through the regulation of drug-metabolizing enzymes anddrug transporters. Biochem Pharmacol 2012; 83: 1112–1126.
55. Park SW, Zhen G, Verhaeghe C, et al . The protein disulfideisomerase AGR2 is essential for production of intestinal mucus.Proc Natl Acad Sci USA 2009; 106: 6950–6955.
56. Noah TK, Kazanjian A, Whitsett J, et al . SAM pointed domain ETSfactor (SPDEF) regulates terminal differentiation and maturation ofintestinal goblet cells. Exp Cell Res 316: 452–465.
2013 Swiss Institute of Bioinformatics. Journal of Pathology published by John Wiley & Sons Ltd J Pathol 2013on behalf of Pathological Society of Great Britain and Ireland. www.pathsoc.org.uk www.thejournalofpathology.com

Gene expression heterogeneity in colorectal cancer 13
57. Steppan CM, Brown EJ, Wright CM, et al . A family of tissue-specific resistin-like molecules. Proc Natl Acad Sci USA 2001; 98:502–506.
58. Heiskala K, Giles-Komar J, Heiskala M, et al . High expression ofRELP (Reg IV) in neoplastic goblet cells of appendiceal mucinouscystadenoma and pseudomyxoma peritonei. Virchows Arch 2006;448: 295–300.
59. Dalerba P, Kalisky T, Sahoo D, et al . Single-cell dissection oftranscriptional heterogeneity in human colon tumors. Nat Biotechnol
2011; 29: 1120–1127.60. *R Development Core Team. A Language and Environment for
Statistical Computing . R Foundation for Statistical Computing:Vienna, Austria, 2012.
61. *Gentleman RC, Carey VJ, Bates DM, et al . Bioconductor: opensoftware development for computational biology and bioinformat-ics. Genome Biol 2004; 5: R80.
62. *Therenau T. A Package for Survival Analysis in S . R packageversion 2.36–14, 2012.
63. *Bolstad BM, Collin F, Simpson KM, et al . Experimental designand low-level analysis of microarray data. Int Rev Neurobiol 2004;60: 25–58.
64. *Venables WNR, Ripley BD. Modern Applied Statistics with S, 4thedn. Springer: New York, 2002.
65. *Hothorn T, Hornik K, Zeileis A. Unbiased recursive partitioning:a conditional inference framework. J Comput Graph Statist 2006;15: 651–674.
66. *Van Cutsem E, Labianca R, Bodoky G, et al . Randomized phase IIItrial comparing biweekly infusional fluorouracil/leucovorin alone orwith irinotecan in the adjuvant treatment of stage III colon cancer:PETACC-3. J Clin Oncol 2009; 27: 3117–3125.
67. *Jorissen RN, Gibbs P, Christie M, et al . Metastasis-associatedgene expression changes predict poor outcomes in patients withDukes stage B and C colorectal cancer. Clin Cancer Res 2009; 15:7642–7651.
68. *IGC. Expression Project for Oncology, 2008 [cited; available from:http://www.intgen.org/expo/]
69. *Smith JJ, Deane NG, Wu F, et al . Experimentally derivedmetastasis gene expression profile predicts recurrence and deathin patients with colon cancer. Gastroenterology 2010; 138:958–968.
70. *Skrzypczak M, Goryca K, Rubel T, et al . Modeling oncogenicsignaling in colon tumors by multidirectional analyses of microarraydata directed for maximization of analytical reliability. PLoS One
2010; 5: e13091.71. *Hong Y, Ho KS, Eu KW, et al . A susceptibility gene set
for early onset colorectal cancer that integrates diverse signalingpathways: implication for tumorigenesis. Clin Cancer Res 2007;13: 1107–1114.
72. *Gyorffy B, Molnar B, Lage H, et al . Evaluation of microarraypreprocessing algorithms based on concordance with RT–PCR inclinical samples. PLoS One 2009; 4: e5645.
73. *Galamb O, Sipos F, Solymosi N, et al . Diagnostic mRNAexpression patterns of inflamed, benign, and malignant colorectalbiopsy specimen and their correlation with peripheral blood results.Cancer Epidemiol Biomarkers Prev 2008; 17: 2835–2845.
74. *Galamb O, Spisak S, Sipos F, et al . Reversal of gene expressionchanges in the colorectal normal–adenoma pathway by NS398selective COX2 inhibitor. Br J Cancer 2010; 102: 765–773.
75. *Koinuma K, Yamashita Y, Liu W, et al . Epigenetic silencingof AXIN2 in colorectal carcinoma with microsatellite instability.Oncogene 2006; 25: 139–146.
76. *Jorissen RN, Lipton L, Gibbs P, et al . DNA copy-number alter-ations underlie gene expression differences between microsatellitestable and unstable colorectal cancers. Clin Cancer Res 2008; 14:8061–8069.
77. *Grone J, Lenze D, Jurinovic V, et al . Molecular profiles andclinical outcome of stage UICC II colon cancer patients. Int JColorectal Dis 2011; 26: 847–858.
78. *Birnbaum DJ, Laibe S, Ferrari A, et al . Expression profiles instage II colon cancer according to APC gene status. Transl Oncol2012; 5: 72–76.
79. *Giancarlo R, Scaturro D, Utro F. Computational cluster validationfor microarray data analysis: experimental assessment of Clest,Consensus Clustering, Figure of Merit, Gap Statistics and Model
Explorer. BMC Bioinformat 2008; 9: 462.80. *Huang DW, Sherman BT, Lempicki RA. Bioinformatics enrich-
ment tools: paths toward the comprehensive functional analysis oflarge gene lists. Nucleic Acids Res 2009; 37: x1–13.
*Cited only in the Supplementary material.
SUPPLEMENTARY MATERIAL ON THE INTERNETThe following supplementary material may be found in the online version of this article:
Supplementary methods and results (contains a further table and two further figures)
Figure S1. (A) Consensus clustering and similarity dendrogram of samples. (B) Subtype projection in the four-dimensional space of LDA axes.(C) Heat map matrix of pairwise meta-gene Fisher Z-transformed Pearson pairwise correlations. (D) Box plots of intra gene module pairwisegene–gene Pearson correlations in normal samples in both discovery and validation sets
Figure S2. Validation of meta-gene expression pattern of subtypes represented by heat maps
Figure S3. (A) Heat map representing validation of gene expression patterns of subtypes. (B) Pairwise Fisher Z-transformed correlations ofmeta-genes in validation set. (C) Box plots representing medians of pairwise gene–gene Pearson correlations in the validation datasets
Figure S4. Expression of top five down- and top five up regulated genes from all pairwise comparisons between subtypes
Figure S5. (A) Other clinical and mutational markers tested and found non-significant between subtypes. (B) Clinical variables tested in theclusters of the validation test. (C) Distribution of significant clinical and mutational markers across subtypes. (D) Classification tree trained onclinical variables
Figure S6. Graphs of joined distribution of dominant vsersus secondary patterns in each of the subtypes
Figure S7. Heat map of CNV profiles of 154 samples from the discovery set, randomly ordered inside each of the subtypes
Figure S8. Result of hypothesis testing of median log-scale copy number estimates of chromosome 20 of subtype B versus all other subtypes
Figure S9. Distribution of β-catenin immunoreactivity of the invasion front counts between subtypes
2013 Swiss Institute of Bioinformatics. Journal of Pathology published by John Wiley & Sons Ltd J Pathol 2013on behalf of Pathological Society of Great Britain and Ireland. www.pathsoc.org.uk www.thejournalofpathology.com

14 E Budinska et al
Table S1. Detailed description of gene module members and detailed results of meta-gene expression tests pairwise between subtypes and ofsubtypes to meta-gene medians
Table S2. Multiclass linear discriminant (LDA) subtype assignment of samples from validation set
Table S3. Correlations of subtype-specific gene expression profiles (1 versus all moderated t test statistics) when accounting for subtype F in thetraining set
Table S4. Detailed results of meta-gene expression tests pairwise between subtypes and of subtypes to meta-gene medians
Table S5. Detailed results of pairwise comparisons of differentially expressed gene between subtypes
Table S6. Detailed results of Cox proportional hazards models for RFS, OS and SAR for subtype, stage, MSI and BRAF and for meta-genes
Table S7. Results of GSEA comparison of enrichment tested signatures in individual subtypes and normal samples
2013 Swiss Institute of Bioinformatics. Journal of Pathology published by John Wiley & Sons Ltd J Pathol 2013on behalf of Pathological Society of Great Britain and Ireland. www.pathsoc.org.uk www.thejournalofpathology.com