Gene Expression Analysis Points to Hemostasis in Livers of Rats Cotreated with Lipopolysaccharide...
11
TOXICOLOGICAL SCIENCES 80, 203–213 (2004) DOI: 10.1093/toxsci/kfh146 Advance Access publication April 14, 2004 Gene Expression Analysis Points to Hemostasis in Livers of Rats Cotreated with Lipopolysaccharide and Ranitidine James P. Luyendyk,* William B. Mattes,‡ ,2 Lyle D. Burgoon,* Timothy R. Zacharewski,† Jane F. Maddox,* Gregory N. Cosma,‡ ,3 Patricia E. Ganey,* and Robert A. Roth,* ,1 Departments of *Pharmacology and Toxicology and †Biochemistry and Molecular Biology, National Food Safety and Toxicology Center, Center for Integrative Toxicology, Michigan State University, East Lansing, Michigan 48824; and ‡Investigative Toxicology, Pharmacia Corporation, Kalamazoo, Michigan Received February 26, 2004; accepted April 2, 2004 Studies in rats have demonstrated that modest underlying inflam- mation can precipitate idiosyncratic-like liver injury from the his- tamine 2-receptor antagonist, ranitidine (RAN). Coadministration to rats of nonhepatotoxic doses of RAN and the inflammagen, bac- terial lipopolysaccharide (LPS), results in hepatocellular injury. We tested the hypothesis that hepatic gene expression changes could be distinguished among vehicle-, LPS-, RAN- and LPS/RAN-treated rats before the onset of significant liver injury in the LPS/RAN- treated rats (i.e., 3 h post-treatment). Rats were treated with LPS (44 3 10 6 EU/kg, iv) or its vehicle, then two hours later with RAN (30 mg/kg, iv) or its vehicle. They were killed 3 h after RAN treat- ment, and liver samples were taken for evaluation of liver injury and RNA isolation. Hepatic parenchymal cell injury, as estimated by increases in serum alanine aminotransferase (ALT) activity, was not significant at this time. Hierarchal clustering of gene expression data from Affymetrix U34A rat genome array grouped animals according to treatment. Relative to treatment with vehicle alone, treatment with RAN and/or LPS altered hepatic expression of numerous genes, including ones encoding products involved in inflammation, hypoxia, and cell death. Some were enhanced syner- gistically by LPS/RAN cotreatment. Real-time PCR confirmed robust changes in expression of B-cell translocation gene 2, early growth response-1, and plasminogen-activator inhibitor-1 (PAI-1) in cotreated rats. The increase in PAI-1 mRNA was reflected in an increase in serum PAI-1 protein concentration in LPS/RAN-treated rats. Consistent with the antifibrinolytic activity of PAI-1, signifi- cant fibrin deposition occurred only in livers of LPS/RAN-treated rats. The results suggest the possibility that expression of PAI-1 promotes fibrin deposition in liver sinusoids of LPS/RAN-treated rats and are consistent with the development of local ischemia and consequent tissue hypoxia. Key Words: inflammation; ranitidine; liver; gene array; plasminogen activator inhibitor-1; hypoxia. Idiosyncratic drug reactions are adverse responses of unknown etiology that occur in a small fraction of people taking a drug, with the liver being a frequent target of toxicity. One drug associated with idiosyncratic hepatotoxicity is the histamine 2-receptor antagonist, ranitidine (RAN), a drug used for the treatment of duodenal ulcers, gastric hypersecretory diseases, and gastroesophageal reflux disease. Mechanisms underlying human idiosyncratic liver injury from RAN remain unclear. Recently it has been suggested that idiosyncratic reactions to some drugs, including RAN, may result from episodic inflammation (Roth et al., 2003). Bacterial lipopolysaccharide (endotoxin, LPS) is a potent inflammagen, and exposure to small, noninjurious amounts of LPS renders rats susceptible to liver injury from normally non- toxic doses of hepatotoxic xenobiotics, including some drugs (Roth et al., 2003). For example, rats cotreated with a small, normally nonhepatotoxic dose of LPS and either a small non- hepatotoxic dose of RAN or the phenothiazine antipsychotic drug chlorpromazine develop hepatotoxicity similar to idiosyn- cratic reactions observed in people treated with either drug (Buchweitz et al., 2002; Luyendyk et al., 2003). Halothane, another agent associated with human idiosyncratic hepatotoxi- city, causes liver injury in hypoxic rats when they are coexposed to LPS (Lind et al., 1984). Thus, these studies support the hypothesis that concurrent inflammation might precipitate some idiosyncratic drug reactions. However, mechanisms of toxicity in these animal models are not understood. LPS recognition by toll-like receptors on Kupffer cells and other inflammatory cells activates signal transduction pathways, leading to cell activation and elaboration of inflammatory med- iators (Beutler, 2002). An important component of LPS activa- tion of inflammatory cells such as macrophages is transcriptional activation of numerous genes (Gao et al., 2002). Many of these gene products such as tumor necrosis factor a (TNF-a) can further activate transcription of other cytokines, adhesion mole- cules, and neutrophil (PMN) chemokines in other cell types such as endothelial cells (Zhao et al., 2003). Increased TNF-a mRNA can be detected in livers of rats treated with LPS, and serum 1 To whom correspondence should be addressed at the Department of Pharmacology and Toxicology, National Food Safety and Toxicology Center, Michigan State University, East Lansing, MI 48824. Fax: (517) 432-2310. E-mail: [email protected]. 2 Present address: Gene Logic, Inc., Gaithersburg, MD 20878. 3 Present address: Bristol Myers Squibb Co., New Brunswick, NJ. Toxicological Sciences vol. 80 no. 1 # Society of Toxicology 2004; all rights reserved. by guest on August 7, 2015 http://toxsci.oxfordjournals.org/ Downloaded from
Transcript of Gene Expression Analysis Points to Hemostasis in Livers of Rats Cotreated with Lipopolysaccharide...

TOXICOLOGICAL SCIENCES 80, 203–213 (2004)DOI: 10.1093/toxsci/kfh146Advance Access publication April 14, 2004
Gene Expression Analysis Points to Hemostasis in Livers of RatsCotreated with Lipopolysaccharide and Ranitidine
James P. Luyendyk,* William B. Mattes,‡,2 Lyle D. Burgoon,* Timothy R. Zacharewski,† Jane F. Maddox,*
Gregory N. Cosma,‡,3 Patricia E. Ganey,* and Robert A. Roth,*,1
Departments of *Pharmacology and Toxicology and †Biochemistry and Molecular Biology, National Food Safety and Toxicology Center,
Center for Integrative Toxicology, Michigan State University, East Lansing, Michigan 48824; and ‡Investigative Toxicology,
Pharmacia Corporation, Kalamazoo, Michigan
Received February 26, 2004; accepted April 2, 2004
Studies in rats havedemonstrated thatmodest underlying inflam-
mation can precipitate idiosyncratic-like liver injury from the his-
tamine 2-receptor antagonist, ranitidine (RAN). Coadministration
to rats of nonhepatotoxic doses of RAN and the inflammagen, bac-
terial lipopolysaccharide (LPS), results in hepatocellular injury.We
tested the hypothesis that hepatic gene expression changes could be
distinguished among vehicle-, LPS-, RAN- and LPS/RAN-treated
rats before the onset of significant liver injury in the LPS/RAN-
treated rats (i.e., 3 h post-treatment). Rats were treated with LPS
(44 3 106 EU/kg, iv) or its vehicle, then two hours later with RAN
(30 mg/kg, iv) or its vehicle. They were killed 3 h after RAN treat-
ment, and liver sampleswere taken for evaluation of liver injury and
RNA isolation. Hepatic parenchymal cell injury, as estimated by
increases in serum alanine aminotransferase (ALT) activity, was
not significant at this time. Hierarchal clustering of gene expression
data from Affymetrix U34A rat genome array grouped animals
according to treatment. Relative to treatment with vehicle alone,
treatment with RAN and/or LPS altered hepatic expression of
numerous genes, including ones encoding products involved in
inflammation, hypoxia, and cell death. Some were enhanced syner-
gistically by LPS/RAN cotreatment. Real-time PCR confirmed
robust changes in expression of B-cell translocation gene 2, early
growth response-1, and plasminogen-activator inhibitor-1 (PAI-1)
in cotreated rats. The increase in PAI-1 mRNA was reflected in an
increase in serumPAI-1 protein concentration in LPS/RAN-treated
rats. Consistent with the antifibrinolytic activity of PAI-1, signifi-
cant fibrin deposition occurred only in livers of LPS/RAN-treated
rats. The results suggest the possibility that expression of PAI-1
promotes fibrin deposition in liver sinusoids of LPS/RAN-treated
rats and are consistent with the development of local ischemia and
consequent tissue hypoxia.
Key Words: inflammation; ranitidine; liver; gene array;
plasminogen activator inhibitor-1; hypoxia.
Idiosyncratic drug reactions are adverse responses of
unknown etiology that occur in a small fraction of people taking
a drug, with the liver being a frequent target of toxicity. One drug
associated with idiosyncratic hepatotoxicity is the histamine
2-receptor antagonist, ranitidine (RAN), a drug used for the
treatment of duodenal ulcers, gastric hypersecretory diseases,
and gastroesophageal reflux disease. Mechanisms underlying
human idiosyncratic liver injury from RAN remain unclear.
Recently it has been suggested that idiosyncratic reactions
to some drugs, including RAN, may result from episodic
inflammation (Roth et al., 2003).
Bacterial lipopolysaccharide (endotoxin, LPS) is a potent
inflammagen, and exposure to small, noninjurious amounts of
LPS renders rats susceptible to liver injury from normally non-
toxic doses of hepatotoxic xenobiotics, including some drugs
(Roth et al., 2003). For example, rats cotreated with a small,
normally nonhepatotoxic dose of LPS and either a small non-
hepatotoxic dose of RAN or the phenothiazine antipsychotic
drug chlorpromazine develop hepatotoxicity similar to idiosyn-
cratic reactions observed in people treated with either drug
(Buchweitz et al., 2002; Luyendyk et al., 2003). Halothane,
another agent associated with human idiosyncratic hepatotoxi-
city, causes liver injury in hypoxic rats when they are coexposed
to LPS (Lind et al., 1984). Thus, these studies support the
hypothesis that concurrent inflammation might precipitate
some idiosyncratic drug reactions. However, mechanisms of
toxicity in these animal models are not understood.
LPS recognition by toll-like receptors on Kupffer cells and
other inflammatory cells activates signal transduction pathways,
leading to cell activation and elaboration of inflammatory med-
iators (Beutler, 2002). An important component of LPS activa-
tion of inflammatory cells such as macrophages is transcriptional
activation of numerous genes (Gao et al., 2002). Many of these
gene products such as tumor necrosis factor a (TNF-a) can
further activate transcription of other cytokines, adhesion mole-
cules, and neutrophil (PMN) chemokines in other cell types such
as endothelial cells (Zhao et al., 2003). Increased TNF-amRNA
can be detected in livers of rats treated with LPS, and serum
1To whom correspondence should be addressed at the Department of
Pharmacology and Toxicology, National Food Safety and Toxicology Center,
Michigan State University, East Lansing, MI 48824. Fax: (517) 432-2310.
E-mail: [email protected] address: Gene Logic, Inc., Gaithersburg, MD 20878.3Present address: Bristol Myers Squibb Co., New Brunswick, NJ.
Toxicological Sciences vol. 80 no. 1 # Society of Toxicology 2004; all rights reserved.
by guest on August 7, 2015
http://toxsci.oxfordjournals.org/D
ownloaded from
TNF-a concentration is markedly increased after LPS exposure
(Barton et al., 2001; Hewett et al., 1993). Interestingly, TNF-a is
important for liver injury fromlarge doses ofLPS inamechanism
dependent on PMN activation (Hewett et al., 1993). Thus,
enhancedexpressionofcertaingenesafterLPSexposureisimpor-
tant for liver injury, and understanding these changes could
further elucidate mechanisms of inflammatory tissue injury.
Investigation of gene expression patterns might also identify
mechanisms of pathogenesis in models in which modest, non-
injurious inflammation potentiates xenobiotic-induced liver
injury. For example, cotreatment of rats with a nonhepatotoxic
dose of LPS potentiates allyl alcohol (AA)-induced liver injury
and results in greater expression of hepatic cyclooxygenase-2
(COX-2) compared to treatment with either agent alone (Ganey
et al., 2001). In this model, COX-2 inhibition affords partial
protection from liver injury, suggesting that augmented COX-
2 gene expression is important for AA/LPS-induced liver injury
(Ganey et al., 2001). In rats cotreated with nonhepatotoxic doses
of aflatoxin B1 (AFB1) and LPS, TNF-a mRNA is increased in
liver to a level similar to rats treated with LPS alone. However,
the serum concentration of TNF-a is significantly greater in
AFB1/LPS-treated rats, and this cytokine is causally involved
in the potentiation of hepatocellular injury (Barton et al., 2001).
Thus, in other models of LPS-potentiation, a difference in mag-
nitude of gene expression in LPS and LPS/xenobiotic-treated
rats may or may not be sufficient to cause liver injury, and post-
transcriptional increases in protein or interaction between two
genes expressed at otherwise noninjurious levels might con-
tribute to liver injury. The use of gene array technology can
facilitate investigation of such interactions. For example, in
rats treated with galactosamine and LPS, gene arrays were
used to identify changes in gene expression related to inflamma-
tion and oxidative stress (Li et al., 2003).
The purpose of this study was to test the hypothesis that
hepatic gene expression changes could distinguish rats treated
with LPS, RAN, or LPS/RAN before the onset of significant liver
injury in LPS/RAN-treated rats. Genes were segregated based on
their patterns of expression and classified based on the nature of
their respective gene products. Real-time PCR and ELISA were
used to confirm enhanced expression of plasminogen activator
inhibitor-1 (PAI-1), and hepatic fibrin deposition was evaluated
to determine if the enhanced PAI-1 expression was associated
with tissue fibrin deposition as a functional consequence.
MATERIALS AND METHODS
Materials. Unless otherwise noted, all chemicals were purchased from
Sigma Chemical Co. (St. Louis, MO). Lipopolysaccharide derived from E.
coli serotype O55:B5 with an activity of 6.6 3 106 endotoxin units (EU)/mg
was used for these studies. This activity was determined using a colorometric,
kinetic Limulus Amebocyte Lysate (LAL) assay (Kit #50–650 U) purchased
from Cambrex (East Rutherford, NJ).
Animals. Male Sprague-Dawley rats (Crl:CD (SD)IGS BR; Charles River,
Portage, MI) weighing 250–350 g were used for this study. Animals were fed
standard chow (Rodent chow/Tek 8640, Harlan Teklad, Madison, WI) and
allowed access to water ad libitum. They were allowed to acclimate for 1
week in a 12-h light/dark cycle prior to use.
Experimental protocol. Rats fasted for 24 h were given 44.4 3 106 EU/kg
LPS or its saline vehicle, iv. Two h later, 30 mg/kg RAN or sterile phosphate-
buffered saline (PBS) vehicle was administered iv. RAN solution was adminis-
tered at 2 ml/kg body weight at a rate of approximately 0.15 ml/min. Accordingly,
rats were treated with either saline and PBS (Veh group), LPS and PBS (LPS
group), saline and RAN (RAN group), or LPSand RAN (LPS/RAN group). Three
h later, rats were anesthetized with sodium pentobarbital (50 mg/kg, ip) and killed
by exsanguination. Blood was allowed to clot at room temperature, and serum
was collected and stored at �80�C until use. Slices (3–4 mm) of the left lateral
liver lobe were collected and fixed in 10% neutral buffered formalin. Three 100-
mg midlobe pieces of the right medial lobe were flash frozen in liquid nitrogen for
RNA isolation. Groups treated with either vehicle, LPS, or RAN contained 3 rats,
whereas 4 rats comprised the LPS/RAN group.
Hepatotoxicity assessment. Hepatic parenchymal cell injury was esti-
mated as an increase in serum alanine aminotransferase (ALT) activity. ALT
activity was determined spectrophotometrically using Infinity-ALTreagent from
Sigma Chemical Co. (St. Louis, MO). Sinusoidal endothelial cell function was
estimated using a commercially available, enzyme-linked immunosorbent assay
(ELISA) for hyaluronic acid (Corgenix Medical Corporation, Westminster, CO).
Formalin-fixed liver samples (3–4 samples/rat) were embedded in paraffin,
sectioned at 5 mm, stained with hematoxylin and eosin (H&E), and examined
by light microscopy.
RNA isolation. Total RNA was isolated from snap-frozen liver samples
(approximately 100 mg) in accordance with protocols recommended by
Affymetrix, Inc. (Santa Clara, CA) for GeneChip experiments. Total RNA
was isolated with Trizol reagent (Invitrogen Corp, Carlsbad, CA) according
to manufacturer’s instructions. Samples were subsequently passed over a Qiagen
RNeasy column (Qiagen Corp., Valencia, CA) for further purification. RNA
quality and concentration were assessed by absorbance at 280 and 260 nm
and by analysis with a 2100 Bioanalyzer (Agilent Technologies, Palo Alto, CA).
Affymetrix GeneChip analysis. RNA isolated from each rat was processed
and analyzed as described below using separate Affymetrix RG_U34A arrays.
Synthesis of double-stranded cDNA from total RNA, synthesis of biotin-labeled
cRNA, fragmentation of thecRNAfor targetpreparation,eukaryotic targethybri-
dization,washing,staining,andscanningof theRG_U34Aarrayswerecarriedout
according to the Affymetrix GeneChip Expression Analysis Technical Manual
(701021, rev. 1). Scan analysis was carried out with both the scaling and normal-
ization factors set to 1. For data normalization, the array was treated as an XYZ-
dimensional vector and normalized by dividing each data point by the Cartesian
length(magnitude)of thevector, thenmultipliedby theaverageof themagnitudes
of the XX arrays in the data set. XYZ is the number of data points on the array and
XX is the number of arrays. Normalized signal data were imported into the JMP
(Release 5.0.1.2, SAS Institute, Inc.) software for principal component analysis.
Data analysis and determination of gene activity. To determine which
probesets changed after treatment compared to Veh-treated rats, the following
steps were performed. Preliminary filtering was performed using the transcript
detection call as described in the Affymetrix Statistical Reference Guide. Probe
sets that did not have at least 2 samples in any treatment group with ‘‘present’’ or
‘‘marginal’’ detection calls were eliminated from further analysis. Assessment of
gene activity was made by Student’s t-test using R software (version 1.7.0,
www.r-project.org). Adjustment for multiple comparisons was made using a false
discovery rate (FDR) criterion (Benjamini and Hochberg, 1995). The FDR
provided an approach capable of decreasing, to a user-determined level, the like-
lihood of committing a type I error, at the same time as providing a manageable
number of probesets for continued analysis. For this study, the 1000 most active
probesets compared to the vehicle-treated group were identified for each
treatment (i.e., LPS, RAN, or LPS/RAN) by an FDR criterion with a 5 0.05.
Each probeset that changed relative to its expression in vehicle-treated rats was
then assigned to a set defined by the treatment or treatments that produced a
204 LUYENDYK ET AL.
by guest on August 7, 2015
http://toxsci.oxfordjournals.org/D
ownloaded from
change in its activity (i.e., LPS/RAN [LR], L, R, L\R, LR\L, LR\R, LR\L\R,
where ‘‘\’’ indicates intersectionof sets).The resultingsetswerevisualizedusing
a Venn diagram (Fig. 3). Student’s t-test was used to compare the expression of
FDR-active probesets after LPS/RAN treatment, with their expression after
treatment with either agent alone. Genes with greater expression in LPS/RAN-
treated rats compared with either agent given alone were identified in the LR,
LR\L, LR\R and LR\L\R sets (see below). Genes with similar expression in
LPS/RAN- and LPS-treated rats, or in LPS/RAN- and RAN-treated rats were
identified in the LR\L and LR\L\R or in the LR\R and LR\L\R sets, respec-
tively. Genes expressed to a greater degree in rats treated with LPS alone as
compared to rats cotreated with LPS/RANwere identified in the L and LR\L sets.
Hierarchical clustering was performed using Spotfire Decision Site for Func-
tional Genomics (Spotfire, Inc., Somerville, MA) on all unique probesets show-
ing a significant treatmenteffect. Two-wayagglomerative hierarchical clustering
was performed using an unweighted average and Euclidean distance as the
similarity measure. Probeset annotation was completed as described previously
(Mattes, 2004). A cosine correlation similarity measure in the profile search tool
in Spotfire Decision Site for Functional Genomics (Spotfire Inc., Somerville,
MA) was used to identify genes with patterns of expression similar to increases in
serum HA concentration.
Reverse transcription and real-time PCR. RNA quantification was per-
formed on the same samples from the gene array experiment using a Spectramax
Microplate Spectrophotometer (Molecular Devices, Sunnyvale, CA). Random
priming was performed in a final volume of 12.5 ml using 500 ng of total RNA,
7.5 mM Random Hexamers (Amersham Biosciences, Piscataway, NJ), and 1 mM
dNTPs (Invitrogen, Carlsbad, California). RNA was denatured at 65�C for 5 min
and chilled on ice. Reverse Transcription (RT) master mix was prepared in a final
volumeof12.5mlwithafinalconcentrationof20U/mlofSuperscript IIRNAseH-
Reverse Transcriptase, 4 U/ml RNaseOut, 2 mM dithiothreitol, and 1X 1st Strand
RT buffer (Invitrogen, Carlsbad, California). Denatured RNA and RT master mix
were combined in total volume of 25 ml. The reverse transcriptase reaction was
performedat roomtemperature for10min,at42�Cfor60min,andthenat70�Cfor
15 min in an MJ Research Thermocycler (MJ Research, Inc., Reno, NV).
The following oligonucleotide primers, designed using Oligo 6 program soft-
ware (Molecular Biology Insights, Cascade, CO), were used to quantify mRNA
levels of the followinggenes by real-time PCR analyses. Early growth response-1
(egr-1): upper primer-50 TGA ACG CAA GAG GCA TAC CA 30; lower primer-
50 GAGCCC GGAGAG GAGTAA GAG 30. B-cell translocation gene-2 (btg-2):
upper primer- 50 CCA GCC AGT CAC CCT TAG TG 30; lower primer- 50 CGG
GCA GAG TGT TTG GTA AGT 30. Plasminogen activator inhibitor-1 (PAI-1):
upper primer- 50 AAC CCA GGC CGA CTT CA 30; lower primer- 50 CAT GCG
GGC TGA GAC TAG AAT 30. Ribosomal protein L19 (Rpl19): upper primer- 50
CTC GAT GCC GGA AGA ACA C 30; lower primer- 50 CGA GCG TTG GCA
GTA CCC 30. A 2100 Bioanalyzer (Agilent Technologies, Palo Alto, CA) was
used to analyze purities of RNA and PCR products.
Real-time PCR reactions using SYBR Green dye methodology were prepared
in a final volume of 25 ml per reaction, with 1 ng of cDNA and 1X SYBR Green
PCR Master Mix (PE Applied Biosystems, Foster City, CA). Primer mixture was
prepared in 5 ml per reaction with a final concentration of 0.3 mM per primer.
SYBR Green real-time PCR was performed using an ABI 7900 (PE Applied
Biosystems, Foster City, CA). Relative amounts of target were calculated using
the comparative CT method with ribosomal protein L19 (RPL19, RefSeq Acces-
sion # NM_031103) as an endogenous reference and a calibrator consisting of
RNA pooled from all livers of vehicle-treated rats.
Immunohistochemistry. Liver samples evaluated for fibrin immunohisto-
chemistry were from the 3-h post-treatment time point in a previous study
(Luyendyk et al., 2003). A 1 cm3 block of liver cut from the left medial lobe
was frozen for 8 min in liquid nitrogen-chilled isopentane, then stored at� 80�C
until processing. Eight-mm-thick sections of frozen liver were fixed in 10%
buffered formalin containing 2% acetic acid for 30 min at room temperature.
This fixation protocol solubilizes all fibrinogen and fibrin except for cross-linked
fibrin; therefore, only cross-linked fibrin remains in sections of liver (Schnitt
et al., 1993). Sections were blocked with PBS containing 10% horse serum
(i.e., blocking solution; Vector Laboratories) for 30 min, and this was followed
by incubation overnight at 4�C with goat anti-rat fibrinogen antibody diluted
(1:1000, ICN Pharmaceuticals, Aurora, OH) in blocking solution. Next, sections
were incubated for three h with donkey anti-goat secondary antibody conjugated
to Alexa 594 (1:1000, Molecular Probes, Eugene, OR) in blocking solution for
3 h. Sections were washed three times, 5 min each, with PBS and visualized using
a fluorescent microscope. No staining was observed in controls for which the
primary or secondary antibody was eliminated from the staining protocol. Liver
sections from all treatment groups that were compared morphometrically were
stained at the same time.
Quantification of fibrin staining. Fluorescent staining in sections of liver
was visualized with an Olympus AX-80T microscope (Olympus, Lake Success,
NY). Ten randomly chosen digital images (100X magnification) were captured
using a SPOT II camera and SPOT advanced software (Diagnostic Instruments,
Sterling Heights, MI). Samples were coded such that the evaluator was not aware
of treatment. Each digital image encompassed a total area of 1.4 mm2 and
contained several centrilobular and periportal regions. Quantification of immu-
nostaining was performed with Scion Image Beta 4.0.2 (Scion Corporation,
Frederick, MD) using the method described by Copple et al. (2002). Ten random
fields analyzed for each liver section were averaged and counted as a replicate,
i.e., each replicate represents a different rat.
Evaluation of serum PAI-1 concentration. Serum total PAI-1 concentra-
tion (i.e., inactive, active, and bound to plasminogen activator) was evaluated
using a commercially available ELISA purchased from American Diagnostica,
Inc. (Greenwich, CT.).
Statistical analysis. Two-way analysis of variance with Tukey’s test for
multiple comparisons was used for analysis of clinical chemistry, immunohis-
tochemistry, and ELISA. The criterion for significance was p 5 0.05.
RESULTS
Development of Hepatic Parenchymal Cell Injury
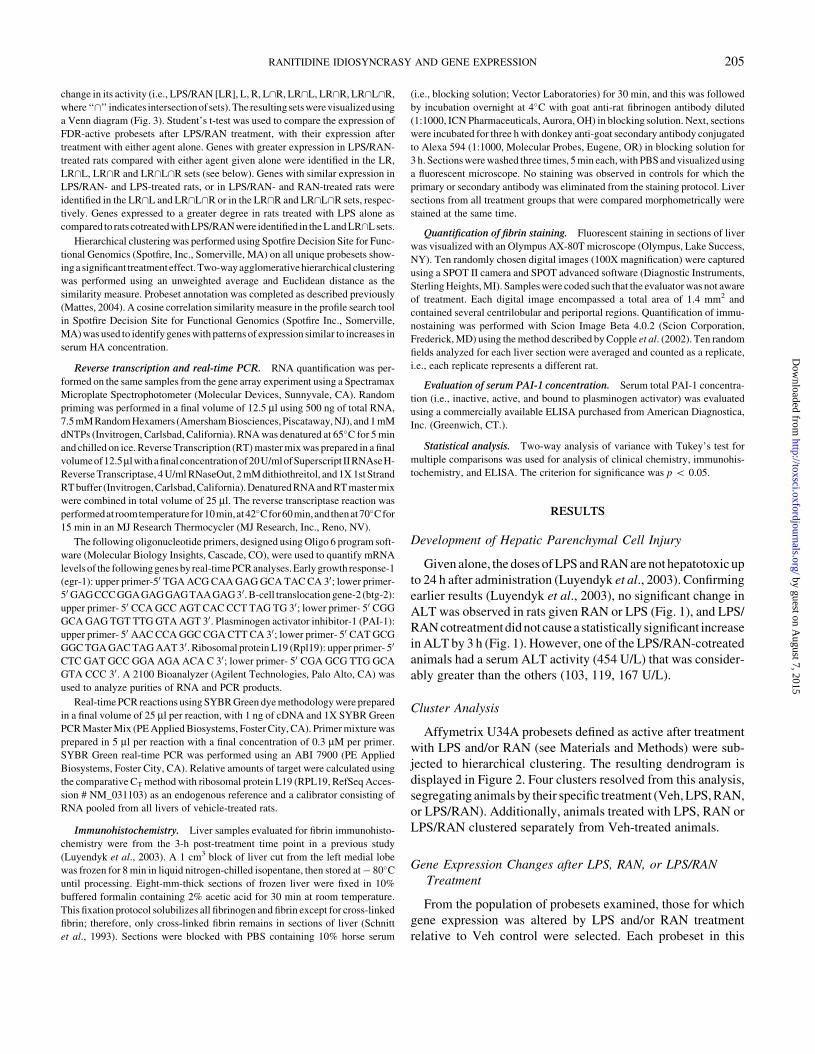
Given alone, the doses of LPS and RAN are not hepatotoxic up
to 24 h after administration (Luyendyk et al., 2003). Confirming
earlier results (Luyendyk et al., 2003), no significant change in
ALT was observed in rats given RAN or LPS (Fig. 1), and LPS/
RAN cotreatment did not cause a statistically significant increase
in ALT by 3 h (Fig. 1). However, one of the LPS/RAN-cotreated
animals had a serum ALT activity (454 U/L) that was consider-
ably greater than the others (103, 119, 167 U/L).
Cluster Analysis
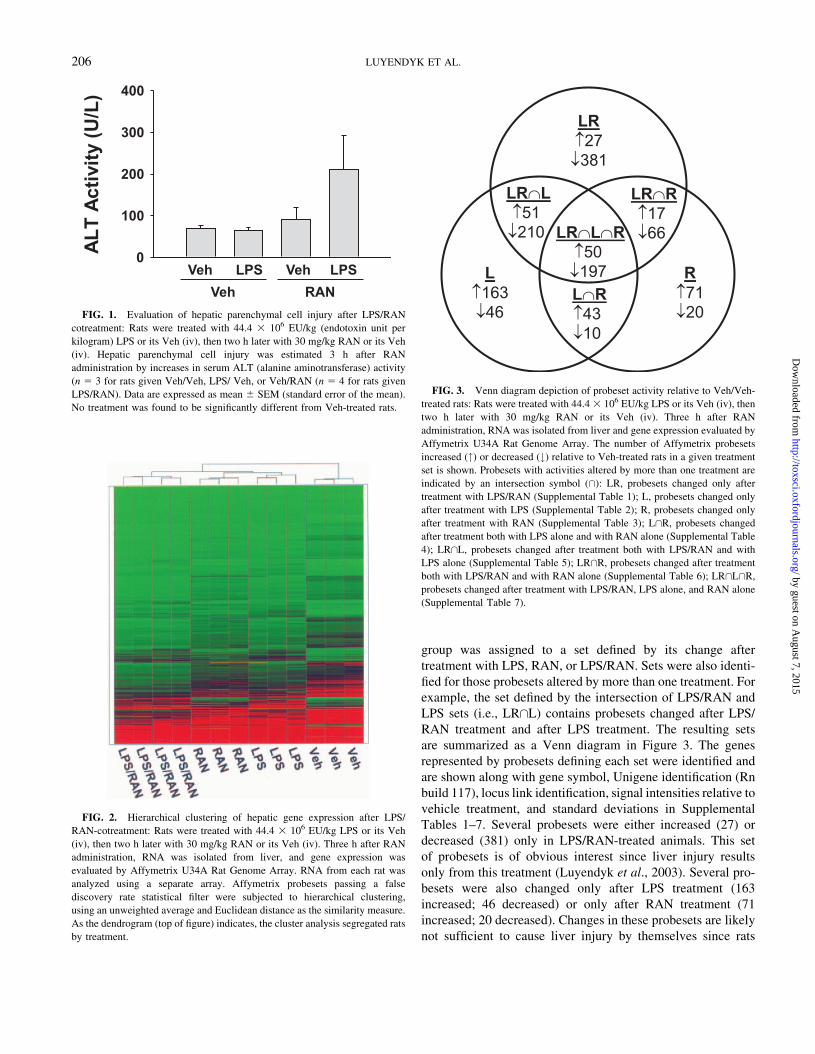
Affymetrix U34A probesets defined as active after treatment
with LPS and/or RAN (see Materials and Methods) were sub-
jected to hierarchical clustering. The resulting dendrogram is
displayed in Figure 2. Four clusters resolved from this analysis,
segregating animals by their specific treatment (Veh, LPS, RAN,
or LPS/RAN). Additionally, animals treated with LPS, RAN or
LPS/RAN clustered separately from Veh-treated animals.
Gene Expression Changes after LPS, RAN, or LPS/RAN
Treatment
From the population of probesets examined, those for which
gene expression was altered by LPS and/or RAN treatment
relative to Veh control were selected. Each probeset in this
RANITIDINE IDIOSYNCRASY AND GENE EXPRESSION 205
by guest on August 7, 2015
http://toxsci.oxfordjournals.org/D
ownloaded from
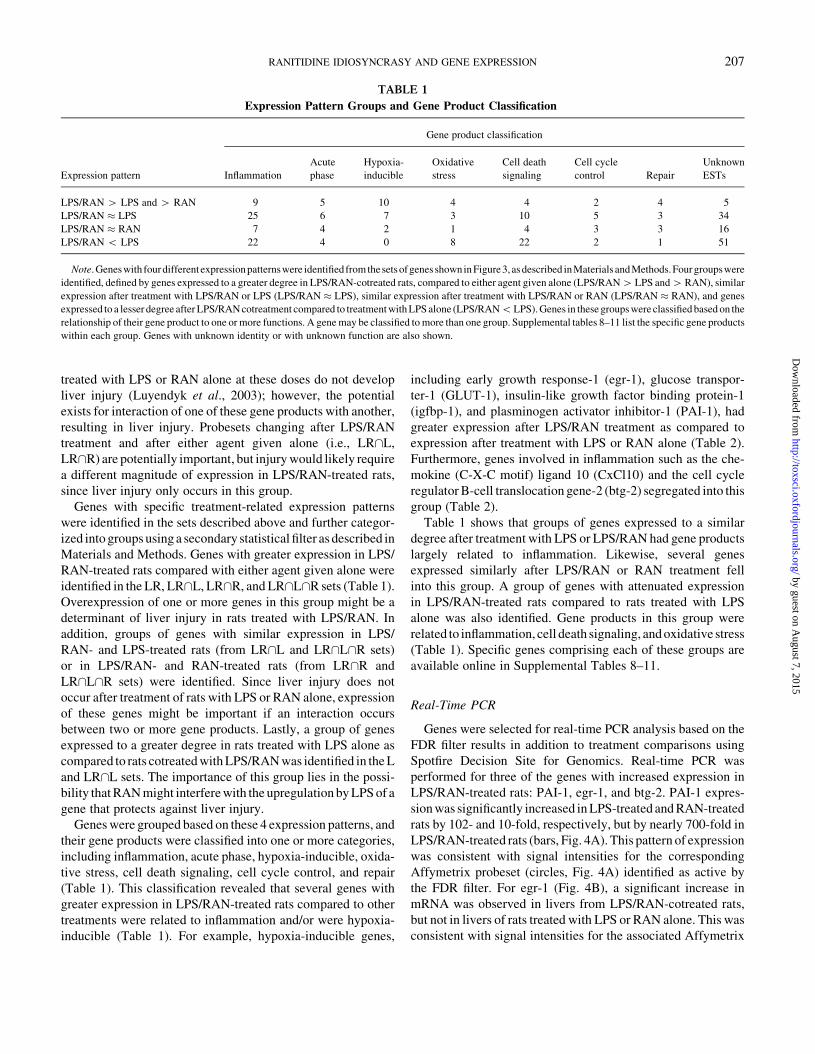
group was assigned to a set defined by its change after
treatment with LPS, RAN, or LPS/RAN. Sets were also identi-
fied for those probesets altered by more than one treatment. For
example, the set defined by the intersection of LPS/RAN and
LPS sets (i.e., LR\L) contains probesets changed after LPS/
RAN treatment and after LPS treatment. The resulting sets
are summarized as a Venn diagram in Figure 3. The genes
represented by probesets defining each set were identified and
are shown along with gene symbol, Unigene identification (Rn
build 117), locus link identification, signal intensities relative to
vehicle treatment, and standard deviations in Supplemental
Tables 1–7. Several probesets were either increased (27) or
decreased (381) only in LPS/RAN-treated animals. This set
of probesets is of obvious interest since liver injury results
only from this treatment (Luyendyk et al., 2003). Several pro-
besets were also changed only after LPS treatment (163
increased; 46 decreased) or only after RAN treatment (71
increased; 20 decreased). Changes in these probesets are likely
not sufficient to cause liver injury by themselves since rats
FIG. 2. Hierarchical clustering of hepatic gene expression after LPS/
RAN-cotreatment: Rats were treated with 44.4 3 106 EU/kg LPS or its Veh
(iv), then two h later with 30 mg/kg RAN or its Veh (iv). Three h after RAN
administration, RNA was isolated from liver, and gene expression was
evaluated by Affymetrix U34A Rat Genome Array. RNA from each rat was
analyzed using a separate array. Affymetrix probesets passing a false
discovery rate statistical filter were subjected to hierarchical clustering,
using an unweighted average and Euclidean distance as the similarity measure.
As the dendrogram (top of figure) indicates, the cluster analysis segregated rats
by treatment.
FIG. 3. Venn diagram depiction of probeset activity relative to Veh/Veh-
treated rats: Rats were treated with 44.4 3 106 EU/kg LPS or its Veh (iv), then
two h later with 30 mg/kg RAN or its Veh (iv). Three h after RAN
administration, RNA was isolated from liver and gene expression evaluated by
Affymetrix U34A Rat Genome Array. The number of Affymetrix probesets
increased (") or decreased (#) relative to Veh-treated rats in a given treatment
set is shown. Probesets with activities altered by more than one treatment are
indicated by an intersection symbol (\): LR, probesets changed only after
treatment with LPS/RAN (Supplemental Table 1); L, probesets changed only
after treatment with LPS (Supplemental Table 2); R, probesets changed only
after treatment with RAN (Supplemental Table 3); L\R, probesets changed
after treatment both with LPS alone and with RAN alone (Supplemental Table
4); LR\L, probesets changed after treatment both with LPS/RAN and with
LPS alone (Supplemental Table 5); LR\R, probesets changed after treatment
both with LPS/RAN and with RAN alone (Supplemental Table 6); LR\L\R,
probesets changed after treatment with LPS/RAN, LPS alone, and RAN alone
(Supplemental Table 7).
FIG. 1. Evaluation of hepatic parenchymal cell injury after LPS/RAN
cotreatment: Rats were treated with 44.4 3 106 EU/kg (endotoxin unit per
kilogram) LPS or its Veh (iv), then two h later with 30 mg/kg RAN or its Veh
(iv). Hepatic parenchymal cell injury was estimated 3 h after RAN
administration by increases in serum ALT (alanine aminotransferase) activity
(n 5 3 for rats given Veh/Veh, LPS/ Veh, or Veh/RAN (n 5 4 for rats given
LPS/RAN). Data are expressed as mean 6 SEM (standard error of the mean).
No treatment was found to be significantly different from Veh-treated rats.
206 LUYENDYK ET AL.
by guest on August 7, 2015
http://toxsci.oxfordjournals.org/D
ownloaded from
treated with LPS or RAN alone at these doses do not develop
liver injury (Luyendyk et al., 2003); however, the potential
exists for interaction of one of these gene products with another,
resulting in liver injury. Probesets changing after LPS/RAN
treatment and after either agent given alone (i.e., LR\L,
LR\R) are potentially important, but injury would likely require
a different magnitude of expression in LPS/RAN-treated rats,
since liver injury only occurs in this group.
Genes with specific treatment-related expression patterns
were identified in the sets described above and further categor-
ized into groups using a secondary statistical filter as described in
Materials and Methods. Genes with greater expression in LPS/
RAN-treated rats compared with either agent given alone were
identified in the LR, LR\L, LR\R, and LR\L\R sets (Table 1).
Overexpression of one or more genes in this group might be a
determinant of liver injury in rats treated with LPS/RAN. In
addition, groups of genes with similar expression in LPS/
RAN- and LPS-treated rats (from LR\L and LR\L\R sets)
or in LPS/RAN- and RAN-treated rats (from LR\R and
LR\L\R sets) were identified. Since liver injury does not
occur after treatment of rats with LPS or RAN alone, expression
of these genes might be important if an interaction occurs
between two or more gene products. Lastly, a group of genes
expressed to a greater degree in rats treated with LPS alone as
compared to rats cotreated with LPS/RAN was identified in the L
and LR\L sets. The importance of this group lies in the possi-
bility that RAN might interfere with the upregulation by LPS of a
gene that protects against liver injury.
Genes were grouped based on these 4 expression patterns, and
their gene products were classified into one or more categories,
including inflammation, acute phase, hypoxia-inducible, oxida-
tive stress, cell death signaling, cell cycle control, and repair
(Table 1). This classification revealed that several genes with
greater expression in LPS/RAN-treated rats compared to other
treatments were related to inflammation and/or were hypoxia-
inducible (Table 1). For example, hypoxia-inducible genes,
including early growth response-1 (egr-1), glucose transpor-
ter-1 (GLUT-1), insulin-like growth factor binding protein-1
(igfbp-1), and plasminogen activator inhibitor-1 (PAI-1), had
greater expression after LPS/RAN treatment as compared to
expression after treatment with LPS or RAN alone (Table 2).
Furthermore, genes involved in inflammation such as the che-
mokine (C-X-C motif) ligand 10 (CxCl10) and the cell cycle
regulator B-cell translocation gene-2 (btg-2) segregated into this
group (Table 2).
Table 1 shows that groups of genes expressed to a similar
degree after treatment with LPS or LPS/RAN had gene products
largely related to inflammation. Likewise, several genes
expressed similarly after LPS/RAN or RAN treatment fell
into this group. A group of genes with attenuated expression
in LPS/RAN-treated rats compared to rats treated with LPS
alone was also identified. Gene products in this group were
related to inflammation, cell death signaling, and oxidative stress
(Table 1). Specific genes comprising each of these groups are
available online in Supplemental Tables 8–11.
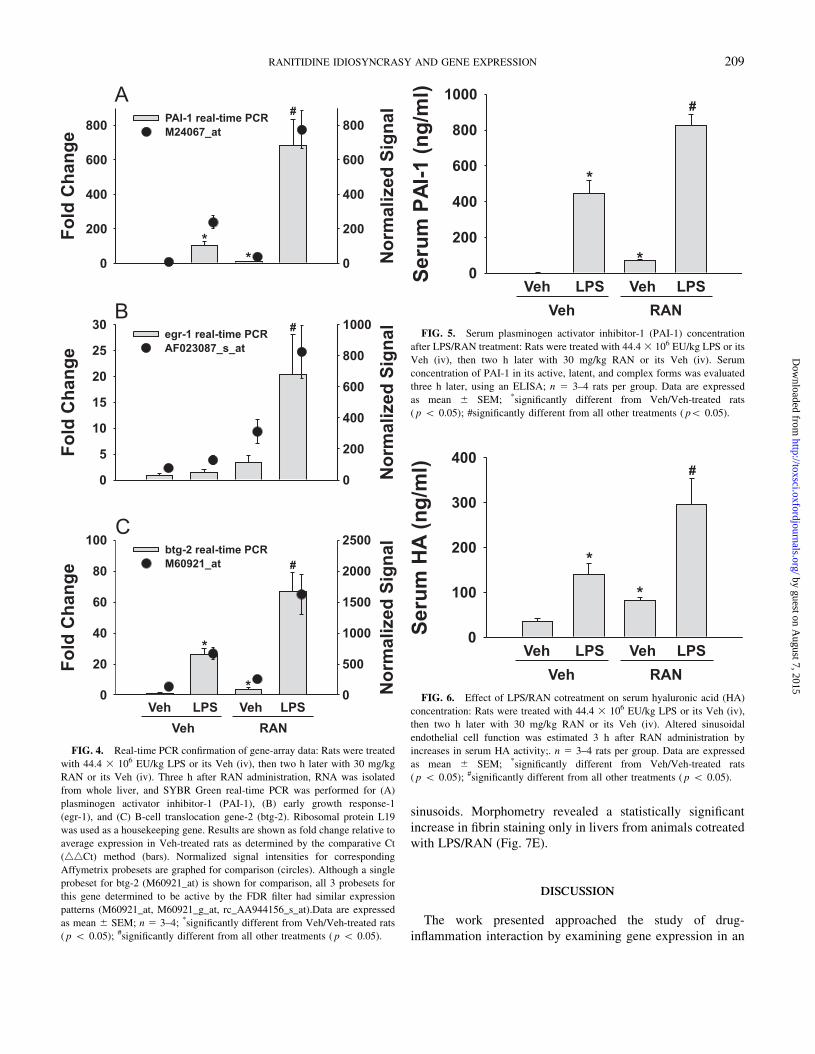
Real-Time PCR
Genes were selected for real-time PCR analysis based on the
FDR filter results in addition to treatment comparisons using
Spotfire Decision Site for Genomics. Real-time PCR was
performed for three of the genes with increased expression in
LPS/RAN-treated rats: PAI-1, egr-1, and btg-2. PAI-1 expres-
sion was significantly increased in LPS-treated and RAN-treated
rats by 102- and 10-fold, respectively, but by nearly 700-fold in
LPS/RAN-treated rats (bars, Fig. 4A). This pattern of expression
was consistent with signal intensities for the corresponding
Affymetrix probeset (circles, Fig. 4A) identified as active by
the FDR filter. For egr-1 (Fig. 4B), a significant increase in
mRNA was observed in livers from LPS/RAN-cotreated rats,
but not in livers of rats treated with LPS or RAN alone. This was
consistent with signal intensities for the associated Affymetrix
TABLE 1
Expression Pattern Groups and Gene Product Classification
Gene product classification
Expression pattern Inflammation
Acute
phase
Hypoxia-
inducible
Oxidative
stress
Cell death
signaling
Cell cycle
control Repair
Unknown
ESTs
LPS/RAN 4 LPS and 4 RAN 9 5 10 4 4 2 4 5
LPS/RAN � LPS 25 6 7 3 10 5 3 34
LPS/RAN � RAN 7 4 2 1 4 3 3 16
LPS/RAN 5 LPS 22 4 0 8 22 2 1 51
Note. Genes with four different expressionpatternswere identifiedfrom thesets of genes shownin Figure 3, as described inMaterials andMethods.Four groupswere
identified, defined by genes expressed to a greater degree in LPS/RAN-cotreated rats, compared to either agent given alone (LPS/RAN4LPS and4RAN), similar
expression after treatment with LPS/RAN or LPS (LPS/RAN � LPS), similar expression after treatment with LPS/RAN or RAN (LPS/RAN � RAN), and genes
expressed to a lesser degree after LPS/RAN cotreatment compared to treatment with LPS alone (LPS/RAN5LPS). Genes in these groups were classified based on the
relationship of their gene product to one or more functions. A gene may be classified to more than one group. Supplemental tables 8–11 list the specific gene products
within each group. Genes with unknown identity or with unknown function are also shown.
RANITIDINE IDIOSYNCRASY AND GENE EXPRESSION 207
by guest on August 7, 2015
http://toxsci.oxfordjournals.org/D
ownloaded from
probeset (circles) identified by the FDR as active only in LPS/
RAN-cotreated rats (Fig. 4B). Btg-2 expression was signifi-
cantly increased in rats given LPS or RAN alone by 25- and
4-fold, respectively, but a much greater increase (67-fold)
occurred in rats cotreated with LPS/RAN (Fig. 4C). Although
a single probeset for btg-2 (M60921_at) is shown for comparison
(circles, Fig. 4C), all 3 probesets for this gene determined to be
active by the FDR filter had a similar expression pattern
(M60921_at, M60921_g_at, rc_AA944156_s_at).
Evaluation of Serum PAI-1
To determine if the change in hepatic gene expression of PAI-
1 resulted in altered serum concentration of PAI-1 protein, total
PAI-1 protein was measured. Serum PAI-1 was significantly
increased after either LPS or RAN treatment by 450- and 70-
fold, respectively. Serum PAI-1 in LPS/RAN-treated rats was
significantly greater than that of rats treated with either agent
given alone (Fig. 5).
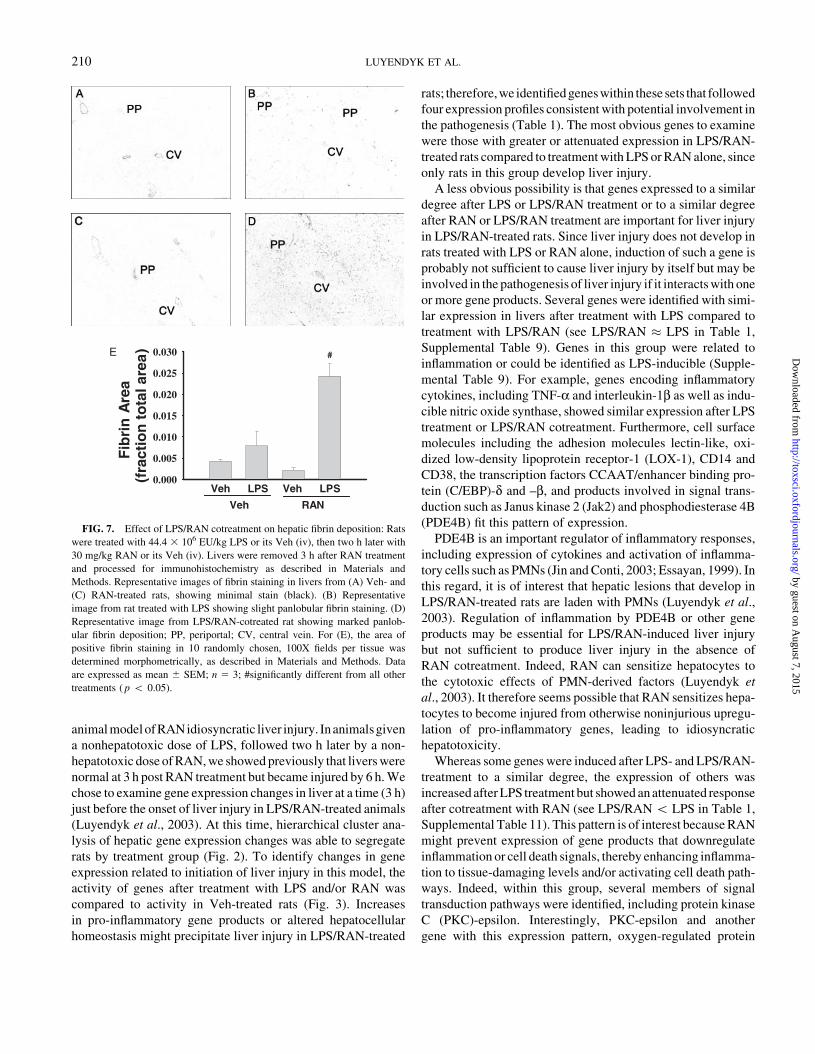
LPS/RAN Treatment and Sinusoidal Endothelial
Cells (SECs)
In addition to expression in hepatic parenchymal cells, PAI-1
is expressed by endothelial cells exposed to factors such as LPS
and inflammatory cytokines (Colman et al., 1994). To investi-
gate alteration of sinusoidal endothelial cell (SEC) function in
livers of LPS/RAN-treated rats, serum hyaluronic acid (HA) was
measured. Ordinarily, 90% of HA in the blood is cleared by SECs
in the liver (Kobayashi et al., 1999). Accordingly, increased
plasma HA concentration suggests altered SEC function, and
this has been used as a biomarker after toxic insult (Copple et al.,
2002; Deaciuc et al., 1993). A modest, but significant elevation
in serum HA concentration was observed in rats treated with
either LPS or RAN alone, whereas serum HA was elevated more
than 8-fold in rats cotreated with LPS/RAN (Fig. 6). PAI-1
expression, as determined by either gene array or real-time
PCR, correlated significantly (r2 5 0.93) with changes in
serum HA concentration (data not shown).
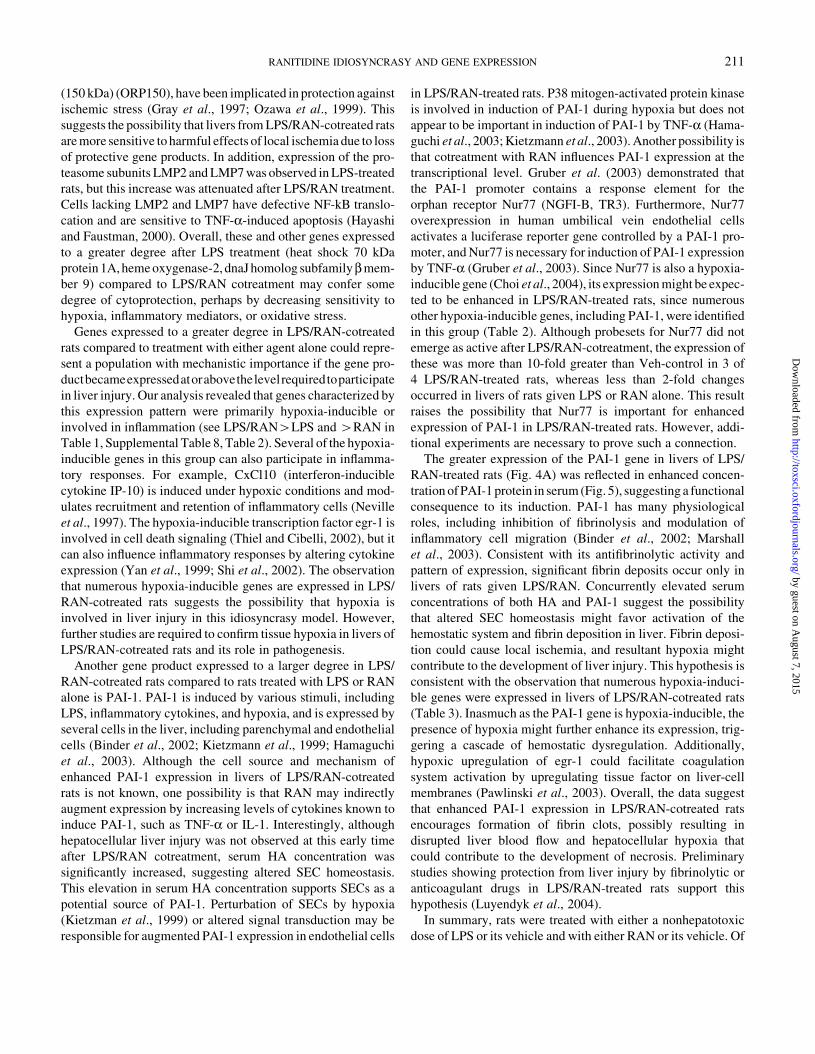
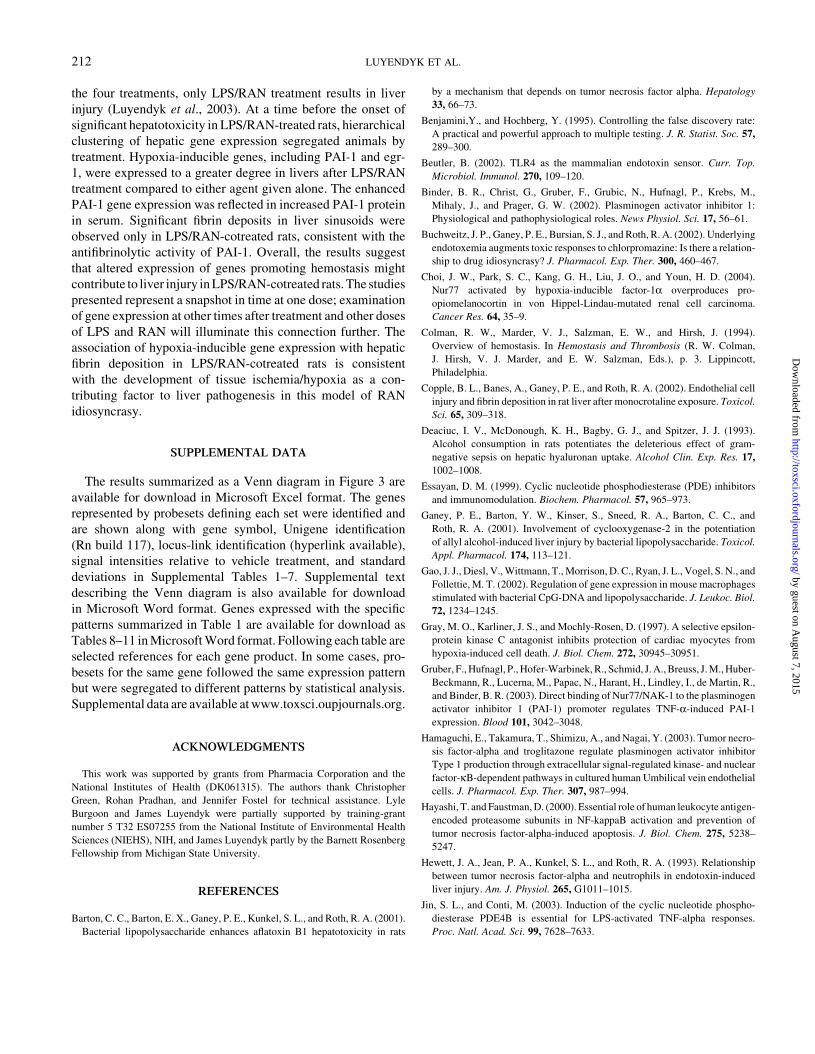
Hepatic Fibrin Deposition
Enhanced PAI-1 expression and serum HA concentration in
LPS/RAN-cotreated rats suggested altered SEC function con-
sistent with a procoagulant environment in the liver, raising the
possibility of enhanced fibrin deposition. Accordingly, livers
were removed 3 h after RAN treatment, as in the gene array
experiment, and processed for fibrin immunohistochemistry.
Figure 7 shows representative images of hepatic fibrin staining
in livers. Fibrin staining in the intima of the larger vessels of
vehicle-treated rats (Fig. 7A) occurs post-mortem (i.e., artifac-
tually) and can be prevented by perfusing the liver with heparin
prior to organ removal (data not shown). Minimal staining was
observed in the sinusoids of Veh-treated rats. Similarly, no
sinusoidal staining was observed in rats given RAN alone (Fig.
7C). Slight fibrin staining was observed in livers of rats treated
with LPS alone (Fig. 7B). In LPS/RAN-treated rats (Fig. 7D), a
much more pronounced, panlobular fibrin staining occurred in
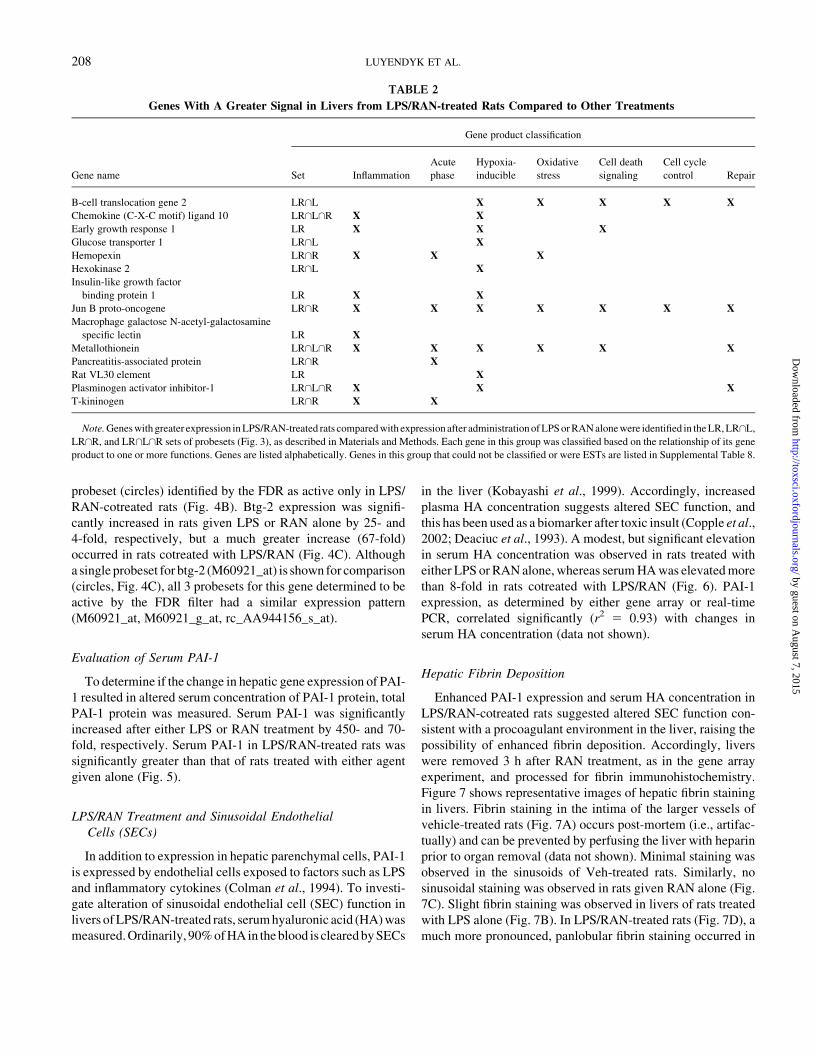
TABLE 2
Genes With A Greater Signal in Livers from LPS/RAN-treated Rats Compared to Other Treatments
Gene product classification
Gene name Set Inflammation
Acute
phase
Hypoxia-
inducible
Oxidative
stress
Cell death
signaling
Cell cycle
control Repair
B-cell translocation gene 2 LR\L X X X X X
Chemokine (C-X-C motif) ligand 10 LR\L\R X X
Early growth response 1 LR X X X
Glucose transporter 1 LR\L X
Hemopexin LR\R X X X
Hexokinase 2 LR\L X
Insulin-like growth factor
binding protein 1 LR X X
Jun B proto-oncogene LR\R X X X X X X X
Macrophage galactose N-acetyl-galactosamine
specific lectin LR X
Metallothionein LR\L\R X X X X X X
Pancreatitis-associated protein LR\R X
Rat VL30 element LR X
Plasminogen activator inhibitor-1 LR\L\R X X X
T-kininogen LR\R X X
Note.Genes with greater expression in LPS/RAN-treated rats compared with expression after administration of LPS or RAN alone were identified in the LR, LR\L,
LR\R, and LR\L\R sets of probesets (Fig. 3), as described in Materials and Methods. Each gene in this group was classified based on the relationship of its gene
product to one or more functions. Genes are listed alphabetically. Genes in this group that could not be classified or were ESTs are listed in Supplemental Table 8.
208 LUYENDYK ET AL.
by guest on August 7, 2015
http://toxsci.oxfordjournals.org/D
ownloaded from
sinusoids. Morphometry revealed a statistically significant
increase in fibrin staining only in livers from animals cotreated
with LPS/RAN (Fig. 7E).
DISCUSSION
The work presented approached the study of drug-
inflammation interaction by examining gene expression in an
FIG. 6. Effect of LPS/RAN cotreatment on serum hyaluronic acid (HA)
concentration: Rats were treated with 44.4 3 106 EU/kg LPS or its Veh (iv),
then two h later with 30 mg/kg RAN or its Veh (iv). Altered sinusoidal
endothelial cell function was estimated 3 h after RAN administration by
increases in serum HA activity;. n 5 3–4 rats per group. Data are expressed
as mean 6 SEM; *significantly different from Veh/Veh-treated rats
( p 5 0.05); #significantly different from all other treatments ( p 5 0.05).
FIG. 4. Real-time PCR confirmation of gene-array data: Rats were treated
with 44.4 3 106 EU/kg LPS or its Veh (iv), then two h later with 30 mg/kg
RAN or its Veh (iv). Three h after RAN administration, RNA was isolated
from whole liver, and SYBR Green real-time PCR was performed for (A)
plasminogen activator inhibitor-1 (PAI-1), (B) early growth response-1
(egr-1), and (C) B-cell translocation gene-2 (btg-2). Ribosomal protein L19
was used as a housekeeping gene. Results are shown as fold change relative to
average expression in Veh-treated rats as determined by the comparative Ct
(44Ct) method (bars). Normalized signal intensities for corresponding
Affymetrix probesets are graphed for comparison (circles). Although a single
probeset for btg-2 (M60921_at) is shown for comparison, all 3 probesets for
this gene determined to be active by the FDR filter had similar expression
patterns (M60921_at, M60921_g_at, rc_AA944156_s_at).Data are expressed
as mean 6 SEM; n 5 3–4; *significantly different from Veh/Veh-treated rats
( p 5 0.05); #significantly different from all other treatments ( p 5 0.05).
FIG. 5. Serum plasminogen activator inhibitor-1 (PAI-1) concentration
after LPS/RAN treatment: Rats were treated with 44.4 3 106 EU/kg LPS or its
Veh (iv), then two h later with 30 mg/kg RAN or its Veh (iv). Serum
concentration of PAI-1 in its active, latent, and complex forms was evaluated
three h later, using an ELISA; n 5 3–4 rats per group. Data are expressed
as mean 6 SEM; *significantly different from Veh/Veh-treated rats
( p 5 0.05); #significantly different from all other treatments ( p5 0.05).
RANITIDINE IDIOSYNCRASY AND GENE EXPRESSION 209
by guest on August 7, 2015
http://toxsci.oxfordjournals.org/D
ownloaded from
animal modelofRANidiosyncratic liver injury. Inanimalsgiven
a nonhepatotoxic dose of LPS, followed two h later by a non-
hepatotoxic dose of RAN, we showed previously that livers were
normal at 3 h post RAN treatment but became injured by 6 h. We
chose to examine gene expression changes in liver at a time (3 h)
just before the onset of liver injury in LPS/RAN-treated animals
(Luyendyk et al., 2003). At this time, hierarchical cluster ana-
lysis of hepatic gene expression changes was able to segregate
rats by treatment group (Fig. 2). To identify changes in gene
expression related to initiation of liver injury in this model, the
activity of genes after treatment with LPS and/or RAN was
compared to activity in Veh-treated rats (Fig. 3). Increases
in pro-inflammatory gene products or altered hepatocellular
homeostasis might precipitate liver injury in LPS/RAN-treated
rats; therefore, we identified genes within these sets that followed
four expression profiles consistent with potential involvement in
the pathogenesis (Table 1). The most obvious genes to examine
were those with greater or attenuated expression in LPS/RAN-
treated rats compared to treatment with LPS or RAN alone, since
only rats in this group develop liver injury.
A less obvious possibility is that genes expressed to a similar
degree after LPS or LPS/RAN treatment or to a similar degree
after RAN or LPS/RAN treatment are important for liver injury
in LPS/RAN-treated rats. Since liver injury does not develop in
rats treated with LPS or RAN alone, induction of such a gene is
probably not sufficient to cause liver injury by itself but may be
involved in the pathogenesis of liver injury if it interacts with one
or more gene products. Several genes were identified with simi-
lar expression in livers after treatment with LPS compared to
treatment with LPS/RAN (see LPS/RAN � LPS in Table 1,
Supplemental Table 9). Genes in this group were related to
inflammation or could be identified as LPS-inducible (Supple-
mental Table 9). For example, genes encoding inflammatory
cytokines, including TNF-a and interleukin-1b as well as indu-
cible nitric oxide synthase, showed similar expression after LPS
treatment or LPS/RAN cotreatment. Furthermore, cell surface
molecules including the adhesion molecules lectin-like, oxi-
dized low-density lipoprotein receptor-1 (LOX-1), CD14 and
CD38, the transcription factors CCAAT/enhancer binding pro-
tein (C/EBP)-d and –b, and products involved in signal trans-
duction such as Janus kinase 2 (Jak2) and phosphodiesterase 4B
(PDE4B) fit this pattern of expression.
PDE4B is an important regulator of inflammatory responses,
including expression of cytokines and activation of inflamma-
tory cells such as PMNs (Jin and Conti, 2003; Essayan, 1999). In
this regard, it is of interest that hepatic lesions that develop in
LPS/RAN-treated rats are laden with PMNs (Luyendyk et al.,
2003). Regulation of inflammation by PDE4B or other gene
products may be essential for LPS/RAN-induced liver injury
but not sufficient to produce liver injury in the absence of
RAN cotreatment. Indeed, RAN can sensitize hepatocytes to
the cytotoxic effects of PMN-derived factors (Luyendyk et
al., 2003). It therefore seems possible that RAN sensitizes hepa-
tocytes to become injured from otherwise noninjurious upregu-
lation of pro-inflammatory genes, leading to idiosyncratic
hepatotoxicity.
Whereas some genes were induced after LPS- and LPS/RAN-
treatment to a similar degree, the expression of others was
increased after LPS treatment but showed an attenuated response
after cotreatment with RAN (see LPS/RAN 5 LPS in Table 1,
Supplemental Table 11). This pattern is of interest because RAN
might prevent expression of gene products that downregulate
inflammation or cell death signals, thereby enhancing inflamma-
tion to tissue-damaging levels and/or activating cell death path-
ways. Indeed, within this group, several members of signal
transduction pathways were identified, including protein kinase
C (PKC)-epsilon. Interestingly, PKC-epsilon and another
gene with this expression pattern, oxygen-regulated protein
F
ibri
n A
rea
(fra
ctio
n t
ota
l are
a )
0.000
0.005
0.010
0.015
0.020
0.025
0.030
Veh LPS Veh LPS
Veh RAN
#
C
E
FIG. 7. Effect of LPS/RAN cotreatment on hepatic fibrin deposition: Rats
were treated with 44.4 3 106 EU/kg LPS or its Veh (iv), then two h later with
30 mg/kg RAN or its Veh (iv). Livers were removed 3 h after RAN treatment
and processed for immunohistochemistry as described in Materials and
Methods. Representative images of fibrin staining in livers from (A) Veh- and
(C) RAN-treated rats, showing minimal stain (black). (B) Representative
image from rat treated with LPS showing slight panlobular fibrin staining. (D)
Representative image from LPS/RAN-cotreated rat showing marked panlob-
ular fibrin deposition; PP, periportal; CV, central vein. For (E), the area of
positive fibrin staining in 10 randomly chosen, 100X fields per tissue was
determined morphometrically, as described in Materials and Methods. Data
are expressed as mean 6 SEM; n 5 3; #significantly different from all other
treatments ( p 5 0.05).
210 LUYENDYK ET AL.
by guest on August 7, 2015
http://toxsci.oxfordjournals.org/D
ownloaded from
(150 kDa) (ORP150), have been implicated in protection against
ischemic stress (Gray et al., 1997; Ozawa et al., 1999). This
suggests the possibility that livers from LPS/RAN-cotreated rats
are more sensitive to harmful effects of local ischemia due to loss
of protective gene products. In addition, expression of the pro-
teasome subunits LMP2 and LMP7 was observed in LPS-treated
rats, but this increase was attenuated after LPS/RAN treatment.
Cells lacking LMP2 and LMP7 have defective NF-kB translo-
cation and are sensitive to TNF-a-induced apoptosis (Hayashi
and Faustman, 2000). Overall, these and other genes expressed
to a greater degree after LPS treatment (heat shock 70 kDa
protein 1A, heme oxygenase-2, dnaJ homolog subfamilybmem-
ber 9) compared to LPS/RAN cotreatment may confer some
degree of cytoprotection, perhaps by decreasing sensitivity to
hypoxia, inflammatory mediators, or oxidative stress.
Genes expressed to a greater degree in LPS/RAN-cotreated
rats compared to treatment with either agent alone could repre-
sent a population with mechanistic importance if the gene pro-
ductbecameexpressedatorabovethelevelrequiredtoparticipate
in liver injury. Our analysis revealed that genes characterized by
this expression pattern were primarily hypoxia-inducible or
involved in inflammation (see LPS/RAN4LPS and 4RAN in
Table 1, Supplemental Table 8, Table 2). Several of the hypoxia-
inducible genes in this group can also participate in inflamma-
tory responses. For example, CxCl10 (interferon-inducible
cytokine IP-10) is induced under hypoxic conditions and mod-
ulates recruitment and retention of inflammatory cells (Neville
et al., 1997). The hypoxia-inducible transcription factor egr-1 is
involved in cell death signaling (Thiel and Cibelli, 2002), but it
can also influence inflammatory responses by altering cytokine
expression (Yan et al., 1999; Shi et al., 2002). The observation
that numerous hypoxia-inducible genes are expressed in LPS/
RAN-cotreated rats suggests the possibility that hypoxia is
involved in liver injury in this idiosyncrasy model. However,
further studies are required to confirm tissue hypoxia in livers of
LPS/RAN-cotreated rats and its role in pathogenesis.
Another gene product expressed to a larger degree in LPS/
RAN-cotreated rats compared to rats treated with LPS or RAN
alone is PAI-1. PAI-1 is induced by various stimuli, including
LPS, inflammatory cytokines, and hypoxia, and is expressed by
several cells in the liver, including parenchymal and endothelial
cells (Binder et al., 2002; Kietzmann et al., 1999; Hamaguchi
et al., 2003). Although the cell source and mechanism of
enhanced PAI-1 expression in livers of LPS/RAN-cotreated
rats is not known, one possibility is that RAN may indirectly
augment expression by increasing levels of cytokines known to
induce PAI-1, such as TNF-a or IL-1. Interestingly, although
hepatocellular liver injury was not observed at this early time
after LPS/RAN cotreatment, serum HA concentration was
significantly increased, suggesting altered SEC homeostasis.
This elevation in serum HA concentration supports SECs as a
potential source of PAI-1. Perturbation of SECs by hypoxia
(Kietzman et al., 1999) or altered signal transduction may be
responsible for augmented PAI-1 expression in endothelial cells
in LPS/RAN-treated rats. P38 mitogen-activated protein kinase
is involved in induction of PAI-1 during hypoxia but does not
appear to be important in induction of PAI-1 by TNF-a (Hama-
guchi et al., 2003; Kietzmann et al., 2003). Another possibility is
that cotreatment with RAN influences PAI-1 expression at the
transcriptional level. Gruber et al. (2003) demonstrated that
the PAI-1 promoter contains a response element for the
orphan receptor Nur77 (NGFI-B, TR3). Furthermore, Nur77
overexpression in human umbilical vein endothelial cells
activates a luciferase reporter gene controlled by a PAI-1 pro-
moter, and Nur77 is necessary for induction of PAI-1 expression
by TNF-a (Gruber et al., 2003). Since Nur77 is also a hypoxia-
inducible gene (Choi et al., 2004), its expression might be expec-
ted to be enhanced in LPS/RAN-treated rats, since numerous
other hypoxia-inducible genes, including PAI-1, were identified
in this group (Table 2). Although probesets for Nur77 did not
emerge as active after LPS/RAN-cotreatment, the expression of
these was more than 10-fold greater than Veh-control in 3 of
4 LPS/RAN-treated rats, whereas less than 2-fold changes
occurred in livers of rats given LPS or RAN alone. This result
raises the possibility that Nur77 is important for enhanced
expression of PAI-1 in LPS/RAN-treated rats. However, addi-
tional experiments are necessary to prove such a connection.
The greater expression of the PAI-1 gene in livers of LPS/
RAN-treated rats (Fig. 4A) was reflected in enhanced concen-
tration of PAI-1 protein in serum (Fig. 5), suggesting a functional
consequence to its induction. PAI-1 has many physiological
roles, including inhibition of fibrinolysis and modulation of
inflammatory cell migration (Binder et al., 2002; Marshall
et al., 2003). Consistent with its antifibrinolytic activity and
pattern of expression, significant fibrin deposits occur only in
livers of rats given LPS/RAN. Concurrently elevated serum
concentrations of both HA and PAI-1 suggest the possibility
that altered SEC homeostasis might favor activation of the
hemostatic system and fibrin deposition in liver. Fibrin deposi-
tion could cause local ischemia, and resultant hypoxia might
contribute to the development of liver injury. This hypothesis is
consistent with the observation that numerous hypoxia-induci-
ble genes were expressed in livers of LPS/RAN-cotreated rats
(Table 3). Inasmuch as the PAI-1 gene is hypoxia-inducible, the
presence of hypoxia might further enhance its expression, trig-
gering a cascade of hemostatic dysregulation. Additionally,
hypoxic upregulation of egr-1 could facilitate coagulation
system activation by upregulating tissue factor on liver-cell
membranes (Pawlinski et al., 2003). Overall, the data suggest
that enhanced PAI-1 expression in LPS/RAN-cotreated rats
encourages formation of fibrin clots, possibly resulting in
disrupted liver blood flow and hepatocellular hypoxia that
could contribute to the development of necrosis. Preliminary
studies showing protection from liver injury by fibrinolytic or
anticoagulant drugs in LPS/RAN-treated rats support this
hypothesis (Luyendyk et al., 2004).
In summary, rats were treated with either a nonhepatotoxic
dose of LPS or its vehicle and with either RAN or its vehicle. Of
RANITIDINE IDIOSYNCRASY AND GENE EXPRESSION 211
by guest on August 7, 2015
http://toxsci.oxfordjournals.org/D
ownloaded from
the four treatments, only LPS/RAN treatment results in liver
injury (Luyendyk et al., 2003). At a time before the onset of
significant hepatotoxicity in LPS/RAN-treated rats, hierarchical
clustering of hepatic gene expression segregated animals by
treatment. Hypoxia-inducible genes, including PAI-1 and egr-
1, were expressed to a greater degree in livers after LPS/RAN
treatment compared to either agent given alone. The enhanced
PAI-1 gene expression was reflected in increased PAI-1 protein
in serum. Significant fibrin deposits in liver sinusoids were
observed only in LPS/RAN-cotreated rats, consistent with the
antifibrinolytic activity of PAI-1. Overall, the results suggest
that altered expression of genes promoting hemostasis might
contribute to liver injury in LPS/RAN-cotreated rats. The studies
presented represent a snapshot in time at one dose; examination
of gene expression at other times after treatment and other doses
of LPS and RAN will illuminate this connection further. The
association of hypoxia-inducible gene expression with hepatic
fibrin deposition in LPS/RAN-cotreated rats is consistent
with the development of tissue ischemia/hypoxia as a con-
tributing factor to liver pathogenesis in this model of RAN
idiosyncrasy.
SUPPLEMENTAL DATA
The results summarized as a Venn diagram in Figure 3 are
available for download in Microsoft Excel format. The genes
represented by probesets defining each set were identified and
are shown along with gene symbol, Unigene identification
(Rn build 117), locus-link identification (hyperlink available),
signal intensities relative to vehicle treatment, and standard
deviations in Supplemental Tables 1–7. Supplemental text
describing the Venn diagram is also available for download
in Microsoft Word format. Genes expressed with the specific
patterns summarized in Table 1 are available for download as
Tables 8–11 in Microsoft Word format. Following each table are
selected references for each gene product. In some cases, pro-
besets for the same gene followed the same expression pattern
but were segregated to different patterns by statistical analysis.
Supplemental data are available at www.toxsci.oupjournals.org.
ACKNOWLEDGMENTS
This work was supported by grants from Pharmacia Corporation and the
National Institutes of Health (DK061315). The authors thank Christopher
Green, Rohan Pradhan, and Jennifer Fostel for technical assistance. Lyle
Burgoon and James Luyendyk were partially supported by training-grant
number 5 T32 ES07255 from the National Institute of Environmental Health
Sciences (NIEHS), NIH, and James Luyendyk partly by the Barnett Rosenberg
Fellowship from Michigan State University.
REFERENCES
Barton, C. C., Barton, E. X., Ganey, P. E., Kunkel, S. L., and Roth, R. A. (2001).
Bacterial lipopolysaccharide enhances aflatoxin B1 hepatotoxicity in rats
by a mechanism that depends on tumor necrosis factor alpha. Hepatology
33, 66–73.
Benjamini,Y., and Hochberg, Y. (1995). Controlling the false discovery rate:
A practical and powerful approach to multiple testing. J. R. Statist. Soc. 57,
289–300.
Beutler, B. (2002). TLR4 as the mammalian endotoxin sensor. Curr. Top.
Microbiol. Immunol. 270, 109–120.
Binder, B. R., Christ, G., Gruber, F., Grubic, N., Hufnagl, P., Krebs, M.,
Mihaly, J., and Prager, G. W. (2002). Plasminogen activator inhibitor 1:
Physiological and pathophysiological roles. News Physiol. Sci. 17, 56–61.
Buchweitz, J. P., Ganey, P. E., Bursian, S. J., and Roth, R. A. (2002). Underlying
endotoxemia augments toxic responses to chlorpromazine: Is there a relation-
ship to drug idiosyncrasy? J. Pharmacol. Exp. Ther. 300, 460–467.
Choi, J. W., Park, S. C., Kang, G. H., Liu, J. O., and Youn, H. D. (2004).
Nur77 activated by hypoxia-inducible factor-1a overproduces pro-
opiomelanocortin in von Hippel-Lindau-mutated renal cell carcinoma.
Cancer Res. 64, 35–9.
Colman, R. W., Marder, V. J., Salzman, E. W., and Hirsh, J. (1994).
Overview of hemostasis. In Hemostasis and Thrombosis (R. W. Colman,
J. Hirsh, V. J. Marder, and E. W. Salzman, Eds.), p. 3. Lippincott,
Philadelphia.
Copple, B. L., Banes, A., Ganey, P. E., and Roth, R. A. (2002). Endothelial cell
injury and fibrin deposition in rat liver after monocrotaline exposure. Toxicol.
Sci. 65, 309–318.
Deaciuc, I. V., McDonough, K. H., Bagby, G. J., and Spitzer, J. J. (1993).
Alcohol consumption in rats potentiates the deleterious effect of gram-
negative sepsis on hepatic hyaluronan uptake. Alcohol Clin. Exp. Res. 17,
1002–1008.
Essayan, D. M. (1999). Cyclic nucleotide phosphodiesterase (PDE) inhibitors
and immunomodulation. Biochem. Pharmacol. 57, 965–973.
Ganey, P. E., Barton, Y. W., Kinser, S., Sneed, R. A., Barton, C. C., and
Roth, R. A. (2001). Involvement of cyclooxygenase-2 in the potentiation
of allyl alcohol-induced liver injury by bacterial lipopolysaccharide. Toxicol.
Appl. Pharmacol. 174, 113–121.
Gao, J. J., Diesl, V., Wittmann, T., Morrison, D. C., Ryan, J. L., Vogel, S. N., and
Follettie, M. T. (2002). Regulation of gene expression in mouse macrophages
stimulated with bacterial CpG-DNA and lipopolysaccharide. J. Leukoc. Biol.
72, 1234–1245.
Gray, M. O., Karliner, J. S., and Mochly-Rosen, D. (1997). A selective epsilon-
protein kinase C antagonist inhibits protection of cardiac myocytes from
hypoxia-induced cell death. J. Biol. Chem. 272, 30945–30951.
Gruber, F., Hufnagl, P., Hofer-Warbinek, R., Schmid, J. A., Breuss, J. M., Huber-
Beckmann, R., Lucerna, M., Papac, N., Harant, H., Lindley, I., de Martin, R.,
and Binder, B. R. (2003). Direct binding of Nur77/NAK-1 to the plasminogen
activator inhibitor 1 (PAI-1) promoter regulates TNF-a-induced PAI-1
expression. Blood 101, 3042–3048.
Hamaguchi, E., Takamura, T., Shimizu, A., and Nagai, Y. (2003). Tumor necro-
sis factor-alpha and troglitazone regulate plasminogen activator inhibitor
Type 1 production through extracellular signal-regulated kinase- and nuclear
factor-kB-dependent pathways in cultured human Umbilical vein endothelial
cells. J. Pharmacol. Exp. Ther. 307, 987–994.
Hayashi, T. and Faustman, D. (2000). Essential role of human leukocyte antigen-
encoded proteasome subunits in NF-kappaB activation and prevention of
tumor necrosis factor-alpha-induced apoptosis. J. Biol. Chem. 275, 5238–
5247.
Hewett, J. A., Jean, P. A., Kunkel, S. L., and Roth, R. A. (1993). Relationship
between tumor necrosis factor-alpha and neutrophils in endotoxin-induced
liver injury. Am. J. Physiol. 265, G1011–1015.
Jin, S. L., and Conti, M. (2003). Induction of the cyclic nucleotide phospho-
diesterase PDE4B is essential for LPS-activated TNF-alpha responses.
Proc. Natl. Acad. Sci. 99, 7628–7633.
212 LUYENDYK ET AL.
by guest on August 7, 2015
http://toxsci.oxfordjournals.org/D
ownloaded from

Kietzmann, T., Jungermann, K., and Gorlach, A. (2003). Regulation of the
hypoxia-dependent plasminogen activator inhibitor 1 expression by MAP
kinases. Thromb. Haemost. 89, 666–673.
Kietzmann, T., Roth, U., and Jungermann, K. (1999). Induction of the plasmino-
gen activator inhibitor-1 gene expression by mild hypoxia via a hypoxia-
response element binding the hypoxia-inducible factor-1 in rat hepatocytes.
Blood 94, 4177–4185.
Kobayashi, H., Horikoshi, K., Yamataka, A., Yamataka, T., Okazaki, T.,
Lane, G. J., and Miyano, T. (1999). Hyaluronic acid: A specific prognostic
indicator of hepatic damage in biliary atresia. J. Pediatr. Surg. 34, 1791–1794.
Li, C., Liu, J., Waalkes, M. P., and Jaeschke, H. (2003). Gene array analysis of
the hepatic response to endotoxin in glutathione peroxidase-deficient mice.
Toxicol. Lett. 144, 397–406.
Lind, R. C., Gandolfi, A. J., Sipes, I. G., and Brown, B. R. J. (1984). The
involvement of endotoxin in halothane-associated liver injury.Anesthesiology
61, 544–550.
Luyendyk, J. P., Maddox, J. F., Cosma, G. N., Ganey, P. E., Cockerell, G. L., and
Roth, R. A. (2003). Ranitidine treatment during a modest inflammatory
response precipitates idiosyncrasy-like liver injury in rats. J. Pharmacol.
Exp. Ther. 307, 9–16
Luyendyk, J. P., Maddox, J. F., Ganey, P. E., and Roth, R. A. (2004). Coagulation
system activation and fibrin deposition are critical factors in idiosyncrasy-like
liver injury from lipopolysaccharide and ranitidine coexposure (Abstract).
FASEB J. (in press).
Marshall, L. J., Ramdin, L. S., Brooks, T., Charlton, P., and Shute, J. K. (2003).
Plasminogen activator inhibitor-1 supports IL-8-mediated neutrophil
transendothelial migration by inhibition of the constitutive shedding of
endothelial IL-8/heparan sulfate/syndecan-1 complexes. J. Immunol. 171,
2057–2065.
Mattes, W. B. (2004). Annotation and cross-indexing of array elements on multi-
ple platforms. Environ. Health Perspect. 112, 506–510.
Neville, L. F., Mathiak, G., and Bagasra, O. (1997). The immunobiology of
interferon-g-inducible protein 10 kD (IP-10): a novel, pleiotropic member
of the C-X-C chemokine superfamily. Cytokine Growth Factor Rev. 8,
207–219.
Ozawa, K., Kuwabara, K., Tamatani, M., Takatsuji, K., Tsukamoto, Y., Kaneda,
S., Yanagi, H., Stern, D. M., Eguchi, Y., Tsujimoto, Y., Ogawa, S., and
Tohyama, M. (1999). 150-kDa oxygen-regulated protein (ORP150) sup-
presses hypoxia-induced apoptotic cell death. J. Biol. Chem. 274, 6397–6404.
Pawlinski, R., Pedersen, B., Kehrle, B., Aird, W. C., Frank, R. D., Guha, M., and
Mackman, N. (2003). Regulation of tissue factor and inflammatory mediators
by Egr-1 in a mouse endotoxemia model. Blood 101, 3940–3947.
Roth, R. A., Luyendyk, J. P., Maddox, J. F., and Ganey, P. E. (2003). Inflamma-
tion and drug idiosyncrasy—is there a connection? J. Pharmacol. Exp. Ther.
307, 1–8.
Schnitt, S. J., Stillman, I. E., Owings, D. V., Kishimoto, C., Dvorak, H. F., and
Abelmann, W. H. (1993). Myocardial fibrin deposition in experimental
viral myocarditis that progresses to dilated cardiomyopathy. Circ. Res. 72,
914–920.
Shi, L., Kishore, R., McMullen, M. R., and Nagy, L. E. (2002). Lipopolysac-
charide stimulation of ERK1/2 increases TNF-alpha production via Egr-1.
Am. J. Physiol. Cell Physiol. 282, C1205–1211
Thiel, G., and Cibelli, G. (2002). Regulation of life and death by the zinc finger
transcription factor Egr-1. J. Cell Physiol. 193, 287–292.
Yan, S. F., Lu, J., Zou, Y. S., Soh-Won, J., Cohen, D. M., Buttrick, P. M.,
Cooper, D. R., Steinberg, S. F., Mackman, N., Pinsky, D. J., and Stern, D.
M. (1999). Hypoxia-associated induction of early growth response-1 gene
expression. J. Biol. Chem. 274, 15030–15040.
Zhao, B., Stavchansky, S. A., Bowden, R. A., and Bowman, P. D. (2003).
Effect of interleukin-1b and tumor necrosis factor-a on gene expres-
sion in human endothelial cells. Am. J. Physiol. Cell Physiol. 284,
C1577–C1583
RANITIDINE IDIOSYNCRASY AND GENE EXPRESSION 213
by guest on August 7, 2015
http://toxsci.oxfordjournals.org/D
ownloaded from