Preferential delivery of the Sleeping Beauty transposon system to livers of mice by hydrodynamic...
30
Preferential delivery of the Sleeping Beauty transposon system to livers of mice by hydrodynamic injection Jason B Bell 1 , Kelly M Podetz-Pedersen 1 , Elena L Aronovich 1 , Lalitha R Belur 1 , R Scott McIvor 1,2 , and Perry B Hackett 1 1Department of Genetics, Cell Biology and Development, Beckman Center for Transposon Research, Institute of Human Genetics, University of Minnesota, 6−160 Jackson Hall, 321 Church Street SE, Minneapolis, Minnesota 55455, USA. 2Discovery Genomics, Inc., 614 McKinley Place NE, Minneapolis, Minnesota 55413, USA. Abstract Nonviral, DNA-mediated gene transfer is an alternative to viral delivery systems for expressing new genes in cells and tissues. The Sleeping Beauty (SB) transposon system combines the advantages of viruses and naked DNA molecules for gene therapy purposes; however, efficacious delivery of DNA molecules to animal tissues can still be problematic. Here we describe the hydrodynamic delivery procedure for the SB transposon system that allows efficient delivery to the liver in the mouse. The procedure involves rapid, high-pressure injection of a DNA solution into the tail vein. The overall procedure takes <1 h although the delivery into one mouse requires only a few seconds. Successful injections result in expression of the transgene in 5−40% of hepatocytes 1 d after injection. Several weeks after injection, transgene expression stabilizes at ∼1% of the level at 24 h, presumably owing to integration of the transposons into chromosomes. INTRODUCTION Gene delivery in mice The mouse is the most used model system for developing tools and techniques for human gene therapy. Several types of genetic disease are caused by a lack of enzymes that either normally exist in the blood or can be supplied to various tissues through the circulatory system. For expressing genes whose protein products can be secreted into the circulatory system, the liver is a particularly favored organ because of its large size and its ability to secrete many polypeptides. There are two approaches to introduce genes into organs and tissues in mice. The first method employs viral vectors that either may have preferences for specific organs or tissues, for example, hepatitis viruses that infect hepatocytes in the liver, or may have greater ranges of infectivity, for example, adenoviruses and adeno-associated viruses (AAVs) that have multiple serotypes and lesser preferences for various cell types. The second method of gene delivery is using plasmids to carry DNA into cells. Viral vector preparations from cultured mammalian cells come with the risk of contamination through a variety of different infectious agents, including replication-competent virus generated by recombination between virus vector and packaging constructs 1 . Moreover, the viral vector can be toxic; for example, adenoviruses can Correspondence should be addressed to P.H. ([email protected]). COMPETING INTERESTS STATEMENT The authors declare competing financial interests (see the HTML version of this article for details). NIH Public Access Author Manuscript Nat Protoc. Author manuscript; available in PMC 2008 September 23. Published in final edited form as: Nat Protoc. 2007 ; 2(12): 3153–3165. doi:10.1038/nprot.2007.471. NIH-PA Author Manuscript NIH-PA Author Manuscript NIH-PA Author Manuscript
Transcript of Preferential delivery of the Sleeping Beauty transposon system to livers of mice by hydrodynamic...

Preferential delivery of the Sleeping Beauty transposon system tolivers of mice by hydrodynamic injection
Jason B Bell1, Kelly M Podetz-Pedersen1, Elena L Aronovich1, Lalitha R Belur1, R ScottMcIvor1,2, and Perry B Hackett11Department of Genetics, Cell Biology and Development, Beckman Center for Transposon Research, Instituteof Human Genetics, University of Minnesota, 6−160 Jackson Hall, 321 Church Street SE, Minneapolis,Minnesota 55455, USA.
2Discovery Genomics, Inc., 614 McKinley Place NE, Minneapolis, Minnesota 55413, USA.
AbstractNonviral, DNA-mediated gene transfer is an alternative to viral delivery systems for expressing newgenes in cells and tissues. The Sleeping Beauty (SB) transposon system combines the advantages ofviruses and naked DNA molecules for gene therapy purposes; however, efficacious delivery of DNAmolecules to animal tissues can still be problematic. Here we describe the hydrodynamic deliveryprocedure for the SB transposon system that allows efficient delivery to the liver in the mouse. Theprocedure involves rapid, high-pressure injection of a DNA solution into the tail vein. The overallprocedure takes <1 h although the delivery into one mouse requires only a few seconds. Successfulinjections result in expression of the transgene in 5−40% of hepatocytes 1 d after injection. Severalweeks after injection, transgene expression stabilizes at ∼1% of the level at 24 h, presumably owingto integration of the transposons into chromosomes.
INTRODUCTIONGene delivery in mice
The mouse is the most used model system for developing tools and techniques for human genetherapy. Several types of genetic disease are caused by a lack of enzymes that either normallyexist in the blood or can be supplied to various tissues through the circulatory system. Forexpressing genes whose protein products can be secreted into the circulatory system, the liveris a particularly favored organ because of its large size and its ability to secrete manypolypeptides.
There are two approaches to introduce genes into organs and tissues in mice. The first methodemploys viral vectors that either may have preferences for specific organs or tissues, forexample, hepatitis viruses that infect hepatocytes in the liver, or may have greater ranges ofinfectivity, for example, adenoviruses and adeno-associated viruses (AAVs) that have multipleserotypes and lesser preferences for various cell types. The second method of gene delivery isusing plasmids to carry DNA into cells. Viral vector preparations from cultured mammaliancells come with the risk of contamination through a variety of different infectious agents,including replication-competent virus generated by recombination between virus vector andpackaging constructs1. Moreover, the viral vector can be toxic; for example, adenoviruses can
Correspondence should be addressed to P.H. ([email protected]).COMPETING INTERESTS STATEMENT The authors declare competing financial interests (see the HTML version of this articlefor details).
NIH Public AccessAuthor ManuscriptNat Protoc. Author manuscript; available in PMC 2008 September 23.
Published in final edited form as:Nat Protoc. 2007 ; 2(12): 3153–3165. doi:10.1038/nprot.2007.471.
NIH
-PA Author Manuscript
NIH
-PA Author Manuscript
NIH
-PA Author Manuscript
stimulate acute immune/inflammatory response following transduction in the liver2. The risksof DNA-mediated delivery, by comparison, are limited to those associated with plasmidpreparation from bacterial extracts (endotoxin, etc.) and whatever chemical component isconjugated with the DNA for the purpose of delivery. A further complication in the use ofretroviruses, lentiviruses and AAV may come from their preference for integrating intopromoters and transcriptional units, where they may have increased chances of causing adverseeffects3–11. In contrast, DNA-mediated delivery systems are likely to be more stable than viralvector preparations, more amenable to pharmaceutical formulation and do not target genes forintegration. However, introducing plasmids that carry transposons into tissues of live animalsis difficult.
This protocol is based on previously validated methods12–18 and describes hydrodynamicdelivery of Sleeping Beauty (SB) transpo-sons to mice and means for determining the extentof gene delivery. In mice, rapid, high-volume infusion of naked plasmid DNA, calledhydrodynamic delivery by the practitioners, is the most effective method for in vivo genetransfer. The method is well-established in mice, in which up to 40% of the hepatocytes in testanimals take up the transgenic DNA. The liver accounts for >95% of the expressed transgenicDNA following hydrodynamic delivery. The mechanism of DNA uptake is poorly understoodbut appears to involve expanding liver endothelium, which in mice heals within 24−48 h19–25. The method has been adapted to larger animals15, including porcine26,27 and rabbitliver28 as well as muscles of larger animals29. The DNA should be ‘naked’, that is, notcomplexed with condensing polymers or other agents30.
SB as a vector for gene deliveryThe SB transposon system is a nonviral vector system designed to deliver specific geneticcargos to vertebrate chromosomes31,32. The SB system consists of two components: atransposon (T), which carries a DNA sequence that is often comprised of a gene of interest(GOI) behind a promoter (the combination is referred to as a gene cassette), and an SBtransposase that can transpose the transposon from a carrier plasmid (or other donor DNA) toa target DNA such as a mouse chromosome (Fig. 1). The SB system has been used for twoprimary purposes—gene delivery and gene discovery32–35; here we discuss only its role ingene delivery. Transposons containing a transcriptional regulatory cassette and a transgene ofinterest within a plasmid carrier are delivered to target cells, after which SB transposase cleavesthe transposon from the donor plasmid and reinserts the transposon at a site in a chromosomefor long-term (often the lifetime of the cell) expression of the transgene. In mice injected withSB transposons and transposase encoded on a plasmid, transposition occurs over a period of∼4 d16,36.
The SB system is particularly well suited for gene delivery because it does not preferentiallyinsert transposons into active genes37–39. There are ∼200 million potential sites in the mousegenome into which an SB transposon can insert, which means that tracking transpositionactivity by cataloging integration sites is essentially impossible. However, transposition canbe quantified using an excision assay (Fig. 2) in which, regardless of where it integrates, thetransposon leaves a plasmid with a definitive ‘footprint’ that can be quantified by PCR36. Theexcision assay is relatively simple and can be used to determine the activity of the transposonsystem quantitatively whenever there is a question about its activity, for example, either undernovel conditions or with constructs that have not been validated in tissue-cultured cells.
The power of the SB system to confer long-term expression of transgenes has beendemonstrated in mice for several models of human disease. SB-mediated long-term expressionof clotting factors such as Factor VIII and Factor IX in the liver has cured hemophilias A andB, respectively40–42. The procedure has also been used by us and others to treat mice withgenetic deficiencies for fumarylacetoacetate hydrolase deficiency43–45 as well as by us for
Bell et al. Page 2
Nat Protoc. Author manuscript; available in PMC 2008 September 23.
NIH
-PA Author Manuscript
NIH
-PA Author Manuscript
NIH
-PA Author Manuscript

β-glucuronidase and iduronidase deficiencies associated with mucopolysaccharidosis Type VIIand Type I, respectively16. Hydrodynamic delivery to mouse liver has also been used withother nonviral vectors including the ϕC31 integrase system46, ϕBT147,48 and a variety ofplasmids encoding transgenic cassettes14,29 The SB system has also been used to deliver genesto other organs of the mouse including skin to treat junctional epidermolysis bullosa49, thebrain to retard glioma xenographs50,51 and to lung allografts to prevent fibrosis52. Abibliography of papers on the SB transposon system is available athttp://beckmancenter.ahc.umn.edu/html/data.html.
Designing an SB vector for gene deliveryA list of some of the available SB transposon constructs, and their full sequences, can be foundat http://www.cbs.umn.edu/labs/perry/plasmids/plasmid.html. There are four aspects thatshould be considered in designing SB transposon vectors for gene delivery.
The expression cassette—This consists of transcriptional regulators (hereafter forconvenience referred to as the promoter) and a gene or sequence that is to be expressed. Thedesired biological effect determines the composition of the expression cassette. The choice ofpromoter is dependent on several variables, including promoter strength, duration ofexpression, stringency of expression in certain cell types, and overall length. For example, theCAGGS promoter53, which is a fusion of transcriptional elements from the β-actin gene andthe cytomegalovirus (CMV) early promoter is considered to be an exceptionally strong, fairlyubiquitous driver of transcription in many cell types54,55. In contrast to the early CMVpromoter, which is often shut off in liver cells after a few days or weeks56,57, the CAGGSpromoter is active over months if not the lifetime of the cell in which it resides58,59. However,owing to the promiscuous expression of the CMV and CAGGS promoters, they also will driveexpression in other cell types, including stem cells60 and antigen-presenting cells that couldexacerbate immunological responses to the transgene product that will abolish its overallpresence in the animal16. Consequently, a combination of tissue-specific promoters, insulatoror boundary elements61, and mir motifs for regulation of translation by miRNAs62 or additionof siRNA genes63 have been used to limit expression to liver cells.
Transposase source and plasmid configuration—As noted earlier, the SB system iscomprised of the transposon and the SB transposase enzyme. In most cases, the transposasesource is an expression cassette on a plasmid and the transposon is carried on another plasmid(Fig. 3a, trans). However, the SB expression plasmid can be included on the transposon plasmid(Fig. 3a, cis). The advantage of the cis configuration is that only a single plasmid preparation,with appropriate quality control for elimination of bacterial endotoxins, is required and everycell is guaranteed a constant ratio of the SB transposase gene and the transposon with its gene/sequence of interest. The advantage of the trans configuration is that there is more flexibilityfor varying the ratio of the transposase gene and the transposon. For most initial studies, thetrans-delivery is the preferred choice.
An alternative to trans-delivery of the SB system with an SB transposase-expressing plasmidis injection of SB transposase mRNA with the transposon plasmid. This method has not beenwidely tested, but it works, albeit at a lower rate of transposition than is generally achievedthrough trans- or cis-delivery of the SB gene17,45. This alternative has the advantage oflimiting transposition to a 1- or 2-d period before the transposase mRNA and protein decay,but the inherent disadvantage is the exceptional instability of mRNA both in most solutionsand in the vascular system.
Molecular stoichiometry of SB transposase to the transposon—Optimaltransposition rates depend on having a ratio of four transposase enzymes per transposon—less
Bell et al. Page 3
Nat Protoc. Author manuscript; available in PMC 2008 September 23.
NIH
-PA Author Manuscript
NIH
-PA Author Manuscript
NIH
-PA Author Manuscript
than four transposase molecules will not support transposition, and excessive levels oftransposase will quench transposition by a process called over-production inhibition (Fig. 3b)64–67. The relative levels of transposase and transposons can be manipulated by the ratio oftransposase genes to transposon and the relative strength of the promoter driving the SBtransposase gene. Thus, delivery of the SB system in the trans configuration allows thetransposase to transposon ratios to be finely adjusted by modifying the ratio of the plasmids;in the cis configuration, a promoter of appropriate strength in the target cell must beexperimentally determined and then incorporated into the final cis-plasmid. The study byMikkelsen et al. is the most complete report of the effects of a variety of promoters used forthe SB gene in a cis configuration66.
Transposon size—This aspect is poorly understood because most end-points fordetermining effectiveness of delivery involve a screen for gene expression or simple insertionof the gene into a chromo-some. However, both assays depend not only on transposition rate,but also on the efficiency of uptake of the plasmids into the nuclei of cells and stability ofexpression of the transgene in the transposon. The efficiency of gene expression, which is takenas a measure of efficiency of gene delivery and transposition, decreases with size of thetransposon-plasmid. As shown in Figure 3c, an SB transposon of ∼6 kb, which wouldaccommodate an expression cassette of ∼5.5 kb, has ∼50% the efficiency of gene transfer asan optimally sized transposon of 2.0−2.5 kb. A size limitation has not been observed for theTol2 transposon system in the single report of effects of size44. Accordingly, if size of thetransposon or its plasmid is an issue, then trans-delivery is the preferred method.
Since its first appearance in 1997 (ref. 31), the SB system has been further developed to givehigher transpositional activities. Improvements in the transposon inverted terminal repeatshave been made36,52,68,69 and the original SB10 transposase has also been improved65,70,71. More recently, efforts to construct SB transposases that can target specific integration siteshave been deployed72–74.
Hydrodynamic injectionThe original conditions for hydrodynamic delivery were worked out in the labs of Jon Wolffand Dexi Liu12,13. In the mouse, hydrodynamic delivery of DNA requires injection of a largevolume (10%, vol/wt) of the mouse body weight of DNA, in a saline solution that is isotonicwith blood and suitable for intravenous administration, through the tail vein in <10 s (Fig. 4).Accordingly, depending on the experience of the person doing the injections, DNA can bedelivered to the livers of one dozen mice or more in an hour if the materials are organized andthe mice are healthy.
Control plasmidsDepending on the experiment, certain control injections may be necessary. These may includea ‘no transposase’ control, in which case the trans-configuration of delivery the plasmid withthe SB transposase gene is replaced with a plasmid that lacks the SB gene expression cassetteor has the inactive mutant ΔDDE gene31. In the cis-configuration of delivery, the SB gene isomitted from the vector. A control for delivery of any expression cassette that may be difficultto evaluate could include adding a small (e.g., 0.1−1 μg) amount of a CMV-luciferase orCAGGS-luciferase plasmid for bioluminescent imaging; this slight amount of luciferaseplasmid should be sufficient to produce 109−1010 photons s−1 (Fig. 5).
In this protocol, we present a step-by-step procedure for hydrodynamic delivery of SBtransposon-containing plasmids to mouse liver cells. We include methods for assaying theeffectiveness of delivery and the effectiveness of transposition of expression cassettes, or other
Bell et al. Page 4
Nat Protoc. Author manuscript; available in PMC 2008 September 23.
NIH
-PA Author Manuscript
NIH
-PA Author Manuscript
NIH
-PA Author Manuscript

genetic cargo, from the carrier plasmid to a recipient DNA molecule, which is generally achromosome.
MATERIALSREAGENTS
• Mice We routinely use 8−10 week-old C57BL/6 mice, available from the NationalCancer Institute (NCI, Frederick, MD). We have successfully used other strains fromother sources (Balb/c, FVB/N, NOD.129(B6)-Prkdcscid IDUAtm1 Clk/J, and variouscongenic substrains) ! CAUTION Mice should be handled as per local InstitutionalAnimal Care and Use Committee and Institutional Biosafety Committee approvedprotocols.
• Anesthetic cocktail: ketamine HCL (Phoenix Pharmaceutical Incorporated);acepromazine maleate (Phoenix Pharmaceutical Incorporated); and butorphanoltartrate (Fort Dodge Animal Health) (see REAGENT SETUP)
• Lactated Ringer's (LR) solution (Henry Schein Company, cat. no. 1533592)•
D-Luciferin firefly luciferase substrate, potassium salt (for in vivo imaging; XenogenCorporation, cat. no. XR-1001). ▲ CRITICAL Store at −20 °C.
• 0.5% (vol/vol) Bleach solution [sodium hypochlorite (NaOCl)]• Vector DNA containing gene for delivery (see REAGENT SETUP)—see
http://www.cbs.umn.edu/labs/perry/plasmids/plasmid.html for details of vectorsavailable from authors on request
• Primers (see Table 1)• Invitrogen Optimized Buffer A Kit (Invitrogen; cat. no. K1220−02A)
EQUIPMENT• Eye drops• Mouse restrainer (Braintree Scientific, cat. no. TV-150) or equivalent• Recovery cage(s) (Extra-clean; Allentown Micro-VENT Mouse cage) for the injected
mice—often we inject more than one mouse in a single session and so the recoverycage is not the same as the cage containing the mice pre-injection.
• 45−50 °C waterbath and/or heat lamp• Heating pad• Scale for weighing mice (Ohaus compact electronic scale; Fisher Scientific, cat. no.
01−919−33)• Bleach• Alcohol pads• Box of 1-ml TB syringes• Box of 3-ml syringes• Box of 18-gauge needles• Box of 27-gauge butterfly needles• Shaver to remove mouse hair
Bell et al. Page 5
Nat Protoc. Author manuscript; available in PMC 2008 September 23.
NIH
-PA Author Manuscript
NIH
-PA Author Manuscript
NIH
-PA Author Manuscript

REAGENT SETUPAnesthetic cocktail—In a 10-ml sterile vacutainer tubes (Becton Dickenson, cat. no. BD2006−12), add 9 ml normal saline, 0.8 ml stock ketamine HCl (100 mg ml−1), 0.1 mlbutorphanol (1 mg ml−1) and 0.1 ml acepromazine (10 mg ml−1) to give a final anestheticmixture of 8 mg ml−1 ketamine HCl, 0.1 mg ml−1 acepromazine maleate and 0.01 mg ml−1
butorphanol tartrate. This drug cocktail is premixed and is stable for 4 weeks at roomtemperature (20−25 °C). Protect anesthetic mixture from light.
Luciferin stock solution—Prepare a stock solution of luciferin (28.5 mg ml−1) bydissolving 1 g substrate in 35 ml sterile Dulbecco's PBS (Cambrix Bio Science, cat. no. 17−512F). Filter-sterilize solution through a 0.22-μm sterile filter. Store reconstituted substratein 1 ml aliquots at −20 °C. Protect substrate from light. Shake well before use.
Preparation of vector DNA—Vector DNA can be prepared with an Endo-Free kit, forexample, Maxi Kit (Qiagen, cat. no. 12362), or can be commercially prepared (e.g., AldevronInc.). We store the DNA at ∼1−2 μg μl−1 in 10 mM Tris–HCl, pH 7.2, 0.1 mM EDTA at 4 °C.
Preparation of samples for numerical evaluation of transgenes, genome copynumber and EPs in liver (Step 23)—DNA is isolated from ∼50 mg liver specimens usinga kit for isolation of total cellular DNA from mammalian tissues, for example, the DNeasyTissue Kit (Qiagen, cat. no. 69504) according to manufacturer's instructions.
Preparation of samples for EP standard curve (Step 24)—A standard curve for theplasmid EP that relates the copy number of excision plasmid product (EP) as a function of thePCR threshold cycle (Ct) number has to be obtained (Fig. 2). For this, a defined number ofcopies of the reference DNA sequence (mockEP, a plasmid that lacks the complete transposonand therefore mirrors the EP) in a defined number of genomes is prepared by diluting a knownamount of plasmid into a known amount of genomic DNA and calculating the relative copynumbers using the known molecular weights of the plasmid and the genomic DNA (≈2.2 ×10¹² g mol−1 for the mouse genome). Experimentally, the standard curve for EP is obtainedthrough serial dilutions of known quantities of plasmid containing the mockEP in genomicDNA prepared from mouse liver. Alternatively, a standard EP curve can be obtained throughserial dilutions of genomic DNA prepared from livers of mice 24 h after injection with 25 mg(the same amount as the transposon plasmid with GOI) of the mockEP (∼7 × 10¹² moleculesin the case of a pT2/BH-based mockEP plasmid; see Plasmid Info athttp://www.cbs.umn.edu/labs/perry/). Twenty-five microgram of transposon plasmidsrepresents a delivery of ∼20,000−40,000 DNA molecules (depending on transposon size) perhepatocyte. On the basis of quantitative PCR (qPCR) curves that detect down to 0.05 copy percell at their limit, we have estimated that ∼1,000 plasmids are associated with each liver cell(diploid genome) 1 d after hydrodynamic delivery16. The mockEP used in our studies waspT2/BH-based in which the transposon was deleted between two flanking BamHI sites. Thenumber of EP molecules can be standardized to the number of genomes by quantifying thenumber of genomic copies of the glyceraldehyde-3-phosphate dehydrogenase (GAPDH) gene(Step 23A). In this case, a standard curve of GAPDH is obtained through serial dilution of thegenomic liver DNA into TE buffer (10 mM Tris pH 7.6, 1 mM EDTA). Figure 2c shows thetype of curve that can be obtained.
EQUIPMENT SETUPGeneral setup considerations—The necessary materials should be set up in a biosafetycabinet or appropriate hood, as shown in Figure 6. Place sufficient 1- and 3-ml syringes, 18-gauge needles, 27-gauge butterfly needles and alcohol pads on table for the entire procedure.
Bell et al. Page 6
Nat Protoc. Author manuscript; available in PMC 2008 September 23.
NIH
-PA Author Manuscript
NIH
-PA Author Manuscript
NIH
-PA Author Manuscript
If using a water bath: wipe the water bath with a 0.5% (vol/vol) bleach solution. Turn heatcontrol for water bath on high and fill 600-ml beaker with 0.5% bleach solution. Put beaker ontop of heat block and read temperature using a thermometer. When solution temperature is∼35−40 °C, turn heat to low. Residual heat will raise temperature to 45−50 °C. If using a heatlamp: Turn on heat lamp and place first cage under it to warm mice
Recovery cage—Turn on heating pad to medium for several minutes and then turn down tolow. Place half of recovery cage on the warmed (40−50 °C) pad to provide a temperaturegradient in the cage, which allows the animal to find its preferred warmth.
PROCEDUREPrepare mice for injection • TIMING 1 min
1| Anesthetize 25−30 g mice by administering 50 μl of anesthetic cocktail i.p., prepared asindicated in REAGENT SETUP. We inject 25−30 μl of anesthetic cocktail to mice weighing<20 g to avoid rendering them unconscious.
▲ CRITICAL STEP The mouse should NOT be unconscious but moving slower (as if it were‘drunk’). The hydrodynamic procedure will increase the effect of the anesthetic. If the mouseis unconscious, there is a significant chance of animal death if injected hydrodynamically.
? TROUBLESHOOTING
2| Weigh mouse. Weighing is easier and thereby more accurate when the mouse is ‘drowsy’than when the mouse is fully active.
Prepare DNA sample for injection • TIMING 3 min3| Before entering the mouse room (i.e., in the lab), transfer the desired amount of stock DNAsolution into a 1.5-ml Eppendorf tube. Then, while the anesthetic takes effect, calculate thevolume required for hydrodynamic injection based on the weight of the mouse [10% (vol/wt)].For example: a 20 g mouse will be injected with 2 ml of a DNA solution that may range from0.05 to 30 μg ml−1; we customarily use ∼10−12.5 μg ml−1 initially with modifications to thedose in subsequent experiments that depend on the level of gene expression attained comparedto that desired.
▲ CRITICAL STEP We find that if an animal weighs >25 g and >2.5 ml is injected, theexpression of the reporter genes does not increase (E. Aronovich, J. Frandsen & R.S. McIvor,unpublished data). Accordingly, we have set an upper limit for the injection volume at 2.5 ml.
4| Place an 18-gauge needle on 3-ml syringe and draw up the amount of LR calculated in Step3 plus an additional 200 μl to take into account fluid that will remain in the 27-gauge butterflyneedle line after the injection is complete.
5| Inject ∼1 ml of the LR from Step 4 into the tube and mix the DNA by withdrawing and re-injecting LR ‘up and down’ in the tube two to three times. At the end, after all of the solutionin the Eppendorf tube has been recovered into the syringe, make sure that the DNA isthoroughly mixed by rocking the syringe several times using the air bubble to mix. As anexample, for injection of a 20-g mouse with 25 μg DNA we would transfer 12.5 μl of stockDNA(at 2 μg μl−1) into the Eppendorf tube and mix it into 2.2 ml LR solution (2 ml + 200 μl)from Step 4; we generally store our plasmids at concentrations of 1−2 μg μl−1.
6| Remove the 18-gauge needle and replace it with a 27-gauge butterfly needle. Remove theair from the syringe by tapping it and then press plunger slowly to fill the butterfly line. Set
Bell et al. Page 7
Nat Protoc. Author manuscript; available in PMC 2008 September 23.
NIH
-PA Author Manuscript
NIH
-PA Author Manuscript
NIH
-PA Author Manuscript
syringe aside until injection. The DNA solution should be stable at room temperature for theduration of the injection time if properly stored in a buffer that lacks free divalent cations suchas Mg2+.
Hydrodynamic injection • TIMING 1 min7| Place the tail of the mouse under a heat lamp or in a 45−50 °C water bath for 10−20 s. Thiswill increase the vascular volume in the tail and make the tail vein more easily visualized.
▲ CRITICAL STEP If using water bath: ensure that the temperature does not exceed 50 °Cor the tail will be burned.
▲ CRITICAL STEP When using a heat lamp, avoid overheating the mice; they die quicklywhen heated too much or for too long. Attach the heat lamp on a ring stand rod ∼45−50 cmhigh. Place the cage under the lamp. The length of time that the mouse can stay under the lampdepends on how close the lamp is to the cage; we find that at a height of 45 cm the mice canrest up to 15 min, which is sufficient time to inject five mice. When a mouse is being overheated,it becomes sluggish and usually will dig into the bedding at the corners of the cage. If younotice this, either move the cage farther away from the heat lamp or turn off the lamp for 2−5min until the mouse regains normal activity.
? TROUBLESHOOTING
8| Place the mouse in a restrainer tube (Fig. 7a) and wipe the tail with an alcohol pad.
? TROUBLESHOOTING
9| Place the tail with the lateral side up between the thumb and forefingers. Inject the needleinto the vein ∼2−3 cm from the tip of the tail, making sure that the bevel of the needle is up(Fig. 7b). Once in the vein, you may see a little backflow of blood into the tubing of the butterflyneedle. In white or nude mice, you can actually see the needle inside the vein.
▲ CRITICAL STEP As there are several variations for mouse tail-vein injections, anexperienced person should use his/her normal injection procedure. A butterfly needle is notnecessary, but we find it is easier to control the tip of the needle during the injection.
10| Press on plunger of the syringe with even force. The plunger will move smoothly with ease.Do not force it. If the plunger will not move easily, remove the needle and reinsert it anteriorto the previous injection site about midway between the first injection site and the body of themouse. If a third attempt is made, it can be done using the other vein on the opposite side ofthe tail.
▲ CRITICAL STEP If the plunger stops moving, you have blown the vein. Usually, the mouseis removed from the experiment. You can retry repositioning the needle. However, we havefound that often delivery is compromised and not as efficient in these animals.
11| Inject the entirety of the DNA sample into the tail vein within a period of 4−7 s.
▲ CRITICAL STEP This short period of time, from start to finish, is critical. An optimalduration of the injection is ∼4−7 s. Injections lasting 8−10 s will have moderate success andinjections taking > 10 s are considered unsuccessful and are not included in test groups.
? TROUBLESHOOTING
Bell et al. Page 8
Nat Protoc. Author manuscript; available in PMC 2008 September 23.
NIH
-PA Author Manuscript
NIH
-PA Author Manuscript
NIH
-PA Author Manuscript

12| When finished, remove needle and, if there is any bleeding or blood, apply light fingertippressure to the injection site until the bleeding stops.
Recovery phase • TIMING 60 min for full recovery13| After injection, remove the mouse from the restrainer as quickly as possible and place eyedrop in its eyes to prevent them from drying out owing to anesthesia. We hold the mouse untilits respiration rate returns to approximately the normal rate.
14| Return the mouse to the recovery cage, half of which should be on a heating pad set at lowheat (see EQUIPMENT SETUP). The mouse is considered to have recovered when it is up andback to normal activity. The mice may be sufficiently stable for the first blood drawing or othertests, such as in vivo bioluminescence, as soon as 30 min after hydrodynamic injection.
▲ CRITICAL STEP Monitor breathing to verify that the mouse survived the injection. Themouse's breathing may slow to one breath every 1 or 2 s. After 5−15 s the breathing rate shouldincrease to near normal, 94−163 breaths per min. If the mouse stops breathing or gasps, chestmassage may be required to promote breathing and recovery.
? TROUBLESHOOTING
15| Repeat the entire procedure with the next mouse. In general, a cohort of several mice isinjected one after the other, with occasional inspection of the recovering mice to ensure theyare not in distress. The only limitation on the number of mice injected over a single period isthe investigator's ability to avoid confusing various DNA solutions that are being injected, keepaccurate records that include injection times and gross physiological responses to the injectionprocedure and all the while monitor the health of the recovering mice. We have injected up to50 mice in a day but generally inject only ∼20 in a single session. When a large number ofanimals are injected, a team of two investigators is best to ensure all the tasks can beaccomplished while maintaining vigilance over mouse activities.
Evaluation of the efficiency of the hydrodynamic injection by in vivo bioluminescent imaging• TIMING 10 min or more per image set (depending on exposure of images)
16| The effectiveness of nucleic acid delivery can be evaluated as soon as 30 min afterhydrodynamic injection through bioluminescent imaging59. Weigh mice and use Table 2 todetermine the appropriate dose of anesthesia.
▲ CRITICAL STEP If imaging equipment is not available, blood can be drawn from miceusing standard methods and assayed for activity of the GOI.
17| Inject anesthetic i.p. Wait 2−5 min, until the mouse is fully anesthetized. Note that the levelof anesthesia is higher than that used in Step 1 because for this procedure the mouse must becompletely anesthesized for compliance with animal care regulations.
▲ CRITICAL STEP Do not overdose the mouse with anesthetic—if the mouse goes intorespiratory distress it will probably die. Owing to the variation in responses to anesthetic byvarious mouse strains and mutant lines, there is no simple method to determine the anestheticdose other than by experimentation. Check with appropriate animal care and veterinary stafffor any guidelines they can provide for particular lines of mice.
? TROUBLESHOOTING
18| If necessary, shave the ventral area over the liver on the underside of the mouse. Generally,only dark-coated mice must be shaved for acceptable imaging.
Bell et al. Page 9
Nat Protoc. Author manuscript; available in PMC 2008 September 23.
NIH
-PA Author Manuscript
NIH
-PA Author Manuscript
NIH
-PA Author Manuscript

19| Inject 100 μl luciferin i.p. and wait at least 5 min before imaging; or inject 50 μl i.v. andimage immediately. For detection of firefly luciferase activity, either i.p. or i.v. delivery ofluciferin can be employed. For detection of Renilla luciferase, substrate should be deliveredi.v.
▲ CRITICAL STEP For the i.p. luciferin injections, several mice can be injected for imagingafter hydrodynamic DNA delivery. Imaging should be carried out between 5 and 25 min afteradministration of the luciferin; after 30 min the level of luciferase activity drops significantlyand the assay will be compromised.
▲ CRITICAL STEP Sometimes, imaging multiple animals at one time results in one animalapparently lacking expression in terms of the color-coding. This could be an artifact owing tostrong signals from one animal interfering with detection of the image from another animalthat has a lesser signal. Accordingly, in this circumstance, mice that do not show a signal shouldbe imaged separately to ensure that their signals are appropriately measured.
20| Place the animal on its back onto black construction paper (Fig. 8). If the animal cannot bepositioned stably on its back with its underside fully exposed, tape down its legs.
21| Image the mice according to manufacturer's instructions. We use the Living Image programfor which the basic guidelines are provided in Box 1.
▲ CRITICAL STEP Exposures should not exceed 5 min—good delivery of a transgeniccassette with a promoter that provides robust expression in the liver usually requires ∼1 sexposure for saturation (Fig. 8).
? TROUBLESHOOTING
22| Return mice to their cage (see EQUIPMENT SETUP) to recover until they are up andmoving around.
▲ CRITICAL STEP Avoid hypothermia. Use heating pad set on low (warm) to keep mousefrom shivering. The heating pad will help keep the mouse's internal temperature from droppingtoo low and causing hypothermia.
Excision assay for transposition efficiency • TIMING 2−3 d23| After bioluminescent imaging, the animals may be killed and the excision assay performed.The excision assay16,36 is the most convenient and comprehensive assay for transposition ofSB transposons in a multicellular organ like the liver. Isolate ∼0.1 mg total DNA from ∼50mg liver specimens using a kit for isolation of total cellular DNA from mammalian tissues, forexample, the DNeasy Tissue Kit according to manufacturer's instructions.
24| Quantify DNA copy number by real-time qPCR (option A) or approximate copy numberby conventional PCR (option B).
▲ CRITICAL STEP All PCR experiments require appropriate controls. Suitable negativecontrols should include samples that lack any DNA and samples that specifically lack the targetDNA sequence. A positive control should be included when possible, but a plasmid source thatmight lead to contamination of the experimental sample should not be used. Internal PCRcontrols, for example, β-glucuronidase in Figure 2b, serve to validate the reaction mix andconditions of amplification.
Bell et al. Page 10
Nat Protoc. Author manuscript; available in PMC 2008 September 23.
NIH
-PA Author Manuscript
NIH
-PA Author Manuscript
NIH
-PA Author Manuscript

(A) Determining DNA copy number by real-time qPCRi. Set up a 25 μl reaction mixture for each sample, as tabulated below. All qPCRs should
be run in triplicate and include appropriate controls and standard curve samples (seeREAGENT SETUP). We use mouse single-copy gene sequences, such as GAPDH,as an internal control of genomic DNA content. A standard curve of GAPDH isobtained through serial dilution of genomic liver DNA from the hydrodynamicallyinjected mice into TE buffer (10 mM Tris pH 7.6, 1 mM EDTA) and measuring theCt numbers using the GAPDH-F and GAPDH-R primers (Table 1)16.
Component Amount Final concentration
Liver DNA 500 ng 20 ng μl−1 (≈ 0.01 pM GAPDH gene)GAPDH-F and -R (Table 1) 5 pmol each 200 nM each2× IQ SYBR green supermix 12.5 μl 1×
BIOLUMINESCENT IMAGE ACQUISITION
We have experience only with Xenogen's IVIS Imaging System with Living Image program.
1. Initialize the system according to manufacturer's instructions.
2. Set stage at A or B (depending on number of mice imaged simultaneously). Usestage A for one to three mice imaged at the same time (depending on size of mice).Use stage B for three to five mice imaged at the same time (depending on size ofmice).
3. Set imaging parameters as follows: Exposure time: 0.5 s to 5 min (duration dependson expression cassette and the time after injection). Binning—medium (we usemost commonly 4 × 4 pixels setting—binning can be decreased if the imagesaturates). F-stop—1 (increasing the F-stop reduces saturation of the image).
4. Take a photo to verify position.
5. Select lumination overlay key.
6. Acquire image.
i. Carry out thermocycling. Typical conditions are tabulated below. We use an iCyclerinstrument (Bio-Rad).
Cycle number Denature Anneal Extend
1 95 °C 2:00 min — —2−41 95 °C 0:40 min 58 °C 0:40 min 72 °C 1:00 min42 — — 72 °C 5:00 min
ii. The DNA content (GAPDH gene number, y-axis) for each dilution is plotted as afunction Ct value (x-axis) to obtain a standard curve for genomic DNA copy number.Figure 2c shows the type of curve that can be obtained.
(B) Conventional PCR for qualitative assessment of EP formationi. Excision analysis using conventional PCR can be used to back up, at lower resolution,
the qPCR results. Conventional PCR can also be used to compare transposition ratesqualitatively in various reactions where the absolute numbers of events is not required.
Bell et al. Page 11
Nat Protoc. Author manuscript; available in PMC 2008 September 23.
NIH
-PA Author Manuscript
NIH
-PA Author Manuscript
NIH
-PA Author Manuscript

Our conventional PCR protocol requires two rounds of amplification. We use a dNTPmix, PCR buffer and DMSO from the Invitrogen Optimized Buffer A Kit. For thefirst round, set up a 50 μl reaction mixture for each sample (including controls), astabulated below.
Component Amount Final concentration
Liver DNA 100 ng 2 ng μl−1 (≈ 30,000 haploid genomes)EP-F1 and EP-R1 primers 10 pmol each 200 nMdNTPs (A, G, C, T) 10 nmol each 200 μM5× Optimized Buffer A 10 μl 1× Optimized Buffer ADMSO 2.5 μl 100% stock 5% (vol/vol)Glycerol 2.5 μl 100% stock 5% (vol/vol)Taq DNA polymerase 5 U 0.1 U μl−1
ii. For the first amplification, we use the following conditions.
Cycle number Denature Anneal Extend
1 95 °C 5:00 min — —2−41 95 °C 0:40 min 58 °C 0:40 min 72 °C 1:00 min42 — — 72 °C 5:00 min
iii. Set up the second, nested round of amplification reactions as tabulated below.
Component Amount Final concentration
PCR mixture from reaction 1 5 μl Not applicableEP-F2 and EP-R2 primers 10 pmol each 200 nMdNTPs (A, G, C, T) 10 nmol each 200 μM5× Optimized Buffer A 10 μl 1× Optimized Buffer ADMSO 2.5 μl 100% stock 5% (vol/vol)Glycerol 2.5 μl 100% stock 5% (vol/vol)Taq DNA polymerase 5 U 0.1 U μl−1
iv. Use the following conditions for second round amplification.
Cycle number Denature Anneal Extend
1 95 °C 5:00 min — —2−31 95 °C 0:40 min 58 °C 0:40 min 72 °C 1:00 min32 — — 72 °C 7:00 min
v. We run 8 μl PCR product on an 1% (wt/vol) agarose gel. An EP band of ∼460 bp isexpected on the gel (Fig. 2b). In this example, the murine β-glucuronidase (GUSB)housekeeping gene served as an internal control that was amplified in the same PCRusing primers GUSB-F and GUSB-R (Table 1). PCR amplification yields a GUSBPCR product of 358 bp.
• TIMINGIt takes ∼6−10 min per mouse from anesthesia to completion of the hydrodynamic injectionalthough a group of 10−15 mice can be performed in <1.5 h as mice can be injected whileothers recover Steps 1−6, preparing mice and DNA solutions for injection, 4 min (per mouse
Bell et al. Page 12
Nat Protoc. Author manuscript; available in PMC 2008 September 23.
NIH
-PA Author Manuscript
NIH
-PA Author Manuscript
NIH
-PA Author Manuscript
—cohorts may take less time since the preparation of the DNA solution is a single event forall mice in a given group)
Steps 7−12, hydrodynamic injection, 1 min (per mouse)
Steps 13−15, recovery phase, 60 min for full recovery; 30 min for sufficient recovery forbioluminescent imaging
Steps 16−22, evaluation of the efficiency of the hydrodynamic injection: in vivo bioluminescentimaging, 10 min or more per image set (depending on exposure of images)
Steps 23−24, excision assay for evaluation of transposition efficiency, 2−3 d after harvestingof liver
? TROUBLESHOOTING Troubleshooting advice can be found in Table 3.
ANTICIPATED RESULTSA natural question is the reliability and extent of gene delivery using the hydrodynamicprocedure. In our experiments, we inject ∼25 mg of DNA, which depending on the size of theplasmid, corresponds to ∼2−4 × 10¹² plasmids per injection. Biodistribution studies haveshown that, based on a CMV promoter that transiently expresses well in many cell types, >95%of the expressing plasmids are in liver, and 0.1−1% in other organs12,75. Assuming thatimmediately after injection ∼1% of the injected DNA remains in the liver, which contains∼108 hepatocytes as well as Kupffer and sinusoidal epithelial cells in an adult mouse76, therewould be on the order of 1,000 transposon-containing plasmids per cell.
Figure 2 shows examples of expected results for assay of the first step of transposition—theexcision of the transposon from its carrier plasmid. The excision assay can quantify EPs downto the level of one excised transposon plasmid per 10,000 cells36.
Figure 5 shows the reproducibility of hydrodynamic delivery to the liver and an example ofthe distribution of cells that take up transgenic DNA for expression in the liver. The efficiencyof delivery to liver varies about tenfold from mouse to mouse as measured by expression ofluciferase from a transposon-containing plasmid 24 h after injection (Fig. 5a). The duration oftransposition following hydrodynamic delivery to the liver appears to be relatively short, ∼3−4 d if a short-duration promoter like the CMV promoter is used to direct transcription oftransposase77. Within the first day, as many as 40%, but more often 10−20% of hepatocytes(Fig. 5b and c)takeup ∼100 transposon-containing plasmids each16 but only express thosewhich are able to enter the nucleus for transcription. In ∼1−5% of cells, a transposition eventoccurs that moves the transposon into a mouse chromosome16,40,43. After ∼2−4 weeks,Southern blots indicate that there is <1 copy of transgenic DNA per liver cell18. Thus, of the1012 injected transposons, we estimate that ∼106 (10−4%) actually integrate into liver cells,which in mice can be sufficient to treat diseases effectively such as hemophilia and lessen theeffects of other diseases such as lysosomal storage disorders. The retention of plasmids maybe dependent on their CpG contents and the strain of mouse.
Figure 8 shows examples of two mice imaged 1 d after hydrodynamic injection. A hybridCMV/β-actin promoter was used to regulate expression of the firefly luciferase gene. Thebioluminescence imaging allows estimation of luciferase gene delivery in vivo.
Figure 9 shows the first reported example of hydrodynamic delivery of the SB system intomice40. In this example, the human Factor IX gene (hFIX) behind an EF1α promoter wasdelivered with either a functional SB10 transposase or the inactive mutant form in cis.
Bell et al. Page 13
Nat Protoc. Author manuscript; available in PMC 2008 September 23.
NIH
-PA Author Manuscript
NIH
-PA Author Manuscript
NIH
-PA Author Manuscript

Expression of hFIX at therapeutic levels was achieved over the lifetime of the mice whenfunctional transposase was co-delivered but not when the mutant transposase was delivered.
ACKNOWLEDGMENTSWe thank the Arnold and Mabel Beckman Foundation for support of our work and all members of the Beckman Centerfor Transposon Research for a long history of contributions of ideas and results. We appreciate the help of Mr. JoelFrandsen for teaching us the intricacies of hydrodynamic injection and our veterinarian technician, Brenda Koniar.The authors were partially supported by National Institutes of Health grant 1PO1 HD32652-07.
References1. Broeke AV, Burny A. Retroviral biosafety: lessons from sheep. J. Biomed. Biotech 2003;1:9–12.2. Muruve DA, Barnes MJ, Stillman IE, Libermann TA. Adenoviral gene therapy leads to rapid induction
of multiple chemokines and acute neutrophil-dependent hepatic injury in vivo. Hum. Gene Ther1999;10:965–976. [PubMed: 10223730]
3. Schroder AR, et al. HIV-1 integration in the human genome favors active genes and local hotspots.Cell 2002;110:521–529. [PubMed: 12202041]
4. Wu X, Li Y, Crise B, Burgess SM. Transcription start regions in human genome are favored targetsfor MLV integration. Science 2003;300:1749–1751. [PubMed: 12805549]
5. Nakai H, et al. AAV serotype 2 vectors preferentially integrate into active genes in mice. Nat. Genet2003;34:297–302. [PubMed: 12778174]
6. Mitchell RS, et al. Retroviral DNA integration: ASLV, HIV, and MLV show distinct target sitepreferences. PloS Biol 2004;2:1127–1136.
7. Laufs S, et al. Insertion of retroviral vectors in NOD/SCID repopulating human peripheral bloodprogenitor cells occurs preferentially in the vicinity of transcription start regions and in introns. Mol.Ther 2004;10:874–881. [PubMed: 15509505]
8. De Palma M, et al. Promoter trapping reveals significant differences in integration site selectionbetween MLV and HIV vectors in primary hematopoietic cells. Blood 2005;105:2307–2315.[PubMed: 15542582]
9. Ciuffi A, et al. Integration site selection by HIV-based vectors in dividing and growth-arrested IMR-90lung fibroblasts. Mol. Ther 2006;13:366–373. [PubMed: 16325473]
10. Bushman F, et al. Genome-wide analysis of retroviral DNA integration. Nat. Rev. Microbiol2005;3:848–858. [PubMed: 16175173]
11. Donsamte A, et al. AAV vector integration sites in mouse hepatocellular carcinoma. Science2007;317:477. [PubMed: 17656716]
12. Liu F, Song Y, Liu D. Hydrodynamics-based transfection in animals by systemic administration ofplasmid DNA. Gene Ther 1999;6:1258–1266. [PubMed: 10455434]
13. Zhang G, Budker V, Wolff JA. High levels of foreign gene expression in hepatocytes after tail veininjections of naked plasmid DNA. Hum. Gene Ther 1999;10:1735–1737. [PubMed: 10428218]
14. Al-Dosari MS, Knapp JE, Liu D. Hydrodynamic delivery. Adv. Genet 2005;54:65–82. [PubMed:16096008]
15. Herweijer H, Wolff JA. Gene therapy progress and prospects: hydrodynamic gene delivery. GeneTher 2007;14:99–107. [PubMed: 17167496]
16. Aronovich EL, et al. Prolonged expression of a lysosomal enzyme in mouse liver after SleepingBeauty transposon-mediated gene delivery: implications for non-viral gene therapy ofmucopolysaccharidoses. J. Gene Med 2007;9:403–415. [PubMed: 17407189]
17. Wilber A, et al. RNA as a source of transposase for Sleeping Beauty-mediated gene insertion andexpression in somatic cells and tissues. Mol. Ther 2006;13:625–630. [PubMed: 16368272]
18. Score PR, et al. Sleeping Beauty-mediated transposition and long-term expression in vivo: use of theLoxP/Cre recombinase system to distinguish transposition-specific expression. Mol. Ther2006;13:617–624. [PubMed: 16356773]
19. Suda T, Gao X, Stolz DB, Liu D. Structural impact of hydrodynamic injection on mouse liver. GeneTher 2007;14:129–137. [PubMed: 16988719]
Bell et al. Page 14
Nat Protoc. Author manuscript; available in PMC 2008 September 23.
NIH
-PA Author Manuscript
NIH
-PA Author Manuscript
NIH
-PA Author Manuscript

20. Crespo A, et al. Hydrodynamic liver gene transfer mechanism involves transient sinusoidal bloodstasis and massive hepatocyte endocytic vesicles. Gene Ther 2005;12:927–935. [PubMed: 15729372]
21. Budker VG, et al. Mechanism of plasmid delivery by hydrodynamic tail vein injection. II.Morphological studies. J. Gene Med 2006;8:852–873. [PubMed: 16724360]
22. Sebestyen MG, et al. Mechanism of plasmid delivery by hydrodynamic tail vein injection. I.Hepatocyte uptake of various molecules. J. Gene Med 2006;8:852–873. [PubMed: 16724360]
23. Kobayashi N, Nishikawa M, Hirata K, Takakura Y. Hydrodynamics-based procedure involvestransient hyperpermeability in the hepatic cellular membrane: implication of a nonspecific processin efficient intracellular gene delivery. J. Gene Med 2004;6:584–592. [PubMed: 15133769]
24. Andrianaivo F, Lecocq F, Wattiaux-De Coninck S, Wattiaux R, Jadot M. Hydrodynamics-basedtransfection of the liver: entrance into hepatocytes of DNA that causes expression takes place veryearly after injection. J. Gene Med 2004;6:877–883. [PubMed: 15293346]
25. Lecocq M, et al. Uptake by mouse liver and intracellular fate of plasmid DNA after a rapid tail veininjection of a small or a large volume. J. Gene Med 2003;5:142–146. [PubMed: 12539152]
26. Yoshino H, Hashizume K, Kobayashi E. Naked plasmid DNA transfer to the porcine liver using rapidinjection with large volume. Gene Ther 2006;13:1696–1702. [PubMed: 16871229]
27. Aliño SF, Herrero MJ, Noguera I, Dasí F, Sánchez M. Pig liver gene therapy by noninvasiveinterventionist catheterism. Gene Ther 2007;14:334–343. [PubMed: 17036058]
28. Eastman SJ, et al. Development of catheter-based procedures for transducing the isolated rabbit liverwith plasmid DNA. Hum. Gene Ther 2002;13:2065–2077. [PubMed: 12490001]
29. Wolff JA, Budker V. Hydrodynamic delivery. Adv. Genet 2005;54:3–20. [PubMed: 16096005]30. Rossmanith W, Chabicovsky M, Herkner K, Schulte-Hermann R. Cellular gene dose and kinetics of
gene expression in mouse livers transfected by high-volume tail-vein injection of naked DNA. DNACell. Biol 2002;21:847–853. [PubMed: 12489995]
31. Ivics Z, Hackett PB, Plasterk RH, Izsvak Z. Molecular reconstruction of Sleeping Beauty, a Tc1-liketransposon from fish, and its transposition in human cells. Cell 1997;91:501–510. [PubMed:9390559]
32. Hackett PB, Ekker SC, Largaespada DA, McIvor RS. Sleeping Beauty transposon-mediated genetherapy for prolonged expression. Adv. Genet 2005;54:187–229.
33. Ivics Z, Izsvak Z. Transposable elements for transgenesis and insertional mutagenesis in vertebrates:a contemporary review of experimental strategies. Meth. Mol. Biol 2004;260:255–276.
34. Hackett, PB.; Ekker, SE.; Essner, JJ. Applications of transposable elements in fish for transgenesisand functional genomics.. In: Gong, Z.; Korzh, V., editors. Fish Development and Genetics Chapter.16. World Scientific, Inc.; New Jersey, USA and Singapore: 2004. p. 532-580.
35. Ivics Z, Izsvak Z. Transposons for gene therapy! Curr. Gene Ther 2006;6:593–607. [PubMed:17073604]
36. Liu G, Aronovich EL, Cui Z, Whitley CB, Hackett PB. Excision of Sleeping Beauty transposons:parameters and applications to gene therapy. J. Gene Med 2004;6:574–583. [PubMed: 15133768]
37. Yant SR, et al. High-resolution genome-wide mapping of transposon integration in mammals. Mol.Cell. Biol 2005;25:2085–2094. [PubMed: 15743807]
38. Berry C, Hannenhalli S, Leipzig J, Bushman FD. Selection of target sites for mobile DNA integrationin the human genome. PLoS Comp. Biol 2006;2:e157.
39. Hackett CS, Geurts AM, Hackett PB. Predicting preferential DNA vector insertion sites: implicationsfor functional genomics and gene therapy. Genome Biol 2007;8(Suppl 1):S12. [PubMed: 18047689]
40. Yant SR, et al. Somatic integration and long-term transgene expression in normal and haemophilicmice using a DNA transposon system. Nat. Genet 2000;25:35–41. [PubMed: 10802653]
41. Ohlfest JR, et al. Phenotypic correction and long-term expression of factor VIII in hemophilic miceby immunotolerization and nonviral gene transfer using the Sleeping Beauty transposon system.Blood 2005;105:2691–2698. [PubMed: 15576475]
42. Liu L, Mah C, Fletcher BS. Sustained FVIII expression and phenotypic correction of hemophilia Ain neonatal mice. Mol. Ther 2006;13:1006–1015. [PubMed: 16464640]
43. Montini EP, et al. In vivo correction of murine tyrosinemia type I by DNA-mediated transposition.Mol. Ther 2002;6:759–769. [PubMed: 12498772]
Bell et al. Page 15
Nat Protoc. Author manuscript; available in PMC 2008 September 23.
NIH
-PA Author Manuscript
NIH
-PA Author Manuscript
NIH
-PA Author Manuscript

44. Balciunas D, et al. Harnessing an efficient large cargo-capacity transposon for vertebrate gene transferapplications. PLoS Genet 2006;4
45. Wilber A, et al. Messenger RNA as a source of transposase for Sleeping Beauty transposon-mediatedcorrection of hereditary tyrosinemia type I. Mol. Ther 2007;15:1280–1287. [PubMed: 17440442]
46. Calos MP. The γC31 integrase system for gene therapy. Curr. Gene Ther 2006;6:633–645. [PubMed:17168696]
47. Chen L, Woo SL. Complete and persistent phenotypic correction of phenylketonuria in mice by site-specific genome integration of murine phenylalanine hydroxylase cDNA. Proc. Natl. Acad. Sci. USA2005;102:15581–15586. [PubMed: 16230623]
48. Chen L, Thung SN, Woo SL. Metabolic basis of sexual dimorphism in PKU mice after genome-targeted PAH gene therapy. Mol. Ther 2007;15:1079–1085. [PubMed: 17406346]
49. Ortiz S, et al. Sustainable correction of junctional epidermolysis bullosa via transposon-mediatednonviral gene transfer. Gene Ther 2003;10:1099–1104. [PubMed: 12808440]
50. Ohlfest JR, Lobitz PD, Perkinson SG, Largaespada DA. Integration and long-term expression inxenografted human glioblastoma cells using a plasmid-based transposon system. Mol. Ther2004;10:260–268. [PubMed: 15294173]
51. Ohlfest JR, et al. Combinatorial anti-angiogenic gene therapy by nonviral gene transfer using theSleeping Beauty transposon causes tumor regression and improves survival in mice bearingintracranial human glioblastoma. Mol. Ther 2005;12:778–788. [PubMed: 16150649]
52. Liu H, Liu L, Fletcher BS, Visner GA. Sleeping Beauty-based gene therapy with indoleamine 2,3-dioxygenase inhibits lung allograft fibrosis. FASEB J 2006;20:2384–2386. [PubMed: 17015408]
53. Akagi Y, et al. Transcriptional activation of a hybrid promoter composed of cytomegalovirus enhancerand beta-actin/beta-globin gene in glomerular epithelial cells in vivo. Kidney Int 1997;51:1265–1269.[PubMed: 9083295]
54. Xu L, et al. CMV-beta-actin promoter directs higher expression from an adeno-associated viral vectorin the liver than the cytomegalovirus or elongation factor 1 alpha promoter and results in therapeuticlevels of human factor X in mice. Hum. Gene Ther 2001;12:563–573. [PubMed: 11268288]
55. Chu Q, Joseph M, Przybylska M, Yew NS, Scheule RK. Transient siRNA-mediated attenuation ofliver expression from an alpha-galactosidase A plasmid reduces subsequent humoral immuneresponses to the transgene product in mice. Mol. Ther 2005;12:264–273. [PubMed: 15946902]
56. Hodges BL, Taylor KM, Joseph MF, Bourgeois SA, Scheule RK. Long-term transgene expressionfrom plasmid DNA gene therapy vectors is negatively affected by CpG dinucleotides. Mol. Ther2004;10:269–278. [PubMed: 15294174]
57. Herweijer H, et al. Time course of gene expression after plasmid DNA gene transfer to the liver. J.Gene Med 2001;3:280–291. [PubMed: 11437333]
58. Okabe M, Ikawa M, Kominami K, Nakanishi T, Nishimune Y. Green mice’ as a source of ubiquitousgreen cells. FEBS Lett 1997;407:313–319. [PubMed: 9175875]
59. Wilber AC, et al. Dynamic gene expression following systemic delivery of plasmid DNA asdetermined by in vivo bioluminescence imaging. Hum. Gene Ther 2005;16:1325–1332.
60. Tolar J, et al. Real-time in vivo imaging of stem cells following transgenesis by transposition. Mol.Ther 2005;12:42–48. [PubMed: 15963919]
61. Manno CS, et al. Successful transduction of liver in hemophilia by AAV-Factor IX and limitationsimposed by the host immune response. Nat. Med 2006;12:342–347. [PubMed: 16474400]
62. Brown BD, Venneri MA, Zingale A, Sergi GS, Naldini L. Endogenous microRNA regulationsuppresses transgene expression in hematopoietic lineages and enables stable gene transfer. Nat. Med2006;5:585–591. [PubMed: 16633348]
63. Grimm D, Kay MA. Combinatorial RNAi: a winning strategy for the race against evolving targets?Mol. Ther 2007;15:878–888. [PubMed: 17311009]
64. Hartl DL, Lohe AR, Lozovskaya ER. Regulation of the transposable element mariner. Genetica1997;100:177–184. [PubMed: 9440271]
65. Geurts AM, et al. Gene transfer into genomes of human cells by the Sleeping Beauty transposonsystem. Mol. Ther 2003;8:108–117. [PubMed: 12842434]
Bell et al. Page 16
Nat Protoc. Author manuscript; available in PMC 2008 September 23.
NIH
-PA Author Manuscript
NIH
-PA Author Manuscript
NIH
-PA Author Manuscript
66. Mikkelsen JG, et al. Helper-independent Sleeping Beauty transposon-transposase vectors for efficientnonviral gene delivery and persistent gene expression in vivo. Mol. Ther 2003;8:654–665. [PubMed:14529839]
67. Hackett PB. ntegrating DNA vectors for gene therapy. Mol. Ther 2007;15:10–12. [PubMed:17164769]
68. Cui Z, Guerts AM, Liu G, Kaufman CD, Hackett PB. Structure-function analysis of the invertedterminal repeats of the Sleeping Beauty transposon. J. Mol. Biol 2002;318:1221–1235. [PubMed:12083513]
69. Zayed H, Izsvak Z, Walisko O, Ivics Z. Development of hyperactive Sleeping Beauty transposonvectors by mutational analysis. Mol. Ther 2004;9:292–304. [PubMed: 14759813]
70. Yant SR, Park J, Huang Y, Mikkelsen JG, Kay MA. Mutational analysis of the N-terminal DNA-binding domain of Sleeping Beauty transposase: critical residues for DNA binding and hyperactivityin mammalian cells. Mol. Cell Biol 2004;24:9239–9247. [PubMed: 15456893]
71. Baus J, Liu L, Heggestad AD, Sanz S, Fletcher BS. Hyperactive transposase mutants of the SleepingBeauty transposon. Mol. Ther 2005;12:1148–1156. [PubMed: 16150650]
72. Yant SR, Huang Y, Akache B, Kay MA. Site-directed transposon integration in human cells. NucleicAcids Res 2007;35:e50. [PubMed: 17344320]
73. Ivics Z, et al. Targeted Sleeping Beauty transposition in human cells. Mol. Ther 2007;15:1137–1144.[PubMed: 17426709]
74. Wilson MH, Kaminski JM, George AL Jr. Functional zinc finger/sleeping beauty transposasechimeras exhibit attenuated overproduction inhibition. FEBS Lett 2005;579:6205–6209. [PubMed:16243318]
75. Herweijer H, Wolff JA. Progress and prospects: naked DNA gene transfer and therapy. Gene Ther2003;10:453–458. [PubMed: 12621449]
76. Ponder KP, et al. Mouse hepatocytes migrate to liver parenchyma and function indefinitely afterintrasplenic transplantation. Proc. Natl. Acad. Sci. USA 1991;88:1217–1221. [PubMed: 1899924]
77. Bell JB, et al. Duration of expression of Sleeping Beauty transposase in mouse liver followinghydrodynamic delivery. Mol. Ther 2006;13(Suppl):S150.
Bell et al. Page 17
Nat Protoc. Author manuscript; available in PMC 2008 September 23.
NIH
-PA Author Manuscript
NIH
-PA Author Manuscript
NIH
-PA Author Manuscript

Figure 1.Schematic of Sleeping Beauty (SB) transposition. DNA transposition consists of a cut-and-paste reaction in which a transposon containing a gene of interest (GOI, shown in blue, withits promoter shown in magenta) is cut out of a plasmid and inserted into another DNA molecule,in this case a mouse chromosome. The cleavage reaction occurs at the ends of the invertedterminal repeats (inverted set of double arrowheads in the diagram) of the SB transposon31.SB transposons integrate only into TA-dinucleotide basepairs (∼200 million in mammaliangenomes). The inverted terminal repeats are the only DNA sequences required by thetransposase enzyme for transposition. The transposase gene can be on the same plasmid (cisconfiguration as shown) or delivered on a separate plasmid (trans configuration, see Fig. 3) topermit greater flexibility in experimental design. (a) The plasmid carrying the SB transposasegene and transposon enters a cell (large back oval) as a result of hydrodynamic delivery andproceeds through the nuclear membrane (dotted hexagon) by a poorly understood process.(b) The SB transposase gene (SB, green) is transcribed from a promoter (magenta arrowhead)and the mRNA translated in the cytoplasm to give an appropriate level of enzyme (greencircles). (c) The SB transposase molecules enter the nucleus and bind to the transposon, twoat each end, to bring the transposon ends together (shown in detail in Fig. 3b). (d) Fourtransposase enzymes work in concert to cleave the plasmid at the termini of the transposon andpaste it (dotted lines) into chromosomal DNA (green tangled lines). (e) A plasmid excisionproduct is left behind in this reaction (the site whence the transposon left is marked by an X).(f) Integration into a chromosome can confer long-term expression of the GOI that is containedwithin the transposon.
Bell et al. Page 18
Nat Protoc. Author manuscript; available in PMC 2008 September 23.
NIH
-PA Author Manuscript
NIH
-PA Author Manuscript
NIH
-PA Author Manuscript

Figure 2.Excision assay. (a) Theory of the excision assay. The first step of transposition is precisecleavage on both sides of the transposon (excision step, step d in Fig. 1). The gap in the donor-plasmid left by the transposon is repaired (step e in Fig. 1) to reform a circular plasmid lackingthe transposon. The re-ligation step often leaves a footprint of an extra 5 bp (either TCTGA orTCAGA) at the site of the original transposon36. As a result of ligation of the plasmid, primers(red arrows in the bottom right corner of panel a) complementary to plasmid sequences locatedon either side of the site whence the transposon originated can bind to the repaired plasmid.PCR-amplification from the primers leads to a DNA sequence of predictable length andsequence (except for the footprint), which we refer to as the excision product (EP) (red line atthe bottom right of panel a). The power of the assay is that regardless of where the transposonintegrates, the EP from each event is the same thereby allowing quantification of the totalityof transposition events. Thus, whereas identification of integration at any of 2 × 10⁸ TA sitescan only be determined through analysis of genomic DNA, the intensity of the PCR productfrom the repaired plasmid can be used to access the overall extent of transposition. The redline represents the EP from PCR and the red arrow indicates its location on the gel in panelc. Primer sites are chosen to be 100−200 bp outside of the inverted repeats of the transposonto ensure that the PCR product is efficiently synthesized, that the EP is distinguishable fromthe primers (and ‘primer dimers’ sometimes seen in gels of PCRs), and that the EP isdistinguishable from the PCR amplification across the transposon from unexcised plasmids.(b) The level of transposition can be estimated through conventional PCR and analysis byagarose-gel electrophoresis. The gel shows a single band amplified from a genomic sequence(e.g., β-glucuronidase) in a liver sample from a sham-treated control mouse that received aninjection of lactated Ringer's solution without DNA and an additional band representing theamplified EP (red EP) from a mouse injected with a transposon-containing plasmid. (c) Theamount of EP can be quantitatively determined by real-time PCR using any of severalinstruments (the data here were generated using an iCycler (Bio-Rad Laboratories) with theirIQ SYBR green supermix according to their guidelines). The data show the copy numbers ofexcision plasmid product (EP) as a function of the PCR threshold cycle (Ct) number whenSYBR Green fluorescence is first detectable. The standard curve indicates that the signal isproportional to the input level of repaired plasmids after excision (open boxes). Triplicatesamples were assayed and overlapped for all samples except that from the sham-treated mouse
Bell et al. Page 19
Nat Protoc. Author manuscript; available in PMC 2008 September 23.
NIH
-PA Author Manuscript
NIH
-PA Author Manuscript
NIH
-PA Author Manuscript

(two triangles; the bottom triangle represents two results) and the untreated mouse (blackcircles with two of the samples overlapping at the bottom). Greater variation between samplesis sometimes seen with the least concentrated samples because the slightest contamination canlead to a measurable signal. The gel at the top shows the final products from real-time PCRsthat were resolved by electrophoresis using 1% agarose gel. Panel a is adapted from Figure 2of Liu et al. (2004)36 and panels b and c are from Figure 6 of Aronovich et al. (2007)16. GOI,gene of interest; SB, Sleeping Beauty.
Bell et al. Page 20
Nat Protoc. Author manuscript; available in PMC 2008 September 23.
NIH
-PA Author Manuscript
NIH
-PA Author Manuscript
NIH
-PA Author Manuscript

Figure 3.Design of Sleeping Beauty (SB) transposons. (a) The cis and trans configurations for deliveryof the SB system are shown with transcriptional regulatory sequences represented by themagenta arrowheads as described in Figure 1. In the trans-delivery mode, the transposase genecan be omitted as a negative control. An alternative trans-delivery is possible wherein the SBmRNA is delivered rather than its gene. (b) The phenomenon of overproduction inhibition isillustrated. The rate of transposition depends on the binding of four transposase enzymes tothe transposon [SB]optimal. If there are fewer than four transposase molecules [SB]low,transposition will not occur and if there are more, then the additional transposase moleculeswill quench the reaction by competing with bound enzymes to prevent the bringing of thetransposon ends together [SB]high. (c) The effects of cargo (expression cassette) size on genedelivery as determined by long-term gene expression in dividing cells. The cause for theapparent decrease in transposition as a function of size is poorly understood because the lengthof the plasmid carrier sets the linear distance between the termini of the transposon once theexpression cassette is longer than ∼2 kb. Factors that may influence the efficiency of genedelivery include propagation through the plasma and nuclear membranes, where effects ofDNA length have not been carefully evaluated. The diagrams in panels b and c are adapted,with permission, from Figure 3 of Geurts et al. (2003)65 and Figure 2 of Hackett (2007)67,respectively.
Bell et al. Page 21
Nat Protoc. Author manuscript; available in PMC 2008 September 23.
NIH
-PA Author Manuscript
NIH
-PA Author Manuscript
NIH
-PA Author Manuscript

Figure 4.Hydrodynamic injection procedure of a transposon containing a gene of interest and a sourceof Sleeping Beauty (SB) transposase encoded by an SB gene. The components of the SB systemare the same as in Figures 1 and 3. Trans- and cis-deliveries are performed in the same way.(a) The desired amount of DNA (generally between 0.1 and 50 μg, although higher and loweramounts can be injected) is diluted into a volume of lactated Ringer's solution that is equivalentto 10% the mouse weight. (b) The DNA solution is injected into the tail vein of the mouse;injections that take 4−7 s are optimal. (c) Results from hydrodynamic delivery can be obtainedas soon as 30 min after injection, depending on the gene of interest (GOI) and the assay.
Bell et al. Page 22
Nat Protoc. Author manuscript; available in PMC 2008 September 23.
NIH
-PA Author Manuscript
NIH
-PA Author Manuscript
NIH
-PA Author Manuscript
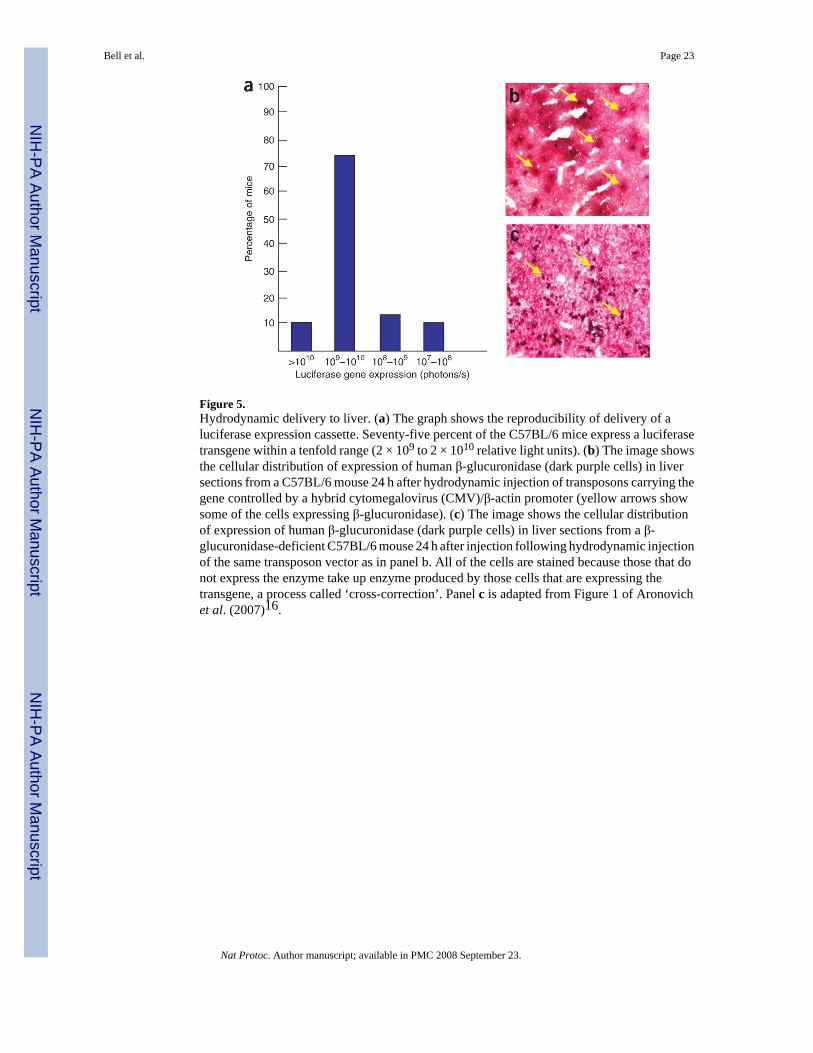
Figure 5.Hydrodynamic delivery to liver. (a) The graph shows the reproducibility of delivery of aluciferase expression cassette. Seventy-five percent of the C57BL/6 mice express a luciferasetransgene within a tenfold range (2 × 10⁹ to 2 × 10¹⁰ relative light units). (b) The image showsthe cellular distribution of expression of human β-glucuronidase (dark purple cells) in liversections from a C57BL/6 mouse 24 h after hydrodynamic injection of transposons carrying thegene controlled by a hybrid cytomegalovirus (CMV)/β-actin promoter (yellow arrows showsome of the cells expressing β-glucuronidase). (c) The image shows the cellular distributionof expression of human β-glucuronidase (dark purple cells) in liver sections from a β-glucuronidase-deficient C57BL/6 mouse 24 h after injection following hydrodynamic injectionof the same transposon vector as in panel b. All of the cells are stained because those that donot express the enzyme take up enzyme produced by those cells that are expressing thetransgene, a process called ‘cross-correction’. Panel c is adapted from Figure 1 of Aronovichet al. (2007)16.
Bell et al. Page 23
Nat Protoc. Author manuscript; available in PMC 2008 September 23.
NIH
-PA Author Manuscript
NIH
-PA Author Manuscript
NIH
-PA Author Manuscript

Figure 6.Layout of equipment for hydrodynamic injection. The items, except for a marker pen in middleare numbered for easy identification: 1) Bleach bucket, for washing items and hands that areused in the hood in accordance with specific-pathogen free (SPF) procedure. 2) Bleach Spraybottle to facilitate washing in accordance with SPF procedure. 3) Lactated Ringer's solutionfor dilution and injection of transgenic DNA. 4) Three milliliter syringes for hydrodynamicinjections. 5) Butterfly needles for hydrodynamic injections; the needle attaches to the 3-mlsyringe. 6) Rack with samples that contain the DNA solutions for injection. 7) One-millilitersyringe with anesthetic drug already drawn up; it is covered because the anesthetic is sensitiveto visible light. 8) Alcohol pads to sanitize tails. 9) Timer to measure duration of each injection.10) Scale for weighing mice. 11) Mouse restrainer to contain mouse and reduce its activityduring the injection. 12) Top of mouse cage set at an angle for better viewing. 13) Bottom ofmouse cage for animal housing. 14) Heat lamp and ring stand to dilate veins in mice and keepthem warm. The vertical rod in the stand is ∼50 cm tall.
Bell et al. Page 24
Nat Protoc. Author manuscript; available in PMC 2008 September 23.
NIH
-PA Author Manuscript
NIH
-PA Author Manuscript
NIH
-PA Author Manuscript

Figure 7.Hydrodynamic injection with mouse in restrainer. (a) The mouse is placed in a restrainer andthe tail is rotated until the lateral vein faces up. In this example, the needle is in the right handand is being placed into the tail vein for injection. (b) Detail of insertion of the needle into atail vein. Two tail arteries run along the top and the bottom of the tail and two tail veins runon either side, midway between the arteries. The needle is inserted ∼2−3 cm from the tip ofthe tail (which is under the injector's thumb in this image). The needle is almost completelyinserted into the vein for best results. The tip of the tail behind the injection site may be bentdownward by some injectors. The tail is pulled taut, but excessive force may result in the tailcoming off in young mice. If the injection fails, a new site, roughly in the middle of the tailcan be tried. If this fails, one can try the other tail vein on the other side. When the needle isremoved, some blood will flow from the puncture; bleeding is stopped by pressing lightly (notsqueezing tightly) the wound with a finger and thumb.
Bell et al. Page 25
Nat Protoc. Author manuscript; available in PMC 2008 September 23.
NIH
-PA Author Manuscript
NIH
-PA Author Manuscript
NIH
-PA Author Manuscript

Figure 8.Typical results from in vivo bioluminescence imaging of mice 24 h after hydrodynamicinjection. Both mice are on black construction paper, which may appear differently accordingto background illumination. Color-coded luminescence scales for the circled regions are shownon the right. Exposures are 1 s. The imaging identifies the liver as the primary site of expressionof a luciferase expression cassette. The mouse on the left is a C57BL/6 mouse (Imaged for 0.5s) and the mouse on the right is a NOD.129(B6)-PrkdcscidIduatm1Clk (imaged for 1 s). ROI,region of interest.
Bell et al. Page 26
Nat Protoc. Author manuscript; available in PMC 2008 September 23.
NIH
-PA Author Manuscript
NIH
-PA Author Manuscript
NIH
-PA Author Manuscript

Figure 9.Example of long-term gene expression following hydrodynamic delivery into mice. Results ofdelivery of the human clotting Factor IX (hFIX) gene in a Sleeping Beauty (SB) transposoninto FIX-deficient mice. Long-term expression depended on the presence of a functionaltransposase (SB10 regulated by a cytomegalovirus (CMV) promoter). The top portion of thefigure shows the constructs delivered in cis. The graphs show the levels of hFIX in the miceas a function of time after hydrodynamic injection relative to normal enzyme amounts(therapeutic level). This figure is adapted from Figure 4 of Yant et al. (2000)40.
Bell et al. Page 27
Nat Protoc. Author manuscript; available in PMC 2008 September 23.
NIH
-PA Author Manuscript
NIH
-PA Author Manuscript
NIH
-PA Author Manuscript
NIH
-PA Author Manuscript
NIH
-PA Author Manuscript
NIH
-PA Author Manuscript
Bell et al. Page 28
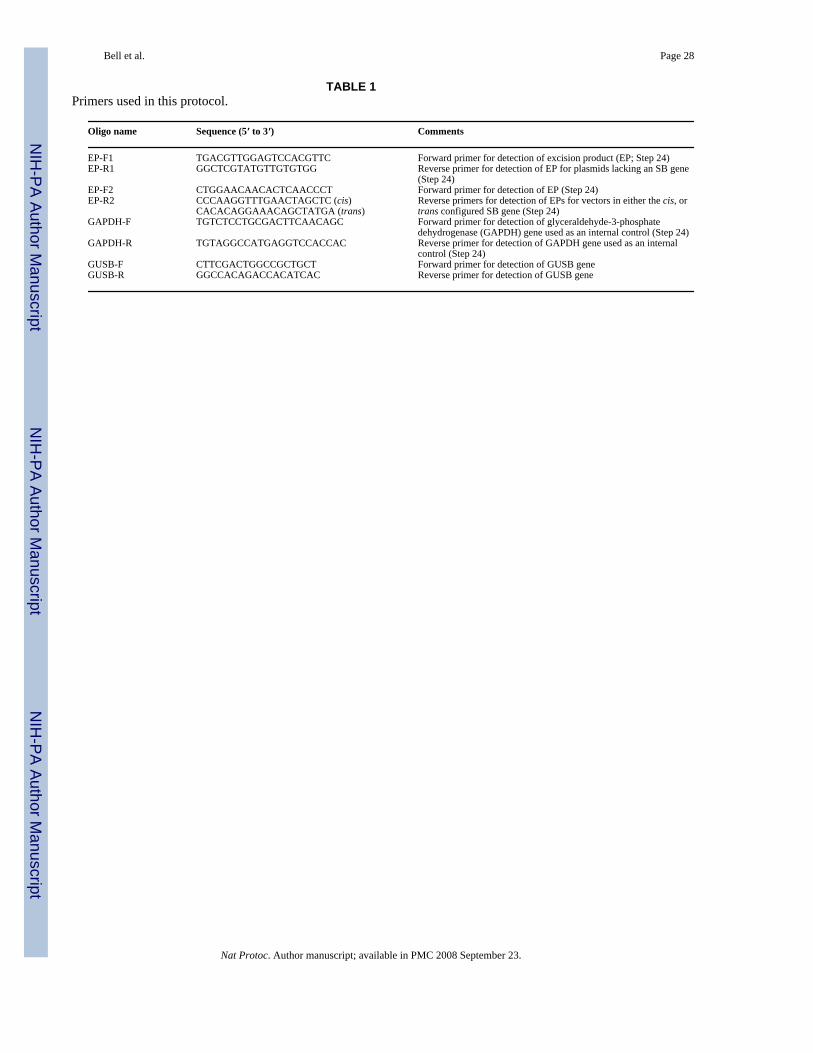
TABLE 1Primers used in this protocol.
Oligo name Sequence (5′ to 3′) Comments
EP-F1 TGACGTTGGAGTCCACGTTC Forward primer for detection of excision product (EP; Step 24)EP-R1 GGCTCGTATGTTGTGTGG Reverse primer for detection of EP for plasmids lacking an SB gene
(Step 24)EP-F2 CTGGAACAACACTCAACCCT Forward primer for detection of EP (Step 24)EP-R2 CCCAAGGTTTGAACTAGCTC (cis)
CACACAGGAAACAGCTATGA (trans)Reverse primers for detection of EPs for vectors in either the cis, ortrans configured SB gene (Step 24)
GAPDH-F TGTCTCCTGCGACTTCAACAGC Forward primer for detection of glyceraldehyde-3-phosphatedehydrogenase (GAPDH) gene used as an internal control (Step 24)
GAPDH-R TGTAGGCCATGAGGTCCACCAC Reverse primer for detection of GAPDH gene used as an internalcontrol (Step 24)
GUSB-F CTTCGACTGGCCGCTGCT Forward primer for detection of GUSB geneGUSB-R GGCCACAGACCACATCAC Reverse primer for detection of GUSB gene
Nat Protoc. Author manuscript; available in PMC 2008 September 23.

NIH
-PA Author Manuscript
NIH
-PA Author Manuscript
NIH
-PA Author Manuscript
Bell et al. Page 29
TABLE 2Doses for anesthetizing mice for imaging.
Animal weight (g) Dose (ketamine HCl:acepromazine malieate: butorphanol tartrate)
<15 150 μl Anesthetic cocktail (1.2 mg:15 μg:1.5 μg)15−20 200 μl Anesthetic cocktail (1.6 mg:20 μg:2.0 μg)20−25 250 μl Anesthetic cocktail (2.0 mg:25 μg:2.5 μg)>25 300 μl Anesthetic cocktail (1.4 mg:30 μg:3.0 μg)
Nat Protoc. Author manuscript; available in PMC 2008 September 23.

NIH
-PA Author Manuscript
NIH
-PA Author Manuscript
NIH
-PA Author Manuscript
Bell et al. Page 30
TABLE 3Troubleshooting table.
Step Problem Possible reason Proposed solution
1: Anesthetic dosing Mouse appears fullyanesthesized
Overdose of anesthetic Reduce dosing to account for variety inmouse strains
7: Heating mice Vein not visible Underheating Heat tail longerTails fall off or the mousedies
Overheating Watch mouse closely; mouse shouldslowly move around cage
8: Loading mouse intorestrainer
Mouse not breathing Mouse wedged intorestrainer
Do not cover nose of mouse
11: Hydrodynamic injection Injection takes longer than 10s
Injection too slow Omit mouse from test group
Blown tail vein Poor placement of needle;injection too rapid
Omit mouse from test group
Mouse suffers cardiac arrestor develops fluid in its lungs
Unknown Massage chest to assist labored bloodflow and/or help clear lungs
14: Recovery Death Hypothermia Place subsequent mice on heating padset on low heat until they are moving
Troubled breathing Unknown Massage chest17: Imaging Mouse dies Overdose of anesthetic Reduce dose in subsequent mice to
account for strain differencesMouse is too active forimaging
Underdose of anesthetic Increase anesthetic. The mouse mayneed to be taped down
21: Imaging Signals not distinct Overexposure Reduce exposure timeImage only one mouse at a time
Nat Protoc. Author manuscript; available in PMC 2008 September 23.