Homelessness and Rough Sleeping Review
35
1 Cambridge City Council Homelessness and Rough Sleeping Review December 2019
-
Upload
khangminh22 -
Category
Documents
-
view
2 -
download
0
Transcript of Homelessness and Rough Sleeping Review

1
Cambridge City Council
Homelessness and Rough Sleeping
Review
December 2019

2
Contents
About this document
• Introduction • Review structure • Consultation
Page 3
One: Background – Housing Affordability and Availability in Cambridge
Page 5
Two: Preventing and Relieving Homelessness
• Quantifying homelessness in Cambridge • Housing advice service performance • Resourcing effective housing advice • What is causing people to lose their last
settled home? • Complex cases • How are we preventing and relieving
homelessness? • The private rented sector • Partnership working • Temporary accommodation
Page 10
Three: Rough sleeping
• Quantifying rough sleeping in Cambridge • Who is rough sleeping? • Provision for rough sleepers in Cambridge • Getting into, and moving on from, hostel
accommodation • Housing First
Page 26

3
About this review document
Introduction
This document is the first formal stage in a process that will lead to a new homelessness and rough sleeping strategy. That strategy will set out how Cambridge City Council and its partners will prevent or relieve homelessness and rough sleeping in the City over the next five years. This document is a critical review of current practice intended to meet the requirements of section 2(1) of the Homelessness Act 2002. To achieve this it sets out and analyses a range of information drawn from the Council’s databases and case recording systems and those of our partners. It supplements this with housing market and other information drawn from publicly available sources. It also draws heavily on information set out in the Greater Cambridge Housing Strategy 2019 – 2023.1 The review also demonstrates and acknowledges that there are areas where better data is needed and areas where we are uncertain about cause, effect and outcomes. This is, however, part of the purpose and value of the review exercise: to set us asking better questions and to stimulate us into seeking better-informed answers, so that we can produce a better homelessness strategy and better services for our customers.
Review structure
This review – and the homelessness strategy that will follow from it - starts from the premise that everyone for whom Cambridge City Council, as the statutory housing authority, is responsible can and should have a home. From this it follows that anyone who at any time is without a permanent home has confronted one or more barriers to gaining or keeping one. The review sets out to systematically identify these barriers and to try to quantify and qualify the problem, starting in Section One to look at supply side issues of housing availability and affordability.
Section Two will move on to looking at the scale and the causes of ‘mainstream’ homelessness - by which we mean homelessness that is largely (but not necessarily solely) the result of the want of accommodation - and will explore how successfully, and by what means, we presently prevent or relieve it. It looks particularly at what has happened locally following the introduction of the Homelessness Reduction Act 2017. In this section we will also consider our use of temporary accommodation, including commercial accommodation, and further consider how well some of the schemes we have put in place to help ameliorate the supply and demand problems identified in Section One have performed.
Section Two will also touch upon the barriers that arise when homelessness and personal difficulties (such as relationship breakdown and debt) intersect. This naturally takes us on to Section Three which will examine in detail the forms of homelessness which have less to do with housing than with deep-seated and often chronic personal matters like mental ill health, substance abuse and lifestyle choice. Homelessness arising from these circumstances is the most likely to manifest itself in repeat cycles of accommodation loss and rough sleeping. It is also the most likely to determine public perceptions of homelessness and of a housing authority’s commitment to, and competence in, dealing with the problem. This is the most intractable area of homelessness, often requiring the long-term concerted efforts of specialist accommodation providers, outreach workers, safer
1 The homelessness and rough sleeper strategy should be seen as the complementary document to the housing strategy.

4
communities services and clinical, criminal justice and social services partners. Accordingly, this review devotes particular attention to this area.
Consultation
This review, and the construction of a new five year homelessness strategy, is a process based on consultation with internal and external partners, with voluntary groups and, most importantly, with people who have experienced homelessness. This process of consultation began early in 2019 with structured discussion with the wide range of statutory and non-statutory partners represented in the homelessness strategy implementation partnership (HSIP). More formal consultation events have taken place over the months of November and December 2019 and input has been invited from officers and others given access to early drafts of the current document.
The homelessness strategy itself will be published in June 2020.
Review and strategy timeline
29 November 2019
4 December December December 31 January - June 2020
June 2020
Partner consultation
Lived experience consultation
Open for further consultation
Completed review posted on-line
Strategy construction and further consultation
Strategy published

5
One: Background – Housing Affordability and Availability in Cambridge
This is a homelessness review and not a housing review. The broad range of housing considerations – supply, delivery, tenure, location, type, quality and other issues – and the housing ambitions of this authority, are detailed in the Greater Cambridge Housing Strategy 2019 – 2023 and the statistical annexes which informed that strategy.
But as pointed out in the introduction, no consideration of homelessness and rough sleeping can avoid starting with housing and, in particular, its availability and affordability. The following Chart 1 shows the relative proportion (rounded) of Cambridge households housed in the various tenures in 20112, but please note that there are strong indications that the proportion of private renters will have increased notably in the eight years since the last census.
Chart 1: Cambridge housing tenure by proportion (2011)
As can be seen, the largest single housing tenure in Cambridge is owner-occupation. But how affordable is this sector to a Cambridge household facing homelessness? Annex 3 of the Greater Cambridge Housing Strategy provides the following summary, shown here as Table 1.
Table 1: ‘For sale’ housing affordability
Item Value Source
Gross household income £37,200 (median) £20,900 (lower quartile) CACI 2017
Median income to house price ratio 10.6 Hometrack, based on sales & valuations: Housing Market Bulletin Sept 2018 data Average house price £541,514
Estimated Annual Income required for a mortgage for median house price (excluding any service charges)
£146,000 (£54,000 deposit)
Based on 10% deposit, 3.9% annual interest, 25 year repayment period and mortgage costs 35% of net household income
Lower quartile income to house price ratio 14.3 Hometrack: Housing Market Bulletin
Sept 2018 data Lower quartile house price £332,000
Estimated Annual Income required for a mortgage for lower quartile sale price (excluding any service charges)
£78,228 (£33,000 deposit)
Based on 10% deposit, 3.90% annual interest, 25 year repayment period and mortgage costs 35% of net household income
2 Source: 2011 census.
48%
26%
15%
8%
1% 2%
Owner-Occupiers
Private Rent
Council Tenancy
Housing Association Tenancy
Shared Ownership
Rent Free

6
Several individual household factors (for example the number of people earning in the household; access to capital and savings; assistance from friends and family) will determine the real-world likelihood of home ownership, but from Table 1 it is clear that moving into owner-occupation is likely to be beyond the means of a large proportion of Cambridge residents.
This being so, we need to look at the availability and affordability of rented housing in Cambridge. The largest proportion of rented accommodation in Cambridge is in the private sector. As we have seen from Chart 1, at the time of the 2011 census over 12,000 households (more than a quarter of all Cambridge households) rented a private sector home. As mentioned, this proportion is likely to have grown in the years since 2011, some estimates suggesting to as great a share as 35 per cent. By contrast, the English Housing Survey 2017-18 puts the national proportion at 19 per cent.
To determine the affordability of the private-rented sector for Cambridge households is a complex question which can only be answered definitively at household level, taking into account circumstances including household composition, earnings, taxation and benefits of all kinds. Table 2 is a snapshot of monthly market private rentals in Cambridge taken in August 2019. Very crudely, contrasting the gross (pre-tax) median household earnings shown in Table 1 with the median market rents shown in Table 2, and assuming that the very upper limit of affordability is the 35 per cent of net income suggested by Shelter, a household with a two-bedroom need on median earnings will have around a maximum of £1,085 a month to spend on rent and will therefore struggle to afford a home priced at the median level. A household with the same housing needs with an income at the lower quartile level will not be able to afford even the lowest two-bedroom rent recorded in the August snapshot.
Low-to-middle earning households will of course almost invariably be entitled to some level of housing support. Table 2 also shows the local housing allowance (LHA) presently in force. This shows that even at the lower end of the market, anyone entirely depending on housing benefit (or, increasingly frequently, the housing element of universal credit) will be unable to find privately-rented accommodation in Cambridge City.
Table 2: Snapshot of Cambridge City private sector rents August 2019
Bedrooms Lowest (pcm) Highest (pcm) Median (pcm) LHA rate (pcm) LHA as % median
Room £375 £765 £570 £349 61
1 bed £650 £2,395 £935 £579 62
2 bed £895 £4,500 £1,350 £666 49
3 bed £1,000 £4,000 £1,495 £775 52
4 bed £1,500 £4,250 £2,175 £1,033 47
Our August 2019 snapshot also looked at rents within the Cambridge broad rental market area (BRMA) and found that the supply of benefit-affordable privately-rented accommodation in areas close to Cambridge is also drying up. There were no affordable properties in any size category in Ely and St Ives, no affordable 1 bedroom properties in Littleport, Newmarket or Haverhill, and no benefit-affordable 2 bedroom properties in Littleport, St Neots or Huntingdon. As this was a snapshot the position may differ from day to day, but the broad trend is unmistakable of an expanding frontier out
7
from Cambridge of rents that are difficult to meet from benefits, and this has shown up in every such exercise we have carried out in the past five years.
For those unable to afford a private sector home, a second source of rented accommodation is social housing – the first preference of many households since offering not just an affordable rent but also security of tenure. But socially rented housing in Cambridge is in short supply, relative to demand.
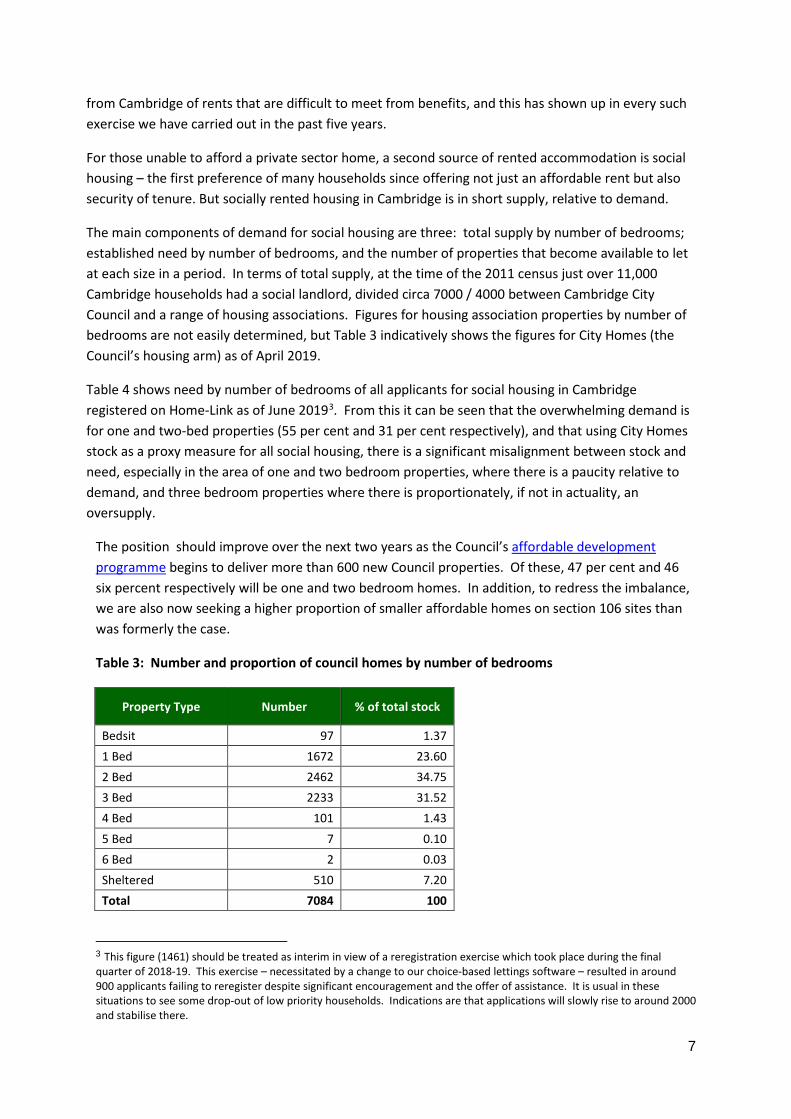
The main components of demand for social housing are three: total supply by number of bedrooms; established need by number of bedrooms, and the number of properties that become available to let at each size in a period. In terms of total supply, at the time of the 2011 census just over 11,000 Cambridge households had a social landlord, divided circa 7000 / 4000 between Cambridge City Council and a range of housing associations. Figures for housing association properties by number of bedrooms are not easily determined, but Table 3 indicatively shows the figures for City Homes (the Council’s housing arm) as of April 2019.
Table 4 shows need by number of bedrooms of all applicants for social housing in Cambridge registered on Home-Link as of June 20193. From this it can be seen that the overwhelming demand is for one and two-bed properties (55 per cent and 31 per cent respectively), and that using City Homes stock as a proxy measure for all social housing, there is a significant misalignment between stock and need, especially in the area of one and two bedroom properties, where there is a paucity relative to demand, and three bedroom properties where there is proportionately, if not in actuality, an oversupply.
The position should improve over the next two years as the Council’s affordable development programme begins to deliver more than 600 new Council properties. Of these, 47 per cent and 46 six percent respectively will be one and two bedroom homes. In addition, to redress the imbalance, we are also now seeking a higher proportion of smaller affordable homes on section 106 sites than was formerly the case.
Table 3: Number and proportion of council homes by number of bedrooms
Property Type Number % of total stock
Bedsit 97 1.37 1 Bed 1672 23.60 2 Bed 2462 34.75 3 Bed 2233 31.52 4 Bed 101 1.43 5 Bed 7 0.10 6 Bed 2 0.03 Sheltered 510 7.20 Total 7084 100
3 This figure (1461) should be treated as interim in view of a reregistration exercise which took place during the final quarter of 2018-19. This exercise – necessitated by a change to our choice-based lettings software – resulted in around 900 applicants failing to reregister despite significant encouragement and the offer of assistance. It is usual in these situations to see some drop-out of low priority households. Indications are that applications will slowly rise to around 2000 and stabilise there.

8
Table 4: Housing need by number of bedrooms (Home-Link November 2019)
Bedroom need Totals % of total Household requiring studios or 1 bedroom 820 56
Household requiring 2 bedrooms 435 30 Household requiring 3 bedrooms 177 12 Household requiring 4 + bedrooms 29 2 Total 14614 100
In terms of a person’s chances of securing a social sector home, of greater significance than gross stock is how many homes become available to be bid for. Table 5 sets out the number of council and housing association properties in Cambridge which became available for letting in 2018-19 by number of bedrooms. Chart 2 contrasts the number of relets shown in Table 5 against the number of applicants by size of property shown in Table 4.
Table 5: Relets 2018-19 by number of bedrooms
Bedrooms Re-Let 2018-19 % all lets 1 216 40 2 243 45 3 71 13 4 10 2
Total 540 100
Chart 2: Re-lets relative to demand
4 See footnote 3
0
100
200
300
400
500
600
700
800
900
1 2 3 4
Number Applicants Seeking
Number of Bedrooms
Home-Link demand relative to available lettings
Home-Link Demand
Re-Let 2018-19

9
A further consideration in terms of how likely it is that any applicant will secure a social home is the banding they achieve under the Council’s lettings policy. Banding can range from the highest category of need ‘A’ to the least urgent need category ‘D’ and is determined by a range of factors including actual or imminent homelessness, under or over-occupancy and unsuitability due to medical or other social need. Of the lets made in 2018-19 and shown in Table 5, they were awarded according to banding in the number and proportion shown in Table 6.
Table 6
Band Number % A 176 32 B 234 43 C 91 16 D 39 7 Total 540 100
Summary
This section has shown that:
• First time owner-occupation is beyond the means of a large proportion of Cambridge households.
• Private renting in the city is unaffordable for many Cambridge households.
• Affordable privately-rented accommodation outside the city is becoming more scarce.
• Demand for social housing far exceeds supply and is especially tight for high-demand one and two bedroom properties.
• There is a significant misalignment between the social housing available locally by
bedroom number and need, especially in the area of one and two bedroom properties.

10
Two: Preventing and Relieving Homelessness
Section One has reviewed the availability and affordability of housing in all tenures in Cambridge and has identified areas of stress. This section goes on to look briefly at what the housing needs register (Home-Link) further tells us about housing stress and homelessness, and then goes on to look at presentations made to the Council for housing advice, and to consider how successfully, and by what means, we are able to assist those people.
Quantifying homelessness in Cambridge
As we have seen in Table 4, around 1500 households are registered on Home-Link, and we anticipate that this figure will rise to over 2000 as pending applications are processed.
In popular discussion this gross figure is sometimes referred to as the ‘waiting list’ and is sometimes seen as representing the numbers of people in immediate need of a home and even homeless. However, as previously discussed, urgency of need is reflected in the banding system and at the time of writing the relative proportions of assessed need among live applicants is as shown in Table 7 where Bands ‘C’ and ‘D’ are respectively medium and low housing need. Home-Link is therefore more accurately described as a housing needs register in that it registers and orders the relative unsuitability (due to a range of factors) of the housing that applicants are currently living in.
Table 7: Home-Link live applications by proportion in each band (November 2019)
Band Percentage
A 8.7
B 26.5
C 41.7
D 23.2
Table 8 sets out what the housing register tells us of the various reasons why a household has made a Home-link application as of September 2019.
Table 8: Home-Link live applications by main housing need November 2019
Home-Link Category No. % Current supported housing resident 29 2 Financial Resources 74 5 Health and Safety risk 2 <1 Homeless households 16 1 Housing conditions 377 26 Lacking one bedroom 213 15 Lacking two or more bedrooms 13 1 Low Housing Need 317 23 Medical Need 107 7 Multiple needs 2 <1 Need to move for social reasons 103 7 Other homelessness 24 2 Owed a prevention or relief duty 34 2 Reasonable preference but no connection to local area 8 1

11
Sleeping rough 4 <1 Under-occupancy by one bedroom 43 3 Under-occupancy by two or more bedrooms or release of adapted property 18 1 Urgent multiple needs 31 2 Urgent Transfer 19 1 Victims of harassment, violence or abuse 27 2 Totals 1461 100
As can be seen, homelessness per se, including rough sleeping, is a small proportion of registered overall demand for social housing. Over and under-occupancy, medical need and general housing conditions together make up the greatest proportion of registration categories. ‘Low housing need’ – the second largest category - reflects the previously-mentioned preference many suitably accommodated people understandably have for a social tenancy.
The number of Home-Link registrations, while indicative, is not definitive in terms of indicating real and present housing need. One illustration of this is the aforementioned drop-out of households formerly on the register during the recent reregistration. Analysis has confirmed that some of the missing have subsequently made a fresh application and we are actively chasing applicants from higher needs bands who have dropped out. But the same analysis also confirms the common-sense supposition that a high proportion of those failing to reregister were in lower bands.
A further reason to conclude that the Home-Link figures are not an exact account of real and present need is that some people with the most complex conditions (for example rough sleepers) will not be sufficiently well-engaged with services to register, or may not be eligible to do so, or may decide not to do so due to legacy circumstances like a former eviction or a housing-related debt.
Another source of information potentially useful in quantifying local homelessness are our housing advice statistics. Table 9 sets out the figures for the ten quarters from April 2017.
Table 9: Housing advice presentations from 2017-18
5 The comparison with the position pre-Act should be treated with caution as classifications have changed. 6 The figures in brackets include effective preventions in cases where homelessness prevention was achieved before the statutory 56-day period. These include cases where the validity of a section 21 notice was successfully challenged. Under present MHCLG rules these cannot be recorded as statutory preventions.
2017-18 (N.B Pre-Homelessness Reduction Act) 2018-19
Q.1 & Q.2 2019-20
No. of approaches (incl. ‘advice only’) 963 1482 882
Volume of prevention/relief work 613 619 335
'Advice only' cases 350 863 436
Successful prevention / reliefs 237 2615 (345)6 155 (205)
Full S193 duty accepted 103 65 44
Average statutory case length (days) 61 74 96

12
Looking first at the gross number of presentations, Table 9 shows that in 2018-19 (the first full year of the Homelessness Reduction Act) almost 1500 households - a number equivalent to around three per cent of the City’s current estimated 48,000 households - contacted the housing advice service because they had a housing concern of some kind. This is not the same as saying that three per cent of all local households were threatened with homelessness or were actually made homeless in that year. As the table shows, more than half of presentations were classified as ‘advice only’ – a category where a customer will have a general concern about their housing circumstances but where there is no actual homelessness or imminent threat of it. This trend of a high proportion of non-homelessness duty cases has continued into the half year to September 2019 and is to be welcomed, as will be discussed later.
Looking more closely at this three percent figure, we should note that the real proportion of local people who may have experienced some kind of housing issue in the period may be lower or higher than this. With reasonable surety we can assume that a number of privately-renting households having a tenancy ended by a landlord will go on to find another tenancy themselves and never contact the Council. Others will resolve their housing problem by making their own arrangements with family and friends. Additionally, as will be discussed in Section Three, we know that a number of people sleeping rough will not present to the Council. These factors may make the three percent figure an underestimate, but other factors may operate in the opposite direction. For example, following the Homelessness Reduction Act (HRA), households may present for advice to any local authority (not just the ‘home’ authority) potentially inflating the numbers presenting in a regional and employment centre like Cambridge. This is something we will be monitoring in the future.
In terms of whether Cambridge residents may be comparatively more or less likely to fall out of accommodation - and in consideration of what this may indicate in terms of future levels of homelessness - a more telling figure than presentations is the number of these that go on to trigger a housing duty under section 193 of the Housing Act 1996, that is, those people in ‘priority need’ whose homelessness cannot be prevented. The advent of the HRA (initiating fuller statutory duties) has ruptured comparisons pre and post 2018-19, but if we consider the number of cases triggering the full homelessness duty in 2017-18 - the last year during which the previous statutory duties applied – then the local figures for full duty acceptances as a percentage of local households compare well at 0.21 per cent of local households relative to an England average of 0.49 per cent of households.7 Tentatively, then, we might say that when households do present for housing assistance, Cambridge may be doing better than many authorities in terms of preventing or relieving homelessness at an early stage. Table 10 (below) would seem to support this suggestion.
Housing advice service performance
Going on to look in more detail at what Table 9 tells us, first we can see that the 2019-20 half year figure for approaches is running a little over half the 2018-19 figure, indicating an increased volume of work of perhaps 20 per cent if trends continue. Prevention and relief cases in the current year are running proportionately close to the 2018-19 trend, but it is worth noting that the number of ‘advice only’ cases in the first half of the current year is already 25 per cent higher than the figure for the whole of 2017-18.
7 See ONS Figure 1a here and number of households here.
13
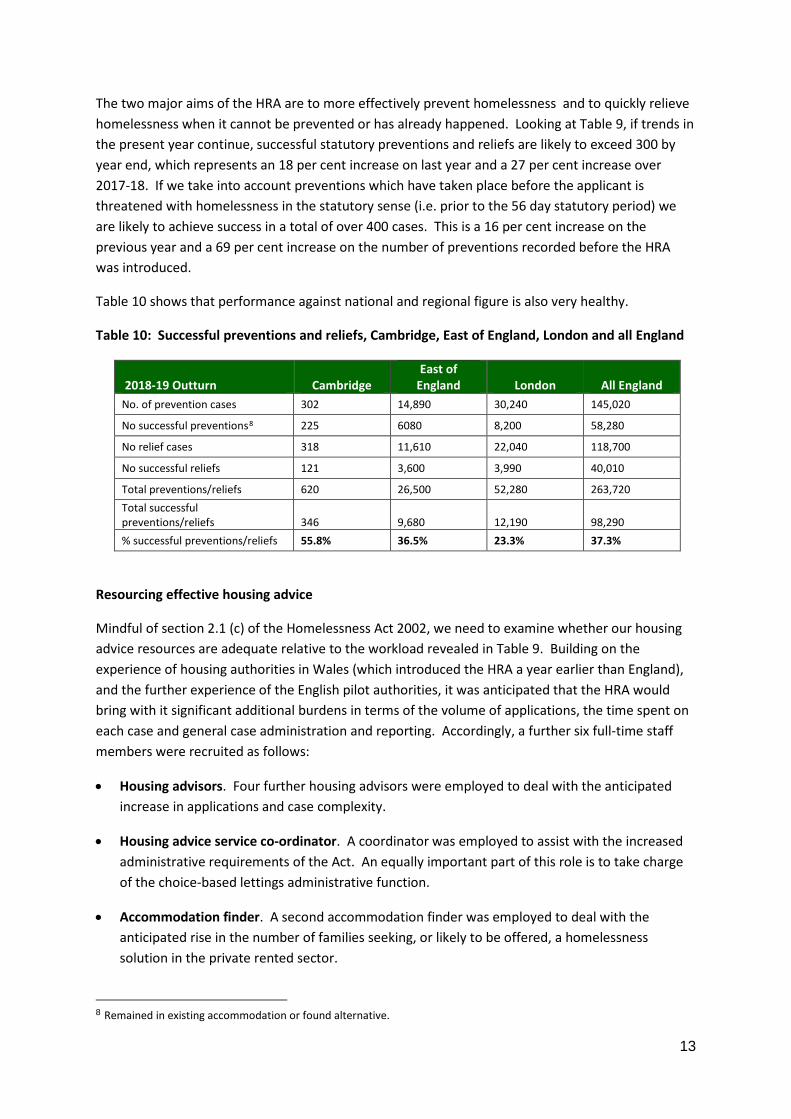
The two major aims of the HRA are to more effectively prevent homelessness and to quickly relieve homelessness when it cannot be prevented or has already happened. Looking at Table 9, if trends in the present year continue, successful statutory preventions and reliefs are likely to exceed 300 by year end, which represents an 18 per cent increase on last year and a 27 per cent increase over 2017-18. If we take into account preventions which have taken place before the applicant is threatened with homelessness in the statutory sense (i.e. prior to the 56 day statutory period) we are likely to achieve success in a total of over 400 cases. This is a 16 per cent increase on the previous year and a 69 per cent increase on the number of preventions recorded before the HRA was introduced.
Table 10 shows that performance against national and regional figure is also very healthy.
Table 10: Successful preventions and reliefs, Cambridge, East of England, London and all England
2018-19 Outturn Cambridge East of
England London All England No. of prevention cases 302 14,890 30,240 145,020
No successful preventions8 225 6080 8,200 58,280
No relief cases 318 11,610 22,040 118,700
No successful reliefs 121 3,600 3,990 40,010
Total preventions/reliefs 620 26,500 52,280 263,720 Total successful preventions/reliefs
346
9,680
12,190
98,290
% successful preventions/reliefs 55.8% 36.5% 23.3% 37.3%
Resourcing effective housing advice
Mindful of section 2.1 (c) of the Homelessness Act 2002, we need to examine whether our housing advice resources are adequate relative to the workload revealed in Table 9. Building on the experience of housing authorities in Wales (which introduced the HRA a year earlier than England), and the further experience of the English pilot authorities, it was anticipated that the HRA would bring with it significant additional burdens in terms of the volume of applications, the time spent on each case and general case administration and reporting. Accordingly, a further six full-time staff members were recruited as follows:
• Housing advisors. Four further housing advisors were employed to deal with the anticipated increase in applications and case complexity.
• Housing advice service co-ordinator. A coordinator was employed to assist with the increased administrative requirements of the Act. An equally important part of this role is to take charge of the choice-based lettings administrative function.
• Accommodation finder. A second accommodation finder was employed to deal with the anticipated rise in the number of families seeking, or likely to be offered, a homelessness solution in the private rented sector.
8 Remained in existing accommodation or found alternative.

14
In addition to this, a senior housing advisor was designated a specialist role, nominally for half the officer’s time, concentrating on those private sector tenancies ending as a result of a section 21 notice being issued. (This is the current single largest cause of households presenting as homeless to the Council).
A further change has been the enhancement of the former home visiting officer role (renaming it more accurately as the ‘homelessness prevention officer’) principally to deal with the duty to refer.
In terms of staff resources relative to demand for housing advice, we can conclude that staffing levels are broadly equal to the task and that staff performance in critical areas is very good. However, we are aware that the average caseload per officer has risen from 74 to 87 (18 percent) in the first year following the introduction of the HRA and that 2019-20 is on trend to rise by a further 20 percent over 2018-19 figure – an upward trend we need to keep closely monitored. This monitoring will include not just case volume but case complexity given that there is strong evidence that the number and overall proportion of complex cases is rising. This will be discussed later in this document.
What is causing people to lose their last settled home?
Chart 3 sets out the main reasons for the loss of the last settled home of households presenting to the housing advice service in 2018-19. As can be seen, the two most common causes – together accounting for almost half of all cases - are the loss of a privately-rented home and family or friends being no longer willing to accommodate. Chart 4 contrasts the same categories of causes (broken down into more detail) in the same period against the east of England, London and England.
Chart 3
0
20
40
60
80
100
120
Loss ofPrivateSector
Tenancy
Told to Leaveby Family or
Friends
RelationshipBreakdown
DomesticAbuse
Violence /Harassment
End of SocialTenancy
Evicted fromSupported
Housing
Num
ber
Main cause of loss of last settled home 2018-19

15
Chart 4
Complex cases
As will be examined in detail in Section Three, a large proportion of households and individuals seeking housing advice and facing homelessness have support needs of one kind or another. Of 1078 presentations in 2018-19 where a support need (or the absence of a support need) was recorded, only 332 (31 percent) reported having no such needs. Of identified needs, mental health support was by far the most common. Chart 5 sets out the position by main identified need (i.e. a customer may have additional support needs).

16
Chart 5
How are we preventing and relieving homelessness?
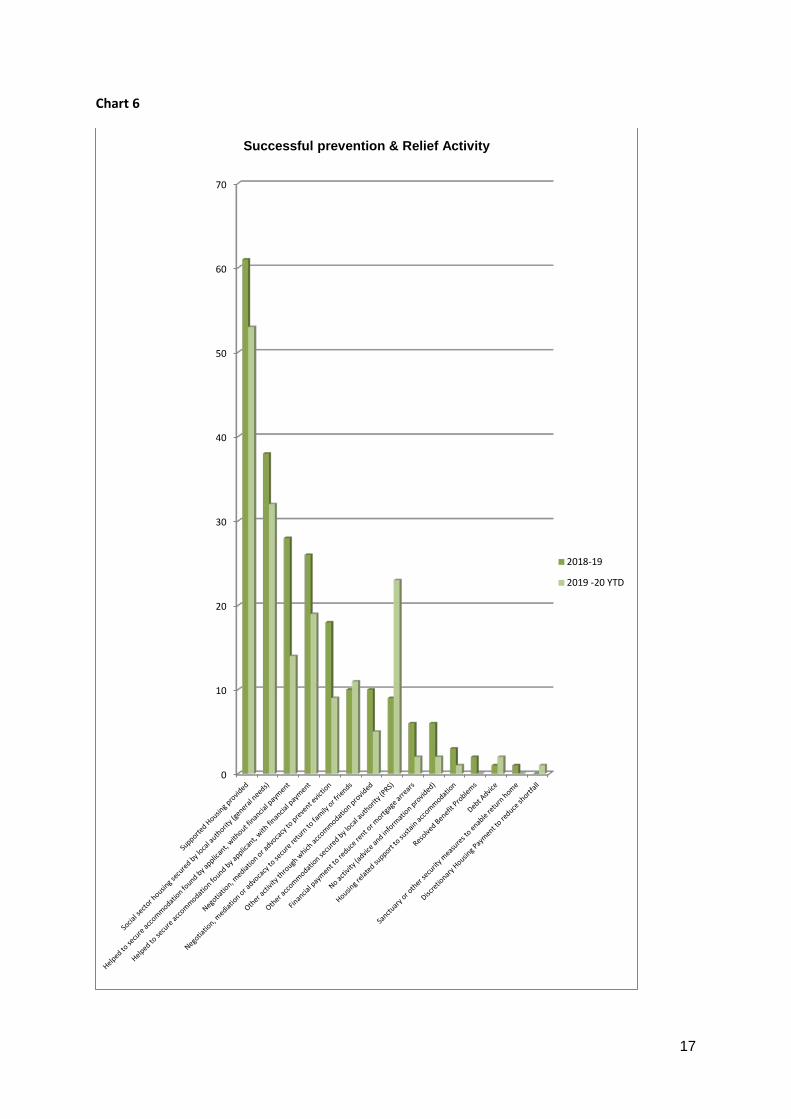
Chart 6 shows our prevention and relief outcomes for the full year 2018-19 and the first half of 2019-20. As can be seen, the provision of supported accommodation or a social sector tenancy have been the most common successful prevention and relief interventions over the six quarters reviewed, but solid outcomes are also being achieved by other means. Of the 417 cases opened and successfully closed in in the period, 183 ( 44 per cent) were resolved by means other than social or supported accommodation. Moreover, our work to assist people into – or to remain housed within - the private rented sector is not fully reflected in the homelessness duty statistics due to a number of factors. The next section will review our private rented sector work.
020406080
100120140160180
Support needs by number and main support need type
17
Chart 6
0
10
20
30
40
50
60
70
Successful prevention & Relief Activity
2018-19
2019 -20 YTD

18
The private rented sector
We have already seen in Section One that Cambridge has a private rented sector that is unusually large – and unusually expensive relative to local benefit levels. We have also noted that, with social housing in relatively short supply, the private sector represents the only realistically available option for many people. Accordingly, we have introduced a range of measures to try to make the sector more affordable and more acceptable to people presenting to the Council for housing advice.
As was referenced in Table 9, a significant number of effective homelessness preventions are not recorded as such as the prevention takes place before the statutory 56-day period. A large proportion of these preventions have involved successful challenges to section 21 notices9. In 2018-19 there were 150 presentations to the housing advice service by households that had received a section 21 notice. Of these, only eight notices were found to be valid at first presentation. Of the 142 found to be invalid:
• in 43 cases, negotiation by an officer achieved an agreement that the tenant could remain until they found a new home;
• in 14 cases a new AST was issued by the landlord; and • in 28 cases the tenancy was allowed to continue on existing terms as a periodic AST.
In the first two quarters of the current year there were 77 section 21 presentations of which only 1 was found to be valid. Of the remaining 76:
• 25 were enabled to remain until they found a new private sector home; • 3 were enabled to remain until they found a new social sector home • 15 remained in their existing accommodation as periodic assured tenants; • 3 were offered a new assured tenancy.
It is gratifying to note that this important work (which saves tenants from the disruption of moving home and incurring court costs, and which over time will help improve standards in the private rented sector) is continuing into the current year to deliver good prevention results.
A number of Council schemes assist people to gain or retain a private sector tenancy. Our Access Scheme makes interest-free, soft-repayment loans to help people meet the entry costs into the private sector.
In 2013 we established two complementary schemes to try to open up the local private rented sector. The first of these, the single homelessness service, was established in order to assist single people not in priority need but at risk of homelessness and rough sleeping to quickly gain a secure home. Since inception the scheme has assisted over 500 Cambridge single person households.
The second scheme set up in 2013, Town Hall Lettings (THL), is our social lettings agency. The primary initial brief for Town Hall Lettings (THL) was to source and manage shared private sector homes for people coming through the single homelessness service, offering landlords a guaranteed return as a key incentive. THL currently manages 10 of these shared properties providing a total of
9 A ‘section 21 notice’ (s.21 of the Housing Act 1988) notice is the necessary first stage ending an assured shorthold tenancy

19
27 bed spaces, including one quasi-Housing First four bedroom property for (predominantly) people whose ability to access to public funds was uncertain and who would otherwise have been on the street.
Since its founding, THL has gone on to secure and manage seven private sector homes for families settling in the Cambridge area as part of the City Council’s commitment to the Home Office Syrian refugees vulnerable persons’ resettlement scheme. It also manages 23 properties owned by the Cambridge City Housing Company (a not-for-profit company wholly-owned by the Council established to provide privately-let accommodation to households unable to afford to buy but earning too much to have a realistic chance of gaining a social tenancy). THL has further entered into nomination and management agreements with housing associations (HAs) presently totalling six properties. This last is particularly satisfying as it has generally involved HA short-life and low-demand properties that would otherwise sit empty.
We are presently reviewing THL’s range of services, in particular looking at ways we might further encourage local private and HA landlords to lease property to us to be re-let on assured shorthold tenancies.
Table 11 sets out the number of households assisted through these schemes and by other means over the past 10 quarters. Importantly, households do not need to be homeless or threatened within 56 days in order to receive assistance.
Table 11: PRS outcomes from 2017-18
People assisted into the PRS10 2017-18 2018-19 Q.1 & Q.2, 2019-20 Single person households 68 73 29 Families (& couples) 19 41 20 Total 87 114 49
Another private rented sector initiative is our Housing Benefit Plus (HB+) scheme, introduced in 2016 as a means of making local (or near-local) private sector homes available by means of a time-limited benefit top-up. Available for both single people and families, a supplement of up to £135 a month for a year for singles and up to £200 a month for two years can be awarded to households to which we owe a homelessness duty. The expectation is that during the period in which the supplement is paid the household will receive, and engage with, specialist income maximisation and employment advice so that at the end of the period they will be able to afford the full rent without the top-up.
HB+ is paid as a discretionary housing payment (DHP) when the accommodation it has helped to secure is in Cambridge city. When the accommodation is outside of the city it is paid as a supplement from the Council’s homelessness budget. To date, HB+ has made 25 awards to families and couples and 20 awards to single people. The majority of single person household HB+ recipients have found a home in Cambridge. However, due to the previously-identified disparity between benefits, lower-end earnings and private rents, even with the maximum top-up the great majority of families assisted remain unable to find accommodation within the city. This has made HB+ less popular than it might otherwise have been, but a recent policy change setting the maximum
10 Please note that these totals include non-statutory interventions not included in the prevention / relief figures provided in Table 10.

20
monthly top-up at £300 in exceptional circumstances may help change this (even though it is likely only to help recipient families live closer to the city rather than within it).
HB+ is expensive – the cost per annum of assisting the current 25 families is £60,000 – but this is not a reason why the numbers assisted so far are relatively small. This is accounted for rather by a combination of the reluctance of families to take up a private sector offer outside of Cambridge, the unwillingness of many landlords to work with the Council because demand from ‘mainstream’ renters is so high, and because of our need to be prudent in the choice of applicants we make an HB+ award to. This latter helps account for the 26 (to date) applications which have been refused, although a failure to cooperate with the key requirements of the scheme has also played a big part in this.
Despite the small numbers so far, we see HB+ as a future major instrument in our objective to make the local private-rented sector a solution in the prevention and relief of homelessness and we are presently considering a rebrand and a publicity-led relaunch of the scheme, coupling it with further incentives for landlords and, for prospective tenants, incentives such as removals and home decoration grants and time-limited transport supplements to assist a person to continue to return to Cambridge on essential business. We are also considering a further increase in the maximum supplement paid to families under HB+, perhaps restricted to the first year of the scheme.
To date, no one awarded a HB+ top-up has lost their tenancy.
In addition to a proposed rebrand of HB+, we are presently overhauling our offer to private sector landlords. To further this we have employed an officer to specialise in gaining new private sector business and we have thoroughly refreshed the THL website. We are also considering schemes to further incentivise households to consider a private sector offer, perhaps including where appropriate removal and redecoration expenses and some short-term assistance with travel.
Partnership working
It is essential for a housing authority to work in partnership with statutory, internal, contracted and voluntary organisations in order to prevent or relieve homelessness and since the introduction under the HRA in October 2018 of the ‘duty to refer’11, partnership working is now effectively a requirement. This section looks at the relationship between Cambridge homelessness service and its range of partners.
Statutory partners
Overall, the Council enjoys good and productive relationships with its statutory partners, and it is acknowledged that there is a strong desire on all sides to work together for the benefit of the people we need jointly to assist if those people are to get the best we are capable of. But this said, all sides acknowledge that there are difficulties and that these sometimes prevent organisations from delivering the service they would want to deliver and which our customers deserve.
11 The ‘duty to refer’ requires public bodies to refer to a housing authority any consenting individual they come across who is homeless or threatened with homelessness. The public bodies include prisons; young offender institutions; secure training centres; secure colleges; youth offending teams; probation; Jobcentres; social services; emergency departments and hospitals.

21
These difficulties are caused by, among other things, a sometimes confusingly different (and sometimes conflicting) set of legislative, political, organisational and local demands; the pressure to work within tight budgets; communication difficulties between organisations; IT incompatibility; and information sharing concerns and uncertainties. Even where partnership arrangements with other statutory organisations are excellent (as in the case, for example, of our sub-regional Home-Link partners) tensions may arise when formulating common policy or practical approaches due to very different demographics and housing markets across the Cambridgeshire districts and very different levels and kinds of demands on housing.
Efforts have been made to diminish partnership working difficulties by, for example, agreeing protocols, and good examples exist of well-thought-out guides to joint working such as our protocol agreement with Children’s Services concerning homeless 16 and 17 year-olds. However, this review has identified that even where such arrangements exist they are not always known about (new staff are not always adequately inducted) and what the protocols mean in practice in specific cases is sometimes disputed. Moreover, in several key areas there are no working protocols in place. Looking again at Chart 5, it is clear that we need to work better with mental health services in particular and that, following a number of recent cases where individuals effectively proved to be ‘unhousable’, support for vulnerable adults needs to be far better integrated into our joint housing and homelessness processes.
One indication that we need better, and better informed, partnership working with statutory agencies can be gauged from Chart 7 which shows that in its first year of the ‘duty to refer’, of 231 referrals from specified organisations only 78 triggered a prevention or relief duty, an accuracy rate of only 34 percent. This is not necessarily a problem and we would rather be told twice and more about the same individual than not at all, but preliminary analysis does point to the need for us to establish better-informed referral practices.
It is not the place of this review document to itemise where the improvements might be made in work with statutory partners, but ongoing consultation as we move toward constructing our homelessness strategy should help to clarify the position and will set out where protocols will need to be better communicated, renewed or established, and set timelines within which they will be agreed. For now it is sufficient to recognise that with a high and, it is thought, a growing number of very complex homelessness cases, how statutory bodies work with us to help deal with these is vital, and will become more so.

22
Chart 7
Contracted and voluntary partners
The Council contracts with, or makes grants to, a range of partners who provide vital homelessness prevention, relief and support services. Contracted and voluntary sector partners work predominantly in the area of street homelessness and support and assistance for those with a history of being on the street or who are otherwise at risk. They also provide services in areas where specialist understanding is required, such as for women or young people.
Wholly contracted service providers include CGL (providing the Council’s street outreach service) while other providers , like Jimmy’s and Wintercomfort, deliver a range of services in addition to those Cambridge City Council pays for. Some of these additional services are provided on contract to the County Council while others are delivered using reserves, donated funds and grants obtained by bidding into a range of charitable and other funding streams. Cambridge City Council currently makes almost £750,000 a year available for organisations and agencies to bid into to support homelessness prevention and relief.
These services together make for a network of homelessness support which is extensive and generally acknowledged to be of high quality. However, this review has also shown that there are gaps in provision and also some duplication. While we will seek to reduce duplication, a degree of parallel provision is probably inevitable in a system of multiple providers and is not always wasteful as service users will sometimes prefer one approach over another or may need an alternative to deal with conflict of interest or the breakdown in the relationship with a particular service. Gaps in provision tend to be most evident in the complex area of
0
10
20
30
40
50
60
70
Statutory referrals under the Duty to Refer (Year to 30/9/19)
Duty accepted
Duty not owed

23
rough sleeping and this will be explored more fully in Section Three, but for the present we note that the most important and serious gap is in the provision of support and, in particular, support of a kind that will accompany a person from the streets to a home of their own and which will remain in place for as long as it is needed.
Temporary accommodation
Cambridge City Council temporary accommodation (TA) is overwhelmingly provided from within our council housing stock, the exception being a block of 10 single person units leased from a housing association. At the time of writing there are 104 discreet TA units of varying sizes, all of which are within Cambridge.
In the run-up to the introduction of the HRA it was debated what effect the Act might have on demand for TA. On the one hand it was thought that better preventative work might reduce demand. On the other, the 56 day relief duty was seen as having the potential to extend the period a household may spend in TA, especially in intentional cases where the decision would not become effective until the relief period ends, after which the usual reasonable notice would need to be given. Differences in recording practice due to changing software provider in April 2018 make it difficult to compare pre and post-Act TA figures. However, now with the benefit of six quarters of post-HRA data it is clear that the number of people in TA and the duration of their stay has increased in the post-Act period as the Act has progressively taken effect. Accordingly, in the full year 2018-19, 262 homelessness applicants were in TA, composed of 164 single people and 98 families. By contrast, in the period April – November 2019, 200 applicants were placed of which 112 were single and 88 families. Projecting forward to the end of the current financial year, should current placement trends continue we will end the year placing 300 households, a projected increase of 14 per cent. Again if current trends continue, it will be families that will account for the largest proportional increase, projected to finish the year at 133 households, an increase of more than half on 2018-19.
The second component of demand for TA is the length of time households remain there. Chart 8 shows that while in five of six quarters from April 2018 the average length of stay per quarter has been above our target of 85 days, the excess has not been great except in one quarter. We also see that the average fluctuates from quarter to quarter with no discernible trend. However, we need to do more work in this area to properly understand whether it is flow or duration that driving upward demand for TA.
Analysis of the figures on a case-by-case basis shows that the average relief duty period in is 66 days. This may reflect good practice if a better outcome might be achieved by taking a few additional days. It may however indicate that officers may not have time to monitor impending 56-day deadlines. An answer to this awaits further work.
But increasing use of TA is a phenomenon not confined to Cambridge city, and nor is it something that has happened only as a consequence of the HRA. Chart 9 shows that among English authorities TA usage has been steadily rising since 2012.

24
Chart 8
Chart 9
0
20
40
60
80
100
120
140
160
Q1 Q2 Q3 Q4 Q1 Q2
Average stay in TA (days) Q.1 2018/19 to Q.2 2019/20
Average stay in TA (days)
Target

25
Use of commercial accommodation as an emergency measure
Like most authorities, the Council seeks to keep its use of commercial hotels to a minimum. However, there will always arise situations where a hotel may represent the only, and sometimes objectively the best, immediately available solution.
The need to use commercial accommodation will usually arise when there is no readily available TA of the required size or when somewhere to stay needs to be found out of normal business hours. We have a policy of using one of three hotels in the city belonging to a large national chain whenever possible and, when these are not available, one of five hotels in the same chain sited within 15 miles of the city on fast and frequent public transport routes. These hotels are popular with customers. We also use a limited number of independent hotels some greater distance away when there is no local accommodation available or in exceptional circumstances such as where a family is unusually large or when a person or household needs to be needs to be placed outside the city for their own protection or for the protection of others.
We visit all commercial hotels on a regular basis and otherwise verify suitability (for example, by customer questionnaire).
Despite having a historically high complement of our own accommodation as TA, following a number of years when our use of commercial accommodation has been steady, use is rising in the current year. This reflects the aforementioned pressure on our temporary accommodation but also a number of exceptional occurrences such as the need to prepare suitable premises for two very large families and the temporary unavailability of a five-room unit while renovation took place. In 2018-19, the average number of unique families who began a stay in a commercial accommodation in any quarter was 9.25. By the middle of 2019-20, the average per quarter rose to 16. No family has been in in commercial accommodation above the statutory limit of six weeks.
We are presently working through an action plan intended to bring down our use of commercial accommodation over the next two quarters, but it needs to be remembered that this is a demand-led service.
Summary
This section has shown that:
• Housing conditions, lacking one or more bedrooms and medical need together account for 48% of housing need as determined by the housing register.
• 21% of households on the register are classified as having ‘low housing need’. • The number of people approaching the Council for advice increased by 54% in the
first full year of the HRA and continues to rise. • Losing a private sector home and being asked to leave by family or a friend were
respectively the second and first most common reasons for the loss of last settled accommodation.
• 69% of people presenting in 2018-19 had a support need of which by far the most common was mental health support.
• Challenges to invalid section 21 notices in 2018-19 kept 85 private tenants in their home or prevented their homelessness.
• Cambridge City Council’s prevention and relief performance compares favourably to the East of England and England generally.
• Demand for temporary accommodation is increasing and the Council has had to increase the supply of temporary accommodation as a result; average stays in temporary accommodation are, however, shorter than they were prior to the Homelessness Reduction Act.

26
Section Three: Rough sleeping
Quantifying rough sleeping in Cambridge
As has been mentioned earlier, rough sleeping is the most visible aspects of homelessness and is often the basis on which the public will judge how effectively authorities are looking after the most vulnerable in society. It is rare to find a report about homelessness which is not illustrated with images of rough sleeping even though, as is shown in this paper, rough sleeping is not, statistically speaking, anything like the typical manifestation of homelessness. As a crude measure, we can contrast the 619 households in 2018-19 where the Council picked up a homelessness prevention or relief duty against the 27 individuals seen rough sleeping in 2018 or the 158 unique individuals counted sleeping rough in the same year. (See below).
What is the scale of rough sleeping in Cambridge and do we have a more significant problem than other cities? As the Ministry of Housing, Communities and Local Government and the Office of National Statistics acknowledge, questions about the scale of rough sleeping are not easy to answer with accuracy.
The City Council and its partners have two distinct but complementary ways of measuring rough sleeping in the city. Our street outreach team counts those bedded down on four mornings every week and from this compiles a list of the number of unique individuals. In addition, on six occasions in the year, a ‘snapshot count’ is made by a large team working across a very wide area of the city. Of the six snapshots, the autumn count is considered the most important as it is this which central government uses to compile its overall national estimate of rough sleeping and is also the benchmark against which to contrast the relative performance of different local authorities.
Table 12 shows the number of rough sleepers counted in the autumn in the three years since 2016. Table 13 is Office of National Statistics information which contrasts Cambridge’s performance in 2018 against a number of other authorities that might be said to be roughly comparable, and from this it can be seen that while the gross figure puts us at the lower end of the list, in terms of our rate of rough sleeping per 10000 households we are doing less well than others. We are currently in the process of speaking to authorities with both better and worse counts than our own in an attempt to discover what might be driving local rough sleeping rates up or down.
But while the snapshot count is important, it provides less of a guide to what is really going on than the number of unique individuals counted over a year. This figure provides a far better guide to flows on and off the street; to the number of people newly rough sleeping and to those who were thought to have, or are known to have, accommodation.
Table 14 sets out the number of unique individuals seen in the four full years since 2015-16.
Table 12: Cambridge Autumn Street Count
2016 40
2017 26
2018 27

27
Table 13: Autumn count of comparable cities and rate per 10,000 households
City Count 2018 Rate per 10000 households Cambridge 27 6.1 Oxford 54 8.2 Bedford 51 7.2 Lincoln 26 6.3 Luton 47 5.9 Brighton 64 5.0 Canterbury 33 5.0 Peterborough 29 3.7 Norwich 21 3.3 Exeter 17 3.2
Table 14: Unique individuals counted rough sleeping 2015/16 – 2018/19
2015-16 152
2016-17 240
2017-18 175
2018-19 158
From 2017 we have been able to organise our ‘unique individuals’ data to gain insights into the dynamics of rough sleeping using the now widely-recognised ‘flow, stock and return’ model pioneered in London by the combined homelessness and information network (CHAIN) where:
• Flow - people seen rough sleeping for the first time. • Stock - people seen rough sleeping in the current and previous years. • Returners - people known to have been rough sleeping in earlier years; not seen in the previous year
but seen in the current year.
Chart 10 sets out that information, and indicates that the greatest proportion is the ‘flow’ category of rough sleepers new to the streets at (62 and 59 per cent of the total over the two respective full years). This is a finding consistent with what our snapshot counts have been showing for several years and is further consistent with what the London CHAIN figures are showing – new street sleepers in London are also the largest proportion.
It is early days for us in terms of further testing and analysing the data, and we have committed to refine and otherwise improve what we record in coming years, but if more rigorous research supports these early findings then it is surely of profound importance that people new to the street may be replacing those we are able to assist into accommodation. We need also to try to understand whether we are seeing in Cambridge a smaller version of the London phenomenon where people are gravitating to the urban centre in search of services or maybe in search of employment and accommodation opportunities that never materialise.

28
Chart 10
*Please note incomplete year
Who is rough sleeping?
Anyone trying to understand rough sleeping, whether in Cambridge or elsewhere in the country, will soon come to realise that the phenomenon is highly complex and that this complexity is rooted in its individuality. There is no ‘magic formula’; no one thing that will solve the problem for everyone everywhere.
But while it may be true that losing a home could happen to almost anyone, street homelessness is clearly not something that strikes at random. Instead – and even allowing for the causal effect that homelessness has on behaviour, habits and well-being – you are much more likely to end up on the street if you suffer from mental ill-heath and addictions (regarding which there is considerable overlap). And these problems are very frequently severe. Of those verified to be rough sleeping in the two years 2017-18 and 2018-19, 35 percent were reported to have ‘severe’ mental illness. Of the same cohort, more than a half reported drug use in the previous month, 36 per cent using Class A substances.
Street homelessness also disproportionately affects males, people who have suffered trauma, people who have been in some kind of institutional care or organisation and people who have little by way of financial or social capital. However, Cambridge would seem to have very few street homeless people who have been in the armed forces.
For rough sleepers, the experience of homelessness is also very different than for people experiencing mainstream homelessness, lasting longer and being much more likely to be cyclical. This was set out clearly in a respected peer-led study of rough sleeping in London carried out by the St Mungo Trust during 2017-18. On My Own Two Feet, found that one-in-six (17 per cent) of people sleeping out in the capital in that year had returned to the street after a gap of at least a year. The study went on to find that there were push and pull factors. Push factors included eviction and abandonment because the accommodation was unsafe or unsanitary or there was the threat of violence or abuse. Pull factors – which have often tended to overlooked - included a sense of belonging and community on the street, compared to boredom and isolation when living alone. A recurring theme was the absence of both informal support (from family and friends) and formal support that will continue for as long as it is needed.
These London findings are also familiar to us here in Cambridge. Table 15 sets this out using the example of the November 2018 street count.
92 8861
53 53
61
3 6
12
0
20
40
60
80
100
120
140
160
2017 2018 2019* to November
Verified Rough Sleepers in Cambridge
Return
Stock
Flow

29
Table 15: Breakdown of November 2018 count
Total Counted 2018 27
Gender Male 21 Female 7
Ethnicity 21 x white - British
6 x white - other
1 x mixed white/Black British
1 x Asian/Asian British - Indian
1 x black/black British – other
Age 16 – 25: 1
25 – 59: 26
60+: 1
Nationality/Immigration status
UK 21
EU 6
Other 1
12Entrenched/revolving door
20
Short term/intermittent 8
Couples 1
Drugs/Alcohol 20
Mental Heath 15
Institutional history (care, prison, armed forces)
10
Local Connection to your LA
14
England 7
Non-UK 7
12 Please note some individuals are in several categories – figures do not sum to 27

30
Provision for rough sleepers in Cambridge
For a city of its size, Cambridge undoubtedly provides a broad suite of high-quality services for people on the street, and work continues to better understand what additionally we need to do to.
Table 16 sets out the number of beds available locally in Cambridge for rough sleepers and those at risk of sleeping rough13. As can be seen – and in response to our understanding of the complexity and individuality of homelessness – there is a wide range of different kinds of accommodation services.
Table 16
Project Name Number of beds
Service description
Cyrenians Short stay 16 Two houses each providing single rooms for eight people, with two live-in staff. The accommodation is designed to be temporary. Most residents have moved on within 12 months stay with a maximum stay of 2 years.
Cyrenians Long Stay 7 Older people's long-stay project.
Cyrenians Move-on properties
40 Cyrenians move-on properties. Rooms are spread over seven houses.
Cyrenians: Jubilee Project 10 For ex-offenders (last offence within a year) project for male and females willing to engage in meaningful activities 3 times a week. Referrals are accepted from Probation, IOM, St Giles, Youth Offending Service, NACRO and HMPs
Cyrenians Working Houses
12
Riverside: The Victoria Project (TVP)
34 TVP is a specialist support centre for the homeless, particularly for those who have experienced addiction or mental health issues. Our support network and accommodation provides a stable, relaxing and motivational atmosphere for our customers to make a positive new start in life.
Jimmy's Cambridge 22 Open 24 hours a day, 365 days a year, Jimmy's is the only emergency accommodation provider in Cambridge.
YMCA 70 Supported housing for up to 70 young people aged 16 - 25 in rooms and some flats.
Riverside Willow Walk 20 For men and women with medium support needs.
Railway House 18 For young single homeless people aged 16-25 with low to medium support needs. Priority given to those with a local connection to Cambridgeshire. Applicants must be willing to engage with the
13 While the City Council will have made some financial contribution to all the services mentioned, there not all the services listed are wholly funded by the Council. In many cases there is co-funding with the County Council and many providers use their own funds.

31
Project Name Number of beds
Service description
support on offer.
Whitworth House 13 Supported accommodation for women aged 16-25
Castle Service 17 Dispersed supported housing scheme for 16 – 25 year olds in existing mental health treatment.
Cambridge Youth Foyer 28 Supported housing for 16 to 25 year olds motivated to engage in education/training/employment.
451 6 451 is a 6 bed project supporting alcohol-dependent individuals to reduce drinking and improve health.
Jimmy's Move on Houses 28 Internal referrals from Jimmy's only
The Springs 24 The Springs provides supported housing for single men and women with low support needs who are willing to engage in education, training, paid or voluntary work.
Corona House 6 6 self-contained flats for women with mental health support needs
Young Parent & Baby Project
8 Low cost social housing and support for parents aged 16-25. Young Parent & Baby Project is a housing association providing a range of low cost social housing to people needing needing somewhere to live. Young Parent & Baby Project is based in Peter Maitland Court, 150 Victoria Road
Total 345
In addition to this permanent accommodation, the Council commissions Jimmy’s Cambridge to provide emergency beds between November and March each year when the weather turns bad. Over the past several years the number of beds provided and the number of nights when this severe weather emergency provision (SWEP) has been called has progressively risen, peaking over the past two years at 20 beds for men and six (in separate provision) for women. This is supplemented from December onwards by 17 beds provided by the Cambridge Churches Homelessness Project (CCHP) giving a total of 43. The following table sets out SWEP bed usage over the past two winters. As can be seen, take-up in 2017-18 was much higher than in 2018-19 on account of the severe winter in that earlier year. It should also be noted that capacity has comfortably exceeded take-up in both years and that in 2018-19 on three out of four nights there were fewer than 10 guests each night.

32
Table 17
2017-18 2018-19
Number of nights 55 40
Number of individuals 156 81
Female14 21 6
Male 128 65
No recourse to public funds (NRPF)
17 16
Nights with fewer than 10 guests
4 27
Nights with more than 10 guests
51 13
Most guests on a night 34 21
In addition to accommodation, the city also hosts a range of welfare services, including a unique GP surgery exclusively for people on the street or with a history of having been so. There is also a thriving day centre – Wintercomfort For the Homeless - which provides showers; toiletries; clothing; a daily breakfast and lunch; support services including housing, benefit and employment advice; emotional and practical support; sports sessions; trips and outings and new health and wellbeing women-only service. Wintercomfort is visited by around 260 individuals each month. Jimmy’s Cambridge also hosts a wide range of day services for residents and others.
In response to the acknowledged number of people on the street with ‘dual diagnosis’ mental health and substance abuse problems, we have also funded a clinical street team of four which could begin to deliver assistance and treatment even while individuals remained without accommodation. Table 18 sets out the numbers and proportions by accommodation type of individuals assisted by the dual diagnosis street team (DDST) in its two years of operation from 2017-18.
The original DDST service closed in June 2019 but we are pleased to have been able to find funding to re-establish a smaller, more-focussed service which will start early in 2020).
Table 18
Total clients seen by DDST service 86 Of which at time of first presentation: Rough sleeping 53 62% Supported housing resident 9 10% Jimmy's guest 23 27% Social tenancy 2 2%
Getting into, and moving on from, hostel accommodation
We have seen that Cambridge, relative to its size, is well-provided-for in terms of the number of permanent hostel beds it hosts for rough sleepers. But how quickly and easily a rough sleeper can enter, move through, and then move out of the hostel system is as important to bringing down our rough sleeper numbers as gross
14 Sex of guest not always recorded

33
provision of beds: how quickly we get people off the streets is directly related to how many beds become available for others in a period.
In this area we are not performing as well as we would like. Looking first at access (which is generally through Jimmy’s assessment centre) the average number of days an individual will wait to get into Jimmy’s will fluctuate randomly in the shorter term, but over the longer term there is an unmistakable upward trend in waiting times. While as recently as the final quarter of 2017-18 the average wait a rough sleeper would have for a Jimmy’s bed was six nights from first registering an interest. At the time of writing that wait is now verbally reported to be around 11 days.
A major reason for rising waiting times is the rising number of Jimmy’s guests staying for very much longer than the target length of stay of 28 days. At the end of the second quarter of 2019-20 nine guests had been resident for between 57 and 84 days; three guests had remained for between 85 and 100 days, and nine guests had stayed for more than 100 days - one for 307 days and one for 461 days.
The reason for these lengthy stays has invariably been the absence of suitable move-on accommodation. In the case of the very long-staying Jimmy’s guests there are indications that a problem is emerging of older rough sleepers (some of whom have continuing drug and alcohol problems and often a history of ASB and housing debt) who do not easily fit into existing mainstream provision for elderly people.
Aside from the particular difficulties of the older rough sleeper cohort, difficulties in moving people out of Jimmy’s clearly arise if spaces in ‘second tier’ hostels (i.e. Willow Walk, The Victoria Project, The Springs and Cyrenians accommodation) are not being created by residents moving on from these into mainstream accommodation. It is the case that move-on from homelessness hostels can be sluggish and, as Table 19 shows, is frequently ‘unplanned’ i.e. due to abandonment or eviction rather than a positive move into a new home. The target maximum period of stay for each resident individual is normally two years, implying that a minimum of one-half of all residents will depart in a planned fashion in any full year. But as can be seen, this is not always being achieved, in most cases principally because the individual is often still not ready for independent living even after two years: It is noteworthy that the best-performing project, The Springs, is the one which specialises in people with very low support needs.
Table 19: Numbers moving on by project 2018.
All services move-on 2018 Planned Unplanned Target (50% of residents per year)
Planned as % of target
Victoria Road 15 11 17 88
The Springs 20 8 12 167
Willow Walk 8 9 10 80 Cyrenians (all except Jubilee and move-on houses) 18 13 17 106 Cyrenians Jubilee 9 11 5 180 Cyrenians move-on houses 11 6 20 55
Sluggish move-on from hostels is also conditioned by the aforementioned absence of affordable privately-rented accommodation and the clear preference of people in hostels for a social housing outcome. Up to 40 social tenancies a year (in the form of the award of an ‘A’ band under the choice-based lettings system) are exclusively available for people leaving hostels who can demonstrate that a social tenancy is critical to their future housing stability, but that 40 is not sufficient to facilitate the desired level of move-on. Our HB+ scheme for single people (please see page 19) was intended to be a major aid to helping people move on from

34
hostels and into good privately-rented accommodation in Cambridge, but after initial rapid take-up of the offer, interest has died back considerably for reasons we do not fully understand. We will be doing some analysis of this in the coming months as part of our review of HB+ and will also be looking intensively at the whole area of movement into and out of the hostel system.
Housing First
Reviewing the range and variety of services in Cambridge it is in many respects disappointing that over the past several years our annual rough sleeper figures have remained stubbornly fixed at somewhere between 25 – 35 (with the exception of the 40 recorded in 2016) as against a target of 10, and that the number of unique individuals counted (while closer to target and decreasing) remains above our hoped-for 135. It is also disappointing to note that some of our most entrenched rough sleepers are unwilling to use many of the accommodation services available, one striking example being our cold weather accommodation which is free of charge to all-comers (including those with NRPF) and is unconditional other than to require a reasonable standard of behaviour. (See Table 17 above).
Consultation with rough sleepers themselves and with service providers has strongly indicated that these choices are influenced by the aforementioned prevalence of substance abuse and mental health problems among this cohort and especially the need to be on the street late at night raising money. Further inhibitory factors include an unwillingness to share accommodation, not wishing to be among people who are less advanced in their progress out of addiction, and what some service users have described as the ‘petty rules and regulations’ of hostels.
These are factors which have caused us to introduce a Housing First programme consisting initially of the following:
HF1 – dedicated HF social tenancies 10
HF2 – new-build social tenancies in a 2 x HF plus 1 caretaker configuration
12
HF3 – private sector shared accommodation Currently 4 bed spaces
The unique feature of HF is that it offers accommodation to people directly, without any intervening period in a hostel and with no requirement to follow a prescribed ‘pathway’. HF also prioritises individual choice, including the choice whether or not to accept support, although preparations are being made to ensure that there is sufficient support to help a person negotiate the traditional divide between the streets and home, and to ensure that this lasts for as long as it is needed and wanted.

35
Summary
This section has shown that:
• Our annual rough sleeper count is comparable with similar authorities, being somewhere in the mid-range.
• The count of the number of unique individuals recorded rough sleeping is closer to target and, in the current year, is promising to be lower than at any time in the past four years.
• In the ‘flow / stock / return’ model (see Chart 9) the greatest proportion is that of ‘new’ (flow) rough sleepers. Not all these are necessarily new to rough sleeping but may have slept rough elsewhere before coming to Cambridge.
• Mental health and substance abuse problems are heavily represented in the street community. In the November 2018 count 20 of 27 recorded rough sleepers were known to have an addiction while 15 of 27 had a mental health problem.
• There are 345 beds in Cambridge City catering for a wide range of different homeless individuals.